
Content:
Presentation type:
HS – Hydrological Sciences

EGU26-15399 | Orals | HS10.1 | Highlight | Henry Darcy Medal Lecture

Ecohydrological Adaptation to Climate Change - from Gondwana to the Globe 

Sally Thompson

The south west corner of Australia holds a level of plant diversity unmatched outside tropical rainforests; fostered through millions of years of isolation and relative tectonic and climatic stability.  Across deep time, pressures of pollinator scarcity, severe nutrient limitation in an ancient, highly weathered Critical Zone, and fire disturbance have produced what might be the most specialised flora in the world.  Southwest Western Australia (SWWA) is also on the bleeding edge of climatic heating and drying, in a trend that has been apparent since the 1960s.  Water resources management in response to these trends has made the cities of SWWA global leaders in conservation and water technologies – but as the drying continues, groundwater recharge is dropping, phreatophytic plants are dying, and more severe summer heatwaves and droughts are impacting key ecosystems over huge areas.  In this Darcy Oration, I hope to introduce you to the often forgotten, but exceptional set of ecosystems, catchments and Critical Zones of SWWA, and ask how can ecohydrology as a discipline support meaningful adaptation to such climatic changes in this megabiodiverse, hyper-endemic area?  I will present a potential hierarchy of actions and research gaps to consider, and suggest that research in support of making decisions about where and how to adapt is a key challenge for our community.  Finally, I will spend a little time reflecting on my personal experiences as a caregiver to special needs children, and how those caregiving responsibilities impact a career in hydrological science.

How to cite: Thompson, S.: Ecohydrological Adaptation to Climate Change - from Gondwana to the Globe, EGU General Assembly 2026, Vienna, Austria, 3–8 May 2026, EGU26-15399, https://doi.org/10.5194/egusphere-egu26-15399, 2026.

EGU26-14330 | Orals | MAL22-HS | Highlight | John Dalton Medal Lecture

Advancing hydrologic science through process-based evaluation of models 

Thorsten Wagener

How rapidly advancing climate change will impact the water cycle and its extremes remains poorly understood and is the origin of much uncertainty. This uncertainty limits our ability to build societal and ecosystem resilience – contributing to policy challenges for adaptation to water scarcity and other hydro-climatic risks. In this context, we rely on hydrologic simulation models to provide robust short-term predictions as well as long-term projections of water cycle dynamics across scales. Even though advancements in observational systems and increasingly detailed simulation models enable us to observe and simulate the water cycle at unprecedent resolutions over large domains, intercomparison studies still reveal inconsistent emergent model behavior. These large domain models are difficult to constrain using current observational datasets given that these are often highly imbalanced, while available theory provides only limited guidance regarding which hydrologic processes we can expect to dominate in diverse climates and landscapes. At the same time, the performance of machine learning models improves rapidly, bypassing process knowledge and therefore questioning the basic need for scientific understanding.

In this talk, I argue that process-based evaluation is an important bridge between hydrologic theory, observations and simulation models – even in the presence of high model complexity and significant data imbalances. I will discuss examples of how process-based evaluation can elicit controlling factors on hydrologic processes by utilizing hydrologically relevant gradients in both simulated and observed data. Thus, demonstrating how this approach can provide a pathway towards assessing and ultimately improving the consistency between perceived and simulated hydrologic process controls over large domains.

How to cite: Wagener, T.: Advancing hydrologic science through process-based evaluation of models, EGU General Assembly 2026, Vienna, Austria, 3–8 May 2026, EGU26-14330, https://doi.org/10.5194/egusphere-egu26-14330, 2026.

EGU26-13436 | ECS | Orals | HS2.4.5 | Highlight | HS Division Outstanding ECS Award Lecture by Larisa Tarasova

Water extremes under change: from processes to impacts 

Larisa Tarasova

A wide variety of processes controls characteristics of water extremes: river floods, droughts, episodes of detrimental streamwater quality. Understanding generation processes of these events may assist in uncovering their emergence and support the interpretation of their changes. Here I show how objective event identification and transferable causative classification frameworks are able to overcome the limitations of locally tailored approaches and detect functional changes in extremes over large spatial domains and long temporal scales.

To pave the way towards more efficient adaptation measures for extremes we need to understand intricate links between their hazard and impact components better. Here I demonstrate how different generation processes of extremes are interlinked with the adaptation efficiency, previous societal experiences and awareness uncovering how they might shape socio-economic impacts. The examples show how bridging across domains can help to improve our preparedness and anticipate future impacts.

How to cite: Tarasova, L.: Water extremes under change: from processes to impacts, EGU General Assembly 2026, Vienna, Austria, 3–8 May 2026, EGU26-13436, https://doi.org/10.5194/egusphere-egu26-13436, 2026.

EGU26-873 | ECS | Posters virtual | VPS8

Geo-statistical and hydrochemical assessment of spring water quality and water sustainability based on WHO standards in the Agadir Ida-Ou-Tanane region 

Aya Raïs, Abdellaali Tairi, Ahmed El Mouden, Safae Ijlil, Hamza Ait Moh, Mohammed Hssaisoune, and Lhoussaine Bouchaou

Water resources worldwide are increasingly threatened by growing anthropogenic pressures and inherent hydrogeological constraints, raising concerns about their suitability for domestic use. This study aims to assess the physicochemical quality of certain springs in the Agadir Ida-Ou-Tanane region and evaluate compliance with international thresholds established by the World Health Organization (WHO) for drinking water. A total of twenty-six water samples were collected across the studied region and analyzed for key parameters including Electrical Conductivity (EC), Total Dissolved Solids (TDS) and Total Hardness (TH). The EC values ranged from 275 µS/cm to 4210 µS/cm with an average of 1446.15 µS/cm. For Total dissolved solids, values ranged from 135 ppm to 7140 ppm, with Total hardness presented a maximum value of 3217.02 mg/L and minimum value of 188.9 mg/L. Water Quality Index (WQI) was calculated to provide an integrated evaluation of the overall water quality.Spatial distribution of water quality was further examined through Inverse Distance Weighting (IDW) interpolation. WQI based classification  revealed that 73.1% of the springs were in acceptable quality categories, with 34.6% classified as excellent and 38.5% as good. Despite this generally favorable status, TDS values approach or exceed international thresholds in several locations, indicating the need for region-wide monitoring and treatment strategies. Considering the heavy dependence of rural communities on spring water, these findings underscore the importance of investing in adequate treatment infrastructure and implementing robust protection measures for sustainable water resource management.

How to cite: Raïs, A., Tairi, A., El Mouden, A., Ijlil, S., Ait Moh, H., Hssaisoune, M., and Bouchaou, L.: Geo-statistical and hydrochemical assessment of spring water quality and water sustainability based on WHO standards in the Agadir Ida-Ou-Tanane region, EGU General Assembly 2026, Vienna, Austria, 3–8 May 2026, EGU26-873, https://doi.org/10.5194/egusphere-egu26-873, 2026.

EGU26-1058 | ECS | Posters virtual | VPS8

A Statistical Methodology for Regional Scale Future Projection of the Seasonal Frequency of Sub-daily Extreme Rainfall Events 

Abhay Varshney and Vemavarapu Venkata Srinivas

Sub-daily extreme rainfall (SDER) events frequently lead to natural disasters, including flash floods, urban floods, landslides, and soil erosion. It is essential to make a reliable prediction of its frequency at the local/regional spatial scale for the future period, in order to devise improved disaster mitigation and adaptation strategies. It has been observed that current CMIP6 GCMs have limitations in simulating short-duration (sub-daily) heavy rainfall events, and large biases are often observed in the control run simulations compared to historical observations at various locations worldwide. Hence, there is a lack of confidence in considering the crucial future projections obtained from those GCMs as reliable. In this study, we present a novel statistical methodology for predicting the seasonal frequency of SDER for 99 river sub-basins (RSBs) in India, encompassing tropical, temperate, arid, and polar climates across various topographies. The methodology identifies the scaling relationship between the SDER frequency and the associated potential atmospheric variables/drivers for each RSB. Results indicated that the seasonal frequency of SDER scales with (i) near-surface air temperature (SAT), and (ii) moisture content in the air, which is measured by near-surface dew-point temperature (DPT). The scaling relationship exhibits an increasing (scaling) phase followed by a decreasing (reverse scaling) phase as the (dew point) temperature increases. The range of SAT and DPT in the scaling relationship varies with RSB and climate. The SAT and DPT values at peak frequency are high for mountainous areas and lower for non-mountainous areas. The effectiveness of those scaling relationships in predicting SDER frequency at the seasonal scale was assessed/validated for the recent past (1981-2020). The method performed fairly well for RSBs with non-mountainous topography and moderately well for RSBs with mountainous topography across climate zones, except for years with an abnormally high or low SDER frequency. A finer spatial-resolution scaling relationship is deemed necessary for mountainous topographies where SDER exhibits a rather local nature. In addition, the time trends in simulated and observed frequencies closely matched. The proposed methodology is applied to predict the future seasonal frequency of SDER in the RSBs for different SSP climate scenarios till the end of the twenty-first century. The performance of various GCMs in projecting the seasonal frequency of SDER is also evaluated.

How to cite: Varshney, A. and Srinivas, V. V.: A Statistical Methodology for Regional Scale Future Projection of the Seasonal Frequency of Sub-daily Extreme Rainfall Events, EGU General Assembly 2026, Vienna, Austria, 3–8 May 2026, EGU26-1058, https://doi.org/10.5194/egusphere-egu26-1058, 2026.

In various parts of arid and semi-arid region of India such as Rajasthan people are mainly depended on groundwater for fulfil their daily demands like drinking and watering their crops. However, in the Khetri mining region of Jhunjhunu district, extensive mining and smelting of copper and associated sulfide minerals have led to heavy metal contamination and a deterioration in groundwater quality. Therefore, this study evaluates the overall groundwater quality and the related human health risks in the region severely affected by copper mining and metallurgical activities. We have collected total 59 groundwater samples from both pre- and post-monsoon periods and were examined for physicochemical parameters, cations, anions, and heavy metals (Pb, Cd, Cr, Cu, Fe). Multivariate analysis, including PCA and correlation, revealed that geogenic processes, such as carbonate and silicate weathering, dominate natural groundwater chemistry. Whereas anthropogenic inputs from mining, ore processing, agriculture, and industrial waste significantly elevate toxic metal concentrations. The elevated level of Pb, Cd and Cr were detected across many locations, often exceeding permissible limits. Non-carcinogenic risks (HI) for Cr, Pb and Cd surpassed the safe thresholds in many locations, and carcinogenic risks (CR) for Cr, Cd, and Pb exceeds the permitted limit of 1 × 10⁻⁴ at multiple sites, indicating significant long-term health threats. The integrated EWQI–Monte Carlo framework thus combines the objectivity of entropy-based weighting with the statistical power of probabilistic simulation, enabling a more realistic and comprehensive evaluation of both groundwater quality and the related human health risks. In addition of this, the risk assessment for human health (HRA) revealed that children are at more danger than adults due to their greater exposure per body weight. These findings clearly indicate an urgent need for groundwater quality management through the adoption of remediation actions and the exploration of alternative sources to protect community health from contaminated groundwater.

How to cite: Kumar, M., Pathania, T., and Gaurav, K.: Integrated EWQI–Monte Carlo framework for assessing groundwater quality and health risk in the Khetri mining region of Jhunjhunu district, Rajasthan, India, EGU General Assembly 2026, Vienna, Austria, 3–8 May 2026, EGU26-1227, https://doi.org/10.5194/egusphere-egu26-1227, 2026.

EGU26-3097 | ECS | Posters virtual | VPS8

sMARt riverbank filtration monitoring: how environmental tracers and high-resolution data support resilient drinking water supply 

Krzysztof Janik, Arno Rein, and Sławomir Sitek

Riverbank filtration (RBF) is a managed aquifer recharge (MAR) technique applied worldwide, operating at the river–groundwater interface and offering the potential to enhance both groundwater quantity and quality, thereby improving drinking water supply security. However, its sustainable implementation requires a robust understanding of hydraulic interactions between surface water and groundwater as well as hydrochemical processes, supported by targeted local and regional monitoring strategies. Moreover, recharge efficiency and water quality benefits may vary in response to seasonal and event-based fluctuations in river flow, upstream contaminant inputs, and site-specific aquifer heterogeneity. In our study, we investigated river water–groundwater mixing, along with bank filtrate residence times, to improve the understanding of recharge dynamics at the Kępa Bogumiłowicka RBF site, a key regional water supply system located near Tarnów, southern Poland. Environmental tracers, including stable water isotopes, chloride concentration, water temperature and specific electrical conductance, were combined with high-resolution hydrological, meteorological and groundwater abstraction records. The results demonstrate that RBF is the dominant aquifer recharge mechanism, contributing more than 90% of the year-round yield from seven production wells located near the riverbank. Based on this case study, we propose a practical and transferable framework for efficient RBF monitoring and management. The approach integrates multi-tracer observations with ensemble end-member mixing analysis (EEMMA), combining discrete sampling with continuous physicochemical and hydrometeorological monitoring over at least one hydrological year. This cost-effective workflow enables robust recharge-source assessment, supports the evaluation of both quantitative and qualitative groundwater status, and facilitates proactive responses to upstream pollution events and rapid hydrological changes. As such, it provides a valuable template for the long-term, sustainable and resilient management of MAR-based drinking water resources in shallow alluvial aquifers.

How to cite: Janik, K., Rein, A., and Sitek, S.: sMARt riverbank filtration monitoring: how environmental tracers and high-resolution data support resilient drinking water supply, EGU General Assembly 2026, Vienna, Austria, 3–8 May 2026, EGU26-3097, https://doi.org/10.5194/egusphere-egu26-3097, 2026.

Accurate or exact estimations of hydraulic conductivity (K) and infiltration rate are crucial for understanding soil-water interactions, optimising irrigation practices, evaluating groundwater recharge potential, and designing drainage systems. Conventionally laboratory permeability tests and in-situ infiltrometer tests, provide direct estimates of soil hydraulic behaviour. However, these methods have limitations of their point-specific nature and are unable to capture subsurface heterogeneity across larger spatial scales. In contrast, the electrical resistivity tomography (ERT) technique offers a non-invasive geophysical approach that is capable of detecting subsurface variations in soil electrical resistivity properties. The electrical resistivity estimates can further be interpreted to analyse soil types, soil layer structures, moisture and mineral contents, and pore connectivity. These are ultimately related to soil hydraulic properties, such as hydraulic conductivity and soil-water interaction behaviour, such as vertical infiltration rates. One of the accurate methods of estimating K is a pumping test, which is expensive and time-consuming. Other methods include laboratory permeameter tests, which require the collection of soil samples from the field, which often are disturbed ones and thus may produce K values with considerable uncertainties. The primary goal of this study is to establish the relationship between hydraulic conductivity (K) and electrical resistivity (ER) to replace the tests mentioned above. The second objective of this study is to establish an ER-infiltration rate relationship to convert point-based infiltration measurements into area-wide infiltration maps using resistivity data, minimizing the number of infiltrometer tests needed, saving time, manpower, and resources. Field investigations executed here involve ERT surveys using different electrode configuration arrays, such as the Wenner, Schlumberger, and dipole-dipole, across selected test sites that represent various soil textures and moisture conditions. The resistivity profiles are inverted to generate 2D subsurface sections, enabling identification of moisture zones and shallow saturation patterns. Parallelly, laboratory permeability tests are carried out on undisturbed soil samples to determine hydraulic conductivity, while infiltrometer tests are performed to obtain field-scale infiltration characteristics and steady-state infiltration rates. The combined dataset provided a comparative evaluation of resistivity variations in relation to measured soil-hydraulic parameters. Once these relationships are established, ERT can move beyond the simple imaging and serve as a fast and cost-effective way to estimate how water moves through the soil over a wider area. This will significantly reduce the need for frequent point-based tests and help capture natural variations in soil conditions that are often required in hydrological studies. Site evaluations can thus become faster and efficient, while areas with higher infiltration potential can be identified with greater confidence, and the overall planning of irrigation, drainage, and groundwater recharge strategies becomes more informed and robust.

Keywords: Electrical Resistivity Tomography (ERT); Hydro-geophysical characterization; Hydraulic Conductivity; Infiltration Rate; Groundwater recharge; Soil Heterogeneity.

How to cite: Jaiswal, M., Ganguly, S., and Prashanth, T.: Integration of electrical resistivity tomography, permeability and infiltrometer tests for modelling hydraulic conductivity and infiltration rates in the field, EGU General Assembly 2026, Vienna, Austria, 3–8 May 2026, EGU26-3766, https://doi.org/10.5194/egusphere-egu26-3766, 2026.

EGU26-4336 | ECS | Posters virtual | VPS8

“Environmental implications of natural sources of arsenic and boron in hydrothermal bodies in the second biggest lake of México.” 

Betsabe Atalia Sierra Garcia, Selene Olea, Isabel Israde Alcántara, Ruth Esther Villanueva Estrada, Eric Morales Casique, Olivia Zamora Martínez, Javier Tadeo León, Martha Gabriela Gómez Vasconcelos, Ramón Avellán Denis, and Nelly Ramírez Serrato

Lake Cuitzeo is the second biggest lake in Mexico. It is placed in a semi-graben
structure, linked to volcanic rocks and fault systems. On the lake shoreline,
hydrothermal bodies emerge. These present arsenic and boron concentrations and
are used in thermal spas. Nevertheless, it is necessary to study the original and
behavior of these hydrothermal bodies, which provides information for the
sustainable management in order to benefit the local users.
The objective of this work is to determine the spatial distribution of the
hydrothermal manifestations, as well as their hydrogeochemical characteristics and
the temperature they reach at depth. The methodology consisted of sampling thermal wells and springs, along with laboratory determination of major ions and
trace elements. Subsequently, hydrogeochemical diagrams, isoline maps, and
geochemical indicators were used to understand their behavior. The results show
that the thermal sites have higher temperatures at depth and are associated with
the presence of faults.
Finally, the information compiled in this study may be useful for defining a safe and
feasible use of the geothermal resource for the communities inhabiting the study
area, whether for energy generation or for direct-use applications.

How to cite: Sierra Garcia, B. A., Olea, S., Israde Alcántara, I., Villanueva Estrada, R. E., Morales Casique, E., Zamora Martínez, O., Tadeo León, J., Gómez Vasconcelos, M. G., Avellán Denis, R., and Ramírez Serrato, N.: “Environmental implications of natural sources of arsenic and boron in hydrothermal bodies in the second biggest lake of México.”, EGU General Assembly 2026, Vienna, Austria, 3–8 May 2026, EGU26-4336, https://doi.org/10.5194/egusphere-egu26-4336, 2026.

EGU26-5224 | ECS | Posters virtual | VPS8

Assessing spatio-temporal variations of groundwater level in the Damodar River basin, India using MODFLOW 

Ankita Kumari and Tinesh Pathania

The global demand for groundwater is expected to increase due to changing hydrological and population patterns. Hence, spatio-temporal characterization of groundwater is crucial for its sustainable management options. This study introduces a fully distributed groundwater simulation model, based on the MODFLOW framework, to understand the fluctuations in the groundwater table and basin-scale hydrological dynamics of the Damodar River basin (DRB) in India. Monthly simulations were conducted over a 5-year period (2015–2020) to quantify changes in groundwater head and interactions between the river aquifer and the watershed. Real field abstraction data were used to represent pumping components of water use in the MODFLOW model. Parameter Estimation Test (PEST) based calibration and validation were performed to estimate the unknown hydraulic conductivity and recharge. The model outcomes reasonably align with heads at the observation wells, thereby improving our understanding of the water table in large river basins. The findings highlight the influence of monsoon precipitation and the overall changes observed in DRB. Furthermore, the study combined the tributary stream network and PEST-calibrated recharge, which further enhanced the physical representation and accuracy of the model despite the additional data requirements. Decline in groundwater level was observed, which potentially highlights unsustainable water management practices in the river basin. The results underscore the significance of numerical groundwater models, which are crucial for informed decision-making in robust groundwater planning interventions.


Keywords: Groundwater, MODFLOW, PEST, recharge, river basin

How to cite: Kumari, A. and Pathania, T.: Assessing spatio-temporal variations of groundwater level in the Damodar River basin, India using MODFLOW, EGU General Assembly 2026, Vienna, Austria, 3–8 May 2026, EGU26-5224, https://doi.org/10.5194/egusphere-egu26-5224, 2026.

EGU26-6358 | Posters virtual | VPS8

Spatial Variability of Uranium in Shallow Aquifers of Semi-Urban Indian Landscapes 

Deepak Kumar, Shubhi Khare, and Sandhya Kurre

Uranium contamination in shallow aquifers is emerging as a concern for groundwater-quality issues across several parts of India. The present study evaluates the spatial distribution, concentration levels in shallow groundwater systems of selected semi-urban regions of India. Secondary data used in this assessment were obtained from the Central Ground Water Board (CGWB), covering semi-urban areas across all Indian states. The results reveal pronounced spatial heterogeneity in uranium concentrations, with numerous locations exceeding the permissible limits prescribed by the World Health Organization (WHO) and the Bureau of Indian Standards (BIS) for drinking water. Analysis of uranium concentration data for the period 2024–2025 indicates that shallow aquifers in parts of Karnataka, Punjab, and Rajasthan exhibit average uranium concentrations of approximately 133 ppb, 48 ppb, and 79 ppb, respectively, while maximum concentrations of 488 ppb, 202 ppb, and 119 ppb respectively, were recorded at select locations. A substantial proportion of groundwater samples were found to exceed WHO guideline values, highlighting widespread contamination concerns. The findings of this study offer critical insights for water-resource managers and policymakers in developing strategies to protect drinking-water security in uranium-affected regions of India.

How to cite: Kumar, D., Khare, S., and Kurre, S.: Spatial Variability of Uranium in Shallow Aquifers of Semi-Urban Indian Landscapes, EGU General Assembly 2026, Vienna, Austria, 3–8 May 2026, EGU26-6358, https://doi.org/10.5194/egusphere-egu26-6358, 2026.

EGU26-7784 | Posters virtual | VPS8

Research on the Adaptation Strategies of Urban Stormwater Drainage to Increased Rainfall Due to Climate Change 

ShengHsueh Yang, DerRen Song, MaoSong Huang, JyhHour Pan, XiJun Wang, ChenWei Chen, and KehChia Yeh

A 2024 climate change study in Taiwan indicated an increase in rainfall of approximately 10-35%, causing flooding in some urban areas where stormwater drainage systems exceeded their original design protection standards. Furthermore, urban stormwater drainage systems improvements in Taiwan often face complex and intertwined spatial issues related to road traffic and underground utility lines, making rapid engineering improvements difficult. Therefore, to address the threats already posed by climate change, the use of big data monitoring of urban areas and surrounding regions, along with rapid AI-powered algorithms for drainage systems, is imperative. The New Taipei City Government, in order to manage urban water information, has developed a series of adaptation strategies for its drainage system. These strategies address environmental factors such as drainage sections affected by tides and storm surges, rainfall characteristics in nearby mountainous areas, and sections with gates and pumping stations that cannot drain by gravity. The aim is to lower urban drainage levels to prevent flooding and shorten flooding duration. This includes practical operational recommendations and early flood warnings. The method is based on historical practical experience and AI-generated water level forecasts to conduct drainage system decision analysis and management value setting. It combines real-time rainfall data from the Internet of Things, road flooding sensors, road CCTV, stormwater sewer water levels, and pumping station water levels. The data used includes actual data from the past 3 hours, forecasted rainfall for the next 6 hours, tidal changes, and real-time water level information at various monitoring locations to formulate adjustment strategies. Synchronous information is released within the drainage system to systematically set stormwater sewer water levels, treating stormwater sewers as flood retention spaces for monitoring and water level control. Based on operational experience gained from the past 3 years of implementation, this method will be used in the future to address the threats posed by increased rainfall due to climate change and to formulate urban flood control strategies to reduce disaster losses.

How to cite: Yang, S., Song, D., Huang, M., Pan, J., Wang, X., Chen, C., and Yeh, K.: Research on the Adaptation Strategies of Urban Stormwater Drainage to Increased Rainfall Due to Climate Change, EGU General Assembly 2026, Vienna, Austria, 3–8 May 2026, EGU26-7784, https://doi.org/10.5194/egusphere-egu26-7784, 2026.

EGU26-8457 | Posters virtual | VPS8

Using a novel chain of models to mimic source aquifer depressurisation  impacts across the Doongmabulla Springs Complex , Queensland, Australia 

Anne Gibson, Richard Cresswell, Jarrah Muller, Samantha Capon, Rebekah Grieger, Penn Lloyd, David Stanton, and Miles Yeates

The Doongmabulla Springs Complex (DSC) is a cluster of groundwater-dependent wetlands located in central Queensland, Australia. The DSC has over 160 individual springs ranging from over 9 ha, with pools of water, down to vents less than 10 cm across, supporting individual grasses. The springs are home to a variety of plant species (many endemic) that are adapted to the unique physico-chemical parameters of the groundwater discharge on which they rely. Wetlands and scalds of the DSC support a listed Threatened Ecological Community of species dependent on this natural discharge of groundwater from underlying artesian aquifers of the Galilee Basin. The springs are protected under Australia’s State and Commonwealth Environmental legislation. 

Aquifer depressurisation due to mine dewatering occurring to the east of the springs has the potential to threaten spring biodiversity in future by reducing groundwater discharge and consequent wetland persistence. Assessing the likelihood and possible magnitude of these threats requires a multi-disciplinary modelling approach to address complex groundwater – surface water – ecosystem interactions: 1) define groundwater pressure change probabilities; 2) simulate likely wetland response; and 3) evaluate potential ecological impacts. Once such a modelling chain is in place, impact mitigation may be assessed, considering the effect of interventions at each stage of the chain.

To support the numerical modelling, extensive hydrological, ecological and physio-chemical data collection and analysis was undertaken to understand spring wetland area and species microhabitats and distributions over multiple scales and time frames, including seasonal and inter-annual variability. Generation of realistic and defensible conceptualisations for the springs is critical and is described in a companion paper (Cresswell, et al., these proceedings).

Regional numerical groundwater modelling (MODFLOW) generated potential groundwater pressure change responses relevant to the DSC source aquifers. Potential groundwater depressurisation over time at the individual spring locations was utilised in a wetland water balance model (GoldSim) to describe wetland persistence, size and seasonality. Water balance outputs were translated into spatial representations of predicted spring hydrology (TUFLOW), generating area and shape configurations that could be compared to historical wetland persistence data and then utilised to predict potential effects on suitable habitat for key flora species under a range of scenarios including mining-related groundwater drawdown and climate change using maximum entropy species distribution modelling (MaxEnt). This latter process relates known species’ occurrences to measurable variables that describe the environment (such as soil moisture, soil salinity and pH) to predict the presence or absence of a species at unsampled locations and under future groundwater drawdown scenarios. 

The results of the application of this novel chain of models have informed a revised impact assessment for the potential impacts of mine dewatering on the unique vegetation communities at the Doongmabulla Springs Complex and enables development of targeted mitigation approaches for individual wetlands and species.

How to cite: Gibson, A., Cresswell, R., Muller, J., Capon, S., Grieger, R., Lloyd, P., Stanton, D., and Yeates, M.: Using a novel chain of models to mimic source aquifer depressurisation  impacts across the Doongmabulla Springs Complex , Queensland, Australia, EGU General Assembly 2026, Vienna, Austria, 3–8 May 2026, EGU26-8457, https://doi.org/10.5194/egusphere-egu26-8457, 2026.

EGU26-8525 | ECS | Posters virtual | VPS8

Seasonal water uptake pattern in Agathis australis (kauri), a large and long-lived Southern Hemisphere conifer, using water stable isotopes  

Melanesia Boseren, Luitgard Schwendenmann, and Gretel Boswijk

Understanding seasonal water uptake depth (WUD) in trees is critical for assessing trees’ physiological responses to seasonal variability in microclimatic conditions and soil water availability. While broadleaf and conifer species in the Northern Hemisphere have been widely studied, studies of seasonal changes in WUD of large and long-lived evergreen conifers in the Southern Hemisphere are rare.

We investigated the effect of season and tree size on the water uptake pattern of Agathis australis (kauri), a large and long-lived endemic conifer, over an 18-month period. Our study site, a remnant kauri-dominated forest, is located in West Auckland, northern New Zealand. We collected stem cores from seven kauri trees (n = 3 < 50 cm diameter, n = 4 > 100 cm diameter) and soil samples underneath each of the seven trees (organic layer (OL), 0-10 cm, 10-20 cm, 20-30 cm, 30-50 cm, 50-70 cm, 70+ cm) across six seasons (austral spring 23,  austral summer 23-24, austral autumn 24, austral winter 24, austral spring 24, and austral summer 24-25). Water from soil and stem cores was extracted using cryogenic vacuum extraction. We measured δ2H and δ18O in all samples and used a Bayesian mixing model (MixSIAR) to determine WUD.

Our preliminary results show that across season and tree size, kauri obtained a larger proportion of water from the shallow layer (OL to 30 cm depth; ~ 60%) compared to ~ 40% sourced from layers below 30 cm. There was greater reliance on water from the shallow layer (up to 75%) during austral summer 23-24 and 24-25. We did not observe strong differences in WUD between small and large trees across our study seasons. These insights advance ecohydrological research on Southern Hemisphere evergreen conifers and highlight the importance of understanding species-specific response to microclimatic conditions and changing water availability.

How to cite: Boseren, M., Schwendenmann, L., and Boswijk, G.: Seasonal water uptake pattern in Agathis australis (kauri), a large and long-lived Southern Hemisphere conifer, using water stable isotopes , EGU General Assembly 2026, Vienna, Austria, 3–8 May 2026, EGU26-8525, https://doi.org/10.5194/egusphere-egu26-8525, 2026.

In arid and semi-arid regions, the agriculture thrives on the use of irrigation systems such as drip and sprinkler irrigation which ensures the higher irrigation application efficiencies. However, the planning and design of drip irrigation systems continue to rely on generic understanding and manual hydraulic calculations which often leads to sub-optimal performance. The present study addresses this gap by using a numerical model for analysing the drip irrigation for Okra Cultivation in a semi-arid district of Udaipur, Rajasthan, India. Therefore, the objectives of this study are analysing the hydraulic performance of the given network of drip irrigation using a numerical model and evaluate its adequacy and operational efficiency.

The hydraulic adequacy is determined using EPANET 2.2 modelling tool employing pressure driven demand (PDD) approach. The temporal variability in the behaviour of system was captured by running the extended period simulation model. The model incorporates operational control rules to define the variable demands for the different phases of the growth of the plant and scheduling the pump and valve operations thereby enabling the digital twin of the drip irrigation system. The source of water taken as well is explicitly represented in the model while the filtration unit is represented as a non-return valve with high loss coefficient. In addition to the watering, the fertigation of the crops is also simulated in the model according to the fertigation schedule.

The hydraulic performance of the irrigation system is evaluated using standard performance indicators  such as the Coefficient of Uniformity, Coefficient of Variation, and Distribution Uniformity. Furthermore, the reliability of system performance is assessed using network reliability parameter.  Thus, the study will assist farmers and stakeholders in achieving optimal operation of drip irrigation systems by addressing and minimizing the multiple technical and operational challenges associated with this irrigation method.

How to cite: Gupta, K.: Numerical Modelling of Drip Irrigation to Improve Water Use Efficiency in Semi-Arid Agroecosystems, EGU General Assembly 2026, Vienna, Austria, 3–8 May 2026, EGU26-8945, https://doi.org/10.5194/egusphere-egu26-8945, 2026.

EGU26-9012 | ECS | Posters virtual | VPS8

Ecohydrological Modelling of Annual Water Yield and Water-Related Ecosystem Services in the Semi-Arid Region of Warangal, India 

Swetha Dasari, Manali Pal, and Venkata Reddy Keesara

Urban and peri-urban regions in semi-arid India are increasingly exposed to contrasting climatic extremes, namely water scarcity and flooding, driven by complex interactions between anthropogenic pressures and biophysical processes. In this context, the present study investigates long-term changes in the annual water yield (AWY) ecosystem service across sub-watersheds of the Godavari River Basin encompassing the semi-arid Warangal district, Telangana, India. The InVEST AWY model is applied for two representative years, 1995 and 2025. The results indicate that AWY ranges from 460-890 mm yr⁻¹ in 1995, with relatively higher values in the north-eastern sub-watersheds, but declines across most sub-watersheds by 2025 to 220-690 mm yr⁻¹. The annual precipitation found to be 1400 to 1230 mm yr⁻¹ over the study period, while potential evapotranspiration increase substantially from 2253 to 2955 mm yr⁻¹, enhancing atmospheric evaporative demand and reducing water availability. Sensitivity analysis (expressed in terms of elasticity, E), shows that AWY is highly sensitive to precipitation variability (E = 1.84) and moderately negatively sensitive to urban-related biophysical parameters (root restricting depth: E = -0.42, crop coefficient (Kc): E = -0.39).  In contrast, sensitivity to potential evapotranspiration is lower (E = -0.36), highlighting the combined influence of climatic forcing and urban expansion. Spatially, urban land use in 1995 is concentrated in the central region, with cropland and forest dominating the western and eastern parts, respectively, yielding a mean AWY of 718.51 mm yr⁻¹. By 2025, relatively higher AWY zones shift toward the north-eastern region, reflecting reduced evapotranspiration associated with urban expansion; however, the overall mean AWY declines to 476.36 mm yr⁻¹, indicating that land-use changes influenced spatial patterns while climatic factors governed the temporal decline. The decline in AWY between 1995 and 2025 corresponds with reduced ecosystem service values (ESV) for water-yield related regulation services, particularly water regulation (ESV1995 = 16.37 to ESV2025 = 12.91 million US$) and water supply (ESV1995 = 84.73 to ESV2025 = 73.69 million US$). Overall, the findings demonstrate the joint role of climate variability and urbanization in shaping sub-watershed water yield and associated ecosystem services, providing insights for climate-responsive urban and landscape management.

How to cite: Dasari, S., Pal, M., and Keesara, V. R.: Ecohydrological Modelling of Annual Water Yield and Water-Related Ecosystem Services in the Semi-Arid Region of Warangal, India, EGU General Assembly 2026, Vienna, Austria, 3–8 May 2026, EGU26-9012, https://doi.org/10.5194/egusphere-egu26-9012, 2026.

EGU26-10663 | ECS | Posters virtual | VPS8

Groundwater Level Prediction in Urban Areas under Data Scarcity Using a Regionalized LSTM Framework 

Aatish Anshuman and Manish Panigrahi

Scarcity of groundwater level (GWL) data poses a significant challenge to effective groundwater resource modeling, particularly in urban and peri-urban regions where anthropogenic influences further complicate hydrological processes. In this study, a machine learning–based framework is developed to predict groundwater levels for Bhubaneswar city, India, using Long Short-Term Memory (LSTM) neural networks. Given the data-driven nature of machine learning models and the limited availability of long-term observations, a regionalized modeling approach is adopted by coalescing GWL measurements from 31 closely located monitoring wells. To enable the model to capture well-specific variability, each well is characterized using static indicators derived from hydrological and socio-environmental datasets. Multiple combinations of predictor variables are evaluated to identify those most effective in representing groundwater level dynamics. The optimal model, trained on aggregated regional data, demonstrates strong predictive performance during testing, with a correlation coefficient (R) of 0.89 and a Nash–Sutcliffe Efficiency (NSE) of 0.79. The proposed regionalized LSTM framework shows promise for reliable groundwater level prediction at individual wells in data-scarce urban settings, offering a practical tool for groundwater assessment and management.

How to cite: Anshuman, A. and Panigrahi, M.: Groundwater Level Prediction in Urban Areas under Data Scarcity Using a Regionalized LSTM Framework, EGU General Assembly 2026, Vienna, Austria, 3–8 May 2026, EGU26-10663, https://doi.org/10.5194/egusphere-egu26-10663, 2026.

EGU26-10790 | ECS | Posters virtual | VPS8

Ranked Multiscale Catalog of Precipitation Extremes using Cross Scale Extremity for the Indian Peninsular Region 

Sree Anusha Ganapathiraju, Paul Voit, Norbert Marwan, and Maheswaran Rathinasamy

Extreme precipitation events (EPEs) are expected to increase in frequency and intensity under global warming and can trigger various impacts such as floods and landslides, which can undermine the socio-economic stability by raising the risk of loss of human lives, infrastructure failure and agricultural losses. Consequently, the study of hydroclimatic extremes has grown substantially in the recent decades, supported by high-resolution data and multivariate event-based analytical frameworks that improve understanding and resilience to climate-related risks. The rainfall induced impacts often show a compound nature because the underlying processes are scale-dependent and can overlap and intensify each another. Therefore it is important to consider extremeness across spatio-temporal scales when assessing EPEs. However, the the complex topography and diverse climatic conditions in the Indian Peninsular region pose a key challenge in assessing and characterizing the EPEs. In this context, a comprehensive ranked catalog of EPEs is developed from the 73 year long data set, based on their extremity across spatio-temporal scales. To increase the robustness of the underlying statistical analysis and to make an optimal use of the data, a combination of the peak-over-threshold (POT) method and the cross-scale weather extremity index (xWEI) is introduced to quantify the spatiotemporal extremity. In addition, the study exemplifies the applicability of POT method and compares the resulting extremeness with the conventional annual maxima approach. The catalog identifies EPEs that are jointly extreme across spatial and temporal scales and distinguishes short-lived localized storms from persistent, widespread events, thereby enabling a systematic characterization of EPE typologies. By linking each EPEs xWEI value to the season and meteorological divisions, the catalog offers a consistent basis for comparing historical events, and advances process-based understanding of regional hazard regimes. In summary, the resulting catalog can be a valuable tool in improving the robustness of quantitative risk assessments and enhancing the reliability of climate change attribution analyses.

How to cite: Ganapathiraju, S. A., Voit, P., Marwan, N., and Rathinasamy, M.: Ranked Multiscale Catalog of Precipitation Extremes using Cross Scale Extremity for the Indian Peninsular Region, EGU General Assembly 2026, Vienna, Austria, 3–8 May 2026, EGU26-10790, https://doi.org/10.5194/egusphere-egu26-10790, 2026.

Groundwater contamination arising from mining activities represents a persistent and complex environmental challenge, particularly in coal-bearing regions where sulfide-rich mine overburden is extensively exposed to atmospheric conditions. Upon interaction with oxygen and moisture, pyrite oxidation generates acidic by-products and mobilizes dissolved constituents, such as ferrous, ferric iron, sulfate, and hydrogen ions. Understanding and predicting the spatiotemporal evolution of contaminant plumes in such systems remains challenging due to the coupled nature of variably saturated flow, multicomponent geochemical reactions, and microbially mediated processes. This study develops a comprehensive numerical modeling framework for simulating contaminant transport and remediation processes associated with oxidation reactions in unsaturated mine overburden systems. Variably saturated flow is represented through discretization of the governing flow equation in the vertical domain using hydraulic head-based parameters, and the resulting tridiagonal system of linear equations is efficiently solved using the Thomas algorithm. The model couples variably saturated groundwater flow, represented by Richards’ equation, with multicomponent reactive transport equations describing the generation and migration of key oxidation products (Fe²⁺, Fe³⁺, SO₄²⁻, and H⁺). In addition, sulfate reduction mediated by sulfate-reducing bacteria (SRB) is incorporated to capture biologically driven attenuation mechanisms relevant to natural and engineered remediation scenarios. Simulations are performed for a total of 22 years (8030 days). A time step of 0.1 day and a grid size of 0.2 m are identified as the optimal choices for the simulations. The simulation results indicate that the concentrations of oxidation-derived species decrease significantly from 200 to 40 mol/m³ in clay, 300 to 95 mol/m³ in loam, and 1 to 0.2 mol/m³ in sand. Sensitivity analysis shows that peak sulphate sensitivity in clay with a sensitivity index (SI) of 0.65 and in loam with an SI of 0.5 under high saturation condition (water content, wc = 0.9), while ferrous ions exhibit maximum sensitivity in loam under low saturation condition (wc = 0.2) with an SI of 750. The findings support the development of predictive frameworks that can inform sustainable groundwater management, optimize remediation strategies, and address key challenges in the practical application of contaminant transport models.

How to cite: Roy, G. and Sivakumar, B.: Hydrogeochemical Forensics of Pyrite Oxidation in Unsaturated Mine Overburden: A Numerical Simulation Framework for Groundwater Contaminant Migration., EGU General Assembly 2026, Vienna, Austria, 3–8 May 2026, EGU26-12747, https://doi.org/10.5194/egusphere-egu26-12747, 2026.

EGU26-13428 | ECS | Posters virtual | VPS8

Hydrogeological and Hydrochemical Characterization of Quarry Lakes in the Piedmont Alluvial Plain 

Giovanni Pigozzi, Alessandra Bianco Prevot, Lucia Biasio, Luca Carena, Daniele Cocca, Domenico Antonio De Luca, Elena Egidio, Manuela Lasagna, and Andrea Mittaridonna

Quarry lakes, primarily located in alluvial plains, form as a result of the deepening of quarry excavations beyond the water table of the shallow aquifer.

They allow for full exploitation of the deposit without excessively damaging the landscape, limiting land consumption. Quarry lakes play also an important ecological and landscape role, because they provide (i) habitats for aquatic plants, aquatic animal species and birds, and (ii) recreational opportunities. Additionally, they contribute to management of water resources and mitigation of flood risks.

In the Piedmont region (NW Italy), quarry lakes are numerous and of considerable size due to the high market demand for concrete and aggregates. These quarry lakes are mostly located along the Po River, the main river of the region, and its main tributaries.

This study focused on six active quarry lakes and, primarily, a hydrogeological reconstruction of the surrounding areas was carried out. Lake water samples were collected in the summer and autumn of 2025 and analysed for hydrochemical composition. Field parameters, including pH, electrical conductivity, and water temperature, were also recorded.

The hydrochemical results, compared with data from the regional network of groundwater monitoring wells, reveal a strong correlation between lake waters, the surface aquifer, and watercourses. The chemical characterization of these quarry lakes supports the study of their  photochemical activity, and the assessment of their potential use as nature-based basins for quaternary treatment of water, thus allowing to minimize the overexploitation of groundwater resources in a context of more frequent drought events due to climate change.

How to cite: Pigozzi, G., Bianco Prevot, A., Biasio, L., Carena, L., Cocca, D., De Luca, D. A., Egidio, E., Lasagna, M., and Mittaridonna, A.: Hydrogeological and Hydrochemical Characterization of Quarry Lakes in the Piedmont Alluvial Plain, EGU General Assembly 2026, Vienna, Austria, 3–8 May 2026, EGU26-13428, https://doi.org/10.5194/egusphere-egu26-13428, 2026.

EGU26-15246 | Posters virtual | VPS8

Nitrate behavior in a groundwater flow system that discharges into the largest lakes of Mexico 

Aurora Guadalupe Llanos Solis, Selene Olea Olea, Eric Morales Casique, Olivia Zamora Martínez, Javier Tadeo León, Martha Gabriela Goméz Vasconcelos, Denis Ramón Avellán, and Nelly Ramírez Serrato

The nitrate input in the groundwater and surface water is the main source of contamination in many areas of the world. In Mexico, agricultural activities depending of groundwater and surface water. The groundwater flow system (GFS) is a single system with recharge and discharge zone were the interactions between surface and groundwater are present. In Mexico, the Cuitzeo GFS is a is one of the most agriculturally developed areas in central Mexico and includes the second and third largest lakes, lakes Cuitzeo and Patzcuaro.
The main object of this work is to analyze the nitrate behavior in groundwater and lake waters to understand the spatial changes over two years.
The methodology includes sampling of major ions of 39 sites, including wells, dugwells, springs, and lakes in the dry season for the years 2024 and 2025. Additionally, hydrogeochemical diagrams and spatial analysis were developed. The nitrate concentrations in this country are regulated by Mexican rules.
The results show that 11 sites exceed the permitted limit of concentrations according to these rules. Nitrates predominate in the zone of major population close to Morelia city and close to Lake Cuitzeo. Whereas ammonium is present close to the lake Patzcuaro. These distributions are in groundwater and surface waters, reflecting the same processes in both water bodies. This area presents a rapid expansion and intensification of berry and avocado cultivation, which have displaced local crops and driven unsustainable patterns of agricultural water use.
This study provided valuable information about the source and quantification of nitrate species contaminations, which can help to generate new management strategies.

How to cite: Llanos Solis, A. G., Olea Olea, S., Morales Casique, E., Zamora Martínez, O., Tadeo León, J., Goméz Vasconcelos, M. G., Avellán, D. R., and Ramírez Serrato, N.: Nitrate behavior in a groundwater flow system that discharges into the largest lakes of Mexico, EGU General Assembly 2026, Vienna, Austria, 3–8 May 2026, EGU26-15246, https://doi.org/10.5194/egusphere-egu26-15246, 2026.

EGU26-15319 | ECS | Posters virtual | VPS8

Groundwater quality assessment in semi-arid Morocco: spatial analysis and monitoring 

Aicha Mouncif, Oussama Nait-Taleb, Morad Karroum, Samira Krimissa, Mustapha Namous, and Abdenbi Elaloui

Groundwater is a critical water resource in Morocco, particularly in semi-arid regions where agricultural demand and local uses place increasing pressure on aquifers. In this setting, a clear and spatially explicit assessment of groundwater quality is essential to support monitoring strategies and contribute to more sustainable water management.

This study presents an approach for characterizing groundwater quality in a semi-arid area of Morocco based on physico-chemical analyses of groundwater samples collected from wells and springs. Water quality is identified through the computation of a groundwater quality index derived from multiple measured parameters, providing a synthetic and comparable metric across sampling points. The results are then integrated within a Geographic Information System (GIS) framework to explore spatial patterns and support interpretation at the territorial scale. Spatial interpolation is used to map the distribution of both the individual parameters and the quality index, highlighting local contrasts and potential hotspots within the study area.

Overall, the findings indicate generally satisfactory groundwater quality, while also revealing localized variations that justify targeted follow-up and site-specific attention. The proposed workflow is transferable and can be adapted to other semi-arid settings in Morocco to support diagnosis, prioritization of actions, and long-term, sustainable groundwater resource management.

Keywords : Groundwater quality; Morocco; semi-arid environment; physico-chemical parameters; water quality index; GIS; spatial interpolation; mapping; sustainable water management


How to cite: Mouncif, A., Nait-Taleb, O., Karroum, M., Krimissa, S., Namous, M., and Elaloui, A.: Groundwater quality assessment in semi-arid Morocco: spatial analysis and monitoring, EGU General Assembly 2026, Vienna, Austria, 3–8 May 2026, EGU26-15319, https://doi.org/10.5194/egusphere-egu26-15319, 2026.

EGU26-16051 | ECS | Posters virtual | VPS8

Characterization of Paleochannel and Floodplain Aquifers Using Vertical Electrical Sounding: A Case Study from the Western Part of Bengal Basin 

Ankit Dipta Dutta, Akhilesh Kumar Yadav, Abhijit Mukherjee, and Probal Sengupta

The subsurface architecture of paleochannel and floodplain deposits, as well as their hydrogeological significance, remains insufficiently characterized in the Ganges upper delta region. The present study evaluates the hydrogeological implications for groundwater resource assessment and aquifer vulnerability in Chakla, North 24 Parganas, West Bengal. Descriptions and discrimination of different subsurface regimes are provided based on electrical resistivity. Vertical Electrical Sounding (VES) surveys are conducted at 51 sites, distributed across paleochannel (np = 31) and floodplain (nf = 20) geomorphic settings. Six-layer resistivity models are developed for each site through inversion analysis. Regime-specific hydrogeological properties are quantified through non-parametric statistical testing (Wilcoxon rank-sum and Kruskal-Wallis) on the modeled VES data. Furthermore, longitudinal conductance and transverse resistance, as obtained from the Dar-Zarrouk parameter analysis, are explored. VES inferences are found to be in well accordance with the borehole lithology from six cores. Paleochannel aquifers and floodplain aquitards exhibit significantly different resistivity distributions due to different grain sizes and saturation. Paleochannel sites reveal higher median resistivity (49.5 Ω·m) and coarser grain sizes, indicating high-capacity aquifers with enhanced investigation depth. On the other hand, floodplain sites are characterized by lower resistivity (19.2 Ω·m), finer grain sizes, and low-permeability confining layers. The findings of the present study support targeted groundwater exploration in paleochannel zones and aquifer protection in floodplain areas, providing key insights for water supply assessment and contaminant vulnerability.

Keywords: Vertical Electrical Sounding (VES), Paleochannel aquifer, Electrical resistivity, Dar-Zarrouk parameters, Hypothesis testing, Non-parametric statistics

How to cite: Dutta, A. D., Yadav, A. K., Mukherjee, A., and Sengupta, P.: Characterization of Paleochannel and Floodplain Aquifers Using Vertical Electrical Sounding: A Case Study from the Western Part of Bengal Basin, EGU General Assembly 2026, Vienna, Austria, 3–8 May 2026, EGU26-16051, https://doi.org/10.5194/egusphere-egu26-16051, 2026.

EGU26-16155 | ECS | Posters virtual | VPS8

Microbial Heterogeneity Outweighs Sediment Variability in Regulating Hyporheic Nitrogen Removal 

Yang Xian, Zhiping Xiao, Zhang Wen, and Stefan Krause

The hyporheic zone serves as a critical hotspot for nitrogen attenuation, driven by flow in streambed sediments, biogeochemical reactions, and enhanced microbial activity. It has, however, yet to be determined how the interaction of heterogeneity in sedimentary physical (e.g., permeability) and chemical (e.g., organic matter content) properties influences nitrogen cycling in complex hyporheic environments. Here we developed numerical models coupling porous flow, reactive transport, and microbial dynamics for realistic heterogeneous streambed scenarios. Simulations reveal that small-scale spatial variations in sediments physical and chemical properties exert negligible effects on nitrogen removal, whereas the spatial heterogeneity in functional microbial biomass dominates nitrogen removal dynamics. This is caused by biofilm-induced bioclogging that drastically reduces hyporheic exchange, thereby weakening the role of sedimentary heterogeneity. This study represents the first quantitative assessment of how sedimentary and microbial spatial heterogeneities jointly regulate nitrogen removal in hyporheic systems, offering critical insights for predictive modeling of bedform interfaces.

How to cite: Xian, Y., Xiao, Z., Wen, Z., and Krause, S.: Microbial Heterogeneity Outweighs Sediment Variability in Regulating Hyporheic Nitrogen Removal, EGU General Assembly 2026, Vienna, Austria, 3–8 May 2026, EGU26-16155, https://doi.org/10.5194/egusphere-egu26-16155, 2026.

EGU26-16236 | ECS | Posters virtual | VPS8

Flood-Driven Groundwater Recharge for India  

Ritaja Roy and Vimal Mishra

Rapid groundwater depletion, driven by intensive pumping and growing climate variability, poses a critical threat to water security across India. Concurrently, climate change is intensifying the frequency and magnitude of flood events, generating episodic but potentially significant opportunities for natural aquifer replenishment. However, the contribution of floods to groundwater in India remains poorly quantified. In this study, we systematically quantify flood‐driven groundwater recharge across the major river basins of India. Using the integrated, physically based ParFlow-CLM hydrological model, we evaluate three fundamental attributes of flood recharge: (i) the contribution of flood runoff to total groundwater recharge, (ii) the temporal lag between flood peaks and aquifer response, and (iii) the persistence of flood‐induced recharge signals following an event. These metrics are evaluated across diverse hydrogeological settings to identify where floodwaters are most effectively captured and retained within aquifers. Our results show strong spatial contrasts in flood recharge efficiency. The highly permeable alluvial aquifers of the Indus, Ganga and Brahmaputra basins exhibit the highest flood-to-recharge contribution and the longest persistence, indicating a strong capacity to capture and retain floodwater. In contrast, less permeable and fractured hard-rock aquifers in large parts of central and southern India show weaker and shorter-lived recharge responses to floods. By explicitly linking flood dynamics to subsurface hydrologic response, this study provides a framework for identifying priority regions for flood‐based groundwater management. The results demonstrate how increasing flood extremes under climate change can be strategically harnessed to enhance the resilience of India’s groundwater resources.

How to cite: Roy, R. and Mishra, V.: Flood-Driven Groundwater Recharge for India , EGU General Assembly 2026, Vienna, Austria, 3–8 May 2026, EGU26-16236, https://doi.org/10.5194/egusphere-egu26-16236, 2026.

EGU26-16340 | Posters virtual | VPS8

Propagation of Meteorological Drought to Groundwater Drought in India 

Aayush Aayush and Vimal Mishra

Groundwater drought poses a growing threat to water security in India, as groundwater supplies support agriculture, ecosystems, and domestic use. Although meteorological and hydrological droughts and their propagation have been studied, the propagation of drought into groundwater systems in India has not been examined. In this study, we employed Standardized Precipitation Index (SPI), the CGWB-based Standardized Groundwater Index (SGI), and the GRACE-based Groundwater Storage Anomaly (GWSA) to investigate meteorological drought and groundwater drought across the Indian region. We estimated drought propagation duration, recovery duration, mean drought duration, and maximum drought duration. The results show that regions in the north, northwest, northeast, and a few regions in southern India have the longest propagation time from meteorological to groundwater drought, while other zones, such as central India, have relatively shorter propagation times. We also find that regions in northeast and northwest India recover faster from groundwater droughts than other regions. Our results also show that the Dryness Index (DI), Seasonality Index (SI), and Land Surface Controls (NDVI, soil moisture (SM), and Evapotranspiration (ET)) play a significant role in the propagation time of meteorological to groundwater droughts across different zones. Overall, understanding the propagation and recovery plays a vital role in aiding effective management and planning of groundwater resources in India.

How to cite: Aayush, A. and Mishra, V.: Propagation of Meteorological Drought to Groundwater Drought in India, EGU General Assembly 2026, Vienna, Austria, 3–8 May 2026, EGU26-16340, https://doi.org/10.5194/egusphere-egu26-16340, 2026.

EGU26-17910 | Posters virtual | VPS8

Understanding the drivers of hydraulic redistribution under salt stress 

Dvir Hochman and Nimrod Schwartz

Hydraulic redistribution (HR), the passive movement of water through plant root systems from wet to dry soil layers, plays a critical role in maintaining plant water status and nutrient uptake in water-limited environments. While HR is well-documented under drought, its dynamics become significantly more complex in saline conditions where total soil water potential is driven by both matric and osmotic components.

In this study, we employed a split-root experimental design using young avocado trees to isolate and quantify HR. The root system of each tree was divided between two pots: a "wet pot" maintained at field capacity and a "drying pot" where irrigation was withheld. We utilized high-precision weighing lysimeters to monitor nocturnal weight changes in the drying pot, alongside soil moisture sensors and isotopic water labelling to track water movement.

Our preliminary results confirm the occurrence of HR in young avocado trees under non-saline control conditions. The phenomenon was clearly identified in two out of three trees monitored during the initial experimental phase, as evidenced by nocturnal increases in soil water content and corresponding weight changes in the drying pots. These findings provide a foundational baseline for the next phase of the research, which aims to evaluate how increasing levels of salt stress (NaCl) in the wet pot influence the osmotic gradients and root hydraulic conductivity that drive HR. By comparing control and saline treatments, we seek to determine whether salinity-induced changes in total water potential suppress or shift the patterns of hydraulic redistribution.

How to cite: Hochman, D. and Schwartz, N.: Understanding the drivers of hydraulic redistribution under salt stress, EGU General Assembly 2026, Vienna, Austria, 3–8 May 2026, EGU26-17910, https://doi.org/10.5194/egusphere-egu26-17910, 2026.

Soil Aquifer Treatment (SAT) relies on biogeochemical processes occurring within the vadose zone to improve the quality of secondary treated wastewater during infiltration. Dissolved organic matter (DOM) is a key driver of these processes; however, its depth-dependent transformation within the soil profile remains insufficiently resolved at the molecular level under field conditions.

In this study, we investigated the vertical evolution of fluorescent dissolved organic matter (fDOM) within the soil profile of a full-scale SAT infiltration basin. Soil samples were collected from successive depths along the vadose zone, representing progressive stages of soil–water interaction during infiltration. DOM composition was characterized using excitation–emission matrix (EEM) fluorescence spectroscopy with inner-filter correction and Raman normalization. Fluorescence data were analysed using Coble peak integration and Parallel Factor Analysis (PARAFAC) to resolve independent fluorescent components and assess their depth-dependent behaviour.

The results reveal pronounced vertical stratification of DOM composition within the soil profile. Shallow soil layers are dominated by protein-like fluorescence associated with labile, wastewater-derived organic matter. With increasing depth, these protein-like signals show strong attenuation, while humic-like fluorescence becomes increasingly dominant. Coble peak analysis indicates preferential removal of tryptophan- and tyrosine-like peaks (B and T), whereas humic-like peaks (A, C, and M) persist at depth. PARAFAC modelling further identifies distinct fluorescent components exhibiting contrasting depth trends, with protein-like components rapidly decreasing in intensity and humic-like components remaining relatively stable or proportionally enriched.

These findings demonstrate that SAT acts as a selective biogeochemical filter within the soil profile, where biodegradation and sorption processes preferentially remove reactive DOM fractions in the upper vadose zone while more refractory humic material persists at depth. The combined use of EEM–PARAFAC provides mechanistic insight into DOM transformation pathways during soil aquifer treatment and highlights the importance of depth-resolved fluorescence analysis for improving process-based understanding of SAT performance.

How to cite: Adler‬‏, O.: Vertical transformation of fluorescent dissolved organic matter within the soil profile of a soil aquifer treatment basin, EGU General Assembly 2026, Vienna, Austria, 3–8 May 2026, EGU26-19818, https://doi.org/10.5194/egusphere-egu26-19818, 2026.

EGU26-20263 | ECS | Posters virtual | VPS8

Controls and Predictability of Large Floods in the Brahmaputra River Basin 

Gayathri Vangala and Vimal Mishra

The Brahmaputra River Basin is among the most flood-prone regions globally, experiencing recurrent large floods with severe socio-economic and ecological impacts. Despite extensive flood management interventions, forecasting skill remains limited due to the basin’s complex hydrology, strong monsoon variability, and pronounced land–atmosphere interactions. This study investigates the drivers and dynamics of large floods in the Brahmaputra Basin, with a particular emphasis on coupled land–atmosphere processes. We conduct a composite analysis of major flood events using reanalysis datasets, satellite observations, and hydrological records. Our results show that large floods are consistently associated with anomalously high atmospheric moisture content, extreme and spatially extensive precipitation, and elevated antecedent soil moisture that amplifies runoff generation. The concurrence of saturated catchments with persistent multiday monsoon rainfall leads to rapid escalation of flood magnitude and prolonged flood duration. In addition, enhanced moisture transport into the basin emerges as a critical contributor to the development of large flood events. By integrating these insights into coupled land–atmosphere modeling frameworks, we demonstrate that improved representation of soil moisture dynamics, rainfall persistence, and moisture transport pathways can substantially enhance flood predictability. This work advances the understanding of flood-generating mechanisms in monsoon-dominated river basins and provides actionable insights for improving early warning systems and adaptive flood risk management in the Brahmaputra Basin.

How to cite: Vangala, G. and Mishra, V.: Controls and Predictability of Large Floods in the Brahmaputra River Basin, EGU General Assembly 2026, Vienna, Austria, 3–8 May 2026, EGU26-20263, https://doi.org/10.5194/egusphere-egu26-20263, 2026.

EGU26-21596 | ECS | Posters virtual | VPS8

Comprehensive Evaluation of Baseflow Separation Methods for Peninsular India 

Paleru Samyuktha, Saket Dubey, and Swapnil Gautam

Reliable baseflow estimation plays a crucial role in water resource management across India's monsoon-dominated landscapes, where groundwater contributions sustain river flows through extended dry periods. This study addresses persistent data limitations in Central and Southern India by first compiling daily streamflow records from 4,862 basins sourced from the India Water Resources Information System (IWRIS), followed by rigorous pre-processing and quality control steps that yielded suitable data for analysis across hundreds of representative basins. A comprehensive evaluation of 12 baseflow separation methods was then conducted using Kling-Gupta Efficiency (KGE) against hydrologically verified baseflow benchmarks, revealing digital filter techniques, particularly the Eckhardt filter (median KGE of 0.88) as superior to conventional graphical methods across diverse hydrological regimes. These findings affirm digital filters' reliability for capturing baseflow variability in monsoon recharge areas and arid inland zones, laying a strong foundation for advanced hydrological modeling in data-constrained environments.

Keywords: Baseflow Separation, Digital Methods


How to cite: Samyuktha, P., Dubey, S., and Gautam, S.: Comprehensive Evaluation of Baseflow Separation Methods for Peninsular India, EGU General Assembly 2026, Vienna, Austria, 3–8 May 2026, EGU26-21596, https://doi.org/10.5194/egusphere-egu26-21596, 2026.

EGU26-1436 | Posters virtual | VPS9

Comparative Evaluation of the Newly Developed HIDROTURK-Phase II Hydrological Model in the North Marmara River Basin, Türkiye 

Meltem Kacikoc, Buket Mesta, Okan Fistikoglu, Huseyin Ozkaya, and Kubra Ozdemir-Calli

Abstract

Reliable hydrological modelling tools that can operate with the type and quality of data commonly available at the basin scale are essential for effective water resources planning. In recent years, the HIDROTURK model has been developed to support national hydrological assessments in Türkiye, especially in modelling tasks undertaken as part of river basin management planning processes. This study presents one of the first comprehensive evaluations of the newly updated HIDROTURK Phase II model and compares its performance with the AQUATOOL + EVALHID hydrological modelling system. The North Marmara River Basin was selected as the test region due to its complex hydrological structure and diverse sub-basin characteristics.

Hydrological simulations were carried out using long-term meteorological inputs derived from precipitation and evapotranspiration records for the period 1989–2014, enabling the examination of the models under a wide range of climatic conditions. Streamflow outputs were compared with observations at 14 calibration points, and model performance was assessed using the Nash–Sutcliffe Efficiency (NSE) and Percent Bias (PBIAS) indicators.

The results indicate that the meteorological inputs generated through HIDROTURK’s internal processing tools show a high level of agreement with data prepared using more traditional methods, and that both models produced comparable flow patterns under similar conditions. Overall, the findings demonstrate that HIDROTURK Phase II exhibits stable behavior even at this early stage of development and provides a practical and reliable alternative for hydrological simulations.

Keywords: Hydrological Modelling; Basin-Scale Simulation; Model Comparison; Model Performance Evaluation; Streamflow Calibration

ACKNOWLEDGEMENT: The authors would like to express their gratitude to the projects “Technical Assistance on Preparation of River Basin Management Plans for Six Basins (EuropeAid/140294/IH/SER/TR)” and “Development and Sustainability of the HIDROTURK Model Project” for their support. The authors also thank the Directorate General for Water Management, the State Hydraulic Works, and the General Directorate of Meteorology for providing essential data.

How to cite: Kacikoc, M., Mesta, B., Fistikoglu, O., Ozkaya, H., and Ozdemir-Calli, K.: Comparative Evaluation of the Newly Developed HIDROTURK-Phase II Hydrological Model in the North Marmara River Basin, Türkiye, EGU General Assembly 2026, Vienna, Austria, 3–8 May 2026, EGU26-1436, https://doi.org/10.5194/egusphere-egu26-1436, 2026.

EGU26-2612 | ECS | Posters virtual | VPS9

Evaluating a Long Short-Term Memory (LSTM) approach for Snow Water Equivalent (SWE) downscaling and hydrological modeling in mountainous terrain 

seyedeh hadis moghadam, Richard Arsenault, André St-Hilaire, and Frédéric Talbot

In the context of the global hydrological cycle, runoff generated from snowmelt plays a key role in water availability, particularly in cold and mountainous regions. In many parts of Canada and the western United States, mountain snowpacks act as natural reservoirs by storing precipitation during cold seasons and releasing it during spring and summer. Accurate estimation of snow water equivalent (SWE) is therefore essential for hydropower reservoir operation, snow-related hazard assessment, and hydrological modeling. However, the coarse spatial resolution of widely available SWE products in northern latitudes, combined with complex mountain topography, introduces substantial uncertainty in their direct application to hydrological models. High-resolution SWE mapping remains a major challenge in these environments. In this study, we propose a multifactor SWE downscaling framework based on a Long Short-Term Memory (LSTM) deep learning approach, applied to the Nechako River watershed in British Columbia, Canada. The framework uses ERA5-Land SWE at 10 km resolution as the target variable, with predictor variables including precipitation, minimum and maximum temperature, solar radiation, and 2-m dewpoint temperature, together with static physiographic information such as elevation and land cover. Daily data from 1981 to 2024 are considered. The model is trained and evaluated at the 10 km resolution before being applied to generate SWE at 5 km resolution, corresponding to the spatial resolution of the CEQUEAU hydrological model. The downscaled SWE fields are designed to retain the large-scale snow patterns provided by ERA5-Land, while adding more spatial detail based on local elevation and land cover. Current work focuses on incorporating these downscaled SWE estimates into the CEQUEAU hydrological model and comparing the resulting runoff simulations with those obtained using CEQUEAU’s internal SWE representation. Rather than aiming to demonstrate clear improvements at this stage, the goal is to better understand how different SWE inputs influence the simulated hydrological response. Preliminary results suggest that LSTM-based downscaling offers a flexible and promising way to generate intermediate-resolution SWE fields in mountainous regions. This approach shows potential as a practical link between coarse-resolution reanalysis products and distributed hydrological models used for water resources and hydropower studies.

How to cite: moghadam, S. H., Arsenault, R., St-Hilaire, A., and Talbot, F.: Evaluating a Long Short-Term Memory (LSTM) approach for Snow Water Equivalent (SWE) downscaling and hydrological modeling in mountainous terrain, EGU General Assembly 2026, Vienna, Austria, 3–8 May 2026, EGU26-2612, https://doi.org/10.5194/egusphere-egu26-2612, 2026.

EGU26-4141 | ECS | Posters virtual | VPS9

Geostatistical Interpolation Approach for Improving Flood Simulation Within a Data- Scarce Region in the Tibetan Plateau 

kanon guedet guede, Zhongbo Yu, and Florentin Hofmeister

The complex orography of the Tibetan plateau (TP) and the scarcity and uneven spatial distribution of meteorological stations 
present significant challenges in accurately estimating meteorological variables for hydrological simulations. This study aims 
to enhance the accuracy of daily precipitation and temperature interpolation for hydrological simulations in the Lhasa River 
Basin (LRB), particularly during flood events. We evaluate and compare the performance of deterministic Inverse Distance 
Weighting—IDW and geostatistical (Ordinary Kriging—OK and Kriging with External Drift—KED) interpolation methods for 
estimating precipitation and temperature patterns. Subsequently, we investigate the influence of different interpolation meth
ods on hydrological simulations by using the interpolated meteorological data as input for the Water Balance Simulation Model 
(WaSiM) to simulate daily discharge in the LRB. Our results revealed that geostatistical methods, specifically OK and KED, are 
more effective in capturing the spatial variability and anisotropy inherent in precipitation patterns influenced by the Indian 
summer monsoons. In addition, the KED method effectively captured the daily variation of the temperature lapse rate, indicating 
the inadequacy of using a constant lapse rate for hydrological modelling in high- elevation regions like the TP. The geostatistical 
technique outperformed the Deterministic method, with KED realising the best temperature and precipitation interpolation 
performance based on cross- validation results. However, although KED provides superior results based on cross- validation per
formance, applying its precipitation interpolation as input into WaSiM led to the poorest discharge simulation. The combination 
of OK for precipitation and KED for temperature produced the most accurate discharge simulations in the LRB, highlighting 
the importance of not solely relying on cross- validation results but also considering the practical implications of interpolation 
methods on hydrological model outputs. Our study offers a robust framework for improving flood simulations and water resource 
management in a data- scarce, high- elevation region like the TP.

How to cite: guede, K. G., Yu, Z., and Hofmeister, F.: Geostatistical Interpolation Approach for Improving Flood Simulation Within a Data- Scarce Region in the Tibetan Plateau, EGU General Assembly 2026, Vienna, Austria, 3–8 May 2026, EGU26-4141, https://doi.org/10.5194/egusphere-egu26-4141, 2026.

EGU26-5160 | ECS | Posters virtual | VPS9

Solute dispersion from continuous point sources in ice-covered turbulent flows with bed absorption 

Sandipan Paul and Koeli Ghoshal

A numerical investigation is conducted to study the steady-state concentration field
when a solute is released from multiple continuous line sources in an ice-covered
channel with an absorbing bed under turbulent flow conditions. The governing
equations are solved using the Crank-Nicolson scheme by adopting a two-power law
velocity and a quartic eddy diffusivity profile, which is influenced by the roughness of
the bed layer and the ice cover. Validation against earlier numerical results for a
specific case reveals strong consistency in the concentration profiles. The findings
highlight how the roughness of the boundaries affects the solute concentration. It
further demonstrates the effect of the bed absorption parameter in the early mixing
stages when solute is released near the bed. For zero bed absorption, the solute
concentration asymptotically attains a uniform far-field value of unity, while any non-
zero bed absorption leads to complete depletion of solute downstream.

How to cite: Paul, S. and Ghoshal, K.: Solute dispersion from continuous point sources in ice-covered turbulent flows with bed absorption, EGU General Assembly 2026, Vienna, Austria, 3–8 May 2026, EGU26-5160, https://doi.org/10.5194/egusphere-egu26-5160, 2026.

EGU26-5899 | Posters virtual | VPS9

High-performance task-based water balance modeling 

Octavio Castillo Reyes, Junjie Li, Ashkan Hassanzadeh, and Enric Vázquez-Suñé

Water balance modeling plays a pivotal role in sustainable water management, as it underpins the understanding of hydrological processes that govern resource distribution, ecosystem stability, and long-term environmental planning. Accurate and efficient computational tools are essential to capture the spatial and temporal dynamics of water balance, particularly in complex geological and urban environments. WaterpyBal is an innovative modeling framework specifically designed to construct spatial-temporal water balance models. It effectively integrates multiple stages of hydrological assessment-including data interpolation, evapotranspiration estimation, and infiltration computation-while accounting for soil heterogeneity and components of the urban water cycle. The tool demonstrates robust performance when applied to both synthetic and experimental datasets, providing reliable and scalable results.

In the context of the exascale era, where data-intensive environmental models demand unprecedented computational power, High-Performance Computing (HPC) frameworks are essential to ensure scalability and efficiency. To this end, WaterpyBal has been enhanced through its integration with PyCOMPSs, the Python binding of the COMPSs programming model. PyCOMPSs enables the transparent parallelization of Python applications by identifying task-level parallelism through annotated methods and dynamically constructing a task-dependency graph during runtime. This graph-driven execution model allows efficient scheduling and data management across distributed computing infrastructures such as clusters and cloud platforms.

The integration of WaterpyBal with PyCOMPSs significantly improves its computational performance, enabling the simulation of large-scale, high-resolution water balance models within feasible timeframes. This work demonstrates the potential of combining advanced hydrological modeling with state-of-the-art parallel computing frameworks to address emerging challenges in environmental modeling and resource management at scale.

How to cite: Castillo Reyes, O., Li, J., Hassanzadeh, A., and Vázquez-Suñé, E.: High-performance task-based water balance modeling, EGU General Assembly 2026, Vienna, Austria, 3–8 May 2026, EGU26-5899, https://doi.org/10.5194/egusphere-egu26-5899, 2026.

EGU26-6269 | ECS | Posters virtual | VPS9

Climate Driven Hydrological Intensification and Its Implications for Water Availability 

Tasneem Kosar, Akif Rahim, Muhammad Yaseen, Raheela Naz, Muhammad Mamoor, and Amina Akif

The intensification of hydrological cycle driven by global warming leads to an increase in extreme precipitation events, prolonged droughts and higher rates of evaporation. This global change has altered the global hydrological cycle and effect on the long term water availability in many watersheds worldwide. The impact of climate change is usually assessed by using ratio of stream flows and climate variables, which are formally defined as the climate elasticity of water availability This study examines how the hydrological cycle is intensifying over the Kabul Watershed and how this affects water availability using the water balance (P–E) approch.  Here, we used ERA5 land data of annual total precipitation (P) and total surface evaporation (E) from 1976 to 2024 to understand how the land and atmosphere interacted.  The climate elasticity of (P-E) to annual water availability is determined for 1976-2010 and validated for 2011-2024. The results reveal 0.8 °C rise in temperature, 12% decline in annual precipitation, and  7% increase in evaporation in the past 25 years. This caused 15% reduction in the P–E balance, which directly reduced the annual water availability. The climate elasticity factor of 0.55 has been determined to water availability in Kabul for the period of 1976-2010. By using this elastic factor, the average water availability of 19.54 MAF is predicted for the period of 2011-2024 whereas the observed water availability is 20.43 MAF. This finding reflects the sensitivity of a watershed to P-E alteration for water availability and underscore the urgent need of climate resilient water management strategies to mitigate the future impacts of climate change in the Kabul watershed.

How to cite: Kosar, T., Rahim, A., Yaseen, M., Naz, R., Mamoor, M., and Akif, A.: Climate Driven Hydrological Intensification and Its Implications for Water Availability, EGU General Assembly 2026, Vienna, Austria, 3–8 May 2026, EGU26-6269, https://doi.org/10.5194/egusphere-egu26-6269, 2026.

EGU26-7262 | ECS | Posters virtual | VPS9

CO2 Dynamics and Carbon Sources in the Critical Zone: An Isotopic Study in Aquifers of Southeastern Spain 

Enrique Echeverría-Martín, Ángel Fernández-Cortés, Enrique P. Sánchez-Cañete, Penélope Serrano-Ortiz, Cecilio Oyonarte, Arnau Riba Palou, Andrew S. Kowalski, and Francisco Domingo

The Critical Zone, extending from the land surface through the vadose zone to groundwater, can store and transfer substantial carbon as CO2 and dissolved inorganic carbon (DIC). Yet CO2 behavior below the first meters of soil remains poorly constrained, particularly where water-table fluctuations, gas-water exchange, and water-rock reactions interact. In these settings, deep vadose CO2 may exhibit atmospheric and soil-respiration signatures with contributions linked to groundwater degassing and carbonate-system reactions, potentially creating transient subsurface CO2 reservoirs that couple the aquifer and the atmosphere.

We present a repeated sampling design to characterize carbon cycling across the Critical Zone in semi-arid southeastern Spain. We sampled the air columns of 11 boreholes belonging to six groundwater bodies during four campaigns (spring 2022, autumn-winter 2022, spring-summer 2024, and spring-summer 2025). In borehole air, we measured CO2, H2O vapor, and its carbon isotopes composition (δ¹³C-CO2); air was stored in gas-tight bags and analyzed by cavity ring-down spectroscopy (Picarro G2508 and G2201-i). In parallel, groundwater was sampled at each site. In situ, we measured pH, temperature, oxidation–reduction potential (ORP), HCO3-, and electrical conductivity. In the laboratory we analyzed pH, alkalinity, major ions, total organic carbon and total nitrogen, carbon isotopes of dissolved inorganic carbon (δ¹³C-DIC), and water isotopes (δ²H, δ¹⁸O). Water-table position at the time of sampling was used to interpret gas-water contact.

Critical Zone CO2 concentrations in borehole air ranged from 614 to 128700 ppm (pCO2=0.000587-0.102287 atm). Groundwater CO2 was estimated with the PHREEQC software, yielding values between 2240 and 9550 ppm (pCO2=0.002240-0.009550 atm), allowing comparison between the air column and the saturated zone, and evaluation of disequilibrium and exchange potential as the water-table varies. Carbon isotopes signatures constrain sources and transformations: δ¹³C-CO2 ranged from -11.14 to -23.62‰, δ¹³C-DIC from -6.27 to -20.11‰, and host-rock δ¹³C from 2.37 to -7.12‰. All values (δ¹³C‰) are reported relative to VPDB (Vienna Pee Dee Belemnite). Joint interpretation across gas, DIC, and rock enabled discrimination among biogenic CO2 production, atmospheric mixing, carbonate dissolution/precipitation (based on the saturation indices of the main carbonate mineral phases), and CO2 transfer from the aquifer to the deep vadose zone. The multi-campaign design provided a basis for quantifying seasonal and interannual shifts in these boreholes and for identifying hydrogeochemical conditions (e.g., pH-alkalinity evolution and redox state) that promote storage/mineralization versus release of CO2.

Our experimental design characterizes subsurface CO2 storage and transport at the Critical Zone scale. It identifies when the deep vadose environments act as reservoirs, conduits, or sources linking groundwater and the atmosphere. This information is rarely available but critical for improving carbon budgets and models for the Critical Zone.

This work was supported by the Spanish Ministry of Science and Innovation (projects PID2024-158786NB-C21 and PID2024-158786NB-C22, NATURAL), the University of Granada (project PPJIB2024-53), and the Regional Ministry of University, Research and Innovation, the Spanish Government and the and European Union – NextGenerationEU (projects BIOD22_001 and PCBIO).

How to cite: Echeverría-Martín, E., Fernández-Cortés, Á., Sánchez-Cañete, E. P., Serrano-Ortiz, P., Oyonarte, C., Riba Palou, A., Kowalski, A. S., and Domingo, F.: CO2 Dynamics and Carbon Sources in the Critical Zone: An Isotopic Study in Aquifers of Southeastern Spain, EGU General Assembly 2026, Vienna, Austria, 3–8 May 2026, EGU26-7262, https://doi.org/10.5194/egusphere-egu26-7262, 2026.

EGU26-8393 | Posters virtual | VPS9

The role of High Temperature-Low Precipitation conditions in shaping heatwaves and droughts 

Devjit Sinha and Chandra Rajulapati

Hydroclimatic extremes have extensive social, economic and ecological impacts, thereby making it highly imperative to develop disaster assessment and mitigation strategies. The frequency of extreme events like heatwaves and droughts is  intricately linked with the rising temperature trends and the changing precipitation patterns worldwide. Moreover, lagged responses amongst such extremes can occur across temporal scales due to the existing large-scale climate linkages. However, the association between present-day occurrences of concurrent high temperature and low precipitation days (HTLPs) with the frequency of heatwaves and droughts of a subsequent period is not fully explored. In this global analysis, we estimate the frequency of heatwaves and droughts based on 1-year temporally lagged HTLPs. Our results reveal a significant rising trend in the average number of heatwaves with an increase in the number of HTLPs of the previous year, while no significant trend is observed for droughts. However, a high number of HTLPs (over 100 events) is associated with a slight reduction in the number of heatwaves (5.9 to 5.6) but a pronounced increase in the number of droughts (1.8 to 2.4). During a 10-year validation period, 81% of heatwaves and 85% of droughts globally remain consistent with the HTLP–conditioned behavior inferred from the 34-year training period of the model. Our findings thus demonstrate the applicability and effectiveness of HTLPs in predicting heatwaves and droughts. This study can be used to develop stochastic models to predict heatwaves and droughts with HTLP as a predictor, and hazard-specific probabilistic assessments that can support and improve resource allocation at regional and global scales.

How to cite: Sinha, D. and Rajulapati, C.: The role of High Temperature-Low Precipitation conditions in shaping heatwaves and droughts, EGU General Assembly 2026, Vienna, Austria, 3–8 May 2026, EGU26-8393, https://doi.org/10.5194/egusphere-egu26-8393, 2026.

EGU26-9421 | ECS | Posters virtual | VPS9

Asymmetric intensification of nighttime versus daytime precipitation extremes under warming 

Jingyi Meng and Haoming Xia

The intensification of the global hydrological cycle is a well-established consequence of anthropogenic climate change. However, how this intensification manifests across the diurnal cycle remains poorly understood, representing a critical blind spot in climate risk assessments. While daily-aggregated metrics consistently suggest a "wetter and more extreme" climate, they mask fundamentally different responses of daytime and nighttime precipitation to warming.Here we analyse high-resolution observational records from 2,399 stations across China spanning 1972–2024 and identify a distinct nighttime intensification regime that is increasingly dominant under warming. In regions experiencing active wetting, extreme precipitation (R95p) intensifies more rapidly at night than during the day, both in magnitude and spatial extent.This diurnal asymmetry reflects contrasting physical controls. Nighttime wetting is driven almost exclusively by increases in precipitation intensity (p < 0.001, Wilcoxon signed-rank test) and exhibits a tight thermodynamic scaling with background warming. By contrast, daytime precipitation changes arise from a heterogeneous combination of intensity and frequency adjustments, indicating a greater role for dynamical modulation.

These findings reveal a previously underappreciated amplification of nocturnal hydrometeorological hazards, including flash floods and landslides, that is systematically underestimated by daily-mean indicators. As global warming continues, the emerging dominance of nighttime precipitation extremes underscores the urgent need to incorporate diurnally resolved processes into climate risk assessment, infrastructure design and early-warning systems.

How to cite: Meng, J. and Xia, H.: Asymmetric intensification of nighttime versus daytime precipitation extremes under warming, EGU General Assembly 2026, Vienna, Austria, 3–8 May 2026, EGU26-9421, https://doi.org/10.5194/egusphere-egu26-9421, 2026.

Surface-groundwater interactions (SGI) plays a crucial role in maintaining stream thermal regime and ecological balance, keeping a check on this is logistically and financially challenging. This study utilises multi-temporal Landsat-8 Thermal Infrared Sensor (TIRS) data to compute Stream Surface Temperature (SST), its anomaly (SSTA), Robust Thermal Deviation Index (R-TDI) and further classifies groundwater influence on the Kharun River, a semi-arid urban catchment in India (approximately 4109 km²).

Due to changes in weather and season, surface water is subject to heating and cooling, but the water system beneath the land surface will be at a constant temperature. The stream reach, influenced by groundwater, will show a relatively stable thermal signature across all seasons. Stream Surface Temperature (SST) derived through radiometric calibration and emissivity-adjusted retrieval across pre-monsoon, monsoon, and post-monsoon periods. To isolate localized hydrological processes from regional climatic forcing, we computed Stream Surface Temperature Anomalies (SSTA) by subtracting reach-wise median SST from pixel-scale values. To account for the non-normal nature of SST, a Robust Thermal Deviation Index (R-TDI) framework was utilised which minimizes atmospheric noise and mixed-pixel interference, allowing for the isolation of persistent thermal signals.

Using statistically defined TDI thresholds, a classification approach was finalised putting stream stretches into high, moderate, and low groundwater influence zones. Results identify spatially consistent cold-water anomalies indicative of groundwater discharge primarily during pre-monsoon and warmer-water anomalies during post-monsoon seasons when thermal contrasts are most pronounced.  These zones coincide with structurally controlled segments and urbanized stretches, suggesting a complex interplay between hydrogeology and anthropogenic modifications. By leveraging open-access satellite data, this research provides a scalable tool for evidence-based river restoration and climate-resilient water management in rapidly urbanizing regions.


Key Words: Thermal remote sensing; Landsat-8 TIRS; Stream surface temperature; Thermal anomaly; Surface–groundwater interaction; Data-scarce catchments

How to cite: Chandel, R. and K. Singh, C.: Thermal Remote Sensing for Qualitative Analysis of Surface Water and Groundwater Interaction: A Case Study of the Kharun River, EGU General Assembly 2026, Vienna, Austria, 3–8 May 2026, EGU26-9498, https://doi.org/10.5194/egusphere-egu26-9498, 2026.

EGU26-9647 | Posters virtual | VPS9

Signature-Based Evaluation of Hydrological Processes Using the SWAT Model in the Bharathapuzha River Basin, India 

Gopika Krishnan Sreelatha, Anakha Anupama Rajith, Akshaya Sreekumar, Greeshma Girish, and Gowri Reghunath

Understanding catchment behaviour is essential for effective water resources planning and sustainable watershed management. Traditional model evaluation approaches based solely on time-series performance metrics often fail to capture the full spectrum of hydrological functioning. This study employs a hydrological signature–based evaluation framework to assess the capability of the Soil and Water Assessment Tool (SWAT) model in reproducing the dominant hydrological processes in the Bharathapuzha River Basin, a monsoon-dominated river system in southern India. The SWAT model was implemented using spatial datasets of topography, land use, and soil characteristics, together with long-term hydro-meteorological inputs, and calibrated and validated against observed daily streamflow. Beyond conventional performance indices, key hydrological signatures including flow duration curves, runoff ratio, baseflow index, seasonal flow patterns, and characteristics of low- and high-flow events were extracted from both observed and simulated datasets. Comparison of observed and simulated signatures provided a process-oriented evaluation of model behaviour, offering key insights into how well runoff generation, seasonal variability, and hydrological extremes are represented. These perspectives are not readily evident from traditional model performance metrics alone. This study demonstrates the value of hydrological signatures as diagnostic tools for enhancing model realism and improving confidence in hydrological simulations for climate impact assessment and water resources management in monsoon-driven catchments.

How to cite: Krishnan Sreelatha, G., Anupama Rajith, A., Sreekumar, A., Girish, G., and Reghunath, G.: Signature-Based Evaluation of Hydrological Processes Using the SWAT Model in the Bharathapuzha River Basin, India, EGU General Assembly 2026, Vienna, Austria, 3–8 May 2026, EGU26-9647, https://doi.org/10.5194/egusphere-egu26-9647, 2026.

EGU26-10986 | Posters virtual | VPS9

Stable isotopic fingerprinting of hydrological variability along the Yamuna river, India 

Muguli Tripti, Suhas D Khobragade, and Someshwar M Rao

Global water security can be achieved by the systematic assessment of available water resources in both large and small river basins. This study investigated the stable isotopic composition of river water in the Yamuna basin, India to fingerprint the major contributing sources of water and their spatial variability along the main river channel. The Yamuna river originates at an altitude of about 6300 m asl in Yamunotri glacier near Bandarpunch, Uttarakhand Himalayas and flows through several states of India like Haryana, Punjab, Madhya Pradesh, Rajasthan and Uttar Pradesh. In this study, the Yamuna river water samples have been collected along main channel from Yamunotri to its confluence with Ganga river during pre-monsoon and post-monsoon seasons of the year 2024. The measured stable isotope ratios of oxygen (δ18O) and hydrogen (δ2H) in river water are in the range of -2.7 – -11.2 ‰ and -23.4 – -75.2 ‰ respectively for the sampling period. This study reports for the first time that there is a significant spatial variability in the source water of Yamuna river as fingerprinted by the stable isotopic composition. The Yamuna river at upper reaches receives water from sources that are depleted in heavier isotopic content mainly from glacial melt. The higher amount of water diversion to canal networks at different stages as well as water mixing from industrial and urbanized regions have led to relative water degradation of Yamuna river in middle reaches. The downstream isotopic composition reflects possible interaction with groundwater, higher water influx from Peninsular tributaries, and evaporation effect. Seasonality in source water contribution to Yamuna river discharge along the entire stretch has also been traced using stable isotopic composition of water.

How to cite: Tripti, M., Khobragade, S. D., and Rao, S. M.: Stable isotopic fingerprinting of hydrological variability along the Yamuna river, India, EGU General Assembly 2026, Vienna, Austria, 3–8 May 2026, EGU26-10986, https://doi.org/10.5194/egusphere-egu26-10986, 2026.

Over the past decade, droughts have drawn increasing attention due to their substantial agricultural and economic consequences, particularly in the U.S. Great Plains area (e.g., the 2012 Central US event and the 2017 Northern Plains event). Although certain large-scale atmospheric and oceanic patterns are necessary for drought development, land- atmosphere interactions can play an important role in the intensification of drought conditions, especially for flash drought. This study aims to predict drought conditions over the U.S. Great Plains at 1-3-week lead times using a convolutional neural network (CNN) model. To forecast drought categories derived from the US Drought Monitor (USDM), the models are trained using multi-source atmospheric and land-surface variables, including 500 hPa geopotential height, precipitation, wind speed, surface radiation, humidity, and temperature from ERA5, soil moisture from Global Land Evaporation Amsterdam Model (GLEAM) and North American Land Data Assimilation System (NLDAS), and Normalized Difference Vegetation Index (NDVI) from satellite products. Model performance is evaluated to unravel the atmospheric and land-surface processes that drive droughts at different lead times and identify their relative contributions to drought development and intensification.

How to cite: Rippeteau, L. and Chen, L.: Drought prediction and understanding the drivers of drought development using a machine learning approach, EGU General Assembly 2026, Vienna, Austria, 3–8 May 2026, EGU26-12345, https://doi.org/10.5194/egusphere-egu26-12345, 2026.

EGU26-14233 | Posters virtual | VPS9

Flash Flood Events in the Northwestern Black Sea Region under Climate Change  

Valeriya Ovcharuk and Inna Khomenko

Extreme hydrological events have become increasingly frequent in Ukraine in recent decades due to climate change and structural weaknesses in water resources management. According to the Water Strategy of Ukraine up to 2050, inadequate governance practices remain a major source of anthropogenic pressure on water bodies, while climate change creates additional risks through prolonged droughts interrupted by intense rainfall events, leading to flooding. These challenges are particularly critical for southern Ukraine, where limited water resources require extensive hydrotechnical regulation and adaptive management.

Flash floods represent one of the most dangerous manifestations of hydrological extremes. Characterised by rapid water-level rise and high flow velocities, they pose severe risks to settlements, infrastructure, and agriculture due to their sudden onset.

The north-western part of the Black Sea region has experienced several severe flash flood events over the past decade. One of the most significant cases occurred in September 2013 in the Kogilnyk River basin., when anomalously high precipitation totals of 41 - 270 mm were recorded from 10 and 14 September. These extreme rainfall conditions were associated with a stationary cold atmospheric front linked to the Asia Minor depression, resulting in prolonged convective rainfall with thunderstorms, squalls and wind gusts of up to 22 m/s in the southern districts of the Odesa region.

The total volume of storm rainfall during this event is estimated at approximately 250 million cubic meters, which exceeded the mean annual runoff of the Kogilnyk River by a factor of 5.5. Precipitation affected an area of about 1,400 km², corresponding to 35% of the total river basin area. As a result, flash flooding impacted multiple settlements, located in the south-western part of Odesa Oblast as well as extensive agricultural lands in there.

Another notable episode occurred in early August 2019, when unstable atmospheric conditions and active cyclones caused intense rainfall across southern and eastern Ukraine. On 3 - 4 August, precipitation amounts reached 130–220% of the monthly norm in several locations. In the Odesa region, rainfall totals of up to 126 mm - equivalent to nearly three months of precipitation—met the criteria for hazardous meteorological phenomena and triggered debris flows and localized flash flooding, particularly in the village of Moloha (Bilhorod-Dnistrovskyi district).

More recently, in September 2025, an urban flash flood in Odesa highlighted the increasing vulnerability of urban areas to extreme rainfall. Prolonged heavy rains caused widespread flooding, significant damage, and human losses, prompting large-scale rescue operations..

The analysed events indicate a clear increase in flash flood intensity and impacts in the north-western Black Sea region. Under continued climate change, enhanced hydrological monitoring, early warning systems, climate-adaptive urban planning, and integrated water resources management are urgently required in southern Ukraine.


ACKNOWLEDGEMENTS

This contribution builds on the conceptual framework of the applied research project “Sustainable Development of Water Resources Management and Modelling in the North-Western Black Sea Region under Conditions of Increasing Climate Extremes and Anthropogenic Pressure”, approved for funding by the Ministry of Education and Science of Ukraine (Order No. 23, 9 January 2026, see https://surl.li/omqxph).

How to cite: Ovcharuk, V. and Khomenko, I.: Flash Flood Events in the Northwestern Black Sea Region under Climate Change , EGU General Assembly 2026, Vienna, Austria, 3–8 May 2026, EGU26-14233, https://doi.org/10.5194/egusphere-egu26-14233, 2026.

Although drought indices can be evaluated employing linear and non-linear algorithms, most contributions in the literature have not adequately quantified geospatial-temporal volatility, leading to Type II errors. This study addresses these gaps by comparing ten drought indices across the Colorado and Louisiana regions of the United States over 75 years, examining non-linear and spatio-temporal patterns to ensure a robust assessment of drought. High-resolution European Centre for Medium-Range Weather Forecasts (ECMWF) gridded monthly total precipitation data for 75 years (1950-2024) were used to evaluate the drought indices. The spatial clustering of precipitation patterns was quantified using the second-order semi-parametric eigen-decomposition geospatial autocorrelation to geolocate hot and cold spots of precipitation. We employed the Autoregressive Integrated Moving Average (ARIMA) model, coupled with the Generalized Autoregressive Conditional Heteroscedastic (GARCH) model, and compared five ARIMA-GARCH variants across nine error distributions to address non-asymptotic conditional volatility and temporal persistence in precipitation. Drought indices were examined across five temporal scales and contrasted with simulated parameters derived from the Community Earth System Model (CESM). The temporal lag relationship between meteorological and agricultural droughts was evaluated using the non-parametric Time-Varying Distance Cross-Correlation Function (TV-DCCF). The findings revealed that the ARIMA-eGARCH(1,1) model with a Student’s t distribution precisely detected the non-asymptotic conditional volatility in the precipitation time series. The Standardized Precipitation Index (SPI), China Z Index (CZI), and Z-Score Index (ZSI) were the most applicable indices for drought monitoring in both regions. TV-DCCF revealed that meteorological droughts significantly influenced agricultural droughts, with a lag of up to four months. CESM-derived drought indices were mainly within the ERA5-Land uncertainty range, except for CZI and aSPI, attributable to CESM’s lower spatial resolution and limited sensitivity to localized extreme events.

Keywords: Standardized Precipitation Index (SPI); Global Moran’s Index; Autoregressive Moving Integrated Average (ARIMA); Generalized Autoregressive Conditional Heteroscedastic Model (GARCH); ERA5-Land; Community Earth System Model (CESM).


How to cite: Choudhari, N., Elshorbany, Y., Jacob, B., and Collins, J.: Prognosticative De-Volatility Modeling for Empirically Quantifying CESM and ECMWF Space-Time Heterogeneity of Drought Indices Across Colorado and Louisiana Regions of the USA, EGU General Assembly 2026, Vienna, Austria, 3–8 May 2026, EGU26-14649, https://doi.org/10.5194/egusphere-egu26-14649, 2026.

EGU26-15165 | Posters virtual | VPS9

Tracing Groundwater-Surface Water Mixing Using Isotopes in a Semi-Arid Volcanic Lake Basin 

Lorena Ramírez González, Selene Olea Olea, Ricardo Sánchez Murillo, Ruth Esther Villanueva Estrada, Miguel A González Mejía, Luis González Hita, Eric Morales Casique, Olivia Zamora Martínez, Martha Gabriela Gómez Vasconcelos, Avellán Denis Ramón, and Nelly Ramírez Serrato

The application of isotopic tracers provides a powerful means to unravel complex hydrological systems, including groundwater (GW)-surface water (SW) connectivity. This study investigates the interacting hydrological and geochemical processes within a temperate volcanic lake basin in west-central Mexico, with the objective of assessing hydrogeological connectivity between groundwater and the lacustrine system. Spatially distributed sampling was conducted for major ions, nitrate, strontium, and stable water isotopes (δ¹⁸O and δ²H) across multiple water sources, including precipitation, rivers, lakes, wells, and springs.

Results indicate that direct infiltration of precipitation constitutes the dominant groundwater recharge mechanism in high-elevation, forested zones, where waters exhibit a Ca–Mg–HCO₃⁻ hydrochemical facies. Mixing with deeper groundwater components is also evident, as reflected by elevated temperatures and isotopic compositions indicative of enhanced water-rock interaction. Surface waters, particularly lakes, display pronounced evaporative enrichment, while elevated nitrate concentrations in shallow groundwater point to anthropogenic inputs associated with irrigation return flows and urban activities.

Although sampling was conducted during the dry season and therefore may not capture the full range of annual hydrological variability, the identification of local and regional recharge zones provides a robust framework for future investigations of precipitation-driven recharge and GW-SW interactions. Additionally, strontium concentrations proved effective for tracing subsurface flow paths and fluid exchange along fault-controlled structures, offering valuable insights into hydrogeological processes in tectonically active volcanic settings. The integrated use of hydrochemical and isotopic tracers highlights their critical role in supporting sustainable water-resource management and protecting groundwater quality in complex temperate, semi-arid lake systems increasingly impacted by anthropogenic pressures.

How to cite: Ramírez González, L., Olea Olea, S., Sánchez Murillo, R., Villanueva Estrada, R. E., González Mejía, M. A., González Hita, L., Morales Casique, E., Zamora Martínez, O., Gómez Vasconcelos, M. G., Denis Ramón, A., and Ramírez Serrato, N.: Tracing Groundwater-Surface Water Mixing Using Isotopes in a Semi-Arid Volcanic Lake Basin, EGU General Assembly 2026, Vienna, Austria, 3–8 May 2026, EGU26-15165, https://doi.org/10.5194/egusphere-egu26-15165, 2026.

EGU26-15655 | Posters virtual | VPS9

Assessing changes in flood inundation patterns using rainfall-controlled event analysis 

Mousumi Ghosh and Subhankar Karmakar

Flood hazard assessments are commonly based on rainfall magnitude and frequency; however, flood responses to similar rainfall intensities may change over time due to evolving land use, river morphology, and hydraulic controls. This study investigates temporal changes in flood inundation patterns between 2014 and 2024 over a highly flood prone urban coastal catchment in India under comparable rainfall forcing, with the objective of improving understanding of non-stationary flood behavior. Rainfall events were identified and grouped based on intensity and duration using long-term precipitation records. For each selected event, flood extents were mapped using satellite-based inundation detection implemented on cloud computing platforms, and, where appropriate, complemented by physically based hydraulic modeling. This combined rainfall–flood framework enables consistent inter-annual comparison of flood patterns under equivalent meteorological conditions. The methodological approach focuses on isolating the influence of landscape and hydraulic evolution on flood response by analyzing spatial characteristics of inundation independent of rainfall variability. By integrating remote sensing and hydraulic modeling within a long-term analysis, the study provides a transferable framework for assessing how flood behavior evolves in response to environmental and anthropogenic changes. This work is relevant to flood risk management and climate adaptation, particularly in rapidly changing river basins where traditional stationary assumptions may no longer be valid. The approach supports improved interpretation of historical floods and more robust planning under future uncertainty.

How to cite: Ghosh, M. and Karmakar, S.: Assessing changes in flood inundation patterns using rainfall-controlled event analysis, EGU General Assembly 2026, Vienna, Austria, 3–8 May 2026, EGU26-15655, https://doi.org/10.5194/egusphere-egu26-15655, 2026.

Understanding hydrological responses to high-intensity rainfall is critical for water resource management in humid tropical regions, where climate change is increasing the frequency and magnitude of extreme storm events. However, runoff generation mechanisms and flow pathway activation in small tropical catchments remain poorly understood. This study investigates hydrological connectivity, flow pathways, and streamflow source contributions in the Acono watershed, Trinidad and Tobago.

A multi-tracer approach combining stable isotopes (δ²H, δ¹⁸O), radioisotopes (³H, ²²²Rn), and major ion geochemistry (SO₄²⁻, Na⁺, Mg²⁺, Ca²⁺, Cl⁻) was applied to characterize water sources and residence times under contrasting hydrological conditions. Periodic sampling was conducted over a 22-month period, complemented by event-based sampling during a minimum of five high-intensity rainfall events. Samples were collected from rainfall, streams, springs, shallow soil water (10–80 cm), and deep groundwater, alongside continuous monitoring of rainfall, soil moisture, and water levels across the catchment. End-member mixing analysis was used to quantify source contributions to streamflow.

Preliminary results indicate that streamflow is predominantly sourced from pre-event (“old”) water under low flow and moderate wet-season conditions, with old water and spring inputs frequently accounting for 60–99% of flow. Direct rainfall contributions are generally limited (average ~7%) and rarely exceed ~30–37%, suggesting strong subsurface buffering and rapid mobilization of stored water rather than dominant overland flow. In contrast, the onset of wetter conditions in early 2025 triggered pronounced, non-linear shifts in source contributions, including sharp increases in deep groundwater and spring contributions (up to ~89% and ~80%, respectively), alongside elevated event water fractions. These patterns suggest threshold-controlled activation of deeper storage and fast-responding subsurface pathways during periods of sustained or intense rainfall.

Data collect is ongoing and additional analyses are expected to improve our understanding of the translation from rainfall to streamflow. This research provides a novel approach to understanding hydrological processes in small island developing states (SIDS).

How to cite: Ramjohn, P. and Farrick, K.: High Intensity Rainfall Event Contributions to Stormflow and Stream Residence Time in the Acono Watershed, Trinidad., EGU General Assembly 2026, Vienna, Austria, 3–8 May 2026, EGU26-15744, https://doi.org/10.5194/egusphere-egu26-15744, 2026.

EGU26-16235 | ECS | Posters virtual | VPS9

Hydrological Whiplashes Over India: Patterns, Drivers, and Recurrence 

Paras Sharma and Vimal Mishra

Climate change is driving a marked intensification of hydrological extremes, including both droughts and floods. When these opposing conditions occur in close succession, known as hydrological whiplash, they generate compounded impacts on ecosystems, infrastructure, and human livelihoods. We analyze hydrological whiplash across India using observed streamflow data and simulations from the validated H08-CaMa-Flood model. The results indicate that nearly 90% of streamflow stations experienced at least one whiplash event, with drought-to-flood transitions being both more common and more abrupt than flood-to-drought shifts. These events are concentrated primarily during the monsoon season, but their occurrence has increased in the non-monsoon months in recent decades, particularly in high-elevation regions. Moreover, we find that whiplash events are becoming more frequent and more intense, while the interval separating dry and wet extremes is shrinking, signaling an escalation of hydrological volatility across the country. Together, these patterns underscore the need for strengthened monitoring, early warning capabilities, and adaptive water management strategies to reduce the growing risks associated with rapid hydrological transitions under a warming climate.

How to cite: Sharma, P. and Mishra, V.: Hydrological Whiplashes Over India: Patterns, Drivers, and Recurrence, EGU General Assembly 2026, Vienna, Austria, 3–8 May 2026, EGU26-16235, https://doi.org/10.5194/egusphere-egu26-16235, 2026.

EGU26-16329 | ECS | Posters virtual | VPS9

Dynamics of Sectoral Water Demand and Future Water Stress Hotspots in Indian River Basins 

Anuj Prakash Kushwaha and Vimal Mishra

Terrestrial water availability in India is increasingly affected by both climate variability and human activities such as groundwater extraction, reservoir operations, and the expansion of irrigation. However, the observed trends in these factors and their future changes at the river basin level are still not well quantified, making it difficult to plan effective water management strategies. In this study, we assess the individual and combined impacts of climate change and human interventions on the water budgets of major Indian river basins using an ensemble framework that includes the Community Water Model (CWatM) hydrological models. We specifically analyze the changes in sectoral water demands, including agricultural, domestic, and industrial, analyzing their historical progression and projected changes from 1951 to 2100. Based on IMD datasets and CMIP6 scenarios, we identify key regions likely to face water stress in the future and estimate uncertainties in water availability. These findings support the development of sustainable water management plans in response to evolving sectoral trends and climate-related challenges across the Indian subcontinent.

How to cite: Kushwaha, A. P. and Mishra, V.: Dynamics of Sectoral Water Demand and Future Water Stress Hotspots in Indian River Basins, EGU General Assembly 2026, Vienna, Austria, 3–8 May 2026, EGU26-16329, https://doi.org/10.5194/egusphere-egu26-16329, 2026.

Agriculture poses severe impacts on water quality and health due to diffuse pollution via pesticide use. In this study, the impact of pesticide use on water quality in the Polatlı district—a region of intensive agriculture within the Ankara River Watershed—was assessed using the Grey Water Footprint (GWF) methodology. The study analyzed 34 active ingredients utilized in the 2023 production cycle of wheat, barley, onion, and sugar beet. District-level data on cultivated areas (ha) for each crop were obtained from the Turkish Statistical Institute (TURKSTAT) for 2023. For the GWF calculations, the natural background concentration was assumed to be zero, while the maximum allowable concentrations for each pesticide were retrieved from local regulations. A watershed-scale hydrological model, namely Soil and Water Assessment Tool (SWAT) were constructed for the study area and calibrated against observed streamflow data to ensure reliable simulation of pesticide transport. Pesticide applications were integrated into the model based on actual usage data. The pollutant loads transported from the Polatlı district to the Ankara River were calculated and subsequently utilized in the grey water footprint equation.

Our findings reveal that pesticide impacts vary significantly with respect to crop and active ingredient levels. For example, SWAT model simulation results for deltamethrin reveal a high environmental transport efficiency despite its low application rate (250 ml/ha) compared to other pesticides. This pesticide has an extremely high affinity for soil particles as clear from the organic carbon-water partition co-efficient value (Koc = 1,000,000 L/kg); it binds strongly to soil rather than dissolve in water. The transport of deltamethrin is entirely driven by soil erosion, leading to its accumulation in riverine sediments. Due to its extreme Koc value, the pesticide remains associated with suspended solids and bed sediments, posing a significant long-term threat to benthic organisms and aquatic biodiversity. This sediment-related pollution indicates that the GWF of the basin is not only a function of dissolved pollutants, but it can be heavily influenced by sediment quality. No leaching to groundwater or dissolved transport was observed, confirming its strong soil-binding behavior. This substantial variability in GWFs underscores the necessity for region-specific water quality standards to more accurately assess and manage the environmental impact of pesticide use. Our analysis addresses the complexities of mixed cropping systems typical of semi-arid regions, where water scarcity and intensive pesticide use converge to create critical water quality challenges. This study provides a framework for similar assessments in other agricultural regions, aiding in the development of more informed pesticide management strategies to enhance water resource sustainability. Our results highlight specific pesticides requiring priority attention: replacing or limiting high-GWF pesticides is essential for progress toward sustainable water management in the Ankara River basin.

How to cite: Dogan, F. N. and Capar, G.: Assessment of Pesticide-Related Water Pollution in the Ankara River Watershed: A Combined SWAT and Grey Water Footprint Approach, EGU General Assembly 2026, Vienna, Austria, 3–8 May 2026, EGU26-16687, https://doi.org/10.5194/egusphere-egu26-16687, 2026.

Chemical weathering of continental rocks plays a key role in regulating river water chemistry and global biogeochemical cycles. This study investigates the spatial and seasonal variability in major and trace element geochemistry of rivers in the Ganga basin to constrain dominant weathering processes and their downstream evolution. A total of 200 water samples and sediment samples were collected across different hydrological regimes and physiographic settings. The results indicate that dissolved loads are primarily controlled by the weathering of silicate and carbonate lithologies. In the Himalayan headwaters, river chemistry is dominated by carbonate and Ca²⁺–Mg²⁺-rich silicate weathering, with Ca²⁺ + Mg²⁺ and HCO₃⁻ contributing approximately 85% of total cations and anions. In contrast, downstream reaches exhibit a systematic decrease in Ca²⁺ + Mg²⁺ contributions and an increase in Na⁺ + K⁺ proportions (up to ~50%), suggesting enhanced influence of silicate weathering and/or alkaline soil inputs. Trace elements such as  Pb, Hg, Th, Sr, Rb, Mo, U, Ba, and V reveal spatially variable source contributions across different catchments. Sodium-normalized trace metal ratios and Ca/Na* relationships indicate additional contributions from carbonate or Ca²⁺–Mg²⁺-rich silicates, particularly during high-discharge periods. Strontium isotope ratios (87Sr/86Sr) of the Ganga River reflect chemical weathering and sediment sources in the Himalayan region. The river drains diverse lithologies of the Himalaya, causing spatial and seasonal isotopic variations. Higher 87Sr/86Sr values indicate silicate weathering of radiogenic continental crust, especially during monsoon periods. Lower ratios reflect inputs from carbonate rocks and recycled sediments. Sr isotopes highlight the role of Himalayan weathering in controlling riverine Sr flux.These observations highlight the combined influence of lithology, hydrology, and seasonal discharge on riverine geochemistry and provide new constraints on chemical weathering processes and trace element fluxes from the Ganga basin to the ocean.

How to cite: Parida, R. K. and Rai, S. K.: Chemical Weathering Dynamics and Riverine Geochemistry of the Ganga River Basin: Spatial and Seasonal Controls on Elemental Fluxes, EGU General Assembly 2026, Vienna, Austria, 3–8 May 2026, EGU26-16801, https://doi.org/10.5194/egusphere-egu26-16801, 2026.

EGU26-17766 | ECS | Posters virtual | VPS9

Hydrodynamic Changes of Estuarine Islands in the Meghna River under Future Climate Scenarios 

Salah Uddin Ahmed Dipu, Elwa Gemintang, Md. Aminul Haque Laskor, Faysal Bhuiyan, Md Asadullahil Galib Fardin, Md. Mahmudur Rahman, Yeamin Rabbany, and Saiful Islam Fahim

Hydrodynamic processes strongly influence coastal and estuarine landscapes, especially in low-lying deltaic regions like the Meghna Estuary. Islands in the lower Meghna and at the Padma-Meghna confluence face increased risk of submergence due to sea-level rise and intensified precipitation under future climate scenarios. This study analyzes the long-term hydrodynamic changes in the Meghna Estuary using Delft3D simulations for 2000, 2024, and 2050, focusing on islands such as Nijhum Dwip, Moulovi Char, Domar Char, Char Kukri Mukri, Rajrajeshwar, Hatiya, and Manipura. The model covers the area from Baruriya Transit to the sea, integrating tidal and riverine dynamics. Future discharge for 2050 was generated from MIROC6 climate projections under SSP2-4.5 and SSP5-8.5 scenarios, bias-corrected and simulated via HEC-HMS. HEC-HMS was calibrated using 2022 data and validated with 2023 discharge records from Bhairab Bazar, while Delft3D was calibrated and validated using observed water level data from Daulatkhan over the same period. Results show rising tidal amplitudes and water levels, with high tides near Char Kukri Mukri increasing by 30 to 35 cm by 2050. Tidal inundation is expected to expand during monsoons, increasing flood risk in low-lying areas. Islands like Char Kukri Mukri and Hatiya are losing relative elevation, heightening their vulnerability to flooding and storm surges. Hydrodynamic projections indicate an average increase in water depth of 0.5 to 0.8 m around Rajrajeshwar, Hatiya, and Manipura by 2050, suggesting enhanced tidal energy and flow velocities that are likely to accelerate shoreline erosion and land loss, particularly along their southern and eastern margins. These findings highlight the increasing vulnerability of the Meghna Estuary’s islands to climate change–driven hydrodynamic shifts, emphasizing the urgent need for targeted adaptive management, improved flood risk mitigation, and resilience-building measures to protect the region’s communities and ecosystems from future inundation and erosion risks.

How to cite: Ahmed Dipu, S. U., Gemintang, E., Haque Laskor, Md. A., Bhuiyan, F., Galib Fardin, M. A., Rahman, Md. M., Rabbany, Y., and Islam Fahim, S.: Hydrodynamic Changes of Estuarine Islands in the Meghna River under Future Climate Scenarios, EGU General Assembly 2026, Vienna, Austria, 3–8 May 2026, EGU26-17766, https://doi.org/10.5194/egusphere-egu26-17766, 2026.

Wetlands play a vital role in the hydrologic cycle since they impact stream flow, add to water storage capacity, provide habitat for many species, and provide resiliency in ecosystems. Ondiri Swamp, which is a peatland located in Kenya with approximately an area of 33 hectares and is the headwaters of Nairobi River has very little hydrological understanding, especially regarding subsurface and groundwater contributions since there have not been any continuous in-situ data measurements. This study aims to quantify water storage and investigate potential groundwater presence using an embedded, multi-sensor dataset.
To overcome the limitation of only using traditional optical index methods for surface water detection under dense vegetation, water occurrence data (Global Surface Water), Sentinel-1 SAR and Sentinel-2 multitemporal optical images, DEM images (Copernicus DEM), and NDVI derived vegetation index data will be combined. Measurements of swamp depth and peat thickness will be collected from short-term field campaigns for calibration of volume estimates and provide preliminary data for a preliminary water balance. The precipitation data (CHIRPS) and ET data (FAO WaPOR) will be combined with inflow and outflow estimates to create a preliminary water balance. Surface storage will be estimated, and potential groundwater contributions will be inferred without long-term observatory data sources. The methods used for the quantitative and qualitative assessment of wetland water resources will generate probabilistic wetland water maps using a multi-temporal remote sensing-based classification of existing datasets, as well as using terrestrial calibrations from field data. 
The study will be able to quantify total wetland water storage, determine the degree to which groundwater may influence wetlands, and identify the seasonal dynamics of wetland hydrology. Through a combination of remote sensing, existing datasets, and terrestrial calibrations from field studies, the study provides a strong, scalable framework for conducting wetland hydrology research, managing wetland ecosystems and planning wetland water resources in areas where very few, if any, hydrological observations are available.

How to cite: Ouedraogo, A.: Estimating Surface and Subsurface Water in Ondiri Swamp, Kenya, Using Multi-Sensor Embedded Data and Preliminary Water Balance, EGU General Assembly 2026, Vienna, Austria, 3–8 May 2026, EGU26-19536, https://doi.org/10.5194/egusphere-egu26-19536, 2026.

EGU26-21040 | ECS | Posters virtual | VPS9

Identifying Scale-Dependent Snow patterns from learned fusion of Multi-modal, Multi-resolution satellite observations 

Getnet Demil, Muhammad Farhan Humayun, Tomi Westerlund, Jukka Heikkonen, and Mourad Oussalah

Snow accumulation and melt dynamics govern water availability and flood timing across high-latitude catchments, yet observational gaps constrain understanding of scale-dependent hydrologic processes. Traditional snow monitoring relies on sparse gauge networks or coarse satellite products, preventing observation of sub-catchment patterns critical for hydrologic connectivity. Recent advances in Sentinel-1 SAR (10m, all-weather) and Sentinel-2 optical (10m, 20m, 60m) constellations offer transformative observational capabilities, yet systematically exploiting their complementary information for continuous fine-resolution snow monitoring across cloud-prone regions remains an operational challenge.

We present an innovative all-weather snow monitoring system that fuses Sentinel-1 SAR backscatter (sensitive to snow wetness and surface properties) with Sentinel-2 optical imagery (discriminating snow from clouds and bare ground) to deliver 10m resolution fractional snow cover estimates across boreal Finland. This fusion approach explicitly addresses the fundamental limitation of optical-only monitoring: persistent cloud contamination prevents observations during critical winter periods in high-latitude regions. Our methodology incorporates quality-aware atmospheric corrections (cloud masks, aerosol optical thickness, water vapor) to extract reliable snow information despite challenging atmospheric conditions.

A data-driven multi-resolution framework bridges the critical scale gap between fine-resolution satellite observations (10m) and operational hydrologic models requiring catchment-aggregated snow states. The system learns scale-dependent aggregation and disaggregation functions directly from observations, preserving fine-scale spatial patterns essential for understanding snow redistribution by wind, sublimation, and terrain-driven processes. This approach captures heterogeneity at forest-canopy scales while remaining compatible with distributed hydrologic model architectures.

Operational validation demonstrates that the system achieves physically realistic snow patterns with spatially coherent uncertainty estimates that appropriately elevate at snow-land boundaries where hydrologic transitions occur. These calibrated uncertainty bounds are critical for risk-informed water management and probabilistic flood forecasting, enabling downstream hydrologic models to appropriately weight observational constraints.

Key scientific innovations: (1) Demonstrated feasibility of all-weather snow monitoring by effectively combining complementary SAR and optical signatures, overcoming the cloud-cover limitation that constrains optical-only approaches during 60-80\% of winter days in boreal regions. (2) Developed a principled multi-scale learning framework that explicitly captures scale-dependent aggregation and disaggregation properties, bridging satellite observations and hydrologic model requirements. (3) Resolved sub-catchment snow heterogeneity previously masked in operational products (MODIS: 500m, VIIRS: 375m), enabling new insights into snow redistribution and hydrologic connectivity across fragmented landscapes. (4) Quantified spatial structure in prediction uncertainty, enabling probabilistic hydrologic forecasting that appropriately reflects observational constraints.

This next-generation observational capability addresses critical scientific and operational data gaps: calibrating distributed snow models at relevant scales, improving melt timing predictions through continuous all-weather depletion monitoring, validating snow-pack simulations in data-sparse headwater regions, and quantifying snow-climate feedbacks across heterogeneous landscapes. The framework's transferability to pan-Arctic and mountain regions demonstrates how integrating complementary space-based observations through data-driven fusion unlocks fine-scale process understanding previously limited by observational constraints, advancing our capacity for water security assessment and climate adaptation planning in snow-dependent regions.

How to cite: Demil, G., Humayun, M. F., Westerlund, T., Heikkonen, J., and Oussalah, M.: Identifying Scale-Dependent Snow patterns from learned fusion of Multi-modal, Multi-resolution satellite observations, EGU General Assembly 2026, Vienna, Austria, 3–8 May 2026, EGU26-21040, https://doi.org/10.5194/egusphere-egu26-21040, 2026.

EGU26-21606 | ECS | Posters virtual | VPS9

The Role of Reservoirs in a Glacierized Basin Under Climate Change: An Analysis Using the WEAP Model 

Umaima Abdul Jalil, Brecht D'Haeyer, Sreya Prakash, and Jingshui Huang


The Syr Darya River Basin is a highly glacierized transboundary system where future water availability is strongly influenced by climate change, reservoir operations, and population growth. This study investigates the role of reservoirs in regulating water supply under future climate scenarios using the Water Evaluation and Planning (WEAP) model. Climate projections from the ISIMIP framework under Shared Socioeconomic Pathways SSP1-2.6, SSP3-7.0, and SSP5-8.5 are used to drive hydrological inputs, including streamflow, precipitation, and temperature, while population growth projections represent evolving water demands.

 Results indicate a strong increase in summer unmet demand by 2050, intensifying further by 2090, with peak deficits occurring in July–August. Reservoir refilling remains seasonal across all scenarios but becomes more variable and less reliable by 2090, with deeper drawdowns and reduced buffering capacity under higher-emission pathways.

How to cite: Abdul Jalil, U., D'Haeyer, B., Prakash, S., and Huang, J.: The Role of Reservoirs in a Glacierized Basin Under Climate Change: An Analysis Using the WEAP Model, EGU General Assembly 2026, Vienna, Austria, 3–8 May 2026, EGU26-21606, https://doi.org/10.5194/egusphere-egu26-21606, 2026.

EGU26-22432 | Posters virtual | VPS9

Benchmarking flexible modelling framework Shyft across mainland Norway 

Olga Silantyeva, Shaochun Huang, and Chong-Yu Xu

Developing hydrological models, which are process-aware and reliably transferable across diverse environments remains a challenge. We benchmark Shyft – an open-source, fully FAIR (findable, accessible, interoperable and reusable) flexible modeling framework, across 109 catchments in mainland Norway to evaluate how model structure, forcing uncertainty and calibration objective jointly shape streamflow simulation performance. We adopt large sample hydrology perspective to probe five models “stacks”, providing alternative process choices, such as evapotranspiration (Penman-Monteith vs Priestley-Taylor), snowmelt (temperature-index vs semiphysical) and runoff response (Kirchner vs HBV tank and soil) with multiple goal functions drawn from KlingGupta Efficiency (KGE) and Nash-Sutcliffe Efficiency (NSE), with and without catchment specific precipitation correction. We use a suite of evaluation metrics targeting bias, hydrograph dynamics, low flows and interannual variability. We move beyond crude mean-flow benchmarks toward simple climatological benchmarks, providing an objective context for model skill evaluation, given the seasonal nature of Norwegian catchments.


The evaluation revealed that configurations containing temperature-index snow simulation and Kirchner runoff offer the greatest robustness and generality across all hydrological regimes. In terms of objective functions, KGEbased targets outperform NSE-based targets, with metric combining KGE and box-cox transformed KGE (KGE_bcKGE) identified as a promising generalist objective, which performs well across diverse metrics, including low-flow targeted (KGE(1/Q)) and interannual NSE. Furthermore, precipitation correction was found to be essential for improving performance in Mountain and Inland regimes, suggesting snow undercatch as a primary source of precipitation uncertainty. Among simple benchmarks, daily mean was found to be best predictor setting model expectations for future model intercomparisons in the region. Our results demonstrate the need for balance of structural adequacy, forcing uncertainty and equifinality.


This project is supported by Norwegian Research Council NFR project 336621.

How to cite: Silantyeva, O., Huang, S., and Xu, C.-Y.: Benchmarking flexible modelling framework Shyft across mainland Norway, EGU General Assembly 2026, Vienna, Austria, 3–8 May 2026, EGU26-22432, https://doi.org/10.5194/egusphere-egu26-22432, 2026.

The climate-related risks in South Africa’s Raymond Mhlaba Municipality and similar rural regions include erratic rainfall, recurring droughts, heatwaves, and shifting seasons. These directly threaten agricultural productivity, leading to frequent crop losses and food insecurity. Vulnerability is heightened by reliance on rain-fed small-scale farming, minimal irrigation infrastructure to buffer against climatic shocks, and the use of old farming methods.

The government uses radio, television, newspapers, and flyers to communicate climate change, and universities are trying to produce more extension officers to assist farmers, but the challenge remains unaddressed.  The root causes of this vulnerability are multi-layered: weak data dissemination systems, socio-economic marginalization, land tenure insecurity, infrastructure deficits, and regulatory and governance gaps. Consequently, farmers make key agricultural decisions such as when and what to plant without critical zone science knowledge, leading to frequent crop losses, wasted inputs, and heightened poverty.

As such, having a Climate-Adapt-Farm-Wise-AI (CAFW-AI) which can inform the farmer about the climate change and provide customised suggestions to a farmer to a) use conservation agriculture, drought-tolerant crop varieties, and precision irrigation to enhance productivity and climate resilience b) integrate adaptation and mitigation strategies across the entire food value chain to ensure sustainable food production and reduce greenhouse gas emissions c) employ Sustainable Agricultural Practices (SAPs) such as agroforestry and millet resilience to improve soil health and enhance food security in climate-vulnerable regions, based on their geographical area.

These techniques are crucial for fostering innovation and resilience in agricultural economies, especially in the face of climate change. By integrating these innovations, farmers can enhance productivity, reduce environmental impact, and ensure food security.

The proposed solution to the problem 

The initiative introduces an AI-enabled, open-source mobile platform that delivers localized, real-time agricultural advisories to rural small-scale farmers in climate-vulnerable regions such as the Eastern Cape. Its strategies are threefold:

  • Localized Climate-Smart Decision Support:

By integrating real-time weather data from IoT sensors (local weather stations), information, and Indigenous Knowledge Systems (IKS), the AI model generates tailored recommendations on crop selection, planting times, and resource use. This ensures that decisions are data-driven, context-specific, and actionable for farmers with limited resources.

  • Accessible Communication Channels: The platform disseminates advisories via SMS/USSD in local languages (e.g., isiXhosa), bridging the digital divide for communities with limited or no smartphone access.
  • Feedback-Driven Learning: Farmers contribute local observations (e.g., rainfall, soil moisture, pest outbreaks) into the system. AI processes these inputs alongside satellite and meteorological data, enabling continuous model refinement and ensuring the system evolves with changing conditions.

What sets this initiative apart is the role of real-time weather data from IoT sensors (local weather stations), AI in combining heterogeneous data sources (real-time weather, soil characteristics, and farmer inputs) to generate hyper-local insights that would not be possible through traditional extension methods. Previously, climate advisories were generalized, delayed, and fragmented; now, AI enables predictive analytics and personalized recommendations at scale, even in remote areas.

How to cite: Vambe, W. T.: Climate-Adapt-Farm-Wise-AI (CAFW-AI): Utilizing IoT, AI, and Machine Learning to Enhance Decision-Making and Protect Crops More Effectively Against Climate Change, EGU General Assembly 2026, Vienna, Austria, 3–8 May 2026, EGU26-23177, https://doi.org/10.5194/egusphere-egu26-23177, 2026.

EGU26-245 | ECS | Posters virtual | VPS10

Surface Water Dynamics under Changing Climate: Integrating Multi-Sensor Satellite Observations (1999–2025) across the Falkland Islands 

Nyein Thandar Ko, Alastair Baylis, G.Matt Davies, Deborah Barlow, and Christopher Evans

A major threat to Falkland Islands (FI) biodiversity and livelihoods is a drying climate. As warming continues, FI water security is a growing concern, but we lack baseline data to inform mitigation and adaptation. This study applies an innovative remote sensing approach to monitor long-term surface water variability across the Falkland Islands, aiming to support climate-resilient water management. Using the Google Earth Engine (GEE) platform, historical dynamics from 1999–2021 were derived from the Global Surface Water (GSW) Explorer dataset, while recent trends (2021–2025) were assessed using Harmonized Sentinel-2 MSI Level-2A imagery. Together, these enable the first continuous, multi-decadal assessment of pond, wetland, and lake dynamics across East Falkland, West Falkland, and Lafonia. Preliminary results show a relative decline in surface water extent across East Falkland, West Falkland, and Lafonia from 1999 to 2021. More recent Sentinel-2 observations reveal regionally distinct trends from 2021 to 2025: East Falkland remains relatively stable, West Falkland shows a modest increase, and Lafonia exhibits a pronounced rise with strong seasonal variability. These results align with limited ground observations from the water level monitoring site, where satellite-derived surface water area strongly correlates with recorded maximum water levels, confirming the hydrological consistency of the satellite data. Despite limited ground validation, this proof-of-concept highlights the capability of cloud-based remote sensing tools to monitor hydrological variability at regional scale. This approach illustrates how open-access Earth observation data and hydroinformatics tools can aid early detection of climate-driven water changes and strengthen water management in data-scarce areas. It also establishes a basis for future studies linking satellite data with peatland hydrology and ecosystem resilience.

Keywords: Climate Change Impacts, Surface Water Variability, Remote Sensing, Sentinel-2, Google Earth Engine

How to cite: Ko, N. T., Baylis, A., Davies, G. M., Barlow, D., and Evans, C.: Surface Water Dynamics under Changing Climate: Integrating Multi-Sensor Satellite Observations (1999–2025) across the Falkland Islands, EGU General Assembly 2026, Vienna, Austria, 3–8 May 2026, EGU26-245, https://doi.org/10.5194/egusphere-egu26-245, 2026.

EGU26-1031 | ECS | Posters virtual | VPS10

Mass Conserving LSTM with Dual States for Improved Streamflow Prediction through Quickflow and Slow Storage Separation 

Saurabh Toraskar, M Niranjan Naik, Abhilash Singh, and Kumar Gaurav

Long-Short Term Memory (LSTM) shows exceptional performance for rainfall-runoff modelling, but lacks physical realism. Efforts to integrate mass conserving into the model architecture didn’t translate to significant improvement in predictive accuracy. We build on the Mass-Conserving LSTM (MC-LSTM) by proposing a novel architecture that incorporates two complementary cell states to represent distinct fast and slow hydrologic memory components while maintaining strict mass balance. We introduce a new partition gate for segregating the mass input for long- and short-term memory, and made required architectural changes to incorporate additional cell state. We benchmarked our model against LSTM and MC-LSTM on CAMELS-IND (158 basins) and CAMELS-US (531 basins) using NSE, KGE, Pearson-r, FHV, FLV, and peak timing/magnitude. For the Indian dataset, MC-LSTM-DS surpasses both LSTM and MC-LSTM across all metrics except Pearson-r and FLV, where it exceeds the performance of LSTM but falls short of MC-LSTM. In the low flow regime (FLV), our model decreases the overestimation of LSTM significantly, while MC-LSTM shows severe underestimation. Analysis of the spatial distribution revealed it to be aligned with hydroclimate, where all the models performed better in humid/tropical climates, while performance lacked in arid regions. Investigation of the cell states revealed that the added cell state represents the long-term processes effectively, while the original cell state captures short-term processes. The change in their relative contributions according to the climate characteristic is observed, thus confirming our hypothesis and also providing an interpretable decomposition of the simulated flows. On the CAMELS-US dataset, MC-LSTM-DS demonstrates equal performance as MC-LSTM and LSTM on NSE, and outperforms all the models in KGE, FHV, and Pearson-r. In FLV, it outperforms all the mass-conserving models by a huge margin and is just short of LSTM. This study proposes a novel mass-conserving model that provides an interpretable prediction. We claim MC-LSTM-DS to be the current state-of-the-art for large sample rainfall runoff modelling, as it showed superior performance across two diverse regions. To the best of our knowledge, this study is the first to investigate the effects of strict mass conservation on the diverse Indian region.

How to cite: Toraskar, S., Naik, M. N., Singh, A., and Gaurav, K.: Mass Conserving LSTM with Dual States for Improved Streamflow Prediction through Quickflow and Slow Storage Separation, EGU General Assembly 2026, Vienna, Austria, 3–8 May 2026, EGU26-1031, https://doi.org/10.5194/egusphere-egu26-1031, 2026.

EGU26-2054 | ECS | Posters virtual | VPS10

Real-Time UAV-Deep Learning System for Citrus Orchard Structure and Yield Assessment 

Khaoula Bakas, Amine Saddik, Azzedine Dliou, Mohammed Hssaisoune, Said El Hachemy, Hamza Ait Ichou, Fatima Hmache, Mohammed El Hafyani, Adnane Labbaci, and Lhoussaine Bouchaou

Arid and semi-arid regions are facing more frequent and severe droughts, with annual rainfall often below 200 mm. Large-scale, intensive irrigation further strains these limited water resources. Under these conditions, growers need practical tools to estimate yield and monitor tree health at high spatial detail so they can better manage irrigation and inputs. This work develops and tests an automated, data-driven pipeline for estimating citrus yield at the individual-tree level using UAV imagery and Deep Learning. The pipeline comprises three main components. First, individual trees and orchard rows are segmented using a lightweight Tiny U‑Net model. Second, a CNN-based model predicts tree-level yield from vegetation indices and field measurements. Third, these predictions are validated through detailed fruit sampling.

The study was conducted in a commercial citrus orchard in a semi-arid region under climate and water stress. High‑resolution UAV imagery was processed into orthomosaics and vegetation index maps, and the Tiny U‑Net was optimized for fast, near real‑time semantic segmentation, enabling precise tree crown delineation and accurate tree and row counts. For yield prediction, the CNN model exploited spatial features from vegetation indices combined with in‑situ data. The validation relied on direct comparison between UAV‑based yield estimates and yields obtained from field sampling and laboratory weighing. Both mean and median yields per tree were computed to capture tree‑level variability. The final dataset, consisting of 34 trees and approximately 340 fruit samples, provided a robust basis for assessing model performance. The Tiny U‑Net segmentation model reached high accuracy, with precision and recall of 94.74% and 94.88%, and an inference time of 12.55 ms per image tile. This shows the model is suitable for real‑time or on‑board use and can reliably map orchard structure at large scale. Tree and row counts derived from the segmentation achieved an R² greater than 0.99, confirming the robustness of the approach. For yield estimation, the CNN model outperformed other machine learning methods, achieving an R² of 0.88 at tree level. Field validation confirmed the practical usefulness of the pipeline, UAV‑predicted yields closely matched ground‑truth values, with both indicating an average yield of roughly 50 kg per tree. Most trees fell between 40 and 70 kg, and the model’s output histogram mean 50.9 kg, and median 51.4 kg aligned well with these field observations.

This robust agreement between model outputs and independent field validation data underscores the system's reliability and operational readiness for accurate, tree-level yield mapping. By integrating precise tree segmentation, high-resolution vegetation indices, and rigorously collected ground truth measurements, this study demonstrates that automated yield maps can be produced with sufficient accuracy to support operational decisions in orchards. This offers a cost-effective and scalable tool for precision agriculture, enabling optimized resource allocation, improved harvest planning, and adaptive management under increasing climate stress.

How to cite: Bakas, K., Saddik, A., Dliou, A., Hssaisoune, M., El Hachemy, S., Ait Ichou, H., Hmache, F., El Hafyani, M., Labbaci, A., and Bouchaou, L.: Real-Time UAV-Deep Learning System for Citrus Orchard Structure and Yield Assessment, EGU General Assembly 2026, Vienna, Austria, 3–8 May 2026, EGU26-2054, https://doi.org/10.5194/egusphere-egu26-2054, 2026.

EGU26-2155 | ECS | Posters virtual | VPS10

A combined approach of UAV data and machine learning algorithms in weeds detection  

Mohammed El Hafyani, Abdelwahed Chaaou, Amine Sadik, Adnane Labbaci, Mohammed Hssaisoune, Abdellaali Tairi, Fatima Abdelfadel, Soufiane Taia, Hamza Ait-Ichou, Ilham Elhaid, and Lhoussaine Bouchaou

The Souss-Massa region is known as the most important agricultural area in Morocco, and one of the most affected regions by climate change and over-exploitation. This situation has required the intervention of new tools to improve water resource management. In this context, the Unmanned Aerial Vehicles (UAVs) images data were used for weeds detection in a Citrus orchard farm. Two sites were considered, the first one planted with 12-years-old and 1.5 years-old clementine trees. After a panoply of image processing from the data collection, following by the georeferencing, the creation of the digital elevation model, the digital surface model, and the elaboration of the orthomosaic image, the machine learning algorithms (MLA) such as Maximum Likelihood Classification, Minimum Distance Classification, Support Vector Machine, were applied for weeds detection and mapping. For both sites, all MLA showed a Cohen’s kappa coefficient higher than 0.6 and an overall accuracy higher than 60%. This study demonstrates how this emerging technology offers farmers opportunities to enhance production while optimizing water usage.

How to cite: El Hafyani, M., Chaaou, A., Sadik, A., Labbaci, A., Hssaisoune, M., Tairi, A., Abdelfadel, F., Taia, S., Ait-Ichou, H., Elhaid, I., and Bouchaou, L.: A combined approach of UAV data and machine learning algorithms in weeds detection , EGU General Assembly 2026, Vienna, Austria, 3–8 May 2026, EGU26-2155, https://doi.org/10.5194/egusphere-egu26-2155, 2026.

Coastal wetlands, characterized by their geomorphological sensitivity and tidal dependence, exhibit pronounced vulnerability under global warming. While the persistent threat of sea-level rise to coastal wetlands has been extensively documented at the macroscale, there remains a lack of systematic quantitative frameworks for mapping these trends to the microscale dynamics of wetland evolution. To address this gap, this paper proposes WetFramework, a novel approach for joint modeling of spatial structure and temporal variation in wetlands. (1) In the encoder, Transformer and Mamba modules are integrated to enhance multiscale feature representation through the synergy of global attention and implicit sequence modeling, with a Token-Driven Attention Mechanism (TDAM) designed to facilitate deep interactions between features. (2) In the decoder, a Wavelet-Enhanced Reconstruction Module (WERM) is introduced to improve spatial structure modeling via wavelet transforms, thereby optimizing boundary delineation and fine detail representation for precise mapping of coastal wetland extents. (3) To capture periodic inundation characteristics, a Fourier-Based Inundation Estimation Module (FBIEM) is further proposed, incorporating tidal-height observations to enable unsupervised modeling of pixel-level hydrological responses and quantitative expression of inundation rhythms. Extensive experiments conducted in four representative coastal regions—Yancheng and Dongying (China), Mont-Saint-Michel Bay (France), and San Francisco Bay (USA)—demonstrate that the proposed framework outperforms state-of-the-art models across multiple evaluation metrics and exhibits robust cross-regional generalization and dynamic modeling capabilities. This study provides an effective paradigm for intelligent remote sensing-based wetland identification and long-term hydrological modeling, and offers key hydrological information to support inundation-dynamics monitoring and management decision-making.

How to cite: Liang, J.: WetFramework: A Deep Learning Framework for Coastal Wetland Boundary Extraction and Inundation Frequency Estimation, EGU General Assembly 2026, Vienna, Austria, 3–8 May 2026, EGU26-2567, https://doi.org/10.5194/egusphere-egu26-2567, 2026.

EGU26-3158 | Posters virtual | VPS10

Revisiting a riparian invasive shrub and its biocontrol in the western United States: Measured Changes in Water Use 

Pamela Nagler, Emily Palmquist, Keirith Snyder, Eduardo Jimenez-Hernandez, and Kevin Hultine

In 2001, the tamarisk leaf beetle (Diorhabda spp.) was released as a biological control agent for invasive tamarisk (Tamarix spp.), which dominates many floodplains in the western United States (US) and substantially alters riparian ecosystem structure and function. Since its release, the beetle has expanded across thousands of river kilometers, repeatedly defoliating tamarisk far beyond original release sites. Although biological control offers an alternative to mechanical or chemical removal, its ecological benefits and tradeoffs remain uncertain. Here, we synthesize current understanding of one of the most extensive biological control programs implemented in North America, evaluating impacts on riparian evapotranspiration (ET) and riverine hydrology. We assess ongoing challenges and opportunities associated with tamarisk biocontrol and consider how western US riparian forests may evolve under reduced tamarisk dominance.

Early management efforts were driven by the assumption that tamarisk consumed exceptionally large volumes of water, motivating legislative and large-scale removal programs. Subsequent studies, however, demonstrated that tamarisk water use is highly variable and comparable to native riparian vegetation such as cottonwood (Populus spp.) and willow (Salix spp.), as well as mixed shrub communities. Reported tamarisk ET since 2000 ranges widely (109–1456 mm yr⁻¹), with mean values near 850 mm yr⁻¹, depending on stand age, density, health, groundwater depth, soil properties, and salinity.

Defoliation by Diorhabda spp. was expected to enhance streamflow by reducing riparian ET, yet observed hydrologic responses have been inconsistent. In past research ET declines exceed 40% relative to healthy tamarisk at some locations, whereas at other sites, reductions are modest or absent, particularly where baseline ET is low. In this current study, we reassess post-defoliation dynamics by analyzing ET across 27 riparian sites from 2014–2023 using Landsat-derived Nagler ET(EVI2) estimates and gridded climate data. Approximately half of the sites exhibited sustained ET reductions averaging a loss of 18% (−142 mm yr⁻¹), while the remainder showed negligible change or increases in ET of 9% (+54 mm yr⁻¹), likely reflecting tamarisk regrowth or replacement by other vegetation. Across all sites, net water savings were modest, averaging a loss of 7% (−48 mm yr⁻¹), consistent with earlier estimates.

These findings reinforce that hydrologic benefits from tamarisk biocontrol are site-specific, often transient, and frequently offset by vegetation recovery or compositional shifts. Consequently, biological control alone is unlikely to yield substantial or reliable increases in water availability for agricultural or municipal use. Predicting future structure and function of western US riparian forests under tamarisk biocontrol requires explicit consideration of ecosystem complexity, spatial heterogeneity, and interacting drivers that will shape whether alternative states favor native vegetation recovery or secondary invasions.

How to cite: Nagler, P., Palmquist, E., Snyder, K., Jimenez-Hernandez, E., and Hultine, K.: Revisiting a riparian invasive shrub and its biocontrol in the western United States: Measured Changes in Water Use, EGU General Assembly 2026, Vienna, Austria, 3–8 May 2026, EGU26-3158, https://doi.org/10.5194/egusphere-egu26-3158, 2026.

EGU26-6937 | Posters virtual | VPS10

Integrating deep learning and hydrological modelling to assess farm roadway runoff risk to inform targeted mitigation in grassland systems 

Lungile Senteni Sifundza, John G. Murnane, Karen Daly, Russell Adams, Patrick Tuohy, and Owen Fenton

Farm roadway networks are an important infrastructure in grassland farms providing access between the farmyard and grazing fields. However, during livestock movement, excreta is deposited on the roadways, especially on bends, T-junctions and at corners where their movement is impeded. Nutrient-enriched soiled runoff generated on these roadways can contribute significantly to water quality degradation if connected to waters (including man-made open drainage ditches). Quantifying the risk associated with farm roadway runoff delivery to waters includes mapping the roadway and drainage networks and identifying sections which contain high pollutant loads and have the potential of generating, mobilising and delivering surface runoff to the drainage channels. In this study, a deep learning (DL) approach was employed to automatically identify internal farm roadway networks and open drainage channels in 5 grassland farms. Aerial imagery and LiDAR-derived digital terrain models were used to train the DL models for identifying farm roadways and open drainage ditches, respectively. The flow direction and flow accumulation were determined using digital elevation models to map farm roadway sections that have the potential to generate and deliver runoff to the drainage network.

Across the 5 farms, a total of 16.7 km of roadway and 13.5 km of drainage channels were identified by the DL models, achieving precisions of 79 % and 64 %, and accuracies of 90 % and 96 %, respectively. Flow accumulation maps were established for each farm to assess delivery pathways and the potential of roadway runoff connectivity to waters. Flow pathways through roadway junctions and at corners were considered critical outranking those on straight roadway sections. Breaking the runoff pathway at these locations will help prevent delivery to waters. The findings of this study indicate that mapping of open drainage channels and internal farm roadways in grassland farms can be automated by using deep learning models. Integrating the automated mapping and hydrological modelling enables more precise identification of critical roadway sections, supporting targeted mitigation to reduce soiled runoff from entering waters and thus enhance water quality protection in grassland farming systems.

How to cite: Sifundza, L. S., Murnane, J. G., Daly, K., Adams, R., Tuohy, P., and Fenton, O.: Integrating deep learning and hydrological modelling to assess farm roadway runoff risk to inform targeted mitigation in grassland systems, EGU General Assembly 2026, Vienna, Austria, 3–8 May 2026, EGU26-6937, https://doi.org/10.5194/egusphere-egu26-6937, 2026.

Abstract: 

In this work, we develop a hydrological model designed to simulate the water balance and runoff processes at the catchment-scale. Instead of using a rectangular grid discretization, the model represents the catchment using a non-homogeneous two-dimensional triangular mesh framework (similar to a triangular mesh in the Finite Element method). This discretization fits a more flexible representation of complex topography and land boundaries. The model is implemented in the Fortran programming language. It depends on the Digital Elevation Model (DEM) to extract the flow pathways starting from upstream and reaching downstream. That guarantees a physically consistent and explicit flow-routing structure across the triangular mesh.

Evapotranspiration is calculated using the Penman–Monteith equation, as the parameters are considered to suit coastal climate conditions. The model utilizes temperature, solar radiation, wind speed, and vapor pressure as atmospheric inputs. The SCS Curve Number method is used to estimate the surface runoff, considering slope, land cover, and soil properties. Meteorological data measurements, including precipitation, temperature, humidity, as well as inflow and outflow discharges, are integrated into the simulations.

Due to its efficient numerical structure, the model supports simulations with numerous spatial elements and long time series while maintaining the computational cost at its lowest limits. This makes it well-suited for large-scale watershed applications and provides a strong basis for future high-performance computing developments.


Keywords: hydrological modeling, watershed triangulation, flow routing, numerical simulation

How to cite: Dali, N.: Hydrological Modelling Framework for Large-Scale Catchments using triangular nonhomogeneous spatial discretization, EGU General Assembly 2026, Vienna, Austria, 3–8 May 2026, EGU26-8171, https://doi.org/10.5194/egusphere-egu26-8171, 2026.

EGU26-8394 | ECS | Posters virtual | VPS10

Uncertainty Evaluation of Hydraulic Jumps in Open-Surface Flows 

Simon Cuny, Panayiotis Dimitriadis, Demetris Koutsoyiannis, G.-Fivos Sargentis, and Theano Iliopoulou

The hydraulic jump is considered to have one of the largest energy losses in the field of Hydraulics. These losses are caused during transition from super-critical to sub-critical flow conditions in the case of open-surface flows. In this study, we focus on a laboratory-scale hydraulic jump combining both experimental measurements and model simulations using theoretical arguments. The main objective is to identify, quantify, and interpret the uncertainty in both cases through key parameters, such as the (sub/super) critical depths and channel geometry, for various flow conditions, with emphasis on energy dissipation, turbulence, mixing, regime transitions, and flow stability characteristics .

How to cite: Cuny, S., Dimitriadis, P., Koutsoyiannis, D., Sargentis, G.-F., and Iliopoulou, T.: Uncertainty Evaluation of Hydraulic Jumps in Open-Surface Flows, EGU General Assembly 2026, Vienna, Austria, 3–8 May 2026, EGU26-8394, https://doi.org/10.5194/egusphere-egu26-8394, 2026.

EGU26-8717 | Posters virtual | VPS10

Analysis of Heavy Precipitation and its Typical Weather Patterns over the Upper Reaches of the Yellow River 

Changrong Tan, Yaoming Ma, Xuelong Chen, Weimo Li, and Qiang Zhang

The frequency of disasters induced by heavy precipitation (HP) in the upper reaches of the Yellow River Basin (URYR) has increased notably. This study had further elucidated the structure and interactions of synoptic systems across different pressure levels and quantitatively characterized the anomalous driving factors. Four weather types had been identified: Xinjiang Trough (Type1, constituting 35% of HP), Mongolian Trough (Type2, 14%), Westward–Extension Western Pacific Subtropical High (WPSH) (Type3, 43%), and Cut–Off Cyclone (Type4, 8%). Influenced by the troughs, the moisture anomalies are transported by the southwesterly jet originating from Bay of Bengal low-pressure systems. In Type3, the WPSH and South Asian High demonstrate the greatest zonal expansion and central intensity (reaching 12610 gpm); this type distinguished by maximal moisture and energy, exhibits the most pronounced extreme properties. The most notable characteristic of Type4 is its stability and persistence presented the most favorable dynamic conditions, despite occurring with the lowest frequency. Due to the anomalous evolution of atmospheric circulation, the anomalies in potential vorticity, column-integrated precipitable water, and convective available potential energy increase; negative anomalies in vertical velocity and moisture flux divergence decline dramatically within 12 to 6 hours preceding HP, signaling anomalous moisture convergence coupled with ascending motion. Low-level moisture is impeded and diverted by the TP topography, generating northerly flow along its eastern flank and forming a distinct “moisture corridor”. Orographic uplift introduces pronounced vertical component to the moisture flux vectors and intensifies local circulations, thereby promoting the initiation and organization of mesoscale systems. The vertical moisture advection serves as dominant mechanism driving HP, while zonal or meridional moist enthalpy predominantly contributes to the physical processes driving the ascending motion under different patterns. These findings may offer a scientific basis for the prediction of HP events in the region. 

How to cite: Tan, C., Ma, Y., Chen, X., Li, W., and Zhang, Q.: Analysis of Heavy Precipitation and its Typical Weather Patterns over the Upper Reaches of the Yellow River, EGU General Assembly 2026, Vienna, Austria, 3–8 May 2026, EGU26-8717, https://doi.org/10.5194/egusphere-egu26-8717, 2026.

EGU26-8732 | Posters virtual | VPS10

Tracking The GER Dam Impoundment Stages Using SWOT and Other Radar Altimetry Products 

Mahir Tazwar, Roelof Rietbroek, Ben H.P. Maathuis, and Amin Shakya

Monitoring of inland water bodies is considered crucial for effective water resource management. In this study, a combination of satellite imagery and altimetry products was utilized to monitor changes in water level and surface extent during the different operational filling phases of the Grand Ethiopian Renaissance (GER) Dam. The primary objective was to utilize diverse remote sensing products to provide an accurate estimation of water volume changes over time. Sentinel-1 data were processed using an unsupervised edge Otsu algorithm to map reservoir extents. These output maps were validated against Planet and Sentinel-2 water masks, and a high level of agreement was observed, with overall accuracy values ranging from 0.97 to 0.99. Furthermore, various Surface Water and Ocean Topography (SWOT) satellite products were evaluated for the estimation of reservoir extents. It was found that the SWOT Lake Single Product performed poorly, with an Intersection over Union (IOU) value of approximately 0.33 being recorded. In contrast, moderate agreement with validation sets was demonstrated by the SWOT water mask raster and pixel cloud products, with overall accuracy values ranging from 0.78 to 0.89 being observed. Volume variation across different dam operational phases was estimated through the application of satellite-based observations and a DEM contouring method. Although a high correlation (R2 value of 0.98) was exhibited by both methods, significant differences in absolute values were identified (RMSE value of 2736.35 km3). These discrepancies are attributed to a potential scaling error and the inherent water slope present within the GER Dam reservoir.

How to cite: Tazwar, M., Rietbroek, R., Maathuis, B. H. P., and Shakya, A.: Tracking The GER Dam Impoundment Stages Using SWOT and Other Radar Altimetry Products, EGU General Assembly 2026, Vienna, Austria, 3–8 May 2026, EGU26-8732, https://doi.org/10.5194/egusphere-egu26-8732, 2026.

EGU26-10090 | Posters virtual | VPS10

Characterizing Baseflow in Indian River Basins Using SWOT Discharge Observations 

Rucha Sanjay Deshpande, Vidushi Vidushi, and Tajdarul Hassan Syed

Baseflow is a crucial component of streamflow, essentially driven by changes in groundwater storage, and is vital for sustaining flows during dry periods. Traditional techniques for baseflow quantification using graphical analysis or digital filters require long-term river discharge observations, which are often limited in their spatial extent. However, with the launch of the Surface Water and Ocean Topography (SWOT) mission, global estimates of river discharge are now available over a period of two years, offering a high-resolution dataset with at least one observation every 21 days. Despite its relatively coarse temporal resolution, prior studies have demonstrated SWOT’s ability to accurately estimate average baseflow even at one observation per cycle, based on synthetic SWOT discharge estimates. The high spatial resolution provided by ‘SWOT discharge’ can be utilized to estimate baseflow at a reach-scale and gain new insights into groundwater-surface water interactions in water-stressed river basins.

In this study, we will utilize SWOT’s discharge products over Indian river basins to characterize baseflow dynamics at reach-scale resolution and examine the effects of climate variability and land-use changes on baseflow. By accurately estimating the baseflow recession parameter (k), this study will be able to identify the gaining-to-losing transition in a basin. Furthermore, the research will explore SWOT’s ability to detect temporal shifts in the baseflow recession parameter (k) during the pre-monsoon period and evaluate the effects of anthropogenic extractions on the groundwater table. Finally, these estimates will be integrated into a mass-balance model, baseflow will be converted into upstream groundwater storage (GWS) changes and validated against independent GWS anomalies derived from the Gravity Recovery and Climate Experiment (GRACE) satellites. This study will demonstrate the capability of SWOT to bridge the gap between reach-scale hydraulics and basin-scale storage, providing a vital tool for sustainable water resource management in water-stressed regions.

How to cite: Deshpande, R. S., Vidushi, V., and Syed, T. H.: Characterizing Baseflow in Indian River Basins Using SWOT Discharge Observations, EGU General Assembly 2026, Vienna, Austria, 3–8 May 2026, EGU26-10090, https://doi.org/10.5194/egusphere-egu26-10090, 2026.

EGU26-10560 | ECS | Posters virtual | VPS10

Uncertainty Evaluation of Hydraulic Losses in Closed Pipes 

Marine Bourbon, G-Fivos Sargentis, Theano Iliopoulou, Demetris Koutsoyiannis, and Panayiotis Dimitriadis

In a context where energy efficiency is a major concern, studying linear and local head-losses in hydraulic networks is essential. These losses are mainly caused by internal fluid friction and network singularities (such as bends, section changes, valves, etc.), have a direct impact on water transport efficiency and management. In this study, we focus on a laboratory-scale hydraulic network combining both experimental measurements and model simulations using theoretical arguments and the EPANET software. The main objective is to identify, quantify, and interpret the uncertainty in both linear and typical local head-losses through key parameters, such as the friction factor and the local-loss coefficient, for various flow conditions.

How to cite: Bourbon, M., Sargentis, G.-F., Iliopoulou, T., Koutsoyiannis, D., and Dimitriadis, P.: Uncertainty Evaluation of Hydraulic Losses in Closed Pipes, EGU General Assembly 2026, Vienna, Austria, 3–8 May 2026, EGU26-10560, https://doi.org/10.5194/egusphere-egu26-10560, 2026.

EGU26-10679 | Posters virtual | VPS10

Contribution of Remote Sensing to the Analysis of the Drying Process of Lake Tanma under Strong Climate Variability 

Mame Diarra Bousso Ndeye, Serigne Mansour Diene, Saidou Ndao, Sabou Sarr, Awa Guèye, and Séni Tamba

Climate variability represents one of the most severe threats to lacustrine ecosystems worldwide, leading to water loss in nearly half of the world’s lakes and reservoirs. On the one hand, this variability is associated with drought conditions, manifested by a decline in precipitation. On the other hand, it is linked to rising temperatures, which enhance evaporation rates at lake surfaces.

In Senegal, a Sahelian country, the prolonged drought period of the 1970s led to the desiccation of several water bodies, including Lake Tanma. In this context, the present study contributes to a better understanding of the drying process of Lake Tanma under climate variability conditions, using remote sensing techniques. Lake Tanma is located in Thiès region, approximately 70 km from Dakar.

To achieve this objective, Landsat Earth observation products were used at the beginning and end of each decade between 1984 and 2024. The time series consists of multispectral images acquired in October, corresponding to the end of the rainy season in Senegal. This choice ensures the capture of the lake’s maximum water extent, thereby minimizing seasonal fluctuations. All data were acquired and processed using the Google Earth Engine platform. The Modified Normalized Difference Water Index (MNDWI) was computed for the entire time series to accurately delineate and characterize water-covered surfaces.

The results reveal a highly variable evolution of the inundated surface area of Lake Tanma, with a variation coefficient of 57.8%. The largest flooded area was observed in 1984, covering 969.33 ha, while the smallest extent was recorded in 2024, with only 76.18 ha. Analysis of intra-decadal variations shows a slight decrease (7%) in the flooded surface, between 1984 and 1989. In contrast, subsequent decades exhibit a marked and progressive regression of the lake’s water surface, reaching 21% during the 2000–2009 decade, 61% during 2010–2019, and up to 89% over the 2020–2024 period.

These decrease trends highlight the influence of hydro-climatic parameters, particularly precipitation and evaporation, which constitute the primary drivers of lake recharge and desiccation. Consequently, further investigation, of hydro-climatic factors, namely rainfall and temperature, is required, to better understand the drying process of Lake Tanma and to assess the impacts of hydro-climatic variability on its long-term dynamics.

How to cite: Ndeye, M. D. B., Diene, S. M., Ndao, S., Sarr, S., Guèye, A., and Tamba, S.: Contribution of Remote Sensing to the Analysis of the Drying Process of Lake Tanma under Strong Climate Variability, EGU General Assembly 2026, Vienna, Austria, 3–8 May 2026, EGU26-10679, https://doi.org/10.5194/egusphere-egu26-10679, 2026.

EGU26-12323 | ECS | Posters virtual | VPS10

Estimation of Crops Water Consumption by Remote Sensing: SEBAL Model Calculations Versus Ground Observation In The Irrigated Area of Lakhmess (Siliana, Northern Tunisia) 

Amani Belhaj Kilani, Alice Alonso, Anis Bousselmi, Slaheddine Khlifi, and Marnik Vanclooster

Tunisian agriculture remains a crucial component of the country’s economic development and faces considerable constraints related to increasing water demand and reducing water resources’ availability. Improving the assessment of irrigation water use is a prerequisite for sustainable water management. The present study aims to evaluate the quality of water consumption estimates in the Public Irrigated Area of Lakhmess using open-source data. High-resolution (10 m) Sentinel 2 images, combined with ERA5-land meterological data, were used to assess monthly and seasonal actual evapotranspiration (ET) and water use through the implementation of the Surface Energy Balance Algorithm for Land (SEBAL) in the Google Earth Engine (GEE) environment. The calculated water uses were combined with the seasonal supplied water to the PIA Lakhmess, collected at plot level.

This study was conducted over eight agricultural campaigns from 2015-2016 to 2022-2023. The method is validated for three sectors Sidi Jaber, Gantra and Gabel, comparing the seasonal water use estimates to water meter observations. Correlation analysis between estimated water use from open-access data and  in-situ measurement yielded correlation coefficients of 0.76, 0.75 and 0.73, with corresponding RMSE values of 0.461, 0.425, and 0,391 mm/day, respectively. In addition, SEBAL-derived evapotranspiration estimates were evaluated through comparison with reference evapotranspiration computed using the FAO-56 Penman-Monteith, resulting in an R²  of 0,68 and an RMSE of 0.315 mm/day. Overall, the methods were deemed satisfactory, as they facilitated the monitoring of excessive water usage by identifying areas where water losses occurred.

Key words: Evapotranspiration, Irrigation, water use, Remote sensing, GEE, SEBAL.

How to cite: Belhaj Kilani, A., Alonso, A., Bousselmi, A., Khlifi, S., and Vanclooster, M.: Estimation of Crops Water Consumption by Remote Sensing: SEBAL Model Calculations Versus Ground Observation In The Irrigated Area of Lakhmess (Siliana, Northern Tunisia), EGU General Assembly 2026, Vienna, Austria, 3–8 May 2026, EGU26-12323, https://doi.org/10.5194/egusphere-egu26-12323, 2026.

EGU26-15829 | ECS | Posters virtual | VPS10

Uncertainty-Aware Flood Prediction Using Deep Neural Networks Across Multiple Watersheds 

Mostafa Saberian, Vidya Samadi, Thorsten Wagener, and Ioana Popescu

Effectively characterizing uncertainty and error in flood prediction is essential for informed decision-making. This study combines advanced deep neural network architectures, i.e., Neural Hierarchical Interpolation for Time Series Forecasting (N-HiTS), and Long Short-Term Memory (LSTM), with multiple uncertainty quantification frameworks to evaluate flood forecasts across several watersheds in the southeastern United States. Bayesian inference, Monte Carlo–based methods, and quantile regression are applied to estimate predictive uncertainty. The comparative analysis examines how different uncertainty approaches perform across a range of flood magnitudes, highlighting their respective advantages and limitations at multiple scales. Results indicate that N-HiTS generally yields narrower and more reliable uncertainty bounds than LSTM. The findings further demonstrate that prior specification in MCMC sampling strongly influences uncertainty estimates and requires careful calibration. While Monte Carlo dropout, which is an approximate Bayesian technique, primarily captures uncertainty near flood peaks, MCMC offers a more complete characterization across the full hydrograph. In addition, this study investigates multi-site training to evaluate model adaptability under diverse hydrological regimes. Collectively, these results advance the integration of deep neural networks and uncertainty quantification to enhance flood modeling capabilities and risk management.

How to cite: Saberian, M., Samadi, V., Wagener, T., and Popescu, I.: Uncertainty-Aware Flood Prediction Using Deep Neural Networks Across Multiple Watersheds, EGU General Assembly 2026, Vienna, Austria, 3–8 May 2026, EGU26-15829, https://doi.org/10.5194/egusphere-egu26-15829, 2026.

EGU26-15872 | ECS | Posters virtual | VPS10

High-resolution operational Flood monitoring in India 

Hiren Solanki and Vimal Mishra

Flood is a recurrent natural disaster, causing socio-economic losses and affecting millions of people every year. High-resolution and near-real time monitoring of flood disasters is critical for a densely populated and hydro-climatically diverse country like India. Existing operational frameworks in India largely rely on coarse-resolution hydrological models and hydrodynamic models, biased meteorological forecasts, limited gauge networks, missing observed data for model setup, static land use, and deterministic forecasts, which constrain their ability to capture basin heterogeneity, reservoir regulation, agriculture expansion, urban influences, and short-term extremes. Here, we present a high-resolution, integrated operational flood monitoring framework using hydrological, hydrodynamic, and data-driven models to provide 5-day ahead forecasts of streamflow, water level, and flood inundation at more than 350 stations across India. We first evaluate meteorological forecasts from UKMO, KMA, ECMWF, and GEFS products to quantify their spatio-temporal skill and estimated systematic biases across hydro-climatic regimes. Consequently, we apply a knowledge distillation–based bias correction approach trained on observed rainfall and temperature data from the India Meteorological Department (IMD), enabling the physically consistent correction of meteorological inputs. These corrected forecasts are then integrated with a process-based hydrological model and a sequential long short-term memory network augmented with a multi-headed attention mechanism, which explicitly learns temporal dependencies, upstream connectivity, and the dynamic relevance of predictors. The forecasted streamflow is then fed into the large-scale hydrodynamic model to forecast water level and flood inundation maps. The proposed stochastic framework aims to achieve substantial improvements in short-lead flood prediction skill, enhanced representation of peak flows and water levels, and more realistic flood inundation dynamics compared to existing operational systems. By combining machine learning-based forecast correction, high-resolution modelling, and advanced deep learning, this study provides a scalable pathway for next-generation flood early warning systems in India, offering direct benefits for evacuation and rescue operations, reservoir operation, agriculture management, and disaster risk reduction at both national and sub-basin scales.

How to cite: Solanki, H. and Mishra, V.: High-resolution operational Flood monitoring in India, EGU General Assembly 2026, Vienna, Austria, 3–8 May 2026, EGU26-15872, https://doi.org/10.5194/egusphere-egu26-15872, 2026.

EGU26-16435 | Posters virtual | VPS10

Ecohydrological and multitemporal analysis of Andean wetlands under climate variabilitiy 

Stefano Sansoni-Koga, Jair Laurente-Torres, Merly Ccaico-Atoccsa, Summy Flores-Quispe, Gabriel Meza-Fajardo, and María Cárdenas-Gaudry

Bofedales are high-altitude wetlands whose functioning is closely linked to surface water availability, playing a key role in hydrological regulation and ecosystem resilience in the Andes. Despite their importance, spatially explicit information on their surface water dynamics remains limited, particularly in data-scarce mountain regions. This study investigates the ecohydrological dynamics of bofedales in the Alto Pampas sub-basin (Huancavelica, Peru) over the 2015–2024 period using a multitemporal remote sensing approach combined with climatic information. Seasonal patterns of bofedal extent and surface water presence were mapped from Landsat 8 imagery using vegetation and moisture indices (NDVI and NDII), together with topographic variables. Bofedales were identified through a Random Forest classification framework and subsequently categorized as permanent or seasonal based on the temporal persistence of hydric signals. Changes in surface water extent and bofedal productivity were quantified, and temporal trends were assessed using the Mann–Kendall test. In addition, generalized additive models were applied to examine potentially nonlinear relationships between climatic drivers and key ecohydrological indicators. The results reveal contrasting surface water trajectories among bofedales, reflecting heterogeneous sensitivity to climate variability within the sub-basin. These findings demonstrate the value of satellite-based monitoring for assessing surface water dynamics in high-Andean wetlands and provide relevant insights for water resources management and climate change adaptation in data-poor mountainous regions.

How to cite: Sansoni-Koga, S., Laurente-Torres, J., Ccaico-Atoccsa, M., Flores-Quispe, S., Meza-Fajardo, G., and Cárdenas-Gaudry, M.: Ecohydrological and multitemporal analysis of Andean wetlands under climate variabilitiy, EGU General Assembly 2026, Vienna, Austria, 3–8 May 2026, EGU26-16435, https://doi.org/10.5194/egusphere-egu26-16435, 2026.

EGU26-19676 | ECS | Posters virtual | VPS10

Modeling Flood Risk in Kalaa Sraghna Region in Morocco Using Explainable Artificial Intelligence Techniques 

Hamza Legsabi, Soufiane Tiai, Sidi Mohamed Boussabou, Nora Najaoui, Bouabid El Mansouri, and Lamia Erraioui

Abstract. Predicting flood risk is a complex phenomenon. Several factors influence flood behavior generation and intensity such as intricate interactions between hydrological dynamics, meteorological variability, the overarching influence of climate change and land-use changes. This study explores flood risk within the watershed of Tassaout River located in the central region of Morocco. Three advanced machine learning algorithms were chosen to evaluate flood risk. These algorithms are Multi-Layer Perceptron Artificial Neural Networks (MLP-ANN), Random Forest (RF) and Support Vector Machine (SVM). The models are trained based on 11 different factors derived from remote sensing data. From ALOS digital elevation model, 8 factors are developed: Elevation, Slope, Aspect, Plan Curvature, Profile Curvature, Stream Power Index (SPI), Topographical Wetness Index (TWI), and Surface Roughness. In addition, from Landsat 9 imagery, three flood susceptibility factors are extracted: Normalized Difference Vegetation Index (NDVI), Normalized Difference Water Index (NDWI) and Land Surface Temperature (LST). The predictive performance of each model was assessed using standard classification metrics: accuracy, recall, and F1-score. Results indicate that the RF model performed the best with an accuracy of 100%, SVM algorithm achieved good performance, attaining 68% in accuracy and more than 80% in f1-score. However, the ANN model underperformed compared to the other algorithms, with an accuracy of only 59% in accuracy and 70% in f1-score highlighting its limitations in capturing the decision boundaries within the current data configuration. Furthermore, the Shapley Additive exPlanations model (SHAP) was used to enhance the transparency and interpretability of the modelling results.

How to cite: Legsabi, H., Tiai, S., Boussabou, S. M., Najaoui, N., El Mansouri, B., and Erraioui, L.: Modeling Flood Risk in Kalaa Sraghna Region in Morocco Using Explainable Artificial Intelligence Techniques, EGU General Assembly 2026, Vienna, Austria, 3–8 May 2026, EGU26-19676, https://doi.org/10.5194/egusphere-egu26-19676, 2026.

EGU26-20408 | Posters virtual | VPS10

Centralizing in-situ Hydrological measurements for satellite altimetry validation: the INSIGHT platform  

Marine Dechamp-Guillaume, Valentin Fouqueau, Jérémy Hahn, Péïo Gil, Estelle Grenier, Jean-Christophe Poisson, Eva Le Merle, Mahmoud El Hajj, Marco Restano, and Filomena Catapano

Reliable validation of satellite altimetry over inland waters relies on long-term, high-quality in-situ water height measurements over different types of waterbodies. The strategy implemented in the St3TART Follow-On (FO) project relies on controlled super sites to produce high quality Fiducial Reference Measurements (FRMs) and on a high number of data provided by public national hydrological networks considered as opportunity sites.

However, these measurements from national hydrological networks remain highly heterogeneous in terms of formats, units, and metadata description, limiting their direct large-scale use for Cal/Val activities. The first step of data uniformization has been performed by vorteX-io team during St3TART-FO project. As an adaptation of the validation strategy for Sentinel-3 is considered for CRISTAL inland waters products, this uniformization work should be extended to cover more virtual stations for other altimetry missions.

This contribution presents the hydrological component of the Hydro-Cryo in-situ platform, INSIGHT, an ESA-funded project, extension of CRISTAL IN-PROVA project, aiming at the centralization and harmonization of publicly available in-situ water surface height data across Europe. This work participates in the preparation for the Cal/Val phase of the future CRISTAL mission and in support of ongoing Sentinel-3 validation activities, with support from the European Environment Agency (EEA) as coordinator of the Copernicus In-Situ component.

In this first phase, the platform will integrate data from twelve national hydrological networks covering France, Switzerland, Belgium (Wallonia), Ireland, Portugal, Norway, Poland, Italy, Slovenia, Croatia, the Netherlands and Germany. The data from fixed in-situ sensors deployed on Cal/Val super sites for Sentinel-3 will also be integrated in the platform. The back-end architecture is designed to easily integrate additional networks in Europe and all over the world. Native temporal resolutions provided by in situ sensors are preserved without aggregation or resampling, and up to ten years of historical observations are considered when available.

The harmonized hydrological datasets will be disseminated on a dedicated Data Hub developed by NOVELTIS together with reference Cryosphere data for satellite altimetry validation. This open-access platform is designed to serve the Cal/Val community by providing a unified entry point for inland water and cryosphere reference measurements relevant to multiple altimetry missions.

The core objective of the hydrological processing chain is the harmonization of in-situ water height measurements by standardizing measurement units and metadata across heterogeneous national public datasets. Attention is given to the consistency of the altimetric reference of the in-situ sensors. This harmonization is essential for the use of in situ stations as FRMs for the validation of both Sentinel-3 and CRISTAL, as well as for others satellite altimetry missions.

Beyond the altimetry community, this platform addresses the broader hydrological community by providing access to a standardized water height dataset from public national networks. By lowering technical barriers to data use, the infrastructure supports cross-border hydrological studies and contributes to the reuse of public hydrological observations.

This project, currently under development, establishes the data infrastructure for the needs of inland water altimetry validation, while simultaneously enabling wider scientific exploitation of harmonized in-situ water level observations at the European scale.


How to cite: Dechamp-Guillaume, M., Fouqueau, V., Hahn, J., Gil, P., Grenier, E., Poisson, J.-C., Le Merle, E., El Hajj, M., Restano, M., and Catapano, F.: Centralizing in-situ Hydrological measurements for satellite altimetry validation: the INSIGHT platform , EGU General Assembly 2026, Vienna, Austria, 3–8 May 2026, EGU26-20408, https://doi.org/10.5194/egusphere-egu26-20408, 2026.

EGU26-22246 | ECS | Posters virtual | VPS10

Man-Made or Natural: Deciphering the Complex Factors Behind the 2023 Derna FloodDisaster 

Vivek Agarwal and Manish Kumar

On September 10, 2023, the city of Derna in northeastern Libya experienced one of the deadliest flood disasters in Mediterranean and African history. Storm Daniel delivered unprecedented rainfall, with Al-Bayda recording 414 mm and Derna receiving over 100 mm within 24 hours, approximately 270 times the region's typical September average of 1.5 mm. This study employs Synthetic Aperture Radar (SAR) from Sentinel and high-resolution Planet imagery to provide a comprehensive analysis of the flood's spatial extent, infrastructure damage, and the interplay between natural and anthropogenic factors that amplified this disaster.

Our flood extent mapping reveals catastrophic impacts on urban infrastructure. The river channel expanded dramatically from 50 meters to approximately 500 meters in width, while the maximum inundated area extended 1.2 km² from the collapsed dams to the Mediterranean Sea over a distance of 2.5 km. The analysis identifies critical damage to infrastructure including the collapse of two upstream dams, destruction of five road flyovers, and significant damage to ports, bridges, and residential areas.

The disaster's severity was substantially amplified by anthropogenic factors. Historical urban development had rerouted the river through artificial canals, with roads and settlements subsequently constructed on the natural riverbed. The two dams, built in the 1970s and unmaintained since 2002, catastrophically failed, releasing an estimated 30 million cubic meters of water. Mann-Kendall trend analysis of 122-year climatic records reveals a statistically significant warming trend (p ≈ 0, Sen's slope = 0.00798) alongside decreasing overall precipitation (p = 0.027, Sen's slope = -0.0389), suggesting a paradoxical pattern where less frequent but more intense rainfall events are becoming more likely.

The socio-economic impacts were devastating, with nearly 4,000 confirmed fatalities in Derna alone, over 10,000 missing, and economic losses estimated at $80 million. Our findings underscore the critical vulnerability created when urban expansion encroaches upon natural floodplains without adequate infrastructure resilience.

This study demonstrates the power of multi-source satellite remote sensing for rapid disaster assessment and highlights the urgent need for integrated flood risk management that considers both climatic extremes and anthropogenic modifications to natural water systems. The lessons from Derna have profound implications for urban planning, dam safety protocols, and climate adaptation strategies in vulnerable Mediterranean regions facing increasingly extreme weather events.

How to cite: Agarwal, V. and Kumar, M.: Man-Made or Natural: Deciphering the Complex Factors Behind the 2023 Derna FloodDisaster, EGU General Assembly 2026, Vienna, Austria, 3–8 May 2026, EGU26-22246, https://doi.org/10.5194/egusphere-egu26-22246, 2026.

EGU26-22992 | Posters virtual | VPS10

Comparison of Irrigation Scenarios in the Ebro Basin Using the SASER Modelling Chain 

Anaïs Barella-Ortiz, Pere Quintana-Seguí, Judith Cid-Giménez, Roger Clavera-Gispert, Victor Altés-Gaspar, Josep Maria Villar, Simon Munier, Pierre Laluet, Luis Enrique Olivera-Guerra, and Olivier Merlin
Water is a key resource for agricultural production and sustainable water resources management, particularly in Mediterranean regions where water availability is highly variable. Improving irrigation management is, therefore, essential to enhance water-use efficiency. In this context, land surface models provide a valuable tool to simulate irrigation practices and assess their impacts at regional scale. This study presents a comparison of irrigation scenarios simulated with the SASER modelling chain over the agricultural irrigated areas located within the Ebro basin (northeastern Spain).
 
SASER is a physically based and distributed hydrological modelling chain that couples SAFRAN meteorological forcing with the SURFEX modelling platform, which includes an irrigation scheme. Drainage and runoff outputs are then provided to the RAPID scheme via the Eaudyssée platform to estimate streamflow. Three irrigation scenarios were defined: default, optimal, and realistic. The default scenario uses the standard irrigation parameters of the SURFEX irrigation scheme. The optimal and realistic scenarios share irrigation parameters derived from a farmer survey conducted in the Algerri-Balaguer region (eastern part of the Ebro basin). The main difference between both lies in the irrigation threshold: the optimal scenario considers the FAO-recommended threshold, while the realistic scenario is derived from in-situ data from the survey region, reflecting local conditions and more realistic irrigation behaviour.  
 
Overall, comparing the optimal and realistic scenarios, results show an average difference of about 20% in irrigation amounts, while differences in evaporation remain below 5%, and drainage differences range between 20% and 30%. Flood irrigation zones located along the Ebro riverbed and in the delta exhibit smaller differences between scenarios. In contrast, drip irrigation areas at the confluence of the Cinca and Segre rivers show the largest discrepancies. Overall, the study demonstrates how scenario-based modelling can support water management strategies and promote sustainable irrigation in the region.

How to cite: Barella-Ortiz, A., Quintana-Seguí, P., Cid-Giménez, J., Clavera-Gispert, R., Altés-Gaspar, V., Villar, J. M., Munier, S., Laluet, P., Olivera-Guerra, L. E., and Merlin, O.: Comparison of Irrigation Scenarios in the Ebro Basin Using the SASER Modelling Chain, EGU General Assembly 2026, Vienna, Austria, 3–8 May 2026, EGU26-22992, https://doi.org/10.5194/egusphere-egu26-22992, 2026.

EGU26-1322 | ECS | Posters virtual | VPS11

From Contamination to Forecast: Linking Anthropogenic Hydrological Change to Ecological Risk in Poyang Lake 

Areej Sabir, Wang Hua, Abdul Hanan, Yanqing Deng, and Xiaomao Wu

Anthropogenic activities including industrial and agricultural discharges, sand mining, and water regulation have drastically altered the hydrological regime and water quality of Poyang Lake, China’s largest freshwater lake. These modifications lead to non-stationary inputs of heavy metals (e.g., As, Hg, Cr, Se) and nutrients, driving eutrophication and posing significant risks to aquatic ecosystems.

This study analyses multi-year (2018–2020) water quality data from key inflow sites to quantify human impacts on contaminant regimes. Results reveal strong seasonal patterns: heavy metal concentrations (As, Hg) peak during low-flow periods, whereas nutrient loads and algal blooms intensify following high-flow events linked to agricultural runoff. This dynamic hydrological contamination directly threatens the endangered Yangtze finless porpoise (Neophocaena asiaeorientalis), with tissue analyses showing high bioaccumulation of Hg and Cu in the liver, indicating significant ecological risk.

Building on these findings, we highlight the urgent need for forecasting frameworks tailored to human-influenced catchments. We propose integrating process-based hydrological models with water quality modules and machine learning techniques to simulate contaminant transport under non-stationary climatic and anthropogenic drivers. Furthermore, we demonstrate how remote sensing and continuous sensor data can improve the monitoring of pollutant sources and algal blooms. Finally, we outline a pathway towards ecological risk forecasting by coupling hydrological-water quality predictions with bioaccumulation models for vulnerable species.

This work underscores the critical gap in forecasting tools for heavily modified systems and provides a case for developing coupled human-natural models to support early warning systems and adaptive management strategies for biodiversity conservation.


How to cite: Sabir, A., Hua, W., Hanan, A., Deng, Y., and Wu, X.: From Contamination to Forecast: Linking Anthropogenic Hydrological Change to Ecological Risk in Poyang Lake, EGU General Assembly 2026, Vienna, Austria, 3–8 May 2026, EGU26-1322, https://doi.org/10.5194/egusphere-egu26-1322, 2026.

EGU26-1658 | ECS | Posters virtual | VPS11

Integrating Intensity–Duration and Antecedent Rainfall Thresholds for Shallow Landslide Prediction in the Eastern Himalaya, India 

swagat kar, Pratik Chaturvedi, and Harendra Singh Negi
  • Rainfall-induced shallow landslides pose a persistent hazard in the Eastern Himalaya, particularly along the strategically important Balipara–Charduar–Tawang (BCT) corridor in western Arunachal Pradesh, India. This study develops a region-specific rainfall threshold framework by integrating long-term rainfall trend analysis with empirical landslide-triggering thresholds to enhance early warning capabilities in this data-scarce, high-relief terrain. Daily gridded rainfall data from the India Meteorological Department (2000–2020) and an inventory of 236 landslide events recorded between 2008 and 2015 were analyzed. Trend analysis reveals a statistically significant decline in annual rainfall (–81.05 mm yr⁻¹), accompanied by pronounced inter-annual variability and persistent monsoonal dominance. Empirical analysis indicates that short-term antecedent rainfall plays a critical role in slope failure initiation, with 3-day and 5-day cumulative rainfall showing the strongest correlation with landslide occurrence (R² = 0.508 and 0.480, respectively). Corresponding 80th percentile thresholds of ≥89.24 mm (3-day) and ≥118.80 mm (5-day) are proposed as practical triggering criteria. In addition, an intensity–duration (I–D) threshold derived from 95 rainfall-induced landslides follows a negative power-law relationship (I = 17.26·D⁻⁰·¹⁰), capturing the influence of short-duration, high-intensity rainfall events. The combined use of antecedent rainfall and I–D thresholds effectively represents both progressive soil saturation and rapid-onset rainfall triggers. This integrated threshold framework provides a robust and scalable basis for landslide early warning system development along the BCT corridor and offers broader applicability to similar monsoon-dominated Himalayan regions.

How to cite: kar, S., Chaturvedi, P., and Negi, H. S.: Integrating Intensity–Duration and Antecedent Rainfall Thresholds for Shallow Landslide Prediction in the Eastern Himalaya, India, EGU General Assembly 2026, Vienna, Austria, 3–8 May 2026, EGU26-1658, https://doi.org/10.5194/egusphere-egu26-1658, 2026.

EGU26-3205 | ECS | Posters virtual | VPS11

Implementation and Evaluation of the WRF-Hydro Model for Hydrometeorological Forecasting in the Piura River Basin, Peru 

Juan Carlos Tufino, Adrian Huerta, Waldo Lavado-Casimiro, Gustavo De la Cruz, Danny Saavedra, and Alexis Ibañez

Extreme hydro-meteorological events associated with the Coastal El Niño phenomenon represent a critical threat to the socioeconomic stability of the northern coast of Peru. In particular, the Piura River basin, characterized by its complex topography and short concentration times, requires precise monitoring and modeling to address these episodes. Currently, the National Meteorology and Hydrology Service of Peru (SENAMHI) employs a semi-distributed system (ARNO/VIC coupled with RAPID) for the operational assessment of flood risk. However, the increasing intensity and frequency of recent events highlights the need for tools that explicitly represent physical processes at higher resolution. This research proposes the implementation of the fully distributed WRF-Hydro model, focusing the methodology on the reconstruction and analysis of the main extreme flood events within the period covered by the PISCOp_h product, a gridded hourly precipitation observational dataset developed by SENAMHI for 2015–2020. The methodological strategy is based on generating a hybrid meteorological forcing to feed the hydrological model. For this purpose, an atmospheric simulation is carried out with WRF, forced by initial and boundary conditions from the GFS, obtaining high-resolution distributed atmospheric fields. Given the uncertainty of the modeled precipitation, the rainfall field generated by WRF is replaced by the hourly gridded observations from PISCOp_h, ensuring controlled and realistic forcing. With this configuration, model calibration and validation are performed. Calibration prioritizes the highest-magnitude events, highlighting the 2017 Coastal El Niño episode for the adjustment of physical parameters, while validation considers a set of floods recorded between 2015 and 2020, evaluating the robustness of the system. It is expected to demonstrate that this combination of atmospheric dynamics and observational accuracy constitutes a physically consistent and operationally viable tool for predicting intense floods, strengthening flood risk management in Peru.

How to cite: Tufino, J. C., Huerta, A., Lavado-Casimiro, W., De la Cruz, G., Saavedra, D., and Ibañez, A.: Implementation and Evaluation of the WRF-Hydro Model for Hydrometeorological Forecasting in the Piura River Basin, Peru, EGU General Assembly 2026, Vienna, Austria, 3–8 May 2026, EGU26-3205, https://doi.org/10.5194/egusphere-egu26-3205, 2026.

EGU26-3693 | Posters virtual | VPS11

Designing efficient rain-gauge networks for improved flood forecasting in a large river basin 

Sanjaykumar Yadav and Ayushi Panchal

Accurate runoff estimation is fundamental to improving streamflow forecasting, particularly in large river basins with sparse or uneven rain-gauge coverage. This study investigates the identification of representative rain gauges from a densely but randomly distributed network to support reliable runoff simulation in data-limited regions. The Middle Tapi Basin (MTB), comprising 26 operational rain gauges and extensive ungauged areas, is used as a case study. Four approaches—Hall’s method, K-means clustering, hierarchical clustering (HC), and self-organizing maps (SOM)—are applied to identify key rain gauges that effectively capture the spatial variability of basin-scale rainfall. Hall’s method selected 15 representative stations, whereas the clustering-based approaches identified nine stations each. The performance of the resulting rain-gauge networks is evaluated by simulating basin runoff using a lumped hydrological model. Results indicate that the rain-gauge network derived from Hall’s method consistently produces superior runoff simulations compared to the clustering-based networks, demonstrating improved representation of rainfall inputs at the basin scale. Based on these findings, the use of 15 key rain gauges identified through Hall’s method is recommended for runoff prediction in the Middle Tapi Basin. The proposed framework is transferable and can be applied to other large basins with heterogeneous rainfall patterns and limited monitoring infrastructure, offering a practical approach for optimizing rain-gauge networks to enhance hydrological modelling and flood forecasting.

How to cite: Yadav, S. and Panchal, A.: Designing efficient rain-gauge networks for improved flood forecasting in a large river basin, EGU General Assembly 2026, Vienna, Austria, 3–8 May 2026, EGU26-3693, https://doi.org/10.5194/egusphere-egu26-3693, 2026.

EGU26-4740 | ECS | Posters virtual | VPS11

Implementing Environmental Flows in Transboundary Rivers under Climate Change 

Karishma Bhatnagar Malhotra and Arvind Kumar Nema

Rapid dam construction, rising water demand, climate change, and increasing pollution are exposing critical weaknesses in the governance of freshwater systems worldwide, particularly in shared river basins. Although environmental flows (e-flows) are widely recognised as essential for sustaining riverine ecosystems and long-term water security, their integration in transboundary water governance has remained largely symbolic, weakly enforced, and poorly adapted to climatic uncertainty. Even durable agreements in several regions prioritise volumetric allocation and procedural cooperation, offering limited mechanisms to safeguard e-flow regimes, as illustrated by treaties such as the Indus Water Treaty and the Ganga Water Sharing Treaty. This study argues that the persistent failure to operationalise transboundary e-flows in national and transboundary river basin governance frameworks reflects a deeper and systematic governance implementation gap that has not been adequately addressed in existing literature. Much of the literature examines legal provisions, economic instruments, and monitoring systems as separate domains rather than as interdependent components of operational governance. As a result, many transboundary river agreements pair legal allocation rules with flow monitoring but fail to link these to enforceable e-flow obligations or adaptive responses. To investigate this gap, the study undertook a structured comparative analysis of ten major international treaties and river basin agreements across Asia, Africa, Europe, and North America, covering both bilateral and multilateral transboundary river systems. Existing treaties were assessed to identify why most fail to deliver implementable e-flow solutions, while arrangements where elements of effective implementation exist were examined to extract transferable best practices for future transboundary water agreements. Based on the findings, the study proposes a three-tier governance framework to operationalise transboundary e-flows under climate uncertainty. The framework integrates climate-adaptive legal obligations, economic and financial mechanisms, and monitoring, reporting, and verification systems supported by remote sensing and GIS. By reframing e-flows as an implementable component of cooperative water security, this study makes both a conceptual and practical contribution to transboundary water governance, with implications for ecological resilience, conflict reduction, and long-term regional stability.

Keywords : Water demand, Climate change, River basin treaties, Ecological resilience

How to cite: Malhotra, K. B. and Nema, A. K.: Implementing Environmental Flows in Transboundary Rivers under Climate Change, EGU General Assembly 2026, Vienna, Austria, 3–8 May 2026, EGU26-4740, https://doi.org/10.5194/egusphere-egu26-4740, 2026.

EGU26-8119 | ECS | Posters virtual | VPS11

Knowledge Distillation of PlanetScope Imagery for Metre-Scale Lake Water-Quality Mapping 

Ying Deng, Daiwei Pan, Simon Yang, and Bahram Gharabaghi

Effective management of eutrophication in inland lakes requires spatially continuous information on key water-quality variables at management-relevant scales. However, metre-scale mapping of total phosphorus (reported as “Phosphorus, Total”, PPUT; µg/L) remains difficult to achieve using conventional in-situ sampling, and nearshore gradients and tributary plumes are often poorly resolved by medium-resolution satellite sensors. In this study, we exploit multi-generation PlanetScope imagery (Dove Classic, Dove-R, and SuperDove; 3–5 m, near-daily revisit) to develop a hybrid, physics-informed AI framework for PPUT retrieval in Lake Simcoe, Ontario, Canada. PlanetScope surface reflectance is combined with short-term meteorological descriptors (3–7-day aggregates of air temperature, wind speed, precipitation, and sea-level pressure) and in-situ Secchi depth (SSD) to train five ensemble-learning models (HistGradientBoosting, CatBoost, RandomForest, ExtraTrees, and GradientBoosting) across eight feature-group regimes. Inclusion of SSD yields a substantial performance gain, with mean R² increasing from ~0.67 (SSD-free) to ~0.94 (SSD-aware), confirming that vertically integrated optical clarity is the dominant constraint on phosphorus retrieval and cannot be reconstructed from surface reflectance alone. To enable scalable SSD-free monitoring, we implement a teacher–student knowledge-distillation scheme in which an SSD-aware teacher transfers its representation to a student using only satellite and meteorological inputs. The optimal student, based on a compact subset of 40 predictors, achieves R² = 0.83, RMSE = 9.82 µg/L, and MAE = 5.41 µg/L on unseen monitoring stations, and is applied to 2020–2025 PlanetScope scenes to generate metre-scale PPUT maps. A 26 July 2024 case demonstrates that >97% of the lake surface remains below 10 µg/L, while rare (<1%) but spatially coherent hotspots >20 µg/L coincide with tributary mouths and narrow channels, highlighting priority areas for management intervention. Although demonstrated here for phosphorus, the PlanetScope–KD framework is model-agnostic with respect to the target variable and can be retrained for other water-quality parameters with optical or hydro-meteorological controls, such as chlorophyll-a, dissolved oxygen, and surface water temperature. This opens a pathway toward unified, high-resolution, multi-parameter lake water-quality prediction to support adaptive monitoring and lake-basin management.

How to cite: Deng, Y., Pan, D., Yang, S., and Gharabaghi, B.: Knowledge Distillation of PlanetScope Imagery for Metre-Scale Lake Water-Quality Mapping, EGU General Assembly 2026, Vienna, Austria, 3–8 May 2026, EGU26-8119, https://doi.org/10.5194/egusphere-egu26-8119, 2026.

EGU26-8693 | ECS | Posters virtual | VPS11

Is blue-green infrastructure effective in reducing urban flood depth and area? 

Pui Kwan Cheung
Cities are prone to pluvial flooding because they are dominated by impervious surfaces. Urban pluvial flooding can cause substantial damages to properties and life. Upgrading existing grey stormwater drainage network is a costly solution. Cities are increasingly turning to blue-green infrastructure to manage stormwater because it provides multiple socio-ecological benefits to cities such as cooling and habitat provision. The volume and peak flow rate of stormwater run-off are commonly used metrics to assess the flood reduction benefits of blue-green infrastructure. However, they do not indicate the severity and extent of flooding. Instead, flood depth and flood area are direct indicators of the severity and extent of flooding. This study aimed to review studies that assessed the effectiveness of blue-green infrastructure in reducing flood depth and flood area on the catchment scale. Five types of blue-green infrastructure were included: stormwater harvesting systems, bioretention systems, urban trees, green roofs, and urban parks. We identified 14 catchment-scale modelling studies that reported the impacts of one of these five types of blue-green infrastructure on flood depth or flood area. Overall, our review found that the median reduction in flood depth across all five types of blue-green infrastructure was 13% (n=11) with urban trees being the least effective (1%) and stormwater harvesting systems the most effective (15%). The median reduction in total flood area was 8%  (n=10) with urban trees being the least effective (0%) and green roofs the most effective (38%). We also found that blue-green infrastructure cannot substantially reduce flood depth or area in large rainfall events. However, there is emerging evidence that long-term economic benefits lie in reducing flood in small and medium rainfall events because they occur far more frequently than large ones. Future studies should prioritise assessing the long-term economic benefits of blue-green infrastructure rather than focusing solely on its effectiveness in flood mitigation in discrete rainfall events.

How to cite: Cheung, P. K.: Is blue-green infrastructure effective in reducing urban flood depth and area?, EGU General Assembly 2026, Vienna, Austria, 3–8 May 2026, EGU26-8693, https://doi.org/10.5194/egusphere-egu26-8693, 2026.

EGU26-8965 | ECS | Posters virtual | VPS11

Impact of Organoclay Content on Hydraulic Performance of Filter Strips to Treat Urban Runoff 

Yaren Ozturk and Derya Ayral Cınar

Impact of Organoclay Content on Hydraulic Performance of Filter Strips to Treat Urban Runoff


Yaren Ozturk 1, Derya Ayral Cınar 2 

1 Marmara University, Istanbul, Turkiye

2 Gebze Technical University, Kocaeli, Turkiye  

Abstract. 

Due to urbanization and climate change, it has become common for urban runoff to carry pollutants to surface water bodies, wastewater treatment plants, infrastructure systems and groundwater. Pollutants transported include heavy metals, solids, nutrients, pathogens and various organic substances such as pesticides and polycyclic aromatic hydrocarbons (PAH). It is proposed to manage this pollutant load at source before it reaches receiving environments.  Nature-based solutions such as filter ditches, infiltration ponds or rain gardens are considered more efficient to manage urban runoff. Among these methods, filter ditches have the highest potential to treat pollutants. It is thought that the use of organoclays, synthesized by the integration of surfactants into the clay mineral structure, as filter material may increase a common contaminant in urban runoff -PAH- removal compared to conventional clay minerals. In addition to treatment efficiency, another important parameter in designing filter ditches is the hydraulic permeability of the filter material. It is desirable that the infiltration rate of the surface flow is slow enough to allow time for pollutant removal and fast enough to prevent ponding on the filter. This study investigated how organoclays, which are proposed to enhance PAH removal from urban runoff, affect the hydraulic permeability of the filter material. Organoclay synthesized by Ca-montmorillonite and HDTMA is used at different percentages in the filter material mixture and hydraulic permeability was determined. Hydraulic conductivity of sand was 4.5x10⁻⁴ cm/s and it dropped to 2.4x10⁻⁵ cm/s and 2.3x10⁻⁵ cm/s when 10% and 20% clay was used, respectively. On the contrary, organoclay at 10% and 20% did not decrease the hydraulic conductivity significantly (to 1.5x10⁻⁴ cm/s and 1.4x10⁻⁴ cm/s, respectively). As hydraulic conductivity is suggested to be 0.3-1.4 x 10⁻⁴ cm/s for surface runoff treatment systems, it appeared that using 20% organoclay is promising to treat emerging pollutants such as PAHs without comprimising the hydraulic performance of the filter system.


Keywords: Nature based solutions, urban runoff, climate change, filter strips, organoclay

How to cite: Ozturk, Y. and Ayral Cınar, D.: Impact of Organoclay Content on Hydraulic Performance of Filter Strips to Treat Urban Runoff, EGU General Assembly 2026, Vienna, Austria, 3–8 May 2026, EGU26-8965, https://doi.org/10.5194/egusphere-egu26-8965, 2026.

To address climate change and population growth, Central Asia must urgently adopt a holistic water resource management strategy, moving beyond traditional sectoral approaches to embrace a water-energy-food-ecosystems (WEFE) nexus approach.  The WEAP model, a key research tool, integrates hydrological data and socioeconomic factors to create scenarios considering glacier melt, irrigation expansion, and energy generation. WEAP, unlike hydrological models, highlights unmet demand, demonstrating the sectoral impacts of water scarcity for decision-makers. The Nexus approach uses the WEAP model to optimize the Vakhsh hydropower cascade (Nurek and Rogun plants), balancing energy security, environmental flows, and predictable agricultural water supply. The WEAP model assesses innovative irrigation technologies in the Zarafshon basin to enhance food security and cross-border cooperation between Tajikistan and Uzbekistan. The scenario analysis shows that modernizing irrigation systems reduces the burden on the ecosystem and ensures stable harvests even in dry years. Integrating climate forecasts into WEAP allows for water availability scenarios, enabling adaptation measures like optimized cropping and expanded runoff management. WEAP modeling in the Vakhsh and Zarafshon basins highlights the importance of cross-sectoral considerations for water resource management in Tajikistan, providing a basis for sustainable water system decisions.

How to cite: Niyazov, J.: A Nexus-Based Approach to Water Resources Assessment: Practical Application of the WEAP Model in Tajikistan, EGU General Assembly 2026, Vienna, Austria, 3–8 May 2026, EGU26-9585, https://doi.org/10.5194/egusphere-egu26-9585, 2026.

The primary goal of hydrological modeling is to generate reliable forecasts of future changes in water resources. In the arid conditions of Central Asia, where irrigated agriculture demands significant water resources during summer, early forecasting is crucial for planning water allocation between upstream and downstream regions.

The WEAP model offers a flexible and user-friendly framework for addressing various water resource management challenges. It supports decision-makers and experts in constructing and selecting optimal solutions for water management. Accurate hydrological forecasts of water availability during the growing season are essential for effective water resource planning. National hydrometeorological services in Central Asia are adopting and adapting modern, effective methods for hydrological forecasting. The primary goal of developing a methodology for forecasting river water content in the Kyrgyz Republic, using the WEAP model, is to create a calculation algorithm, simulate a water management model, and implement this methodology into the practices of the Kyrgyz Republic's National Hydrometeorological Services. This approach will be applied to forecast water availability in the Naryn River during the growing season, monitor changes in the Toktogul Reservoir's water volumes, support hydroelectric power production, and facilitate agricultural irrigation. Advanced forecasts of low water availability during the growing season are vital for implementing preventive measures to ensure efficient water use by water and energy management organizations.

The WEAP model allows for the use of various scenarios, such as climatic ones, with a focus on the national level, while introducing various innovative technologies for irrigation and energy conservation in the upcoming years. This is significant for long-term planning in water management activities and the energy strategy of both the country and the region.

How to cite: Kalashnikova, O.: Predictive WEAP modeling for NEXUS management in the Naryn River basin (Kyrgyzstan), EGU General Assembly 2026, Vienna, Austria, 3–8 May 2026, EGU26-9627, https://doi.org/10.5194/egusphere-egu26-9627, 2026.

EGU26-11912 | ECS | Posters virtual | VPS11

Mapping Inter-State Rice Virtual Water Trade in India Using Complex Network Analysis 

Aditya Badoni and Manne Janga Reddy

Inter-state agricultural trade plays a critical role in redistributing water resources across India, particularly for water-intensive crops such as rice. This study examines the structure of inter-state rice virtual water trade in India using a directed, weighted complex network approach. Physical inter-state rice trade data covering all Indian states were obtained from the Directorate General of Commercial Intelligence and Statistics (DGCIS) and transformed into virtual water flows using crop-specific virtual water content coefficient for rice (m³/ ton), assumed to be uniform across states. This transformation enables an assessment of trade relationships in terms of embodied water transfers rather than physical commodity volumes. States are represented as nodes and directed edges denote rice virtual water flows from exporting to importing states, weighted by total virtual water volumes (m³). Network properties were analysed using strength-based measures to quantify import and export intensities, betweenness centrality to identify states functioning as key intermediaries in trade pathways, and PageRank to assess systemic importance within the national virtual water trade system. These metrics jointly allow differentiation between dominant exporting states, import-dependent states, and structurally central states influencing the overall redistribution of water through trade. The analysis reveals a highly centralized rice virtual water trade network, characterised by a small group of states accounting for a disproportionate share of total virtual water exports. States such as Punjab, Haryana, Andhra Pradesh, Chhattisgarh, Uttar Pradesh, Odisha, and Madhya Pradesh emerge as major exporters, while several other states rely predominantly on inter-state imports to meet rice demand. The concentration of virtual water exports among a limited number of producing regions indicates strong structural dependencies within the national trade network. Several major exporting states like Punjab are also subject to increasing pressure on water resources, the observed trade patterns raise concerns regarding the sustainability of current production-trade configurations. By integrating crop-specific virtual water accounting with complex network analysis, this study provides a quantitative framework for identifying key contributors, dependencies, and structural vulnerabilities in India’s inter-state agricultural water redistribution system. The methodology is transferable to other crops, years, and regional contexts and offers a basis for informing discussions on sustainable agricultural trade and water resource management.

How to cite: Badoni, A. and Reddy, M. J.: Mapping Inter-State Rice Virtual Water Trade in India Using Complex Network Analysis, EGU General Assembly 2026, Vienna, Austria, 3–8 May 2026, EGU26-11912, https://doi.org/10.5194/egusphere-egu26-11912, 2026.

EGU26-12410 | ECS | Posters virtual | VPS11

Multi-Timescale SPEI Drought Forecasting Using Random Forest Regression over Maharashtra, India 

Gaurav Ganjir, Manne Janga Reddy, and Subhankar Karmakar

Accurate drought forecasting is crucial for effective agricultural risk management in semi-arid regions, particularly in drought-prone regions of Maharashtra, India, where the majority of the population relies on farming. This study develops a one-month-ahead drought forecasting using random forest regression, an ensemble tree-based machine-learning algorithm, using the Standardized Precipitation Evapotranspiration Index (SPEI) at multiple temporal scales. Random Forest regression models were trained to forecast SPEI-3, SPEI-6, and SPEI-12, incorporating rainfall, temperature, and derived hydro-climatic predictors. Model performance exhibits clear timescale-dependent predictability, with skill increasing for longer accumulation periods: SPEI-3 (R² = 0.55, RMSE = 0.81), SPEI-6 (R² = 0.65, RMSE = 0.69), and SPEI-12 (R² = 0.87, RMSE = 0.38). Corresponding generalization ratios of 62.4%, 71.8%, and 90.5% indicate improved robustness and reduced overfitting at short (SPEI-3) to long (SPEI-12) timescales. Feature importance analysis consistently highlights the current SPEI state, contributing approximately 35–40% of the total importance, followed by the precipitation minus potential evapotranspiration (PPET) balance and other hydro-climatic variables, reflecting the dominant role of drought persistence and climatic memory in one-month-ahead forecasting. The models successfully capture spatial drought patterns, though reduced accuracy is observed for extreme drought magnitudes at shorter timescales, likely due to inherent climate non-stationarity and rapidly evolving predictor relationships. Overall, this study demonstrates the effectiveness of machine-learning-driven, one-month-ahead drought forecasting across multiple SPEI time scales, enabling near-real-time monitoring and early warning depending on the selected accumulation period. The proposed framework provides a scalable foundation for operational drought early-warning systems in Maharashtra and other drought-prone hydro-climatic regions worldwide.

Keywords: SPEI, Drought forecasting, Random Forest

How to cite: Ganjir, G., Reddy, M. J., and Karmakar, S.: Multi-Timescale SPEI Drought Forecasting Using Random Forest Regression over Maharashtra, India, EGU General Assembly 2026, Vienna, Austria, 3–8 May 2026, EGU26-12410, https://doi.org/10.5194/egusphere-egu26-12410, 2026.

Water scarcity across the Mediterranean is increasingly forcing economies that are deeply integrated into global markets to balance export performance with long-term water sustainability. Research on “virtual water” and trade-related water footprints has grown rapidly, yet it remains fragmented: studies rely on diverse frameworks (physical accounting, MRIO, life-cycle assessment, and hybrids), use non-uniform scarcity metrics, and often treat climate projections and adaptation only implicitly. This review asks: which methods are currently used to estimate the water footprint of trade under climate constraints, what limits their comparability, and what methodological protocol is needed for a robust, policy-relevant application to Morocco? By framing trade-related water footprints as part of coupled human–water systems, the review highlights how economic structures, trade choices, and climate-driven water scarcity interact and generate feedbacks relevant for water governance and policy design.

We follow a PRISMA-type workflow based on systematic searches in Scopus and Web of Science, with explicit inclusion/exclusion criteria and standardized data extraction. Studies are coded along five dimensions: (i) data type (monetary vs. physical); (ii) modelling approach (IO/MRIO, LCA, hybrid); (iii) treatment of scarcity (stress factors, availability indicators, scarcity-adjusted footprints); (iv) integration of climate change (scenarios, downscaling, hydrological modelling); and (v) potential to inform policy (efficiency improvements, reallocation options, abstraction caps, and economic or trade-related instruments). Institutional sources are used in a complementary way to document indicator frameworks and datasets, without replacing the peer-reviewed evidence base.

The review delivers (1) an operational typology of methods used to quantify trade-related water footprints under climate stress; (2) a diagnosis of key comparability barriers (spatial resolution, upstream embodied water through inputs, and the limited use of dynamic approaches); and (3) a practical empirical agenda linking hydrological projections, water-extended input–output frameworks, and decision-relevant scarcity metrics. Outputs will be shared through a reusable coding grid and an analytical framework diagram to support country studies and comparative work across the Mediterranean.

How to cite: Tasra, F. and Mafamane, D.: How Much Water Is Embedded in Trade? A Systematic Review and Research Roadmap for Morocco under Climate Change, EGU General Assembly 2026, Vienna, Austria, 3–8 May 2026, EGU26-14286, https://doi.org/10.5194/egusphere-egu26-14286, 2026.

EGU26-14773 | ECS | Posters virtual | VPS11

Event-Based Calibration of a Physically-Based Hydrological Model for Flood Simulation in the Arno River Basin Tuscany Region 

Hafiz Kamran Jalil Abbasi, Fabio Castelli, and Matteo Masi

Accurate flood forecasting in complex river basins depends on the effective use of high-resolution hydro-meteorological information, physically based hydrological models, and appropriate calibration procedures. This work describes the development of an event-based flood modelling framework for the Arno River basin (Italy), designed to enhance the simulation of flood hydrographs and support operational flood forecasting activities.

Spatially distributed rainfall data were obtained from raster-based precipitation products and transformed into event-specific time series suitable for use within the distributed hydrological model MOBIDIC. Observed discharge records from several gauging stations were retrieved from raw monitoring archives and reorganized into event-based datasets, allowing a coherent and consistent comparison between simulated and observed hydrographs. A unified processing workflow was established to ensure proper temporal synchronization among rainfall inputs, model outputs, and discharge observations.

The proposed framework was tested on major flood events that occurred in November 2023. Model performance was assessed using standard evaluation metrics, including the Nash–Sutcliffe Efficiency (NSE), Root Mean Square Error (RMSE), correlation measures, and time-lag analysis. Results from the initial simulations show that the model is able to capture flood timing satisfactorily, while differences in peak discharge magnitude and recession dynamics indicate the necessity for targeted parameter calibration.

A preliminary manual sensitivity analysis was carried out to identify key soil and hydraulic parameters influencing runoff generation and channel routing processes. Building on these results, an automated calibration approach based on PEST++ is currently being developed to systematically optimize the most sensitive parameters and improve model performance across multiple flood events.

Overall, the presented framework offers a reproducible and scalable methodology for event-based flood modelling and calibration in complex catchments. It provides a solid basis for multi-event analyses, automated calibration, and the future incorporation of data assimilation and artificial intelligence techniques into operational flood forecasting systems.

How to cite: Abbasi, H. K. J., Castelli, F., and Masi, M.: Event-Based Calibration of a Physically-Based Hydrological Model for Flood Simulation in the Arno River Basin Tuscany Region, EGU General Assembly 2026, Vienna, Austria, 3–8 May 2026, EGU26-14773, https://doi.org/10.5194/egusphere-egu26-14773, 2026.

EGU26-15359 | ECS | Posters virtual | VPS11

Applicability of distributed thermal sensing for identifying illicit sewage connections in urban drainage networks under tropical climates 

elias de lima neto, Luis Eduardo Bertotto, and Edson Cezar Wendland

Urban water pollution remains a major challenge for sanitation management in Brazil and other tropical regions. In areas served by separate sewer systems, illicit domestic sewage connections to stormwater drainage networks represent a significant source of contamination of urban runoff and receiving water bodies. Conventional inspection techniques for identifying such contributions are often operationally complex, spatially limited, and therefore rarely applied. Distributed temperature sensing techniques have been successfully used in temperate regions to detect sewage inputs based on thermal contrasts; however, their applicability under tropical conditions remains poorly explored.

This study investigates the thermal signature of domestic sewage in a tropical urban environment and evaluates the detectability of illicit sewage discharges in stormwater systems using a simplified thermal mixing model. Sewage temperature was monitored using thermocouples connected to a data logger with 1-minute temporal resolution in a sewer interceptor located at the São Carlos School of Engineering, University of São Paulo, Brazil, in an area characterized by student housing and food service facilities. Two monitoring campaigns were conducted. Mean sewage temperatures of 27.45 ± 0.45 °C (November 2024–April 2025) and 24.21 ± 0.54 °C (September–November 2025) were observed. A moderate Pearson correlation between sewage temperature and local air temperature (r = 0.58, p < 0.05, n = 140) indicates that atmospheric conditions partially influence sewage thermal variability.

Based on the monitored sewage temperatures (T₂) and stormwater temperature data (T₁) from the literature, a preliminary theoretical model was developed using an instantaneous energy balance approach. The model relates the detectable temperature variation (ΔT) to the sewage fraction (f), defined as the ratio between sewage discharge (Q₂) and stormwater flow (Q₁). Results indicate an exponential relationship between f and ΔT for different thermal contrasts (T₂ − T₁). The minimum detectable sewage discharge was found to be highly sensitive to ΔT, associated with the thermal resolution of the sensing system, while showing direct proportionality to stormwater flow and inverse proportionality to the thermal contrast between sewage and runoff. Future work will focus on model validation under field conditions and its extension to non-stationary flow regimes.

How to cite: de lima neto, E., Bertotto, L. E., and Wendland, E. C.: Applicability of distributed thermal sensing for identifying illicit sewage connections in urban drainage networks under tropical climates, EGU General Assembly 2026, Vienna, Austria, 3–8 May 2026, EGU26-15359, https://doi.org/10.5194/egusphere-egu26-15359, 2026.

EGU26-15614 | ECS | Posters virtual | VPS11

Assessing the Water-Energy-Food Nexus under Climate and Socio-economic Change in Vu Gia – Thu Bon River Basin, Vietnam 

Lieu Hoang, Asaad Y. Shamseldin, Theunis F. P. Henning, Kilisimasi Latu, Conrad Zorn, and Sihui Dong

The Vu Gia – Thu Bon River Basin (VGTBRB), Central Vietnam’s largest river basin (about 10,350 km2), flows through Quang Nam Province and Da Nang City. It supplies water for multiple purposes, including hydropower generation (with around 20 operational upstream hydropower plants), irrigation, and domestic use (accounting for almost 70% of domestic use for Da Nang). While this multifunctional role supports the regional socio-economic development, the basin is increasingly challenged by intensifying water, energy, and food (WEF) demands driven by population growth, urban expansion, tourism development, and salinity intrusion, highlighting the need for an integrated Water-Energy-Food nexus approach.

Despite growing global research on the WEF nexus, no comprehensive statistical WEF nexus models have been developed for the VGTBRB. Previous studies in the region have largely focused on individual sectors, overlooking the role of salinity intrusion and its implications for water demand, food production, and tourism-related resource use. This study addresses this gap by employing a WEF nexus framework combined with System Dynamics Modelling (SDM) to capture sectoral interactions, feedback mechanisms, and trade-offs in water allocation under future climate and socio-economic scenarios. The analysis incorporates historical data from 2010 to 2024 for model calibration and validation, and projections for 2025–2050 aligned with climate change scenarios and the regional Master Plan for 2021–2030 with a vision to 2050.

Results indicate pronounced seasonal variability in water demand, critical feedback between temperature and domestic water use, and interactions between rainfall and water use that influence the risks of salinity intrusion at downstream water supply intakes. In addition, a positive relationship is identified between tourism growth and water demand, particularly during dry seasons, which exacerbates water stress.

By explicitly integrating salinity and tourism dynamics, this study pioneers a WEF nexus-based modelling approach for the VGTBRB. The findings provide policy-relevant insights to enhance water system resilience under climate and socio-economic change, support progress towards the Sustainable Development Goals, and inform integrated resource governance in a tourism-dependent, salinity-affected river basin.

How to cite: Hoang, L., Shamseldin, A. Y., Henning, T. F. P., Latu, K., Zorn, C., and Dong, S.: Assessing the Water-Energy-Food Nexus under Climate and Socio-economic Change in Vu Gia – Thu Bon River Basin, Vietnam, EGU General Assembly 2026, Vienna, Austria, 3–8 May 2026, EGU26-15614, https://doi.org/10.5194/egusphere-egu26-15614, 2026.

EGU26-16119 | ECS | Posters virtual | VPS11

Differentiable, Learnable MILC: Balancing Predictive Skill and Physical Interpretability 

Vidushi Sharma, Siddik Barbhuiya, and Vivek Gupta

Deep learning models, particularly LSTMs, have transformed large-sample hydrology by achieving high streamflow predictive performance, yet they remain largely black-box approaches with limited physical interpretability and no explicit representation of multiphysical hydrological processes. Differentiable, learnable process-based models (or δ-models) overcome these limitations by embedding neural networks within differentiable physics frameworks. While existing benchmarks like HBV-δ have proven this concept across 671 US basins, they rely on conceptual foundations (e.g., empirical beta-functions) that approximate, rather than resolve, underlying soil physics. This study introduces MILC-δ (Modular Differentiable Physic-Informed Learning), designed to bridge this gap. The MILC model utilizes continuous soil water retention curves and physically derived drainage laws, which can aid in more accurate hydrological flux simulation. Thus, we developed a MILC-δ - a hydrologic model embedded with neural networks and trained in a differentiable programming framework. Consequently, MILC-δ is anticipated to match or exceed HBV-δ by leveraging neural networks to map static catchment attributes directly to physically measurable properties (e.g., pore size distribution, hydraulic conductivity) rather than abstract calibration parameters. Initial testing of the developed model shows that the model performs at par in some basins and better than HBV-δ in other basins. This approach gives LSTM-level accuracy and generalizability as well as the clear physical story stakeholders actually need to explain the decline in baseflow, threats to the groundwater recharge, etc.

How to cite: Sharma, V., Barbhuiya, S., and Gupta, V.: Differentiable, Learnable MILC: Balancing Predictive Skill and Physical Interpretability, EGU General Assembly 2026, Vienna, Austria, 3–8 May 2026, EGU26-16119, https://doi.org/10.5194/egusphere-egu26-16119, 2026.

EGU26-16207 | ECS | Posters virtual | VPS11

Data-Driven LSTM Architectures for Reservoir Inflow Forecasting 

Devesh Mani and Vimal Mishra

Accurate forecasting of reservoir inflow is crucial for managing water resources, maintaining a balance between water supply and demand, preventing floods, supporting hydropower production, and planning irrigation. India, ranking third globally, with more than 5,000 dams, faces challenges in reservoir operations due to hydrological variability caused by the monsoon. While ensuring demand, supply, and flood security requires high water levels, the reservoir also needs to maintain a certain amount of free storage to accommodate high inflows. While Long-Short Term Memory (LSTM) models have been widely used for inflow forecasting, traditional LSTM models often limit their ability to capture sudden hydrological extremes and accurately represent peak timings. Therefore, a comparative evaluation of various advanced LSTM variants is necessary to identify architectures that are more reliable for modelling nonlinear inflow dynamics. Our study introduces a specialised type of recurrent neural network, specifically the LSTM framework, for forecasting daily reservoir inflow. Our methodology uses a structured feature engineering strategy that integrates hydrometeorological forcings, hydrological state variables, and outputs from the CaMa-Flood hydrodynamics model. A permutation-based feature importance analysis, in terms of the increase in mean absolute error, highlights that antecedent precipitation and lagged upstream reservoir outflow are the main influencing factors for the inflow forecast within a multivariate sequence-to-one LSTM framework. Overall, this framework provides a strong, scalable, and practical solution for inflow forecasting. By supporting timely operational decisions for water release, flood preparedness and storage optimisation, the framework serves as an effective tool for managing reservoirs.

How to cite: Mani, D. and Mishra, V.: Data-Driven LSTM Architectures for Reservoir Inflow Forecasting, EGU General Assembly 2026, Vienna, Austria, 3–8 May 2026, EGU26-16207, https://doi.org/10.5194/egusphere-egu26-16207, 2026.

EGU26-16490 | ECS | Posters virtual | VPS11

Estimation of Ecological Flow for Major Indian River Basins under Changing Climate 

Sahil Sahil and Vimal Mishra

Streamflow provides critical support for the biodiversity of aquatic and riparian ecosystems, sediment transport, and nutrient cycling. Therefore, a minimum streamflow in rivers is crucial for sustaining the proper functioning of aquatic habitats. However, lean or low-flow regimes have been significantly altered by various human activities, such as dam construction, flow diversion for irrigation purposes, industrialisation, and urbanisation. Moreover, changing climate is causing erratic monsoons, increased temperatures, and more prolonged droughts, thereby maintaining ecological flow has become increasingly challenging and urgent to preserve the riverine ecosystems. Our aim is to develop a robust, data-driven framework for estimating environmental flows (E-flows) across 55 stations in major Indian river basins. The primary objective is to assess the quantity and timing of streamflow required to sustain the various river ecosystems, utilising hydrological indicators and long-term datasets, such as temperature and precipitation from the Indian Meteorological Department (IMD). Changes in streamflow characteristics are assessed by comparing observed and machine learning-based naturalised flows, enabling the isolation of reservoir-induced impacts on the streamflow regime, magnitude, duration, and seasonal timing. The study hypothesises that, with the use of observed streamflow data, naturalised streamflow reconstruction and a multi-indicator hydrologic approach, integrating Indicators of Hydrological Alteration (IHA), the Range of Variability Approach (RVA), and Flow Duration Curve (FDC) analysis, can provide reliable E-Flow estimates at regional and national scales. By comparing indicator-based benchmarks derived from observed and naturalised streamflow, the stations are classified according to the degree of hydrologic alteration, thereby supporting scientifically informed river management and policy decisions. 

How to cite: Sahil, S. and Mishra, V.: Estimation of Ecological Flow for Major Indian River Basins under Changing Climate, EGU General Assembly 2026, Vienna, Austria, 3–8 May 2026, EGU26-16490, https://doi.org/10.5194/egusphere-egu26-16490, 2026.

EGU26-17089 | Posters virtual | VPS11

Remote Sensing–Based Monitoring of Lake Sarikamish Water Level Dynamics 

Gulomjon Umirzakov, Salauat Kalabaev, Akmal Gafurov, and Daniyar Turgunov

Lakes and associated hydrological processes are sensitive indicators of environmental change and climate variability. Variations in lake water level and storage reflect the combined effects of atmospheric forcing (precipitation, evaporation, and temperature regime) and anthropogenic interventions, including irrigation, drainage, and hydraulic infrastructure development. Continuous monitoring of lake level dynamics is therefore essential for water resources management, evaluation of regional climate impacts, and assessment of environmental risks in arid and semi-arid regions.

Central Asia has experienced pronounced hydrological transformations over recent decades as a result of climate warming, altered precipitation patterns, and intensified human water use. These changes are manifested in contrasting lake responses, ranging from the dramatic desiccation of the Aral Sea to the expansion of endorheic water bodies receiving anthropogenic inflows. Lake Sarikamish, one of the largest lowland lakes in the region, is located along the Uzbekistan–Turkmenistan border near the escarpment of the Ustyurt Plateau and represents a key example of such coupled natural–human system dynamics.

This study investigates water level variability of Lake Sarikamish over the period 2001–2024 using satellite altimetry observations from the Global Reservoirs and Lakes Monitor (G-REALM) database. The dataset, provided at a 10-day temporal resolution in NetCDF format, was processed to construct a continuous long-term time series. Short data gaps were filled using linear interpolation, a method previously shown to yield robust performance for altimetric lake level records. Descriptive statistics and trend analyses were applied to quantify intra-annual variability, interannual fluctuations, and long-term tendencies.

The minimum lake level during the observation period was recorded in February 2002 (4.23 m), while the maximum level occurred in April 2018 (8.84 m). The time series exhibits substantial interannual variability, with a standard deviation of 0.91 m. Four distinct phases of lake level evolution were identified: (i) a rapid increase during 2001–2007 at a rate of +0.56 m yr⁻¹, (ii) a short-term decline in 2008–2009 (−0.60 m yr⁻¹), (iii) a prolonged period of moderate increase during 2010–2020 (+0.15 m yr⁻¹), and (iv) a renewed decrease during 2021–2024 (−0.36 m yr⁻¹). Despite the recent downward trend, the overall period is characterized by a net positive trend of +0.16 m yr⁻¹.

The observed post-2020 decline suggests an increasing influence of regional climate change, particularly rising air temperatures and reduced effective precipitation. Continued water level lowering may have negative consequences for local ecosystems, biodiversity, and environmental stability. The results highlight the value of satellite altimetry for long-term lake monitoring and emphasize the need for integrated assessments of climatic and anthropogenic drivers of lake hydrological change in Central Asia.

How to cite: Umirzakov, G., Kalabaev, S., Gafurov, A., and Turgunov, D.: Remote Sensing–Based Monitoring of Lake Sarikamish Water Level Dynamics, EGU General Assembly 2026, Vienna, Austria, 3–8 May 2026, EGU26-17089, https://doi.org/10.5194/egusphere-egu26-17089, 2026.

EGU26-18311 | ECS | Posters virtual | VPS11

 Laboratory testing and in-situ monitoring of the hydrological response of a resin gravel permeable pavement and a bioswale 

Martina Ferro, Enrico Chinchella, Arianna Cauteruccio, and Luca G. Lanza

The present study investigates the hydrological performance of two Nature Based Solutions (NBS) realised within the urban requalification project of the former military area “Caserma Gavoglio” (now public park), in one of the most heavily urbanized districts of the city of Genoa (Italy). The rapid expansion of urbanization has led to an increase in impervious surfaces and a consequent increase in runoff generation, flood volume and flood peak. Since the required expansion of the stormwater drainage capacity is neither economically nor environmentally sustainable, innovative stormwater management strategies are required. In this context, NBSs represent effective solutions to mitigate runoff generation and peak flows and restore natural infiltration processes.

A resin gravel permeable pavement (PP) was used for the paving of about 40% of the park surfaces while a bioswale was realised alongside the sport field to manage stormwater excess.  

The PP was preliminarily tested in the laboratory by monitoring the outflow from a standardized test bed under various rainfall input and slope conditions. The results of the tests were interpreted mathematically using the analogy of the step response function of first- and second-order dynamic systems. This allows to transfer the laboratory results for comparison with field conditions, even if these were not precisely reproduced in the laboratory tests.

Both NBSs were monitored in the field with the objective to measure the outflow rate, representing the inflow to the urban drainage system, and to compare it with the corresponding rainfall input.

Two hydrometric measurement stations and one rain gauge station were installed. Since the stormwater drainage system was already in place, water stage probes were housed inside existing manholes equipped with suitable “V-shaped” weirs. Due to non-standard operational conditions, the measurement stations were preliminarily tested in the laboratory to verify their accuracy prior to field installation.

From the monitored rainfall events, direct comparisons between the measured precipitation and the outflow hydrographs were performed. These analyses enabled the quantification of the retention and detention effects due to the NBSs and their improvement relative to typical impervious paving solutions. The following performance indicators were derived for each significant precipitation event that exceeded the retention capacity of the NBS: (i) the outflow coefficient, defined as the ratio between total outflow and rainfall volumes, (ii) the peak reduction coefficient, i.e. the ratio between peak discharge and peak rainfall intensity and (iii) the system response delay, i.e. the time lag between the centre of mass of the flow hydrograph and that of the rainfall.

Acknowledgements

This work was conducted in the framework of the Urban Nature LABs (UNALAB) project, under the “HORIZON 2020” programme, Smart and sustainable Cities-SCC-02-2016-2017, as a collaboration between the University of Genova (DICCA) and the Municipality of Genova (project partner).

How to cite: Ferro, M., Chinchella, E., Cauteruccio, A., and Lanza, L. G.:  Laboratory testing and in-situ monitoring of the hydrological response of a resin gravel permeable pavement and a bioswale, EGU General Assembly 2026, Vienna, Austria, 3–8 May 2026, EGU26-18311, https://doi.org/10.5194/egusphere-egu26-18311, 2026.

EGU26-18956 | Posters virtual | VPS11

Assessing Groundwater Storage Changes in Data-Scarce Basins of Afghanistan: A Machine-Learning Based Downscaling of GRACE(-FO) Data 

Abdul Haseeb Azizi, Fazlullah Akhtar, Christian Borgemeister, and Bernhard Tischbein

Climate change, rising water demand, and ecosystem stress are intensifying the reliance on groundwater while limiting the capacity of many basins to effectively monitor and manage subsurface water resources. In data-scarce and conflict-affected regions where monitoring networks are sparse, decision-makers increasingly require reliable, high-resolution information to support drought preparedness, climate adaptation, and sustainable groundwater governance. The present study proposes an evidence-based machine-learning framework for the purpose of enhancing the monitoring of groundwater storage anomaly (GWSA) through the process of downscaling GRACE and GRACE-FO observations from ~3° to 0.1°. The reconstruction of monthly GRACE/GRACE-FO gaps was performed using a Seasonal-Trend Decomposition based on Loess (STL), and a Random Forest model was trained with hydroclimatic and land-surface predictors, including soil moisture, snow water equivalent, evapotranspiration, precipitation, land-surface temperature, and the normalized difference vegetation index (NDVI). The performance of the model was evaluated by comparing the model's results with the existing in-situ groundwater-level observations in the Kabul River Basin. The results indicate that satellite-inferred groundwater losses in Afghanistan are persistent, with a rate of −0.71 cm yr-1, ranging from basin-scale depletion of −0.77 cm yr-1 in the Helmand River Basin to −0.40 cm yr-1 in the Northern River Basin. Recent conditions indicate intensified depletion during 2018–2022, with year-sum GWSA declines reaching ~145 cm in the Harirod–Murghab River Basin, while the Northern River Basin shows comparatively lower losses (~80 cm). The 0.1° downscaled product improves agreement with observations (root mean square error (RMSE) reductions up to 77.8%) and reveals spatially heterogeneous hotspots that are not detectable at coarse GRACE resolution. Generally, the proposed framework translates coarse satellite gravimetry into actionable, basin-relevant information for climate-resilient groundwater management, while underscoring the necessity for uncertainty-aware, multi-source monitoring under increasing hydroclimatic extremes. The approach enables the early detection of emerging depletion hotspots, thereby supporting proactive planning for future water security. This includes targeted demand management, drought response, and adaptation investments in groundwater-dependent regions.

How to cite: Azizi, A. H., Akhtar, F., Borgemeister, C., and Tischbein, B.: Assessing Groundwater Storage Changes in Data-Scarce Basins of Afghanistan: A Machine-Learning Based Downscaling of GRACE(-FO) Data, EGU General Assembly 2026, Vienna, Austria, 3–8 May 2026, EGU26-18956, https://doi.org/10.5194/egusphere-egu26-18956, 2026.

HS1.1 – Field hydrology

EGU26-75 | Posters on site | HS1.1.2

A Low-Cost Flood-Proof Water Level Measurement System, Using GNSS Reflectrometry 

Nick van de Giesen, Tijs De Laere, Jort van Driel, Ward van der Bijl, and Stefan Loen

Global Navigation Satellite System Interferometric Reflectometry (GNSS-IR) is a well-established technology to determine water heights in reservoirs, rivers, and lakes. A big advantage of GNSS-IR over traditional level measurements is that it is a non-contact flood-proof method. So far, GNSS-IR has been applied through off-site processing, necessitating a good internet connection for near-real-time monitoring. In Africa, where the TEMBO project seeks to develop in situ monitoring of weather and water, such connections are often not available, especially in more remote river valleys. Although a live satellite uplink would be possible, these tend to be costly and very energy-hungry. For this reason, equipment was developed that allowed local processing (edge processing). The advantage is that only water levels and some system information need to be communicated, which can be done with a simple satellite modem at very moderate costs. Existing gnssrefl code (https://gnssrefl.readthedocs.io/), written in Python, was rewritten in Rust to facilitate running the code on a PICO 2.  By reducing unneeded lines of code, the runtime was reduced from three minutes with the original Python code to less than three seconds. In all, energy use was minimized to avoid the need for large solar panels. With power cycling and uploads four times per day, the average power consumption was 44mW, which translates into a small solar panel of 1.2 W (66mm x 113mm). Water level measurement accuracy depended on integration time or, better, the number of satellites captured and was about 8cm when five or more satellites were captured. Total material costs, excluding the satellite modem, were about EU 50. The satellite modem and antenna were, at EU 360, the most expensive parts.

TEMBO Africa: The work leading to these results has received funding from the European Horizon Europe Programme (2021-2027) under grant agreement n° 101086209. The opinions expressed in the document are of the authors only and in no way reflect the European Commission’s opinions. The European Union is not liable for any use that may be made of the information.

How to cite: van de Giesen, N., De Laere, T., van Driel, J., van der Bijl, W., and Loen, S.: A Low-Cost Flood-Proof Water Level Measurement System, Using GNSS Reflectrometry, EGU General Assembly 2026, Vienna, Austria, 3–8 May 2026, EGU26-75, https://doi.org/10.5194/egusphere-egu26-75, 2026.

EGU26-1566 | ECS | Posters on site | HS1.1.2

Acoustic Sensor–Based Borehole Monitoring in Semi-Arid African Regions 

Anna Geofrey, Rolf Hut, and Nick van de Giesen

Wells and boreholes have long served as critical sources of freshwater in the semi-arid and arid regions of Africa. Despite their importance, effective monitoring of these water points remains limited due to the high cost of establishing and maintaining dedicated observation wells, resulting in sparse and unreliable datasets. This study explores a cost-effective approach to groundwater monitoring by equipping operational wells and boreholes with low frequency acoustic sensors integrated into a scalable wireless sensor network. The system enables continuous acquisition of time-series data on water levels, discharge rates, and recharge dynamics. The major innovation here is that we use existing and operational water infrastructure as monitoring points. The presentation will demonstrate the principles, advantages, and obstacles that still need to be overcome. The proposed method improves data availability and supports more sustainable groundwater management across data-scarce regions in Africa.

How to cite: Geofrey, A., Hut, R., and van de Giesen, N.: Acoustic Sensor–Based Borehole Monitoring in Semi-Arid African Regions, EGU General Assembly 2026, Vienna, Austria, 3–8 May 2026, EGU26-1566, https://doi.org/10.5194/egusphere-egu26-1566, 2026.

Measuring open-channel hydraulics is crucial, for example, for deriving discharges from stage observations, estimating travel times for pollutant plumes, and assessing riverbed dynamics. State-of-the-art surveying approaches are typically conducted along predefined cross-sections of the river course, either manually using a flow meter or with instrumented boats. The latter are technologically advanced platforms equipped with electric propulsion, ADCP sensors, and high-precision RTK-GPS and may cost several tens of thousands of US dollars (or euros). To fill data gaps between cross-sections, surveys often rely on longitudinal boat campaigns, which are generally feasible only in larger streams without hydraulic barriers.

To support water authorities with limited budgets, particularly to survey smaller streams, we developed MONIKA, a low-cost surveying catamaran. In accordance with its acronym, MONIKA is comprised of three primary functions: MO - Monitoring (continuous tracking of water parameters), NI - Navigation (movement along and across the stream), and KA -  Kartography (mapping of the riverbed morphology). The platform is equipped with a castable sonar, GPS, and two CTD (Conductivity-Temperature-Depth) dataloggers. As an additional payload, a commercial high-precision inclination sensor is deployed to monitor the water surface slope. All data-processing steps are implemented in an object-oriented framework within an open-source Python package.

After extensive testing and design optimization, the engine-less boat can be deployed in two operational modes: (1) bank-guided operation using an aluminum rod and snap hook, and (2) free-floating operation in which the boat is retrieved with a net installed at the downstream end of the study reach. The free-floating mode is particularly suited for surveying riverbed slope, as it avoids operator-induced interference with inclination measurements.

As an initial application, MONIKA, was deployed at two sections of the Spree River (Germany) to support the placement of new sampling stations downstream of a river confluence. MONIKA was used to determine the minimum downstream distance required for complete mixing. Future applications will extend this approach to open-channel surveys in small rivers, with a particular emphasis on data-scarce catchments.

How to cite: Nixdorf, E., Böhmeke, M., and Gatzke, F.: Development of a low-cost water vehicle for surveying river bed elevation and chemo-physical changes along the river course , EGU General Assembly 2026, Vienna, Austria, 3–8 May 2026, EGU26-4963, https://doi.org/10.5194/egusphere-egu26-4963, 2026.

EGU26-5086 | Posters on site | HS1.1.2

A cost-effective rock sample unit for quality control and intercomparison of 222Rn measurements 

Frédéric Huneau, Sebastian Grondona, Sébastien Santoni, Seng Chee Poh, Tibari El Ghali, Stefan Terzer-Wassmuth, and Mélanie Vital

Reliable radon-222 measurements are essential for a wide range of hydrological, geological, and environmental applications, including the study of surface water - groundwater interactions and the quantification of groundwater discharge. Despite the widespread use of 222Rn detectors, routine verification of instrument performance and measurement stability remains limited, particularly in laboratories with constrained financial and technical resources. This study presents the development and evaluation of a cost-effective rock sample unit designed to support quality control, calibration checks, and inter-laboratory comparison of 222Rn measurements.

The system is based on acidic plutonic igneous rock purchased from commercial suppliers, selected for their naturally elevated and stable 222Rn production. The rocks were enclosed in a simple, airtight container assembled using readily available components, including a standard garden filter and plastic tubing. This configuration allows 222Rn generated within the rock matrix to accumulate in a closed volume and be circulated through commonly used 222Rn detectors without the need for specialized or commercial equipment. Equal amounts of material were placed in each rock sample unit, which were then sealed and stored for 21 days to allow 222Rn to reach secular equilibrium with its parent radionuclides. Initial characterization of the rock units was performed at the IAEA Isotope Hydrology laboratory. Each unit was analysed three times using a standardized protocol consisting of six measurement cycles of 30 minutes each. Measurements were conducted using RAD7 and RAD8 222Rn detectors from Durridge, which are widely applied in environmental and hydrological studies. The results demonstrated stable and reproducible 222Rn concentrations across repeated measurements, confirming the suitability of the rock units as reference sources for quality control purposes.

Following this initial validation, the previously measured rock sample units were distributed to participating laboratories in Argentina, France, Malaysia, and Morocco. Each laboratory applied the same measurement protocol and used their routinely operated 222Rn detectors (RAD7 and RAD8).

To support the interpretation of the observed variability, contextual information was considered, including the age of the instrument, the date of last recalibration, the intensity of use, the type of water typically analysed (saline or non-saline; surface water or groundwater), and the range of 222Rn concentrations normally encountered. This approach enabled the assessment of the significance of deviations under different operating conditions and allowed the evaluation of the robustness of measurements obtained with calibrated versus non-calibrated instruments.

This exercise showed that even simple comparison of 222Rn responses obtained from the rock units provides valuable insight into the performance of the instrument and detect the potential measurement drift related to the lack of calibration. The results demonstrate that these cost-effective rock sample units represent a practical and accessible tool for strengthening 222Rn measurement quality assurance. Their simplicity, low resource requirements, and reproducibility make them particularly suitable for routine checks, contributing to the improved comparability of 222Rn data.

How to cite: Huneau, F., Grondona, S., Santoni, S., Poh, S. C., El Ghali, T., Terzer-Wassmuth, S., and Vital, M.: A cost-effective rock sample unit for quality control and intercomparison of 222Rn measurements, EGU General Assembly 2026, Vienna, Austria, 3–8 May 2026, EGU26-5086, https://doi.org/10.5194/egusphere-egu26-5086, 2026.

EGU26-11522 | Posters on site | HS1.1.2

Automated sampling of dew water to identify hidden nutrient inputs to ecosystems 

Jannis Groh, Andreas Lücke, Thomas Pütz, Ferdinand Engels, Roger Funk, Andreas Sitnikow, Daniel Beysens, and Wulf Amelung

The terrestrial water and nutrient cycle is of crucial importance, influencing the climate, ecosystems, and related services. In many climates, non-rainfall water inputs (NRWIs) play a significant role in the water cycle. These inputs stem from various processes, including dew, fog, and soil water vapour adsorption. Weighable lysimeters are ideal tools for quantifying such water inputs to ecosystems, as their surfaces are either plant- or soil-covered, which is relevant for their formation processes, compared to devices with artificial surfaces. However, the nutrient inputs from dew and fog, apart from wet and dry deposition, are yet to be overlooked, as it is difficult to monitor these hidden nutrient inputs to ecosystems without adequate sampling devices.

We present a newly developed dew collector for the regular collection and analysis of dew samples, for example for stable isotopes, nutrients, and other substances. The lack of automated methods for collecting dew samples represents a significant bottleneck to account for these hidden nutrient inputs. Using a comprehensive measurement setup with weighable lysimeters, wet and dry deposition, and dew and fog water collectors, we show how NRWIs introduce nutrients into ecosystems with different land uses (grassland and cropland) in a temperate climate.

How to cite: Groh, J., Lücke, A., Pütz, T., Engels, F., Funk, R., Sitnikow, A., Beysens, D., and Amelung, W.: Automated sampling of dew water to identify hidden nutrient inputs to ecosystems, EGU General Assembly 2026, Vienna, Austria, 3–8 May 2026, EGU26-11522, https://doi.org/10.5194/egusphere-egu26-11522, 2026.

EGU26-12528 | Posters on site | HS1.1.2

Low-cost spectrophotometer for measuring nitrogen dioxide (NO2) air pollution 

Bas Mijling and Rolf Hut

Palmes diffusion tubes are widely used as a low-cost method for measuring ambient nitrogen dioxide (NO2) air pollution. Based on the principle of molecular diffusion, ambient NO2 accumulates as nitrite at the closed end of the tube. After a typical four-week exposure period, the tubes are returned to a laboratory, where the nitrite is dissolved in water, reacted with a colorimetric reagent, and quantified by measuring the resulting color change using a spectrophotometer.

Despite their effectiveness and affordability, Palmes diffusion tubes are still rarely used in Africa. A major reason is that tube preparation and analysis are typically must be carried out in laboratories outside the continent. One key barrier to establishing local Palmes laboratories is the high upfront cost of spectrophotometers required for sample analysis.

While conventional spectrophotometers can measure absorbance across a wide range of wavelengths, most reagent-based colorimetric analyses require only a single wavelength. For Palmes tube analysis, absorbance is measured at 540 nm, corresponding to the maximum absorption of the Griess reagent. Since green LEDs emit light within a narrow waveband close to this absorption peak, they offer a low-cost alternative light source.

We present and will live-demonstrate a simple device that replaces the spectrophotometer in the Palmes tube analysis workflow. The device consists of a 3D-printed light-tight cuvette holder housing a green LED for illumination and a photodiode to measure transmitted light. Measurement results are displayed directly on the device. The system can determine nitrite concentrations with an accuracy of 3 µg/L, corresponding to approximately 0.1 µg/m3 of ambient NO2 for a four-week exposure period—well below the intrinsic uncertainty of the Palmes diffusion method.

Costing only a fraction of a conventional spectrophotometer, this device has the potential to greatly expand in-situ monitoring of NO2 pollution in sub-Saharan Africa without substantially increasing costs. Moreover, it provides a promising proof of concept for developing similar low-cost instruments for other air and water quality applications based on colorimetric measurements.

How to cite: Mijling, B. and Hut, R.: Low-cost spectrophotometer for measuring nitrogen dioxide (NO2) air pollution, EGU General Assembly 2026, Vienna, Austria, 3–8 May 2026, EGU26-12528, https://doi.org/10.5194/egusphere-egu26-12528, 2026.

EGU26-16212 | Posters on site | HS1.1.2

A novel geophysical electric field sensor design and testing 

Da Lei and Qihui Zhen

One of the Earth's natural physical fields is the geoelectric field. The conductivity of subterranean medium and the locations of pollution sources, among other things, may be examined by tracking variations in the geoelectric field signal over time. The success rate of resource exploration and the accuracy of geological structure inversion are closely correlated with signal quality. Conventional geoelectric field measurement techniques use electrochemical non-polarizing electrodes to detect the potential difference between two electrodes that are far apart in order to acquire the geoelectric field signal. The potential difference value that exists between the electrodes for their own causes is called the "range difference."  Environmental conditions will influence the electrodes' range difference, and the range difference variation amplitude will be greater than the amplitude of the actual geoelectric field signal. Non-polarizing electrodes must be buried deep below during the actual measuring procedure, and electrolyte solutions must be poured to lower the grounding impedance. The electrolyte solution is prone to evaporation or loss in unique environments like deserts and the Gobi, which might result in an abrupt rise in the grounding impedance of the non-polarizing electrodes. This will impact the precision of the geoelectric field signal measurement findings.

This design, which is based on the charge induction principle, aims to create a new kind of electric field sensor that can continuously measure the geoelectric field signal without range differences and does not require the electrodes to be buried. The viability of this sensor is confirmed using physical models and circuit simulations, as well as by contrasting the geoelectric field signal measurement findings of the physical product with those of solid non-polarizing electrodes.

How to cite: Lei, D. and Zhen, Q.: A novel geophysical electric field sensor design and testing, EGU General Assembly 2026, Vienna, Austria, 3–8 May 2026, EGU26-16212, https://doi.org/10.5194/egusphere-egu26-16212, 2026.

EGU26-18536 | Posters on site | HS1.1.2

Analysis of Nitrate Stable Isotopes by Cavity Ring-Down Spectroscopy 

Jennifer McKay, Cedric Douence, Magdalena Hofmann, Jan Woźniak, and Joyeeta Bhattacharya

Nitrate contamination of surface and groundwater is a serious environmental and public health issue.  Identifying the source of this pollutant is an important step in addressing the problem. Nitrogen and oxygen isotopes (δ15N and δ18O values) are a powerful tool for tracing the source(s) of nitrate and understanding processes that impact its cycling in the environment.  Traditionally nitrate isotopes are measured via isotope ratio mass spectrometry (IRMS) but in recent years laser spectroscopy has become a practical option.

We evaluated Picarro’s new PI5131-i isotopic and gas concentration analyser for determining bulk δ15N and δ18O values of N2O converted from dissolved nitrate using the Titanium III chloride method. The PI5131-i analyser is based on a robust mid-infrared, laser-based cavity ring-down spectrometry (CRDS) technology. This system when combined with Picarro’s Sage gas autosampler allowed us to analyse the isotopic composition of dissolved nitrate to a level matching IRMS precision and at concentrations as low as 0.05 mg/L NO3-N. 

In 40 mL reaction vials, Ti (III) chloride was added to 10 mL sample at a 1:20 ratio (v/v, reagent to sample). After 24 hours of reaction time enough N2O was produced for laser spectroscopy analysis. Prior to analysis, the headspace N2O was transferred into 12 mL exetainers to fit in the Sage autosampler. We compared a direct transfer protocol where 2 mL N2O from the reaction vial is injected into exetainers and a 2-steps protocol where the N2O is injected into purged exetainers (evacuated and pressurized with synthetic air).

Both transfer methods performed well in a blind nitrate intercomparison exercise (NICO).  The direct transfer workflow required fewer preparation steps but required a blank correction, whereas the two-step protocol was more labour-intensive due to the purge and fill process.

How to cite: McKay, J., Douence, C., Hofmann, M., Woźniak, J., and Bhattacharya, J.: Analysis of Nitrate Stable Isotopes by Cavity Ring-Down Spectroscopy, EGU General Assembly 2026, Vienna, Austria, 3–8 May 2026, EGU26-18536, https://doi.org/10.5194/egusphere-egu26-18536, 2026.

EGU26-19260 | ECS | Posters on site | HS1.1.2

EVE: a low-cost, modular, end-to-end monitoring pipeline for environmental variables and GHG in rewetted peatlands 

Milan Shay Kretzschmar, Maren Dubbert, Matthias Lück, Michael Asante, Geoffroy Sossa, and Mathias Hoffmann

Rewetted peatlands exhibit strong small-scale, spatio-temporal variability in their greenhouse gas (GHG; CO₂, CH₄ and N₂O) emissions. Those are shaped by water table dynamics, vegetation structure, and microclimate. Capturing “hotspots” and “hot moments” across heterogeneous peatlands typically requires dense instrumentation. However, conventional monitoring solutions remain expensive, difficult to scale, and often depend on commercial, vendor-locked systems. We present the Environmental Variables Explorer (EVE) as a low-cost, modular, open-source alternative that enables researchers to build, repair, adapt, and self-host their monitoring stack without vendor lock-in.

EVE is a platform blueprint rather than a single device. It combines low-power microcontroller nodes with power-saving duty cycling and two interoperable end-to-end, full user controlled workflows. The first, offline workflow, provides robust timestamped local storage (RTC + FRAM) with Bluetooth retrieval via a custom Android app - suited for remote sites. The second, online workflow, uses an ESP32 IoT node to upload measurements via Wi-Fi to a self-hosted PHP/MySQL backend that provides a web dashboard, API access, data visualization and data export (as CSV file) on inexpensive shared hosting. Critically, the offline-online duality provides a “fallback” logic for intermittently connected peatland environments and supports gradual scaling from single devices to multi-site networks.

Building on EVE’s user-controlled pipeline, we present a pathway toward transferable near-real-time analytics by adding chamber-based GHG modules (low-cost CO₂/CH₄ sensing and chamber automation/sampling workflows. Integrating data-driven models (Random Forest and related methods) to estimate flux dynamics and annual budgets across 2-3 sites. Explicitly comparing high-end versus minimal low-cost inputs. By releasing hardware designs, firmware, backend code, and build documentation, this work aims to lower barriers for peatland and other scientists to deploy reproducible monitoring networks and to move toward shared, community-driven approaches for scalable GHG observation and modeling.

How to cite: Kretzschmar, M. S., Dubbert, M., Lück, M., Asante, M., Sossa, G., and Hoffmann, M.: EVE: a low-cost, modular, end-to-end monitoring pipeline for environmental variables and GHG in rewetted peatlands, EGU General Assembly 2026, Vienna, Austria, 3–8 May 2026, EGU26-19260, https://doi.org/10.5194/egusphere-egu26-19260, 2026.

EGU26-21344 | Posters on site | HS1.1.2

Low-Cost Water Quality Buoys: Open-Source Design and AI-Enhanced Monitoring  

Tom Rowan, Joaquina Noriega Gimenez, Yixuan Jia, Yanchi Tang, Ben Howard, Liam Kelleher, Luke Tumelty, Aaron Packman, Athanasios Paschalis, Stefan Krause, and Wouter Buytaert

Water quality monitoring networks face an inherent trade-off between measurement precision and spatial-temporal coverage. We present an open-source smart water quality buoy designed to explore the potential of maximising deployment density and sampling frequency through low-cost instrumentation combined with AI-enhanced analytics. 

The stable buoy enclosure was developed using computational fluid dynamics, water flume validation, and extensive field testing. Initially designed for 3D-printing, it houses three sensors (temperature, turbidity and conductivity) with an ATmega328P microcontroller, real-time clock, flash logging, and/or LoRaWAN connectivity. Laboratory calibration established measurement reliability suitable for network-scale deployment. 

Field deployments have demonstrated autonomous operation with a relatively light monthly maintenance protocol. This platform enables novel monitoring approaches that leverage density over individual sensor accuracy. Initial Machine Learning models trained on national databases (millions of observations) convert basic sensor measurements into estimates of complex parameters — nutrients, dissolved oxygen, and bacteria — with encouraging accuracy. The high-frequency data from dense sensor networks enables automated pollution detection by analyzing concentration dynamics and comparing them against patterns learned from a large database of water quality measurements.

By combining accessible hardware with AI analytics, we investigate whether prioritising spatial-temporal resolution can advance water quality monitoring capabilities, particularly for early pollution detection and regulatory compliance in under-resourced catchments. 

How to cite: Rowan, T., Noriega Gimenez, J., Jia, Y., Tang, Y., Howard, B., Kelleher, L., Tumelty, L., Packman, A., Paschalis, A., Krause, S., and Buytaert, W.: Low-Cost Water Quality Buoys: Open-Source Design and AI-Enhanced Monitoring , EGU General Assembly 2026, Vienna, Austria, 3–8 May 2026, EGU26-21344, https://doi.org/10.5194/egusphere-egu26-21344, 2026.

The emergence of Unmanned Aerial Systems (UAS) has revolutionized environmental monitoring by bridging the gap between stationary ground-based stations and coarse-resolution satellite imagery. However, integrating high-fidelity sensors into lightweight platforms remains a challenge due to strict Size, Weight, and Power (SWaP) constraints. This study presents the development and deployment of an advanced, portable sensing payload designed for high-resolution environmental data collection.

The integrated payload consists of a suite of low-cost yet calibrated sensors capable of measuring Isme PM2.5, CO2, NH4, Smoke and O3 at high temporal frequencies. To ensure data integrity, the system incorporates an onboard microprocessor for real-time data fusion, GPS-tagging, and active aspiration systems to mitigate the effects of rotor wash and thermal interference.

Preliminary field campaigns were conducted across two locations (Dehradun, Uttarakhand and New Delhi) to evaluate the system’s performance. Results indicate that the payload provides vertical and horizontal spatial resolutions previously unattainable with traditional methods. This work highlights the potential of modular UAS payloads to provide actionable insights into boundary layer dynamics and pollutant dispersion in complex terrains.

To ensure data integrity, the platform integrates active aspiration systems designed to decouple sensor readings from the effects of rotor wash and localized thermal artifacts. Initial experiments demonstrate that the payload achieves high-granularity in vertical and horizontal spatial resolutions.

How to cite: Natoo, A.: Developing a Lightweight UAS sensing Payload for Environmental Data collection, EGU General Assembly 2026, Vienna, Austria, 3–8 May 2026, EGU26-21545, https://doi.org/10.5194/egusphere-egu26-21545, 2026.

EGU26-23048 | Posters on site | HS1.1.2

In a Grassed Waterway the grass is always greener – and surface runoff a challenge to measure 

Matthias Konzett, Peter Strauss, Christopher Thoma, Dušan Marjanovic, Borbala Szeles, Günter Blöschl, and Elmar Schmaltz

Grassed waterways (GWW) are a nature-based solution in agricultural catchments to reduce surface runoff and soil erosion. However, continuous measurements of surface runoff in a GWW remain challenging, limiting knowledge of how to construct a measurement station to obtain reliable data. Furthermore, these limitations restrict our understanding of hydrological processes and the effectiveness of GWWs. In this study, we present a monitoring station designed to measure surface runoff and quantify soil erosion from a 6 ha agricultural sub-catchment, and discuss the opportunities and limitations of monitoring runoff, sediments, and nutrients in a managed GWW. This study is part of the overall 66 ha catchment at the HOAL (Hydrological Open-Air Laboratory), Austria.  

We developed an H-Flume-like structure that reliably quantifies flow without disturbing the GWW’s function. Non-contact radar probes measure the height and velocity of runoff in the structure, allowing discharge calculations during runoff events. When a specified runoff height is detected, an automatic water sampler collects water for further analysis, such as sediment quantification. Thermal and optical cameras are mounted on the structure to capture images from upslope, the structure itself, and downslope, providing several perspectives for visual documentation of runoff processes and sediment transport.

While complementary measurements and modelling support the understanding of the overall effectiveness of the GWW in the HOAL catchment, this station provides valuable information on the timing of runoff, peak flow reduction, and catchment connectivity. The integrated sensor network at this station and throughout the HOAL - including rain gauges, soil moisture sensors, and additional runoff stations - enables a process-based understanding of how grassed waterways affect surface runoff, pluvial floods, and sediment and nutrient transport towards the stream.

This methodology remains under active development, and we encourage community input on improvements to the current methodologies and suggestions for additional observations. This presentation aims to share our current design, present preliminary results, and foster collaborative discussion on advancing monitoring of vegetated, nature-based erosion control structures.

How to cite: Konzett, M., Strauss, P., Thoma, C., Marjanovic, D., Szeles, B., Blöschl, G., and Schmaltz, E.: In a Grassed Waterway the grass is always greener – and surface runoff a challenge to measure, EGU General Assembly 2026, Vienna, Austria, 3–8 May 2026, EGU26-23048, https://doi.org/10.5194/egusphere-egu26-23048, 2026.

EGU26-23272 | Posters on site | HS1.1.2

SMARTWATER: low-cost, open-source portable water autosampler for environmental monitoring 

Liam Kelleher and Kieran Khamis and the SMARTWATER Team

Water sampling is essential for assessing the quality of rural and urban water systems. As part of the NERC-NSFGEO SMARTWATER project we aim to diagnose pollution “hot spots” and “hot moments” within watersheds defined as locations and times of pollution transport. To understand and diagnose pollutant dynamics we are forming a smart monitoring network consisting of offline and online sensors, low-cost proxy sensor measurements, and event-based sample collection using autosamplers.

To address existing autosampler constraints, we have developed a smart online autosampler that can be triggered either by a float switch or remotely through a LoRa network. The system is optimised for low-power operation using 12V electronics, light and smaller lithium-based batteries, power optimised Arduino controller, LoRa shield, commercial solenoid values and relays. Laboratory testing has validated the system operation and effective flushing of water between sampling bottle fills. Field deployment along our urban observatory, the Birmingham Urban River Observatory, a UNESCO Intergovernmental Hydrological Programme site, demonstrated performance comparable to standard systems.

This open-source design enables scalable, cost-effective monitoring of river water quality, facilitating improved spatial and temporal assessment across multiple catchments. SMARTWATER: https://www.smart-water.org.uk/

How to cite: Kelleher, L. and Khamis, K. and the SMARTWATER Team: SMARTWATER: low-cost, open-source portable water autosampler for environmental monitoring, EGU General Assembly 2026, Vienna, Austria, 3–8 May 2026, EGU26-23272, https://doi.org/10.5194/egusphere-egu26-23272, 2026.

EGU26-3833 | Posters on site | HS1.1.3 | Highlight

Risk near hydroelectric structures – Determination of critical velocity thresholds for river users (swimmers and floating crafts) 

Thomas Morlot, Arnaud Belleville, and Matthieu Le Brun

Whether we talk about safety reasons, energy production or regulation, water resources management is one of EDF’s (Électricité De France, French hydropower company) main concerns.

The range of water-based activities is steadily increasing : paddleboarding, canoeing, float-tube fishing, these floating crafts are now widely available at low cost and are becoming popular on rivers. EDF’s hydroelectric facility operators are regularly faced with the intrusion of swimmers and watercraft near the structures. This occurs, for example, beyond the restricted zone upstream of hydroelectric installations. This zone, usually marked by a line of buoys, is intended to prevent drowning accidents that could result from the start-up of a turbine or any other system capable of creating a suction current. Similar risks exist downstream of the structures, where currents and depths attract swimmers and floating crafts.

Given the risky behavior of river users, EDF’s challenge is to secure the vicinity of its installations by assessing the danger and proposing appropriate countermeasures. In this context, EDF aims at determining current thresholds beyond which the swimming ability and maneuvering capacity of floating crafts (paddleboards, canoes, float-tubes) for different user profiles (children, adults, athletes) are no longer sufficient to escape the danger of being sucked in or swept away. This study therefore only concerns areas where users cannot stand in the river. Such work will enable the company to implement the necessary measures to secure zones considered hazardous near hydroelectric structures.

To carry out this work, tests in collaboration with members of the SDIS 81 Water Rescue team were conducted at the Millau whitewater stadium to determine the current speeds beyond which swimmers and light watercraft can no longer escape danger. These trials, carried out under controlled and safe conditions, involved scenarios of swimming and maneuvering floating crafts in currents ranging from weak to strong at the Millau water sports facility. The objective was to assess the swimming and mobility capacities of swimmers and non-motorized watercraft (paddleboards, canoes, float-tubes) across different current speed ranges.

All the tools routinely used by EDF hydrometric teams to measure flow velocities were deployed (ADCP, current meter, SVR radar, LSPIV) to better characterize the different current speeds tested.

The results obtained made it possible to identify the threshold values sought, based on current speed and the presence or not of turbulence. Finally, a theoretical approach based on Newton’s second law helped corroborate the empirical results obtained during the tests.

How to cite: Morlot, T., Belleville, A., and Le Brun, M.: Risk near hydroelectric structures – Determination of critical velocity thresholds for river users (swimmers and floating crafts), EGU General Assembly 2026, Vienna, Austria, 3–8 May 2026, EGU26-3833, https://doi.org/10.5194/egusphere-egu26-3833, 2026.

EGU26-4747 | ECS | Posters on site | HS1.1.3

Field Estimation of Manning’s Roughness and Its Application to CSA Discharge Computation during Flood Events 

Lee Ikhan, Kim Dongsu, Kim Dohyeon, Seo Gibeom, and Yun Jonghyeon

River discharge is a key indicator for water resources management and flood forecasting; however, the traditional single stage–discharge rating curve used for its estimation produces systematic errors under unsteady flow conditions due to hysteresis. In this study, field-measured Manning’s roughness coefficients (n) are first estimated at Naju Bridge on the Yeongsan River by combining H-ADCP–measured discharges with water-surface slopes derived from upstream and downstream stage observations, using the continuous slope–area (CSA) framework in inverse form. The resulting 10-min n time series for the 2020 flood events is then segmented by stage to represent cross-sectional controls on roughness. These stage-wise n segments are subsequently applied to the CSA method to compute discharge time series for the 2019 and 2021 flood events, and the estimates are validated against observations. The estimated n exhibits a consistent stage-dependent pattern, including a rapid decrease at low stages, convergence at intermediate stages, an inflection point near the onset of rapid cross-sectional expansion, and an increase at high stages, reaching n ≈ 0.08–0.09 during extreme floods—values higher than those from conventional empirical formulas and design criteria. Using the measured and stage-segmented n, the CSA-based discharge estimates successfully reproduce hysteresis across six flood events, achieving R² ≥ 0.94 and peak error ≤ 3%, although nRMSE exceeds 10% under low-flow conditions. Overall, applying field-derived roughness substantially improves CSA discharge estimation and supports the practical use of roughness monitoring and CSA-based computation in rivers subject to unsteady flow.

How to cite: Ikhan, L., Dongsu, K., Dohyeon, K., Gibeom, S., and Jonghyeon, Y.: Field Estimation of Manning’s Roughness and Its Application to CSA Discharge Computation during Flood Events, EGU General Assembly 2026, Vienna, Austria, 3–8 May 2026, EGU26-4747, https://doi.org/10.5194/egusphere-egu26-4747, 2026.

Sediment transport is a key process in fluvial geomorphology, particularly in gravel-bed rivers, as it controls channel morphology and has important implications for river management and restoration. This process occurs in three main phases: entrainment, movement, and deposition, and is influenced by factors such as particle size, shape, density, angularity, imbrication, and the ratio between transported sediment size and bed material.  Although field data on sediment transport are essential, they are often difficult to obtain. To overcome this, a wide range of monitoring techniques has been developed, including direct samplers such as the Helley-Smith sampler and bedload traps, acoustic sensors such as geophones and hydrophones, and laboratory experiments that allow sediment dynamics to be studied under controlled conditions. In parallel, sediment transport models rely strongly on grain size distribution, either using the full distribution or representative metrics such as D50 or D84. Since the 1990s, sediment tracking has become increasingly important, with gravel tagging emerging as a widely used method for analysing sediment mobility and travel distances. Technological advances have significantly improved recovery rates, particularly through the use of electronic tags. Passive Integrated Transponder (PIT) tags are now commonly used due to their small size, low cost, long lifespan, and passive operation. Active tags, such as VHF and UHF, enable continuous tracking via fixed antennas but are larger and more expensive. In this work, we used active tags to estimate the volume of sediment mobilised by deploying RFID‑tagged gravels, thereby improving our understanding of sediment movement through the concept of virtual velocity. Tag seeding was carried out at four sites upstream of the first fixed antenna. Preliminary results show that gravels in the 45–181 mm size range (85% of all seeded material) have been mobilised over distances of approximately 700 m and detected by the antennas, whereas gravels in the coarsest size classes have not yet been recorded. In conclusion, higher‑magnitude events are required for the coarsest particle sizes to become mobile and be detected by the first antenna. Although several low‑magnitude events have occurred, very few of the mobilised gravels have been detected by the second antenna located downstream of the first, suggesting that they may have become buried or trapped in pools.

ACKNOWLEDGMENTS: This work is funded by the European Research Council (ERC) through the Horizon Europe 2021 Starting Grant program under REA grant agreement number 101039181 - SEDAHEAD.

How to cite: Juez, C. and Rabanaque, M. P.: Sediment mobility in a gravel-bed river (Aragón Subordán River, Central Spanish Pyrenees) assessed using active RFID tags, EGU General Assembly 2026, Vienna, Austria, 3–8 May 2026, EGU26-7104, https://doi.org/10.5194/egusphere-egu26-7104, 2026.

River flow conditions at high latitudes show strong seasonal variability due to changes in hydrological conditions throughout the year. During winter, ice cover reduces flow velocity. In spring, snowmelt increases discharge and often results in flooding. During summer and autumn, rainfall can cause temporary increases in discharge. High-latitude fluvial environments are particularly sensitive to climate change, which has been found to have a stronger impact in these regions than in rivers at lower latitudes. This study investigated seasonal flow dynamics in a single meander bend of the Oulankajoki River in Finland during winter, spring, and autumn over one hydrological year using an Acoustic Doppler Current Profiler (ADCP). Vertical ADCP surveys provided detailed cross-sectional velocity profiles and flow directions throughout the water column in each field campaign.

Results showed significant variation between seasons. Winter ice cover significantly reduced near-surface velocities and shifted the high-velocity core (HVC) to mid-depth, whereas in open-water conditions the highest velocities occurred closer to the surface. In open-channel conditions, peak velocities were observed in the shallow upstream and deep downstream sections of the bend, while in winter flow decelerated downstream of the bend apex.  During winter and autumn, the HVC was located near the inner bank in the upstream section of the meander bend and gradually shifted to the outer bank before the bend apex. Downstream of the apex, the HVC migrated from the outer bank toward the center of the channel. Unlike in winter and autumn, the spring flood caused the HVC to migrate from the upstream of the meander, flow directly across the point bar, and shift toward the outer bank at the apex.

The study is now being extended by integrating continuous monitoring of flow conditions using a side-looking Doppler current meter. This enables long-term, high-resolution observations, including ice-covered periods. Combining vertical and horizontal ADCP measurements is expected to provide a rare, spatially comprehensive and temporally continuous dataset. This integration enables improved characterization of flow variability and seasonal dynamics in high latitude rivers, thereby enhancing hydrological analyses and process-based modeling.

How to cite: Korkiakoski, K.: From short-term vertical ADCP measurements to continuous Side-Looking current meter monitoring in a high-latitude river, EGU General Assembly 2026, Vienna, Austria, 3–8 May 2026, EGU26-7246, https://doi.org/10.5194/egusphere-egu26-7246, 2026.

EGU26-7926 | Posters on site | HS1.1.3

Applying image velocimetry on curved free‑surface geometries of known shape such as spillways or free-nappe: the OrthoCyd method. 

Guillaume Bodart, Alexandre Hauet, Jérôme Le Coz, and Magali Jodeau

Ensuring the safety of spillways during flood events is a critical challenge for dam operators and public authorities. Accurate knowledge of flow velocities along spillways and downstream of ski jumps is essential for assessing the erosive potential of high‑velocity flows and preventing structural damage. However, intrusive velocity measurement techniques are unsuitable in such configurations due to limited accessibility and the very high flow speeds involved. Image‑based velocimetry offers an attractive alternative, providing instantaneous, spatially distributed velocity fields from a single viewpoint. Yet, conventional image-based techniques rely on the assumption of a planar free surface, which becomes invalid for curved flows such as those encountered on spillway chutes or nappe flows. Surface curvature induces geometric distortions in ortho‑rectified images, leading to significant velocity errors.

Stereo‑vision systems can be used to reconstruct non‑planar free surfaces, but their deployment on full‑scale spillways is complex and costly as it requires synchronized cameras with high spatial and temporal resolution. To overcome these limitations, we propose OrthoCyd, a novel single‑camera orthorectification method dedicated to flows whose free‑surface geometry is known a priori and corresponds to a right‑cylindrical surface (i.e., a planar surface which is curved along the longitudinal dimension). This approach is well suited to spillway chutes, with the assumption that the free surface follows the underlying curved geometry. OrthoCyd enable consistent displacement measurements with any image-velocimetry method (block matching, tracking, optical flow, spatio-temporal approach). This method extends the applicability of image‑based velocimetry to non‑planar free‑surface flows while maintaining the simplicity and practicality of single‑camera acquisition systems.

Two applications illustrate the method: a laboratory experiment on a free‑nappe flow, and a field application on an operating spillway. These examples demonstrate that OrthoCyd provides reliable velocity measurements in both controlled and full‑scale conditions.

How to cite: Bodart, G., Hauet, A., Le Coz, J., and Jodeau, M.: Applying image velocimetry on curved free‑surface geometries of known shape such as spillways or free-nappe: the OrthoCyd method., EGU General Assembly 2026, Vienna, Austria, 3–8 May 2026, EGU26-7926, https://doi.org/10.5194/egusphere-egu26-7926, 2026.

EGU26-8486 | Posters on site | HS1.1.3

Relationship between Cross-Sectional Mean Velocity and Surface Velocity in Rivers 

Sinjae Lee, Bokjin Jang, and Jihea Lee

Recently, non-contact current meters (radar, image-based) are widely used to measure the discharge of rivers, and research and cases of calculating discharge by applying surface velocity-based index velocity method and velocity distribution method are increasing. To apply index velocity or velocity distribution methods based on surface velocity, the relationship between the surface velocity used as the index velocity and the cross-sectional average velocity must be known. In general, in straight channels with sufficiently large channel width, the ratio of the cross-sectional average velocity to the maximum velocity (ϕ(M)) is known to be between 0.6 and 0.7.

In this study, the relationship between the maximum surface velocity and the cross-sectional average velocity was analyzed. Using 179 flow measurement data from 60 sites, the ratio of the cross-sectional average velocity to the maximum surface velocity (≈ϕ(M)) was calculated. As a result, ϕ(M) was analyzed to have an average of 0.64(correlation coefficient R=0.86). When the relationship between the two elements was established as a linear equation, the slope was calculated to be 0.6306 (R=0.74). The ratio of ϕ(M) and the velocity coefficient α (ratio of reference discharge/surface velocity discharge (α=1 applied)) was calculated to be 0.75 on average (range 0.51 to 0.91), and when the relationship between the two elements was established as a linear equation, the slope was calculated to be 0.7586 (R= 0.68). The correlation coefficient between ϕ(M) and the maximum surface velocity/average surface velocity of the cross-section was calculated to be -0.84, indicating that ϕ(M) shows a strong correlation with the distribution characteristics of the surface velocity. When the relationship between the two factors was established as an exponential equation, the coefficient of determination was calculated to be 0.76, confirming that the value of ϕ(M) can be estimated and used through surface velocity measurements.

keyword : average velocity, surface velocity, index velocity, ϕ(M)

Acknowledgements

This work was supported by Korea Environment Industry & Technology Institute (KEITI) through Research and development on the technology for securing the water resources stability in response to future change Program, funded by Korea Ministry of Climate, Energy and Enviroment (MCEE)(RS-2024-00336020)

How to cite: Lee, S., Jang, B., and Lee, J.: Relationship between Cross-Sectional Mean Velocity and Surface Velocity in Rivers, EGU General Assembly 2026, Vienna, Austria, 3–8 May 2026, EGU26-8486, https://doi.org/10.5194/egusphere-egu26-8486, 2026.

EGU26-8722 | Posters on site | HS1.1.3

An Integrated Regression Model for Estimating the Velocity Index in Non-Contact River Discharge Measurements 

Tae Hee Lee, Jung Hwan Chun, Seung Ho Park, Tae Woong Ok, and Woo Jin Kim

Non-contact river discharge measurement techniques, such as radar-based surface velocity sensors, are increasingly applied in hydrological observations due to their advantages in operational safety and accessibility during flood events. However, these sensors directly measure only surface velocity, and reliable discharge estimation therefore requires conversion to depth-averaged velocity using an accurately estimated velocity index (α). In practice, α is often treated as a constant or determined empirically, which can lead to substantial uncertainty, particularly under unsteady flow conditions. 

This study proposes a regression-based framework to quantify the velocity index as a function of hydraulic and flow variability characteristics, using field observations from natural rivers. Both Acoustic Doppler Current Profiler (ADCP) measurements and radar-based surface velocity data are employed. First, reliable depth-averaged velocities and velocity profiles are obtained from ADCP observations, from which reference velocity index values are derived. Subsequently, corresponding α values for radar observations are generated using stage–discharge relationships, and the regression dataset is expanded by integrating both ADCP- and radar-based cases.

The velocity index is formulated using a hybrid multiplicative regression model incorporating water surface slope, channel aspect ratio, and the rate of water level change (dH/dt). In particular, the inclusion of the water level change rate explicitly accounts for unsteady flow effects occurring during rising and falling stages of flood events. Model performance and robustness are comprehensively evaluated using adjusted coefficient of determination, root mean square error, mean absolute percentage error, and variance inflation factor to assess both predictive accuracy and multicollinearity.

Results indicate that the three-variable model consisting of water surface slope, channel aspect ratio, and water level change rate achieves the most favorable balance, exhibiting the lowest prediction errors while maintaining low multicollinearity. The incorporation of dH/dt is shown to effectively represent hysteresis effects in the relationship between surface velocity and depth-averaged velocity during flood conditions, significantly improving model stability.

The regression model proposed in this study is developed based on an integrated dataset combining ADCP and radar observations and provides a velocity index formulation that is applicable across a wide range of hydraulic conditions, including unsteady flood flows, without dependence on a specific sensor type. The results confirm that the proposed model contributes to improving the reliability and consistency of depth-averaged velocity estimation in non-contact river discharge measurements.

Keywords : Non-contact river discharge measurement, Velocity index (mean velocity conversion coefficient), Surface velocity, Unsteady flow conditions, Regression model


Acknowledgements 
This work was supported by Korea Environment Industry & Technology Institute (KEITI) through Research and development on the technology for securing the water resources stability in response to future change Program, funded by Korea Ministry of Climate, Energy and Enviroment (MCEE)(RS-2024-00336020)
 

How to cite: Lee, T. H., Chun, J. H., Park, S. H., Ok, T. W., and Kim, W. J.: An Integrated Regression Model for Estimating the Velocity Index in Non-Contact River Discharge Measurements, EGU General Assembly 2026, Vienna, Austria, 3–8 May 2026, EGU26-8722, https://doi.org/10.5194/egusphere-egu26-8722, 2026.

EGU26-9919 | ECS | Posters on site | HS1.1.3

River surface velocity estimation using UAS-borne Doppler radar and continuous wavelet transform 

Zhen Zhou, Xinqi Hu, Fabian Merk, Markus Disse, Elisa Caccamo, Silvia Barbetta, Daniele Giordan, Angelica Tarpanelli, Villads Flendsted Jensen, Michael Andreas Pedersen, Sune Nielsen, Daniel Wennerberg, Viktor Fagerström, David Gustafsson, and Peter Bauer-Gottwein

Accurate measurement of river surface velocity is essential for hydrological monitoring, flood forecasting, and water resource management. In contrast with traditional in-situ point measurements using electromagnetic current meters, remote sensing techniques offer significant advantages for river surface velocity estimation, including rapid data acquisition, lower operational costs, and contactless operation. Based on Unmanned Aerial Systems (UAS) equipped with Doppler radar becomes more attractive due to it is suitable for real-time velocity determination and has fewer limitations.

The UAS-borne Doppler radar estimates river surface velocity by detecting the frequency shift of backscattered microwaves, with the drone operating at a controlled hover altitude of approximately 4 meters above the water surface during field measurements. However, the propeller wash (propwash) generated by the UAS distorts the radar return signal, resulting in a composite velocity measurement that combines the true river surface flow with the locally induced airflow velocity. To isolate the true river velocity, we introduce a bidirectional observation scheme in which the same surface footprint is measured from two opposing directions. The Continuous Wavelet Transform (CWT) algorithm is employed to extract the mixed velocity components from each directional dataset. By analytically reconciling these bidirectional measurements, the downwash contribution is effectively removed, thereby yielding a refined estimate of the true river surface velocity.

In this study, river surface velocity was analysed across more than 50 cross-sections spanning four distinct rivers, covering a broad velocity range from 20 cm/s to 250 cm/s. To validate the velocity estimates obtained from the UAS-Doppler radar and CWT method, comparisons were made against in-situ measurements collected using instruments such as the OTT MF Pro, Acoustic Doppler Current Profilers (ADCP), and flow trackers. Quantitative analysis confirmed that the UAS-Doppler radar system provides reliable river flow velocity measurements while offering enhanced efficiency in post-processing workflows.

How to cite: Zhou, Z., Hu, X., Merk, F., Disse, M., Caccamo, E., Barbetta, S., Giordan, D., Tarpanelli, A., Flendsted Jensen, V., Andreas Pedersen, M., Nielsen, S., Wennerberg, D., Fagerström, V., Gustafsson, D., and Bauer-Gottwein, P.: River surface velocity estimation using UAS-borne Doppler radar and continuous wavelet transform, EGU General Assembly 2026, Vienna, Austria, 3–8 May 2026, EGU26-9919, https://doi.org/10.5194/egusphere-egu26-9919, 2026.

EGU26-10110 | Posters on site | HS1.1.3

Ensuring Data Quality in River Discharge Measurements: Strategies and Future Directions 

Silke Kainz, Martin Hasenhündl, and Steffen Büchen

Ensuring high-quality river discharge measurements is fundamental for flood protection, forecasting and assessing water availability under changing climate conditions. While modern technologies such as Acoustic Doppler Current Profilers (ADCP), camera-based surface velocimetry and emerging sensor technologies offer advanced capabilities, they also present new challenges in terms of quality assurance compared to traditional instruments such as rotating-element current meters.

Although the modern measurement methods mentioned above are already in use in many countries, standardized testing procedures are still lacking. Coupled with the complexity of device application and data evaluation, and the absence of standardized operating protocols in these areas, the accuracy of these methods may be compromised compared to conventional techniques. Addressing these issues requires innovative, internationally coordinated approaches to quality assurance that can adapt to future developments.

Several strategies have proven effective in improving data reliability:

  • Routine device checks and maintenance to guarantee functionality and detect early signs of malfunction.
  • Regular intercomparison measurements to identify systematic and random errors, highlight operational differences, and ensure comparability of results.
  • Continuous training and experience exchange to reduce operational errors and strengthen technical expertise.
  • Development of independent software solutions and adoption of open data principles to reduce black box solutions, enable robust data analysis and foster innovation.
  • Creation of guidelines and institutionalization of standards for measurement methods, intercomparison programs and device testing.
  • Promotion of research and development to advance measurement techniques and adapt to emerging technologies.

Our work highlights effective measures and underscores the need for coordinated international initiatives to establish common standards. By combining research, operational experience, and international collaboration, we can collectively strengthen the reliability of river monitoring worldwide.

How to cite: Kainz, S., Hasenhündl, M., and Büchen, S.: Ensuring Data Quality in River Discharge Measurements: Strategies and Future Directions, EGU General Assembly 2026, Vienna, Austria, 3–8 May 2026, EGU26-10110, https://doi.org/10.5194/egusphere-egu26-10110, 2026.

EGU26-11565 | Posters on site | HS1.1.3

Using Electrical Conductivity as a Proxy for Q: A Madman’s Delusion or Elusive Science 

Gabriel Sentlinger, Florentin Hofmeister, Michele Combatti, Alessio Gentile, Gabriele Chiogna, Steven Weijs, Alexandre Hauet, David Mindham, and Rhys Mahannah

Salt Dilution (SD) is an accurate, safe, relatively inexpensive, and easily employed method to measure water flow in turbulent streams and rivers. Often, Temperature Compensated Electrical Conductivity (EC.T) sensors are deployed continuously in Automated Salt Dilution (AQ) flow measurement systems. Recent studies (Cano-Paoli, K., Chiogna, G., and Bellin, A. 2019) have examined how well a continuous EC.T record can be used in regression analysis to estimate the Discharge. EC.T has the benefit of not requiring a stable Pressure Transducer (PT) elevation and avoids other complications of a stage-discharge station, such as shifting hydraulic controls. However, EC.T can be impacted by sediment fouling, aeration, and seasonal/storm event-related changes to the relationship with Q. This study examines how robust a combined stage-discharge-EC.T time series can be for the generation of a maximum likelihood flow hydrograph. This relationship can be useful for infilling missing data and determining hydraulic control shifts in the stage-discharge relationship. Examples are presented from several mountainous catchments.

How to cite: Sentlinger, G., Hofmeister, F., Combatti, M., Gentile, A., Chiogna, G., Weijs, S., Hauet, A., Mindham, D., and Mahannah, R.: Using Electrical Conductivity as a Proxy for Q: A Madman’s Delusion or Elusive Science, EGU General Assembly 2026, Vienna, Austria, 3–8 May 2026, EGU26-11565, https://doi.org/10.5194/egusphere-egu26-11565, 2026.

EGU26-15987 | Posters on site | HS1.1.3

Characteristics of Surface-to-Depth-Averaged Velocity Conversion Factors Based on ADCP Measurements 

Kisung Lee, Sinjae Lee, and Soojeen Yang

This study investigates surface-to-depth-averaged velocity relationships for discharge estimation across a wide range of river scales and flow conditions. The analysis focuses on conversion factors used in surface-velocity-based discharge estimation and their hydraulic controls. A total of 172 ADCP datasets collected from Korean rivers between 2016 and 2018 were reprocessed using an updated version of QRev to obtain consistent and reliable velocity and discharge estimates. Surface velocities were estimated using QRev-based extrapolation and power-law velocity profile methods, and conversion factors were calculated as the ratio of depth-averaged velocity to surface velocity.

The mean conversion factor was 0.88 for the extrapolation method and 0.85 for the power-law method, with most values ranging between 0.80 and 0.90. The estimated uncertainty was approximately 7–8%. Analysis of hydraulic variables showed that conversion factors increased with water surface width and mean depth, whereas weak negative trends were observed with mean velocity and shape factor. Correlation coefficients were generally below 0.5, indicating substantial scatter and limitations in generalizing conversion factors based on single hydraulic parameters.

Acknowledgements
This work was supported by Korea Environment Industry & Technology Institute (KEITI) through Research and Development on the Technology for Securing the Water Resources Stability in Response to Future Change program, funded by Korea Ministry of Climate, Energy and Environment (MCEE) (RS-2024-00336020)

Keywords : Surface velocity, Depth-averaged velocity, Conversion factor, ADCP, Natural rivers


How to cite: Lee, K., Lee, S., and Yang, S.: Characteristics of Surface-to-Depth-Averaged Velocity Conversion Factors Based on ADCP Measurements, EGU General Assembly 2026, Vienna, Austria, 3–8 May 2026, EGU26-15987, https://doi.org/10.5194/egusphere-egu26-15987, 2026.

EGU26-17351 | Posters on site | HS1.1.3

RUHM: An open-source tool for rapid stage–discharge Rating curve Uncertainty estimation using Hydraulic Modelling and UAV data 

Ida Westerberg, Reinert Karlsen, Valentin Mansanarez, and Axel Lavenius

We present RUHM (Rating curve Uncertainty estimation using Hydraulic Modelling), a new open-source tool for rapid estimation of stage–discharge rating curves and their uncertainty at river discharge monitoring stations. A rating curve models the relation between stage (water level) and discharge at a river location and is used to derive discharge time series from water level at most discharge monitoring stations worldwide. However, many stage-discharge field gaugings are needed to estimate rating curves and their uncertainty using traditional approaches. RUHM combines a 1D hydraulic model with Bayesian inference and uncertainty estimation techniques to more rapidly estimate a rating curve and its associated uncertainty with a minimum of three low to middle flow gaugings. The data needed to use RUHM can be effectively collected using drone/UAV (Unmanned Aerial Vehicle) surveys, reducing field efforts compared with traditional approaches. Our open-source implementation of RUHM is written in Python and features a graphical user interface, a user manual, two workflows for pre-processing UAV-derived and/or traditionally surveyed data to generate the RUHM input data files, and example datasets with UAV data. Applications of RUHM to Swedish stations show well-constrained and robust uncertainty estimates where the 1D-flow assumption holds, and wider uncertainty intervals where it does not.

How to cite: Westerberg, I., Karlsen, R., Mansanarez, V., and Lavenius, A.: RUHM: An open-source tool for rapid stage–discharge Rating curve Uncertainty estimation using Hydraulic Modelling and UAV data, EGU General Assembly 2026, Vienna, Austria, 3–8 May 2026, EGU26-17351, https://doi.org/10.5194/egusphere-egu26-17351, 2026.

EGU26-18005 | Posters on site | HS1.1.3

Rating curve estimation in ungauged basins using coupled hydrological–hydraulic modelling and multi-source remote sensing and UAS data 

Xinqi Hu, Zhen Zhou, Faizan Anwar, Ye Tuo, Sune Nielsen, Fabian Merk, Peter Bauer-Gottwein, and Markus Disse

Discharge observations mainly rely on gauged water levels through rating curves (RC), whose reliable establishment requires long term measurements that are often unavailable due to high maintenance costs, complex terrain, and political reasons. As a result, many basins worldwide remain ungauged, making RC estimation particularly challenging. Recent advances in remote sensing, including satellite altimetry, provide new opportunities for discharge and RC estimation in ungauged basins. However, several challenges remain, including parameter equifinality in discharge inversion from water level, oversimplified assumptions of channel resistance and cross-sectional instability in morphologically active rivers. While Unmanned Aerial Systems (UAS) enable retrieval of channel geometry in complex and hard-to-reach river reaches which imposes an important constraint to mitigate parameter equifinality in hydrodynamic modeling, a systematic assessment of how UAS and remote sensing observations can be combined to reliably estimate rating curves in fully ungauged basins remains lacking.

Funded by European Union's Horizon Europe project UAWOS (Unoccupied Airborne Water Observing System), this study presents a RC estimation framework specifically for ungauged basins using multisource remote sensing, UAS data, and a coupled lumped rainfall–runoff and one-dimensional hydrodynamic model. The model is fully forced and calibrated using remote sensing and UAS observations only. To address parameter equifinality, we first perform a temporal-scale dependent parameter sensitivity analysis to assess the identifiability of model parameters given availability of different remote sensing observations. Based on the sensitivity results, a multi-staged Bayesian calibration strategy is introduced, in which each observation type constrains only the parameter subspace supported by its information content. Isar River, Germany was chosen to test and evaluate the feasibility of the proposed methodology.

Overall, the proposed framework provides a transferable theoretical and technical pathway for estimating RC in ungauged river basins, demonstrating the potential of combining UAS and remote sensing data to derive RC, without relying on prior discharge measurements and offering implications for estimation of ungauged catchments.

How to cite: Hu, X., Zhou, Z., Anwar, F., Tuo, Y., Nielsen, S., Merk, F., Bauer-Gottwein, P., and Disse, M.: Rating curve estimation in ungauged basins using coupled hydrological–hydraulic modelling and multi-source remote sensing and UAS data, EGU General Assembly 2026, Vienna, Austria, 3–8 May 2026, EGU26-18005, https://doi.org/10.5194/egusphere-egu26-18005, 2026.

EGU26-19389 | ECS | Posters on site | HS1.1.3

A novel low-cost stereo camera system for river monitoring. 

Pedro Zamboni, Robert Krüger, László Bertalan, and Anette Eltner

Most existing developments in camera gauges focus on single-camera configurations supported by ancillary information, such as detailed three-dimensional (3D) channel geometry and ground control points (GCPs). In these approaches, the water surface is delineated from images and reprojected onto a predefined 3D terrain model. However, acquiring accurate and up-to-date 3D models is often challenging or impractical, particularly in dynamic river environments where channel geometry evolves over time. As a result, frequent model updates are required to maintain measurement accuracy. Another key limitation of conventional camera gauges is the limited quantification of uncertainty in water level estimation. Surface velocity is typically derived using image velocimetry or particle tracking velocimetry. While these methods can provide accurate velocity measurements, they are contingent upon the selection of several parameters that must be meticulously chosen for each monitoring site. Furthermore, the performance of these methods can be degraded by challenging camera poses, varying illumination conditions, and flow regimes.

To address these limitations, we introduce a novel low-cost camera gauge system that integrates stereo photogrammetry with artificial intelligence (AI). The system comprises two low-cost cameras connected to a microcomputer capable of capturing, storing, and transmitting images and short video sequences to an online server. An AI-assisted multi-epoch stereo photogrammetry workflow is then applied to estimate camera pose and reconstruct dense 3D model. This process eliminates the need for predefined 3D data of the cross-section and allows us to compute a new and updated 3D model for each image pair. The updated 3D models are the key component of our methodology, from each water level and water surface velocity can measured in scaled values. Additionally, geomorphologic process can be also measured comparing subsequently 3D models. River water surface segmentation is performed using two foundation models, Grounding DINO and the Segment Anything Model (SAM). River waterlines from both images are then matched and projected into the 3D model, from which the water level is retrieved. This approach enables explicit assessment of errors in water level measurements. Particles tracked in video sequences, using a robust AI model, in both images are further projected into the 3D model, enabling scaled estimation of water surface velocity and, subsequently, river discharge.

The proposed methodology provides a robust and scalable remote sensing solution for river monitoring, enabling the observation of hydrological variables and geomorphological processes. Its low cost and reduced reliance on site-specific ancillary data make it well suited for addressing observational data gaps and for densifying hydrological monitoring networks. Moreover, with an appropriate setup, the system can be used for real-time monitoring, making it a valuable tool in scenarios such as flash floods.

How to cite: Zamboni, P., Krüger, R., Bertalan, L., and Eltner, A.: A novel low-cost stereo camera system for river monitoring., EGU General Assembly 2026, Vienna, Austria, 3–8 May 2026, EGU26-19389, https://doi.org/10.5194/egusphere-egu26-19389, 2026.

EGU26-19665 | ECS | Posters on site | HS1.1.3

River ice under climate change: integrating modelling and data acquisition methods for detecting changes 

Reeta Vaahtera, Marijke de Vet, Noora Veijalainen, and Eliisa Lotsari

Fluvial ice significantly impacts river hydrodynamics by increasing flow resistance, which leads to altered water levels, flow velocities, and turbulence characteristics. River ice also has socio-economic implications as it impacts energy production, flood risk management, and transportation. These effects have remarkable spatial extent: approximately one third of the Earth’s landmass is drained by seasonally freezing rivers. At the same time, the Earth system is experiencing rapid and dramatic changes due to changing climate and these changes are intense in northern areas due to even faster warming and fragile ecosystems. Despite the importance of understanding these changes, obtaining detailed information of ice-covered hydrodynamics remains challenging and potentially dangerous, resulting in limited data availability even under current conditions.

In this research, more comprehensive insights into fluvial ice and ice-covered hydrodynamics in Finland are achieved by integrating novel approaches in physical modelling, numerical modelling, and field data acquisition and processing. Information of current conditions in the studied subarctic rivers is gathered using conventional methods, such as flow velocity measurements, as well as emerging technologies including underwater drones. The study includes ice growth calculations under projected climate and flow conditions. Flume experiments in an indoor flume with proxy ice and bed topography and pressurised conditions are conducted to observe ice-covered hydraulics in a controlled environment. New methodologies and integration of different approaches allow for gathering more comprehensive information on seasonally freezing rivers and help in predicting future changes in response to climate change.

How to cite: Vaahtera, R., de Vet, M., Veijalainen, N., and Lotsari, E.: River ice under climate change: integrating modelling and data acquisition methods for detecting changes, EGU General Assembly 2026, Vienna, Austria, 3–8 May 2026, EGU26-19665, https://doi.org/10.5194/egusphere-egu26-19665, 2026.

Global warming has increased the amount of deadwood in forests due to wildfires, insect outbreaks, and droughts. Deadwood and fresh wood are mobilised by erosion into river systems as driftwood, forming the largest organic carbon sink due to its slow decomposition rate. Thus, event-based driftwood transport is crucial for disaster management and assessing carbon storage. Here, we applied YOLOv8 to detect driftwood using images from surveillance cameras and a drone. Three types of driftwood, i.e., instream, riverbank, and nearshore, were used from the database of Swiss, Arctic Data Center, and our own drone surveys to train the model of object detection and instance segmentation. To estimate the volume of driftwood, we compared the detected image areas with radio-frequency identification (RFID) tagged logs of known dimensions, establishing an area-to-volume conversion. Our models achieved an mAP50 of 0.96 for in-stream object detection. Applying this model to Typhoon Kong-rey in the Liwu River, we estimated an in-stream driftwood volume of 3.5×10⁵ m3, with a carbon stock of 8.24×10¹⁰ g C, representing 0.11% of Taiwan’s annual carbon export. Furthermore, we observed that driftwood flux increases nonlinearly with river discharge. Our analysis suggests that driftwood accumulation along the outer bends of the riverbank may lead to pulsed driftwood flux. These findings highlight the significance of event-scale driftwood transport as a quantifiable component of green carbon and demonstrate the feasibility of integrating deep learning-based detection with hydrological monitoring for carbon budget assessments.

Keywords: Driftwood flux, YOLOv8, RFID, drone, green carbon

How to cite: Kong, Q.-Y., Yang, C.-J., Tsai, C.-H., and Lee, M.-Y.: Integrating deep learning detection and hydrological monitoring for driftwood flux and carbon stock estimation in a steep tropical basin, EGU General Assembly 2026, Vienna, Austria, 3–8 May 2026, EGU26-4783, https://doi.org/10.5194/egusphere-egu26-4783, 2026.

EGU26-5265 | ECS | PICO | HS1.1.4

Autonomous Robotised Repeatable Soil Moisture Sampling 

Ilektra Tsimpidi, Fernando Labra Caso, Vidya Sumathy, Konstantinos Soulis, and George Nikolakopoulos

In this study, we present the continuation of the novel robotic mechanism introduced at the EGU General Assembly Conference 2025 (I. S. Tsimpidi, 2025) for autonomous soil moisture data collection. Soil moisture is vital for irrigation, flood and drought forecasting, and hydrological studies, yet shows strong spatial and temporal variability; therefore accurate measurements are required. We conduct field experiments to improve the fully autonomous robotized procedure with AgriOne, reducing sampling time and enhancing repeatability.
As the AgriOne robot, Figure 1, enables in situ, high-precision, spatially dense data collection across the field, we conducted additional field experiments to collect soil moisture data, both autonomously and manually. The AgriOne robot autonomously executes soil moisture data-collection missions, with sampling positions defined by georeferenced waypoints. The waypoints were generated in ArcGIS software using a grid creation tool, with the centre of each grid square as the selected position. The size of each grid cell was defined as 8m * 8m. In the sequel, these waypoints feed the robotic autonomous navigation system, which combines satellite positioning and motion sensors to continuously estimate the robot’s position and plan its trajectory and the sampling points, to meet the initially planned sampling protocol. For the robotic navigation, a hierarchical control architecture generates velocity commands to guide the robot to each target location with centimeter-level positioning accuracy. Upon reaching each waypoint, the system autonomously triggers a probing mechanism to collect and log soil moisture measurements before continuing to the next mission point. Manual data collection was performed by a human carrying a handheld TEROS 12 sensor connected to a Bluetooth sensor interface for instant readings in a mobile application. The positions for taking the measurement were selected using an empirical sampling method.

Figure 1: AgriOne robot with description of its components.

The first experiment was executed successfully in mid-July in a flat field with no vegetation cover, no precipitation, relative air humidity of 52%, air temperature of 20 °C and wind speed of 2 Bft. The autonomous data collection yielded data from 69 of the 73 waypoints where the robot stopped, and the manual data collection yielded data from 50 waypoints, both covering an area of 4.800m2. The second experiment was successfully conducted in mid-October in an area with low elevations and dense grass cover. On the experimental day, precipitation was absent; air temperature was 12°C, relative air humidity was 66% and wind speed was 1 Bft. In this experiment, AgriOne autonomously collected soil moisture data from 63 of the 72 waypoints where stopped, and from 41 waypoints we collected soil moisture data manually, covering an area of 4.700 m2. The results of the conducted experiments are presented on a satellite map of the tested areas, with proportioning the points based on the soil moisture values and are shown in Figure 2.

Figure 2:Presentation of the SM collected data autonomously and manually in both testing areas.

Tsimpidi, I. S. (2025). Large-scale Soil Moisture Monitoring: A New Approach. EGU General Assembly Conference Abstracts, pp. EGU25-1910.

How to cite: Tsimpidi, I., Labra Caso, F., Sumathy, V., Soulis, K., and Nikolakopoulos, G.: Autonomous Robotised Repeatable Soil Moisture Sampling, EGU General Assembly 2026, Vienna, Austria, 3–8 May 2026, EGU26-5265, https://doi.org/10.5194/egusphere-egu26-5265, 2026.

Planetary boundaries for many legacy and emerging contaminants are exceeded. Moving beyond the “safe operating space” for handling these pollutants means increased risks of tipping points which may irreversibly change the functioning of ecosystems and the services they provide, resulting in severe environmental and public health impacts.

In particular the monitoring and prediction of the strongly nonlinear behaviour of many contaminants, including pollution hotspots (locations) and hot moments (events) that disproportionally affecting catchment water quality when a significant proportion of the contaminant load is mobilised withing river catchments and transported to the river network and then further downstream, remains a significant challenge for state of the art water quality monitoring.

We here present the SMARTWATER environmental sensing platform, integrating sensor technology, network and data science innovations with and mathematical modelling with stakeholder catchment knowledge to we diagnose, understand, predict, and manage the emergence and evolution of water pollution hotspots and hot moments. We highlight how innovations in fluorescence and UV absorbance optical sensing technologies can be utilised for instance to track the drivers of extreme hypoxia events through urban and rural observatories and how the combination of easy to sense water quality proxies widely dispersed across the catchment can help optimising high-utility observational networks with regards to the placements of multi-sensor platforms as well as guiding their operation. Deploying data-science approaches including hysteresis and flushing indexes across a range of low- to higher monitoring locations revealed not only divergences in the sources and their mobilisation of different pollutant types (nutrients, DOM, metals) but also differences in their downstream evolution and spatial footprints through complex (and managed) river networks. Integrating information of the different behaviours of pollutants and functional markers such as tryptophan-like fluorescence and Chlorophyll a helped to identify pollutant specific activated source areas and mobilisation mechanisms, supporting also the development of automated event-triggered in-situ sampling solutions for analysis of emerging pollutants (including microplastics) and microbial analyses that are currently not possible to sense in-situ. Integrating this information highlights drastic differences in the contaminant specific emergence of pollution hotspots and hot moments including their large-scale footprint and longer-term relevance for catchment water pollution.

How to cite: Krause, S. and the SmartWater Team: Smart sensor networks for tracking the evolution of water pollution hotspots and hot moments through river networks, EGU General Assembly 2026, Vienna, Austria, 3–8 May 2026, EGU26-7650, https://doi.org/10.5194/egusphere-egu26-7650, 2026.

EGU26-7732 | ECS | PICO | HS1.1.4

Resolving Sequential Storm-Driven Pollutant Pulses using Novel Hydrochemical Measurements within a Reactivity-Hydrodynamic workflow. 

Chris Pesso, Ponnambalam Rameshwaran, Andrew J Wade, and Nick Everard

Within river deployments that combine Acoustic Doppler Current Profiler (ADCP) hydrodynamics with high-frequency water quality sensing now offer unprecedented detail regarding instream physical processes, chemical mixing, and nutrient transformations, but a key barrier is translating complex, high-volume datasets into process-based interpretations.  Here, we present the Reactivity Index – Hydrodynamic Index (RI - H) workflow, an approach that combines standard hydrodynamic and water-quality sensor data into diagnostic behavioural classes describing hydrochemical behaviours, demonstrated at the Kennet-Thames confluence (Reading, UK). 

The workflow was developed and tested using a remote-controlled moving-boat platform (ArcBoat) equipped with a SonTek M9 (ADCP) and a YSI EXO2 multiparameter sonde.  We collected simultaneous near-surface measurements of velocity, nutrients (NH₄⁺-N, NO₃⁻-N), fluorescent dissolved organic matter (fDOM), turbidity, and specific conductivity across a quasi-synoptic transect design (upstream controls, repeated cross-sections, and diagonal transects) on three days. The study reach was segregated into 14 spatial zones to monitor the chemical and physical changes from upstream end-members (of the Rivers Kennet and Thames), how the end-members interact and evolve downstream of the confluence, and the shift in chemical and physical behaviour under different hydrological conditions. 

RI and H were derived from solute concentrations and flow velocities. Plotting the two indices enabled each observation to be classified into one of five process-based behavioural categories (e.g., Retentive, Reactive, Low-energy depletion, Attenuating, and Conservative). Across three campaigns (including a rainfall-impacted survey), zonal contrasts in RI were consistently strong (Kruskal–Wallis ε² = 0.28–0.81; p < 0.0001), identifying zones with distinct behavioural signatures (nitrate reaction or ammonium retention zones). Extending the same logic to turbidity yielded complementary particulate-transport classes (Local Input, Advective Input, Sediment Deposition, Advective Dilution and Conservative mixing), demonstrating that the workflow was applicable for solutes and particulates. 

Our high-frequency transect sampling captured the hydrological and biogeochemical response to sequential rainfall events on 26 February 2025. Following morning rainfall, we identified a pollutant pulse characterised by elevated NH4+ and fDOM, indicative of sewage or wastewater influence in the River Kennet, which diluted progressively downstream. A late-afternoon high-intensity rain and hail event triggered a distinct second wave, marked by a sharp spike in nitrate NO3- and turbidity, characteristic of surface run-off. The rapid succession of these pulses reveals differing pollutant sources and pathways activated under varying rainfall intensities. Statistically strong spatial contrasts in reactivity persisted even during this dynamic event (Kruskal-Wallis ε² > 0.28 - 0.76 for all solutes). This outcome demonstrates the workflow can resolve within-event functional shifts, translating sensor data into a real-time diagnostic of a river's response to rainfall. The RI – H framework provides a standardised approach by enabling event-scale diagnosis of solute and sediment behaviour that cannot be resolved by fixed or point-based monitoring alone. By classifying how rivers transport and process materials in space and time using deployable sensors, the workflow offers a diagnostic, process-informed water quality assessments relevant to better understanding pollutant dispersal, chemical transformations and biota in fluvial systems. 

How to cite: Pesso, C., Rameshwaran, P., Wade, A. J., and Everard, N.: Resolving Sequential Storm-Driven Pollutant Pulses using Novel Hydrochemical Measurements within a Reactivity-Hydrodynamic workflow., EGU General Assembly 2026, Vienna, Austria, 3–8 May 2026, EGU26-7732, https://doi.org/10.5194/egusphere-egu26-7732, 2026.

EGU26-12962 | PICO | HS1.1.4

Calibration of oblique image-based monitoring systems using photogrammetric principles 

Hessel Winsemius, Hubert Samboko, Salvador Peña-Haro, Stephen Mather, and Hamish Biggs

Autonomous camera-based systems combined with image velocimetry analyses, enables operational river flow measurements in rapidly responding rivers. The open-source OpenRiverCam (ORC) software stack supports edge and cloud video processing, time-series generation, and rating-curve development, enabling fully operational, scalable non-contact water level and discharge estimation with relatively affordable camera systems.

Despite these advances, image calibration remains a major bottleneck for broad uptake, as it typically requires high-precision surveying of non-collinear ground control points to constrain the camera's pose. This process is often complex and relies on instruments that are not readily available to many users.

We investigate a photogrammetry-based alternative workflow for camera pose estimation for possible integration in ORC: during camera installation, users collect a set of smartphone photographs from multiple viewpoints near the camera location. A photogrammetric reconstruction using these photos together with a sample video from the installed camera, jointly estimates the camera pose and lens parameters. The resulting camera pose is then used to orthorectify videos in operational data collection. Using controlled experiments and field experiments in New Zealand, Zambia and The Netherlands, we assess here (i) the accuracy of reconstructed 3D coordinates compared to traditional calibration, (ii) methods to robustly constrain the horizontal plane, (iii) the number of photographs required, and (iv) the influence of GPS accuracy on the solution.

This approach aims to significantly simplify calibration workflows and lower the barrier to deploying camera-based river monitoring systems.


How to cite: Winsemius, H., Samboko, H., Peña-Haro, S., Mather, S., and Biggs, H.: Calibration of oblique image-based monitoring systems using photogrammetric principles, EGU General Assembly 2026, Vienna, Austria, 3–8 May 2026, EGU26-12962, https://doi.org/10.5194/egusphere-egu26-12962, 2026.

EGU26-13018 | PICO | HS1.1.4

Potential and limitation of Landsat, Sentinel-2 and Planet datasets in monitoring the intermittency regime of non-perennial rivers 

Maria Nicolina Papa, Carmela Cavallo, Lucio Iantorno, Isabelle Brichetto, Giammarco Manfreda, Giovanni Negro, and Paolo Vezza

One of the major difficulties in studying and protecting non-perennial rivers is the lack of knowledge about the occurrence of dry periods and their duration. Traditional flow measurement systems are not reliable in measuring zero or near-zero flows and do not provide any information on the presence of isolated ponds during periods of no flow. In this context, satellite observations can make a crucial contribution thanks to their global coverage and high observation frequency, especially if freely available data can be exploited. In the field of multispectral satellite data, the free datasets provided by Landsat (USGS/NASA) and Sentinel-2 (ESA) are particularly useful. Another dataset with interesting features is that of PlanetScope, but unfortunately this data is not free, although available on request for research purposes. In this study, we present an analysis of the potential and limitations of these three datasets in observing the intermittency regime of non-perennial rivers. The differences in their spatial, temporal and spectral resolution make them more or less suitable for monitoring specific rivers with given characteristics and observation requirements. It emerged that thanks to a long archive of observations (more than 40 years), Landsat is particularly useful for analyzing changes in the intermittent flow regime over time, enabling the detection of climatic trends over the standard climatological period of 30 years but due to coarse spatial resolution (30 m) it only allows observation of rivers with sufficiently wide active riverbeds (around 90 m or more). Thanks to the finer spatial resolution (10 or 20 m depending on the band), Sentinel-2 allows observation of water features greater than 6-15 m in rivers larger than approximately 30 m for an observation period that currently stands at 9 years. Thanks to the short revisit time of 5 days or less and the free availability of data, this dataset is particularly useful for continuous observations and obtaining the annual intermittency regime in a larger set of rivers of adequate size. PlanetScope provides data with spatial resolution of around 3 m and a revisit time up to 1 day. Although the spatial resolution is significantly higher than that of Sentinel-2, the ability to observe small water surfaces is not improved proportionally. In fact, we have found that this data allows for the observation of water features greater than 4-10 m in rivers larger than approximately 20 m. This is likely due to the different spectral characteristics of the acquired data. Another factor affecting performance is related to the acquisition time, which for Sentinel-2 is the same for all acquisitions of the same scene, while for PlanetScope images it is variable. This leads to inconsistency in the dataset, making it more challenging to identify water surfaces.

For all considered datasets, the “flowing,” “ponding,” and “dry” phases can be distinguished in a supervised manner using false-color images or automatically by exploiting the reflectance characteristics of water. The performances of both supervised and unsupervised classification are analyzed for different datasets and in various case studies.

How to cite: Papa, M. N., Cavallo, C., Iantorno, L., Brichetto, I., Manfreda, G., Negro, G., and Vezza, P.: Potential and limitation of Landsat, Sentinel-2 and Planet datasets in monitoring the intermittency regime of non-perennial rivers, EGU General Assembly 2026, Vienna, Austria, 3–8 May 2026, EGU26-13018, https://doi.org/10.5194/egusphere-egu26-13018, 2026.

EGU26-13052 | PICO | HS1.1.4

Velocity Hydrograph Routing to Enable Discharge Estimation at a Channel Section 

Muthiah Perumal and C. Madhusudana Rao

Recent developments in hydrometric practices enable the measurements of continuous maximum surface velocity of flow passing at a river section and the corresponding water level using a combined surface velocity and water level sensors installed across river bridges. These measurements enable continuous discharge estimation at these river section by employing the well-studied entropy methods. However, the cost of equipping these combined radars at many gauging stations of a river may be prohibitive. But the use of standalone water level radars at many stations may not be cost-wise prohibitive. Taking into consideration of this aspect, the current study proposes a novel method of routing the upstream estimated velocity hydrograph to a desired downstream station of a river reach, which is equipped with a water level sensor, and using the routed velocity hydrograph and the water levels measured at that station, one can estimate the corresponding discharge hydrograph. The proposed study establishes the equation governing the velocity hydrograph propagation in a channel reach which is of the same form as that of the weak-diffusive wave equations governing the discharge and flow depth hydrographs propagation. The derived velocity routing equation is of the same form as the Muskingum routing equation. The parameters of the routing method are estimated using the channel and velocity characteristics of the propagating velocity hydrograph. The proposed velocity routing method is tested by routing the hypothetical velocity hydrographs arrived at by routing a given hypothetical discharge hydrograph defined by Pearson Type-III mathematical function at the inlet of 25 uniform trapezoidal channel reaches each characterised by a unique combination of bed slope and Manning’s roughness characteristics. The benchmark solutions were arrived using the HEC-RAS model. The routed velocity hydrographs enable the close reproduction of the corresponding estimated benchmark velocity hydrographs and, thus, proving the appropriateness of the proposed velocity hydrograph routing method.  

How to cite: Perumal, M. and Rao, C. M.: Velocity Hydrograph Routing to Enable Discharge Estimation at a Channel Section, EGU General Assembly 2026, Vienna, Austria, 3–8 May 2026, EGU26-13052, https://doi.org/10.5194/egusphere-egu26-13052, 2026.

EGU26-13155 | ECS | PICO | HS1.1.4

Identifying River Plastic Hotspots from Space 

Ámbar Pérez-García, Graciela Amanda, José Fco. López, Marc Russwurm, and Tim H.M. van Emmerik

Rivers play a key role in the transport and retention of floating debris, including plastics. Reliable and scalable monitoring of riverine plastic accumulation is essential for identifying hotspots, understanding debris movement, and supporting mitigation strategies. However, conventional in situ monitoring approaches are often labor-intensive, spatially limited, and difficult to deploy consistently across large or remote river systems. This study presents a semi-automated, image-based monitoring framework that integrates satellite remote sensing and machine learning to detect and map riverine plastic accumulation hotspots at a global scale.

The methodology integrates high spatial resolution imagery for precise manual annotation of accumulation areas and multispectral Sentinel-2 data for classification of litter hotspots using Random Forests in Google Earth Engine. The workflow combines the most influential spectral bands with targeted spectral indices, including NDVI, PI, FDI, and SI13, to enhance class separability between plastic, water, and vegetation.

The methodology is evaluated across three highly polluted river systems in Indonesia, Guatemala, and Ghana. These sites represent a wide range of hydrological and environmental conditions, including floating vegetation, canopy shading, and narrow urban channels affected by pixel mixing. Results demonstrate high within-river classification performance, with overall accuracies up to 99.5% on independent sections of the same river, and robust cross-river generalization when spectral indices are incorporated, achieving plastic F1-scores up to 79%.

In addition to image classification, the workflow supports multi-temporal analysis to generate hotspot frequency maps, enabling the identification of persistent plastic accumulation zones linked to river morphology and infrastructure. Feature-importance analysis highlights the relevance of specific spectral bands and indices across different environmental conditions and supports the development of reduced, generalizable models.

To facilitate reproducibility and large-scale application, the methodology is operationalized in an open-access Google Earth Engine application that enables users to apply the trained model to rivers worldwide using Sentinel-2 imagery. The proposed framework contributes to the advancement of environmental monitoring and provides a foundation for future developments toward global, long-term assessment of river plastic dynamics.


More information: https://doi.org/10.1016/j.isci.2025.114570

How to cite: Pérez-García, Á., Amanda, G., López, J. Fco., Russwurm, M., and van Emmerik, T. H. M.: Identifying River Plastic Hotspots from Space, EGU General Assembly 2026, Vienna, Austria, 3–8 May 2026, EGU26-13155, https://doi.org/10.5194/egusphere-egu26-13155, 2026.

EGU26-15052 | ECS | PICO | HS1.1.4

Personal weather station rainfall data for semi-distributed flood modelling: Feasibility and limitations 

Ranka Kovačević, Alessandro Ceppi, Carlo De Michele, Roberto Nebuloni, and Andrijana Todorović

Accurate representation of the spatial and temporal variability of precipitation is a fundamental requirement for reliable flood modelling, especially if semi-distributed/fully-distributed models are used. However, official rain gauge networks often exhibit limited spatial coverage and low density, leading to substantial uncertainty in the representation of rainfall at the sub-basin scale. Recently, opportunistic precipitation observations derived from personal weather stations (PWS) have attracted increasing attention as a potential complementary data source, offering unprecedented spatial coverage. At the same time, PWS networks are characterized by heterogeneous data quality, inconsistent maintenance, frequent outages, incomplete records, and a dynamically changing network structure. Despite the attention that PWS have gained, their applicability in hydrological modelling, especially within semi-distributed modelling frameworks, has been explored in only a limited number of studies.

This study evaluates the feasibility of PWS rainfall data for semi-distributed hydrological flood modelling and outlines the conditions under which their application is appropriate. The Lambro catchment in northern Italy is used as a case study. PWS rainfall observations obtained from the Meteonetwork platform (https://www.meteonetwork.it/, Giazzi et al., 2022) and official rainfall data provided by the Lombardy Regional Environmental Protection Agency (ARPA) are used in this study. Different PWS-based rainfall datasets are created: namely, raw PWS data (PWSraw), quality-controlled PWS data (PWSqc), and data from persistent PWS stations, implying those PWS that were active over all considered storm events (PWSqc_p), and their combinations with the ARPA observations (denoted by ARPA + PWSraw, ARPA + PWSqc, ARPA + PWSqc_p, respectively).

Each set is compared to the ARPA rain gauge measurements, which are used a reference dataset. The evaluation is performed by comparing rainfall features at the point- and sub-basin scales, as well as through semi-distributed hydrological flood simulations by analyzing the impact of the rainfall input on simulated peak discharge and timing of its occurrence, and runoff volume at the basin outlet. The hydrological modelling with every rainfall dataset is performed by using the semi-distributed model developed by Politecnico di Milano (Cazzaniga et al., 2022).

The results demonstrate that quality-controlled and persistent PWS datasets (PWSqc and PWSqc_p), as well as their combination with ARPA observations, generally enhance hydrological model performance. This indicates that PWS data can provide added value for semi-distributed flood modelling when appropriately controlled and integrated with reference datasets from the official networks.


References

Cazzaniga, G., De Michele, C., D’Amico, M., Deidda, C., Antonio Ghezzi, A., and Nebuloni, R.: Hydrological response of a peri-urban catchment exploiting conventional and unconventional rainfall observations:  the case study of Lambro Catchment, Hydrology and Earth Sysem. Sciences, 26, 2093–2111, https://doi.org/10.5194/hess-26-2093-2022, 2022.

Giazzi, M., Peressutti, G., Cerri, L., Fumi, M., Riva, I. F., Chini, A., Ferrari, G., Cioni, G., Franch, G., Tartari, G., Galbiati, F., Condemi, V., and Ceppi, A.: Meteonetwork: An Open Crowdsourced Weather Data System, Atmosphere, 13, 928, https://doi.org/10.3390/atmos13060928, 2022.

https://www.arpalombardia.it/   


Acknowledgments

The authors would like to thank the COST Action “OpenSense” (CA20136) for supporting collaboration opportunities among the co-authors through the STSM program.

How to cite: Kovačević, R., Ceppi, A., De Michele, C., Nebuloni, R., and Todorović, A.: Personal weather station rainfall data for semi-distributed flood modelling: Feasibility and limitations, EGU General Assembly 2026, Vienna, Austria, 3–8 May 2026, EGU26-15052, https://doi.org/10.5194/egusphere-egu26-15052, 2026.

For years, the SATURO from METER Group has offered simple, fast, and precise field saturated hydraulic conductivity measurements. While this instrument excels at surface measurements, taking measurements at depth has been a challenge. Measurements at depth require digging a large hole, causing disturbance and compromising the readings. The new SATURO borehole attachment allows you to take readings at depths of up to 2 meters out of the box (additional depth possible with custom cable lengths). The measurement head is compact enough to go down a 4 inch (10 cm) borehole, significantly reducing disturbance, and allowing for more accurate readings in situ.  

The SATURO borehole attachment comes with everything that you need to prepare the site, and conduct the measurements, including the installation tools, and borehole auger. The attachment also works with the current SATURO control unit, if you have already purchased one. 

How to cite: Weldon, S.: A novel approach to automated field saturated hydraulic conductivity measurements at depth, EGU General Assembly 2026, Vienna, Austria, 3–8 May 2026, EGU26-15282, https://doi.org/10.5194/egusphere-egu26-15282, 2026.

EGU26-16174 | ECS | PICO | HS1.1.4

Rapid Sedimentation Impact Assessment of Ukai Reservoir using Geospatial methodology 

Nilima Ghosh Natoo, Prasun Kumar Gupta, and Bhaskar Ramchandra Nikam

The double whammy of increasing human water consumption and the effects of warming world is poised to further shrink large lakes, especially in arid and semi-arid regions. Further, reservoir sedimentation remains a critical challenge to global water security, causing a progressive loss in storage capacity and disrupting the ecological balance of downstream river systems. The motivation of the present study is based on the fact that at present reservoir managers are dependent upon expensive hydrographic surveys to locate the sedimentation impacted area, which cannot be conducted as and when required due to financial constraints. Further, the recent floods in the Indian state of Punjab (August 2025) were related to intense rainfall, sudden sediment inflow, resulting in drastic reduction in the storage capacity of the reservoirs.

This study presents a comprehensive geospatial framework on assessment of elevation-area-capacity relationships of Ukai reservoir. The method uses multi-temporal optical and SAR satellite imageries (Landsat-9, Sentinel-2 and Sentinel-1) and corresponding altimetry water level data to delineate the water spread areas (contours) at varying elevations. Two different time-periods (historical, 2008-2010 and 2021-2022) were compared to assess the change in contours. The results of sedimentation assessment clearly show an expansion in water boundary extent in recent years compared to that in the past decade. Additionally, the findings reveal that over the last decade Ukai reservoir’s live storage capacity has significantly declined by ~200 MCM, indicating ~20 MCM annual sedimentation rate. The spatial analysis distinctly maps the geographical areas of sediment accumulation or erosion and show that the sediment change is not uniform.

How to cite: Ghosh Natoo, N., Kumar Gupta, P., and Ramchandra Nikam, B.: Rapid Sedimentation Impact Assessment of Ukai Reservoir using Geospatial methodology, EGU General Assembly 2026, Vienna, Austria, 3–8 May 2026, EGU26-16174, https://doi.org/10.5194/egusphere-egu26-16174, 2026.

EGU26-16213 | ECS | PICO | HS1.1.4

Assessment of Optical and Near-Infrared Proximal Remote Sensing for Suspended Sediment Concentration Estimation under Artificial and Ambient Illumination 

Aung Chit Moe, Domenico Miglino, Ruodan Zhuang, Khim Cathleen Saddi, Lucrezia Viscido, Monton Methaprayun, Naw Shareen, Tanabadee Budrach, Punpim Puttaraksa Mapiam, Thom Bogaard, and Salvatore Manfreda

Proximal remote sensing represents an effective approach for water quality monitoring, enabling the estimation of turbidity and suspended sediment concentration (SSC) through spectral indices, such as red–green band ratios. Low-cost RGB cameras are widely adopted for this purpose, however, their measurements are strongly affected by variations in illumination, shadows, surface glint, and ambient environmental conditions, which can compromise data consistency and reliability. Extending the spectral coverage into the near-infrared (NIR) domain has the potential to enhance sensitivity to suspended sediments and reduce the influence of variable lighting conditions. Although hyperspectral sensors remain costly and impractical for routine monitoring, the analysis of hyperspectral data provides valuable insights into the most informative wavelengths and supports the targeted integration of RGB imagery with selected NIR bands for future field applications.

In this laboratory study, proximal hyperspectral sensing was employed to investigate SSC under both artificial and ambient illumination conditions, using two sediment types with contrasting optical properties (yellowish soil and white China clay). The experiments assess the influence of illumination conditions and sediment characteristics on spectral signatures, and compare the performance of reflectance information derived from the RGB and NIR spectral ranges. The results offer initial insights into sediment–reflectance interactions and contribute to the development of more robust and cost-effective proximal remote sensing strategies for water quality monitoring in real-world environments.


Keywords: Proximal remote sensing; hyperspectral data; suspended sediment concentration; laboratory experiments

How to cite: Moe, A. C., Miglino, D., Zhuang, R., Saddi, K. C., Viscido, L., Methaprayun, M., Shareen, N., Budrach, T., Mapiam, P. P., Bogaard, T., and Manfreda, S.: Assessment of Optical and Near-Infrared Proximal Remote Sensing for Suspended Sediment Concentration Estimation under Artificial and Ambient Illumination, EGU General Assembly 2026, Vienna, Austria, 3–8 May 2026, EGU26-16213, https://doi.org/10.5194/egusphere-egu26-16213, 2026.

EGU26-19490 | PICO | HS1.1.4

Towards a Low-Cost River Monitoring Setup 

Salvador Peña-Haro, Hubert T. Samboko, and Hessel C. Winsemius

Deployment and upscale of traditional monitoring systems have different challenges, specially in developing countries, because of high investment costs, difficult operation and maintenance. In the last years there have been several low-cost, open-source products developed as well as initiatives with the objective of tackling down those issues.

Herein we present the setup and first leanings of the project L-DaaS “Local people for Discharge monitoring as a Service” where we proposed a scheme of using an open-source software for flow monitoring and a low-cost hardware which use standard components with a business model centred around a local enterprise in charge of the operation and maintenance. The project was executed in Zambia with a locally-driven environmental monitoring company based in the same country. Key stakeholders where the Water Resource Management Authority of Zambia and hydropower operators.

Open-source and low-cost system are not by themselves a solution, it is also needed to create a sustainable and scalable business model which fosters affordable, efficient, and locally supported water management solutions.

How to cite: Peña-Haro, S., Samboko, H. T., and Winsemius, H. C.: Towards a Low-Cost River Monitoring Setup, EGU General Assembly 2026, Vienna, Austria, 3–8 May 2026, EGU26-19490, https://doi.org/10.5194/egusphere-egu26-19490, 2026.

EGU26-19511 | ECS | PICO | HS1.1.4

AI-Driven Photogrammetric Workflow for Low-Cost Wadi Monitoring 

Robert Krüger, Pedro Zamboni, Jens Grundmann, Ghazi Al-Rawas, and Anette Eltner

Arid regions such as Oman are increasingly susceptible to severe flash floods driven by climate change and rapid urbanization. Accurate water level measurements are vital for flood preparedness and the development of early warning systems required to mitigate severe socio-economic impacts, including substantial property damage and the recurring loss of life. Beyond disaster mitigation, recording runoff is essential for sustainable water management and for enhancing the understanding of hydrological processes in small-scale, ephemeral catchments that remain largely ungauged. However, traditional water level monitoring via pressure gauges or radar sensors is often hindered by high infrastructure costs, physical vulnerability to high-flow events, and the changing morphology of wadi channels. To address these limitations, we present a robust photogrammetric workflow integrated into a low-cost, Raspberry Pi-based optical monitoring system for measuring water level, surface velocities and discharge assessment.

The workflow relies on the synergy between a single fixed low-cost camera and high-resolution Digital Terrain Models (DTMs) generated through UAV-based Structure-from-Motion (SfM-MVS). To convert 2D image measurements into 3D object space, both the camera and the DTM must be referenced in a shared coordinate system. Traditionally, this is established using permanent Ground Control Points (GCPs) measured with RTK GNSS; however, establishing and maintaining such markers in adverse wadi conditions is logistically challenging and the physical markers are prone to being lost during flood events. We address this by employing the GIRAFFE (Geospatial Image Registration And reFErencing) workflow. This approach replaces physical markers by performing an image-to-geometry registration that aligns the real 2D camera view with a synthetic image rendered from the UAV-based 3D pointcloud. Using the AI-based LightGlue matching algorithm, the system automatically identifies homologous points between the views to create 2D–3D correspondences. These correspondences function as pseudo-control points, allowing for the precise determination of the camera’s 3D pose and orientation via spatial resection.

For the hydrological monitoring, the workflow further employs two AI-driven stages:

Water Level Estimation: Convolutional Neural Networks (CNNs) segment the water area in time-lapse images. The resulting waterlines are projected into 3D space and intersected with the DTM to derive accurate water levels.

Discharge Assessment: Surface flow velocities are measured using the PIPs++ (Persistent Independent Particle tracker) technique. Unlike traditional frame-by-frame methods, PIPs++ tracks particles across multiple time steps jointly, providing enhanced temporal smoothness and robustness against illumination changes or partial occlusions. Based on these surface velocities, the mean velocity is determined and combined with the wetted cross-section from the DTM to estimate total discharge.

Initial results from deployments in Wadi Al-Hawasinah, Oman, demonstrate that this solar-powered, remote system successfully captures ephemeral flow events. By leveraging GIRAFFE for automated localization and PIPs++ for robust surface velocity estimation, this workflow provides a scalable and cost-effective solution for enhancing flood early warning systems in complex, ungauged terrains.

How to cite: Krüger, R., Zamboni, P., Grundmann, J., Al-Rawas, G., and Eltner, A.: AI-Driven Photogrammetric Workflow for Low-Cost Wadi Monitoring, EGU General Assembly 2026, Vienna, Austria, 3–8 May 2026, EGU26-19511, https://doi.org/10.5194/egusphere-egu26-19511, 2026.

EGU26-21112 | ECS | PICO | HS1.1.4

Understanding Pumping Dynamics in Granitic Hard Rock Aquifers Using Integrated Flow Metering and Camera-Based Monitoring 

Lakshmikantha N r, Aditya Vikram Jain, Ananya Jain, Karan Misquitta, Vivek Grewal, and Veena Srinivasan

Granitic hard rock aquifers dominate much of semi-arid peninsular India and are characterized by highly heterogeneous, fracture-controlled flow systems with limited storage. In these settings, conventional indicators such as static water levels and standard well drawdown equations provide poor insight into actual aquifer stress and pumping sustainability. This study presents an integrated hydrological monitoring approach that combines flow meters, borewell camera scans, and continuous camera-based observations to directly understand aquifer behaviour under pumping. We deploy non-invasive flow measurement to quantify real-time abstraction, alongside step-drawdown tests and downhole camera surveys to identify active fracture zones, their depth-wise contribution to yield, and their dynamic response during sustained pumping. Continuous camera scans during pumping cycles enable direct visualization of drawdown, fracture inflows, and the rapid transition from borehole storage to fracture-limited supply, revealing why prolonged pumping from deeper depths often leads to high energy use with marginal water gains. By linking pumping rates, energy consumption, and observed subsurface flow processes, the study demonstrates how mismatches between pump capacity and fracture-controlled yields drive inefficiency and accelerated aquifer stress. The results highlight the value of image-based and sensor-driven monitoring for developing context-specific indicators of groundwater stress and for identifying optimal pumping regimes in hard rock aquifers. This integrated methodology offers a scalable pathway to improve hydrological understanding, support adaptive groundwater management, and inform incentive-based interventions aimed at conserving both water and energy in data-scarce, remote settings.

How to cite: N r, L., Vikram Jain, A., Jain, A., Misquitta, K., Grewal, V., and Srinivasan, V.: Understanding Pumping Dynamics in Granitic Hard Rock Aquifers Using Integrated Flow Metering and Camera-Based Monitoring, EGU General Assembly 2026, Vienna, Austria, 3–8 May 2026, EGU26-21112, https://doi.org/10.5194/egusphere-egu26-21112, 2026.

EGU26-23288 | PICO | HS1.1.4 | Highlight

Opportunistic Sensing of Precipitation and Evaporation Using Microwave Links From Cellular Communication Networks 

Remko Uijlenhoet,  Bas Walraven, Luuk van der Valk, Miriam Coenders, Rolf Hut, Aart Overeem, and Oscar Hartogensis

Precipitation and evaporation are the two fluxes coupling the atmospheric and terrestrial compartments of the hydrologic cycle. Accurate and robust observations of the spatial and temporal variability of these two fluxes over the Earth’s continents is crucial to help understand the intricacies of land surface – atmosphere interactions. Improving our understanding and our ability to quantify these interactions is not only important for scientific purposes (such as developing better earth system models) but also for societally relevant applications (such as flood and drought forecasting). Here, we demonstrate the potential and address the limitations of microwave links from cellular communication networks for estimating both precipitation and evaporation.

Previous research has shown that attenuation of microwave signals propagating through rainfall from the transmitting to the receiving antennas of microwave links can be related to the average rainfall intensity along the path between transmitter and receiver. Over the past two decades, this notion has been successfully applied to retrieve rainfall fields from existing microwave links which are part of cellular communication networks. Rain-induced signal loss due to absorption and scattering of microwave signals by raindrops, a source of “noise” for mobile network operators, has turned out to be a “signal” for hydrometeorological science and applications. The approach of using existing cellular communication infrastructure for environmental monitoring (in this case rainfall measurement) has been dubbed “opportunistic sensing”.

However, atmospheric constituents between the transmitters and receivers of microwave links do not only affect signal propagation when it rains. When it is dry, refractive index fluctuations induced by temperature and water vapor variations resulting from rising turbulent eddies in the atmospheric boundary layer between transmitters and receivers cause received signals to “scintillate”. The variance of these scintillations has been shown to be related to the structure parameter of the refractive index, which in turn can be related to sensible and latent heat fluxes across the microwave link path using Monin-Obukhov Similarity Theory (and the aid of auxiliary information). This principle is used by microwave scintillometers, commercially available instruments for observing turbulent fluxes in the atmospheric boundary layer.

Recent research results show that microwave links from cellular communication networks can, under certain conditions, also be employed as boundary layer scintillometers. Combining this notion with the previous finding that such microwave links can also be used as path-average rain gauges suggests that there is potential to use each of the roughly five million backhaul links from cellular communication networks worldwide as combined precipitation-evaporation sensors. Hence, gaining access to received signal level data from this enormous number of microwave links would allow large-scale rainfall and evaporation mapping, also for regions across the globe which are currently poorly served in terms of dedicated meteorological stations.

We present both the physical basis of this approach and empirical results from previous and ongoing measurement campaigns to discuss the potential and challenges of opportunistic sensing of two hydrologic fluxes with one single instrument: precipitation and evaporation.

How to cite: Uijlenhoet, R., Walraven,  ., van der Valk, L., Coenders, M., Hut, R., Overeem, A., and Hartogensis, O.: Opportunistic Sensing of Precipitation and Evaporation Using Microwave Links From Cellular Communication Networks, EGU General Assembly 2026, Vienna, Austria, 3–8 May 2026, EGU26-23288, https://doi.org/10.5194/egusphere-egu26-23288, 2026.

HS1.2 – Cross-cutting hydrological sessions

EGU26-1851 | ECS | Orals | HS1.2.2

Parameter estimation, uncertainty analysis and data worth assessment of soil water and heat transport models using an Iterative Ensemble Smoother 

Antoine Di Ciacca, Hugo Delottier, Marie Coudène, Tom Narth, Landon Halloran, Géraldine Bullinger, and Philip Brunner

Mechanistic soil water and heat transport models are important tools for quantifying and predicting exchange fluxes between the atmosphere, vegetation, soils, and aquifers. For instance, these models are essential for assessing how soils help mitigate flood and heatwave risks, particularly in urban environments. Mechanistic soil water and heat transport models rely on parameters characterising the soils' hydraulic and thermal properties. The estimation of these parameters through inverse modelling and the quantification of associated uncertainties is challenging due to the non-linear nature of the processes and computational demands of the simulations. However, recent advances in inverse modelling algorithms such as Iterative Ensemble Smoothers (IES) allow us to handle highly parameterised, non-linear models while keeping the number of model runs relatively small (~1000).  These advances not only keep the computational demand for inverse modelling and parameter estimation tractable, but in addition allow for the quantitative assessment of data worth of available or planned observations, which can be used to increase the efficiency of experimental designs. In this work, we tested a Levenberg-Marquardt form of IES, a relatively novel method increasingly used in reservoir and groundwater modelling, with a mechanistic soil water and heat transport model. We firstly generated reference values of soil moisture, temperature and fluxes using three synthetic models representing different characteristic soil profiles with contrasting parameter values. We simulated a calibration period representing our planned field experiments, consisting of two infiltration tests with warm and cold water, and a prediction period including a heat wave and an extreme rainfall event. Secondly, we used the IES algorithm to history-match the model-generated “observations” of soil moisture and temperature at six depths for the calibration period. We finally evaluated the algorithm's ability to estimate the reference parameters, as well as predict soil moisture, temperature, and fluxes. The results show that the posterior distributions obtained with the IES algorithm are consistent with the reference values for all parameters and predictions considered. Furthermore, the relatively small number of runs required (< 10,000) allowed us to perform parameter estimation and uncertainty quantification across different experimental scenarios, thereby quantifying their data worth and optimising our experimental design. The synthetic approaches formed the basis for simulating water and heat transport in three real-world urban soils and assessing the worth of temperature measurements in tracing water and heat fluxes. IES algorithms have strong potential to become standard tools for vadose zone modelling, and the insights gained from our study offer a solid foundation for their effective application.

How to cite: Di Ciacca, A., Delottier, H., Coudène, M., Narth, T., Halloran, L., Bullinger, G., and Brunner, P.: Parameter estimation, uncertainty analysis and data worth assessment of soil water and heat transport models using an Iterative Ensemble Smoother, EGU General Assembly 2026, Vienna, Austria, 3–8 May 2026, EGU26-1851, https://doi.org/10.5194/egusphere-egu26-1851, 2026.

Two-dimensional (2D) hydraulic models are essential tools for flood hazard assessment, yet their calibration remains computationally demanding and strongly constrained by data availability. This study presents a Bayesian calibration framework that integrates a convolutional neural network (CNN) surrogate model to efficiently infer spatially distributed Manning’s roughness coefficients while explicitly accounting for model structural uncertainty.

The approach is applied to a reach of the Lower Piura River (Peru), a flood-prone basin characterized by limited in situ observations. An ensemble of TELEMAC-2D simulations is generated using Latin Hypercube Sampling over multiple roughness configurations, and a CNN is trained to emulate spatial water depth fields with high fidelity. To focus learning on hydraulically relevant regions, a weighted loss function based on roughness–depth sensitivity is employed.

The trained emulator is embedded within a Bayesian inference scheme that incorporates a Gaussian Process discrepancy term to represent systematic model–reality deviations. Posterior distributions of Manning’s coefficients and uncertainty parameters are estimated using Markov Chain Monte Carlo sampling. Synthetic experiments demonstrate accurate parameter recovery in hydraulically sensitive areas, while a real-case application based on optical satellite imagery confirms the method’s ability to reproduce observed flood depth patterns under data scarcity.

The proposed framework significantly reduces computational cost compared to conventional calibration approaches and provides a probabilistic characterization of parameter uncertainty. These results highlight the potential of CNN-based surrogate models as scalable tools for Bayesian inference in large-scale hydraulic modeling and flood risk assessment.

How to cite: Zevallos Ruiz, J. A.: Bayesian calibration of a 2D hydraulic model using a CNN-based surrogate emulator under data-scarce conditions, EGU General Assembly 2026, Vienna, Austria, 3–8 May 2026, EGU26-1947, https://doi.org/10.5194/egusphere-egu26-1947, 2026.

EGU26-3076 | ECS | Posters on site | HS1.2.2

Efficient Uncertainty Quantification for Physics-Aware Machine Learning of Diffusion-Sorption Models 

Stefania Scheurer, Riccardo Frenner, Tim Brünnette, Sergey Oladyshkin, and Wolfgang Nowak

The Finite‑Volume Neural Network (FINN) merges the rigor of classical numerical discretizations with the flexibility of artificial neural networks (ANNs) to uncover unknown terms or parameters in partially unknown partial differential equations (PDEs). While this hybrid framework enhances flexibility and interpretability, the highly parameterized ANN makes uncertainty quantification (UQ) of the identified PDE components both demanding and computationally expensive, especially when conventional Bayesian approaches rely on costly Markov Chain Monte Carlo sampling. To address this, we introduce a computationally efficient, Machine Learning (ML)‑assisted inference‑with‑UQ scheme that yields confidence intervals for the PDE components learned by FINN. The procedure consists of data‑driven bootstrapping of the available observations and repeated training of FINN on each resampled set. We illustrate the method on the retardation factor of a diffusion‑sorption PDE, showing that it produces trustworthy interval estimates while markedly lowering the computational burden.

How to cite: Scheurer, S., Frenner, R., Brünnette, T., Oladyshkin, S., and Nowak, W.: Efficient Uncertainty Quantification for Physics-Aware Machine Learning of Diffusion-Sorption Models, EGU General Assembly 2026, Vienna, Austria, 3–8 May 2026, EGU26-3076, https://doi.org/10.5194/egusphere-egu26-3076, 2026.

It is unrealistic to build independent alternative models to constitute the model space of Bayesian model aver­ aging (BMA) in groundwater/surface water modeling. Using uniform prior weights can lead to overweighting models with similar structures, as well as biased posterior model weights and BMA predictions. This study applied a correlation matrix R to measure the correlations among alternative models. And two weighting schemes based on R, namely the cos-square (CS) and capped eigenvalue (CE), were used to dilute models’ prior weights. Additionally, the effective model number (Neff) metric derived from R was proposed to measure the effectiveness of BMA model set. Based on two real-world cases (snowmelt runoff modeling and groundwater modeling), and a synthetical groundwater case, we validated the importance of prior weight dilution and the important value of the R-based methods in improving BMA prediction. The results demonstrated that the prior weight dilution schemes redistribute models’ prior weights by penalizing highly correlated models while rewarding those with relatively independent structures. The BMA predictive performance is improved using the weight dilution schemes, with the CS scheme outperforming the CE scheme. In addition, the correlation matrix provides insight into the rationality of the model structures in the BMA model set. The metric of Neff can serve as an effective tool for quantifying the effectiveness of the model set, which provides an important reference for updating the model set and improving BMA predictions with prior weight dilution schemes.

How to cite: Haoxin, H.: Prior weight dilution in Bayesian model averaging for groundwater modeling, EGU General Assembly 2026, Vienna, Austria, 3–8 May 2026, EGU26-3699, https://doi.org/10.5194/egusphere-egu26-3699, 2026.

EGU26-4054 | ECS | Orals | HS1.2.2

Extended peer community finds limited epistemic justification for key assumptions in global irrigation models 

Seth N. Linga, Carmen Aguiló-Rivera, Olivia Richards, Samuel Flinders, Joshua Larsen, Michela Massimi, Giovanni De Grandis, and Arnald Puy

Estimates of irrigation water withdrawals (IWW) by global irrigation models (GIM) depend on assumptions about which features (irrigated lands, crop types, schedules and water sources) are represented and how they are formalised. While uncertainty and sensitivity analyses (UA/SA) routinely interrogate parameter uncertainty, many assumptions are qualitative or pragmatic, resist numerical characterisation and thus lie beyond conventional quantitative approaches.

We addressed this gap by subjecting 100 irrigation modelling assumptions, drawn from c. 50 papers, to an expert elicitation process involving eleven scientists and five irrigators. Experts were asked to rank the assumptions in terms of influence and then assess the first ten based on their situational limitations, plausibility, choice space, peer agreement and influence on model outputs.

Scientists identified irrigated area, irrigation efficiency and water availability, often represented by single datasets, as primary drivers of global IWW estimates. Both scientists and irrigators judged these assumptions to be highly influential with weak pedigree (quality of the knowledge base), exhibiting limited empirical support, derivation under practical constraints, multiple plausible alternatives, and low peer agreement, and thus placing them in the NUSAP "danger zone". 

By linking assumption influence with epistemic strength, this study extends conventional UA/SA, demonstrating that extended peer engagement can reveal overlooked uncertainties, enhance transparency and strengthen the robustness of global IWW assessments under deep uncertainty.

How to cite: Linga, S. N., Aguiló-Rivera, C., Richards, O., Flinders, S., Larsen, J., Massimi, M., De Grandis, G., and Puy, A.: Extended peer community finds limited epistemic justification for key assumptions in global irrigation models, EGU General Assembly 2026, Vienna, Austria, 3–8 May 2026, EGU26-4054, https://doi.org/10.5194/egusphere-egu26-4054, 2026.

EGU26-4306 | ECS | Posters on site | HS1.2.2

Utilizing Linear Uncertainty Analysis for Potential Observation Well Locations in the Pwales Aquifer, Malta 

Mert Çetin Ekiz, Maria Clementina Caputo, Lorenzo De Carlo, Antonietta Celeste Turturro, Manuel Sapiano, Luke Galea, and Michael Schembri

In coastal aquifers, a main objective of groundwater management is often to determine sustainable pumping rates that avoid seawater intrusion and well salinization. Models can be used to understand and forecast the behavior of such aquifers. A necessary step for modeling is calibration, and such a process contains uncertainty. Understanding how uncertainties affect water management is crucial for providing water utilities with the necessary information about well salinization risk. Uncertainty in the model can be reduced by new observation types and locations. One of the most common observation types is groundwater head observation in an observation well. However, the number of observation wells is limited by constraints, such as budget. A FOSM approach was chosen for data worth analysis considering parameter and observation uncertainty. It was implemented in a real-world island aquifer in the Pwales CA (Malta). The flow model was developed using MODFLOW6, and Linear Uncertainty analysis was done via PEST. FOSM was conducted, aiming to find optimum groundwater head observation locations to reduce forecast uncertainty. The workflow used scripts for reproductibility and it adapted to high-dimensional model.

How to cite: Ekiz, M. Ç., Caputo, M. C., De Carlo, L., Turturro, A. C., Sapiano, M., Galea, L., and Schembri, M.: Utilizing Linear Uncertainty Analysis for Potential Observation Well Locations in the Pwales Aquifer, Malta, EGU General Assembly 2026, Vienna, Austria, 3–8 May 2026, EGU26-4306, https://doi.org/10.5194/egusphere-egu26-4306, 2026.

EGU26-5697 | ECS | Posters on site | HS1.2.2

Adding geological knowledge in transport models to improve their predictive capacity for risk mitigation in heterogeneous aquifers 

Zoé Petitjean, Alexandre Pryet, Olivier Atteia, Marc Kham, Mathieu Couplet, Raphaël Lamouroux, and Frédéric Lalbat

Connected, highly permeable subsurface features act as preferential flow paths and strongly influence solute transport. Transport models are frequently used for risk assessment and mitigation and should properly account for these connected structures to provide unbiased and informative predictions.

The parameterization of hydraulic properties typically relies on multi-Gaussian distributions and poorly integrate geological knowledge in the prior. They allow for a flexible and efficient data assimilation of process variables (heads, concentrations), but may lead to unrealistic geology and insufficient description of connectivity. Alternatively, detailed descriptions of heterogeneities can be obtained with advanced geostatistical methods, such as multiple-point statistics. They account for geological knowledge and can be conditioned to geological or geophysical data. Unfortunately, they are hardly compatible with a data assimilation process and therefore usually fail to match observed data.

To address this issue, we compared several approaches capable of integrating both geological knowledge and observation data. We employed different parameterization strategies by using pilot points (de Marsily, 1978), adopting a facies-like representation of the subsurface with truncated pluri-Gaussian simulations (Matheron et al., 1987), or inserting structures whose positions can be adjusted during parameter estimation (Khambhammettu et al., 2020). We also implemented data space inversion (Delottier et al, 2023), which bypasses parameter estimation and focuses on the link between observations and forecasts.

The approaches are tested with a transport model considering a contaminant migration scenario in a synthetic alluvial aquifer with permeable channels. The predictions of interest are the mass flow, peak time, and total mass of contaminant reaching the river. Results show that there is a compromise to find between a simple but effective parameterization, which can struggle to represent connectivity, and a more detailed one, which is more difficult to make consistent with observations.

How to cite: Petitjean, Z., Pryet, A., Atteia, O., Kham, M., Couplet, M., Lamouroux, R., and Lalbat, F.: Adding geological knowledge in transport models to improve their predictive capacity for risk mitigation in heterogeneous aquifers, EGU General Assembly 2026, Vienna, Austria, 3–8 May 2026, EGU26-5697, https://doi.org/10.5194/egusphere-egu26-5697, 2026.

EGU26-5846 | ECS | Orals | HS1.2.2

Entropy-Based Quantification of Infiltration Model-Form Uncertainty 

Zhonghao Zhang and Caterina Valeo

Infiltration is a quantitative expression of water loss in the urban hydrological cycle, but current hydrological models often use empirical or semi-empirical equations. The inherent uncertainties in these equations (often simplifying boundary conditions or water content expression) are not accurately conveyed to end users via hydrological models. As well, these empirical equations introduce model-form uncertainty that is often ignored before model calibration. This research focuses on analyzing the uncertainty in the infiltration process by constructing a quantitative framework based on uncertainty propagation from a true, physical model (Richards Equation) to conceptually simpler models (Green-Ampt and Horton’s model) that uses entropy to track the uncertainty’s magnitude change. Firstly, we conducted sensitivity analyses using various designed rainfalls (time series as well as IDF curve) in a watershed over varying spatial-temporal scales to isolate the uncertainty propagation in the infiltration equations arising from different spatial-temporal scales. This uncertainty propagation framework for infiltration answers the question of how changes in the structural assumptions of the infiltration equation affect peak flowrate errors or volume estimation errors. It adopts entropy as a quantitative index to describe the amount of information loss in the infiltration process, as well as how the uncertainty propagates over time and space. Furthermore, this entropy uncertainty framework can help in decision making related to when a more physically-based approach must be used, or when a simplified equation is still acceptable.

How to cite: Zhang, Z. and Valeo, C.: Entropy-Based Quantification of Infiltration Model-Form Uncertainty, EGU General Assembly 2026, Vienna, Austria, 3–8 May 2026, EGU26-5846, https://doi.org/10.5194/egusphere-egu26-5846, 2026.

EGU26-7856 | Posters on site | HS1.2.2

Reducing parameter uncertainty in hydrological modeling using MODIS-derived constraints 

Mariaines Di Dato, Maria Grazia Zanoni, Diego Avesani, Filippo Di Marco, and Alberto Bellin

Hydrological models are a fundamental tool for supporting water resources management; yet, model predictions are often affected by high uncertainty. Among the other sources of uncertainty, snow-dominated catchments must also cope with modeling the snow accumulation and melting processes. Snow controls discharge by storing winter precipitation and releasing it during melt periods, thereby regulating the timing and magnitude of the streamflow. 

A widely used approach for representing snow processes is the degree-day model, which estimates snow accumulation and melt based on air temperature thresholds and a melting factor. Due to the scarcity of in situ snow observations, the degree-day parameters are commonly inferred by calibrating the discharge within a hydrological model, thereby exacerbating parameter equifinality.

In this study, we quantify the impact of constraining degree-day model parameters with MODIS, a multispectral satellite sensor that provides near-daily global observations of snow cover extent. The constrained calibration framework results in an overall improvement in discharge performance and a significant reduction in parameter uncertainty, including for the non-snow-related parameters of the other model. These results underscore the importance of integrating satellite-based snow information to mitigate equifinality and enhance the robustness of hydrological modeling in alpine environments.

How to cite: Di Dato, M., Zanoni, M. G., Avesani, D., Di Marco, F., and Bellin, A.: Reducing parameter uncertainty in hydrological modeling using MODIS-derived constraints, EGU General Assembly 2026, Vienna, Austria, 3–8 May 2026, EGU26-7856, https://doi.org/10.5194/egusphere-egu26-7856, 2026.

EGU26-8668 | ECS | Orals | HS1.2.2

A Predictive Environmental Modelling Framework for Decision Support:Monthly Municipal-Level Forecasting of Nuisance Insect Outbreak Risk in Seoul, South Korea 

Joo Ho Lee, Dae Hee Cho, Dong Gun Kim, June Wee, Sang Chul Lee, and Jung A Lee

Climate change and rapid urbanization are reshaping insect phenology and spatial occurrence patterns, leading to increasingly frequent nuisance insect outbreaks in urban environments. In dense metropolitan areas, sudden mass emergence of nuisance insects-such as mayflies, red-backed lovebugs, and non-biting midges-can cause sanitation concerns, disruption of urban infrastructure, and surges in public complaints, placing growing pressure on local environmental management. Despite these challenges, most current management practices remain reactive, relying on complaint-driven responses after outbreaks occur, which limits timely and efficient allocation of monitoring and management resources.

This study presents a predictive environmental modelling framework designed to support municipal decision-making by forecasting monthly nuisance insect outbreak risk at the district (gu) level in Seoul, South Korea. Rather than pursuing nationwide prediction, the study focuses on a single metropolitan system where environmental heterogeneity, administrative demand, and operational feasibility are closely aligned. By fixing the spatial analysis unit at the municipal district level, the framework delivers risk information directly compatible with urban monitoring plans, prioritization of management efforts, and allocation of limited resources.

A GIS-based spatial database was constructed by integrating nuisance insect occurrence history derived from citizen-science platforms and open biodiversity databases, monthly climate variables (mean temperature and cumulative precipitation), and district-level land cover composition. Occurrence records were subjected to quality control procedures, including coordinate validation and spatial de-duplication, and aggregated into monthly district-level counts as a proxy for outbreak intensity. Climate predictors were selected for interpretability and relevance to insect life cycles, while land cover metrics emphasized water and wetland areas, green spaces, and urbanized land.

To characterize baseline spatial tendencies, species distribution modelling was applied to derive habitat suitability indices for each target taxon. These indices were incorporated as auxiliary predictors to support interpretation of spatial risk patterns rather than serving as standalone forecasts. A predictive model integrating climate variables, land cover composition, occurrence history, and habitat suitability indices was then developed to estimate one-month-ahead outbreak risk scores for each district. Continuous risk scores were translated into ordinal risk classes using objective threshold rules to facilitate interpretation and identification of priority districts.

The predicted results indicate clear seasonal and spatial heterogeneity in outbreak risk across Seoul. Elevated risk tends to concentrate within specific seasonal windows, while district-level patterns vary according to local environmental conditions. Species-specific differences suggest that the relative importance of spatial drivers differs among taxa, with some showing stronger associations with water-related land cover and others responding more strongly to urban–green space configurations.

By delivering interpretable, one-month-ahead risk information at an administrative scale, the proposed framework provides a practical basis for shifting nuisance insect management from reactive responses toward anticipatory, risk-informed planning. The workflow is implemented as a reproducible, GIS-based pipeline that can be updated as new climate or occurrence data become available, demonstrating how predictive environmental modelling can function as an operational decision-support tool for urban environmental management under increasing climate and ecological uncertainty.

This research was supported by the Basic Science Research Program through the National Research Foundation of Korea (NRF), funded by the Ministry of Education (RS-2021-NR060142).

How to cite: Lee, J. H., Cho, D. H., Kim, D. G., Wee, J., Lee, S. C., and Lee, J. A.: A Predictive Environmental Modelling Framework for Decision Support:Monthly Municipal-Level Forecasting of Nuisance Insect Outbreak Risk in Seoul, South Korea, EGU General Assembly 2026, Vienna, Austria, 3–8 May 2026, EGU26-8668, https://doi.org/10.5194/egusphere-egu26-8668, 2026.

EGU26-8930 | ECS | Posters on site | HS1.2.2

Watershed modeling considering parameter uncertainty to evaluate future physical water risks 

Miyu Kajita, Mariko Saito, Yasuhiro Tawara, Shun Kurihara, and Hidenori Okamoto

For beverage manufacturers that utilize local water resources, it is crucial to understand future physical water risks caused by climate change to ensure business continuity and appropriate disclosure to investors, customers, and other stakeholders. Recently, free and widely used water risk screening tools have become available, such as Aqueduct 4.0 (WRI, 2023) and Water Risk Filter (WWF, 2024). However, because of their global-scale design, they may not accurately represent site-specific hydrological water cycle processes, including local water use conditions and surface water-groundwater interactions. Thus, their outputs may not be consistent with historical experience or local perceptions.

Watershed modeling is a useful tool for representing local hydrological water cycle processes and quantitatively evaluating future water risks. Nevertheless, watershed model parameters are inherently uncertain, and future prediction simulations with a single parameter set may lead to either underestimation or overestimation of water risk metrics. Therefore, in order to assess water risk more effectively, it is necessary to develop a framework that can identify feasible parameter combinations (multiple solutions) while taking into account parameter uncertainty.

In this study, we developed a watershed model that considers parameter uncertainty to quantify future physical water risks in the Phu Sai River Basin, Rayong Province, Thailand (approximately 280 km2), which is a concern due to the increase in water risks based on Aqueduct 4.0. A watershed modeling tool GETFLOWS was applied, which can simulate surface water and groundwater flow simultaneously.

The required data for watershed modeling was classified into hydrological observations, meteorology, land use/land cover, topography, geology, and water use. Our primary source of data was public data, including global datasets for meteorology, land use/land cover, and topography, as well as Thai government datasets for geology and water use. Regarding hydrological observation data used for model validation, in addition to existing data released by the Thai government, field measurements of river discharge and groundwater levels were conducted to improve model accuracy. Model performance for 2015–2025 was evaluated using the Nash–Sutcliffe efficiency (NSE), root mean square error (RMSE), and correlation coefficient.

The first step was to identify a parameter set that can accurately reproduce the hydrological observations through manual calibration. The next step was to create realistic parameter ranges and conduct sensitivity analyses to extract parameters that have a significant impact on simulated river discharge and groundwater levels. For the selected parameters, we generated 100 parameter combinations using Latin hypercube sampling and ultimately identified two parameter sets that showed high agreement with hydrological observations based on the NSE, RMSE, and correlation coefficient. Obtaining multiple solutions could help us evaluate the spread of future water risk predictions caused by parameter uncertainty.

In future work, we plan to conduct future prediction simulations using climate projection datasets such as NEX-GDDP-CMIP6 v2.0 (NASA, 2025) and to quantitatively evaluate future physical water risks based on risk assessment metrics such as required river discharge and groundwater level thresholds.

How to cite: Kajita, M., Saito, M., Tawara, Y., Kurihara, S., and Okamoto, H.: Watershed modeling considering parameter uncertainty to evaluate future physical water risks, EGU General Assembly 2026, Vienna, Austria, 3–8 May 2026, EGU26-8930, https://doi.org/10.5194/egusphere-egu26-8930, 2026.

EGU26-12048 | ECS | Orals | HS1.2.2

A Bayesian Hierarchical Model to Simulate Temporal Variability in Urban Stormwater Event Mean Concentrations 

Zhaokai Dong, Pradeep Goel, and Clare Robinson

Event Mean Concentration (EMC) is widely used to estimate stormwater pollutant loads due to its simplicity and low data requirements. However, conventional deterministic approaches typically use a single representative EMC for a catchment to estimate loads, thereby neglecting temporal variability across seasons and storm events, and potentially biasing event-level load estimates. To address this limitation, we present a Bayesian hierarchical linear mixed model that explicitly quantifies seasonal and inter-event variability in EMCs by estimating full posterior distributions, rather than a single deterministic EMC value, while retaining the operational simplicity of the traditional EMC approach. The model decomposes EMC into three hierarchical components: a global fixed effect, a seasonal random effect, and an event-level random effect. This structure enables EMC variability to be partitioned across multiple temporal scales and propagated into predictive uncertainty. The approach is demonstrated using soluble reactive phosphorus (SRP) data from a mixed urban catchment in London, Canada, comprising 18 monitored storm events across summer and fall seasons. A suite of models is developed to systematically evaluate methodological choices, including models with increasing levels of EMC variability representation (from global-only to full hierarchical structures) and models considering alternative land-use representations (lumped versus distributed). Results indicate that the full hierarchical model consistently outperforms simplified structures that exclude key variability components, as evaluated using leave-one-out cross-validation (LOO). Models that explicitly represent distinct land-use types demonstrate improved predictive performance compared to lumped representations; however, spatial disaggregation increases marginal variance, reflecting additional uncertainty. For the full hierarchical, land-use-distributed model, seasonal-level effects account for the largest share of marginal variability (median 63%), indicating that EMC variability for SRP manifests mainly as seasonal changes. Overall, these findings demonstrate that a single representative EMC is insufficient to characterize intrinsic temporal variability. By explicitly propagating uncertainty across hierarchical levels, the proposed Bayesian framework improves the reliability of stormwater load predictions and provides a more robust basis for management decisions.

How to cite: Dong, Z., Goel, P., and Robinson, C.: A Bayesian Hierarchical Model to Simulate Temporal Variability in Urban Stormwater Event Mean Concentrations, EGU General Assembly 2026, Vienna, Austria, 3–8 May 2026, EGU26-12048, https://doi.org/10.5194/egusphere-egu26-12048, 2026.

Understanding how uncertainty propagates in hydrological modelling, from precipitation inputs to streamflow simulations, is essential for improving model sensitivity and strengthening the interpretation of model outputs. While gridded precipitation products are increasingly developed and widely used in different applications worldwide, their impacts on the uncertainty of simulated streamflows remain largely unexplored. In this work, we tested a variety of state-of-the-art precipitation datasets to explore how their uncertainty cascades through a process-based hydrological model and influences streamflow predictions using the Reno River basin in Italy as a case study. Our results indicate that, although precipitation patterns are broadly consistent across datasets, substantial differences emerge at seasonal and annual scales especially in complex terrains. Moreover, precipitation uncertainties are propagated and also amplified to the streamflow, on average 3.5 times for the dry season. The opposite occurs for the wet season, where uncertainty slightly decreases. The subsequent analysis reveals that the influence of precipitation uncertainty differs among subbasins. As such, our work emphasises the substantial impact of precipitation forcing in hydrological modelling and the significance of evaluating and quantifying uncertainty propagation

How to cite: Cenobio-Cruz, O. and Di Baldassarre, G.: From precipitation datasets to streamflow simulations: Tracing the propagation of uncertainty in hydrological modelling, EGU General Assembly 2026, Vienna, Austria, 3–8 May 2026, EGU26-12725, https://doi.org/10.5194/egusphere-egu26-12725, 2026.

The traditional groundwater modeling approach of manual calibration with a handful of parameters and ad hoc one-at-a-time sensitivity analysis is giving way to formal data assimilation and uncertainty estimation, where the natural very-high dimensionality of the inverse problem is embraced.  In theory, this is an improvement for applied groundwater modeling, and, more importantly, the management of groundwater resources.  However, this transition is not without hardship.  Many new concepts, skills, and techniques must be learned to effectively and efficiently assimilate many kinds of information and to ultimately provide robust estimates of predictive uncertainty in an applied groundwater modeling setting, where time and budget pressures are real. 

This talk will present some foundational concepts surrounding predictive groundwater modeling, including the roles of model complexity, data, and uncertainty. The talk will include discussion of apparent trends in the groundwater modeling industry, with a few examples of modern applied predictive groundwater modeling.

How to cite: White, J.: Predictive groundwater modeling and uncertainty estimation in practice, EGU General Assembly 2026, Vienna, Austria, 3–8 May 2026, EGU26-14178, https://doi.org/10.5194/egusphere-egu26-14178, 2026.

The recent passing of Ilya M. Sobol’ marks the loss of one of the most influential figures in the development of global sensitivity analysis (GSA). Sobol’s work fundamentally shaped how uncertainty in model outputs is attributed to uncertain inputs, providing a rigorous and widely adopted framework that has become a cornerstone of uncertainty and sensitivity analysis across the Earth, environmental, and hydrological sciences.

This contribution first offers a brief tribute to Sobol’s scientific legacy and a concise review of the conceptual foundations of GSA. We revisit the primary question that motivated Sobol’s work—How much of the uncertainty in the model output is caused by each uncertain input?—and discuss why this question remains central for the analysis of complex, nonlinear, and high-dimensional models. We also emphasize that the principles underpinning GSA are increasingly relevant in the context of artificial intelligence (AI), where complex and high-dimensional models demand robust and transparent methods for attributing influence and uncertainty.

Building on this foundation, we highlight recent developments around variogram analysis of response surfaces (VARS), and in particular X-VARS, which extend GSA concepts to settings relevant for explainable AI (XAI). By leveraging paired perturbations and scale-explicit analysis, X-VARS enables efficient and robust attribution of uncertainty and influence in complex models, making GSA practical for modern AI-driven applications. Compared to established explainability methods such as SHAP, X-VARS offers substantial gains in computational efficiency while providing diagnostically richer insight into nonlinearity, interactions, and scale dependence.

We conclude by highlighting some key challenges and opportunities for the next generation of GSA methods in complex modelling and AI applications.

How to cite: Razavi, S., Panigrahi, B., and Abbasnezhad, H.: Ilya M. Sobol’ (1926–2025): A Tribute and Overview of the Foundations of Global Sensitivity Analysis, Recent Advances, and Extensions toward Explainable Artificial Intelligence, EGU General Assembly 2026, Vienna, Austria, 3–8 May 2026, EGU26-14866, https://doi.org/10.5194/egusphere-egu26-14866, 2026.

Key challenges in hydrologic modelling include characterizing and propagating uncertainty, diagnosing model sensitivity, and conducting robust hypothesis testing. Traditionally, hydrologic model workflows rely on fragmented and bespoke scripts that obscure key sources of uncertainty, confound model performance evaluation, and impede reproducibility. We present SYMFLUENCE, an open-source framework that operationalizes end-to-end hydrological simulations, from conceptualisation, through model compilation and data processing, to calibration and visualisation, by integrating models, data, and computation into a coherent, reproducible system architecture. 

SYMFLUENCE provides a modular pipeline spanning the full hydrological modelling lifecycle: domain definition and watershed delineation, sub-basin and hydrological response unit (HRU) discretization, multi-source data acquisition and preprocessing, model input preparation, model instantiation, parameter estimation, multi-objective evaluation, and visualization. Each stage offers interchangeable components—users can select among delineation tools (TauDEM, pysheds) and existing geofabric producs such as, MERIT-Basins and TDX Hydro, forcing datasets (e.g., ERA5, CERRA, CARRA,, AORC, etc.), discretization schemes, model structures, calibration algorithms, evaluation metrics, etc. while the framework manages technical execution. This separation of concerns allows researchers to express scientific choices (e.g., spatial resolution, process representation, objective functions) independently from their computational implementation, reducing the cognitive burden of workflow orchestration and enabling systematic comparison of modelling decisions. 

At its core, SYMFLUENCE employs a declarative YAML specification to define entire modelling experiments—including parameter bounds, sampling strategies, objective functions, and multi-criteria evaluation metrics. This design directly addresses reproducibility challenges by ensuring that modelling decisions are consistent and transparent across computing environments. The framework supports model-agnostic ensemble generation for uncertainty quantification and model optimisation across diverse model structures and model ecosystems (SUMMA, FUSE, GR4J, HYPE, NextGen, and others), automated provenance capture, and efficient parallel execution for large-domain sensitivity experiments. 

We present applications spanning single-basin calibration to continental-scale ensemble analyses. These cases illustrate how SYMFLUENCE enables rigorous benchmarking of model performance by holding computational infrastructure constant, allowing structural uncertainty to be isolated from implementation artifacts. By bridging technical infrastructure and scientific inference, SYMFLUENCE enables systematic and transparent exploration of alternative modelling options.  


How to cite: Eythorsson, D. and the Comphyd team: On the Architecture of Integration in Hydrological Modelling — Orchestrating Reproducible, Scalable, and Transparent Workflows with SYMFLUENCE , EGU General Assembly 2026, Vienna, Austria, 3–8 May 2026, EGU26-15704, https://doi.org/10.5194/egusphere-egu26-15704, 2026.

EGU26-18127 | ECS | Orals | HS1.2.2

Optimizing flood risk mitigation measures at river scale 

Mara Ruf and Daniel Straub

The optimization of flood risk mitigation measures necessitates the estimation of flood risk without and with a wide range of combinations of mitigation measures. This flood risk estimation is a complex task, involving climate, hydrological, hydraulic and economic process components. Moreover, these components do not form a linear process chain but interact - for example through local protection measures and potential flood protection failures. Additionally, flood risk assessment is accompanied by significant natural and model uncertainties.

We developed a probabilistic model capable of efficiently estimating the flood risk at river scale [1]. It explicitly models the interplay among flood process components and mitigation measures, making it well suited to estimate the benefit of individual mitigation measures or combinations thereof. In the latter case, the model captures the joint effect of mitigation measures, rather than summing their independent benefits.

Decision making in flood risk management involves numerous possible mitigation measures, multiple conflicting objectives (such as minimizing costs versus maximizing risk reduction), and generally very high uncertainties. In this contribution, we present how the flood risk model can support decision making for the selection of flood mitigation measures. Identifying pareto-optimal combinations of mitigation measures at river scale poses different challenges: a combinatorially large design space, partly discrete optimization variables, substantial natural and model uncertainties and large variance in the sample-based risk estimates. We present an optimization framework tailored for these settings, which balances between the robustness of sample-based flood estimates and the convergence behavior of the optimization given computational constraints. 

How to cite: Ruf, M. and Straub, D.: Optimizing flood risk mitigation measures at river scale, EGU General Assembly 2026, Vienna, Austria, 3–8 May 2026, EGU26-18127, https://doi.org/10.5194/egusphere-egu26-18127, 2026.

EGU26-18152 | ECS | Orals | HS1.2.2

Modelling Hydrologically-Conditioned Residuals For Improved Error Correction Across Different Flow Regimes  

Muhammad Hammad, Rajeshwar Mehrotra, and Ashish Sharma

Hydrological models often fail to fully capture catchment responses, which leaves systematic residuals between modelled and observed flow. Here, we present a comprehensive state-dependent, two-stage residual modelling framework that separates residuals into modelling error, arising from structural and parametric limitation, and observation error, coming from measurement and forcing data uncertainty. The residuals are estimated conditional on hydrological states, allowing the error dynamics to vary across flow regimes rather than assuming stationarity. The residual model is trained on 124 CAMELS-AU catchments from diverse climatic regions across Australia and is tested on independent catchments from the continent. The results demonstrate improved correction across all flow regimes, specifically for high (>95th percentile) and extremely high flow (>99th percentile). To enhance the generalizability, Minimum Redundancy Maximum Relevance (mRMR) feature selection is employed to identify the most important catchment attributes, which are used as static inputs alongside the dynamic model states and hydrological forcings. The framework is applicable to fully calibrated, partially calibrated, and uncalibrated hydrological models, and remains effective under limited or absent streamflow data. By explicitly modelling residuals as separable state-dependent processes, the proposed framework provides a robust method for improved streamflow correction, with particular relevance for peak flow estimation and applications in data-scarce environments. 

How to cite: Hammad, M., Mehrotra, R., and Sharma, A.: Modelling Hydrologically-Conditioned Residuals For Improved Error Correction Across Different Flow Regimes , EGU General Assembly 2026, Vienna, Austria, 3–8 May 2026, EGU26-18152, https://doi.org/10.5194/egusphere-egu26-18152, 2026.

EGU26-18396 | ECS | Posters on site | HS1.2.2

Relating free-surface flow and discharge in mountain streams 

Axel Giboulot and Christophe Ancey
The most accurate way of measuring water discharge in a mountain stream is to use a concrete structure (like a Parshall flume or a weir), so that the bed elevation is known and hyporheic flow is substantially reduced. This technique is costly, provides only a one-point measurement and it may be overtopped or damaged during floods. An alternative is offered by non-intrusive monitoring techniques, which do not come into contact with the flow.

Non-intrusive monitoring techniques do not measure a river's discharge directly, they extrapolate it from observable features of the free surface.
While empirical relations (e.g. rating curves or velocity profiles) for flows over impermeable walls are widely accepted to infer the discharge from the surface conditions, they fall short in mountain streams where the bed is coarse and permeable. As a result, discharge monitoring in mountain streams, both under normal conditions and during floods, remains inaccurate and calls for a new modeling framework.

Given that free-surface velocity measurements can be noisy and flow parameters (depth, eddy viscosity, porosity) are known with poor precision, we suggest using Bayesian inference to estimate the discharge from the surface velocity while explicitly accounting for parameter uncertainty through prior information.

The proposed approach will be tested using a laboratory flume experiment conducted at the bed roughness scale, based on a refractive index matched scanning (RIMS) setup. This experimental configuration enables direct access to bed porosity and the full velocity field by using glass beads as a sediment analogue and matching the refractive indices of the solid and fluid phases to eliminate optical distortion.

How to cite: Giboulot, A. and Ancey, C.: Relating free-surface flow and discharge in mountain streams, EGU General Assembly 2026, Vienna, Austria, 3–8 May 2026, EGU26-18396, https://doi.org/10.5194/egusphere-egu26-18396, 2026.

EGU26-18621 | Posters on site | HS1.2.2

There is sense in every model: Discover it with SPOTPY 

Tobias Houska

Uncertainty in hydrological modeling has an important effect on the reliability of predictions, such as droughts and floods. Uncertainty quantification can expose parameter sensitivities and structural flaws, enabling better calibration and robust risk assessments. However, the use and implementation of suitable methods often hinder good research and thus good model results.

Building on a decade of community work, SPOTPY has evolved into a widely used tool for covering a wide range of peer-reviewed hydrological calibration, uncertainty, and sensitivity analysis techniques. Here, the latest advances in research and practice are presented, featuring an expanded set of optimization algorithms, hydrological performance metrics, and high-throughput workflows that make rigorous parameter exploration accessible, ranging from desktop studies to large computing clusters.

The new release strengthens SPOTPY’s role as a “single entry point” for testing alternative calibration strategies for any hydrological or ecohydrological model. A redesigned model interface simplifies the coupling of external models (from simple conceptual bucket models to fully distributed land‑surface models), while improved I/O handling and database backends streamline storage of millions of simulations for posterior analysis. The availability of global and local optimization methods has been extended and harmonized: alongside classic algorithms such as SCE‑UA, DREAM, ROPE and Monte Carlo sampling, users can now flexibly switch between multi‑objective and single‑objective formulations and customize stopping criteria to balance convergence and computational cost.

For performance evaluation, SPOTPY now offers an enriched library of objective functions and hydrological signatures tailored to discharge and ecohydrological time series, from classical Kling–Gupta Efficiency (parametric and non‑parametric) to hydrological signature-based flow percentile‑based indicators. All metrics are fully integrated into calibration, sensitivity analysis, and uncertainty assessment workflows so that users can, for example, calibrate to traditional goodness‑of‑fit while simultaneously tracking regime‑oriented diagnostics that are critical for low‑flow, flood, or water‑quality applications. Recent case studies demonstrate how these capabilities help quantify trade‑offs between parameter identifiability and process realism in hydrological models under changing climate and land‑use conditions, for which an overview will be presented.

Furthermore, the new features will be illustrated through real-world hydrological applications, highlighting practical guidance on algorithm choice, the diagnostic use of hydrological signatures, and robust uncertainty communication. However, as not every model produces the expected result on the first try, a discussion ground will be provided for problems that are frequently encountered in hydrological modeling.

How to cite: Houska, T.: There is sense in every model: Discover it with SPOTPY, EGU General Assembly 2026, Vienna, Austria, 3–8 May 2026, EGU26-18621, https://doi.org/10.5194/egusphere-egu26-18621, 2026.

EGU26-18895 | ECS | Posters on site | HS1.2.2

Information entropy and clustering-based sensor placement in water distribution networks for leak detection 

Priyanshu Jain and Manne Janga Reddy

The optimal sensor placement (OSP) within water distribution networks (WDNs) is a critical research area, driven by the need for effective leak detection, localization, and data-driven decision support. Due to the large scale, complex topology, and uncertain hydraulic behavior of WDNs, identifying sensor locations that are both informative and spatially representative remains a challenging task. This study proposes an information-entropy and clustering-based framework for optimal sensor placement, aimed at enhancing leak detection and localization through machine learning in smart water networks.

Hydraulic pressure data are generated using EPANET by introducing a single leak at a time, modeled as an additional demand at each demand node in the network. The pressure signal at each node is treated as a random variable, and its probability distribution is estimated using a histogram-based approach. Shannon information entropy is employed to quantify the uncertainty and sensitivity of nodal pressure responses, where nodes with higher entropy are considered more informative and responsive to system disturbances such as leaks. Mutual information is incorporated to compute shared information between candidate sensor locations. By penalizing nodes that exhibit high redundancy with previously selected sensors, the proposed framework ensures that each sensor contributes unique and complementary information. Furthermore, to guarantee spatially distributed sensors and network-wide coverage, spectral clustering is applied using nodal coordinates and elevation (X, Y, Z), partitioning the network into geographically coherent clusters. Sensors are placed within each cluster at the nodes with maximum penalized entropy score. A greedy search algorithm is employed to maximize this score. Consequently, this integrated framework effectively balances information maximization, redundancy reduction, and spatial representativeness.

The methodology is validated on the benchmark Modena network, a medium-sized gravity-fed WDN consisting of 268 demand nodes, 317 pipes, and four reservoirs. The performance of the information-entropy and clustering-based sensor placement framework was evaluated using spatial classification accuracy metrics at varied distance tolerances (0m to 500m). The multilayer perceptron (MLP) based leak localization model trained using data from the information-entropy and clustering-based OSP at nodes {7, 42, 162, 228, 257} achieved training accuracy of 97.62% and test accuracy of 85.73%. Spatial accuracy results further validate robustness, with localization accuracies of 93.94% within 100 m, improving to 97.95% and 99.72% within 200 m and 500 m tolerance, respectively. Robust performance was maintained even after introducing noise into the data; however, under noisy conditions, the use of spatial accuracy metrics is recommended to effectively predict the leak zone rather than exact node locations. The high spatial accuracies demonstrate the frameworks effectiveness for machine learning–based predictive analytics. The framework supports informed decision-making and provides an efficient solution for smart water network monitoring and management.

How to cite: Jain, P. and Reddy, M. J.: Information entropy and clustering-based sensor placement in water distribution networks for leak detection, EGU General Assembly 2026, Vienna, Austria, 3–8 May 2026, EGU26-18895, https://doi.org/10.5194/egusphere-egu26-18895, 2026.

EGU26-20073 | ECS | Posters on site | HS1.2.2

Beyond deterministic hydrological modelling: a copula-based uncertainty framework 

Luca Lombardo and Alberto Viglione
Conceptual hydrological models are widely used in both theoretical investigations and operational applications. Their flexibility and relative ease of implementation have contributed to their success in the last decades. Despite their widespread use, conceptual hydrological models are still predominantly applied in a deterministic form (D-model), without explicitly accounting for the inherent uncertainties affecting their predictions. To address this limitation, a broad range of uncertainty estimation methods has been proposed in the literature, spanning from simple resampling techniques to more complex Bayesian frameworks, from approaches that explicitly separate different sources of uncertainty, to methods that aggregate all sources into a single error term. The common objective of these approaches is the transition from a deterministic D-model to a probabilistic or stochastic representation (S-model), typically expressed through an ensemble of model output predictions.
Recently, Koutsoyiannis and Montanari (Koutsoyiannis, D., & Montanari, A., 2022) introduced an innovative methodology, applied to river discharge model outputs, to tackle this problem, departing from the traditional residual-based paradigm adopted by most existing approaches. Their method, known as BLUECAT, instead exploits the dependence structure between D-model predictions and observed discharge, providing a local, data-driven characterization of predictive uncertainty. While the non-parametric nature of BLUECAT offers important advantages, it also entails intrinsic limitations, particularly in the representation of uncertainty near the extremes of the discharge distribution, especially when limited discharge records are available.
This contribution builds upon the original BLUECAT framework by proposing a conceptually equivalent, yet operationally novel, parametric post-processing approach for conceptual rainfall–runoff uncertainty estimation. The method relies on the use of parametric copula models to describe the joint dependence between D-model predictions and discharge observations, enabling the analytical derivation of conditional predictive distributions. This formulation provides an elegant solution to several limitations of the non-parametric approach, including the definition of confidence bands in proximity to extreme flows. In addition, a second parametric variant specifically tailored to high-flow regimes is introduced, allowing for a focused characterization of uncertainty within a restricted range of D-model discharge predictions.
The proposed methods are evaluated through a comparative study over 24 mountainous catchments in the Piedmont region (north-western Italy), considering both calibration and validation periods. The analysis includes reliability metrics for confidence bounds as well as performance indicators for key ensemble properties, such as the ensemble median. The results indicate that the parametric approaches, when short observation records are available, generally yield more robust and reliable uncertainty estimates during validation compared to the original non-parametric BLUECAT. Furthermore, the high-flow-tailored approach outperforms both the non-parametric method and the parametric approach applied over the full discharge range when focusing on extreme flows, thereby improving uncertainty quantification in high-risk hydrological scenarios. 
 
Koutsoyiannis, D., & Montanari, A. (2022). Bluecat: A local uncertainty estimator for deterministic simulations and predictions. Water Resources Research, 58, e2021WR031215. https://doi.org/10.1029/2021WR031215

How to cite: Lombardo, L. and Viglione, A.: Beyond deterministic hydrological modelling: a copula-based uncertainty framework, EGU General Assembly 2026, Vienna, Austria, 3–8 May 2026, EGU26-20073, https://doi.org/10.5194/egusphere-egu26-20073, 2026.

EGU26-20968 | ECS | Orals | HS1.2.2

Conditional Subsampling of Legacy Boreholes for Subsurface Model Validation 

Pablo De Weerdt, Stijn Luca, and Ellen Van De Vijver

Practical constraints often force modellers to rely on legacy data rather than targeted new data collection relying tailored sampling design for subsurface modelling. While these pre-existing datasets enable model development and gap identification, their spatial density and distribution may not always meet the desired resolution or precision. Consequently, strategic subsampling for calibration and validation is essential to ensure a robust and accurate performance assessment of the resulting models. While cross-validation techniques are commonly applied to maximize data utility, their application in spatial modelling yields overoptimistic performance estimates with high variance, particularly when data are clustered. Probabilistic-based sampling is known to tackle bias, but its effectiveness remains poorly understood for spatially sparse and clustered legacy data.
This research evaluates the impact of subsampling methods on the validation of spatial interpolation techniques. Conditional versus random subsampling is compared for different subsample sizes in terms of actual model performance with particular attention to geostatistical concepts that additionally take into account spatial autocorrelation within subsurface data. Legacy boreholes spanning over a century with sparse and clustered spatial distribution were queried to model peat content in 3D. Conditioning relied on 2D legacy attributes such as age, spatial coordinates, and target feature statistics. We also investigated how the complexity of spatial variation (represented in different models with varying anisotropic autocorrelation) influenced performance by populating the existing borehole configuration with three 3D target features: two more spatially continuous synthetic and one heterogeneous, real field dataset. First results suggest that variance of validation results reduced exclusively in the heterogeneous case, provided the validation subset was large enough (35%) to incorporate the cumulative peat content within a borehole as a 2D attribute. These results underscore the resilience of conditioned probabilistic subsampling over alternative validation methods for legacy-based modelling.

How to cite: De Weerdt, P., Luca, S., and Van De Vijver, E.: Conditional Subsampling of Legacy Boreholes for Subsurface Model Validation, EGU General Assembly 2026, Vienna, Austria, 3–8 May 2026, EGU26-20968, https://doi.org/10.5194/egusphere-egu26-20968, 2026.

EGU26-21104 | Posters on site | HS1.2.2

How can inverse reactive transport modelling of radiocarbon improve the estimation of sustainable yield in confined aquifer systems? 

Alexandre Pryet, Carlos Felipe Marín Rivera, Nicole Fernandez, Marc Saltel, Olivier Atteia, Michel Franceschi, Julio Goncalves, Bruno Hamelin, Pierre Deschamp, Adrien Claveau, and Christelle Marlin

The sustainable yield of aquifer systems in sedimentary basins can theoretically be derived by long-term model simulations considering the adverse effects of pumping, such as streamflow depletion, subsidence, or contamination induced by flow reversals. The implementation of a model-based approach for sustainable yield estimation is often challenged by the lack of knowledge on system properties and (paleo)-recharge rates. Specifically, leakage flows through aquitards generally drive the hydrodynamic response of confined aquifers to pumping, but their properties are poorly constrained by typical observational datasets. Dating methods such as radiocarbon have been widely used to infer residence time in confined aquifer systems. However, their use to constrain flow hydrodynamics in multi-layer systems with a state-of-the-art inverse modeling approach is scarce.

In this study, we investigated the flow dynamics of the Aquitaine Basin located in Southwest France, with an extensive repository of hydrologic and geochemical data spanning several decades. A 2D cross-sectional numerical flow model was developed and extended to simulate reactive transport of radiogenic carbon. An inverse modeling approach was then implemented to estimate model parameters using observed hydraulic heads and 14C activity. This paves the way to a more rational quantification of the sustainable yield of critical resources for the resilience of water supply in a changing world.

How to cite: Pryet, A., Marín Rivera, C. F., Fernandez, N., Saltel, M., Atteia, O., Franceschi, M., Goncalves, J., Hamelin, B., Deschamp, P., Claveau, A., and Marlin, C.: How can inverse reactive transport modelling of radiocarbon improve the estimation of sustainable yield in confined aquifer systems?, EGU General Assembly 2026, Vienna, Austria, 3–8 May 2026, EGU26-21104, https://doi.org/10.5194/egusphere-egu26-21104, 2026.

EGU26-21485 | Posters on site | HS1.2.2

Community needs for Observations to constrain Earth System Models 

Amy Doherty, Emma Woolliams, and Douglas Rao

Observations are key for development of earth and environmental systems models. They can be used for initialisation, verification and evaluation, forcing, constraining and benchmarking. Providing the observed variables required by modellers in a useful format with necessary metadata, including uncertainty characterisation, has traditionally not been seen as the responsibility of the observation providers. This has caused a mismatch between what is provided and what is required, leading to proxy climate data such as reanalyses being widely used in place of true observations. To enhance the uptake and usability of observational datasets, they should be provided with easy access, in easy to use format, clearly documented and with detailed metadata.

The Working Group on Observations for Researching Climate (WGORC) was set up in 2025 by the World Climate Research Program (WCRP) Earth System Modelling and Observations (ESMO) core project. WGORC kicked off in December 2025 and is focused on improving the use of observations throughout climate science, addressing the mismatch mentioned above and ensuring correct use and application of observations to model development.

ESMO working groups function through the activities of panels and task teams which are set up in response to identified needs. WGORC has one existing panel and will be looking to set up at least two more based on the outcomes of the scoping activities currently underway.

The initial WGORC focus areas include:

* Characterisation and communication of observational uncertainties 

* Use of observations in machine learning applications for climate 

* Observations to better understand and model extreme weather and climate events 

* Data rescue and recovery of historical climate observations 

The existing panel, obs4MIPs, is an ongoing community-driven initiative to provide observational datasets in the format to support model benchmarking and evaluation of Earth System Models as part of the Climate Model Intercomparison Projects (CMIP). 

This presentation will describe WGORC in detail and outline the scoping activities in the four focus areas and the ongoing activities of the existing panel obs4MIPs which is currently investigating how to expand its offering to provide point observations as well as gridded, and the provision of associated uncertainty data with each dataset. It will also discuss opportunities on how the community can stay engaged with WGORC and ESMO activities and be consulted during user requirements gathering for climate observations.

How to cite: Doherty, A., Woolliams, E., and Rao, D.: Community needs for Observations to constrain Earth System Models, EGU General Assembly 2026, Vienna, Austria, 3–8 May 2026, EGU26-21485, https://doi.org/10.5194/egusphere-egu26-21485, 2026.

How process knowledge can improve flood forecasting: A stochastic and deterministic perspective (Invited)

Svenja Fischer

Hydrology and Environmental Hydraulics, Wageningen University & Research, Wageningen, the Netherlands


Flood prediction remains challenging. With changing climate and environment, predictions are becoming more important because the impacts are increasing, while at the same time, they are becoming more challenging because flood-generating mechanisms change. Floods can be triggered by different processes, such as heavy rain, long-duration rain or melting snow. With changing climate, these processes are expected to change in frequency and magnitude. However, in current flood prediction models, the different flood-generating mechanisms are not explicitly considered and all flood events are treated equally. While in stochastic hydrology, process knowledge has been shown to be able to improve flood estimation and reduce uncertainty, this is less well studied for physical models. This can introduce uncertainty into the estimation.

The first step is to identify the relationship between atmospheric and catchment characteristics, flood-generation processes and the flood hydrograph. The identified relations are then integrated in the hydrological models by directly tailoring the physical relations to each flood type. In combination with an dynamic weighting approach, this enables a non-stationary and flexible flood prediction that can capture the changing frequency and magnitude of flood types and provide different flood scenarios with assigned probabilities. This approach does not only reduce the error in flood peak prediction but also improves the link of the model parameters to physical processes and thus increases our understanding of flood processes. Moreover, the uncertainty of the considered process can be directly quantified by a probability-based evaluation.

How to cite: Fischer, S.: How process knowledge can improve flood forecasting: A stochastic and deterministic perspective (Invited), EGU General Assembly 2026, Vienna, Austria, 3–8 May 2026, EGU26-22244, https://doi.org/10.5194/egusphere-egu26-22244, 2026.

HS2.1 – Catchment hydrology in diverse climates and environments

EGU26-193 | ECS | PICO | HS2.1.1

Continental-Scale Groundwater Response Dynamics to Climate Variability in Africa 

Grmay Kassa Brhane, Chuen-Fa Ni, and Chian-Yi Liu

Our work has aimed to deal with the long-term groundwater response to understand the natural and human roles at the continental scale, with a time window ranging from 2003 to 2024. A comprehensive mass balance of the terrestrial water storage (TWS) approach was used for the determination of monthly groundwater storage change to attribute its variability to both climatic and human-induced drivers. Our findings show a long-term upward pattern of groundwater storage anomaly (GWSA), demonstrating a dual reality of groundwater response to precipitation, where the flux of the groundwater system (recharge/discharge) is quickly responsive to inter-annual extremes of precipitation, with a response time of 0 months. However, the state (total storage) is slow and integrated with a multi-year response time peaking approximately 29 months after a precipitation event. There is a significant hydro-climatic regime shift that developed after 2018, where groundwater was being replenished to levels never seen before. This surge occurred because of positive precipitation anomalies caused by a prolonged multi-year La Niña phase, and there is a shift within the regime of the hydrogeological system of the continent from negative human contribution at the beginning (2003) to positive human intervention toward the end of the study time range. This is primarily driven by sustained decreasing groundwater withdrawal, mainly for agricultural activities, at a slower rate than the continent's total annual groundwater renewal. Although the continent has recently benefited from a period of intense, climate-driven recharge (post-2019), this has occurred in defiance of a massive and growing human-induced withdrawal signal. This positive continental trend also masks severe concurrent regional droughts, such as the catastrophic 2020-2022 La Niña-induced drought in the Horn of Africa. These findings present the first complete picture of the African groundwater system, underscoring its susceptibility to significant climatic phenomena such as the El Niño-Southern Oscillation (ENSO). It also highlights the critical need to incorporate regional variations and diverse climatic factors in all future water security assessments carried out on water security. Moreover, continental groundwater storage anomaly is a robust proxy for the integrated impact of major climate teleconnections like ENSO. This work measures these opposing forces and finds that the current positive balance of groundwater storage is vulnerable and relies on the proper maintenance of the positive wet climate. This indicates the need for sustainable policy interventions in the groundwater sector based on long-term agricultural water productivity to maintain the value of the most significant African source of freshwater.

How to cite: Brhane, G. K., Ni, C.-F., and Liu, C.-Y.: Continental-Scale Groundwater Response Dynamics to Climate Variability in Africa, EGU General Assembly 2026, Vienna, Austria, 3–8 May 2026, EGU26-193, https://doi.org/10.5194/egusphere-egu26-193, 2026.

EGU26-531 | ECS | PICO | HS2.1.1

Hydrological Response to Climate Change and Variability in East Africa 

Tsion Ayalew Kebede, Francesco Laio, and Alberto Viglione

African countries' economic growth and sustainable development is being constrained by their capability to adapt to climate change, in particular regarding water availability and distribution. Hydrological processes exhibit a high degree of temporal and spatial variability, and their modelling is affected by issues of nonlinearity of physical processes, conflicting spatial and temporal scales, and uncertainty in parameter estimates. In addition, conventional hydrometeorological data has long suffered from data breaks due to changes in reporting methods and from gaps (missing information), especially in Africa.

This study focuses on modelling the impact of climate change and variability on the long-term distribution of water-balance components in East Africa through the evaluation of historical patterns and future projections.

The methodology uses an integrated Soil and Water Assessment Tool (SWAT) with a machine learning model to examine historical data, to capture nonlinear hydrological patterns, and to generate accurate projections. The modelling analysis is partitioned into two phases: (1) a land-phase module, where SWAT simulates processes from the event of raindrops onto the land surface to the stream, and (2) a climate-phase module, where Regional Climate Models (RCMs) will be used to produce time series for a set of climatic variables under different scenarios. Machine learning algorithms that closely align with RCM will be used to impact assessments on water resources. Based on this, we aim to predict the impact of drought related to the water resources for sustainable agricultural production potential across the region.

At the EGU General Assembly, we will present the spatio-temporal variability of seasonal water balance in East Africa, and the modelling framework for climate change projection and drought prediction.


Acknowledgments:  This research is supported by Eni S.p.A. through the Eni Award “Debut in Research: Young Talents from Africa”. We thank our company tutors Alessandro Nardella and Alessandra Bertoli for their invaluable guidance and technical expertise.

How to cite: Kebede, T. A., Laio, F., and Viglione, A.: Hydrological Response to Climate Change and Variability in East Africa, EGU General Assembly 2026, Vienna, Austria, 3–8 May 2026, EGU26-531, https://doi.org/10.5194/egusphere-egu26-531, 2026.

EGU26-667 | PICO | HS2.1.1

Influence of Large-Scale Climate Indices on Reservoir Surface Extent Variability in West Africa 

Valery Bessely Stanislas Kouassi, Kwok Pan Chun, Blé Anouma Fhorest Yao, Gneneyougo Emile Soro, Albert Elikplim Agbenorhevi, Albert Bi Tié Goula, Nelly Carine Kelome-Ahouangnivo, and Julian Klaus

In recent years, artificial reservoirs have attracted increasing attention, not only for their essential role in mitigating hydrological and meteorological extremes but also for their vulnerability to climate variability in region like West Africa. This growing interest has been supported by advances in remote sensing, which now allow near-real-time monitoring of reservoir surface extent (RSE) dynamics. However, regional-scale research quantifying and communicating trends and variability in reservoir surface dynamics remains limited. Additionally, while the effects of large-scale climate indices on hydrological processes have been largely investigated, any study has specifically examined how RSE respond to these climate indices across West Africa. At the same time, regression-based machine learning approaches, frequently used to assess multiple teleconnections while addressing multicollinearity issues, often lack systematic evaluations of their robustness and reliability. These gaps constitute important challenges for both local and regional efforts to monitor hydroclimatic shift impacts and anticipate water resource stress under ongoing global warming. In this study, we addressed these challenges by assessing the spatiotemporal variability and trends in RSE dynamics from 1985 to 2022 for 482 reservoirs across West Africa in relation to ten Sea Surface Temperature Anomaly (SSTA) indices. We further evaluated the performance of three supervised machine learning methods, Ridge Regression, Elastic Net, and Partial Least Squares (PLS) to identify the most suitable for modeling and predicting the effects of SSTA indices on RSE. Finally, we identified the dominant oscillations influencing RSE dynamics and highlighted the regional response patterns of West African reservoirs to the ten SSTA indices. We found strong interannual and decadal variability in both the SSTA indices and RSE, underscoring a dynamic coupling between oceanic conditions and terrestrial hydrology in West Africa. Among the ten indices, the Western Mediterranean Index (WMED) shows the strongest and statistically significant upward trend (p < 0.05). At the reservoir level, 43.26% of the 485 reservoirs exhibit significant long-term trends, with 31.07% showing declines. Of the three algorithms tested, PLS delivers the best generalizability and the most stable out-of-sample predictive performance, but only when using PCA-filtered and low-collinearity predictors. WMED emerges as the most influential driver, with moderate contributions from the Atlantic modes (AMO and AMM). Finally, SSTA regression coefficients vary widely across reservoirs, with minimal spatial clustering, indicating uneven reservoir sensitivity to oceanic oscillations likely shaped by local factors.

How to cite: Kouassi, V. B. S., Chun, K. P., Yao, B. A. F., Soro, G. E., Agbenorhevi, A. E., Goula, A. B. T., Kelome-Ahouangnivo, N. C., and Klaus, J.: Influence of Large-Scale Climate Indices on Reservoir Surface Extent Variability in West Africa, EGU General Assembly 2026, Vienna, Austria, 3–8 May 2026, EGU26-667, https://doi.org/10.5194/egusphere-egu26-667, 2026.

EGU26-1029 | ECS | PICO | HS2.1.1

Reducing Hydrological Uncertainty: A Multi-Variable SWAT Calibration Using Global AET Products 

Mohamed Ouarani, Abdennabi Alitane, Yassine Manyari, David Mulla, and Yassine Ait Brahim

Parameter equifinality remains a central challenge in hydrological modeling, limiting the reliability of process-based tools such as the Soil and Water Assessment Tool (SWAT). This study evaluates how multi-variable calibration strategies that combine in-situ streamflow with five remote sensing global actual evapotranspiration (RSAET) products (GLEAM v3.6, GLEAM v4.2, ETMonitor, PML, and SSEBop) can reduce equifinality, using the Essaouira watershed (Morocco) as a study case. A total of 10,000 Monte Carlo simulations were performed, from which the 100 best-performing parameter sets were selected for posterior uncertainty assessment. A Composite Identifiability Score (CIS) was developed by integrating normalized metrics of standard deviation, entropy, peak-to-width ratio, and Kullback-Leibler divergence to quantify parameter identifiability.

Results show that streamflow-only calibration (S0) yields the highest CIS, confirming the strong constraining power of discharge on routing and runoff parameters. However, multi-variable calibration further reduces equifinality for several soil–plant–atmosphere parameters, with the Streamflow + GLEAM v3.6 configuration achieving the highest multi-source CIS, followed by SSEBop and GLEAM v4.2. In terms of performance, streamflow-only scenarios achieve the highest NSE and lowest PBIAS, while hybrid streamflow–AET calibrations maintain strong predictive skill and improve the physical consistency of ET-related processes. In contrast, AET-only calibrations exhibit poor runoff-volume accuracy and large water-balance inconsistencies.

Overall, integrating complementary AET datasets with discharge observations enhances parameter identifiability, constrains key hydrological processes, and mitigates equifinality. This demonstrates a practical pathway to strengthen SWAT model robustness in data-scarce regions, as is the case for many African basins. These results are preliminary, and ongoing work aims to consolidate them by extending the calibration and identifiability framework to include soil-moisture remote-sensing products, with the goal of further constraining soil-water dynamics and reducing remaining model uncertainties.

How to cite: Ouarani, M., Alitane, A., Manyari, Y., Mulla, D., and Ait Brahim, Y.: Reducing Hydrological Uncertainty: A Multi-Variable SWAT Calibration Using Global AET Products, EGU General Assembly 2026, Vienna, Austria, 3–8 May 2026, EGU26-1029, https://doi.org/10.5194/egusphere-egu26-1029, 2026.

EGU26-6809 | ECS | PICO | HS2.1.1

Opportunities for opportunistic sensing of rainfall with Commercial Microwave Links in Nigeria 

Bas Walraven, Arjan Droste, Aart Overeem, Miriam Coenders, Rolf Hut, and Remko Uijlenhoet

Near-surface rainfall estimates from Commercial Microwave Links (CMLs) are a viable source of rainfall information in data scarce regions, notably Low and Middle-Income countries in the tropics. CMLs are point-to-point radio links commonly used in cellular telecommunication networks. When it rains, the radio signal between two cell phone towers is (partially) attenuated, and this rain-induced attenuation can be used to infer the average rainfall intensity along the path. Typically, every 15 minutes the minimum and maximum received signal levels are stored in network management systems by mobile network operators for quality monitoring purposes. Based on these signal levels it is possible to estimate path-averaged rainfall intensities, which can be interpolated to produce high-resolution rainfall maps.

In this study we investigate the use of several thousands of CMLs, predominantly located in heavily urbanized areas, during one rainy season in Nigeria. We use 32 hourly rain gauges (12 from Nigeria’s Meteorological Agency, and 20 from the Trans-African Hydro-Meteorological Observatory) as a reference to compare with the path-averaged rainfall intensities from CMLs within 5 km of a gauge. To quantify the uncertainties in CML rainfall estimates we compare the performance of these links with different frequency and polarization across the same path. We make a similar comparison by comparing interpolated rainfall maps from CMLs to available gridded (satellite) rainfall products on a seasonal basis. As such, this study aims to highlight the added value of using CMLs as an opportunistic source of rainfall estimation in a region where reference rainfall information from dedicated ground-based sensors is very limited. It offers a balanced outlook for the use of these near-surface rainfall estimates with their associated uncertainties as input for hydrometeorological applications at the kilometer scale, ranging  from numerical weather prediction to calibration of satellite precipitation products, and hydrological modelling.

How to cite: Walraven, B., Droste, A., Overeem, A., Coenders, M., Hut, R., and Uijlenhoet, R.: Opportunities for opportunistic sensing of rainfall with Commercial Microwave Links in Nigeria, EGU General Assembly 2026, Vienna, Austria, 3–8 May 2026, EGU26-6809, https://doi.org/10.5194/egusphere-egu26-6809, 2026.

EGU26-12394 | ECS | PICO | HS2.1.1

How to assess drought in data scarcity areas? A case study in Kruger National Park (South Africa)  

David Gabella, Rafael Pimentel, Hector Nieto, Vicente Burchard-Levine, Timothy Dube, and Ana Andreu

Mediterranean savanna ecosystems exhibit a hydrological regime with marked wet and dry seasons. This variability makes droughts a recurrent hazard that impacts water supply, food security, wildlife, and economy. Consequently, a thorough drought definition and monitoring are essential to foresee drought impact, to support decision-making processes, and to design mitigation and adaptation strategies. However, drought definition is not easy, specifically, in data-scarce areas, where ground observations are sparse or unavailable. In these cases, satellite remote sensing and geospatial data are a valuable alternative to in situ information.  

This study evaluates the usefulness of satellite-based indicators to characterize drought dynamics in these data scarce environments. Special emphasis was put in two aspects: (i) exploring lagged relationships and cascading effects among different drought types and (ii) the capacity of different remote-sensing-based indexes to capture agricultural drought in several land cover of these environments. The Kruger National Park in South Africa (KNP) over the period 2000 – 2023 was selected as pilot case area due to the characteristic recurrence of droughts.  

Therefore, meteorological, agricultural, and hydrological droughts were computed over four different land cover classes: savanna, forest, grassland, and cropland. Each of these areas were identified using ESACCI Land Cover (1992 – 2015). Meteorological drought was defined through the Standardized Precipitation Index (SPI) computed using the ERA5-Land precipitation data (25km). Agricultural drought was analyzed using three different methods, with different levels of complexity. First, the 16-day MOD13Q1 NDVI product. Second, the daily Evaporative Stress Index (ESI), defined as the ratio of actual to reference evapotranspiration (ET), as a proxy for ecosystem water stress. Actual ET was estimated using a Two Source Energy Balance (TSEB) model driven by MOD11A1 Land Surface Temperature (LST). Third, a MODIS-based Composite Drought Index (CDI) derived from air temperature, precipitation, and NDVI was also considered. Finally, hydrological drought was assessed through the Standardized Streamflow Index (SSI) derived from Global Flood Awareness System (GloFAS) v4 river discharge data.  Drought events were identified using standard thresholds for SPI, SSI, and CDI, while ESI and NDVI thresholds were defined by land cover and month to account for phenology. 

Regarding the connection between different droughts, the preliminary results show for all the classes analyzed that only the more severe meteorological droughts, that is those occurring during 2003-04 and 2015-16, have a direct impact on agricultural drought. The effect on hydrological drought is lumped in comparison. When comparing the different agricultural drought methods, we found that NDVI is the index more sensitive to changes, particularly in non-forested areas which are more dependent on precipitation, while ESI is better representing abrupt fluctuation in forests and savannas. On the contrary, CDI poses a more homogenous value, what makes it overestimate the presence of droughts. 

These initial results show the potential of coupling different spatial data sources, geospatial and remote-sensing-based to define different droughts and their relations in data scare regions. In addition, they allow providing some initial recommendations about their different responses depending on the land cover analyzed. 

Acknowledgments: This work is part of the grant RYC2022-035320-I, funded by MCIN/AEI/10.13039/501100011033 and FSE+. 

How to cite: Gabella, D., Pimentel, R., Nieto, H., Burchard-Levine, V., Dube, T., and Andreu, A.: How to assess drought in data scarcity areas? A case study in Kruger National Park (South Africa) , EGU General Assembly 2026, Vienna, Austria, 3–8 May 2026, EGU26-12394, https://doi.org/10.5194/egusphere-egu26-12394, 2026.

EGU26-13916 | ECS | PICO | HS2.1.1

Digital Earth Africa as a Platform for Coastal Erosion Monitoring along Ghana’s Eastern Coastline 

Eric Mortey, Jacob Agyekum, Akoto Yiadom, Mabel Kumah, Seifu Tilahun, Alemseged Tamiru Haile, and Abdulkarim Seid

Coastal erosion is a persistent and growing challenge along West African shorelines, posing serious risks to livelihoods, infrastructure, and coastal ecosystems. In Ghana, erosion along the eastern coastline is driven by strong wave action, sea-level rise associated with climate change, unregulated coastal development, and sediment retention resulting from dam construction. In response, a range of hard engineering interventions, such as sea walls, breakwaters, armour rock revetments, and groyne systems were implemented in 2017 to reduce shoreline retreat. However, systematic and cost-effective monitoring is required to assess the effectiveness and long-term impacts of these interventions. This study documents the development of a digital coastal erosion monitoring tool using the Digital Earth Africa (DE Africa) platform, focusing on Blekusu, a highly erosion-prone coastal community in eastern Ghana, where major sea-defense structures have been constructed. Relevant national stakeholders, including the Ghana Hydrological Authority, the Ghana Meteorological Agency (GMet), and the Water Research Institute (WRI), were identified through an IWMI–DE Africa stakeholder training workshop and engaged to co-create the coastal erosion use case. An ecosystem of DE Africa tools was used, including DE Africa Explorer, DE Africa Maps, and DE Africa Sandbox. The Explorer served as a unified interface to query and retrieve analysis‑ready coastline datasets and metadata (2010–2024), spanning both pre‑ and post‑intervention periods, derived from 30 m Landsat imagery and tidal modeling. The DE Africa Sandbox served as an integrated development environment for Python-based analysis, enabling users to access, process, and visualize coastline dynamics without relying on multiple external tools. Existing coastal erosion notebooks within the Sandbox were adapted, significantly reducing the learning curve and development time. Code sharing among team members facilitated collaborative development and aligned with open-access data-sharing principles. IWMI and DE Africa jointly reviewed the use case and developed online training materials that allow users to enroll, build capacity, and earn certification. Shoreline extraction and change-detection analyses revealed persistent accretion exceeding 30 m in several sections following the intervention, although localized stabilization was observed near engineered structures. These results demonstrate the reliability of DE Africa as a scalable, accessible, and cost-effective platform for coastal monitoring and support its integration into national coastal management and planning strategies. Continued investment in DE Africa and its integration into university curricula would further expand its impact across Africa.

How to cite: Mortey, E., Agyekum, J., Yiadom, A., Kumah, M., Tilahun, S., Haile, A. T., and Seid, A.: Digital Earth Africa as a Platform for Coastal Erosion Monitoring along Ghana’s Eastern Coastline, EGU General Assembly 2026, Vienna, Austria, 3–8 May 2026, EGU26-13916, https://doi.org/10.5194/egusphere-egu26-13916, 2026.

Southern Africa is increasingly vulnerable to long-term drought, particularly in arid to semi-arid regions. However, insufficient monitoring makes the timing and extent of groundwater response to droughts difficult to quantify. Here, we combine evidence of past drought in the satellite record with water table modeling to evaluate the spatio-temporal relationship between agricultural and hydrological drought across Southern Africa from 1981-2025. We use the normalized difference vegetation index (NDVI) from the STFLNDVI dataset as a proxy for agricultural drought. We simulate monthly water table depth (WTD) at 30 arcsecond resolution using the Water Table Model (WTM), which dynamically couples surface and subsurface hydrologic processes. 

By defining standardized anomalies derived from NDVI and simulated WTD, we aim to examine spatio-temporal drought propagation characteristics between agricultural and hydrological drought. Drought periods are compared against documented droughts to evaluate whether the human experience of drought  is reflected in simulated groundwater changes. The goal of this study is to provide a regional assessment of drought propagation into groundwater across Southern Africa and to identify where groundwater systems may be vulnerable to drought. 

How to cite: Quigley, L. and Callaghan, K.: A multi-proxy approach to evaluating  Drought in Southern Africa: climate, vegetation, and water table, EGU General Assembly 2026, Vienna, Austria, 3–8 May 2026, EGU26-15327, https://doi.org/10.5194/egusphere-egu26-15327, 2026.

EGU26-15382 | PICO | HS2.1.1

The role of ENSO and Atlantic Niño on rainfall variability and extremes in West Africa 

Jan Bliefernicht, Lisa Kloos, Windmanagda Sawadogo, Souleymane Sy, Aissatou Ndiaye, Thomas Jagdhuber, and Harald Kunstmann

The African monsoon is governed by the complex interplay of large-scale atmospheric and oceanic processes. Understanding how these drivers influence rainfall variability can improve the prediction of hydro-meteorological extremes (e.g. heavy rainfall, droughts) for this vulnerable region. This study examines the role of dominant climate modes, such as the El Niño–Southern Oscillation (ENSO) and the Atlantic Niño, in modulating rainfall variability and extremes over West Africa. Unlike previous studies, this investigation is conducted across seven objectively defined rainfall zones in West Africa, describing typical rainfall regimes (e.g. Sahelian) for the region. Moreover, the analysis builds on an advanced quality-controlled station-based rainfall dataset, namely the West African Historical Precipitation Database, compiled over the past decade to improve the coverage and quality of data from rain gauges in this region. To describe the state of ENSO, the Atlantic Niño and other climate modes, various state-of-the art indices (e.g. MEIv2, ATL3, DMI, AMM, SOI) and indices specifically established for West African Monsoon (e.g. the African Southwesterly Index ASWI) are used. The statistical relationships between climate modes and rainfall variability are assessed for the seasonal rainfall amount and other rainfall statistics (e.g. onset, rainfall probability, mean-wet day amount) for the main monsoon phases over a period of 50 years (e.g. 1960 to 2010). Preliminary results show that JAS-rainfall for the Sahelian and Sudan savanna region is controlled by both, ENSO and Atlantic Niño, and low-level wind dynamics. The ASWI alone can explain up to 50% of the rainfall variability in this region compared to 20% for MEIv2 and ALT3. Moving southwards to the coastal regions with two monsoon peaks (MJJ and SON), ENSO becomes the dominant driver for MJJ-rainfall with lagged impacts between 1 to 3 months. Notably, ATL3 displays regime-dependent sign reversals, highlighting the contrasting impacts of Atlantic Niño across the region. Our findings indicate that WAM is strongly influenced by various drivers whose dependence structure with monsoonal rainfall varies in space and time. This reflects shifts in teleconnection dynamics and emphasizes the development of modelling approaches that can capture this non-stationarity in a suitable way.   

How to cite: Bliefernicht, J., Kloos, L., Sawadogo, W., Sy, S., Ndiaye, A., Jagdhuber, T., and Kunstmann, H.: The role of ENSO and Atlantic Niño on rainfall variability and extremes in West Africa, EGU General Assembly 2026, Vienna, Austria, 3–8 May 2026, EGU26-15382, https://doi.org/10.5194/egusphere-egu26-15382, 2026.

Coastal megacities like Lagos, Nigeria, face major water security challenges. Rapid population growth and urbanization are placing enormous pressure on water resources. Lagos domestic water supply is almost entirely sourced from its underlying multi-layered aquifer. Sustainable groundwater management requires a robust conceptual model of that Lagos coastal aquifer system that resolves subsurface heterogeneity, hydrostratigraphy, hydraulic connectivity, degree of confinement, saltwater intrusion, and anthropogenic contamination. Such model is currently hampered by fragmented subsurface data and prevalence of undifferentiated lithologies. The coastal aquifer system has been typically described as comprising three main aquifers units separated by aquitards of variable thickness and discontinuous lateral extent, and underlain by a thick clay aquitard found between ~150-250+ m depth below surface, with a general dipping toward the ocean. This study develops a data-driven framework using novel integration of borehole geophysical datasets with machine learning (ML) techniques to improve Lagos aquifer system conceptualisation and quantify uncertainty.

We compiled and synthesized an extensive database, including over 100 borehole gamma-ray and resistivity logs. The well-logs were processed using unsupervised ML clustering to objectively delineate the aquifer lithology and hydrostratigraphy. Gamma-ray log responses revealed pronounced vertical and lateral heterogeneity, with distinct clay-rich and sand-dominated horizons that allow clearer differentiation of previously undifferentiated aquifer/aquitard units across the aquifer system. Resistivity patterns further delineated the saline water occurrence in southern Lagos, revealing the clearer saline intrusion extent.

Building upon the lithological and hydrological delineations, we further constructed a high-resolution 3D aquifer model using a novel machine learning (ML) technique. Unlike conventional geostatistical methods like Ordinary Kriging, which can under-perform for the non-stationary processes inherent to complex coastal sedimentary geology, we developed a specialized artificial neural network (ANN) scheme. This architecture used a series of distance-based basis functions as covariates to directly predict spatial interpolation weights. Critically, the training process incorporates ridge regression and an entropy-based regularization, enabling the model to capture both smooth regional trends and abrupt lithological variations observed in boreholes. Furthermore, the framework provides robust uncertainty quantification by differentiating between data noise (aleatoric uncertainty) and model uncertainty (epistemic uncertainty addressed using ensemble methods and Monte Carlo dropout). The ML technique was validated against synthetic benchmarks and applied to generate a probabilistically constrained 3D model by transforming discrete, irregular borehole observations into a continuous, uncertainty-aware volumetric representation.

The 3D model offers an unprecedented view of aquitard continuity and aquifers hydraulic connectivity, potential recharge pathways, and areas vulnerable to over-abstraction or saline intrusion, creating a robust framework for groundwater assessment and sustainable management in Lagos. This technique offers a transferable framework for hydrogeological studies in data-limited coastal megacities across Africa.

How to cite: Olabode, O., Giannakis, I., and Comte, J.-C.: Data-driven conceptualisation of the complex multilayered coastal aquifer system underlying Lagos megacity, Nigeria: Integrating borehole geophysics and machine learning, EGU General Assembly 2026, Vienna, Austria, 3–8 May 2026, EGU26-18298, https://doi.org/10.5194/egusphere-egu26-18298, 2026.

EGU26-18605 | PICO | HS2.1.1

Recharge in natural and urbanised subhumid dryland basement aquifers in Sub-Saharan Africa 

Bentje Brauns, Onesmus Tirivashe Kativhu, Dan J. Lapworth, Alan M. MacDonald, Daina Mudimbu, Richard J. S. Owen, Samson Shumba, and Moses Souta

Understanding groundwater recharge processes in dryland and seasonally dry subhumid environments is central to improving water‑resource resilience under increasing climatic variability and land‑use change. This study integrates multi‑year groundwater level observations from crystalline basement aquifers in an unpumped agricultural setting about 30 km north of Harare, Zimbabwe (2018-2025) with recent groundwater‑level data from eight boreholes monitored in the pumped urban area of the city (2022–2025). Together, these high-resolution (30-min frequency) datasets provide insight into both natural and urbanised dryland systems, where recharge is highly sensitive to rainfall variability and human pressures.

Recharge in the agricultural sites was characterised using water‑table fluctuation (WTF) methods, chloride mass balance (CMB), water‑stable isotopes, and dissolved gas residence time tracers. The effect of variation in land use—such as tilled land, land under conservation agriculture, and woodland—on the responses to cumulative rainfall and rainfall events of varying magnitude was studied by integrating daily rainfall data collected at the research site. Recharge was observed for most years across all sites and was controlled by hydrogeological settings, rainfall totals and antecedent conditions, i.e. the groundwater level at the end of the preceding dry season. No measurable recharge occurred at most of the agricultural sites during a year of poor rainfall (380 mm total), highlighting the strong climatic dependency of basement‑aquifer recharge in subhumid drylands. Annual groundwater level variations were mostly limited to 2 to 3 m.

In contrast, the urban groundwater dataset from Harare revealed markedly different recharge behaviour. Groundwater‑level fluctuations were strongly influenced by nearby pumping, producing hydrographs that diverged from the smoother, rainfall‑controlled signals seen in natural settings and showing much stronger annual variation of groundwater levels up to about 15 m. However, pumping did not mask the overall annual recharge pattern, though at some sites, groundwater capture was markedly increased. A subset of the boreholes had similar hydrographs to those in the unpumped, agricultural setting. The variability in drawdown and recovery responses across the eight urban boreholes underscores the need for well‑designed, spatially distributed groundwater‑monitoring networks to evaluate the sustainability of abstraction and to detect changes in recharge availability under increasing urban water demand. In addition, capturing and integrating existing datasets—such as drilling logs, pump tests, and historical abstraction records—can provide valuable baseline information to support groundwater management in Harare.

Taken together, these findings advance understanding of recharge processes in both natural and urban dryland basement aquifers, emphasise the sensitivity of recharge to climatic variability, and highlight the implications for sustainable groundwater management under changing land use and rainfall regimes.

How to cite: Brauns, B., Kativhu, O. T., Lapworth, D. J., MacDonald, A. M., Mudimbu, D., Owen, R. J. S., Shumba, S., and Souta, M.: Recharge in natural and urbanised subhumid dryland basement aquifers in Sub-Saharan Africa, EGU General Assembly 2026, Vienna, Austria, 3–8 May 2026, EGU26-18605, https://doi.org/10.5194/egusphere-egu26-18605, 2026.

EGU26-19169 | PICO | HS2.1.1

Stakeholders engagement in Integrated Water Resources Management in the Saïss Basin, Morocco: Challenges and Responses under climate change conditions  

Safae Ijlil, Ali Essahlaoui, Mohammed Hssaisoune, Narjisse Essahlaoui, Anton Van Rompaey, El Mostafa Mili, Ismail Ait Lahssaine, Elhousna Faouzi, and Lhoussaine Bouchaou

Water stress and groundwater overexploitation constitute critical challenges to water sustainability in semi-arid regions. In Morocco, the Saïss Basin represents a strategic agricultural area facing increasing pressure on groundwater resources due to intensive irrigation, fragmented governance, and limited coordination among water stakeholders. This study assesses the effectiveness of stakeholder’s integration within the Integrated Water Resources Management (IWRM) framework, with a focus on governance, participation, and decision-making processes. A mixed-methods approach was adopted, combining stakeholder surveys, institutional analysis, and a SWOT-based evaluation to address both technical and socio-institutional dimensions of water management. Key stakeholders’ groups, including public authorities, water agencies, agricultural users, and local organizations, were analyzed in terms of their roles, interactions, and influence on groundwater management. The results reveal a persistent gap between IWRM principles and their practical implementation, characterized by limited stakeholder coordination, uneven participation, and sectoral fragmentation. While institutional frameworks for IWRM exist, their operationalization remains constrained by power asymmetries, insufficient data sharing, and weak integration of local actors in decision-making. The SWOT analysis highlights opportunities for improving stakeholder engagement through participatory platforms, capacity building, and the integration of scientific knowledge into policy processes.

This study provides evidence-based insights into the governance barriers hindering effective IWRM implementation in groundwater-dependent regions. The findings contribute to ongoing debates on adaptive water governance and offer practical recommendations to strengthen stakeholder integration as a pathway toward sustainable groundwater management and the achievement of SDG 6 in arid and semi-arid regions.

How to cite: Ijlil, S., Essahlaoui, A., Hssaisoune, M., Essahlaoui, N., Van Rompaey, A., Mili, E. M., Ait Lahssaine, I., Faouzi, E., and Bouchaou, L.: Stakeholders engagement in Integrated Water Resources Management in the Saïss Basin, Morocco: Challenges and Responses under climate change conditions , EGU General Assembly 2026, Vienna, Austria, 3–8 May 2026, EGU26-19169, https://doi.org/10.5194/egusphere-egu26-19169, 2026.

EGU26-19778 | ECS | PICO | HS2.1.1 | Highlight

Advancing drought risk analysis and management: a case study of Kenya 

Rhoda A. Odongo, Ileen Streefkerk, Anne F. Van Loon, Oliver Wasonga, Hans De Moel, Marthe Wens, Jens De Bruijn, and Jeroen Aerts

In 2019, scientists from African countries called for more research on drought and better drought forecasting and management (Padma, 2019). Between 2020 and 2023, the Horn of Africa had experienced the worst drought in 40 years, with severe consequences related to reduced agricultural productivity and high food prices (Okoth, 2024). In this presentation, we will showcase the drought research done within the DOWN2EARTH project with a case study in Kenya.

Agro-pastoral livelihoods in the Horn of Africa (HoA) are acutely exposed to climate variability due to the predominance of rain-fed systems. Yet drought risk emerges from more than rainfall deficits—it reflects interacting biophysical processes, socio-economic vulnerability, and institutional response capacity. We advance an integrated, impact-based and adaptation-informed framework by combining statistical risk modelling across Kenya’s arid and semi-arid lands (ASALs) with a coupled socio-hydrological and agent-based simulation of human–water interactions.

First, using Spearman correlations and Random Forest regression, we link drought hazards to observed societal impacts and identify distinct timescale sensitivities: short (2–6 months) precipitation deficits align with increased household water trekking distances, while medium-to-long drought indices (5–24 months) better explain declines in milk production and increases in malnutrition. Clustering counties by vulnerability profiles improves predictive skill. Socio-economic clustering best captures water access outcomes, whereas environmental clustering better explains agricultural and nutrition impacts. Extending to probabilistic risk via Random Forest hindcasts (1984–2014) yields Average Annual Loss (AAL) and Probable Maximum Loss (PML) estimates, highlighting spatial heterogeneity: high water-access risk in northwestern Kenya and elevated livestock, milk, and malnutrition risk in eastern and southeastern counties. Priority adaptation pathways include sanitation and safe water access, poverty reduction, and small-scale water infrastructure.

Second, the ADOPT‑AP framework couples the DRYP hydrological model with a behavioural agent model to simulate bounded-rational adaptation and policy scenarios. Sensitivity analysis identifies irrigation abstraction as the dominant driver of both drought hazard and adaptation uptake. Replacing upstream commercial farms with communities or forests increases downstream streamflow and groundwater, modestly improving water access and production in drought years. During the 2020–2023 drought, doubling extension access marginally boosts low-cost measure adoption but not capital-intensive options, underscoring finance constraints; scaling water harvesting improves milk and reduces water trekking but has mixed crop effects and downstream hydrological trade-offs.

Together, these results demonstrate how vulnerability-informed, spatially targeted interventions and dynamic adaptation modelling can be used to strengthen early warning, guide equitable water governance, and build long-term resilience. However, improving drought management requires more than research. Early warnings are for example often not acted upon because of cultural values or limited resources. We therefore advocate for more transdisciplinary research, co-creation of drought adaptation solutions, and strengthening connections between communities and formal governance actors.

References

Padma, T. V. (2019). African nations push UN to improve drought research. Nature, 573(7774).

Okoth, D. (2024). The cost of African drought. Nature Africa, doi.org/10.1038/d44148-024-00075-0.

How to cite: Odongo, R. A., Streefkerk, I., Van Loon, A. F., Wasonga, O., De Moel, H., Wens, M., De Bruijn, J., and Aerts, J.: Advancing drought risk analysis and management: a case study of Kenya, EGU General Assembly 2026, Vienna, Austria, 3–8 May 2026, EGU26-19778, https://doi.org/10.5194/egusphere-egu26-19778, 2026.

EGU26-21954 | ECS | PICO | HS2.1.1

 Groundwater–Surface Water Interactions in Ethiopia: A Review of Knowledge Gaps, Emerging Opportunities, and the Role of Integrated HydroGeoSphere Modeling under Climate Change 

Anteneh Yayeh Adamu, Asmare Belay Nigussie, Steven K. Frey, Assamen Ayalew Ejigu, and Hazen A. J. Russell

In climate-vulnerable and data-scarce countries like Ethiopia, developing an understanding of groundwater–surface water (GW–SW) interactions is essential to understanding hydrological and hydrogeological functioning, ecological resilience, water security, and sustainable water resource management. Water resources in Ethiopia support rain-fed and irrigated agriculture, domestic supply, urban centers, hydropower, and water-dependent ecosystems. Current understanding of GW–SW processes in Ethiopia is fragmented, with most existing groundwater and surface water studies conducted independent of one another. The result is substantial knowledge gaps pertaining to effects of widespread irrigation, land-use change, and climate change on connected water systems, capacity of aquifers during droughts, and seasonal GW–SW exchange fluxes and GW contribution to stream flow.  A literature  analysis of GW–SW interactions in Ethiopia highlights methodological and scientific limitations, and indicates opportunity to improve GW–SW understanding through fully-integrated GW–SW modeling. GW–SW interaction investigations in Ethiopia are primarily local and clustered geographically. The dynamic feedbacks between surface water, unsaturated zones, and aquifers are still not well quantified, with most studies relying on point-scale hydrogeochemical indicators, baseflow separation methods, or groundwater potential mapping. Predictive understanding hydroclimatic datasets and hydrogeological processes is limited by lack of long-term monitoring data, inconsistent conceptual models, and minimal representation of land-use change and unknown human water abstraction.  There are no fully-integrated GW–SW modeling studies at a basin/watershed scale in Ethiopia, although loosely coupled models have been used.  As part of a Natural Resources Canada Technical Assistance Program with Wollo University, a HydroGeoSphere fully-integrated GW–SW model for the Borkena watershed, located on the northeastern margin of the Rift Valley, has been created for educational and training purposes. The development of the HGS model followed the framework laid out in the Canada1Water initiative for national scale water resources assessment. As part of the model construction process, requisite data has been assembled from globally extensive sources, including geology, hydrology, soil, landcover and vegetation, and climatology; thus demonstrating that state-of-the-art models can be deployed in perceived data sparse regions. Following construction, model application can be demonstrated towards long-term water security planning, climate resilience, and sustainable water management in Ethiopia. The framework developed in this project is broadly applicable to other Sub-Saharan African nations, where process-based understanding of GW–SW interactions is indispensable but still lacking.

How to cite: Adamu, A. Y., Nigussie, A. B., Frey, S. K., Ejigu, A. A., and Russell, H. A. J.:  Groundwater–Surface Water Interactions in Ethiopia: A Review of Knowledge Gaps, Emerging Opportunities, and the Role of Integrated HydroGeoSphere Modeling under Climate Change, EGU General Assembly 2026, Vienna, Austria, 3–8 May 2026, EGU26-21954, https://doi.org/10.5194/egusphere-egu26-21954, 2026.

EGU26-1220 | ECS | Posters on site | HS2.1.2

Advancing NPP modelling to support sustainable management in Brazil’s semi-arid ecosystems 

Sabrina Oliveira, Ulisses Bezerra, Artur Lourenço, Fernanda Valente, and John Cunha

The Caatinga, the largest tropical dry forest in South America, holds significant yet often unrecognized potential for carbon sequestration and ecosystem functioning despite its highly seasonal and water-limited environment. However, carbon dynamics in this biome remain poorly quantified, especially regarding how vegetation structure, climate variability, and land-use interventions influence net primary productivity (NPP). This knowledge gap is particularly concerning given that the Caatinga is the Brazilian biome most severely affected by land degradation. Approximately 12% of its territory is classified within the two highest degradation classes, characterized by vegetation loss, low productivity, and depleted soil organic matter. This degradation process disproportionately affects traditional populations, such as Indigenous Peoples, Quilombola communities, and smallholder farmers, who rely directly on natural resources for their livelihoods.

To address this gap, we integrate satellite-based remote sensing, eddy-covariance observations, and ecological modeling to investigate spatial and temporal patterns of NPP under contrasting vegetation conditions and management regimes. First, we estimate NPP using a Light Use Efficiency (LUE) model driven exclusively by remote sensing inputs and compare these outputs with flux tower-derived NPP calculated from flux measurements collected during both a dry year and a wet year. This comparison enables the assessment of how semi-arid constraints, such as recurrent droughts, elevated temperatures, and soil water scarcity, shape photosynthetic efficiency and biomass accumulation. Once validated, the LUE model is applied to characterize spatial and temporal patterns of NPP in two contrasting socio-ecological contexts: a degraded area and a recovering area. This approach allows us to evaluate how contrasting management conditions influence the capacity of Caatinga vegetation to assimilate carbon.

Preliminary results indicate a strong sensitivity of NPP to rainfall variability and canopy structure, with degraded areas showing reduced carbon sequestration compared to conserved areas. These findings contribute to broader discussions on sustainable land management in the Brazilian Semi-Arid region and the urgent need for inclusive public policies to mitigate land degradation, protect ecosystems, and support the livelihoods of local communities.

How to cite: Oliveira, S., Bezerra, U., Lourenço, A., Valente, F., and Cunha, J.: Advancing NPP modelling to support sustainable management in Brazil’s semi-arid ecosystems, EGU General Assembly 2026, Vienna, Austria, 3–8 May 2026, EGU26-1220, https://doi.org/10.5194/egusphere-egu26-1220, 2026.

EGU26-4955 | Orals | HS2.1.2 | Highlight

Land–atmosphere feedbacks a mechanism of dryland expansion 

Akash Koppa

Just in the last four decades, ~5 million sq.km of humid land has transformed into a dryland. A rapidly warming climate is expected to further accelerate this dryland expansion. Consequently, not only will societies face permanent water insecurity, but plant and animal biodiversity will be under threat. Despite these consequences, very little is known about the physical mechanisms which cause irreversible drying of humid regions. As a result, our ability to predict the future expansion of drylands and its impact remains limited. Learning how drylands have expanded historically from humid regions could hold the key to predicting how they might expand in the future. So far, dryland expansion has been attributed to shifts in atmospheric circulation, topography, and orbital cycles. However, these changes occur at timescales reaching up to millions of years and thus do not fully explain the current rate of expansion. In this regard, the role of vegetation response to atmospheric drying and the consequent changes in land–atmosphere interactions have been largely ignored as possible mechanistic pathways of dryland expansion. Here, by tracking the air flowing over drylands, I show that the warming and drying of that air by changes in dryland vegetation-driven land–atmosphere feedback contributes to dryland expansion in the downwind direction. As they dry, drylands contribute less moisture and more heat to downwind humid regions, reducing precipitation and increasing atmospheric water demand, which ultimately causes their aridification. In ~40% of the land area that recently transitioned from a humid region into a dryland, self-expansion accounted for >50% of the observed aridification. Our results highlight the urgent need for climate change mitigation measures in drylands and provide a scientific basis for land-based interventions to prevent irreversible drying of humid regions


How to cite: Koppa, A.: Land–atmosphere feedbacks a mechanism of dryland expansion, EGU General Assembly 2026, Vienna, Austria, 3–8 May 2026, EGU26-4955, https://doi.org/10.5194/egusphere-egu26-4955, 2026.

EGU26-5965 | ECS | Posters on site | HS2.1.2

Transfer Learning for Streamflow Modelling Among Sub-Basins of the Brazilian Semi-Arid Region 

Taís Fonte Boa de Campos Maia, Marina Marcela de Paula Kolanski, André Rodrigues, and Bruno Brentan

Streamflow forecasting is an essential component of effective water resources management, particularly in regions highly vulnerable to extreme hydroclimatic events, such as the Brazilian semi-arid region, which is characterized by pronounced spatial and temporal variability of precipitation, frequent droughts, and occasional flood events. The scarcity, irregularity, and limited duration of hydrological data in many watersheds of this region pose significant challenges to traditional hydrological modeling approaches, restricting the ability to make informed decisions in water resources planning and operational management. In recent years, machine learning–based models, particularly Long Short-Term Memory (LSTM) recurrent neural networks, have shown considerable potential for streamflow modelling due to their ability to capture complex nonlinear relationships and long-term temporal dependencies between precipitation, catchment storage, and runoff generation processes. However, the modelling performance is highly dependent on the availability of extensive and continuous historical records, which limits their direct applicability in data-scarce watersheds. In this context, transfer learning has emerged as a promising strategy to overcome these limitations by enabling the transfer of knowledge learned in well-monitored source sub-basins to improve predictions in target watersheds with limited data availability. This study aims to evaluate the transferability of deep learning models for streamflow modelling among watersheds of the Brazilian semi-arid region, considering different scenarios of data availability. The study also seeks to identify the main physical and hydrological parameters that influence both the performance and transferability of the models. LSTM models were initially pre-trained on watersheds with longer historical records and subsequently fine-tuned for watersheds with varying levels of available local data. Performance evaluation, conducted using widely adopted hydrological metrics, demonstrated that knowledge transfer is effective, allowing significant gains in predictive accuracy even when local datasets are limited. Furthermore, it was observed that certain hydrological and physiographic attributes exert a direct influence on the models’ ability to generalize to new basins. The application of eXplainable Artificial Intelligence (XAI) techniques further reinforced the physical consistency of the streamflow modelling, enhancing both interpretability and reliability of the results. Overall, the use of transfer learning proved to be a highly promising strategy for improving hydrological modelling in data-scarce semi-arid regions, reducing dependence on long-term monitoring, supporting more effective water resources management, and contributing to risk mitigation and sustainability in these vulnerable environments.

How to cite: Fonte Boa de Campos Maia, T., Marcela de Paula Kolanski, M., Rodrigues, A., and Brentan, B.: Transfer Learning for Streamflow Modelling Among Sub-Basins of the Brazilian Semi-Arid Region, EGU General Assembly 2026, Vienna, Austria, 3–8 May 2026, EGU26-5965, https://doi.org/10.5194/egusphere-egu26-5965, 2026.

EGU26-5983 | Orals | HS2.1.2

Streamflow event clustering and vadose-zone memory as coupled controls on focused groundwater recharge in dryland catchments 

Gabriel C. Rau, José Bastías Espejo, Ian Acworth, Martin S. Andersen, Dylan Irvine, Tony Bernardi, and Mark O. Cuthbert

Groundwater recharge is one of the least constrained hydrological fluxes in dryland catchments, particularly where thick vadose zones, ephemeral streamflow, and high evaporative demand decouple rainfall from aquifer replenishment. Recharge is commonly attributed to rare, high-magnitude floods, yet this perspective rarely accounts for event sequencing and vadose-zone memory. Here, we synthesise multi-year hydrometric observations and process-based simulations from an ephemeral dryland stream in the arid zone of Australia (Fowlers Gap, NSW) to show that temporal clustering of moderate streamflow events can enable focused recharge where thick vadose zones impose strong percolation thresholds. Field data indicate that several historic floods produced substantial vadose-zone wetting but no sustained groundwater response, whereas sequences of closely spaced, moderate flows generated delayed, yet persistent water-table rise beneath the channel.

Numerical simulations demonstrate that event clustering progressively wets the vadose zone, suppresses evapotranspiration losses, and non-linearly increases unsaturated hydraulic conductivity, resulting in sufficient flow via the streambed to measurably recharge the aquifer. These results show that groundwater recharge in dryland catchments emerges from the interaction between event sequencing, vadose-zone properties, transmission losses, and evapotranspiration, rather than from rainfall or streamflow magnitude alone. Under projected climate change, shifts toward more intense but less frequent rainfall may reduce recharge by disrupting event clustering, even where total precipitation remains unchanged. Explicitly accounting for vadose-zone memory and event sequencing is therefore essential for recharge estimation, model calibration, and dryland water-resource assessments.

How to cite: Rau, G. C., Bastías Espejo, J., Acworth, I., Andersen, M. S., Irvine, D., Bernardi, T., and Cuthbert, M. O.: Streamflow event clustering and vadose-zone memory as coupled controls on focused groundwater recharge in dryland catchments, EGU General Assembly 2026, Vienna, Austria, 3–8 May 2026, EGU26-5983, https://doi.org/10.5194/egusphere-egu26-5983, 2026.

EGU26-7899 | ECS | Orals | HS2.1.2

Controls on drought propagation in drylands 

George Blake, Katerina Michaelides, Michael Singer, E. Andrés Quichimbo, and Mark Cuthbert

Drought propagation in dryland environments is often conceptualised as a sequential transfer of meteorological deficits into soil moisture, streamflow, and groundwater drought with the propagation rate controlled by catchment and aquifer properties. However, quantifying the spatial and temporal propagation of rainfall deficits remains challenging because few hydrological models explicitly connect climate forcing to all relevant hydrological stores and fluxes, or represent their interactions across spatial scales. Here, we investigate how meteorological drought propagates through overland flow, streamflow, and soil moisture into groundwater storage across dryland catchments in the Horn of Africa. We hypothesise that drought propagation will be related to aridity, catchment scale, and lateral groundwater connectivity. To investigate these ideas, we use the 1 km resolution DRYland water Partition (DRYP) hydrological model to simulate daily water-balance components across the Horn of Africa from 2000–2023. To examine the influence of basin size, catchments are delineated using a range of stream orders (4–8); for example, stream order 5 yields ~1,300 basins with a mean area of ≈900 km² spanning hyper-arid to humid conditions. We focus on regionally widespread meteorological drought events defined using SPEI-12 (derived from CHIRPS rainfall and hPET); catchment-mean SPEI is used to identify basins experiencing prolonged meteorological drought (> 12 months). We then use basin-scale total water storage anomaly (TWSA) and the standardised total water storage index (STWSI) to explore groundwater dynamics in basins experiencing prolonged drought. Our analysis reveals substantial spatial heterogeneity in groundwater response to meteorological drought. Even during prolonged drought events, many basins exhibit neutral or increasing TWSA trends, with coherent spatial clusters of both declining and increasing storage observed within the same drought period. These results demonstrate that meteorological drought does not consistently translate into groundwater drought, even over multi-year timescales. We explore how aridity, basin size, and lateral groundwater contributions can decouple groundwater dynamics from atmospheric water deficits, leading to enhanced drought resilience in some regions (and longer recovery in others). This work highlights the limitations of assuming fixed drought-propagation pathways in drylands and demonstrates the value of high-resolution modelling for improving drought monitoring and water-resource management under increasing climate variability.

How to cite: Blake, G., Michaelides, K., Singer, M., Quichimbo, E. A., and Cuthbert, M.: Controls on drought propagation in drylands, EGU General Assembly 2026, Vienna, Austria, 3–8 May 2026, EGU26-7899, https://doi.org/10.5194/egusphere-egu26-7899, 2026.

The Qaidam Basin, located on the northern margin of the Qinghai-Tibet Plateau in China, is the second-largest inland basin in the country. Hosting numerous salt lakes rich in mineral resources, with particularly prominent lithium reserves. The Nalenggele River, the largest inland river within the Qaidam Basin, hosts the most extensive brine-type lithium deposit in China in its terminal salt lake region. With lithium resources reaching 2.3 million tons, this deposit accounts for approximately 87% of Chinese total lithium reserves. The genetic mechanism of brine in this terminal salt lake area is closely linked to hydrogeochemical processes. Previous studies have primarily focused on the qualitative analysis of hydrogeochemical processes, while relatively few have quantitatively assessed the impact of different hydrogeochemical processes. In this study, river water and groundwater from the mountainous areas to the basin within the watershed are selected as the research objects. Multiple isotopic tracers (δ²H, δ¹⁸O, ⁸⁷Sr/⁸⁶Sr, δ11B and δ7Li) are employed to trace the material sources and evolutionary processes of elements. The material sources, controlling factors and evolutionary mechanisms of hydrochemistry in the Nalenggele River Basin are clarified. The Positive Matrix Factorization model is applied to quantitatively identify the recharge sources of different water bodies, trace the material sources of major ions, and elucidate the evolutionary processes of the watershed hydrological cycle. The results show that: (1) The hydrochemical compositions of both river water and groundwater are dominated by Na⁺ and Cl⁻. The hydrochemical types evolve from mixed Cl·HCO₃·SO₄-Na·Ca type in the upstream rivers to Cl-Na type in the downstream waters. Analyses of ionic ratios and strontium isotope data confirm that water-rock interaction is the primary controlling factor of hydrochemical compositions, which is characterized by silicate weathering as the dominant process, supplemented by carbonate weathering and evaporite (halite, gypsum, mirabilite) dissolution. Cation exchange exhibits spatial heterogeneity: forward exchange (Ca²⁺/Mg²⁺ vs. Na⁺/K⁺) occurs in the upstream and downstream areas, while reverse exchange takes place in the midstream area. (2) Evidence from δ²H and δ¹⁸O indicates that river water is mainly recharged by atmospheric precipitation from the southern mountainous areas with the elevation of 4700m. Groundwater has close hydraulic connectivity with river water, showing bidirectional recharge-discharge interactions. (3) The observed B and Li isotopic footprints in the Nalenggele River Catchment are significantly depleted in heavy isotopes compared with those in other geological systems dominated by natural weathering processes. In the upper reaches of the Nalenggele River, the concentrations of B and Li increase sharply, while the δ¹¹B and δ⁷Li values decrease gradually. The mechanism responsible for the B and Li enrichment is mainly associated with the Li-B supply potential of material sources, favorable tectonic conduits for water circulation, and high evaporation rates. (4) The Positive Matrix Factorization model quantitatively reveals the contribution rates of different hydrogeochemical processes during the hydrological cycle, specifically: evaporite mineral dissolution (28%), mixed evaporite dissolution (25%), agricultural activity (17%), and silicate weathering (30%). This study provides a comprehensive framework for integrating multi-isotope tracers and statistical models to quantify hydrochemical processes in arid inland basins.

How to cite: Zhang, S., Zhao, C., Liu, K., and Zhang, Y.: Revealing hydrochemical characteristics and evolution process of river and groundwater in the Nalenggele Basin, northwest China: insights from major ions, multi-isotopes (H、O 、Sr、B and Li) tracers, and positive matrix factorization, EGU General Assembly 2026, Vienna, Austria, 3–8 May 2026, EGU26-8648, https://doi.org/10.5194/egusphere-egu26-8648, 2026.

EGU26-9343 | ECS | Posters on site | HS2.1.2

Climatic, topographic, and groundwater controls on runoff response to precipitation: evidence from a large-sample data set 

Zahra Eslami, Hansjörg Seybold, and James W Kirchner

Runoff responses to precipitation can vary widely across catchments and climates, shaped by hillslope water storage and release dynamics and by the transmission of hydrological signals through channel networks. Understanding these controls is critical for interpreting hydrological behavior and informing water resource management.

Here, we apply ensemble rainfall–runoff analysis (ERRA) to characterize runoff responses across 189 Iranian catchments spanning diverse landscapes and climates. ERRA quantifies the increase in lagged streamflow attributable to each unit of additional precipitation while accounting for nonlinear catchment behavior.

Peak runoff response, as quantified by ERRA across Iran, is higher in more humid climates, in steeper and smaller catchments, and in catchments with shallower water tables. The direction and approximate magnitude of these effects persist after accounting for correlations among the drivers (e.g., deeper water tables are more common in more arid regions).

These findings highlight the importance of catchment attributes in shaping runoff behavior, particularly in arid and semi-arid regions, where climatic variability and groundwater dynamics play a crucial role in sustainable water resource management and effective flood risk mitigation.

How to cite: Eslami, Z., Seybold, H., and Kirchner, J. W.: Climatic, topographic, and groundwater controls on runoff response to precipitation: evidence from a large-sample data set, EGU General Assembly 2026, Vienna, Austria, 3–8 May 2026, EGU26-9343, https://doi.org/10.5194/egusphere-egu26-9343, 2026.

Climate seasonality, characterized by alternating drought and rainfall, drives the degradation and recovery of soil properties that shape hydrological functioning. These shifts can trigger ecohydrological responses such as increased runoff, reduced soil water availability, and vegetation decline, while subsequent recovery may enable partial or full restoration of soil hydraulic properties. The objective of this study was to determine how the interaction of these mechanisms, driven by stochastic climatic inputs, shapes the soil water balance, with particular emphasis on runoff generation.

We developed a conceptual model in which soil hydraulic properties are represented as a dynamic variable subject to degradation, recovery, or no change, formulated using discrete-state logic. In a specific implementation, state-dependent thresholds determine system behavior: degradation occurs as a discrete jump triggered by abrupt wetting of the soil, characterized by rapid wetting from a dry state to an upper moisture threshold; recovery follows a time-dependent trajectory when soil moisture is maintained within this threshold for a sufficient duration; and outside these conditions, no change occurs. This variable dynamically scales infiltration capacity, allowing rainfall under degraded conditions to generate surface runoff.

Resulting runoff time series were normalized by annual evaporation and classified using agglomerative hierarchical clustering with dynamic time warping. Three characteristic runoff patterns emerged: (i) rapid recovery with sub-decadal runoff decline; (ii) an intermediate transitional pattern with slower recovery and moderate runoff persistence; and (iii) permanent degradation associated with multi-decadal runoff regimes. To identify the drivers of these patterns, we analyzed a dimensionless set of parameters using linear discriminant analysis. The dominant control leading to degradation was the temporal clustering of rainfall, defined as the relative duration of rainfall events compared to the expected interarrival time between events.

Using dimensionless parameter combinations that express state-shifting forcings associated with each regime, we investigated clusters of runoff patterns. The results indicate that temporally isolated rainfall events can trigger irreversible state shifts leading to runoff-dominated regimes, whereas sustained or closely spaced rainfall events have the potential to initiate recovery processes spanning multiple decades.

How to cite: Hinz, C., Monhasser, A., and Wachsmut, G.: Event-based changes in hydraulic properties of surface soils in semi-arid regions may generate surface runoff regimes at decadal timescales, EGU General Assembly 2026, Vienna, Austria, 3–8 May 2026, EGU26-9834, https://doi.org/10.5194/egusphere-egu26-9834, 2026.

EGU26-11211 | Orals | HS2.1.2

Regionalization of streamflow intermittency in Mediterranean catchments (Southern Italy) 

Fatemeh Moradi, Roberta Padulano, and Giuseppe Del Giudice

Flow Duration Curves (FDCs) are used to describe streamflow variability and support water-resources planning. In Mediterranean climates, intermittent rivers challenge FDC regionalization because zero-flow periods influence the lower part of the curve and discharge observations are scarce or fragmented in gauged basins. Southern Italy is a representative case where historical hydrological information is discontinuous and uncertain, so regional tools are needed to infer flow behavior in unmonitored catchments [1].

This study utilizes historical daily discharge from 58 gauging stations across three regions in southern Italy, covered by the Departments of Napoli (1925–1994), Bari (1950–1996), and Catanzaro (1950–1984). Stations were retained if they provide at least 15 years of records. Streamflow intermittency is quantified using the Intermittency Ratio (τ), defined as the fraction of non-zero daily discharge observations over the total number of daily observations. In the selected dataset, 20 stations exhibit τ < 1, indicating zero-flow days and intermittent behavior; these stations are considered in the intermittency analysis and regionalization.

For each basin, a hydrologically connected DEM was built by integrating an authoritative 20 m × 20 m DTM with the available river network and basin boundaries, enabling extraction of physiographic and morphologic descriptors in a GIS environment, supported by land-cover and geological and rainfall information [2,3]. A set of physiographic, topographic, and climatic covariates was analyzed, starting with collinearity assessment to reduce redundancy among predictors. The dependence of τ on catchment descriptors was investigated through stepwise regression using a power-law formulation. Results show that a parsimonious model based on two predictors—catchment area (A) and a catchment-shape descriptor (SF)—is sufficient to describe a significant portion of the observed variability in τ across the study region (as seen in figure 1).

Model performance is evaluated using standard statistical indices, including R², PBIAS, RMSE, MAE, and MAPE, which summarize explained variance, bias, and absolute/relative errors. The approach supports practical estimation of intermittency in ungauged Mediterranean catchments and provides a basis to incorporate intermittency into FDC regionalization, improving low-flow and zero-flow representation in data-constrained basins.


Figure 1. Observed vs predicted intermittency ratio (τ). Labels: B = Bari, N = Napoli, C = Catanzaro. Dashed line = 1:1.


Keywords: Intermittency ratio, Flow Duration Curve, regionalization, regression, stepwise selection, Mediterranean rivers, Southern Italy, GIS

References:

[1] Viola, F., Noto, L. V., Cannarozzo, M., & La Loggia, G. (2011). Regional flow duration curves for ungauged sites in Sicily. Hydrology and Earth System Sciences, 15(1), 323–331.

[2] Mendicino, G., & Senatore, A. (2013). Evaluation of parametric and statistical approaches for the regionalization of flow duration curves in intermittent regimes. Journal of Hydrology, 480, 19–32.

[3] Burgan, H. I., & Aksoy, H. (2022). Daily flow duration curve model for ungauged intermittent subbasins of gauged rivers. Journal of Hydrology, 604, 127249.

How to cite: Moradi, F., Padulano, R., and Del Giudice, G.: Regionalization of streamflow intermittency in Mediterranean catchments (Southern Italy), EGU General Assembly 2026, Vienna, Austria, 3–8 May 2026, EGU26-11211, https://doi.org/10.5194/egusphere-egu26-11211, 2026.

EGU26-11411 | ECS | Orals | HS2.1.2

Do sediments matter? Assessing sedimentation effects on surface water storage in a semi-arid ephemeral river system 

Monique Fahrenberg, Christian Reinhardt-Imjela, Valentine Katte, Evanilton Pires, Robert Jüpner, and Achim Schulte

Ephemeral river systems are key hydrological components of dryland catchments, particularly in semi-arid regions where surface water availability is highly episodic and closely linked to short-lived rainfall events. Shallow channel depressions temporarily store water and extend its availability beyond individual flow events. However, the extent to which sedimentation affects their long-term storage capacity remains poorly constrained, especially in data-scarce regions of southern Africa. This knowledge gap is increasingly relevant under rising water demand, pronounced climate variability, and more frequent droughts.

This study focuses on the Iishana system, a transboundary network of ephemeral channels and shallow depressions in northern Namibia and southern Angola. The system constitutes the primary rural water resource for a densely populated semi-arid region, with surface water availability largely restricted to short periods following rainfall events. Consequently, the capacity of channel depressions to retain water over extended periods is critical for domestic use, livestock, and small-scale agriculture. Understanding sediment accumulation processes in these depressions is therefore essential for improving water resource management in dryland catchments. The Iishana system is characterized by very low gradients, episodic runoff, and highly variable hydrological connectivity, making it representative of semi-arid environments where event-driven processes, storage, and transmission losses dominate.

The objective of this study is to characterize sediment properties and quantify sedimentation rates in selected depressions in order to assess their influence on surface water storage. Sediment cores were collected from multiple depressions and analyzed using physical and geochemical methods. Chronologies were established using 210Pb and 137Cs radionuclides, supported by radiocarbon dating. Sedimentation rates were calculated using Constant Flux-Constant Sedimentation (CFCS) and Constant Rate of Supply (CRS) models.

Sediments are predominantly fine-grained sand and silt, with weak pedogenic development, indicating limited and discontinuous deposition. The CFCS model results show low accumulation rates ranging from 0.017 to 0.12 cm yr-1, while CRS-derived mass accumulation rates range between 0.05 and 0.07 g cm-2yr-1. Below approximately 10 cm depth, sediment ages commonly exceed 150 years. In contrast, 137Cs activities were very low and lacked identifiable peaks, rendering this radionuclide unsuitable for chronologies in the study area.

The consistently low sedimentation rates indicate that natural sediment infill currently plays a negligible role in reducing the surface water storage capacity of ephemeral depressions within the Iishana system. From a hydrological perspective, this suggests that storage limitations are primarily controlled by hydrological connectivity, event-driven runoff generation, and infiltration rather than by progressive sediment accumulation. The results provide an empirical basis for evaluating the potential of selected depressions for targeted deepening or lateral expansion to enhance short-term surface water storage during episodic flow events.

Furthermore, spatial variability in sediment properties and accumulation rates highlights the importance of site-specific characteristics such as channel connectivity, flow velocity, and local catchment conditions, which are key controls on hydrological processes in dryland systems. By linking sediment dynamics with surface water storage, this study contributes to hydrological modeling, scenario-based planning, and sustainable water management in semi-arid catchments under increasing climatic stress.

How to cite: Fahrenberg, M., Reinhardt-Imjela, C., Katte, V., Pires, E., Jüpner, R., and Schulte, A.: Do sediments matter? Assessing sedimentation effects on surface water storage in a semi-arid ephemeral river system, EGU General Assembly 2026, Vienna, Austria, 3–8 May 2026, EGU26-11411, https://doi.org/10.5194/egusphere-egu26-11411, 2026.

EGU26-13776 | ECS | Posters on site | HS2.1.2

A modeling perspective on hydro-climate variability in dryland lakes : What is the impact of low- to high-frequency and intensity hydro-climate variability on the rise, development, persistence and demise of Lake Eyre - Kati Thanda ? 

Ahmed Naceur Mama, Frédéric Fluteau, Guillaume Le Hir, Jan-Hendrik May, Thomas Faraon, Joep Storms, and Mathieu Schuster

Shallow, temporary salt lakes, known as ephemeral playas, are considered among the hydrogeological most sensitive systems to climatic extreme perturbations and flood extent. With a drainage basin exceeding 1,000,000 km2 and a lake depth of less than 6.5 m, Kati Thanda-Lake Eyre (KT-LE) in Southern Australia is characterized by a highly variable water balance and large water level fluctuations. It has reached its maximum level only once in the past 150 years, during the 1974-1977 “Great Filling”, emphasizing its status as one of the most unpredictable systems.

During the project, we aim to understand how hydro-climate variability across event magnitudes drives episodic lake filling and drying, and which basin-scale processes (inflow generation, transmission losses, evaporation, and potential groundwater interactions) control the water-level dynamics of KT-LE. We use the one-dimensional General Lake Model (GLM), forced with hourly ERA5 meteorological and hydrological reanalysis inputs over the 1974–2022 period to simulate daily lake level variations through time.

Initially, in this study, our model, calibrated in terms of surface energy balance and driven by a basin-averaged surface runoff, produces overestimated lake levels compared to satellite measurements. This suggests that basin-scale precipitation signals, largely driven by the northern catchment, do not necessarily reflect hydrological conditions farther south near the lake. To quantify water losses and the processes controlling them, we first define the fraction of inflow reaching the lake that reproduces the observed lake-level evolution with satisfactory agreement. We find that losses are strongly non-linear through time, exceeding 70–90% during minor floods, when precipitation affects only limited portions of the Lake Eyre Basin, and decreasing toward 0% during major floods, indicating a saturated and fully interconnected basin state. To identify the processes driving these non-linear losses, accounting for where precipitation occurs and which sub-basins are active, a river-focused approach using GLOFAS v4.0 (a channel-routing system) suggests that transmission losses estimated from spatial-mean ERA5 runoff may be overestimated in years when not all sub-basins contribute simultaneously to downstream flow.

Given the large surface area of the basin and the limited in-situ monitoring, these multi-scale results underline the importance of assessing and continuously evaluating the limitations of reanalysis-based climatic and hydrological forcing when applied to arid environments.


How to cite: Mama, A. N., Fluteau, F., Le Hir, G., May, J.-H., Faraon, T., Storms, J., and Schuster, M.: A modeling perspective on hydro-climate variability in dryland lakes : What is the impact of low- to high-frequency and intensity hydro-climate variability on the rise, development, persistence and demise of Lake Eyre - Kati Thanda ?, EGU General Assembly 2026, Vienna, Austria, 3–8 May 2026, EGU26-13776, https://doi.org/10.5194/egusphere-egu26-13776, 2026.

EGU26-13964 | Posters on site | HS2.1.2

Paired karst–non-karst modeling reveals hidden sensitivity to climatic persistence 

Luz Doris Vivas Betancourt, David Rivas Tabares, Marc B. Neumann, Javier Herrero, and María José Sanz

Mediterranean basins are increasingly exposed to sequences of dry and wet years that challenge reliable estimates of water availability and ecosystem resilience1,2.In karst catchments, strong surface–groundwater coupling and large subsurface storage fundamentally alter how precipitation is partitioned and how long hydrological anomalies persist. Although the physical behavior of karst systems is well known, most hydrological assessments and management-oriented studies still rely on models that do not explicitly represent karst processes. Consequently, it remains unclear how much water-balance estimates and management-relevant fluxes would change if karst dynamics were properly accounted for under persistent climatic extremes.
Here we address this gap using a counterfactual modeling framework that directly compares karst and non-karst realizations of the same basin under identical climate and land-use forcing. Our central research question is how climatic persistence (consecutive dry and wet years) controls precipitation partitioning in a Mediterranean karst basin, and how different those responses would be if the basin behaved as non-karst. We hypothesize that explicit representation of karst processes increases hydrological memory, making multi-year climatic sequences more influential than isolated extreme years and leading to substantially different estimates of key water fluxes.
We applied a physically based, distributed hydrological model to the 4,818 km² Mijares River basin in eastern Spain, a heterogeneous karst system with strong surface–groundwater interaction. The model was forced with meteorological data for 2000–2014 and a land-use map derived from the SIOSE 2014 classification. Using the same forcing and experimental design, we generated a counterfactual non-karst scenario in which karst-specific subsurface processes were suppressed.
At the basin scale, results show that karst-induced subsurface storage and delayed water transfer strongly amplify the impact of climatic persistence. In the karst configuration, sequences of dry or wet years exert a stronger control on the partitioning of precipitation into evapotranspiration, infiltration, runoff, subsurface flow, and percolation than do isolated extreme years. In contrast, the non-karst scenario exhibits weaker hydrological memory, with more immediate and climate-proportional responses. In several flux components, the karst and non-karst simulations diverge not only in magnitude but also in their implied hydrological functioning.
At the land-use class level, forests and shrublands in karst terrain promote infiltration and evapotranspiration with negligible surface runoff, reinforcing delayed subsurface responses during dry periods. Agricultural areas show higher interannual variability, while artificial surfaces generate disproportionate increases in runoff, particularly during persistent wet sequences. These contrasts are markedly attenuated in the non-karst experiment.
Overall, this paired karst–non-karst modeling approach demonstrates that omitting or oversimplifying karst processes can lead to substantial errors in both the magnitude and interpretation of water fluxes under persistent climatic conditions, providing a robust basis for evaluating water-resource decisions in karst regions facing increasing climate variability.
References
1 Rivas-Tabares, D., Tarquis, A. M., Willaarts, B., & De Miguel, Á. (2019). An accurate evaluation of water availability in sub-arid Mediterranean watersheds through SWAT: Cega-Eresma-Adaja. Agricultural Water Management, 212, 211-225.
2 Rivas-Tabares, D. A., Saa-Requejo, A., Martín-Sotoca, J. J., & Tarquis, A. M. (2021). Multiscaling NDVI series analysis of rainfed cereal in Central Spain. Remote Sensing, 13(4), 568.

How to cite: Vivas Betancourt, L. D., Rivas Tabares, D., Neumann, M. B., Herrero, J., and Sanz, M. J.: Paired karst–non-karst modeling reveals hidden sensitivity to climatic persistence, EGU General Assembly 2026, Vienna, Austria, 3–8 May 2026, EGU26-13964, https://doi.org/10.5194/egusphere-egu26-13964, 2026.

Rapid urban expansion in arid cities is transforming surface hydrology and amplifying flood risks under increasingly variable rainfall conditions. This study examines land use and land cover (LULC) change and its hydrologic implications in Al Ain, UAE, a transboundary basin influenced by orographic forcing from the Oman Mountains. Multi-temporal Landsat imagery from 1987–2023 was classified into five dominant surface types-sand, compacted sand, rocky terrain, built-up, and green areas using supervised Maximum Likelihood classification. Accuracy assessment yielded overall accuracies of 68–86% and kappa values up to 0.81, consistent with regional arid-environment benchmarks.

LULC analysis revealed a substantial shift from natural to managed surfaces, with built-up and green areas increasing by 274% and 1,667%, respectively, at the expense of rocky and sandy terrains. These changes were incorporated into a distributed GSSHA model to simulate rainfall–runoff responses across five major storm events between 2007 and 2024. Model results show that progressive urbanization markedly increased peak discharge (up to 78%) and runoff volume, particularly under low- to moderate-intensity storms where infiltration-excess (Hortonian) processes dominate. Under extreme events, the flood response became primarily governed by rainfall intensity, diminishing the relative impact of LULC change.

Spatial analysis emphasized strong localization of flood hazards within newly urbanized areas, with flood depths intensifying along residential and roadway corridors. While the expansion of irrigated green spaces enhanced infiltration locally, their spatial distribution limited broader runoff mitigation. The findings highlight storm condition dependent urban flood response in arid environments and emphasize the need for hydrologically informed urban design, including permeable pavements, vegetated buffers, and managed aquifer recharge systems.

This integrated approach, combining multi-temporal remote sensing and distributed hydrologic modeling, offers a transferable framework for evaluating urban flood dynamics in data-scarce arid regions, supporting policy efforts toward climate-resilient urban planning in rapidly developing desert cities.

How to cite: Bose, A. and Sharif, H.: Hydrologic consequences of rapid urbanization in an arid environment: Multi-temporal remote sensing and distributed flood modeling, EGU General Assembly 2026, Vienna, Austria, 3–8 May 2026, EGU26-14306, https://doi.org/10.5194/egusphere-egu26-14306, 2026.

EGU26-16315 | Orals | HS2.1.2

What the stable isotope composition of precipitation reveals when it rarely rains - a decade of observations from northwestern Australia 

Grzegorz Skrzypek, Chengwei Wan, Shawan Dogramaci, Jennifer Gleeson, Paul Hedley, Pauline Grierson, and John Gibson

Global climate change is reshaping precipitation regimes worldwide and intensifying aridity across many dryland regions. These changes also impact the dry subtropics of northwestern Australia. In this region, the strong spatial and temporal variability of rainfall complicates the characterisation of hydrologic processes, making it challenging to assess groundwater recharge, manage water resources effectively, and protect vulnerable ecosystems.

The region is marked by a distinct dry winter season (April-October) and a wet summer season (November-March), and it receives a far greater proportion of cyclone-driven rainfall than most other parts of Australia. These cyclonic systems contribute to pronounced seasonal and interannual variability, producing intense but short-lived flash-flooding events separated by extended droughts. During the study period (2015–2024), more than 80 % of total rainfall occurred between December and March across the five monitored weather stations. Mean annual rainfall ranged from 288 to 366 mm, while mean relative humidity remained low (30-37 %). Consequently, potential evaporation rates were extremely high, often exceeding 3000 mm/y.

To better understand the atmospheric processes governing precipitation formation and moisture sourcing in this environment, we analysed ten years of rainfall stable hydrogen and oxygen isotope compositions (δ¹⁸O and δ²H) from five sites. We also analysed 1,101 air parcel trajectories corresponding to rain events at five sites over the study period. Rainfall with low δ²H and δ¹⁸O values occurred predominantly during high-rainfall months, demonstrating a strong ‘amount effect’ at most locations. Both, stable hydrogen and oxygen isotope compositions were positively correlated with the stratiform fraction of total precipitation, indicating substantial sub‑cloud evaporation during stratiform events. On average, ~30 % of rainfall was lost to sub‑cloud evaporation, and back‑trajectory analysis showed that up to 47 % of wet-season moisture originated from recycled land evapotranspiration.

Differences between arithmetic and volume-weighted monthly isotope means highlight the seasonal importance of small-volume rainfall events. To address this bias, we introduce a new “cut‑off” method designed to reduce the disproportionate influence of low‑volume rainfall on monthly isotope compositions and on the construction of Local Meteoric Water Lines.

How to cite: Skrzypek, G., Wan, C., Dogramaci, S., Gleeson, J., Hedley, P., Grierson, P., and Gibson, J.: What the stable isotope composition of precipitation reveals when it rarely rains - a decade of observations from northwestern Australia, EGU General Assembly 2026, Vienna, Austria, 3–8 May 2026, EGU26-16315, https://doi.org/10.5194/egusphere-egu26-16315, 2026.

EGU26-17863 | ECS | Posters on site | HS2.1.2

Calibration Strategies for IHACRES in Data-Scarce Environments: Addressing Equifinality and Parameter Uncertainty 

Francesco Alongi, Caterina Alonzo, Antonio Francipane, and Leonardo Valerio Noto

Hydrological rainfall-runoff models are essential tools for simulating and predicting watershed responses to meteorological forcings by linking precipitation and climate inputs with catchment characteristics such as land cover, topography, and soil properties. By representing key hydrological processes, these models support water resources management, extreme event forecasting, and infrastructure design. In semi-arid and data-scarce environments, modelling becomes particularly challenging due to high hydroclimatic variability and ephemeral flow regimes, often associated with limited or discontinuous observational records. Under these conditions, reliable rainfall-runoff simulations are essential not only for understanding catchment dynamics but also for supporting water resource management, including reservoir operation, allocation strategies, and drought risk mitigation. Regardless of their structure, all models require parameter calibration using observed data to ensure reliable reconstruction of hydrological response; this calibration represents a critical step, especially in data-limited contexts, where parameter uncertainty and equifinality pose significant challenges.

This study investigates the impact of different calibration strategies on model performance and parameter estimation under conditions of limited and incomplete observational data in a semi-arid region. The analysis was carried out using the IHACRES model (Identification of unit Hydrographs And Components from Rainfall, Evaporation and Streamflow; Jakeman, 1990), a parsimonious conceptual rainfall-runoff model specifically designed for applications in data-scarce environments. IHACRES consists of a non-linear loss module that converts rainfall into effective precipitation and a linear routing module that simulates both fast and delayed runoff components. The model was slightly modified and applied to several gauged catchments in Sicily (Italy), encompassing a wide range of climatic conditions and including many ephemeral streams. Calibration experiments were performed using a Monte Carlo approach and evaluated using both single- and multi-objective frameworks. Four complementary performance metrics were adopted as objective functions: Nash-Sutcliffe Efficiency (NSE), Kling-Gupta Efficiency (KGE), relative cumulative volume error (RVE), and an error metric based on flow duration curves signatures (D*). Single-objective calibration optimized individual metrics, whereas multi-objective configurations combined time series accuracy, water balance consistency, and flow regime representation in bi-, tri-, and tetra-objective setups. Multi-objective calibration explicitly incorporated equifinality through Pareto dominance theory, identifying non-dominated parameter sets and quantifying trade-offs among competing objectives.

Results indicate that single-objective calibration may reproduce specific hydrograph features but can misrepresent overall water availability and flow regime characteristics. In contrast, multi-objective calibration approaches can jointly constrain hydrograph dynamics, cumulative water balance, and flow regime behavior as represented by flow duration curves, leading to more reliable estimates of both high and low flows. Pareto-optimal analysis also revealed functional relationships among model parameters, suggesting opportunities to reduce parameter dimensionality and derive empirical relationships to estimate one parameter from another. This study demonstrates that multi-objective approaches offer significant advantages in explicitly addressing equifinality-driven parameter uncertainty, and that integrating Pareto-based optimization with uncertainty quantification improves the robustness and interpretability of hydrological simulations.

How to cite: Alongi, F., Alonzo, C., Francipane, A., and Noto, L. V.: Calibration Strategies for IHACRES in Data-Scarce Environments: Addressing Equifinality and Parameter Uncertainty, EGU General Assembly 2026, Vienna, Austria, 3–8 May 2026, EGU26-17863, https://doi.org/10.5194/egusphere-egu26-17863, 2026.

EGU26-21452 | ECS | Posters on site | HS2.1.2

Hydrological issues in Mediterranean coastal semiarid irrigation districts in the context of the AI4Water PRIMA project 

Paolo Colosio, Hamza Bouguerra, Salah Elsayed, Muhammad Faisal Hanif, Slaheddine Khlifi, Hiba Mohammad, Eva Onaindia, Sana Ounaies, Marco Peli, Roberto Ranzi, Ivan Serina, Ruggero Signoroni, Salah Eddine Tachi, Fatma Trablesi, and Stefano Barontini

Mediterranean coastal areas are prone and increasingly exposed to hydrological stress driven by water scarcity, climate change, increasing agricultural pressure, groundwater exploitation, and water quality degradation. These drivers manifest differently across regions but often result in common challenges and issues such as salinization, saltwater intrusion, and competition between agricultural and domestic or industrial water uses, thus impacting water management in irrigation districts. 

In this context, the AI4Water PRIMA project investigates hydrological issues and water management challenges in four Mediterranean coastal irrigation districts and aims to apply Artificial Intelligence optimization and prediction techniques to improve water management. The four study areas are the Ras Jebel Coastal area (Tunisia), the Coastal Constantinois and Seybouse Basins (Algeria), the Capitanata Irrigation District (Italy), and the Nile Delta Basin (Egypt). Although these areas are all located in the Mediterranean region, they differ in population (from 50 thousands up to 3.5 million people), hydrogeological characteristics, water sources, irrigation practices, and water management policies. 

This contribution, after introducing the AI4Water project, presents a preliminary comparison of the main hydrological and irrigation issues in the selected case studies, with a broader Mediterranean perspective. The comparison highlights both shared vulnerabilities and site-specific drivers of hydrological stress, emphasizing the need for context-dependent management strategies. By framing the different case studies within a common perspective, the project provides a basis for cross-district comparison and discussion, supporting the development of adaptive and transferable water management approaches for Mediterranean coastal systems. This comparative approach is intended to stimulate discussion and critical feedback from the scientific community working on similar or related case studies.

How to cite: Colosio, P., Bouguerra, H., Elsayed, S., Hanif, M. F., Khlifi, S., Mohammad, H., Onaindia, E., Ounaies, S., Peli, M., Ranzi, R., Serina, I., Signoroni, R., Tachi, S. E., Trablesi, F., and Barontini, S.: Hydrological issues in Mediterranean coastal semiarid irrigation districts in the context of the AI4Water PRIMA project, EGU General Assembly 2026, Vienna, Austria, 3–8 May 2026, EGU26-21452, https://doi.org/10.5194/egusphere-egu26-21452, 2026.

EGU26-21807 | Orals | HS2.1.2

Climate-driven increases in crop water consumption in a Central Asian dryland catchment despite less water-intensive cropping 

Daniel Müller, Gabriel Senay, Atabek Umirbekov, Larisa Tarasova, Philipp Rufin, Bakhtiyor Pulatov, and Mayra Daniela Peña-Guerrero

Dryland catchments are highly sensitive to climatic variability, with evapotranspiration dominating the water balance and strongly constraining water availability. In irrigated drylands, understanding how climate change and land-use transformations jointly affect crop water consumption is critical for sustainable water management. This study analyses long-term changes in agricultural water use in the Amu Darya Basin, the largest transboundary river basin in Central Asia and one of the world’s most water-stressed regions.

We classified annual crop cover and cropping practices from 1987 to 2019 using the Landsat archive at 30 m spatial resolution. These crop cover maps served as a consistent input for estimating crop water consumption using satellite-based estimates of actual evapotranspiration, again derived from Landsat imagery, and computed with the Operational Simplified Surface Energy Balance (SSEBop) model, a water–energy balance approach well suited for dryland environments. A decomposition approach was applied to disentangle the relative contributions of climate change and land-use change to observed evapotranspiration dynamics.

Results show that total crop water consumption increased by about 10% over the study period, while average water use per unit area rose by 18%. Rising temperatures and increasing atmospheric evaporative demand alone would have pushed up water consumption by 21%. In contrast, shifts toward less water-intensive cropping practices, most notably from water-intensive summer cotton to winter wheat, offset only around 3% of this increase. Climate-driven effects intensified after the early 2000s and were strongest in downstream areas, where water stress, salinity, and ageing irrigation infrastructure limit adaptive capacity.

The findings demonstrate that, in irrigated dryland catchments, land-use change and cropping adjustments alone cannot counteract the accelerating impacts of climate change on evapotranspiration. All evapotranspiration and land-use datasets generated in this study are openly accessible, supporting transparency, reproducibility, and future research in data-scarce dryland regions. Our results underscore the need to combine improvements in water-use efficiency with climate mitigation and basin-scale management to strengthen hydrological resilience under continued warming.

How to cite: Müller, D., Senay, G., Umirbekov, A., Tarasova, L., Rufin, P., Pulatov, B., and Peña-Guerrero, M. D.: Climate-driven increases in crop water consumption in a Central Asian dryland catchment despite less water-intensive cropping, EGU General Assembly 2026, Vienna, Austria, 3–8 May 2026, EGU26-21807, https://doi.org/10.5194/egusphere-egu26-21807, 2026.

EGU26-95 | ECS | Orals | HS2.1.3

Identification of Groundwater Potential Zones Using GIS and Multi-Criteria Decision-Making Techniques: A Case Study of the Shabelle River Basin (Somalia) 

Ismail Mohamoud Ali Alasow, Mahad Abdullahi Hussein, Sanjay Kumar Tiwari, and Rajeev Bhatla

In addition to supplying the water that people need daily, groundwater also affects agricultural methods, preserves natural balance, and promotes industrial development. The 108,300 km2 Shabelle River Basin served as the site of the current study. Monitoring, evaluating, and conserving groundwater supplies for water resource management and development is made possible by the effective integration of remote sensing data and GIS in hydro-geological research. The Shabelle basin area's Ground Water Potential Zones were defined by combining seven thematic layers—geology, land use/land cover, drainage density, slope, lineament density, rainfall distribution map, and soil map—into a GIS platform using the spatial analyst tool in Arc GIS 10.8. The analytical hierarchy process (AHP) technique is used to find the weighted values for each parameter and its sub-parameters based on the relative importance of the influencing elements for groundwater recharge. Four groups were identified on the final groundwater potential zonation map of the study area: low potential zones of 1,548.7 km2 (1.43%), moderate potential zones of 25,786.23 km2 (23.81%), high potential zones of 22,353.12 km2 (20.64%), and very high potential zones of 55,341.3 km2 (54.10%). According to this study, high and very high groundwater potential zones dominate in the basin in 75% of the entire studied region. These zones are found in the basin's northern and central regions, where low slopes, fractured geological formations, and porous soil are present. However, because to their steep slopes, strong geological formations, and low rainfall zones, the south and southwest regions of the basin have poor potential zones. When well data was utilized to validate the accuracy of this data, there was a high degree of agreement between the expected and observed well performance. The Shabelle river basin's water management policies, effective use of natural resources, physical design, and sustainable groundwater development should all benefit greatly from the findings, particularly as the adverse effects of climate change on human life become closer. Anywhere else in the world, the study's methodologies can be used. The findings of this study can be applied to future research on agriculture, basin management, sustainable groundwater, and the interaction between groundwater and climate change.


How to cite: Alasow, I. M. A., Hussein, M. A., Tiwari, S. K., and Bhatla, R.: Identification of Groundwater Potential Zones Using GIS and Multi-Criteria Decision-Making Techniques: A Case Study of the Shabelle River Basin (Somalia), EGU General Assembly 2026, Vienna, Austria, 3–8 May 2026, EGU26-95, https://doi.org/10.5194/egusphere-egu26-95, 2026.

EGU26-841 | ECS | Orals | HS2.1.3

Transfer Learning for Hydrological Modelling and XAI-Based Physical Consistency Assessment in Reconstructing Streamflow Time Series in Data-Scarce Regions 

André Rodrigues, Tais Maia, Matheus Macedo, Rodrigo Perdigão, Julian Eleutério, and Bruno Brentan

Accurate streamflow monitoring is essential for water resources management, yet many Brazilian watersheds lack sufficiently long historical records to support effective decision-making. This challenge is particularly critical in the Metropolitan Region of Belo Horizonte (RMBH), which depends on major reservoirs located within its territory – such as Rio Manso, Serra Azul, Vargem das Flores, and the Ibirité (REGAP) reservoir – for industrial and domestic water supply. Several of these strategic systems suffer from limited or inconsistent hydrological monitoring, complicating operational planning, increasing the risk of water shortages and of compromising reservoirs flow outcome capacity. Transfer Learning (TL) with Long Short-Term Memory (LSTM) networks emerges as a promising strategy to overcome this limitation, enabling the development of hydrological models in watersheds with little or no historical data. This study investigates the application of TL to enhance daily streamflow prediction in data-scarce basins of the Metropolitan Region of Belo Horizonte (RMBH), while assessing the optimal length of local streamflow records required to improve hydrological modelling through fine-tuning of a regional TL model. For this, 23 watersheds with similar hydrological behaviour and geomorphological characteristics were previously selected in the RMBH to evaluate the feasibility of reconstructing streamflow time series in data-scarce regions. Satellite-derived products and reanalysis datasets were employed as inputs to overcome limitations in hydrometeorological data availability. Furthermore, eXplainable Artificial Intelligence (XAI) methods are employed to explore the physical feasibility of knowledge transfer, with the potential to identify which watershed attributes – such as drainage area, elevation, soil-moisture dynamics, land-use composition, and climatic seasonality – most strongly influence whether hydrological behaviour learned in source basins can be meaningfully transferred to target basins. Significant performance gains can be achieved with only one to two years of local data, allowing accurate models to be developed rapidly even in newly monitored watersheds. This improves considerably the decision-making in data scarce regions, primarily those ones with some water conflicts. XAI analyses confirmed the physical soundness of the predictions, supporting more reliable streamflow reconstruction. However, further methodological improvements are required, as some watersheds were unable to benefit from transfer learning. Overall, TL represents a powerful direction for streamflow modelling in regions with limited monitoring, while XAI provides a framework to understand the physical consistency of the transferred knowledge and to determine the minimum monitoring effort required to build reliable local models.

How to cite: Rodrigues, A., Maia, T., Macedo, M., Perdigão, R., Eleutério, J., and Brentan, B.: Transfer Learning for Hydrological Modelling and XAI-Based Physical Consistency Assessment in Reconstructing Streamflow Time Series in Data-Scarce Regions, EGU General Assembly 2026, Vienna, Austria, 3–8 May 2026, EGU26-841, https://doi.org/10.5194/egusphere-egu26-841, 2026.

Physics-Informed Neural Networks (PINNs) offer a promising framework for groundwater modeling in regions where hydrogeological data are limited. However, their performance significantly depends on the choice of constraint weights associated with governing equations and derivative-based regularizations. In this study, we develop a constraint-weight selection strategy for PINNs to simulate groundwater head dynamics in data-sparse environments where aquifer properties such as hydraulic conductivity (K) and specific yield/storativity (S) are unavailable. The proposed formulation incorporates first-, second-, and third-order spatial and temporal derivatives of hydraulic head and aquifer properties into the PINN loss function, enabling the model to capture fine-scale spatiotemporal variations without explicit knowledge of subsurface parameters. The approach is applied to a small section of the Varuna River Basin, using groundwater-level observations collected from 37 monitoring stations between 2022 and 2024. The dataset contains several missing values that the PINN framework handles seamlessly, unlike conventional simulation models such as MODFLOW, which require complete and continuous input fields for stable execution. An iterative optimization scheme is employed to balance data fidelity, physical constraints, and derivative-based regularization during training. The proposed method achieves a training R² of 0.986 and a testing R² of 0.947, with corresponding RMSE values of 0.721 and 1.416 meters, respectively. These results demonstrate that adaptive constraint weighting significantly improves prediction accuracy, robustness, and convergence compared to fixed-weight PINN formulations. Overall, the study highlights the potential of derivative-enhanced PINNs for groundwater modeling in data-sparse aquifers and provides a generalized framework for physics-guided learning under missing or incomplete observations.e data scarcity.

How to cite: Bajpai, M., Gaur, S., and Singh, K.: Derivative-Enhanced Constraint Weights for PINNs in Groundwater Flow Modeling Under Unknown Aquifer Properties, EGU General Assembly 2026, Vienna, Austria, 3–8 May 2026, EGU26-896, https://doi.org/10.5194/egusphere-egu26-896, 2026.

EGU26-1536 | Posters on site | HS2.1.3

Large-scale streamflow regionalization in ungauged West African catchments: How do classical and deep learning approaches compare? 

Yves Tramblay, Serigne Bassirou Diop, Fadilath Kate, Issam Souassi, Bastien Dieppois, Ansoumana Bodian, Joris Guerin, Renaud Hostache, Anne Johannet, Frederik Kratzert, Ludovic Oudin, Vianney Sivelle, and Kalil Traoré

In West Africa, limited access to hydrometric data remains a major challenge for advancing surface water research and improving water management. Since the early 1980s, many gauging stations have been decommissioned, leaving gaps in reliable streamflow records across numerous catchments. Parameter regionalization of hydrological models is commonly employed to enable runoff prediction in ungauged catchments. This study represents an assessment of rainfall-runoff model regionalization across West Africa. We used an unprecedented dataset of 189 near-natural catchments to compare two contrasting approaches: (i) a benchmark conceptual modeling framework using the GR4J model, regionalized with three parameter-transfer techniques (spatial proximity, physiographic similarity, and Random Forest), and (ii) a data-driven framework based on Long Short-Term Memory (LSTM) neural networks. Using a leave-one-out resampling approach, regionalization approaches were evaluated using different performance metrics: (i) the Kling-Gupta Efficiency (KGE), calculated between simulated and observed streamflows, (ii) the relative bias (rBias) on several hydrological signatures computed with observed or simulated discharge and (iii) the difference between observed and simulated flood quantiles. Results show that the conceptual modeling approach with traditional parameter-transfer techniques consistently underperforms compared to the LSTM, failing to reproduce key hydrological signatures. In contrast, the LSTM model showed better generalization performance, accurately simulating streamflow with a median KGE of 0.67 and reliably capturing hydrological signatures and flood quantiles across West Africa’s diverse climates and landscapes with lower biases. These findings highlight the potential of data-driven approaches to enhance hydrological prediction in data-scarce regions, supporting more effective flood risk management and water resource planning.

How to cite: Tramblay, Y., Diop, S. B., Kate, F., Souassi, I., Dieppois, B., Bodian, A., Guerin, J., Hostache, R., Johannet, A., Kratzert, F., Oudin, L., Sivelle, V., and Traoré, K.: Large-scale streamflow regionalization in ungauged West African catchments: How do classical and deep learning approaches compare?, EGU General Assembly 2026, Vienna, Austria, 3–8 May 2026, EGU26-1536, https://doi.org/10.5194/egusphere-egu26-1536, 2026.

EGU26-4669 | ECS | Orals | HS2.1.3

Comparison of expert-knowledge and machine learning approaches for mapping groundwater-dependent ecosystems in a regional setting in Central Mexico 

A. Camila Salgado-Albiter, Selene Olea-Olea, Nelly L. Ramírez-Serrato, Eric Morales-Casique, Lorena Ramírez-González, and Aurora G. Llanos-Solis

Intensive groundwater abstraction, land-use changes, and climate variability have significantly altered natural discharge and flow patterns within groundwater systems, threatening long-term groundwater sustainability. These disruptions increase the risk of degradation in ecosystems that rely directly or indirectly on groundwater discharge, i. e. groundwater-dependent ecosystems (GDEs).

Mexico is particularly vulnerable to declining water table levels, a situation accelerated by gaps in groundwater management that fail to incorporate GDEs into decision-making processes. This issue is especially critical in northeastern Michoacán, home to two of the country’s largest lakes: Pátzcuaro and Cuitzeo lakes, which represent a key study area for studying growing threats to GDEs caused by pollution, climate change, and intensive groundwater abstraction. In order to preserve GDEs, along with their associated biodiversity and ecosystem services, accurate mapping is essential to secure their future integration into groundwater sustainability policies and conservation initiatives.

To address this issue, we compared four methods usually used in geospatial mapping: the Analytical Hierarchy Process (AHP), Weights of Evidence (WoE), and two machine learning models: Logistic Regression (LR) and Random Forest (RF), using environmental variables associated with GDE presence obtained from geospatial data and remote sensing products.

Model performance was evaluated using a validation dataset derived from local inventories and fieldwork conducted in 2024, applying Receiver Operating Characteristic (ROC) curves and the Area Under the Curve (AUC) metric. Results showed that RF (AUC = 0.82) and LR (AUC = 0.70) outperformed WoE (AUC = 0.61) and AHP (AUC = 0.59), with RF demonstrating the highest predictive accuracy and best performance in cross-validation folds.

The GDEs prediction map derived from RF highlights areas primarily along the shores of both lakes, where volcanic lithology contacts with lacustrine deposits, inducing groundwater discharge through springs that sustain wetlands. Additional GDEs areas occur along fault zones that enhance discharge within volcanic lithology near Morelia City and in perennial streams located at intermediate elevations.

The study faces limitations related to varying spatial resolutions, independent errors in geospatial datasets, and uneven data quality across local zones within the study area. Furthermore, the absence of direct field verification for areas with the highest predicted GDE potential constrains the overall impact of the study. Nevertheless, this research provides significant evidence of the advantages of using machine learning approaches in regions lacking detailed hydrogeological information, supporting the integration of GDEs into groundwater sustainability management.


How to cite: Salgado-Albiter, A. C., Olea-Olea, S., Ramírez-Serrato, N. L., Morales-Casique, E., Ramírez-González, L., and Llanos-Solis, A. G.: Comparison of expert-knowledge and machine learning approaches for mapping groundwater-dependent ecosystems in a regional setting in Central Mexico, EGU General Assembly 2026, Vienna, Austria, 3–8 May 2026, EGU26-4669, https://doi.org/10.5194/egusphere-egu26-4669, 2026.

EGU26-4811 | Posters on site | HS2.1.3

Graph-based machine learning approach for river water quality prediction under data limitations 

Sueryun Choi, Eun-hee Jung, Hyeong-Soon Shin, Jin-Ho Song, Hanjo You, HaeJun Son, Intae Choi, Jihoon Yang, and Hee-Cheon Moon

Accurate prediction of river water quality is essential for effective watershed management, yet it is often hindered by practical monitoring constraints, including infrequent grab sampling (e.g., monthly observations) and the lack of reliable streamflow data. These limitations restrict the applicability of conventional process-based water-quality models and necessitate alternative analytical tools. In this study, we propose a graph-based machine learning framework that integrates prediction and diagnostic analyses of river water quality, with chromaticity prediction in the Hantan River Basin, Republic of Korea, as a case study. Graph-based models outperformed purely temporal baselines, with the Graph Sample-and-Aggregate (GraphSAGE) model achieving a test R² of 0.82. Its sampling-based spatial aggregation integrates localized and distributed upstream information across the river network, allowing the model to capture nonlinear relationships mediated by implicit flow connectivity. Graph explanation analyses using PGExplainer identify the SC sub-watershed as the dominant pollution source and primary intervention area. In addition, feature attribution analyses distinguish persistent long-term drivers (e.g., TOC associated with major wastewater treatment plant discharges) from short-term episodic influences linked to facility-specific effluent spikes. Overall, these results demonstrate that graph-based machine learning can serve as a useful framework for both prediction and diagnostic interpretation of key water-quality drivers in data-limited river systems.

How to cite: Choi, S., Jung, E., Shin, H.-S., Song, J.-H., You, H., Son, H., Choi, I., Yang, J., and Moon, H.-C.: Graph-based machine learning approach for river water quality prediction under data limitations, EGU General Assembly 2026, Vienna, Austria, 3–8 May 2026, EGU26-4811, https://doi.org/10.5194/egusphere-egu26-4811, 2026.

EGU26-5433 | ECS | Posters on site | HS2.1.3

Proposing a Deep Learning based Regional Goodness-of-Fit test for identification of regional distribution  

Sukhsehaj Kaur and Sagar Rohidas Chavan

Regional frequency analysis relies heavily on robust goodness-of-fit (GOF) testing for selecting an appropriate probability distribution, which directly influences the accuracy of estimated quantiles. However, existing statistical approaches often involve strong assumptions and computational overheads that limit their effectiveness, particularly for large regional datasets. The widely used L-moment-based approach requires scaling each site’s data by its own mean, which raises concerns about potential distortion of the original distributional characteristics. To overcome this limitation, the present study proposes a novel Deep Learning (DL)-based GOF test that identifies the regional distribution without performing mean-based scaling. The proposed methodology employs a Deep Neural Network (DNN) trained to classify regional distributions based on the distinctive behavior of Generalized Extreme Value, Generalized Pareto, Generalized Logistic, Generalized Normal, and Pearson Type III distributions under specific mathematical transformations. These transformations yield distribution-specific signatures that form the basis of the DNN training process. For a given dataset, the transformations are applied, and kernel density estimates derived from the transformed data are used as inputs to a pre-trained DNN model to identify the most suitable regional distribution. The DNN classifier achieved an accuracy of 95.09% on the training dataset and 94.86% on the test dataset. A comprehensive simulation study was conducted for multiple regional configurations to assess the performance of the proposed DL-based GOF test. The results were compared against the conventional L-moment-based GOF approach. The proposed method demonstrated comparable classification accuracy for smaller region sizes and marginally improved accuracy for larger datasets. The proposed DL-based GOF framework shows significant promise, particularly due to its substantially lower computational cost compared to the conventional L-moment methodology. The findings suggest that this approach can facilitate accurate and efficient estimation of quantiles, thereby supporting informed decision-making planning, management and risk assessment.

How to cite: Kaur, S. and Chavan, S. R.: Proposing a Deep Learning based Regional Goodness-of-Fit test for identification of regional distribution , EGU General Assembly 2026, Vienna, Austria, 3–8 May 2026, EGU26-5433, https://doi.org/10.5194/egusphere-egu26-5433, 2026.

Lakes are the essential asset for the inhabitants of our planet since these are vital sources of water. It is understood that these lakes become more crucial in the regions where water is not easily available such as in Himalayas, drought-prone, and arid regions. However, it has been noticed that the dual problems have arisen at the same time due to climate change, i.e., water scarcity in the arid or drought-prone regions due to rapid extinction of some of the lakes and flood devastations in Himalayan due to overtopping of water from the vulnerable lakes. Climate Change extremes cannot be blamed alone for the extinction of these lakes while overexploitation, improper maintenance and non-civic senses have also exaggerated the process. While the catastrophic events due to these lakes called Glacier Lake Outburst Floods (GLOFs) are mostly occurring due to extremes rainfall events causing regular expansion and contraction of the lakes. However, these extreme events are more intense and frequent due to climate change and tends to increase in the future, making these lakes more vulnerable and responsible for such events.  It is essential to monitor the lake water dynamics not only for sustainable water resources management but also for mitigating future catastrophic event risk arising due to these lakes. While the monitoring of lakes is not always easy either due to data-scarcity in the catchments or impossible in-situ measurements due to inaccessible catchment terrain like in Himalayas. The availability and accessibility of advanced remote satellite sensing data such as altimeter, and space-borne Light Detection and Ranging (LiDAR) have been enabled us lake monitoring, however, their processing demands modern approaches. Hence, the present study aims to develop a machine learning model integrated with geospatial approach to process these advance remote sensing data for the spatio and temporal monitoring of water dynamics of lakes. The present study utilizes Icesat-2 as space-borne LiDAR and Surface Water and Ocean Topography (SWOT) as wide swath altimeter data. The study provides a reliable and precise remote sensing derived Water Surface Elevation (WSE) for the lakes at spatial and temporal scales. The derived WSE for lakes would help us to identify the vulnerable lakes and to evolve robust policies to solve dual lake problems at greater extent, i.e., water scarcity in drought or arid-prone regions as well as in the regions like Himalayas for mitigating catastrophic events due to glacier lakes. Further, the developed model would be easily applicable to any lake while the finer adjustment may be required due to different topographic conditions. 

Keywords: Lake water dynamics, Space-borne LiDAR, Altimeter, Machine Learning, and Geospatial.

How to cite: Ranjan, R., Rai, A. K., Dhote, P. R., and Keshari, A. K.: Leveraging Advanced Remote Sensing with Machine Learning and Geospatial Techniques for Spatio-Temporal Monitoring of Lake Water Dynamics in Inaccessible and Data-Scarce Catchments , EGU General Assembly 2026, Vienna, Austria, 3–8 May 2026, EGU26-6020, https://doi.org/10.5194/egusphere-egu26-6020, 2026.

Water quality monitoring in subsurface environments is often limited by sparse, irregular, and uncertain measurements, complicating the calibration process and reliability of transport models. In this study, we propose a Finite Volume (FV) residual Physics Informed Neural Network (PINN) framework for contaminant transport through subsurface media governed by the advection-dispersion equation (ADE), with a focus on generating predictions considering parameteric uncertainty for data-scarce environments. The core idea is to replace the strong-form PDE residual typically used in PINNs with a control-volume conservation imbalance derived from a discrete FV balance. Neural network predictions are used to evaluate advective and dispersive numerical fluxes at cell faces, and training minimizes the resulting cell-wise flux imbalance while enforcing initial and boundary conditions. This conservative formulation enables transport-specific numerical flux treatments (e.g., upwind/TVD advection and consistent boundary fluxes), and we assess performance for advection-dominated systems with sharp concentration fronts. 

To represent heterogeneity and uncertainty in dispersion, we parameterize the dispersion coefficient as a strictly positive random field using a low-dimensional basis. Uncertainty is propagated through the learned surrogate using Monte Carlo sampling to obtain prediction intervals and monitoring-relevant risk metrics such as threshold exceedance probabilities at selected locations. We outline two uncertainty workflows: (i) an ensemble strategy that trains FV-PINN models across sampled dispersion realizations, and (ii) a prospective conditional FV-PINN that takes random-field coefficients as additional inputs, enabling efficient Monte Carlo evaluation after a single training stage. The application of the methodology is demonstrated on simple benchmark examples designed to represent sparse monitoring data, showing how conservative learning and random-field uncertainty propagation can support reliable transport predictions when observations are limited.

How to cite: Jain, S., Dey, S., and Chahar, B. R.: A Conservative FV-Residual PINN Framework for Solute Transport through Subsurface Media with Dispersion Uncertainty for Data-Scarce Environments, EGU General Assembly 2026, Vienna, Austria, 3–8 May 2026, EGU26-6256, https://doi.org/10.5194/egusphere-egu26-6256, 2026.

Pharmaceuticals, ubiquitous in human, veterinary and agricultural use, are prevalent emerging contaminants in Chinese surface waters. Although not highly persistent, their low removal in conventional wastewater treatment leads to continuous discharge, creating "pseudo-persistence." This chronic exposure poses significant ecological and human health risks, including hormonal disruption of female reproduction and antibiotic-induced gut microbiota alterations and antimicrobial resistance in aquatic biota.

Numerous pharmaceuticals (>100) have been detected in China's surface waters. However, clear regulatory priorities are lacking, and nationwide monitoring is insufficient, leaving many regions without concentration or risk data. This study aims to: (1) identify pharmaceuticals posing the highest human and environmental hazards; (2) develop nationwide predictive concentration models using machine learning; and (3) generate a health risk map for pharmaceuticals in China's surface waters.

Through systematic keyword searches in Web of Science and CNKI, we compiled data from 227 peer-reviewed articles (2010-2023), covering approximately 13,000 sampling sites across China's nine major river basins. Pharmaceutical concentrations, detection frequencies, and sampling metadata were extracted. To assess environmental behavior and risks, four key indicators were selected: octanol-water distribution coefficient (LogDow) for bioaccumulation potential, degradation half-life (T1/2) for persistence, predicted no-effect concentration for aquatic ecosystems (PNECeco) for ecotoxicity, and predicted no-effect concentration for human exposure (PNEChum) through drinking water and fish consumption.

Principal component analysis (PCA) integrated four indicators into a composite hazard score (HP) and to combine concentration and detection frequency into an exposure potential score (EP). Pharmaceuticals were preliminarily screened based on reference thresholds for HP and EP values, and then ranked by the product of HP and EP to establish priority control lists for each river basin. Roxithromycin and erythromycin, exhibiting high toxicity and extensive data, ranked highest across all basins. Antibiotics were consistently high-priority in all nine basins. In densely populated basins (Haihe, Yangtze, Pearl), bezafibrate, indomethacin, and ibuprofen require additional attention. Hormones (estrone, estriol, ethinylestradiol) showed elevated concentrations and risks in Songhua/Liao basins. Increased monitoring is strongly recommended for data-scarce inland basins.

Four representative pharmaceuticals (erythromycin, ciprofloxacin, norfloxacin, carbamazepine), selected based on high toxicity or exposure potential, were modeled nationally. Predictors included 27 variables across five categories: Socioeconomic, Healthcare, Agricultural and aquacultural, Natural environmental, and Water quality indicators. Seven machine learning algorithms were evaluated (DT, ExtraTrees, GB, KNN, RF, SVM, XGBoost). RF demonstrated superior performance and was selected for feature selection (via weighted backward stepwise regression) and hyperparameter tuning (grid search with 10-fold CV). The optimal model was chosen based on R² and RMSE.

Predicted concentrations were then input into the USEPA-recommended human health risk assessment model. Carbamazepine, ciprofloxacin, and norfloxacin exhibited low risks nationwide (HQ < 1). Erythromycin exceeded safe levels (HQ > 1) in eastern regions (Yangtze River Delta, Bohai Rim, Pearl River Delta). Spatially, erythromycin and norfloxacin risks displayed a distinct east-west gradient (higher east), while carbamazepine and ciprofloxacin showed minimal spatial variation.

How to cite: Li, J.: Nationwide Prioritization and Machine Learning-Based Risk Prediction of Pharmaceuticals in China's Surface Waters, EGU General Assembly 2026, Vienna, Austria, 3–8 May 2026, EGU26-6360, https://doi.org/10.5194/egusphere-egu26-6360, 2026.

EGU26-10106 | ECS | Orals | HS2.1.3

A Multiscale Interpretation of Memory-Driven Anomalous Sediment Transport 

Hsuan Hung Wu and Christina W Tsai

Anomalous sediment transport is often observed in turbulent flows. Under these conditions, particle motion frequently deviates from the classical Fickian diffusion assumption due to long-term correlations and complex interactions between flow and sediment. Although many models have been developed to describe this behavior, it remains challenging to link particle-scale dynamics, field-scale transport processes, and statistical descriptions of concentration distributions within a single physical framework. As a result, parameters used in statistical or fractional-order models are often obtained through empirical fitting, and their physical interpretations remain unclear.

This study presents a multiscale framework for interpreting memory-driven anomalous sediment transport by linking particle dynamics, continuum transport behavior, and statistical descriptions. At the particle scale, a Fractional Sediment Diffusion Particle Tracking Model (FSDPTM) is employed to simulate sediment motion with temporal memory. Under this setting, anomalous diffusion emerges from non-Markovian particle dynamics. The mean-square displacement (MSD) is then analyzed to quantify anomalous transport behavior at the particle scale and to describe the strength of temporal correlations.

At the macroscopic scale, transient concentration fields obtained from particle trajectories are used to guide the fractional advection–diffusion equation (FADE). This step connects the particle-scale memory effect with the field-scale Eulerian description. Since experimental observations of transient concentration evolution are often difficult to obtain, the proposed method focuses on cross-scale internal consistency rather than direct data fitting. The steady-state concentration profiles produced by the particle model are then compared with laboratory measurements to assess whether the long-term transport behavior is physically reasonable.

Building on the validated steady-state profiles, a fractional entropy formulation is used to describe the statistical structure of sediment concentration distributions. The entropy parameter is not an empirical fitting coefficient, rather, it is interpreted as a potential indicator reflecting the cumulative effects of memory-driven transport processes. By comparing the mean-square displacement (MSD) at the particle scale, the FADE parameters at the field scale, and the entropy-based description, this study demonstrates that entropy parameter may be related to anomalous transport characteristics associated with long-term particle memory.

Overall, this study presents a multiscale interpretation of anomalous sediment transport in which particle dynamics, continuum transport equations, and statistical descriptions are treated in a mutually consistent manner. The results suggest that entropy-based parameters may have the potential to serve as compact and physically interpretable indicators of anomalous transport intensity. This framework provides a structured approach for connecting transport dynamics across scales and for extracting physical insights from limited observable information.

Keywords:Anomalous diffusion;Memory-driven transport; Multiscale processes; Fractional dynamics; Particle-based modeling; Statistical characterization

How to cite: Wu, H. H. and Tsai, C. W.: A Multiscale Interpretation of Memory-Driven Anomalous Sediment Transport, EGU General Assembly 2026, Vienna, Austria, 3–8 May 2026, EGU26-10106, https://doi.org/10.5194/egusphere-egu26-10106, 2026.

Over the past two decades, microplastics (MPs) pollution has been recognized as a significant risk to public health and to a wide range of environments, particularly riverine, estuarine, and oceanic systems. However, much of the existing research on MPs has focused primarily on large-scale transport behavior in ocean zones using deterministic approaches. Consequently, many of the underlying fundamental principles governing the transport mechanisms of MPs and their fate in open channel flows remain poorly understood. Unlike sediments, which generally settle downward, MPs exhibit far greater variability in physical properties, including material composition, shape, size, drag, and density. Some MPs are even lighter than water, leading to upward or buoyant motion during transport and introducing additional complexity to the governing hydrodynamics.

To account for the geometric irregularity of particles, this study employs a stochastic diffusion particle tracking model (SD-PTM) that incorporates a modified vertical velocity formula to better represent the effects of inertial and viscous drag forces on MPs. In this model, the movement of suspended MPs is modeled as a stochastic process composed of a drift term and a random term, to represent particle transport in open channel flow. In addition, the genetic algorithm (GA) is applied to optimize the drag coefficients, thereby enhancing model robustness under data-limited conditions.

Compared with traditional models without consideration of MPs’ physical properties, the proposed modified stochastic model investigates not only the settling motion of MPs, but also extends, for the first time, stochastic modeling approaches to buoyant particles. The model results are compared with the experimental data provided by Born et al. (2023) across a range of flow conditions to calibrate the model coefficients. This study offers a new perspective on both rising and settling MP motion, thereby advancing the understanding of microplastic fate and transport in open channel flows.

How to cite: Chen, M. T. and Tsai, C. W.: Modified Stochastic Model for Settling and Rising Microplastic Transport in Open Channel Flows, EGU General Assembly 2026, Vienna, Austria, 3–8 May 2026, EGU26-10114, https://doi.org/10.5194/egusphere-egu26-10114, 2026.

EGU26-10246 | Orals | HS2.1.3

Three-Layer Ornstein–Uhlenbeck Model for Turbulent Flow Simulation 

Cheng Yu Chen and Christina W Tsai

This study develops a three-layer embedded Lagrangian stochastic (LS) model for simulating suspended sediment transport in open-channel flows. The model describes particle motion at three levels: position, velocity, and acceleration, using multiple Ornstein–Uhlenbeck (OU) processes within a coupled stochastic system. This construction preserves intrinsic stochasticity while allowing the velocity process to be differentiated in time to obtain particle acceleration, enabling a consistent description of particle motion at small time scales.

In conventional LS models, random forcing is typically represented by a Wiener process. Since this process is nowhere differentiable, it limits the interpretation of higher-order kinematic quantities. In this study, an embedded Ornstein–Uhlenbeck formulation is employed, where the random forcing is described by a finite-order system of coupled stochastic ordinary differential equations. Compared with conventional two-layer LS models, the three-layer formulation produces smoother Lagrangian velocity trajectories by improving the differentiability of the velocity process. This formulation reduces abrupt fluctuations in the simulated velocity signal and allows acceleration to remain finite and well-behaved.

As a result, the model provides a clearer basis for describing short-time-scale particle motion and for exploring rapid turbulent effects near the bed. Model parameters are determined based on laboratory experimental data and commonly used turbulence scaling relations reported in the literature.

Overall, the proposed framework provides a stochastic description of particle motion that allows velocity and acceleration to be consistently represented at small time scales and offers a basis for further investigation of near-bed particle behavior and suspended sediment transport processes.

How to cite: Chen, C. Y. and Tsai, C. W.: Three-Layer Ornstein–Uhlenbeck Model for Turbulent Flow Simulation, EGU General Assembly 2026, Vienna, Austria, 3–8 May 2026, EGU26-10246, https://doi.org/10.5194/egusphere-egu26-10246, 2026.

The overexploitation of groundwater has emerged as a critical environmental issue due to the increasing pressure placed on this vital freshwater resource by rapid urbanization and population growth. Understanding future groundwater availability near urban expansion is essential for sustainable urban planning and water-resource management. This study investigates the influence of land-cover change on groundwater depletion while also examining the spatial patterns of urban growth and their effects on surface thermal conditions using Land Surface Temperature (LST) and the Normalized Difference Vegetation Index (NDVI). Groundwater storage variations were monitored using data from the Gravity Recovery and Climate Experiment (GRACE), while Landsat imagery was used to derive land-cover maps, NDVI, and LST. To assess the relationship between climate variability and groundwater recharge, GRACE-derived groundwater storage anomalies were correlated with precipitation data obtained from the Global Precipitation Measurement (GPM) mission. Time-series analyses of groundwater storage and land-cover changes were conducted at five-year intervals from 1990 to 2025 to quantify the impacts of urbanization on groundwater dynamics. The results reveal a significant acceleration in groundwater depletion and urban expansion over the past decade. Concurrently, LST exhibits an increasing spatial trend that closely corresponds with declining vegetation cover and expanding built-up areas, indicating that urbanization has contributed substantially to rising surface temperatures. These findings underscore the urgent need for effective groundwater management policies and integrated urban planning strategies to ensure the long-term sustainability of freshwater resources.

How to cite: Ali, M. Z. and Benaafi, M.: Impact of Urbanization on Groundwater Storage and Surface Temperature Changes: A Case Study of Riyadh, Saudi Arabia, EGU General Assembly 2026, Vienna, Austria, 3–8 May 2026, EGU26-10496, https://doi.org/10.5194/egusphere-egu26-10496, 2026.

EGU26-11882 | ECS | Orals | HS2.1.3

Regional Annual Flow Estimation by Machine Learning Tool in QGIS for Data-Scarce Catchments 

Cristiano Guidi, Alena Seidenfaden, Philip Marzahn, and Jens Tränckner

Within the APRIORA project, an open-source, geospatial QGIS plugin was developed to support the implementation of the EU Urban Wastewater Treatment Directive in 2025 by assessing environmental risks from human pharmaceuticals. This multidisciplinary deterministic model estimates annual loads from wastewater treatment plants, distributes them spatially through river networks and calculates the Predicted Environmental Concentration (PEC) for each reach.

The practical application of the tool encountered a key limitation in data-scarce regions, where missing catchment-scale flow data and API consumption data prevented the calculation of PECs. Existing hydrological models often present barriers due to high computational demands, intensive calibration needs and strict data requirements. To bridge this gap, a new, integrated hydrological module for the QGIS plugin was developed, offering a flexible, efficient solution that operates with minimal and easily accessible geospatial inputs. In that way, the tool became applicable in data scarce catchments of the project with limited monitoring networks as Poland and Latvia.

The module consists of four tools designed to operate sequentially. The first, “Fix river network”, establishes topological contributing relationships between river sections. The second, “Contributing area of gauging station”, delineates subcatchments contributing to any available stream gauges, defining the areas for model calibration and validation. This step can be omitted in fully ungauged catchments. The third, “Calculate geofactors”, computes physiographic and climatic predictors (e.g., mean elevation, slope, share of forest and settlement area, mean annual precipitation) for each subcatchment. It is important to note that the model makes use of freely available continental-scale datasets (e.g., Copernicus DEM (30m resolution), Corine Land Use Land Cover (100m resolution) and ERA5 monthly total precipitation) thereby ensuring its applicability in regions where data is scarce. The fourth tool, “Flow estimation”, employs a machine learning approach (specifically a Random Forest Regressor) where the previously calculated geofactors act as independent variables to predict the flow measured in gauged subcatchments.

In order to guarantee its applicability in regions without local gauges, the tool allows the use of pre-calibrated, averaged model parameters derived from the project’s partner countries. This provides a transferable solution despite underlying regional hydrological uncertainties. The model estimates annual mean flow and annual mean low flow for regional river sections. This temporal resolution aligns with annual API consumption statistics and also represents the worst-case condition for pollution dilution and environmental risks.

In this presentation, we will present the tool itself as well as results from three different Baltic Sea catchments.


Acknowledgement - The authors thank the Interreg Baltic Sea region funding programme – co-founded by the European Union (ERDF) – and all the APRIORA project partners contributing to this work.

How to cite: Guidi, C., Seidenfaden, A., Marzahn, P., and Tränckner, J.: Regional Annual Flow Estimation by Machine Learning Tool in QGIS for Data-Scarce Catchments, EGU General Assembly 2026, Vienna, Austria, 3–8 May 2026, EGU26-11882, https://doi.org/10.5194/egusphere-egu26-11882, 2026.

EGU26-11919 | Orals | HS2.1.3

The value of data in reducing uncertainty in mountain groundwater modeling 

Alberto Bellin, Andrea Betterle, and Mariaines Di Dato

Mountain aquifers are receiving increasing attention as a key component of the so-called water towers. They sustain important freshwater ecosystems, river flow during droughts, and are a key water resource for populations living in mountain valleys and the nearby floodplains. These aquifers are exposed to emerging pollutants, such as pharmaceuticals, PFAS, and microplastics, whose adverse effects on ecosystems and human health are exacerbated by overexploitation. The interaction between surface and subsurface waters increases the risk of groundwater contamination by untreated sewage waters, and in several cases also by treated waters, because in most countries sewage treatment systems are not yet designed to remove pharmaceutical and emerging contaminants. A significant challenge that modelers face when dealing with these systems is the endemic lack of data to constrain the models, which limits their reliability in risk analysis and in the comparison of the effectiveness of alternative remediation actions.  An example of application in a mountain valley aquifer of northeastern Italy is used to discuss how to make a convenient use of available data to reduce the uncertainty affecting groundwater modeling in such environments, where lateral fluxes stemming from hillslopes and the surface/subsurface water exchange fluxes are difficult to constraint and a source of large uncertainties in modeling both groundwater availability and groundwater contaminant transport.  In particular, we explored the gain in model consistency that can be obtained by supplementing groundwater head data with geochemical and groundwater concentration data of a target contaminant at a few controlling groundwater wells. The geochemical data refer to river water and to springs emerging from the lateral hillslopes. Electrical conductivity and other geochemical data typically collected as part of the standard water quality monitoring performed by Environmental Protection Agencies may help in reducing the uncertainty in the lateral and surface/subsurface exchange fluxes and in improving the reliability of the transport model, when used in combination with contaminant concentration data at the available groundwater monitoring wells. The analysis suggests that considering the valley aquifer as part of a more complex system, including the contribution of the lateral mountain aquifers, and the exchange with surface water, is an opportunity for producing realistic models rather than an unnecessary complication.

How to cite: Bellin, A., Betterle, A., and Di Dato, M.: The value of data in reducing uncertainty in mountain groundwater modeling, EGU General Assembly 2026, Vienna, Austria, 3–8 May 2026, EGU26-11919, https://doi.org/10.5194/egusphere-egu26-11919, 2026.

EGU26-16044 | Orals | HS2.1.3

Deep Learning-Driven Hyperspectral Data Fusion for Real-Time Water Quality Monitoring 

Daeun Yun, Na-Hyeon Gwon, Jinyoung Jung, and Sang-Soo Baek

Water quality monitoring is essential for addressing water contamination and ensuring public safety. Particularly, managing nitrate levels has become a major concern due to their direct impact on eutrophication. Despite the high accuracy of conventional analysis methods, their practical application is often limited by high costs, labor-intensive processes, and a lack of real-time monitoring capabilities. This study presents a novel framework for real-time water quality monitoring by integrating hyperspectral and multi-sensor data through deep learning-based data fusion. The multi-sensor data includes pH, electrical conductivity (EC), dissolved oxygen (DO), and oxidation-reduction potential (ORP). A transformer-based deep learning model was applied to predict water quality concentrations by capturing correlations within time-series hyperspectral absorbance and multi-sensor data. Furthermore, transfer learning was employed to improve the performance in target domains by transferring the information contained in a pre-trained model. The data-fusion transformer model predicted water quality concentrations with high accuracy, achieving a coefficient of determination (R2) exceeding 0.99 in both deionized and tap water conditions. Specifically, the integration of multi-sensor data improved model robustness and performance compared to applying spectral data alone. This research also demonstrated that transfer learning effectively supported the model in adapting to varying flow conditions. The proposed deep learning-based data-fusion framework provides a reliable solution for real-time water quality monitoring, with aims to extend the model application to predict multiple water parameters simultaneously.

How to cite: Yun, D., Gwon, N.-H., Jung, J., and Baek, S.-S.: Deep Learning-Driven Hyperspectral Data Fusion for Real-Time Water Quality Monitoring, EGU General Assembly 2026, Vienna, Austria, 3–8 May 2026, EGU26-16044, https://doi.org/10.5194/egusphere-egu26-16044, 2026.

Accurate representation of transport processes is essential for understanding water quality dynamics in surface flow systems, particularly under turbulent conditions where observations are limited in space and time. In such environments, sediment and sediment-associated constituent transport is strongly influenced by multiscale turbulence, intermittency, and correlated particle dynamics, processes that are not adequately captured by conventional deterministic modeling approaches.

This study presents a Lagrangian stochastic framework for modeling particle transport in turbulent flows, with particular emphasis on addressing unresolved variability and the limited availability of Eulerian observations. Particle motion, entrainment, and dispersion are formulated using multivariate and multi-layer stochastic differential equations that explicitly incorporate turbulence-induced intermittency, particle memory, and scale-dependent correlations. Near-threshold sediment entrainment is represented through physically based probabilistic criteria, enabling the modeling of intermittent transport events that dominate sediment flux in regimes close to the threshold of sediment motion.

To capture relative dispersion and correlated motion driven by multiscale turbulent structures, the framework extends beyond single-particle formulations to include two-particle stochastic dynamics. Model development and validation are informed by Direct Numerical Simulation (DNS) data, which provide flow statistics for quantifying particle position, velocity, and correlation structures. This integration allows critical transport characteristics to be inferred even when field-scale monitoring data are limited in space or time.

The proposed stochastic framework provides a physical framework for modeling the transport of particle-associated constituents in surface flows. By emphasizing process-based stochastic representations rather than data-intensive deterministic closures, the approach offers a robust pathway for advancing transport modeling in turbulent flows under data-limited conditions.

How to cite: Tsai, C.: Physically Based Lagrangian Stochastic Modeling of Particle Transport in Data-Limited Turbulent Flows , EGU General Assembly 2026, Vienna, Austria, 3–8 May 2026, EGU26-17157, https://doi.org/10.5194/egusphere-egu26-17157, 2026.

High-precision and accurate runoff simulation is crucial for the management and allocation of water resources, the operation of hydraulic engineering, and the prevention of flood and drought disasters. However, there is currently no consensus on how to effectively filter and reshape the impact of numerous external factors influencing runoff, and also there is a lack of sufficient theoretical support. To maximize the metrics accuracy of the result of runoff simulation and better capture the internal hydrological characteristics of runoff, the concept of granular computing from the field of artificial intelligence was drawn on, terrain factors were extracted and their attribute features were optimal-selected based on granulation rules, and a Long Short-Term Memory (LSTM) model incorporating the climate characteristic index (LSTM-new) was developed based on delineated sub-region areas in this study. Finally, a unidirectional feedback framework was proposed, combining process-driven method based on the Variable Infiltration Capacity (VIC) model with a data-driven method using the established LSTM (CopulingVIC-new), to enhance the hydrological process characteristics of the simulated runoff and improve simulation accuracy. The results showed that the average NSE, R2, KGE, and RMSE of CopulingVIC-new during training, validation, and testing periods achieved 0.93, 0.92, 0.91, and 334.86 m3/s, respectively, which increased by 7.29%、2.97%、9.73%、-19.41% and 13.41%, 12.19%, 19.73%, -46.95% compared to uncoupled LSTM and VIC. Additionally, the proposed framework effectively captured the interannual variation trend of runoff in all seasons except late spring and summer, though it also overestimated the risk of the occurrence of annual maximum daily peak flow (AMDPF) and total flood volume of annual continuous maximum 5-day (TFAM5D) and thier joint variables. The overall results indicated that the scheme of introducing climate characteristic index, based on sub-region division, can more accurately capture extreme runoff in the study area, as well as the variation of seasonal runoff on both intra-annual and interannual scales. Although CouplingVIC-new still had limited ability to capture extreme flow, the structure of extreme value of the output runoff became more robust after unidirectional coupling. This research can help to expand the application of machine learning in hydrological modelling and provide a useful reference for related studies.

How to cite: Zhao, Y.: Runoff simulation based on granular computing by introducing terrain factors to construct climate characteristic index, EGU General Assembly 2026, Vienna, Austria, 3–8 May 2026, EGU26-18485, https://doi.org/10.5194/egusphere-egu26-18485, 2026.

EGU26-19227 | ECS | Orals | HS2.1.3

GIS-Based Assessment of Karstification Potential in Siargao Island, Philippines 

Riva Karyl Varela, Ed Dwight Barrios, Friendylle Bondad, and Yleiah Ann Cortejos

Karstic terrains are formed by the dissolution of carbonate rocks and are essential zones for groundwater reservoirs but are susceptible to geological and climatic conditions. Thus, delineation and characterization of potential karst development sites are necessary, especially in areas with limited data on karst development, which hinders accurate groundwater assessment, hazard mitigation, and sustainable land-use planning, especially in remote areas such as Siargao Island, Philippines. By applying a data-driven geospatial framework that combines statistical analysis with Geographic Information System (GIS) techniques, it is possible to evaluate the island’s karstification potential as support for future water resource management strategies.

Principal Component Analysis (PCA) was applied to eight initially selected variables, which were then reduced to four key components: geology, slope, precipitation, and vegetation. These components were used for GIS-based multi-criteria evaluation to generate a karst potential map of Siargao Island. Results show strong spatial variability in karst development wherein high to very high potential zones are in the southern and southeastern regions, characterized by mature cockpit karsts, caves, and sinkholes. The eastern and western parts of the island, where transitional stages of karst development are present, exhibit moderate karstification potential. Non-carbonate areas with minimal karst expression in the central and northern regions showed low to very low potential zones. Field observations, existing geomorphological maps, and sinkhole inventory data were utilized for model validation, resulting in an overall accuracy of 80.6% and a Kappa coefficient of 0.44, indicating moderate agreement between the predicted and observed karst features.

Through this approach, a cost-effective monitoring strategy for assessing groundwater resources and geohazards in data-scarce, remote areas with karstic terrains, such as Siargao Island, can be developed. The generated karst potential map provides a baseline for sustainable water resource management, groundwater protection, and land-use planning. Furthermore, this study demonstrates the use of geospatial and decision-support methods to strengthen hydrological management in remote environments.

How to cite: Varela, R. K., Barrios, E. D., Bondad, F., and Cortejos, Y. A.: GIS-Based Assessment of Karstification Potential in Siargao Island, Philippines, EGU General Assembly 2026, Vienna, Austria, 3–8 May 2026, EGU26-19227, https://doi.org/10.5194/egusphere-egu26-19227, 2026.

EGU26-19960 | ECS | Posters on site | HS2.1.3

Assessing urban water access in African cities: a GIS clustering approach in Malabo, Equatorial Guinea 

Manuel Rodríguez del Rosario, Severo Meñe Nsue-Mikue, Víctor Gómez-Escalonilla, Esperanza Montero-González, Silvia Díaz-Alcaide, and Pedro Martínez-Santos

Access to safe drinking water remains a daily challenge for millions of urban residents around the world, particularly in sub-Saharan Africa. This study provides a detailed assessment of inequalities in the realization of the human right to water in urban neighborhoods in Malabo, Equatorial Guinea. Clustering techniques combined with GIS analysis were used to map and assess access to water throughout the study area. The clustering results were compiled into a matrix assessing six key indicators: the physical availability of improved water sources; transport time; water quality; water quantity; reliability; and affordability. More than 500 household surveys were conducted and over 200 water points were sampled for this work. The results indicate that access to water is severely limited by poor quality, insufficient quantity and an unreliable supply. Below 3% of households meet the standard for safely managed drinking water, and less than 22% have at least basic access, which contrasts sharply with official statistics. Considering these results in the context of current literature highlights the importance of taking all relevant factors into account when making reliable estimates of water access. Current rates of access to this resource tend to be significantly lower than reported, and despite global progress, humanity is still far from fulfilling the fundamental human right to water. These findings emphasise the urgent need for targeted interventions to address inequalities and enhance the water supply in urban areas.

How to cite: Rodríguez del Rosario, M., Nsue-Mikue, S. M., Gómez-Escalonilla, V., Montero-González, E., Díaz-Alcaide, S., and Martínez-Santos, P.: Assessing urban water access in African cities: a GIS clustering approach in Malabo, Equatorial Guinea, EGU General Assembly 2026, Vienna, Austria, 3–8 May 2026, EGU26-19960, https://doi.org/10.5194/egusphere-egu26-19960, 2026.

EGU26-21064 | Posters on site | HS2.1.3

Ice-Regulated Water Quality Dynamics in Finnish Shallow Lakes: A Machine-Learning Reconstruction 

Shahin Nourinezhad, Nasim Fazel, Heini Postila, and Ali Torabi Haghighi

Water quality in ice-covered lakes is strongly affected by winter physical conditions, particularly in shallow systems where ice cover influences mixing, oxygen availability, light conditions, and biogeochemical processes. Changes in ice thickness and duration can therefore have substantial impacts on key water quality parameters, including dissolved oxygen and nutrient dynamics. However, long-term observations of both water quality and ice conditions are sparse and unevenly distributed across Finnish lakes, limiting comprehensive assessments. In this study, we apply a machine-learning approach based on the gradient boosting algorithm to model water quality and ice conditions on shallow lakes in Finland over the period 1965–2024. The model demonstrates strong predictive performance, evaluated using the root mean square error (RMSE), enabling the reconstruction of water quality dynamics under data-scarce conditions.

How to cite: Nourinezhad, S., Fazel, N., Postila, H., and Torabi Haghighi, A.: Ice-Regulated Water Quality Dynamics in Finnish Shallow Lakes: A Machine-Learning Reconstruction, EGU General Assembly 2026, Vienna, Austria, 3–8 May 2026, EGU26-21064, https://doi.org/10.5194/egusphere-egu26-21064, 2026.

EGU26-21229 | ECS | Orals | HS2.1.3

Scenario-based 1D hydrodynamic modelling of glacial lake outburst floods in the Western Indian Himalaya 

Nikhil Mishra, Ashok K. Keshari, and Bhagu Ram Chahar

Glacial Lake Outburst Floods (GLOFs) are emerging as a significant hazard in high-mountain regions due to accelerated glacier retreat and lake expansion resulting from climate warming. The present study employs a one-dimensional hydrodynamic modelling framework to simulate the propagation of GLOF and downstream flood characteristics for the Gepan Gath Lake–Chandra Basin in the Western Indian Himalayas. The selected study area represents one of the most rapidly evolving and hazard-prone glacial lake settings in the region. Unsteady flow simulations are performed using the HEC-RAS hydraulic model to route scenario-based GLOF hydrographs along the downstream river corridor. Breach outflow hydrographs have been generated using plausible combinations of lake volume and dam failure mechanisms, and are applied as upstream boundary conditions. River geometry is represented through cross-sections extracted from the ALOS PALSAR digital elevation model and supporting geospatial datasets. The simulations capture the temporal and spatial evolution of discharge and water surface elevation along the river network under multiple GLOF scenarios. Results indicate rapid flood wave propagation in steep upstream reaches, followed by attenuation and lateral spreading in wider downstream valleys. Peak discharge, inundation depth, and flood arrival time exhibit strong spatial variability, primarily governed by valley morphology and hydraulic connectivity. The modelling outputs enable identification of critical downstream impact zones and provide first-order estimates of exposure to GLOF hazards. This study demonstrates that 1D hydrodynamic modeling using HEC-RAS, combined with remotely sensed terrain data, provides an efficient and robust approach for regional-scale GLOF hazard assessment, supporting the design of early warning systems and disaster risk reduction planning in data-scarce Himalayan environments.

How to cite: Mishra, N., Keshari, A. K., and Chahar, B. R.: Scenario-based 1D hydrodynamic modelling of glacial lake outburst floods in the Western Indian Himalaya, EGU General Assembly 2026, Vienna, Austria, 3–8 May 2026, EGU26-21229, https://doi.org/10.5194/egusphere-egu26-21229, 2026.

Ecosystem services (ESs) represent the essential ecological contributions that support human well-being and socioeconomic subsistence. This study employs multi-temporal remote sensing (RS) datasets from 1995 - 2022 to quantify the Ecosystem Service Value (ESV) of key ecosystem functions within a representative Tier-2 Indian city. Land Use/Land Cover (LULC) classification is performed using a Random Forest (RF) supervised machine learning algorithm to delineate ecosystem units, producing high-precision classification results with strong overall accuracy and optimized Kappa coefficients. Valuation is conducted using benefit transfer methods, with values expressed in million US dollars per year. The results indicate that, after vegetative cover, built-up areas, croplands, waterbodies, and barren land are the next major contributors to the total ESV. The key findings of the study are that Vishakapatnam, Tier-2 city in India is highly sensitive to LULC transitions, where rapid urbanization significantly alters the trajectory of provisioning, supporting, regulatory, and cultural ecosystem services. In addition, the study examines spatio-temporal relationships between ecosystem service trade-offs and synergies, demonstrating that high-resolution ESV mapping serves as a reliable diagnostic tool for assessing the impacts of human overexploitation and poor resource management. Overall, the study provides a robust quantitative framework for ecological valuation, offering a critical foundation for evidence-based policy interventions and sustainable urban planning in rapidly transforming urban environments.

How to cite: Agrahari, S., Swetha , D., and Pal, M.: Spatiotemporal Assessment of Ecosystem Services in a Tier-II Indian City: A Case Study of Visakhapatnam (1995–2022), EGU General Assembly 2026, Vienna, Austria, 3–8 May 2026, EGU26-21599, https://doi.org/10.5194/egusphere-egu26-21599, 2026.

EGU26-2074 | ECS | Posters on site | HS2.1.4

Temporal variability of catchment storage-discharge characteristics and their driving mechanisms in cold region 

Zhicheng Xu, Yinjun Zhou, and Lei Cheng

The catchment storage-discharge characteristics (CSDC) are usually the highly sensitive parameters in hydrology model and fundamentally decide the baseflow simulation performance. With dramatic climate change, several recent studies had found significant trend of the power-law parameter of CSDC (b0) in cold region. However, studies about the temporal variability of b0 and its driving mechanism in cold region are less consistence because of differences in study area and time scale. In this study, the b0 was firstly calculated from daily recession event in 315 cold catchments, after which the time-varying rule of b0 and its driving mechanism was investigated at events, warm period and decades scales. The results show that the set of calculated b0 have a median of 2.1 around all study catchments and are great different between flow recession events in a specific catchment with the median of its variance in all study catchments is equal to 2.3. Moreover, the b0 increased within warm period in most (78%) cold catchments and had also an increase on the decades scale in 63% cold catchments, stating a significant time-varying characteristic. Correlation analysis presents that permafrost extent degradation, increases in both precipitation (P) and terrestrial water storage (TWS) play the positive roles in b0, while increasing PET play the negative role on the contrary. On the events scale, potential evaporation (PET) is the main control of the b0, followed by the permafrost extent, while P and TWS take a slightly positive effect. During the warm period, permafrost thawing overtakes PET as the main control of the b0, followed by the PET, and the effect of P and TWS can be not negligible. On the decade scale, climate change (i.e, climate warming and wetting) caused permafrost degradation and increases in both P and TWS, which has further increased the b0. These results are of great significance for improving the understanding of the catchment storage-discharge process, and highlight that traditional hydrology modelling with constant CSDC could result in systematic bias in baseflow simulation and prediction in cold region.

How to cite: Xu, Z., Zhou, Y., and Cheng, L.: Temporal variability of catchment storage-discharge characteristics and their driving mechanisms in cold region, EGU General Assembly 2026, Vienna, Austria, 3–8 May 2026, EGU26-2074, https://doi.org/10.5194/egusphere-egu26-2074, 2026.

EGU26-3886 | ECS | Orals | HS2.1.4

Reimagining how Andean glaciers buffered past streamflow droughts  

Rodrigo Aguayo, Harry Zekollari, Jordi Bolibar, Marit van Tiel, Álvaro Ayala, Lander Van Tricht, and Lizz Ultee

Climate change intensifies water scarcity by increasing the frequency of streamflow droughts. Glaciers play a key role in moderating these events by regulating runoff, but their ongoing retreat threatens this natural resilience. Despite case-specific advances, the regional role of Andean glaciers in shaping streamflow droughts across complex climates and landscapes remains highly uncertain. To address this gap, we use a hybrid glacio-hydrological model that combines process-based glacier mass-balance and ice-flow dynamics with a data-driven runoff representation, allowing us to capture both long-term glacier evolution and short-term hydrological responses. This model is applied to a newly developed dataset of 257 glacierized catchments spanning the Andes (“AndeanGC”; 5–56ºS), which consolidates harmonized hydrological observations, remotely sensed glacier characteristics, and gridded meteorological forcing. The hypothetical future glacier extents correspond to projections under three warming storylines that represent plausible global outcomes: a Paris-aligned pathway limiting warming to 1.5 °C, a current-policy trajectory leading to approximately 2.8 °C of warming, and a high-emission pathway reaching about 4.0 °C. We find that glaciers historically provided substantial buffering of streamflow droughts, but this effect diminishes as glaciers shrink. If past droughts had occurred under the smaller glacier extents projected for the late 21st century under current climate policies, their severity and spatial extent would have increased substantially. Consequently, regional water stress would have intensified markedly. These hypothetical scenarios reveal the previously unquantified regional influence of glaciers on past droughts and illustrate the broader consequences of their decline for water resources. They also highlight the critical need to communicate these changes effectively to support climate-resilient planning and policy.

How to cite: Aguayo, R., Zekollari, H., Bolibar, J., van Tiel, M., Ayala, Á., Van Tricht, L., and Ultee, L.: Reimagining how Andean glaciers buffered past streamflow droughts , EGU General Assembly 2026, Vienna, Austria, 3–8 May 2026, EGU26-3886, https://doi.org/10.5194/egusphere-egu26-3886, 2026.

EGU26-4540 | ECS | Posters on site | HS2.1.4

Snowmelt–Baseflow Lags as Indicators of Elevation-Dependent Storage Buffering in Snow-Dominated Mountain Catchments 

Johnmark Nyame Acheampong and Michal Jenicek

Snowmelt is a critical seasonal water source in mountain catchments, yet the dynamics of catchment water storage and release, as well as the redistribution of snowmelt signals into low-flow periods, remain poorly constrained, particularly across the snow–rain transition. In this study, we focus on one diagnostic question: how long does the snow signal persist before it emerging in baseflow, and how does that lag change with elevation and snow regime? We analyse 88 near-natural mountain catchments in Czechia and Switzerland using HBV-Light simulations of snow water equivalent (SWE) and baseflow and apply wavelet coherence to quantify phase-derived SWE–baseflow lags as a signal-based indicator of storage modulation. Across both regions, SWE and baseflow exhibit stable annual coupling, with SWE consistently leading baseflow. Mean lags are systematically longer in higher, colder, and snow-richer catchments, consistent with stronger storage buffering and delayed meltwater release. At the regional scale, the characteristic lag is ~69 days in Czech catchments and ~100 days in Swiss catchments, and the lag increases with elevation in both countries. These storage-linked delays align with stronger snow support to summer baseflow at higher elevations, while mid-elevation catchments near the snow–rain transition show shorter lags and weaker persistence of snow influence. This lag-based indicator provides a compact, transferable way to diagnose where snowmelt most strongly sustains baseflow through storage buffering, and where this mechanism is most likely to weaken as snow seasons shorten under warming.

How to cite: Acheampong, J. N. and Jenicek, M.: Snowmelt–Baseflow Lags as Indicators of Elevation-Dependent Storage Buffering in Snow-Dominated Mountain Catchments, EGU General Assembly 2026, Vienna, Austria, 3–8 May 2026, EGU26-4540, https://doi.org/10.5194/egusphere-egu26-4540, 2026.

EGU26-6027 | ECS | Posters on site | HS2.1.4

Evaluation of the performance of a database for snow water equivalent in southern Quebec, obtained using a spatialised particle filter 

Ralph Bathelemy, Marie-Amélie Boucher, Sergio Andrés Redondo Tilano, and Justine Hamelin

Université de Sherbrooke (UdeS) produced a snow water equivalent (SWE) database for southern Quebec, Canada, using a spatialised particle filter, the snow module of the distributed hydrological model Hydrotel, and two types of snow observations (manual snow surveys, and automated sonic sensors). This gridded database has a spatial resolution of 10 km and covers the southern part of the province of Quebec, below 53°N. This database is used operationally as part of the government’s official flood forecasting system but has never been compared to other similar gridded datasets. This work therefore aims to compare the UdeS-produced SWE grids with reference data from the Canadian database CanSWE, and GMON stations, which measure SWE using gamma ray attenuation. This study also compares the UdeS grids with four other gridded databases that are widely used in hydrology: ERA-5 Land, SNODAS, MERRA and Crocus-ERA-5. Three indices are used to evaluate the ability of these databases to estimate the duration of the snow cover period: the start and end dates of snow cover and the start date of snowmelt. The annual maximum of SWE, the correlation coefficient, bias, and root mean square error (RMSE) are other indices used to evaluate the ability of these databases to estimate SWE values. The main results show that, despite some differences, particularly in the north-eastern part of the study area, all databases accurately estimated the duration of the snow cover period. Except for the MERRA database, which appears to underestimate the SWE in our study area, the results show that all databases perform well. ERA-5 Land appears to perform better, although it overestimates the reference data. UdeS and Crocus perform similarly but underestimate the reference data.

How to cite: Bathelemy, R., Boucher, M.-A., Redondo Tilano, S. A., and Hamelin, J.: Evaluation of the performance of a database for snow water equivalent in southern Quebec, obtained using a spatialised particle filter, EGU General Assembly 2026, Vienna, Austria, 3–8 May 2026, EGU26-6027, https://doi.org/10.5194/egusphere-egu26-6027, 2026.

EGU26-6555 | ECS | Posters on site | HS2.1.4

Recent Trends in Snow Water Equivalent and Evapotranspiration in the Western Italian Alps: Emerging Signals of Climate Warming 

Alessio Gentile, Davide Gisolo, Tanzeel Hamza, Aurora Olivero, Matteo Salis, Aqsa Aqsa, Stefano Bechis, Stefano Ferrari, Davide Canone, and Stefano Ferraris

European Alps are essential sources of water sustaining downstream ecosystems and human activities. In this regard, they are referred to ‘the water towers of Europe’. However, these regions are also among the most sensitive to climate change. Indeed, the high rate of temperature increase, altered precipitation regimes, and “snow droughts”, i.e., a lack of snow accumulation in winter, are significantly impacting the hydrological processes in snow-dominated areas.

In this context, Snow Water Equivalent (SWE) and Actual EvapoTranspiration (AET) are two key variables for understanding the mountain water cycle. Investigating SWE and AET changes is essential to detect whether the hydrological cycle is accelerating in response to climate warming.

Gridded datasets, such as those derived from reanalysis products or satellite-based observations, have significantly enhanced the spatial representation of climatic and environmental variables in topographically complex regions, where the availability of ground-based observational data is often sparse or unevenly distributed due to logistical and environmental constraints.

This study examines the dynamics of SWE and AET over recent years across catchments of varying spatial scales in the Western Italian Alps, based on SWE data from the IT-SNOW dataset and AET data from MODIS. The analysis also includes a comparison between gridded data and in-situ measurements. The main aims are:

  • evaluate the ability of gridded datasets to capture key hydrological processes at multiple spatial scales;
  • identify shifts in snow regimes and evapotranspiration patterns potentially driven by climate warming;
  • assess the reliability of gridded data for local-scale hydrological applications through comparison with ground-based observations.

This publication is part of the project NODES which has received funding from the MUR – M4C2 1.5 of PNRR funded by the European Union - NextGenerationEU (Grant agreement no. ECS00000036). This work was supported  by the PRIN 2022 202295PFKP SUNSET Project and by Funding 2023-2025 Fondazione CRT.

How to cite: Gentile, A., Gisolo, D., Hamza, T., Olivero, A., Salis, M., Aqsa, A., Bechis, S., Ferrari, S., Canone, D., and Ferraris, S.: Recent Trends in Snow Water Equivalent and Evapotranspiration in the Western Italian Alps: Emerging Signals of Climate Warming, EGU General Assembly 2026, Vienna, Austria, 3–8 May 2026, EGU26-6555, https://doi.org/10.5194/egusphere-egu26-6555, 2026.

EGU26-7317 | ECS | Orals | HS2.1.4

High-Altitude Himalayan Meltwater Contributions Revealed by Isotopic Analysis 

Benjamin Graves, Tom Matthews, and Richard Taylor

Melting glaciers provide crucial seasonal water to communities in high mountain regions. To project how mountain water resources will be impacted by glacial recession requires quantification of current contributions of glacier meltwater to streamflow. This is particularly challenging in monsoon-affected regions, where high glacier melt rates are synchronous with very high precipitation rates. Glacio-hydrological modelling provides a way of estimating meltwater contributions, but confidence in applied conceptual and numerical models is enhanced by observations. Here, stable isotope ratios of oxygen and hydrogen are employed in order to trace relative contributions of multiple sources to the flow of the Dudh Koshi river in northeastern Nepal. Integration of 45 new observations from river, glacial melt, and snow samples with 784 previous observations creates a comprehensive multi-season dataset; these data constrain a mixing model to resolve contributions to river flow that vary seasonally and along the river transect. Preliminary results from the new post-monsoon samples indicate the highest meltwater fractional contribution yet seen in this region.

How to cite: Graves, B., Matthews, T., and Taylor, R.: High-Altitude Himalayan Meltwater Contributions Revealed by Isotopic Analysis, EGU General Assembly 2026, Vienna, Austria, 3–8 May 2026, EGU26-7317, https://doi.org/10.5194/egusphere-egu26-7317, 2026.

EGU26-8202 | ECS | Orals | HS2.1.4

Elevation-dependent snow cover changes across Switzerland in the 21st century 

Harsh Beria, Sven Kotlarski, Adrien Michel, Tobias Jonas, and Christoph Marty

Snow provides numerous ecosystem and economic services, such as hydropower generation, regulation of stream temperature, and winter tourism. Despite projected increases in winter precipitation, warming temperatures are expected to reduce snowfall and shift precipitation toward rainfall, fundamentally changing snowpack accumulation dynamics, and the associated hazards such as rain-on-snow flooding. This highlights the need for accurate snow projections at locally relevant spatial scales.

Here, we present novel high-resolution (1x1 km²) daily projections of snow water equivalent (SWE) and snow depth for Switzerland, based on the recently released Climate CH2025 scenarios. SWE is simulated for an ensemble of 12 bias-adjusted regional climate models from the EURO-CORDEX initiative using a distributed temperature-index snow model, which is statistically nudged toward a reference SWE dataset (SPASS) – derived from the same model but debiased using data assimilation with observations from 1998-2024.

We project widespread SWE declines across Switzerland, with the largest percentage reductions at low elevations (<1000 m a.s.l.), and a transition from seasonal to ephemeral snowpacks at intermediate elevations. We further assess the added value of high-resolution snow simulations by comparing them with physically-based, but coarser (~12 km) raw EURO-CORDEX SWE projections. While both show consistent large-scale patterns, our higher resolution simulations reveal clearer elevation-dependent signals, especially in topographically complex mountainous landscapes, enabling robust estimation of locally relevant snow indicators. These results offer actionable insights for managing future snow-dependent resources in a rapidly warming climate.

How to cite: Beria, H., Kotlarski, S., Michel, A., Jonas, T., and Marty, C.: Elevation-dependent snow cover changes across Switzerland in the 21st century, EGU General Assembly 2026, Vienna, Austria, 3–8 May 2026, EGU26-8202, https://doi.org/10.5194/egusphere-egu26-8202, 2026.

EGU26-9801 | ECS | Orals | HS2.1.4

Improving the spatial distribution of snow height in physics-based snow models using large-area airborne lidar-scans 

Jens Oprel, Jan Magnusson, Tobias Jonas, Manuela Brunner, Karoline Holand, Andreas Stordal, and Gaute Lappegard

Predicting the volume and timing of snowmelt is essential for applications such as hydropower production planning and flood forecasting. The timing of snowmelt is strongly influenced by the spatial distribution of snow. A more heterogeneously distributed snowpack leads to a longer melt season and lower peak flow than a homogeneously distributed snowpack. Despite the importance of spatial snow distribution for runoff characteristics, large-scale and high-resolution measurements of snow distribution are rare and it is challenging to effectively use such measurements in models when the snow conditions differ substantially across the study region.

We acquired high-resolution airborne lidar snow height maps in three winters for three large hydropower regions in Southern Norway, covering over 1000 km2. We use these to improve snow height simulations and demonstrate how the scans can be assimilated into a physics-based snow model. To this end, we use a snowfall scaling method that aims to implicitly describe preferential deposition and redistribution processes during snow accumulation by altering the snowfall inputs to the snow model. In each grid cell, a scaling factor is chosen such that the modelled snow height matches the observed snow height. Existing methods are often not finding the optimal scaling factor, especially in case snowmelt has started in parts of the scanned regions. We present a new approach that considers estimated snow losses due to melt and sublimation that occurred before the acquisition of the lidar scan. With this improvement, scans taken slightly after melt onset in part of the region can still be used to reliably find the optimal snowfall scaling factors, even if part of the snow is already lost due to melt and sublimation.

We show how similar these snowfall scaling factors are between years, due to repeatable patterns in snow height, and whether this similarity provides opportunities to transfer snowfall scaling factors to different years. Furthermore, we show that higher model resolutions are best suited to represent the observed spatial snow distribution in the model using the proposed snowfall scaling method. The insights of this work can be used to effectively use large area, high-resolution snow height measurements in snow models.

This work is partially funded by Statkraft Energi AS and the Norwegian Research Council (SnowInflow, NFR 346308).

How to cite: Oprel, J., Magnusson, J., Jonas, T., Brunner, M., Holand, K., Stordal, A., and Lappegard, G.: Improving the spatial distribution of snow height in physics-based snow models using large-area airborne lidar-scans, EGU General Assembly 2026, Vienna, Austria, 3–8 May 2026, EGU26-9801, https://doi.org/10.5194/egusphere-egu26-9801, 2026.

Quantifying snow water equivalent (SWE) and melt dynamics across the Pan-Siberian domain is critical for understanding the hydro-climatological conditions of the entire Northern Hemisphere. However, due to the scarcity of data, the strong interaction between vegetation and climate, and representativeness biases of sparsely distributed measurement stations, there is a high degree of uncertainty in current estimations. While traditional monitoring networks provide essential points of reference, their limited spatial coverage and site-selection biases—often favoring open clearings—hinder the accurate assessment of regional snow storage across diverse and complex landscapes.
In this study, we develop and apply a physics-based snow process model designed for data-sparse cold regions, combined with a corresponding regionalization strategy to bridge the gap between sparse point-scale observations and regional snow dynamics. The model was first validated at the Sodankylä site in Finland, demonstrating high performance for both Snow Depth (NSE > 0.78) and SWE (NSE > 0.83), indicating a physically consistent representation of snow density, compaction, and melt processes. The model was then applied across Pan-Siberia by grouping 85 stations into hydro-climatic regimes based on wind, precipitation characteristics, and forest cover. Model parameters were calibrated simultaneously across stations within each regime to derive robust zonal parameter sets, thereby ensuring physical consistency and overcoming parameter equifinality.
The resulting regionalized model achieves robust performance across the majority of the domain (median KGE > 0.75), substantially outperforming global default parameterizations. The results reveal a key physical insight in forest-dominated Taiga regions, where the optimized wind correction factor converges toward zero, confirming the strong canopy sheltering effect and indicating that standard WMO wind corrections systematically overestimate snowfall under forest cover. In contrast, the Cold Continental regime (Yakutia) exhibits a high rain–snow temperature threshold (~+3.7°C), reflecting sublimation-driven cooling under extremely dry atmospheric conditions. 
This approach enables the reconstruction of spatially consistent, multi-year snow dynamics across Pan-Siberia, providing a scalable strategy for hydrological modeling in ungauged, cryosphere-dominated regions and offering new insights into the spatiotemporal evolution of Eurasian snow resources.

How to cite: Luo, J. and Menzel, L.: A Physics-Based Regionalized Snow Modeling Framework for the Data-Sparse Pan-Siberian Domain, EGU General Assembly 2026, Vienna, Austria, 3–8 May 2026, EGU26-9883, https://doi.org/10.5194/egusphere-egu26-9883, 2026.

EGU26-10888 | Orals | HS2.1.4

Assessment of snow model uncertainty using a large number of openAMUNDSEN snow model configurations: A study from the Berchtesgaden National Park (Germany) 

Erwin Rottler, Brage Storebakken, Michael Warscher, Florian Hanzer, Elena Bertazza, and Ulrich Strasser

While the assessment of climate model uncertainty is well established, the uncertainty originating from the selection of a surface snow model usually only receives little attention. However, a better understanding of snow model uncertainty currently becomes more and more important, as novel climate model data at the kilometer-scale, innovative downscaling techniques, and increasing computational capacities are among the elements that pave the way for a new phase of high resolution and physically based climate change impact studies assessing cryospheric changes in complex mountain areas. To investigate the uncertainty induced by the selection of the snow model configuration, we simulate the seasonal snow cover in the mountain area of the Berchtesgaden National Park (Germany) under historical conditions (10/2013 - 09/2023) and for a 10-year period characterized by a 1°C warming. Therefore we use a large number of openAMUNDSEN snow model configurations (n = 108) with T-Index, enhanced T-Index as well as energy balance based snowmelt methods, varying land cover maps and spatial resolutions. Forcing data for the 10-year warming period is constructed using the stochastic bootstrap resampler (climate generator) available within the openAMUNDSEN modelling framework. Prior to the estimation of snow model uncertainty, we evaluate the snow model results using satellite-based snow data. Our results suggest that differences in key snow metrics such as snow cover duration and snow disappearance day can be in the same range as the impact of a 1°C warming. The results also support the identification of critical snow model settings that need to be considered, in particular, when using energy balance instead of degree-day snow models to investigate climate change impacts on snow hydrological processes in complex mountain terrain.

How to cite: Rottler, E., Storebakken, B., Warscher, M., Hanzer, F., Bertazza, E., and Strasser, U.: Assessment of snow model uncertainty using a large number of openAMUNDSEN snow model configurations: A study from the Berchtesgaden National Park (Germany), EGU General Assembly 2026, Vienna, Austria, 3–8 May 2026, EGU26-10888, https://doi.org/10.5194/egusphere-egu26-10888, 2026.

EGU26-11091 | Orals | HS2.1.4

Global glacier contribution to streamflow 

Fanny Brun, Marit van Tiel, Matthias Huss, and Giulia Mazzotti

Glacier contribution to streamflow has mostly been investigated at the scale of relatively small catchments, and more rarely at the scale of the major rivers. In this study, we compare monthly glacier mass changes to monthly estimates of streamflow for the period 1990-2023, both annually and seasonally for 55 major river basins larger than 5700 km2 (0.01 to 20.0 % glaciated). Monthly mass changes for every individual glacier are obtained by temporally downscaling geodetic elevation change observations with the variability from in situ glaciological measurements and global-scale model results. Streamflow is based on GLOFAS and G-RUN global datasets. GLOFAS is a land surface model forced by ERA5 reanalysis that feeds a channel routing model. G-RUN is a machine learning algorithm that predicts monthly runoff based on the Global Soil Wetness Project Phase 3 dataset. Basin scale precipitation and evapotranspiration are estimated from ERA5 reanalysis data.

Annual glacier mass change and thus water release ranges from near zero to 550 mm at the basin-scale and roughly correlates with the percentage of the glacierized area in the basin.  The ratio of annual glacier mass change divided by the mean annual discharge, hereafter called the annual glacier contribution, is below 6 % for all the basins larger than 500’000 km2, with the exception of the Indus river with an annual glacier contribution of 25 % (40 mm). The Indus river basin is both highly glacierized (more than 3 %) and arid, explaining such a high ratio.

The glacier seasonal contributions, defined as the water volume derived from glacier mass change during summer months (JJAS in the northern hemisphere and DJFM in the southern hemisphere), divided by the mean discharge in the same months, are always higher than the annual ones. In particular for the basins with low flow during the melt season (e.g. Rapel, Skagit, Rhone, Columbia, Biobio, Po, Rhine), the seasonal contribution is more than three times the annual one. On average 62 % of the glacier mass change originate as a balance contribution, meaning that it corresponds to the seasonal snow accumulation. In contrast, 38 % of the glacier contribution originates from ice melt, i.e. the unsustainable release of the solid water stored in glaciers.

Besides uncertainties in glacier mass change and streamflow data, evaporation (of the glacier meltwater) and groundwater contributions are not treated explicitly, which might lead to overestimations of the glacier contributions. It should thus be seen as a first-order estimate that highlights the major contrasts between basins at the global scale.

How to cite: Brun, F., van Tiel, M., Huss, M., and Mazzotti, G.: Global glacier contribution to streamflow, EGU General Assembly 2026, Vienna, Austria, 3–8 May 2026, EGU26-11091, https://doi.org/10.5194/egusphere-egu26-11091, 2026.

EGU26-11618 | ECS | Posters on site | HS2.1.4

From Snow to Rain: Elevation-Dependent Drought Responses and Drivers in a Large Italian Alpine Catchment. 

Senna Bouabdelli, Martin Morlot, Christian Massari, and Giuseppe Formetta

Drought has recently emerged as a common hazard in Alpine regions, where snow
dynamics strongly influence river flow regimes and play a crucial role in reservoir filling,
irrigation, tourism, and ecosystem sustainability. Reduced snow contributions and
warmer winters, which enhance rainfall at the expense of snowfall, can shift the
hydrological behaviour of Alpine catchments toward regimes typical of lower elevations.
In this study, we assess the main drivers of drought in the Adige River basin, a large
Italian Alpine basin characterized by sub-catchments spanning a wide range of
elevations over the period (1980-2018). We further investigate the seasonality and
characteristics of drought events across elevation bands to identify the drought types
with the greatest impacts in terms of total severity and duration. Our results show that
cold-season snow drought is the dominant drought type over the study period, followed
by snowmelt drought and rainfall deficit drought. Mid- and high-elevation sub-
catchments are particularly affected by cold season and snowmelt drought, whereas
low-elevation areas are mainly impacted by rainfall deficit drought. These findings
highlight the need for adaptation strategies that explicitly account for seasonal drought
processes and elevation-dependent river responses to sustain mountain water systems
under increasing drought conditions, especially given the implications for hydropower
production, irrigation, and tourism.

How to cite: Bouabdelli, S., Morlot, M., Massari, C., and Formetta, G.: From Snow to Rain: Elevation-Dependent Drought Responses and Drivers in a Large Italian Alpine Catchment., EGU General Assembly 2026, Vienna, Austria, 3–8 May 2026, EGU26-11618, https://doi.org/10.5194/egusphere-egu26-11618, 2026.

EGU26-13523 | Posters on site | HS2.1.4

Sentinel-2 Based Validation of Snow Covered Area of Alpine3D Simulations Applying Snow Depth Pattern Redistribution across Two High-Alpine Karst Catchments 

Roberta Facchinetti, Elias Bögl, Paul Schattan, Jakob Knieß, Karl-Friedrich Wetzel, Karsten Schulz, and Franziska Koch

Modelling high-alpine hydrology poses significant challenges due to terrain heterogeneity and complex topography. In snow-dominated karst catchments, accurate representation of spatiotemporal snow distribution is essential for simulating aquifer recharge and spring discharge dynamics. However, differences in data availability and landscape complexity can be a limit. Here, we assess the ability of Alpine3D applying snow pattern redistribution to capture the spatiotemporal snow cover variability in two adjacent alpine karst catchments with different spatial snow distribution characteristics.

We present an 11-year (2015-2025) validation of Alpine3D simulations in two adjacent high-alpine karst catchments in the Zugspitze region in Germany (European Alps): the Partnach Spring catchment (15.4 km², 1430-2962 m a.s.l.) and the Hammersbach catchment (17.8 km², 768-2951 m a.s.l.). While both catchments share similar karstified alpine geomorphology, Partnach Spring is characterized by higher elevations on average, limited vegetation, and more persistent snow cover, whereas Hammersbach exhibits stronger elevation gradients, greater forest cover, and higher radiation exposure, leading to more heterogeneous snow accumulation and melt dynamics.

Precipitation and snow were redistributed in order to correct snow water equivalent quantitatively and spatially. Therefore, we used a snow depth map derived by Pléiades stereo satellite images taken on the 9th of April 2021, near peak snow accumulation. Data gaps, e.g. due to shaded areas and very steep terrain were filled using Random Forest trained on terrain attributes, topographic indices, and energy balance parameters. Alpine3D was run at 16 m × 16 m resolution with spatially interpolated meteorological station data on an hourly base and was validated against Sentinel-2 snow cover area (SCA) maps during the melt season (May-August). Snow classification employed dual thresholds (red band reflectance and NDSI) with manual cloud masking and DEM-based shadow removal. Modelled performance was evaluated using pixel-based confusion matrices across multiple dates per year, whereof we will present preliminary results for both catchments.

This multi-catchment approach with different characteristics, but similar meteorological conditions aim to demonstrate the transferability of this snow redistribution method across different alpine environments. The results are valuable insights for improving hydrological predictions in ungauged basins with limited spatially distributed snow observations.

How to cite: Facchinetti, R., Bögl, E., Schattan, P., Knieß, J., Wetzel, K.-F., Schulz, K., and Koch, F.: Sentinel-2 Based Validation of Snow Covered Area of Alpine3D Simulations Applying Snow Depth Pattern Redistribution across Two High-Alpine Karst Catchments, EGU General Assembly 2026, Vienna, Austria, 3–8 May 2026, EGU26-13523, https://doi.org/10.5194/egusphere-egu26-13523, 2026.

EGU26-13824 | ECS | Posters on site | HS2.1.4

A Methodological Framework for Harmonized Comparison of Model-Based and Satellite-Derived Snow Cover Products in Data-Sparse Mountain Regions of Kyrgyzstan.  

Jumana Akhter, Beatrice Marti, Peter Molnar, Joel Caduff-Fiddes, and Silvan Ragettli

In the glacier-melt-dominated regions of Kyrgyzstan, accurate cryosphere monitoring is essential for Central Asian water resource forecasting. However, the lack of consistent in situ observations necessitates the integration of diverse remote sensing datasets and physically based models which often vary in their underlying assumptions and resolutions. This study presents a transparent, reproducible framework for the comparative evaluation of heterogeneous snow products in complex terrain, applied to SnowMapper (a NWP-driven physical model) and GlacierMapper (a MODIS-based NDSI product) for the period 2000–2024.

The framework employs spatial harmonization via nearest-neighbor resampling to a common independent grid and temporal alignment across differing calendar conventions. To address variable incompatibility, Snow Water Equivalent (SWE) outputs from SnowMapper are transformed into binary snow/no-snow classifications using literature-derived thresholds. Sensitivity analyses reveal that product agreement is significantly influenced by these methodological transformations. Evaluation using complementary spatiotemporal diagnostics such as fractional snow cover area, balanced accuracy, Cohen’s kappa and snow depletion curves (SDCs) identifies periods of systematic divergence across decadal and seasonal timescales. Results demonstrate that apparent product discrepancies arise not only from physical inconsistencies but also from methodological treatment. This standardized intercomparison approach is transferable across sensors and regions enhancing the reliability of snow-product assessments in data-scarce mountain environments.

How to cite: Akhter, J., Marti, B., Molnar, P., Caduff-Fiddes, J., and Ragettli, S.: A Methodological Framework for Harmonized Comparison of Model-Based and Satellite-Derived Snow Cover Products in Data-Sparse Mountain Regions of Kyrgyzstan. , EGU General Assembly 2026, Vienna, Austria, 3–8 May 2026, EGU26-13824, https://doi.org/10.5194/egusphere-egu26-13824, 2026.

EGU26-14610 | ECS | Posters on site | HS2.1.4

Process-based modelling of the energy and water balance of the Rio Santa Basin, Peruvian Andes 

Yota Sato, Catriona Fyffe, Thomas Shaw, Vinisha Varghese, Achille Jouberton, Maximiliano Rodriguez, and Francesca Pellicciotti

Glaciers in the Peruvian Andes play a crucial role in sustaining regional water resources for downstream populations and ecosystems, have been experiencing rapid mass loss and retreat in recent decades. The region is characterised by a tropical semi-arid climate with minimal seasonal temperature variability, alternating dry and wet seasons, and high-elevation areas frequently experience air temperatures close to 0 °C. These conditions lead to dynamic glacier energy-balance processes, in which intermittent and ephemeral snow strongly controls melt. Furthermore, these glacierized areas provide water resources to fragile downstream ecosystems, as well as subsistence and commercial agricultural systems, which themselves alter the water balance. It is challenging to reproduce the energy and water balance of such a complex environment using simplified, empirically parameterised models, and integrated, process-based modelling approaches might offer a viable way forward under a changing climate. We use a physically-based land surface modelling framework to disentangle the spatio-temporal variability of the energy and water balance of a large catchment in the Peruvian Andes. 

Within this study we focus on the Rio Santa basin (4950 km2), located in the Cordillera Blanca, which contains ~330 km2 of glacier area at elevations of 4300-6300 m a.s.l. We employ the process-based land-surface model Tethys-Chloris to simulate energy and water fluxes over a 9-year period (2010-2018) for the whole catchment. We use downscaled meteorological forcing derived from a WRF climate model simulation forced by ERA5 reanalysis. Meteorological forcings are bias-corrected using observations from multiple automatic weather stations across the catchment. The model is evaluated using in-situ glacier observations, including mass balance, surface albedo, and snow-pit measurements, as well as remote-sensing products covering the catchment. 

We present a comprehensive, process-based simulation of the catchment-scale water balance of the Rio Santa basin. We quantify the altitudinal distribution and the spatial, seasonal, and interannual variability of the blue-green-white water balance and its individual components across the entire catchment. We further estimate the energy- and mass-balance components of all glaciers in the Cordillera Blanca (445 glaciers) to identify hotspots of glacier changes and their controls. This allows us to determine the importance of sublimation for controlling glacier mass balance and the role of ephemeral snow in shaping melt rates. A key step forward is the catchment-wide quantification of catchment losses, where we identify the combined role of sublimation and evapotranspiration in the water balance. These results provide a novel process-based understanding of the energy and water balance of the Rio Santa basin to establish a mechanistic baseline simulations to understand future changes in the system.

How to cite: Sato, Y., Fyffe, C., Shaw, T., Varghese, V., Jouberton, A., Rodriguez, M., and Pellicciotti, F.: Process-based modelling of the energy and water balance of the Rio Santa Basin, Peruvian Andes, EGU General Assembly 2026, Vienna, Austria, 3–8 May 2026, EGU26-14610, https://doi.org/10.5194/egusphere-egu26-14610, 2026.

EGU26-14775 | ECS | Posters on site | HS2.1.4

Assessing climate change impacts on pristine glaciated catchments in the Alpine region using indicators of hydrological alteration 

Chahinaz Ziani, Lars Ribbe, Moritz Heinle, Renee van Dongen-Köster, Claudia Zentis, Tinh Vu, and Luna Bharati

Glaciers sustain the global water cycle and preserve natural ecosystems by acting as reservoirs that release consistent freshwater during dry periods. This meltwater supports biodiversity, nutrient balances, river streamflow modulation, and human activities such as irrigation and water supply. Currently, accelerating glacier melt has become an alarming phenomenon, with global glacier mass loss of around 5% since 2000. This contributes to sea-level rise and threatens water supplies for over 2 billion people. In this context, this study aims to assess the impacts of climate change on pristine glaciated catchments in the Apline region, where accelerating ice loss threatens spring and summer river flows that are vital for ecosystems and societies. Using the ROBIN dataset, we calculated seasonal (i.e., spring and summer) indicators of hydrologic alterations (magnitude, timing, extremes) comparing pre-climate change (1931–1950) and post-climate change (1977–2012) baselines for 20 pristine catchments with areas ranging between 22 Km2 -981 Km2.

Results in spring and summer reveal high variability in key flow indicators (including mean monthly and seasonal flows, rise and fall rates, In addition to  seasonal minimum and maximum flows) especially across the six largest catchments in the study area (> 345 Km2). Comparing the post-climate change period (1977–2012) to the pre-climate change baseline, results indicated increased interquartile ranges and greater uncertainty of mean values associated with seasonal flow rates. Additionally, they showed irregular occurrences of extremes regarding their timing, frequency, and duration of high and low pulses, as well as flow reversals, for all catchments. These findings indicate increased dispersion, extremes, and instability associated with a meltwater buffer zone.

These results highlight that climate change has a strong impact on pristine Alpine glaciated catchments with limited human intervention, showing how increased glacier melting rates trigger hydrological fluctuations with pivotal implications on water resources management. This situation requires effective adaptation measures concerning increased ice melting rates.

How to cite: Ziani, C., Ribbe, L., Heinle, M., van Dongen-Köster, R., Zentis, C., Vu, T., and Bharati, L.: Assessing climate change impacts on pristine glaciated catchments in the Alpine region using indicators of hydrological alteration, EGU General Assembly 2026, Vienna, Austria, 3–8 May 2026, EGU26-14775, https://doi.org/10.5194/egusphere-egu26-14775, 2026.

EGU26-15976 | ECS | Orals | HS2.1.4

Tree sway monitoring for improved representation of canopy snow interception in cold, wet climates 

Emmanuelle Barrette, Vincent Vionnet, Benjamin Bouchard, and Daniel F. Nadeau

In cold and wet regions, the forest canopy strongly influences the energy and mass balance of the snowpack by intercepting a large fraction of solid precipitation. Although commonly represented in land-surface models, snow interception remains poorly documented in the field because of the difficulties associated with directly measuring intercepted snow mass. Existing indirect measurement approaches include the use of accelerometers to quantify wind-induced tree sway and relate changes in sway frequency to variations in intercepted snow mass. However, this experimental method has so far been applied at only one site in the western United States, under climatic conditions that differ from those of the boreal forests of eastern Canada.

The objective of this study is to apply the tree sway method in eastern Canada to estimate intercepted snow mass and to improve the parametrization of canopy snow interception in the SVS2–Crocus land surface model.

A total of nine coniferous trees were equipped with accelerometers across three sites to monitor wind-induced tree sway and obtain estimates of intercepted snow mass. Results from the winter 2024–25 show that the sway method captures rapid loading and unloading events, with sway frequency responding to interception and release within a few hours, in agreement with hourly timelapse imagery acquired at each site. The resulting intercepted snow time series is then used to evaluate the canopy interception parametrization in the SVS2–Crocus model, which was forced using in situ meteorological measurements.

Sway-based observations and simulated intercepted snow mass show good agreement in the timing of interception and unloading, with rapid increases during snowfall and subsequent exponential decay. However, the model tends to overestimate slow, continuous unloading and often fails to accurately reproduce rapid unloading events associated with strong winds, warm temperatures, or rain-on-snow events. These results pave the way for improving the parametrization of canopy snow unloading in SVS2–Crocus and, in turn, for more accurately estimating snow cover in forested environments.

How to cite: Barrette, E., Vionnet, V., Bouchard, B., and Nadeau, D. F.: Tree sway monitoring for improved representation of canopy snow interception in cold, wet climates, EGU General Assembly 2026, Vienna, Austria, 3–8 May 2026, EGU26-15976, https://doi.org/10.5194/egusphere-egu26-15976, 2026.

EGU26-16472 | ECS | Posters on site | HS2.1.4

Most Asian Glaciers Will Deplete After Mid-Century: Linking Mass Loss to Peak Water Runoff 

Muhammad Mannan Afzal, Xie Fuming, and Shiyin Liu

Glacier runoff in High Mountain Asia (HMA) is approaching peak water in many regions, with asynchronous timing across basins due to differences in glacier size, elevation, and climate forcing. Using the Open Global Glacier Model (OGGM v1.6.1), we simulate glacier mass balance (1940–2019), glacier dynamics and runoff (1940–2100) across 17 major basins, driven by bias-corrected GSWP–W5E5 historical forcing and an ensemble of 13 CMIP6 GCMs and four SSP scenarios. Small, low-elevation glaciers have already surpassed their peak runoff and are rapidly vanishing, whereas large, high-elevation glaciers continue to buffer downstream flows into the late 21st century particularly in glacier-rich basins such as the Indus and Tarim. HMA-wide glacier mass is projected to decline by 57–82% between 2001-2100, accompanied by an overall 10 ± 6.5% reduction in glacier runoff. Crucially, basin-scale hydrological shifts are not dictated by average glacier behavior, but by the composition and distribution of glacier classes. Clustering analysis reveals three distinct peak-runoff regimes, early, transitional, and delayed primarily controlled by glacier size, elevation, and regional climate. These staggered peak-runoff patterns highlight pronounced spatial heterogeneity in HMA’s hydrological response and underscore the urgency of basin-specific adaptation strategies in one of Earth’s most densely populated and climate-sensitive mountain regions.

How to cite: Afzal, M. M., Fuming, X., and Liu, S.: Most Asian Glaciers Will Deplete After Mid-Century: Linking Mass Loss to Peak Water Runoff, EGU General Assembly 2026, Vienna, Austria, 3–8 May 2026, EGU26-16472, https://doi.org/10.5194/egusphere-egu26-16472, 2026.

EGU26-16647 | Orals | HS2.1.4 | Highlight

The changing water cycle of the mountains 

Francesca Pellicciotti, Mike McCarthy, Achille Jouberton, Alvaro Ayala, Catriona Fyffe, Maximiliano Rodriguez, Pascal Buri, Thomas Shaw, Adria Fontrodona Bach, and Zhenya Tumarkin

Much of the freshwater sustaining human societies is generated in the mountains: the mountain cryosphere supports almost a third of the global population for irrigation, drinking water, industry and the environment. At the same time, this crucial resource is undergoing unprecedented changes, with glaciers shrinking, snow decreasing globally and permafrost thawing across continents. This bigger picture masks a very large variability of responses across climates and continents, shaped by processes specific to different mountain ranges. Glaciers and seasonal snow are often assumed to respond to a changing climate in a linear manner, especially at large and global scales, given the complexity of interactions among them and the eco-hydrology of the catchments they sustain. Growing evidence suggests more complex dynamics and threshold effects that will affect the water resources they generate. 

In this talk, I will focus on processes and non-linearities in the mountain cryosphere that shape the mountain water cycles across climates, and show how that water cycle is changing  across regions as a result. I will focus on a number of specific processes: i) the role of ephemeral and marginal snowpacks on streamflow generation, and their vulnerability to temperature and precipitation shifts, especially in sub-tropical regions; ii) changes in precipitation phase, and their distinct effects on the water cycle depending on precipitation seasonality; iii) the transition from sublimation to melt in a warmer world and how that can change the assumed linear trajectory of water from glaciers and snow in arid areas; iv) the role of evaporative fluxes in the mountain water cycle and how warming promotes increased evapotranspiration that recycle increasing portions of high-altitude precipitation and surface water into the atmosphere. Another key disruption in the functioning of mountain systems is the increasing frequency and intensity of droughts, and I will show some very recent results about how glaciers buffer droughts, and how this capacity might be hampered when droughts become more severe and of longer duration. We use for most of these investigations a fully mechanistic, physically-based modelling framework that represent both the cryosphere, the biosphere and hydrosphere of mountain regions, and I will also briefly touch on the modelling strengths and limitations. 

Our results show that the response of the cryosphere to ongoing changes in the climate is very heterogenous. Ephemeral snow in sub-tropical, semi-arid climates has been mostly neglected in modelling assessments, invisible to satellite images, but represents the main contributor to water runoff, and yet this will change in the future with increasing temperatures, which will remove a major source of water. Overall, shifting snowline altitudes and shrinking accumulation areas will move the areas of water generation to higher elevations, altering storage and routing patterns and seasonality, and accelerating the water cycle. Droughts are changing the functioning of mountain systems, with evapotranspiration amplifying water deficits in many mountain regions, while snow droughts enhance this so-called drought paradox. I will conclude with a perspective of future research on mountain processes and water resources. 

How to cite: Pellicciotti, F., McCarthy, M., Jouberton, A., Ayala, A., Fyffe, C., Rodriguez, M., Buri, P., Shaw, T., Fontrodona Bach, A., and Tumarkin, Z.: The changing water cycle of the mountains, EGU General Assembly 2026, Vienna, Austria, 3–8 May 2026, EGU26-16647, https://doi.org/10.5194/egusphere-egu26-16647, 2026.

Seasonal snowmelt strongly influences hydrological and ecological processes by controlling the timing of peak soil moisture and subsequent vegetation growth; yet, this relationship is less studied in the Indian Himalayan region, especially in Himachal Pradesh’s snow region. This study investigates the linkage between snow disappearance timing and peak soil moisture using station data across various elevation ranges from 1571 m to 3325 m and the FLDAS dataset (daily, 0.01° resolution), and then their effect on vegetation growth using the MODIS NDVI product (8-day, 250-m resolution). We quantified the spatial and temporal variability in snow recession by fitting an exponential decay model. The recession rate varies between 0.03 and 0.27 across various elevation ranges and temporal periods. The recession rate also exhibits a strong elevation dependency, being low at higher elevations (e.g., Lari, 3325 m m.s.l., k = 0.044 m/day) and high at lower elevations (e.g., Dodra Kawar, 2522 m m.s.l., k = 0.169 m/day). Based on analysis from 2001 to 2020 across nine stations, results show that snow onset occurs in mid-December, followed by snow recession in late February and complete snow disappearance by late March across Himachal Pradesh. We observed an average lag of 3-4 days between the timing of peak soil moisture and snow disappearance, and a correlation of 0.94 (p < 0.05) was observed across various stations. Early melt does contribute to greening, as evidenced by the weaker but still positive correlation (0.54, p < 0.05) between the timing of snow disappearance and the rise in NDVI. The results show that the timing of snowmelt primarily influences soil moisture dynamics and controls vegetation activity in Himalayan catchments.

How to cite: Nanda, A., Bharti, A., and Varade, D.: Understanding the Role of Snowmelt Processes on Soil Moisture Storage and Vegetation Dynamics acrossTopographic Gradients of Himalayan Catchments, EGU General Assembly 2026, Vienna, Austria, 3–8 May 2026, EGU26-16655, https://doi.org/10.5194/egusphere-egu26-16655, 2026.

EGU26-16791 | ECS | Orals | HS2.1.4

Dynamic identification of snow phenology in the Northern Hemisphere 

Le Wang, Xin Miao, and Weidong Guo

Snow phenology characterizes the cyclical changes in snow and has become an important indicator of climate change in recent decades. Changes in snow phenology can significantly impact climate and hydrological conditions. Previous studies commonly employed fixed threshold methods to extract snow phenology. However, these methods do not account for the variability in snow distribution across the Northern Hemisphere, leading to potential biases of snow phenology. In this study, we observe that snow phenology extracted from different snow data and methods shows significant differences, but consistently underestimates snow duration at low and middle latitudes. Our analysis further indicates that the changes in snow depth exhibits a significant shift around 10% of peak value across the Northern Hemisphere, marking the transition between the snow and non-snow seasons. We further apply the 10% snow depth threshold and investigate the differences between original and newly extracted snow phenology. At low and middle latitudes, the snow cover duration (SCD) extends, the snow cover onset day (SCOD) advances, and the snow cover end day (SCED) delays, especially on the Tibetan Plateau, where the SCD differences can reach 28 days. The change at higher latitudes is reversed. The dynamic snow phenology accounts for the spatial heterogeneity of Northern Hemisphere snow cover, and excludes the influence of inter-annual variability of snow cover on snow phenology extraction, providing a novel perspective for identifying and understanding snow cover variations in the Northern Hemisphere.

How to cite: Wang, L., Miao, X., and Guo, W.: Dynamic identification of snow phenology in the Northern Hemisphere, EGU General Assembly 2026, Vienna, Austria, 3–8 May 2026, EGU26-16791, https://doi.org/10.5194/egusphere-egu26-16791, 2026.

EGU26-17257 | ECS | Posters on site | HS2.1.4

Integrating snow-water equivalent simulated by a physically based model into a lumped model in an Alpine catchment in Italy 

John Mohd Wani, Giacomo Bertoldi, Michele Bozzoli, Daniele Andreis, and Riccardo Rigon

In the European Alps, seasonal snow plays a crucial role in hydrology, functioning as a reservoir by storing precipitation during winter and releasing it during the summer. Snow is highly sensitive to climate change, particularly in low- and mid-elevation mountain regions like the European Alps. In snow-fed basins, any changes in snowmelt contribution to river discharge can significantly impact agriculture, domestic water supply, and hydro power generation. 

Hydrological modeling employs a variety of models, ranging from simple lumped models to physically-based, spatially distributed models, to simulate river discharge. These models either have a simple temperature-based or a physically based snow module to simulate the snow dynamics. Distributed, physically based models can provide accurate insights into snow dynamics. However, their high input data requirement, over-parameterization, and high computational demands make them challenging to calibrate for discharge estimation for operational purposes. In contrast, simple lumped models require less input data, standard snow parameters, quick calibration, and are well-suited for operational applications, but, of course, lack spatial details.

In this study, we present an approach to improve both runoff forecasting and spatial snow pattern estimation by integrating the snow water equivalent (SWE) simulations from a physically based GEOtop model into the lumped GEOframe system. We utilize a mass-conserving Topographic Response Unit (TRU) aggregation logic to preserve the spatial variability of melt fluxes across elevation and aspect gradients. The methodology is applied in the Non Valley catchment, Italy, where water is important for agriculture, hydropower, and other uses.

Our results for the period 01-01-2017 to 15-09-2022 at hourly time step show that the GEOframe is able to simulate the discharge very well with a Kling-Gupta Efficiency (KGE) value of 0.87 and 0.72 during the calibration and validation, respectively. Substituting the internal snow module with GEOtop-derived fluxes yielded a KGE of 0.71 without further calibration. This demonstrates that the physically-based snow input successfully maintains the model’s predictive power while providing a more realistic and spatially distributed representation of snow dynamics. This coupling approach preserves the operational efficiency of lumped models while incorporating the improved physical representation and spatial variability essential for modeling mountain hydrology under a changing climate.

Acknowledgement

JMW and RR would like to thank and acknowledge the funding support from Project “SPACE IT UP! ASI Contract n.2024-5-E.0 CUP Master n. I53D24000060005” SAP fund n: 000040104905.

How to cite: Wani, J. M., Bertoldi, G., Bozzoli, M., Andreis, D., and Rigon, R.: Integrating snow-water equivalent simulated by a physically based model into a lumped model in an Alpine catchment in Italy, EGU General Assembly 2026, Vienna, Austria, 3–8 May 2026, EGU26-17257, https://doi.org/10.5194/egusphere-egu26-17257, 2026.

EGU26-17888 | ECS | Orals | HS2.1.4

SNOWCOP: Advancing High-Resolution Retrospective SWE Reconstruction in the Andes of Chile and Argentina with Remote Sensing 

Valentina Premier, Diego Blanch, Paloma Valentina Palma, Maria Ignacia Orell, Ezequiel Toum, Mariano Masiokas, Pierre Pitte, Leandro Cara, James McPhee, and Carlo Marin

SNOWCOP is a Horizon Europe project aimed at developing and evaluating a new high-resolution reanalysis dataset of snow water equivalent (SWE) and glacier ice melt rates for the extra-tropical Andes. The project integrates Copernicus and complementary remote sensing products within a physically based modeling framework to generate daily SWE and ice melt rate maps at 50 m spatial resolution, covering the period from 2002 to the present. These products address a critical observational gap in the region, where ground-based snow and meteorological measurements remain sparse. To support the development and validation of the SNOWCOP workflow, the initial phase of the project focuses on two pilot basins: the Río Maipo (Chile) and the Upper Río Mendoza (Argentina). These basins were selected due to their long term and high-quality instrumental SWE records, making good candidates for method’s evaluation.

We present the first results of a retrospective SWE reconstruction that integrates high-resolution daily snow cover maps with snowmelt modeling. The snow cover products are generated by applying a gap-filling and downscaling algorithm to coarse-resolution snow cover fraction data fused with high-resolution multi-source optical observations (Premier et al., 2021). Several snowmelt modeling approaches are evaluated, including a simple temperature-index (TI) model, an enhanced temperature-index (ETI) model (Pellicciotti et al., 2005), and fully physics-based formulations. Model coefficients are derived through calibration against in-situ observations. Meteorological forcings are obtained from ERA5 reanalysis data and dynamically downscaled using MicroMet (Liston & Elder, 2006). The reconstructed SWE is evaluated against ground-based measurements and compared with an existing SWE reanalysis dataset (Cortés & Margulis, 2017). as well as  modeling results produced by our team (CHM model - Marsh et al., 2020). 


References 

Cortés, G., & Margulis, S. (2017). Impacts of El Niño and La Niña on interannual snow accumulation in the Andes: Results from a highresolution 31 year reanalysis. Geophysical Research Letters, 44(13), 6859-6867. 

Liston, G. E., & Elder, K. (2006). A meteorological distribution system for high-resolution terrestrial modeling (MicroMet). Journal of Hydrometeorology, 7(2), 217-234. 

Marsh, C. B., Pomeroy, J. W., and Wheater, H. S.: The Canadian Hydrological Model (CHM) v1.0: a multi-scale, multi-extent, variable-complexity hydrological model – design and overview, Geosci. Model Dev., 13, 225–247. 

Pellicciotti, F., Brock, B., Strasser, U., Burlando, P., Funk, M., & Corripio, J. (2005). An enhanced temperature-index glacier melt model including the shortwave radiation balance: development and testing for Haut Glacier d’Arolla, Switzerland. Journal of glaciology51(175), 573-587. 

Premier, V., Marin, C., Steger, S., Notarnicola, C., & Bruzzone, L. (2021). A novel approach based on a hierarchical multiresolution analysis of optical time series to reconstruct the daily high-resolution snow cover area. IEEE Journal of Selected Topics in Applied Earth Observations and Remote Sensing, 14, 9223-9240. 

How to cite: Premier, V., Blanch, D., Palma, P. V., Orell, M. I., Toum, E., Masiokas, M., Pitte, P., Cara, L., McPhee, J., and Marin, C.: SNOWCOP: Advancing High-Resolution Retrospective SWE Reconstruction in the Andes of Chile and Argentina with Remote Sensing, EGU General Assembly 2026, Vienna, Austria, 3–8 May 2026, EGU26-17888, https://doi.org/10.5194/egusphere-egu26-17888, 2026.

EGU26-17903 | Posters on site | HS2.1.4

Understanding the combined impact of vegetation and glacier change on Andean hydrology 

Catriona L. Fyffe, Katy Medina, Rolando Cruz, Edwin Loarte, Joshua Castro, Thomas E. Shaw, Simone Fatichi, Harol Granados, and Francesca Pellicciotti

The Peruvian Andes have faced substantial glacier loss in recent decades, and as the glaciers have receded, the exposed ground has been gradually occupied by succession vegetation. Previous work assessing the impact of glacier loss on downstream hydrology has tended to assess the cryospheric change in isolation, which may not account for the impact of vegetation changes on the water balance, especially in terms of altering catchment losses. An increasing body of work has demonstrated the importance of snow and glaciers for water resources in this region, especially in the dry season, although continued warming and glacier loss is predicted to decrease these meltwater contributions. Plant growth in deglaciated regions has the potential to compound runoff decreases through increasing evapotranspiration, but few studies have attempted to quantify this. This work aims to provide the first integrated assessment of the combined impact of glacier evolution and post-glacial vegetation succession on water availability in the Peruvian Andes. 

Here we quantify these changes by modelling the hydrological and ecological functioning of the Shallap catchment (13.6 km2) in the Rio Santa basin of the Peruvian Andes. We apply the mechanistic land surface model Tethys-Chloris which applies a full energy balance approach to resolving the fluxes over clean and debris-covered ice, snow and vegetation surfaces. The model is applied for a present period (2014-2025), forced by measured meteorological data, and using data from vegetation transects to parameterise the succession vegetation cover. The model is validated against ablation stakes, remotely sensed glacier mass balance, ground temperature, soil moisture and river discharge. We then simulate scenarios of climate, vegetation and glacier change to assess the separate and combined impact of glacier change and plant succession on the energy and water balance into the future. We are able to determine the impact of succession vegetation on evapotranspiration rates and water yield compared to bare soil and glacier cover, and determine the overall potential impact of glacier and vegetation change on downstream runoff. This work will provide a basis for understanding the significance of plant succession for the overall water balance in deglaciating catchments, impacting strategies for larger scale catchment and water management modelling throughout the Andes. 

How to cite: Fyffe, C. L., Medina, K., Cruz, R., Loarte, E., Castro, J., Shaw, T. E., Fatichi, S., Granados, H., and Pellicciotti, F.: Understanding the combined impact of vegetation and glacier change on Andean hydrology, EGU General Assembly 2026, Vienna, Austria, 3–8 May 2026, EGU26-17903, https://doi.org/10.5194/egusphere-egu26-17903, 2026.

EGU26-18389 | ECS | Orals | HS2.1.4

Impact of Snow Data Assimilation on Land-Surface Energy Fluxes at Sites Across Europe Using eCLM-PDAF 

Buliao Guan, Lukas Strebel, Johannes Keller, Harrie-Jan Hendricks Franssen, Gabrielle De Lannoy, and Bibi S. Naz

Snow plays a key role in land-surface processes by modulating the surface energy balance, soil thermal insulation and water availability. However, the influence of snow on water and energy fluxes in land surface models remains insufficiently understood. To improve simulations of the coupled water–energy cycle, we developed a snow data assimilation (snow-DA) within the Encore Community Land Model coupled to the Parallel Data Assimilation Framework (eCLM-PDAF; https://github.com/HPSCTerrSys/eCLM), enabling assimilation of both snow depth and snow water equivalent (SWE). In the Snow-DA experiment, we assimilate daily snow depth with a one-dimensional Ensemble Kalman Filter (EnKF), updating the liquid and ice SWE components across all snow layers; snow depth is then adjusted through its correlation with SWE. We evaluated the performance of the snow-DA framework by comparing snowpack variables as well as heat fluxes such as latent heat flux (LE), sensible heat flux (SH), ground heat flux (GH), and soil temperature, between data assimilation (DA) and open-loop (OL) simulations at eleven selected Integrated Carbon Observation System (ICOS) sites across Europe. The sites span different observation periods within 2017–2024. Each OL and DA experiment used 100 ensemble members, generated through perturbation of meteorological variables and key snow related parameters.  A multiplicative inflation factor of 0.95 and observation error of 0.2m are applied across all sites. Results across ICOS sites showed that DA substantially improved snow variable estimates compared to OL simulations. On average, the root mean square error (RMSE) of SD decreased by 27.3%, and the correlation coefficient (R) increased by 0.06. DA also improved the timing of snow cover duration, yielding a more realistic seasonal snow cover evolution when compared with satellite-based observations. Although overall changes in land-surface heat fluxes were modest, the improved snowpack reduced RMSE during the melt season for LE by 9.5%, evaporative fraction (EF) by 1.6%, and soil temperature by 20.8%. Although the energy balance was evaluated, and LE and EF improved, snow DA degraded the performance of SH and GH at most sites, indicating possible coupling bias between modeled variables for energy partitioning, or representativeness errors between tower-based and modeled fluxes. Overall, this study enhances the representation of snow processes in a land surface model and encourages further research into the modeling of associated water and energy balance mechanisms. Future work will investigate regional responses of water flux components, including runoff, evapotranspiration, and soil water content, to further examine snow data assimilation impacts on water availability.

How to cite: Guan, B., Strebel, L., Keller, J., Hendricks Franssen, H.-J., De Lannoy, G., and S. Naz, B.: Impact of Snow Data Assimilation on Land-Surface Energy Fluxes at Sites Across Europe Using eCLM-PDAF, EGU General Assembly 2026, Vienna, Austria, 3–8 May 2026, EGU26-18389, https://doi.org/10.5194/egusphere-egu26-18389, 2026.

EGU26-18889 | Posters on site | HS2.1.4

Past and Future Evolution of the Gébroulaz Glacier. Modelling the impact on the Hydrology of the Doron des Allues in the Vanoise Massif 

Matthieu Le Lay, Adrien Gilbert, Kevin Pinte, Charlotte Jouet, Olivier Laarman, and Delphine Six

The Alps, often referred to as Europe's water tower, are undergoing profound changes as a result of climate change. Declining snow cover, accelerated glacier retreat, and increasingly severe periods of low flow raise urgent questions for water resource management, biodiversity, and energy security. Hydropower, one of the pillars of the European renewable energy strategy, is particularly exposed to these changes. To understand and anticipate these impacts, it is necessary to have detailed modeling of Alpine hydrological systems, combined with reliable climate projections.

To meet these challenges, the spatially distributed hydrological model MORDOR-TS (Garavaglia et al., 2017; Rouhier et al., 2017) now includes an explicit glacier component to simulate glacier dynamics in warming scenarios (Rouzies et al., 2024). Applied to the Isère basin in the French Alps, this model supports strategic decisions relating to hydroelectric exploitation by simulating hydrological responses at the basin scale under different future climate scenarios (Le Lay et al., 2022). However, glaciers remain relatively poorly instrumented today, and their ice volumes are often poorly known, making such modeling inevitably imprecise. In this context, local observations and modeling produced by glaciologists are valuable for better quantifying the relative contribution of glaciers to river flows and improving the robustness of hydrological projections.

This study focuses on the modeling of a representative alpine glacier in the Vanoise massif, which feeds the Doron des Allues River. On this glacier, combining historical glaciological monitoring with radar-based surveys of current geometry and ice volume has enabled a detailed modelling of the glacier geometry, its evolution and meltwater discharge throughout the 21st century. These data are used to refine glacier representation in the MORDOR-TS hydrological model —surface area, volume, and meltwater flows—improving the reliability of basin-scale hydrological simulations, distinguishing between precipitation-driven and glacier-driven contributions. Results confirm strong consistency between the local glaciological model and the regional hydrological model and highlight pathways for further parameterization improvements.

The glacier is projected to almost completely disappear by 2100, with cascading impacts on discharge regimes. Beyond reduced mean flows, significant shifts in seasonal patterns and diminished summer flows are expected—posing challenges for hydropower production, ecosystem resilience, and water allocation. These results highlight the importance of coupling regional  hydrological models with high-resolution glaciological data to improve the robustness of climate impact assessments in mountain regions.

These findings underscore the urgency of adaptation strategies for mountain water resources in a warming climate. They also illustrate the value of coupling large-scale hydrological models with high-resolution glaciological data to support energy planning and climate resilience across Europe’s alpine regions.

How to cite: Le Lay, M., Gilbert, A., Pinte, K., Jouet, C., Laarman, O., and Six, D.: Past and Future Evolution of the Gébroulaz Glacier. Modelling the impact on the Hydrology of the Doron des Allues in the Vanoise Massif, EGU General Assembly 2026, Vienna, Austria, 3–8 May 2026, EGU26-18889, https://doi.org/10.5194/egusphere-egu26-18889, 2026.

EGU26-19296 | ECS | Orals | HS2.1.4

Flash Snow Drought: Escalating Risks to Mountain Water Resources at local scale 

Hemant Singh, Md Mehraj, and Divyesh Varade

Snow plays a critical role in water resources, the planetary energy balance, glacier nourishment, ecosystem and the winter tourism economy. In recent decades, rising temperatures have led to a decline in snowfall and shifting of patterns. These changes have resulted in reduced snowpack and earlier snowmelt, thereby triggering snow drought conditions. Since the first formal definition of snow drought in 2017, the topic has gained increasing scientific attention, with the first systematic studies published in 2019, followed by significant advancements in subsequent years. However, flash snow droughts (FsD) have not yet been studied and remain unexamined. FsD are short-duration events characterized by rapid onset and intensification, occurring over timescales ranging from weeks to month. These events may arise due to low precipitation accompanied by warm winter. Consequently, establishing a clear definition and identifying FsD hotspots are critical, particularly in regions experiencing imbalanced seasonal snow patterns and low snowpack. In this work, we examine FsD at a 500 m spatial resolution in the North-West Basin part of Afghanistan of the Hindu Kush Himalaya (HKH) using a Snow Water Equivalent Index (SWEI) derived from the High Mountain Asia Snow Reanalysis (HMASR) dataset. The analysis is limited to the 1999–2016 water years due to the unavailability of HMASR data for more recent periods. It is also noted that coarser-resolution datasets may be inadequate for capturing FsD events because of spatial heterogeneity in snow cover dynamics. Our results indicate the recurrence of flash snow droughts (FsDs) with varying durations, notably during February-March 2001, November-December 2010, and January 2011 and 2014. These FsDs fall within the moderate to severe drought categories, based on a threshold of −1. This study highlights the importance of FsD at the local scale for policymaking, mitigation planning, and integrated monitoring frameworks, and it identifies key research gaps to support resilient FsD management.

How to cite: Singh, H., Mehraj, M., and Varade, D.: Flash Snow Drought: Escalating Risks to Mountain Water Resources at local scale, EGU General Assembly 2026, Vienna, Austria, 3–8 May 2026, EGU26-19296, https://doi.org/10.5194/egusphere-egu26-19296, 2026.

EGU26-19867 | Posters on site | HS2.1.4

Glacio-hydrological modeling informed by observations from a research basin in the Central Andes of Chile 

James McPhee, Noemi Villagra, Pablo Mendoza, and María Courard

Water resources availability in the Central Andes of Chile largely depends on glacier melt, which is undergoing accelerated changes as a consequence of global warming. Studying the hydrological response of glacierized systems requires understanding their interaction with catchment-scale processes, which in turn demands detailed observations that are rarely available in glacierized basins. Physically based hydrological modeling offers the opportunity of representing processes at large spatial extents through the informed selection and transference of observable parameters. Here, the Cold Regions Hydrological Model (CRHM) was implemented to evaluate the feasibility of transferring parameters from the intensively monitored Glaciar Echaurren Research Basin (app. 4 km2) to two larger glacierized basins: the Yeso River basin at Termas del Plomo (RYTP, app. 60 km2) and the Mapocho River basin at los Almendros (RMLA, app. 640 km2).

Simulations were performed using both locally calibrated parameters and parameters transferred from the experimental basin, and model performance was evaluated in terms of streamflow, fractional snow-covered area (fSCA), and snow water equivalent (SWE). Full transfer of the calibrated parameters from the small intensive study catchment to the larger RMLA basin resulted in reductions of up to 71% in streamflow KGE and 97% in SWE NSE compared to the basin’s own calibration. In the intermediate RYTP basin, the transfer of snow-related parameters adequately reproduced the seasonal pattern of SWE, although with a −59.2% bias and a 70.6% decrease in streamflow KGE relative to the calibrated version.

Individual parameter transfer revealed that snow-related parameters, such as snow roughness length and active layer thickness, explain a large fraction of the loss in SWE performance. On the other hand, the degradation in streamflow performance was dominated by parameters associated with surface storage processes. Overall, the results indicate that parameter transferability is only partially viable: while some parameters can be generalized across basins with similar characteristics, highly sensitive and locally dependent parameters require site-specific calibration to preserve model representativeness.

How to cite: McPhee, J., Villagra, N., Mendoza, P., and Courard, M.: Glacio-hydrological modeling informed by observations from a research basin in the Central Andes of Chile, EGU General Assembly 2026, Vienna, Austria, 3–8 May 2026, EGU26-19867, https://doi.org/10.5194/egusphere-egu26-19867, 2026.

EGU26-19982 | Orals | HS2.1.4

How Much Climate Information Does a (Temperature Index) Snow Model Need? 

Ross Woods, Adria Fontrodona-Bach, Josh Larsen, and Bettina Schaefli

Changes in snowpack climatology are taking place because of changes in climate. Information is needed on how future changes in climate may affect snowpack regimes.

This information is usually generated by running time stepping models for which time series of forcing data must be supplied. In this study we explore whether it is possible to make reliable estimates of snowpack regime without explicit knowledge of the temporal sequence of forcing data. This could support development of a hydrological theory of seasonal snowpacks. We will test whether it could be enough to know some statistics of the forcing data, rather than the complete time series. In this presentation, we begin by trying to identify where it is necessary to maintain the correlation between temperature and precipitation amount in a temperature index model. Our interest is in correlations at the timescale of a precipitation event; seasonal-scale correlations will be captured separately.

We investigate these questions at 4736 locations in the northern hemisphere, using the NH-SWE database combined with precipitation (P) and temperature (T) data from GHCN. We run the temperature index model once with the original forcing data, and then again with the temperature data displaced by a few days in time from the precipitation data, to reduce their cross-correlation. We calculate statistics of the modelled snowpack for the two model runs (for each station and each year: the start date, peak date and end date for the snowpack, and the peak SWE – snow water equivalent). If the cross-correlation is not important, then the statistics of modelled snowpack should not change much between the two model runs. Since our interest is in snow accumulation and melt, we expect that the most important P-T correlations are at times of year when both rainfall and snowfall are likely to occur.

Initial results show that for the 60% of sites with a positive correlation between P and T-anomaly, neglecting the correlation generally leads to an overestimation of peak SWE (by an average 12%). The overestimation presumably occurs because when the correlation is removed, days below freezing are more likely to be paired with the higher precipitation amounts which tend to occur on days above freezing, and thus the amount of snowfall is increased by neglecting the correlation.   For the remaining sites with a negative correlation between P and T-anomaly, neglecting the negative correlation generally leads to a slight underestimation of peak SWE (by an average -4%).

We will also carry out several other similar model experiments with degraded forcing to identify key features of the climate data. The intended endpoint of the work is an improved theory of snowpack hydrology, i.e., a stochastic version of the deterministic theory in Woods 2009 (https://doi.org/10.1016/j.advwatres.2009.06.011)

How to cite: Woods, R., Fontrodona-Bach, A., Larsen, J., and Schaefli, B.: How Much Climate Information Does a (Temperature Index) Snow Model Need?, EGU General Assembly 2026, Vienna, Austria, 3–8 May 2026, EGU26-19982, https://doi.org/10.5194/egusphere-egu26-19982, 2026.

EGU26-20199 | Posters on site | HS2.1.4

Aufeis (Proglacial Icing) in the forefield of a land-terminating outlet glacier in West Greenland – multi-annual and seasonal variability and drivers  

Jakob Abermann, Andreas Truegler, Harald Zandler, Helena Bergstedt, Florina Schalamon, Sebastian Scher, and Wolfgang Schöner

In this contribution, we share observations of a braided river plain adjacent to the little ice age moraine of a land-terminating outlet glacier in West Greenland at around 71°N. During three visits in spring (2023 - 2025), we document a plain of refrozen water. We report on the extent, genesis and decay of the aufeis plain and hypothesize on drivers building it. Time-lapse and high-resolution satellite imagery allow us to assign the build-up of the aufeis during core winter until spring and the decay throughout the melting season. We find that long after the disappearance of the snow cover at the adjacent glacier and ice-free environment, the aufeis still is in place. Using multispectral satellite imagery (Sentinel-2) we derive a time series of aufeis extent ranging from virtually no coverage to almost 0.5 km² for the period 2016-2025, using a random forest classification. DEM differences derived from photogrammetric acquisitions using UAVs enable us to estimate ice volumes between 49x10³ (April 2025) and 110x10³ m³ (April 2024), respectively. To understand atmospheric conditions for meltwater generation, we use automated weather station data near the aufeis plain. As another reason for ice formation, we discuss potential water sources related to groundwater aquifers in porous ground moraine material. Finally, bias-corrected CARRA model output was applied to reconstruct meteorological conditions relevant for aufeis formation. Based on a lagged correlation approach, we find statistically significant (p = 0.05) correlations between cumulative positive air temperature departures and aufeis extent summing up approx. 7 years before the respective icing occurrence. While simplified, we discuss a possible long-term relation between icing extent and meltwater generation.

How to cite: Abermann, J., Truegler, A., Zandler, H., Bergstedt, H., Schalamon, F., Scher, S., and Schöner, W.: Aufeis (Proglacial Icing) in the forefield of a land-terminating outlet glacier in West Greenland – multi-annual and seasonal variability and drivers , EGU General Assembly 2026, Vienna, Austria, 3–8 May 2026, EGU26-20199, https://doi.org/10.5194/egusphere-egu26-20199, 2026.

EGU26-21723 | ECS | Posters on site | HS2.1.4

Multidecadal snow water equivalent reconstruction in Central Italy using the Multiple Snow Data Assimilation System 

Mohsin Tariq, Esteban Alonso-González, Manuela Girotto, Francesco Avanzi, Mauro Rossi, Paolo Stocchi, Paolo Tuccella, and Christian Massari

Reliable estimates of snow water equivalent (SWE) are necessary to understand hydrological variability and snow-related extremes in mountain environments of Central Italy and the Apennines, where snowpacks are generally thin, variable, and still insufficiently observed by conventional monitoring networks. As part of broader efforts to improve how snow processes are represented in complex terrain, this work describes the recent developments using the Multiple Snow Data Assimilation System (MuSA). The primary goal of this work is to generate spatially coherent SWE estimates over Central Italy.

The modelling approach employs a physically based snow model within MuSA, driven by MORE meteorological reanalysis (MOloch-downscaled ERA5 REanalysis), which provides high-resolution atmospheric forcing at ~1.8 km over Italy spanning more than three decades from 1990 onward, enabling consistent multidecadal SWE reconstruction. This extended forcing, available at an hourly scale and with a finer spatial resolution, captures the complex orographic precipitation and temperature gradients that are critical for accurate snowpack simulation in the Apennines.  Snow depth observations from Sentinel-1 (S-1) are assimilated as the primary observational input, leveraging their spatial extent and ability to detect snowpack characteristics in areas with limited ground measurements. Given that S-1 snow depth is only available from around 2015 onward, the main objective of this research is to use an observation-constrained MuSA configuration to extrapolate the SWE estimate back to 1990, producing multidecadal records.

The methodological design, data preparation, and assimilation strategy are described to ensure temporal consistency between the observation-rich and pre-observation period. Specific focus is given to basin-scale implementation, uncertainty estimation, and potential scalability to regional-scale applications. Presently, model validation and analysis of SWE are ongoing. This research establishes a concrete framework for long-term SWE estimation in Central Italy. It provides future studies with the opportunity to assess snow variability and extremes at the regional scale in a changing climate.

How to cite: Tariq, M., Alonso-González, E., Girotto, M., Avanzi, F., Rossi, M., Stocchi, P., Tuccella, P., and Massari, C.: Multidecadal snow water equivalent reconstruction in Central Italy using the Multiple Snow Data Assimilation System, EGU General Assembly 2026, Vienna, Austria, 3–8 May 2026, EGU26-21723, https://doi.org/10.5194/egusphere-egu26-21723, 2026.

The proportion of annual precipitation that falls as snow, called snow fraction (Sf), in the western United States is declining. The impact of this transition on streamflow timing and magnitude is unclear.  Some studies report declining runoff efficiency (streamflow/precipitation, RE) with declining Sf , while others report no change and even increases. The causes of variability in the Sf-RErelationship involve complex interactions between climate and landscape properties. To understand and perhaps mitigate the impact of declining Sf on water resources, it is essential to be able to represent the physical processes and properties controlling that variability in predictive models. While significant insights in SfRErelationships across catchments have been revealed in recent years, few have investigated the variability within a catchment over time. Here, we report Sf-RE relationships from two long-term, highly instrumented catchments in the rain-to-snow transition zone in southwest Idaho, USA. The Dry Creek Experimental Watershed (DCEW) and the Reynolds Creek Experimental Watershed (RCEW) have been monitoring hydrometeorological variables for approximately 25 and 60 years, respectively. Analyzing these long-term records allows us to identify potential physical mechanisms controlling the Sf-RE relationship that short-term, spatially-focused studies cannot. Preliminary results suggest that variability in the alignment of energy and water availability across the rain-dominated to snow-dominated elevation gradient controls how snow fraction impacts streamflow response.

How to cite: McNamara, J.: Impact of decling snow fraction on runoff efficiency in the rain-snow transition zone., EGU General Assembly 2026, Vienna, Austria, 3–8 May 2026, EGU26-21980, https://doi.org/10.5194/egusphere-egu26-21980, 2026.

EGU26-22177 | Orals | HS2.1.4

Advancing Snow Observation Systems to Improve Hydrologic Prediction in Mountain Headwaters 

S. McKenzie Skiles, William Roe, and Steven Clark

Snow energy balance, particularly radiation balance, is monitored only at a limited number of well-instrumented, research-focused snow study sites in the western United States. This lack of observations limits our ability to force or validate process-based snow models in mountain terrain, an important hurdle to operational adoption. To address this gap, we have prototyped a low-cost, low-power, transportable snow monitoring system capable of transmitting near-real-time snow energy balance relevant observations. Each instrumentation suite measures incoming and reflected broadband shortwave radiation, incoming and emitted longwave radiation, air temperature/relative humidity, and snow depth. Including sensors, power, data logging, and communications infrastructure, each site costs less than USD $10,000, enabling deployment at a scale not feasible with conventional research stations. The systems have been deployed at 11 sites across snow-dominated headwater catchments in the Intermountain West, more than doubling the current number of snow radiation balance observation sites. Two sites are co-located with research sites for validation, and observations are used to drive the 1d SNOBAL model to assess the sensitivity of simulated snow water equivalent to lower-cost instrumentation. This approach complements existing snow monitoring networks, including the ~900-site SNOTEL (Snowpack Telemetry) network, which provides long-term observations for snow mass balance monitoring and index-based streamflow forecasting. SNOTEL sites are intentionally located in sheltered, mid-elevation forest openings and do not capture spatial variability, nor do they measure radiation balance. Low-cost, distributed energy balance observations provide a pathway to complement and extend the observational capabilities of current networks.

How to cite: Skiles, S. M., Roe, W., and Clark, S.: Advancing Snow Observation Systems to Improve Hydrologic Prediction in Mountain Headwaters, EGU General Assembly 2026, Vienna, Austria, 3–8 May 2026, EGU26-22177, https://doi.org/10.5194/egusphere-egu26-22177, 2026.

EGU26-23257 | ECS | Posters on site | HS2.1.4

Investigating Snow and Firn Processes in a Georgian Glacier through Local Data and Modeling 

Sopio Beridze and Carlo De Michele

Mountain glaciers in data-scarce regions are particularly sensitive to climate variability, yet their snow and
firn processes remain poorly constrained due to limited long-term observations/analyzes, especially in the
Caucasus region. Caucasus glaciers are highly sensitive to temperature and precipitation variability due to
their mid-latitude location, steep relief, and strong seasonal contrasts.
In this study, we present a preliminary analysis of snow accumulation and melt dynamics for selected
areas in Georgia (Racha Region, Buba glacier), based on in situ meteorological observations and historical
data. The analysis focuses on preparing meteorological input data for the application of a conceptual
snow–firn model, following the framework proposed by Banfi and De Michele (2021). Meteorological and
snow data from selected Georgian glacierized catchments are analyzed to characterize snow
accumulation and melt dynamics and to prepare input datasets for snow–firn modelling. Particular
attention is given to precipitation phase partitioning, seasonal snow persistence, and data harmonization,
as available observations are often heterogeneous and affected by temporal gaps.
Key variables include snow depth, snow bulk density, snow water equivalent (SWE), and meltwater runoff.
While such variables are monitored at several well-instrumented Alpine sites, allowing for extensive multi-
year model evaluation, comparable long-term and structured datasets remain scarce in the Caucasus
region. However, given the similarities between the Caucasus region and the Italian Alps in terms of
geomorphological and hydrological characteristics, the modelling framework is well suited for application
in the Caucasus context.

How to cite: Beridze, S. and De Michele, C.: Investigating Snow and Firn Processes in a Georgian Glacier through Local Data and Modeling, EGU General Assembly 2026, Vienna, Austria, 3–8 May 2026, EGU26-23257, https://doi.org/10.5194/egusphere-egu26-23257, 2026.

EGU26-503 | ECS | Orals | HS2.1.5

Climate-Driven Transformations in Flood Hydrograph Characteristics in a Mountainous Catchment 

Sanjay Kumar, Pankaj Dey, and Brijesh Kumar Yadav

Flooding in the mountainous catchments remains a major concern due to its steep terrain, intense monsoon rainfall, and rapidly changing climate. The complex hydro-geomorphic setting makes communities, agricultural systems, and critical infrastructure highly vulnerable to flood hazards in the mountainous regions. As climate change accelerates, shifts in precipitation patterns, storm intensity, and temperature regimes are expected to influence the magnitude, duration, and timing of flood events. Despite these emerging risks, the climatic controls on annual flood hydrographs and their future trajectory in the Himalayan mountains of Nepal remain insufficiently understood. A clearer understanding of how flood characteristics are evolving under a warming climate is essential for improving hydrologic design standards, strengthening flood forecasting systems, and guiding risk reduction strategies in this mountainous environment. This study investigates historical (1986–2019) and projected future (2031–2100) changes in annual maximum flood hydrograph properties across the western Nepal mountains. Key attributes, including flood peak, flood volume, flood duration, and timing of occurrence, are evaluated to characterize how flood behavior has responded, and is likely to respond, to changing climatic conditions. Additionally, shifts in flood seasonality and the sensitivity of flood peaks and volumes to variations in precipitation and temperature are examined to identify the dominant climatic drivers shaping future flood regimes. The historical analysis reveals marked interannual variability in flood characteristics, influenced by monsoon dynamics, catchment topography, and antecedent moisture conditions. Future climate projections indicate a pronounced transformation in flood behavior, with flood peaks expected to increase and flood durations to decrease, suggesting a trend toward more intense and short-lived flood events. The timing of annual maximum floods is also projected to shift later into the monsoon season, reflecting changes in seasonal rainfall distribution and catchment wetness. Sensitivity assessments demonstrate that changes in event-scale precipitation exert a stronger influence on flood peaks and volumes than temperature variations, underscoring the critical role of rainfall intensity in steep mountainous catchments. While temperature-driven effects are evident, they remain secondary compared to precipitation-driven changes. Overall, the findings highlight the need to incorporate climate-informed variations in flood hydrograph characteristics into regional water management, hydro-infrastructure planning, and disaster risk reduction frameworks. This study provides valuable insights into evolving flood hazards and supports the development of adaptive and resilient strategies for safeguarding vulnerable communities in the Nepal mountainous region.

How to cite: Kumar, S., Dey, P., and Yadav, B. K.: Climate-Driven Transformations in Flood Hydrograph Characteristics in a Mountainous Catchment, EGU General Assembly 2026, Vienna, Austria, 3–8 May 2026, EGU26-503, https://doi.org/10.5194/egusphere-egu26-503, 2026.

EGU26-957 | ECS | Orals | HS2.1.5

Novel Application of Isotopic and field-based survey for uncovering spring hydrogeology for sustainable management 

Praveen Kumar, Gopal Krishan, and Pallavi Banerjee Chattopadhyay

Freshwater springs are the primary source of drinking water for people residing in remote and inaccessible mountainous terrains. Additionally, springs play a crucial role in maintaining the base flow of Himalayan rivers during the lean season. However, half of the Himalayan springs are experiencing a noticeable decline in discharge and are drying up due to current climate change and anthropogenic influences. The rejuvenation and restoration of freshwater springs have long been a challenging task due to the presence of complex geological terrain, along with fractured aquifers that connect across multiple watersheds. Previous studies have focused more on the watershed approach, lacking aquifer-targeted springshed management. This study integrates isotopic (δ18O, δ2H and 3H) and field-based hydrogeological and geophysical resistivity surveys to uncover multifaceted hydrogeological elements, including recharge sources, recharge altitudes, surface and subsurface conduits, and hydrological processes controlling spring flow for springshed management.

In the present study, 240 samples were collected from 120 springs for pre-monsoon and post-monsoon seasons, and 66 samples of precipitation were collected on an event basis throughout the year. The Local Meteoric Water Line (LMWL) for the study region has been developed as δ2H = 8.02*δ18O + 11.79 and found equivalent to GMWL. The isotopic values of the springs (δ18O ranges from -10.6‰ to -5.2‰ and δ2H ranges from -68.0‰ to -35.9‰) coincide with seasonal precipitation signatures (δ18O ranges from -16.23‰ to +2.82‰, δ2H= -125.0‰ to 20.5‰), indicating that the springs are recharging from the Indian Summer Monsoon. The precipitation exhibited an isotopic lapse rate of -0.4‰ and -4.1‰ for δ18O and δ2H, respectively, for a 100m increase in altitude. The recharge elevation of all springs, calculated from the isotopic lapse rate, lies within the altitude range of 1386 to 2194 m in the study area. These locations can be utilised for artificial recharge interventions, such as the construction of check dams, ponds, and trenches, as per the suitability.  

The hydrogeological survey reveals that freshwater spring discharge is influenced by gravity flow along local-scale geological discontinuities, including fracture zones, joint networks, and minor fault and fracture interactions that have developed within the rock mass. In contrast, geothermal springs are channelised across major regional geological discontinuities, such as the MCT. The geophysical resistivity survey in the springshed of the different springs is capable of mapping the subsurface conduits and pathways in the fracture-dominant lithology. These results provide site-specific guided intervention, along with validation of the isotopic results. The proposed methodological integration of stable isotopes and field-based hydrogeological and geophysical surveys can successfully aid in the investigation of complex mountain hydrology. The study can help policymakers, the government, and other stakeholders in the successful implementation of targeted recharge interventions for springshed management.


How to cite: Kumar, P., Krishan, G., and Chattopadhyay, P. B.: Novel Application of Isotopic and field-based survey for uncovering spring hydrogeology for sustainable management, EGU General Assembly 2026, Vienna, Austria, 3–8 May 2026, EGU26-957, https://doi.org/10.5194/egusphere-egu26-957, 2026.

EGU26-1691 | Posters on site | HS2.1.5

Cascading downstream impacts of climate change in the world’s water towers 

Daniel Viviroli, Fabian Drenkhan, Christopher A. Scott, Lauren Somers, and Marit van Tiel

Mountains, often called the world’s "water towers" due to their important role in global hydrology and water resources including supply for human uses and ecological processes, are interconnected with lowlands in a system that encompasses both natural resources and society. Climate change in mountain regions affects the amount, timing and quality of mountain runoff, with important consequences downstream. While mountain streamflow and associated climate change impacts always travel downstream, these impacts can cascade not only spatially and temporally but also causally across a wide range of social-ecological systems. Additionally, upstream-downstream teleconnections can have important impacts that shape upstream water tower systems, for example, through infrastructure development based on priorities for downstream users.

We synthesize key water cycle changes in mountain regions worldwide and examine their consequences downstream, such as shifts in surface and groundwater availability, disaster risks, water quality, human water use, sediment transport, aquatic ecosystems, and sea-level rise. We link these dynamics to social processes, including culture, economy, and well-being in local and transboundary contexts. Furthermore, we highlight feedback mechanisms where downstream activities shape upstream water dynamics, including infrastructure development (e.g., hydropower), land and water use (roads, mining, tourism), and conservation (glacier protection, low-impact recreation). Our analysis underscores the importance of an integrated framework for advancing the understanding of interconnected mountain-lowland systems to inform sustainable water management and policy development in rapidly changing mountain regions and beyond.

How to cite: Viviroli, D., Drenkhan, F., Scott, C. A., Somers, L., and van Tiel, M.: Cascading downstream impacts of climate change in the world’s water towers, EGU General Assembly 2026, Vienna, Austria, 3–8 May 2026, EGU26-1691, https://doi.org/10.5194/egusphere-egu26-1691, 2026.

EGU26-1710 | Orals | HS2.1.5

Cold on the water: mechanisms, impacts, and future scenarios of lake-effect snowfall in Italy and Japan 

Francesco Avanzi and Katsuya Yamashita and the Appennine-Snow research team

Lake-effect snowfall was largely studied around the North American Great Lakes, yet similar processes arise in other coastal and mountainous regions where cold continental air flows over comparatively warm water. In this study, we investigate lake-effect snow in two seemingly distant but meteorologically comparable settings: the central Apennines in Italy, influenced by the Adriatic Sea, and Japan’s Niigata Prefecture, affected by air masses crossing the Sea of Japan. Despite their geographical distance, both regions share key ingredients: shallow and narrow seas acting as efficient heat and moisture sources, strong cold-air spells, and steep orography that enhances convergence and precipitation. This results in remarkably analogous snowfall extremes, which are both a key water resource and an intense hazard. Using ground-based observations, weather radar data, and future climate projections, we characterized the mechanisms driving these events and assessed their local impacts, including road closures, infrastructure disruptions, and structural failures. Particular attention was given to how warming air masses and concurrently warming sea surfaces may alter the frequency, intensity, and spatial distribution of lake-effect episodes. Our findings indicate that these phenomena represent a significant and often underestimated hazard, and that their sensitivity to climatic shifts exposes both regions to growing vulnerabilities in a warming world. 

How to cite: Avanzi, F. and Yamashita, K. and the Appennine-Snow research team: Cold on the water: mechanisms, impacts, and future scenarios of lake-effect snowfall in Italy and Japan, EGU General Assembly 2026, Vienna, Austria, 3–8 May 2026, EGU26-1710, https://doi.org/10.5194/egusphere-egu26-1710, 2026.

EGU26-2629 | ECS | Orals | HS2.1.5

Analysis of groundwater recharge in a mountainous basin 

Giacomo Falcone, Antonio Annis, Giulia Passadore, and Marco Marani

Since climate change is challenging every part of the water cycle, not only at the global scale but also regionally and locally, it is increasingly important to understand its impact on both surface and subsurface hydrological processes, with particular interest in groundwater recharge, which is a key component. This is fundamental for many reasons, starting from irrigation and water management strategies. To do so, we apply two different models to estimate historical groundwater recharge in one case study in a mountainous catchment in Northern Italy.

Specifically, we would employ the GEOframe model, developed by the University of Trento, which offers a flexible, component-based framework for process-based simulations of hydrological dynamics, including evapotranspiration, snowmelt, infiltration and groundwater recharge at high spatial-temporal resolution.

The second one is a linear reservoir model developed at the University of Padova, tailored for efficient lumped-parameter estimation of recharge through simplified storage-discharge relationships calibrated against observed hydrographs and soil data.

The input that we will use are the hourly dataset of precipitation and air temperature from the regional network of Veneto region. The final idea is to analyze the current status and trends of groundwater recharge and compare with the dataset from the observations.

How to cite: Falcone, G., Annis, A., Passadore, G., and Marani, M.: Analysis of groundwater recharge in a mountainous basin, EGU General Assembly 2026, Vienna, Austria, 3–8 May 2026, EGU26-2629, https://doi.org/10.5194/egusphere-egu26-2629, 2026.

Permafrost degradation on the Tibetan Plateau (TP) has profound impacts on hydrological processes, yet the responses of permafrost hydrology to different climate forcings remain unclear. Here we integrate outputs from global climate models with a watershed cryospheric-hydrological model to provide the first quantitative attribution analysis to examine the responses of permafrost hydrology to anthropogenic and natural forcings in the source region of the Yellow River, northeastern TP. Our results confidently attribute frozen ground degradation to anthropogenic greenhouse gases (GHG), leading to permafrost area decline by 3398.4 km²/10a during 1960–2019, while aerosols exhibit a slight mitigating effect. GHG emissions also drive concomitant hydrological changes, including increased subsurface runoff and winter runoff ratio. They also reduce streamflow seasonality, particularly in regions where permafrost degrades severely. Our study provides critical insights for understanding permafrost and hydrological processes under climate change, highlighting the importance of effective emission reduction and adaptive water resources management strategies.

How to cite: Fang, P., Wang, T., and Yang, D.: Permafrost Degradation and Concomitant Hydrological Changes Dominated by Anthropogenic Greenhouse Gas Emissions in the Northeastern Tibetan Plateau, EGU General Assembly 2026, Vienna, Austria, 3–8 May 2026, EGU26-2710, https://doi.org/10.5194/egusphere-egu26-2710, 2026.

EGU26-2820 | ECS | Posters on site | HS2.1.5

Physics-based simulation of long-term hydrological changes in the high-alpine environments in central Europe  

Xinyang Fan, Florentin Hofmeister, Bettina Schaefli, and Gabriele Chiogna

The European high-alpine landscapes are particularly sensitive to climate change, with accelerating glacier retreat, reduced snow cover, and altered precipitation patterns. Glacier and snowmelt play a crucial role in determining the water availability in such environments. Quantifying long-term historic streamflow variations under the impact of climate change in high-alpine landscapes has, however, rarely been studied due to limited long-term hydroclimatic observations, complex topography, and modeling challenges. Here, we develop a cascading hydroclimatic coupling framework (Reanalysis-WRF-WaSiM) to simulate streamflow changes in three high-alpine catchments (55-77 km2) with varying glacier coverages (3% to 31%) in the central European Alps from 1850 to 2015 in an hourly time step and a spatial resolution of 25m × 25m. We first build a physics-based and fully-distributed hydrological model, WaSiM, for each site, and the model performances of the snow, glacier, and river discharge modules are evaluated in detail. The models are then forced with the dynamically downscaled and bias-corrected reanalysis climate data from the Weather Research and Forecasting Model (WRF). By performing such detailed long-term hydrological simulations with high temporal and spatial resolutions for the first time, our study provides new insights into the evolution of extreme hydrological events and changes in water availability via internal flux partitioning in high-alpine environments with accelerating glacier retreats under climate change.

How to cite: Fan, X., Hofmeister, F., Schaefli, B., and Chiogna, G.: Physics-based simulation of long-term hydrological changes in the high-alpine environments in central Europe , EGU General Assembly 2026, Vienna, Austria, 3–8 May 2026, EGU26-2820, https://doi.org/10.5194/egusphere-egu26-2820, 2026.

Climate change and glacier retreat in the tropical Andes are transforming mountain hydrology and challenging water security for both upstream communities and large downstream cities. Most research and policies have focused on declining glacier contributions during the dry season, as the loss of buffering capacity threatens water supply for drinking, irrigation, and hydropower. However, glacier shrinkage is also reshaping water quality: as ice recedes and exposes sulfide-rich bedrock, oxidation generates acid rock drainage, reducing pH and mobilizing metals. In several basins (e.g. the Santa River Basin - SRB), this has already led to regulatory bans on the use of historically important rivers for drinking water unless costly treatment is installed, constraining water access well before projected declines in water volumes. Beyond physical impacts, glacier loss has profound cultural and social consequences. High-mountain glaciers hold strong spiritual significance for Indigenous communities; their disappearance disrupts rituals, alters pilgrimage routes, and erodes place-based identities, ultimately shaping how communities perceive and respond to water insecurity. Recent work further demonstrates that glacier retreat has measurable economic consequences for water-dependent sectors. For instance, in the SRB, results indicate that glacier retreat alone can account for up an additional 15% of economic losses in the agriculture and hydropower production sectors.

To address these complexities and uncertainties in future water security, our recent work has focused on supporting robust adaptation planning. We apply robust decision-making and exploratory modelling approaches to test portfolios of adaptation measures, across wide ranges of climate and socioeconomic conditions. Rather than targeting a single “most likely” future, we identify combinations of measures that provide sustained performance in uncertain and evolving contexts while reducing the risk of maladaptation. A key insight is the need for stakeholders to explicitly negotiate thresholds of acceptable loss and damage for both water quantity and quality to guide water governance choices. Building on this foundation, we now plan to expand our research to systematically examine how glacier-related hazards propagate through interconnected social-ecological systems. Using conceptual frameworks on cascading and compound risks, we will analyze cross-sectoral impacts on domestic supply, agriculture, hydropower, and cultural values, and assess how responses in one sector may amplify vulnerabilities in others. This work aims to identify leverage points for adaptation that strengthen resilience rather than shifting or creating risks, supporting long-term resilience in the Peruvian Andes and other rapidly changing mountain regions.

How to cite: Muñoz, R.: Cascading risks and robust adaptation in the tropical Andean glacier-fed systems, EGU General Assembly 2026, Vienna, Austria, 3–8 May 2026, EGU26-3179, https://doi.org/10.5194/egusphere-egu26-3179, 2026.

EGU26-3660 | ECS | Posters on site | HS2.1.5

Shift regime of multiphase water in the Three-River-Source Region 

Minghao Lu

A significant hydrological feature of the cryosphere is that water bodies exist in multiphase forms. Abrupt shifts in multiphase water indicate a break in the stability of the hydrological cycle and may threaten sustainable water resources supply. However, the phenomenon of abrupt shifts in alpine regions and their underlying driving mechanisms remain poorly understood. This study investigated the spatiotemporal patterns, gradual accumulation–abrupt characteristics, and driving mechanisms of multiphase water in the Three-River-Source Region (TRSR). The results revealed that solid water decreased, while liquid and gaseous water increased from 2002 to 2022. A total of 32.25% of the TRSR experienced abrupt shifts, primarily in the Yangtze and Yellow River source regions. The critical thresholds for solid, liquid, and gaseous water were identified as 2.54×10⁴ m3,1.60×107 m3, and 3.21×10⁵ m3, respectively. Abrupt shifts were most likely to occur when the volumes of solid, liquid, and gaseous water reached their respective thresholds. Climate was the primary driver of gradual and abrupt changes, while vegetation significantly moderated solid water ablation and enhanced liquid water accumulation in regions with abrupt shifts. Specific environmental conditions, such as leaf area index (0.11–1.00), annual rainfall (199.26–649.76 mm), and the maximum temperature (0.83–9.80℃), were found to increase the likelihood of triggering abrupt shifts. This study proposed a more accurate method to depict the shift regime of multiphase water, providing critical insights for water resources management and risk governance in alpine regions.

How to cite: Lu, M.: Shift regime of multiphase water in the Three-River-Source Region, EGU General Assembly 2026, Vienna, Austria, 3–8 May 2026, EGU26-3660, https://doi.org/10.5194/egusphere-egu26-3660, 2026.

The meltwater from snow and glaciers in the data-scarce mountainous regions of the upper Indus Basin (UIB) confronts significant concerns due to climate change, the consequential cryospheric changes in snow cover dynamics and glacier mass balance are altering hydrological regimes through seasonal streamflow shifts. Taking the UIB as a study area, season dynamics and long-term trends in hydro-meteorological time series was analyzed, and a high-quality meteorological forcing dataset was developed for driving a distributed hydrological model (J2000). The Hydrograph Partitioning Curves (HPC) method was used to assist in model calibration and mitigated uncertainty. Water balance and the distributions of different runoff components in the UIB were further quantified. Our analysis indicates that winter and spring runoff in several sub-basins of the UIB exhibits an increasing trend, characterized by earlier snowmelt runoff timing and considerable regional variability. The timing of runoff center advancement is significantly influenced by the snow fraction (SF). When SF is less than 0.8, alterations in the timing of runoff centers are predominantly influenced by precipitation; when SF exceeds 0.8, these changes are principally dictated by the timing of snowmelt. We included environmental factors, including elevation and NDVI, to facilitate regional downscaling of the TRMM grid-based precipitation product, which was subsequently employed to drive a hydrological model for analyzing runoff processes in the typical Gilgit, Shyok, and Kharmong basins of the UIB. Among these three basins, the Gilgit Basin experiences a precipitation of 793 mm and an evapotranspiration of 334 mm, with snowmelt and glacial melt runoff constituting 34% and 28% of the total runoff, respectively. In the Shyok Basin, precipitation measures 539 mm, evapotranspiration is 289 mm, and snowmelt and glacier melt runoff account for 26% and 41% of the total runoff, respectively. The Kharmong Basin experiences the lowest precipitation at 392 mm, with an evapotranspiration rate of 243 mm, while snowmelt and glacier melt runoff contribute 36% and 25%, respectively. This study provides valuable insights into hydrological changes in the UIB, and underlying methodology can be important for other modelling studies in data-scarce basins and in the context of climate change.

How to cite: Shen, Y. and Wang, Y.: Comparative impact assessment and modelling analysis of river basins in the data-scarce upper Indus Basin, EGU General Assembly 2026, Vienna, Austria, 3–8 May 2026, EGU26-4675, https://doi.org/10.5194/egusphere-egu26-4675, 2026.

EGU26-4760 | ECS | Orals | HS2.1.5

Climate change affects the water supply of the Chinese Water Tower 

Han Cheng, Taihua Wang, and Dawen Yang

Mountain regions function as natural “water towers” by storing water and supplying it to downstream areas. The source regions of the Yellow, Yangtze, and Lancang-Mekong rivers on the eastern Tibetan Plateau are referred to as the “Chinese Water Tower,” providing freshwater to billions of people across downstream China and Southeast Asia. A cryospheric meltwater tracking hydrological model is developed to simulate hydrological changes as well as variations in snow, permafrost, and glaciers, and to quantify the runoff contributions of cryospheric meltwater. The results show that historically (1960–2019), cryospheric meltwater contributed 21–32% of the total runoff. Under three future socio-economic pathways (SSP1-2.6, SSP2-4.5, and SSP5-8.5), runoff in the three headwater basins is projected to increase during 2020–2100. However, due to substantial cryospheric degradation as indicated by diminishing snow cover, a thickening active layer and declining glacier ice storage, the runoff contribution of cryospheric meltwater is unlikely to be sustainable in a warming climate. Overall, the total contribution of cryospheric meltwater is projected to decline in the Chinese Water Tower, indicating a loss of water storage and regulation capacity, reduced drought mitigation capacity, and weakened interannual runoff stability. Moreover, under different scenarios, the mismatch between population growth and water resources may exacerbate water supply–demand imbalances. This study highlights the widespread risks of declining cryospheric meltwater supply both in the Tibetan Plateau and in other cold-region catchments in a warming climate.

How to cite: Cheng, H., Wang, T., and Yang, D.: Climate change affects the water supply of the Chinese Water Tower, EGU General Assembly 2026, Vienna, Austria, 3–8 May 2026, EGU26-4760, https://doi.org/10.5194/egusphere-egu26-4760, 2026.

Climate change reduces snow and ice input to mountain meltwaters, which provide as much as 60% of the world’s annual freshwater flow. Water resource models in these environments are often flawed in their implementation of glacier and snowmelt, affecting model outputs and how stakeholders plan water resource management needs. Therefore, addressing these limitations is key to improving water security.  


A water resource model is applied to the Rofental catchment in the Austrian Alps using a model-coupling approach to incorporate glacier and snowmelt processes, as well as new routing mechanics to better simulate flow in these catchments. This modelling is supported by new observations of glacial thickness, extent and meltwater runoff, and enhanced with the use of isotope tracers to distinguish dominant flow paths. 


Preliminary results point to more conservative water routing and better glacial water representation within the catchment. Ultimately, this approach serves to constrain uncertainty and deliver a clearer picture of the dominant hydrological processes in mountain catchments, and how changes in these may impact mountain water resources in the future.

How to cite: Bernardi, G., Baron, H., and Rickards, N.: Simulating the water resources of an Alpine catchment within a coupled water resource, glacier and snowmelt model framework, EGU General Assembly 2026, Vienna, Austria, 3–8 May 2026, EGU26-4910, https://doi.org/10.5194/egusphere-egu26-4910, 2026.

EGU26-5195 | Orals | HS2.1.5

Wildfire Effects on Stream Temperature and Flow in Humid Mountain Forests: Insights from the H.J. Andrews Experimental Forest 

Catalina Segura, Zachary Perry, Shannon Duffy, and Pamela Sullivan

Wildfires can alter hydrology and stream temperature (Ts) in headwater catchments, yet their effects in humid forests remain poorly understood. In the Western U.S., warming and declining snowpacks are increasing fire frequency and severity, threatening small streams that provide critical aquatic habitat. We examined how catchment storage mediates hydrologic response—both summer flows and Ts—following wildfire in the H.J. Andrews Experimental Forest (Oregon, USA), an old-growth conifer system. We leveraged long-term hydrometric records for watersheds that burned in 2020 Holiday Farm Fire and using 75 sensors, we monitored Ts in six headwater streams before, during, and after the 2023 Lookout Fire. While low flows appear to be increasing post-fire given reductions in evapotranspiration, effects of the fire on high flows are not evident. Pre-fire Ts ranged from 7–14 °C, driven by solar radiation and subsurface storage. Post-fire, burned streams warmed by 0.5–3 °C, with the largest increases in low-storage catchments. Diel amplitudes also rose more in these systems. Spatial models linked burn severity and storage to both thermal and flow shifts, offering predictive insight into future fire impacts. Our findings underscore the buffering role of subsurface storage and the interaction between fire severity and storage in shaping stream resilience. This research advances understanding of wildfire impacts on thermal regimes and hydrology in humid forests and informs management of fire-affected headwater ecosystems under a warming, fire-prone climate.

How to cite: Segura, C., Perry, Z., Duffy, S., and Sullivan, P.: Wildfire Effects on Stream Temperature and Flow in Humid Mountain Forests: Insights from the H.J. Andrews Experimental Forest, EGU General Assembly 2026, Vienna, Austria, 3–8 May 2026, EGU26-5195, https://doi.org/10.5194/egusphere-egu26-5195, 2026.

EGU26-5336 | ECS | Orals | HS2.1.5

Hydroclimatic interconnection between the Alps and the Italian agriculture 

Nike Chiesa Turiano, Marta Tuninetti, Francesco Laio, and Luca Ridolfi


Mountain regions play a major role in the hydrological cycle and in sustaining downstream water resources. The link between mountain regions and lowland areas, however, is not limited to the supply of seasonal meltwater but expands to atmospheric moisture exchanges that contribute to local precipitation.

While the connection between the Alps and downstream agricultural land has been widely studied from the riverine perspective, studies on the atmospheric interconnection are still few. This study addresses this knowledge gap by investigating the bidirectional moisture exchange between the Alps and the agricultural areas of the Pianura Padana. In doing so we pay particular attention to the geographical distribution of sources and sinks highlighting the locally unbalanced water supply, giving rise to a “moisture-hopping” mechanism and potential pathway for drought propagation.

Moisture fluxes are quantified using the water vapor tracking model UTrack applied to a climatological mean year for the period 2008–2017. Due to the spatial variability and the critical role of local factors in shaping ET within the alpine environment, we coupled UTrack with the high-resolution ERA5-Land dataset. This combined framework allows for a detailed assessment of atmospheric moisture pathways and estimates the hydrological interdependencies between alpine regions and downstream agricultural systems.

How to cite: Chiesa Turiano, N., Tuninetti, M., Laio, F., and Ridolfi, L.: Hydroclimatic interconnection between the Alps and the Italian agriculture, EGU General Assembly 2026, Vienna, Austria, 3–8 May 2026, EGU26-5336, https://doi.org/10.5194/egusphere-egu26-5336, 2026.

EGU26-5930 | ECS | Orals | HS2.1.5

Drivers and magnitude of evapotranspiration in a high-altitude Himalayan catchment: insights from eddy covariance observations 

Philip Kraaijenbrink, Alexander van den Berg, Emmy Stigter, and Walter Immerzeel

While the role of High Mountain Asia (HMA) as water tower is well established, the evaporative loss component of the high-altitude water balance remains poorly constrained. Quantifying evapotranspiration (ET) in these environments is complicated by extreme topographic relief and the severe scarcity of in-situ observations. Consequently, the interplay between atmospheric demand, soil moisture, and alpine vegetation remains a significant source of uncertainty in assessing current and future mountain water resources. In this study, we characterize the temporal variability and controlling mechanisms of ET in the Nepal Himalayas using data from a unique high-altitude hydrometeorological observational setup. In addition to measurements of temperature, precipitation, relative humidity and soil moisture, we continuously monitored turbulent fluxes using an eddy covariance system installed at 4214 m a.s.l. in the Langtang Valley in Nepal for a full year (November 2023 – October 2024), providing an exceptionally detailed dataset for understanding temporal ET dynamics and model evaluation. We observed high ET rates in the pre-monsoon season, driven by vegetation transpiration when there is sufficient soil moisture in a water-limited regime. With the increased precipitation during the monsoon season, the system shifts to a largely energy-limited regime. ET is suppressed during precipitation, but rebounds rapidly during multi-day dry spells. In the post-monsoon season, when precipitation is mostly absent, evapotranspiration is dominated by receding soil moisture and exceeds the precipitation input. Over the entire year, ET returned 44% of the precipitation input to the atmosphere. This substantial fraction indicates that these high-altitude headwaters are not merely passive runoff generators but active ecohydrological systems that contribute substantially in regulating catchment yield. To support robust climate adaptation strategies, future hydrological projections in HMA should therefore explicitly account for vegetation dynamics and soil moisture coupling to avoid significant misinterpretations of the water balance under global change.

How to cite: Kraaijenbrink, P., van den Berg, A., Stigter, E., and Immerzeel, W.: Drivers and magnitude of evapotranspiration in a high-altitude Himalayan catchment: insights from eddy covariance observations, EGU General Assembly 2026, Vienna, Austria, 3–8 May 2026, EGU26-5930, https://doi.org/10.5194/egusphere-egu26-5930, 2026.

EGU26-7946 | ECS | Posters on site | HS2.1.5

Assessing the sustainability of mountain groundwater resources under conditions of permafrost degradation and glacial recession  

Corrine Celupica-Liu, Jeffrey McKenzie, and Shemin Ge

Mountain regions, characterized by glacial and periglacial features, constitute a major global freshwater resource, yet climate-driven changes in the magnitude and timing of groundwater discharge threaten large-scale water resource sustainability. Though the widespread retreat of mountain glaciers and degradation of permafrost are well-documented, their individual and combined influences on groundwater systems remains poorly understood. Quantifying the temporal and spatial relationship between glacial melt, permafrost extent, groundwater discharge, and streamflow is necessary to assess the sustainability of streamflow under changing climate conditions. We present a two-dimensional coupled groundwater flow and heat transport model with seasonal freeze-thaw capability using the United States Geological Survey SUTRA 4.0 modeling software to investigate how warming air temperatures influence groundwater discharge patterns from a permafrost-affected aquifer recharged by glacial meltwater. The model represents a hillslope-valley cross-section adjacent to a small alpine glacier in the Rocky Mountains of Colorado, USA. The model is forced with baseline and observed warming air temperature scenarios and explicitly resolves the relative importance of permafrost thaw, seasonally-variable recharge, and changes in glacial meltwater contribution to groundwater discharge patterns to an alpine lake. Results suggest that interactions between a saturated glacial meltwater recharge zone and the adjacent permafrost hillslope may drive groundwater discharge seasonality and contribute to talik development beneath the hillslope. Simulations assess sensitivity to warming rate, permafrost thickness and continuity, and the timing and magnitude of glacial meltwater recharge.

This research provides process-based insight into mountain groundwater flow dynamics in areas of degrading permafrost and glacial features, and helps clarify the role of glacial meltwater recharge in sustaining mountain-derived streamflow under elevation-dependent warming. Results will inform predictions of hydrologic resilience and water resource sustainability in alpine watersheds, which are experiencing rapid environmental change.

How to cite: Celupica-Liu, C., McKenzie, J., and Ge, S.: Assessing the sustainability of mountain groundwater resources under conditions of permafrost degradation and glacial recession , EGU General Assembly 2026, Vienna, Austria, 3–8 May 2026, EGU26-7946, https://doi.org/10.5194/egusphere-egu26-7946, 2026.

EGU26-11422 | ECS | Orals | HS2.1.5

Snow droughts and the water cycle of the Central Apennines 

Maximiliano Rodriguez, Alvaro Ayala, Michael McCarthy, Catriona Fyffe, Thomas Shaw, Achille Jouberton, Emanuele Romano, Simone Fatichi, and Francesca Pellicciotti

Mountain regions in Europe are experiencing changes in temperature and precipitation patterns, as well as an increasing frequency and intensity of droughts. Periods of low precipitation reduce winter snow accumulation, while anomalous hot periods during spring and summer accelerate snowmelt, altering the water cycle and discharge patterns of mountain systems and their downstream areas. The combination of warmer and drier conditions increases water scarcity, reduces crop yields and decreases hydropower generation, with reductions in streamflow and groundwater recharge. Implementing high-resolution land surface models allow us to predict future conditions by capturing the complex behavior of flow paths and water storage across entire regions. Consequently, these models facilitate the study of future droughts and their impact on hydrological conditions within the catchment. 

We identify a number of droughts including snow droughts in the Central Apennines of Italy, and investigate their compounded effects on the hydrosphere, biosphere and pedosphere using a fully distributed, mechanistic land surface model (Tethys-Chloris) over two decades (from 2000 to 2020). Our model configuration resolves energy budgets and mass balances at an hourly timestep and 250 m resolution to simulate processes such as snowmelt, sublimation and plant transpiration. We force the model using a combination of stations and bias-corrected ERA5Land reanalysis data and evaluate it against streamflow measurements, snow depth, soil moisture and remote sensing products of snow-covered area and leaf area index. 

We analyze distributed simulations of snow depth, snow water equivalent, soil moisture, lateral subsurface water fluxes and surface temperature to obtain a highly resolved picture of the functioning of the mountain hydrological system. Our analysis shows how droughts produced by a reduction of snow accumulation, precipitation or warm temperatures produce runoff deficits and positive anomalies of evapotranspiration at high elevations. We focus in particular on the effect of evaporative fluxes in reducing water yields. Our findings indicate that warm periods lead to enhanced evapotranspiration at elevations between 1500 and 2500 m a.s.l. We also investigate the contrasting effect of snow on this so-called drought paradox, as snow provides water vital to plant functioning, but limits the growing season length. This phenomenon ultimately reduces downstream water availability in mountain regions, which impacts water security for mountain-dependent communities and ecosystems. As such, our study provides an entirely new understanding of the eco-hydrological functioning of the Central Apennines water system under drought stresses, and establishes a baseline of unprecedented resolution in time and space to predict the ecological and hydrological impacts of future droughts.


How to cite: Rodriguez, M., Ayala, A., McCarthy, M., Fyffe, C., Shaw, T., Jouberton, A., Romano, E., Fatichi, S., and Pellicciotti, F.: Snow droughts and the water cycle of the Central Apennines, EGU General Assembly 2026, Vienna, Austria, 3–8 May 2026, EGU26-11422, https://doi.org/10.5194/egusphere-egu26-11422, 2026.

EGU26-12094 | ECS | Posters on site | HS2.1.5

Ecohydrological Controls Across Elevation and Climate Gradients in the Andes 

Ruiqi Gu, Rike Becker, Wouter Buytaert, and Athanasios Paschalis

The Andes support critical mountain ecosystems and water resources that are highly sensitive to climate variability. Spanning multiple climate zones and steep topographies, Andean ecosystems exhibit distinct ecohydrological responses to changes in climate and land use across elevational gradients. However, interactions between vegetation dynamics and hydrological processes remain poorly understood at the scale of the Andean domain. This key knowledge gap is partly driven by local data scarcity and the limited representation of strong spatial heterogeneity. In this study, we investigate the spatial patterns of ecohydrological dynamics in the Andes using a hyper-resolution, physics-based ecohydrological modelling framework. Specifically, we develop a catchment selection scheme to identify representative catchments of all major climates and biomes across the entire mountain range of the Andes, quantify their hydrological and vegetation dynamics across elevational and latitudinal ranges. More specifically, we applied K-means clustering to all non-Amazon Andean catchments using key hydroclimatic, topographic, and soil variables. Four primary clusters were identified to represent the regional diversity: the North Tropical Andes, South Tropical Dry Andes, Central Dry Andes, and Extratropical Wet Andes. The North Tropical Andes cluster is located in Peru, while the remaining three clusters consist of Chilean catchments. Within each cluster, we analyse (1) vegetation dynamics and water balance components across elevation bands, (2) elevation-dependent plant water limitations and their variability among catchments, and (3) the relative importance of key drivers including precipitation, vapor pressure deficit, and air temperature in controlling evapotranspiration, gross primary productivity, and discharge, and how these relationships are modulated by topography. Through this integrated analysis, we aim to provide new insights into how climate, vegetation and hydrology vary systematically across the Andes.


How to cite: Gu, R., Becker, R., Buytaert, W., and Paschalis, A.: Ecohydrological Controls Across Elevation and Climate Gradients in the Andes, EGU General Assembly 2026, Vienna, Austria, 3–8 May 2026, EGU26-12094, https://doi.org/10.5194/egusphere-egu26-12094, 2026.

EGU26-12537 | ECS | Posters on site | HS2.1.5

Droughts in glacierized catchments of the Italian Alps: evolution and emerging high-elevation variabilities (2000–2024) 

Martina Leone, Francesco Avanzi, Simone Gabellani, Michel Isabellon, Clara Manganaro, Alvaro Ayala, and Catriona Fyffe

High-elevation regions are increasingly exposed to intensifying droughts, challenging the role of mountains as reliable water towers. Glacierized catchments represent particularly complex systems, where atmospheric forcing, snow and glacier dynamics, and hydrological processes interact across multiple timescales to shape drought impacts.
Despite this complexity, drought processes in glacierized alpine basins remain only partially explored. Here we focus on glacierized catchments across the Italian Alps, including basins in north-western and north-eastern Italy (Piedmont, Aosta Valley, and Trentino), a climatic transition zone between Mediterranean and continental alpine regimes where drought responses may differ from those observed in other alpine regions, while downstream water availability supports hydropower production, irrigation, drinking water supply, and alpine ecosystems.
This study investigates how droughts have manifested and evolved in Italian glacierized catchments over the period 2000–2024, analyzing their spatial and temporal variability and their propagation across meteorological, snow, glacier, and hydrological compartments. Meteorological droughts are characterized using precipitation and temperature anomalies derived from the BigBang dataset, while snow droughts and glacier melt contributions are assessed using snow water equivalent and melt simulations from the S3M Italy model. Hydrological drought conditions are further investigated using streamflow observations provided by regional monitoring agencies. The analysis aims to examine how meteorological variability, hydrological mechanisms, and glacier melt influence drought duration and intensity, and how these relationships have evolved over the last two decades, particularly at high elevations.
By providing an integrated assessment of drought mechanisms in southern alpine glacierized basins, this work addresses a key knowledge gap in mountain hydroclimatology. The results will improve understanding of how glacierized catchments respond to drought under ongoing climate change, offering a basis for future investigations of high-elevation drought signals and their implications for alpine water resources, as well as for assessing drought impacts across different environmental compartments in mountain regions.

How to cite: Leone, M., Avanzi, F., Gabellani, S., Isabellon, M., Manganaro, C., Ayala, A., and Fyffe, C.: Droughts in glacierized catchments of the Italian Alps: evolution and emerging high-elevation variabilities (2000–2024), EGU General Assembly 2026, Vienna, Austria, 3–8 May 2026, EGU26-12537, https://doi.org/10.5194/egusphere-egu26-12537, 2026.

EGU26-13176 | ECS | Posters on site | HS2.1.5

Understanding the water-ecosystem nexus in the Inter-Andean region of Bolivia – a synergistic, historical and complex connection 

Ivan Alexis Chavez Flores, Santiago Mendoza Paz, Andres Saul Gonzales Amaya, Mauricio Florencio Villazon Gomez, Santiago Nuñez Mejia, Patrick Willems, and Anne Gobin

Climate change poses a major threat to vulnerable regions, necessitating the development of adaptive strategies to ensure a sustainable future. To achieve sustainability, a deeper understanding of ecosystems and their nexus with climate is needed. Moreover, the interconnection between mountains and valleys demonstrate the synergies of water services in these two zones. Mountain regions, which function as critical water sources for downstream users, are particularly vulnerable and should be prioritized in adaptation strategies. These areas play a central role in water production, storage, and distribution, rendering their resilience essential for regional sustainable water management. Remote sensing products, such as MODIS and GMET, provide valuable tools for monitoring ecosystem dynamics and their interconnection with climatic variables. Precipitation emerges as the key driver influencing ecosystem responses. Our analysis reveals that vegetation indicators, NDVI and EVI, exhibit a lag by approximately one month in response to changes in precipitation. Seasonal-Trend decomposition (STL) confirms a strong correlation in the trend component: wet events typically trigger ecosystem responses after about one month. Furthermore, both wet and dry extreme events, significantly influence ecosystem development and their capacity to deliver services. Climate change scenarios indicate that future extremes will predominantly be wet rather than dry. This suggests an increase in the frequency and intensity of precipitation events by 2050, raising the risk of flooding and associated socio-ecological challenges. Such extremes can disrupt vegetation dynamics in EVI and NDVI indicators which may reflect a reduction in plant productivity and altering the dynamics of ecosystem services. Understanding these dynamics is crucial for designing resilient integrated water and ecosystem management strategies that safeguard both human and environmental well-being in the Inter - Andean region of Bolivia.

How to cite: Chavez Flores, I. A., Mendoza Paz, S., Gonzales Amaya, A. S., Villazon Gomez, M. F., Nuñez Mejia, S., Willems, P., and Gobin, A.: Understanding the water-ecosystem nexus in the Inter-Andean region of Bolivia – a synergistic, historical and complex connection, EGU General Assembly 2026, Vienna, Austria, 3–8 May 2026, EGU26-13176, https://doi.org/10.5194/egusphere-egu26-13176, 2026.

EGU26-13406 | ECS | Posters on site | HS2.1.5

Spatial patterns of water security risks in the deglaciating Andes  

Rike Becker, Sofia Castro, Fabian Drenkhan, Nilton Montoya, Bethan Davies, Jeremy Ely, and Wouter Buytaert

Deglaciation alters hydrological processes in mountain catchments by modifying runoff regimes, impacting water quality, availability, and storage, with widespread consequences for downstream water security. While the timing and rate of glacier loss are increasingly well constrained, how glacier retreat translates into spatially heterogeneous water security risk remains poorly understood. In water-scarce catchments, small reductions in glacier melt may have severe impacts, whereas in water-abundant systems, large losses may be inconsequential. Risks can also differ substantially between upstream and downstream regions due to spatial heterogeneities in hazards, and the exposure and vulnerabilities of social-ecological systems.

To address this gap, we present a conceptual and quantitative framework to assess deglaciation-driven water security risk in Andean catchments, grounded in a comprehensive risk assessment approach (risk = hazard × exposure × vulnerability). First results quantify the effects of glacier retreat on the hazard and exposure components using high-resolution hydrological simulations from the JULES land surface model. The analysis spans ten glaciated river basins across the Andes, covering a broad climatic gradient from hyper-arid to humid conditions. A key novelty is our spatially explicit approach, accounting for upstream-downstream heterogeneities in hazard and exposure quantifications.

Our framework moves beyond glacier-centric assessments by explicitly linking cryospheric change to downstream water security risk across diverse hydro-climatic settings. By providing a transferable but region-specific method, our approach offers a foundation for identifying hotspots of emerging water security risk under continued glacier retreat.

How to cite: Becker, R., Castro, S., Drenkhan, F., Montoya, N., Davies, B., Ely, J., and Buytaert, W.: Spatial patterns of water security risks in the deglaciating Andes , EGU General Assembly 2026, Vienna, Austria, 3–8 May 2026, EGU26-13406, https://doi.org/10.5194/egusphere-egu26-13406, 2026.

EGU26-13430 | Orals | HS2.1.5

Shifting Storage Regimes and Declining Streamflow Resilience in Mountain Systems 

Rosemary Carroll, Beatrice Gordon, Erica Siirila-Woodburn, Charuleka Varadharajan, Christine Albano, Jessica Lundquist, and Kenneth Williams

Mountain snow is a globally important source of water for downstream users and ecosystem sustainability, but it is uncertain when and where traditional snow metrics alone provide reliable indicators of water supply. Here, we synthesize large-sample regional analysis with a high-resolution integrated hydrologic model of a headwater basin of the Colorado River (East River, Colorado, 750 km2) to demonstrate the tight coupling between land surface and subsurface process on mountain streamflow generation. Our analysis of nearly 4,700 western US mountain watersheds indicates that streamflow predictability depends not only on snow accumulation magnitude, but on whether snow represents the dominant water reservoir. Snow storage-dominated mountain basins exhibit a tight coupling between peak snow water equivalent and runoff, while mixed storage systems, such as the East River, depend on interactions among snow, rainfall, and groundwater. Recent declines in runoff efficiency and the degradation of low-flow metrics in the East River coincide with persistent subsurface storage deficits due to overlapping climate extremes, signaling a shift toward subsurface storage-limited behavior.  Modeled scenarios of persistent and prolonged warming indicate enhanced vegetation water use reduces recharge, drives substantial groundwater storage loss that disproportionately affects dry years and limits recovery even during wet periods, ultimately reducing annual flows and increasing stream intermittency. Sensitivity experiments further show that the depth and porosity of active bedrock circulation strongly modulate drought response. Deeper, higher-porosity groundwater systems are able to buffer low flows during multi-year drought conditions but experience prolonged post-drought recovery. Collectively, these findings highlight the tight coupling among climate, vegetation, snow, and groundwater, and demonstrate that explicit representation of subsurface storage dynamics is essential for forecasting mountain water supply, ecosystem vulnerability, and drought response under future climate conditions.

How to cite: Carroll, R., Gordon, B., Siirila-Woodburn, E., Varadharajan, C., Albano, C., Lundquist, J., and Williams, K.: Shifting Storage Regimes and Declining Streamflow Resilience in Mountain Systems, EGU General Assembly 2026, Vienna, Austria, 3–8 May 2026, EGU26-13430, https://doi.org/10.5194/egusphere-egu26-13430, 2026.

EGU26-13449 | ECS | Orals | HS2.1.5

Groundwater monitoring along a Trans-Himalayan transect using seismic velocity changes 

Luc Illien, Peter Makus, Christoff Andermann, and Niels Hovius

The Himalayas represent one of the world’s major water towers, sustaining downstream populations across Asia. However, hydrological processes in this region remain poorly constrained due to extreme topography, limited accessibility, and sparse in situ observations. Consequently, most existing studies rely on modeling and remote sensing, with a strong emphasis on glacier melt. Yet water-budget estimates suggest that up to two-thirds of discharge originates from groundwater, underscoring the need to better understand subsurface water dynamics.
To anticipate future water availability in a progressively glacier-free Himalaya, ground-based observations are required. Here, we exploit the dense Hi-CLIMB seismic array to investigate hydrological variability along a Trans-Himalayan transect. The array spans ~250 km from the Terai plains to the Tibetan Plateau, with an average station spacing of ~5 km. Most stations operated between late 2022 and 2024, capturing at least one full monsoon cycle.
We derive temporal seismic velocity changes from ambient noise interferometry as a proxy for groundwater storage variations, and analyze seismic noise amplitudes as an indicator of river activity. These seismic observations are compared with climatological datasets, regional geology, glacier cover from the Randolph Glacier Inventory, and geomorphic features extracted from GIS analysis. Our results reveal strong spatial contrasts in monsoon-driven hydrological responses and identify distinct zones and phases contributing to runoff along the transect, highlighting the potential of seismic monitoring for resolving groundwater dynamics in high-mountain environments.

How to cite: Illien, L., Makus, P., Andermann, C., and Hovius, N.: Groundwater monitoring along a Trans-Himalayan transect using seismic velocity changes, EGU General Assembly 2026, Vienna, Austria, 3–8 May 2026, EGU26-13449, https://doi.org/10.5194/egusphere-egu26-13449, 2026.

EGU26-14455 | ECS | Orals | HS2.1.5

Elevation-dependent sensitivity of the snow accumulation period to climate warming in mountain basins 

Sam Anderson, Radley Horton, Kate Hale, and Shawn Chartrand

The seasonal snow accumulation period – approximated as the number of days between the autumn onset and spring end of sub-freezing temperatures – varies across elevation in mountain basins, with colder, higher elevation areas accumulating snow for longer relative to warmer, lower-elevation areas. Climate warming will reduce the sub-freezing duration throughout a year and alter the timing and magnitude of snow accumulation and melt, with profound implications for downstream ecosystems, infrastructure, and societies; however, it is not well known how such changes will vary across elevation gradients in mountain basins.

Here we present a novel idealized conceptual model to analytically explain how and why the annual sub-freezing period responds differently to climate warming across elevation gradients in mountain basins. We use this model to demonstrate theoretically under what climactic conditions the sub-freezing duration is more sensitive to warming at low elevation areas relative to high elevations, and vice-versa. Both the strength (i.e. the magnitude of change of sub-freezing duration) and the shape (i.e. whether high- or low-elevation regions are more sensitive to warming) of this sensitivity vary non-linearly as a function of mean temperature, temperature seasonality, temperature lapse rate, and the basin elevation range.

We then use ERA5-Land climate reanalysis data to apply this novel framework to mountain basins across North America. We find that in basins with warmer climates (i.e. those with mean annual temperatures greater than freezing), the annual number of days below freezing is more sensitive to warming at low elevations. In contrast, in basins with colder climates (i.e. those with mean annual temperatures less than freezing), the annual number of days below freezing are more sensitive to warming at high elevations. We evaluate both the present sensitivity of the sub-freezing duration, as well as observed changes since 1950.

We detail two case studies in which we apply our methodology. First, we present how the snow accumulation period may decrease by substantially more in some glacierized areas than others (i.e. Canadian Rocky Mountains vs Coast Mountains). We find that in many glacierized basins, the snow accumulation period is more sensitive to warming in the high-elevation glacierized areas relative to lower-elevation non-glacierized areas. Second, we adapt our methodology to describe the period of the year when heatwaves, defined as persistent periods hotter than the seasonally-varying 90th percentile of temperature, may be warmer than freezing and thus potentially able to modify basin hydrology. We show that the potential for heatwave-driven ablation in mountain basins changes non-linearly across elevation with warming, and that heatwaves may rapidly emerge as a more prominent driver of high-elevation melt. Overall, our study presents a novel modelling framework to assess and project changes to melt-driven hydrological dynamics in mountain basins.

How to cite: Anderson, S., Horton, R., Hale, K., and Chartrand, S.: Elevation-dependent sensitivity of the snow accumulation period to climate warming in mountain basins, EGU General Assembly 2026, Vienna, Austria, 3–8 May 2026, EGU26-14455, https://doi.org/10.5194/egusphere-egu26-14455, 2026.

Knowledge of the flow regime of streams and rivers is fundamental for assessing their ecological resilience and impacts from human activities and climate change. However, for many streams, especially those in remote mountain areas, streamflow data are lacking. For ungauged catchments, citizen science and participatory action research methodologies can be used to generate the needed streamflow data. The CrowdWater (www.crowdwater.ch) app can, for example, be used to record observations for different hydrological variables. Repeated observations of the relative stream water level or the presence of water and flow in intermittent streams can provide data for otherwise ungauged catchments. To demonstrate the usefulness of the CrowdWater app for collecting data on streamflow in a marginalized mountainous community setting, this presentation will highlight a case study in the Queuco catchment in Chile. The catchment is located in the indigenous Mapuche-Pehuenche territory. Due to threats related to water rights, it became urgent for the local communities to obtain reliable hydrological data. Therefore, the communities observed stream water-levels using the CrowdWater app. The community co-designed the research objectives and selected the monitoring sites, while the researchers organized the initial training workshop and provided ongoing support. The data were used in a lumped hydrological model (HBV) to obtain estimates of the streamflow, which were then compared to historic monthly data (1938 – 1970). The model results suggest that even though there are no dams or water abstractions yet, the natural flow regime has already changed, with reduced flow throughout the year, and especially in October and November, likely due to declines in snowmelt. Overall, this case study highlights the usefulness of a citizen science app in participatory action research to collect data on the natural flow regime, which can be used in other (mountain) catchments with pressing issues related to water availability and security as well.

How to cite: van Meerveld, I., Bañales-Seguel, C., Vis, M., and Seibert, J.: From ungauged to informed: combining community observations, a citizen science app, and hydrological modeling to estimate mountain streamflow, EGU General Assembly 2026, Vienna, Austria, 3–8 May 2026, EGU26-14567, https://doi.org/10.5194/egusphere-egu26-14567, 2026.

EGU26-14652 | Posters on site | HS2.1.5

Snow in transition: 80 Years of SWE data for the Wägital, Switzerland 

Ilja van Meerveld, Fiona Sigrist, Mario Rohrer, and Jan Seibert

Temporary storage of precipitation in mountainous regions as snow is crucial for downstream water users, including agriculture and hydroelectric power generation. However, the amount and duration of this storage are changing over time. We used snow water equivalent (SWE) data from the pre-alpine Wägital in Switzerland, one of the longest datasets of SWE globally, to analyze trends in SWE. Measurements have been made annually on April 1st at multiple locations in the Wägital catchment since 1943. To overcome the limitations of relying solely on April 1st SWE measurements, we applied a degree-day model to reconstruct daily SWE values, and identified the annual maximum SWE (maxSWE) and duration of snow cover. Here, we present trends in meteorological parameters, April 1st SWE, maxSWE, and the duration of snow cover. In addition, we describe the spatial variation in maxSWE with respect to elevation, aspect, and slope.

The model results revealed that April 1st measurements often fail to capture maxSWE, highlighting the importance of using maxSWE for trend analyses. There was a general decline in maxSWE across the catchment during the study period and maxSWE now occurs earlier than in the past. Positive trends for maxSWE dominated from the 1940s to the 1980s, followed by stronger negative trends from the 1980s onward. The strength of these negative trends depended strongly on the chosen start year. Similar patterns were observed for the duration of snow cover. Not surprisingly, "cold and wet" years resulted in the most snow, whereas "warm and dry" years resulted in the lowest maxSWE. The variability in maxSWE was larger for higher elevations sites. Spatially, maxSWE increased with elevation, was lowest on south-facing slopes and highest on west-facing locations, and was lower for steeper than flat slopes. While uncertainties in input data and modeling limitations exist, this study underscores the value of long-term datasets like those from the Wägital monitoring program for understanding trends in snow cover and storage, and anticipating future challenges related to a reduced snow cover due to climate change.

How to cite: van Meerveld, I., Sigrist, F., Rohrer, M., and Seibert, J.: Snow in transition: 80 Years of SWE data for the Wägital, Switzerland, EGU General Assembly 2026, Vienna, Austria, 3–8 May 2026, EGU26-14652, https://doi.org/10.5194/egusphere-egu26-14652, 2026.

EGU26-15370 | ECS | Orals | HS2.1.5

UAV-Derived Volumetric Monitoring of Artificial Ice Reservoirs for Climate Adaptation in Ladakh, India 

Karuna Mira Sah and Suryanarayanan Balasubramanian

Climate change is exacerbating spring water scarcity in the trans-Himalayan region of Ladakh, India, owing to increased uncertainty in winter snowfall. Amidst this growing concern, artificial ice reservoirs emerged as a climate adaptation technique and have gone through several engineering iterations since the late 1980s. These gravity-based systems capture winter streamflow in the form of ice and release meltwater during the crucial spring agricultural season. Despite their rapid implementation across the region, data integration into their construction process and quantitative monitoring of their water systems and volumetrics remain limited.

This study demonstrates the application of a lightweight, consumer-grade unmanned aerial vehicle (UAV) for photogrammetry-based volumetric analysis of ice reservoirs. A DJI Mini 3 was used to conduct 20 repeat surveys during the winter–spring 2024–2025 season on ice reservoirs constructed by a Ladakh-based startup, Acres of Ice, in two villages: Igoo and Sakti. Oblique imagery was captured at a 65° camera angle with 80% overlap to constrain ice reservoir geometries. Photogrammetric data processing was used to generate high-resolution digital elevation models (DEMs), which were coregistered using ground control points surveyed in situ with a Trimble RS2 GNSS with real-time kinematics (RTK). Finally, on-site weather station and pipeline-based sensor inputs provided water and air temperatures, as well as discharge data, to further contextualise the construction process.

Preliminary results reveal a maximum ice volume of approximately 4,116 m³ at the Igoo site, with mean discharge rates of ~3.5 L s⁻¹ and a low water-to-ice efficiency of 13% between November and April. During this period, water temperature averaged 4 °C and mean air temperatures averaged −8 °C. At the Sakti site, ice volumes reached ~1,814 m³, with average discharge rates of ~5 L s⁻¹, indicating a lower water-to-ice efficiency of 6% between December and April. During this period, water temperatures averaged ~2 °C, while air temperatures averaged −10 °C. These results indicate a need to optimise design parameters for water management and better integrate microclimate data into ice reservoir construction.

This research offers the first comprehensive, data-driven approach to volumetric measurements of ice reservoirs, laying the groundwork for future studies on groundwater hydrology, watershed management, and socio-ecological impacts, and contributing to a holistic, scalable approach to adaptive climate strategies in high-altitude villages in Ladakh.

How to cite: Sah, K. M. and Balasubramanian, S.: UAV-Derived Volumetric Monitoring of Artificial Ice Reservoirs for Climate Adaptation in Ladakh, India, EGU General Assembly 2026, Vienna, Austria, 3–8 May 2026, EGU26-15370, https://doi.org/10.5194/egusphere-egu26-15370, 2026.

EGU26-16038 | ECS | Posters on site | HS2.1.5

 Influences of a dual monsoon system on River Water Recharge in the Japanese Southern Alps 

Tatsuki Kimura, Koichi Sakakibara, and Takashi Nakamura

Mountain regions are major recharge areas that sustain downstream groundwater and river systems, yet they are among the least observed parts of catchments. In dual-monsoon climates, the proportion of precipitation falling as pre-monsoon snow and monsoon rain varies greatly between regions. However, harsh environmental conditions and limited accessibility have restricted observations in mountain areas. As a result, it remains unclear how much different types of precipitation, such as snow and rain, contribute to groundwater recharge and which controlling factors, such as geology and slope, regulate these contributions.

Stable water isotopes and d-excess are powerful tracers of the seasonality of recharge precipitation and subsurface groundwater mixing processes. For example, Nakamura (2017) clarified seasonal local meteoric water lines (LMWLs) in the Kofu Basin of central Japan and demonstrated that groundwater in the alluvial fan is strongly dominated by pre-monsoon (snow-season) precipitation, even though pre-monsoon precipitation accounts for only about 25% of the annual precipitation in the lowlands. This apparent paradox has been explained by recharge from snowmelt originating in the surrounding mountains. However, due to limited accessibility, precipitation and river water have not been sufficiently observed in mountain regions, and large-scale, observation-based verification from the mountain side remains limited.

In central Japan, mountain ranges with elevations of approximately 3,000 m extend across the main island of Honshu from the Sea of Japan to the Pacific Ocean. These ranges are collectively referred to as the Japanese Alps and are subdivided into the Northern, Central, and Southern Alps. Several alluvial fans have developed along their foothills, forming important recharge areas for downstream water resources.

In this study, we focused on the Japanese Southern Alps, located on the Pacific side of the Japanese Alps. The Japanese Southern Alps are characterized by steep topography, multiple geological units, and a dual-monsoon climate. River water was sampled at 48 sites across an elevation range of 392–1,556 m (the elevation of the downstream urban area of Kofu City is approximately 200 m).

River water samples were collected during both the pre-monsoon and monsoon seasons, and δ¹⁸O, δD, and d-excess were analyzed. In both seasons, river water d-excess values were close to those of pre-monsoon precipitation, indicating that winter-origin water dominates streamflow even during the monsoon period. Mass-balance analysis further confirmed that pre-monsoon precipitation makes a dominant contribution to river water in both seasons.

Furthermore, significant differences in d-excess were observed among geological units. These differences followed a consistent ranking, with higher d-excess associated with higher hydraulic conductivity. This suggests that, in steep and geologically complex mountain regions under a dual-monsoon climate, permeability contrasts among geological units regulate the infiltration of pre-monsoon precipitation and thereby influence the relative contributions of pre-monsoon and monsoon precipitation to river water.

These results demonstrate that differences in geological structure within mountain blocks influence the d-excess values of downstream alluvial-fan groundwater and river water. This finding has important implications for identifying recharge areas and for understanding mountain–lowland hydrological connectivity in dual-monsoon regions.

How to cite: Kimura, T., Sakakibara, K., and Nakamura, T.:  Influences of a dual monsoon system on River Water Recharge in the Japanese Southern Alps, EGU General Assembly 2026, Vienna, Austria, 3–8 May 2026, EGU26-16038, https://doi.org/10.5194/egusphere-egu26-16038, 2026.

EGU26-16807 | ECS | Posters on site | HS2.1.5

Between scales and complexity: Integrated process functioning of evapotranspiration in alpine catchments 

Anna Herzog, Till Francke, and Klaus Vormoor

Evapotranspiration (ET) is an important process in the water-balance of alpine catchments but usually superimposed by snow and glacial processes. Due to complex topography, vegetation segmentation and scarcity of observation data,  large uncertainty exists in the description and modelling of ET processes in alpine terrain. This is especially the case when looking at detailed process functioning on the distributed sub-kilometer scale. To address this knowledge gap and better quantify the spatial distribution and temporal dynamics of ET rates in alpine areas, we are combining detailed field monitoring and distributed, physically based modelling in the 12 km² sized Fundusbach catchment (Tyrol, Austria).  The monitoring network includes four water level and water temperature loggers along the longitudinal river profile (since 2022), two meteorological stations (Temperature and Precipitation since 2022), three Bowen-Ratio Stations coupled with soil moisture sensors and placed at locations with different elevation and vegetation cover (since 2024), as well as one CNRS-probe (since 2025) to quantify distributed soil moisture. All sensors operate at hourly or 15-minute intervals. To bridge the gap between the point- and catchment scale, we use a high-resolution water balance model (WaSiM, 25 m, 1 h). Based on the temporal resolution of the observations and the model, we are able to include both seasonal as well as diel cycles of the water balance.

In a two-step approach we first use the measurements and model to investigate integrated process functioning within the last decade. While changes in the diel streamflow cycles along the longitudinal river profile helped disentangling the contradictory signals of melt and ET, they were not sufficient to investigate spatial patterns of process behaviour. Bowen-Ratio measurements add some spatial information, but observations are still sparse with reference to the complex micrometeorological conditions and  topography. However, all observations proved crucial for the calibration and validation of the model, particularly given the goal of capturing process interactions and quantifying ET volumes.
In a second step, we apply an ensemble of six EURO-CORDEX climate projections to investigate how process dominance might change until the end of the century. Furthermore, we investigate the key role of vegetation distribution on spatial process behaviour. In this regard, we combine the climate projections with different land use scenarios. We hypothesize that especially the distribution of shrubs will have major influence on the partitioning of water within the catchment, potentially limiting water availability for lower elevation forested areas. 

How to cite: Herzog, A., Francke, T., and Vormoor, K.: Between scales and complexity: Integrated process functioning of evapotranspiration in alpine catchments, EGU General Assembly 2026, Vienna, Austria, 3–8 May 2026, EGU26-16807, https://doi.org/10.5194/egusphere-egu26-16807, 2026.

Groundwater-fed river systems in mountainous regions are particularly vulnerable to the combined effects of climate variability and groundwater abstraction. Yet, quantitative assessments are often hindered by limited data availability, especially when the water table lies deep below the topographic surface. This study investigates groundwater–surface water interactions in the Northern Etna volcanic aquifer (Sicily, Italy), a UNESCO World Heritage Site that sustains the Alcantara River baseflow and supplies water for civil and agricultural uses.

A regional groundwater flow model was developed using MODFLOW 6, adopting an equivalent porous-medium representation of the fractured basalt aquifer under data-scarce conditions. The model was calibrated using PEST under steady-state conditions, using hydraulic head observations, and validated in transient mode against monthly discharge measurements from a major drainage gallery over the period 2009–2022. Scenario simulations were performed to quantify the effects of current groundwater abstractions and projected climate-driven recharge changes.

Model results show that current groundwater abstractions reduce spring discharge by approximately 23–37% (mean ≈30%). No significant long-term trend in baseflow is observed over the 2009–2022 period, suggesting that historical baseflow variability reflects the integrated aquifer response to recharge, storage and abstraction processes rather than a sustained climatic forcing.

Conversely, simulations driven by EURO-CORDEX climate projections reveal a substantial future decline in groundwater availability. Drainage gallery discharge is projected to decrease up to 23% in the near future (2021–2050) and up to 40% in the far future (2041–2070), depending on the emission scenario. These results highlight increasing stress on groundwater resources and reduced aquifer–river connectivity during prolonged droughts, with potentially severe impacts on groundwater-dependent ecosystems.

Despite inherent limitations related to data scarcity and necessary conceptual assumptions, this study demonstrates that regional numerical modeling can provide robust, management-relevant insights into mountainous aquifer systems. The proposed framework supports adaptive groundwater management strategies aimed at preserving river baseflow and ecosystem services under changing climatic conditions.

How to cite: Bonaccorso, B., Silipigni, M., Di Salvo, C., Borzì, I., and Preziosi, E.: Modeling Climate and Anthropogenic Controls on Groundwater Recharge, Baseflow, and Spring Discharge in a mountainous volcanic Aquifer in the Mediterranean Area (Northern Etna, Italy), EGU General Assembly 2026, Vienna, Austria, 3–8 May 2026, EGU26-17360, https://doi.org/10.5194/egusphere-egu26-17360, 2026.

EGU26-17778 | ECS | Posters on site | HS2.1.5

Coupled Snow-Runoff Modelling in Alpine Karst: Comparing physics-based vs. conceptual snow model representation in neighbouring catchments with different characteristics 

Elias Bögl, Roberta Facchinetti, Paul Schattan, Karl-Friedrich Wetzel, Jakob Knieß, Karsten Schulz, and Franziska Koch

Hydrological modelling in snow-dominated high-alpine karstified catchments remains challenging due to complex snow processes and their influence on runoff generation. This study investigates the impact of snow model complexity on discharge simulations in the Zugspitze region, at the border of Germany and Austria, in the European Alps across two neighbouring catchments. Both catchments are located in the same mountain range, are heavily karstified, share similar geological structures, and have practically no surface runoff. However, some catchment characteristics differ, which we will investigate in this modelling study. The Partnach spring catchment (15.4 km², 1430-2962 m a.s.l., W-E orientation) comprises steep rocky terrain in the upper and lower part in the south-, west- and north-facing terrain with dominant a high-altitude plateau in the middle part, and overall limited vegetation. In contrast, Hammersbach (17.8 km², 768-2951 m a.s.l., N-S orientation) shows stronger elevation gradients and is predominantly covered by forests in the lower third of the catchment. Steep north-facing rock walls reach down to ~1000 m and lead to a longer lasting snow cover in the upper and middle part of the catchment due to terrain shading. We examine for these two catchments how a physically-based snow representation (Alpine3D) compares to a degree-day approach (CemaNeige) regarding its impact on snowpack evolution and runoff generation when coupled with an identical lumped conceptual GR4H hourly routing scheme and meteorological forcing. Alpine3D explicitly simulates boundary layer fluxes and energy balance processes, while CemaNeige relies on the upper GR4H storage to represent evapotranspiration and interception. The GR4H routing parameters are calibrated using a 5-year moving window approach across hydrological years 2014-2025 for both catchments, which face characteristic high-alpine measurement challenges such as winter data gaps, avalanche events, and sediment transport. Multicriteria validation incorporates SWE measurements, Sentinel-2 snow-covered area information, and discharge observations. Results show on the one hand, that both modelling approaches achieve comparable annual discharge performance, while Alpine3D consistently provides a more realistic representation of spatiotemporal snow distribution. On the other hand, the comparative analyses of the adjacent catchments present model behaviour under different snow, terrain and land-cover conditions. This study provides insights into the conditions under which increased physical realism improves runoff simulations and for which situations conceptual approaches are a good choice, supporting informed model selection for snow-dominated and ungauged alpine regions.

How to cite: Bögl, E., Facchinetti, R., Schattan, P., Wetzel, K.-F., Knieß, J., Schulz, K., and Koch, F.: Coupled Snow-Runoff Modelling in Alpine Karst: Comparing physics-based vs. conceptual snow model representation in neighbouring catchments with different characteristics, EGU General Assembly 2026, Vienna, Austria, 3–8 May 2026, EGU26-17778, https://doi.org/10.5194/egusphere-egu26-17778, 2026.

EGU26-18345 | ECS | Orals | HS2.1.5

Localized buffering, widespread decoupling: Glacier meltwater's shrinking influence on high-Andean wetland hydrology 

Dingyu Xuan, Rike Becker, Miguel Christian Vargas Valverde, Bethan J. Davies, Jeremy C. Ely, Owen King, Nilton Montoya, Christian Onof, Anthony C. Ross, and Wouter Buytaert

High-altitude wetlands are vital for water storage, flow regulation, and biodiversity in mountain regions. Their hydrologic resilience depends on water inputs from precipitation, groundwater, snow, and glacier melt, making them sensitive indicators of climate-induced hydrological change.  However, the specific impacts of rapid glacier retreat and shifting precipitation regimes on the spatiotemporal stability of these ecosystems remain poorly quantified, limiting the development of targeted adaptation strategies.

This study investigates the hydrological drivers and spatial dynamics of high-altitude wetlands in two Peruvian Andean catchments: glaciated Cordillera Vilcanota and nearly deglaciated La Raya. Using high-resolution satellite-based wetland mapping (2019-2025), we employ a sub-catchment-based regression analysis to disentangle the role of precipitation and glacier melt in controlling wetland seasonal and interannual variability.

Our results show that seasonal wetland dynamics are primarily driven by precipitation, which explains up to 25% of wetland variability. However, in proximity to glaciers, wetland seasonality is significantly dampened, indicating a stabilizing effect of glacier meltwater inputs. Spatially explicit analysis reveals that this glacier-buffering effect is highly localized: it attenuates sharply with distance from periglacial and becomes statistically undetectable beyond approximately 12 km. This suggests that most high-Andean wetlands are hydrologically decoupled from direct glacier melt influence, and their future vulnerability will be predominantly governed by precipitation changes.

This work provides a novel spatially explicit assessment of glacier–wetland hydrological connectivity, which is a key and understudies component of mountain water cycles. The findings advance the understanding of how different water resources regulate wetland variability and offer a monitoring framework that can support the development of adaptation strategies for sustaining mountain ecosystem services under climate change.

How to cite: Xuan, D., Becker, R., Vargas Valverde, M. C., Davies, B. J., Ely, J. C., King, O., Montoya, N., Onof, C., Ross, A. C., and Buytaert, W.: Localized buffering, widespread decoupling: Glacier meltwater's shrinking influence on high-Andean wetland hydrology, EGU General Assembly 2026, Vienna, Austria, 3–8 May 2026, EGU26-18345, https://doi.org/10.5194/egusphere-egu26-18345, 2026.

EGU26-18420 | Orals | HS2.1.5

Trailcam Hydrology – Can very low-cost wildlife cameras be used to monitor streamflow in an Alpine environment? 

Nick Everard, Nathan Rickards, Nazimul Islam, Amber Barr, and Hamish Pritchard

High mountain environments provide a critical store of water in the form of winter snow that is released as liquid water in the summer months. Globally, one sixth of the human population is dependent on this meltwater as it moves down the mountains into more heavily populated regions. The rapid warming of our planet threatens the security of this resource, with winter snow becoming less predictable and glaciers shrinking at an accelerating rate. In this context, understanding the storage and release of water from the high alpine environment is an urgent research need.

The Big Thaw project aims to fill four observational gaps to improve intelligence relating to mountain water resource availability, with runoff being a key element. To supplement and inform modelling, a series of very low-cost wildlife cameras was installed in the Rofental region of the Austrian Alps, and programmed to obtain short videos of meltwater-fed rivers between three and four times a day. The videos were analysed and processed to provide a time series of streamflow using a Space Time Imaging Velocimetry (STIV) technique.

This presentation describes the success of this approach, as well as challenges relating environmental conditions, morphological change and the practicalities of operating low-cost sensors for long periods in harsh environments.

How to cite: Everard, N., Rickards, N., Islam, N., Barr, A., and Pritchard, H.: Trailcam Hydrology – Can very low-cost wildlife cameras be used to monitor streamflow in an Alpine environment?, EGU General Assembly 2026, Vienna, Austria, 3–8 May 2026, EGU26-18420, https://doi.org/10.5194/egusphere-egu26-18420, 2026.

EGU26-18858 | ECS | Orals | HS2.1.5

Snow-hydrological validation of undercatch corrected precipitation across alpine regions in Austria 

Caroline Ehrendorfer, Philipp Maier, Sophie Lücking, Thomas Pulka, Fabian Lehner, Mathew Herrnegger, Herbert Formayer, and Franziska Koch

Stationary precipitation measurements are frequently affected by undercatch errors, which are particularly pronounced in cold and alpine regions with strong winds. Since gridded precipitation products used in land surface modelling are often derived from spatial interpolation of meteorological station data, these measurement errors propagate directly into gridded datasets. Hydrological models provide a powerful tool for validating precipitation products through their integration of multiple water balance components. In this study, we develop a monthly undercatch correction product for Austria using Generalized Additive Models (GAMs) trained on station observations with geographical exposure and terrain elevation as predictors (R² > 0.76 in cross-validation), and apply these corrections to existing gridded precipitation datasets.

We validate the undercatch correction using the conceptual rainfall-runoff model COSERO across Austria and in two high-alpine reservoir catchments (Kölnbrein and Schlegeis). Austrian-wide simulations demonstrate elevation-dependent improvements, with reduced runoff biases particularly in catchments above 1500-2000 m elevation. In the alpine case study regions, the corrected precipitation closes the long-term water balance where uncorrected data showed deficits exceeding 20 %. The physically-based snowpack model Alpine3D, validated against stereo-satellite observations, shows substantial improvements in snow depth simulations with median biases decreasing from -0.87 m to +0.15 m. Additionally, the correction improves representation of snow melt-out behaviour during the ablation season and enables more realistic simulation of long-term glacier volume changes. These results highlight the importance of accounting for undercatch errors in high-alpine terrain and demonstrate the value of comprehensive hydrological validation for precipitation products.

Acknowledgements: We thank the Austrian Climate Research Programme (ACRP), and the Verbund Energy4Business GmbH for funding, fruitful discussions and providing us with data.

How to cite: Ehrendorfer, C., Maier, P., Lücking, S., Pulka, T., Lehner, F., Herrnegger, M., Formayer, H., and Koch, F.: Snow-hydrological validation of undercatch corrected precipitation across alpine regions in Austria, EGU General Assembly 2026, Vienna, Austria, 3–8 May 2026, EGU26-18858, https://doi.org/10.5194/egusphere-egu26-18858, 2026.

In the mountainous regions of Armenia, the formation of maximum river flow is heavily influenced by seasonal snowmelt processes. For small and medium-sized river basins, which often lack ground-based gauging stations, understanding the timing and duration of snow cover is critical for flood risk assessment and water resource management. This study focuses on monitoring snow cover patterns over the last decade using Sentinel-2 satellite data.

The research utilizes the Normalized Difference Snow Index (NDSI) to accurately identify snow-covered areas across diverse topographic gradients. The primary objective is to establish a 10-year baseline for snow phenology, specifically identifying the "First Snow Day" (onset) and the "Last Snow Day" (melt-off) for several pilot basins in Armenia. By processing multi-temporal image stacks through Google Earth Engine (GEE), the study analyzes the rate of snow depletion during the spring season.

The research aims to quantify the inter-annual variability in snow duration as a function of shifting temperature patterns and elevation gradients. By establishing this 10-year baseline, the study expects to demonstrate that the timing of the final snowmelt can serve as a primary proxy indicator for predicting maximum flows in ungauged catchments. This remote sensing approach intends to provide a robust, cost-effective alternative to traditional monitoring, offering a scalable tool for modeling peak flows in data-scarce environments. Ultimately, the integration of these satellite-derived snow dynamics into hydrological frameworks will enhance the accuracy of flood risk mapping.

How to cite: Khachatryan, S. and Sarukhanyan, A.: Spatiotemporal analysis of snow cover dynamics in small and medium-sized mountainous basins of Armenia using satellite imagery, EGU General Assembly 2026, Vienna, Austria, 3–8 May 2026, EGU26-18968, https://doi.org/10.5194/egusphere-egu26-18968, 2026.

EGU26-19626 | ECS | Orals | HS2.1.5

Transit times and governing processes in high-mountain wetlands 

Anthony C. Ross, Ben C. Howard, Braulio Lahuatte, Paola Fuentes, Bert De Bievre, Mateo Jerves, Patricio Crespo, Nilton Montoya, Jasper Oshun, and Wouter Buytaert

High-mountain wetlands have the potential to store and release large volumes of water, providing crucial supplies to highland communities and receiving lowlands, especially in seasonally dry climates due to their flow regulation capacity and extended residence times. Despite their significance to mountain hydrology and water resources, gaps remain in understanding the connection between wetlands and streams. This study uses a combination of fluorescent tracing and high frequency monitoring of rainfall-runoff and wetland water levels to assess the movement and timing of flow through wetlands. The experiments were conducted during the wet or dry season in 5 representative study catchments (0.38 km2 – 12.58 km2) with varying wetland coverage, from Northern Ecuador to Southern Peru. Fluorescein was introduced into wetlands and monitored downstream with activated carbon samplers for 5-12 months. Our results suggest transit times from less than 1 week to upwards of 3 ½ months, with one experiment seeing little to no response. Results indicate that wetlands are likely far more hydrologically connected to streams in the wet season than in the dry season, where in some cases they may not be connected at all. Several peaks in fluorescein concentration during the wet season may suggest that the wetlands contribute to streamflow via multiple pathways. The potential lack of fluorescein response at one site could indicate a very high transit time or that the wetlands did not feed the stream at the monitored locations during the monitoring period. The results demonstrate a complex connection between wetlands and streams depending on location and season, amongst other factors. However, persistent contributions from wetlands to streams observed several months after dye introduction support their significance to downstream, year-round water supply. We discuss potential hypotheses for divergent wetland behaviours and provide a baseline for further investigation.

How to cite: Ross, A. C., Howard, B. C., Lahuatte, B., Fuentes, P., De Bievre, B., Jerves, M., Crespo, P., Montoya, N., Oshun, J., and Buytaert, W.: Transit times and governing processes in high-mountain wetlands, EGU General Assembly 2026, Vienna, Austria, 3–8 May 2026, EGU26-19626, https://doi.org/10.5194/egusphere-egu26-19626, 2026.

EGU26-19972 | Posters on site | HS2.1.5

Exploring diel streamflow variations in an alpine headwater catchment 

Klaus Vormoor, Herzog Anna, Francke Till, and Bronstert Axel

During rain-free periods, and in catchments without considerable human intervention, diel streamflow cycles are characterized by distinctive patterns of rising and falling streamflow over the course of day. This dynamic is mainly driven by variations in solar radiation leading to an impact of snow and glacier melt, and evapotranspiration (ET) on diel streamflow cycles in alpine catchments. However, there are also other processes such as thermal expansion of water and streamflow-groundwater exchange that can lead to variations in diel streamflow patterns.

In this study, we investigate diel streamflow cycles in the 12 km² sized Fundusbach headwater catchment of the Ötztaler Ache in the Eastern European Alps. Based on observation data from three water level loggers along the longitudinal river profile (installed in 2022), we aim to identify the relative role of meltwater, ET, and water temperature on diel streamflow cycles along the river profile to better understand the interaction of these ecohydrological processes both spatially and seasonally. Results reveal that throughout the year without snowfall, diel streamflow cycles are mainly driven by meltwater dynamics. However, isolating the meltwater impulse from the uppermost part of the catchment from the water level loggers further downstream, diel streamflow cycles highlight the potential influence of ET. In the next step, we aim to correlate these streamflow variations with water temperature to quantify the effects of thermal expansion and the potential impact of water exchange between streamflow and soil- and groundwater. 

How to cite: Vormoor, K., Anna, H., Till, F., and Axel, B.: Exploring diel streamflow variations in an alpine headwater catchment, EGU General Assembly 2026, Vienna, Austria, 3–8 May 2026, EGU26-19972, https://doi.org/10.5194/egusphere-egu26-19972, 2026.

EGU26-20444 | Posters on site | HS2.1.5

Groundwater storage in alpine catchments and response to climate change: the importance of geology and snow cover 

Marie Arnoux, Antoine Carron, Landon J.S. Halloran, Claire Carlier, Fabien Cochand, Philip Brunner, Bettina Schaeffli, Tristan Brauchli, Adam Winstral, and Daniel Hunkeler

Alpine areas play a major role in the water supply of downstream valleys by releasing water, and especially during dry periods. The response of catchment discharge to climate change can be significantly influenced by groundwater processes. However, these processes are still poorly understood in Alpine areas. 

In this study, we use isotopic monitoring of a small alpine catchment to investigate the evolution of snowpack isotopic composition and its implications for groundwater recharge assessment. The results highlight the dominant contribution of snowmelt to recharge processes in the studied alpine catchment located in the Swiss Alps. This finding is critical for improving the evaluation of alpine hydrological responses under future climate change.

Then, we apply an integrated surface–subsurface hydrological model to assess the role of groundwater in buffering future summer low flows and to provide new insights into the influence of geological controls on discharge dynamics. The spatially explicit modelling framework enables the quantification of groundwater storage and its variability across different geological units within an alpine catchment under both present and future climate conditions. In parallel, conceptual hydrological models are used to assess future changes in spring discharge in different alpine settings, these resources being particularly relevant for drinking water supplies. The used climate scenarios were CH2018 RCP 8.5 and 4.5.

The results suggest that under future extreme climate change conditions: the average groundwater storage in quaternary deposits at the catchment scale increases in winter and decreases in summer as well as spring and catchment discharges. Annual groundwater storage for the entire catchment decreases due to a reduction in mean annual groundwater recharge, and total catchment discharge also decreases. In relative terms, the modelled decrease in groundwater storage was less severe than the simulated decrease in discharge in the analysed climate change scenarios. This study demonstrates that both quaternary deposits (especially moraine and talus units) and bedrock play an important role in sustaining discharge during low-flow periods.

How to cite: Arnoux, M., Carron, A., Halloran, L. J. S., Carlier, C., Cochand, F., Brunner, P., Schaeffli, B., Brauchli, T., Winstral, A., and Hunkeler, D.: Groundwater storage in alpine catchments and response to climate change: the importance of geology and snow cover, EGU General Assembly 2026, Vienna, Austria, 3–8 May 2026, EGU26-20444, https://doi.org/10.5194/egusphere-egu26-20444, 2026.

High-altitude tropical ecosystems, such as the Andean Páramo, play a fundamental role in regional hydrological regulation and the provision of essential ecosystem services.Traditionally, the characterization of these rainfall-runoff systems has focused on terrestrial catchment controls—including vegetation-soil complexes, topographic gradients, and hydrogeological baseflow—to understand water movement within the Area of Interest (AOI). However, the corresponding 'precipitation watershed' (the atmospheric moisture source) remains largely uncharacterized in terms of its own hydrological drivers. While terrestrial basins characterize their hydrological response through discharge dynamics and evapotranspiration fluxes, the precipitation watershed is effectively probed through a stable isotope approach to decouple its governing controls—such as precipitation amount, temperature, and altitude—encoded within the meteoric isotopic signature.

Addressing this gap, this investigation utilizes the WAM-2Layers Eulerian moisture tracking model to characterize the hydrological drivers and transport pathways for the Chingaza Páramo 'precipitationshed'. This integrated tracking approach provides the essential provenance context required to interpret isotopic data from both geographic and hydrological perspectives, allowing for a comprehensive evaluation of how moisture origin and transport history are manifested within the environmental signature of meteoric waters. To ensure model consistency, isotopic data were collected at dual daily and monthly frequencies, purposefully aligned with the temporal timestamps and 'sink' settings of the WAM-2Layers model.

By leveraging this spatio-temporal alignment, the study analyzed isotopic compositions concurrently with the precipitation, elevation, and temperature history along the moisture trajectories en route to the Chingaza Páramo. The integration of these variables into novel hydrological driver archetypes enabled a detailed characterization of the atmospheric environmental signature. Preliminary results demonstrate the robustness of this classification framework when mapped against the Global Meteoric Water Line (GMWL). For the monitored period, the daily sampling characterization identified a dominance of warm-source trajectories (63%), followed by mixed (19%) and cold-source (16%) archetypes, with moisture provenance primarily originating from the Atlantic Ocean. The distribution of these samples within the stable isotope biplot (d18O vs. d2H) effectively illustrates the transition between enrichment and depletion phenomena, underscoring the potential of this approach to quantify the influence of atmospheric drivers on Andean meteoric water behavior.

How to cite: Piña, A. and Romero, P.: Characterizing Hydrological Drivers of the Andean Precipitationshed: Integrating Moisture Tracking and Stable Isotopes to Disentangle Precipitation Amount, Altitude, and Temperature Effects., EGU General Assembly 2026, Vienna, Austria, 3–8 May 2026, EGU26-20483, https://doi.org/10.5194/egusphere-egu26-20483, 2026.

EGU26-4553 | Posters on site | HS2.1.9

Influence of river network representation on discharge and flooding in kilometre-scale CaMa-Flood simulations across Australia  

Filippo Nelli, Christopher Pickett-Heaps, Fitsum Woldemeskel, Foad Brakhasi, Katayoon Bahramian, Jiawei Hou, Ulrike Bende-Michl, and Wendy Sharples

Australian catchments exhibit diverse hydrological responses across climates, ranging from humid tropical and temperate systems to arid regions with intermittent rivers. Accurately representing this diversity requires river routing models that resolve drainage connectivity, floodplain storage and travel times at high spatial resolution. In this study, we present a novel approach using an Australia wide CaMa-Flood configuration at ~1.5 km (1 arc-minute) resolution, using MERIT-Hydro and Australian Geofabric DEMs to parameterize drainage networks and river geometry

The routing system is driven by projected runoff from the Bureau of Meteorology's operational Australian Water Resources Assessment (AWRA) model, enabling multi-decadal simulations of river discharge and floodplain dynamics across contrasting hydro-climatic regimes. To allow investigating effects of hydrography-driven differences in discharge, water level and inundation, we perform paired CaMa-Flood simulations using identical AWRA runoff. We compare (i) a river network derived from the MERIT digital elevation model and (ii) the Australian Geofabric river network and attributes.

We investigate a range of river systems including low-gradient floodplains, endorheic basins and ephemeral river systems, where flow intermittency and channel–floodplain interactions strongly control downstream hydrological behaviour. Modelled discharge and water levels are evaluated against in situ streamflow and stage gauge observations, while simulated flood extents are compared with satellite-based inundation maps derived from ICEYE synthetic aperture radar imagery. Model behaviour is analysed across representative catchments spanning tropical monsoonal, temperate, semi-arid and arid climates to identify scale-dependent controls on hydrological response. We further assess numerical stability and computational performance to quantify the feasibility of kilometre-scale routing for large-domain and ensemble applications. 

Our results demonstrate that high-resolution routing substantially improves representation of river connectivity and flood dynamics, particularly in dryland environments, providing a robust framework for catchment-scale hydrological analysis and climate-impact studies including future flood-risk assessment and across diverse Australian environments. Future developments will extend this framework through coupling with ocean circulation models to assess the combined influence of tides and storm surge on coastal flood hazard, enabling the evaluation of compound river-coastal flooding processes.

How to cite: Nelli, F., Pickett-Heaps, C., Woldemeskel, F., Brakhasi, F., Bahramian, K., Hou, J., Bende-Michl, U., and Sharples, W.: Influence of river network representation on discharge and flooding in kilometre-scale CaMa-Flood simulations across Australia , EGU General Assembly 2026, Vienna, Austria, 3–8 May 2026, EGU26-4553, https://doi.org/10.5194/egusphere-egu26-4553, 2026.

Understanding how small-scale processes interact to shape ecosystem development at landscape scales remains a major challenge in environmental science, particularly in post-mining environments where belowground processes are difficult to measure and manipulate. To address this, we established FALCON (2019), an array of four hydrologically isolated artificial catchments (0.25 ha each) in a post-coal mining area in Czechia, enabling controlled, landscape-scale experimentation. Two catchments were reclaimed by leveling and planting alder, while two were left to spontaneous succession on wave-like microtopography. Each catchment is fully instrumented to monitor water, nutrient, gas, and energy fluxes, and includes lysimeters to link small-scale processes to catchment-scale responses. Early studies demonstrate that erosion and deposition strongly control microhabitat formation, with wave-like topography generating pronounced heterogeneity in soil texture, hydrology, and water retention  while homogenization prevail in flat catchments. These processes support surface run off in reclaimed and subsurface run off in unreclaimed catchments. Carbon flux measurements show rapid ecosystem recovery at both reclaimed and unreclaimed sites, with all catchments transitioning from CO₂ sources to sinks within four years; differences between treatments shifted from being driven by soil physical properties to vegetation productivity as alder established. Lysimeter-based assessments indicate that surface water fluxes and evapotranspiration can be reasonably upscaled, particularly in unreclaimed sites, but subsurface flow and solute transport remain poorly represented. Overall, FALCON provides a unique platform to experimentally link erosion, hydrology, biogeochemistry, and carbon exchange across scales

How to cite: Bartuška, M. and Frouz, J.: Large experimental fully hydrologically isolated catchment as a tool to study hydrological and ecological processes on multiple scales , EGU General Assembly 2026, Vienna, Austria, 3–8 May 2026, EGU26-6970, https://doi.org/10.5194/egusphere-egu26-6970, 2026.

EGU26-7089 | Posters on site | HS2.1.9

Critical zone studies in pre-alpine climate 

Vesna Zupanc, Matic Noč, Urša Pečan, Nejc Golob, Matjaž Glavan, Rok Kuk, Marina Pintar, Tjaša Pogačar, Špela Železnikar, Vid Žitko, Zala Žnidaršič, Luka Žvokelj, and Rozalija Cvejić

Weighing monolith lysimeters enable precise measurement of water balance parameters, including infiltration, evapotranspiration, and deep percolation as well as studies of solute fluxes within the complex soil–plant–atmosphere continuum. At the experimental field of the Biotechnical Faculty, University of Ljubljana, two monolith lysimeters were installed to study solute transport and to measure evapotranspiration. In addition to the installed lysimeters, an advanced meteorological station is located at the same site, enabling measurement of other meteorological variables required for calculating evapotranspiration. To expand and establish a critical zone research site, the lysimeter station was equipped with two cosmic ray neutron sensors for proximity moisture sensing, as well as sampling points for drainage water and groundwater quality. The research center serves as a focal point for soil water balance studies in the peri-urban area of a pre-Alpine climate in central Slovenia, and is a part of SI-COSMOS network that spreads across the Continental, Alpine, Karst, Mediterranean, and Pannonian regions. Biotechnical faculty critical zone research field enables quantification of hydrological processes that control the upper critical zone water balance and contaminant transport under changing climate conditions. Evaluation after the first decade of operation shows that advances in weighing technology, lower boundary condition control, and data processing have made high-precision lysimeters very useful tools; however, they require intensive, regular maintenance to ensure data quality. Drainage water monitoring indicates favorable water quality conditions for developing circular water and nature based solutions in per-urban agricultural landscape.
Acknowledgements: This research was partially supported by ARIS research programme P4-0085, IC RRG-AG (IO-0022-0481-001), Interreg Alpine Space program, project Alpine Space Drought Prediction (A-DROP) (grant number 101147797), European Union – LIFE Programme (LIFE23-IPC-SI-LIFE4ADAPT), OPTAIN Horizon 2020 (grant number 862756), and the Slovenian CAP Strategic Plan 2023–2027 (grant number 33126-3/2025/23).

How to cite: Zupanc, V., Noč, M., Pečan, U., Golob, N., Glavan, M., Kuk, R., Pintar, M., Pogačar, T., Železnikar, Š., Žitko, V., Žnidaršič, Z., Žvokelj, L., and Cvejić, R.: Critical zone studies in pre-alpine climate, EGU General Assembly 2026, Vienna, Austria, 3–8 May 2026, EGU26-7089, https://doi.org/10.5194/egusphere-egu26-7089, 2026.

EGU26-7113 | ECS | Orals | HS2.1.9

Integrating microbiome responses across warming experiments in coastal marshes 

Johanna Schwarzer, Susanne Liebner, Alexander Bartholomäus, Ella Lu Logemann, Julian Mittman- Goetsch, Kai Jensen, Simon Thomsen, J. Patrick Megonigal, Roy Rich, Genevieve Noyce, and Peter Mueller


Coastal marshes are critical carbon sinks in the global carbon system, yet rising temperatures may alter microbial processes that regulate carbon and nutrient cycling. In a recent ex-situ warming experiment conducted in the Climate Change Marsh Mesocosm Facility (CCMMF) at the University of Hamburg, Germany, we could show that warming can alter soil microbial communities, and that responses vary with environmental context, such as plant community diversity and ecosystem age. We also found that warming favored microbial taxa with traits supporting plant growth and nutrient cycling. Here, we expanded our analysis and included microbial 16S rRNA gene sequencing data sets from two in-situ coastal marsh warming experiments: MERIT (“Marsh Ecosystem Response to Increased Temperatures”) in northern Germany and SMARTX (“Salt Marsh Accretion Response to Temperature eXperiment”) in a brackish marsh on Chesapeake Bay, USA. By this, we combined three genetic microbial data sets of coastal marshes characterized by different soil type, ecosystem age, vegetation type, tidal regime, and soil carbon and nitrogen stocks.

We will show how warming-induced shifts in microbial community relate to ecological parameters across sites building on the hypothesis that microbial responses to warming vary strongly with vegetation composition and ecosystem age. With this meta study, we will be able to identify key factors controlling microbial responses to experimentally increased temperatures to better understand how climate change reshapes microbial composition and thereby carbon dynamics in coastal wetlands.

How to cite: Schwarzer, J., Liebner, S., Bartholomäus, A., Logemann, E. L., Mittman- Goetsch, J., Jensen, K., Thomsen, S., Megonigal, J. P., Rich, R., Noyce, G., and Mueller, P.: Integrating microbiome responses across warming experiments in coastal marshes, EGU General Assembly 2026, Vienna, Austria, 3–8 May 2026, EGU26-7113, https://doi.org/10.5194/egusphere-egu26-7113, 2026.

EGU26-9220 | Posters on site | HS2.1.9

WATCH / Time2WATCH projects towards the implementation of a permanent observatory of groundwater in Kenya – A first hydrogeological model of the Chyulu Hills 

Helene Celle, Julie Albaric, Yael Barre-Rolland, Stéphanie Gautier, Yanni Gunnell, Jean-Christophe Ianigro, Ian Kaniu, Jacques Marteau, Agnes Mbugua, François Mialhe, Patrick Murunga, Oldrich Navratil, Pierre Nevers, Edwin Nyaga, Lydia Olaka, Lydia Roos, Christel Tiberi, Matias Tramontini, and Dennis Waga

In semi-arid southern Kenya, the Chyulu Hills consist of an alignment of Quaternary scoria cones and basaltic lava flows. This ~80-km-long, NW–SE volcanic fissure vent hosts underground water resources of importance to the local rural population and the savanna ecosystems. The subvolcanic topography allows groundwater to flow south and east, resulting in a line of springs along the base of the hills. Several springs are partially tapped to supply water for drinking water and farming activities. Mzima spring, in the south, yields 70% of the total outflow of the Chyulu Hills watershed, and 10% of Mzima water is diverted from its local use to supply the city of Mombasa, 200 km to the southeast. This generates conflict between local residents and regional water resource authorities. It is therefore crucial to quantify the water resources of the Chyulu Hills and establish to what extent these are suitable for sustainably supplying the local and wider regional population in the future, in a context of global change. The WATCH and Time2WATCH projects (2024–2026), funded by the Centre National de la Recherche Scientifique (France), aim to assess and monitor Chyulu-wide water budgets by setting up a multidisciplinary observatory combining meteorological, geophysical, geological, hydrogeological, and land use/land cover evaluations. This observatory was elaborated in close collaboration between Kenya (University of Nairobi, Technical University of Kenya, Regional Centre on Groundwater Resources Education, Training & Research) and France (Université Lumière Lyon 2, Université Claude Bernard Lyon 1, Université Marie and Louis Pasteur, Université de Montpellier, Sorbonne Université). The present contribution mainly focuses on preliminary hydrochemistry results. Their integration across the entire observatory provides the first functional insights into the Chyulu Hills groundwater system.

How to cite: Celle, H., Albaric, J., Barre-Rolland, Y., Gautier, S., Gunnell, Y., Ianigro, J.-C., Kaniu, I., Marteau, J., Mbugua, A., Mialhe, F., Murunga, P., Navratil, O., Nevers, P., Nyaga, E., Olaka, L., Roos, L., Tiberi, C., Tramontini, M., and Waga, D.: WATCH / Time2WATCH projects towards the implementation of a permanent observatory of groundwater in Kenya – A first hydrogeological model of the Chyulu Hills, EGU General Assembly 2026, Vienna, Austria, 3–8 May 2026, EGU26-9220, https://doi.org/10.5194/egusphere-egu26-9220, 2026.

EGU26-12381 | Orals | HS2.1.9

Infrastructures – a primer for the Critical Zone 

Martyn Futter, Ulf Grandin, Dolly Kothawala, Holger Villwock, Marcus Wallin, James Weldon, and Blaize Denfield

This presentation will articulate a metaphor about painting. If it is successful, you should be convinced that there are things out there that, if we made better use of them, would significantly enhance our understanding of the critical zone. Before working on the actual painting, most artists apply one or more coats of primer. In most finished paintings, you don’t see the primer, but without it, the painting would likely not be as good. Just because we don’t usually think about the primer doesn’t mean it isn’t there. 


One can make the same argument for monitoring and research infrastructures; hopefully you can be convinced that infrastructures could provide the primer behind the critical zone painting. Infrastructures such as the International Cooperative Programme on Integrated Monitoring of Air Pollution Effects (ICP-IM) collect, curate and report monitoring data to assess compliance with European legislation. In some ways, the data they collect are a by-product or intermediary step in regulatory assessments. However, these long-term, standardized, well curated and increasingly open access data series can be a resource in and of themselves as well as providing vital context for new data collection.


Some infrastructures, e.g., the Swedish Infrastructure for Ecosystem Science (SITES) and the Integrated European Long-Term Ecosystem, critical zone and socio-ecological system Research Infrastructure (eLTER) not only collect and curate environmental data, they function as a platform to support field sampling and experiments across multiple ecosystems and spatial scales. The background monitoring data collected by the infrastructure enhances the scientific value of these experiments. Platforms can also help to grow networks by providing the opportunity for people to work together on new questions, such as in the global Aquatic Mesocosm network (AQUACOSM).


Often, the role of these networks, platforms and infrastructures is mentioned in the acknowledgements, if at all. Even if they are not visible, they are vital. The future of infrastructures and platforms is not guaranteed. If we as a community make more use and highlight what they have to offer, it helps them to secure their future and to give us a primer for our scientific canvas.

How to cite: Futter, M., Grandin, U., Kothawala, D., Villwock, H., Wallin, M., Weldon, J., and Denfield, B.: Infrastructures – a primer for the Critical Zone, EGU General Assembly 2026, Vienna, Austria, 3–8 May 2026, EGU26-12381, https://doi.org/10.5194/egusphere-egu26-12381, 2026.

EGU26-12631 | Orals | HS2.1.9

Lessons learned from a long-term manipulation experiment in a semi-arid savanna ecosystem 

Laura Nadolski, Sinikka Paulus, Bayu Hanggara, Richard Nair, Tarek El Madany, Arnaud Carrara, Mirco Migliavacca, Markus Reichstein, and Sung-Ching Lee

Semi-arid ecosystems dominate the interannual variability and trend of the terrestrial carbon sink. They are sensitive to anthropogenic environmental changes, including shifts in the nitrogen (N) to phosphorus (P) ratio driven by increasing N deposition.

In 2015, a large-scale fertilization experiment was established at Majadas de Tiétar, a tree-grass ecosystem in western Spain. Three eddy covariance towers operate simultaneously at the site: one serves as unfertilized control plot, one measures an area fertilized with N, and the third samples an area with N and P addition. This setup provides an exceptional opportunity to study the long-term influence of altered N:P ratios on ecosystem functioning. Flux measurements are complemented by a variety of other instruments, such as lysimeters, mini-rhizotrons, soil chambers, soil sensors, phenocams and proximal sensing instruments. The comprehensive measurement setup at Majadas de Tiétar therefore enables a deeper understanding of the trends and interactions among climate change, nutrient availability and the biogeochemical cycles of carbon, N, and P in semi-arid ecosystems.

We found that both fertilization schemes increased carbon uptake, and that N+P addition enhanced the water use efficiency more than N-only addition. Fertilization also increased the inter-annual variability of net ecosystem exchange (NEE) and altered the sensitivity of seasonal NEE to its drivers. However, water limitation in summer and energy limitation in winter overweighed fertilization effects at the seasonal scale.

How to cite: Nadolski, L., Paulus, S., Hanggara, B., Nair, R., El Madany, T., Carrara, A., Migliavacca, M., Reichstein, M., and Lee, S.-C.: Lessons learned from a long-term manipulation experiment in a semi-arid savanna ecosystem, EGU General Assembly 2026, Vienna, Austria, 3–8 May 2026, EGU26-12631, https://doi.org/10.5194/egusphere-egu26-12631, 2026.

EGU26-12900 | ECS | Posters on site | HS2.1.9

Hydro-ecological controls of dissolved organic carbon dynamics and greenhouse gas emissions in a temperate peatland: A multi-disciplinary collaboration in the Frasne peatland observatory (Jura Mountains, France) 

Noémie Poteaux, Alexandre Lhosmot, Marc Steinmann, Robin Calisti, Adrien Jacotot, Sarah Coffinet, Philippe Binet, Anne Boetsch, Marie-Laure Toussaint, Lilian Joly, Nicolas Dumelie, Jean-Louis Bonne, Laurent Longueverne, Marie-Noelle Pons, Christophe Loup, and Guillaume Bertrand

Peatlands are increasingly recognized as key components of the Critical Zone (CZ) - the thin layer at the surface of the Earth where major biogeochemical reactions occur - , because they tightly integrate, within a single ecosystem, hydrological, biological, and carbon cycle processes that all impact each other. Although they cover only about 3% of the global continental surface, they store over 30% of global soil organic carbon, highlighting their long-term role as carbon sinks, largely due to permanent water saturation and specific vegetation. However, climate change is increasingly disrupting the hydroecological balance of peatlands, potentially converting them from carbon sinks into sources of greenhouse gases (GHGs) and dissolved organic carbon (DOC).              
In this study, we adopted an approach using innovative techniques developed within the TERRA FORMA initiative of the French OZCAR CNRS research infrastructure. Our work was focused on a temperate 7-hectare peatland (Frasne, French Jura Mountains) hosting a long-term Critical Zone observatory (SNO Tourbières) to unravel the mechanisms underlying the continuum of DOC production, mineralization and export to the atmosphere as GHGs (CO₂ and CH₄). Spatial variability in DOC quality - including aromaticity, molecular weight, and microbial origin - was compared to hydrological gradients, vegetation types and atmospheric GHG concentrations, the latter measured by drone surveys and ground-based accumulation chambers.              
The results indicate a preferential production of recalcitrant DOC in the upstream part of the peatland, where conifers dominate the vegetation. In contrast, biochemical markers reveal intense microbial decomposition of organic carbon in the more frequently flooded downstream zones, producing DOC that is lower in concentration, less aromatic, and more labile. This area coincides with higher GHG concentrations in the overlying atmosphere, suggesting that the labile DOC is readily transformed into GHGs. This pattern is hypothesized to result from the presence of less aromatic molecules originating from vascular plants and Sphagnum moss exudates formed under anaerobic conditions, in areas where the water table is close to the surface. With declining Water Table Depth (WTD), this more labile carbon becomes exposed to aerobic conditions, enhancing microbial respiration and promoting GHG emissions.
Lateral DOC export at the outlet of the peatland is strongly controlled at seasonal scale: export increases in spring and autumn during WTD transitions, with generally higher fluxes in winter when the water table is near the surface. In the context of climate change, with progressively wetter winters and drier summers, this pattern suggests a potential intensification of winter DOC export and higher atmospheric GHG emissions during summer, thus leading both to increased annual organic carbon exports. However, the model still needs to account for changes in vegetation type and productivity to fully capture future dynamics.
Overall, this study emphasizes that understanding such a complex environment requires strong integration across scientific disciplines. The integrative framework enabled by the OZCAR  research infrastructure provides a robust foundation for a better understanding of peatland carbon dynamics at different spatial scales.

How to cite: Poteaux, N., Lhosmot, A., Steinmann, M., Calisti, R., Jacotot, A., Coffinet, S., Binet, P., Boetsch, A., Toussaint, M.-L., Joly, L., Dumelie, N., Bonne, J.-L., Longueverne, L., Pons, M.-N., Loup, C., and Bertrand, G.: Hydro-ecological controls of dissolved organic carbon dynamics and greenhouse gas emissions in a temperate peatland: A multi-disciplinary collaboration in the Frasne peatland observatory (Jura Mountains, France), EGU General Assembly 2026, Vienna, Austria, 3–8 May 2026, EGU26-12900, https://doi.org/10.5194/egusphere-egu26-12900, 2026.

Snowmelt-driven watersheds provide water for billions of people, yet warming temperatures threaten to reduce streamflow across these regions. One pathway for greater water loss is through increased evapotranspiration (ET), particularly during the warm summer growing months. However, the magnitude of summer transpiration and the water sources accessed by vegetation remain poorly understood. While snowmelt is the primary driver for peak runoff and supplies soil moisture for early summer transpiration, vegetation water use and its influence on summer baseflow are less well understood.

To study this pathway, we instrumented an 81 ha headwaters micro-catchment in the Upper Colorado River Basin (UCRB), where ET represents the largest annual water flux. This site includes eddy-flux towers, stream gages, shallow groundwater wells, sap-flux sensors, and a dense soil-moisture network. High-resolution eddy-flux observations show how ET is sustained even during extended summer droughts. Over three growing seasons, daily fluctuations in soil moisture, groundwater, and streamflow indicate roots intercept shallow groundwater to support the continued transpiration during these dry periods.

We extended this analysis basin wide across 18 headwaters catchments and observed that summer growing season conditions independently regulate streamflow, with effects rivaling those of snowpack. Warm summers suppress streamflow, causing high-snowpack years to be near-average, while cool summers elevate flow.

Together these results demonstrate upland vegetation suppresses summer streamflow in mountain headwaters by sustaining transpiration through shallow groundwater access during hot, dry periods. As warming continues, this vegetation-groundwater pathway will intensify summer streamflow declines across mountain regions, with significant implications for future water availability and management.

How to cite: Stone, H. and Maxwell, R.: Not Just Snowpack: Vegetation-Groundwater Controls on Summertime Streamflow in Colorado River Headwaters, EGU General Assembly 2026, Vienna, Austria, 3–8 May 2026, EGU26-14762, https://doi.org/10.5194/egusphere-egu26-14762, 2026.

EGU26-15714 | Posters on site | HS2.1.9

Manipulation to prediction: integrating flood experiments and AI to understand coastal forest mortality 

Peter Regier, Ben Bond-Lamberty, Pat Megonigal, Ben Sulman, Nicholas Ward, and Vanessa Bailey

Rising sea levels and intensifying storms are driving increased flooding and salinization of coastal forests, yet the mechanistic pathways linking belowground disturbances to forest mortality remain poorly constrained. We designed an ecosystem-scale flood manipulation experiment in a coastal forest to disentangle the roles of inundation and salinity in initiating the hypothesized “tree mortality spiral”. Our experimental plots are outfitted with an extensive array of sensors to complement high resolution sampling campaigns, allowing us to observe immediate and lagged responses to flooding. Experimental flooding drove rapid, consistent shifts in soil biogeochemistry indicative of oxygen stress and altered carbon cycling, followed by a lagged response in aboveground vegetation. The temporal disconnect between belowground process thresholds and observable forest impacts demonstrates how manipulative experiments can benchmark the early stages of transitions in the coastal Critical Zone. 

Building on our field-based findings and substantial AI-ready datasets produced over multiple years of flooding experiments, we are developing a coupled modeling framework that leverages both AI-based and process-based models to predict forest responses under future flooding regimes. Through this integrated approach, we aim to understand how disturbance intensity, duration, and legacy effects propagate across time and space to control coastal forest resilience. The combination of controlled large-scale ecosystem manipulation and data-driven predictive modeling provides a framework for bridging disciplines and scales—linking soil biogeochemistry, ecohydrology, and vegetation dynamics—to improve projections of coastal forest mortality and its consequences for coastal Critical Zone carbon cycling.

How to cite: Regier, P., Bond-Lamberty, B., Megonigal, P., Sulman, B., Ward, N., and Bailey, V.: Manipulation to prediction: integrating flood experiments and AI to understand coastal forest mortality, EGU General Assembly 2026, Vienna, Austria, 3–8 May 2026, EGU26-15714, https://doi.org/10.5194/egusphere-egu26-15714, 2026.

EGU26-15787 | Posters on site | HS2.1.9

Investigating the Root Zone Critical Interface in Intensively Managed Critical Zones 

Ashlee Dere, Brian Saccardi, Jinyu Wang, Jennifer Druhan, Neal Blair, Lisa Welp, Timothy Filley, Martha Jimenez-Castaneda, Sean Schaeffer, Andrew Stumpf, Erin Bauer, James Haken, Isaac Noel, Kelly Deuerling, Alison Anders, Allison Goodwell, and Praveen Kumar

The Critical Zone (CZ) in the Midwestern United States has transformed from predominantly prairie landscapes to highly productive row-crop agriculture that requires intensive management such as tillage, tile drains and fertilizer inputs. The Critical Interfaces CZ Network (CINet) project focused on three critical interfaces that are important regulators of material storage, transport and transformation in the CZ: the near-land surface, the active root zone and the river corridor. To investigate the root zone critical interface, we established instrument clusters called MIRZ (Management Induced Reactive Zone) in Illinois and Nebraska on both agriculture and restored prairie land management. The study sites differ in climate and geology: Illinois has wetter conditions (100 cm MAP) with loess over glacial till and extensive tile drainage, while Nebraska is drier (78 cm MAP), formed in loess, and lacks artificial drainage. At each site, precipitation, soil porewater (sampled at 20, 60, 110, and 180 cm depths), surface waters, tile drains, groundwater and soil gases were collected biweekly. In addition, co-located sensors were installed to monitor soil moisture, temperature, electrical conductivity, oxygen, carbon dioxide, and meteorological conditions at hourly intervals. Bulk soil measurements included geochemistry, carbon/nitrogen concentrations, mineralogy, density and particle size. Key findings from the MIRZ root zone measurements suggest that land use strongly controls how quickly water moves through soils and how much geochemical alteration occurs before water reaches streams. Longer water residence times and greater water–mineral interaction occur in agricultural soils, whereas stronger soil structure and deeper root systems in restored prairies promote rapid infiltration and more limited geochemical alteration. The geochemical similarity between agricultural porewaters and stream or tile-drain waters highlights strong hydrologic connectivity and implies that agricultural land use fundamentally alters root-zone structure, water flow paths, and ultimately stream geochemistry at the watershed scale. The diverse and deeply rooted prairie vegetation also influences soil gases, with higher carbon dioxide production rates and enhanced seasonal variability in prairie soils compared to agricultural soils. The widespread conversion of Midwestern USA prairies to intensive agriculture has therefore altered solute, carbon, and gas fluxes throughout the root zone critical interface, including the depth and intensity of the reactive zone where weathering, nutrient cycling, and carbon storage occur.

How to cite: Dere, A., Saccardi, B., Wang, J., Druhan, J., Blair, N., Welp, L., Filley, T., Jimenez-Castaneda, M., Schaeffer, S., Stumpf, A., Bauer, E., Haken, J., Noel, I., Deuerling, K., Anders, A., Goodwell, A., and Kumar, P.: Investigating the Root Zone Critical Interface in Intensively Managed Critical Zones, EGU General Assembly 2026, Vienna, Austria, 3–8 May 2026, EGU26-15787, https://doi.org/10.5194/egusphere-egu26-15787, 2026.

EGU26-16343 | Orals | HS2.1.9

The future of critical zone research in Europe imbedded in eLTER research infrastructure 

Jérôme Gaillardet and Michael Mirtl

Although scientific disciplines are becoming increasingly specialised and expert, they nevertheless isolate themselves from one another. This is particularly evident in the study of the Earth's surface. Over time, the geosciences have diverged from ecology, despite the fact that the historical concept of ecosystem (Tansley, 1935) included both biotic and abiotic components. With time and investment from also compartmented institutions, this has led to independent communities developing parallel research and equipping themselves with field laboratories (long-term observatories): geosciences focusing on the biophysical components of water, relief, and soils, and ecology focusing on biodiversity. Even within geosciences, disciplines are isolated and have developed their own “dialects”.

The Critical Zone Initiative, which originated in the US in 2003, was an attempt to encourage these different Earth science communities to collaborate at the level of instrumented scales (Critical Zone Observatories). This initiative has expanded further in Europe, particularly through the SoilTrec FP7 programme (2009–2014), the CRITEX program in France (2022-2021) or the OZCAR and TERENO research networks in France and Germany respectively. Today, these divisions are no longer tenable. The deterioration of the planet's habitability means that we need to return to a much more systemic approach to habitats that support life, particularly humans and their societies. While disciplinary expertise, particularly in experimental developments and numerical modelling, is necessary, it is far from sufficient to understand how changes in biodiversity will affect biogeochemical cycles, water and food resources.

The eLTER (Long-Term Ecosystem, critical zone, and socio-ecological) Research Infrastructure represents a unique and even historic achievement to (re)connect scientific communities working in the field of environmental and sustainability sciences on continental surfaces. At a backbone of permanently operated sites, eLTER promotes a holistic approach from the local/regional to the continental and global scales. In this contribution, we will present eLTER and show how the list of eLTER Standard Observations selected, distributed across different layers or “spheres,” and the categorization of sites (with a focus on the geosphere and hydrosphere) make it possible to capitalize on the previous works of the critical zone community and enrich it with ecological measurements or socio-ecological practices (Zaccharias et al., 2025). The services offered by eLTER RI also exploit recent advances in critical zone modeling. They provide access to a network of sites spanning large environmental conditions open to transnational access and an open data base and hence a unique opportunity for the moving forward critical zone science, at the local to global scales.

eLTER is the European future of critical zone science.

Tansley, A. G. (1935). The use and abuse of vegetational concepts and terms. Ecology,16, 284–307.

Zacharias, S., Lumpi, T., Weldon, J., Dirnboeck, T., Gaillardet, J., Haase, P., ... & Mirtl, M. (2025). Achieving harmonized and integrated long-term environmental observation of essential ecosystem variables-eLTER's Framework of Standard Observations. Authorea Preprints.

How to cite: Gaillardet, J. and Mirtl, M.: The future of critical zone research in Europe imbedded in eLTER research infrastructure, EGU General Assembly 2026, Vienna, Austria, 3–8 May 2026, EGU26-16343, https://doi.org/10.5194/egusphere-egu26-16343, 2026.

EGU26-16646 | Orals | HS2.1.9

Revisiting the meanings of the Critical Zone through the OZCAR research infrastructure example, definitions and evolutions 

Damien Jougnot, Isabelle Braud, Julien Tournebize, Brice Boudevillain, Agnès Rivière, Jean Marcais, Eliot Chatton, Sylvain Pasquet, Julien Bouchez, Héloise Bénard, and Jérôme Gaillardet

Since its first definition by the National Research Council in 2001, the concept of Critical Zone has known undeniable success over the last quarter of a century. A success that is often reflected by the evolution and diversification of its meanings. Recently, Lee et al. (2023) proposed a review that literally focuses on “the meanings of the Critical Zone”. Through an extensive review of the literature across the disciplines and journals, they have identified three loosely overlapping meanings. An ontological meaning, where the Critical Zone is mostly seen as the Earth’s spatial interface where geochemical and biological activity sustains life. An epistemic meaning, where the Critical Zone is considered a product of collaborative efforts between scientific communities to build a whole-system knowledge data-base and library. And finally, an anthropocenic meaning, where the Critical Zone is the vulnerable home of the human species. In this contribution, we aim at revisiting these three meanings through the creation and development of the French network OZCAR (Critical Zone Observatories: Research and Application).

Created in 2015 to enhance the collaborations between Critical Zone observatories (Gaillardet et al., 2018), OZCAR is a French Research Infrastructure that gathers 23 national observation services and +120 study sites in metropolitan France and on 5 continents. If most observation services existed prior to the creation of OZCAR, we have seen major evolutions over the last decade as the OZCAR community developed and bloomed. Originally conceived as a spatial definition (ontological meaning), the “Critical Zone” words in OZCAR became a vast collaborative effort to develop the whole system approach and data base (epistemic meaning). It is now also fostering transformative research aimed at preserving our planet’s habitability, i.e., the giant spaceship in which we all live together (anthropocenic meaning).

References:

  • Lee, R. M., Shoshitaishvili, B., Wood, R. L., Bekker, J., & Abbott, B. W. (2023). The meanings of the Critical Zone. Anthropocene, 42, 100377.,doi:10.1016/j.ancene.2023.100377.
  • Gaillardet, J., Braud, I., Hankard, F., Anquetin, S., Bour, O., Dorfliger, N., et al. (2018). OZCAR: The French network of critical zone observatories. Vadose Zone Journal, 17(1), 1-24, doi:10.2136/vzj2018.04.0067.

How to cite: Jougnot, D., Braud, I., Tournebize, J., Boudevillain, B., Rivière, A., Marcais, J., Chatton, E., Pasquet, S., Bouchez, J., Bénard, H., and Gaillardet, J.: Revisiting the meanings of the Critical Zone through the OZCAR research infrastructure example, definitions and evolutions, EGU General Assembly 2026, Vienna, Austria, 3–8 May 2026, EGU26-16646, https://doi.org/10.5194/egusphere-egu26-16646, 2026.

EGU26-18719 | Posters on site | HS2.1.9

Connecting Ecosystems Across Scales: eLTER Standard Observations and Critical Zone Science 

Steffen Zacharias, Jaana Bäck, Jérôme Gaillardet, and Michael Mirtl

The European Long-Term Ecosystem, Critical Zone, and Socio-Ecological Research Infrastructure (eLTER RI) aims to provide a continental-scale, site-based network for observing, understanding, and addressing major ecological, geochemical, and socio-ecological challenges. A core element of eLTER RI is the implementation of the eLTER Standard Observations (SOs), which establish a harmonised framework for the systematic collection and analysis of long-term environmental data across a diverse range of ecosystems. Ensuring methodological consistency and interoperability by the SOs is imperative in order to create a shared observational basis. Such a basis is essential for large-scale synthesis and international collaboration, particularly within the context of Critical Zone Science.

The eLTER Standard Observations adopt a multidisciplinary perspective, integrating biological, hydrological, geochemical, climatic, soil-related, and socio-economic variables. Core thematic domains include biodiversity, primary production, water quality, nutrient and carbon cycling, soil processes, and climate dynamics. This integrated design explicitly supports Critical Zone Science by enabling the coupled analysis of processes spanning the Earth’s surface, from the vegetation canopy through soils and groundwater to the underlying geology, while simultaneously accounting for human influences. Standardisation across sites and regions ensures data comparability over space and time, facilitating cross-site analyses, model development, and the identification of patterns and drivers of change.

The SOs are closely aligned with the concept of Essential Variables (EVs) and cover key elements of Essential Climate Variables (ECVs), Essential Biodiversity Variables (EBVs), and Essential Socio-Economic Variables (ESVs). Through this coverage, the SOs provide a comprehensive observational foundation to assess ecosystem status, track long-term trends, and analyse human–nature interactions. By harmonising observations and explicitly linking Critical Zone processes to existing EV frameworks, eLTER strengthens connections between national and international research initiatives and enhances the contribution of European long-term ecosystem research to global observation systems.

This presentation will outline the scope, methodology, and scientific relevance of the eLTER Standard Observations, with a particular emphasis on their role in fostering international collaboration in Critical Zone Science. It will demonstrate how the SOs support integrative ecosystem research and contribute to addressing global challenges such as climate change, biodiversity loss, and sustainable resource management through coordinated, long-term, and comparable observations.

How to cite: Zacharias, S., Bäck, J., Gaillardet, J., and Mirtl, M.: Connecting Ecosystems Across Scales: eLTER Standard Observations and Critical Zone Science, EGU General Assembly 2026, Vienna, Austria, 3–8 May 2026, EGU26-18719, https://doi.org/10.5194/egusphere-egu26-18719, 2026.

EGU26-22054 | Posters on site | HS2.1.9

DELUGE - Disturbance and Ecohydrological Legacies in Upland Great-lakes Ecosystems: An Ecosystem Scale experiment to study coastal critical zone 

Inke Forbrich, Kennedy Doro, Avni Malhotra, Etienne Fluet-Chouinard, Prince Atiti, Alaina Foster, Evangelos Grammenidis, Roberta Peixoto, Fausto Machado-Silva, Roy Rich, Sacha Brewer, Cecilia Howard, Kenton Rod, Nicholas Ward, Michael Weintraub, Patrick Megonigal, and Vanessa Bailey

Coastal ecosystems along the Great Lakes play an important role in critical element cycling between land and lake ecosystems. Because lake water levels are highly dynamic, the dominant ecosystems (marsh, swamp, upland forest) constantly respond to the varying water line. Flood pulses are important controls on plant community zonation, as well as their respective biogeochemical functions, setting the boundary between herbaceous wetlands, forested wetlands, and/or upland forest based on the respective flooding tolerance. Because lake levels are predicted to increase in future decades (e.g. 2040-2049 vs. 2010-2019), shifts in ecosystem boundaries are expected but the change in ecosystem function is currently unknown.

To understand the impact these flood pulses have on soil biogeochemistry and plant function, we are implementing an ecosystem-scale manipulative experiment to create increasingly intense flood pulses by pumping water across an elevation gradient from forested wetland to upland (DELUGE - Disturbance and Ecohydrological Legacies in Upland Great-lakes Ecosystems). We follow a before-after-control-impact design using two diked parcels in the Ottawa National Wildlife Refuge at the coast of Lake Erie, one of which will be untreated and serve as a reference. The main objective is to gain a mechanistic understanding of how the effects of freshwater flooding and subsequent drainage propagate through water, soils, microbes, and plants to cause ecosystem state changes such as tree mortality and changes in biogeochemical cycling. Here we present the experimental design, site characterization, and results from sensor-based baseline measurements which started in June, 2025. Results from DELUGE will be incorporated into multi-scale process and Earth system models, with the overarching goal of an improved predictive understanding of coastal ecosystems.

How to cite: Forbrich, I., Doro, K., Malhotra, A., Fluet-Chouinard, E., Atiti, P., Foster, A., Grammenidis, E., Peixoto, R., Machado-Silva, F., Rich, R., Brewer, S., Howard, C., Rod, K., Ward, N., Weintraub, M., Megonigal, P., and Bailey, V.: DELUGE - Disturbance and Ecohydrological Legacies in Upland Great-lakes Ecosystems: An Ecosystem Scale experiment to study coastal critical zone, EGU General Assembly 2026, Vienna, Austria, 3–8 May 2026, EGU26-22054, https://doi.org/10.5194/egusphere-egu26-22054, 2026.

The soil security situation in Africa continues to worsen endangering both food production, population health and Sustainable Development Goal (SDG) achievement. While soil degradation and contamination happen in local areas, policies remain largely at national levels or beyond. This situation exists because of an organizational dependence on low-resolution top-down geospatial information which fails to detect the micro-scale mechanisms operating within African critical zones.
The study combines data from the Critical Zones Africa (CZA) project which studied five African countries including Ethiopia, Tanzania, Malawi, Zimbabwe and South Africa to understand the reasons behind different soil policies that do not match smallholder farming practices. The study evaluates the advantages and weaknesses of multiple geospatial tools through a systematic literature review framework to analyze land-use and land-cover mapping and vegetation indices and erosion models and hydrological simulations.
The study results demonstrate that geospatial methods successfully detect large-scale patterns of land deterioration and soil erosion vulnerability, but they do not solve essential soil management problems which need higher resolution at both farm and community levels. The main blind spots exist in Ethiopia where geochemical contamination occurs, and Tanzania faces groundwater contamination because of agricultural land growth and Malawi experiences soil degradation because of deforestation and Zimbabwe and South Africa struggle with water system nutrient waste. The evaluation process for all cases shows that soil investment choices and governance decisions face limitations because the available data does not match what happens in the field.
The achievement of soil security in African critical zones needs policymakers to adopt evidence-based integrated systems which operate at suitable scales. We recommend three essential measures which include: (i) providing all of Africa with access to detailed geospatial information (ii) African soil science education needs to be revitalized while laboratory facilities must be restored (iii) All fields must undergo ground-truthing assessments while local communities need to participate in the process. The study also recommends that proposed work program for AMCEN during 2026-2028 should enable UNEP to provide high-resolution data access which will help develop soil policies that fit the specific conditions of African territories.

How to cite: Chari, M. and Green, L.: Linking geospatial science with local knowledge systems to support soil security in African critical zones, EGU General Assembly 2026, Vienna, Austria, 3–8 May 2026, EGU26-22760, https://doi.org/10.5194/egusphere-egu26-22760, 2026.

The Lilongwe River Upper Catchment Area (LRUC) exemplifies the urgent need for Critical Zone Science (CZS) in Africa, where biophysical degradation and socio-political inequities converge. This study applies a CZ lens to investigate how soil health deterioration, land commodification, governance fragmentation, and gendered struggles intersect to undermine ecological livability and community resilience. Preliminary findings reveal alarming soil erosion rates exceeding global tolerable limits, rapid land-use transformations driven by urbanization and infrastructure expansion, and persistent exclusion of women from land and resource governance.

By integrating soil health assessments, geospatial analysis, ethnographic inquiry, and participatory community engagement, the Malawi CZA team identifies critical micro-watersheds where ecological degradation and human vulnerability overlap. Modeling of Nature-Based Solutions (NbS), including reforestation, contour farming, and integrated agroecological practices, demonstrates pathways to restore soil function, regulate hydrology, and enhance resilience under future climate scenarios. Importantly, the research situates soil health as both an ecological indicator and a sociopolitical marker, revealing how commodification and complex tenure systems exacerbate inequities.

This work contributes to global CZ science by foregrounding African environmentalism and community-driven approaches, while linking directly to Sustainable Development Goals (SDGs) 1 (poverty reduction), 2 (food security), 5 (gender equality), and 15 (life on land). By framing LRUC as a social-ecological system shaped by material flows and governance structures, the Malawi CZA initiative demonstrates how CZ methodologies can inform inclusive policies, strengthen grassroots participation, and advance equitable sustainability in rapidly transforming landscapes.

How to cite: Kampanje Phiri, J.: “Our Soils are Sick”: Addressing Soil Health, Energy, Land, Governance and Gender Complexities through Critical Zone Approaches in Lilongwe River Upper Catchment Area of Malawi, EGU General Assembly 2026, Vienna, Austria, 3–8 May 2026, EGU26-23138, https://doi.org/10.5194/egusphere-egu26-23138, 2026.

Urban watersheds in sub-Saharan Africa face unprecedented environmental degradation due to rapid urbanization, inadequate infrastructure, and governance failures. Lake Chivero, a shallow hypereutrophic reservoir constructed in 1952 on Zimbabwe's Manyame River, exemplifies this crisis. Serving as the primary water source for Harare and its dormitory towns of Chitungwiza and Ruwa a combined population exceeding 2.4 million. The lake has experienced catastrophic deterioration over seven decades. This study presents an innovative multidisciplinary framework combining Critical Zone Sciences with participatory diagnosis and community engagement to address complex socio-environmental challenges threatening water security in rapidly urbanizing African contexts. This framework offers scalable insights for addressing watershed degradation across African urban centers where rapid demographic transitions outpace infrastructure development and governance capacity, demonstrating how transdisciplinary approaches can bridge science-policy-community divides to achieve sustainable water resource management.

Lake Chivero's degradation manifests across multiple dimensions. Sedimentation has consumed 18% of the reservoir's storage capacity (49,126,170.34 m³), with annual capacity losses averaging 792,357 m³ year⁻¹ since 1953. Current sedimentation rates of 352.31 m³ year⁻¹ km⁻² project a remaining useful life of merely 106.63 years, pointing to a "2050 Doomsday Scenario." Sediment composition analysis reveals concerning proportions of mud (54%), sand (24%), and silt (22%). Nutrient pollution has escalated dramatically, with combined nitrogen and phosphorus loads surging from 3,524 tons in 2000 to 38,940 tons in 2012, an increase primarily attributable to untreated and partially treated sewage effluent. This pollution has triggered extensive water hyacinth (Pontederia crassipes) proliferation, linked to sewage effluent and abattoir waste discharge. Public health consequences include cholera outbreaks, waterborne diseases, and elevated cancer incidence rates, while ecological and economic impacts manifest in green-colored water and ecosystem collapse, as well as ballooned water treatment and public costs.

The research identifies governance fragmentation and knowledge silos as critical barriers to effective watershed management. Population growth from 200,000 during the colonial era to over 2.4 million by 2022, compounded by civil conflict in the 1970s, rural-urban migration, economic structural adjustment programs (ESAP), and informal settlement expansion, has overwhelmed water and sanitation infrastructure. Policy dissonance, corruption, informal waste management through opaque private contracts, chemically intensive agriculture, and politically connected land speculation further exacerbate environmental stress.

Our methodological innovation addresses these challenges through deliberate transdisciplinary integration. The research team comprises experts in social sciences, governance, environmental science, GIS, soil science, hydrology, waste management, and renewable energy. We hypothesize that fragmented relationships among stakeholder’s stem fundamentally from asymmetric data access and exclusion of local communities from knowledge production and decision-making processes. Our approach systematically reviews published literature while collecting primary field data, then transforms scientific findings into accessible formats for policymakers, government officials, planners, and local communities.

Participatory diagnosis employs ethnographic methods including "photovoice" to capture thick descriptions of lived experiences, validating local knowledge systems alongside scientific data. GIS-based time series analysis integrates scientific measurements with ethno-environmental perspectives, creating space for authentic dialogue. This methodology enables collaborative problem identification and solution co-creation grounded in shared visions and mutual trust. Thematic analysis using NVivo software ensures rigorous qualitative data interpretation.

How to cite: Mukamuri, B.: Experimenting with Multidisciplinary, Participatory Diagnosis and Community Engagement to Rehabilitate Endangered Watersheds in African Urban Settings: The Case of Lake Chivero in Zimbabwe, EGU General Assembly 2026, Vienna, Austria, 3–8 May 2026, EGU26-23141, https://doi.org/10.5194/egusphere-egu26-23141, 2026.

The multiple roles of Kilombero Valley-Rufiji Delta as a watershed, national hub for food production and a critical landscape for biodiversity protection makes it a highly significant national and international site of interraction between different actors who represent international conservation and development partnerships, private and civil society interests, small-holder farmers and agri-business deallers. Over the years, the role of these actors in translating ecologies into financial values has transformed the social biogeophysical relations of the landscape in ways that raise concerns about the future habitability. The Critical Zone project addresses this concern by focusing on how financialization models leave issues of soil health and water quality unaddressed hence compromising the sustainability of their development interventions. Precisely, the crops are managed solely with an eye on commercial values, which miss the care for soil with agrochemicals and fertilizers increasing productivity in the short term but causing long term damage to soils and water bodies. This has downstream impacts to both biodiversity and agricultural floodplains in the Rufiji Delta. Our key question, then, is: How useful is the Critical Zone approach for improving land-use decisions for Kilombero-Rufiji landscape, in the context of Tanzania’s Green Revolution? We combine spatial and temporal biophysical analysis with bottom-up approaches that draw from people science and policy actor engagements to reflect on the future habitability of the landscape.

How to cite: Pallangyo, C.: The Changing Social and Biophysical Relations in Tanzania’s Kilombero– Rufiji Landscape, EGU General Assembly 2026, Vienna, Austria, 3–8 May 2026, EGU26-23144, https://doi.org/10.5194/egusphere-egu26-23144, 2026.

Cape Town, the legislative capital of South Africa, is renowned for is natural beauty and is ranked as one of the best developed and well governed cities in Africa. However, for whom is the city aesthetically pleasing, developed and well-governed for? When the language of development, growth and progress permeates all spheres of contemporary Cape Town city planning, what does this obscure? What are the lived experiences on the ground? The project takes the Cape Flats, an expansive low-lying area situated to the south-east of Cape Town’s central business district, as a critical zone, where urban metabolic flows shape policy and habitability. The Cape Flats, characterized by a geography defined by a unique combination of maritime geology, endangered biodiversity, wetlands, lakes and rivers, agricultural and mining land, formal and informal residential areas, industrial areas, a waste dump and several wastewater treatment works (WWTW), is marked by “slow violence”, where apartheid spatial planning and environmental degradation and contamination meet contemporary urban precarity. Described as “apartheid’s dumping ground”, the Cape Flats was where people of colour were forcibly relocated under the Group Areas Act of 1950, as well as a site where a significant portion of Cape Town’s waste is disposed of. In thinking about the critical zone, it is then important to think about how biologies, ecologies, society, geologies are shaped by this inheritance of colonial and apartheid city planning. The central question for Cape Flats’ Critical Zones project is therefore: How do Cape Town's modes of development address realities in inherited zones of abandonment and contamination in the Cape Flats critical zone? The project explores how changes in the landscape, under the guise of “development” through the different historical periods under the colonial, apartheid and contemporary neoliberal forms of governance, have shaped the poly-crises evident in the area today. Considering the Cape Flats’ critical zone from aquifer to cloud, the project explores how material flows and urban metabolic processes shape habitability, policy and politics in the area. By paying attention to how disrupted urban metabolic processes impact biodiversity, water and contamination, soil, waste cycles, infrastructure, health and governance, the project proposes an amendment to the approaches in environmental governance from one that seeks to command, predict and control, to one that sees urban ecology as urban metabolisms of flows and relations.

How to cite: Solomon, N.: Urban Metabolisms: What makes for Habitability in the Cape Flats Critical Zone, in Cape Town, South Africa, EGU General Assembly 2026, Vienna, Austria, 3–8 May 2026, EGU26-23148, https://doi.org/10.5194/egusphere-egu26-23148, 2026.

This study examines the hydrological, pedological, ecological, and socioanthropological evidence to unpack the drivers of land transformation in the Central Rift Valley (CRV) of Ethiopia. It identifies a nexus of unsustainable land use, over-extraction of water (leading to dramatic lake-level decline), industrial pollution, soil degradation, and biodiversity loss. These interlinked pressures manifest as acute resource scarcity, compromised water and food safety, heightened socio-economic insecurity, and organized violence as a desperate means to reclaim lost rights, a cascading crisis that is further aggravated by climate change.

A critical driver is state policy that prioritizes export-oriented agribusiness, such as floriculture. These policies grant flower farms preferential access to land and water, leading to the over-extraction and chemical pollution that degrade lakes and soils. While the flower farm investment aims to create jobs and boost the national revenue, it often affects the community through pollution, resource competition and dispossession.  Toxification of water from industry activities, water overextraction by both commercial farms and industry,  clearing of woodlands not only disrupts ecosystems but also dismantles the material basis of indigenous cultural orders, such as the Oromo moral-ecological code Safuu, which once regulated resource use and conflict resolution.

While trends of environmental change in the CRV are well-documented, the usual analytical and governance frameworks remain inadequate. Conventional approaches often treat soil, water, and biodiversity as isolated commodities, overlooking the fundamental biophysical and social processes that sustain these systems. Moreover, these frameworks lack meaningful community engagement. This underscores the necessity for transdisciplinary co-design processes that involve local farmers and indigenous communities to identify the problems and search for suitable repair mechanisms. This study applies a Critical Zone Science (CZS) framework to demonstrate how discrete forms of degradation are causally linked. For instance, soil degradation drives sedimentation and nutrient loading into lakes, exacerbating the shrinkage of lakes and aquatic biodiversity loss. Contaminants from floriculture cause widespread toxification and a human health crisis. Deforestation disrupts microclimates and hydrological cycles, while the erosion of cultural governance creates a vacuum in which resource scarcity fuels protracted violence.

Viable solutions, therefore, depend on integrating local knowledge with scientific. This study advocates for a paradigm shift to process-based, Critical Zone-centered governance, an approach that prioritize community-driven resource management, locally adapted climate responses, and the restoration of both ecological functionality and culturally legitimate conflict-resolution mechanisms to secure a sustainable future for the CRV.

How to cite: Degefa, S.: Navigating the Polycrisis: Flower farms in the Web of Unsustainable Practices Transforming Ethiopia’s Central Rift Valley, EGU General Assembly 2026, Vienna, Austria, 3–8 May 2026, EGU26-23182, https://doi.org/10.5194/egusphere-egu26-23182, 2026.

A critical zone-based environmentalism understands that local habitability arises primarily in Earth’s material exchanges across bedrock, aquifers, soils, plants, and the lower atmosphere. With support from the Science For Africa Foundation, the Critical Zones Africa (CZA) consortium is working in specific locales of five African countries to understand how societal and policy processes are affecting circulations of water, soil nutrients and contaminants. This paper presents a first comparative assessment of these relations, and explores their implications for landscape governance, social sciences, and landscape repair.

Beginning with forensic accounts of flows and movements of water, soil nutrients and contaminants in landscapes, ie both horizontal and vertical relations, CZA team studies have explored where, how and why harms to habitability have arisen.  If environmental governance sciences are to shift from their current basis in finance, property and objects, to molecular and energy flows and the processes between them, the comparative aspect of the CZA project asks with what concepts and analytics might damaged relations be described, understood, and remediated? 

A first step to building a politics capable of habitability repair, is to recognise how specific patterns of social relations and concepts affect landscape flows, movements, interactions and transformations of matter and materials.

Reflecting comparatively on the research findings emerging from the CZA studies, this paper sets out a critical zone-based social science for local governance.

How to cite: Green, L.: Critical Zone Science, Social Sciences and Local Governance: An overview of the Critical Zones Africa Research Programme, EGU General Assembly 2026, Vienna, Austria, 3–8 May 2026, EGU26-23229, https://doi.org/10.5194/egusphere-egu26-23229, 2026.

The HSRC’s policy study component of the CZA project is anchored on the wide acknowledgement of the importance of building habitable futures by including bio-geophysical aspects of place in local governance. CZ thinking-informed policy practices are particularly relevant in African contexts, where livelihoods are closely tied to the geophysical ecosystem and climate variability. In these contexts, CZ approaches provide a powerful approach to informing policy innovations that are knowledge-plural and contextualized within lived realities. 

To date, this in-progress study of policy in specific places provides evidence that policy development and implementation activities continue to ignore the complex interaction of  societal practices, institutional arrangements, and biophysical processes. Drawing on foundational CZ literature and an analysis of selected site policies and data from science-policy-societal engagements conducted in Ethiopia and Zimbabwe, the study demonstrates how environmental policy practices continue to be narrowly shaped by fragmented, sector-based governance frameworks and profit-oriented thinking, in which financialised relations, historical legacies, and knowledge hierarchies shape whose voices are included in policy processes.  This narrow framing leads to policy interventions that compromise the biogeophysical ecosystems resulting in problems such as material flows that lead to contamination and loss of wetlands and hydrological cycles (Tanzania’s Rufiji Delta, Zimbabwe’s Lake Chivero and the Cape Flats in South Africa); as well as soil quality degradation and loss (Ethiopia’s Central Rift Valley and Malingunde in Malawi). Over time, these non-inclusive policies create a feedback loop in which degraded ecosystems  have limited adaptive capacity and future livelihoods and habilitability are  compromised.  What this study shows is that land use land cover change is not simply due to ‘humans’, as so much of the LULC literature suggests, but that specific macroeconomic policies and approaches to local governance, which pay little attention to biogeophysical relations with society, have a significant responsibility – and therefore also the potential to make a difference.

The presentation argues for policy process innovations that transcend discipline boundaries between society, economy and biogepphysical relations, integrating different knowledge systems and adopt adaptive approaches capable of responding to uncertainty and long-term change. Where co-creative and  collaborative policy development  and implementation practices bring together scientists, policymakers, and communities as co-producers of knowledge, there is  potential for improved governance that builds habitable futures. By foregrounding knowledge plurality in policy as a tool, this presentation contributes to the session’s focus on international innovation and collaboration, and demonstrates how critical zone science can meaningfully inform local governance and policy across varied regional contexts.

How to cite: Sobane, K.: Innovating Environmental Governance through Critical Zone Thinking: Lessons from the Global South, EGU General Assembly 2026, Vienna, Austria, 3–8 May 2026, EGU26-23241, https://doi.org/10.5194/egusphere-egu26-23241, 2026.

HS2.2 – From observations to concepts to models (in catchment hydrology)

EGU26-262 | Posters on site | HS2.2.1

Bridging single-tree processes and landscape-scale patterns to explain vegetation drought resistance and resilience in a headwater catchment 

Kamini Singha, Annie Tucker, Marc Dumont, Joel Singley, Nathan Lenssen, Russell Callahan, Adrienne Marshall, and Luke Jacobsen

Quantifying controls on tree-stand drought response remains challenging due to the interacting effects of landscape, moisture availability, and vegetation. Here, we investigated tree response to drought in terms of resistance—the ability of a forest to continue transpiring during drought—and resilience—the ability to rebound post-drought. We estimated resistance and resilience using remotely sensed normalized difference vegetation index (NDVI) over a 0.5 km2 sub-catchment of the Southern Sierra Critical Zone Observatory in California, USA. At the catchment-wide scale, we fitted generalized additive models with eight remotely sensed predictors to explain 51% of the variance in resistance and 59% in resilience. Elevation, slope, distance to stream, topographic wetness index, and baseline greenness were the strongest predictors and exhibited opposite effects on resistance versus resilience, underscoring the need to distinguish the drivers of resistance and resilience. We further explored these results through ecological process analysis at the tree scale using in-situ ecohydrological (sapflow and soil moisture), meteorological (air temperature and vapor pressure deficit, VPD), and geophysical (electrical resistivity) data from six stations selected based on differing drought responses. The data revealed valley-bottom hydrologic refugia, internal tree water stores, and consistent sapflow-VPD coupling are all associated with higher drought resistance. Together, our sub-catchment work identifies spatial patterns in drought resistance and resilience while our tree-level analysis reveals underlying mechanisms of drought response, demonstrating that forest vulnerability emerges from coupled, scale-dependent interactions among hydrology, vegetation structure, and topography. 

How to cite: Singha, K., Tucker, A., Dumont, M., Singley, J., Lenssen, N., Callahan, R., Marshall, A., and Jacobsen, L.: Bridging single-tree processes and landscape-scale patterns to explain vegetation drought resistance and resilience in a headwater catchment, EGU General Assembly 2026, Vienna, Austria, 3–8 May 2026, EGU26-262, https://doi.org/10.5194/egusphere-egu26-262, 2026.

EGU26-5174 | ECS | Posters on site | HS2.2.1

Spatiotemporal prediction of groundwater level changes with the hydrological model mHM 

Ronja Iffland and Uwe Haberlandt

Current methodologies for groundwater level prediction mainly focus on local predictions at single wells. This leaves a gap in spatiotemporal predictions at unobserved sites, particularly from the perspective of suitable target systems [1]. This study addresses this gap by adopting surface catchments as the target system to represent spatiotemporal variations groundwater levels, despite the fundamental differences between aquifers and catchments.

Therefore, groundwater levels from single wells are regionalised and then aggregated to catchment means. Prior to interpolation, groundwater levels are centered to make the data comparable across the study area. This is necessary due to the problem of spatial variability in groundwater levels even within an aquifer, e.g. with regard to distance to the river and topographical heterogeneity.

For prediction, the open-source mesoscale hydrological model (mHM) [2] is implemented for 100 catchments in Lower Saxony, Germany. While it is primarily designed for modelling surface hydrological processes and thus may overlook complex three-dimensional subsurface heterogeneity, it serves as a useful tool for groundwater level prediction in data-limited scenarios, particularly within simple hydrogeological environments like shallow unconfined aquifers. For direct groundwater level prediction, the mHM is calibrated using error measures calculated between observed and simulated groundwater level as linear transfer from simulated reservoir contents. The regression parameters and global parameters of mHM are calibrated simultaneously.

We expect good model performance in predicting groundwater level changes at the catchment scale, which represents a new regional approach for shallow, unconfined aquifers in particular.


[1] Barthel, R., Haaf, E., Giese, M., Nygren, M., Heudorfer, B., & Stahl, K. (2021). Similarity-based approaches in hydrogeology: Proposal of a new concept for data-scarce groundwater resource characterization and prediction. Hydrogeology Journal, 29(5), 1693–1709.

[2] mHM: Luis Samaniego et al., mesoscale Hydrologic Model. Zenodo. doi:10.5281/zenodo.1069202, https://doi.org/10.5281/zenodo.1069202

How to cite: Iffland, R. and Haberlandt, U.: Spatiotemporal prediction of groundwater level changes with the hydrological model mHM, EGU General Assembly 2026, Vienna, Austria, 3–8 May 2026, EGU26-5174, https://doi.org/10.5194/egusphere-egu26-5174, 2026.

EGU26-5407 | ECS | Orals | HS2.2.1

From Rain to Runoff: Unraveling Hidden Subsurface Flowpaths in Hillslopes 

Jonas Pyschik, Alexey Kuleshov, Emanuel Thoenes, Christina Fasching, Stefan Achleitner, Luisa Hopp, Bernhard Kohl, and Markus Weiler

Subsurface stormflow (SSF) can be a significant runoff mechanism in many headwater catchments, accounting for up to 90% of streamflow during rainfall-runoff events. Despite its hydrological significance, the processes controlling SSF are not yet fully understood. In order to investigate SSF dynamics and flowpath behavior in more detail, we conducted several field experiments including artificial rainfall simulations with deuterium-labelled water, monitored SSF response of artificial and natural rainfall events and performed soil core isotope profiling on a forested hillslope in a Black Forest catchment.

A dual-layer trench system captured SSF in two soil depth layers during experimental and natural events. Labelled rainfall water infiltrated to depths of over 1 m within minutes; however, isotope profiles revealed that the labelled water was largely confined to the top 20 cm of the soil matrix, indicating rapid bypass flow via deep preferential pathways. While only ~10% of the applied labelled water was recovered as SSF outflow, ~45% remained in the topsoil. SSF outflow was dominated by pre-event water, suggesting displacement via piston flow due to infiltrating labelled water, supporting a dual-domain conceptual model. During natural rainfall, the ratio of pre-event to event water varied with antecedent soil moisture, indicating that the storage–remobilization behavior was modulated by initial wetness conditions — wetter soils remobilized stored pre-event water more effectively. Additionally, event water volumes scaled linearly with precipitation inputs, indicating that larger storms activate more flowpaths and/or increase transport velocities.

These results highlight the complexity and spatial heterogeneity of subsurface flow paths in hillslopes. They emphasize the importance of high-resolution monitoring and targeted experiments in improving our understanding and representations of SSF dynamics in catchment-scale models, particularly with regard to solute transport and runoff generation.

How to cite: Pyschik, J., Kuleshov, A., Thoenes, E., Fasching, C., Achleitner, S., Hopp, L., Kohl, B., and Weiler, M.: From Rain to Runoff: Unraveling Hidden Subsurface Flowpaths in Hillslopes, EGU General Assembly 2026, Vienna, Austria, 3–8 May 2026, EGU26-5407, https://doi.org/10.5194/egusphere-egu26-5407, 2026.

EGU26-7311 | ECS | Orals | HS2.2.1

Dynamic river networks shaped by surface-subsurface interactions 

Francesca Barone, Nicola Durighetto, Enrico Bertuzzo, and Gianluca Botter

Hydrological modelling has a long tradition in environmental science, aiming to simulate water flow and storage across a variety of scales, from small catchments to entire river basins.  Over the past decades, new data have been made available which helped supporting the development of numerical models. However, most of them focus on catchment runoff only as it is easier to measure and often represents the more dominant component of the hydrological regime. On the other hand, subsurface processes occurring in the river domains, which govern water storage and regulate the exchange of matter between the superficial and subsuperficial environments, remain relatively underexplored. Moreover, existing models generally neglect the dynamics of expansion and contraction of the network in response to transient hydrological conditions. This numerical simplification is relevant not only when analysing headwater systems but also entire catchments.

Here we propose a novel, physically based, spatially explicit modelling framework which quantitatively represents the interaction between superficial and subsuperficial streamflow dynamics, thus representing the hyporheic zone as the key interface between surface and subsurface compartments. This model combines well-known laws of hydraulics and hydrology into a mass balance that describes how streamflow changes in time in each reach of the river network. The model quantitatively conceptualizes hillslope drainage to focus on the hydrological dynamics taking place on a river network domain in a range of possible scales, from local scale to larger river basins.

This framework aims to i) estimate how flows change in time and space, both in the surface and subsurface domains, and ii) assess the persistency of each reach (i.e. the percentage of time in which the monitoring point is wet) resulting from the interaction between superficial and subsuperficial flows. This approach allows to investigate how subsurface storage controls runoff generation, flow connectivity and network expansion and contraction. Beyond hydrology, the framework provides a basis for investigating water, solute and energy exchanges, thereby offering new opportunities to link hydrologic dynamics with ecological and biogeochemical processes at the catchment scale.

How to cite: Barone, F., Durighetto, N., Bertuzzo, E., and Botter, G.: Dynamic river networks shaped by surface-subsurface interactions, EGU General Assembly 2026, Vienna, Austria, 3–8 May 2026, EGU26-7311, https://doi.org/10.5194/egusphere-egu26-7311, 2026.

EGU26-7869 | ECS | Posters on site | HS2.2.1

Catchment Runoff Response to Land-Use–Driven Soil Impacts: Modelling a small torrential catchment in the Wienerwald Flysch Zone using Raven 

Julia Luhn, Maximilian Behringer, Karl Gartner, Günther Gollobich, Anita Zolles, and Christian Scheidl

Small torrential catchments respond rapidly to critical precipitation or rainfall events, which can pose serious natural hazards to downstream settlements. Natural water retention - primarily through forest interception and soil infiltration - can reduce runoff peaks. Its effectiveness is strongly shaped by human land use and respective changes. Climate change additionally impacts natural water retention by shifting vegetation patterns and increasing the occurrence of heavy rainfall events. To evaluate the impact of changing catchment characteristics, the first step is to gain a better understanding of interrelated processes and their impact on runoff dynamics.

In this study the hydrological modeling framework Raven (Craig et al. 20201) was applied to model hydrological processes in a small, forested catchment (~0.5km2), which is a tributary of the “Wienfluss” and is dominated by clayey soils. Hydrological response units (HRU) were delimited based on calculated sub-catchments, topography, land use, vegetation, and a soil classification geostatistically interpolated from a grid (75 × 75 m) of 104 core samples. Runoff is measured at a weir located at the catchment outlet and serves to validate the model runoff. Meteorological data provided by the Federal Forest Research Centre (BFW) were used as input over a warm-up period, as well as for the simulation period of two years (2022-2023). Raven, as a modular, mixed lumped/semi-distributed model framework, offers a wide range of flexible algorithms that allows users to adapt the configuration of represented hydrological processes according to specific catchment characteristics. We focus on understanding the interrelation of different processes, and in particular, the dynamics between soil properties, storage, interflow, baseflow, and surface runoff. Further applications of the model are planned to investigate the influence of soil compaction from heavy forestry machinery, including changes in soil functions (infiltration, storage, drainage) and associated greenhouse-gas emissions (CO₂, N₂O, CH₄).


1Craig, J.R., Brown, G., Chlumsky, R., Jenkinson, R.W., Jost, G., Lee, K., Mai, J., Serrer, M., Sgro, N., Shafii, M., Snowdon, A.P., Tolson, B.A., 2020. Flexible watershed simulation with the Raven hydrological modelling framework. Environmental Modelling & Software 129, 104728. https://doi.org/10.1016/j.envsoft.2020.104728

How to cite: Luhn, J., Behringer, M., Gartner, K., Gollobich, G., Zolles, A., and Scheidl, C.: Catchment Runoff Response to Land-Use–Driven Soil Impacts: Modelling a small torrential catchment in the Wienerwald Flysch Zone using Raven, EGU General Assembly 2026, Vienna, Austria, 3–8 May 2026, EGU26-7869, https://doi.org/10.5194/egusphere-egu26-7869, 2026.

EGU26-8213 | Posters on site | HS2.2.1

Extraction approach influences soil water-soluble organic matter: Insights from absorbance, fluorescence, and PARAFAC analysis 

Christina Fasching, Kyle Boodoo, Annika Feld-Golinski, Mansour Foroushani, and Peter Chifflard

Water-soluble organic matter (WSOM) plays a key role in soil and aquatic biogeochemical processes. As a mobile fraction of soil organic matter (OM), WSOM is commonly studied to understand OM dynamics, yet its chemical composition is strongly influenced by the extraction method employed. Here, we evaluated two WSOM extraction techniques—distilled water and 0.5M K₂SO₄—across 217 soil samples from 83 profiles spanning four central European regions. We applied absorbance and fluorescence spectroscopy combined with Parallel Factor Analysis (PARAFAC) to assess dissolved organic carbon (DOC) concentrations and composition, approaches increasingly used to trace soil OM transformation. DOC concentrations generally decreased with depth. K₂SO₄ extracts yielded consistently higher DOC levels, dominated by humic-like fluorescence components, whereas water extracts showed greater variability, with stronger protein-like signatures and more pronounced depth-related trends, suggesting enrichment of microbially-derived DOM in deeper layers. These differences highlight the role of extraction chemistry: water-based methods preferentially recover reactive, microbially-produced WSOM that may reflect short-term inputs to aquatic systems, while salt-based extractions emphasize more stable, less bioavailable pools, indicative of long-term terrestrial OM reservoirs. Selecting the appropriate extraction approach is therefore critical for addressing specific ecological or biogeochemical questions.

How to cite: Fasching, C., Boodoo, K., Feld-Golinski, A., Foroushani, M., and Chifflard, P.: Extraction approach influences soil water-soluble organic matter: Insights from absorbance, fluorescence, and PARAFAC analysis, EGU General Assembly 2026, Vienna, Austria, 3–8 May 2026, EGU26-8213, https://doi.org/10.5194/egusphere-egu26-8213, 2026.

EGU26-10131 | Orals | HS2.2.1

Understanding storage-discharge dynamics in permafrost-underlain catchments using a storage partitioning approach 

Clarissa Glaser, Julian Klaus, Arsh S. Grewal, Andras Szeitz, Calvin Newbery, and Sean K. Carey

Seasonal thawing and freezing cycles of soils fundamentally control storage dynamics in permafrost-underlain catchments. In spring, most of the snow-stored water melts and large volumes of water reach the stream without infiltrating into the frozen subsurface. During the soil thawing period (summer and autumn), storage capacity in the subsurface active layer increases and previously frozen water becomes available and may contribute to discharge of the receiving stream. Although research in temperate catchments indicates that not all stored water contributes to discharge dynamics, the proportion of storage controlling discharge (hydraulically connected storage) in permafrost regions and how it changes during freezing-thawing cycles remains unclear. Here, we tested whether thawing of subsurface ice over summer and autumn increases the hydraulically connected storage that controls discharge dynamics. To test this hypothesis, we applied a storage partitioning approach for a headwater catchment underlain by continuous permafrost located in Tombstone Territorial Park in Yukon, Canada. We applied the water balance to calculate the total storage and a recession curve analysis to derive the hydraulically connected storage. From the difference between these two storage compartments, we calculated the hydraulically disconnected storage, consisting of both saturated and unsaturated storage. Our preliminary results show that hydraulically connected storage remains stable during subsurface thawing, while disconnected storage increases. This finding suggests that a large proportion of the total storage becomes unsaturated during summer and autumn, reducing the relative proportion of hydraulically connected storage. The insights from the storage partitioning approach presented here deepen our understanding of how permafrost-underlain catchments store or release water throughout the open water season. Such knowledge is especially important given climate change impacts on freezing-thawing dynamics in permafrost regions.

How to cite: Glaser, C., Klaus, J., Grewal, A. S., Szeitz, A., Newbery, C., and Carey, S. K.: Understanding storage-discharge dynamics in permafrost-underlain catchments using a storage partitioning approach, EGU General Assembly 2026, Vienna, Austria, 3–8 May 2026, EGU26-10131, https://doi.org/10.5194/egusphere-egu26-10131, 2026.

EGU26-10270 | ECS | Orals | HS2.2.1

Lateral groundwater flow in boreal catchments: Implications on soil moisture and the impacts of landscape characteristics and model resolution 

Jari-Pekka Nousu, Kersti Leppä, Olli-Pekka Tikkasalo, Pertti Ala-aho, Hannu Marttila, Anneli Ågren, Giulia Mazzotti, Hjalmar Laudon, Anne Ojala, and Samuli Launiainen

Understanding the lateral movement of water is essential for accurately modeling hydrological and biogeochemical processes and element fluxes within catchments. Traditional land surface and hydrological models often focus on vertical fluxes and river discharge and tend to overlook the dynamic and spatially heterogeneous nature of lateral water flows from land to smaller water bodies. To capture these dynamics, we use the process-based SpaFHy model at very high spatial resolution (e.g., 16m x 16m), leveraging novel remote sensing data to parameterize the model for boreal catchments. We demonstrate how shallow lateral groundwater flow shapes surface soil moisture patterns in a catchment in northwestern Finland. We then explore how catchment-scale hydrological behaviour responds to different representations of stream and ditch networks in a nested subcatchment system in northern Sweden by comparing simulations using the natural stream network with simulations in which human-made ditches are also represented. Finally, to assess the capability to upscale the simulations to larger areas, we investigate how model behaviour changes when simulations are performed at coarser spatial resolutions, highlighting the challenges in conventional conceptualization of groundwater–surface water exchange. This work represents an important step toward improving our understanding and modeling of lateral fluxes and lays the groundwork for future coupling with carbon dynamics, including lateral dissolved organic carbon, across diverse catchments.

How to cite: Nousu, J.-P., Leppä, K., Tikkasalo, O.-P., Ala-aho, P., Marttila, H., Ågren, A., Mazzotti, G., Laudon, H., Ojala, A., and Launiainen, S.: Lateral groundwater flow in boreal catchments: Implications on soil moisture and the impacts of landscape characteristics and model resolution, EGU General Assembly 2026, Vienna, Austria, 3–8 May 2026, EGU26-10270, https://doi.org/10.5194/egusphere-egu26-10270, 2026.

EGU26-10684 | ECS | Orals | HS2.2.1

Monitoring subsurface moisture redistribution during sprinkling experiments using time-lapse ERT 

Veronica Cordero Perez and Stefan Hergarten

Precipitation-driven lateral subsurface flow, known as subsurface stormflow (SSF), is an important process for generating runoff and can considerably contribute to streamflow during storm events. However, its transient and spatially variable nature complicates its investigation and measurement, and the limited number of systematic studies across contrasting land uses, soil types, and hydrogeological settings limits its accurate representation in hydrological models.

To improve the understanding of SSF, controlled sprinkling experiments were conducted at multiple sites in Germany and Austria, covering different land uses, soils, and climatic conditions. At each site, trenches were excavated downslope to intercept lateral subsurface flow at depths of up to 3 m. Artificial sprinkling experiments were performed over a surface area of approximately 200 m² at a constant irrigation rate of ~16 mm h⁻¹. During the experiments, trenchflow discharge was continuously measured at two depths, complemented by soil moisture and groundwater level observations.

Additionally, 2D time-lapse Electrical Resistivity Tomography (ERT) profiles were carried out during eight of the eleven sprinkling experiments, including six forested and two grassland sites. Time-lapse ERT measurements were acquired during the 3-hour irrigation, until 6 hours after the beginning of irrigation, and 24 hours after irrigation to capture delayed subsurface responses.

This study evaluates the contribution of ERT to resolving subsurface features that may control SSF generation and flow pathways, such as vertical heterogeneity, structural interfaces, and potential preferential flow zones. Time-lapse resistivity variations are analysed in conjunction with observations of soil moisture, trenchflow discharge, and groundwater levels, to assess the consistency between geophysical responses and hydrological dynamics. The study highlights both the strengths and limitations of ERT for characterising SSF-related subsurface dynamics and contributes to the integration of geophysical observations into hydrological studies.

How to cite: Cordero Perez, V. and Hergarten, S.: Monitoring subsurface moisture redistribution during sprinkling experiments using time-lapse ERT, EGU General Assembly 2026, Vienna, Austria, 3–8 May 2026, EGU26-10684, https://doi.org/10.5194/egusphere-egu26-10684, 2026.

EGU26-10957 | Orals | HS2.2.1

Seasonal Asynchronicity of Wetness and Streamflow in an Alpine Catchment 

Natalie Ceperley, Meret Weh, and Bettina Schaefli

Soil moisture is a crucial indicator of the seasonal dynamics of storage and fluxes, as the key interface between the surface and atmosphere and the surface and subsurface. At the same time it is the primary ecohydrological water source. In an alpine environment, its seasonal fluctuations are largely governed by radiation via snow melt, evaporation, and transpiration in addition to precipitation arrival, storage, and runoff.  Because of this interaction of fluxes, it offers a critical lens with which to examine catchment processes. Meanwhile, it is one of the most challenging water stores to monitor at relevant scales.

In the Vallon de Nant, a 13.5 km2 catchment in Switzerland, over 7 years of in situ data (with intermittent gaps), we observe two distinct peaks, the first in March and the second in December, punctuated by two periods of low soil moisture, in mid-January and over the growing season from June to September.   This is particularly surprising because the stream flow peak does not occur until 3 months later in June.  This time lag has been observed in other alpine catchments and may primarily be an expression of the interplay of wetting and drying, however we might also be observing an artifact of the scale discrepancy between the point measurements of soil moisture and the catchment response of streamflow.  This scale discrepancy can be framed as a threshold-connectivity problem demonstrating the functional roles of hillslope versus riparian catchment areas and their expansion and contraction according to seasonal vegetation activity. 

In this presentation, we will examine the seasonal dynamics of wetting and drying to highlight the compounding roles of topography, season and vegetation.   We will further explore the implications for plant available water given anticipated changes in seasonal snow pack timing and duration.  


How to cite: Ceperley, N., Weh, M., and Schaefli, B.: Seasonal Asynchronicity of Wetness and Streamflow in an Alpine Catchment, EGU General Assembly 2026, Vienna, Austria, 3–8 May 2026, EGU26-10957, https://doi.org/10.5194/egusphere-egu26-10957, 2026.

Surface water and groundwater form a single, dynamically connected system. Yet water resources management often treats them as separate components. This separation becomes particularly problematic in geomorphologically flat, groundwater-dominated landscapes, where local subsurface processes exert strong control over catchment-scale hydrological response and water availability. These challenges are further amplified by the presence of shared aquifer systems and cross-border flow paths, which link local hydrological processes directly to transboundary water management decisions. In this study, we combine process-based modelling, hydrological indicators, and conceptual analysis to examine how surface water and groundwater interact across different spatial and temporal scales. We focus on the active water zone that is most relevant for water resources management. 

We combine results from local catchment-scale studies, drinking-water abstraction areas, and a regional transboundary groundwater flow model to examine how groundwater recharge, storage, and release shape river discharge and baseflow dominance. Emphasis is placed on distinguishing between water participating in the contemporary hydrological cycle and older, weakly connected groundwater, and on identifying the scales at which these components interact. Local headwater catchments and springs exhibit long memory effects and delayed responses to recharge, whereas borehole capture zones reveal how pumping alters natural flow paths and redistributes surface–groundwater exchange.

Using integrated modelling tools, including PRMS and MODFLOW-based regional models, we demonstrate that surface water, shallow groundwater, and deeper aquifers cannot be managed independently without risking serious misinterpretation of water availability and vulnerability. Our results indicate that surface–groundwater interactions and transboundary groundwater flows are primarily influenced by shallow, actively circulating aquifer systems. This directly links local water use decisions to regional and cross-border impacts. 

Our results underscore the need for an integrated assessment of surface water and groundwater as a joint resource, explicitly accounting for scale-dependent flow processes, recharge pathways, and the impacts of abstraction. This approach provides a more realistic basis for sustainable water resources management, drinking-water protection, and transboundary water governance in northern European lowlands and similar hydrogeological settings.

How to cite: Hunt, M. and Marandi, A.: Surface–groundwater interactions across scales: implications for integrated water resources management in Estonian catchments, northeastern Europe, EGU General Assembly 2026, Vienna, Austria, 3–8 May 2026, EGU26-11500, https://doi.org/10.5194/egusphere-egu26-11500, 2026.

EGU26-12009 | Posters on site | HS2.2.1

Introducing a Network of Experimental Catchments in the Urban Tropics  

Zuzana Drillet, Aurelie Bironne, Amelie Chaput, Marius Floriancic, Nikunj Mangukiya, Valeriy Ivanov, Seng Keat Ooi, Vladan Babovic, and Simone Fatichi

This contribution introduces three tropical experimental catchments across diverse urban settings in Singapore, designed to advance understanding of runoff generation across different land-uses. Rapid urbanization in tropical cities magnifies hydrological complexity, yet the processes governing runoff formation remain poorly quantified, especially at finer spatial scales. Tropical rainfall events are highly variable in space and time, and runoff formation processes, including interactions between surface and subsurface flow, typically exhibit pronounced heterogeneity due to the complexity of urban structures and diverse soil characteristics.

Here we introduce a new experimental catchment network, comprising three primary catchments, each spanning a few hectares in size. Catchments are densely instrumented for high resolution monitoring of hydrological and ecological processes, including rain gauges and meteorological stations, lysimeters, pressure transducers in wells and channels, leaf wetness sensors, rain gutter for throughfall measurement, sapflow meters and dendrometers, soil moisture sensors and water potential probes. This diverse instrumentation enables high-resolution data collection on precipitation, infiltration, discharge dynamics as well as vegetation ecophysiology.

The three experimental catchments, i.e. Kent Ridge catchment, Gallop catchment located within the Singapore Botanic Gardens, and Everton/Blair catchment near Duxton Hill vary greatly in their land-cover composition. Kent Ridge represents catchment with a mixed land-use, combining urbanized areas, parks, and remnants of tropical secondary forest. It is characterized by a higher proportion of built-up areas and an extensive system of open artificial drainage canals. In contrast, Gallop catchment is dominated by pervious natural surfaces, represented by tropical vegetation (rainforest, managed trees and lawns). Everton/Blair catchment contains highly sealed surfaces with low-rise buildings and occasional trees, open drainage canals and relatively flat terrain within Singapore’s central urban district.

Preliminary data illustrate differences in both surface and subsurface hydrological responses across these catchments, highlighting the influence of land-use, soil properties, and urban infrastructure on water storage and flow pathways. The collected high-resolution data aim to improve mechanistic understanding and modelling of hydrological responses in rapidly urbanizing tropical environments.

How to cite: Drillet, Z., Bironne, A., Chaput, A., Floriancic, M., Mangukiya, N., Ivanov, V., Ooi, S. K., Babovic, V., and Fatichi, S.: Introducing a Network of Experimental Catchments in the Urban Tropics , EGU General Assembly 2026, Vienna, Austria, 3–8 May 2026, EGU26-12009, https://doi.org/10.5194/egusphere-egu26-12009, 2026.

EGU26-13209 | Posters on site | HS2.2.1

Subsurface stormflow recession analysis of different hillslopes 

Emanuel Thoenes, Markus Weiler, Bernhard Kohl, and Stefan Achleitner

In many natural landscapes, subsurface stormflow (SSF) is a runoff-producing mechanism which can substantially contribute to the stream’s storm hydrograph. Despite its importance, the hidden (subsurface) processes controlling SSF are still not well understood. To study SSF and characterize associated storage-discharge dynamics, we analyzed the recession behavior of multiple SSF events of three trenched hillslopes in a Black Forest (Germany) catchment.  SSF triggered by natural and artificial rainfall events was measured in three trenches at the bottom of different hillslopes (T1–T3; 11–15 m wide, 1–3 m deep). In addition to SSF discharge (Q), groundwater levels and soil moisture dynamics were continuously monitored upslope of the trench. We extracted SSF recession segments and evaluated a single linear reservoir (1LR) model, a two parallel linear reservoirs (2PLR) model and also a power-law relationship −dQ/dt = aQb, where t is time and a and b are fitted parameters.

Recession behavior varied significantly across hillslopes: at T1, most recessions were adequately reproduced by the 2PLR model, whereas at T2 and T3 recessions generally followed the 1LR dynamics. The median 1LR recession timescales (k) were similar for T2 and T3 and about twice as long at T1. Where 2PLR was required, the slow and fast reservoirs differed strongly (median relationship between ks/kfaround 16 at T1, 11 at T2, 14 at T3). The 2PLR fits show that a transient b > 1 can occur from the superposition of two linear reservoirs: b approaches 1 under clear fast- or slow-flow dominance, but steepens during the transition between the two reservoirs. Consistent with this mechanism, T1 had higher apparent nonlinearity (median b = 2.5) than T2–T3 (median b = 1–1.5). The comparison between natural and artificial rainfall events suggests that event-to-event variability in recession timescales is partly driven by changes in the upslope contributing area feeding the trench. Soil moisture and water table dynamics provide further insights on how evolving hydrological conditions modulate the SSF drainage.

How to cite: Thoenes, E., Weiler, M., Kohl, B., and Achleitner, S.: Subsurface stormflow recession analysis of different hillslopes, EGU General Assembly 2026, Vienna, Austria, 3–8 May 2026, EGU26-13209, https://doi.org/10.5194/egusphere-egu26-13209, 2026.

EGU26-14424 | ECS | Orals | HS2.2.1

The drought recovery spectrum: variable storage controls across a European climatic gradient 

Ilenia Murgia, Christian Massari, Gabriele Chiogna, Núria Martínez-Carreras, Christophe Hissler, Jérôme Latron, Pilar Llorens, Laurent Pfister, Giulia Zuecco, and Daniele Penna

Hydrological drought recovery is a complex, non-linear process that frequently lags behind the return of seasonal precipitation. While drought onset and propagation are well-documented, the internal mechanisms governing recovery remain poorly understood. This research investigates the hypothesis that drought recovery is a scale-dependent process in which the effects of atmospheric variables, such as precipitation (P) and air temperature (T), are filtered through catchment storage compartments, specifically soil moisture (SM) and groundwater (GW), before resulting in the generation of stream runoff (Q). 

The study considers a multi-site climatic gradient to capture diverse hydrological behaviors: the Ressi catchment (Italy), which is a humid temperate pre-alpine climate with a mean annual P of 2119 mm and mean annual T  of 10.2 °C; the Can Vila catchment (Spain), which is a humid Mediterranean climate with mean annual  P of 918 mm and mean annual T of 10.3 °C; and the Weierbach catchment (Luxembourg), which is a temperate semi-oceanic climate with mean annual P of 898 mm and mean T of  8.7 °C. By leveraging high-resolution hydrometeorological data (P, T, SM, GW, and Q) spanning several years, the research moves beyond traditional linear analysis, employing wavelet analysis to identify time-frequency localizations and scale-dependent lag times in the relationships among the hydrometeorological variables considered.

Preliminary results show that hydrological recovery is not a simple function of P amount and distribution but is governed by internal storage behaviour. The Can Vila catchment functions as a threshold-based system in which intermittent Q depends on SM deficits. In this case, the soil acts as a collector, absorbing all initial P to satisfy SM deficits, resulting in no Q and a sudden “switch-like” recovery only once soil water storage is full. Conversely, “buffered” systems like the Weierbach catchment experience a lagged, multi-month recovery. In fact, the storage capacity acts as a long-term filter, providing resilience against short dry spells but requiring a prolonged period of consistent P to slowly recharge the system. Finally, “connected” systems such as the Ressi catchment demonstrate immediate recovery due to their short hydrological memory and constant vertical connectivity. In fact, considering the small size of the catchment’s storage, this leads to rapid fluctuations in SM, but also allows Q to reflect P almost instantaneously, with SM simply modulating the response of Q volume rather than delaying it. A more complete understanding of drought recovery dynamics will be gained through the upcoming analyses planned for GW.

The novelty of this work lies in the use of decadal wavelet analysis to examine where and how recovery from drought is influenced by local catchment characteristics. Considering that drought recovery is determined more by the internal conditions and dynamics than by meteorological factors alone, this study provides a framework for a more accurate understanding of drought recovery processes, highlighting the need for multi-compartmental monitoring to effectively manage water resources as climate variability increases across Europe.

How to cite: Murgia, I., Massari, C., Chiogna, G., Martínez-Carreras, N., Hissler, C., Latron, J., Llorens, P., Pfister, L., Zuecco, G., and Penna, D.: The drought recovery spectrum: variable storage controls across a European climatic gradient, EGU General Assembly 2026, Vienna, Austria, 3–8 May 2026, EGU26-14424, https://doi.org/10.5194/egusphere-egu26-14424, 2026.

EGU26-15515 | ECS | Orals | HS2.2.1

From Discrete Streamflow Components to Continuous Delay Spectra: A Mixed Weibull CDF Parameterization of Characteristic Delay Curves 

Hsin-Yu Chen, Kathryn Leeming, Hsin-Fu Yeh, Chia-Chi Huang, Ya-Sin Yang, Jonathan Mackay, John Bloomfield, Ben Marchant, Kuo-Chin Hsu, and Shien-Tsung Chen

Streamflow is traditionally regarded as the superposition of binary or a limited number of discrete components. Under this framework, the Baseflow Index (BFI) is a widely used hydrological signature for characterizing subsurface water and catchment behavior. However, streamflow generation is inherently a continuous, spectrum-like delayed response across multiple timescales, rendering such discrete representations a methodological simplification. Building on the Characteristic Delay Curves (CDCs), this study finds that a mixed Weibull cumulative distribution function (CDF) effectively fits CDCs. Drawing on interpretations of the Weibull distribution from Reliability and Survival Analysis, we propose three parameters within the CDCs: the ratio of baseline, the delayed discharge mode (corresponding to the Weibull shape parameter), and the characteristic delayed time (corresponding to the Weibull scale parameter), to characterize streamflow generation mechanisms and catchment behavior. This study examines the relationships and causal structure among these parameters using long-term streamflow records from 60 catchments in Taiwan and 671 catchments in the United Kingdom. The results indicate that characteristic delayed time acts as a common driver of both the ratio of baseline and the delayed discharge mode, while the latter two exhibit weak mutual dependence. Time- and frequency-domain analyses further demonstrate that the proposed parameters better discriminate streamflow dynamic regimes than the BFI. Overall, this study provides a continuous compositional framework for interpreting streamflow hydrographs and establishes a Weibull-based foundation for advancing theories of streamflow generation and aquifer drainage.

How to cite: Chen, H.-Y., Leeming, K., Yeh, H.-F., Huang, C.-C., Yang, Y.-S., Mackay, J., Bloomfield, J., Marchant, B., Hsu, K.-C., and Chen, S.-T.: From Discrete Streamflow Components to Continuous Delay Spectra: A Mixed Weibull CDF Parameterization of Characteristic Delay Curves, EGU General Assembly 2026, Vienna, Austria, 3–8 May 2026, EGU26-15515, https://doi.org/10.5194/egusphere-egu26-15515, 2026.

EGU26-16608 | ECS | Posters on site | HS2.2.1

Bridging Complexity and Efficiency in Vadose Zone-Aquifer Interaction Modelling 

Ankit Kumar, Soumyaranjan Sahoo, and Bhabagrahi Sahoo

Recharge processes linking rainfall to groundwater and streamflow responses play a critical role in catchment hydrology, yet remain a major source of uncertainty due to complex interactions between vertical vadose-zone dynamics and lateral groundwater flow. In this study, a parsimonious, semi-distributed modelling framework is developed to evaluate how alternative representations of recharge influence catchment-scale groundwater dynamics by explicitly coupling a one-dimensional Richards equation solver for vadose-zone soil moisture dynamics with a Hillslope-Storage Boussinesq (HSB) model that simulates topography-driven lateral groundwater redistribution. Hillslope geometry is parameterised using geomorphological width functions, enabling efficient representation of subsurface storage and flow while retaining physical interpretability. Groundwater recharge flux is estimated using three conceptualisations of increasing complexity: (i) an HSB coupled linearised diffusion-based Richards equation, (ii) an HSB coupled nonlinear Richards equation with  van Genuchten soil hydraulic parameters, and (iii) an HSB-HYDRUS 1D coupled model wherein the Richards equation is solved using a linear finite element scheme with implicit time integration. These hierarchical approaches are applied to the well-instrumented Maimai catchment, New Zealand, using observed rainfall and groundwater-level time series. The results reveal that representation of vertical recharge dynamics exerts a dominant control on simulated groundwater response. The coupled linearised Richards equation  produces unrealistically rapid recharge signals, overestimating groundwater levels under wet antecedent conditions; whereas the coupled nonlinear Richards equation including HYDRUS-1D based coupled models could capture the critical vadose-zone buffering, yielding delayed and smoother groundwater responses with improved accuracy. These findings demonstrate that moderately- complex models can provide an effective balance between the physical realism and computational efficiency in modelling the subsurface storage–flow interactions at the catchment scale.

How to cite: Kumar, A., Sahoo, S., and Sahoo, B.: Bridging Complexity and Efficiency in Vadose Zone-Aquifer Interaction Modelling, EGU General Assembly 2026, Vienna, Austria, 3–8 May 2026, EGU26-16608, https://doi.org/10.5194/egusphere-egu26-16608, 2026.

EGU26-20789 | ECS | Posters on site | HS2.2.1

Soil eDNA as Hydrological Tracer 

Yvonne Schadewell, Sören Köhler, Christina Fasching, Peter Chifflard, Bernhard Kohl, and Florian Leese

Tracer-based approaches have advanced our understanding of subsurface hydrology, yet conventional tracers often lack sensitivity to the fine-scale physical and ecological structures that influence water movement through soils. Environmental DNA (eDNA) has recently emerged as a promising natural tracer, capturing biological signals that may reflect hydrological connectivity while simultaneously enabling biodiversity assessment. We investigate the three-dimensional structuring of soil biodiversity and evaluate its potential for hydrological flow path tracking across contrasting catchments. Using tree-of-life (ToL) metabarcoding, we characterised eDNA-based community composition of bacteria, protists, fungi, plants, and invertebrates from 10 soil drilling cores (0.7–3.2 m depth) across twelve hillslopes in four catchments in Germany and Austria, differing in parent material, land cover, and geomorphological and geochemical properties. We identified 5493 eDNA sequences consistently associated with specific soil depths and habitat types. Despite differences in geology, parts of this vertical and horizontal biodiversity structuring were conserved across catchments, suggesting the presence of broad-scale, potentially catchment-independent sequences that may serve as natural tracers of subsurface hydrological processes. Overall, our findings demonstrate the potential of eDNA as a naturally occurring tracer to identify subsurface flow pathways and enhance process understanding in the unsaturated zone. While the application of eDNA in hydrological tracing is still in its early stages, integrating biodiversity information into tracer frameworks offers a promising avenue for advancing the study of hidden subsurface flow processes.

How to cite: Schadewell, Y., Köhler, S., Fasching, C., Chifflard, P., Kohl, B., and Leese, F.: Soil eDNA as Hydrological Tracer, EGU General Assembly 2026, Vienna, Austria, 3–8 May 2026, EGU26-20789, https://doi.org/10.5194/egusphere-egu26-20789, 2026.

The management of water resources is complicated, in particular when dealing with the prediction of solute export from entire catchments. One common approach is to set up physically-based, distributed hydrologic models for specific catchments, to calibrate them with recorded time series of precipitation and discharge and thus to simulate in detail every aspect of solute transport in the catchments. However, the setup of such models is relatively laborious and the application often computationally expensive. Also, the results are usually not directly transferable to other catchments.

We facilitated a simpler approach for the prediction of solute export by using a physically-based model to integrate more realism into a conceptual model (at the catchment scale). This could be achieved by linking the shape of transfer functions (which are used in many conceptual models to convert solute input into solute output) with physically measurable catchment and climate parameters. These transfer functions are forward transit time distributions that contain detailed information on how long waters and substances entering with a particular precipitation event stay inside of a catchment before they discharge. The shape of transit time distributions changes depending on which flow paths are preferentially activated during and after a precipitation event. The shape also varies spatially with specific catchment characteristics like, for example, soil depth or hydraulic conductivity.

In a virtual experiment that forms the basis of this study we used a physically-based, distributed model (HydroGeoSphere) to examine how the shape of transit time distributions changes spatially between catchments with different properties and how it changes temporally within one catchment with changing antecedent moisture content. Now we verified the results of the virtual modeling study with the help of empirical field data in real-world catchments. To this end we used discharge and nitrate time series of the freely accessible data base Germany, selected, set up and calibrated six uniquely representative (archetypal) catchments in HydroGeoSphere and compared the resulting transit time distributions with the ones produced in the virtual catchments.

How to cite: Heidbüchel, I., Yang, J., and Fleckenstein, J. H.: Can we realistically use archetypal transit time distributions for integrating soil moisture, surface and subsurface flows in order to determine temporally variable catchment response?, EGU General Assembly 2026, Vienna, Austria, 3–8 May 2026, EGU26-21508, https://doi.org/10.5194/egusphere-egu26-21508, 2026.

EGU26-21555 | Orals | HS2.2.1

Complex dynamics of fluid and matter sinks, transformations, and sources in thick recharge-area aeration zones contribute to groundwater quality evolution 

Kai Uwe Totsche, Katharina Lehmann, Dinusha Eshvara Arachchige, Robert Lehmann, Will A. Overholt, and Kirsten Küsel

Thick aeration zones beneath topographic highs, being neither “vadose” (Latin vadosus = shallow) nor “water-unsaturated”, play a critical yet poorly understood role in groundwater quality and subsurface ecosystem functioning (Lehmann et al., 2026). Using a network of twenty spatially distributed sub-horizontal drainage collectors in the groundwater recharge area of the Hainich Critical Zone Exploratory, we quantified bedrock percolation volumes, solute and particle transport, and their controlling factors over three years, complementing existing lysimeter and well networks. The newly developed drainage collectors fill an observational gap in subsurface water research. Approximately 65% of annual percolation occurred in winter, with extreme rainfall and snowmelt events accounting for 58% of this flux, depending on antecedent moisture conditions. Collectors captured 13% of topsoil seepage, controlled by soil thickness, seasonality, slope, and fracture properties. Analysis of multiple factors linked mobile inventory dynamics to deterministic chaos. Percolate composition showed strong seasonal variability, differed markedly from soil seepage, and resembled groundwater signatures. Winter high-flow events dominated the transport of organic carbon, mineral particles, mineral–organic aggregates up to 160 µm, and bioparticles. Notably, highly geodiverse aeration zones (Lehmann and Totsche, 2020; Aehnelt and Totsche, 2025) not only transform and retain but also generate mobile matter, including microorganisms. Our results highlight complex interactions between weather extremes, regolith–bedrock structure, and matter transport. Thick aeration zones in recharge areas, being foremost exposed to (belowground) climate change, should be recognized as key compartments in subsurface ecosystem functioning and in groundwater quality evolution and thus incorporated into monitoring, modelling, and water resources management.

How to cite: Totsche, K. U., Lehmann, K., Eshvara Arachchige, D., Lehmann, R., Overholt, W. A., and Küsel, K.: Complex dynamics of fluid and matter sinks, transformations, and sources in thick recharge-area aeration zones contribute to groundwater quality evolution, EGU General Assembly 2026, Vienna, Austria, 3–8 May 2026, EGU26-21555, https://doi.org/10.5194/egusphere-egu26-21555, 2026.

EGU26-21689 | Posters on site | HS2.2.1

The role of subsurface storage in snow dominated alpine catchments  

Bettina Schaefli, Natalie Ceperley, and Xinyang Fan

In snow-dominated catchments, the hydrological response is governed by complex interactions between surface and subsurface storage that evolve throughout the snow accumulation and melt season. The water input from snowmelt has fundamentally different properties in terms of spatial and temporal patterns than rainfall input. In addition, frozen soil  comes into play. Accordingly, understanding the hydrological response of such catchments requires a shift from a too strong focus on surface processes (snow accumulation and melt patterns) to subsurface storage dynamics, soil moisture conditions, and the connectivity of flow pathways. Despite their importance, these subsurface processes are often simplified or inadequately represented in hydrological models, contributing to persistently wrong streamflow simulations in alpine catchments.

Based on field and modeling data from different case studies, we discuss the role of subsurface storage and flow paths during the snow melt season and what is required to represent them in models. A special emphasis is given to the question how understanding surface-subsurface interactions in today snow dominated catchments is of key importance to anticipate the effect of snow line shifts and eg the more frequent occurrence of rain-on-snow events.

How to cite: Schaefli, B., Ceperley, N., and Fan, X.: The role of subsurface storage in snow dominated alpine catchments , EGU General Assembly 2026, Vienna, Austria, 3–8 May 2026, EGU26-21689, https://doi.org/10.5194/egusphere-egu26-21689, 2026.

EGU26-417 | ECS | Orals | HS2.2.2

Monitoring Mobile Metals: A Pb-Zn Isotopic Approach to Trace Metal Pollutant Sources in Rivers 

Luke Franks, Julia Knapp, Julie Prytulak, Luke Bridgestock, and Geoff Nowell

Dissolved heavy metals in river systems reflect contributions from a range of natural and anthropogenic inputs. These inputs can vary spatially and temporally. It is well documented that dissolved heavy metal concentrations show pronounced changes in response to discharge in both polluted and pristine catchments.

Environmental legislation (such as the Water Framework Directive) sets recommended limits on heavy metal concentrations in freshwater systems, which many rivers exceed. To effectively remediate pollutant sources, it is vital to identify and quantify the specific contributions from different endmembers. Concentration data alone are insufficient to apportionment sources whilst accounting for hydrological controls and within-catchment processes. To overcome this shortcoming, we combine concentration measurements with metal isotope signatures, which provide a powerful tool for distinguishing and quantifying individual source contributions under varying flow conditions.

We utilise a novel multi-tracer approach combining trace element, major cation and dissolved organic carbon (DOC) concentrations, as well as stable Zn and radiogenic Pb isotopes to identify and differentiate sources of dissolved heavy metal pollutants. We apply this approach in the River Wear catchment - a historic Pb-Zn mining region in northeast England, UK. In this catchment, legacy mine wastes dominate dissolved metal loads in the headwaters, while downstream reaches show increasing influence from agricultural activities and urban sources (e.g. wastewater effluent and road runoff).

We present data from catchment-wide transect sampling completed under three contrasting hydrological conditions: high, medium, and low flow. We show a resolvable and significant change in Zn isotope composition under these different flow conditions. Combining Zn and Pb isotope measurements with supporting chemical tracers provides enhanced resolution for distinguishing between legacy mining contributions, diffuse agricultural inputs, and urban sources, as well as for identifying key catchment processes such as mixing, dilution, and hydrologically mediated mobilisation. This integrated framework offers a powerful tool for source apportionment and can assist the development of targeted remediation strategies in historically contaminated river systems.

How to cite: Franks, L., Knapp, J., Prytulak, J., Bridgestock, L., and Nowell, G.: Monitoring Mobile Metals: A Pb-Zn Isotopic Approach to Trace Metal Pollutant Sources in Rivers, EGU General Assembly 2026, Vienna, Austria, 3–8 May 2026, EGU26-417, https://doi.org/10.5194/egusphere-egu26-417, 2026.

EGU26-440 | ECS | Orals | HS2.2.2

Utilizing Regional Spectral Model Outputs as Forcing Data for Isotope-enabled Eco-Hydrology Models 

Yan Yang, Christian Birkel, Chris Soulsby, Ana. M Durán-Quesada, Kei Yoshimura, and Dörthe Tetzlaff

Most hydrological models rely on forcing data derived from in situ observations or reanalysis products. However, the scarcity of observational data, particularly isotope measurements, makes long-term hydrological simulations at the catchment scale or larger still challenging. With the ongoing development of global and regional circulation models, it has become feasible and increasingly common to simulate atmospheric variables at high spatial and temporal resolution. At the same time, precipitation isotopes, which serve as important tracers of water sources and physical processes, can now be simulated by several isotope-enabled circulation models. This study uses IsoRSM, an isotope-enabled regional spectral model, to simulate precipitation and its isotopic composition in Central America. The resulting dataset provides a valuable potential input for isotopic eco-hydrological models.

A 14-year (2010-2023) simulation was carried out using IsoRSM at a spatial resolution of 5 km and a temporal resolution of 6 hours. The model domain covered a 6°×6° region encompassing Costa Rica and surrounding areas. The outputs were validated against observations from 58 precipitation-amount sites and 28 precipitation-isotope data sites, and were also compared with a previous IsoRSM simulation at 10 km resolution. After applying quantile mapping (QM) bias correction, the simulated precipitation and isotope fields successfully reproduced the spatial distribution and seasonal patterns across Costa Rica. The average KGE for precipitation δD reached 0.44. Compared with the 10 km simulation, the 5 km resolution produced higher KGEs for precipitation δD, indicating that better representation of topography enhances the simulation of precipitation isotopes. Regarding interannual variability, most sites exhibited a positive relationship between annual mean precipitation δD and the Oceanic Niño Index (ONI), with 12 sites showing correlation coefficients above 0.4. In addition, potential evapotranspiration (PET) could also be calculated from IsoRSM outputs with the Penman-Monteith equation. Overall, the bias-corrected IsoRSM atmospheric variables provide a useful and applicable source of forcing data for isotope-enabled eco-hydrological models.

How to cite: Yang, Y., Birkel, C., Soulsby, C., Durán-Quesada, Ana. M., Yoshimura, K., and Tetzlaff, D.: Utilizing Regional Spectral Model Outputs as Forcing Data for Isotope-enabled Eco-Hydrology Models, EGU General Assembly 2026, Vienna, Austria, 3–8 May 2026, EGU26-440, https://doi.org/10.5194/egusphere-egu26-440, 2026.

EGU26-598 | ECS | Orals | HS2.2.2

Seasonal variation in the quantitative contribution of water sources: A case study from the Yamuna River, India 

Sanchita Banerjee, Amal Ms, and Prasanna Kannan

Hydrological parameters are dynamic within the context of regional climatic zones worldwide. The regional difference is prominent in the riverine systems of the Indian subcontinent and varies significantly for both perennial and ephemeral rivers. The contribution of discharge from the tributaries can incorporate an additional level of intricacy while impacting the changes in seasonal signatures. In the present study, we have deduced the seasonal changes in the relative contribution of the surface runoff or precipitation, glacial meltwater and groundwater for the Yamuna River, including one of the tributaries, the Betwa, using the Discharge Dependent Budget Estimation (DDBE) model [1]. We were able to discriminate the contribution of glacial meltwater through isotopic fingerprints of the Yamuna River (with glacial contribution) while comparing with the rain-fed tributary, the Betwa. The measured values of δ2H and δ18O of water samples collected on a monthly interval around a year (2023-2024) from the Yamuna, the tributary Betwa river and the confluence of Yamuna-Betwa: Hamirpur, Himachal Pradesh, and the monitored annual discharge values were used for the estimation of seasonal variation in proportional contribution of the sources. Implementation of the IMix model application[2] led to the estimation of increased discharge through the Yamuna, contributing 62-67% (normal distribution model), during the monsoon and similar discharge of both the Yamuna and the Betwa, throughout the rest of the year. The D-excess values in combination with the δ18O mixing allowed for quantitatively defining the contribution of water sources in the sub-tropical climatic zone. We would be implementing the existing Bayesian Model(MixSIAR) for the same set of data to quantify the uncertainty associated with each of the components, which can help us in the assessment of regional hydrological component turnovers.


[1] Kumar et al. (2023) River Res. Applic.

[2] Song et al. (2025) Eco. Proc.

How to cite: Banerjee, S., Ms, A., and Kannan, P.: Seasonal variation in the quantitative contribution of water sources: A case study from the Yamuna River, India, EGU General Assembly 2026, Vienna, Austria, 3–8 May 2026, EGU26-598, https://doi.org/10.5194/egusphere-egu26-598, 2026.

EGU26-1214 | Orals | HS2.2.2

ELUCIDATING COMPLEX groundwater CIRCULATION in KARST SYSTEMs using ENVIRONMENTAL ISOTOPIC TRACERS: Case of the middle atlas, morocco 

Fatima raibi, Mouad maaziz, Yassine ait brahim, Mohamed hssaissoune, Hamza berrouch, Mohamed qurtobi, Moncef benmanssour, Rachid essafi, Taha el ghezlani, and Lahoussine bouchaou

The Middle Atlas in Morocco serves as a critical recharge zone for several major river basins, yet its groundwater systems remain poorly constrained at the regional scale. This study presents an integrated hydrogeological assessment based on major-ion chemistry, stable isotopes (δ²H, δ¹⁸O), tritium (³H), and radiocarbon (¹⁴C) from 60 springs and 8 surface waters across the Sebou, Oum Er-Rbia, and Moulouya basins. Results show that groundwater is dominantly of meteoric origin, with minimal evaporative influence, and largely composed of Ca–HCO₃ and Ca–Mg–HCO₃ types. A new local meteoric water line (δ²H = 7.99 δ¹⁸O + 14.56) and δ¹⁸O–altitude gradient (–0.23‰ per100 m) allow estimation of recharge elevations ranging from 700 m to 2,490 m. Tritium and ¹⁴C data distinguish fast-flowing conduit systems with modern water from confined compartments with older, mixed groundwater. Elevated salinity in some springs is attributed to subsurface dissolution of Triassic evaporites rather than surface evaporation. Structural features, particularly fault zones like Tizi N’Tretten, control both vertical circulation and cross-basin flow. These findings provide the first massif-scale isotopic and geochemical baseline for the region can be extended to other karst systems in arid and semi-arid environments to resolve recharge dynamics, flow architecture, and inter-basin connectivity.

How to cite: raibi, F., maaziz, M., ait brahim, Y., hssaissoune, M., berrouch, H., qurtobi, M., benmanssour, M., essafi, R., el ghezlani, T., and bouchaou, L.: ELUCIDATING COMPLEX groundwater CIRCULATION in KARST SYSTEMs using ENVIRONMENTAL ISOTOPIC TRACERS: Case of the middle atlas, morocco, EGU General Assembly 2026, Vienna, Austria, 3–8 May 2026, EGU26-1214, https://doi.org/10.5194/egusphere-egu26-1214, 2026.

EGU26-1619 | ECS | Posters on site | HS2.2.2

Hydrometric and isotopic variability of tile drainage discharge in a small agricultural catchment 

Borbála Széles, Ladislav Holko, Juraj Parajka, Christine Stumpp, Michael Stockinger, Peter Strauss, Carmen Krammer, Thomas Weninger, Elmar Schmaltz, Matthias Konzett, Reinhard Hollerer, Patrick Hogan, Stefan Wyhlidal, Katharina Schott, Christin Müller, Kay Knöller, and Günter Blöschl

Understanding the discharge dynamics of tile drains is crucial to better manage water resources in agricultural areas. This study aimed to compare two tile-drainage systems (Sys4, Frau2) in a small agricultural catchment at the Hydrological Open Air Laboratory in Lower Austria by utilizing six years of high-frequency (10 minutes – 2 hours) hydrometric and isotopic observations, to investigate if their discharge is dominated by new or old water and whether new-water fractions correlate with certain hydrometric characteristics. One tile drain system, Sys4, was a perennial system with a larger drainage area, pipes with larger diameter and a simpler topology. The other tile drain, Frau2, was an ephemeral system with a smaller drainage area, pipes with smaller diameter and a complex topology. The flashiness, time to peak flow, soil moisture and groundwater dynamics were evaluated for the two tile drainage systems. Peak flow new water fractions were estimated by stable isotopes using both two-component (IHS) and ensemble hydrograph separations (EHS). The results indicated clear differences between the discharge dynamics and new water fractions of the two tile drains. Sys4 responded rapidly to even small amounts of rainfall, with 0.9 h median time to peak. The response here was generally independent from the soil moisture state and the depth to the groundwater table. Frau2 had the flashiest behavior with an average Richard-Baker Index of 0.52. Discharge at Frau2 depended rather on rainfall amount than rainfall intensity, and larger discharge peaks occurred only above a soil moisture (0.35 m3/m3) and groundwater level threshold (0.3 m below ground surface). The largest average peak flow new water fractions were obtained for Sys4 (with IHS average 0.54, with EHS 0.66 for δ18O) compared to Frau2 (with IHS average 0.47, with EHS 0.35 for δ18O). The differences in the hydrometric and isotopic characteristics of the drains can be explained by differences in their construction properties, drainage areas and drainage densities. Discharge from drainage systems with a larger area but smaller drainage density, with a simpler topology and pipes with larger diameter had faster response to rainfall and larger new water fractions.

How to cite: Széles, B., Holko, L., Parajka, J., Stumpp, C., Stockinger, M., Strauss, P., Krammer, C., Weninger, T., Schmaltz, E., Konzett, M., Hollerer, R., Hogan, P., Wyhlidal, S., Schott, K., Müller, C., Knöller, K., and Blöschl, G.: Hydrometric and isotopic variability of tile drainage discharge in a small agricultural catchment, EGU General Assembly 2026, Vienna, Austria, 3–8 May 2026, EGU26-1619, https://doi.org/10.5194/egusphere-egu26-1619, 2026.

EGU26-1630 | ECS | Posters on site | HS2.2.2

Time-variable transit times and derived water fractions during low, intermediate and high flow conditions in large Central European watersheds  

Karl Knaebel, Markus Hrachowitz, Michael Stockinger, Paul Koeniger, Siyuan Wang, and Christine Stumpp

Flow conditions strongly influence hydrological transport processes at the catchment scale. Water transit time distributions (TTDs) provide an integrative framework to quantify how water is stored and released from catchments under different flow conditions. Previous studies have primarily focused on small to meso-scale catchments. However, how time-variable TTDs and derived water fractions vary across low-, intermediate-, and high-flow conditions and across seasons remains unclear in large watersheds. Therefore, the objective of this study was to determine and compare time-variable TTDs and derived water fractions of high, intermediate and low flows and across seasons. Here, we applied a semi-distributed tracer-aided conceptual hydrological model combined with StorAge Selection (SAS) functions to nine Central European large watersheds ranging in size from 4,981 km² – 139,549 km². The model was calibrated against streamflow and δ18O in streamflow using 20 – 32 years of data and is validated with an independent part of the streamflow time series and MODIS Terra snow-cover observations. We defined flow conditions as: high (q > q90​), intermediate (q10 ≤ q ≤ q90) and low (q < q10). We focused on younger water fractions f(t<10 days), f(t<30 days), f(t<90 days), medium aged fractions f(t<1 year), f(t<5 years), and older water f(t>5 years). Results across catchments showed that younger water fractions increased with increasing streamflow, with the median of young and medium aged water fractions being higher under high- and lower under low-flow conditions. While the variability of water fractions remained high across all flow conditions, intermediate flows, showed the highest variability in water ages. Water fractions ratios, e.g., f(t<30 days):f(t<1 year) or f(t<90 days):f(t<1 year), showed high variability across seasons and flow conditions. Next, we will elaborate the interannual and seasonal variability of flow conditions, TTDs, and derived water fractions, and eventually relate the findings to hydroclimatic and physical catchment properties.

How to cite: Knaebel, K., Hrachowitz, M., Stockinger, M., Koeniger, P., Wang, S., and Stumpp, C.: Time-variable transit times and derived water fractions during low, intermediate and high flow conditions in large Central European watersheds , EGU General Assembly 2026, Vienna, Austria, 3–8 May 2026, EGU26-1630, https://doi.org/10.5194/egusphere-egu26-1630, 2026.

EGU26-2583 | Orals | HS2.2.2

Using ²²²Rn as a tracer in hydrogeological studies: a critical review of qualitative and quantitative assessments of potential sources of error 

Melanie Vital, Natasha Dimova, Benjamin Gilfedder, Valenti Rodellas, Stephen Sadler, Sebastian Santoni, Frederic Huneau, Stephanie Musy, Oliver S Schilling, Lucia Ortega, and Michael Schubert

Radon-222 (²²²Rn), a radioactive noble gas produced by the decay of ²²⁶Ra in geological materials, is widely applied as a natural tracer in hydrogeological investigations. Its ubiquitous occurrence in groundwater, conservative behaviour in aqueous systems, and relatively straightforward on-site detection have made it a powerful tool for identifying groundwater flow paths, quantifying groundwater–surface water exchange and estimating water residence times. However, despite its extensive use, radon-based studies often suffer from large uncertainties and inconsistent results, frequently caused by methodological issues. This contribution presents a comprehensive critical review of the main qualitative and quantitative sources of error associated with the application of ²²²Rn as a tracer.

We analyse the fundamental physical processes controlling ²²²Rn production, emanation from the mineral matrix, accumulation in groundwater under secular equilibrium conditions, and partitioning between water and gas phases and link them to practical aspects of field sampling, on-site and laboratory measurements, and data evaluation. Emphasis is given to the performance and limitations of mobile radon detectors commonly used in hydrological studies, for which we assessed how detector sensitivity, response time, air humidity, carrier gas composition, and internal air-loop configuration influence measurement accuracy and precision. We further discuss the influence of water temperature and salinity on the radon water–air partition coefficient and demonstrate how neglecting these parameters can lead to systematic biases in calculated ²²²Rn-in-water concentrations. Determining representative groundwater endmembers is identified as a key challenge with regards to natural spatial and temporal variability in aquifer properties. Finally, we discuss uncertainties arising from the stochastic nature of radioactive decay.

The review identifies critical steps where avoidable errors commonly occur, including sample collection and handling, degassing during pumping and storage, diffusion losses through container materials, and inappropriate selection of water and air volumes during extraction. Practical recommendations are provided for survey design, sampling strategies, measurement protocols, and data processing, to minimise avoidable errors and improve reproducibility.

By systematically addressing the physical, technical, and methodological aspects of ²²²Rn measurements, this review provides a consolidated framework for best practice in radon tracer studies, supporting more robust applications in hydrogeology and increasing confidence in both qualitative interpretations and quantitative flux estimates.

How to cite: Vital, M., Dimova, N., Gilfedder, B., Rodellas, V., Sadler, S., Santoni, S., Huneau, F., Musy, S., Schilling, O. S., Ortega, L., and Schubert, M.: Using ²²²Rn as a tracer in hydrogeological studies: a critical review of qualitative and quantitative assessments of potential sources of error, EGU General Assembly 2026, Vienna, Austria, 3–8 May 2026, EGU26-2583, https://doi.org/10.5194/egusphere-egu26-2583, 2026.

Stable water isotopes (i.e., δ¹⁸O, δ²H) are key tracers of water sources, flow pathways, and transport processes in hydrological systems. In snow-dominated regions, seasonal snowpacks strongly control water storage, release, and snowmelt isotope signals used in tracer-aided analyses. However, the isotopic evolution of seasonal snowpacks is still poorly represented in hydrological models. Most previous models therefore assume that snowmelt isotopic composition equals that of the snowpack, despite observations showing systematic differences during the melt season. These differences can not be resolved without explicitly representing isotope fractionation and are further constrained by the limited availability of high-resolution isotope data. The objective of this study is therefore to improve the simulation of snowpack and snowmelt isotope dynamics by developing and systematically evaluating a physically based, isotope-enabled multi-layer snowpack model (FSM-Iso) for a boreal subarctic environment. The analysis is based on high-temporal-resolution observations of snowpack and snowmelt isotopic composition, snow water equivalent, and meteorological forcing from northern Finland (Pallas site). FSM-Iso explicitly couples stable water isotope evolution to snow, isotope mass and energy balance and represents isotope fractionation during sublimation, melting, and refreezing using physically based formulations. Model performance is evaluated through a stepwise comparison with two widely used isotope-enabled snowpack models that span a range from conceptual to simplified physically based approaches. Results show that FSM-Iso reproduces observed seasonal isotope dynamics in both the snowpack and snowmelt well, including the transition from isotopically depleted early meltwater to progressively enriched meltwater later in the melt season. In contrast, simplified snow isotope models systematically misrepresent both the timing and magnitude of meltwater isotope enrichment, resulting in biased snowmelt isotope signals. These results demonstrate that coupling isotope fractionation processes consistently with mass and energy balance is critical for reliable tracer-aided hydrological modelling in snow-dominated catchments.

How to cite: Wang, S. and Ala-aho, P.: Advancing isotope-enabled snowpack modelling: Development and evaluation at a boreal-subarctic site, EGU General Assembly 2026, Vienna, Austria, 3–8 May 2026, EGU26-2596, https://doi.org/10.5194/egusphere-egu26-2596, 2026.

EGU26-2888 | ECS | Orals | HS2.2.2

Topographic controls on the hydrochemical and isotopic evolution of groundwater in semiarid landscapes 

Chengwei Wan, Shawan Dogramaci, Jennifer Gleeson, Paul Paul Hedley, Pauline Grierson, John J. Gibson, and Grzegorz Skrzypek

Sustainable groundwater management in water-scarce semiarid environments is challenging because it relies on understanding the intricate coupling between episodic recharge and hydrochemical evolution. In this study, conducted in the Pilbara region of Western Australia, ~6000 water analyses from ~1,800 groundwater boreholes and ~300 surface-water sites collected over a decade of monitoring (2015–2024) were used to develop a conceptual model of groundwater hydrochemical evolution.

Stable hydrogen and oxygen isotope compositions indicate that groundwater recharge is not seasonal but instead occurs during sporadic tropical cyclones, which deliver precipitation with distinctly lower δ2H and δ18O values than local groundwater. Self-Organizing Maps (SOM), applied to stable isotope and hydrochemical data, identified five distinct categories that capture hydrochemical transition from recharge sources to endorheic basins. The evolutionary pathway begins in freshwater headwaters, where sulfide oxidation generates acidity that enhances carbonate dissolution and silicate weathering. As groundwater moves to alluvial plains, geochemical control shifts towards cation exchange, ultimately cumulating in low-lying zones where evaporative concentration dominates, and brine formation occurs. Structural Equation Modelling (SEM) confirms a fundamental spatial regime shift between inland and coastal systems. Inland chemistry is primarily controlled by topography and, at times, by internal rock-water interactions. Conversely, coastal water hydrochemistry is related to distance to the coast.

Hydrochemical categories serve as effective proxies for hydraulic behaviour. Hydrochemically "young" recharge freshwaters exhibit dynamic water level responses to cyclonic events, whereas evolved, saline waters in the alluvial plains maintain comparatively stable water tables. These patterns demonstrate that hydrochemical evolution and hydraulic dynamics are tightly coupled, reflecting systematic differences in water retention times across the landscape. Together, they reveal a clear transition from lithological controls in recharge zones to salinity-driven physical controls in terminal areas.

These findings indicate that sustainable yield assessments should distinguish between the rapid-response behaviour of headwater systems and the storage-dominated dynamics of downstream alluvial basins.

How to cite: Wan, C., Dogramaci, S., Gleeson, J., Paul Hedley, P., Grierson, P., Gibson, J. J., and Skrzypek, G.: Topographic controls on the hydrochemical and isotopic evolution of groundwater in semiarid landscapes, EGU General Assembly 2026, Vienna, Austria, 3–8 May 2026, EGU26-2888, https://doi.org/10.5194/egusphere-egu26-2888, 2026.

EGU26-3259 | Orals | HS2.2.2

Trifluoroacetate (TFA) – Potentials and Limits of a New Hydrological Pollution Tracer 

Jens Lange, Larissa Bulka, Dario Nöltge, Finnian Freeling, Konstantin Ilgen, Christoph Külls, and Michael Müller

Trifluoroacetate (TFA), the perfluorinated analogue of the acetate ion, is an emerging pollutant that is highly water-soluble, mobile and persistent in the environment. TFA has many precursors and a variety of atmospheric and terrestrial sources. This study investigates the suitability of this molecule to act as a hydrological pollution tracer to characterize water types and to identify young recharge components and river water infiltration. For this purpose, TFA was compared with classical environmental tracers (stable water isotopes and major ions) in depth-profiles of three groundwater wells and in surrounding rivers. The tapped porous aquifer supplies drinking water for the city of Freiburg, Germany, and is located in an area used by intense agriculture. Rising atmospheric inputs and, probably, the increased use of fluorinated pesticides led to a strong signal of TFA in recent soil water. This signal enabled efficient differentiation between different surface water types and groundwater of different ages. Dual−anion plots with TFA and Cl/NO3 were more efficient than the traditional dual−isotope plot with 18O and deuterium. These plots allowed estimates about the approximate contribution of TFA from agricultural soil. Moreover, TFA traced considerable contributions of relatively young soil water components down to deep groundwater. We see promising applications of TFA as a tracer in the future, provided that TFA input functions are well-defined, the major TFA sources are known, and other tracers are used in parallel to back up TFA-derived results.

This study received funds by two research projects. By the EU, within the European Regional Development Fund (ERDF), support measure INTERREG VI in the Upper Rhine as part of the Reactive City A3-4 project (“Towards a Reactive City without Biocides”) and by the Federal Ministry of Research, Technology and Space (BMFTR), who is funding the “StressRes” project (02WGW1663A), within the LURCH funding measure as part of the federal research program on water “Wasser: N”. Wasser: N contributes to the BMFTR “Research for Sustainability’ (FONA) Strategy”).

How to cite: Lange, J., Bulka, L., Nöltge, D., Freeling, F., Ilgen, K., Külls, C., and Müller, M.: Trifluoroacetate (TFA) – Potentials and Limits of a New Hydrological Pollution Tracer, EGU General Assembly 2026, Vienna, Austria, 3–8 May 2026, EGU26-3259, https://doi.org/10.5194/egusphere-egu26-3259, 2026.

EGU26-3491 | ECS | Posters on site | HS2.2.2

High Resolution Machine Learning Derived Global Monthly Isoscapes for Stable Water Isotopes with Pixel-Level Uncertainty Intervals 

Johannes Scherer, Swantje Petersen, and Julian Klaus

Stable oxygen and hydrogen isotope ratios in precipitation (δ18O, δ2H) are powerful tracers of water cycle processes. However, the construction of global isoscapes (i.e., gridded maps of isotopic composition) is limited by sparse and clustered station networks and by simplified assumptions about prediction uncertainty, reducing their reliability in hydrological and ecological applications.

Here, we present the development of global 0.04° (~ 4 km) monthly precipitation isoscapes using gradient-boosted trees trained on ~1900 stations (1962-2024) and > 15 environmental predictors including climate variables, topography, and regional circulation patterns. Spatial independence is ensured through geographically stratified cross-validation. Leave-one-region-out sensitivity tests demonstrate robust generalization to unsampled regions, while at the same time highlighting the importance of regional fractionation controls, that cannot be captured without adequate spatial coverage.

To quantify prediction uncertainty, we combine bootstrap ensembles with quantile random forests calibrated on out-of-fold errors. This approach achieves ~60-65 % empirical coverage of independent test stations, which is more than double compared to conventional bootstrap intervals (~24 %) and approaches the nominal 68 % target. Calibrated uncertainty maps dynamically highlight regions with sparse data or complex climate, while well-sampled regions show significantly lower uncertainties.

These spatially adaptive, calibrated uncertainty intervals combined with demonstrated transferability to unsampled regions enable downstream applications that require actionable confidence information. To our knowledge, this represents both the first application of machine learning to derive global monthly isoscapes for δ18O and δ2H, and the first framework providing explicitly calibrated, high resolution, pixel-level prediction intervals with validated transferability. 

How to cite: Scherer, J., Petersen, S., and Klaus, J.: High Resolution Machine Learning Derived Global Monthly Isoscapes for Stable Water Isotopes with Pixel-Level Uncertainty Intervals, EGU General Assembly 2026, Vienna, Austria, 3–8 May 2026, EGU26-3491, https://doi.org/10.5194/egusphere-egu26-3491, 2026.

As droughts become more common, they affect the local availability of water, but also alter the quality and ecology of streams. The complex interactions between landcover change, hydrological partitioning and water availability as well as water quality are difficult to quantify, especially at different temporal and spatial scales. Tracers can help test and constrain hydrological models and reveal new insights into the relationships between water fluxes, storage and ages. Here, we present insights from integrated isotope and water quality monitoring and modelling approaches on pathways, transformations and catchment responses. We coupled stable water isotopes into a water quality modelling framework to simulate 30-years of NO3-N dynamics. The isotope-aided model effectively constrained hydrological processes and mapped the (dis)connection of different flow paths involved in NO3-N transport. We use such tracer-aided modelling framework to investigate, quantify and visualise ecohydrological fluxes and dynamics of water storage, pathways and ages across different scales as well as the effects of connectivity between landscapes and riverscapes. Results also highlight the role of transient hydrological states in nutrient cycling on top of landscape characteristics. Hydrological connectivity controls N transformations by regulating soil moisture and determining available NO3-N for processing from upstream inflows. Hydrological pathways determine where, when, and which NO­3-N storages are connected. At our groundwater-dominated study catchment, subsurface flows are the primary pathway, but transition to near-surface flow occurred in specific riparian “hot spots” due to development of soil saturation along flow paths, resulting in flashy stream NO3-N peaks. Our findings underscore the necessity of considering hydrological connectivity in nutrient modelling and management planning, which can be revealed by tracer-aided modelling. Such integrated modelling frameworks provide robust science-based evidence for policy makers allowing quantitative assessment of landuse effects on connectivity, water availability and quality as well as effective communication with stakeholders.

How to cite: Tetzlaff, D. and Soulsby, C.: Tracing hydrological connectivity and biogeochemical interactions across scales through isotope-enabled water quality modelling frameworks, EGU General Assembly 2026, Vienna, Austria, 3–8 May 2026, EGU26-4509, https://doi.org/10.5194/egusphere-egu26-4509, 2026.

To manage water resources and forecast river flows, hydrologists seek to understand the processes that move water from precipitation, through watersheds, into river channels. A fundamental question in hydrology is to explain where and when different processes occur, and how they are controlled by climate and landscape. Understanding the patterns and drivers of hydrological processes over large scales will transform our ability to build accurate forecast models, to improve water management based on knowledge of water storage and flow, and to adapt to changes in hydrological extremes.

Much of our understanding of runoff generation processes and their drivers derives from research watersheds, where intensive monitoring and analysis allows hydrologists to develop a detailed perceptual model of water sources, flow paths, and residence times. This study quantifies the role of tracer data in process understanding, by synthesizing knowledge from a global database of 400 research watersheds with published descriptions of dominant flow pathways. By examining the underlying journal articles in the database, we assess what types of field evidence are most valuable to deduce dominant flow pathways and evaluate the strength of evidence in individual watersheds. Using a standard process classification, we analyze the extent to which tracer data has proved effective for understanding a range of hydrological processes across different climate and landscape regions.

This study shows how a knowledge synthesis approach enables deep investigation into how hydrologists use tracers to generate knowledge about runoff generation processes, leveraging decades of grant funding and fieldwork effort. Our results will be valuable for the design of future hydrological observatories or research watersheds that seek to analyze dominant runoff generation processes for applications such as flood mitigation and watershed restoration.

How to cite: McMillan, H.: The role of tracers in hydrological process understanding: a global perspective, EGU General Assembly 2026, Vienna, Austria, 3–8 May 2026, EGU26-5963, https://doi.org/10.5194/egusphere-egu26-5963, 2026.

EGU26-6205 | ECS | Orals | HS2.2.2

Isotopic signatures of mountain block recharge and groundwater flow paths inferred from EMMA analysis in a tropical mountainous river basin draining the Southern Western Ghats, India 

Gayathri Jayan Anila, Vipin T Raj, Utpal Majee, Sreelash Krishnankutty, Maya Kesavan, and Padmalal Damodaran

Groundwater is a critical source of drinking water in arid and semi-arid regions of developing countries. Understanding groundwater recharge sources and mechanisms is crucial for sustainable resource management in a changing climate.  Mountain block recharge (MBR) plays an important role in sustaining groundwater in downslope and valleys; however, distinguishing MBR from local and shallow recharge processes remains complex. This study investigates the role of MBR in a tropical river basin- the Upper Bhavani River Basin, draining the Southern Western Ghats, India, using stable isotopes of oxygen (δ¹⁸O) and chloride (Cl-) as conservative tracers. Groundwater samples collected from confined and unconfined aquifers were analyzed to understand spatial variability in isotopic and geochemical signatures across the basin. End-member mixing analysis (EMMA), applied to normalized δ¹⁸O and Cl- data, indicates that groundwater in the basin results from conservative mixing among three conceptual recharge components: mountain-front recharge (MFR), mountain-block recharge (MBR), and front-slope recharge (FSR). Most samples plot within the defined mixing space, supporting the assumption of conservative tracer behaviour and the applicability of EMMA in this hard-rock setting. The results suggest that focused recharge at mountain fronts and shallow recharge along slopes play a dominant role in sustaining groundwater resources, while deep mountain block recharge exhibits a comparatively limited influence. Confined aquifers commonly display elevated total dissolved solids, reflecting prolonged subsurface residence times and enhanced water–rock interaction within the fractured crystalline aquifer, which indicates a contribution from deep mountain block flow. Overall, this study highlights the importance of shallow and focused recharge processes in mountainous hard-rock terrains and demonstrates the value of isotope-based end-member mixing analysis in understanding groundwater recharge mechanisms and flow paths. The findings provide valuable insights for groundwater resource management and protection strategies in water-stressed mountainous regions.

How to cite: Jayan Anila, G., Raj, V. T., Majee, U., Krishnankutty, S., Kesavan, M., and Damodaran, P.: Isotopic signatures of mountain block recharge and groundwater flow paths inferred from EMMA analysis in a tropical mountainous river basin draining the Southern Western Ghats, India, EGU General Assembly 2026, Vienna, Austria, 3–8 May 2026, EGU26-6205, https://doi.org/10.5194/egusphere-egu26-6205, 2026.

Accurate hydrological simulation and credible climate-change projections in cold mountainous basins are hindered by complex phase transitions and strong cryospheric controls that exacerbate model equifinality and uncertainty in runoff component partitioning. This study advances a tracer-aided hydrological modeling framework by using stream-water stable isotopes to diagnose model structural deficiencies associated with frozen soils and to quantify how such deficiencies propagate into projections of hydrological sensitivity to climate change. We implement the tracer-aided Tsinghua Representative Elementary Watershed model (THREW-T) in a Tibetan Plateau cold catchment and compare two configurations: a baseline model lacking explicit frozen-soil processes (THREW-NoFS) and an enhanced version incorporating a simplified catchment-scale frozen-soil module with dynamically varying soil hydraulic properties (THREW-FS). While both configurations reproduce observed streamflow, isotope constraints expose a key limitation of THREW-NoFS: it cannot simultaneously capture baseflow dynamics and stream-water isotopic signatures, indicating missing freeze–thaw controls that effectively induce unrepresented seasonal variability in soil hydraulic behavior. Incorporating the frozen-soil module substantially improves the joint simulation of streamflow and isotopes and yields a more physically consistent runoff partitioning, characterized by reduced baseflow during dry seasons and increased subsurface runoff contributions during wet seasons. Frozen soils exert limited influence on annual discharge totals but markedly reshape runoff seasonality through altered surface–subsurface connectivity. Importantly, the isotope-informed structural correction changes projected climate sensitivity: both models suggest runoff decreases with warming and increases with precipitation intensification, yet THREW-NoFS produces systematically stronger sensitivities and tends to overestimate runoff responses because it provides more available water for evaporation and misrepresents surface–subsurface partitioning. These results demonstrate that tracer-aided hydrological models, when constrained by stable isotopes, offer a powerful pathway to diagnose frozen-soil impacts on model structure, reduce uncertainty in runoff component contributions, and generate more reliable projections of hydrological sensitivity to climate change in cryospheric basins.

How to cite: Nan, Y. and Tian, F.: Tracer–aided method diagnoses hydrological model structural deficiencies and improves hydrological simulations in frozen-soil–affected catchments, EGU General Assembly 2026, Vienna, Austria, 3–8 May 2026, EGU26-6532, https://doi.org/10.5194/egusphere-egu26-6532, 2026.

EGU26-6743 | Orals | HS2.2.2

Data-Driven Interpretation of High-Resolution Stream Tracer Data 

Paolo Benettin, Quentin Duchemin, Raphaël Miazza, and James Kirchner

Compared with other hydrologic disciplines, tracer hydrology remains relatively data scarce, with most tracer series not exceeding a few hundred data points. Nevertheless, the availability and temporal resolution of tracer data is increasing, with opportunities to develop new models that rely less on a-priori assumptions and more on the data themselves.

Here, we introduce a novel data-driven approach for interpreting conservative tracer measurements in streamflow through the lens of transit time distributions (TTDs). We build on concepts from traditional TTD modelling and integrate them with tools from statistical learning. The proposed model is designed to infer time-variable TTDs by leveraging hydrologic and tracer data, but it can also incorporate additional information that may help characterize the catchment state, as e.g. time series of soil moisture, snow cover or plant status.

As transit times cannot be measured directly in any real-world catchment, we test and validate the model using virtual benchmark datasets designed to reflect realistic flow and transport dynamics. Results suggest that both long-term monitoring campaigns (e.g. multiple years of fortnightly sampling) and high-frequency in-situ measurements (e.g. 1-2 years of subdaily sampling) may provide sufficient information for data-driven interpretations of TTDs. While more applications and testing are needed, these early developments highlight the potential of data-driven methods for advancing our understanding of flow and transport processes in catchments.

How to cite: Benettin, P., Duchemin, Q., Miazza, R., and Kirchner, J.: Data-Driven Interpretation of High-Resolution Stream Tracer Data, EGU General Assembly 2026, Vienna, Austria, 3–8 May 2026, EGU26-6743, https://doi.org/10.5194/egusphere-egu26-6743, 2026.

EGU26-7408 | Posters on site | HS2.2.2

A multi-tracer hydrological model reveals dissolved organic carbon dynamics in a cold mountainous basin 

Chenxin Xie, Yi Nan, and Fuqiang Tian

Dissolved organic carbon (DOC) dynamics in cold mountainous basins, significantly influenced by cryospheric processes, remain poorly understood due to model limitations and scarce observations. This study explores DOC dynamics in the Source Region of the Yangtze River (SRYR) on the Tibetan Plateau using a novel multi-tracer-aided hydrological model, THREW-IC. The model integrates modules for water isotopes and DOC into the distributed THREW framework, explicitly representing key cryospheric processes (snow, glacier, frozen soil). It was calibrated and validated against daily streamflow, streamwater δ¹⁸O, and streamwater/groundwater DOC concentrations from 2010-2018. Results demonstrate satisfactory model performance across all objectives, confirming its capability to simulate coupled hydrological-biogeochemical processes. Sensitivity analysis revealed that parameters governing runoff generation  were most influential for streamflow simulation, whereas DOC-specific parameters were crucial for capturing DOC dynamics but less critical for water flux or isotope simulations, highlighting the value of multi-tracer constraints. Spatially, DOC production was predominantly linked to water storage in unsaturated soils. The analysis further elucidated the modulating role of soil freeze-thaw cycles on DOC production and transport. This study underscores the efficacy of a multi-tracer approach in reducing model uncertainty and advancing the mechanistic understanding of DOC generation and export in complex, cold mountainous environments.

How to cite: Xie, C., Nan, Y., and Tian, F.: A multi-tracer hydrological model reveals dissolved organic carbon dynamics in a cold mountainous basin, EGU General Assembly 2026, Vienna, Austria, 3–8 May 2026, EGU26-7408, https://doi.org/10.5194/egusphere-egu26-7408, 2026.

We present a novel framework that leverages stable water isotopes measurements (δ¹⁸O) across multiple hydrological fluxes (snowpack, rainfall, several springs and stream) to constrain dominant runoff-generation processes during two summers in a snow-dominated headwater catchment in the western Swiss Alps (Vallon de Nant). To achieve this, a new flux partitioning routine has been developed to separate the contributions from (i) snowmelt, (ii) direct runoff, (iii) fast subsurface, and (iv) slow subsurface flow paths to streamflow. This routine has then been integrated into a simple hydrological model which combines the Geomorphological Instantaneous Unit Hydrograph and multiple subsurface reservoirs.

Results show that the model is able to simulate both streamflow and stream water isotopic composition at very high temporal resolution (10-minute intervals). By jointly calibrating the model with streamflow and streamflow isotopes during the summer season, we observe altered flux partitioning, with smaller event-water contribution to streamflow routed through direct runoff. We also find that incorporating stable water isotopes helps to refine model structure, to reduce parameter uncertainty, and to improve process attribution of short-timescale rainfall-runoff dynamics.

How to cite: Benoit, L., Beria, H., Ceperley, N., and Schaefli, B.: Combining stable water isotopes and streamflow observations to model rainfall-runoff dynamics at 10-min resolution in a steep alpine catchment, EGU General Assembly 2026, Vienna, Austria, 3–8 May 2026, EGU26-8001, https://doi.org/10.5194/egusphere-egu26-8001, 2026.

Catchments are commonly treated as hydrologically closed systems; however, subsurface flow across topographic watershed boundaries can occur in tectonically complex regions. In this study, tracer methods including stable water isotopes were used to investigate potential inter-catchment groundwater contributions in faulted and volcanic terrains of central Japan.

The study area covers the Miya River and Kamanashi River catchments, where drainage divides are ambiguous and major fault zones run subparallel to river channels. River water and spring water were sampled, and water chemistry and oxygen/hydrogen stable isotope ratios were analyzed.

A local meteoric water line was made using precipitation collected for 5 years, providing a regional isotopic reference. All samples plotted near the meteoric water line, indicating a meteoric origin; however, systematic spatial differences were observed. Overall, isotope ratios increased in the order of spring water, Kamanashi River, and Miya River. Tributaries of the Miya River showed distinct isotopic clustering depending on their source mountains: tributaries originating from the Akaishi Mountains plotted along the meteoric water line, whereas those from the Yatsugatake volcanic area formed a linear trend slightly offset from the meteoric water line. In contrast, both the main stream and tributaries of the Kamanashi River consistently plotted on the meteoric water line, regardless of source area.

Along the Miya River main stream, upstream sites reflected isotopic signatures of local tributaries, while downstream sites showed a shift toward meteoric-line values that cannot be explained solely by mixing of Miya River tributaries. This interpretation is supported by total dissolved solids (TDS) data: tributaries from the Yatsugatake area exhibited higher TDS, whereas the Miya River main stream showed lower values than expected from tributary contributions alone. Given that the Kamanashi River catchment is characterized by generally lower TDS, these combined isotopic and geochemical patterns suggest subsurface water contributions from the Kamanashi River catchment to the Miya River across the drainage divide.

How to cite: Sakakibara, K. and Takahashi, T.: Water isotope evidence for inter-catchment groundwater flow across drainage divides in faulted and volcanic terrains of central Japan, EGU General Assembly 2026, Vienna, Austria, 3–8 May 2026, EGU26-8592, https://doi.org/10.5194/egusphere-egu26-8592, 2026.

EGU26-8614 | ECS | Orals | HS2.2.2

Quantifying soil moisture fluxes and evaporative controls in a semiarid floodplain 

Wilfren Clutario, James McCallum, Matthias Leopold, Jennifer Gleeson, and Grzegorz Skrzypek

Arid and semiarid zones cover roughly 70 % of Australia, including the Pilbara region of Western Australia. The Pilbara experiences low seasonal rainfall of ~350 mm/y, with nearly 80 % of precipitation estimated to be lost to evaporation. Subsurface water fluxes are vital to ecohydrological functioning in these environments, yet remain poorly understood. This study integrates stable water isotopes (δ2H and δ18O) with direct hydrometric observations to characterise soil moisture dynamics in semiarid floodplain soils. The aim is to constrain isotope-based inferences using physically measured soil water fluxes to clarify how episodic water inputs are partitioned, retained, and lost in semiarid floodplains under increasing water scarcity. Vertically resolved isotope profiles were combined with continuous measurements from smart lysimeters and soil-moisture probes across six sites. To our knowledge, this work represents the first combined application of smart lysimeters and stable isotope analyses in natural environments in Australia. Near-surface moisture is strongly affected by evaporation, with elevated δ2H and δ18O values extending to the depths of ~50 cm. Below this zone, isotope compositions remain comparatively uniform, indicating limited vertical exchange and minimal deep percolation. Only substantial rainfall events (> 60-90 mm) generated transient pulses characterised by low δ-values consistent with episodic deep infiltration. Spatial variability across sites revealed systematic gradients in moisture retention and isotope composition that correspond to soil texture and structure. Shallow infiltration exhibited highly variable instantaneous rates (3.33 – 300 mm/hr), controlled primarily by rainfall intensity and surface conditions. Together, these multi-method observations provide a detailed understanding of flow paths and hydrological transformations in strongly evaporative semiarid environments, demonstrating how stable isotopes, combined with lysimeters and soil moisture probes, can resolve catchment-scale responses and enhance water balance quantification and tracing.

How to cite: Clutario, W., McCallum, J., Leopold, M., Gleeson, J., and Skrzypek, G.: Quantifying soil moisture fluxes and evaporative controls in a semiarid floodplain, EGU General Assembly 2026, Vienna, Austria, 3–8 May 2026, EGU26-8614, https://doi.org/10.5194/egusphere-egu26-8614, 2026.

EGU26-8713 | ECS | Orals | HS2.2.2

Nitrate transport process driven by groundwater-surface water interactions in the Langat River Basin, Malaysia 

Mayu Ogiya, Koichi Sakakibara, Yusra Shabir, Noorain Mohd Isa, Takashi Nakamura, Maki Tsujimura, and Siti Nurhidayu

Rapid population growth and agricultural expansion have increased nitrogen input in tropical regions, increasing the risk of nitrate contamination of water resources in tropical catchments. Most catchment-scale studies of nitrate contamination have focused on either surface water or groundwater. However, because nitrate is highly soluble and mobile, investigating interactions between groundwater and surface water systems is essential for tracking nitrate contamination. In this study, a multi-isotope tracer approach (δ2H-H2O, δ18O-H2O, δ15N-NO3-, and δ18O-NO3-) was applied to investigate three-dimensional nitrate transport processes through groundwater–surface water interactions. The study area is the Langat River Basin (2350 km2), in Selangor, Malaysia, which includes diverse land uses such as tropical rainforest, urban areas, peatlands, and oil palm plantations. Water sampling was carried out in wet and dry seasons at a spatial network of 44 groundwater, 17 river water, and 4 irrigation drainage channel sites. Results in the dry season showed that the mean nitrate concentration in river water was 13.4 mg/L (range 1.38 to 96.2 mg/L), while much lower concentrations were observed in groundwater (0.69 mg/L) and irrigation drainage (0.80 mg/L). Spatial stable water isotope compositions showed that groundwater near the river had similar signatures to river water, whereas groundwater farther from the river was more depleted, indicating river water recharge into the aquifer is important in floodplain areas. Nitrate isotope data revealed that sewage and manure were the dominant nitrate sources in the floodplain, affecting both river water and groundwater. In contrast, downstream areas dominated by oil palm plantations showed nitrate sources derived from fertilizer were dominant. These results demonstrate that land use and groundwater–surface water interactions control nitrate sources and transport pathways, emphasizing the importance of integrated water flow for assessing nitrate pollution in tropical catchments.

How to cite: Ogiya, M., Sakakibara, K., Shabir, Y., Mohd Isa, N., Nakamura, T., Tsujimura, M., and Nurhidayu, S.: Nitrate transport process driven by groundwater-surface water interactions in the Langat River Basin, Malaysia, EGU General Assembly 2026, Vienna, Austria, 3–8 May 2026, EGU26-8713, https://doi.org/10.5194/egusphere-egu26-8713, 2026.

EGU26-9400 | ECS | Posters on site | HS2.2.2

Young Water Fractions and Hydrogeological Controls in Alpine Springs 

Magdalena Seelig, Simon Seelig, Felix Thalheim, Paul Töchterle, Matevž Vremec, Martin Masten, Heike Brielmann, Jutta Eybl, and Gerfried Winkler

The young water fraction (Fyw) has become a widely used metric to characterize catchment transit time behavior while avoiding many of the aggregation biases inherent in mean transit time estimates. Although Fyw has been widely studied in rivers, little is known about its magnitude, variability, and controls in springs, despite their importance for mountain hydrology and water supply. Here, we present the first systematic, large-sample analysis of young water fractions in spring discharge.

We quantify Fyw for 469 springs across Austria, spanning a broad range of hydrogeological settings including karst, talus, fractured, and alluvial aquifers. Fyw is estimated by comparing seasonal stable isotope cycles in precipitation and spring water to quantify the fraction of water reaching the spring within approximately 2–3 months. Across all springs, Fyw values are generally low and approximately log-normally distributed, with a mean of about 0.06, indicating a dominant contribution of older groundwater. However, pronounced differences emerge between spring types. Karst springs exhibit the highest young water fractions and the largest variability, reflecting rapid and dynamically activated flow paths. Talus springs show intermediate values, while fracture and alluvial springs display consistently low Fyw with limited variability, indicative of strongly buffered flow systems.

We further analyze the sensitivity of Fyw to discharge, revealing contrasting responses to hydrologic forcing. Karst springs show the strongest discharge dependence, consistent with shifting proportions of fast and slow flow paths, whereas fracture springs exhibit near-invariant young water fractions across flow conditions. Comparison with a reference dataset of 565 rivers reveals a clear and systematic offset between surface- and groundwater-dominated systems. Springs consistently contain substantially lower fractions of young water than rivers, highlighting the dominant role of slow subsurface transport.

By resolving young water fractions across a large and diverse population of springs, this study provides new quantitative constraints on groundwater transit time dynamics and demonstrates the diagnostic value of Fyw for conceptual modeling, groundwater protection, and contamination risk assessment in alpine environments.

How to cite: Seelig, M., Seelig, S., Thalheim, F., Töchterle, P., Vremec, M., Masten, M., Brielmann, H., Eybl, J., and Winkler, G.: Young Water Fractions and Hydrogeological Controls in Alpine Springs, EGU General Assembly 2026, Vienna, Austria, 3–8 May 2026, EGU26-9400, https://doi.org/10.5194/egusphere-egu26-9400, 2026.

EGU26-10159 | ECS | Posters on site | HS2.2.2

Stable isotope patterns and dynamics in a sandy urban aquifer — The Brunswick Aquifer in Northern Germany 

Tobias Langmann, Paul Koeniger, and Hans Matthias Schoeniger

Sustainable drinking water supply from groundwater reservoirs in urban areas is becoming increasingly important against the backdrop of global change. Knowledge of groundwater recharge processes is an important prerequisite for future-oriented resource management. The sandy aquifer beneath the northern German city of Braunschweig (Brunswick), with a population of 250,000, is used for the production of 500,000 m3 of drinking water per year for municipal water supply. The aquifer is an unusual  example of a drinking water resource, as it is characterized by a high proportion of sealed surfaces within the densely built-up urban area. By analyzing 114 groundwater samples (from 92 monitoring wells) and 47 river water samples for stable water isotopes (δ¹⁸O, δ²H), we aimed to identify patterns in isotopic compositions to gain insights into groundwater recharge processes.

Despite the small study area (40 km2), the groundwater from the Brunswick aquifer exhibited a fairly high heterogeneity in its isotopic composition. δ²H values for groundwater samples ranged from –60.4 ‰ to –41.3 ‰ (median –57.0 ‰), and δ¹⁸O values from –8.7 ‰ to –4.7 ‰ (median –8.1 ‰). Groundwater and surface water were isotopically similar, precluding the quantification of recharge from river infiltration. Compared to the Local Meteoric Water Line (LMWL) for Hannover, many of the well waters exhibit lower deuterium excess, indicating an evaporation influence before or during recharge. The shallow groundwater (< 15 m below ground level) at seven wells showed little seasonal variation in isotope composition, especially for δ²H in some wells. Deeper groundwater presented more negative δ-values, suggesting older groundwater and cooler recharge temperatures. A comparison with amount-weighted annual mean δ‐values of precipitation in Hannover (50 km distance) indicates that mainly winter precipitation (November to April) dominates recharge. The low isotope variability of shallow groundwater confirms that infiltrating precipitation contributes to groundwater recharge in heavily sealed urban areas. Further investigations need to quantify these findings and to validate groundwater recharge calculations derived by water balance modeling.

How to cite: Langmann, T., Koeniger, P., and Schoeniger, H. M.: Stable isotope patterns and dynamics in a sandy urban aquifer — The Brunswick Aquifer in Northern Germany, EGU General Assembly 2026, Vienna, Austria, 3–8 May 2026, EGU26-10159, https://doi.org/10.5194/egusphere-egu26-10159, 2026.

EGU26-10204 | ECS | Orals | HS2.2.2

Tracer Evolution in Multiscale Oceanic Flow Fields 

Francesco Maria Benfenati, Francesco Trotta, and Nadia Pinardi

Tracking ocean pollution and marine litter is a compelling problem for safeguarding ocean ecosystems and is recognized as a priority under the UN Ocean Decade Vision 2030. This work investigates how the evolution of pollution transport is affected by ocean dynamics across multiple spatial scales, with particular focus on mesoscale and submesoscale flow structures.

To achieve this goal, high- and very high-resolution regional ocean simulations were conducted in the Subpolar and Tropical Northern Atlantic, two open ocean regions characterized by a different baroclinic deformation radius and therefore different mesoscale eddy sizes. Secondly, different oil spill simulations were performed to understand how submesoscale filaments influence pollutant concentration patterns. Idealized coastlines are considered to perform a statistical analysis of beached oil distributions and particles first-passage time, enabling a direct link between transport pathways and underlying flow properties.

The high-resolution (“child”) ocean fields were obtained by dynamically downscaling the 1/12° (“parent”) Global Ocean Physics Analysis and Forecast product from the Copernicus Marine Service using the SURF platform (v2.0.1), based on NEMO v5.0.1. Horizontal resolutions of 1/36° and 1/108° were achieved, covering the period 1 January–30 June 2025. Each month has been simulated independently to maintain consistency between the parent and child model fields.

The MEDSLIK-II v3.0 software has been used to run multiple oil spill simulations in both the high-resolution and coarse fields. One simulation is run every five days in the period covered by the high-resolution simulations. Each simulation covers ten days and is characterized by a punctual continuous release lasting five days.

Beached oil concentration and first-passage time probability distribution functions were computed and compared across resolutions and dynamical regimes.

The results show that oil concentration distributions associated with highly resolved ocean fields, appear to be characterized by fatter tails and larger concentration extreme values. This indicates that submesoscale activity, better resolved at finer resolutions, enhances surface pollutant aggregation, while coarser simulations tend to underestimate these extremes.


How to cite: Benfenati, F. M., Trotta, F., and Pinardi, N.: Tracer Evolution in Multiscale Oceanic Flow Fields, EGU General Assembly 2026, Vienna, Austria, 3–8 May 2026, EGU26-10204, https://doi.org/10.5194/egusphere-egu26-10204, 2026.

EGU26-11588 | Orals | HS2.2.2

Multivariate statistical analysis of hydrogeochemical and stable isotopic data for characterising groundwater dynamics of an anthropized alluvial aquifer 

Hassan Mahamat, Anne-Laure Cognard-Plancq, Emilie Gibert, Noé Barthelemy, and Sebastien Savoye

In France, alluvial aquifers provide 45% of the freshwater used for drinking, agriculture, and industry (Maréchal and Rouillard, 2020). These aquifers are often hydraulically connected to rivers and are particularly vulnerable due to their proximity to the surface. This proximity makes them sensitive to anthropogenic pressures both quantitatively and qualitatively. The current study aims to better understand groundwater-surface water interactions in an anthropized alluvial aquifer in the lower Rhône Valley. This goal will be achieved using multivariate statistical methods on hydrogeochemical and stable water isotope data. Two datasets were analyzed. One dataset contained inert tracers (Cl, Br, δ2H and δ18O) and included 667 water samples (40 rainwater, 110 surface water and 517 groundwater). The other dataset contained major and minor ions (Ca2+, Mg2+, K+, Na+, Cl, SO42-, alkalinity, NO3, Br and U(VI)) and stable water isotopes (δ2H and δ18O) data., and included 374 water samples (37 surface water and 337 groundwater). First, a hierarchical cluster analysis (HCA) was applied to both datasets to better understand groundwater recharge and the geochemical processes that control groundwater chemistry in the study area. We used the recently developed t-distributed stochastic neighbor embedding (t-SNE) (Van Der Maaten and Hinton, 2008) method and principal component analysis (PCA) to assist with the cluster analysis and visualization. When HCA, PCA, and t-SNE were applied to inert tracers dataset, the results first revealed the distribution of groundwater on the study site between two recharge sources: the Rhône River and rainfall. Water samples collected along the Rhône River boundary are characterized by highly depleted δ2H and δ18O signatures, indicating the significant influence (up to 80%) of the Rhône on the recharge of the alluvial aquifer in this area. In contrast, groundwater samples collected in the northern and northwestern parts of the site showed highly enriched δ2H and δ18O signatures, similar to those of rainfall indicating dominant recharge from local precipitation. Others water samples are characterized by intermediate δ2H and δ18O signatures, falling between the signatures of rainfall and the Rhône River, indicating mixed recharge. These water samples are predominantly distributed in the southern part of the site. Second, the results revealed the response of the alluvial groundwater to exceptional climatic events. In 2022, particular isotopic signatures with higher deuterium excess and high chloride concentrations were observed in rainwater and the Rhône River, which are reflected in groundwater. This suggests an influence of continental air masses originating from the Sahara Desert (Xu-Yang et al., 2025). When HCA, PCA, and t-SNE were applied to the second dataset containing hydrogeochemical and stable water isotope data, the results identified water samples with high uranium and chloride concentrations, likely due to historical pollution. This study shows that t-SNE is a promising tool for assessing groundwater-surface water interactions in an alluvial aquifer when used to assist in cluster analysis. Compared with PCA, t-SNE can better identify hidden information and perform much better with complex, nonlinear hydrogeochemical, and stable water isotope data.


References

Maréchal and Rouillard, 2020.https://doi.org/10.1007/978-3-030-32766-8_2

Van Der Maaten and Hinton, 2008.Res.9,2579–2625.

Xu-Yang, et al., 2025.https://doi.org/10.1126/sciadv.adr9192


How to cite: Mahamat, H., Cognard-Plancq, A.-L., Gibert, E., Barthelemy, N., and Savoye, S.: Multivariate statistical analysis of hydrogeochemical and stable isotopic data for characterising groundwater dynamics of an anthropized alluvial aquifer, EGU General Assembly 2026, Vienna, Austria, 3–8 May 2026, EGU26-11588, https://doi.org/10.5194/egusphere-egu26-11588, 2026.

EGU26-11808 | ECS | Posters on site | HS2.2.2

Establishment and Evolution of Stable Water Isotopes in Seasonal Alpine Snow 

Jasper F. D. Lammers, Thomas Wagner, Martin Masten, Simon Seelig, Wolfgang Schöner, and Gerfried Winkler

Stable water isotopes are splendid passive tracers, not only suited to show hydrogeological flow paths but also to determine - and possibly quantify - processes at catchment scale, such as evaporation and sublimation. In alpine hydrology, snow largely contributes to groundwater recharge, therefore understanding how the water isotopes in snow are shaped and how they change over time is key. In this study we discuss the potential driving forces of snow isotopic composition in individual snow events, through correlating snow isotopy to several individual meteorological parameters at the field site and at the location of moisture origin using a back trajectory model. Furthermore, in this study we discuss the results of weekly field observations at three sites along an elevational transect within an East Austrian cirque (7 km2), where snow pack melt water and high-resolution snow pack layers isotopy were sampled. Weekly isotopic changes of isotopic snow pack layers are correlated to potential driving forces. Considering the thermal induced snow metamorphism, we installed an array of snow thermometers in the snow throughout the season to correlate the isotopic changes to the snow temperature and thermal gradient. First order isotopes (δ2H and δ18O) show to be significantly correlated to local meteorological conditions like the cloud top pressure, and cloud temperature. The second order isotope, Deuterium excess (dxs), is significantly correlated to the relative humidity and temperature at the moisture origin. Weekly changes in first order isotopes of the seasonal snowpack could be correlated to the average global radiation of the period between sampling, and to the net radiation 24 hours before sampling. Changes in dxs only showed significance to the temperature gradient. Isotopic gradients (i.e., the gradient of snow isotopy above and below a monitored layer) did appear to significantly affect the isotopic change, both for the first and second order isotopes.  This research highlights the local and non-local establishment of meteoric stable water isotopes in winter and proposes that more research needs to be conducted towards isotopic snow profile evolution in a seasonal snowpack. 

How to cite: Lammers, J. F. D., Wagner, T., Masten, M., Seelig, S., Schöner, W., and Winkler, G.: Establishment and Evolution of Stable Water Isotopes in Seasonal Alpine Snow, EGU General Assembly 2026, Vienna, Austria, 3–8 May 2026, EGU26-11808, https://doi.org/10.5194/egusphere-egu26-11808, 2026.

EGU26-13231 | Orals | HS2.2.2

Tracing Recharge Pathways and Drought Stress in Mediterranean Karst Aquifers Using Isotopic Signatures 

Sonia Valdivielso, Marta Turull, Benjamín Crisóstomo, Deby Jurado, Enric Vázquez-Suñé, Sergi Díez, and Sergio Carrero

This study advances the understanding of hydrological and hydrogeological processes in fractured and karstified carbonate massifs by systematically characterizing the isotopic composition of precipitation, surface water, and groundwater in the headwaters of the Llobregat River (Spain). A total of 115 water samples, collected between April 2024 and February 2025, were analyzed to assess temporal and spatial isotopic variability, examine the relationships between stable isotopes and meteorological variables, reconstruct backward air-mass trajectories of moisture sources, and delineate groundwater recharge zones.

Results reveal an isotopic gradient linked to moisture conditions, and show that thermodynamic processes and air-mass origin exert a primary control on d-excess values. Moisture sources contributing to precipitation were identified as the Atlantic Ocean (44%), the Mediterranean Sea (24%), France (18%), and the Cantabrian Sea (14%). Backward trajectory analysis highlights a strong link between moisture provenance and isotopic signatures; however, accumulated precipitation samples represent integrated mixtures of multiple moisture sources.

Groundwater and surface water isotopic signatures suggest dominant winter recharge occurring above 1,800 m a.s.l., consistent with regional topography and the highly karstified structure of the Moixeró massif. Seasonal precipitation signals preserved in groundwater further suggest short residence times and rapid recharge responses.

These findings provide valuable insights for water-resource management and highlight the sensitivity of alpine karst systems to climatic variability, underscoring the need for continued long-term isotopic monitoring and expanded future hydrogeological studies.

How to cite: Valdivielso, S., Turull, M., Crisóstomo, B., Jurado, D., Vázquez-Suñé, E., Díez, S., and Carrero, S.: Tracing Recharge Pathways and Drought Stress in Mediterranean Karst Aquifers Using Isotopic Signatures, EGU General Assembly 2026, Vienna, Austria, 3–8 May 2026, EGU26-13231, https://doi.org/10.5194/egusphere-egu26-13231, 2026.

EGU26-13498 | Orals | HS2.2.2

Empowering model diagnosis with a water tracer model in WRF-Hydro: influence of lateral flow and groundwater on water transit times 

Huancui Hu, Ruby Leung, Zachariah Butler, Stephen Good, Xingyuan Chen, Francina Dominguez, David Gochis, and Aubrey Dugger

While most traditional land models simplify the representation of terrestrial hydrology to the vertical processes, it is increasingly important to represent lateral water movement as model resolution increases. To understand the role of lateral processes in affecting the water transit times (WTTs) in watersheds, we incorporate a water tracer module in the WRF-Hydro model (WT-WRF-Hydro), which explicitly represents surface and subsurface lateral flows. Comparing with simulations that include only vertical flow, enabling the representation of lateral flow shortens the WTTs in a humid watershed due to the additional water pathways through lateral flow. In contrast, enabling lateral flow extends the WTTs in a dry watershed due to the re-infiltration of surface water during surface lateral flow, highlighting the different effects of lateral flow on WTTs in different watersheds.

Recently, WT-WRF-Hydro has been further applied to six National Ecological Observatory Network (NEON) sites to numerically tag monthly precipitation continuously over a seven-year period. Compared with water isotope measurements, WT-WRF-Hydro tends to underrepresent the seasonal variations of water tracer dynamics, with overestimation of WTTs in four basins and underestimation of WTTs in the rest. The overestimation of WTTs in the four basins contrasts with our general assumption of underestimation of WTTs by models and suggests an overestimation of groundwater storage and inadequacy in water mixing processes in WT-WRF-Hydro at those catchments. Using a combination of modeled and observed WTTs may help us understand and diagnose model deficiencies, highlighting the value of water tracers in hydrologic modeling.

How to cite: Hu, H., Leung, R., Butler, Z., Good, S., Chen, X., Dominguez, F., Gochis, D., and Dugger, A.: Empowering model diagnosis with a water tracer model in WRF-Hydro: influence of lateral flow and groundwater on water transit times, EGU General Assembly 2026, Vienna, Austria, 3–8 May 2026, EGU26-13498, https://doi.org/10.5194/egusphere-egu26-13498, 2026.

EGU26-15846 | ECS | Orals | HS2.2.2

Nitrate source apportionment in a semiarid aquifer of Mexico using Bayesian dual-isotope mixing models (δ15N, δ18O, δ11B) 

Juan Antonio Torres-Martínez, Jurgen Mahlknecht, Abrahan Mora, Dugin Kaown, Dong-Chan Koh, Bernhard Mayer, and Dorthe Tetzlaff

Across the semiarid landscapes of northern Mexico, groundwater systems that sustain both regional food production and population centers are approaching critical thresholds owing to sustained overextraction and widespread nitrate contamination. The Meoqui–Delicias aquifer (MDA) exemplifies this challenge, supplying water to approximately 265,000 people, one of the country’s largest irrigation districts, and more than 90,000 head of cattle while experiencing a severe groundwater deficit of ~165 Mm3·yr-1. Moreover, 82% of the sampled wells exceeded the natural nitrate background levels (>3 mg L-1 as N), raising concerns regarding drinking-water security and ecosystem health.

Identifying nitrate sources in such systems is inherently challenging because of the overlapping isotopic signatures of manure, sewage, synthetic fertilizers, and soil nitrogen, further complicated by active biogeochemical transformations. To address this complexity, groundwater samples were first classified using hydrochemical clustering based on self-organizing maps, which revealed two statistically coherent groups. Bayesian mixing models were then constrained using robust isotope end members from the literature. Each model was run with 300,000 MCMC iterations (200,000 burn-in, thinning interval of 100, three parallel chains), with convergence verified using Gelman–Rubin, Heidelberg–Welch, and Geweke diagnostics. A systematic sensitivity analysis (±10–20% perturbations of source signatures) demonstrated the greater robustness and stability of the δ15N vs δ11B model compared to the conventional δ15N vs δ18O pairing model.

The results revealed a marked contrast between the isotopic approaches. The traditional δ15N vs δ18O model aggregates manure and sewage as the dominant combined source (65 ± 20%, ~4.5 mg L-1 N), with secondary contributions from soil nitrogen (22 ± 19%) and fertilizers (13 ± 14%). In contrast, the incorporation of boron isotopes effectively resolved source overlap, identifying livestock manure as the primary contributor (52 ± 12%, ~3.5 mg L-1 N), followed by soil nitrogen (37 ± 14%), with minor inputs from fertilizers (6 ± 8%) and negligible sewage contributions (5 ± 7%). Isotopic evidence further indicated that nitrification dominated nitrogen cycling in approximately 60% of the samples, whereas denitrification was restricted to riparian zones. Stable water isotopes confirm that meteoric recharge is modified by evaporation during irrigation return flows.

Overall, this study demonstrates that boron-enhanced Bayesian isotope mixing models provide a robust and transferable framework for nitrate source apportionment in complex semiarid aquifers, delivering quantitative discrimination where conventional isotope approaches remain ambiguous and offer direct relevance for targeted groundwater management and nutrient-mitigation strategies.

How to cite: Torres-Martínez, J. A., Mahlknecht, J., Mora, A., Kaown, D., Koh, D.-C., Mayer, B., and Tetzlaff, D.: Nitrate source apportionment in a semiarid aquifer of Mexico using Bayesian dual-isotope mixing models (δ15N, δ18O, δ11B), EGU General Assembly 2026, Vienna, Austria, 3–8 May 2026, EGU26-15846, https://doi.org/10.5194/egusphere-egu26-15846, 2026.

EGU26-17100 | Posters on site | HS2.2.2

Stable isotopes of water, dissolved inorganic carbon and nitrate in the Danube River – results from the Joint Danube Survey in 2025 

Andrea Watzinger, Monis Nolitha Gcakasi, Katharina Schott, Michael Stockinger, and Christine Stumpp

Within the frame of the Joint Danube Survey 5 in July 2025, we explore the source and fate of water and nutrients (namely carbon, nitrate, phosphate and sulphate) along the Danube river, major tributaries and selected groundwater wells using stable isotope techniques.

Both hydrogen and oxygen isotope composition of the water (2H-H2O and 18O-H2O) were determined using a laser-based isotope analyser (Picarro 2140i). Among the nutrients, we measured carbon isotope composition of dissolved inorganic carbon (13C-DIC) and the oxygen and nitrogen isotope composition of nitrate (18O-NO3 and 15N-NO3) by Gasbench- and a Precon-Isotope Ratio Mass Spectrometer (MAT253Plus, Thermo Fisher Scientific) after H3PO4 addition and Ti(III)reduction respectively.

The δ2H-H2O and δ18O-H2O values range from -88.7‰ to -25.0‰ and from -12.4‰ to -7.5‰. The tributary Inn has the lowest isotope value of all samples and is the main water source even further downstream. After the Inn-Danube confluence the isotope values continuously increase along the river length due to influence of other tributaries with comparatively higher isotope values. Groundwater samples have similar isotope values compared to river water indicating surface water - groundwater interactions. The δ13C-DIC values also increase with the distance from the source to the sea from -11 ‰ to around -9‰, but the increase levels off after around 1200 km and remains constant between -8 and -9‰. The tributary Inn is high (-8.5‰) in contrast to the Danube (-10.5‰) before the confluence. Low δ13C-DIC values in tributaries are only seen for the Morawa and Ipel. Distinct lower and higher values of δ13C-DIC are found downstream of Vienna and Budapest respectively. DIC values well separated carbonate dissolution and photosynthesis dominated versus organic matter mineralisation driven systems. Preliminary results of δ15N-NO3 and δ18O-NO3 values indicate various sources of nitrate e.g. relevant wastewater input downstream of the major cities; low δ15N-NO3 values in Lim and Inn tributaries indicating a higher proportion of soil derived nitrogen; and distinct higher δ18O-NO3 values common for NO3 fertilizers in the tributary Vah.

We gain a first glimpse on the source and fate of water and nutrients in the Danube river. Pending measurements of sulphate and phosphate isotopes, implementation of mixing models and comparison with earlier surveys will complement these findings and increase its relevance.

How to cite: Watzinger, A., Gcakasi, M. N., Schott, K., Stockinger, M., and Stumpp, C.: Stable isotopes of water, dissolved inorganic carbon and nitrate in the Danube River – results from the Joint Danube Survey in 2025, EGU General Assembly 2026, Vienna, Austria, 3–8 May 2026, EGU26-17100, https://doi.org/10.5194/egusphere-egu26-17100, 2026.

Winter temperature is rising and lake-effect snowfall is intensifying in the Great Lakes Basin, USA. To understand the impact of rising winter temperature and intensifying lake-effect snowfall on streamflow, samples have been collected since 2022 from precipitation, stream water at several catchments, wetlands, and groundwater at varying locations and depths. Samples were analyzed for stable isotopes and calculated for d-excess (δ2H – 8×δ18O). The mean values of δ18O, δ2H, and d-excess in precipitation were distinct over summer rainfall (July-September), dormant season rainfall (October-November, May-June), late spring snowfall (March-April), and January-February snowfall dominated by lake-effects. For instance, the mean δ18O and d-excess values (±1s), respectively, changed from -9.37(±2.54)‰ and 10.03(±5.05)‰  in summer rainfall to -23.54(±2.92)‰ and 31.66(±13.61)‰ in lake-effect dominated snowfall. The mean d-excess values in precipitation over the four periods were significantly correlated (p < 0.05) with both δ18O and δ2H, decreasing with an enrichment in both δ18O and δ2H at a rate of -1.38‰ per 1‰ of δ18O and -0.18‰ per 1‰ of δ2H. The temporal variation of δ18O, δ2H, and d-excess values in stream water and groundwater were strongly dampened, suggesting longer transit times and mixing with other source waters such as groundwater and subsurface water from wetlands. A mixing diagram, established by δ18O and d-excess, indicated, surprisingly, that stream water and groundwater were dominated by summer and dormant season rainfalls. However, both isotopes and d-excess values showed that streamflow during winter (December-February) was strongly affected by snowmelt, demonstrating an increasing impact of snowmelt on streamflow during winter. Hydrology and concomitant ecosystem in winter are facing a shift to early spring in the Great Lakes Basin.

How to cite: Liu, F. and Gierke, J.: The Impact of Rising Winter Temperature and Lake-Effect Snow on Streamflow in the Great Lakes Basin, USA, EGU General Assembly 2026, Vienna, Austria, 3–8 May 2026, EGU26-17922, https://doi.org/10.5194/egusphere-egu26-17922, 2026.

EGU26-18541 | Orals | HS2.2.2

Multi-Decade Isotope-based Analysis of Groundwater Dynamics in the Veneto Plain 

Laura Fabrello, Adriano Mayer, Elysia Lewis, Francesco Morari, Barbara Lazzaro, and Pietro Teatini

Limited knowledge of subsurface hydrogeological characteristics often hinders the proper understanding of groundwater dynamics, especially in highly heterogeneous systems. In the portion of the Veneto plain (Italy) east of the Brenta river, extending from the pre-Alpine foothills to the Venice Lagoon, groundwater nitrate infiltration represents a major concern, also because of the relatively limited understanding of the hydrogeological setting. This lack of information makes it difficult to constrain sources, pathways, and travel times of the substance conveyed by groundwater from the unconfined aquifer in the high plain to the complex confined multi-aquifer system seaward.

To address these difficulties, we apply a multi-tracer approach. We analysed major ions along with isotopes of O, H, C, Sr, He and Ne in groundwater samples collected at thirty representative points distributed across the domain in 2025.

We compared the resulting isotopic interpretation with the outcomes of previous similar investigations carried in the same domain in 1973 and 2008. This multi-decadal dataset, spanning approximately 50 years provides valuable insights into temporal shifts in groundwater dynamics due to climate change and anthropogenic forcings. The improved conceptualization of the groundwater system resulting from this analysis will enhance our understanding of the nitrate fate in the Venice aquifer system. This, in turn, will provide a robust scientific basis for developing and implementing effective groundwater management and protection policies.

How to cite: Fabrello, L., Mayer, A., Lewis, E., Morari, F., Lazzaro, B., and Teatini, P.: Multi-Decade Isotope-based Analysis of Groundwater Dynamics in the Veneto Plain, EGU General Assembly 2026, Vienna, Austria, 3–8 May 2026, EGU26-18541, https://doi.org/10.5194/egusphere-egu26-18541, 2026.

EGU26-20908 | Orals | HS2.2.2

Tracing subsurface flow paths from hillslopes to streams using a multi-method approach 

Theresa Blume, Gijs Vis, Natasha Gariremo, Anne Hartmann, Alexey Kuleshov, Ilja van Meerveld, and Luisa Hopp

The identification of lateral flows on hillslopes is a challenge because this is an invisible process with pronounced spatial variability that is influenced by a variety of factors. However, identifying the signal of hillslope contributions, especially interflow, in the stream is even more challenging because this signal can change not only during passage through the riparian zone, but also directly before entering the stream.

Our innovative cross-scale experimental approach within the DFG research group on Subsurface Stormflow (SSF) includes the monitoring of flow captured in trenches but also the spatially distributed recording of groundwater dynamics in the riparian zone during both natural events and salt tracer injection experiments. This is complemented by the analyses of water chemistry and thus potential SSF tracers both in hillslope subsurface flow and in groundwater and stream water. Additional campaign-based measurements include salt dilution tracer experiments, measurements of radon concentrations and patterns of temperature anomalies identified in the stream channel with both fiber optic temperature sensing and thermal infrared imagery, using heat as a tracer for groundwater inflows. This presentation will give an overview of the first results of the project.

How to cite: Blume, T., Vis, G., Gariremo, N., Hartmann, A., Kuleshov, A., van Meerveld, I., and Hopp, L.: Tracing subsurface flow paths from hillslopes to streams using a multi-method approach, EGU General Assembly 2026, Vienna, Austria, 3–8 May 2026, EGU26-20908, https://doi.org/10.5194/egusphere-egu26-20908, 2026.

Domestic wastewater (WW) may constitute a significant part of the baseflow of rivers and contribute to groundwater recharge into connected alluvial aquifers. Even treated, WW impacts both surface and groundwater quality by a large range of nutrients, inorganic and organic contaminants, including contaminants of emerging concern (CECs). There are overlaps with the compound range from other sources of contamination, notably agriculture, so that their distinction is challenging, especially for the nitrogen input. We combine in our study of the Rhine valley alluvial aquifer a range of tracers that are specific to WW, notably boron and its isotopes, gadolinium and a selection of human pharmaceuticals. This allows us to detect and quantify urban WW contribution from treatment plants to small streams and associated groundwater in a context of multiple, complex human pressures on water quality. We distinguish local and regional recharge components and identify stream-aquifer connection through stable water isotopes. Non-target screening of a large range of organic compounds by LC-TOF-MS allows to establish contaminant fingerprints under high- and low water conditions and, together with targeted tracers, provides insight into the annual variations of water and contaminant dynamics.

How to cite: Malcuit, E., Kloppmann, W., Soulier, C., and Boukra, A.: Identifying urban wastewater in streams and connected groundwater through a multi-tracer approach (boron and boron isotopes, stable isotopes of O and H, gadolinium anomaly, pharmaceuticals) and non-target screening, EGU General Assembly 2026, Vienna, Austria, 3–8 May 2026, EGU26-21134, https://doi.org/10.5194/egusphere-egu26-21134, 2026.

EGU26-22318 | ECS | Posters on site | HS2.2.2

Advances in tracer-aided mixing models for Critical Zone hydrology 

Andrea L. Popp and Harsh Beria and the Cost Action Watson WG1

Safeguarding water resources for both society and ecosystems requires improved understanding of hydrological fluxes within the Critical Zone. Tracer-aided mixing models have long been used to investigate water flow paths through this zone, linking atmospheric inputs to subsurface storage. Recent advances in tracer measurements, particularly stable water isotopes, together with new modeling frameworks, now enable hydrological partitioning to be explored in greater detail and across a wider range of spatial and temporal scales. In this poster, we synthesize recent methodological advances in tracer-aided hydrological modeling. These developments provide new insights into mixing processes in the Critical Zone, enable more explicit testing of model assumptions, and support more robust treatment of uncertainty in estimates of water fluxes.

Reference:

Popp, A.L., Beria, H., Sprenger, M., Ala-Aho, P., Coenders-Gerrits, M., Groh, J., Klaus, J., Knapp, J., Koren, G., Bakiri, I., Xu Fei, E., Gillon, M., Harman, C., Hissler, C., Holmes, T., Jeelani, G., Kalvans, A., Montemagno, A., Zeray Öztürk, E., Žvab Rožič, P., Stadnyk, T., Stumpp, C., Valiente, N., von Freyberg, J., van Meerveld, I., Penna, D., Vreˇca, P., Zuecco, G., Kirchner, J. W. Recent Advances in Tracer-Aided Mixing Modeling of Water in the Critical Zone. Reviews of Geophysics doi.org/10.1029/2024RG000866.

How to cite: Popp, A. L. and Beria, H. and the Cost Action Watson WG1: Advances in tracer-aided mixing models for Critical Zone hydrology, EGU General Assembly 2026, Vienna, Austria, 3–8 May 2026, EGU26-22318, https://doi.org/10.5194/egusphere-egu26-22318, 2026.

EGU26-22435 | Posters on site | HS2.2.2

A novel system design to obtain daily in-situ soil and xylem water stable water isotope data in the Rosalia Research Forest (Austria) 

Michael Stockinger, Megan Asanza-Grabenbauer, and Christine Stumpp

The climate change induced increased frequency and intensity of drought and rainfall events impacts the interaction of trees with components of the hydrological cycle, e.g., rainfall, soil water, or groundwater. To study this, more often in-situ measurement systems are applied capable of high-resolution measurement of the stable water isotopes (d18O, d2H) of soil and xylem water. These systems often use gas-permeable probes to sample water vapor in isotopic equilibrium with the liquid xylem or soil water, which are connected to transport tubing that guide the vapor sample to the gas-inlet of a field-deployed isotope analyzer. Previous system designs used N2 gas cylinders and mass flow controllers to provide a carrier gas for the water vapor sample and additionally to flush the transport lines in between sampling to avoid condensation that can lead to erroneous measurements. Here, we present a simplified version of an in-situ isotope measurement system that avoids using gas cylinders and mass flow controllers, showing first results obtained within the first six months of operation.

Daily sampling started in July 2025 for two soil water profiles (at depths of 10, 20, 30, and 60 cm) and xylem water of four beech (Fagus sylvatica S.) trees. Soil probes consist of a 10-cm long gas-permeable tube with a 1/8-inch tube inserted into it that transports water vapor samples to a Picarro laser spectrometer solely using a vacuum pump, i.e., pulling instead of pushing the sample. A second 1/8-inch tube inside the probe is connected to the atmosphere and allows for pressure equilibration using ambient air. For trees, contrary to previous systems that installed gas-permeable tubes in tree boreholes, we inserted two 1/8-inch tubes into boreholes with the same functions as for soil probes: transport and pressure equilibration using ambient air. To prevent condensation, we heated and additionally flushed the transport lines each night by pulling air through the tubes using a vacuum pump instead of pushing dry air through, thus avoiding gas cylinders and mass flow controllers.

First results of collecting daily data showed no major issues with our system. Comparing our measurements to collected precipitation isotopes of the same period, our data indicated a fast reaction of soil and xylem water to precipitation events. The obtained isotope ratios of soil and xylem water plot close to the local meteoric water line. Therefore, it is unlikely that the ambient air that is used to equilibrate the pressure significantly altered the water vapor isotope ratios. Approximately 60% of all samples had a relative humidity larger than 90% which is necessary for a reliable measurement. Cases of lower relative humidity could be explained by a drought experiment and large summer temperatures that naturally dry out soil. Future work will focus on improving the system after further analyses by, e.g., adapting the flushing period during the night, and by comparing its results to manually taken control samples. 

How to cite: Stockinger, M., Asanza-Grabenbauer, M., and Stumpp, C.: A novel system design to obtain daily in-situ soil and xylem water stable water isotope data in the Rosalia Research Forest (Austria), EGU General Assembly 2026, Vienna, Austria, 3–8 May 2026, EGU26-22435, https://doi.org/10.5194/egusphere-egu26-22435, 2026.

Blanket bogs act as dynamic water reservoirs and regulate headwater runoff, yet their hydrological resilience under a warming and drying climate, coupled with anthropogenic activities, remains poorly constrained. Water stable isotopes (δ18O, δ2H, and d-excess) provide direct tracers of moisture sources and evapotranspiration, while hydrochemistry reveals solute pathways and mixing in peatland catchments. This study uses intensive monitoring in a blanket-bog headwater catchment in the Wicklow Mountains to investigate the environmental controls on temporal and spatial variability in stream water isotopes and water quality.
Since November 2024, monthly precipitation and stream samples have been collected at 21 runoff sites for isotopic analysis, providing a growing record of δ18O, δ2H, and d-excess. In parallel, water quality parameters (major anions and cations, and physicochemical variables) have been measured at 11 of these sites. A weather station in the Luggala Estate supplies continuous meteorological data, including precipitation amounts and variables relevant to evapotranspiration. Using these datasets, the study examines which environmental parameters control month-to-month variability in δ18O, δ2H, and d-excess in blanket bog streams, how isotopic signatures co-vary with hydrochemical indicators across the catchments and to what extent observed patterns reflect seasonal changes, evaporation and flow-path mixing between precipitation and bog waters.
Preliminary analysis will apply local meteoric and evaporation lines, time-series statistics and mixed effects models to separate catchment-wide seasonal signals from site-specific behavior. Principal component and correlation analysis will jointly evaluate isotopes and solutes, identifying groups of sites with similar hydrological functioning and reaches where evaporative enrichment is most pronounced. Together, these tracer-based analysis constrain conceptual models of storage, connectivity, and mixing in a blanket-bog headwater, provide a modern process-based reference for interpreting blanket-bog stream isotopes and offer initial guidance on how many and what kinds of sites are most informative for future isotope-enabled monitoring of peatland catchments.

How to cite: Kusi-Afrakoma, Z. and Akers, P.: Isotopic and hydrochemical tracers of hydrological functioning in an Irish blanket-bog headwater catchment, EGU General Assembly 2026, Vienna, Austria, 3–8 May 2026, EGU26-22997, https://doi.org/10.5194/egusphere-egu26-22997, 2026.

EGU26-418 | ECS | Orals | HS2.2.5

A global large-sample synthesis of large wood (LW) dynamics based on catchment descriptors and hydrological drivers 

Hezron Casasola, Diego Ravazzolo, Elisabetta Persi, Gabriella Petaccia, and Stefano Sibilla

The body of research on large wood (LW) dynamics in rivers has been gaining momentum in line with the increasing recognition of the multifaceted morphological and ecological roles that wood exerts on fluvial systems. Although processes constituting LW dynamics (e.g., recruitment, mobility, storage, and export) have been extensively explored at the reach scale, understanding remains scarce at the catchment scale, which requires a systematic, landscape-level approach to identifying broader risks and developing targeted action plans. This contribution synthesizes a three-decade scholarly corpus and presents a nuanced meta-analysis on catchment-scale LW dynamics across different geographical and climatic regions. The final database encompasses 248 distinct catchments globally, classified according to the specific LW process documented and indexed with a common parameter for each process: recruitment per channel area (m3 ha-1) for recruitment, stability index– equal to wood length to channel width ratio (m m-1)– for mobility, LW load (m3 ha-1) for storage, and unit LW export rate (m3 ha-1 a-1) for export. Regression modelling was rigorously employed, with the aforementioned LW parameters from the four processes as response variables. Meanwhile, predictor variables were systematically chosen to represent the effect of catchment characteristics and hydrological forcing on the LW parameters, thereby adopting a large-sample hydrology perspective across diverse environmental settings. Quantitative results from the regression analyses suggest that drainage area, mean catchment slope, mean annual precipitation, and percentage forested area are statistically significant predictors of LW parameters across the studied LW processes. For the recruitment phase, higher mean annual precipitation and steeper slope are generally associated with greater LW recruitment. In terms of mobility, an increase in drainage area corresponds to a decrease in the stability index, suggesting lower LW stability in larger catchments. LW storage patterns show that higher mean annual precipitation is linked to a greater LW load, while smaller catchments generally exhibit lower stored LW volumes. Finally, the unit LW export rate is significantly influenced by the percentage forested area and slope within each catchment, with both higher percentages of forestation and steeper slopes leading to greater LW export per unit drainage area. These results highlight the extent to which catchment-scale characteristics affect LW processes in a way that studies conducted at the reach scale could easily overlook. This meta-analysis also represents the first systematic attempt to quantify catchment-scale variability in LW parameters at a global level, a dimension that previous reviews have not explored. Finally, the analyses suggest that a disproportionate number of studies on LW dynamics are concentrated on catchments in temperate and continental climatic regions. This highlights a profound need for more studies on LW patterns in underrepresented areas, including tropical catchments in the Southern Hemisphere and the boreal and Arctic rivers in high latitudes– all of which are increasingly altered and subjected to anthropogenic pressures as well as climate change ramifications.

How to cite: Casasola, H., Ravazzolo, D., Persi, E., Petaccia, G., and Sibilla, S.: A global large-sample synthesis of large wood (LW) dynamics based on catchment descriptors and hydrological drivers, EGU General Assembly 2026, Vienna, Austria, 3–8 May 2026, EGU26-418, https://doi.org/10.5194/egusphere-egu26-418, 2026.

Reliable estimation of river discharge is constrained by uncertainties in stage-discharge rating curves, particularly in steep, high-gradient catchments where channel morphology is highly dynamic. Conventional approaches often fail to capture the complexity of these systems. To synthesize a more robust understanding of Rating Curve generation, this study evaluates three methods, the conventional power law, spline interpolation, and Bayesian inference, across multiple sites within a mountainous headwater catchment.

We use two years of high-frequency stage data and corresponding gauged discharge measurements from a primary field site, with ongoing validation at two additional sites. The methods are compared in terms of different performance metrics (e.g., RMSE, NSE), their ability to extrapolate low and high flow conditions, and their treatment of uncertainty.

Initial results show that the Bayesian approach substantially outperforms deterministic power law and spline methods in simulating discharge time series. Its strength lies in explicitly accounting for measurement error and structural uncertainty, which are pronounced in high-gradient environments. Posterior parameter distributions further provide physically meaningful insights linked to reach characteristics such as roughness and bed slope. Testing across additional sites will enable synthesis of generalized patterns: if consistent Bayesian priors prove effective across geomorphologically similar reaches, this suggests common hydraulic-hydrological controls operating within this catchment type.

This comparative study advances a probabilistic framework for Rating Curve generation in steep river systems. By demonstrating the transferability of Bayesian methods across multiple sites, we highlight a pathway for operational hydrology to move beyond deterministic curve fitting toward more robust, uncertainty-aware, and physically grounded discharge estimation.

How to cite: Saxena, N. and Sen, S.: Advancing Rating Curve Generation in High-Gradient Rivers: Comparing Power Law, Spline, and Bayesian Approaches of Rating Curve Generation, EGU General Assembly 2026, Vienna, Austria, 3–8 May 2026, EGU26-1079, https://doi.org/10.5194/egusphere-egu26-1079, 2026.

EGU26-1741 | ECS | Posters on site | HS2.2.5

Catchment area veils land use and topographic controls on runoff generation in Swiss catchments 

Rebecca Pulli and Marius Floriancic

Distinct effects of land use and topography on runoff metrics are well established at small scales, yet their identification in large sample studies remains challenging, as they are often masked by other dominant catchment features. Here, we systematically investigated the drivers of runoff response across a rich dataset of catchment properties from 152 Swiss catchments using runoff metrics derived from non-linear Ensemble Rainfall-Runoff Analysis (ERRA).

We show that catchment area exhibits the strongest control on both the timing and magnitude of streamflow response to precipitation. We found that across Switzerland runoff response is not related to catchment slope (neither mean slope nor fraction of steep or flat terrain), even when clustering catchments of similar area. Thus, contrary to widely circulating assumptions, steeper catchments do not exhibit faster or stronger runoff response. We also tested the differences between forest and agriculture dominated catchments and found no statistical differences in timing and magnitude of streamflow response to precipitation when using the entire dataset. Thus, our Swiss wide analysis does not show the expected buffering effect of forests and faster responses in agricultural landscapes. Land use effects only emerged when stratifying catchments by area and assessing the runoff response for different precipitation intensities. In agriculture dominated catchments, we observed higher peak flow with intense precipitation compared to forest dominated catchments. Thus, the buffering effects of streamflow response to precipitation in catchments with different land use are non-linear and dependent on rainfall intensity.

Our results caution against generalized assumptions in large sample hydrology, because effects of topography and land use are strongly modulated and often veiled by other catchment properties or climate and dependent on rainfall intensity.

How to cite: Pulli, R. and Floriancic, M.: Catchment area veils land use and topographic controls on runoff generation in Swiss catchments, EGU General Assembly 2026, Vienna, Austria, 3–8 May 2026, EGU26-1741, https://doi.org/10.5194/egusphere-egu26-1741, 2026.

Potential evaporation is central to hydrology, ecohydrology, and drought/climate-impact studies, yet “potential evaporation / evaporative demand” remains fragmented across definitions, implementations, and complementary relationship (CR) formulations. This fragmentation complicates intercomparison, obscures physical interpretation, and can lead to conflicting conclusions even when analyses use the same underlying data. Here I present a synthesis framework that unifies CR curve families and clarifies which aspects of inferred behavior arise from definitional choices versus land–atmosphere adjustment physics.

I recast CR theory in a nondimensional phase space defined by x ≡ Ep0/Epaand y ≡ E/Epa, where E is actual evaporation, Epa is “apparent potential” evaporation diagnosed from the drying environment, and Ep0 is a wet-environment benchmark. In this atlas, physically admissible behavior occupies a constrained region and diverse CR formulations become directly comparable. Remaining differences among curve families can be summarized with a small set of geometric descriptors (e.g., wet-limit slope, dry-end location, and curvature), enabling a compact “fingerprint” of CR behavior.

To prevent definitional artifacts from masquerading as physical inference, I introduce definition-consistency tests that isolate the impact of the wet benchmark choice on the x-axis mapping. I show that inconsistent wet-benchmark definitions can primarily induce horizontal remapping in x, biasing inferred asymmetry/curvature and thereby altering conclusions about coupling regimes. To interpret geometry physically, I connect atlas descriptors to a minimal coupled mixed-layer model that links curve shape to a small set of drivers controlling land–atmosphere feedback strength and adjustment timescales (e.g., ventilation and boundary-layer mixing).

Finally, I demonstrate the framework using eddy-covariance evaporation and meteorological time series from NEON sites, showing how inter-site differences emerge largely through differences in the distribution of x and in the curvature of the median y(x) response. The atlas provides a transparent pathway to compare, interpret, and select potential evaporation metrics for ecohydrological and hydroclimatic applications, while reconciling apparently divergent results across the CR literature.

How to cite: Pettijohn, J.: A nondimensional atlas for potential evaporation and the Bouchet–Morton complementary relationship: separating definition choices from land–atmosphere adjustment, EGU General Assembly 2026, Vienna, Austria, 3–8 May 2026, EGU26-2831, https://doi.org/10.5194/egusphere-egu26-2831, 2026.

Topography fundamentally regulates how ecosystems access and redistribute water and energy, thereby shaping spatial patterns of vegetation productivity, soil carbon, and nutrient dynamics. Despite its recognized importance, the influence of topography on the spatial heterogeneity of coupled water and carbon processes remains poorly quantified. This is largely because real landscapes confound terrain effects with variability in climate, soil, and vegetation, and because many existing models treat ecohydrological and biogeochemical processes in a decoupled manner. Here, we isolate and quantify the role of terrain complexity by combining synthetic landscapes of varying geomorphic complexity – generated using a landscape evolution model – with meteorological forcings and land cover data from six FLUXNET sites spanning diverse biomes. Using the state-of-the-art, spatially distributed, ecohydrological model T&C-BG-2D, we simulate the distributions of evapotranspiration (ET), gross primary productivity (GPP), and soil organic carbon (SOC) across these landscapes. We find that, on average, ET and GPP decrease as terrain becomes more complex, reflecting enhanced hydrological redistribution and energy limitation. In contrast, SOC exhibits two contrasting response modes that depend on soil texture and hydroclimatic regime, highlighting the interactions between topography-driven processes and local biogeochemical controls. The spatial distributions of ET, GPP, and SOC are well described by lognormal and mixture-lognormal forms, whose shape parameters scale systematically with catchment-scale terrain complexity. An independent analysis of satellite-derived GPP and ET across three different biomes confirms that similar scaling relationships emerge in real landscapes, demonstrating that topography imposes a consistent and measurable constraint on ecohydrological variability. Together, these results provide a physically based framework linking terrain complexity to the spatial organization of coupled water and carbon processes, and offer quantitative guidance for the development of topography-aware parameterizations in large-scale land surface and Earth system models.

How to cite: Bonetti, S. and Lian, T.: Topographic controls on water and carbon cycling: Insights from mechanistic modelling in synthetic landscapes, EGU General Assembly 2026, Vienna, Austria, 3–8 May 2026, EGU26-5402, https://doi.org/10.5194/egusphere-egu26-5402, 2026.

EGU26-5729 | ECS | Orals | HS2.2.5

Hydrologic Process Synthesis across Diverse Landscapes: Towards a hierarchical classification of North American hydrology 

Wouter Knoben, Hilary McMillan, Ying Fan, Peter Wagener, Irene Garousi-Nejad, Julia Masterman, Jordan Read, Shaun Carney, Katie van Werkhoven, and Martyn Clark

Hydrologic processes can be notoriously place-specific and much of our understanding about these processes originates from intensively monitored but small research basins.  This project is motivated by a need to connect this small-scale hydrologic process understanding with large-scale model applications, to strengthen the theoretical underpinnings of the models used for water resources planning and prediction of water-related risks across large geographical domains. Here we describe a community-driven synthesis effort that convened multiple virtual workshops, in-person community engagements, and online interactions that bring together water science experts working in various regions across North America. The community expertise was used to develop a hierarchical division of the North American continent into distinct hydrologic domains and provinces, and to describe the dominant hydrologic processes of each landscape.

At the highest level, we recognize five distinct domains: (1) the east, characterized by complex surface-groundwater interaction; (2) the west, with complex topography and resulting climate patterns as a dominant feature; (3) the central domain covering the prairies and plains across landscapes with extensive agriculture; (4) the north, primarily characterized by complex cold-region processes; and (5) the tropical islands, where large gradients in hydrologic drivers occur over relatively short distances. At the second level, we divided the domains into 35 hydrologic provinces. We then developed perceptual models of the hydrologic behaviour of each province using a combination of expert knowledge, literature reviews and data-based quantification of hydrologically relevant landscape characteristics. We envision further development of a third level in the classification that includes progressively more local detail. In parallel, the current perceptual models can be mapped onto computational models, modules and individual equations to support a theory-based large-domain effort to develop appropriate hydrologic models for any location in the wider North American continent. The procedures used in this work are general and could be applied to any geographical domain where expert knowledge of local conditions is available.

How to cite: Knoben, W., McMillan, H., Fan, Y., Wagener, P., Garousi-Nejad, I., Masterman, J., Read, J., Carney, S., van Werkhoven, K., and Clark, M.: Hydrologic Process Synthesis across Diverse Landscapes: Towards a hierarchical classification of North American hydrology, EGU General Assembly 2026, Vienna, Austria, 3–8 May 2026, EGU26-5729, https://doi.org/10.5194/egusphere-egu26-5729, 2026.

EGU26-7154 | ECS | Posters on site | HS2.2.5

A Moment-Based, Calibration-Free Evaluation of Unit Hydrograph Shape Across UK Catchments 

Yiming Yin, Rafael Rosolem, and Ross Woods

The choice of unit hydrograph (UH) shape remains a long-standing problem in rainfall–runoff modelling, with widely used forms such as the Gamma, triangular and other hydrographs often adopted without explicit validation. Here we present a calibration-free, moment-based framework to objectively test UH shape assumptions using observed rainfall–runoff events.

Treating time as a random variable and rainfall and runoff as probability weights, we exploit the additivity of central moments under convolution to directly estimate the first three temporal moments of the UH from data. For each event, UH moments are obtained as differences between runoff and rainfall moments, without fitting hydrographs or calibrating model parameters. For two-parameter unit hydrograph shape families, such as the Gamma (Nash) and triangular hydrographs, the first two temporal moments uniquely determine the shape parameters. The third central moment is therefore not a fitting target but an independent prediction, allowing systematic errors from the assumed shape to be identified.

The framework is applied to hourly data from 431 UK catchments from the CAMELS-GB dataset, using the 50 largest events per catchment. Event- and catchment-level diagnostics highlight systematic differences between alternative unit hydrograph shape families, including Gamma and triangular representations. By comparing moment-based consistency across shapes and response time scales, the analysis provides an objective basis for identifying the most appropriate unit hydrograph form for different hydrological conditions.

Overall, the proposed moment-based framework offers a physically interpretable and calibration-free approach for evaluating and comparing unit hydrograph shapes, with clear potential for application in catchment classification and regionalisation.

How to cite: Yin, Y., Rosolem, R., and Woods, R.: A Moment-Based, Calibration-Free Evaluation of Unit Hydrograph Shape Across UK Catchments, EGU General Assembly 2026, Vienna, Austria, 3–8 May 2026, EGU26-7154, https://doi.org/10.5194/egusphere-egu26-7154, 2026.

Time-variance in catchment hydrologic function—how rainfall-runoff relationships shift across events, seasons, and years—remains a fundamental yet incompletely understood aspect of catchment behavior. Synthesizing this time-variance across scales is essential for advancing hydrological theory, improving predictions in ungauged basins, and guiding model development. Here, I present a synthesis of recent work spanning local to continental to global scales, integrating fine-resolution mechanistic models with large-sample data-driven methods.

At the local scale, process-based modeling reveals how subsurface physical structure—including subsurface lateral permeability pattern—mediates the climate-induced time-varying partitioning of water between long-term storage, shallow and deep flow paths, and evapotranspiration. At continental to global scales, large-sample analyses across more than five thousand gauged catchments and 80,000 ungauged catchments expose systematic patterns in functional complexity (or time-variance): most catchments exhibit strongly time-varying rainfall-runoff behavior, with climate (particularly rainfall persistence and aridity) providing the dominant control, while geology and topography modulate outcomes locally.

To enable these syntheses, we developed new data-driven methodologies for extracting catchment hydrologic function and quantifying its temporal variation from observational records. These methods provide a transferable framework for diagnosing functional behavior in gauged systems. These findings advance process-based explanations of hydrological phenomena across places and scales, connect event-scale dynamics to seasonal and long-term patterns, and offer new tools for identifying hydrological signatures in data. The implications extend to model structure selection, monitoring network design, and the development of a unifying hydrological theory that accommodates—rather than assumes away—functional time-variance.

How to cite: Ameli, A.: Synthesizing Time-Variance in Catchment Hydrologic Function: Patterns, Controls, Methodological Advances and Global Extrapolation to Ungauged Basins, EGU General Assembly 2026, Vienna, Austria, 3–8 May 2026, EGU26-8753, https://doi.org/10.5194/egusphere-egu26-8753, 2026.

EGU26-8825 | ECS | Posters on site | HS2.2.5

Why did South Sudan experience unprecedented flooding in 2022? The role of upstream storage and hydrological memory in the White Nile. 

Douglas Mulangwa, Evet Naturinda, Charles Koboji, Benon Zaake, Emily Black, Hannah Cloke, and Elisabeth Stephens

Between 2019 and 2024, South Sudan experienced prolonged and widespread flooding that existing early-warning systems did not anticipate, largely because flood forecasting models were conditioned on short-term rainfall variability and did not reflect the basin’s long hydrological memory. This study examines the physical processes underlying this forecasting mismatch and shows how limited representation of upstream storage, wetland dynamics, and multi-season antecedent conditions constrained the skill of anticipatory flood information. Using daily lake levels, river discharge, CHIRPS rainfall, and MODIS flood extent, we quantified floodwave travel time from Lake Victoria to the Sudd Wetland to identify the mechanisms shaping this multi-year flood response.

The analysis shows that the mean upstream-to-downstream floodwave transit time is approximately 16.8 months, rather than the often-assumed five months, revealing a fundamentally slow system controlled by lake storage, floodplain buffering, and wetland attenuation. This long delay explains why downstream hydrological signals evolved differently from local rainfall patterns. Flooding in the central and western Sudd was shaped by the gradual movement of stored water through the Victoria–Kyoga–Albert–Sudd corridor, where each lake and wetland unit progressively reshapes and delays the floodwave. In contrast, eastern sub-catchments such as the Baro–Akobo–Sobat responded more directly to local rainfall, reflecting weaker connectivity to the lake–wetland system. The extensive inundation observed in 2022, including around Bentiu, therefore resulted from cumulative multi-year storage initiated by the 2019 positive Indian Ocean Dipole and reinforced by successive anomalous rainy seasons both up- and downstream, rather than from local rainfall downstream alone.

These findings highlight the limitations of flood forecasting modelling approaches that emphasise short-term precipitation forcing while under-representing storage, routing, and long hydrological memory in large lake–river systems. By identifying system-scale transit times and the spatial structure of storage-driven response, this work provides a physical basis for improving the interpretation of flood forecasts and for extending effective lead times for anticipatory action. Explicit recognition of long-memory dynamics can help distinguish precipitation-driven from storage-driven flooding, supporting more timely and proportionate preparedness decisions along the White Nile corridor.

How to cite: Mulangwa, D., Naturinda, E., Koboji, C., Zaake, B., Black, E., Cloke, H., and Stephens, E.: Why did South Sudan experience unprecedented flooding in 2022? The role of upstream storage and hydrological memory in the White Nile., EGU General Assembly 2026, Vienna, Austria, 3–8 May 2026, EGU26-8825, https://doi.org/10.5194/egusphere-egu26-8825, 2026.

EGU26-9586 | ECS | Orals | HS2.2.5

A Water Year Definition that Works Everywhere  

Ashvath Kunadi, Marko Kallio, and Matti Kummu

Water years have been used by water resource managers for more than a century to align hydrological phenomena with the annual precipitation cycle. The central idea is to start a new water year when specific hydrological conditions are met, so that precipitation carry-over from the preceding 12-months period is minimised. With the increase in global hydrological data and analysis, it is vital to understand first how to best determine the start of water years across the globe and to understand their effect on evaluating interannual changes. 

The only global analysis of the water year to date defines its start by the month of lowest stream discharge. While this definition works well in seasonal climates, it neglects snow dynamics, as the snowfall does not immediately contribute to discharge. In snow-dominated catchments, the lowest discharge often occurs just before the spring melt; consequently, precipitation from the previous water year significantly influences the discharge in the following water year.  

We present a new definition to be used in the global water year estimations. It utilizes the areal mean of snow water equivalent collected in upstream catchments and discharge of the target catchment to determine the starting month. This definition mirrors the dynamics of terrestrial water storage and aligns more closely with various national definitions. Applying this methodology across ERA5 Land variables and a combination of MSWEP, GLEAM, GRADES, and SWEML datasets, reveals significant differences in trends and coefficients of variation for annual hydrological fluxes when compared to the standard calendar year. Additionally, our snow-and-discharge-based definition minimizes water balance closure errors. Given these findings, we suggest that global interannual hydrological analysis should, at minimum, consider water years for a physically sound assessment.  

How to cite: Kunadi, A., Kallio, M., and Kummu, M.: A Water Year Definition that Works Everywhere , EGU General Assembly 2026, Vienna, Austria, 3–8 May 2026, EGU26-9586, https://doi.org/10.5194/egusphere-egu26-9586, 2026.

EGU26-9893 | Posters on site | HS2.2.5

Hydro-meteorological variability in the Levant (200–1850 CE) reconstructed from historical documentary evidence 

Roger Moussa, Mohammad Merheb, Gaelle Hamelin, Nicolas Lemoine, and Christophe Cudennec

Understanding long-term hydro-climatic variability is essential for contextualising present and future water stress in semi-arid regions. In the Levant, instrumental observations are short and paleoclimate reconstructions remain spatially coarse, leaving large gaps in knowledge of past drought and flood dynamics. This study explores the potential of historical documentary evidence to reconstruct hydro-meteorological variability across the Levant between 200 and 1850 CE, with a detailed focus on Damascus, one of the best-documented cities in the region.

We compiled and harmonised 3,507 hydrometeorological records extracted from major historical databases and scholarly compilations based on Arabic, Greek, Syriac, and Latin sources. Events were standardised by type, timing, location, and intensity using a common classification scheme, enabling consistent temporal and spatial analyses. Event frequencies were aggregated at decadal resolution to assess documentation density, biases, and long-term variability across the region. While the resulting dataset spans more than 1,600 years and 50 locations, coverage is highly uneven, with a strong concentration in major urban centres after the thirteenth century. Damascus emerges as the only site with sufficiently continuous records to support quantitative analysis.

For Damascus, we analyse long-term precipitation and flood events between 1250 and 1520 CE, the period of highest documentary density. A semi-quantitative dryness index derived from historical descriptions was constructed and compared with the Palmer Drought Severity Index (PDSI) from the Old World Drought Atlas. Both datasets were aggregated into decadal bins, and drought frequencies were statistically evaluated. Results reveal pronounced multi-decadal hydro-climatic fluctuations, including persistent dry phases in the late fourteenth and early fifteenth centuries, punctuated by episodic but severe flood clusters. The documentary-based dryness index shows a moderate and statistically significant correlation with PDSI at the decadal scale, indicating broad coherence between independent historical and tree-ring-based reconstructions.

Seasonal analysis of historical records further highlights the vulnerability of Damascus to precipitation deficits during autumn and winter, the city’s primary rainy seasons. These findings demonstrate that, despite fragmentation and strong spatial biases, historical documents can provide robust, locally grounded indicators of past hydro-climatic variability when systematically harmonised and analysed.

The study also underscores key limitations, including uneven spatial coverage, source availability, and interpretive uncertainty, reinforcing the need for close collaboration between historians and climate scientists. Integrating documentary evidence with paleoclimate proxies offers a valuable pathway for improving reconstructions in data-sparse regions and for linking hydro-climatic variability to societal impacts in the long term.

How to cite: Moussa, R., Merheb, M., Hamelin, G., Lemoine, N., and Cudennec, C.: Hydro-meteorological variability in the Levant (200–1850 CE) reconstructed from historical documentary evidence, EGU General Assembly 2026, Vienna, Austria, 3–8 May 2026, EGU26-9893, https://doi.org/10.5194/egusphere-egu26-9893, 2026.

EGU26-10592 | ECS | Orals | HS2.2.5

From synoptic baseflow campaigns to hydrological processes understanding: a meta-analysis 

Camyla Innocente dos Santos, Clarissa Glaser, Julian Klaus, and Pedro Luiz Borges Chaffe

Synoptic baseflow campaigns use spatially distributed snapshot measurements of discharge and streamwater chemistry to characterize spatial and temporal patterns of baseflow generation across river networks. Despite growing insights from individual studies, transferring process understanding across catchments remains limited by the lack of a comprehensive synthesis. Here, we present a global meta-analysis of synoptic baseflow campaign applications that examine streamflow sources, scaling, and groundwater flow paths. We identified 52 peer-reviewed studies focusing on 71 catchments worldwide. For each catchment, we assessed monitoring approaches and study objectives. We evaluated outcome metrics including Representative Elementary Area (REA) thresholds, baseflow source identification, and the main drivers of groundwater flow paths. Our synthesis shows that synoptic baseflow campaigns have mainly been applied in temperate regions and in small (< 10 km²) to medium-sized (< 100 km²) catchments, with limited representation of arid, tropical, and high-latitude environments. REA analyses from synoptic baseflow campaigns revealed scale-dependent behavior consistent with the fractal organization of hydrological processes, in which the REA, ranging from 0.5 to 75 km², increases with catchment area (ρ = 0.78, p-value = 0.003) and is driven by the aridity index for catchments larger than 20 km² (ρ = −0.90, p-value = 0.037). Geology emerged as a key driver of regional groundwater flow paths, where permeability controls deep groundwater contributions, highlighting the importance of explicitly accounting for geology in hydrological models. Synoptic campaigns are an efficient alternative for investigating hydrological processes in data-scarce regions, supporting the design of long-term monitoring networks, and helping transfer process understanding to ungauged catchments.

How to cite: Innocente dos Santos, C., Glaser, C., Klaus, J., and Chaffe, P. L. B.: From synoptic baseflow campaigns to hydrological processes understanding: a meta-analysis, EGU General Assembly 2026, Vienna, Austria, 3–8 May 2026, EGU26-10592, https://doi.org/10.5194/egusphere-egu26-10592, 2026.

EGU26-11133 | Orals | HS2.2.5 | Highlight

Controls on runoff processes in forested catchments: a global synthesis 

Daniele Penna

Forested catchments represent major hydrological hotspots worldwide, supplying a large proportion of global freshwater resources while delivering the highest water quality among land-cover types and a wide range of water-related ecosystem services. Understanding the controls on runoff processes in forested catchments is therefore essential for land, water, and forest management. Despite nearly a century of experimental and modelling research on the hydrological functioning of forested catchments, existing knowledge is largely derived from individual sites or limited intercomparison studies, and a coherent global synthesis of runoff processes has been lacking.

Here, I compiled a global database comprising data of 691 forested catchments extracted from 267 peer-reviewed studies published between 1993 and 2024. I used this new and extensive dataset to identify and synthesize the dominant climatic, hydrological, pedological, vegetational, and geological/geomorphological controls on runoff generation, streamflow response, and streamflow prediction. I tested seven classic hypotheses in forest hydrology at the global scale, alongside an original one addressing the dominance of climate as an overarching control and its variability across humid and less humid regions.

The synthesis reveals that threshold behaviors are widespread across forested catchments globally, with soil moisture—often interacting with rainfall—emerging as the dominant driver of nonlinear runoff responses. Tracer-based studies confirm that pre-event water dominates streamflow generation, with groundwater constituting the largest fraction of this contribution, while soil water plays a secondary role. Subsurface flow, often involving preferential flow through macropores and soil pipes, is identified as the most frequent runoff mechanism. Contrary to conventional assumptions, overland flow is not rare in forested catchments: infiltration-excess overland flow, typically associated with arid and/or scarcely vegetated environments, occurs in many of the documented studies, particularly in catchments with low mean annual precipitation and with strong pedological control.

The analysis further shows that hillslope–stream hydrological connectivity is more strongly governed by topographic and vegetation patterns than by climate alone, highlighting the importance of landscape structure in forested environments. Streamflow response magnitude is primarily controlled by geomorphological characteristics and antecedent wetness conditions, in addition to meteorological forcing. Streamflow modelling performance is influenced by a broad combination of controls, with topography and geology exerting slightly stronger effects than soil, vegetation, or climate, reflecting both landscape dominance and model structural assumptions.

Overall, the results reveal the interaction of multiple factors on runoff processes in forested catchments across the planet, highlighting the larger role played by geological/geomorphological, pedological, and hydrological factors in certain processes compared to climate, while the relative importance of vegetation increases under humid conditions. This global synthesis provides new process-based insights, revises long-standing theories, and offers an empirical foundation for advancing our understanding of catchment functioning and improving hydrological modelling in forested catchments worldwide.

How to cite: Penna, D.: Controls on runoff processes in forested catchments: a global synthesis, EGU General Assembly 2026, Vienna, Austria, 3–8 May 2026, EGU26-11133, https://doi.org/10.5194/egusphere-egu26-11133, 2026.

EGU26-12170 | ECS | Orals | HS2.2.5

The spatially variable relative influences of climate and landscape on European streamflow behaviour  

Julia M. Rudlang, Thiago V.M. do Nascimento, Ruud van der Ent, Fabrizio Fenicia, and Markus Hrachowitz

Understanding the complexity of hydrological systems is still a major challenge in the field of hydrology, despite advances in observations, large-sample datasets and analytical methods. Improving this understanding is important for addressing water-related challenges, including hydrological extremes such as floods and droughts.  

In this study we use more than 7000 catchments in Europe from the EStreams dataset (Nascimento et al., 2024) to identify hydrologically similar catchments and to assess their relative climate and landscape controls.  Across the wide spatial and temporal gradients of the study catchments, 10 hydrological response types (HRTs) could be identified using 40 hydrological streamflow signatures.  

The dominant controls of hydrological streamflow behaviour across the HRTs were identified using 84 climate- and landscape attributes with a Random Forest classification model. Climate emerges as the primary control of hydrological streamflow behaviour at the continental scale. However, in 4 out of 10 HRTs, landscape was found to be at least as strong, or even stronger, a control on the hydrological streamflow response. 

To further identify the climatic and landscape controls on a regional scale, the hydrological variability was analysed within the HRTs and across several major river basins by identifying subgroups within these hydrological and spatial groupings based on the 40 hydrological signatures. Using the same climate and landscape attributes, the drivers of hydrological streamflow behaviour were assessed for these subgroups. The results further support that climate and landscape jointly shape the hydrological streamflow behaviour.  

Overall, this analysis shows that European streamflow behaviour can be classified into a limited number of hydrological response types using streamflow signatures alone. While climate is the dominant control at the continental scale, landscape exerts considerable influence and often becomes equally strong or a stronger control at regional scales. These findings highlight the need to understand climate and landscape as joint drivers within a co-evolutionary perspective to advance our understanding of hydrological systems. 

The presentation will be based on Rudlang et al. (2025) as well as new analysis. 

References 

do Nascimento, T. V. M., Rudlang, J., Höge, M., van der Ent, R., Chappon, M., Seibert, J., Hrachowitz, M., & Fenicia, F. (2024). EStreams: An integrated dataset and catalogue of streamflow, hydro-climatic and landscape variables for Europe. Scientific Data, 11(1), 879. https://doi.org/10.1038/s41597-024-03706-1 

Rudlang, J. M., do Nascimento, T. V. M., van der Ent, R., Fenicia, F., and Hrachowitz, M.: Climate and landscape jointly control Europe's hydrology, EGUsphere [preprint], https://doi.org/10.5194/egusphere-2025-6372, 2025. 

How to cite: Rudlang, J. M., do Nascimento, T. V. M., van der Ent, R., Fenicia, F., and Hrachowitz, M.: The spatially variable relative influences of climate and landscape on European streamflow behaviour , EGU General Assembly 2026, Vienna, Austria, 3–8 May 2026, EGU26-12170, https://doi.org/10.5194/egusphere-egu26-12170, 2026.

EGU26-14035 | ECS | Posters on site | HS2.2.5

From Signatures to Structures: Comparing Dominant Hydrologic Processes and Models Across North America 

Peter Wagener, Wouter J. M. Knoben, and Martyn P. Clark

Understanding how dominant hydrological processes vary across hydroclimatic gradients remains a central challenge in hydrology, particularly because model structures embed assumptions about which processes matter and how they interact, limiting transferability beyond individual catchments. Intensively instrumented research basins provide a unique opportunity to link long-term observations, hydrologic signatures, and model behaviour in a controlled yet climatically diverse setting. Here, we report progress on a comparative analysis of a broad set of intensively monitored research basins that represent considerable hydroclimatic diversity, including arid, semi-arid, temperate rainforest, humid continental, snow-dominated, and humid subtropical environments. These basins are characterized by long-term records of discharge, snow, soil moisture, groundwater, and surface–atmosphere fluxes, as well as open data policies that facilitate inter-comparison.

For each basin, we combine a synthesis of existing process understanding from the literature with a data-driven analysis of long-term observations and a benchmark modelling experiment. Hydrologic signatures derived from hydro-meteorological records are used as proxies for dominant processes, enabling characterization of long-term fluxes and storages, including snow dynamics, evapotranspiration patterns, soil and groundwater storage, baseflow, and streamflow behaviour. In parallel, we implement a common set of model structures within the physically-based SUMMA framework, complemented where appropriate by conceptual models (e.g. FUSE). Model setups are harmonized as far as feasible, including meteorological forcing and spatial discretization, to isolate the influence of process representation rather than data availability and model configuration choices. Calibration results are evaluated using multi-state diagnostics and hydrologic signatures.

The anticipated outcomes are (i) an empirical synthesis of how dominant hydrological processes vary across well-instrumented basins, and (ii) evidence of systematic differences (or lack of such differences) in which model structures and process representations are most suitable under contrasting hydro-climatic conditions. These results are a step on the path towards targeted model development and testing within flexible modelling frameworks, supporting more transferable and process-consistent hydrological models.

How to cite: Wagener, P., Knoben, W. J. M., and Clark, M. P.: From Signatures to Structures: Comparing Dominant Hydrologic Processes and Models Across North America, EGU General Assembly 2026, Vienna, Austria, 3–8 May 2026, EGU26-14035, https://doi.org/10.5194/egusphere-egu26-14035, 2026.

EGU26-16859 | ECS | Posters on site | HS2.2.5

A Process-Based Probabilistic View on Hydrological Drought Formation 

Hsing-Jui Wang

Hydrological drought is commonly described using standardized indices derived from observed streamflow. While such indices are useful for monitoring purposes, they often rely on empirical distribution fitting and fixed thresholds, which makes their physical interpretation and transferability across climates and time periods difficult. In particular, it remains unclear how changes in climate forcing or catchment properties are reflected in drought characteristics defined by these indices.

In this study, hydrological drought is examined from a process-based probabilistic perspective, starting from stochastic rainfall–runoff dynamics. Daily rainfall is represented as a marked Poisson process, with storm arrivals occurring at a constant frequency and rainfall depths following an exponential distribution. Infiltration produces random increments of soil moisture, while evapotranspiration leads to continuous moisture losses from the root zone. These losses vary linearly with soil moisture between the wilting point and an upper threshold associated with soil water holding capacity. When this threshold is exceeded, runoff pulses are generated, with their occurrence and magnitudes described by stochastic processes. The resulting runoff feeds a lumped catchment storage, which is drained through the river network according to a nonlinear storage–discharge relationship that reflects the combined contribution of different flow components.

Based on this framework, the stationary probability distribution of streamflow is analytically derived, allowing hydrological drought to be interpreted as a left-tail behavior of the flow distribution rather than as an empirical anomaly. By mapping this theoretical distribution into a standardized probability space, drought conditions can be evaluated in a way that remains comparable with conventional approaches, while keeping an explicit link to physically meaningful parameters. The emphasis of this work is therefore not on defining a new drought index, but on improving the physical understanding of why and how hydrological drought characteristics change under different climatic and catchment conditions.

How to cite: Wang, H.-J.: A Process-Based Probabilistic View on Hydrological Drought Formation, EGU General Assembly 2026, Vienna, Austria, 3–8 May 2026, EGU26-16859, https://doi.org/10.5194/egusphere-egu26-16859, 2026.

EGU26-20328 | ECS | Posters on site | HS2.2.5

Diverse yet Surprisingly Weak Influence of Snow-Fraction Changes on Regional Streamflow Seasonality Shifts 

Zeqiang Wang, Wouter Berghuijs, Nicholas Howden, and Ross Woods

Snowmelt-driven streamflow is often highly seasonal and supports ecosystems and human water use. Climate-driven changes in snow accumulation and melt alter the timing and rates of liquid water input to catchments, thereby reshaping seasonal streamflow patterns. However, shifts in streamflow seasonality under climate change (e.g. snow fraction) remain uncertain. Here, we employ directional statistics to quantify streamflow seasonality (i.e., center of mass timing and concentration) and their sensitivity to annual snow fraction for 239 snow-affected CONUS catchments. While the snowfall-fraction sensitivity of streamflow timing and concentration is relatively weak in individual catchments, consistent and distinguishable patterns emerge at the regional scale. We demonstrate and explain an apparently opposite regional response of seasonal streamflow to between-year variations in snowfall fraction. In years with less snowfall, we identify regions of the USA where seasonal streamflow occurs later (Eastern Rockies and Great Plain-western Great Lakes) and where the flow becomes more concentrated in time (Pacific Northwest). These effects are precisely the opposite of the expected behaviour (observed in other snow-affected parts of the USA), which would be that less snowfall leads to earlier and less concentrated seasonal streamflow. The climate context, particularly precipitation seasonality, provides a mechanistic explanation for these unexpected behaviours. Further, trends from 1980 to 2022 show that changes in streamflow seasonality do not always match the expected effects of declining snow. Our results imply that climate change will not affect snow-affected water resources in the same way everywhere. Water managers in snow-affected regions will need to adapt their strategies to local climate conditions, taking into account not only changes in snow but also shifts in precipitation.


How to cite: Wang, Z., Berghuijs, W., Howden, N., and Woods, R.: Diverse yet Surprisingly Weak Influence of Snow-Fraction Changes on Regional Streamflow Seasonality Shifts, EGU General Assembly 2026, Vienna, Austria, 3–8 May 2026, EGU26-20328, https://doi.org/10.5194/egusphere-egu26-20328, 2026.

EGU26-23084 | ECS | Orals | HS2.2.5

Forest impacts on peak runoff revealed by accounting for the effects of climate 

Shaozhen Liu, James W. Kirchner, Louise J. Slater, Marius G. Floriancic, Ilja van Meerveld, and Wouter R. Berghuijs

Land cover affects the runoff response of catchments. However, such land-cover effects remain difficult to decipher because experimental studies reveal site-specific effects, while large-sample analyses are often confounded by other factors, such as climate gradients that obscure the role of land cover. Empirical methods that do not consider differences in antecedent wetness may overestimate runoff responses in forested catchments due to their typically humid climate. We quantify runoff responses to a unit precipitation input and examine how this varies across 252 U.S. catchments with different land covers. For comparable antecedent wetness conditions, peak runoff responses decline as forest cover increases, with peaks in forested catchments being 16-63% lower than those in catchments dominated by cropland or grassland. By accounting for climate-driven differences among sites, our approach isolates the influences of forest cover on reducing peak flows, which is often masked by climate in large-sample analyses.

How to cite: Liu, S., Kirchner, J. W., Slater, L. J., Floriancic, M. G., van Meerveld, I., and Berghuijs, W. R.: Forest impacts on peak runoff revealed by accounting for the effects of climate, EGU General Assembly 2026, Vienna, Austria, 3–8 May 2026, EGU26-23084, https://doi.org/10.5194/egusphere-egu26-23084, 2026.

EGU26-23227 | Posters on site | HS2.2.5

From snowfall to streamflow: synthesizing the hydrology of high alpine catchments 

Tom Müller and Bettina Schaefli

The hydrology of snow-influenced catchments is characterized by streamflow seasonality resulting from snow and ice accumulation and melt effects. Given how strongly these processes are connected to topography, it is tempting to think that the main streamflow characteristics can be inferred from topography and information on the statistical properties of precipitation and air temperature alone. In this study, we analyze streamflow distributions, interannual and interseasonal water carry-over, and precipitation properties from the CAMELS-CH data set to synthesize the dominant controls on streamflow variability in high-alpine catchments. A key focus is on understanding the interplay between water input (as modulated by air temperature) and groundwater (derived from baseflow analysis) to understand the seasonal streamflow cycle. Ultimately, the proposed analysis should provide a framework to synthesize high-alpine catchment behavior and to assess their sensitivity to climatic variability and change.

How to cite: Müller, T. and Schaefli, B.: From snowfall to streamflow: synthesizing the hydrology of high alpine catchments, EGU General Assembly 2026, Vienna, Austria, 3–8 May 2026, EGU26-23227, https://doi.org/10.5194/egusphere-egu26-23227, 2026.

EGU26-252 | ECS | Orals | HS2.2.6

From Fixed Calendars to Dynamic Triggers: Climate-Responsive Field Management with SWAT+ Decision Tables 

Mamad Eini, Birgit Müller, and Michael Strauch

Climate-change impact assessments using agro-hydrological models often assume that farmers stick to their historical planting and harvest calendars under future climate conditions. This fixed-calendar assumption conflicts with observed and expected shifts in crop phenology and management, leading to errors in simulated crop timing, yields, and water use. Here, we develop and test a generic workflow to replace static calendars with dynamic, state-triggered crop management in SWAT+ using decision tables. Focusing on winter wheat and corn silage in a rainfed catchment in eastern Germany, we first run a conventional, date-based SWAT+ setup and analyze the management log to determine the heat units and weather conditions under which farmers actually plant, harvest, till, and fertilize. Empirical distributions of base-0 potential heat units, days since planting/harvest, and recent precipitation are converted into compact decision-table guards. These guards, mainly expressed as PHU windows and dry-day constraints, are tuned so that dynamic management reproduces historical planting and harvest dates within about one week, while maintaining baseline yield performance. Next, we run the decision-table model with three contrasting late-century EURO-CORDEX climates (cool–dry, cool–wet, warm–wet), without changing crop parameters or management intensities. Under cool scenarios, winter wheat maintains a long growing season of approximately 313–314 days, but under a warm–wet climate, later autumn planting is followed by an earlier midsummer harvest, shortening the season to roughly 287–290 days. Corn silage shows marked advances in planting (up to about three weeks earlier in the warm–wet scenario) while harvest remains anchored near early September, lengthening the growing period from ≈150 to ≈170 days across scenarios. Yields for corn silage stay high and fairly stable, whereas winter wheat yields show modest scenario-dependent changes in the average and more variation between years. The study demonstrates that SWAT+ decision tables can encode historically accurate, climate-responsive management directly from observed practices and apply it consistently under future climates. The proposed workflow provides a transferable model for representing adaptive cropping calendars, reducing structural bias, and enhancing the credibility of climate-change impact studies on crops and agricultural water management.

How to cite: Eini, M., Müller, B., and Strauch, M.: From Fixed Calendars to Dynamic Triggers: Climate-Responsive Field Management with SWAT+ Decision Tables, EGU General Assembly 2026, Vienna, Austria, 3–8 May 2026, EGU26-252, https://doi.org/10.5194/egusphere-egu26-252, 2026.

Between 2023 and 2024, Emilia-Romagna (Italy) was affected by highly anomalous, persistent, and spatially homogeneous frontal precipitation events that triggered disastrous floods. Analysis of small and very small Apennine catchments shows that maximum hourly areal rainfall was significant but never extreme, whereas aggregated rainfall over 6–48 hours reached exceptional values, with return periods exceeding 200 years based on records dating back to the early 1900s. The resulting flood discharges were extremely intense, challenging the traditional design storm approach: synthetic storms with durations equal to the hydrological response time provided very limited guidance on the frequency of the resulting flood, even for catchments with relatively low permeability. Continuous simulation, instead, demonstrated strong potential for flood estimation.
A parsimonious lumped hourly rainfall–runoff model, GR5H, was calibrated under conditions of scarce discharge data using hydrological signatures—Flow Duration Curve and cumulative probability of annual maxima (both Gumbel and GEV distribution were considered, conducting two parallel analysis)—rather than conventional performance metrics. Over 30-year long simulated hourly series were validated through temporal validation and further analysed through log-normal frequency fitting of AMS. Despite limited observations and complex antecedent conditions, the approach provided plausible estimates of extreme flood peaks, highlighting its effectiveness for small, data-scarce basins and its relevance for improving flood risk assessment under evolving hydro-climatic patterns.

How to cite: Smerilli, G. and Castellarin, A.: Questioning the Design Storm Approach: Empirical Evidence for Small Basins from Emilia-Romagna’s Recent Catastrophic Floods, EGU General Assembly 2026, Vienna, Austria, 3–8 May 2026, EGU26-1248, https://doi.org/10.5194/egusphere-egu26-1248, 2026.

Vegetation dynamics play a critical role in canopy interception and transpiration, yet its representation in hydrological models is often simplified or even entirely omitted. Rising air temperatures have been shown to shift the timing and extend the duration of the vegetation period, directly affecting evapotranspiration. Incorporating vegetation dynamics into hydrological models is therefore essential, particularly in studies assessing the impacts of climate change. In this study, we employ satellite‑derived Normalized Difference Vegetation Index (NDVI) data to parameterize vegetation processes within a distributed HBV-type rainfall–runoff model. For each land cover class in the Upper Danube basin, NDVI regimes over a 25‑year period were derived by averaging values from 1,000 randomly selected points. Seasonal vegetation dynamics were then characterized by fitting trapezoid functions to the annual NDVI regimes, yielding estimates of the onset and end of the growing season.

The analysis of vegetation characteristics revealed that certain land cover classes (particularly deciduous forest, agricultural land and pastures) exhibit notable changes including increases in mean annual NDVI values and earlier onset of the growing season. Moreover, the timing of the active growing season was found to correlate with air temperature indices, such as the number of days above or below certain thresholds. These relationships were used to calibrate temperature thresholds and consecutive day counts to estimate the start and end of the vegetation period. The methodology was implemented in the Upper Danube basin as a case study, providing a foundation for further evaluation of its impact on hydrological simulations. By explicitly linking vegetation dynamics to temperature indices, the approach enables hydrological models to operate independently of direct NDVI observations, which are unavailable in climate change impact studies, while also accounting for elevation effects, as cooler temperatures at higher altitudes naturally delay vegetation onset.

How to cite: Valent, P. and Parajka, J.: Linking NDVI-derived vegetation dynamics with air temperature to model interception and transpiration processes of a conceptual hydrological model, EGU General Assembly 2026, Vienna, Austria, 3–8 May 2026, EGU26-1612, https://doi.org/10.5194/egusphere-egu26-1612, 2026.

EGU26-2852 | ECS | Posters on site | HS2.2.6

Do Process-Based Models Really Fall Short? Rethinking Channel Routing to Bridge the Gap with Machine Learning Models 

Ekant Sarkar, Akshay Kadu, Vijay Katari, and Basudev Biswal

Machine-learning models, particularly Long Short-Term Memory (LSTM) networks, often outperform process-based rainfall–runoff models, yet the specific process limitations driving this performance gap remain underexplored. We hypothesize that a major contributor is the use of simplified channel routing formulations that insufficiently represent temporal variability in flow velocity. Here, we couple the HBV rainfall–runoff model with the recently proposed Iterative Routing Model (IRM), a parsimonious and non-linear channel routing framework that explicitly allows flow velocity to vary with discharge. We evaluate the coupled HBV–IRM model over 64 CAMELS catchments across the United States. The hybrid model attains a median NSE of 0.72, improving on the original HBV (0.65) and approaching the performance of global LSTM benchmarks (0.74). The results indicate that improving process representation in channel routing can substantially reduce the performance gap between process-based and data-driven models, while retaining process understanding and physical interpretability.

How to cite: Sarkar, E., Kadu, A., Katari, V., and Biswal, B.: Do Process-Based Models Really Fall Short? Rethinking Channel Routing to Bridge the Gap with Machine Learning Models, EGU General Assembly 2026, Vienna, Austria, 3–8 May 2026, EGU26-2852, https://doi.org/10.5194/egusphere-egu26-2852, 2026.

Accurate representation of vegetation dynamics is critical for hydrological modeling and climate change impact assessments. Leaf Area Index (LAI) influences ecohydrological processes, including evapotranspiration, interception, and soil moisture. The conventional Soil and Water Assessment Tool Carbon (SWAT-C) model has a simplified vegetation growth module, which limits the accuracy of the model in decision making. The present study evaluates how improved simulation of LAI affects ecohydrological responses of a watershed under historical and future climate scenarios. The study employed setting up of two models: original SWAT-C as a baseline model, and a modified version of the SWAT-C model with an improved plant growth module to simulate LAI more realistically in forested areas. Both models were calibrated using streamflow, evapotranspiration, and sediment yield using A Multi Algorithm Genetically Adaptive Multiobjective (AMALGAM) optimizer. The climate projections from different bias corrected global circulation models were applied to understand the sensitivity of ecohydrological simulations of streamflow, evapotranspiration, sediment yield, net primary productivity (NPP), biomass, net ecosystem exchange (NEE), soil organic carbon (SOC), and lateral carbon fluxes to vegetation-driven changes in LAI. The differences in the future climate scenarios highlights the influence of vegetation feedbacks on projected hydrological responses and carbon dynamics. This approach provides better insight into vegetation–water–carbon interactions and can support improved strategies for managing water and ecosystem resources under changing climate conditions.

How to cite: Vema, V. K. and Aashi, A.: Influence of Vegetation Dynamics on Hydrological and Carbon Responses under Future Climate Scenarios Using SWAT-C, EGU General Assembly 2026, Vienna, Austria, 3–8 May 2026, EGU26-3703, https://doi.org/10.5194/egusphere-egu26-3703, 2026.

EGU26-5934 | ECS | Orals | HS2.2.6

Comparing multi-model approaches to simulate streamflow across a large sample of catchments 

Cyril Thébault, Wouter J. M. Knoben, Nans Addor, and Martyn P. Clark

The research and operational communities have developed many models to represent the complexity and diversity of hydrological processes and meet specific application needs. Previous studies have shown the limitations of a one-size-fits-all model structure (e.g. poor representation of local conditions, limited process representation, scalability issues). To address these barriers and improve model performance, multi-model approaches have been developed that select and/or combine outputs from an ensemble of models (e.g., catchment-specific selection based on performance scores, or weighting of ensemble members using methods such as Bayesian model averaging).

This study compares multi-model methods to improve streamflow simulation. Specifically, we evaluated five different approaches: a mosaic (i.e. per-catchment selection) based on performance, a mosaic based on performance-equivalence, a static combination in time and space (i.e. a fixed combination applied across all catchments), a static combination in time only (i.e. per-catchment combination) and a dynamic combination (i.e. evolving over time and space). To this end, an ensemble of 78 models was designed with the Framework for Understanding Structural Errors (FUSE) and applied to 559 catchments in the CAMELS dataset across the contiguous USA. The evaluation is based on a composite criterion to account, to some extent, for both high- and low-flow conditions. Sampling uncertainty (i.e. the variability in performance scores due to the evaluation period selected) was assessed using a bootstrap-jackknife method.

Results show that differences between multi-model approaches are small, even when complexity varies greatly (e.g., number of models per catchments, variability in space and time, computational time). Benefits compared with a one-size-fits-all model are not as large as expected, especially after considering sampling uncertainty. While perhaps surprising, this underscores the strength of the one-size-fits-all model selection used here, where model choice is guided by performance across a large ensemble of models and sample of catchments, and not arbitrarily or by convenience. These findings may also reflect limitations of common evaluation metrics, which may not fully capture the benefits of more complex approaches.

How to cite: Thébault, C., Knoben, W. J. M., Addor, N., and Clark, M. P.: Comparing multi-model approaches to simulate streamflow across a large sample of catchments, EGU General Assembly 2026, Vienna, Austria, 3–8 May 2026, EGU26-5934, https://doi.org/10.5194/egusphere-egu26-5934, 2026.

EGU26-6570 | ECS | Posters on site | HS2.2.6

From perceptualisation to modelling: Improving the representation of temporally variable intercatchment groundwater flow in hydrological models 

Louisa Oldham, Gemma Coxon, Nicholas Howden, and Christopher Jackson

The groundwater system is dynamic in time, in particular in high productivity aquifers such as the heterogeneous and fractured Chalk aquifer. Unlike river catchments, which are generally topographically controlled and therefore stable, groundwater catchments vary seasonally. The location and magnitude of intercatchment groundwater flow (IGF) can therefore also vary seasonally. This can pose a significant challenge for hydrological conceptual models. Building on work previously conducted by the authors on perceptualising the spatial variability of IGF and incorporating this into the DECIPHeR conceptual rainfall-runoff model, we have followed the same data-led approach in an investigation of the temporal variability of IGF. An evidence-based perceptual model of the River Kennet, UK (a tributary of the River Thames) was first developed and then used to inform the design of model edits that capture seasonal IGF in-line with the perceptual understanding. From review of recorded data, it was found that a strong sinusoidal climate signal propagates through to the groundwater table, river flow and catchment water balance annual profiles, but that this signal is highly variable between years. The temporal variability observed in the test sub-catchments was applied to an IGF flux within the DECIPHeR model, and the results compared to both the baseline model and the spatial IGF model developed in previous work. Four model structures were developed and tested, show-casing an increasing level of hydrogeological information and seasonal analysis. Model calibration at the annual scale was no better than the spatially-variable IGF model, but there was a marked improvement in the representation of the monthly flow profile when an additional IGF flux sinusoidal amplitude parameter was introduced. The timings of the autumnal increase in river flow, plus the slow spring recession, are now able to be replicated. The findings prompted a discussion on the challenges that remain when representing intercatchment groundwater flow in conceptual hydrological models. Most notably, these include a lack of representation of long-term catchment storage limiting a model’s ability to replicate the inter-annually variable groundwater catchment areas that are so characteristic of Chalk catchments.

How to cite: Oldham, L., Coxon, G., Howden, N., and Jackson, C.: From perceptualisation to modelling: Improving the representation of temporally variable intercatchment groundwater flow in hydrological models, EGU General Assembly 2026, Vienna, Austria, 3–8 May 2026, EGU26-6570, https://doi.org/10.5194/egusphere-egu26-6570, 2026.

Traditional raster-based distributed hydrological models often face challenges in representing the geometric complexity of landscape features, leading to fragmented boundaries and oversimplified topological relationships. To address these limitations, this study proposes a novel Integrated Vector-Raster Hydrological Model (VeRHyM). By employing a flexible spatial discretization scheme, the VeRHyM utilizes vector polygons to represent irregular land features (e.g., glaciers, reservoirs, agricultural fields) and vector polylines for river networks, while maintaining raster data for continuous field variables (e.g., precipitation, topography) and describing internal heterogeneity within individual land features.

Enabled by its hybrid data structure, the proposed model offers several key advantages over conventional grid-based approaches: (1) Geometric Integrity: It preserves the precise boundaries of land features, preventing the fragmentation of physical objects into disjointed pixels; (2) Topological Accuracy: It provides a more rigorous description of river networks, water conveyance structures, and the spatial connectivity between different land features; and (3) Multi-scale Coupling: It facilitates the seamless coupling of hydrological processes across varying spatial scales, from individual glaciers to the entire watershed. This also enables precise coupling between distinct physical models (e.g., glacier runoff and crop water stress) at their native spatial scales.

We applied the VeRHyM to the Urumqi River Basin in Tianshan, China, a typical complex watershed characterized by diverse landscapes ranging from high-altitude glaciers and alpine vegetation to arid piedmont zones containing oases, cropland, and urban settlements. The model performance was rigorously validated using multi-source data: River discharge was calibrated against observations from the Tianshan No. 1 Glacier station and the mountain outlet hydrological station; simulated evapotranspiration was compared with remote sensing products; and human water consumption estimates were verified against regional statistical records. Results demonstrate that the VeRHyM captures the spatiotemporal variability of the water cycle effectively in this complex terrain. The successful application suggests that the vector-raster integration strategy significantly improves the representation of heterogeneous landscapes and provides a robust tool for integrated water resources management in arid regions.

How to cite: Liu, X.: A Novel Integrated Vector-Raster Model for Multi-Process Hydrological Simulation in Heterogeneous Landscapes, EGU General Assembly 2026, Vienna, Austria, 3–8 May 2026, EGU26-6697, https://doi.org/10.5194/egusphere-egu26-6697, 2026.

EGU26-7610 | Posters on site | HS2.2.6

Application of an upscaled hydrological model to five Oklahoma watersheds of the CAMELS database. 

Emmanuel Mouche and Fanny Picourlat

An upscaling approach of 3D hydrological processes for Land surface models (LSM) has recently been developed and tested on the Little Washita experimental watershed (Ok., USA). We show here how the resulting upscaled model, which depends on two hydrologic variables, may be encapsulated into a vertical soil column model. This upscaling approach allows to establish the relationships between the physical and geometrical parameters of a watershed and the empirical parameters of the LSM ORCHIDEE. A comparison of both models on the Little Washita is discussed. Then, we test this new model on five watersheds located in Oklahoma (USA) and picked from the CAMELS database. All the geometrical and physical parameters come also from the database except the van Genuchten infiltration parameters obtained by a calibration algorithm. The five watersheds cover a wide range of areas and hydroclimatic conditions of the south great plain region. The results show that the monthly inter-annual means and annual means KGE values are comparable to those obtained with SACMA which is the reference model of CAMELS. As a conclusion, it is worth to emphasize that the quality of our results depends essentially on the calibration of the infiltration parameters. This work will be extended to other watersheds of the CAMELS database.

How to cite: Mouche, E. and Picourlat, F.: Application of an upscaled hydrological model to five Oklahoma watersheds of the CAMELS database., EGU General Assembly 2026, Vienna, Austria, 3–8 May 2026, EGU26-7610, https://doi.org/10.5194/egusphere-egu26-7610, 2026.

EGU26-7811 | ECS | Orals | HS2.2.6

Testing multiple structures of a lumped hydrogeological model to simulate karst spring discharge in France and provide seasonal forecasts in the Aqui-FR platform 

Thibault Hallouin, Jean-Pierre Vergnes, Jean-Baptiste Charlier, and Pascal Audigane

Karst springs represent an important source of drinking water. Karst aquifers are highly complex and heterogeneous hydrogeological systems made of poorly known conduit networks which makes springs discharge difficult to forecast. Lumped hydrological models can only satisfactorily model karst systems if they consider both diffuse and localised infiltration, and matrix and conduit flow pathways. The French Geological Survey developed RAMEAU (River and Aquifer Model of the frEnch geological sUrvey), a flexible lumped hydrogeological model conceptually encompassing these processes in its model structure. The objective of this study is to demonstrate the versatility of the model to simulate discharge in a variety of karstic systems in France. This study evaluates the performance of the different model structures to simulate the discharge of a large sample of French springs. The models are calibrated on decades long time series of observed spring discharge, and the best model structure is selected independently for each spring. These models are then integrated in the Aqui-FR platform, a multi-model platform that provides hydrogeological seasonal forecasts over continental France.

How to cite: Hallouin, T., Vergnes, J.-P., Charlier, J.-B., and Audigane, P.: Testing multiple structures of a lumped hydrogeological model to simulate karst spring discharge in France and provide seasonal forecasts in the Aqui-FR platform, EGU General Assembly 2026, Vienna, Austria, 3–8 May 2026, EGU26-7811, https://doi.org/10.5194/egusphere-egu26-7811, 2026.

EGU26-8296 | ECS | Orals | HS2.2.6

When and where are abstractions and wastewater discharges crucial for streamflow modelling? Lessons learnt from large sample analysis and hydrological modelling in England 

Yanchen Zheng, Gemma Coxon, Francesca Pianosi, Ross Woods, Mostaquimur Rahman, Laura Devitt, and Nicholas Howden

Water resources are increasingly under threat across the UK. Climate change is driving more frequent and severe floods and droughts, while anthropogenic pressures such as abstractions and wastewater discharges are increasingly impacting streamflow. Accurate hydrological simulations are critical for water resources management, particularly in densely populated and water-stressed regions such as South-East England. However, many hydrological models omit or oversimplify key human activities such as surface and groundwater abstractions and discharges from wastewater treatment plants, limiting model performance in human-influenced catchments.

To address this challenge, we exploit a unique water resource management dataset, which includes decades-long records of monthly surface water and groundwater abstraction (1999–2023) and daily wastewater discharge time series (2005–2015) for thousands of locations across England. We first analyse this dataset to identify when and where river flows are most affected by abstractions and wastewater discharges, and characterise their intra-annual and interannual variability, providing evidence for integrating these data into hydrological models. We then implement water abstraction and wastewater discharge modules within the DECIPHeR-GW hydrological model, and quantify the resulting improvements in streamflow simulations. We also identify the conditions under which neglecting these processes leads to substantial model degradation. Scenario-based experiments are used to assess how water resource management data should be represented, for instance, the importance of temporal patterns, providing guidance for modelling human impacts in data-scarce regions.

How to cite: Zheng, Y., Coxon, G., Pianosi, F., Woods, R., Rahman, M., Devitt, L., and Howden, N.: When and where are abstractions and wastewater discharges crucial for streamflow modelling? Lessons learnt from large sample analysis and hydrological modelling in England, EGU General Assembly 2026, Vienna, Austria, 3–8 May 2026, EGU26-8296, https://doi.org/10.5194/egusphere-egu26-8296, 2026.

The spatial scale and delineation of Representative Elementary Watersheds (REWs) are fundamental determinants of fidelity in physically based hydrological modeling. The REW framework facilitates a semi-distributed representation of dominant processes—such as surface runoff, subsurface flow, and channel routing—by averaging conservation equations of mass and momentum over discretized sub-units. Leveraging the Tsinghua Hydrological REW model (THREW), this study investigates the sensitivity of hydrological simulations to REW spatial scale across a diverse set of over 80 catchments. By systematically varying drainage area thresholds for REW delineation, we observed distinct scale-dependent behaviors: for larger basins, higher spatial resolution generally enhances model accuracy with relatively low sensitivity to the specific delineation threshold. Conversely, in smaller catchments, excessive discretization often degrades performance and exhibits heightened sensitivity to threshold selection. In the context of daily time-step simulations, we found that for smaller catchments, the detriments of increased data noise and parameter uncertainty often outweigh the marginal gains derived from resolving spatial heterogeneity. In contrast, the explicit characterization of this heterogeneity is critical for optimizing model performance in larger basins.

How to cite: Xu, B. and Tong, R.: Assessing the impact of the spatial scale of Representative Elementary Watershed (REW) delineation for hydrological modeling, EGU General Assembly 2026, Vienna, Austria, 3–8 May 2026, EGU26-9215, https://doi.org/10.5194/egusphere-egu26-9215, 2026.

EGU26-9295 | ECS | Orals | HS2.2.6 | Highlight

Unboxing the Water Cycle across Spatial Scales with Isotope-Enabled Hydrological Modelling 

Songjun Wu, Doerthe Tetzlaff, and Chris Soulsby

Improvements in computer power have facilitated the automatic calibration of hydrological and ecohydrological models. Still, many internal hydrological processes remain poorly understood due to their inherent complexity, strong spatial heterogeneity, and highly interactive nature. This knowledge gap largely stems from the prevailing focus on catchment celerity responses (rainfall-runoff response) in hydrological studies, while the pathways and velocities of internal water fluxes remain largely unexplored. Consequently, many hydrological models function as grey boxes – capable of reproducing discharge dynamics yet often “for the wrong reasons.”

Stable water isotopes offer a powerful means to unbox the water cycle with improved process understanding across spatial scales. As conservative tracers, 2H and 18O are independent of most biogeochemical reactions and naturally integrate spatial heterogeneity, providing effective constraints on the spatial connectivity and velocities of hydrological flow paths. In this presentation, we synthesize our experience with isotope-enabled hydrological and ecohydrological modelling to demonstrate how such frameworks enhance process representation from plot to continental scales.

We will briefly introduce how we developed or refined isotope-aided ecohydrological models at plot, river, catchment, and continental scales. We then demonstrate how these models can be used to partition hydrological fluxes and to identify key flow pathways and their corresponding velocities. Specifically, we illustrate how stable isotopes can be used to (i) quantify depth-dependent root water uptake at the plot scale, (ii) resolve geometry-controlled channel recharge and leakage at the river scale, (iii) diagnose lateral hydrological connectivity among landscape units at the catchment scale, and (iv) characterize pathways and velocities of terrestrial water cycling at the continental scale. These process-based insights not only support more robust and sustainable water management strategies, but also advance our understanding of the co-evolutionary mechanisms linking water and nutrient cycles.

How to cite: Wu, S., Tetzlaff, D., and Soulsby, C.: Unboxing the Water Cycle across Spatial Scales with Isotope-Enabled Hydrological Modelling, EGU General Assembly 2026, Vienna, Austria, 3–8 May 2026, EGU26-9295, https://doi.org/10.5194/egusphere-egu26-9295, 2026.

EGU26-9617 | ECS | Orals | HS2.2.6

Towards Consistent Multi-Scale Flood Modelling Using an Integrated Hydrological–Hydrodynamic Framework 

Mohamed Amine Berkaoui, Mohamed Saadi, François Colleoni, Ngo Nghi Truyen Huynh, Ahmad Akhtari, Kevin Larnier, Pierre-André Garambois, and Hélène Roux

Representing hydrological and hydraulic processes consistently across spatial scales remains a major challenge for large-scale flood modelling. Besides using simplified routing schemes that struggle to accurately represent in-channel river flow dynamics, most large-scale hydrological models adopt a Cartesian-grid discretization scheme due to their compatibility with widely available gridded datasets. However, this grid-based structure poorly captures river geometry and oversimplifies natural drainage boundaries, leading to scale-dependent biases in runoff production and streamflow simulations, commonly referred to as the “catchment size problem”. In contrast, hydrodynamic models implement more physically-based routing schemes with fine-scale geometric representation of river channels, but face important parametrization challenges at larger scales. To address these challenges, we introduce an integrated hydrological–hydrodynamic (H&H) modelling framework that enables a seamless coupling between coarse-resolution gridded hydrological modelling and fine-scale vector-based river routing, leveraging a sub-grid representation of the river network derived from high-resolution topography. Notably, sub-grid information is propagated into the hydrological model by replacing regular grid-cell areas with realistic drainage areas derived from sub-grid topography, thereby addressing the aforementioned “catchment size problem”. The integrated H&H framework is implemented within the SMASH modelling platform (Spatially distributed Modelling and ASsimilation for Hydrology, https://smash.recover.inrae.fr/). For this application, we coupled the grid-based conceptual hydrological model GR4 to a vector-based hydrodynamic model solving a simplification of the 1D shallow water equations without convective acceleration terms. We evaluated this framework over the Garonne River catchment (France, ~50,000 km²) using the MERIT digital elevation model (resampled at 100 m) and the reference national river network BD TOPAGE®. We conducted H&H simulations across three spatial resolutions: 1 km, 5 km, and 10 km, where we considered the 1 km configuration as a baseline and kept the same hydrological and hydrodynamic parametrization across resolutions (no recalibration): semi-distributed hydrological parameters, uniform channel friction, and simplified rectangular channel geometry where widths and depths are estimated from geomorphological relationships, and bathymetry is subsequently derived from geomorphological depths and elevation. Results show that the sub-grid river representation maintains a consistently high spatial accuracy across spatial scales, with mean separation distance from the reference hydrography of around 25 m and minimal omission of the mapped network (<6%). This geometric accuracy consistency is further supported by H&H simulations showing robust preservation of flow timing across scales. Furthermore, H&H simulations demonstrate improved consistency across spatial scales when leveraging sub-grid drainage areas, compared to the conventional grid-based delineation method that shows scale-dependent volume bias. This bias reflects the impact of drainage area misrepresentation as resolution is coarsened, which results in biased precipitation volumes and propagates into runoff production. Overall, these results highlight the potential of the proposed integrated H&H framework to enable scalable hydrological–hydrodynamic modeling at large scales and provide a flexible foundation for leveraging increasingly available multi-source water surface observations, such as satellite altimetry (e.g., SWOT, ICESat-2), to infer key H&H model parameters and enhance modeling accuracy in data-sparse regions.

How to cite: Berkaoui, M. A., Saadi, M., Colleoni, F., Huynh, N. N. T., Akhtari, A., Larnier, K., Garambois, P.-A., and Roux, H.: Towards Consistent Multi-Scale Flood Modelling Using an Integrated Hydrological–Hydrodynamic Framework, EGU General Assembly 2026, Vienna, Austria, 3–8 May 2026, EGU26-9617, https://doi.org/10.5194/egusphere-egu26-9617, 2026.

EGU26-9813 | ECS | Posters on site | HS2.2.6

On attempting to close the water balance when all fluxes are questionable: what can we learn from the spatial coherence of the water balance anomaly signal ? 

Matteo Rosales, Fanny Sarrazin, Frédéric Hendrickx, and Vazken Andréassian

The struggle to reliably close the water balance at the catchment scale has been a major issue for conceptual hydrological models. Inter-catchment groundwater flows (IGF), human influences, forcing biases and streamflow uncertainties all unite to provide high-end puzzles even to the most enduring hydrologist. In the absence of a better assessment of each of these non-closure sources, many mesoscale conceptual models either choose to accept the mismatch between observed and simulated streamflow, or to force the water balance closure through calibration. Here, we argue that, when working at the mesoscale, ridding ourselves of the actual non-closure complexity through calibration can (or should) be avoided: rather, we propose to grapple with water balance anomalies by explicitly addressing all of their potential causes, ahead of any subsequent parameter estimation.

Specifically, we take advantage of the recent proliferation of natural streamflow datasets, enriched with a number or regional and national contributions to evaluate water-balance anomalies as computed with the CERRA-Land climate reanalyses over the period 1984-2024. Thereon, we develop a methodology based on the spatial analysis of the distribution of catchments’ distances to a Budyko-type curve. Our belief is that the spatial coherence of this water balance anomaly signal can be used to disentangle the different causes of the water balance non-closure and, in particular, to discriminate between those which have local determinants (such as groundwater flows) and those involving regional factors (such as forcing biases). Finally, we further break down the contribution of the forcing biases based on a priori knowledge about precipitation (P) and potential evaporation (E0) biases. We present our results under the form of a pan-European map displaying all catchment-specific non-closure sources, with a three-way scale (e.g. ternary plot) measuring the respective weights of P, E0 and IGF.

How to cite: Rosales, M., Sarrazin, F., Hendrickx, F., and Andréassian, V.: On attempting to close the water balance when all fluxes are questionable: what can we learn from the spatial coherence of the water balance anomaly signal ?, EGU General Assembly 2026, Vienna, Austria, 3–8 May 2026, EGU26-9813, https://doi.org/10.5194/egusphere-egu26-9813, 2026.

EGU26-9884 | ECS | Posters on site | HS2.2.6

Exploring hydrological changes across a mountain basin in Friuli-Venezia Giulia through a distributed hydrological model 

Davide Flaugnacco, Andrea Bassi, Juby Thomas, and Elisa Arnone

Climate change is one of the anthropogenic factors inducing alterations in hydrological processes, known as hydrological changes. To assess these changes at catchment scale and evaluate their impacts on the hydrology-related hazards, spatially-distributed and physically-based hydrological models represent reliable and suitable tools. However, significant challenges remain in achieving robust parameterization and calibration, mainly due to data limitations, spatial and temporal scale mismatches, and the intrinsic complexity of hydrological processes.

In this study we adopt the Triangulated Irregular Network-based real-time integrated basin simulator (tRIBS) hydrological model to build a proper laboratory tool enabling a comprehensive high-resolution distributed analysis on the response to scenarios of changes of multiple hydrological aspects, such as runoff components partitioning, evapotranspiration fluxes andsoil moisture dynamics. The case study is the Cedarchis basin, a part of the municipality of Arta Terme in the Friuli-Venezia Giulia (FVG) region, located in the north-eastern Italy. The basin covers 125 km2, as part of the main Tagliamento river basin, and the Chiarsò stream flows through it. Stream flow is monitored through an ultrasonic stream gauge installed at the outlet and managed by the Civil Protection Department of the FVG region. Additional stream measurements are available along the Chiarsò stream due to a small private hydropower plant. Rainfall data are available for the Paularo station, located approximately at the center of the basin. The calibration was conducted using data from the 2023-2024 period, which includes the proper spin-up time. To update and enhance the rating curve, required to transform hydrometric readings into discharge, we carried out multiple field measurements of stream flow managed by the water resources management service (Servizio Gestione Risorse Idriche) of the region. This time series was subjected to procedures of corrections, such as filling, extrapolation and filtering, with two moving windows, to reduce instrumental noise. The Nash-Sutcliffe efficiency coefficient (NSE) was used to perform the calibration and validation. Finally, to evaluate the response of the basin to climate change, synthetic precipitation series generated using an advanced weather generator for the 2050 and 2100 horizons under the RCP 4.5 and RCP 8.5 scenarios are used.

This research received funding from European Union NextGenerationEU – National Recovery and Resilience Plan (PNRR), Mission 4, Component 2, Investiment 1.1 -PRIN 2022 – 2022ZC2522 - CUP G53D23001400006.

How to cite: Flaugnacco, D., Bassi, A., Thomas, J., and Arnone, E.: Exploring hydrological changes across a mountain basin in Friuli-Venezia Giulia through a distributed hydrological model, EGU General Assembly 2026, Vienna, Austria, 3–8 May 2026, EGU26-9884, https://doi.org/10.5194/egusphere-egu26-9884, 2026.

EGU26-10150 | Orals | HS2.2.6

Are more advanced hydrological models necessary to help water managers adapt to climate change? 

Louise Mimeau, Louis Héraut, Jean-Philippe Vidal, and Flora Branger

A current challenge in hydrological modelling is to provide water resource managers with projections of future water resources under various climate change, land use and water management scenarios. This will help them to develop climate change adaptation strategies specific to their territories. The hydrological models used to simulate these projections can be complicated and time-consuming to implement at a local level. Therefore, the challenge lies in providing water managers with modelling tools that are simple enough to implement, yet realistic enough in their representation of processes to simulate the correct hydrological response.

CACTUS (CustomizAble CaTchment model for water Use Scenarios) is an interactive tool that allows users to customise the characteristics of a simplified catchment, then run simulations using the distributed hydrological model J2000 and visualize the simulation results. In order to make the tool operational and quick to implement, several simplifications had to be made : (i) the shape of the catchment and river network is predefined and discretized into a fixed number of grid cells (185) and reaches (14), (ii) the input climate data are estimated for a specific localization based on a limited number of reference time series, (iii) the Penmann-Monteith formula to represent potential evapotranspiration has been replaced by a formula that depends only on latitude and temperature (Oudin formula), (iv) the model is not calibrated and the parameters are selected from standard values found in the literature, (v) climate change scenarios are produced by perturbing the climate variables of the present period (delta on the seasonal temperature, cumulative precipitation and number of rainy days). Thanks to these simplifications, the catchment can be configured in about ten to twenty minutes and a 40-year simulation can be run in a few seconds.

To evaluate the accuracy with which CACTUS can simulate catchment hydrology and its response to climate scenarios, simulation results obtained with this tool were compared with hydrological projections from an ensemble of 7 hydrological models and 4 climate projections (Sauquet et al., 2025), in 5 contrasted French catchments (1 high mountain basin, and 2 lower mountain basins, 1 agricultural basin in plains, 1 peri-urban basin). The comparison shows that CACTUS simulates hydrological regimes and changes in hydrological indicators (in terms of both signs and magnitudes) that fall within the uncertainty range of the benchmark 7-models ensemble. This demonstrates that quick-to-implement, simplified hydrological models can provide water managers with a valuable primary level information for initiating an exploration of adaptation strategies.

Sauquet, E., Evin, G., Siauve, S., Aissat, R., Arnaud, P., Bérel, M., Bonneau, J., Branger, F., Caballero, Y., Colléoni, F., Ducharne, A., Gailhard, J., Habets, F., Hendrickx, F., Héraut, L., Hingray, B., Huang, P., Jaouen, T., Jeantet, A., Lanini, S., Le Lay, M., Magand, C., Mimeau, L., Monteil, C., Munier, S., Perrin, C., Robelin, O., Rousset, F., Soubeyroux, J.-M., Strohmenger, L., Thirel, G., Tocquer, F., Tramblay, Y., Vergnes, J.-P., and Vidal, J.-P.: A large transient multi-scenario multi-model ensemble of future streamflow and groundwater projections in France, EGUsphere [preprint], https://doi.org/10.5194/egusphere-2025-1788, 2025

How to cite: Mimeau, L., Héraut, L., Vidal, J.-P., and Branger, F.: Are more advanced hydrological models necessary to help water managers adapt to climate change?, EGU General Assembly 2026, Vienna, Austria, 3–8 May 2026, EGU26-10150, https://doi.org/10.5194/egusphere-egu26-10150, 2026.

EGU26-10607 | Posters on site | HS2.2.6

From continent to coast: advances in HYPE hydrological model calibration and AI-based model enhancement 

Pavel Terskii, Yiheng Du, Conrad Brendel, Ilias Pechlivanidis, and Alena Bartosova

The Horizon Europe project FOCCUS (https://foccus-project.eu) aims to enhance Copernicus Marine Service's coastal dimension by developing innovative products as well as facilitating seamless ocean monitoring and forecasting. The scope of the project includes improvement of the estimation of water and matter runoff to the European coastal regions using large-scale hydrological models. Effort is directed on improving the pan-European HYPE (E-HYPE) hydrological model (see 1) both through a traditional calibration and a hybrid modelling approach through an AI-based enhancement.

The calibration framework was revised and updated, including changes in the application of common criteria (NSE, KGE, RE, R²). The previous E-HYPE calibration focused on improving domain-average model performance. Instead of relying on domain-average model performance, the proportion of calibration stations meeting acceptable performance thresholds was used to increase the number of well-calibrated stations. This approach reduces the influence of stations with highly unreliable data that may otherwise bias criteria-based parameter selection. The model validity was also assessed for key physical processes including snow accumulation, reservoir siltation, and sedimentation-resuspension dynamics. The final step involved manual inspection of time series and performance distributions for streamflow, nutrient and sediment concentrations, as well as snow water dynamics. Validation was conducted at the spatial extent across gauged catchments (not used for calibration), and at major coastal outlets. The updated E-HYPE model shows improved overall performance compared to its previous benchmark version, especially in streamflow, sediment concentration and evapotranspiration.

Finally, a hybrid modelling approach was applied, which included an AI-based post-processing to improve the streamflow predictions at coastal outlets (see 2). This effort involves transferring the knowledge learned from the upstream gauged locations, providing improved predictive performance at ungauged locations (not included in the training stations). Overall, the final dataset includes daily streamflow, sediment and nutrient concentration at 5,302 European coastal outlets for the period 2000-2024 and will be soon publicly available on Zenodo.

References:

1. Brendel, C., Capell, R., & Bartosova, A. (2023). To tame a land: Limiting factors in model performance for the multi-objective calibration of a pan-European, semi-distributed hydrological model for discharge and sediments. Journal of Hydrology: Regional Studies50, 101544. 

2. Du, Y., & Pechlivanidis, I. G. (2025). Hybrid approaches enhance hydrological model usability for local streamflow prediction. Communications Earth & Environment, 6(1), 334.

How to cite: Terskii, P., Du, Y., Brendel, C., Pechlivanidis, I., and Bartosova, A.: From continent to coast: advances in HYPE hydrological model calibration and AI-based model enhancement, EGU General Assembly 2026, Vienna, Austria, 3–8 May 2026, EGU26-10607, https://doi.org/10.5194/egusphere-egu26-10607, 2026.

EGU26-12060 | ECS | Posters on site | HS2.2.6

Dealing with imperfect data to integrate farm dams and agricultural water uses in hydrological modelling 

Nathan Pellerin, Ninon Brown, Louise Mimeau, Jean-Philippe Vidal, and Flora Branger

Farm dams are a controversial solution for ensuring the supply of water for summer agricultural crops. Their potential impact on catchment hydrological balance and river ecology is still an open question. In France, research work is mostly focused on small catchments, where it is possible to collect information. However, it is necessary to study the cumulative impact of farm dams at a larger scale and in contrasting (geographical, agricultural, geological, and climatic) contexts to guide the development of national regulations. To this end, large-scale distributed hydrological modelling integrating representations of farm dams and agricultural uses of water is a solution. This requires spatialised data on agricultural practices (e.g. types of crops, irrigated areas), farm dams (e.g. their locations, sizes, connections to the river network), and their uses (e.g. agricultural, industrial, recreational). These data are not always available, and if they exist, additional challenges are posed by the partial nature of the data, lack of documentation, and varying or overly coarse resolutions. The work undertaken here proposes a methodology to exploit these imperfect databases and to optimise the representation of the territories heterogeneity for hydrological modelling. We collected recent public data (last 20 years) for two major French river basins, the Rhône and the Loire (~100,000 km² each). Agricultural statistics (crops and irrigation) from national census, have an overly coarse spatial resolution and therefore need to be spatially redistributed. National inventory of water bodies (locations, surface) built using satellite imagery, contains limited data on the volumes and uses of water bodies. Annual water abstractions database (locations, volumes, uses, water origins), where the use of farm dams are heterogeneously documented. The first step reconstructs crop and irrigation surfaces at a fine spatial resolution over the domain of study in order to allocate variables in the model units, using a dedicated optimisation algorithms. The second step synthetises and allocates an equivalent farm dam to the model units, crossing informations from the national inventory embedded by local databases. The third step connects irrigated areas to water abstraction origin (farm dams, rivers or groundwater) using statistics rebuilt for both catchment. The spatial reconstruction and allocation of irrigation (i.e. farm dams) is validated by comparing the model units with the original data. In addition, the integration of farm dams and agriculture water use is validated by exploring the hydrological variables simulated with the J2000 hydrological model, in comparison with abstraction volumes. This modelling approach will enable the assessment of the impact of farm dams and their uses on catchment hydrology. It will also evaluate the capacity of farm dams to meet irrigation demands at different spatial scales, while accounting for the uncertainties associated with the imperfect nature of the databases.

How to cite: Pellerin, N., Brown, N., Mimeau, L., Vidal, J.-P., and Branger, F.: Dealing with imperfect data to integrate farm dams and agricultural water uses in hydrological modelling, EGU General Assembly 2026, Vienna, Austria, 3–8 May 2026, EGU26-12060, https://doi.org/10.5194/egusphere-egu26-12060, 2026.

EGU26-12226 | ECS | Orals | HS2.2.6

Evaluating multiscale performance of the TETIS distributed hydrological model using satellite and in situ observations in the Tugela basin 

Nicolás Cortés-Torres, Nathaly Güiza-Villa, Sergio Salazar-Galán, and Félix Frances

The spatial resolution at which distributed hydrological models are implemented plays a critical role in their ability to represent dominant hydrological processes and to close the water balance consistently across scales (Blöschl & Sivapalan, 1995). Despite the increasing availability of satellite-based observations, their integration into multiscale hydrological modelling frameworks remains challenged by scale dependency, parameter transferability (Barrios & Francés, 2012; Medici et al., 2008), and computational constraints.

This study presents a multiscale performance assessment of the distributed hydrological model TETIS (Francés et al., 2007; GIMHA - Grupo de Investigación en Modelación Hidrológica y Ambiental Distribuida, 2021) by coupling in situ observations from 27 gauging stations with satellite-derived(García-García et al., 2026) state variables, including evapotranspiration (ET) and surface soil moisture (SSM), in the Tugela River basin (South Africa) (Droppers et al., 2024). The model is implemented at four spatial resolutions (250 m, 500 m, 1 km, and 5 km) to evaluate the sensitivity of key water balance components—ET, SM, and discharge (Q)—to spatial discretization.

A set of mono-objective (5 km) and multi-objective (1 km) calibration experiments is conducted using Q, ET, and SSM as target variables, supported by both satellite products and ground observations. Model performance is assessed using complementary efficiency metrics (correlation, variability ratio, bias ratio, KGE, and SPAEF), enabling a detailed analysis of scale-dependent behavior and spatial pattern consistency.

The results reveal systematic trends in model performance across spatial resolutions, highlighting scale-dependent sensitivities of individual water balance components. According to the KGE metric, model performance is consistently higher at finer resolutions and progressively degrades toward coarser ones, a behavior observed across all experiments regardless of the calibration scale. Furthermore, the integration of satellite data with ground observations leads to improved model performance across scales, as reflected by higher KGE values and a more balanced contribution of the correlation, variability, and bias components.

Overall, this work contributes to the ongoing discussion on scale dependency in hydrology and directly relates to several open questions identified by Blöschl et al. (2019), particularly those addressing the consequences of spatial heterogeneity in hydrological fluxes, the existence of hydrological laws across catchment scales, and the effective use of innovative observation technologies to characterize hydrological states and fluxes across resolutions. By integrating satellite-derived state variables into a multiscale distributed modelling framework, this study establishes a methodological baseline for future research on calibration transferability, multiscale equifinality, and synthetic basin experimentation.

How to cite: Cortés-Torres, N., Güiza-Villa, N., Salazar-Galán, S., and Frances, F.: Evaluating multiscale performance of the TETIS distributed hydrological model using satellite and in situ observations in the Tugela basin, EGU General Assembly 2026, Vienna, Austria, 3–8 May 2026, EGU26-12226, https://doi.org/10.5194/egusphere-egu26-12226, 2026.

EGU26-12916 | ECS | Orals | HS2.2.6

AI-Enabled multi-Objective calibration of a wflow_sbm hydrological model of the Nile Basin 

Addis Alaminie and Mohammed Basheer

Abstract: The water resources of the Nile Basin are under mounting pressures due to population growth, climate change, and growing transboundary tensions. These pressures intensify upstream–downstream trade-offs, making adaptive, data-driven planning essential to meet demands. wflow_sbm is a well-suited tool for understanding and modelling large-basin hydrological processes, yet it lacks an automated multi-objective calibration workflow. To overcome this limitation, we develop Optiverse, an AI-driven, multi-objective Python framework to calibrate wflow_sbm. Optiverse is designed as a modular, general-purpose package for multi-objective optimization of simulator workflows. Building on the Python package Platypus, Optiverse implements multi-objective evolutionary algorithms to search for Pareto-optimal solutions using NSGA-II and NSGA-III. This study presents a case study of calibrating a wflow_sbm model of the Blue Nile Basin for the period 1991-2020. The calibration was run on high-performance computing resources to meet the computational demands of iterative calibration, enabling reliable convergence to Pareto-optimal solutions. Early results indicate promising improvements across multiple calibration objectives for wflow_sbm, considering multiple calibration locations within the same optimization formulation. This framework provides a practical pathway for AI-enabled calibration of wflow_sbm and, for the Nile, provides a practical tool for decision support under increasing variability and risk.

Keywords: Distributed hydrology; wflow_sbm; optiverse; AI optimization; NSGA-II; calibration; evolutionary algorithms

How to cite: Alaminie, A. and Basheer, M.: AI-Enabled multi-Objective calibration of a wflow_sbm hydrological model of the Nile Basin, EGU General Assembly 2026, Vienna, Austria, 3–8 May 2026, EGU26-12916, https://doi.org/10.5194/egusphere-egu26-12916, 2026.

EGU26-13038 | ECS | Posters on site | HS2.2.6

Investigating hydrogeological controls at the GeoLaB site using ParFlow-CLM  

Edinsson Muñoz-Vega, Marcel Horovitz, and Stephan Schulz

The GeoLaB project (https://geolab.helmholtz.de/en/) aims to establish an underground laboratory in the crystalline rocks of the Odenwald, Germany, to conduct controlled experiments on thermal-hydraulic-mechanical-(bio)chemical processes relevant to the development and operation of enhanced geothermal systems. The facility will provide access to representative reservoir rocks of the Upper Rhine Graben, specifically the Tromm granite located along its northeastern margin.

One of the key questions to be addressed during the exploratory phase of GeoLaB concerns the occurrence and flow rates of groundwater in the area. The geological setting is complex and includes plutonic, metamorphic, and sedimentary rocks, all affected by different degrees of fracturing and intersected by regional faults. These units, particularly the hard rocks, are difficult to investigate directly, which results in a general lack of subsurface information in the study area. In addition, the alluvial and colluvial deposits besides the soils developed under grasslands and forests are expected to exert significant control on groundwater flow, together with the weathered zones and associated saprolites. This combination of factors makes the hydrogeological assessment particularly challenging.

To numerically explore the influence of the different hydrogeological units on groundwater dynamics, we employ integrated hydrologic modelling using ParFlow–CLM. The focus is placed on testing alternative assumptions regarding the hydraulic properties and geometries of the shallow deposits and weathered horizons, as well as different hydraulic conductivities for the underlying hard rock units, all of which are expected to exert strong control on groundwater flow. Although groundwater is the central objective, the use of ParFlow–CLM also provides insights into surface water resources and the complete water balance. As a first step, we simulate a suite of steady state models to assess groundwater table depths under different conceptualizations. Subsequently, we run transient simulations for the most plausible scenarios and compare the results with available observations of discharge, groundwater level and soil moisture profiles. Preliminary results highlight the sensitivity of groundwater table depths to the conceptualization of the shallow and weathered units and illustrate the potential of this approach to constrain hydrogeologic conditions in the GeoLaB area.

Overall, this work provides a first hydrogeological assessment for the GeoLaB site and outlines a modelling framework that can be progressively refined to support future explorations and the design of the laboratory.

How to cite: Muñoz-Vega, E., Horovitz, M., and Schulz, S.: Investigating hydrogeological controls at the GeoLaB site using ParFlow-CLM , EGU General Assembly 2026, Vienna, Austria, 3–8 May 2026, EGU26-13038, https://doi.org/10.5194/egusphere-egu26-13038, 2026.

EGU26-13773 | ECS | Orals | HS2.2.6

Can improved root zone storage capacity estimates simplify hydrological modelling? 

Muhammad Ibrahim, Ruud van der Ent, Miriam Coenders, and Markus Hrachowitz

Root zone storage (Sr,max) is a key parameter in hydrological and land-surface models that regulates water fluxes partitioning and the ability of vegetation to buffer against dry periods, and closely linked to the Budyko parameter ω describing long-term catchment precipitation partitioning (Ibrahim et al., 2025). Sr,max is defined as the maximum subsurface water volume accessible to plants to meet their transpiration demands. Because direct observations of rooting depth are scarce and limited to local scales, catchment-scale Sr,max is commonly calibrated or estimated using the memory-method. This method derives Sr,max from annual maximum water storage deficits calculated from water balance data, assuming a fixed extreme-value distribution (typically Gumbel), and a predefined return period of 20 years. Despite its broad application, uncertainties arising from these assumptions and their implications for hydrological modelling have rarely been quantified. Here, we systematically evaluate the uncertainty, robustness and practical applicability of memory-method Sr,max estimates across different hydroclimatic regions globally (≈ 5700 catchments). Annual maximum storage deficits (Sd) were derived following the original memory-method framework but instead of fitting Gumbel distribution to Sd , we used the Generalized Extreme Value (GEV) distribution to allow flexible tail behaviour. Analysis of the GEV shape parameter - which determines tail behaviour - within the Budyko framework reveals strong hydroclimatic control, with Pearson correlations of approximately -0.50 with both the aridity index and the evaporative index. Most water-limited catchments exhibit negative shape parameter indicative of bounded (reversed Weibull Type-III) extremes, whereas energy-limited catchments tend toward positive shape parameters associated with heavy tailed (Frechet type-II) behaviour.

Uncertainty in Sr,max estimates was quantified using bootstrap resampling and expressed as confidence bounds derived from 2-year and 80-year return periods. Uncertainty width was strongly climate dependent with the widest ranges (median ≈ 132mm) occurring in transitional climates (aridity index ≈ 0.5-2), while arid and humid regions exhibit comparatively narrow uncertainty envelops (median ≈ 72mm). To assess practical implications, Sr,max uncertainty bounds were propagated into hydrological model calibration (≈1950 catchments). Among the Pareto-optimal solutions, model performance metrics were very similar, indicating strong equifinality in Sr,max estimates. Median simulated Sr,max values show strong agreement with memory-method estimates, with a global Pearson corelation of 0.92 (RMSE ≈ 60mm) and corelations across Koppen-Geiger climate zones ranging from 0.91-0.98. When memory-method Sr,max was calculated using the GEV distribution, the strongest agreement with median simulated Sr,max occurred for return periods of 20-30 years (Pearson r ≈ 0.93) at the global scale, with particularly clear sensitivity in cold and temperate regions. Overall, our results demonstrate that the memory-method robustly captures spatial patterns of Sr,max and that the commonly used 20-year return period represents a physically meaningful and hydro-climatically consistent choice. Using memory-method-based Sr,max estimates, instead of calibrating it, can reduce model complexity and parameter uncertainty without compromising model performance, offering practical advantages for large-scale hydrological and land-surface modelling.


Reference:

Ibrahim, M., Van der Ent, R., Coenders, M., Markus Hrachowitz, M. & van Oorschot, F. 2025. Catchment precipitation partitioning in the Budyko framework is controlled by root zone storage capacity. Environmental Research Letters, (under review)

How to cite: Ibrahim, M., van der Ent, R., Coenders, M., and Hrachowitz, M.: Can improved root zone storage capacity estimates simplify hydrological modelling?, EGU General Assembly 2026, Vienna, Austria, 3–8 May 2026, EGU26-13773, https://doi.org/10.5194/egusphere-egu26-13773, 2026.

EGU26-14034 | ECS | Posters on site | HS2.2.6

Assessing effects of adapted agricultural water management on hydrological processes using integrated hydrological modelling and field observations 

Filippo Signora, Franziska Tügel, Martijn Booij, Christiaan van der Tol, and Tom Rientjes

Climate change is intensifying hydrological extremes, making droughts and floods more frequent and severe in agricultural landscapes. These changes pose growing challenges for water availability, crop productivity and sustainable land management. Effective adaptation requires a better understanding of how hydrological fluxes and storages respond to changing climatic conditions and human interventions. Interactions between soil moisture, groundwater, surface water and the atmosphere play a key role in determining water availability and system resilience in the context of increasing extreme events. However, many commonly used hydrological models simplify these interactions, which limits their ability to adequately assess the effects of water management measures under climate extremes.

This research aims to investigate how agricultural water management measures influence hydrological fluxes and storages by integrating physically based hydrological modelling with observational data. The focus is on agriculture-dominated catchments where management interventions such as controlled drainage, adjustable weirs and retention measures are applied. A spatially distributed, integrated hydrological model will be applied to simulate coupled surface and subsurface processes, including soil moisture dynamics, groundwater fluctuations, evapotranspiration and surface water flow, enabling a holistic assessment of hydrological system behaviour under climate extremes.

Model calibration and validation will be conducted using multi-source observational data, including in situ measurements of soil moisture at multiple depths, groundwater levels, surface water observations and satellite-derived products. This approach allows the evaluation of the model’s ability to reproduce internal hydrological states in addition to discharge. The validated model will then be used to assess the impacts of different water management strategies under variable climate conditions. The analysis initially focuses on one or two small agricultural catchments with dense observational coverage and in a later stage the modelling framework can be upscaled to larger catchments to explore the implications of water management strategies beyond the local scale.

By improving the representation and evaluation of subsurface–surface–atmosphere interactions, this work aims to support the development of more robust and resilient agricultural water management strategies under a changing climate.

How to cite: Signora, F., Tügel, F., Booij, M., van der Tol, C., and Rientjes, T.: Assessing effects of adapted agricultural water management on hydrological processes using integrated hydrological modelling and field observations, EGU General Assembly 2026, Vienna, Austria, 3–8 May 2026, EGU26-14034, https://doi.org/10.5194/egusphere-egu26-14034, 2026.

EGU26-14327 | ECS | Orals | HS2.2.6

Process-Based Modeling of Paddy Water Dynamics in SWAT Through Crop-Model Algorithm Integration 

Mangalath Shyma and Balaji Narasimhan

Paddy rice is a major irrigated crop in Asia and plays a critical role in regional food security, particularly in countries such as India. It is also highly water-intensive, accounting for roughly 40% of global agricultural irrigation withdrawals. Flooded paddy systems exhibit a unique water balance characterized by continuous ponding, high evapotranspiration, seepage and percolation losses, return flows, and controlled drainage, leading to substantial seasonal water requirements. However, most basin-scale hydrological models are originally developed for upland crops and rainfall–runoff systems, and therefore have limited capability to represent irrigated, ponded systems.

The Soil and Water Assessment Tool (SWAT) is widely used for watershed-scale hydrological assessments but lacks explicit representation of flooded rice cultivation. Existing approaches in SWAT including the curve number (CN) method (treating paddy as upland) and pothole routines do not fully capture paddy-specific irrigation management or field-level water balance components. In contrast, field-scale crop models such as ORYZA and CERES-Rice provide more advanced representations of paddy water dynamics, but are not intended for watershed-scale analysis. To address this gap, this study develops a new process-based paddy module (SWAT-PADDY) by integrating soil water routing and irrigation management algorithms adapted from crop model frameworks into SWAT. The module accounts for key management practices, including transplanting, puddling, irrigation and drainage scheduling, and bunded field hydraulics. Soil water routing was reformulated to couple the ponded layer with the soil profile, enabling realistic simulation of infiltration, percolation, overflow, and return flows. The enhanced model was evaluated at ten paddy fields in South India over two cropping seasons using observed water levels, and key water balance components were assessed through cross-model comparisons with ORYZA, CERES-Rice, and a numerical soil water flow model (HYDRUS-1D) to assess consistency and process representation.

Results show that SWAT-PADDY realistically simulates ponded water levels and major water balance components, including evapotranspiration, infiltration, percolation, overflow, and soil water storage. The enhanced model demonstrated good statistical performance for observed water levels (NSE > 0.5) and achieved zero water balance closure error at field scale. Cross-model comparisons showed strong agreement with field-scale crop and numerical model simulations. The improved process representation broadens the applicability of SWAT for regions dominated by irrigated rice cultivation and enables basin-scale assessment of water use under diverse climatic, soil, and management conditions.

Keywords: Flooded rice systems, SWAT model development, Process-based modelling, hydrology, Water balance simulation

How to cite: Shyma, M. and Narasimhan, B.: Process-Based Modeling of Paddy Water Dynamics in SWAT Through Crop-Model Algorithm Integration, EGU General Assembly 2026, Vienna, Austria, 3–8 May 2026, EGU26-14327, https://doi.org/10.5194/egusphere-egu26-14327, 2026.

Hydrological model structures are often selected based on legacy considerations—such as habit, practicality, or experience—rather than whether they are fit for a specific modelling purpose. This is problematic, as model structure alone can substantially influence modelling results and hence outcomes for e.g. design flow assessment. Automatic Model Structure Identification (AMSI) offers a way to address this issue by framing model choice as an optimization problem. AMSI combines the modular modelling framework Raven with mixed-integer calibration algorithms (DDS/PA-DDS), allowing the simultaneous optimization of model structural choices and parameter values with respect to user-defined objectives.

Here, we apply AMSI to explore a hypothesis space of more than 13,500 conceptual model structures with zero to 12 parameters per model. We test 14 calibration routines, including six single-metric, four multi-metric, and four multi-objective formulations, designed to reflect different modelling purposes that target flood, drought, and water-resources management assessment. Model evaluation uses metrics and hydrological signatures associated with different aspects of the flow regime to assess model suitability across these different purposes. All experiments are conducted on a test catchment located on the Eastern Coast of the US.

Each calibration routine is performed 50 times, yielding a set of preferred model structures. These are analyzed regarding their individual processes and equations, as well as model performance across purpose-specific metric and flow signature groups. Results show that model structural preferences vary with modelling purpose, favouring different process descriptions for different intended applications of the model. Within the tested hypothesis space, identifying suitable model structures is easiest for water-resources management (average flow behaviour), followed by flood (peak flow) modelling, and most challenging for drought (low flow) modelling. Multi-metric and multi-objective calibrations provide more balanced representations than single-metric approaches, with multi-objective calibration revealing explicit trade-offs between structural choices and multi-metric calibration reducing structural equifinality.

How to cite: Spieler, D. and Stadnyk, T.: When Calibration Metrics Choose Your Model: Investigating Model Selection Choices for Different Modelling Purposes, EGU General Assembly 2026, Vienna, Austria, 3–8 May 2026, EGU26-15121, https://doi.org/10.5194/egusphere-egu26-15121, 2026.

EGU26-16142 | ECS | Posters on site | HS2.2.6

Coupling a Global Glacier Model and Hydrological Model: Constraining Cryospheric Contributions in the Data-Scarce Indus Basin 

Justine Berg, Pascal Horton, Martina Kauzlaric, Alexandra von der Esch, and Bettina Schaefli

Climate warming is rapidly modifying glacier and snowmelt processes, with impacts that propagate across spatial and temporal scales, from high-elevation cryospheric dynamics to basin-scale streamflow. Capturing these cross-scale interactions requires hydrological models that explicitly represent cryospheric processes, such as glacier dynamics and snow redistribution, while also accounting for uncertainty arising from data scarcity and model structure. To address these challenges, we present a one-way coupling that integrates the Global Glacier Evolution Model (GloGEM) with Raven, a flexible hydrological modeling framework designed to emulate multiple model structures for systematic uncertainty assessment. Glacier simulations are first improved by incorporating snowline observations as an additional calibration constraint to the geodetic mass balance, reducing parameter equifinality and enhancing glacier runoff estimates. The resulting glacier runoff is then provided to the hydrological model, leading to a more robust representation of snowmelt processes and their contribution to streamflow. By evaluating multiple hydrological model structures within Raven, we further quantify uncertainties in simulated melt contributions arising from structural model choices. The framework is applied to multiple data-scarce Indus headwaters as representative high-mountain catchments, simulating melt contributions and streamflow across scales. By explicitly coupling cryosphere and hydrological models, this framework aims to improve projections of future water availability in data-scarce regions and provides a transferable approach for integrated cryosphere-hydrology modeling in complex mountain regions.

How to cite: Berg, J., Horton, P., Kauzlaric, M., von der Esch, A., and Schaefli, B.: Coupling a Global Glacier Model and Hydrological Model: Constraining Cryospheric Contributions in the Data-Scarce Indus Basin, EGU General Assembly 2026, Vienna, Austria, 3–8 May 2026, EGU26-16142, https://doi.org/10.5194/egusphere-egu26-16142, 2026.

EGU26-16951 | Posters on site | HS2.2.6

Capacity and flux model parameters should be addressed separately in parameter sensitivity and identifiability analyses 

Björn Guse, Anna Herzog, Tobias Houska, Diana Spieler, Maria Staudinger, Paul Wagner, Sandra Pool, Ralf Loritz, Jens Kiesel, Matthias Pfannerstill, Doris Duethmann, Thorsten Wagener, Hoshin Gupta, and Nicola Fohrer

Analysing parameter sensitivity and identifiability are important steps in hydrological modelling as they help to detect the most relevant parameters and suitable parameter ranges. Within such studies we can categorize parameters is diverse ways – one of them being capacity vs. flux parameters. While capacity parameters regulate the magnitude or storage of hydrological components, flux parameters determine the timing of water flow. We demonstrate in two steps that separating capacity and flux parameters is beneficial for model analyses.

First, we conducted a temporally resolved parameter sensitivity analysis, targeting the rate of change of eight hydrological components in addition to the absolute time series. Using the rate of change as target variable improved the representation of dynamic flux parameters, while capacity parameters were more precisely represented by the absolute time series of the hydrological components.

In a second step, we conducted a parameter identifiability analysis across six contrasting German catchments using sixteen diverse performance metrics and hydrological signatures. Our analysis with four hydrological models (Raven-GR4J, HBV, SWAT+ and mHM) reveals that capacity parameters can be precisely identified using several performance criteria, in particular those related to mid and low flows. In contrast, accurate identification of flux parameters requires specific performance criteria such as hydrological signatures related to the process timing.

Separating parameters into capacity and flux parameters improves the detection of the sensitivity signal and enables a more precise identification of parameter values. The reduced uncertainty in estimating the dominant parameters is a valuable step towards efficient model calibration.

How to cite: Guse, B., Herzog, A., Houska, T., Spieler, D., Staudinger, M., Wagner, P., Pool, S., Loritz, R., Kiesel, J., Pfannerstill, M., Duethmann, D., Wagener, T., Gupta, H., and Fohrer, N.: Capacity and flux model parameters should be addressed separately in parameter sensitivity and identifiability analyses, EGU General Assembly 2026, Vienna, Austria, 3–8 May 2026, EGU26-16951, https://doi.org/10.5194/egusphere-egu26-16951, 2026.

Over the past few years, the increasing global population and climate change have intensified pressure on existing waterbodies, with many regions experiencing both water shortages and prolonged periods of water stress. As a result, the demand for reliable, detailed information on water availability and storage has grown rapidly. Despite this, many of the hydrological models used today either do not explicitly represent storage or operate at scales too coarse for practical water management.

A clear example of this can be seen in Sweden. Historically largely spared from water scarcity, the country has in recent years experienced recurrent shortages and increasing water stress, particularly in the southern regions. Traditional water storage assessments have relied on S-HYPE, the national adaptation of the widely used HYPE model (Hydrological Predictions for the Environment). Like HYPE, S-HYPE is a semi-distributed catchment model used for flood and drought forecasting, water quality assessment, and evaluating hydromorphological and climate change impacts. While S-HYPE can estimate total storage at the catchment scale, the current setup does not support assessments of individual waterbodies, severely limiting the model’s usefulness in providing in-depth information about local storage changes.

To address this, we explored a modified version of the Australian Water Resources Assessment Landscape model (AWRA-L). A case study was conducted on three lakes in the Lagan River catchment in southern Sweden to evaluate the model’s performance and applicability. Initial results showed generally good performance, with an average NSE of 0.68 and a KGE’ of 0.64. However, systematic differences between simulated and observed storage were noted. Preliminary analysis indicated that surface runoff is a major contributor to these residuals, while the influence of individual model parameters remains unclear. It is also uncertain whether the model fully captures all relevant processes under varying climatic conditions, particularly during cold periods.

This study aims to improve the model by combining physics-informed parameter optimization with detailed residual diagnostics. First, a randomized one-at-a-time sensitivity analysis was conducted to assess the overall contribution of the various input variables used to calculate the surface runoff. Parameter optimization was then performed using physics-informed rating curves constrained to physically plausible ranges, and optimized inputs were used to recalculate surface runoff. Model performance was evaluated against previous simulations, with residuals analyzed for systematic biases and potential missing processes using statistical and machine learning methods. Finally, temporal and seasonal patterns, autocorrelation, and correlations with auxiliary variables such as air temperature were analysed to identify model deficiencies and areas of improvement.

How to cite: Bjerkén, A., Ahmadi, K., and Klante, C.: Advancing water storage model development through physics-informed machine learning and residual diagnostics: a case study of the Lagan River catchment, southern Sweden, EGU General Assembly 2026, Vienna, Austria, 3–8 May 2026, EGU26-17170, https://doi.org/10.5194/egusphere-egu26-17170, 2026.

EGU26-17532 | ECS | Orals | HS2.2.6

Representing Vegetation in Hydrological Modeling: Between process detail and structural uncertainty 

Carla Peter, Valentin Simon Lüdke, Sven A. Westermann, Friedrich Boeing, Pallav Kumar Shrestha, Matthias Kelbling, Stephan Thober, Luis Samaniego, and Anke Hildebrandt

Vegetation strongly influences evapotranspiration, the largest water flux from land to atmosphere, and a key land-surface process, and thus plays a central role for capturing soil moisture and groundwater dynamics. As drought duration and magnitude increase, reliable high-resolution simulations of these variables become increasingly important for informed water resource management and sustainable allocation decisions. Yet, many hydrological models still have difficulty reproducing spatially distributed variables, in part due to epistemic uncertainty arising from model structural choices. Epistemic uncertainty is further amplified by calibration practices that rely solely on streamflow, an integration variable. This common practice disregards internal states and, consequently, the spatial variability of hydrological processes. Because vegetation modulates the variability of evapotranspiration and soil moisture, it is particularly relevant for local-scale uncertainty analyses. Although numerous studies examine individual aspects of vegetation–water interactions and their parameterization, it remains unclear which vegetation processes are essential to capture small-scale spatial variability and which may be redundant or even exacerbate overfitting, thereby increasing uncertainty.
In this study, we examine how different model structures influence simulated soil moisture and related water storage variables using the mesoscale Hydrological Model (mHM) [1]. To this end, we incorporate Leaf Area Index–based evaporation control, alternative root water uptake schemes, and additional land-cover types, representing three types of forest as well as pastures, savanna, wetlands. We construct model structure variants representing different combinations of these processes, including configurations in which individual processes are disabled. We then evaluate the skill of each model variant to reproduce not only the streamflow but also catchment wide total water storage and spatial distribution of soil moisture at a resolution of 1 km, which allows vegetation heterogeneity and its impact on evapotranspiration and soil moisture dynamics to be explicitly represented. The investigation provides an improved understanding of model structural uncertainty associated with vegetation, and assesses whether additional calibration on spatially distributed variables can compensate for structural shortcomings. This is achieved by comparing the traditional streamflow calibration with the actual evapotranspiration calibration using the spatial pattern efficiency metric (ESP) defined by Dembélé et al. [2].
By identifying which vegetation processes meaningfully improve spatial predictions, this research supports the development of more robust hydrological models for drought assessment and sustainable water management under increasing hydro-climatic stress.


References:

[1] L. Samaniego, R. Kumar, S. Attinger, Water Resources Research 2010, 46.
[2] M. Dembélé, M. Hrachowitz, H. H. Savenije, G. Mariéthoz, B. Schaefli, Water resources research 2020, 56, e2019WR026085.

How to cite: Peter, C., Lüdke, V. S., Westermann, S. A., Boeing, F., Shrestha, P. K., Kelbling, M., Thober, S., Samaniego, L., and Hildebrandt, A.: Representing Vegetation in Hydrological Modeling: Between process detail and structural uncertainty, EGU General Assembly 2026, Vienna, Austria, 3–8 May 2026, EGU26-17532, https://doi.org/10.5194/egusphere-egu26-17532, 2026.

Land surface models are often made increasingly complex to represent heterogeneity in soils and vegetation. However, the level of horizontal and vertical complexity actually required to capture drought processes in boreal forests remains unclear. This issue is critical for large-sample hydrological and climate applications, where detailed site-by-site calibration is rarely feasible. In this study, the Canadian Land Surface Scheme (CLASS v3.6) is applied in point mode and driven by ERA5-Land to quantify trade-offs between structural complexity and hydrological realism under a strictly calibration-free, rule-based parameterization.

The analysis is conducted at Forêt Montmorency, a humid, snow-dominated boreal catchment in Québec, Canada, instrumented with eddy-covariance towers, soil water content and temperature profiles, and long-term hydrometeorological observations. Vegetation and soil parameters are constrained by field data, LiDAR-based canopy metrics and CLASS defaults, without tuning to match fluxes. Two experiment sets are considered. In the first, the impact of progressively increasing the number of grouped response units (GRUs) and soil layers (from reduced 3–4 layer profiles to an 8-layer column) on model skill is assessed under identical ERA5-Land forcing. Second, the multi-decadal ERA5-Land record is used to isolate and evaluate model behavior during independently defined drought windows. Therefore, performance metrics specifically target water-limited conditions rather than aggregates over mixed wet and wet–dry periods.

Model behavior is evaluated for total evaporation and its components, soil moisture and temperature, diagnostically derived soil water potential (psi), and simple runoff and low-flow indicators at seasonal to annual scales, using Kling–Gupta efficiency, bias and error metrics. Drought periods are defined independently of the model from standardized climatic and soil-based indices (SPEI, SSMI, REW and psi thresholds), ensuring that the assessment targets genuinely water-limited conditions rather than artifacts of model structure.

Results indicate clear diminishing returns from added structural complexity. Increasing the number of GRUs and extending the soil column beyond a limited number of layers does not systematically improve evaporation skill and can degrade the coherence of shallow soil water content dynamics. However, a parsimonious configuration with a small set of dominant GRUs and a moderately deep soil profile is sufficient to reproduce seasonal energy partitioning and to capture the timing and relative severity of drought events within forcing-related uncertainty. These findings provide quantitative evidence that robust drought diagnostics in snow-affected boreal forests do not require highly complex land-surface setups and that carefully designed, rule-based configurations offer a pragmatic benchmark for regional hydrological and climate modelling studies.

How to cite: Razavi Ebrahimi, Y. and Anctil, F.: How much land-surface complexity is needed to simulate drought processes in boreal forests?  A calibration-free CLASS assessment across an energy-water gradient, EGU General Assembly 2026, Vienna, Austria, 3–8 May 2026, EGU26-17777, https://doi.org/10.5194/egusphere-egu26-17777, 2026.

EGU26-18718 | ECS | Posters on site | HS2.2.6

Validation of Specific and Total Catchment Area estimated via Flow Direction Algorithms through a 2D Shallow Water Equations Numerical Solver 

Sara Carta, Federico Prost, Francesca Aureli, and Paolo Mignosa

Specific Catchment Area (SCA) and Total Catchment Area (TCA) are two widely used topographic attributes in the study of hydrological, geomorphological and biological processes at the watershed scale. They are typically estimated starting from a Digital Terrain Model using Flow Direction (FD) algorithms. In the ideal case of constant and uniform rainfall excess, SCA and TCA are directly proportional to the steady-state specific discharge and discharge of surface runoff, respectively. This study investigates an alternative approach that computes SCA and TCA fields using a rain-on-grid Shallow Water Equations (SWE) model (PARFLOOD-Rain). Given a DTM representing a terrain, a constant and spatially uniform rainfall rate is applied, and the simulation is run until a steady-state regime is reached everywhere. At each pixel, the ratio between the steady-state discharge and the imposed rainfall rate yields the TCA value, while SCA is obtained by dividing the steady-state specific discharge by the rainfall rate. In the first part of the study, SCA and TCA fields generated by PARFLOOD-Rain are compared against outputs from six commonly used FD algorithms (namely D8, Rho8, D-infinity, MFD-Quinn, MFD-md and FD8) and from the recent IDS algorithm proposed by Prescott et al. (2025). All outputs are validated against analytical solutions on four synthetic surfaces (inclined plane, saddle, convergent and divergent surfaces). All the methods, including PARFLOOD-Rain, are further validated – on another synthetic surface – against a numerical solution of the differential equation proposed by Gallant & Hutchinson (2011), which defines SCA along a flow line. On all test surfaces, PARFLOOD-Rain predicts SCA and TCA with errors one to two orders of magnitude smaller than those of the FD methods, and its accuracy improves with grid refinement – unlike the FD algorithms – which show no such convergence behavior. In the second part of the study, PARFLOOD-Rain is used to estimate SCA and TCA in a real catchment, and its results are used as a reference solution to validate the FD algorithms in a complex, channelized terrain. A small catchment downstream of Blanca Peak, Colorado (USA) is selected as a case study. The analysis highlights that, while SCA and TCA’s sensitivity to the rainfall intensity is negligible on smooth synthetic surfaces, it is a major controlling factor in irregular, natural terrains featuring channels and carvings. Whereas it is trivial that FD methods could never fully describe the complex hydrodynamics captured by SWE-based approaches, the results of the study suggest that more sophisticated FD algorithms, like IDS, can offer potential advantages over traditional FD methods in the prediction of TCA and SCA.

How to cite: Carta, S., Prost, F., Aureli, F., and Mignosa, P.: Validation of Specific and Total Catchment Area estimated via Flow Direction Algorithms through a 2D Shallow Water Equations Numerical Solver, EGU General Assembly 2026, Vienna, Austria, 3–8 May 2026, EGU26-18718, https://doi.org/10.5194/egusphere-egu26-18718, 2026.

EGU26-19167 | Posters on site | HS2.2.6

Novel methods to spatially downscale water demands 

Helen Baron, Rashmi Kulranjan, Amber Barr, Madeleine Christie, and Nathan Rickards

To understand water scarcity, it is vital to have reliable water demand data at suitable spatial and temporal resolutions. While more hydrological models are including human influences, and at increasingly fine resolutions, this improvement in process representation is not matched by improved data for driving or validating the models. Water demand data is normally very difficult to access and, when available, is usually at a coarse spatial resolution (often a country level). Downscaling methods for irrigation demand are well developed but domestic and industrial demands are generally naively downscaled using population as a proxy.

This work explores the potential for Machine Learning models in spatial downscaling of industrial demands at a range of resolutions. Various ensemble-tree type models are presented, trained on a recently published high-resolution water abstraction dataset from England, and using easily accessible spatial datasets as explanatory variables. The results are compared to a population-proxy downscaling and demonstrate minor improvements but without achieving the desired level of skill for application in water resource assessments.

Further avenues for exploration are proposed, with the aim of achieving a transferable downscaling method for water demands which can be trained in data-rich regions and applied to data-scarce areas. A successful approach would enhance water resource modelling through improved driving data, and improve our understanding of water scarcity, to support decision making in water allocation under increasingly water-scarce conditions.

How to cite: Baron, H., Kulranjan, R., Barr, A., Christie, M., and Rickards, N.: Novel methods to spatially downscale water demands, EGU General Assembly 2026, Vienna, Austria, 3–8 May 2026, EGU26-19167, https://doi.org/10.5194/egusphere-egu26-19167, 2026.

EGU26-19207 | ECS | Orals | HS2.2.6

Assimilation of SSM into hydrological models: comparing assimilation in higher spatial resolution (1km, few-daily) vs. higher temporal resolution (25km, daily) 

Leire Retegui-Schiettekatte, Francesco Leopardi, Jaime Gaona, Luca Brocca, Paolo Filippucci, Stefania Camici, Henrik Madsen, and Ehsan Forootan

Surface Soil Moisture (SSM) is a key variable in terrestrial hydrology, governing land–atmosphere exchanges of water and energy, influencing runoff generation, and mediating interactions with deeper soil layers and groundwater recharge. Accurate representation of SSM within land surface and hydrological models is critical for simulating these processes realistically. To achieve this, operational hydrometeorological systems assimilate satellite-derived SSM observations into models.

Looking ahead, next-generation hydrological modeling aims to develop “digital twins” of Earth’s water cycle, high-resolution (≤1 km), physically consistent systems that integrate advanced models with spaceborne observations through Data Assimilation (DA). However, implementing SSM DA at such fine spatial scales raises fundamental questions. For instance, the benefits and limitations of assimilating high-resolution (1 km) SSM products remain poorly understood. Furthermore, it is unclear how DA performance compares when using high-resolution but temporally sparse observations (e.g., every few days) versus coarser-resolution data available daily.

This study addresses these gaps by conducting two DA experiments: (i) assimilation of ASCAT-derived SSM at 25 km resolution with daily availability, and (ii) assimilation of Sentinel-1-derived SSM at 1 km resolution with a few-day revisit. Both experiments employ the World Wide Water Resources Assessment (W3RA) hydrological model, downscaled to operate at 1 km daily resolution. The Ebro River basin (Iberian Peninsula) serves as the testbed, chosen for its availability of 1 km precipitation forcing, in-situ discharge observations, and significant irrigation activity, which is an anthropogenic factor not explicitly represented in W3RA but potentially captured through SSM DA. Assimilation is implemented via a localized Ensemble Kalman Filter (EnKF).

Evaluation is carried out in three stages: (1) comparison of DA outputs against assimilated observations to assess assimilation skill; (2) analysis of spatial and temporal variability in SSM estimates to quantify DA method’s downscaling capability; and (3) validation of simulated river runoff against independent discharge measurements. Through this comparative framework, the study aims to elucidate the trade-offs, benefits, and challenges of high-resolution SSM DA for operational hydrological modeling.

How to cite: Retegui-Schiettekatte, L., Leopardi, F., Gaona, J., Brocca, L., Filippucci, P., Camici, S., Madsen, H., and Forootan, E.: Assimilation of SSM into hydrological models: comparing assimilation in higher spatial resolution (1km, few-daily) vs. higher temporal resolution (25km, daily), EGU General Assembly 2026, Vienna, Austria, 3–8 May 2026, EGU26-19207, https://doi.org/10.5194/egusphere-egu26-19207, 2026.

EGU26-77 | ECS | Posters on site | HS2.2.7

Multisite and multivariate calibration of the SWAT+ model in Galicia-Costa, NW Spain 

Darine Saad, Carolina Acuña Alonso, and Xana Álvarez Bermudez

Calibration and validation are fundamental steps in hydrological modeling, ensuring the accuracy and reliability of model predictions for effective management of freshwater resources. Traditional calibration approaches rely solely on streamflow, although other hydrological variables (soil moisture, evapotranspiration) have also proved useful. One of the most widely used hydrological models is the Soil and Water Assessment Tool (SWAT), which simulates spatial and temporal variations in watershed processes such as the water balance, streamflow routing, and the transport of nutrients and sediments. In this study, SWAT+, a revised version of the SWAT model, was applied to the Ulla River basin within the Galicia-Costa Hydrographic Demarcation in Spain to evaluate the performance of three calibration strategies: (1) single-variable calibration using streamflow (SC-Q), (2) single-variable calibration using evapotranspiration (SC-ET), and (3) multivariate calibration, integrating both streamflow and evapotranspiration (MC-QET). Multi-site calibration and validation were performed using the Sequential Uncertainty Fitting Algorithm (SUFI-2), with the Nash-Sutcliffe efficiency (NSE) index as the objective function and NSE ≥ 0.60 defined as the behavioral threshold. Observed streamflow data was obtained from three river gauging stations distributed along the river network (one downstream and two upstream). Ground-truth evapotranspiration (ET) data were estimated via triple collocation analysis combining three independent datasets (remote sensing-based, land surface model output, and reanalysis product). Results revealed that for streamflow, the MC-QET calibration scheme yielded the best performance at the downstream validation site (NSE = 0.82, PBIAS = -4.51), whereas SC-Q achieved superior results at the upstream stations (NSE = 0.82-0.86 and PBIAS = +6.35 – +12.72). Meanwhile, SC-ET performed the worst for streamflow overall, although model performance was still acceptable (NSE = 0.70 – 0.75). For evapotranspiration, both SC-ET (NSE = 0.89, PBIAS = +6.56) and MC-QET (NSE = 0.90, PBIAS = +6.24) clearly outperformed SC-Q (NSE = 0.66, PBIAS = +22.97). These findings suggest that while streamflow- or ET-only calibration can optimize the targeted variable, incorporating multiple hydrological variables during model calibration improves the overall representation of watershed processes and the water balance. However, the acceptable performance of the ET-only calibration highlights that this calibration scheme can till serve as a valid alternative in data-scarce regions where streamflow observations are limited or inconsistent. Furthermore, this study demonstrates the reliability of triple collocation analysis in improving ET estimates by reducing uncertainty among independent data sources. In conclusion, integrating multivariate calibration strategies in SWAT+ significantly enhances spatial transferability, ensures physically realistic model outputs, and improves overall prediction reliability. At the same time, ET-based calibration alone remains a practical and defensible option for data-limited watersheds, demonstrating the growing potential of remote sensing–driven hydrological modeling for comprehensive and resilient water resource assessment.

How to cite: Saad, D., Acuña Alonso, C., and Álvarez Bermudez, X.: Multisite and multivariate calibration of the SWAT+ model in Galicia-Costa, NW Spain, EGU General Assembly 2026, Vienna, Austria, 3–8 May 2026, EGU26-77, https://doi.org/10.5194/egusphere-egu26-77, 2026.

EGU26-129 | ECS | Orals | HS2.2.7

How calibration targets shape good modelling practices: trade-offs among ET patterns, discharge, and isotopes in a large ET-dominated lowland catchment 

Hanwu Zheng, Doerthe Tetzlaff, Christian Birkel, Songjun Wu, and Chris Soulsby

Due to the inherent complexity of hydrological systems, single observation data types rarely contain sufficient information for model calibration, particularly for distributed models with large parameter dimensions. Previous studies have demonstrated the ability of multi-objective calibration to constrain equifinality and promote good model practices. However, most of these efforts have focused mainly on predictions of discharge and ET, while lacking evaluations of other key components of ecohydrological systems (e.g., subsurface storages and fluxes, and ET partitioning), potentially leading to biased hydrological inferences. Although incorporating multiple objectives provides additional constraints on the modelling, degradations in model performance often occur due to trade-offs among observations. Evaluations of these trade-offs are necessary for robust modelling inferences. Therefore, we applied multiple calibration schemes combing discharge, isotope, spatial and temporal patterns of remote sensed ET in an ET-dominated catchment (the Mid-Spree, 2800km2) of the river Spree, NE Germany, to constrain a spatially distributed tracer-aided model (STARR) over a 20-year period. Since the Spree is a major water source supplying Berlin’s drinking water, agricultural irrigation and industrial needs, ensuring trustworthy hydrological modelling, realistic process representation and careful consideration of calibration strategies is of vital importance.

Our findings show that compared to discharge-only based calibrations, additional incorporation of either isotope, temporal or spatial patterns of ET produced distinct process insights. These multi-variable calibrations revealed contrasting trade-offs, with slightly degraded discharge performance but clear improvements in the additional calibrated variables (i.e., isotope or ET patterns). Temporal patterns of ET contained similar information to discharge, and provided limited additional insights into catchment functioning. In contrast, incorporating isotopes and spatial patterns of ET in addition to discharge reduced simulated discharge volumes generated in the Mid-Spree region (>70% of discharge at the outlet of the catchment originated from the upper Spree), accompanied with slower lateral flow rates in the subsurface layer, reflecting a slow water celerity of the catchment. Isotope-aided calibrations also inferred large subsurface water storage to reproduce the damped isotope variations observed in the field, and higher ET peaks (compared to other calibration schemes) during summer. Conversely, calibrations constrained by the spatial patterns of ET indicated lower subsurface water storage, compared to calibrations constrained by other variables. This study demonstrated the implications and trade-offs of using multiple observational targets in model calibration in large scale, heavily anthropogenically influenced catchments, helping to identify more reliable parameterizations and to improve process-based understanding in distributed hydrological modelling.

How to cite: Zheng, H., Tetzlaff, D., Birkel, C., Wu, S., and Soulsby, C.: How calibration targets shape good modelling practices: trade-offs among ET patterns, discharge, and isotopes in a large ET-dominated lowland catchment, EGU General Assembly 2026, Vienna, Austria, 3–8 May 2026, EGU26-129, https://doi.org/10.5194/egusphere-egu26-129, 2026.

EGU26-1127 | ECS | Orals | HS2.2.7

To sweep or not to sweep? Investigating controversial parameters in hydrological models 

Franziska Clerc-Schwarzenbach, Paul C. Astagneau, Eduardo Muñoz Castro, Ilja van Meerveld, Jan Seibert, and Vazken Andréassian

In bucket-type hydrological models (also known as conceptual models), the paths of the water in a catchment are represented in a simplified way. In general, there is one way for water to enter – via precipitation – and two ways to leave – streamflow and evaporation. However, as the simple water balance equation P=Q+E this concept is based on is often not fulfilled, many bucket-type models include ‘sweep parameters’, parameters that represent an additional way for water to enter or leave the catchment. Sweep parameters come as correction factors that are used to align inputs and outputs, but also in more sophisticated ways, such as representations of groundwater inflows or outflows. The X2 parameter (Intercatchment Groundwater Flow parameter) in the GR4J model is a well-known example of a sweep parameter.

Compared to a model in which the water balance is enforced, a model that includes a sweep parameter is usually more successful in simulating streamflow volumes: Too much or too little water can be compensated thanks to the sweep parameter, while otherwise the only options for compensation are via evaporation or large simulated storage volumes.

Because including a sweep parameter improves model performance, sweep parameters are often seen as ‘cheat parameters’. This accusation is understandable, since sweep parameters can also compensate for incorrect input data. Still, there are many reasons why the use of sweep parameters should not be frowned upon. Many catchments are not closed systems along their topographic borders and sweep parameters are one way of representing this knowledge. In addition, we should avoid compensating for incorrect input data or additional water gains or losses via evaporation, a flux that is generally not included in  model calibration – and that could be considered cheating as well. If a mismatch in the basic water balance can be represented via a sweep parameter, this is arguably a reasonable and transparent way to do so.

To investigate the effects of sweep parameters, we tested the model performance and model robustness towards variations in precipitation input data for hydrological models with and without a sweep parameter. Using a large-sample approach for more than 500 catchments in France, we could not find any evidence that model robustness is affected by the use of a sweep parameter. Furthermore, we clearly illustrate that models benefit from using a sweep parameter. Based on these results, we argue that it is justifiable to decide to sweep, but also stress that the way and effect of the sweeping should be communicated transparently and interpreted with caution.

How to cite: Clerc-Schwarzenbach, F., Astagneau, P. C., Muñoz Castro, E., van Meerveld, I., Seibert, J., and Andréassian, V.: To sweep or not to sweep? Investigating controversial parameters in hydrological models, EGU General Assembly 2026, Vienna, Austria, 3–8 May 2026, EGU26-1127, https://doi.org/10.5194/egusphere-egu26-1127, 2026.

Flood simulation in small and medium-sized catchments across China is constrained by limited hydrometeorological data and pronounced hydroclimatic heterogeneity. The wflow_sbm model offers promising potential, as seamless parameter fields can be estimated from global datasets via pedotransfer functions (PTFs), enabling explicit representation of the spatial and temporal variability of catchment characteristics. However, the extent to which parameter sensitivity differs between humid and semi-humid regions with distinct runoff-generation mechanisms remains insufficiently understood. Moreover, it is unclear whether parameters derived by PTFs are directly applicable to small and medium-sized catchments or require regional adjustment.

In this study, the wflow_sbm model is applied to two representative Chinese catchments: the humid Tunxi basin and the semi-humid Chenhe basin. Distributed parameters are derived from global datasets using HydroMT model setup and preprocessing framework. We (1) systematically analyze the sensitivity of three key parameters about soil water dynamics (KsatHorFrac, InfiltCapSoil and SoilThickness) in humid and semi-humid basins, (2) assess the applicability of seamless parameter maps derived by PTFs and evaluate the necessity of regional adjustment, and (3) benchmark the performance of wflow_sbm against the well-established Xin’anjiang (XAJ) model in China, including multi-site validation to assess spatial robustness.

Results reveal clear regional differences in parameter sensitivity: KsatHorFrac and InfiltCapSoil dominate runoff responses in the humid Tunxi basin, whereas KsatHorFrac and SoilThickness exert the strongest control in the semi-humid Chenhe basin. The PTF-derived SoilThickness (~2 m) in Chenhe leads to systematic underestimation of flood volume and peaks. Reducing it to ~0.2 m substantially improves model performance and is consistent with vadose-zone depth estimates from the XAJ model, highlighting SoilThickness as a key control in semi-humid basins. The results also show that the wflow_sbm model achieves performance comparable to XAJ in both catchments, with an average NSE of 0.85 in Tunxi and generally NSE >0.7 in Chenhe. The good performance at the internal stations in Tunxi (average NSE > 0.70) further demonstrates that the parameter maps derived by PTFs are applicable and reliable for small and medium-sized basins.

Overall, wflow_sbm is applicable for flood simulation in small and medium-sized catchments in humid and semi-humid regions and is particularly advantageous in data-scarce basins. However, if its application in semi-humid regions requires appropriate adjustment of SoilThickness, which can be guided by parameter ranges inferred from the XAJ model.

How to cite: Zang, S., Wu, X., and Mu, J.: Evaluating the Applicability of wflow_sbm Model with Seamless Parameter Maps for Streamflow Simulation in Small and Medium-Sized River Basins, EGU General Assembly 2026, Vienna, Austria, 3–8 May 2026, EGU26-2064, https://doi.org/10.5194/egusphere-egu26-2064, 2026.

EGU26-3497 | Posters on site | HS2.2.7

Multivariate calibration and regionalization of a conceptual hydrological model using streamflow and groundwater level 

Sheikh Muhammad Asad, Zhenyu Wang, and Andreas Hartmann

Hydrological models are an important tool in understanding the complex interactions of a catchment's water balance and for supporting water resource management. The widespread practice of calibrating these models is based on streamflow, which causes problems like inaccurate representation of other important fluxes and equifinality, where different parameter sets yield similar modelling results. These problems reduce the model interpretability, robustness, and propagate uncertainty in processes like regionalization.

Using 935 German catchments from the CAMELS-DE dataset, supported by groundwater level records and hydrogeological descriptors, we compared univariate (streamflow-only) and multivariate (streamflow + groundwater) calibration strategies. Several groundwater representation approaches and objective functions were tested. Correlation-based evaluation of groundwater storage outperformed bias-insensitive KGE, yielding higher median streamflow KGE values during calibration (0.75 vs. 0.71) and validation (0.64 vs. 0.60), confirming groundwater levels as reliable indicators of groundwater storage. Hydrogeological characteristics also showed a strong influence on model performance.

When the resulting parameter sets were used in the PASS regionalization framework, both models were found to reduce the equifinality. The multivariate-based regionalization performed significantly better, even with parameters that showed greater variability during the calibration phase. We also found that low-land catchments showed lower model efficiency during local calibration phase. During regionalization, we find the slow-draining porous catchments to show greater variability for the nonlinear parameter of groundwater βGW for the multivariate model in comparison to the univariate model. Overall, the approach underscores the importance of having additional constrained to improve the physical interpretability of the model and reduce the uncertainty and equifinality of produced parameter sets.

How to cite: Asad, S. M., Wang, Z., and Hartmann, A.: Multivariate calibration and regionalization of a conceptual hydrological model using streamflow and groundwater level, EGU General Assembly 2026, Vienna, Austria, 3–8 May 2026, EGU26-3497, https://doi.org/10.5194/egusphere-egu26-3497, 2026.

EGU26-5395 | Posters on site | HS2.2.7

Adventures in Model Land: Using tabletop roleplay games to explore the abstract worlds of numerical models 

Christopher Skinner, Erica Thompson, Jessica Enright, Rolf Hut, Sam Illingworth, and Elizabeth Lewis

Good modelling practice is founded on both understanding the limitations and assumptions of models and the clear communication of these. This includes appreciation of the impacts of modelling choices and how things might be different if other choices were made. Often the audience for this communication are non-modellers who will need to make decisions based on the information provided by the modeller. There is a need for creative approaches and tools that can translate technical and abstract concepts into something meaningful.

Games, including tabletop roleplay games (TTRPGs), immerse players within imaginary worlds. Although they might resemble the real-world, they have differences that enable smooth gameplay, player immersion, and for narratives to advance. For example, they might have boundary limits to the explorable world, or approximations of time to focus on the most interesting elements. In this sense, numerical modellers and games developers have a shared experience when simulating ‘realities’.

Thompson (2022) introduced the concept of ‘model lands’ – strange worlds that are created by our models, which share some characteristics of the real-world but also many differences. We argue that model lands and game worlds are functionally the same but with different usefulness’s. We present the Adventures in Model Land framework, an open-source resource for numerical modellers that uses world-building methods from TTRPGs to bring model lands to life in an explorable way. Originally proposed as a fun activity, the methods are being developed into a toolkit to help modellers communicate the details, assumptions, limitations, and uses of their models with non-modellers.

How to cite: Skinner, C., Thompson, E., Enright, J., Hut, R., Illingworth, S., and Lewis, E.: Adventures in Model Land: Using tabletop roleplay games to explore the abstract worlds of numerical models, EGU General Assembly 2026, Vienna, Austria, 3–8 May 2026, EGU26-5395, https://doi.org/10.5194/egusphere-egu26-5395, 2026.

EGU26-8123 | ECS | Posters on site | HS2.2.7

Does AI Understand Hydrology? - Investigating AI recommended conceptual hydrological model setups 

Philipp Schultze, Darri Eythorsson, Martyn Clark, and Julian Klaus

Large language Models (LLMs) are being developed and marketed at a rapid pace, and practitioners and scientists across many fields are exploring applications that deliver on the promises made by the leading Large Language Model providers. Given the advent of this new technology,  the fields of hydrology and hydrologic modeling are starting to investigate  its potential application. The idea of an AI assistant that is skilled in hydrological reasoning is exciting and timely. Despite the growing application of LLMs across earth sciences, it remains unclear if and how they can provide meaningful guidance on hydrological modelling.  

In this study, we investigate whether LLMs provide robust a priori suggestions for conceptual model structure, based on the implicit hydrological understanding captured in their training data. We addressed this aim across 14 diverse and a separate set of 26 hydrologically similar catchments in the contiguous United States using Google’s Gemini 2.5 Flash model. We translated the conceptual hydrological modeling framework FUSE (Framework for Understanding Structural Errors) into five different structured text-based prompts, differing in symbolic abstraction. Next, we tasked the LLM to recommend suitable hydrological model components for each catchment based on their geographic location. These recommendations were then evaluated against an exhaustive set of all 78 plausible  FUSE configurations.

We assessed the outcome of streamflow simulations from the recommendation of the LLM regarding KGE performance, regional consistency, and model fidelity in representing hydrological signatures. Our preliminary results indicate that LLMs can be prompted to adhere to strict modeling frameworks and provide model component recommendations that strongly adhere to the given restrictions resulting in executable model setups. Furthermore, the structure of the prompt profoundly impacts efficacy, highlighting a need for future research on prompt design. However, the model commonly did not recommend the top-performing structures and demonstrated inconsistency by recommending different model components across repeated identical prompts. This research represents a first step toward establishing benchmarks for "hydrologic understanding" in LLMs and assessing their viability in future modeling applications.

How to cite: Schultze, P., Eythorsson, D., Clark, M., and Klaus, J.: Does AI Understand Hydrology? - Investigating AI recommended conceptual hydrological model setups, EGU General Assembly 2026, Vienna, Austria, 3–8 May 2026, EGU26-8123, https://doi.org/10.5194/egusphere-egu26-8123, 2026.

Hydrological modelling practice increasingly demands transparent, reproducible, and flexible workflows that enable systematic evaluation of model structure, process representation, and coupling strategies. This study presents a refactoring and componentization of a conceptual hydrologic model and its internal routines using the Basic Model Interface (BMI) as a practical mechanism for improving modelling practice through modularity, interoperability, and reproducibility. As a case study, an existing R implementation of the Hydrologiska Byråns Vattenbalansavdelning (HBV) model was reimplemented in Python using object-oriented design and exposed through BMI, a standardized interface widely adopted in Earth system modelling.

BMI components were developed at two complementary levels of granularity: (1) a component representing the complete HBV model, and (2) individual components representing the Snow, Soil, Response, and Routing routines. This dual-level design enables transparent reconstruction of the full model from its constituent processes while supporting controlled experimentation with alternative structural configurations, such as the inclusion or exclusion of internal routing. The BMI-enabled components were integrated within the Next Generation National Water Model (NextGen) framework, facilitating consistent execution, standardized variable exchange, and reproducible multi-model simulations. Applications include both standalone HBV simulations and multi-model mosaic formulations in which HBV components are coupled with other hydrologic and land-surface models.

The results demonstrate how interface-driven model design can improve hydrological modelling practice by enabling systematic model comparison, structural sensitivity analysis, and reusable workflows across modelling environments. More broadly, this work provides a transferable roadmap for converting Python-based hydrologic models into BMI-compliant components, supporting community efforts toward more transparent, interoperable, and reproducible hydrological modelling.

How to cite: Abualqumboz, M., Tarboton, D., and Jennings, K.: Improving Hydrological Modelling Practice through Componentization: A BMI-Based HBV Implementation within the NextGen Framework, EGU General Assembly 2026, Vienna, Austria, 3–8 May 2026, EGU26-8788, https://doi.org/10.5194/egusphere-egu26-8788, 2026.

EGU26-11010 | ECS | Orals | HS2.2.7

Rheinblick2027: a multi-model approach to generate large-scale hydrological scenarios for the Rhine River and assess climate change impacts on key hydrological signatures 

Julie Collignan, Michael Schirmer, Frederiek Sperna Weiland, Joost Buitink, Julianna Regenauer, Jules Beersma, Massimiliano Zappa, Vazken Andreassian, and Tobias Wechsler

The Rheinblick2027 project investigates the impacts of climate change on the discharge of the Rhine River and its major tributaries as assessed by different working groups in the riparian countries of the Rhine. Initiated by the International Commission for the Hydrology of the Rhine Basin (CHR), the project builds on its predecessor Rheinblick2010 (formerly denoted as Rheinblick2050). The project’s main objectives are to compare model differences, develop hydrological scenarios through 2150, and assess the effects of climate change on key hydrological signatures over the Rhine catchment, such as annual water balance and high- and low flow situations.

The project started with a model intercomparison involving four hydrological models: wflow_sbm (Deltares, NL), LARSIM-ME (BfG, DE), PREVAH (WSL, CH), GRSD (INRAE, FR). A first round of simulations was conducted using the KNMI’23 scenarios, one of the few CMIP6 based downscaled climate scenarios available, providing a valuable opportunity to test and establish common workflows towards a well-defined hydrological simulation protocol.

Initial projections reconfirm increasing winter discharge and decreasing summer discharge, when water demand is highest. This first round of simulations represents a crucial step in preparing for the second round using a set of EURO-CORDEX CMIP6 scenarios as processed in the "DWD-Reference Ensemble" provided by the German weather service, scheduled for early 2026. In parallel, the Rheinblich2027 team has begun investigating the impacts of climate change on six selected key topics, among which groundwater recharge and extreme value statistics.

Beyond its core goals, Rheinblick2027 aims to strengthen stakeholder engagement and foster collaboration among modelling groups by regularly organising outreach activities and interactive platforms that bring together stakeholders from the Rhine catchment and scientists from various institutions. These interactions are essential to ensure that the final products align with stakeholder needs and provide actionable climate services for water resources management.

How to cite: Collignan, J., Schirmer, M., Sperna Weiland, F., Buitink, J., Regenauer, J., Beersma, J., Zappa, M., Andreassian, V., and Wechsler, T.: Rheinblick2027: a multi-model approach to generate large-scale hydrological scenarios for the Rhine River and assess climate change impacts on key hydrological signatures, EGU General Assembly 2026, Vienna, Austria, 3–8 May 2026, EGU26-11010, https://doi.org/10.5194/egusphere-egu26-11010, 2026.

EGU26-11368 | ECS | Orals | HS2.2.7

Comparing Hydrological Models in Configuration and Trajectory Space 

Mikhail Smilovic

Hydrological models often differ substantially in their internal structure, process representations, and parameterisations, even when calibrated against similar observations. Understanding how these structural differences manifest under both environmental forcing and management-driven forcing remains a central challenge for model intercomparison. Here, we explore a transformation-based diagnostic framework grounded in mass conservation and seasonal cyclic behaviour.

Rather than interpreting models in terms of static system states, we focus on admissible mass-conserving transformations defined by the balance among inputs, outputs, and storage changes. This relation defines an admissible envelope of possible transformations, which can be interpreted as a generalised configuration space. Within this space, seasonal cycles trace characteristic trajectories shaped by climatic variability and by model-specific representations of regulation, storage, and decision rules.

To facilitate comparison, we introduce the concept of “prints” and “scans” of these trajectories: visual representations that can be overlaid across models to reveal similarities, divergences, and systematic structural differences. This extension of the "water circles" allows model behaviour to be compared in terms of geometry and organisation of admissible transformations, rather than differences in isolated states or aggregated performance metrics.

Intended as a complementary and exploratory diagnostic, the framework provides a conservation-anchored reference to understand how environmental and anthropogenic forcings are encoded across hydrological models, offering insight into structural differences that traditional intercomparison approaches may obscure.

How to cite: Smilovic, M.: Comparing Hydrological Models in Configuration and Trajectory Space, EGU General Assembly 2026, Vienna, Austria, 3–8 May 2026, EGU26-11368, https://doi.org/10.5194/egusphere-egu26-11368, 2026.

EGU26-11573 | ECS | Posters on site | HS2.2.7

Efficient and Automated Mesh Generation for Refined Flood Modeling in Complex Urban Environments 

Leon Frederik De Vos, Karan Mahajan, Daniel Caviedes-Voullième, Faizal Rohmat, Muhammad Farras Adiprayoga, and Nils Rüther

Accurate two-dimensional hydrodynamic flood modeling in urban environments requires mesh resolutions that can capture complex flow patterns around buildings and infrastructure, while maintaining computational efficiency. However, generating suitable meshes for such applications is often time-consuming, mainly due to the complex layout of buildings in urban areas. This contribution presents an efficient and automated mesh generation workflow tailored for refined 2D flood modeling in complex urban areas. The approach introduces rule-based local mesh refinements around buildings, flow paths, and critical urban features, while maintaining a coarse resolution elsewhere. First, geometrical input data sets, such as building outlines or water body outlines, are preprocessed to ensure their geometric validity. The building geometry data set is then further analyzed and processed to ensure a refined, yet not excessive, mesh resolution between buildings, taking into account user-given thresholds for mesh resolution. Finally, the mesh is generated based on the processed input data using the Triangle mesher developed by Shewchuck (1996). The framework is designed to be automated yet user-controlled, enabling reproducible and scalable mesh generation for urban flood hazard assessment. Its performance is demonstrated through application to an urban test case in Majalaya, Indonesia, highlighting improvements in accuracy–efficiency trade-offs and suitability for operational flood risk modeling.

Reference:

Shewchuk, J. R.: Triangle: Engineering a 2D Quality Mesh Generator and Delaunay Triangulator, in: Applied Computational Geometry: Towards Geometric Engineering, edited by Lin, M. C. and Manocha, D., vol. 1148 of Lecture Notes in Computer Science, pp. 203–222, Springer-Verlag, from the First ACM Workshop on Applied Computational Geometry, 1996.

How to cite: De Vos, L. F., Mahajan, K., Caviedes-Voullième, D., Rohmat, F., Adiprayoga, M. F., and Rüther, N.: Efficient and Automated Mesh Generation for Refined Flood Modeling in Complex Urban Environments, EGU General Assembly 2026, Vienna, Austria, 3–8 May 2026, EGU26-11573, https://doi.org/10.5194/egusphere-egu26-11573, 2026.

EGU26-11658 | ECS | Posters on site | HS2.2.7

A data-driven approach to evaluate the importance of terrain features for hydrological modelling in flood warnings 

Grith Martinsen, Jonas Wied Pedersen, Maggie Henry Madsen, Cecilie Thrysøe, Lucas Dalgaard Jensen, Emma Dybro Thomassen, Michael Butts, Raphaél Payet-Burin, and Sanita Dhaubanjar

Denmark’s national river flood forecasting system employs several different hydrological models for predicting river discharge estimates. These are used by duty meteorologists at the Danish Meteorological Institute (DMI) to issue flood warnings. In this study we explore two of these models: a Long Short-Term Memory network (DK-LSTM) and a conceptual hydrological model with the software HYPE (DK-HYPE). From operational experience, we suspect that both models have structural deficiencies related to lack of topographically driven processes. We therefore apply a dual-model approach to explore the potential in processing and feeding more detailed terrain description for forecasting high river flows in Denmark.

The LSTM model is trained primarily based on the CAMELS data set for Denmark. CAMELS data sets are widely used and are becoming a standard, recognized data set for training and running data-driven models. The current CAMELS data sets contain simple statistical description of terrain features, like catchment-averaged mean, min and max values of elevation above mean sea level and terrain slope. The HYPE model is based on the concept of hydrological response units (HRUs) but the default implementation in HYPE only delineates HRUs based on soil and land use information. Experience from the development of the two national models (DK-LSTM and DK-HYPE) indicates that catchments with distinct topological characteristics can exhibit markedly different hydrological responses that are not captured by simple catchment averages of DEM properties.

We perform detailed raster-based representations of terrain indices like HAND, rDune and TWI across Denmark. We then test multiple ways of processing the indices and summarizing the distribution of values within each sub-catchment into catchment attributes that the LSTM model can use as inputs. The relative importance of various terrain indices in DK-LSTM for high-flow predictions are then evaluated, and this information is used to redesign HRU delineation in the DK-HYPE. This enables the DK-HYPE setup to calibrate hydrological processes with terrain information. Our findings show which terrain indices, and therefore which topographic properties, that provide most benefit for predictive performance in high river discharge events relevant for flood warning applications.

How to cite: Martinsen, G., Pedersen, J. W., Madsen, M. H., Thrysøe, C., Jensen, L. D., Thomassen, E. D., Butts, M., Payet-Burin, R., and Dhaubanjar, S.: A data-driven approach to evaluate the importance of terrain features for hydrological modelling in flood warnings, EGU General Assembly 2026, Vienna, Austria, 3–8 May 2026, EGU26-11658, https://doi.org/10.5194/egusphere-egu26-11658, 2026.

EGU26-11880 | ECS | Orals | HS2.2.7

Towards semi-distributed modelling for low-flow simulation: comparing four hydrological models in the French Meuse catchment 

Camille Brun, Alban de Lavenne, Claire Delus, Hajar El Khalfi, Didier François, Thibault Hallouin, Frédéric Hendrickx, Shu-Chen Hsu, Céline Monteil, and Jean-Pierre Vergnes

Droughts are a growing concern for water managers, as climate change is expected to intensify both their severity and frequency. Accurately forecasting these events is crucial to mitigate their impacts. Semi-distributed hydrological modelling, by dividing the catchment into interconnected hydrological units, provides flow estimation at gauged and ungauged locations and explicitly accounts for some physical and climatic spatial variability across the catchment.

In this study, four semi-distributed models (GRSD, MORDOR-TS, PRESAGES, RAMEAU) are implemented in the Meuse River catchment at Chooz, an area characterized by contrasting geological, topographic, and meteorological conditions. The models differ in their structural assumptions, notably regarding groundwater exchanges beyond topographic boundaries and the potential use of piezometric data during calibration.

Following a joint calibration exercise, the four models provide consistent results on streamflow across the entire catchment and comparable performance at the outlet at Chooz in comparison to their lumped-model counterparts. Similar biases are observed among the models, which may reflect common limitations in their assumptions or uncertainties in flow measurements and meteorological data. The case study of the 2022 low-flow event highlights variability in simulated low flows, linked in particular to the choice of model and to the climate data used for calibration. Gauging measurements taken during low-flow periods would help strengthen these results. Future work should focus on improving the understanding and the representation of groundwater flows in semi-distributed hydrological models.

How to cite: Brun, C., de Lavenne, A., Delus, C., El Khalfi, H., François, D., Hallouin, T., Hendrickx, F., Hsu, S.-C., Monteil, C., and Vergnes, J.-P.: Towards semi-distributed modelling for low-flow simulation: comparing four hydrological models in the French Meuse catchment, EGU General Assembly 2026, Vienna, Austria, 3–8 May 2026, EGU26-11880, https://doi.org/10.5194/egusphere-egu26-11880, 2026.

EGU26-12204 | Orals | HS2.2.7

Transparent Modelling in Interdisciplinary Research: An Illustration from an Agro-Hydrological Study in the Cambodian Mekong Delta  

Christina Anna Orieschnig, Jean-Philippe Venot, Gilles Belaud, and Sylvain Massuel

Ensuring transparency and a clear communication of uncertainties poses a ubiquitous challenge in hydrological modelling, both in the application of existing models in new domains and in the development of new models. This challenge becomes especially pressing in interdisciplinary research contexts, where expectations of models and understanding of their roles often differ. While an increasing body of work on good modelling practices in hydrology has been developed over the past years, there is no common standard yet that could help modellers address these challenges. In particular, one aspect that is rarely explicitly described in modelling studies is the effect of preliminary perspectives of different members of the modelling team and subjective choices along the modelling chain on the model’s outputs and uncertainties. 

This study takes the example of an agro-hydrological model developed in the Cambodian Mekong Delta (Southeast Asia) to explore this social side of model development and application in an international, interdisciplinary development context. The model in question was developed to explore how regional hydrological dynamics - and particularly water availability for agriculture - would change following hydro-infrastructure rehabilitation projects funded by international development agencies. The implementation of these projects can be seen against the background of the shifting hydrological dynamics in the Mekong basin, driven by climate change, hydropower construction, and land use changes. In its final version, the model allows for a relative assessment of the effects of water availability for irrigation on the agricultural productivity in the study area, taking into account different configurations of the artificial channels to be rehabilitated as well as the annual Monsoon inundations and the hydrological dynamics of the Mekong’s deltaic distributaries. 

In our case study, we strive to highlight the impact of the expectations and goals of different members of the modelling team, originating from different disciplines, as well as the subjective modelling choices and simplifications made collectively throughout the modelling process, on the final results. In particular, we also examine the process by which simplifications were implemented and the perceptual model was negotiated, against the background of the data scarcity that is characteristic of many hydrological studies carried out in the Global South. Furthermore, we reflect on how existing guidelines for good modelling practices (such as FAIR principles) have helped with the communication of uncertainties and limitations of the model, and how future guidelines could evolve to better take into account and transparently represent social dynamics within interdisciplinary modelling teams, for instance through the use of positionality statements.

How to cite: Orieschnig, C. A., Venot, J.-P., Belaud, G., and Massuel, S.: Transparent Modelling in Interdisciplinary Research: An Illustration from an Agro-Hydrological Study in the Cambodian Mekong Delta , EGU General Assembly 2026, Vienna, Austria, 3–8 May 2026, EGU26-12204, https://doi.org/10.5194/egusphere-egu26-12204, 2026.

EGU26-14520 | ECS | Posters on site | HS2.2.7

 Evaluating Hydrological Model Structures and Parameter Transfer across the Indian Subcontinent  

Neharika Bhattarai, Martyn Clark, Manabendra Saharia, Darri Eythorsson, Nicolas Vasquez, and Cyril Thébault

Hydrological simulations in the Indian subcontinent are impacted by substantial uncertainty contributed by the selection of model structure and parameterization. Nevertheless, most studies in the Indian subcontinent have relied on a single model structure to simulate streamflow, without evaluating how such a choice might impact simulations  in ungauged basins. In this study, we comprehensively evaluate the 277 gauged basins spanning across the diverse hydro-climatic regions of the Indian subcontinent using the Framework for Understanding Structural Errors (FUSE). FUSE allows testing different model structures within a controlled experimental framework, enabling the systematic evaluation of the impact of different model structures on streamflow simulations. For each gauged basin, we calibrate 78 FUSE structures and evaluate their performance with respect to the basic benchmarking models using the HydroBM python package and simulations from Noah-Multiparameterization Land Surface Model (Noah-MP LSM).

For regionalization, we generate ensembles of 500 parameter sets for each selected decision structure using Latin Hypercube Sampling and propagated these through FUSE to characterize predictive uncertainty in ungauged basin simulations. These simulations are subsequently used to train surrogate emulators of the performance surface response, enabling efficient transfer of parameters from gauge to ungauged basins.Results indicate strong variability in predictive skill, uncertainty, and regionalization performance across model structures, highlighting that structures identified as optimal in calibrated basins do not necessarily generalize under parameter transfer. These findings underscore the need to consider structural benchmarking, uncertainty reliability, and regionalization performance when developing hydrological modelling frameworks for data-scarce regions such as the Indian subcontinent.

How to cite: Bhattarai, N., Clark, M., Saharia, M., Eythorsson, D., Vasquez, N., and Thébault, C.:  Evaluating Hydrological Model Structures and Parameter Transfer across the Indian Subcontinent , EGU General Assembly 2026, Vienna, Austria, 3–8 May 2026, EGU26-14520, https://doi.org/10.5194/egusphere-egu26-14520, 2026.

The setup of hydrological models in accordance to good modelling practice guidelines involves several steps of model development that have to be performed sequentially as well as iteratively. Purpose is decisive for choices that need to be made in the modelling process. Regardless of whether the task is to develop a predictive or explanatory model, the modelling process typically involves a stage where one or several model candidates are selected, a stage of model calibration, uncertainty quantification and a phase of model evaluation and diagnostics. Ideally, at the end of the process stands a model that serves the purpose.
Explanatory models could be used to learn about (dominant) hydrological processes and thus require a certain level of process realism in the governing equations that represent the system under study. In practice, modellers form one or several hypotheses about “how the system works” and test these hypotheses by setting up corresponding model structures whose parameters are trained on data. Model choice is then a matter of model-data (mis)fit. 
However, errors in the data and model inputs, uncertainty in parameter values, misspecified or missing processes, scaling issues, among others, can and often do lead to parameter compensation in the model calibration stage. Model ensembles typically cover only a fraction of the model space, i.e. the “population” of plausible model structures. Particularly when the “true” model (or a “realistic” one) is not included, model choice boils down to model flexibility or fidelity rather than plausibility. A further complicating factor is that misspecification in combination with confidence in the data can distort uncertainty estimates of parameters and predictions, potentially leading to over-confident and biased distributions. The relative contributions of different error sources to the total uncertainty are then also affected. Unfortunately, most of this goes unnoticed, even when following good modelling practice guidelines.
In this contribution we illustrate some of these potential pitfalls and bad choices in hydrological modelling with both a synthetic test case where the “true model” exists and with an ensemble of candidate hydrological models and field data from the Forellenbach catchment in the Bavarian National Park. We highlight and demonstrate the impact of misspecified priors, biased data and uncertain model forcings on model choice and briefly discuss model fidelity vs. plausibility. Bayesian analysis is applied for model diagnosis and to disentangle error sources and their relative contribution to total uncertainty. Most of these issues, either separately or combined, have been described in modelling studies before. We like to raise awareness and encourage further discussion in the hydrological community on suitable and practical solutions to identify and treat major uncertainty sources in hydrological modelling. 

How to cite: Wöhling, T. and Bartusch, A.: Disentangling pitfalls and (bad) choices in the hydrological modelling process and their impact on model performance, uncertainty and model choice, EGU General Assembly 2026, Vienna, Austria, 3–8 May 2026, EGU26-15141, https://doi.org/10.5194/egusphere-egu26-15141, 2026.

EGU26-15343 | ECS | Posters on site | HS2.2.7

The impact of benchmark selection on spatial patterns of model evaluation metrics 

Paul Coderre, Wouter Knoben, Cyril Thébault, Nicolas Vásquez, Martyn Clark, and Alain Pietroniro

Hydrological model evaluation is often performed with aggregated metrics such as the widely used Nash Sutcliffe Efficiency (NSE). The NSE is a skill score that can be interpreted as using the mean observed flow as a benchmark against which to compare model performance. However, this results in strong spatial patterns of scores that conflate model skill with flow variability, depending on how appropriate the benchmark model is for the catchment at hand. These patterns make it difficult to compare NSE scores across catchments which complicates model evaluation and comparison. This work addresses this limitation by using alternative formulations of the NSE that replace the mean observed flow term with various other benchmark simulations (called “benchmark efficiencies”, BME). BME values were calculated for an ensemble of 20 simple benchmarks, using hydrological model simulations from 960 basins in North America as a test case. The benchmarks vary from simple statistics calculated directly from the streamflow series to extremely simple models that try to capture the main outcomes of catchment behavior.

Results show that alternative benchmarks show spatial patterns of model performance that differ from those of the NSE, due to differences in how well the individual benchmarks capture flow variability in different regions. Benchmarks that effectively capture flow variability in a given catchment result in a low BME score and are a more challenging test of model performance. As such, selecting the lowest BME score in each catchment can reduce the spatial patterns in model scores by ensuring that the model is always being compared to the benchmark that best captures the flow variability of the catchment. The highest NSE scores were all found in catchments with strongly seasonal flow regimes, but the highest BME scores came from a more even distribution of flow regimes. Indeed, several catchments with strongly seasonal flow regimes had NSE scores above 0.5 with negative corresponding BME scores. This indicates that failing to use appropriate benchmarks for BME calculations in catchments with a strongly seasonal flow regime can mask the fact that the model cannot beat simple benchmarks and may provide an overly optimistic assessment of model performance. By selecting the most appropriate benchmark in each basin from a larger benchmark ensemble, the resulting spatial overview of model performance found through the BME approach is less conflated with flow variability. This results in BME values that are more strongly focused on the added value of using the model over alternative ways to predict the variable of interest. This strongly affects the conclusions one might draw about where a model is fit-for-purpose, and where improvements in model performance may be most readily achieved.    

How to cite: Coderre, P., Knoben, W., Thébault, C., Vásquez, N., Clark, M., and Pietroniro, A.: The impact of benchmark selection on spatial patterns of model evaluation metrics, EGU General Assembly 2026, Vienna, Austria, 3–8 May 2026, EGU26-15343, https://doi.org/10.5194/egusphere-egu26-15343, 2026.

EGU26-15888 | ECS | Orals | HS2.2.7

Flow duration curve prediction in ungauged basins: a model intercomparison study 

Daniel Kovacek and Steven Weijs

The flow duration curve (FDC) has long been used in water resources research and practice.  We compared three approaches to FDC estimation in ungauged basins, ranging in model complexity and richness of input data.  FDCs were estimated by 1) assuming daily runoff is log-normally distributed and predicting distribution parameters from catchment descriptors, 2) ensemble averaging of nearest and most physically similar gauged neighbours, and 3) neural network rainfall runoff modelling. When evaluated on a hydrologically diverse sample of 712 catchments around British Columbia, Canada, we found the more complex neural network model provided little performance advantage over a simpler nearest-neighbour ensemble approach, and inter-model ensembles yielded equal or better performance than individual components.  Models were evaluated by four performance measures to highlight different notions of dissimilarity expressed by conventional residual error based metrics versus an information measure, the Kullback-Leibler divergence.  

How to cite: Kovacek, D. and Weijs, S.: Flow duration curve prediction in ungauged basins: a model intercomparison study, EGU General Assembly 2026, Vienna, Austria, 3–8 May 2026, EGU26-15888, https://doi.org/10.5194/egusphere-egu26-15888, 2026.

EGU26-19091 | Posters on site | HS2.2.7

Multi-objective optimization to explore trade-offs in a multi-purpose national scale integrated hydrological model 

Simon Stisen, Lars Troldborg, Maria Ondracek, and Raphael Schneider

A central element in water management in Denmark is the National Hydrological Model for Denmark (DK-model). The DK-model is a multi-purpose distributed, integrated hydrological model coupling 3D groundwater flow with root zone processes, overland flow and river routing combined with major human impacts such as groundwater abstraction

The model is applied for a range of national scale analysis and provides publicly available data for historic periods, in real time and for future projections. Applications include assessment of available water resources, effects of abstractions, nitrate transport and climate change impact assessments.

The model development and calibration is an ongoing process that seeks to improve performance across a range of model objectives and meet the requirements of endusers.

Recently, the calibration and parameterization of the DK-model has moved towards more spatially distributed parametrization schemes and new calibration targets regarding spatial patterns of evapotranspiration, drain fraction maps and irrigation volumes. This in combination with the large-scale distributed nature and high computational demand of the model system requires a pragmatic optimization approach that allows for both multi-objective and efficient optimization.

This is approached through the Pareto Archived Dynamically Dimensioned Search (PADDS) algorithm allowing a robust global parameter search effective even at a few hundred model runs. In addition, the PADDS approach enables a systematic analysis of tradeoffs between different objectives with minimal a-priori weighting of objective function groups.

In this study we specifically analyse the value of multiple objective functions by comparing optimizations based solely on conventional groundwater head observations and streamflow targets versus a more complex objective function scheme including seasonal groundwater fluctuations, evapotranspiration patterns, drain fractions and irrigation.  

This analysis, illustrates tradeoffs and equifinalities that are relevant for screening behavioral parameter sets for application of a multi-purpose model. In addition, a scheme for selecting an ensemble of parameter sets is illustrated.

How to cite: Stisen, S., Troldborg, L., Ondracek, M., and Schneider, R.: Multi-objective optimization to explore trade-offs in a multi-purpose national scale integrated hydrological model, EGU General Assembly 2026, Vienna, Austria, 3–8 May 2026, EGU26-19091, https://doi.org/10.5194/egusphere-egu26-19091, 2026.

EGU26-19380 | Orals | HS2.2.7

Good modelling practice begins before modelling. Data, perception, and model hypotheses 

Fabrizio Fenicia, Thiago do Nascimento, and Pasquale Perrini

Over the past decades, numerous guidelines have been proposed to improve hydrological modelling practice, with much emphasis placed on model calibration, evaluation, and intercomparison. This includes our own work and that of many others. While these efforts have advanced methodological rigor, they often implicitly assume that the set of candidate models is already well defined. In practice, however, the modelling space is vast, particularly for distributed models where process representations, parameterizations, and spatial variability can differ substantially. Selecting suitable model structures therefore remains a fundamental and often underexplored challenge.

In this contribution, we argue that hydrological modelling should not be the starting point of analysis, but rather the outcome of a structured chain of reasoning. This chain begins with the data: understanding data characteristics, limitations, and information content, and interpreting them in the context of dominant hydrological processes. Such data-driven reflection naturally leads to explicit and testable model hypotheses, which then form a meaningful basis for model selection and comparison. Central to this workflow is the perceptual model, which acts as a conceptual bridge between data interpretation and formal model structures.

Using examples from recent work in distributed hydrological modelling, we illustrate how this process-oriented approach can guide the choice of model complexity and structure, reduce arbitrariness in modelling decisions, and improve the interpretability of results. The contribution emphasizes that good modelling practice requires not only robust calibration and comparison strategies, but also a transparent and data-informed pathway that precedes model application itself.

How to cite: Fenicia, F., do Nascimento, T., and Perrini, P.: Good modelling practice begins before modelling. Data, perception, and model hypotheses, EGU General Assembly 2026, Vienna, Austria, 3–8 May 2026, EGU26-19380, https://doi.org/10.5194/egusphere-egu26-19380, 2026.

EGU26-20396 | Posters on site | HS2.2.7

The UK Hydro-MIP: Lessons learned from a hydrological and land-surface model intercomparison project 

Emma Robinson, Rosanna Lane, Helen Baron, and Elizabeth Cooper

The UK Hydro-MIP is a community-led model intercomparison project (MIP) for hydrological and land-surface modelling in the United Kingdom (UK). It was co-developed with the UK hydrological and land-surface modelling community to carry out coordinated modelling of historical streamflow for over 600 catchments across Great Britain. Participants followed a modelling protocol to ensure consistency while representing how models are used in practice. A variety of model types have been contributed, sampling the breadth of river flow modelling in the UK. The model ensemble has been evaluated and benchmarked using observed streamflow records and the participants and wider community were invited to contribute to initial analysis of the model ensemble through a community hackathon event. The resulting data set will be published later this year, providing a valuable resource to the wider hydrological community.

The UK Hydro-MIP provides an important insight into UK hydrological and land-surface modelling, allowing investigations of model uncertainty and highlighting potential research gaps. We present the development of the UK Hydro-MIP, from designing the protocol through to analysis of the results. We will discuss lessons learned from organising this MIP and demonstrate the value of model intercomparisons through our initial results.

How to cite: Robinson, E., Lane, R., Baron, H., and Cooper, E.: The UK Hydro-MIP: Lessons learned from a hydrological and land-surface model intercomparison project, EGU General Assembly 2026, Vienna, Austria, 3–8 May 2026, EGU26-20396, https://doi.org/10.5194/egusphere-egu26-20396, 2026.

The planning and management of multiple dams within a river basin are critically important for the effective use of water resources and energy generation. Under the growing pressures of climate change, Türkiye, classified as a water-stressed region, faces significant challenges in balancing water availability with population growth, environmental sustainability, and energy demands. The sustainable operation of multiple dams is a vital step toward ensuring the efficient utilisation of water resources for the country's future, while addressing environmental considerations and climate resilience.

The Euphrates-Tigris Basin spans a semi-arid area of 762,000 km², covering six countries: Türkiye, Iran, Iraq, Jordan, Syria, and Saudi Arabia. The two major rivers in the basin, the Tigris and Euphrates, originate from the mountains in eastern Türkiye. These rivers are primarily fed by snowmelt stored during the winter, while during the dry summer months, they rely heavily on groundwater, making the region particularly vulnerable to climate change. Approximately 60 million people depend on these rivers for irrigation, energy production, and other water-related needs. This study focuses on the portion of the Euphrates-Tigris Basin located within Türkiye, covering an area of 18,500 km² (Esit et al., 2023; Rateb et al., 2021).

Türkiye has built 19 hydropower plants and 22 dams in this region over recent decades to store water for irrigation, energy generation, and flood control (SAPRDA, 2009). However, the basin faces increasing challenges due to climate change, including reduced precipitation, rising temperatures, and greater variability in seasonal water availability. These changes exacerbate flood risks during extreme rainfall events while also intensifying drought conditions in dry seasons. The stored water in dams is essential for hydropower production, contributing to Türkiye’s renewable energy targets, yet evaporation losses and reduced inflows pose threats to long-term sustainability. Addressing these interconnected issues is critical for maintaining water security, energy production, and ecosystem stability in the region.

Currently, dams in Türkiye are operated individually, often without coordination or consideration for downstream interdependencies, population growth, or the effects of a changing climate. Using the Euphrates- Tigris basin as a case study, this study seeks to explore the impacts of multiple dam operations in water management. The research will analyse the implications of uncoordinated dam operations on water allocation, seasonal water availability, and hydropower production. Furthermore, it will assess the potential benefits of integrated dam management strategies for improving water resource efficiency. By identifying key challenges and opportunities, this study aims to contribute to the sustainable management of the Euphrates-Tigris Basin in the face of evolving climatic and socio-economic pressures.

How to cite: Sarışen, D. and Yılmaz, D.: Managing Water Resources in the Euphrates -Tigris Basin: Impacts of Multipurpose Dam Operations, EGU General Assembly 2026, Vienna, Austria, 3–8 May 2026, EGU26-4546, https://doi.org/10.5194/egusphere-egu26-4546, 2026.

EGU26-5116 | ECS | PICO | HS2.2.9

Impacts of the Kapulukaya Dam on the Hydrological Health of the Kızılırmak River 

Arda Enes Yıldırım and Döndü Sarışen

This study analyzes the hydrological conditions of the downstream of Kapulukaya Dam on the Kızılırmak River, comparing the pre-construction natural period (1970–1989) with the post-operation-controlled period (1989–2013). Using the Flow Health Software, the nine different hydrological sub-indicators, such as High Flow, Low Flow, and Seasonal Flow Shift were employed to determine the ecological and functional integrity of the river on a scale of 0 to 1. The results show a moderate deviation from natural processes; the most significant changes were observed in the Flood Flow Interval (FFI) and Seasonal Flow Shift (SFS) indices, indicating the suppression of natural flood cycles. Even during periods of extreme drought between 2006 and 2008, the Kapulukaya Dam has a high Persistently Very Low (PVL) rating of 0.95, preventing the complete drying up of the riverbed. However, the facility failed to reach its design energy production target of 190 GWh annually due to climatic pressures and upstream water conditioning. Furthermore, factors such as increase in drinking water demand in Kırıkkale and the lack of a central irrigation union negatively affected operational efficiency. The results obtained demonstrate that the dam achieved its flood control objective but experienced increased seasonal pressures on the river flow. In conclusion, the study highlights the need for an efficient water management strategy in the Kızılırmak Basin, encompassing climate change and water demand scenarios to achieve long-term sustainability.

How to cite: Yıldırım, A. E. and Sarışen, D.: Impacts of the Kapulukaya Dam on the Hydrological Health of the Kızılırmak River, EGU General Assembly 2026, Vienna, Austria, 3–8 May 2026, EGU26-5116, https://doi.org/10.5194/egusphere-egu26-5116, 2026.

EGU26-5184 | PICO | HS2.2.9

A web-based integrated Hydrosphere modeling system for scientists and decision-makers 

Lluís Pesquer, Amanda Batlle, Savitri Galiana, Xavier Garcia, Kaori Otsu, Eva Flo, Ester Prat, Elisa Berdalet, and Joaquim Ballabrera

The appropriate management of the water system requires a holistic consideration of the inland waters, the marine ecosystems and their interactions. However, these two systems are monitored, analysed and modelled separately and managed with often non connected policies. This is in part due to the intrinsic characteristics of the two systems and to the complex processes occurring between them, usually understudied. Nowadays modelling offers new opportunities for integrating land-sea interactions, as we show in this study. At the same time, such models are expanding their capabilities in cloud computing environments. However, many existing modelling tools remain fragmented and are limited to either inland or marine components, such as Digital Twin Earth (DTE) Hydrology Next or European Digital Twin Ocean (EDITO). To overcome this limitation, the current work presents a virtual research environment (VRE)-based workflow with a single interface for the whole water continuum: from inland water, through coastal water to open oceans. We present a seamlessly connected inland surface hydrological model with a modular ocean circulation modelling system, available into the AquaINFRA VRE in compliance with FAIR principles. It is provided on the web-based Galaxy platform https://aqua.usegalaxy.eu/ to facilitate the integration with the European Open Science Cloud (EOSC) system.

The developed solution allows to execute the modelling workflow in a pre-prepared specific region with a chain of three components:

  • Surface inland model: it allows different scenario simulations at daily or monthly responses through parameterised SWAT+ executions with a previous watershed delineation.
  • Inland-marine connector: transform the output in hydrological response units in the neighbouring of the mouth in the sea of the catchment area to needed inputs for the marine model.
  • Ocean circulation model: it takes as input for the rivers and computes with the MITgcm modelling code the coastal ocean dynamics.

This workflow is initially developed for a Mediterranean use case but is designed to be reproducible and scalable to other European and global regions. The first study area tested is the Tordera catchment and its neighbouring coastal zone, located on the central Catalan coast in the NW Mediterranean. The Tordera basin features a diverse landscape, including croplands, shrublands, forests, urban areas, and industrial zones. Associated human activities, together with the high variability of climatic events, directly affect the quantity and quality of water in both inland and marine ecosystems. Therefore, integrated information through the water continuum is key for its management.

The proposed system aims to 1) reduce the technical complexity of hydrological and marine model executions, 2) show an innovative connection tool between fresh and ocean water environments, and 3) display clear and useful information of the results. The AquaINFRA project will make this system accessible to a broader research community beyond SWAT and MITgcm experts. Thus, scientists, decision-makers and other stakeholders will be able to simulate and assess different future scenarios and better understand past extreme events with an improved representation of land–sea interactions.

Acknowledgments

The AquaINFRA project received funding from the European Commission’s Horizon Europe Research and Innovation programme under grant agreement No 101094434

How to cite: Pesquer, L., Batlle, A., Galiana, S., Garcia, X., Otsu, K., Flo, E., Prat, E., Berdalet, E., and Ballabrera, J.: A web-based integrated Hydrosphere modeling system for scientists and decision-makers, EGU General Assembly 2026, Vienna, Austria, 3–8 May 2026, EGU26-5184, https://doi.org/10.5194/egusphere-egu26-5184, 2026.

With the increasing impacts of climate change in recent decades, numerous studies have reported a rising frequency of extreme rainfall events worldwide, accompanied by intensified droughts and floods. Consequently, traditional hydrological analyses require further consideration of climate change effects.This study analyzes more than 125-year record of daily rainfall observations (1900–2025) from the Taipei and Tainan meteorological stations in Taiwan. The dataset is divided into a historical period (1900–1990) and a recent period (1991–2025) to investigate long-term variations in extreme rainfall and drought characteristics. Three hydrological indicators are examined: (1) changes in return periods of extreme rainfall, (2) trends in the number of non-rainy days, and (3) months of extreme precipitation occurrence.In the return period analysis, the Annual Maximum Series (AMS) method combined with the Weibull plotting position formula was applied. The results reveal a decreasing trend in return periods at both the Taipei and Tainan stations, indicating an increased frequency of extreme rainfall events.In terms of drought characteristics, long-term variations in non-rainy days were examined based on the concept of an accelerated hydrological cycles. The results show that the number of non-rainy days has increased at a rate of approximately 0.3 days per year in both northern and southern Taiwan. Furthermore, the average annual number of non-rainy days in the recent period increased by approximately 23 days compared to the historical period, reflecting climate characteristics associated with reduced light rainfall and intensified drought–flood extremes.Regarding seasonal variability, the probability distribution of extreme precipitation occurrence by month was analyzed. The Taipei station exhibits an expansion of the flood season, with extreme precipitation events primarily occurring in June and October, forming a bimodal distribution. In contrast, the Tainan station shows a pronounced concentration of extreme precipitation during the wet season, with approximately 43.8% of events occurring in August.Based on these findings, it is recommended that flood control design standards be upgraded to account for shortened return periods of extreme rainfall. In addition, water resource allocation and management strategies should be strengthened to mitigate the increasing risk of water shortages associated with the rise in non-rainy days. Flood warning systems and construction planning should also be dynamically adjusted in response to shifts in the occurrence months of extreme precipitation.

How to cite: Yang, C.-L. and Lin, Y.-C.: Investigating Trends in Regional Hydrological Characteristics Under Climate Change Using Long-term Rainfall Observation Data: A Case Study of Taipei and Tainan, Taiwan, EGU General Assembly 2026, Vienna, Austria, 3–8 May 2026, EGU26-6106, https://doi.org/10.5194/egusphere-egu26-6106, 2026.

Abstract: Under the increasing pressure of water scarcity, irrigation decision-making plays a critical role in achieving efficient agricultural water use while maintaining stable and increased crop yields. With the continuous advancement of crop water information sensing technologies, irrigation decisions based on multi-source farmland information monitoring have become an important development direction for precision irrigation. Targeting salinized farmland in arid regions with shallow groundwater tables, this study proposes an irrigation decision-making method based on in situ measured farmland evapotranspiration, which effectively avoids the adverse effects of soil salinity on the measurement accuracy of soil moisture sensors and enables precise irrigation regulation under saline conditions. Based on two consecutive years of comparative irrigation decision experiments conducted on tomato and maize, the results indicate that, compared with conventional soil-moisture-based irrigation decision methods, the proposed approach can reduce irrigation water use by 7.69%–14.29% while increasing crop yield by 19.6%–24.2%, leading to a significant improvement in crop water productivity. Furthermore, under the same decision-making framework, the use of plastic mulching combined with a moderate reduction in irrigation level (irrigation adjustment coefficient reduced from 0.9 to 0.7) further saved approximately 3.6%–9.8% of irrigation water and enhanced water productivity by 4.6%–33.5%. These results confirm the feasibility and advantages of the proposed irrigation decision method for salinized farmland and provide reliable theoretical support and empirical evidence for irrigation management and the development of smart irrigation technologies in arid salinized agricultural regions, with practical significance for advancing precision agriculture.

Keywords: irrigation decision-making; evapotranspiration

How to cite: Bingbing, J. and Zailin, H.: Research on Irrigation Decision-making Method for Salinized Farmland Based on Actual Farmland Water Consumption Monitoring , EGU General Assembly 2026, Vienna, Austria, 3–8 May 2026, EGU26-9361, https://doi.org/10.5194/egusphere-egu26-9361, 2026.

EGU26-15137 | PICO | HS2.2.9

Application of DWAT for inflow estimation in a data-scarce agricultural reservoir 

Seonmi Lee, Cheolhee Jang, Deokhwan Kim, Wonjin Jang, Min-Gi Jeon, and Hyeonjun Kim

Climate change has intensified drought conditions, and various approaches have been developed to ensure stable water supply using reservoirs. In South Korea, many agricultural reservoirs are monitored only in terms of storage (water level), while inflow data are not available. This limitation poses a challenge for developing drought response strategies, highlighting the need for methods to estimate reservoir inflow under data-scarce conditions.

In this study, we propose a methodology for estimating inflow scenarios for agricultural reservoirs using a physically based hydrological model constrained by observed storage (water level) data. As a case study, the Donghwa Reservoir, an agricultural reservoir located in the Seomjin River basin, was selected, and the Dynamic Water Resources Assessment Tool (DWAT) was applied. DWAT is a physically based hydrological model that represents surface water and groundwater processes and is widely used for water resources planning and management.

In the model setup, a prescribed time series of agricultural water withdrawals from May to September was applied, and catchment parameters were adjusted using observed reservoir storage data. The comparison between observed and simulated storage indicates that the model reasonably reproduces the overall variability and statistical characteristics of reservoir storage. However, there are limitations in directly representing artificial operational elements considered in actual reservoir management, such as flood control storage and water intake restrictions. Consequently, larger deviations between observed and simulated storage occurred during periods of extreme drought and flood between 2017 and 2020.

The proposed approach demonstrates the feasibility of estimating inflow scenarios for reservoirs without inflow measurements using a physically based hydrological model and provides a methodological basis for future drought analysis and the development of operational strategies for agricultural reservoirs.

Keyword: DWAT(Dynamic Water resources Assessment Tool), drought, agricultural reservoir, inflow estimation, storage-based calibration

Acknowledgement: This work was supported by Korea Environment Industry & Technology Institute(KEITI) through Aquatic Ecosystem Conservation Research Program, funded by Korea Ministry of Climate, Energy and Environment(MCEE) (RS-2025-02304832).


How to cite: Lee, S., Jang, C., Kim, D., Jang, W., Jeon, M.-G., and Kim, H.: Application of DWAT for inflow estimation in a data-scarce agricultural reservoir, EGU General Assembly 2026, Vienna, Austria, 3–8 May 2026, EGU26-15137, https://doi.org/10.5194/egusphere-egu26-15137, 2026.

EGU26-15611 | ECS | PICO | HS2.2.9

Quantifying Drought Impacts on Reservoir Operations with DWAT: The Obong Reservoir Water Crisis 

Wonjin Jang, Hyeonjun Kim, Cheolhee Jang, Seonmi Lee, Min-Gi Jeon, and Deokhwan Kim

In September 2025, Obong Reservoir(supplying ~87% of the city’s domestic water) in Gangneung-si, South Korea experienced a severe drawdown that triggered citywide rationing. Reported effective storage fell to about 11% on 12 Sep 2025, with the water level near 99.5 m, only 7 m above the implied dead-water line. This case study applies the Dynamic Water Resources Assessment Tool (DWAT) to (i) reproduce the observed 09/2025 drawdown, (ii) diagnose dominant drivers of the low-water crisis, and (iii) quantify the rainfall threshold required for short-term recovery. DWAT is a hydrological modeling framework designed for water-resources assessment across diverse regions worldwide. It allowing detailed characterization of both short- and long-term hydrologic behavior. DWAT represents key processes such as surface runoff, groundwater flow, and human water use (e.g., irrigation and municipal withdrawals), supporting integrated evaluation of water availability and its movement through a watershed.

For reservoir operation, simulations incorporated spillway/outlet/intake characteristics, the stage–area–storage relationship, and time-varying withdrawal data reflecting operational conditions. The simulation period spanned from January 2023 to September 2025, including a one-year warm-up period and the major drought period affecting Gangneung. Results confirm that DWAT accurately reproduces the progressive water-level decline over multiple seasons, the sharp drawdown in late summer 2025, and the transition into the near dead-storage zone in both timing and magnitude. Water-balance diagnostics indicate that the Obong watershed is strongly storage-dependent (surface runoff is less than 3.4%), such that prolonged drought markedly reduces event-driven inflow, depletion of soil moisture and groundwater weakens baseflow support, and continued pumping accelerates reservoir water-level decline. Recovery experiments using the calibrated model show that reservoir stage can return to the normal operating range and that restoration of soil moisture and groundwater storage requires at least ~200 mm of rainfall.

Overall, the DWAT-based drought simulation demonstrates that DWAT is well suited for integrated drought assessment and reservoir operation analysis, providing a practical tool for diagnosing low-water crises and for identifying actionable recovery thresholds that can support emergency response planning and adaptive water-supply management under increasing hydroclimatic variability.

This work was supported by Korea Environment Industry & Technology Institute(KEITI) through Water Management Program for Drought Project, funded by Korea Ministry of Climate, Energy and Environment(MCEE).(2022003610002)


How to cite: Jang, W., Kim, H., Jang, C., Lee, S., Jeon, M.-G., and Kim, D.: Quantifying Drought Impacts on Reservoir Operations with DWAT: The Obong Reservoir Water Crisis, EGU General Assembly 2026, Vienna, Austria, 3–8 May 2026, EGU26-15611, https://doi.org/10.5194/egusphere-egu26-15611, 2026.

EGU26-15934 | ECS | PICO | HS2.2.9

Diagnosing contrasting runoff responses under similar soil moisture conditions using the DWAT model 

Min-Gi Jeon, Hyeonjun Kim, Choelhee Jang, Deokhwan Kim, Wonjin Jang, and Seonmi Lee

Soil moisture is widely used to describe catchment wetness conditions and to support drought-related hydrological interpretation. However, runoff responses under apparently similar soil moisture conditions can differ substantially across catchments and events, suggesting that soil moisture alone may not fully capture the processes controlling runoff generation. This study aims to diagnose the hydrological mechanisms associated with contrasting runoff responses under comparable soil moisture states using the process-based DWAT model. The analysis will use daily catchment-scale DWAT outputs including soil moisture, precipitation, total runoff, baseflow (groundwater flow), recharge, infiltration, and actual evapotranspiration for multiple catchments with contrasting hydrological characteristics. To enable consistent comparison across time, daily soil moisture will be transformed into percentile-based indicators to classify relative soil moisture states without directly implying absolute drought impacts. Runoff response will be quantified using event-based runoff ratios derived from simulated precipitation and discharge, and associated process indicators will be evaluated to interpret differences in runoff behavior. By separating soil moisture state from runoff response and leveraging internal model process variables, this work provides a structured framework to investigate why hydrological responses may diverge under similar dry conditions. The proposed approach is expected to support process understanding relevant for drought analysis and catchment-scale hydrological modeling.

This work was supported by Korea Environment Industry & Technology Institute(KEITI) through Aquatic Ecosystem Conservation Research Program, funded by Korea Ministry of Climate, Energy and Environment(MCEE). (RS-2025-02304832)


How to cite: Jeon, M.-G., Kim, H., Jang, C., Kim, D., Jang, W., and Lee, S.: Diagnosing contrasting runoff responses under similar soil moisture conditions using the DWAT model, EGU General Assembly 2026, Vienna, Austria, 3–8 May 2026, EGU26-15934, https://doi.org/10.5194/egusphere-egu26-15934, 2026.

EGU26-15973 | PICO | HS2.2.9

Component-wise Decomposition of Return Flow in Paddy Fields Based on DWAT Simulations 

Deokhwan Kim, Wonjin Jang, Min-Gi Jeon, Seonmi Lee, Cheolhee Jang, and Hyeonjun Kim

In paddy fields, both rainfall and irrigation water from reservoirs contribute interactively to the hydrological cycle. Quantitative decomposition of return flow based on its source is essential for efficient management of agricultural water. In this study, we employed the Dynamic Water Resources Assessment Tool (DWAT), a physically based semi-distributed model, to simulate major hydrological components in paddy fields including surface runoff, interflow, baseflow, infiltration, evapotranspiration, and water storage and separated them into rainfall and irrigation origin contributions.

The proposed component-wise decomposition framework enables spatio-temporal analysis of each hydrological process and uniquely allows monthly tracking of water storage by origin across soil and groundwater layers, providing a novel approach not explored in previous studies.

This framework can offer diagnostic insight into irrigation efficiency. For example, rapid conversion of irrigation water to surface runoff may indicate hydrological inefficiency, while effective utilization of rainfall implies potential for optimized supply operations. Such source-based decomposition provides a qualitative understanding of irrigation performance that cannot be inferred from return flow ratios alone.

This study can contribute to optimizing the operation of agricultural reservoirs and improving irrigation allocation policies, ultimately enhancing the sustainability of agricultural water use and supporting adaptive water resource management under increasing uncertainties driven by climate change.

This work was supported by Korea Environment Industry & Technology Institute(KEITI) through Aquatic Ecosystem Conservation Research Program, funded by Korea Ministry of Climate, Energy and Environment(MCEE). (RS-2025-02304832)

How to cite: Kim, D., Jang, W., Jeon, M.-G., Lee, S., Jang, C., and Kim, H.: Component-wise Decomposition of Return Flow in Paddy Fields Based on DWAT Simulations, EGU General Assembly 2026, Vienna, Austria, 3–8 May 2026, EGU26-15973, https://doi.org/10.5194/egusphere-egu26-15973, 2026.

According to the standard CSN 75 1400 "Hydrological data of surface waters", M-day discharges are among the basic hydrological data. The Czech Hydrometeorological Institute is responsible for deriving and providing these basic hydrological data.

The objective of the research was to derive basic hydrological data of low flows for description of the hydrological regime, to propose new methodological procedures for deriving basic hydrological data, which include the long-term average discharge Qa and M-day discharges. These data are, among other things, the basis for decision-making of water authorities. Updated information of the hydrological regime will serve to improve planning in the water sector and will contribute to maintain and improve water management as a key commodity for preserving and increasing the quality of life.

The paper presents methodical approaches used to derive basic hydrological data of low flows in the network of water gauging stations in the Czech Republic. Statistical processing used a five-parameter log-normal distribution (LN5), which is essential for accurate representation of extreme values ​​in hydrology. Furthermore, the paper shows the input data that went into the derivation and presents the resulting database of basic hydrological data for unobserved catchments.

How to cite: Kukla, P. and Kourková, H.: Derivation of basic hydrological data (M-day discharges) for the reference period 1991–2020 in the Czech Republic, EGU General Assembly 2026, Vienna, Austria, 3–8 May 2026, EGU26-16389, https://doi.org/10.5194/egusphere-egu26-16389, 2026.

Lake water quality monitoring in India faces a critical paradox—one where sub-daily or daily data needs are only met with sparse, annually available information. The largest publicly available water quality dataset in India is hosted by the Central Pollution Control Board (CPCB), which only provides annual maxima and minima for a few monitored quality parameters, providing no details on their intra-annual variability. To bridge this critical data gap, this analysis attempts to build a Satellite-based Monitoring approach, demonstrated for two India lakes- Lake Nainital, a source water body in Uttarakhand (0.438 km2 area) and Lake Sukhna, a wastewater receiving water body in Chandigarh (1.38 km2 area). Using Sentinel-2 imagery from 2016-2023, we reconstructed water quality values for 11 parameters of interest, including optically active (chlorophyll-a, turbidity, TSS, etc.) and optically inactive (electrical conductivity, fecal bacteria, BOD, etc.), derived on 3 separate grid sizes: 10m*10m, 20m*20m and 30m*30m. For Lake Nainital, lake quality was analysed for a 100m buffer zone around the water intake point and the following analyses were performed

(i) Seasonal Random Forest models were trained with CPCB ground-truth data, achieving promising predictive accuracy. In that, for Lake Nainital, winter served as the optimal period for nutritional monitoring with R2 values exceeding 0.9, whereas temperature prediction was most accurate in the monsoon (R2=0.93).  Fecal coliform demonstrated remarkable accuracy in summer (R2=0.90), in stark contrast to its diminished performance during the monsoon (R2=0.80). Sukhna exhibited contrasting seasonal dependencies: temperatures peaked in summer (R2=0.81), while electrical conductivity spiked in winter (R2=0.90). Also, BOD prediction enhanced significantly from summer (R2=0.66) to winter (R2=0.91).

(ii) Using Modified Robust Principal Component Analysis (MRPCA) Lake Naintial successfully diagnosed a single-factor dominance to multi-stressor complexity, e.g., during the COVID-19 pandemic in 2020 anthropogenic pressures temporarily eased then resurged with altered patterns. Further, the chronic nutrient impairment of Lake Sukhna was also diagnosed using this approach.


The advantages of the proposed satellite-based lake monitoring approach are significant- allowing water treatment plant operators to seasonally forecast coagulant demand fluctuations. This novel satellite-to-tap approach demonstrates an alternative future for water quality monitoring-one which need not rely on extensive grab sampling or sensor-based data as inputs. It also allows regulatory monitoring of chronically impaired lakes of the country and monitoring the upkeep of restored and rejuvenated lakes.

How to cite: Suchetana, B. and Nag, S.: Development of a Satellite-based Monitoring Approach for Augmenting Open-source Indian Lake Water Quality Datasets with Seasonal Information, EGU General Assembly 2026, Vienna, Austria, 3–8 May 2026, EGU26-17803, https://doi.org/10.5194/egusphere-egu26-17803, 2026.

EGU26-20395 | ECS | PICO | HS2.2.9

Update of a regional groundwater model using an ensemble-based approach 

Cécile Coulon, Pierre Le Cointe, Nadia Amraoui, and Pascal Audigane

A groundwater model of the Tarn-et-Garonne department in southern France was updated and recalibrated using an ensemble-based approach to support short- to medium-term groundwater level forecasting. The model uses the MARTHE finite-difference groundwater modeling software (developed by the BRGM) to simulate groundwater flow, stream-aquifer interactions and groundwater and surface water withdrawals in a Quaternary alluvial aquifer system.  The model was originally developed to support local groundwater management and define allowable groundwater abstraction volumes. It was later coupled with the SURFEX land surface model (developed by the CNRM) and integrated into Aqui-FR, a French hydrometeorological modeling platform that provides groundwater level forecasts at a national scale. The model was last calibrated using data through 2015 and a trial-and-error approach. The update incorporated ten additional years of groundwater level, stream flow and pumping data, along with the latest recharge and surface runoff estimates generated by the SURFEX model. History matching then was performed using an iterative ensemble smoother to generate an ensemble of posterior parameter realizations that honor both expert knowledge and observed groundwater levels and stream flows. Using the posterior parameter ensemble, the uncertainty in various predictions of interest, including groundwater levels and standardized piezometric level indices, was evaluated at multiple locations across the study area. All analyses were implemented using a fully scripted workflow to facilitate future model updates and deployment of the workflow in other areas.

How to cite: Coulon, C., Le Cointe, P., Amraoui, N., and Audigane, P.: Update of a regional groundwater model using an ensemble-based approach, EGU General Assembly 2026, Vienna, Austria, 3–8 May 2026, EGU26-20395, https://doi.org/10.5194/egusphere-egu26-20395, 2026.

EGU26-3452 | Posters on site | HS2.2.10

Can water table and thermal regimes in boreal peatlands recover temporal dynamics in a decade after restoration? 

Xiao Lu, Lassi Päkkilä, Aleksi Räsänen, Anna-Kaisa Ronkanen, and Hannu Marttila

Peatland restoration is increasingly implemented as a nature-based solution to recover ecosystem functions degraded by historical drainage, yet the temporal dynamics of hydrological and thermal recovery remain poorly understood, particularly at fine time scales. This study investigates the effects of restoration on water table (WT) and porewater temperature (Tpw) using high-resolution (30-min) data across 43 boreal peatlands in Finland, including drained, restored, and pristine sites, based on a long-term before-after control-impact experiment. Wavelet coherence analysis is applied to examine the temporal similarity between restored and pristine sites in terms of WT and Tpw dynamics across hourly to monthly scales.

Our results show that restoration significantly increases the global wavelet coherence of WT across all time scales, with the strongest recovery observed at daily and longer scales. However, WT coherence at sub-daily scales remains low, indicating incomplete recovery of short-term hydrological buffering. In contrast, Tpw dynamics show limited restoration effects, with significant coherence increases only at monthly scales. Differences in restoration response are evident among peatland types and trophic levels, with open mires and intermediate-nutrient sites exhibiting the highest post-restoration WT coherence. Temporal analysis reveals a gradual increase in WT coherence over the first six years post-restoration, followed by stabilization, while Tpw coherence remains variable. These findings highlight the importance of multi-scale temporal analysis in evaluating restoration success and underscore the need for long-term monitoring to capture the full trajectory of hydrological recovery in peatlands.

How to cite: Lu, X., Päkkilä, L., Räsänen, A., Ronkanen, A.-K., and Marttila, H.: Can water table and thermal regimes in boreal peatlands recover temporal dynamics in a decade after restoration?, EGU General Assembly 2026, Vienna, Austria, 3–8 May 2026, EGU26-3452, https://doi.org/10.5194/egusphere-egu26-3452, 2026.

EGU26-6607 | ECS | Posters on site | HS2.2.10

Historical Patterns of Snow Drought in Fennoscandia: 1980-2022  

Sahra Parvin, Hannu Marttila, Elizabeth Carter, and Masoud Irannezhad

Snow drought is characterized by an abnormally low snowpack, resulting generally from reduced precipitation, warmer surface air temperature (SAT), or a combination of both. However, there is still a limited understanding of how snow drought patterns change across space and time. Hence, this study investigates the influence of precipitation and SAT on the spatio-temporal patterns of snow droughts in Fennoscandia during 1980-2022. In general, the results show strong spatial variations in dry (reduced precipitation) and warm (elevated SAT) snow drought types across Fennoscandia over time. Dry snow droughts were more frequent in northern and mountainous parts of Fennoscandia, indicating that precipitation deficits are the primary driver under persistent cold conditions. In contrast, warm snow droughts were more spatially extensive, affecting both northern and southern regions, and showing considerably higher frequencies in coastal zones and lower-latitude areas. This sheds particular light on the increasing occurrence of SAT-driven snow droughts across Fennoscandia. These findings indicate a transition from precipitation-driven snow droughts in high-latitude regions to SAT-driven events in southern and maritime areas in response to global warming and climate change. Accordingly, this study lays a solid foundation for developing climate-adaptive water resources management strategies in Fennoscandia, where snowpack plays a crucial role in water security and regional sustainable development.

How to cite: Parvin, S., Marttila, H., Carter, E., and Irannezhad, M.: Historical Patterns of Snow Drought in Fennoscandia: 1980-2022 , EGU General Assembly 2026, Vienna, Austria, 3–8 May 2026, EGU26-6607, https://doi.org/10.5194/egusphere-egu26-6607, 2026.

EGU26-7330 | ECS | Posters on site | HS2.2.10

When Physics Meets Machine Learning for Nowcasting of Hydrological Sensors Fault Detection  

Farid Mousavi, Ali Torabi Haghighi, Jari Silander, Mehdi Monemi, and Mehdi Rasti

Urban flood monitoring requires timely and dependable decisions in fast-evolving, partially observed settings. Sensor-network faults can degrade awareness and delay response, with substantial human and economic consequences. We introduce a Nowcasting Physics-Informed (NPI) framework for detecting faults in streamflow sensors using a 100-min sliding window sampled every 2 min. The approach combines measured sensor signals with outputs from the Storm Water Management Model (SWMM), forms a fused feature set, and feeds it to a stacked long short-term memory (LSTM) model to estimate the probability of a fault at the end of each window. We assess the benefit of coupling physical-model information with data-driven learning by comparing non-physics baselines. Over five cross-validation folds, the physics-informed fusion improves F1 by 3.7 to 12.5 percentage points, raising performance from 0.75 for a data-only LSTM to 0.88 for the complete NPI model. The pipeline is causal, yields auditable predictions via explicit physical features, and generates binary alerts that operators can use directly. Overall, the method offers a practical blueprint for robust warning systems that maintain performance under unseen conditions.

How to cite: Mousavi, F., Torabi Haghighi, A., Silander, J., Monemi, M., and Rasti, M.: When Physics Meets Machine Learning for Nowcasting of Hydrological Sensors Fault Detection , EGU General Assembly 2026, Vienna, Austria, 3–8 May 2026, EGU26-7330, https://doi.org/10.5194/egusphere-egu26-7330, 2026.

EGU26-7978 | Posters on site | HS2.2.10

Ecosystem-level Monitoring of Environmental Impact after Peatland Rewetting 

Hannu Marttila, Annalea Lohila, Maarit Liimatainen, Anna-Kaisa Ronkanen, and Heini Postila and the VISIO project team for Turvesuo-Miehonsuo

We introduce a comprehensive observation and measurement framework designed to monitor ecosystem-level changes in a former peat extraction area using advanced instrumentation and digitalisation tools. This system aims to deliver accurate scientific data to support peatland management decisions and provide reference measurements for carbon emission calculations in the land use sector. In Finland, peat extraction for energy is being phased out as part of the green transition. Former extraction sites are commonly restored through rewetting, yet the short- and long-term impacts on water quality, greenhouse gas (GHG) emissions, and terrestrial and aquatic ecosystems remain poorly understood. To address this knowledge gap, we have established an intensive monitoring site at the Turvesuo–Miehonsuo peat extraction area in the Sanginjoki catchment near Oulu, Finland. Peat extraction ended in 2023, and rewetting is planned for 2025–2026. Our monitoring integrates online and cloud-based data transfer, model input, and visualisation from: 1) continuous high-frequency water quality and aquatic gas measurements, 2) eddy covariance and chamber-based GHG flux monitoring, 3) drone surveys for spatial variability assessment, 4) hydrological monitoring of surface and groundwater, 5) microbial and algal community analyses, and 6) detailed vascular plant and bryophyte inventories. This approach will provide a robust dataset for evaluating the environmental impacts of peatland rewetting using latest technological advances.

How to cite: Marttila, H., Lohila, A., Liimatainen, M., Ronkanen, A.-K., and Postila, H. and the VISIO project team for Turvesuo-Miehonsuo: Ecosystem-level Monitoring of Environmental Impact after Peatland Rewetting, EGU General Assembly 2026, Vienna, Austria, 3–8 May 2026, EGU26-7978, https://doi.org/10.5194/egusphere-egu26-7978, 2026.

EGU26-9308 | ECS | Posters on site | HS2.2.10

Detection of Groundwater–surface water Contributions in a Subarctic Stream using Distributed Temperature Sensing, Topographic Indices, and Spatial Hydrological Model 

Parsa Parvizi, Hannu Marttila, Samuli Launiainen, Pertti Ala-aho, Jari-Pekka Nousu, Danny Croghan, and Ilkka Martinkauppi

Groundwater (GW) seepage into streams plays a crucial role in sustaining streamflow and regulating thermal regimes in boreal and arctic headwaters. However, spatial variation of seepage and interactions with the stream network remain difficult to observe, especially in snow-dominated catchments with seasonal freezing. This study used high-resolution distributed temperature sensing (DTS) to identify groundwater and surface-water contributions along a sub-arctic headwater stream in northern Finland. Stream temperature was continuously monitored at 2 m spatial and 30 min temporal resolution over a 2 km reach. Seasonal slope-based thermal patterns were used to distinguish stream sections dominated by groundwater inflow. In addition, melt-active nights with observed snow cover and elevated stream discharge were used to capture surface and near-surface inputs to the stream. These DTS-derived signals were compared with commonly used terrain-based predictors, including upslope contributing area (UCA) and topographic wetness index (TWI), as well as with lateral inflow simulations from the SpaFHy-2D hydrological model. The results show that topography-based indices captured broad-scale surface convergence but failed to consistently identify local groundwater discharge zones. SpaFHy-2D reproduced the general distribution of major groundwater-influenced reaches but shows local mismatches, particularly in esker-controlled sections. This study highlights the value of in-stream temperature observations and hydrological modeling for detecting groundwater–surface water interactions in cold-region, where strong seasonality and snow-dominated hydrology limit traditional field methods.

How to cite: Parvizi, P., Marttila, H., Launiainen, S., Ala-aho, P., Nousu, J.-P., Croghan, D., and Martinkauppi, I.: Detection of Groundwater–surface water Contributions in a Subarctic Stream using Distributed Temperature Sensing, Topographic Indices, and Spatial Hydrological Model, EGU General Assembly 2026, Vienna, Austria, 3–8 May 2026, EGU26-9308, https://doi.org/10.5194/egusphere-egu26-9308, 2026.

EGU26-9698 | Orals | HS2.2.10

Multi-source approach for reach scale river bed modeling - a case study on Rambla de la Viuda 

Antero Kukko, Harri Kaartinen, Petteri Alho, Ville Kankare, Mikel Calle, and Gerardo Benito

Understanding river channel changes induced by floods is crucial for effective flood risk management, as floods dramatically reshape rivers through erosion and deposition impacting infrastructure and ecosystems. Factors like landslide-channel interactions, channel confinement or human induced channel modifications (e.g. sediment extraction) significantly amplify flood risks. Predicting future hazards with this knowledge helps manage development in floodplains, design better flood defenses, and adapt to climate change impacts on river systems.

Thus, we need efficient methods for monitoring the dynamics of the river channel, especially after flood events. Also, as use of Digital Twins is emerging for river management, ability to update the 3D topography of the river Digital Twin rapidly becomes a necessity. Mobile laser scanning (MLS) technology offers a way of direct 3D measurements of the environment, regardless of ambient light. We have developed and tested multi-platform mobile laser scanning (MLS) systems for riverine environment mapping for more than a decade, including deployments since 2012 at the Rambla de la Viuda in Spain. Rambla de la Viuda is an ephemeral  gravel bed channel that remains dry for most of the year, but infrequent flash floods can significantly reshape its geomorphology. During the past years such flooding occasions have become more frequent and powerful, not forgetting the extreme flooding in October 2024.

Three different laser scanning systems were used to obtain 3D point cloud data of the dry river bed in Rambla de la Viuda after a major flood event in March 2025. A 8 km long reach of the river channel was scanned for the first time with drone operated laser scanning system (Riegl VUX-120 scanner and NovAtel CPT7 GNSS-IMU navigation system), and smaller parts of the channel were scanned with two different backpack systems: commercial SLAM system Faro Orbis and FGI developed Akhka system with Riegl miniVUX-3 scanner and NovAtel Pwrpak 7/ISA-100C GNSS-IMU navigation system.

In addition to the aforementioned data acquisition, we have collected time series data of the same area with backpack and ATV based MLS systems in years 2012, 2013, 2016 and 2019, and we present some examples of change in selected parts of the reach.

We compare the operability of these systems, and their feasibility for detailed river bed topography mapping in terms of area coverage, level of detail and ease of operation. Time series data is used for change detection, i.e. erosion and deposition, examples of which are depicted discussed in the presentation.

How to cite: Kukko, A., Kaartinen, H., Alho, P., Kankare, V., Calle, M., and Benito, G.: Multi-source approach for reach scale river bed modeling - a case study on Rambla de la Viuda, EGU General Assembly 2026, Vienna, Austria, 3–8 May 2026, EGU26-9698, https://doi.org/10.5194/egusphere-egu26-9698, 2026.

Ice cover significantly alters river flow dynamics by introducing friction at the ice-water interface, shifting the high-velocity core closer to the riverbed, and modifying shear forces that influence sediment transport. Climate change further complicates these processes as winter base flow increases and ice conditions change. Rising temperatures reduce the extent and stability of river ice, making discharge patterns more variable and impacting under-ice sediment transport processes. Therefore, real-time, continuous monitoring of under-ice flow and sediment dynamics is essential. As part of an experimental study, a new measurement approach was tested against the traditional, labour-intensive method in a Finnish river under mid-winter conditions. Instead of conventional cross-sectional stationary measurements taken from ice-auger holes at one-metre intervals once or twice per winter, the new approach used side-looking acoustic Doppler sensors mounted on aluminium frames, with three sensors per frame evenly spaced. These frames were placed vertically into the river along the outer bank through large holes in the ice. This enabled the sensors to measure flow across the entire horizontal cross-section and at three depths: near the ice surface, mid-water column, and near the riverbed. The sensors remained in the river for several weeks, continuously recording under-ice flow and sediment transport conditions. This pilot deployment aimed to assess whether these sensors could replace the conventional method for long-term,  enable continuous monitoring of under-ice flow conditions and possibly reveal previously unresolved temporal variability in under-ice hydraulics and sediment transport, including short-lived flow pulses, vertical velocity redistribution, and event-scale sediment mobilisation that are not captured by episodic winter measurements. Traditional cross-sectional measurements were conducted at sensor locations to compare flow dynamics, data accuracy and spatiotemporal resolution. The results will help evaluate the feasibility of continuous hydrological monitoring in ice-covered conditions, which remains challenging today.

How to cite: Blåfield, L. and Alho, P.: From Intermittent Observations to Continuous Monitoring: Advancing Under-Ice River Flow Measurements, EGU General Assembly 2026, Vienna, Austria, 3–8 May 2026, EGU26-9969, https://doi.org/10.5194/egusphere-egu26-9969, 2026.

EGU26-13323 | Orals | HS2.2.10

Spatial modeling of the vulnerability-resilience-sustainability nexus in complex socio-hydrological system 

Carlos Gonzales-Inca, Elina Kasvi, and Petteri Alho

Water resources management has evolved from traditional monofunctional approaches toward integrated water resources management, aiming to better understand and represent the complex interactions between social and hydrological components. These interactions form a coupled and dynamic socio-hydrological system. Significant advances have been made in developing concepts and theories related to socio-hydrological systems, sustainable water resources management, resilience enhancement, restoration, and vulnerability assessment.

In cold environments, substantial climate variability occurs, and the effects of climate change have shown strong impacts on catchment hydrology and biogeochemistry. At the same time, several policy initiatives and legal frameworks have been implemented in recent years—such as the EU Water Framework Directive (WFD) and the European Green Deal—to improve freshwater protection and achieve good ecological status. Furthermore, changes in agricultural practices, including fertilization, drainage, and cropping systems, are observed at the local scale. Consequently, these system properties exhibit strong spatial and temporal variability. Assessing such variability requires advanced and objective indicators based on reliable, continuous data and information to describe the different properties of the system.

Recent advances in physics-based and AI-based hydrological modeling enable more accurate and spatially distributed representations of hydrological processes and patterns. These models can provide richer data and insights for the quantitative assessment of the vulnerability–resilience–sustainability nexus in socio-hydrological systems. This study presents a case study of two managed catchments in southern Finland, using the process-based SWAT+ model in combination with Python-based composite indicators to spatially assess vulnerability, resilience, and sustainability within the socio-hydrological system, thereby providing tools to support green and digital transitions in water resources management.

How to cite: Gonzales-Inca, C., Kasvi, E., and Alho, P.: Spatial modeling of the vulnerability-resilience-sustainability nexus in complex socio-hydrological system, EGU General Assembly 2026, Vienna, Austria, 3–8 May 2026, EGU26-13323, https://doi.org/10.5194/egusphere-egu26-13323, 2026.

EGU26-15218 | ECS | Posters on site | HS2.2.10

Geostatistical interpolation methods to create robust bathymetric surfaces across the USACE dredging portfolio 

William Caldwell, Elizabeth Carter, and Magdalena Asborno

The United States Corps of Engineers (USACE) maintains over 30,000 km (25,000 mi) of coastal and inland waterways to ensure safe navigation for commercial, recreational, and military traffic. The USACE leverages hydrographic surveying with SONAR echosounders to generate bathymetric surfaces used to identify where and how much material needs removal for channel maintenance. Bathymetric survey data is archived within the USACE eHydro database. However, since these hydrographic survey operations are contracted externally, the data retained have discrepancies impacting end-use cases (e.g., single-beam vs. dual-beam echosounders, survey density, projection system). For operational use in hydrologic and hydrographic applications, SONAR data must be reprocessed into a standard raster data format. Since small errors in bathymetric surface estimation can translate to economically impactful sediment volumes, robust surface generation and uncertainty quantification is crucial.

The USACE currently uses Triangulated Irregular Networks (TIN) as the default surface generation algorithm; this deterministic method has limited capability to capture spatial correlation structure in SONAR data. This study compares bathymetric surfaces created with TIN, Nearest Neighbor (NEAN), and Natural Neighbor (NATN) interpolation and two robust geostatistical interpolation methods—isotropic Ordinary Kriging (OK), and isotropic Regression Kriging (RK) based on spline trend residuals, with a goal of creating an automatic SONAR-to-bathymetric surface data processing pipeline.

The analysis uses 100 independent SONAR surveys collected from across the USACE civil works districts representing diverse spatial extents, sampling densities, and channel morphologies. 10-foot spatial resolution bathymetric surfaces are generated using each of the five interpolation methods for each SONAR dataset. To ensure reproducible kriging models for OK and RK approaches, multiple empirical semivariogram shape functions were fit using a weighted least squares solution with final shape function selection based on maximum Coefficient of Determination. A 5-fold cross-validation using Root Mean Squared Error (RMSE) selects the optimal spline trend surface for RK.

Once bathymetric surfaces are generated, a 10-fold cross-validation scheme for each SONAR dataset compares the five interpolation methods. Normalized Median Absolute Deviation (NMAD) and RMSE assess each method’s accuracy across all surveys. Across the 100 surveys, the OK approach proved best, yielding a 39.1% and 54.6% decrease in RMSE and NMAD, respectively, compared to TIN. The RK approach produced 8.1% decrease in RMSE and 31.4% decrease in NMAD compared to TIN. Conversely, neighbor-based approaches produced worse bathymetric surfaces with a 15.0% increase in RMSE and 5.2% increase in NMAD for the NEAN approach, and an 11.1% increase in RMSE and 11.3% increase in NMAD for the NATN approach.

The preliminary results of the study indicate the importance of accounting for spatial autocorrelation between points in generating accurate bathymetric surface estimates with unbiased uncertainty. Simple deterministic interpolation (TIN) cannot reliably account for complex topography that manifests from dredging and tidal response. However, methods modeling semivariance across the dataset (OK and RK) can account for spatial structure to better model seabed morphologies. In practice, employing geostatistical methods to generate accurate bathymetric surfaces could improve coastal morphological modeling and dredge planning.

How to cite: Caldwell, W., Carter, E., and Asborno, M.: Geostatistical interpolation methods to create robust bathymetric surfaces across the USACE dredging portfolio, EGU General Assembly 2026, Vienna, Austria, 3–8 May 2026, EGU26-15218, https://doi.org/10.5194/egusphere-egu26-15218, 2026.

EGU26-15890 | Orals | HS2.2.10

Capturing the geomorphological change of a sub-arctic riverbank through unique long term terrestrial laser scanning time series 

Ville Kankare, Linnea Blåfield, Vertti Markkanen, Karoliina Lintunen, Harri Kaartinen, Antero Kukko, Elina Kasvi, and Petteri Alho

Riverbank erosion and deposition are fundamental drivers of fluvial geomorphological change yet their long-term interannual dynamics remain poorly quantified at high spatial resolutions, particularly in sub-arctic environments. Existing studies typically rely on short monitoring periods or coarse-resolution remote sensing data, limiting the ability to resolve interannual variability, cumulative change, and the influence of hydroclimatic extremes. This study addresses these limitations by exploiting a unique over a decade long time series of high-resolution terrestrial laser scanning (TLS) point cloud data collected from the Pulmanki River in northern Finland. The main aims of this research are (1) to quantify the decadal riverbank erosion and deposition, and their interannual variability, (2) to investigate the key drivers of the observed geomorphic change, and (3) to evaluate how effectively long-term TLS data can capture these changes and their controlling mechanisms.

The study focuses on a single 18 meters high bank on one compound asymmetric meander bend of the Pulmanki River, where the experimental design was initially established already in 2012. The surface angle of the bank is 36° at the apex and it consists of horizontally bedded fluvio-lacustrine sediments. Annual TLS point cloud data have been collected using Riegl VZ-400i laser scanner, with consistent data acquisition geometry and robust georeferencing using real time kinetic global navigation satellite system (RTK-GNSS) measured reference points. Point cloud data have been acquired from the riverbank during spring and autumn field campaigns, enabling the assessment of both interannual and decadal-scale changes. Point cloud data were collected using multiple scanning locations and merged into a composite point cloud to ensure comprehensive data of the whole riverbank at centimeter-scale resolution. Three-dimensional geomorphic change will be quantified using a direct point cloud to point cloud comparison while accounting for surface orientation and measurement uncertainty. This will enable detection of both gradual bank retreat and episodic mass failures, as well as localized sediment accumulation. Particular emphasis is placed on the uncertainty quantification, including levels of detectable change and the robustness of volumetric erosion and deposition estimates over long monitoring periods. Finally, to investigate and interpret the drivers of the observed geomorphic change and its variability, long-term auxiliary information of river flow characteristics (using acoustic doppler current profiler, ADCP) and water level collected during field surveys together with climatic data (e.g., precipitation and temperature) will be analyzed.

How to cite: Kankare, V., Blåfield, L., Markkanen, V., Lintunen, K., Kaartinen, H., Kukko, A., Kasvi, E., and Alho, P.: Capturing the geomorphological change of a sub-arctic riverbank through unique long term terrestrial laser scanning time series, EGU General Assembly 2026, Vienna, Austria, 3–8 May 2026, EGU26-15890, https://doi.org/10.5194/egusphere-egu26-15890, 2026.

EGU26-16563 | ECS | Posters on site | HS2.2.10

Climate-driven extreme winter thaw triggers summerlike microbial activity in a subarctic stream 

Kaisa-Riikka Mustonen, Hannah Bailey, Danny Croghan, Kaisa Lehosmaa, Jonna Tauriainen, Pertti Ala-Aho, Hannu Marttila, Valtteri Hyöky, and Jeffrey Welker

Winter remains the most understudied season across northern latitudes, despite its growing importance in the context of rapid warming of the north. Winters are changing, for example, via processes related to the Arctic water cycle, such as increased rainfall and extreme temperature fluctuations, which disrupt the previously more predictable hydrological regime of northern stream systems. We show how a large panarctic scale climate-driven winter event triggered biological activity in a typical subarctic stream at the Pallas Atmosphere-Ecosystem Supersite in northern Finland. By using simultaneous high-frequency measurements of water vapor, precipitation, and stream water isotopes, along with water chemistry, discharge, and bacterial community attributes, we captured two exceptionally warm Atlantic air intrusion events in early winter 2020–2021. These two closely spaced rain-on-snow events caused complete snowpack melt and triggered a high discharge and dissolved organic carbon pulse in our study stream, which in turn reactivated the already receding summer-like aquatic bacterial community and initiated their primary production despite the prevailing cold and dark conditions. Our findings reveal how large-scale climate anomalies can abruptly disrupt local-scale hydrology and trigger biological activity in wintering stream ecosystems, highlighting the sensitivity of aquatic ecosystems and biogeochemical processes to shifting weather and climate patterns. Capturing this event underscores the need for continuous high-frequency observations that span seasons and years. Overall, this study reinforces winter as a critical season for ecological research and reveals the vulnerability and responsiveness of northern stream ecosystems to climate change.

How to cite: Mustonen, K.-R., Bailey, H., Croghan, D., Lehosmaa, K., Tauriainen, J., Ala-Aho, P., Marttila, H., Hyöky, V., and Welker, J.: Climate-driven extreme winter thaw triggers summerlike microbial activity in a subarctic stream, EGU General Assembly 2026, Vienna, Austria, 3–8 May 2026, EGU26-16563, https://doi.org/10.5194/egusphere-egu26-16563, 2026.

EGU26-16726 | ECS | Orals | HS2.2.10

Learning-assisted InSAR DEM Enhancement for High-Resolution, Terrain-Aware Hydrologic Digital Twins 

Muhammad Farhan Humayun, Getnet Demil, Tomi Westerlund, Mourad Oussalah, and Jukka Heikkonen

Accurate Digital Elevation Models (DEMs) at high spatial resolution are a critical prerequisite for terrain-aware hydrologic Digital Twins, where topographic errors directly compromise flow routing, inundation mapping, and hazard prediction. Within the scope of hydrologic digitization, improving the reliability of DEMs derived from spaceborne Interferometric Synthetic Aperture Radar (InSAR) remains a key challenge.

InSAR is a widely used technique for DEM generation, which exploits phase differences and coherence information from two or more SAR acquisitions. While spaceborne InSAR enables large-scale and weather-independent observations, its performance is strongly constrained by sensor geometry, temporal and perpendicular baselines, and surface dynamics. In particular, coherence degradation caused by vegetation cover, soil moisture variability, atmospheric effects, and the presence of wetlands or water bodies leads to noisy interferograms and reduced DEM accuracy in hydrologically relevant environments.

This study investigates a learning-assisted InSAR framework to enhance interferometric data quality and mitigate coherence-related limitations in SAR-derived DEMs. Deep learning based generative and representation-learning models, including diffusion models, generative adversarial networks, and variational autoencoders, are evaluated to support coherence enhancement and artifact suppression in SAR image pairs. The learning components are integrated with established InSAR processing pipelines to improve interferometric phase stability and DEM quality without compromising the physical consistency of the interferometric observables.

Our methodology leverages daily repeat-track ICEYE and bistatic TerraSAR-X/TanDEM-X satellite acquisitions, with high-resolution reference DEMs from the National Land Survey of Finland enabling robust validation beyond open global DEM products. Initial experiments using Sentinel-1 image pairs show consistent improvements in interferogram quality and spatial coherence patterns relative to baseline InSAR processing, particularly in vegetated and mixed land-cover areas affected by decorrelation. Quantitative aspect of the methodology focuses on improvements in interferogram quality, elevation accuracy, and uncertainty patterns relevant for hydrologic Digital Twin applications. The workflow is designed for scalability across different SAR sensor configurations.

By addressing coherence limitations through the integration of physics-aware deep learning with InSAR pipelines, this work aims to enable more reliable, high-resolution DEM generation for terrain-sensitive hydrologic Digital Twins within the Digital Waters (DIWA) framework.

How to cite: Humayun, M. F., Demil, G., Westerlund, T., Oussalah, M., and Heikkonen, J.: Learning-assisted InSAR DEM Enhancement for High-Resolution, Terrain-Aware Hydrologic Digital Twins, EGU General Assembly 2026, Vienna, Austria, 3–8 May 2026, EGU26-16726, https://doi.org/10.5194/egusphere-egu26-16726, 2026.

EGU26-17002 | Posters on site | HS2.2.10

The I-DT Hydro Framework: Immersive Digital Twin Platforms for Hydrologic Systems 

Siamak Bazzaz, Elizabeth Carter, Mehdi Rasti, and Bjørn Kløve

Immersive digital twin platforms are emerging as a key paradigm for advancing the understanding and management of hydrologic systems, by integrating interfaces and workflows within a unified conceptual architecture. This contribution presents the I-DT Hydro Framework, a conceptual model that defines the core components, interactions, and design principles of immersive digital twin platforms for water resources applications. The framework functions as a human-facing integration layer for a hydrologic digital twin architecture that includes data integration, multi-scale modeling, and simulation pipelines, continuously supported by real-time monitoring from remote sensing, in-situ observations, and crowdsourced data, and made accessible through immersive and interactive interfaces. A central element of the I-DT Hydro Framework is the role of immersive interfaces, enabled through extended reality (XR), which mediates between complex computational processes and human interpretation and decision-making. Hydrologic systems and the models used to represent them are inherently complex and often inaccessible to non-specialist users. Immersive experiences provide a new method for decision-makers with diverse domain expertise to access, explore, and interpret the knowledge generated by hydrologic data and models. The framework further illustrates how hybrid modeling and machine learning can be embedded within autonomous pipelines to support adaptive decision support systems under dynamic environmental conditions. By explicitly linking platform layers, workflows, and user interaction, the I-DT Hydro Framework provides a shared reference for the design and evaluation of immersive digital twin platforms, supporting scalability, interoperability, and stakeholder engagement in hydrologic digitization.

How to cite: Bazzaz, S., Carter, E., Rasti, M., and Kløve, B.: The I-DT Hydro Framework: Immersive Digital Twin Platforms for Hydrologic Systems, EGU General Assembly 2026, Vienna, Austria, 3–8 May 2026, EGU26-17002, https://doi.org/10.5194/egusphere-egu26-17002, 2026.

EGU26-17115 | ECS | Orals | HS2.2.10

Interoperability Strategies for Process-Based Models in Digital Water Twins: An Architectural and Framework-Based Synthesis 

Abubaker Omer, Debasish Pal, Jan Olsman, Elizabeth Carter, and Harri Koivusalo

Digital Water Twins (DWTs) are increasingly adopted to support sustainable and efficient management of complex water systems. While process-based models form the analytical core of the DWTs, the literature lacks a coherent, model-centric synthesis that links DWT architectures and operational objectives to explicit interoperability requirements and systematic framework evaluation. Here we synthesize the literature to distil interoperability requirements for process-based models within multi-scale DWT architectures and to evaluate established interoperability frameworks (i.e., BMI/CSDMS, OpenMI, HydroCouple, ESMF and OMS3) against operational demands. The synthesis identifies core interoperability requirements for process-based DWTs, including semantic consistency, modular coupling, coordinated time–space execution, operational robustness, and traceability.  Comparative analysis shows that framework suitability is primarily determined by where coupling and semantics sit in the DWT architecture. BMI/CSDMS favours rapid model wrapping and flexible model–data exchange. OpenMI and HydroCouple support tighter, time-synchronized and spatially explicit coupling, making them suitable for operational and high-performance contexts. ESMF excels at parallel coupling and regridding for Earth-system–scale applications but requires substantial integration effort. OMS3 is best suited to modular, calibration-focused workflows, with more limited applicability to spatially detailed or HPC-driven models. Consistent with these trade-offs, application studies continue to rely on ad-hoc pipelines, while successful large-scale initiatives converge on layered interoperability strategies that combine lightweight interfaces, targeted runtime couplers, and platform services. These syntheses establish a model-centric evaluation basis for selecting and combining interoperability frameworks and provide actionable guidance for designing scalable, robust, and decision-relevant DWTs.  


Acknowledgement

This research has been conducted with Flagship Programme funding granted by the Research Council of Finland for Digital Waters Flagship (decision no. 359248).

How to cite: Omer, A., Pal, D., Olsman, J., Carter, E., and Koivusalo, H.: Interoperability Strategies for Process-Based Models in Digital Water Twins: An Architectural and Framework-Based Synthesis, EGU General Assembly 2026, Vienna, Austria, 3–8 May 2026, EGU26-17115, https://doi.org/10.5194/egusphere-egu26-17115, 2026.

EGU26-17470 | Orals | HS2.2.10

Hybrid Numerical–Machine Learning Framework for Predicting Aquifer Drainage 

Sami Ghordoyee Milan, Mehdi Rasti, and Ali Torabi Haghighi

The amount of drainage from the aquifer is one of the most important components of the groundwater balance in aquifers situated in humid and extremely humid climates. To manage groundwater and modify the groundwater balance, modeling this interaction is essential. However, it has rarely been taken into consideration thus far, and no comprehensive approach has been put out due to the complexity of simulating and forecasting the two systems. There are two methods for draining the amount of drainage from the aquifer: in the first, a portion of the river serves as a natural drain. In the second, artificial drains are excavated to a depth of one to three meters to regulate the amount of groundwater rise. It regulates groundwater levels, keeps agricultural areas from draining, stops land salinization and groundwater contamination, and shields plant roots.  Based on the outcomes of numerical modeling, machine learning models can forecast the amount of drainage from the aquifer. This strategy led to the development of a numerical modeling and machine learning method that simulates the drainage system and aquifer and then estimates drainage from the aquifer. The Guilan Plain in northern Iran was used to evaluate such an approach. The drainage-aquifer system was simulated using MODFLOW in GMS software. The drained amount of the aquifer was then predicted using Gaussian process regression (GPR), a probabilistic and Gaussian machine learning technique. Features such as surface recharge, groundwater level, topography, and aquifer discharge were extracted from the simulated model and later used as inputs to machine learning models to predict the amount of aquifer drainage. The MODFLOW simulation's results showed that drains discharge a significant quantity of groundwater each year, which could not be disregarded when evaluating the groundwater balance. In addition, GPR performed the best in predicting the volume of aquifer drainage with RMSE, MAE, and NSE of 1.772 thousand cubic meters per month, 0.70 thousand cubic meters per month, and 0.78, respectively. The proposed approach can be investigated in other comparable locations to forecast the amount of aquifer draining and modify the groundwater balance based on the results obtained.

How to cite: Ghordoyee Milan, S., Rasti, M., and Torabi Haghighi, A.: Hybrid Numerical–Machine Learning Framework for Predicting Aquifer Drainage, EGU General Assembly 2026, Vienna, Austria, 3–8 May 2026, EGU26-17470, https://doi.org/10.5194/egusphere-egu26-17470, 2026.

EGU26-17695 | ECS | Orals | HS2.2.10

Adaptive geospatial data search engine for river basin observation systems 

Maksym Vasiuta and Ville Mäkinen
River basins hold special interest and challenge in the Earth observation and digital twin designs. Given the complexity of these natural systems, multi-modal and multi-spectral measurements with high resolutions are needed to describe their state. In the MultiGIS4Rivers project, we have three measurements sites at different river systems: the Baixada Maranhense (Brazil), the Umia Basin (Spain) and the Odra River (Poland, Czechia). Together, they amass hundreds of variables and extensive metadata. We will prototype a spatio-temporal search engine that is specifically catered for these domains. The engine operates both on observations from the sites and its metadata: metadata is checked for integrity, and the missing or corrupted data is identified in measurements dataset. The search engine adapts to the lack of data in a selected domain by doing heuristic analysis of identified temporal and spatial data gaps. The analysis is then coupled with interpolation and propagation models developed in the project, together providing complete model-optimized measurement datasets. The search engine is a part of the data management digital platform that facilitates scientists and stakeholders of the MultiGIS4Rivers. The platform is designed as a web server providing its users with observations and modelling products via API compliant with the OGC standards. In addition, it allows for the visualization of the search results, showing data availability and statistics. The proposed approach is expected to demonstrate how adaptive data discovery and gap-aware processing can support interoperable hydrologic digital infrastructures for river basin applications.

How to cite: Vasiuta, M. and Mäkinen, V.: Adaptive geospatial data search engine for river basin observation systems, EGU General Assembly 2026, Vienna, Austria, 3–8 May 2026, EGU26-17695, https://doi.org/10.5194/egusphere-egu26-17695, 2026.

EGU26-18353 | ECS | Orals | HS2.2.10

Large Language Model-Based Multi-Agent Systems: The Next Frontier in Digital Water Engineering  

Seyed Hossein Hosseini, Babak Zolghadr-Asli, Henrikki Tenkanen, Kaveh Madani, Mir A. Matin, Ibrahim Demir, Avi Ostfeld, Vijay P. Singh, and Dragan Savic
Large Language Model-based Multi-Agents (LLM-MAs) are emerging systems that manage complex tasks with specialized and coordinated agents. Water engineering typically involves data integration, analysis, modeling, decision-making, and cross-disciplinary collaboration, which often present significant difficulties. To address these domain-specific complexities, we explore and present new perspectives on how LLM-MA systems can support and enhance advanced operations in water engineering. By pointing out the linguistic capabilities of LLMs and the modular, scalable, and collaborative architecture of LLM-MA systems, we investigate the role of intelligent agents in enabling timely, adaptive, and traceable solutions. Various practical applications were identified, e.g., LLM-MA for pressure drop detection in water distribution networks, flood management, or in their role as potential negotiating agents to find a balanced solution considering differing goals. Our investigation highlights both the capabilities and limitations of LLM-MAs in water engineering and proposes practical recommendations for their effective implementation within the field. This study seeks to develop a foundational framework for understanding how LLM-MAs can shape the future of water engineering processes.
 
Reference: Hosseini, Seyed Hossein, Babak Zolghadr-Asli, Henrikki Tenkanen, Kaveh Madani, Mir A. Matin, Ibrahim Demir, Avi Ostfeld, Vijay P. Singh, and Dragan Savic. "Making waves: A conceptual framework exploring how large language model-based multi-agent systems could reshape water engineering." Water Research (2025): 125157.

How to cite: Hosseini, S. H., Zolghadr-Asli, B., Tenkanen, H., Madani, K., Matin, M. A., Demir, I., Ostfeld, A., Singh, V. P., and Savic, D.: Large Language Model-Based Multi-Agent Systems: The Next Frontier in Digital Water Engineering , EGU General Assembly 2026, Vienna, Austria, 3–8 May 2026, EGU26-18353, https://doi.org/10.5194/egusphere-egu26-18353, 2026.

EGU26-18755 | ECS | Posters on site | HS2.2.10

Continuous Surface Water Isotopes Reveal Fram Strait Water Mass Interactions during the Onset of Sea Ice Melt 

Femke den Ouden, Jeff Welker, and Ben Kopec

The Fram Strait is a key region for Arctic freshening and Atlantification, shaped by the interaction between warm, saline Atlantic Water inflow and the export of cold, fresh Polar Surface Waters, with Atlantic heat transport exerting a strong control on regional sea ice conditions. While the Fram Strait has been extensively studied using hydrographic transects and deep water profiles via mooring arrays, open surface waters and those beneath sea ice and non-summer periods, when sea-ice cover limits accessibility, are comparatively under sampled. We present one of the first Fram Strait dedicated, ultra high resolution surface water geochemistry datasets from the I/B Oden as part of the ARTofMELT 2023 expedition (May–June). We have collected continuous measurements of temperature, salinity, δ¹⁸O, and d-excess in surface waters at 8 m depth along the expedition cruise track during the transition from winter to spring. Our stable water isotope measurements provide a powerful tool to distinguish surface water provenance and freshwater modification in this region of the Arctic, where temperature–salinity (T-S) properties often converge under sea ice. We observed pronounced gradients across the Fram Strait, with fresher and isotopically depleted surface waters in the west, consistent with influence from the East Greenland Current, and more saline, isotopically enriched waters in the east. Conventional T-S frameworks would classify most observations as Polar Surface Water, inherently indicating surface waters being derived and exported from the Arctic. However, the isotopic composition suggests that waters with an Atlantic provenance intrude substantially farther beneath the sea ice in the eastern Fram Strait than previously appreciated. By combining continuous surface water isotope measurements with isotopic observations from sea ice and precipitation, we further show that the contribution of local sea ice melt to surface waters increases during the second half of the expedition, preceding the observed surface melt onset by approximately two weeks. Our results demonstrate that T-S relationships alone are insufficient to resolve surface water provenance and freshwater modification, whereas seawater isotopes provide critical constraints on the sources and evolution of surface water masses and freshwater in the seasonally ice-covered Fram Strait.

How to cite: den Ouden, F., Welker, J., and Kopec, B.: Continuous Surface Water Isotopes Reveal Fram Strait Water Mass Interactions during the Onset of Sea Ice Melt, EGU General Assembly 2026, Vienna, Austria, 3–8 May 2026, EGU26-18755, https://doi.org/10.5194/egusphere-egu26-18755, 2026.

The Matilija Creek watershed in southern California, USA, is characterized by pronounced vulnerability to post-wildfire debris flow and sediment-laden flood hazards which are challenging to predict since they occur as a result of the confluence of diverse but interconnected physical mechanisms. These events are a cascading hazard, in that wildfire increases susceptibility to mass movements. Southern California is prone to wildfires due to its dry climate during the summer months. The fires in turn cause changes in hydrologic response, including increased runoff and decreased soil cohesion. The region has also experienced severe drought in the mid-2010s. Stationarity is often an assumption of both statistical and physically-based hydrologic models, but in the case of Matilija Creek watershed it is likely that the best hydrologic parameters vary as a result of both drought and fire. Changes in hydrologic response can be detected through a wide variety of statistical analyses, including traditional methods for detecting changes in water yield, double-mass analysis and flow-duration curves. Data assimilation is a promising approach for dynamically capturing post-disturbance changes in hydrologic response over time. This study aims to assess the utility of data assimilation with a physically-based hydrologic model to detect changes in hydrologic parameters during a drought and following a fire. In our previous work on this method, over-parameterization has likely caused inconsistent results between runs. If many parameters are allowed to change too drastically, different parameter shifts can cause the same results. This new analysis will therefore focus on a small set of infiltration-related parameters. Data assimilation is also compared to a statistical method – a performance of a linear model of runoff-ratio over time - for detecting post-wildfire changes in the hydrologic response. In choosing a data assimilation algorithm, this study seeks to provide a more objective and data-driven assessment of the wildfire-driven changes in hydrologic parameters than would be possible with other methods.

How to cite: Culler, E. and Livneh, B.: An investigation of post-wildfire changes in hydrologic parameters using data assimilation in a southern California watershed , EGU General Assembly 2026, Vienna, Austria, 3–8 May 2026, EGU26-22445, https://doi.org/10.5194/egusphere-egu26-22445, 2026.

EGU26-23205 | ECS | Orals | HS2.2.10

Uncertainty-Aware Data-Driven Framework for Near Real-Time Lake Ecological Status Assessment under the EU Water Framework Directive  

Mehran Mahdian, Soroush Abolfathi, Jussi Kukkonen, and Mikko Kolehmainen

Lakes cover only about three percent of the Earth’s land surface, yet they are a critical component of the hydrosphere and provide substantial ecosystem services. Sustained monitoring and modeling of lake ecological status are therefore essential. Within the European Union, the Water Framework Directive provides a harmonized framework for assessing lake ecological status using biological quality elements such as phytoplankton, aquatic flora, benthic invertebrates, and fish, classifying lakes into five status classes: high, good, moderate, poor, and bad. However, sparse and infrequent field-based ecological measurements limit spatial and temporal coverage, particularly for near-real-time assessments. 

We present a national-scale machine-learning framework for ecological status classification of 2,487 Finnish lakes using routinely available water-quality and morphometric variables, including total nitrogen, total phosphorus, turbidity, conductivity, pH, color, dissolved oxygen, Secchi depth, maximum depth, and lake surface area. Multiple classification models were evaluated, including Random Forest, XGBoost, Support Vector Machine, Artificial Neural Network, and TabNet. Model uncertainty was explicitly quantified using a Bayesian neural network. An ensemble of models achieved a macro F1 score of 0.67 and a Matthews correlation coefficient of 0.50 under five-fold cross-validation. 

The Bayesian neural network achieved the lowest Brier score of 0.44 and Expected Calibration Error of 0.04, indicating superior probabilistic calibration compared to other models. Mean total predictive uncertainty across all lakes was 0.12, with the lowest uncertainty observed for high and bad ecological status classes and the highest uncertainty associated with intermediate classes, reflecting transitional ecological conditions and class overlap. These results demonstrate that data-efficient machine-learning models, combined with explicit uncertainty quantification, can support cost-effective and scalable ecological status assessment for lakes with limited monitoring data. 

The proposed framework enhances national-scale reporting, supports prioritization of restoration efforts, and provides uncertainty-aware decision support for lake management, particularly in Arctic–Boreal regions. 

Keywords: Ecological status assessment, Water quality, Finnish lakes, Machine learning, Near-real-time monitoring.  

How to cite: Mahdian, M., Abolfathi, S., Kukkonen, J., and Kolehmainen, M.: Uncertainty-Aware Data-Driven Framework for Near Real-Time Lake Ecological Status Assessment under the EU Water Framework Directive , EGU General Assembly 2026, Vienna, Austria, 3–8 May 2026, EGU26-23205, https://doi.org/10.5194/egusphere-egu26-23205, 2026.

HS2.3 – Water quality at the catchment scale

EGU26-1030 | ECS | Orals | HS2.3.1

Demonstrating Open Source and Low-Cost Sensors as Surrogates for River Water Quality Monitoring 

Jaswant Singh, Liam Kelleher, Kieran Khamis, David Hannah, and Stefan Krause

High-frequency water-quality monitoring is essential to understand nutrient dynamics, contaminant “hot moments,” and ecohydrological feedback in rapidly changing river catchments. However, the cost and maintenance requirements of commercial sensors constrains their deployment, limiting use particularly in remote or logistically challenging environments. This study evaluates the feasibility of open source and lower-cost surrogate-based monitoring for nitrate and dissolved organic matter (DOM), UK. The scalability of open source sensors for broader applications, such as dense and smart sensor networks are also explored.

Commercial field-deployed sondes continuously recorded optical and physicochemical variables—temperature (Tw), turbidity, dissolved oxygen (DO), electrical conductivity (EC), nitrate, and fluorescence (DOM fractions) —over seasonal cycles (sub-hourly data, i.e. 15 min frequency). Complementary low-cost sensors (e.g., EC, Tw and turbidity) captured in-situ hydrodynamic and water-quality variations. Empirical proxy models were developed to test whether low-cost parameters can represent DO, NO₃⁻ and fluorescent DOM (fDOM) dynamics, and whether turbidity, Tw, and EC enhance predictive power. Comparison with reference-grade instruments showed strong consistency, with coefficients of determination (R²) between 0.50 and 0.90 across flow regimes. Deviations during high-turbidity and runoff events highlight the need for adaptive calibration and uncertainty quantification.

The results demonstrate that open source and low-cost sensor networks, when properly calibrated, can capture fine-scale variability in nutrient and DOM fluxes, offering a scalable and affordable alternative to commercial systems. With onboard telemetry the sensors allow for integrating real-time data assimilation and harmonised workflows that supports data-driven catchment management and strengthens environmental monitoring in resource-limited regions. The findings align with innovative and classical monitoring frameworks, promoting uncertainty reduction and advancing transferable methodologies for next-generation smart river monitoring.

Keywords:  Monitoring; Sensors; Dissolved Oxygen; Surrogates; Calibration; Water Quality

How to cite: Singh, J., Kelleher, L., Khamis, K., Hannah, D., and Krause, S.: Demonstrating Open Source and Low-Cost Sensors as Surrogates for River Water Quality Monitoring, EGU General Assembly 2026, Vienna, Austria, 3–8 May 2026, EGU26-1030, https://doi.org/10.5194/egusphere-egu26-1030, 2026.

Record-breaking heatwaves have become a hallmark of the warming climate, disrupting water, energy and food systems and straining public health. While a nascent body of research has begun to document riverine heatwaves, their co-occurrence with atmospheric events and the emerging threat remain largely unexplored. Here we analyze 796 river basins in the US and Europe to characterize atmospheric-riverine compound heatwaves (ARCH) events, where atmospheric and riverine heatwaves co-occur. Using observational data and deep learning model, and we find ARCH frequency has tripled over the past four decades, at an increasing rate of +0.4 events per decade (p< 0.001). This trend is driven by the rapid intensification of riverine heatwaves (RHWs), with increases in frequency (114%), duration (148%), and intensity (95%) between the 1981–1990 and 2010–2019 decades, far outpacing changes in their atmospheric counterparts (AHWs). The occurrence of ARCH events is primarily controlled by climatic (59.2%), topographic (22.4%), and hydrological (18.3%) factors, with amplified trends in high-elevation (>3000 m) mountain rivers (+128% per decade), highlighting the vulnerability of these critical water sources to global change. These compound events exert greater thermal and oxygen stress on aquatic ecosystems than isolated heatwaves. Projections under a high-emissions scenario (SSP5-85) indicate that by 2100, nearly all riverine heatwaves will coincide with atmospheric heatwaves. These findings highlight the escalating threat of compound heatwaves to freshwater ecosystems and the importance of incorporating ARCH dynamics into future water risk assessments.

How to cite: zhou, Y. and zhi, W.: Climate change triples the frequency of atmospheric-riverine compound heatwaves in US and Europe rivers, EGU General Assembly 2026, Vienna, Austria, 3–8 May 2026, EGU26-1591, https://doi.org/10.5194/egusphere-egu26-1591, 2026.

EGU26-2574 | ECS | Orals | HS2.3.1

Human impact on land–ocean total phosphorus flux in the world's rivers 

Guowangchen Liu and Dongfeng Li

Rivers control the land-ocean phosphorus flux that affect ecosystem health and food security. Yet, systematic trend analysis of the global phosphorus flux is lacking, primarily due to sparse and inconsistent observations. Here, we develop a machine learning framework integrating multimodal data and 280,000 TP measurements to reconstruct TP flux patterns over 1980–2019 across 420 major rivers. Results reveal a deceptive global equilibrium. While TP flux declines in the Northern Hemisphere, driven by dam trapping, it rises in the Southern Hemisphere due to increased fertilizer use and deforestation. Notably, the number of small rivers with rising TP flux is nearly double that of large rivers. Our findings highlight a shifting global phosphorus landscape and underscore the need for more targeted, sustainable phosphorus management strategies.

How to cite: Liu, G. and Li, D.: Human impact on land–ocean total phosphorus flux in the world's rivers, EGU General Assembly 2026, Vienna, Austria, 3–8 May 2026, EGU26-2574, https://doi.org/10.5194/egusphere-egu26-2574, 2026.

The dynamics of rainfall-runoff processes, driven by climate change, impact the timing and magnitude of nutrients mobilization from land to river. However, understanding of concentration-discharge (C-Q) relationships of nutrients in event scale from high-frequency observations remains insufficient. This study analyzes event-scale concentration-discharge (C-Q) relationships for total phosphorus (TP) and total nitrogen (TN) using two-year high-frequency monitoring data from seven nested sub-catchments in the Wei River Basin. Based on 92 identified rainfall-runoff events, an advanced power-law C-Q model was applied to derive concentration intercepts, slopes, and hysteresis indices, with controlling factors examined via K-means clustering and Support Vector Machine classification. Results indicate that daily direct flow positively correlates with TP concentration but negatively with TN. Notably, 88.6% of TP C-Q slopes were positive, demonstrating that runoff processes substantially enhance TP export, whereas only 31.1% of TN slopes were positive, primarily in northern catchments. Cluster analysis revealed that TP response patterns (dilution, facilitation, and lagged-facilitation) are largely governed by rainfall/runoff duration and antecedent flow, whereas TN patterns (dilution, weak-function, and lagged-facilitation) are predominantly controlled by rainfall characteristics such as peak intensity, peak ratio, and antecedent rainfall. In conclusion, this research highlights distinct export mechanisms and drivers for TP and TN during hydrological events,  providing a process-based framework for predicting nutrient responses under changing climate conditions in semi-arid river basins.

How to cite: Chen, X.: Event-Scale Nutrient Export Dynamics Revealed by High-Frequency Monitoring in a Semi-Arid River Basin, EGU General Assembly 2026, Vienna, Austria, 3–8 May 2026, EGU26-3728, https://doi.org/10.5194/egusphere-egu26-3728, 2026.

EGU26-3887 | ECS | Posters on site | HS2.3.1

Spatio-temporal patterns of ecologically-relevant river water quality extremes during hydrological droughts 

Giulia Bruno, Li Li, Cornelia W. Twining, and Manuela I. Brunner

Dry periods can negatively impact river ecosystems through deficits in streamflow (hydrological droughts) and deteriorations in water quality. Yet, literature on water quality extremes is in its infancy and the co-occurrence of hydrological droughts and water quality extremes remains poorly understood, especially for different hydro-climatic regimes. With hydrological models often struggling to capture extreme conditions, observation-based studies from multiple catchments are crucial to gain insights on regional-scale patterns. High-frequency observations - at least daily - are needed to properly characterize often short-lived extreme events, but such observations are rarely available in current large-sample water quality datasets, which mostly have a relatively low temporal resolution (e.g., monthly). Therefore, data fragmentation, both in space and time, has hampered our understanding of the co-occurrence of hydrological droughts and water quality extremes to date. Specifically, here we ask the questions: Where and when do ecologically-relevant water quality extremes occur during hydrological droughts? and What are the hydro-climatic factors influencing these events? To address these questions, we rely on a newly-assembled dataset of water quantity and quality observations (i.e., streamflow, water temperature, electrical conductivity, and dissolved oxygen) at a daily resolution for 43 catchments across Europe and the USA and the period 2005−2024. For this case study, we derive hydrological droughts and water quality extremes (namely, sustained periods of abnormally low flows, abnormally high water temperature and electrical conductivity, and abnormally low dissolved oxygen) using a percentile-based approach with seasonally and catchment varying thresholds. We then focus specifically on concurrent hydrological droughts and water quality extremes, and in particular on those events exceeding thresholds that can lead to stress for aquatic animals. We finally characterize these events using metrics describing their magnitude and timing, and perform regression analyses to shed light on our research questions. Preliminary results indicate that hydrological droughts co-occurring with water quality extremes exhibit notable spatio-temporal variability. They further suggest that ecologically-relevant thresholds are exceeded in terms of water temperature in particular, and especially in catchments with human influence and minimal snow contribution. This study will enhance our mechanistic understanding on the potential impacts of hydrological droughts and water quality extremes on river ecosystems, by providing relevant information for river management under drying and warming.

How to cite: Bruno, G., Li, L., Twining, C. W., and Brunner, M. I.: Spatio-temporal patterns of ecologically-relevant river water quality extremes during hydrological droughts, EGU General Assembly 2026, Vienna, Austria, 3–8 May 2026, EGU26-3887, https://doi.org/10.5194/egusphere-egu26-3887, 2026.

The growing availability of large-scale environmental datasets offers a foundational opportunity to decode continental water quality dynamics; however, disentangling the scale-dependent interplay between transient meteorological forcings and persistent catchment attributes remains a challenge. Focusing on the pronounced hydro-climatic gradients of mainland China, this study presents a comprehensive synthesis of heterogeneous environmental data to bridge the gap between data-driven predictability and mechanistic understanding. We curated an extensive dataset anchored by 4,077 monitoring sections across nine major river basins, incorporating continuous daily observations from April 2014 to February 2025. This dataset covers 10 critical water quality parameters, encompassing a broad spectrum of physicochemical, nutrient, and biological indices.To systematically characterize driving mechanisms, we structured a multi-source explanatory framework that explicitly partitions predictors into two categories: 12 dynamic time-varying forcings (capturing transient fluctuations via meteorological variables and hydrological fluxes) and over 30 static attributes (representing physiographic contexts and anthropogenic footprints, such as land use intensity and reservoir regulation). To decode the nonlinear dynamics of this high-dimensional system, we propose a Physics-Data Coupled Framework employing an Encoder-Decoder architecture integrated with Multivariate Singular Spectrum Analysis. A key innovation is the embedding of explicit physical mechanism gates within the network, designed to ensure hydrological and biogeochemical consistency in deep learning predictions. Beyond enabling robust long-term forecasting, this framework facilitates multi-scale interpretability, allowing for the assessment of how dominant drivers shift across weekly, monthly, and annual resolutions. The analysis elucidates the differential roles of meteorological events in modulating high-frequency variability versus static landscape features in defining long-term baselines, offering a consistent methodological paradigm to support decision-making under changing environmental conditions.

How to cite: Hu, J., Zhi, W., Qin, Y., and Jiang, D.: Spatiotemporal Patterns and Multiscale Drivers of Riverine Water Quality in China: A Continental-Scale Analysis via Physics-Informed Deep Learning, EGU General Assembly 2026, Vienna, Austria, 3–8 May 2026, EGU26-4161, https://doi.org/10.5194/egusphere-egu26-4161, 2026.

Background. Moldova has a legacy of intensive pesticide use associated with historical agricultural practices and obsolete pesticide storage, with documented contamination affecting river-associated water systems in major transboundary basins such as the Dniester and Prut (Sapozhnikova et al., 2005; Ivanova et al., 2021). Widespread pesticide application combined with inadequate waste management during the Soviet and post-Soviet periods resulted in long-term contamination structured along river networks and basin-scale hydrological organization. This study examines whether spatial and temporal patterns of cancer incidence and prevalence align with hydrologically structured downstream exposure rather than with conventional population-level epidemiological risk proxies, with emphasis on long-latency environmental signals.

Methods. A district-level ecological analysis was conducted using national cancer incidence and prevalence rates per 100,000 population aggregated across three periods, 2008 to 2012, 2013 to 2017, and 2018 to 2022. District-level mean rates were calculated for each period to avoid pseudoreplication. Hydrological vulnerability was defined by integrating official contamination site inventories with peer-reviewed river pollution data and downstream river basin organization. QGIS was used to link river catchments with administrative district boundaries. Seventeen vulnerable districts were compared with eighteen non-vulnerable districts. Group differences were assessed using Welch's t-tests and Mann-Whitney U tests, with effect sizes quantified using Cohen’s d. Correlations with alcoholism, liver hepatitis and cirrhosis, respiratory disease as a proxy for smoking, and population age structure were examined. Analyses were performed using R.

Results. From 2008 to 2017, vulnerable downstream districts showed lower cancer incidence and prevalence, with no statistically significant differences. In contrast, from 2018 to 2022, vulnerable districts exhibited higher cancer incidence by 14.2 percent and higher cancer prevalence by 27.6 percent. Both outcomes were statistically significant with p < 0.05 and showed the largest effect sizes, with incidence Cohen’s d equal to 0.93 and prevalence Cohen’s d equal to 1.59. Temporal trends were highly parallel between groups, with r equal to 0.969 for incidence and 0.999 for prevalence, indicating divergence driven by level rather than trend shape. Risk proxies showed weak and non-significant correlations.

Conclusions. The post-2018 emergence of excess cancer burden in downstream districts represents a delayed spatial pattern consistent with long-latency environmentally mediated exposure structured by river basin hydrology rather than by short-term population-level risk factors. This exploratory study demonstrates the value of hydrology-informed public health analysis for detecting environmentally structured disease patterns and identifying priority downstream corridors for targeted monitoring of river-associated water systems in transboundary basins.

How to cite: Borodulin, N.: Datasets and drivers of catchment-scale river pollution: spatial correlations with district-level cancer incidence in Moldova , EGU General Assembly 2026, Vienna, Austria, 3–8 May 2026, EGU26-4998, https://doi.org/10.5194/egusphere-egu26-4998, 2026.

EGU26-6656 | ECS | Orals | HS2.3.1

Riverine heatwaves and their dominant generation processes: a systematic typology. 

Corentin Chartier-Rescan, Giulia Bruno, Maria Grundmann, Corinna Frank, and Manuela I. Brunner

The summer of 2025 in Europe provided another striking example of the severe consequences that riverine heatwaves, i.e. periods of extremely high river temperatures, can have on natural ecosystems and human societies. They led to a general decrease of water quality, massive fish die-offs, and in France and Switzerland, to the shutdown of nuclear power plants because of a lack of cooling capacity. Under continued climate change, river temperatures are expected to further increase, potentially leading to even more frequent and severe riverine heatwaves. Although the drivers of river temperatures have been widely studied, the factors causing riverine heatwaves remain largely unknown, in particular across large spatial scales. To address this research gap, we compiled the first large-sample dataset of river temperatures at the European scale and used it to assess the dominant hydro-climatic generation processes leading to riverine heatwaves over the period 1985-2020. For this assessment, we developed a systematic typology of riverine heatwaves, which classifies these events according to their associated antecedent hydro-climatic conditions. We used this typology to quantify the relative importance of each generation process for riverine heatwave development across 957 catchments, and describe the spatial and seasonal distribution of the different riverine heatwave types. We show that riverine heatwaves are mainly occurring during periods of anomalously warm air temperatures and that many severe summer events are occurring because of the cumulative effect of warm air temperatures and low discharge. Our results demonstrate that the importance of each generation process can significantly vary in space and time. They highlight the complex processes leading to riverine heatwaves, pointing towards the need to develop flexible and location-specific mitigation and adaptation measures 

How to cite: Chartier-Rescan, C., Bruno, G., Grundmann, M., Frank, C., and Brunner, M. I.: Riverine heatwaves and their dominant generation processes: a systematic typology., EGU General Assembly 2026, Vienna, Austria, 3–8 May 2026, EGU26-6656, https://doi.org/10.5194/egusphere-egu26-6656, 2026.

EGU26-7644 | ECS | Posters on site | HS2.3.1

Integrated hydrochemical and multi-index assessment of groundwater quality in phreatic and deep aquifers of the Bou Omrane–Sabkhet Ennaouel area (Southern Tunisia) 

Marwa Ghaib, Dorra Tanfous, Nizar Troudi, Thomas Hermans, Ferid Dhahri, and Kristine Walraevens

Salinization and nitrate contamination are major global threats to groundwater sustainability, particularly in semi-arid regions. In southern Tunisia, these issues are intensified by the combine effect of surface-water scarcity, low average annual precipitation, and excessive groundwater abstraction, emphasizing the need for continuous integrated hydrochemical monitoring and further exploration labors. The Bou Omrane–Sabkhet Ennaouel is ~1668 Km2 country extending between southeastern Gafsa and southern Sidi Bouzid regions in south Central Tunisia and relies exclusively on its own groundwater resources for both domestic supply and agricultural irrigation. Groundwater abstraction therein targets both shallow (phreatic) and deep aquifers, both constitute together the primary freshwater sources of the region. In this work, a physicochemical characterization including analyses/ measures of pH, electrical conductivity (EC), Total dissolved Solids (TDS), major ions (Na⁺, K⁺, Ca²⁺, Mg²⁺, Cl⁻, SO₄²⁻, HCO₃⁻, CO₃²⁻), and nutrient-related pollution indicators (NO₃⁻, NO₂⁻, NH₄⁺, PO₄³⁻) was done at the Laboratory for Applied Geology and Hydrogeology, Department of Geology, Ghent University (Belgium), for 19 and 20 samples from shallow and deep aquifers, respectively. In addition, hydrochemical relationships were examined using correlation analyses, while water quality was evaluated through a multi-index framework integrating the Water Quality Index (WQI) for drinking purposes and the irrigation criteria index.

It was found that the groundwater chemistry is dominated by Na⁺ > Ca²⁺ > Mg²⁺ > K⁺ among cations and SO₄²⁻ > Cl⁻ > HCO₃⁻ > NO₃⁻ among anions. Strong correlations between Na⁺–Cl⁻ and Ca²⁺–SO₄²⁻ suggest common geochemical controls associated with evaporite dissolution and salinization processes. The WQI results indicates the absence of excellent-quality water in both aquifers. In the phreatic aquifer, 12% of samples are classified as good, 21% as fair, 12% as poor, and 55% as extremely poor, whereas the deep aquifer exhibits more severe degradation, with 67% of samples falling into extremely poor class. For irrigation use, salinity constitutes the primary limiting factor. Electrical conductivity, as it is common measure of salinity, classifies 68% of samples as unsuitable for irrigation, while sodicity-related indicators are generally favorable, with most samples presenting SAR values below 10 and acceptable magnesium ratios. The permeability index (PI) and Kelley ratio (Kr) indicate suitable to moderate irrigation water quality, although some samples exhibit PI values below 25. Wilcox and USSL diagrams confirm the predominance of doubtful to unsuitable classes (C3–S1 to C4–S2), indicating significant agronomic risks related to soil structure degradation and crop productivity. Overall, the phreatic aquifer appears more vulnerable due to the limited thickness of the vadose zone, which facilitates contaminant infiltration. These findings highlight the urgent need to strengthen groundwater governance in the Bou Omrane–Sabkhet Ennaouel region through systematic monitoring of groundwater quality and abstraction, integration of field data into administrative databases, and the implementation of adaptive management strategies such as controlled drainage, water blending, and selection of salt-tolerant crops to ensure long-term groundwater sustainability.

How to cite: Ghaib, M., Tanfous, D., Troudi, N., Hermans, T., Dhahri, F., and Walraevens, K.: Integrated hydrochemical and multi-index assessment of groundwater quality in phreatic and deep aquifers of the Bou Omrane–Sabkhet Ennaouel area (Southern Tunisia), EGU General Assembly 2026, Vienna, Austria, 3–8 May 2026, EGU26-7644, https://doi.org/10.5194/egusphere-egu26-7644, 2026.

Rivers are major pathways transferring terrestrial nutrients to coastal waters, where both the magnitude and stoichiometry of exported nutrients play a critical role in regulating primary production and coastal ecosystem functioning. Nutrient export is strongly controlled by hydrological processes, yet large-scale understanding of how seasonal hydrological variability shapes multi-nutrient export and stoichiometry remains limited, particularly when hydrological circulation and biological activity re-initiate during spring. Here we investigated springtime (March–May) export dynamics of total organic carbon (TOC), total nitrogen (TN), and total phosphorus (TP) across 19 major estuaries discharging into the West (Yellow Sea), South, and East coastal regions of South Korea over the period 2012–2023. We compiled a paired concentration–discharge–precipitation (C–Q–P) dataset by spatially matching river water quality, streamflow, and precipitation monitoring stations. Nutrient loads, long-term trends, and responses to different hydrological conditions (e.g., dry, normal, and wet years) were analyzed with spatial patterns in C:N:P stoichiometry. Springtime nutrient export was highly uneven across coastal regions, with 73–80% of total loads delivered to West Sea, reflecting geomorphological and hydrological controls. Over the study period, springtime TOC, TN, and TP loads exhibited declining trends, with mean decreases of 511, 668, and 53 ton/yr, respectively. However, load dynamics differed markedly among nutrient species. While TOC and TN exports were predominantly discharge-driven, showing symmetric responses to hydrological variability, with 34–36% reductions in dry years and 26–39% increases in wet years, TP export displayed a pronounced asymmetric response, decreasing by 57% in dry years but increasing by only 4% in wet years. This result suggested strong regulation by concentration dynamics, soil retention processes, and phosphorus management regulations. Stoichiometric analysis revealed widespread nitrogen-enriched conditions along the Korean Peninsula coastal lines except for the southern estuary, a distinct hotspot with near-Redfield C:N:P ratios. Along the southern coastal lines, the probability to balanced stoichiometry increased during dry years with co-occurrence of higher chlorophyll-a concentrations, indicating coupled hydrological and biological controls. Our results demonstrated that spring hydrological variability induces nutrient-specific and asymmetric export responses, highlighting the need to account for both magnitude and stoichiometry in management for not only in-land catchments but also coastal ecosystems.

How to cite: Kim, Y. and Kam, J.: Asymmetric springtime responses of carbon, nitrogen, and phosphorus export to hydrological variability across South Korean estuaries, EGU General Assembly 2026, Vienna, Austria, 3–8 May 2026, EGU26-8922, https://doi.org/10.5194/egusphere-egu26-8922, 2026.

EGU26-9142 | ECS | Orals | HS2.3.1

Identifying the spatiotemporal dynamics and determinants of riverine DOC and pCO2 in the Yangtze River using machine learning methods 

Menghan Chen, Lei Cheng, Yue Wu, Mingshen Lu, Liwei Chang, Shiqiang Wu, Lu Zhang, and Pan Liu

Rivers are the link among terrestrial, oceanic, and atmospheric carbon pools, with longitudinal transport and vertical emission processes serving as critical pathways for riverine carbon export from river ecosystems. However, the spatiotemporal dynamics and determinants of riverine carbon export processes in large river systems remain poorly understood due to limited quantification of riverine carbon fluxes. In this study, the spatiotemporal patterns and determinants of longitudinal transport and vertical emissions of riverine carbon (i.e., dissolved organic carbon concentration (CDOC) and partial pressure of carbon dioxide (pCO2), respectively) were revealed using machine learning methods in the world’s third-largest river (the Yangtze River). Long-term, monthly, and river-reach scale estimation of riverine CDOC derived from Random Forest and Recursive Feature Elimination methods identified upstream hotspots of annual variation (approximately 23.6% of all basin reaches) and a spatial pattern of higher tributary concentrations, which corresponded to an annual DOC export of approximately 0.80 to 1.55 Tg to the ocean. Riverine pCO2 was higher than the atmospheric level, exhibited an increasing trend from upstream to downstream, and showed monthly fluctuations that, as identified by the k-Shape clustering algorithm, gradually evolved from smooth (upstream) to bimodal mode (downstream). Both riverine CDOC and pCO2 exhibited a seasonal pattern with high values in summer and autumn, whereas a distinct springtime peak in pCO2 was observed in the downstream. Climate and vegetation served as major determinants of the spatiotemporal patterns of riverine CDOC and pCO2. Precipitation, air temperature, and cumulative gross primary productivity exhibited significant and nonlinear increasing effects on riverine CDOC, with their importance second only to elevation. Air temperature was the most important determinant for riverine pCO2, with a relative contribution ranging from 17.8±1.3% to 40.0±0.9%. Vegetation factors exerted stronger influences on riverine pCO2 with strong fluctuation than on pCO2 with a smooth mode. This suggested that both longitudinal transport and vertical emission processes in the Yangtze River system would strongly respond to global warming, wetting and greening trends. Consequently, the DOC-enriched Yangtze River (with approximately 45.9% of river reaches being significantly transport-limited and only 0.6% being significantly source-limited) might export more DOC to the ocean, and the peak time of riverine CO2 emissions might vary in the future. In summary, this study revealed the spatiotemporal dynamics and determinants of riverine carbon longitudinal transport and vertical emission processes in the Yangtze River, emphasizing that riverine carbon export processes need to be further concerned under the global change.

How to cite: Chen, M., Cheng, L., Wu, Y., Lu, M., Chang, L., Wu, S., Zhang, L., and Liu, P.: Identifying the spatiotemporal dynamics and determinants of riverine DOC and pCO2 in the Yangtze River using machine learning methods, EGU General Assembly 2026, Vienna, Austria, 3–8 May 2026, EGU26-9142, https://doi.org/10.5194/egusphere-egu26-9142, 2026.

EGU26-10324 | Posters on site | HS2.3.1

Sensitivity of River Thermal Modeling to Hydrological Forcing 

Hanieh Seyedhashemi, Frederic Hendrickx, Celine Monteil, and Raphael Lamouroux

In the context of climate change, characterized by increasingly frequent droughts, stronger regional hydrological contrasts, and growing pressure on water resources, understanding and anticipating the evolution of river thermal regimes is essential. River temperature is a key parameter influencing water quality and ecological balance. However, at large scales, thermal responses of hydrosystems remain insufficiently characterized due to limited observational data.

To address this challenge, physical process-based thermal models are commonly used. These models generally require discharge time series as input and are therefore usually coupled with a hydrological model. Nevertheless, the performance of the selected hydrological model can influence thermal simulations—particularly in regions affected by groundwater inputs. In this study, we investigated the sensitivity of a thermal model to different hydrological forcings by applying T-NET thermal model over the Loire basin up to Saumur (81,200 km²) at a spatial resolution of ~1.7 km. This basin exhibits significant hydrological, climatic, and morphological variability, making it a representative case study for testing the sensitivity of thermal models. Specifically, we coupled T-NET with two semi-distributed hydrological models, EROS (developed by BRGM) and MORDOR (developed by EDF), and compared their outputs. Model outputs were validated for the 2008–2016 period using observations from ~400 stations, and the comparison was extended to 1980–2016 at multiple temporal scales (daily, monthly, seasonal, and annual).

Our results show that differences in hydrological model structure and performance influence thermal simulations. This finding is critical for identifying areas with substantial groundwater contributions where mitigation strategies could help limit increasing river temperature trends under climate change. By quantifying the impact of hydrological model choice on thermal simulations, this study provides insights for improving coupled modeling approaches and supports better-informed water management and adaptation strategies.

How to cite: Seyedhashemi, H., Hendrickx, F., Monteil, C., and Lamouroux, R.: Sensitivity of River Thermal Modeling to Hydrological Forcing, EGU General Assembly 2026, Vienna, Austria, 3–8 May 2026, EGU26-10324, https://doi.org/10.5194/egusphere-egu26-10324, 2026.

EGU26-12346 | Posters on site | HS2.3.1

Toward a National Understanding of River Chemistry: Analyzing Water Quality Baselines and Controls across Great Britain from the new CAMELS-GB-Chem dataset 

Francesca Pianosi, Yanchen Zheng, Nicholas Howden, Ross Woods, Gemma Coxon, and Penny Johnes

Hydrological research increasingly benefits from large-sample datasets for better understanding and modelling hydrological processes. Recent studies have shown how compiling and integrating large-scale water quality datasets can shed new light on water quality baseline conditions and understanding its controls. However, large-sample water quality datasets remain relatively scarce despite rising global river pollution.

In this study, we compiled around 64 million water quality records for Great Britain’s rivers by harmonising different datasets provided by Natural Resources Wales (NRW) and the Environment Agency of England. We matched these water quality records to existing catchments within CAMELS-GB, a large-sample hydrology dataset containing hydro-meteorological timeseries and catchment attributes for 671 catchments across Great Britain. We applied rigorous quality assurance and control procedures to account for detection limits, outliers, and duplicate entries in the water quality time series. We aim to release this harmonized CAMELS-GB-Chem dataset for national-scale analyses of river water quality.

Using the new CAMELS-GB-Chem dataset, we characterize baseline water quality and trends across Great Britain. We then explore whether these baseline conditions can be linked to catchment attributes such as climatic indicators, hydrological signatures, geology, soil properties, land cover and topography. Our preliminary results reveal that climatic variables (e.g., aridity and mean rainfall) and streamflow metrics (e.g., Q95 and mean discharge) are the dominant controls, while land cover, geology, and soils exert varied influence on different water quality indicators. Future work will incorporate anthropogenic influences into our analysis.

In sum, our work not only fills a critical water quality data gap at the national scale but also lays a scientific foundation for monitoring, modelling, and managing the water quality in Great Britain’s rivers under environmental change.

How to cite: Pianosi, F., Zheng, Y., Howden, N., Woods, R., Coxon, G., and Johnes, P.: Toward a National Understanding of River Chemistry: Analyzing Water Quality Baselines and Controls across Great Britain from the new CAMELS-GB-Chem dataset, EGU General Assembly 2026, Vienna, Austria, 3–8 May 2026, EGU26-12346, https://doi.org/10.5194/egusphere-egu26-12346, 2026.

EGU26-12422 | Orals | HS2.3.1

Long-term Effects of Forest Management on Hydrochemical Fluxes: Insights from the TERENO Wüstebach Experiment 

Heye Bogena, Frank Herrmann, Andreas Lücke, and Harry Vereecken

Although the hydrological impacts of land use changes are well studied, few datasets comprehensively capture the influence of land management on hydrochemical processes and solute fluxes. The long-term Wüstebach catchment experiment within the TERENO network (TERrestrial Environmental Observatories) provides a unique infrastructure for monitoring key water balance components, numerous anions and cations, as well as spatiotemporal soil moisture—both before and after partial deforestation and subsequent forest management measures such as thinning and underplanting.

We present long-term hydrochemical observations, including macro- and micronutrients, dissolved aluminum, and dissolved organic carbon, collected three years before and thirteen years after deforestation. Hourly concentrations and fluxes were estimated using the R package LOADFLEX. Predicted nitrate concentrations were compared with high-resolution reference data to select the optimal modeling approach. Comparable flux data were determined for a neighboring reference catchment with similar characteristics but without clear-cutting, enabling the isolation of deforestation and reforestation effects on nutrient cycling and transport.

Using flux data from both catchments, we applied a Before–After–Control–Impact (BACI) framework to quantify hydrochemical responses and feedbacks to forest management. Three phases were distinguished: pre-deforestation, the first two years after deforestation, and a later post-deforestation phase (three years after). The BACI analysis revealed distinct short- and long-term responses in solute fluxes, with the strongest effects observed for NO₃⁻, dissolved organic carbon (DOC), and Fe. Notably, fluxes during the two-year period immediately following deforestation differed significantly from both the pre-deforestation phase and the later post-deforestation phase, indicating a pronounced but transient disturbance effect. This dataset offers valuable opportunities to investigate the long-term impacts of deforestation and reforestation on hydrochemical fluxes under varying climatic conditions.


Bogena, H.R., F. Herrmann, A. Lücke, T. Pütz and H. Vereecken (2025): Long-term hourly stream-water flux data to study the effects of forest management on solute transport processes at the catchment scale. Earth Syst. Sci. Data. 17: 6965–6992. DOI: 10.5194/essd-17-6965-2025

How to cite: Bogena, H., Herrmann, F., Lücke, A., and Vereecken, H.: Long-term Effects of Forest Management on Hydrochemical Fluxes: Insights from the TERENO Wüstebach Experiment, EGU General Assembly 2026, Vienna, Austria, 3–8 May 2026, EGU26-12422, https://doi.org/10.5194/egusphere-egu26-12422, 2026.

The desert steppe on the northern foothills of the Yinshan Mountains serves as a critical ecological barrier and an agro-pastoral ecotone in northern China. Sustainable utilization of groundwater resources is essential for safeguarding regional ecological security and supporting socio-economic development. In the region, groundwater not only sustains fragile ecosystems but also constitutes the sole source of drinking water for local. However, the groundwater quality exhibits spatial heterogeneity due to the complex geological settings and anthropogenic activities. The study focused on the Tabu River Basin, a representative area of the desert steppe, where 107 groundwater samples were collected. By integrating conventional hydrochemical analysis, self-organizing map (SOM), explainable artificial intelligence (XAI) methods, and health risk assessment coupled with Monte Carlo simulation, we systematically characterized groundwater chemistry, evaluated its suitability for drinking purposes, and identified the dominant factors controlling water quality variations. The results showed that the self-organizing map classified three groundwater clusters, and hydrochemical facies were primarily identified as HCO₃⁻–Ca²⁺, Cl⁻–Na⁺, and mixed HCO₃⁻–Ca²⁺·Na⁺ types, primarily governed by cation exchange and human activities.  The entropy-weighted water quality index (EWQI) showed that 23.3% of the samples were classified as excellent, 36.5% as moderate, while 15.9% and 24.3% fell into the poor and very poor categories, respectively. Further analysis employing the XGBoost model combined with SHAP (Shapley Additive Explanations) interpretability techniques identified nitrate (NO₃⁻) and total dissolved solids (TDS) as the key drivers of water quality deterioration. Health risk assessment results indicated that 98.9%, 92.0%, and 80.5% of groundwater samples exceeded the acceptable threshold for total non-carcinogenic health risks for children, adult females, and adult males, respectively. By synergistically combining traditional hydrochemical approaches with unsupervised machine learning (SOM) and interpretable machine learning (XGBoost+SHAP), the study establishes a multidimensional and highly interpretable analytical framework, which not only advances the understanding of groundwater evolution mechanisms in arid and semi-arid inland basins but also provides robust scientific support for the sustainable management and utilization of regional groundwater resources.

How to cite: Wang, Z., Jia, Y., Liao, Z., Jin, J., Zhang, J., and Deng, T.: Unraveling Hydrochemical Drivers of Groundwater Quality and Assessing Associated Health Risks Using Self-Organizing Map, Explainable Artificial Intelligence, and Monte Carlo Simulation, EGU General Assembly 2026, Vienna, Austria, 3–8 May 2026, EGU26-12984, https://doi.org/10.5194/egusphere-egu26-12984, 2026.

EGU26-13581 | ECS | Orals | HS2.3.1

Morphometry of reservoirs and lakes reveals differences in algae blooms 

Tianying Shi, Yongcan Chen, Hong Zhang, Haoran Wang, and Zhaowei Liu

Algal blooms pose increasing threats to lakes and reservoirs worldwide, with harmful species such as cyanobacteria and dinoflagellates releasing toxin that endanger ecosystem and human health. However, the dominant bloom type varies across systems due to differences in climatic conditions and morphometric characteristics. This study aims to identify the key drivers influencing algal bloom types in freshwater systems. We compiled a global dataset of 160 lakes and reservoirs that have experienced either cyanobacterial or dinoflagellate blooms, incorporating climate variables, morphometric features, and physico-chemical water quality parameters. Using XGBoost and Logistic Regression models, we found that lake morphology, particularly depth and surface area, as well as wind speed are critical determinants of bloom type. Notably, a simple depth-area function (H=7.8×A0.3)  effectively differentiate between the two bloom categories, underscoring the strong influence of lake morphology on bloom dynamics. In addition, the dimensionless morphometric index CS=H√(π/A), combined with wind speed, further improves classification performance. Given that lake morphology reflects underlying climatic, hydrodynamic, and biogeochemical conditions, these findings offer practical guidance for assessing bloom risk and developing targeted management strategies.

How to cite: Shi, T., Chen, Y., Zhang, H., Wang, H., and Liu, Z.: Morphometry of reservoirs and lakes reveals differences in algae blooms, EGU General Assembly 2026, Vienna, Austria, 3–8 May 2026, EGU26-13581, https://doi.org/10.5194/egusphere-egu26-13581, 2026.

Characterizing large-scale spatiotemporal variability in river water qaulity and its drivers is challenging because monitoring data are irregular in time and space, and the underlying hydrological, biogeochemical, and human processes are complex and interconnected. These difficulties are acute for nitrate, whose behaviour reflects interacting natural and human drivers that vary across catchments and over time. In contrast to large-sample streamflow prediction, where measurements are frequent and relatively stable, large-sample water quality prediction usually needs to cope with sparse, uneven sampling and human-driven changes in both pressures and responses.

To meet these challenges, we designed a domain-guided, four-step workflow that emphasizes realistic handling of irregular monitoring data and trains a regional LSTM so that sites can share information and learn common patterns from many catchments. First, we assign one monitoring station to each catchment outlet using distance along the river network and apply quality checks to identify comparatively reliable sites. Second, we select and process input variables around nitrate-relevant processes and human activities (e.g., meteorology, land use, agricultural and urban pressures). Third, we train a single, England-wide long short-term memory (LSTM) model on historical records and evaluate performance using time-based tests within catchments and space-based tests across catchments (regions) to assess temporal and spatial generalisation. Finally, we apply attribution analysis to separate the roles of meteorological variability and static catchment characteristics and to examine how dominant drivers vary spatially for national upscaling.

Using nitrate measurements from the Environment Agency Water Quality Archive, the LSTM ingests diverse input categories to generate daily nitrate predictions at more than 2000 Water Framework Directive (WFD) catchment outlets. Results show that predictive skill varies across catchments; station screening improves generalization relative to models trained on all stations; and attribution reveals differing roles of meteorological drivers versus static properties across contrasting catchment settings. Overall, the framework produces daily predictions from irregular and limited observations, provides interpretable and water quality-focused insights into drivers at scale, and offers a large-scale view of how nitrate controls vary in space. It also supports future work on transfer learning and local fine-tuning to enable scalable assessment and management.

How to cite: Tang, J., Chun, K., and Mijic, A.: Large-Sample Nitrate Forecasting with a Regional LSTM: Multi-Source Inputs, Station Screening, and Attribution Analysis, EGU General Assembly 2026, Vienna, Austria, 3–8 May 2026, EGU26-13835, https://doi.org/10.5194/egusphere-egu26-13835, 2026.

The growing availability of long-term, open observational datasets has expanded the scope of comparative and multi-site water quality research. Many contemporary water quality questions, including changing organic matter dynamics, nonstationary concentration–discharge relationships, and the role of extremes, were not anticipated when most monitoring programs were originally designed. These questions can be addressed because long-term observation systems provide the temporal context and continuity needed to understand change across sites and regions. This presentation highlights how existing long-term and open datasets from national and international collaborative monitoring networks are being used in novel ways to move from monitoring toward insight. The focus is on data reuse and synthesis to interpret long-term water quality trends as environmental drivers change, to inform and evaluate model structures, and to reveal emergent spatial and temporal patterns across regions. Key challenges are also discussed, including data harmonization, evolving analytical methods, and sustaining scientific value over multi-decadal timescales. These examples underscore both the scientific value of long-term observation systems and the risks associated with losing continuity in long-term observational records.

How to cite: Boyer, E.: From monitoring to insight: how long-term, open data enable the next generation of water quality science, EGU General Assembly 2026, Vienna, Austria, 3–8 May 2026, EGU26-14639, https://doi.org/10.5194/egusphere-egu26-14639, 2026.

EGU26-15497 | ECS | Orals | HS2.3.1

Leveraging machine learning and large-scale datasets to elucidate the spatial and temporal dynamics of C, N and P 

Felipe Saavedra, Pia Ebeling, Lan Remeta, Rohini Kumar, Tam V. Nguyen, Christian Siebert, and Ralf Merz

Carbon (C), Nitrogen (N) and Phosphorus (P) are key macronutrients controlling ecosystem functioning; however, human activities have caused severe disturbances both in concentration levels as well as in their C-N-P ratio with potential consequences for ecosystem health. Large-scale assessment of C, N and P concentrations based on in situ data at high temporal resolution remains challenging due to discontinuous and spatially limited data availability. 


To address this gap we leveraged the recently published low-frequency (biweekly to monthly) German water-quality dataset QUADICA v2 (Ebeling et al., 2025) to develop three regional deep learning models to predict daily concentrations of dissolved organic carbon (DOC), nitrate (NO3) and phosphate (PO4). These species are commonly used as proxies for the reactive and bioavailable fractions of C, N, and P, with NO3 representing the dominant form of dissolved inorganic nitrogen in the study catchments. We selected catchments with at least 20 years of concentration data and 200 samples for each compound as well as discharge observations, resulting in a total of 155 catchments. For each compound, we trained a single Long Short-Term Memory (LSTM) model across all catchments. Model performance is satisfactory in most of the catchments with median Kling–Gupta efficiencies of 0.55, 0.62 and 0.45 for DOC, NO3 and PO4 respectively (average across cross-validation folds).


We used  SHAP to explain spatial and temporal variabilities in predicted concentrations. Results for spatial variability indicate that DOC is mainly controlled by topographic and climatic factors, while NO3 is controlled by land use and soil properties, and PO4 variability is governed by geology, climate and point sources. For temporal variability, we further cluster catchments into groups with similar dominant drivers based on temporal SHAP values. For DOC and nitrate, the clusters are mainly explained by precipitation and temperature variability. In contrast, phosphate exhibits three distinct clusters characterized by either precipitation and temperature, discharge or seasonality. Our results demonstrate that low-frequency water-quality data combined with deep learning and explainable AI can provide new insights into daily C, N, P dynamics at the large scale. This basis allows us to further characterize C, N, P archetypes, nutrient interactions and their dominant drivers.  

How to cite: Saavedra, F., Ebeling, P., Remeta, L., Kumar, R., V. Nguyen, T., Siebert, C., and Merz, R.: Leveraging machine learning and large-scale datasets to elucidate the spatial and temporal dynamics of C, N and P, EGU General Assembly 2026, Vienna, Austria, 3–8 May 2026, EGU26-15497, https://doi.org/10.5194/egusphere-egu26-15497, 2026.

Increases in nitrogen (N) fertilizer application, livestock densities, and human population over the last century have led to widespread nitrate contamination. While increases in riverine N loads are well documented, the total magnitude of N accumulation in groundwater remains poorly constrained. Here we provide a first data-driven estimate of groundwater N mass accumulation in the Upper Mississippi River Basin (UMRB), a region of intensive row-crop agriculture and the primary contributor to Gulf of Mexico hypoxia.

Using approximately 49,000 groundwater nitrate well concentration measurements spanning a range of depths, along with a suite of hydrogeologic and land-use predictors, we developed a Random Forest model to generate gridded predictions of depth-varying nitrate concentrations. Our results indicate that approximately 15 Tg of N (328 ± 167 kg-N ha⁻¹) is currently stored in UMRB groundwater recharged over the past 50 years.

For context, we compare these estimates to those from a lumped statistical model, which predicts accumulation of 387 ± 133 kg-N ha⁻¹, and to a simple basin-scale N mass balance, which places an upper bound of approximately 1000 kg-N ha⁻¹ for the period 1967–2017. These findings underscore the importance of legacy N when forecasting future water quality, as nitrogen stored in the subsurface will continue to degrade drinking water quality and elevate surface water N loads for decades.

How to cite: Van Meter, K.: Data-driven approaches demonstrate legacy N accumulation in Upper Mississippi River Basin groundwater, EGU General Assembly 2026, Vienna, Austria, 3–8 May 2026, EGU26-15985, https://doi.org/10.5194/egusphere-egu26-15985, 2026.

EGU26-16618 | Orals | HS2.3.1 | Highlight

Necessary but not sufficient: Exploring the role of diverse water quality datasets in UK river health 

Linda Speight and Saskia Nowicki

The growing availability of water quality datasets presents new opportunities to understand the dynamics of river health across multiple spatial and temporal scales. Citizen scientist data on pollution events, particularly from combined sewage overflows, have successfully increased scrutiny of polluted inland waterways. At the same time, there is a need to avoid undermining the importance of continued high-quality, long-term monitoring. These debates raise a critical question: has increasing data availability translated into improved understanding of, and outcomes for, river health?

Based on insights from a scoping review of published academic and grey literature, qualitative case studies from the perspectives of regulators, water companies and wild swimmers, and a systems mapping workshop with interdisciplinary scientists, data providers and users, we examine how existing UK river water quality data are collected and integrated. This combined approach allows us to explore how data are used to support scientific understanding and decision-making by river users and managers across multiple scales.

One of the key points made during the workshop was that perceived data gaps may be smaller than initially envisioned if all the data were brought together in one place. As a first step towards improved integration, we will present a systems map and accompanying database of English river datasets and data platforms spanning governmental organisations, private companies, researchers and citizen scientists. These data include CSO spills, faecal indicator organisms, physicochemical variables, macroinvertebrates, major nutrients and other chemical and ecological variables such as microplastics, PFAS and trace elements.

Our analysis highlights persistent challenges related to trust, consistency and bias, mismatches between spatial and temporal data resolution and decision needs, limited analytical capacity, and wider political-economic constraints. We argue that while data availability is necessary, it is not sufficient to improve river health. Progress depends not only on continued investment in monitoring, but also on shifting emphasis from identifying data gaps towards improving the integration, interpretation and decision relevance of existing data, enabling more effective understanding of water quality patterns and drivers across scales.

How to cite: Speight, L. and Nowicki, S.: Necessary but not sufficient: Exploring the role of diverse water quality datasets in UK river health, EGU General Assembly 2026, Vienna, Austria, 3–8 May 2026, EGU26-16618, https://doi.org/10.5194/egusphere-egu26-16618, 2026.

EGU26-17607 | ECS | Posters on site | HS2.3.1

QUADICA v2: Expanded large-sample water quality data for Germany offer new opportunities for cross-catchment analyses 

Pia Ebeling, Alexander Hubig, Alexander Wachholz, Ulrike Scharfenberger, Sarah Haug, Tam Nguyen, Fanny Sarrazin, Masooma Batool, Andreas Musolff, and Rohini Kumar

Large-sample hydrology aims to identify general spatial and temporal patterns and their exceptions across diverse catchments and to infer underlying processes by linking observed responses to hydroclimatic, biogeochemical, and anthropogenic drivers. While large-sample datasets for water quantity are now well established, similarly comprehensive resources for water quality have remained limited.

QUADICA (water QUAlity, DIscharge and Catchment Attributes) addresses this gap for Germany. Here, we present QUADICA v2, an extended large-sample water quality dataset covering 1386 catchments. The update expands temporal coverage to 2020, adds ecologically relevant water quality variables (including water temperature, oxygen, and chlorophyll a), and introduces long-term time series of nitrogen and phosphorus inputs from both diffuse and point sources. By linking QUADICA with CAMELS-DE, the number of stations with concurrent water quality and discharge data is effectively doubled (now 637 stations).

Beyond extending data availability, QUADICA v2 enables new analyses of driver–response relationships, network-topological patterns, and ecological impact studies across gradients of climate, land use, and pollution pressure. The dataset supports comparative large-sample studies, data-driven and machine-learning approaches, and the calibration and evaluation of process-based water quality models, providing a ground for understanding and management of freshwater systems.

How to cite: Ebeling, P., Hubig, A., Wachholz, A., Scharfenberger, U., Haug, S., Nguyen, T., Sarrazin, F., Batool, M., Musolff, A., and Kumar, R.: QUADICA v2: Expanded large-sample water quality data for Germany offer new opportunities for cross-catchment analyses, EGU General Assembly 2026, Vienna, Austria, 3–8 May 2026, EGU26-17607, https://doi.org/10.5194/egusphere-egu26-17607, 2026.

EGU26-17653 | ECS | Posters on site | HS2.3.1

Dissolved carbon storage and flux dynamics in China’s inland waters over the past 30 years 

Shuoyue Wang, Gaboury Benoit, Peter Raymond, Guirui Yu, Feng Zhou, Shaoda Liu, Chiyuan Miao, Kun Sun, Zhaoxi Li, Junjie Jia, and Yang Gao

Inland waters (lakes, reservoirs, and rivers) serve as important regulators of global climate change and carbon (C) cycling. China's inland water systems significantly regulate regional C budgets. However, our understanding of the long-term spatiotemporal patterns and underlying mechanisms of dissolved carbon (DC) storages and fluxes in inland waters remains limited. This study examined lake and reservoir DC storage and river DC flux, quantifying their changes in China over the past three decades. We found that inland water DC stocks in China increased from 96 Tg C in the 1990s to 142 Tg C in the 2010s while DC river flux did not significantly change (13.2 ± 0.4 Tg C/yr). Findings also showed that a combination of climate change, anthropogenic disturbance, and water chemistry collectively drove inland water DC dynamics. River DC was more directly driven by climate and anthropogenic factors (>50%) while lakes and reservoirs were more directly influenced by water chemistry (>70%). Additionally, climate factors can explain changes in dissolved inorganic carbon (DIC) concentrations via water chemistry factors (i.e., electrical conductivity (EC) and pH), while, collectively, climate and the nutrient status can typically explain changes in DOC concentrations. This study emphasizes the important role that inland water plays in the global C balance and underscores the necessity of considering it in future C budgets.

How to cite: Wang, S., Benoit, G., Raymond, P., Yu, G., Zhou, F., Liu, S., Miao, C., Sun, K., Li, Z., Jia, J., and Gao, Y.: Dissolved carbon storage and flux dynamics in China’s inland waters over the past 30 years, EGU General Assembly 2026, Vienna, Austria, 3–8 May 2026, EGU26-17653, https://doi.org/10.5194/egusphere-egu26-17653, 2026.

This study examines groundwater quality evolution and nitrate transport across a heterogeneous aquifer system in Barcelona Province (NE Spain), assessing compound effects of the 2021–2023 drought (the most severe on record) and anthropogenic pressures over 2016–2024. A total of 3,543 samples from 578 natural springs acting as aquifer discharge points were analyzed for physicochemical and hydrochemical parameters.

Results reveal contrasting trends in nitrate contamination. Mean concentrations decreased 25% (from 39.82 to 29.84 mg/L), attributable to action programs in vulnerable zones under EU Directive 91/676/EEC. However, springs exceeding the 50 mg/L drinking water threshold remained stable at ~24%, indicating persistent structural contamination unresponsive to conventional management. Spatially, elevated nitrates cluster in central and southern sectors coinciding with intensive agricultural and livestock activities.

Hydrochemical characterization confirms carbonate aquifer dominance, with 61.2% of springs exhibiting calcium-bicarbonate facies. Facies evolution between 2023–2024 reveals diagnostic trajectories: transitions toward sulfate facies indicate evaporitic formations contact, while shifts toward chloride facies signal increasing anthropogenic pressure in coastal areas and alluvial plains, reflecting synergistic degradation from drought-induced concentration and diffuse contamination.

The system shows clear climate signals: 0.5°C temperature increase during 2016–2024 and rising electrical conductivity consistent with severe drought. Reduced recharge diminishes natural dilution while increasing contribution of deeper, mineralized flows. This synergy between water stress and pre-existing contamination amplifies degradation beyond what either stressor would produce independently.

These findings demonstrate spring monitoring networks' value as complements to official surveillance, providing higher spatial resolution for early detection of localized deterioration. Differential aquifer vulnerability, with porous alluvial systems showing highest sensitivity to drought and contamination, has direct implications for prioritizing protection in recharge areas.

How to cite: Sigoña León, P., Vázquez-Suñé, E., and Valdivielso, S.: Groundwater Quality Degradation and Nitrate Transport in a Mediterranean Aquifer System: Synergistic Effects of Extreme Drought and Anthropogenic Pressures (Barcelona Province, Spain), EGU General Assembly 2026, Vienna, Austria, 3–8 May 2026, EGU26-18982, https://doi.org/10.5194/egusphere-egu26-18982, 2026.

EGU26-21138 | ECS | Orals | HS2.3.1

Global trends in river eutrophication and oligotrophication: A systematic review 

Nguyen Vu Duc Thinh, Flórián Tóth, Xavier Benito, Camille Minaudo, and András Abonyi

Trophic status serves as a fundamental water quality indicator, directly affecting biodiversity and ecosystem functioning in aquatic environments. While riverine nutrient pollution has remained a critical global challenge, recent evidence suggests a widespread transition from eutrophic towards oligotrophic states. However, the recovery is spatially heterogenous driven by contrasting anthropogenic pressures and management efficacies. Consequently, the true spatial extent and ecological implications of oligotrophication remained insufficiently explored, a deficit further compounded by inconsistent definitions and indicator parameters.

To address these gaps, we systematically reviewed 1,034 scientific publications (Scopus: 955; Web of Science: 526) and conducted a full-text analysis of 102 studies to address the following questions: (1) How are eutrophication and oligotrophication defined, and what are the most commonly associated variables? (2) What is the global distribution of oligotrophication and eutrophication in river systems? We identified key indicator variables used to analyse long-term trends in trophic status (≥ 10 years), and reporting either eutrophication, no change, or oligotrophication.

The global distribution of long-term nutrient trends exposes a stark regional divergence between mature and emerging economies. Rivers of European countries predominantly demonstrate a declining trajectory (oligotrophication), attributed to successful legislative intervention. France and Germany exhibit significant nitrate reductions in 74% and 91% of long-term observations, respectively, alongside a "resounding success" in phosphorus decrease driven by tertiary wastewater treatment and detergent bans. Conversely, Asian basins display a pronounced upward trajectory (eutrophication); in Japan, 55% of rivers show increasing nitrate levels, meanwhile the Yangtze River (China) exhibits continuous increases in nitrate flux, driven by intensive agriculture and forest loss. Degradation extends to the African continent, where nearly 60% of South African catchments exhibit significant phosphate increases linked predominantly to mining and dysfunctional sewage infrastructure. North America presents a complex, transitional profile characterised by "stalled recovery" in urbanised systems (e.g. the Charles River) and hydrological decoupling of concentration and load (e.g. the Maumee River). Superimposed on anthropogenic impact, climate factors are increasingly modulating long-term trends, with intensified drought driving "chemodynamic" behaviour (e.g. the Spree River, Germany) and warming temperatures amplifying natural denitrification (e.g. the Po River, Italy).

Riverine ecosystems divide along with two distinct trajectories globally: widespread oligotrophication in developed regions (e.g. in Europe), contrasted against intensifying eutrophication in developing regions (e.g. in Asia and Africa). While climate change increasingly alters long-term nutrient baselines, a critical research asymmetry persists. Although oligotrophication trends become more prevalent in riverine datasets, the scientific literature remains heavily skewed towards eutrophication assessments. Future research need to urgently redress the imbalance and investigate the ecological implications of trophic status recovery. As an example, greater attention is required to understand how river communities respond and may restructure both in terms of composition and functionally.

How to cite: Duc Thinh, N. V., Tóth, F., Benito, X., Minaudo, C., and Abonyi, A.: Global trends in river eutrophication and oligotrophication: A systematic review, EGU General Assembly 2026, Vienna, Austria, 3–8 May 2026, EGU26-21138, https://doi.org/10.5194/egusphere-egu26-21138, 2026.

EGU26-21504 | Orals | HS2.3.1

Introducing Caravan-Qual: A comprehensive global river water quality dataset 

Edward R. Jones, Frederik Kratzert, and Michelle T. H. van Vliet

Here, we introduce Caravan-Qual, a new water quality dataset which represents the first global integration with large-sample hydrology. The dataset contains >70 million river water quality observations covering 100 water quality constituents, compiled from a range of national-to-global datasets covering the period of 1980-2025. By leveraging the Caravan dataset and open-source software, we have matched water water quality monitoring stations to streamflow gauges and have derived meterological variables which together provide contextual environmental data which is envisaged to aid our understanding of the water quality data and facilitate research into topics including:

  • Spatio-temporal analysis of river water quality dynamics at local to global scales.
  • Investigation of the relationships between (constituent-specific) river water quality responses and hydrological, meteorological and catchment characteristics.
  • The development and evaluation of process-based, hybrid and data-driven water quality models across diverse hydrological and climatic conditions.

How to cite: Jones, E. R., Kratzert, F., and T. H. van Vliet, M.: Introducing Caravan-Qual: A comprehensive global river water quality dataset, EGU General Assembly 2026, Vienna, Austria, 3–8 May 2026, EGU26-21504, https://doi.org/10.5194/egusphere-egu26-21504, 2026.

EGU26-21949 | ECS | Orals | HS2.3.1

Bridging prediction and causal attribution in large-scale river water-quality networks 

Ke Yu, Ziyue Li, and Shen Qu

Water-quality forecasting and attribution at large spatial scales remain challenging because observations are sparse and heterogeneous, monitoring networks are nonstationary, and river systems impose strong directional and time-delayed connectivity. These constraints are further complicated by abrupt pollution shocks that cannot be explained by routine upstream–downstream propagation, yet are critical for risk-aware water management. Consequently, existing approaches often face a trade-off between predictive accuracy and interpretability: data-driven models capture complex spatiotemporal patterns but provide limited insight into underlying drivers, while causal analyses offer mechanistic understanding but are difficult to operationalize for real-time, multi-step forecasting across large monitoring networks.

Here we develop a physically constrained, topology-aware causal forecasting framework that unifies large-scale water-quality prediction with driver attribution in river networks. The framework explicitly represents three defining characteristics of fluvial systems: unidirectional upstream-to-downstream transport, travel-time-dependent propagation delays, and dynamic monitoring configurations in which stations appear or disappear over time. By embedding physical flow constraints into a data-driven causal representation, the framework jointly learns evolving spatiotemporal dependencies while remaining robust to extreme data sparsity and uneven sampling typical of water-quality observations.

We apply the framework to China’s national surface-water monitoring network, comprising more than 1,900 stations and multiple water-quality indicators, together with hydro-meteorological covariates. The framework achieves strong multi-step predictive skill across the full network under realistic data gaps, while providing an interpretable decomposition of dynamics into local persistence, upstream propagation, and externally driven disturbances. This decomposition enables real-time identification of dominant drivers of water-quality change at individual stations, distinguishes systemic trends from short-lived pollution shocks, and localizes influential upstream contributors consistent with river-network connectivity. Beyond forecasting, the framework supports event-oriented causal diagnostics and prioritization of high-information monitoring locations, helping to optimize sampling strategies and enhance early-warning capability under limited monitoring resources.

Our results demonstrate that physically constrained causal forecasting can bridge the long-standing divide between prediction and explanation in water-quality modelling at scale. Crucially, the framework remains operational under nonstationary station availability, enabling consistent forecasting and attribution as monitoring configurations evolve. By integrating topology-aware learning with interpretable attribution, the proposed framework establishes a coherent pathway from forecasting to diagnosis and source localization, supporting proactive, data-informed water-quality management and rapid response to pollution events in complex river networks.

How to cite: Yu, K., Li, Z., and Qu, S.: Bridging prediction and causal attribution in large-scale river water-quality networks, EGU General Assembly 2026, Vienna, Austria, 3–8 May 2026, EGU26-21949, https://doi.org/10.5194/egusphere-egu26-21949, 2026.

EGU26-2206 | ECS | Posters on site | HS2.3.3

Cross-Seasonal Heat Storage Driven by Autumn Impoundment: Thermal-Timing Evidence in Large Chinese Cascade Reservoirs 

Yue Qin, Yongcan Chen, Huatang Ren, Jiaming Luo, Zijun Xiao, Hong Zhang, and Zhaowei Liu

Quantifying the joint impacts of climate change and intensive cascade regulation on river thermal regimes is critical for managing ecological risks and optimizing hydropower production. However, most existing attribution studies primarily document broad, seasonally asymmetric warming and cooling patterns, offering limited mechanistic understanding of how specific reservoir operation strategies—particularly the widely implemented clear-water impoundment in China—regulate cross-seasonal heat storage and downstream winter warming. Here we developed an LSTM-based attribution framework to reconstruct counterfactual “no-dam” river temperatures and to quantify the relative contributions of anthropogenic regulation (ΔANT), long-term climatic warming (ΔTrend), and intra-annual climatic variability (ΔNCV) to downstream temperature changes in the lower Jinsha River, China. In addition, a suite of thermal-timing metrics is proposed to characterize seasonal heat states and to diagnose the cross-seasonal heat-storage processes responsible for the pronounced winter warming.

Results indicate that anthropogenic regulation (ΔANT) is the dominant driver of observed downstream thermal changes, inducing substantial autumn–winter warming of up to ~2°C while dampening summer temperature extremes. Long-term climatic warming (ΔTrend) provides a persistent background increase, whereas intra-annual climatic variability (ΔNCV) imposes strong seasonal and interannual modulation. Notably, the magnitude of winter warming varies markedly among years and is strongly controlled by antecedent thermal-storage conditions, with thermal-timing metrics linking earlier autumn impoundment and greater cumulative heat storage to enhanced downstream winter temperatures (Pearson's r≈0.62). Overall, these findings elucidate the coupled roles of climate change and cascade reservoir regulation in shaping river thermal regimes and provide a mechanistic basis for optimizing multi-reservoir operations to balance hydropower generation with downstream thermal and ecological requirements.

How to cite: Qin, Y., Chen, Y., Ren, H., Luo, J., Xiao, Z., Zhang, H., and Liu, Z.: Cross-Seasonal Heat Storage Driven by Autumn Impoundment: Thermal-Timing Evidence in Large Chinese Cascade Reservoirs, EGU General Assembly 2026, Vienna, Austria, 3–8 May 2026, EGU26-2206, https://doi.org/10.5194/egusphere-egu26-2206, 2026.

EGU26-7506 | ECS | Orals | HS2.3.3

Vegetation effects on low flow water temperature small to the medium size urban stream Liesingbach 

Helene Mueller, Anna Ludwiczek, Magdalena von der Thannen, and Hans Peter Rauch

Urban streams are exposed to strong anthropogenic pressures and frequently exhibit extensive morphological modifications, including embankments, channel straightening, and elevated longitudinal slopes. Especially in urban areas hydraulic capacity and requirements on flood control are driving factors for channel geometry and morphology, leaving strongly limited lateral space availability. Despite these pressures, restoration has gained increasing attention also for urban streams. Hydraulic conditions change, roughness is getting higher, slope might be reduced. Such morphological alterations have a direct influence on hydraulic behavior. Frequently, a trade-off exists between riparian vegetation and hydraulic capacity, since flow capacity is generally highest where woody vegetation is absent from banks and adjacent zones. In urban stream systems thermal energy input during low flow situations is mainly connected to short wave radiation and to air temperature. Restoration works slow down the system, increasing hydraulic residence time. In consequence slower systems exhibit a higher energy input, which makes them more sensitive to heat stress. Riparian vegetation can buffer energy input via shading effects. When addressing the trade-off between the services provided by riparian vegetation and hydraulic capacity, linking hydraulic and thermal aspects could provide valuable insights. The research done in the INTERLAYER project dedicates the impact of riparian vegetation on water temperature during low flow conditions at the small to medium size urban river, Liesingbach. Based on a water temperature model the vegetation effects on water temperature through shade during a low flow period with high air temperature values are quantified and compared to a scenario in absence of riparian vegetation. A HEC-RAS water quality model was set up for 8 km along the urban flow path of the river Liesingbach using the full energy budget approach. The model was calibrated and validated by measured water temperature data for two river heat periods in two consecutive years. Vegetation data was collected by hemispherical photographs. The prevailing vegetation was tested against a total absence of vegetation. The results show that effects of shade through riparian vegetation were able to buffer of 0.7 to 1.3°C daily water temperature peaks. An impact on daily minimum values was not detected. Based on our results vegetation effects are not limited to dense riparian forests. Even single tree lines, or shrubby vegetation implemented through soil and water bioengineering techniques have remarkable influence on water temperature. Vegetation can clearly support ecological aspects during low flows. With the prevailing water temperature model, we created a tool to quantify the impacts and predict potential changes. Building on this integration of hydraulic and vegetation modelling will enable us to improve ecological outcomes during low-flow periods.

How to cite: Mueller, H., Ludwiczek, A., von der Thannen, M., and Rauch, H. P.: Vegetation effects on low flow water temperature small to the medium size urban stream Liesingbach, EGU General Assembly 2026, Vienna, Austria, 3–8 May 2026, EGU26-7506, https://doi.org/10.5194/egusphere-egu26-7506, 2026.

EGU26-7754 | ECS | Orals | HS2.3.3

Spatially contiguous reconstruction of water temperature and discharge in Switzerland using deep learning 

Louis Poulain--Auzéau, Basil Kraft, Lukas Gudmundsson, and Sonia Seneviratne
Water temperature and discharge are critical variables for Switzerland’s ecosystem health and energy production, particularly for nuclear cooling and hydroelectric production. These variables are physically coupled; low-flow conditions often exacerbate high water temperatures, creating "compound events" that can threaten biodiversity and constrain energy availability. 
Pressures on the hydrological system are intensified by anthropogenic climate change, e.g. through rising water temperature and decreasing summer discharge.
 
Switzerland's monitoring network of discharge gauges and water temperature sensors provides valuable insights into past and present conditions, but gaps in spatial coverage and record length still limit robust assessment of country-scale trends.
We develop a joint reconstruction of daily catchment-level water temperature and discharge from 1962 to 2023 using a Long Short-Term Memory (LSTM) network.
Our network is trained on 226 catchments and requires precipitation and air temperature as meteorological inputs, besides static land properties.
We assess the potential of this data-driven reconstruction through an exhaustive spatio-temporal cross-validation and evaluation at different temporal scales.
In addition, we explore the potential of the multi-output architecture to decipher physical coupling of water temperature and discharge and thereby improve representation of compound events.
 
Our network achieves a median Kling-Gupta efficiency (KGE) of 0.83 for water temperature and 0.71 for discharge. The computational efficiency of our model enables an extended reconstruction with spatially contiguous predictions at 1193 locations along the Swiss river network. This first joint reconstruction of water temperature and discharge for Switzerland opens avenues for process understanding and assessments of national trends. The results are promising and highlight potential for refining the model and expanding its applications, such as coupling with climate projections.

How to cite: Poulain--Auzéau, L., Kraft, B., Gudmundsson, L., and Seneviratne, S.: Spatially contiguous reconstruction of water temperature and discharge in Switzerland using deep learning, EGU General Assembly 2026, Vienna, Austria, 3–8 May 2026, EGU26-7754, https://doi.org/10.5194/egusphere-egu26-7754, 2026.

EGU26-8460 | ECS | Orals | HS2.3.3 | Highlight

Riverine heat waves on the rise, outpacing air heat waves 

Kayalvizhi Sadayappan and Li Li

Riverine heat waves receive far less attention compared to air heat waves. Our understanding of riverine heat waves has been limited by poorly consolidated water temperature records, despite the substantial advances in river water temperature monitoring. To address this gap, we developed a long short-term memory (LSTM) model for reconstructing historical daily mean water temperature in 1471 sites across the contiguous United States from 1980 to 2022. Using these temporally complete records, we analyzed the characteristics of riverine heat waves and their long-term trends, and evaluated how they compare with air heat waves. Our analysis revealed that riverine heat waves occur less frequently (2.3 versus 4.6 events/year), and with lower intensity (2.6 versus 7.7 °C/event) than air heat waves, but persist for longer durations (7.2 versus 4.0 days/event). More importantly, the frequency, duration and intensity of riverine heat waves have been increasing at rates 2–4 times higher than air heat waves. These increases in riverine heat waves are primarily driven by climate factors including rising air temperatures and declining snowpacks, while anthropogenic activities such as river regulation by dams and agriculture further modulate response of rivers to climate change. The pronounced rise in riverine heat waves highlights the urgent need for global monitoring of river water temperatures and inclusion of riverine thermal extremes in climate risk assessments and mitigation strategies.

How to cite: Sadayappan, K. and Li, L.: Riverine heat waves on the rise, outpacing air heat waves, EGU General Assembly 2026, Vienna, Austria, 3–8 May 2026, EGU26-8460, https://doi.org/10.5194/egusphere-egu26-8460, 2026.

EGU26-9900 | ECS | Posters on site | HS2.3.3

High-resolution contemporary river temperature atlas for Central Europe 

Shekhar Sharan Goyal, Christian Schmidt, Tam Nguyen, and Rohini Kumar

River water temperature governs aquatic metabolism, oxygen availability, and habitat suitability, yet monitoring remains sparse and uneven especially for small tributaries leaving much of the river network unobserved. Across Central Europe, long-term in situ observations are spatially heterogeneous, constraining assessments for many ecologically important rivers and tributaries that are only a few tens of meters wide. We address these limitations by developing a machine-learning framework that combines satellite thermal infrared land surface temperature (LST) with hydroclimatic, topographic, and land-cover predictors to generate high-resolution river water temperature (Tw) estimates across Central Europe, with a focus on Germany. We collocate quality-controlled in situ water temperature records with ECOSTRESS overpasses using a river-corridor sampling strategy that minimizes mixed-pixel contamination and propagates cloud and retrieval uncertainty. To ensure geographic transferability, we apply geographically structured training validation that limits spatial leakage. We then fit and compare machine-learning models to predict Tw from daily to monthly timescales. The resulting product provides spatially explicit Tw fields at ECOSTRESS native resolution (order 70 m) along the river network, resolving fine-scale thermal gradients and identifying localized hotspots associated with urbanization, flow regulation, and riparian alteration. By quantifying the combined influence of climate variability and anthropogenic modification on river heating and cooling capacity, this work supports ecological risk assessment and climate-adaptation planning, and offers a transferable template for other data-limited river systems.

How to cite: Goyal, S. S., Schmidt, C., Nguyen, T., and Kumar, R.: High-resolution contemporary river temperature atlas for Central Europe, EGU General Assembly 2026, Vienna, Austria, 3–8 May 2026, EGU26-9900, https://doi.org/10.5194/egusphere-egu26-9900, 2026.

EGU26-11067 | ECS | Orals | HS2.3.3

Patterns of Subsurface Urban Heat Island Intensity (SubSUHII) 

Verena Dohmwirth, Elena Egidio, Ashley Merry-Eve Patton, Daniele Cocca, Domenico Antonio De Luca, Manuela Lasagna, and Susanne A. Benz

The strength of subsurface urban heat islands (SubSUHII) hasn't been studied much, even though this could be a key indicator of how urban infrastructure and human activities affect groundwater temperatures. Moreover, understanding SubSUHII is crucial for assessing the impact of cities on underground temperature patterns and what this means for groundwater resources.

This study tackles two main issues. First, we analyse how to quantify SubSUHII reliably. Similar to the intensity of the atmospheric urban heat island, SubSUHII is described as the difference in temperature between the average annual groundwater in urban wells and in a rural setting. Particular attention is given to how urban boundaries should be defined, and how measurement depths and rural background groundwater temperatures (GWT) should be conceptually addressed in the subsurface, highlighting both the similarities and fundamental differences with atmospheric urban heat islands.

Secondly, we explore how SubSUHII spatial patterns can be compared across multiple cities using an updated global groundwater temperature dataset by Benz et al. (2024) in conjunction with several observed groundwater temperature datasets. While our data covers more than 40 cities in total, this pilot study particularly focuses on Karlsruhe (Germany), Turin (Italy) and Cardiff (UK) where data availability is highest. These cities cover a wide range of climatic, geological and urban contexts, allowing for a comparative analysis of SubSUHII under different conditions. At the urban level, we analyse variations in SubSUHII as a function of local climate zones (LCZ) and groundwater measurement depth. Finally, we investigate the role of urban morphology and infrastructure, including building types and population density, to identify recurrent patterns of SubSUHII across cities and countries.

By providing a consistent framework for calculating SubSUHII and identification of local and global patterns, this study helps to provide a more comprehensive understanding of urban thermal impacts in the subsurface.

How to cite: Dohmwirth, V., Egidio, E., Patton, A. M.-E., Cocca, D., De Luca, D. A., Lasagna, M., and Benz, S. A.: Patterns of Subsurface Urban Heat Island Intensity (SubSUHII), EGU General Assembly 2026, Vienna, Austria, 3–8 May 2026, EGU26-11067, https://doi.org/10.5194/egusphere-egu26-11067, 2026.

EGU26-11177 | ECS | Posters on site | HS2.3.3

Water temperature aspects of a (geo)thermal stream in context of climate change adaptation  

Jürgen Kleiner, Helene Müller, and Johann Peter Rauch

Climate change adaptation in urban areas often involves the expansion and further development of blue-green infrastructure. In cities where stream systems are routed in the underground, there is potential to adapt public spaces to the growing requirements caused by climate change by daylighting  these streams. Usually, urban streams are used as climate change adaptation in terms of PET (physically equivalent temperature) reductions. Beside their usage in cooling public spaces, streams, especially spring-fed streams, also provide potential for thermal utilization as a climate change adaptation measure in the built environment. In case streams originating from thermal springs temperature patterns are inverted. Showing the highest temperatures at the spring and cooling down on their way downstream. Climate change adaptation initiatives include efforts to utilize their thermal potential for geothermal energy. One example is MaDoKli Project, focusing on Mannersdorfergraben in Eastern Austria. The region is characterized through a focus on agriculture and open fields next to the city of Mannersdorf. The initial conditions of the project area show an interesting situation with a constant discharge in a range of 14 – 27 l/s measured with 23° C year-round at the spring. Therefore, the warm stream is intended to be integrated into the municipality’s energy system through heat exchange for thermal energy extraction. The Mannersdorfergraben is monitored over its 6 km long flow path. Water temperature is measured at 300 m intervals using HOBO Bluetooth Onset 1-800-loggers, covering the springs, the flow path in the underground and the open channel. The inverse temperature regime was investigated over a six-month period in 2025 at 15-min interval. The measurements are intended to support a sensitivity analysis assessing how fluctuations of +/- 5° C impact the total water temperature regime of the stream. The data allows the identification of the longitudinal extent affected by thermal stress, manifested as river temperature reduction in heating period and thermal pollution during the summer period. Early results indicate that approximately halfway along the open flow section, the effect of thermal energy extraction diminishes and the water temperature returns to its initial baseline.
Additionally, the results are intended to help determine the impact of the thermal intervention in the flow system on the stream and its ecosystem.

How to cite: Kleiner, J., Müller, H., and Rauch, J. P.: Water temperature aspects of a (geo)thermal stream in context of climate change adaptation , EGU General Assembly 2026, Vienna, Austria, 3–8 May 2026, EGU26-11177, https://doi.org/10.5194/egusphere-egu26-11177, 2026.

EGU26-11260 | ECS | Posters on site | HS2.3.3

Thermal regime of a heavily regulated Alpine river at multiple spatial scales 

Anisa Bica, Marta Crivellaro, Niccolò Schiavi Cappello, and Guido Zolezzi

The present study aims to quantify the thermal regime of a highly regulated Alpine river at the catchment scale, some of its ecological implications, to support decision making in water management, particularly in relation to revising existing ecological flows protocols. The chosen case study is  the Sarca river (NorthEastern Italian Alps), where a complex hydropower diversion scheme, consisting of more than 60 km of tunnels and penstocks, two large storage reservoirs and two major hydropower plants, were constructed in the 1950s.

The Sarca River originates from the Adamello glacier, flowing for approximately 80 km to Lake Garda. The study spans from Spiazzo (1100m asl)  to Sarche (150m asl), including some major lateral tributaries such as the glacier-fed Bedù stream. River water temperature was monitored since May 2025 using 14 continuous HOBO sensors conveniently distributed along the study area, on the basis of criteria that account for existing hydrometric stations, the ability to capture relevant spatial and temporal variability, and physical accessibility. In addition to such year-round catchment-scale distributed monitoring, short-term temperature monitoring at five sites along the middle course of the Sarca River was designed to assess local thermal variability associated with riparian vegetation shading, and valley slopes morphology and exposure comparing sensors placed in locations with different sunlight exposure with a spatially explicit assessment of hourly radiation.

The measured thermal regime reveals that river water temperatures already achieve values of concern for the local fish community, particularly during summer heatwaves. An analysis of continuous event duration under threshold allows to estimate some possible effects on the autochthonous marble trout. Reaches with a North-South alignment and a wider valley floor show higher daily thermal oscillations despite their higher elevation.  The effect of local hydrology, valley morphology, riparian vegetation, in creating local thermal refugia for target species such as brown and marble trout is quantified. By integrating watershed-scale analyses, thermal monitoring, fish thermal requirements, spatially explicit year-round shading models, this study shows the relevance of combining ecological, hydrological, and water management perspectives to understand the thermal effects of water diversions and climate change on Alpine riverine ecosystems, providing the basis to design possible mitigation measures to increased river warming.

How to cite: Bica, A., Crivellaro, M., Schiavi Cappello, N., and Zolezzi, G.: Thermal regime of a heavily regulated Alpine river at multiple spatial scales, EGU General Assembly 2026, Vienna, Austria, 3–8 May 2026, EGU26-11260, https://doi.org/10.5194/egusphere-egu26-11260, 2026.

EGU26-12579 | Orals | HS2.3.3

Operational modelling of the thermal structure of Swiss Lakes: Achievements, challenges, and new horizons 

Martin Schmid, Fabian Bärenbold, James Runnalls, and Damien Bouffard

Accurate simulations of lake thermal structure are essential for understanding the impacts of climate change and predicting ecosystem responses. We provide operational simulations of the thermal dynamics of all major and selected smaller Swiss lakes using the one-dimensional hydrodynamic model Simstrat. These simulations are updated daily with five-day forecasts and made openly accessible via the Alplakes platform, which also offers downloadable input and output files.

Model performance is generally excellent for the larger lakes, with RMSE values around 1.0 °C at the surface and 0.5 °C in the deep water, compared to extensive monitoring data. However, notable challenges persist for: (i) lakes with short residence times strongly influenced by inflow dynamics, (ii) managed reservoirs with operational procedures outside the model’s scope, and (iii) small lakes where local interactions (e.g., groundwater exchange, snowmelt) substantially affect thermal properties.

Comparisons with high-resolution data from new temperature monitoring stations and with 3D simulations available for selected lakes on Alplakes provide multiple opportunities for model evaluation, enhancing process understanding and guiding model improvement. Furthermore, coupling Simstrat with biogeochemical models leverages its robust physical simulations for water quality projections. A beta version of an oxygen model is already running operationally with promising results, paving the way for integrated ecological and geochemical forecasting.

How to cite: Schmid, M., Bärenbold, F., Runnalls, J., and Bouffard, D.: Operational modelling of the thermal structure of Swiss Lakes: Achievements, challenges, and new horizons, EGU General Assembly 2026, Vienna, Austria, 3–8 May 2026, EGU26-12579, https://doi.org/10.5194/egusphere-egu26-12579, 2026.

EGU26-13760 | ECS | Posters on site | HS2.3.3

A Differentiable Physics-Informed Neural Network (DPINN) for National-Scale River Temperature Modelling 

Guhan Li, Peng Shi, Lingzhong Kong, James White, Senlin Zhu, Yiqun Sun, Simin Qu, and Qian Yang

River temperature (Tw) is of fundamental importance to freshwater ecosystem health and the services this provides to society. Yet anthropogenically-induced Tw transformations from pressures like flow regulation, deforestation and climate change induce various thermal impacts globally. As such, evidence-led management approaches are needed to mitigate Tw modifications, but these are often hindered by a paucity of reliable data across river networks. Modelling Tw regimes across unmonitored rivers and forecasting future change is critical for helping safeguard freshwater ecosystems. Hybrid Tw models offer a promising scientific avenue to embed process-based insights within spatially transferrable statistical frameworks, but few studies have applied this across national-scales. However, current hybrid architectures often rely on simplified equations as rigid structural priors which may constrain their flexibility in capturing complex thermal dynamics. In light of this, we have developed a novel hybrid Tw method based on Differentiable Physics-Informed Neural Networks (DPINNs) and applied this to multi-decadal data (1980-2020) from 78 sites across the conterminous United States. This approach integrates a zero-dimensional (0D) heat advection-dispersion equation within a neural network (NN) framework and utilizes the neural network to estimate river heat exchange processes. This capability allows the method to be applied to data from a single site, where establishing a physical process-based model is typically difficult. We observed a Mean Absolute Error (MAE) of 0.68 °C when comparing DPINN model predictions versus observed Tw values. Our results indicated this approach outperformed the established air2stream Tw model and traditional neural networks approaches like MLP (MAE = 0.79 °C) and LSTM (MAE = 0.93 °C). Our results thus highlight that by embedding physical priors to incorporate explicit heat transfer mechanisms, it enhances Tw modelling performance while also reducing the need for large environmental datasets. The strong performance of this innovative DPINN Tw model on a national-scale highlights its potential transferability across a broad range of river environments, and thus could be a vital tool to help predict large-scale Tw dynamics to help underpin effective, ‘climate proofed’ management interventions.

How to cite: Li, G., Shi, P., Kong, L., White, J., Zhu, S., Sun, Y., Qu, S., and Yang, Q.: A Differentiable Physics-Informed Neural Network (DPINN) for National-Scale River Temperature Modelling, EGU General Assembly 2026, Vienna, Austria, 3–8 May 2026, EGU26-13760, https://doi.org/10.5194/egusphere-egu26-13760, 2026.

EGU26-14281 | ECS | Posters on site | HS2.3.3

Mapping riverine heatwave trends across Europe using reconstructed river temperature time-series 

Corinna Frank, Martin Gauch, Corentin Chartier-Rescan, Maria Grundmann, and Manuela Brunner

Riverine heatwaves, that is, periods of anomalously high water temperature, have become more frequent and intense over the past decades across Europe. To improve our understanding of their spatial distribution and to analyze potential shifts in the causes of such events, we require long time-series of river temperature over a large spatial domain. However, records of measurement stations are often of limited length or, in some regions of Europe, not available at all. 

To fill these temporal and spatial data gaps, we train a deep learning Long Short-Term Memory (LSTM) model to reconstruct historic time-series (1985-2020) of daily river temperature from meteorological records and catchment characteristics. To train and evaluate the model for the simulation of riverine heatwaves, we use the new TempER (Temperature of European Rivers) dataset that contains over 4000 temperature measurement stations in Europe. TempER covers 26 European countries and contains daily water temperature records of 1 to 72 years length. 48% of the stations additionally provide streamflow observations that we integrate into the model to enhance the fidelity of the reconstructed data. In regions not covered by TempER we use streamflow records from EStreams[1] to guide the temperature simulation. 

We analyze the reconstructed river temperatures with respect to trends in riverine heatwave characteristics (frequency, duration, intensity) and their spatial distribution across Europe. With our findings we intend to improve the understanding of the hydro-meteorological processes that drive riverine heatwaves and provide a continuous dataset allowing further analysis of river temperatures in Europe. 


[1] do Nascimento, T.V.M., Rudlang, J., Höge, M. et al. EStreams: An integrated dataset and catalogue of streamflow, hydro-climatic and landscape variables for Europe. Sci Data 11, 879 (2024). 

How to cite: Frank, C., Gauch, M., Chartier-Rescan, C., Grundmann, M., and Brunner, M.: Mapping riverine heatwave trends across Europe using reconstructed river temperature time-series, EGU General Assembly 2026, Vienna, Austria, 3–8 May 2026, EGU26-14281, https://doi.org/10.5194/egusphere-egu26-14281, 2026.

Lake and river water temperatures provide a framework for understanding the ecological, biogeochemical, and physical functioning of these aquatic ecosystems. In particular, knowledge of the current global distribution of lake and river thermal characteristics can serve as a critical baseline to assess impacts of projected future changes. However, site-specific observations of lake and river temperatures are not readily available for most locations in the world and are especially scarce for small lakes and streams. This presentation provides an overview of several assessments at global scale and in high spatial resolution to estimate the surface water temperatures of all lakes and rivers worldwide as contained in the HydroATLAS database.

First, the seasonality of lake surface temperatures was derived from Landsat 8 thermal radiance observations between 2013 and 2021 for ~1.4 million lakes in the world that are ≥10 ha in surface area; resulting in a dataset termed LakeTEMP. Furthermore, mixing regime types were estimated for all lakes with a deterministic, physically-based model using the satellite-derived, lake-specific surface temperatures of LakeTEMP combined with other lake properties (ice cover, transparency, wind, solar radiation, and mean lake depth); resulting in a dataset termed LakeMIX. LakeTEMP and LakeMIX fill a crucial spatial data gap in large-scale limnological research, especially for the incorporation of small lakes and understudied geographies of remote regions. The data are in an analysis-ready format and freely available at https://www.hydrosheds.org/products/laketemp.

Second, we developed a global high-resolution model to estimate the long-term monthly average water temperatures of every river reach within the global digital river network of HydroATLAS, representing all rivers and streams exceeding either 10 km2 in upstream catchment area or 100 L/sec in average flow. The hybrid model uses a geostatistical approach to estimate the water temperature of headwater streams based on air temperature as well as a physical model component that includes streamflow routing and snow and groundwater contributions.

Our global, high-resolution water temperature datasets are intended to serve as a baseline that can aid in large-scale assessments of lake and river ecosystem conditions by categorizing different thermal regime types. Results are globally consistent and expected to be particularly valuable as first-order proxies in remote and data sparse regions, but less adequate for smaller scale studies due to local inaccuracies.

How to cite: Lehner, B., Korver, M., and Han, Z.: Lake and river temperature regimes at global scale derived from remote sensing imagery and geospatial modelling, EGU General Assembly 2026, Vienna, Austria, 3–8 May 2026, EGU26-15362, https://doi.org/10.5194/egusphere-egu26-15362, 2026.

EGU26-15389 | Posters on site | HS2.3.3

Multiscale teleconnection controls on river water temperature variability in a cold region regulated basin 

Hadi Sanikhani, Mostafa Khorsandi, Stephen J. Déry, and André St-Hilaire

River water temperature integrates atmospheric forcing with hydrological and operational controls, yet the extent to which large-scale climate modes shape river thermal variability in regulated, cold region basins is still not well constrained. We examine the imprint of two dominant Pacific modes, El Niño-Southern Oscillation (ENSO) and the Pacific Decadal Oscillation (PDO), on multi-decadal river temperature variability across the 47,200 km2 Nechako River Basin of western Canada, where a major reservoir and flow regulation may alter the transmission of climate signals to the river network. Monthly water temperature series were assembled for 10 stations over the period 1950-2024 using a combination of Air2Stream model hindcast simulations and available observations. We then used multiscale time-frequency and coherence diagnostics to characterize variability from interannual to decadal bands and to isolate the relative influence of ENSO and PDO while accounting for shared variability and the confounding effects of regulation. The analyses indicate a clear scale separation in climate-temperature linkages: ENSO is associated with intermittent interannual modulation of river temperatures, whereas PDO relates more consistently to lower-frequency variability, with spatially heterogeneous expression across the basin. Regulated reaches show reduced persistence of low-frequency thermal variability compared with less regulated sites, consistent with reservoir storage and operations that damp longer timescale climate imprints and reshape seasonal sensitivity. In particular, the combined effects of large-scale climate variability and regulation emerge most strongly during warm-season conditions, when thermal habitat constraints are most relevant. Overall, the results show that teleconnection controls on river thermal regimes are strongly scale-dependent and can be substantially modified by regulation in cold-region systems. Resolving these interacting controls provides a basis for interpreting past thermal changes and for improving climate-informed river management and warming risk assessments under future variability.

How to cite: Sanikhani, H., Khorsandi, M., Déry, S. J., and St-Hilaire, A.: Multiscale teleconnection controls on river water temperature variability in a cold region regulated basin, EGU General Assembly 2026, Vienna, Austria, 3–8 May 2026, EGU26-15389, https://doi.org/10.5194/egusphere-egu26-15389, 2026.

EGU26-17531 | Orals | HS2.3.3

Thermal sensitivity of rivers, an indicator for ecological refuges and hydrological model diagnostic 

Florentina Moatar, Guillaume Hevin, Marion Moussay, Jean-Christophe Duffet, Laurent Valette, Jean Marçais, Alban de Lavenne, and Flora Branger

Climate change constraints impose to identify streams and rivers that are, either resilient to atmospheric warming and can serve as ecological refuges, or highly sensitive and require restoration measures, e.g. tree planting, restoration of groundwater connections. In order to characterise the streams’ resilience or sensitivity, predict their evolution under climate change, and analyse scenarios of riparian restorations, we used data-driven analysis and physical-based modelling using thermal sensitivity (TS), as a key indicator linking climate forcing, hydrological processes and ecological relevance.

We first aggregated and harmonised a large database of French streams temperatures, i.e. 5515 (summer records) and 3143 (annual records) monitoring sites recorded between 2008 and 2024. We developed linear regressions for each site to predict weekly water temperature from weekly air temperature. The slope of the regression was qualified as the sensitivity of stream temperature (TS) of a given site to change in air temperature. Based on this large dataset, we identified several predictors of the TS, including surface area upstream sampling stations, baseflow index, riparian vegetation, summer air temperature. We found a significant positive correlation between TS and summer water temperatures, i.e. cold-streams are less sensitive to air temperature, and could therefore be important refuge areas for native species conservation.

We then used TS indicator to evaluate how a physically based thermal model (T-NET) coupled with a hydrological model (J2000) on a meso-scale contrasted lithology catchment could simulate daily water temperatures and discharges.  TS enables the attribution of water temperature model’s biases to specific hydrological processes, rather than merely quantifying overall model performance. In particular, low-TS streams, typically groundwater-dominated headwaters, highlight structural limitations in the representation of groundwater-driven heat fluxes.

Finally, we used the coupled model in sub-catchments with high-TS to study the influence of several riparian vegetation restoration scenarios on the stream temperatures. We could rank streams and rivers according to the temperature attenuation gain for specific riparian scenarios.

Our results suggest that TS indicator could be a relevant metric for biological applications, such as stream species distribution modelling.

How to cite: Moatar, F., Hevin, G., Moussay, M., Duffet, J.-C., Valette, L., Marçais, J., de Lavenne, A., and Branger, F.: Thermal sensitivity of rivers, an indicator for ecological refuges and hydrological model diagnostic, EGU General Assembly 2026, Vienna, Austria, 3–8 May 2026, EGU26-17531, https://doi.org/10.5194/egusphere-egu26-17531, 2026.

EGU26-18436 | ECS | Posters on site | HS2.3.3

Unravelling environmental drivers governing rapid warming and cooling in rivers spanning the conterminous United States 

James White, David Hannah, Darren Ficklin, and Seth Adelsperger

Abrupt river water temperature (Tw) transitions are a key driver of freshwater ecosystem health as this governs how quickly and readily biota can adapt to shifting thermal conditions. However, despite rapid Tw increases (‘surges’) or decreases (‘plummets’) occurring prevalently across various river typologies globally, they remain poorly explored. Most research to date has isolated hydropower, snowmelt and summer storm controls on surges and plummets in individual catchments, but multiple environmental drivers governing such rapid Tw changes across broad geographic domains have been seldom explored. To address this gap, we leveraged high resolution Tw data from 77 locations spanning the conterminous United States, whereby 5159 surges and 4020 plummets (∆±1 °C in a 15-minute period) were identified between 2008-2022. Subsequently, we quantified the effects of natural and anthropogenic environmental controls on surge and plummet tallies. For this, hydropower activity was identified a key driver nationally, as evidenced by its influence at the two monitoring stations exhibiting by far the highest number of surges and plummets (n = 950-1608). Catchment-wide urban cover and snowmelt influences were more consistently associated with surges and plummets, respectively. The same environmental drivers were also tested against different event-based Tw metrics derived for each surge / plummet. For this, climate exerted significant effects on Tw magnitudes and averages (i.e., minimum, mean and maximum Tw), while catchment influences like hydropower and geology yielded stronger influences on Tw variations occurring within each event (e.g., maximum rate of change, the number of Tw increases and decreases). This paper provides a better understanding of hydroclimatic and river catchment conditions governing surges and plummets. Such evidence could help inform management interventions by targeting river environments most sensitive to rapidly fluctuating Tw regimes, which could become more volatile with a changing climate. 

How to cite: White, J., Hannah, D., Ficklin, D., and Adelsperger, S.: Unravelling environmental drivers governing rapid warming and cooling in rivers spanning the conterminous United States, EGU General Assembly 2026, Vienna, Austria, 3–8 May 2026, EGU26-18436, https://doi.org/10.5194/egusphere-egu26-18436, 2026.

EGU26-18598 | ECS | Posters on site | HS2.3.3

Stream water temperature in Austria – From irregular observations to regionalized monthly and daily datasets 

Johannes Laimighofer, Leon Hohenstein, and Gregor Laaha

Austria hosts a relatively dense network of stream water temperature stations (n = 680), most operating since 2006. Measurement frequency is highly irregular both across stations and within individual stations, ranging from 5-minute records to sporadic single observations with imprecise timestamps. These characteristics complicate analysis and modeling, and systematic assessments of trends and modeling approaches for stream water temperature remain scarce in Austria.

We present a workflow that addresses these obstacles to produce extended daily and monthly stream water temperature datasets for all available stations. Missing values are imputed on an hourly basis for days with at least one observation per station. We fit a station-specific diurnal spline weighted by daily meteorological predictors to reconstruct the diurnal cycle. Results are compared to an approach using LSTM autoencoder. From these reconstructions, we derive daily minimum, maximum, and mean temperatures together with day-specific uncertainty. Monthly statistics (e.g., quantiles, maximum, mean) are obtained via Monte Carlo simulation. To extend and regionalize the datasets, we use LSTMs for daily resolution and a combination of Model-based boosting and Topkriging for monthly estimates.

The resulting products enable robust trend analyses and the evaluation of stream water temperature models across Austria.

How to cite: Laimighofer, J., Hohenstein, L., and Laaha, G.: Stream water temperature in Austria – From irregular observations to regionalized monthly and daily datasets, EGU General Assembly 2026, Vienna, Austria, 3–8 May 2026, EGU26-18598, https://doi.org/10.5194/egusphere-egu26-18598, 2026.

EGU26-18771 | ECS | Posters on site | HS2.3.3

Building regional LSTM models to predict river and groundwater temperature in Germany 

Harsh Shah, Felipe Saavedra, Zhenyu Wang, Ralf Merz, and Christian Siebert

River and groundwater temperatures (RT and GWT) play a critical role in aquatic ecosystem functioning, drinking-water resources, and geothermal potential. Their dynamics reflect delayed responses to atmospheric temperature as well as interactions between surface water and groundwater, while for GWT, geological and geomorphological controls may be particularly important. Under ongoing climate change, understanding the dominant controls on RT and GWT at regional scales is essential for anticipating and mitigating the impacts of warming water resources.

In this study, we develop two deep learning models to predict and analyse daily RT and GWT across Germany. For river temperature, we use low-frequency (biweekly to monthly) observations from the QUADICA v2 dataset (Ebeling et al., 2024) at more than 300 locations, combined with hydroclimatic variables from CAMELS-DE and catchment descriptors as predictors. For groundwater temperature, we use daily sensor measurements from the federal state of Thuringia. After data quality control, 77 monitoring wells are retained, and model inputs include groundwater levels, atmospheric temperature, precipitation, and static well characteristics such as depth and surface elevation. We employ an LSTM architecture to account for delayed responses to atmospheric forcing, which are known to be characteristic of water temperature dynamics. All variables are transformed using a Box-Cox transformation to approximate normal distributions. Model hyperparameters are tuned using a train-validation-test split (60%, 15%, and 25%, respectively) by minimizing the root mean squared error on the validation set, and overfitting is mitigated through early stopping.

Preliminary results show that the LSTM model for river temperature achieves a median Kling–Gupta efficiency (KGE) of 0.88 for unseen periods, indicating a high predictive skill. In contrast, the groundwater temperature model yields a median KGE below zero, highlighting substantially higher complexity of the system response compared to river temperature. This reduced performance is likely attributable to a combination of data limitations and missing site-specific controls, including river proximity, land use, human abstractions, and recharge processes. These findings highlight the need for larger groundwater datasets and richer explanatory variables to better understand and predict regional-scale GWT variability.

How to cite: Shah, H., Saavedra, F., Wang, Z., Merz, R., and Siebert, C.: Building regional LSTM models to predict river and groundwater temperature in Germany, EGU General Assembly 2026, Vienna, Austria, 3–8 May 2026, EGU26-18771, https://doi.org/10.5194/egusphere-egu26-18771, 2026.

EGU26-19585 | ECS | Orals | HS2.3.3

The integration of hydrological and heat exchange processes improves stream temperature simulations  

Kristin Peters, Jens Kiesel, Isabel Oswald, Björn Guse, Efrain Noa-Yarasca, Jeffrey G. Arnold, Javier M. Osorio Leyton, Katrin Bieger, and Nicola Fohrer

Stream temperature is an important variable for the aquatic system as it plays a key role for habitats of aquatic species and interacts with multiple other variables such as dissolved oxygen and nutrients. Therefore, it directly and indirectly affects fish, invertebrate communities, primary production and other biological processes. Due to global climate variability, increased stream temperatures are becoming more relevant in ecohydrological research. However, spatial and temporal stream temperature dynamics are impacted by a complex interplay between climate, hydrological processes, and catchment characteristics. In many ecohydrological model applications, this interplay is simplified or neglected. To address these challenges, a more detailed representation of stream temperature and its spatio-temporal variability is required.

Our study addresses the limitations of a simplified stream temperature model by using the ecohydrological model SWAT+ to demonstrate how process representation can improve simulations. SWAT+ currently predicts stream temperature based on a relatively simple linear relationship with air temperature. Important factors are not considered, since the influence of runoff components, heat exchange, and riparian shading are neglected in stream temperature predictions. To improve the representation of temperature related processes, we modified the SWAT+ model source code (version 60.5.4) and included mixing of hydrological processes (Ficklin et al., 2012), heat transfer processes (Du et al., 2018), and shading (Noa-Yarasca et al., 2023). The enhanced SWAT+ model was tested at 23 stations in the medium-sized mountainous Kinzig catchment (Central Germany) with high-resolution observed stream temperature data.

The enhanced model performed significantly better than the default model, achieving a mean KGE of 0.8 across multiple calibration sites (improved from 0.72 with the default linear model). We investigated, improved, and tested previous advances in stream temperature modelling within this work, highlighting the importance of accurate process representation. Furthermore, our results emphasize the necessity of a good hydrological calibration for a satisfactory stream temperature model performance. The resulting model serves as a valuable tool for ecological research and catchment management. By replacing empirical simplifications with process-based source code modifications, we provide a methodology for improving stream temperature representation that is transferable to other models.

How to cite: Peters, K., Kiesel, J., Oswald, I., Guse, B., Noa-Yarasca, E., Arnold, J. G., Osorio Leyton, J. M., Bieger, K., and Fohrer, N.: The integration of hydrological and heat exchange processes improves stream temperature simulations , EGU General Assembly 2026, Vienna, Austria, 3–8 May 2026, EGU26-19585, https://doi.org/10.5194/egusphere-egu26-19585, 2026.

EGU26-20927 | Posters on site | HS2.3.3

Assessing long-term variability in daily river water temperature in the Seine Basin, including the Paris metropolitan area 

Agnès Rivière, Guillaume Metayer, Damien Corral, Valerie Roy, and William Thomas

Surface water temperature (SWT) is a key factor of aquatic ecosystem balance but also of domestic,industrial and agricultural water uses, particularly in densely populated regions with intense humanactivities. SWT is affected by multiple drivers, including meteorological conditions (e.g. airtemperature, precipitation, solar radiation, wind speed) and anthropogenic activities (e.g. wastewatertreatment plant effluents, nuclear reactor cooling, datacenter cooling, and urban cooling systems).These drivers exhibit strong spatial and temporal variability. Consequently, SWT exhibits pronouncedvariability at short-term (e.g. day-to-day) timescales, influencing the structure of aquatic communities(Bonacina et al., 2023) and human uses, such as energy production (Du et al., 2026), as well as atlong-term timescales, particularly since the Industrial Revolution, in response to ongoing globalchange. Characterizing these dynamics at the scale of large river basins is essential for understandingclimate-change impacts, assessing risks of critical thermal thresholds, and informing adaptive waterand energy resources management strategies. Conducting such characterization is particularlychallenging in the Seine River Basin (France), a 76,238 km² basin that includes the Paris metropolitanarea, hosts 17 million inhabitants, and faces competing water and energy uses. This study aimed tocharacterize long-term daily river water temperature dynamics across the Seine River Basin from1958 to 2025. Continuous daily SWT time series from 1958 to 2025 were reconstructed at nearly 80monitoring stations using an LSTM model. The time series were subsequently analysed with respectto critical thermal thresholds identified for different water uses (drinking water supply, industrialcooling, irrigation, and ecosystem preservation), in order to assess the risks of reaching or exceedingthese thresholds during the study period. This approach enables the analysis of long-term thermaltrends and paves the way for identifying adaptation levers supporting sustainable, multi-use water-resource management.

How to cite: Rivière, A., Metayer, G., Corral, D., Roy, V., and Thomas, W.: Assessing long-term variability in daily river water temperature in the Seine Basin, including the Paris metropolitan area, EGU General Assembly 2026, Vienna, Austria, 3–8 May 2026, EGU26-20927, https://doi.org/10.5194/egusphere-egu26-20927, 2026.

EGU26-445 | ECS | PICO | HS2.3.4

Using large-sample high-frequency records to optimise water quality sampling 

Walter Hettler, Kerstin Stahl, Pia Ebeling, Nicola Fohrer, Jens Kiesel, and Carolin Winter

River water quality shapes both ecosystem health and human well-being. However, rapid fluctuations in a river's water quality can emerge between sampling intervals and escape detection. These brief events are often linked to intense rainfall or post-drought flushing. Consequently, low-frequency grab sampling can result in an incomplete representation of water quality in a river. By contrast, high-frequency monitoring at hourly or finer intervals can reveal these previously hidden water quality dynamics. What remains unresolved is how frequently we must sample to detect short-lived water-quality events without exceeding realistic monitoring effort. To address this, we systematically examine the effect of sampling frequency on accurately capturing riverine water-quality dynamics, with particular focus on extreme values. We use a novel, large-sample, Germany-wide dataset of multi-year hourly river water quality records from 72 catchments, covering more than 70 per cent of Germany's land area. We focus on eight primary parameters, including conductivity, dissolved oxygen, ammonia, nitrate, pH, phosphate, turbidity, and water temperature. Each time series is sub-sampled along a continuous range of interval lengths (hourly to annually). We analyse different measurement objectives through skewness, water quality duration curves, and weighted regression on time, discharge and season (WRTDS). For each interval, we compute skewness to diagnose extreme values' behaviour, as well as annual duration curves of water quality. WRTDS was applied to determine whether a relatively simple model can overcome sampling-interval-induced inaccuracy. Our results show that low-frequency intervals of one week or longer are consistently associated with a considerable loss of information, most substantially for dissolved oxygen, pH and conductivity. This loss was pronounced for extreme values, while the mean and median were less affected. WRTDS did not substantially combat the information loss associated with increasing sampling intervals. Estimates of skewness and coefficient of variation worsened, while median values showed only minor improvements. We conclude that sampling frequency must align with the monitoring objective and be explicitly incorporated into the interpretation of the results. Coarse sampling can approximate central tendencies, but not extremes or variability. These findings underscore the need for tailored sampling strategies to optimise water quality monitoring and ensure that critical fluctuations are not overlooked.

How to cite: Hettler, W., Stahl, K., Ebeling, P., Fohrer, N., Kiesel, J., and Winter, C.: Using large-sample high-frequency records to optimise water quality sampling, EGU General Assembly 2026, Vienna, Austria, 3–8 May 2026, EGU26-445, https://doi.org/10.5194/egusphere-egu26-445, 2026.

EGU26-998 | ECS | PICO | HS2.3.4

Are hydro-graphically assessed streamflow components hydro-chemically meaningful? 

Sofia Frietsch and Tobias Schuetz

In recent years, extreme weather events such as intense rainfall and prolonged droughts are occurring with increasing frequency all over Central Europe. To deal with the hydrological consequences an improved understanding of storage and flow dynamics within hydrological catchments might be essential. Hence, the objective of this study is to develop and test a parsimonious work-routine to identify dominant streamflow components and dynamic catchment storages in complex hydrogeological settings.

Based on a two-year field campaign at public streamflow gauging stations in western Germany, we investigated water quality dynamics in two nested catchments with long-term hydrological records. We collected daily water samples and analyzed dissolved organic carbon, nitrate, electrical conductivity, silica, and stable water isotopes. Using these data, we evaluated a hydrographical filter algorithm and a subsequent linear storage detection method, focusing on their hydro-chemical interpretability. We then applied the resulting workflow to published datasets from several nested catchments in Switzerland and the United States. The dynamic hydrographical filter algorithm, DelayedFlowIndex (DFI), is derived from the classical Baseflow Index (IH-UK). It produces Characteristic Delay Curves (CDCs) that describe average catchment drainage behavior with filter widths from 0 to 60 days after a streamflow increase. We improved an existing workflow that divides CDCs into several linearly draining subsets. The new automated routine determines the catchment-specific number of sub-storages. Testing this approach on more than 100 catchments showed that both CDCs and the number of sub-storages can be linked to distinct morphological catchment characteristics. To increase confidence in the hydrological interpretability of hydrographically derived streamflow components, we compared stream hydro-chemical information from our field sites and from published datasets with the resulting flow components. We also examined their roles in streamflow composition throughout the year. At our test sites, rapid flow components showed elevated DOC concentrations. Intermediate components displayed pronounced nitrate peaks. Delayed components had increased silica concentrations, while highly delayed components were associated with higher electrical conductivity. In the downstream sub-catchment, these hydro-chemical signals were additionally shaped by seasonal effects. Water samples collected during a 45-day drought in spring 2025 at both gauges provided valuable information for validating the hydro-chemical signatures of very slow storage components, which are rarely observable.

The streamflow components derived from the DFI show consistent correlations with distinct solute signatures, demonstrating that they are hydro-chemically meaningful. Consequently, DFI analysis combined with the automated storage-delineation algorithm provides a robust, streamflow-based method for identifying catchment-specific flow components. This approach offers valuable insight into storage depletion processes and groundwater dynamics, particularly under extreme low-flow conditions in (mid-)mountain regions.

How to cite: Frietsch, S. and Schuetz, T.: Are hydro-graphically assessed streamflow components hydro-chemically meaningful?, EGU General Assembly 2026, Vienna, Austria, 3–8 May 2026, EGU26-998, https://doi.org/10.5194/egusphere-egu26-998, 2026.

EGU26-3393 | ECS | PICO | HS2.3.4

Pollution dynamics in the lower Bengal Delta of Bangladesh 

Simu Akter and Matthias Gassmann

Understanding pollution dynamics in tropical coastal rivers and groundwater is critical due to the complex landscape interface between terrestrial, mangrove and marine processes, especially in the lower Bengal Delta of Bangladesh. We are conducting hydrogeochemical statistics by combining in-situ and ex-situ hydrochemical data at high and low tide to estimate pollution dynamics in 90 km long river networks of three major rivers along with 30 groundwater wells in the catchments. We used the Hydrochemical Facies Evolution Diagram (HFED) to assess seawater intrusion and freshening stages with dominant ions (cation and anion) visualised through Piper Diagram. Results showed that river water in both high and low tide and groundwater chemistry is dominated by Na+ and Cl- during the dry season, with all river water samples (100%) plotted in the seawater intrusion zone (Na-Cl).  In contrast, 50% of groundwater chemistry is dominated by Na+ and Cl- and plotted in the seawater intrusion zone (Na-Cl), whereas 23.33% is dominated by Ca2+ + Na+ and HCO3- and plotted in the mixed zone, 23.33% is dominated by Ca2+ + Mg2+ and HCO3-, and plotted in the temporary hardness zone, and lastly 3.34% is dominated by Na+ + K+ and HCO3- + CO32- and plotted in the alkali carbonate zone. Furthermore, Ca2+, Na+, and HCO3- ions indicated that groundwater chemistry is significantly influenced by rock weathering processes, which is also evident in the Gibbs diagram. Regression analysis illustrated significant positive relationship (r2) between Na+ and Cl- in river (r2 = 0.99) and groundwater (r2 = 0.93). Further, box and whisker plots illustrated variation in ions’ concentration in three rivers, where 2nd river has higher variation compared to the 1st river (upstream) and 3rd river (downstream). These variations align with diverse land use patterns along 2nd riverbank including mega coastal city, industries, food processing facilities, agriculture, and aquaculture. The degree of pollution including nutrient parameters such as NO3- indicated high pollution levels in river catchments which ranged from 95.6% to 99%. Downstream groundwater samples showed higher pollution levels (89.3%) compared to upstream groundwater (3.4%). Possible reasons for increasing water pollution include variations in freshwater flow associated with precipitation and temperature patterns. Additionally, diverse land use patterns from upstream to downstream in the river catchments have significant impact on water pollution levels and are considered as an important anthropogenic pollution source. The research offers a novel approach for providing in-depth pollution characterization through ion concentration analysis, which aids regional-scale water quality management in the lower Bengal Delta of Bangladesh.

How to cite: Akter, S. and Gassmann, M.: Pollution dynamics in the lower Bengal Delta of Bangladesh, EGU General Assembly 2026, Vienna, Austria, 3–8 May 2026, EGU26-3393, https://doi.org/10.5194/egusphere-egu26-3393, 2026.

EGU26-6542 | ECS | PICO | HS2.3.4

Assessing changes in streamwater chemistry along a rural–urban gradient 

Raphaël Miazza and Paolo Benettin

Urban expansion is altering hydrological processes and water quality dynamics in many catchments. At a regional scale, catchments are often only partially urbanized, with land cover combining both natural and developed areas. A common configuration is a predominantly rural upper part, where forests, agricultural land, and natural landscapes prevail, which transitions to increasingly urbanized areas downstream. This land cover arrangement creates a rural–urban gradient along the stream network, providing a natural framework to assess how land cover influences hydrochemical dynamics.

Here, we investigate the influence of this land-cover gradient on streamwater chemistry in two parallel catchments in the Lausanne area (Switzerland). Five stream gauges monitor nested sub-catchments (5–22 km²) spanning urban land cover fractions from 5% to 40%. Stream gauges continuously measure streamflow and water quality parameters (electrical conductivity, temperature, turbidity, and fDOM), complemented by weekly and event-based streamwater sampling for major ions and trace metals.

Results from the first year of measurements confirm that urbanization strongly alters hydrochemical dynamics. We find that individual solutes respond differently along the land-cover gradient, reflecting contrasting dominant sources (geogenic, agricultural, and urban). This results in distinct downstream patterns in their mean concentrations. Despite these differences, most solutes exhibit increasingly dilution-dominated concentration–discharge (C–Q) relationships in the more urbanized downstream sub-catchments. This behavior is consistent with relatively constant solute inputs (from point sources or spatially diffuse sources) that become rapidly diluted during high-flow conditions by low-solute runoff generated from impervious surfaces. Together, these observations provide new insights into how urbanization influences the storage and release of water and solutes. The approaches developed and insights gained will support a more holistic understanding of water and solute dynamics across diverse catchment types, as urban areas represent an ever-growing proportion of landscapes worldwide.

How to cite: Miazza, R. and Benettin, P.: Assessing changes in streamwater chemistry along a rural–urban gradient, EGU General Assembly 2026, Vienna, Austria, 3–8 May 2026, EGU26-6542, https://doi.org/10.5194/egusphere-egu26-6542, 2026.

EGU26-8247 | PICO | HS2.3.4

A modelling approach to disentangle DOC release processes from riparian wetlands  

Benny Selle, Remi Dupas, Ophelie Fovet, Anne Jaffrezic, Laurent Jeanneau, and Oliver Lechtenfeld

Release of dissolved organic carbon (DOC) from soils into pore waters can occur via three distinct processes: (i) microbial decomposition of soil organic matter, producing soluble organic molecules; (ii) desorption of DOC from soil mineral surfaces, such as oxyhydroxides and clays, driven by increasing pH in pore waters and (iii) reduction of ferric iron in waterlogged soils, leading to the dissolution of amorphous Fe(III) oxyhydroxides that were previously coprecipitated with dissolved organic matter. Once released into pore waters, DOC can either be mineralised or exported to surface waters.

Riparian wetlands are important sources of organic matter and sites where all three DOC release mechanisms may occur. DOC release via microbial decomposition (process i) is typically associated with a rapidly cycling DOC pool that fuels microbial mineralisation, whereas desorption and reductive dissolution processes (ii and iii) are often linked to DOC mobilisation and export of a potentially more stable, mineral-associated pool of soil organic matter. Despite their importance, the relative contributions of these processes and their controlling factors remain incompletely understood. Improved understanding of these mechanisms may provide insight into the extent to which these processes are likely to influence the long-term carbon storage capacity of wetland soils.

Against this background, we propose and demonstrate a modelling approach to disentangle the processes and drivers of seasonal DOC mobilisation in riparian pore waters of the Kervidy-Naizin Critical Zone Observatory in western France. First, a principal component analysis was applied to weekly to biweekly measurements (period from November 2022 until May 2023 and 17 sites) of pH, nitrate, DOC, soluble reactive phosphorus, ferrous iron, five variables describing dissolved organic matter composition based on fluorescence properties, and hydrological variables. Scores of the first two principal components - interpreted as proxies for DOC desorption and reductive dissolution of coprecipitates - were extracted. Second, these component scores, together with two additional variables assumed to represent lateral DOC leaching and microbial decomposition of soil organic matter, respectively, were used as predictors in a generalized additive model (GAM) of DOC concentrations. Third, the GAM was used to quantify the relative contributions of the four processes to DOC increases.

Our analysis suggests that desorption was the dominant process responsible for DOC release during winter and spring in the studied riparian zones of the Kervidy-Naizin catchment. These results demonstrate that disentangling the processes contributing to seasonal DOC mobilisation in riparian soils - such as pH driven desorption and reductive dissolution of coprecipitates - is feasible using a combined multivariate and additive modelling approach. To further improve the quantification of individual process contributions, additional measures of DOC quality, for example derived from FT-ICR MS, are likely to be beneficial.

How to cite: Selle, B., Dupas, R., Fovet, O., Jaffrezic, A., Jeanneau, L., and Lechtenfeld, O.: A modelling approach to disentangle DOC release processes from riparian wetlands , EGU General Assembly 2026, Vienna, Austria, 3–8 May 2026, EGU26-8247, https://doi.org/10.5194/egusphere-egu26-8247, 2026.

Understanding the patterns and mechanisms of DOC export from catchments is key to interpreting and quantifying land-to-ocean lateral carbon transport process. The DOC export is highly dynamic and storm-driven, especially in mountainous headwater catchments. Yet traditional low-frequency monitoring and modelling often misses rapid DOC changes and fail to identify potential shifts on DOC export pattern and process, limiting a deeper understanding of short-term export mechanisms. We have conducted high-frequency measurements combined with process-based modeling in a mountainous flash flood headwater catchment in China, to reveal how hydrological processes control DOC mobilization and export under varying storm conditions. Based on high-frequency measurements and hysteresis analysis, we have found a three-phase concentration-discharge (C-Q) relationship of DOC and a shift on DOC export pattern from transport-limited to source-limited across extreme storms. The studied catchment streamflow and DOC dynamics were successful reproduced by the process-based INCA-C model at hourly steps, further supporting the quantification of different flow pathways’ contributions on DOC output. The results showed that more DOC were exported by subsurface flows from shallow organic soil with greater peaks and shorter time-to-peaks at higher storm intensities. DOC is primarily sourced from subsurface runoff from the mineral layer (73 %–77 %) during moderate events, whereas it is primarily sourced from subsurface runoff from the organic layer (61 %–79 %) during extreme events. The two contrasting contributions suggest that hydrological pathway controls and DOC dynamic patterns can shift owing to runoff generation influenced by storm intensity. Our research revealed mechanisms on shifted DOC export regimes at a typical flash flood catchment with increasing storm intensity and changing flow-path contributions. The findings highlight high-frequency measurements and modellings for insights into hydrological controls on DOC export process.

How to cite: Wu, Y., Cheng, L., Su, H., Fu, C., and Qin, S.: Dissolved organic carbon export mechanism at a typical flash flood catchment: insights from high-frequency measurements and modellings, EGU General Assembly 2026, Vienna, Austria, 3–8 May 2026, EGU26-8828, https://doi.org/10.5194/egusphere-egu26-8828, 2026.

EGU26-9392 | PICO | HS2.3.4 | Highlight

Where land and water meet: The role of riparian zones in catchment nutrient cycling 

Anna Lupon, José L. J. Ledesma, Sílvia Poblador, Carolina Jativa, Francesc Sabater, Ryan Sponseller, Eugènia Martí, Hjalmar Laudon, and Susana Bernal

Nutrient supply, processing, and transport in fluvial ecosystems have received increasing attention over recent decades due to their ecological significance and influence on water quality. Within catchments, riparian zones are widely recognized as critical control points for nutrient exports, serving as the last buffer zone of terrestrial nutrient exports. However, understanding their influence on downstream nutrient patterns, compared with other nutrient sources, remains poorly constrained. In this talk, we examine some of the key mechanisms by which riparian zones influence stream nutrient dynamics across different spatial and temporal scales. By combining synoptic surveys across multiple catchment compartments (soils, groundwater, stream) with modelling approaches, we demonstrate the dual role of riparian zones as both major regulators for terrestrial nutrient inputs and controls of stream metabolism and associated nutrient processing. Further, we discuss the hydrological and biogeochemical significance of riparian zones, with particular emphasis on its variability across seasons, along the river continuum and among biomes. Overall, this talk aims to highlight the need for an integrated, landscape-scale perspective to advance our understanding of catchment biogeochemistry.

How to cite: Lupon, A., J. Ledesma, J. L., Poblador, S., Jativa, C., Sabater, F., Sponseller, R., Martí, E., Laudon, H., and Bernal, S.: Where land and water meet: The role of riparian zones in catchment nutrient cycling, EGU General Assembly 2026, Vienna, Austria, 3–8 May 2026, EGU26-9392, https://doi.org/10.5194/egusphere-egu26-9392, 2026.

EGU26-9743 | ECS | PICO | HS2.3.4

Dynamics of the Dissociation of Dissolved Organic Acids across Swedish Streams over 35 Years 

Anna Lackner, Rolf David Vogt, Carin Sjöstedt, Jon-Petter Gustafsson, and Kevin Bishop

Dissolved organic matter (DOM) plays a key role in weakly-buffered surface water ecosystems by influencing pH, metal speciation, and the bioavailability of trace elements through complexation reactions. Despite a substantial decrease in acid deposition over recent decades, many Swedish streams and lakes remain relatively acidic, largely due to the natural acidity associated with DOM.  A robust understanding of the acid–base properties of DOM is therefore essential for accurately assessing natural water acidity and determining the continued need for liming as a mitigation measure. In this study, we analyzed national monitoring data comprising more than 42,000 samples collected between 1990 and 2024 from 136 streams across Sweden to quantify long-term changes in DOM acidity. Organic matter charge density at pH 5.6 (OMCD5.6) was used as an indicator of the dissociation behaviour of dissolved organic acids. While spatial variation in median OMCD5.6 among sites was relatively small, compared to variation within individual stations, approximately two-thirds of the sites exhibited significant temporal trends, predominantly reflecting a decline in organic matter charge density over time. Lower charge density implies reduced dissociation of organic acids and, at constant DOM concentrations, a diminished influence of DOM on stream water pH. We further examine how catchment characteristics, such as atmospheric deposition, land-use, and water chemistry, and their long-term changes, relate to observed trends in OMCD5.6. Our findings challenge the common assumption that changes in DOM dissociation properties can be neglected in surface water chemistry assessments and highlight the need to explicitly consider shifts in DOM acid–base properties.  

How to cite: Lackner, A., Vogt, R. D., Sjöstedt, C., Gustafsson, J.-P., and Bishop, K.: Dynamics of the Dissociation of Dissolved Organic Acids across Swedish Streams over 35 Years, EGU General Assembly 2026, Vienna, Austria, 3–8 May 2026, EGU26-9743, https://doi.org/10.5194/egusphere-egu26-9743, 2026.

EGU26-12167 | ECS | PICO | HS2.3.4

Extreme precipitation controls P export mechanisms and N:P stoichiometry in contrasting Po River agricultural basins 

Monia Magri, Edoardo Severini, Elisa Soana, Maria Pia Gervasio, Fabio Vincenzi, Giuseppe Castaldelli, and Marco Bartoli

Diffuse agricultural pollution is a major driver of nutrient enrichment in European surface waters, and its impacts are expected to intensify as climate change alters the timing, magnitude, and intensity of precipitation events. The Po River basin, like many nutrient hotspots worldwide, exhibits a chronic excess of nitrogen (N) driven by the preferential export of highly mobile nitrate. Extreme precipitation events, however, can also mobilize less mobile nutrient pools through erosion-driven transport. Phosphorus (P), which preferentially accumulates in the solid phase due to its strong affinity for soil particles, is therefore mainly exported during high-flow conditions, leading to marked, event-driven shifts in nutrient stoichiometry. Yet, how these processes vary across basins with contrasting nutrient surpluses, land management, and physical settings remains poorly understood.

In this study, we analyzed N and P export dynamics in two agricultural basins of the Po River watershed that experienced similar climatic anomalies but differ strongly in their biogeochemical and physical characteristics. The Chiese basin is characterized by high livestock density and a marked nutrient surplus, whereas the Volano basin exhibits lower livestock pressure and overall nutrient deficit. The two basins further contrast in soil permeability and topography, providing a natural experiment to investigate control mechanisms on nutrient export.

Monthly samplings carried out at the basin outlets throughout 2024-2025 were combined with high-frequency autosampler measurements (every 3 hours) during hydrological extremes. Dissolved and particulate phosphorus, including its bioavailable fraction and particulate nitrogen, together with dissolved inorganic nitrogen species (NO3-, NO2-, NH4+), were quantified and linked to continuous discharge records.

Both basins displayed elevated nutrient concentrations, with contrasting partitioning between dissolved and particulate forms linked to differences in hydrological functioning. Hydrological extremes exerted divergent controls on nutrient behaviour, resulting in dilution or strong mobilization responses. Event-specific concentration-discharge relationships varied with seasonality and rainfall intensity. Overall, extreme events induced variable but generally P-dominated shifts in nutrient stoichiometry, with short-lived pulses accounting for a substantial fraction of annual export and temporarily altering N:P ratios.


How to cite: Magri, M., Severini, E., Soana, E., Gervasio, M. P., Vincenzi, F., Castaldelli, G., and Bartoli, M.: Extreme precipitation controls P export mechanisms and N:P stoichiometry in contrasting Po River agricultural basins, EGU General Assembly 2026, Vienna, Austria, 3–8 May 2026, EGU26-12167, https://doi.org/10.5194/egusphere-egu26-12167, 2026.

End-member mixing models are widely used in catchment geochemistry to interpret the observed stream chemistry as a linear combination of underlying end-members, and infer lithological source contributions, carbon fluxes or weathering rates. In pursuit of their conceptual simplicity, these models rely on a set of assumptions including conservative behavior of tracers, exactly identified (a-priori) number of sources with known and constant tracer signatures. While the conservativity of certain tracers is well-established, the accurate identification of geochemical end-member signatures from field investigations remains a challenge, contributing to uncertainties in inferred mixing fractions and subsequent interpretations. However, another layer of uncertainty, pertaining to the validity of the mixing model is often overlooked in this process. 

Here, we use high-frequency stream chemistry and discharge datasets from multiple small and mesoscale catchments to demonstrate the existence of large inaccuracies in inferred mixing fractions, irrespective of the perfect identification of (supposed) end-members. We employ a geometrical approach to visualize observed stream chemistry with reference to an ideal mixing space spanned by a given set of tracers. We then relate deviations from this reference space to hydrology (using discharge as a proxy) to argue that such deviations cannot be explained by the existence of another static unidentified end-member, but only through either discharge-dependent shifts in the source signatures themselves, or secondary geochemical processes correlated with discharge. This is evidenced by strong synchronization between the mixing model residuals and discharge time series, highlighting the role of discharge as a confounding factor in geochemical mixing analyses.

Preliminary results indicate that the variance unaccounted for by the mixing model due to the violation of its assumptions is comparable to, or even exceeds, the magnitude of the inferred mixing contributions. This raises questions on treating mixing as the primary control of observed variability in stream chemistry. Furthermore, we also demonstrate how data-driven inference of the number/nature of geochemical end-members using Principal Component Analysis, a frequently adopted practice, could be heavily biased due to this uncertainty. 

Overall, our results dispute the common practice of using mixing models to infer catchment geochemical processes, and call for exercising caution in downstream analyses such as calculating weathering and solute fluxes. We suggest that establishing the existence of a tenable mixing space must be a prerequisite for any subsequent geochemical interpretation.

How to cite: Mallik, A. P. and Gaillardet, J.: Discharge as a confounding control on geochemical mixing inferences, and implications on catchment-scale weathering flux estimates, EGU General Assembly 2026, Vienna, Austria, 3–8 May 2026, EGU26-12695, https://doi.org/10.5194/egusphere-egu26-12695, 2026.

EGU26-13450 | PICO | HS2.3.4

From Pattern to Process at a River Confluence: A Process-based Reactivity-Hydrodynamic Framework from High-resolution Synoptic Monitoring 

Ponnambalam Rameshwaran, Chris Pesso, Andrew J Wade, and Nick Everard

High-resolution, water quality observations reveal complex instream transformations and mixing of solutes dependent on the source and the prevailing flow conditions, with both concentration and dilution effects apparent. Here we explore river confluence behaviour using a combination of an Acoustic Doppler Current Profiler (ADCP) and multiparameter water quality sonde to resolve solute and particulate behaviours of tributary mixing. We hypothesise that confluence-scale functional heterogeneity is spatially persistent, but that hydrological forcing systematically alters the predominance of source- and sink-type behaviours spatially across the confluence. To test this, we implemented an innovative quasi-synoptic field campaign at the Kennet-Thames River confluence (Reading, UK). Using an uncrewed moving-boat platform (ArcBoat), we collected simultaneous, high-resolution data on velocity, nutrients (NH₄⁺, NO₃⁻), fluorescent dissolved organic matter (fDOM), and turbidity on three days. Each time, the reach was subdivided into 14 fixed spatial zones, allowing reproducible analysis across the three hydrologically distinct campaigns: higher winter flow (12 Feb 2025), a rainfall event pulse (26 Feb 2025), and low spring baseflow (14 Mar 2025). 

We evaluated solute behaviour using a Reactivity Index (RI) based on conservative mixing and integrated it with a Hydrodynamic Index (H) to classify each observation into process-informed categories (e.g., Reactive, Retentive, Low-energy depletion, Attenuating, and Conservative). Extending the same logic to turbidity yielded complementary particulate-transport classes (Local Input, Advective Input, Sediment Deposition, Advective Dilution and Conservative mixing).

Zone-wise analysis revealed exceptionally strong and persistent spatial structuring of functional classifications across campaigns (Kruskal–Wallis ε² = 0.28–0.81, p < 0.0001 for solute RIs). Across the fortnightly transition from event to baseflow conditions, the Kennet-influenced pathway exhibited a coherent regime shift in both dissolved and particulate classifications: during the rainfall snapshot, NH₄⁺ enrichment and turbidity input classes dominated, whereas under baseflow the same corridor shifted toward attenuation-depletion and dilution-deposition dominance.

These results demonstrate that confluence function is organised into distinct functional zones. Hydrological forcing does not erase these zones but alters the predominant process, driving downstream branch-wide (Kennet-influenced, middle mixing corridor, and Thames-influenced branches) switches from source to sink dominated regimes. Because confluences integrate signals from contrasting tributary sub-catchments, this approach provides a transferable workflow for translating high-resolution synoptic patterns into process-based diagnostics that complement fixed-station monitoring and help locate source- versus sink-dominant behaviour within river catchments.

How to cite: Rameshwaran, P., Pesso, C., Wade, A. J., and Everard, N.: From Pattern to Process at a River Confluence: A Process-based Reactivity-Hydrodynamic Framework from High-resolution Synoptic Monitoring, EGU General Assembly 2026, Vienna, Austria, 3–8 May 2026, EGU26-13450, https://doi.org/10.5194/egusphere-egu26-13450, 2026.

To test hypotheses about catchment processes inferred from hydrological and hydrochemical patterns observed at the outlet, measurements are needed at a high temporal frequency from multiple water sources distributed in space. Here we present the Water Analysis Trailer for Environmental Research (WATER), a trailer-based mobile sampling platform capable of autonomously measuring stable water isotopes, nitrate, electrical conductivity, pH and temperature for 72 samples per day, collected from up to 11 sources. As a proof of concept, the WATER was deployed to the Schwingbach Environmental Observatory (1.03 km2) in Hesse, Germany, where six water sources were analysed (2 × stream water, 3 × groundwater, 1 × precipitation) for a period of six months. The multi-source, high-frequency data offered new insights into catchment functioning that had not been revealed by previous, lower-resolution sampling campaigns. For example, rapid vertical movement of incoming precipitation into the soil and a strong linkage between shallow sub-surface flow paths and the stream became apparent during events. In addition, streamflow generation and water quality at the catchment outlet showed likely signs of influence from nearby water sources and arable farming practices. Simulating the reduced sampling frequency associated with connecting additional sources to the WATER indicated that key features of the collected data would likely be preserved if sampling occurred over a period of several months. Overall, the WATER provides a mobile and scalable approach for moving from pattern-based inference to process understanding through multi-source, high-temporal-frequency measurements.

How to cite: Neill, A., Windhorst, D., Kraft, P., Sahraei, A., and Breuer, L.: The Water Analysis Trailer for Environmental Research (WATER): Proof-of-concept and process insights from multi-source, high-frequency measurements, EGU General Assembly 2026, Vienna, Austria, 3–8 May 2026, EGU26-17655, https://doi.org/10.5194/egusphere-egu26-17655, 2026.

EGU26-20763 | PICO | HS2.3.4

Terrain and land management practice influences on water quality in oil palm compared with forested catchments in Sabah, Malaysian Borneo 

Rory Walsh, Lelavathy Mazilamani, Mayu Ogiya, Anand Nainar, Kogilavani Annammala, Siti Nurhidayu, Glen Reynolds, and Rob Ewers

Oil palm plantations have become a major land-use in parts of the wet tropics over the past 40 years. There has been much concern about its hydrological, erosional, water quality and nitrous emissions (and hence climate change) consequences.  These impacts, however, may vary considerably with terrain  (hilly terrain with bench-terracing being very different from low- and    moderate-slope terrain without bench-tarracing), details of land management practices, and  over the c. 25 years life-cycle of oil palm plantations – but remain largely unassessed.  With regard to water quality, this paper presents evidence from catchment studies in hilly terrain since 2012 in the headwaters of the Brantian and Kalabakan river basins in Sabah (Malaysian Borneo), with a  particular focus on results from a bench-terraced, mature oil palm catchment (3.27 km2).  Studies there formed part of Stability of Altered Forest Ecosystems (SAFE) Project, within which comparisons were drawn between the oil palm (OP) catchment, a near-primary (VJR Virgin Jungle Reserve) catchment, and six multiple-logged catchments. All catchments were instrumented from 2011 with sensors recording 15-minute data on conductivity, turbidity, water temperature and water depth (and hence discharge). This was supplemented by (a) a programme of monthly spot sampling for water chemistry, (b) opportunistic storm event sampling of water chemistry since 2014, (c) a regional survey of baseflow water chemistry of oil palm catchments in 2014; and (d) exploratory application in June 2025 of a multi-isotope approach (using δ²H–H₂O, δ¹⁸O–H₂O, δ¹⁵N–NO₃⁻, and δ¹⁸O–NO₃⁻) in exploring water chemistry (particularly nitrate values) of the oil palm and VJR catchments. The regional survey highlights significant but relatively modest increases in nitrate, sulphate and chloride levels at baseflow that also vary in magnitude between catchments.   For the OP catchment, (1) nitrate levels at baseflow differ little from values in forested catchments, but levels of chloride and sulphate are much elevated; (2) both the conductivity records and storm-event sampling, however, indicate the importance of flushing of fertilizer-derived nitrates and sulphates during some (but not all) storm events.  Reasons for the regional survey and OP catchment results are explored, particularly the influence of (1) the enhanced stormflow and reduced baseflow of hilly oil palm terrain with its bench-terracing and high track density and (2) the varying degree of efficiency of fertilizer uptake linked to different application techniques and frequency strategies. Results of the multi-isotope (nitrogen, oxygen and hydrogen) isotope approach of 2025 highlight differences in isotope values (a) downstream within the OP catchment, (b) with changes in discharge before and after a rainstorm, (c) between the OP and VJR catchments and (d) between the OP catchment and published results from other studies in low slope terrain in Peninsular Malaysia.  Links with nitrate source processes are explored.  Possible ways in which impacts on pollution might be reduced are presented and discussed, including how to avoid possible conflicts with strategies to reduce erosion, storm runoff (and downstream flooding) and nitrous atmospheric emissions from oil palm terrain.    

How to cite: Walsh, R., Mazilamani, L., Ogiya, M., Nainar, A., Annammala, K., Nurhidayu, S., Reynolds, G., and Ewers, R.: Terrain and land management practice influences on water quality in oil palm compared with forested catchments in Sabah, Malaysian Borneo, EGU General Assembly 2026, Vienna, Austria, 3–8 May 2026, EGU26-20763, https://doi.org/10.5194/egusphere-egu26-20763, 2026.

Quantifying solute and particulate export from river catchments is particularly challenging when concentration measurements are sparse, irregular, or limited to low‑frequency monitoring schemes. In such conditions, traditional regression‑based approaches used to interpret concentration–discharge (C–Q) relationships often fail to capture the full range of hydrological and hydrochemical variability. Here we present a bootstrap‑based methodology designed to robustly infer export mechanisms and associated uncertainties using minimal observational data.

The approach combines daily discharge series (Q) with available concentration measurements (C), explicitly separating rising and falling limbs of the hydrograph to account for hysteresis effects and asymmetric mobilization dynamics. In each bootstrap iteration (N≈1000), entire (Q, C) pairs are resampled and the C–Q relationship is fitted. For each parameter set, cumulative load duration curves (Mp%, p = 1–99) are computed, enabling the derivation of confidence intervals for both regression parameters and export‑pattern metrics.

The method yields a full empirical distribution of Mp%, allowing process‑based inference even in catchments with very limited measurements. Results demonstrate that bootstrap‑derived parameter distributions reliably distinguish dilution vs. mobilization patterns, identify “hot moments” of export, and quantify hysteresis strength. Percentile‑based confidence intervals effectively communicate uncertainty without assuming parametric error structures, making the framework well-suited for diverse catchment types and monitoring strategies.

This work shows that bootstrap resampling provides a powerful, model‑agnostic tool for moving “from pattern to process” in data‑scarce environments. The methodology enables more defensible interpretation of C–Q behaviours, supports targeted design of water‑quality monitoring networks, and provides transferable insights for ungauged or poorly sampled catchments.

How to cite: Szalińska, W., Ciupak, M., and Tokarczyk, T.: From Sparse Measurements to Robust Inference: A Bootstrap Framework for Solute and Particulate Export Mechanisms Assessment in River Catchments, EGU General Assembly 2026, Vienna, Austria, 3–8 May 2026, EGU26-20890, https://doi.org/10.5194/egusphere-egu26-20890, 2026.

EGU26-20925 | ECS | PICO | HS2.3.4

An ecosystem-oriented framework reveals coupled climate and human controls on river water quality 

Fei Wang, Jianqing Du, and Yanfen Wang

River water quality, governed by complex natural and anthropogenic drivers and further intensified by global climate change, poses growing threat to aquatic ecosystems and human water use. To systematically disentangle drivers in controlling river water quality, an ecosystem-oriented framework that bridged and included diverse catchment attributes  (e.g., climate, topography, lithology, land cover, and human influence) was proposed and tested against monthly data from 149 catchments in the Yellow River Basin (YRB). The framework addressing the vegetation and soil mediated mechanisms achieved satisfactory performance and reiterated the dominant role of human influence as primary source controlling water quality. Legacy effects of topographical and lithological controls, which shaped present-day soil, vegetation, and geomorphological characteristics by regulating long-term energy and material fluxes, led to great positive effect of aspect and a negative effect of pb (basic plutonics rocks) proportion on concentrations of water quality metrics represented by organic pollution indicators (BOD5, COD, and permanganate index) and nitrogen and phosphorus loads (ammonia nitrogen, total nitrogen, and total phosphorus). Within the ecosystem-oriented framework, vegetation and soil exerted opposite mediating effects on climate-water quality relationships, partially offsetting each other. Moreover, direct effects of warming-wetting climate positively influenced the concentrations of organic pollution indicators, while negatively affected nitrogen and phosphorus loads. The proposed framework clarifies the relative roles of diverse catchment attributes and offers a transferable basis for anticipating future water quality trajectories under ongoing climate change, supporting tailored river water quality management.

How to cite: Wang, F., Du, J., and Wang, Y.: An ecosystem-oriented framework reveals coupled climate and human controls on river water quality, EGU General Assembly 2026, Vienna, Austria, 3–8 May 2026, EGU26-20925, https://doi.org/10.5194/egusphere-egu26-20925, 2026.

EGU26-966 | ECS | Posters on site | HS2.3.5

Are Existing Water Quality Indices (WQIs) Fit for Purpose? Evaluating Their Applicability to Irrigation Surface Water Quality 

Muskula Sai Bargav Reddy, Krishna Chaitanya Maturi, and Vinnarasi Rajendran

Globalization-driven food demand and rapid urbanization have intensified agricultural intensification and land-use changes, leading to widespread deforestation, increased human settlements, and a heavy reliance on chemical fertilisers, pesticides, and animal manure. These practices have significantly degraded surface and groundwater quality through nutrient-laden agricultural runoff, particularly nitrate and ammoniacal nitrogen, across many watersheds. In light of the deteriorating water quality for irrigation, indexing techniques have been regarded as the most advanced methods for assessing water quality since the late 20th century. This study evaluates the suitability of conventional irrigation water quality indices for assessing surface water used for irrigation in the heavily impacted Hindon River Basin, India. Monthly water samples were collected from 16 strategically selected sites following standard protocols. Key irrigation suitability parameters and indices were computed, including sodium adsorption ratio (SAR), percentage sodium (%Na), permeability index (PI), Kelly ratio (KR), residual sodium carbonate (RSC), and magnesium adsorption ratio (MAR). Results revealed that Irrigation Water Quality Index (IWQI) values at most sites ranged between 25 and 50, classifying the water as marginally suitable with minor treatment required. In contrast, a few downstream sites exceeded 75, indicating severe unsuitability. A marked deterioration in water quality was observed during the pre-monsoon and monsoon periods compared to the post-monsoon period, largely attributed to runoff and leaching processes. However, despite mathematically acceptable index values at several locations, the water remains unsuitable for sustained irrigation due to elevated concentrations of toxic and emerging contaminants that are not incorporated into existing irrigation indices. The study highlights a critical limitation of conventional irrigation water quality indices: their inability to account for trace elements and other non-classical pollutants that pose long-term risks to soil health and crop safety. Findings underscore the urgent need to develop modified or composite indices that account for the trace elements and tailored to agro-industrial basins and to safeguard irrigation water quality, ensure agricultural productivity, and promote environmental sustainability in rapidly urbanizing catchments.

How to cite: Reddy, M. S. B., Maturi, K. C., and Rajendran, V.: Are Existing Water Quality Indices (WQIs) Fit for Purpose? Evaluating Their Applicability to Irrigation Surface Water Quality, EGU General Assembly 2026, Vienna, Austria, 3–8 May 2026, EGU26-966, https://doi.org/10.5194/egusphere-egu26-966, 2026.

EGU26-1187 | ECS | Orals | HS2.3.5

Machine Learning Based Prediction of Riverine Nitrate Flux for Indian Rivers from Agricultural Landscapes 

Ayush Kumar, Idhayachandhiran Ilampooranan, and Mukund Narayanan

India is predominantly an agrarian country, with ~46% of its population dependent on agriculture. Meeting rising food demand often relies on intensive synthetic fertiliser use, which boosts crop yields but causes environmental impacts. Nutrient runoff from fields is a significant source of riverine nitrate pollution, contributing to the gradual degradation of water quality. To explore the link between agricultural intensification and riverine nitrate, this study applies multiple machine learning models, including Linear, Polynomial, Decision Tree, Random Forest, Support Vector, XGBoost, Neural Network, and Multi-layer Perceptron, to predict nitrate concentrations using hydrological, socioeconomic, and agricultural nitrogen input variables across major river basins and identify key controlling factors. The best-performing model achieved an R² of 0.57. Results show significant spatial and temporal variation of riverine nitrate flux across major river basins between 1966 and 2017. At the national scale, the average nitrate flux declined from 535.6 kg/km²/year to 443.8 kg/km²/year, reflecting ~17.1% an overall reduction. The decline in nitrate is primarily attributed to reduced precipitation and an increase in consecutive dry days, as shown by the overall trend analysis. Analysis suggests that lower rainfall reduces surface runoff, thereby limiting the transport of nutrients to rivers. Despite an overall decline in nitrate, larger basins such as the Brahmaputra and the Ganga maintained high concentrations due to their high discharge, greater catchment area, and intensive agriculture. Basin-wise correlation analysis further shows a positive correlation between precipitation, discharge, and nitrate export, confirming that these hydrological variables are the dominant controls, as they enhance runoff. This increased runoff strengthens hydrological connectivity between agricultural fields and river channels, thereby mobilising nitrogen from soils and fertilisers into surface water. Furthermore, our Pearson correlation analysis indicates that net anthropogenic nitrogen inputs contribute more strongly to soil nitrogen build-up, groundwater contamination, and atmospheric emissions, rather than directly influencing riverine nitrate through runoff pathways. Overall, the major drivers of riverine nitrate dynamics across Indian basins are precipitation and discharge, with agricultural practices and basin hydrology acting as secondary influences.


Keywords: Machine Learning, Riverine Nitrate, Agricultural Landscapes, Environmental Impact

How to cite: Kumar, A., Ilampooranan, I., and Narayanan, M.: Machine Learning Based Prediction of Riverine Nitrate Flux for Indian Rivers from Agricultural Landscapes, EGU General Assembly 2026, Vienna, Austria, 3–8 May 2026, EGU26-1187, https://doi.org/10.5194/egusphere-egu26-1187, 2026.

Water quality signature of agricultural catchments is shaped by non-point and point sources contributing a wide range of solutes (e.g., nutrients, carbon, pesticides, emerging contaminants) and sediments to the drainage and stream network. In this presentation we evaluate storm event contribution of non-point sources in a small agricultural headwater (7.2 km2, 58° 35' N and 16° 11' E ) dominated by clay soils, crop production and tile drainage. We used a combination of experimental and modelling data for points along the drainage and stream network, from individual drainage wells to the catchment outlet. For the 6 nested sampling locations, we used concentration-discharge (C-Q) metrics from both high-frequency in situ data and process-based model to aswer the following research questions: 1) does C-Q slope for solutes and sediments change signficantly along the drainage and stream network or is it a constant catchment-feature, 2) do the shape and direction of the C-Q relationships change significantly along the drainage and stream network in response to different contribution of flow pathways. Information about the contribution of different flow pathways was derived from a calibrated/validated HYPE model which differentiated surface, subsurface and tile drainage flow pathways. Our results showed that the contribution of different flow pathways changes from a tile drainage dominance for the drainage wells to a more balanced contribution of different flow pathways at the outlet . This led to more stable and chemostatic C-Q slopes at the outlet compared to steeper and more variable C-Q slopes at the drainage wells. We also showed that the changing contribution and timing of different flow pathways during storm events control the shape and the direction of the C-Q relationships for both solutes and sediments. Overall, our results showed that there was a surprisingly large variation in the C-Q relationships between different locations in the catchment despite its small size and fairly uniform land use. 

How to cite: Bieroza, M.: From a drainage well to the catchment outlet - propagation of water quality signatures through a headwater agricultural catchment , EGU General Assembly 2026, Vienna, Austria, 3–8 May 2026, EGU26-1389, https://doi.org/10.5194/egusphere-egu26-1389, 2026.

EGU26-2197 | ECS | Orals | HS2.3.5

Anthropogenic Impact in a Small Mountain Catchment: A Case Study of the Czerwonka Stream (Białka Tatrzańska, Carpathians, Southern Poland) 

Oktawia Kaflińska, Anna Bojarczuk, Łukasz Jelonkiewicz, Anna Lenart-Boroń, Wiktoria Suwalska, and Mirosław Żelazny

Białka Tatrzańska is a tourist-oriented locality and one of the largest ski resorts in southern Poland, situated in the Carpathian Mountains. In recent years, dynamic population growth and intensified tourism development have resulted in increasing anthropogenic pressure on the natural environment, including the waters of the Czerwonka Stream, which flows through the central part of the village. The objective of this study was to assess the impact of anthropogenic pressure on changes in water quality along the course of the Czerwonka Stream.

In 2023–2025, systematic monitoring of physicochemical and microbiological parameters of surface waters was conducted within the Czerwonka catchment. Hydrochemical analyses were performed using ion chromatography, determining concentrations of 14 major ions and biogenic compounds (H, Ca, Mg, Na, K, NH₄, Li, HCO₃, SO₄, Cl, NO₃, NO₂, PO₄, F, Br). Microbiological analyses included the determination of fecal indicator bacteria (Escherichia coli and Enterococcus faecalis) using culture-based methods on selective media.

Along the course of the Czerwonka Stream, abrupt increases in electrical conductivity were observed, associated with the influence of numerous point pollution sources. These include effluents from thermal facilities, tourist accommodation infrastructure, household and hotel wastewater treatment plants, as well as surface runoff from ski slopes, including waters derived from technical snowmaking. An additional factor deteriorating water quality is the poorly developed water and wastewater management system, largely based on septic tanks, which are often leaky and prone to overflow.

Identified local pollution hot spots caused increases in electrical conductivity of stream water of up to 560%, while maximum conductivity values recorded in inflowing wastewater reached nearly 9750 µS/cm. The natural hydrochemical type of the Czerwonka Stream, dominated by calcium–bicarbonate waters, undergoes substantial transformation along the stream course, leading to the dominance of chloride and sodium ions. Concurrently, a marked increase in fecal indicator bacteria was observed, with Escherichia coli predominating and a significant contribution of Enterococcus faecalis, clearly indicating anthropogenic sources of contamination.

This research was partially funded by BANIA SP. Z O O (eng. Ltd.) (project number - K/KDU/000942).

How to cite: Kaflińska, O., Bojarczuk, A., Jelonkiewicz, Ł., Lenart-Boroń, A., Suwalska, W., and Żelazny, M.: Anthropogenic Impact in a Small Mountain Catchment: A Case Study of the Czerwonka Stream (Białka Tatrzańska, Carpathians, Southern Poland), EGU General Assembly 2026, Vienna, Austria, 3–8 May 2026, EGU26-2197, https://doi.org/10.5194/egusphere-egu26-2197, 2026.

As a typical complex aquatic ecosystem, the Taihu Basin relies heavily on the material exchange between the lake and its connected rivers, a critical factor driving eutrophication and algal blooms. However, existing water quality monitoring data suffer from spatiotemporal sparsity and insufficient sample sizes, limiting the accuracy of deep learning models in simulating long-term nitrogen and phosphorus (N/P) migration and mining algal bloom mechanisms. To address these challenges, this study proposes a comprehensive framework integrating data augmentation with graph deep learning. Specifically, a Conditional Spatio-Temporal Generative Adversarial Network (CST-GAN) was first constructed to learn inherent distribution patterns and generate high-quality augmented data, significantly expanding the sample scale. Subsequently, the Attention-based Spatio-Temporal Graph Convolutional Network (A-STGCN) was employed to model the river-lake system as a topological graph. Crucially, leveraging the interpretability of the attention mechanism embedded within A-STGCN, this study moved beyond black-box prediction to successfully identify primary N/P input channels, quantify the response mechanisms of algal blooms to N/P migration fluxes, and pinpoint the key driving factors triggering outbreaks. This research demonstrates a closed-loop approach from data augmentation to system simulation, providing a scientific basis for precise pollution control and early warning of algal blooms in the Taihu Basin.

How to cite: Yao, J., Ruan, X., and Saavedra Melendez, F.: Coupled CST-GAN Data Augmentation and A-STGCN for Predicting Nitrogen-Phosphorus Migration and Unraveling Algal Bloom Mechanisms in the Taihu River-Lake System , EGU General Assembly 2026, Vienna, Austria, 3–8 May 2026, EGU26-2344, https://doi.org/10.5194/egusphere-egu26-2344, 2026.

EGU26-4062 | ECS | Orals | HS2.3.5

Sensitivity of riverine nitrate modelling to territorial estimations of diffuse sources in agricultural catchments 

Emma Roussel, Mélanie Raimonet, Vincent Thieu, and Marie Silvestre

Coastal eutrophication has been linked to excessive nitrogen inputs from intensive agricultural practices on contributing watersheds and is associated with multiple ecological alterations such as green tides and toxic algal blooms, as observed in the Bay of Brest (Brittany, France). Mechanistic modelling is a powerful tool for improving our understanding of nitrogen transfers from the land to the sea through river networks. However, its effectiveness strongly depends on the accurate estimation of territory-specific boundary conditions, which remains challenging due to the scarcity of existing observational measurements, especially in small watersheds.

The sensitivity of simulated riverine nitrate concentrations to different boundary condition datasets was assessed using the pyNuts-Riverstrahler modelling platform applied to the two main watersheds draining into the Bay of Brest (~320 and 1700 km2). This model explicitly represents water fluxes (including discharges from wastewater treatment plants, water withdrawals, and dams) and associated concentrations of carbon and nutrients (N, P, and Si) across the entire river network at a kilometre-scale spatial resolution. Simulated riverine nitrate concentrations were compared to observational data to evaluate the performance of different input datasets for each watershed. First, two alternative baseflow estimation approaches were tested, namely a statistical recursive digital filter (BFLOW) and the conductivity mass balance (CMB) method. Second, diffuse agricultural nitrogen inputs through surface runoff were estimated from the GRAFS methodology at two spatial scales: regional and municipal.

Results indicate that estimates derived from the CMB method predict lower baseflow contribution to total streamflow and show greater spatial variability across the watersheds than those obtained with BFLOW. Nitrate simulations driven by municipality-scale GRAFS inputs better reproduce observed nitrate concentrations and their spatial heterogeneities along the river network, despite data gaps due to the partial confidentiality of agricultural statistics at this scale. The simulation combining CMB methodology with municipality-scale GRAFS inputs appears to be the most representative, both in terms of nitrate concentration levels and seasonal dynamics simulation, particularly in areas with complex hydrogeological functioning. 

Overall, this work highlights the critical role of boundary condition estimation in mechanistic hydro-biogeochemical modelling, with direct implications for understanding and managing coastal eutrophication in agricultural watersheds. 

How to cite: Roussel, E., Raimonet, M., Thieu, V., and Silvestre, M.: Sensitivity of riverine nitrate modelling to territorial estimations of diffuse sources in agricultural catchments, EGU General Assembly 2026, Vienna, Austria, 3–8 May 2026, EGU26-4062, https://doi.org/10.5194/egusphere-egu26-4062, 2026.

Despite agri-environmental measures implemented to protect water quality, there are still ongoing water quality issues and eutrophic impacts at different scales. Phosphorus (P) sources are diverse but evidence on the relative contribution of diffuse- and point-sources to P loading in rivers is limited, estimated from models or based on low frequency datasets that don’t capture brief but high magnitude P discharges. Using hourly measurements of P concentrations, the aim of this study was to investigate the relative contribution of diffuse- and point-sources to P loading in a large, complex catchment river noted as major contributor to downstream lake hypertrophication. Stream water total P (TP) concentrations were measured every hour at the outlet of two nested catchments: an ‘upstream’ catchment dominated by diffuse agricultural P sources and a ‘downstream’ catchment which included additional point urban P sources. Hourly TP loads were computed for each catchment to quantify the diffuse vs point P source percentage contributions to TP loading. Results showed that over February-June 2025, median TP concentrations were 0.092 mg L-1 and 0.137 mg L-1 at the outlet of the ‘upstream’ and ‘downstream’ catchment, respectively. Total diffuse- and point-sources TP loads were 5.8 tons (22.7 kg km-2) and 2.4 tons (6.2 kg km-2) and contributed on average 70% and 30% of the hourly TP load, respectively. When comparing these relative contributions for different flow conditions, the P pressure from diffuse sources increased at high flows (median of 77.7% for the 15% highest flows) while pressure from point sources increased at low flows (median of 42.2% for the 15% lowest flows). The study emphasizes the imperative to reduce both diffuse- and point‑source P losses to safeguard river ecosystems during low‑flow periods, when ecological vulnerability is greatest, and to prevent lakes from receiving excessive P inputs during high‑flow events. This need becomes increasingly critical as climate change amplifies the frequency and severity of hydrological extremes.

How to cite: Fresne, M., Jordan, P., and Cassidy, R.: Quantifying diffuse- vs point-source contributions to phosphorus loading using high-frequency monitoring in a large-scale nested catchment , EGU General Assembly 2026, Vienna, Austria, 3–8 May 2026, EGU26-5614, https://doi.org/10.5194/egusphere-egu26-5614, 2026.

EGU26-5814 | ECS | Orals | HS2.3.5

Machine Learning and Citizen Science for Catchment-Scale Water-Quality Assessment 

Xinyu Liu, Heri Chisute, Fred Nyongesa, Rochi Mkole, Stuart Warner, Gerogio Emmanuel Nader, Amedeo Boldrini, Alessio Polvani, Riccardo Gaetano Cirrone, Luisa Galgani, and Steven Arthur Loiselle

Assessing and managing water quality in data-scarce tropical basins remains challenging due to rapid land-use change, intensifying human pressures, and increasing climate variability. In the transboundary Mara River Basin (MRB), these factors strongly influence sediment and nutrient dynamics, yet traditional monitoring networks lack the temporal and spatial resolution needed to characterize pollution sources, transport pathways, and event-driven responses. To address these gaps, this study integrates citizen-science observations with satellite-derived hydro-climatic and land-use variables to model turbidity (NTU), nitrate (NO₃), and phosphate (PO₄) across 40 sub-basins. Two machine-learning approaches: Random Forests (RF) and Artificial Neural Networks (ANN) were employed to evaluate water-quality variability and identify dominant drivers under heterogeneous environmental conditions. RF outperformed ANN across all indicators, providing more robust predictions under noisy and nonlinear data constraints. SHAP analyses revealed that precipitation and river flow velocity dominate short-term, event-based fluctuations of turbidity, while population density represents persistent drivers of NO₃ concentration. These findings highlight the basin’s sensitivity to climate-driven changes in rainfall intensity and seasonality and demonstrate how hybrid monitoring–modelling frameworks can enhance the identification of nutrient hotspots, improve source attribution, and support adaptive water-quality management under land-use and climate-change scenarios.

How to cite: Liu, X., Chisute, H., Nyongesa, F., Mkole, R., Warner, S., Nader, G. E., Boldrini, A., Polvani, A., Cirrone, R. G., Galgani, L., and Loiselle, S. A.: Machine Learning and Citizen Science for Catchment-Scale Water-Quality Assessment, EGU General Assembly 2026, Vienna, Austria, 3–8 May 2026, EGU26-5814, https://doi.org/10.5194/egusphere-egu26-5814, 2026.

Microplastic (MP) research in drinking water faces a persistent challenge: methods, analytical capacities, and legislative frameworks differ widely across countries, making comparison and coordinated action difficult. Within the Interreg Danube Region project MicroDrink, we developed the MicroDrink Knowledge Base to address this issue. The Knowledge Base is an open-access, multilingual online platform that compiles structured information on MP sampling methods, analytical methods, laboratory capabilities, instrumentation, legislation, and projects across the Danube Basin.

The platform is organized into six interconnected sections—Sampling Methods, Analytical Methods, Instruments, Projects, Legislation & Guidelines, and Laboratories. Each section contains curated content that has been reviewed and standardized to support comparison between countries and institutions. Sampling and analytical methods include preparation steps and performance characteristics used by partner laboratories. Instrument entries document specifications, supplier details, and typical detection limits. Legislative and guideline summaries highlight national frameworks relevant to MP monitoring, providing essential context for interpreting results. A directory of laboratories presenting their MP analysis capacity enables practitioners to identify regional expertise.

To support accessibility, the Knowledge Base includes multilingual data sheets available in six languages, making technical content more usable for water suppliers and national institutions. Embedded submission forms allow researchers, laboratories, and agencies to contribute updated methods, new instruments, and legislative changes. All submissions are checked before being uploaded, ensuring the resource remains accurate and up to date.

By consolidating dispersed knowledge into a single platform, the MicroDrink Knowledge Base enables saving of time and resources and strengthens cooperation across scientific, regulatory, and operational sectors. Its integration into the main MicroDrink website ensures long-term visibility and supports ongoing harmonization efforts in the Danube Region. This contribution presents the structure, content, and practical applications of the Knowledge Base, demonstrating its value as a shared reference point for MP monitoring in drinking water resources.


How to cite: Alqadi, M. and the Microdrink project team: The MicroDrink Knowledge Base: A Multilingual Platform for Harmonizing Microplastic Monitoring in Drinking Water Across the Danube Region, EGU General Assembly 2026, Vienna, Austria, 3–8 May 2026, EGU26-5824, https://doi.org/10.5194/egusphere-egu26-5824, 2026.

Predicting riverine algal blooms remains a major challenge due to the high stochasticity of aquatic systems and the complex, non-linear interactions among environmental drivers. To address this, the present study establishes a robust probabilistic forecasting framework for the middle and lower Han River, China, by integrating multi-source datasets into a Bayesian Neural Network (BNN), complemented by a hybrid interpretability approach merging Bayesian posterior inference with Generalized Additive Model (GAM). By fusing heterogeneous long-term hydrological, meteorological, water quality, and ecological data, the model effectively captures dynamic environmental interactions and therefore provides reliable probabilistic forecasts of chlorophyll-a (Chl-a) concentrations for 1-to-7-day horizons. The BNN architecture explicitly performs uncertainty quantification to mitigate inherent data noise and model uncertainty by delivering exceedance probability of bloom predictions, which help decision-makers minimize false negatives near critical alert thresholds. Key ecological findings elucidate a dual driving mechanism, whereby short-term forecasts are predominantly governed by algal biological inertia, whereas medium-to-long-term trends are constrained by environmental carrying capacity. Specifically, bloom outbreaks hinge on a multi-factor environmental window featuring water temperature exceeding 23°C, optimal light intensity, and stable hydrological conditions. GAM analysis reveals a nonlinear relationship between total phosphorus (TP) and Chl-a, indicating the limited efficacy of nutrient reduction in high-phosphorus regimes. Methodologically, this study underscores the necessity of combining multi-source data fusion with uncertainty quantification and non-linear attribution to advance deep learning applications in complex ecological systems.

Keywords: Bayesian Neural Network; Uncertainty quantification; Algal Bloom Prediction; Middle and Lower Han River; Multi-source datasets; Generalized Additive Model

How to cite: Li, Y. and Zhang, X.: Probabilistic prediction of chlorophyll-a in a highly regulated river using a multi-source Bayesian Neural Network, EGU General Assembly 2026, Vienna, Austria, 3–8 May 2026, EGU26-6508, https://doi.org/10.5194/egusphere-egu26-6508, 2026.

EGU26-8345 | Orals | HS2.3.5 | Highlight

Responses of Carbon, Nitrogen, and Phosphorus Export to Drought-Induced Forest Dieback Based on Multi-Substance Hydrological Modelling 

Michael Rode, Mufeng Chen, Felix Sauke, Karsten Rinke, Martyn Futter, and Seifeddine Jomaa

Severe and prolonged summer-droughts and subsequent bark beetle outbreaks have increased forest vulnerability and mortality, altering the export of carbon (C), nitrogen (N), and phosphorus (P) from forested catchments. Currently, comparative field studies of how these three substances respond to forest dieback, as well as evaluation of process-based model simulations, remain limited. This study aims to analyze and compare the impacts of drought-induced forest dieback on catchment C, N, and P export and their underlying drivers, and the capability of a process-based hydrological water quality model to simulate those matter fluxes under rapid forest change. We applied a modified dynamic HYPE model to three headwater catchments in the Harz Mountains (Germany) with different land-use compositions. The conifer-dominated catchments Warme Bode and Rappbode experienced severe forest dieback of approximately 57% and 75%, respectively, between the 2018 drought until 2024, whereas the agricultural catchment Hassel showed a lower forest loss of about 15%. The model was calibrated by simultaneously optimizing hydrological and C–N–P process parameters using long-term discharge and water-quality observations. Model performance was overall acceptable, with good performance for hydrology and N simulations (mean NSE = 0.80 for discharge and 0.71 for nitrogen), moderate performance for C (mean NSE = 0.68), and the weakest performance for P (mean NSE = 0.53). Results showed clear increases in C, N, and P exports in the forest-dominated catchments after forest dieback, whereas changes in the agricultural catchment were minor. Among the three substances, N showed the strongest increase after forest dieback, driven by increased nitrogen availability associated with reduced plant uptake and enhanced soil mineralization. The increase in C export resulted from elevated organic carbon availability in surface soils, and was also controlled by changes in hydrological processes. P showed a relatively weaker response to forest dieback, with changes primarily driven by increased runoff magnitude and intensity, as well as enhanced flushing due to the loss of vegetation cover. Differences in simulation capabilities of these three substances further indicate distinctions in their generation and transport mechanisms. N dynamics are mainly governed by subsurface flow paths and biogeochemical availability, whereas C export depends more on surface runoff and flow-path connectivity, which are relatively well represented in the model. P export relies more on high-flow events, which are roughly generalized and simplified in the model parameterization. Therefore, the simultaneous optimization of C, N, and P points towards a more realistic representation of the various runoff components and biogeochemical processes in the model. Overall, this study advances the understanding of forest dieback impacts on catchment nutrient and carbon exports, reveals the limitations of multi-substance modeling, and provides suggestions for model development.

How to cite: Rode, M., Chen, M., Sauke, F., Rinke, K., Futter, M., and Jomaa, S.: Responses of Carbon, Nitrogen, and Phosphorus Export to Drought-Induced Forest Dieback Based on Multi-Substance Hydrological Modelling, EGU General Assembly 2026, Vienna, Austria, 3–8 May 2026, EGU26-8345, https://doi.org/10.5194/egusphere-egu26-8345, 2026.

EGU26-10186 | ECS | Orals | HS2.3.5

Estimating Summer Internal Phosphorus Loads and Their Drivers in an Eutrophicated Lake in Southern Sweden 

Anna Söderman, Vera Sandell, Clemens Klante, and Christian Alsterberg

Eutrophication remains one of the major drivers of change in freshwater ecosystems worldwide. Phosphorus (P) is of particular concern since it is considered the limiting nutrient for phytoplankton growth in lakes. An excess of P can lead to increased phytoplankton biomass, reduced water clarity, and undesirable ecological changes. Consequently, reducing P loading from anthropogenic sources in the catchment has historically been the main restoration approach for eutrophic lakes. Many lakes have shown improvements in water quality following reductions in external P loading. However, others have not responded as expected, and their recovery has been delayed by years or even decades, often attributed to internal cycling of P. Lake Vombsjön in southern Sweden exemplifies these issues, as it continues to experience high P concentrations despite catchment mitigation efforts. Previous studies have indicated that internal P loading sustains high P concentrations, but this has not been quantified.

In this study, we applied a weekly ecosystem-scale mass-balance approach to quantify the internal P loading of Lake Vombsjön during the summer period and to identify the key physical drivers. We combined weekly monitoring of inflowing and outflowing streams with in-lake measurements of total phosphorus and other water quality parameters. We found that internal P loading fluctuated throughout the summer and, in total, dominated the summer P budget. A substantial proportion of the mobilised P remained within the lake, indicating continued internal retention that may delay recovery. Variations in internal loading were primarily associated with physical processes related to wind conditions and thermal structure. These findings demonstrate that internal P loading is a key factor controlling summer P dynamics in Lake Vombsjön and highlight the importance of accounting for internal P loading when designing management strategies for eutrophic lakes.

How to cite: Söderman, A., Sandell, V., Klante, C., and Alsterberg, C.: Estimating Summer Internal Phosphorus Loads and Their Drivers in an Eutrophicated Lake in Southern Sweden, EGU General Assembly 2026, Vienna, Austria, 3–8 May 2026, EGU26-10186, https://doi.org/10.5194/egusphere-egu26-10186, 2026.

EGU26-11125 | Posters on site | HS2.3.5

The behaviour of physicochemical parameters in watercourses downstream of WWTPs under reduced flows 

Libuše Barešová, Magdalena Nesládková, Vojtěch Svoboda, and Vít Kodeš

Significant changes in long-term hydrological values have been observed, resulting in an increase in the proportion of wastewater discharged from wastewater treatment plants (WWTPs) in watercourses. During periods of reduced flow, this proportion can exceed 50% of the flow in the receiving watercourse. For most parameters, concentrations increase in the watercourse downstream of the WWTP, thereby deteriorating water quality (nutrients, chlorides, conductivity, coliform bacteria, dissolved substances). However, the assessment is less clear-cut for some parameters. With decreasing flow, the differences in concentrations upstream and downstream of the WWTP discharge increase for most parameters. A notable increase in water temperature and pH downstream of the WWTP is observed during the warmer months, accompanied by a more rapid decomposition of organic matter. This results in smaller differences for ammonium nitrogen, and conversely, larger differences in its concentrations during the colder months.

In addition to the well-known problems with nutrients, the situation with increasing salinity of watercourses may also worsen with more frequent occurrences of low flow periods. Unlike nutrient parameters, salinity parameters do not have targets for good ecological status set in the Czech Republic, so they are not included in the assessment of the status of water bodies and no measures to improve their ecological status need to be proposed. Phosphorus and chloride concentrations exhibit a marked increase downstream of the WWTP throughout the whole year.

The paper will present the impacts of discharges from WWTPs that have been selected as significant for the Czech Republic in the Plan for Managing Drought and Water Scarcity in the Czech Republic. These examples are used to find flow rates that would eliminate the combined impact of drought and wastewater treatment plant discharges on the ecological status of the affected surface water bodies. The results of an assessment of the impact of the first stage of reconstruction of the largest WWTP in the Czech Republic, which treats wastewater from the capital city of Prague, on improving water quality in the Vltava River will also be presented.


How to cite: Barešová, L., Nesládková, M., Svoboda, V., and Kodeš, V.: The behaviour of physicochemical parameters in watercourses downstream of WWTPs under reduced flows, EGU General Assembly 2026, Vienna, Austria, 3–8 May 2026, EGU26-11125, https://doi.org/10.5194/egusphere-egu26-11125, 2026.

EGU26-11697 | Orals | HS2.3.5

Hydroclimatic extremes reveal shifting nitrogen export behavior from catchments 

Andreas Musolff, Tam Nguyen, Rohini Kumar, Shixue Wu, and Pia Ebeling

Elevated nitrate concentrations remain a persistent problem for European inland water bodies. Recent unprecedented multi-year droughts have challenged our understanding of nitrate exports from catchments. While both increasing and decreasing concentrations have been observed in response to droughts (Saavedra et al. 2024), summer droughts and subsequent re-wetting were found to decrease the nitrate retention capacity of catchments and increase exported loads. Furthermore, drought-induced forest dieback has created additional nitrate sources, further elevating instream concentrations and fluxes (Musolff et al. 2024). To understand and robustly predict future concentration trajectories in response to climate extremes, we need to first understand the reactive transport processes shaping these observed responses. To this end, we analyze long-term (>40 years) time series of nitrate concentrations in two catchments in Central Germany with diverse land uses and nitrate sources, spanning the recent drought years. Despite relatively constant nutrient inputs over the last 20 years, we found diverging trajectories for annual maximum and minimum concentrations. Drought years amplified intra-annual concentration ranges by increasing high-flow and decreasing low-flow concentrations. Annual maximum concentrations were sensitive to temporal changes in hydroclimatic conditions, with exceptionally high winter concentrations, following low summer drought concentrations. We attribute these high winter concentrations to the rapid mobilization of strong nutrient sources in shallow, hydrologically well-connected agricultural and riparian forest soils. Conversely, annual minimum concentrations responded to slowly reacting groundwater heads of deeper aquifers; lower groundwater levels corresponded to lower summer concentrations. These changes in low-flow concentrations are therefore a function of hydraulic heads controlling the influx of nitrate-rich deeper groundwater to the stream. Thus, we observe a strong effect of hydrological states in shallow and deep storages on the flow paths connecting nutrient sources to streams making export dynamics highly sensitive to hydroclimatic extremes. This data-driven indication raises questions about whether travel-time-based water quality models adequately capture the complexity of flow-paths and connected water ages and nitrate concentration dynamics providing a basis for future model development.

References:

Musolff, A., Tarasova, L., Rinke, K., & Ledesma, J. L. J. (2024). Forest Dieback Alters Nutrient Pathways in a Temperate Headwater Catchment. Hydrological Processes, 38(10). https://doi.org/10.1002/hyp.15308

Saavedra, F., Musolff, A., Von Freyberg, J., Merz, R., Knöller, K., Müller, C., Brunner, M., & Tarasova, L. (2024). Winter post-droughts amplify extreme nitrate concentrations in German rivers. Environmental Research Letters, 19(2). https://doi.org/10.1088/1748-9326/ad19ed

Winter, C., Nguyen, T. V., Musolff, A., Lutz, S. R., Rode, M., Kumar, R., & Fleckenstein, J. H. (2023). Droughts can reduce the nitrogen retention capacity of catchments. Hydrology and Earth System Sciences, 27(1), 303-318. https://doi.org/10.5194/hess-27-303-2023

How to cite: Musolff, A., Nguyen, T., Kumar, R., Wu, S., and Ebeling, P.: Hydroclimatic extremes reveal shifting nitrogen export behavior from catchments, EGU General Assembly 2026, Vienna, Austria, 3–8 May 2026, EGU26-11697, https://doi.org/10.5194/egusphere-egu26-11697, 2026.

EGU26-13592 | ECS | Posters on site | HS2.3.5

Mapping potential high nitrogen leaching zones using TETIS hydrological model 

Nathaly Güiza-Villa, Sandra Pool, Alberto Garcia-Prats, Félix Francés, and Joaquín Jiménez-Martínez

Agricultural intensification over recent decades has led to a growing reliance on irrigation schemes and nitrogen-based fertilizers to sustain crop productivity (FAO, 2020; Lassaletta et al., 2021, 2014). However, these practices enhanced nitrogen leaching processes, increasing the risk of groundwater pollution that can persist for more than a decade (Bijay-Singh and Craswell, 2021; FAO and IWMI, 2018; Lassaletta et al., 2014; Martin et al., 2021; Sebilo et al., 2013). Identifying zones prone to nitrogen leaching is therefore essential for sustainable agricultural management and long-term groundwater protection.

This study aims to identify and map potential high nitrogen leaching zones in the agricultural area near Valencia, Spain, covering the lowlands of the Júcar River basin, before its discharge into the Mediterranean Sea. The approach combines hydrological simulation with spatial analysis of agricultural practices. The distributed TETIS hydrological model (Frances et al., 2007, 2021) with its nitrogen module (Puertes et al., 2020) was applied for the period 1966 to 2015, to simulate water balance components and nitrogen transport under different irrigation and fertilizer practices. We evaluated five distinct management scenarios based on Pool et al (2022), comparing flood versus drip irrigation with nitrogen application rates ranging from 133 to 182 kg N ha⁻¹ year⁻¹. All simulations employed a calibrated set of 12 water balance parameters (Pool et al., 2021b, 2021a), together with the nitrogen cycle parameters estimated by Puertes et al (2021).

Based on the outputs, monthly, annual, and maximum daily recharge and leaching amounts were derived for each irrigation–fertilizer practice and parameterization. These values were analysed individually and in combination to delineate potential nitrogen leaching zones across the study area. The resulting spatial patterns provide valuable information that can support the Acequia Real del Júcar irrigation authority in identifying strategic locations for monitoring and controlling nitrogen leaching within the irrigated system.

How to cite: Güiza-Villa, N., Pool, S., Garcia-Prats, A., Francés, F., and Jiménez-Martínez, J.: Mapping potential high nitrogen leaching zones using TETIS hydrological model, EGU General Assembly 2026, Vienna, Austria, 3–8 May 2026, EGU26-13592, https://doi.org/10.5194/egusphere-egu26-13592, 2026.

EGU26-13943 | ECS | Orals | HS2.3.5

The impact of seasonal hydroclimatic variability and NDVI on long-term nutrient dynamics in a Finnish agricultural catchment draining to the Baltic Sea 

Beata Plutova, Carlos Gonzales Inca, Elham Kakaei Lafdani, Iiro Seppä, Elina Kasvi, Maria Kämäri, Petteri Alho, and Ville Kankare

Understanding how seasonal hydroclimatic variability and vegetation conditions influence the nutrient dynamics in agricultural catchments is crucial for sustainable management of surface water quality. In this study, we assessed the seasonal impact of hydroclimatic variability and shifts in vegetation conditions on >30 years of total nitrogen (TN) and total phosphorous (TP) in the Aurajoki catchment draining to the Baltic Sea, Southwest Finland. The datasets included long-term monitoring records of nutrient concentrations, discharge, temperature, precipitation, and the Landsat imagery series. Prior to the analyses, we characterized hydroclimatic variability using the Standardized Precipitation Index (SPI), Accumulated Winter Season Severity Index (AWSSI), and vegetation conditions were represented using Normalized Difference Vegetation Index (NDVI). We used Mann – Kendall statistics to assess seasonal trends in both TN and TP concentrations and loads, and generalized additive models (GAMs) to quantify the influence of NDVI and hydroclimatic conditions. Seasonal trend analysis revealed significant increases in both TN and TP during autumn and decreases during spring. Modeling results indicated that NDVI influenced nutrient concentrations but had no significant effect on nutrient loads. In contrast, the influence of hydroclimatic class was confined to nutrient loads and varied depending on the combination of hydroclimatic class and NDVI. These results highlight the relevance of accounting for seasonal hydroclimatic variability and NDVI-derived vegetation conditions when assessing nutrient dynamics in the agricultural catchments. The findings further support understanding of nutrient‑driven eutrophication in systems such as the Baltic Sea.

How to cite: Plutova, B., Gonzales Inca, C., Kakaei Lafdani, E., Seppä, I., Kasvi, E., Kämäri, M., Alho, P., and Kankare, V.: The impact of seasonal hydroclimatic variability and NDVI on long-term nutrient dynamics in a Finnish agricultural catchment draining to the Baltic Sea, EGU General Assembly 2026, Vienna, Austria, 3–8 May 2026, EGU26-13943, https://doi.org/10.5194/egusphere-egu26-13943, 2026.

Wastewater effluent can introduce nutrients that drive eutrophication and oxygen depletion in river systems, impacting their chemical and ecological status under the Water Framework Directive. Microbial degradation of effluent can also generate indirect greenhouse gases, which are increasingly relevant for meeting Net Zero goals. Understanding effluent behaviour in tidal rivers, where transport and mixing are complex, is therefore critical for effective catchment management. This study investigates the spatial and temporal dynamics of effluent discharge in the lower River Tyne, which receives continuous treated wastewater from Howdon Sewage Treatment Works, by applying a multi-phased approach that combines geospatial analysis, hydrodynamic modelling, and field measurements. Historical datasets have been analysed to characterise patterns and variability in effluent discharge, highlighting the need for targeted monitoring to capture biogeochemical hotspots. Two- and three-dimensional hydrodynamic simulations will be used to explore effluent transport and mixing under varying tidal and flow conditions and will be validated against in situ observations. Ongoing field campaigns monitor several water quality parameters, alongside Acoustic Doppler Current Profiler surveys to resolve flow structure and stratification. Model outputs will be integrated with observed data to identify zones of minimal and maximal effluent impact and to estimate indirect greenhouse gas emissions. Overall, this research will enhance our understanding of effluent dynamics in aquatic systems, providing insights for monitoring strategies and catchment management under current and future environmental conditions.

How to cite: Fairless, O.: Spatial–temporal dynamics of wastewater effluent in a tidal river system: the lower River Tyne, UK, EGU General Assembly 2026, Vienna, Austria, 3–8 May 2026, EGU26-14703, https://doi.org/10.5194/egusphere-egu26-14703, 2026.

EGU26-15325 | ECS | Orals | HS2.3.5

High-frequency data reveal complex water quality processes in a mixed land use, groundwater dominated catchment in England 

Diego Panici, Josephine Ashe, Sharon Russell-Verma, and Peter Melville-Shreeve

Rapid-response, mixed land-use, groundwater-dominated catchments represent a unique yet highly complex class of river systems, where the identification of multiple pollution sources is hindered by the coexistence of several competing hydrological and biogeochemical processes. Traditional regulatory water-quality monitoring typically captures baseline conditions but often fails to resolve short-lived, rainfall-driven pollution dynamics. In this context, concentration–discharge (C–Q) analysis applied to high-frequency datasets provides a powerful framework for disentangling event-scale processes and pollutant sources.

Here, we analyse high-frequency water-quality data from a series of high-flow events in the Pix Brook, a groundwater-dominated chalk stream in Hertfordshire and Central Bedfordshire (England) characterised by flashy hydrological behaviour and heterogeneous land use (approximately 40% agricultural and 60% urban). The C–Q relationships of four parameters (ammonium, turbidity, conductivity, and dissolved oxygen) were examined across 18 rainfall-generated events. Event dynamics were quantified using established hysteresis metrics (Hysteresis Index, HI; Flush Index, FI) alongside a newly developed Complexity Index (CI) to characterise source proximity and process interactions.

Results reveal consistent buffering of hydrological responses by groundwater contributions, while ammonium, conductivity, and dissolved oxygen frequently exhibit dilution during high flows, suggesting limited in-stream sources or rapid dilution by surface runoff. In contrast, turbidity consistently shows accretion, indicating systematic sediment mobilisation during events. Notably, a temporal shift from distal to proximal sediment sources is observed midway through the monitoring period, pointing to the potential emergence of new, faster sediment delivery pathways. Overall, this study demonstrates how high-frequency C–Q hysteresis analysis can effectively resolve event-based water-quality processes and disentangle multiple pollution sources in complex mixed-use catchments, supporting targeted monitoring and pollution mitigation strategies.

How to cite: Panici, D., Ashe, J., Russell-Verma, S., and Melville-Shreeve, P.: High-frequency data reveal complex water quality processes in a mixed land use, groundwater dominated catchment in England, EGU General Assembly 2026, Vienna, Austria, 3–8 May 2026, EGU26-15325, https://doi.org/10.5194/egusphere-egu26-15325, 2026.

EGU26-16028 | Orals | HS2.3.5

Assessing Climate- and Land-Use-Driven Water Quality Change in Irish Catchments Using Statistical and Spatial Modelling 

Bidroha Basu, Arunima Sarkar Basu, and Fiachra O'Loughlin

Understanding the responses of riverine nutrient concentrations to combined land-use and climate pressures is essential for effective catchment management and water quality protection. However, water quality monitoring data are frequently sparse and irregularly sampled, particularly in regions with limited resources, presenting a widespread challenge for the robust analysis of nutrient dynamics. Generalized Additive Models (GAMs) provide a flexible statistical framework capable of capturing non-linear relationships, accounting for seasonal and interannual variability, and handling uneven temporal observations, making them well suited for analysing limited water quality datasets.

This study investigated the historical changes in nitrate and phosphate concentrations across three Irish river catchments representing contrasting land-use patterns: the predominantly rural Midleton catchment, the semi-urban Lee catchment, and the highly urbanised Liffey catchment. Observations collected between eight and fifteen times per year over an eight-year period were analysed using GAMs to quantify associations with climatic drivers, evolving land-cover characteristics, and temporal trends. The relationships between nitrate and phosphate concentrations were examined to identify how the two nutrients respond together under different environmental conditions.

To explore potential future trajectories, land-use and land-cover changes were projected using an Artificial Neural Network–Cellular Automata (ANN–CA) modelling framework. Spatially explicit land-cover scenarios were generated under two Socioeconomic Pathways: SSP4.5 and SSP8.5, representing moderate and high climate forcing and socio-economic development. These land-cover projections were integrated with corresponding climate scenario data to examine expected changes in both nitrate and phosphate concentrations, assessing how catchment characteristics modulate nutrient responses under alternative climate and land-use futures.

By applying a consistent analytical framework across rural, semi-urban, and urban catchments, the study enables a comparative assessment of how land-use intensity, hydrological context, and climate variability may influence the nutrient dynamics. Combining GAM-based statistical analysis with ANN–CA land-cover projections provide a reliable and adaptable approach for studying nutrient interactions in catchments with limited data. This framework can support evidence-based catchment management, nutrient control strategies, and the evaluation of possible future changes in water quality under different land-use and climate scenarios.

How to cite: Basu, B., Sarkar Basu, A., and O'Loughlin, F.: Assessing Climate- and Land-Use-Driven Water Quality Change in Irish Catchments Using Statistical and Spatial Modelling, EGU General Assembly 2026, Vienna, Austria, 3–8 May 2026, EGU26-16028, https://doi.org/10.5194/egusphere-egu26-16028, 2026.

EGU26-16241 | Posters on site | HS2.3.5

Physics-guided graph-based multimodal prediction of chlorophyll-a in river networks 

Seun Jung, Yisol Yoon, Jung Hyun Park, Doyun Kim, Soeun Park, Byeongwon Lee, and Sangchul Lee

 Short-term prediction of chlorophyll-a (Chl-a) is essential for eutrophication management and early warning of algal blooms. Existing Chl-a prediction studies commonly rely on remotely sensed observations, process-based models, or data-driven models. However, remotely sensed observations are often discontinuous, data-driven models alone may struggle with nonlinear and network-dependent dynamics, and process-based models are limited in capturing observation-consistent, short-term Chl-a variability. 

 To address these limitations, we develop a multimodal prediction framework based on a graph neural network (GNN) that explicitly represents the river network as a directed graph. The framework integrates (i) remotely sensed Chl-a observations and meteorological data with (ii) process-based hydrological and water-quality states that provide continuous, physically consistent information on streamflow and constituent transport along the river network. These process-based variables are generated using the Soil and Water Assessment Tool (SWAT), and provide physics-guided information that complements observation gaps and supports learning of upstream–downstream dynamics along the river network.

 The proposed framework is applied to Geumho River Watershed (2,092 km2), and predictive performance is evaluated using the coefficient of determination and the root mean square error. Comparative analyses are conducted with an RNN model and conventional machine learning models, including Random Forest and XGBoost, to assess the validity of the GNN-based approach in learning structural connectivity within river networks. This study demonstrates the applicability of a graph-based multimodal prediction framework integrating satellite observations and physics-guided hydrological information and provides a foundation for the development of intelligent early warning systems.

How to cite: Jung, S., Yoon, Y., Park, J. H., Kim, D., Park, S., Lee, B., and Lee, S.: Physics-guided graph-based multimodal prediction of chlorophyll-a in river networks, EGU General Assembly 2026, Vienna, Austria, 3–8 May 2026, EGU26-16241, https://doi.org/10.5194/egusphere-egu26-16241, 2026.

Intensification of agricultural production has increased access to food, but puts significant stresses on water quality. Mathematical models of watershed processes are used to guide the management of nutrients, though their use is subject to significant uncertainties. This talk presents a project that uses a data-driven approach to estimate the effect of conservation practices on water quality. While the project focuses on cover crops, it is generalizable to other measures for which spatial data is available. We show that by combining spatial assessments of cover crop extents and stream event sampling with Generalized Additive Modelling, we can estimate the effect of cover crops on different species of nutrient loss. We show that cover crops result in less loss of particulate phosphorus but more loss of dissolved phosphorus with respect to bare fields. We also conduct scenario analyses to evaluate the effects of increased adoption of cover crops on water quality. We conclude with an assessment of data requirements and identify a number of opportunities for applying this approach elsewhere.


How to cite: Wellen, C., Ahmadi, L., and Parsons, C.: Checking the hype: A data driven approach to assess the effect of conservation measures on water quality in agricultural catchments, EGU General Assembly 2026, Vienna, Austria, 3–8 May 2026, EGU26-16970, https://doi.org/10.5194/egusphere-egu26-16970, 2026.

EGU26-19118 | Orals | HS2.3.5

A water quality model for distributed nutrient load estimation in sparsely monitored catchments 

Matteo Masi, Fabio Castelli, Maryam Barati Moghaddam, and Chiara Arrighi

Nutrient pollution in freshwater systems remains a major environmental challenge, driving eutrophication, and ecological degradation, and requiring robust modelling tools to support effective water management. However, catchment-scale water quality modelling is often constrained by sparse and uneven monitoring networks, scale mismatches between processes and observations, and high parameter uncertainty associated with complex biogeochemical dynamics. These limitations hinder reliable load estimation, pollution sources identification, and scenario analysis, particularly in large and data-scarce catchments.

This study presents an integrated modelling framework combining the existing MOBIDIC hydrological model with a newly developed BIO–ALGAE reactive component, to simulate nutrient dynamics at the catchment scale. The model simulates eight key water quality constituents, including dissolved oxygen, carbonaceous biochemical oxygen demand, organic and inorganic nitrogen and phosphorus species, and algal biomass. To address parameter non-identifiability and spatial heterogeneity, the framework employs a spatially regularized ensemble calibration strategy using the PEST++ iterative ensemble smoother. This ensemble-based framework enables efficient estimation of spatially distributed diffuse loads while providing a robust quantification of predictive uncertainty. Tikhonov regularization is employed to enforce spatial smoothness of the parameters, while a combination of localization matrices and singular value decomposition is used to stabilize the inversion in high-dimensional parameter spaces.

The model was applied to the Arno River catchment (7990 km2) in central Italy, simulating water quality dynamics over a ten-year period (2011–2020) across a network of more than 3600 river reaches. Calibration relied on 8151 spot observations from 70 monitoring stations. Despite the sparse and discontinuous nature of the dataset, the model demonstrated good predictive capability across multiple constituents and successfully reproduced observed spatial and temporal patterns. The results revealed pronounced pollution hotspots, particularly associated with urban and peri-urban areas, characterized by elevated ammonium and organic loads, while phosphorus exhibited a more heterogeneous distribution indicative of multiple source contributions.

Despite limitations under low dissolved oxygen conditions, the approach captured first-order reactive processes and provided spatially explicit load estimates with uncertainty bounds. This framework offers a practical decision-support tool for targeted water quality management in data-scarce catchments.


Acknowledgements

This work was carried out within RETURN Extended Partnership and received funding from the European Union Next-GenerationEU (National Recovery and Resilience Plan – NRRP, Mission 4, Component 2, Investment 1.3 – D.D. 1243 2/8/2022, PE0000005). The authors also wish to acknowledge Fondazione Cassa di Risparmio Firenze for co-funding this work within the project ECO-C – “ECOidrologia dei corsi d’acqua urbani nel contesto dei Cambiamenti climatici e socioeconomici”.

How to cite: Masi, M., Castelli, F., Barati Moghaddam, M., and Arrighi, C.: A water quality model for distributed nutrient load estimation in sparsely monitored catchments, EGU General Assembly 2026, Vienna, Austria, 3–8 May 2026, EGU26-19118, https://doi.org/10.5194/egusphere-egu26-19118, 2026.

EGU26-19679 | ECS | Orals | HS2.3.5

A validation study of a high-resolution catchment-scale water quality monitoring framework utilizing a novel bacterial screening device. 

Eva Perrin, Alistair White, Christian Good, João Brandão, Simon Jackson, and William Blake

UK waterways face significant pollution from both treated and untreated sewage discharges and agricultural runoff. This can lead to serious health issues for water users, environmental damage to ecosystems and losses for the economy via closed bathing waters. Management, however, is hampered by a lack of information on the relative contribution and severity of point and diffuse sources of pollution and their spatial and temporal dynamics. Conventional assessment of water quality, currently undertaken via the EU Water Framework Directive and Bathing Waters Directive, relies on infrequent sampling at limited locations, often failing to capture the dynamic nature of river pollution. In addition, analysis methodologies often require lengthy wait times, limiting the ability to respond to pollution events. To manage water quality sustainably at a catchment scale, and implement effective measures for targeted pollution reduction, there is a clear need for a monitoring framework that allows for more agile, accurate and context-sensitive assessments of water quality and pollution risk.

This study presents a ‘living laboratory’ approach implemented in a small agricultural and sewage-impacted catchment in Southwest England. The work focusses on the application of a novel water quality monitoring technology within a multi-parameter, catchment-scale monitoring framework centred around clear rural (agricultural) and urban (sewage) pollution hotspots for near real-time assessment of bacteriological quality in partnership with community and citizen science groups active within the catchment. This was integrated with high-resolution monitoring undertaken continuously for 12 months alongside frequent in-field sampling for physicochemical, hydrological, nutrient and bacterial measurements to capture baseflow and storm conditions, validated with real-time sewage discharge data.

Elevated nutrient concentrations (>1 mg/L P) showed clear spatial signatures associated with diffuse pollution from small tributaries draining agricultural land, as well as the influence of a rural wastewater treatment works. Discrete pollution signals downstream of an urban centre further reflected the impact of untreated sewage inputs. Additional key findings highlight the ability to generate rapid (13-minute) bacterial measurements comparable to standard reference methods, with wet-weather events exerting the strongest control on bacterial pollution, particularly from small agricultural tributaries where E. coli (CFU/100 mL) concentrations exceeded the Bathing Water Regulation (2013) threshold by up to 30 times. Together, these spatial and temporal patterns provided detailed insight into the source dynamics of both nutrient and bacterial pollution across the catchment. Data fusion across chemical, hydrological, and microbial datasets underpinned the development of a predictive modelling framework, enabling novel rapid bacterial measurements to be evaluated against “gold standard” methods and linked to routine water quality monitoring data.

This work develops a transferable framework for catchment-scale water quality assessment that overcomes delays associated with conventional sample analyses while encouraging stakeholder participation in data collection. The multiple dimensions of this dataset support diagnostic evaluation of the relative importance of agriculture vs sewage pollution sources through space and time, allowing for targeted pollution reduction management and regulatory decision making.

How to cite: Perrin, E., White, A., Good, C., Brandão, J., Jackson, S., and Blake, W.: A validation study of a high-resolution catchment-scale water quality monitoring framework utilizing a novel bacterial screening device., EGU General Assembly 2026, Vienna, Austria, 3–8 May 2026, EGU26-19679, https://doi.org/10.5194/egusphere-egu26-19679, 2026.

EGU26-20054 | ECS | Orals | HS2.3.5

Revealing anthropogenic influences on catchment surface water quality under data scarcity: case of Hindon River Basin, India 

Raul Mendoza, Sibren Loos, Frederiek Sperna Weiland, and Albrecht Weerts

Assessing anthropogenic impacts on surface water quality is essential for developing water quality management strategies. Such assessment relies on sufficient data including anthropogenic effluent and observed concentrations along the river network. These data records  are often incomplete or unavailable in many areas. A water quality model provides means for extrapolation and integration of the available data to the full catchment extent, allowing catchment-wide quantification of pollution patterns and simulation of potential interventions. This study implements a model-based water quality assessment under data scarce conditions applied to the Hindon River Basin in India where surface water is highly polluted due to alleged contributions from industrial, domestic, and agricultural activities leading to emissions into the basin. A catchment modelling framework was implemented by linking a distributed hydrological model (wflow_sbm), which includes anthropogenic demand and allocation, with a substance-based emission model (D-Emissions) and in-stream water quality model (D-Water Quality), set up with mostly open-source datasets. The modelling tool was used to determine the sources, hot spots, and pathways of nutrients and other pollutants across the catchment and river network and assess the seasonal (pre-monsoon, monsoon, and post-monsoon) variations. To quantify the influence of data scarcity on the model output, a sensitivity analysis was conducted on the principal inputs (industrial effluent, domestic wastewater, and fertilizer use) and the resulting variabilities of simulated concentrations were compared against (limited) observations. Finally, management scenarios were simulated including changes in treatment of industrial and domestic wastewater and fertilizer application rates. The results reveal the relative contribution of each of the principal anthropogenic sectors (industries, domestic, and agriculture) on the surface water pollution and implications for catchment water quality management including pollution reduction measures and monitoring requirements for improved model predictions.

How to cite: Mendoza, R., Loos, S., Sperna Weiland, F., and Weerts, A.: Revealing anthropogenic influences on catchment surface water quality under data scarcity: case of Hindon River Basin, India, EGU General Assembly 2026, Vienna, Austria, 3–8 May 2026, EGU26-20054, https://doi.org/10.5194/egusphere-egu26-20054, 2026.

EGU26-20165 | ECS | Posters on site | HS2.3.5

Network structure, wastewater treatment plants and land cover control algal and nutrient dynamics in rivers 

Niklas Heinemann, Soohyun Yang, Dietrich Borchardt, and Luca Carraro

Understanding eutrophication at the river network scale is essential for sustainable and effective river water-quality management, yet most assessments have focused on local drivers and neglected the inevitable interactions between river network structure and spatial nutrient loading across stream orders. To address the knowledge gap, this study investigates how catchment form, land-cover distribution, and nutrient loads discharged from wastewater treatment plants (WWTPs) affect the coupled dynamics of nutrient and algal communities across river networks. As the proof-of-concept activity, we employ artificial river networks with contrasting geometries (elongated, rectangular, and square) but identical total area, generated on the basis of the Optimal Channel Network theory and constrained to realistic morphometric properties. These networks are coupled with archetypical land-cover configurations that impose equal total phosphorus (P) loads but differ in spatial organization, including homogeneous, random, and upstream- or downstream-clustered anthropogenic inputs from urban and agricultural areas as well as point source discharge from WWTPs. The coupled dynamics of nutrient P and algae are elaborated through each configuration-based simulations of the CnANDY model, which is a parsimonious mechanistic river-network-scale model for pelagic and benthic algae competing for light and phosphorus under steady hydrologic conditions. By comparing the different loading configurations, the study examines the implications of focusing management measures on headwaters versus downstream reaches, as well as the potential role of WWTP relocation, and end-of-pipe solutions. Overall, our findings are expected to support a more network-aware perspective on eutrophication assessment and management at the entire catchment scale.

How to cite: Heinemann, N., Yang, S., Borchardt, D., and Carraro, L.: Network structure, wastewater treatment plants and land cover control algal and nutrient dynamics in rivers, EGU General Assembly 2026, Vienna, Austria, 3–8 May 2026, EGU26-20165, https://doi.org/10.5194/egusphere-egu26-20165, 2026.

The hydrological network in agricultural areas in Latvia consist of subsurface drainage systems and agricultural ditches. The excess water along with nutrients mainly in the soluble forms on nitrogen and phosphorus is collected from agricultural areas by subsurface drainage systems and discharged into agricultural ditches. It is known that the amount and quality of water leaving agricultural areas depends of multiple factors, e.g., meteorology (precipitation and air temperature) and catchment specific (catchment area, land use distribution, topography, soils, crops). This study aims to assess the concentrations of nitrogen and phosphorus in relation to the catchment area and length of the selected agricultural ditches. The outcomes of this study will support decision makers to evaluate potential criteria for implementation of buffer strips of different width along agricultural ditches in Latvia.

For the purpose of this study 112 agricultural ditches, which are evenly distributed in the territory of Latvia and among all four geomorphological regions of minimum runoff, were selected for detailed investigation. The analysis of geospatial data showed that the ditches are in the length from 325 m to 1524 m, while the catchment area ranges from 0.37 to 10.98 km2. In 107 of 112 ditches water samples were collected and analyzed for total nitrogen (TN) and total phosphorus (TP) concentrations in the accredited laboratory according to the national standards. It was not possible to collected water samples in 5 ditches due to lack of water.

The results of this study showed that 108 of the catchment areas of the selected agricultural ditches were smaller than 2 km2, while the length of the same ditches varied from 325 m to 1475 m. The linear regression analysis indicated that there is a weak and positive relationship between the catchment area and length. The observed concentrations of TN varied in the range from 0.49 to 13.95 mg l-1, while TP concentrations were in the range from 0.003 to 0.911 mg l-1, where neither catchment area nor length were detected as the factors affecting TN or TP concentrations. The results of this study indicate that the catchment area and length of the agricultural ditches cannot be directly applied as the parameters to define different widths for buffer strips as these parameters does not directly affect water quality.

This study was funded by the Ministry of Agriculture of the Republic of Latvia within the scope of the research project “The assessment of hydrological conditions and water quality during the vegetation period in agricultural ditches in Latvia”, the decision No. 10.9.1-11/25/1545-e.

How to cite: Straume, A.: The relationship between concentrations of nitrogen and phosphorus and catchment area and length of agricultural ditches in Latvia, EGU General Assembly 2026, Vienna, Austria, 3–8 May 2026, EGU26-21283, https://doi.org/10.5194/egusphere-egu26-21283, 2026.

EGU26-21307 | Posters on site | HS2.3.5

WICKIE - an in-situ monitoring system to measure groundwater recharge flux and water quality 

Markus Weiler, Heinke Paulsen, Florenz König, and Barbara Henstritt

Groundwater contamination in intensively cultivated catchments frequently threatens drinking‑water supplies. However, continuous, low‑cost monitoring of recharge fluxes and the related water quality remains elusive. We present WICKIE (WICK‑sampler In‑situ Estimations), an on-line, passive system that quantifies percolating water directly in the field and allows to take water samples or in-situ water quality monitoring systems. The device combines 2 m‑long fiberglass wicks, fixed in a collector to operate at field‑capacity suction, with a 3D‑printed PETG tipping‑bucket that records each drainage event as an absolute volume. A stainless‑steel collector (1 m × 0.12 m) is inserted horizontally into a pre‑excavated pit wall, preserving the surrounding pore structure and providing an active sampling area of 900 cm².

In addition, we introduce an in-situ, low-cost optical sensor for real-time, in-situ monitoring of nitrate (NO3-) and dissolved organic carbon (DOC) concentrations in natural water. Utilizing absorbance and fluorescence at specific wavelengths with LEDs and photodiodes, this sensor system offers a practical alternative to expensive and complex laboratory or in situ spectrometer methods. Although the sensor's accuracy does not yet fully match that of much more expensive commercial sensors, it maintains strong predictive capabilities with comparative accuracies and correlations. Challenges such as the interference of DOC and turbidity with the nitrate absorbance signal, intense calibration procedures and site-specific variability remain, necessitating further refinement.

A half-year field trial at a cropping–grassland interface in southwestern Germany demonstrated that WICKIE effectively captures the temporal lag between precipitation and percolation, yielding high‑resolution flux data with low external power supply. WICKIE’s key advantages are reduced soil disturbance compared to lysimeter, enhanced lateral representativeness compared to alternative methods, direct volumetric flux measurement facilitating water balance calculations, inexpensive material cost, and modular adaptation to diverse soils and land uses. WICKIE facilitates precise groundwater recharge assessments and promotes sustainable agricultural and aquifer‑management through the provision of continuous, real‑time, cost-effective recharge and water quality data.

How to cite: Weiler, M., Paulsen, H., König, F., and Henstritt, B.: WICKIE - an in-situ monitoring system to measure groundwater recharge flux and water quality, EGU General Assembly 2026, Vienna, Austria, 3–8 May 2026, EGU26-21307, https://doi.org/10.5194/egusphere-egu26-21307, 2026.

The climatic conditions in Latvia can be characterized as humid, where the annual
precipitation exceeds evapotranspiration. Therefore, sustainable and economically
sound agricultural production is not possible without drainage systems including
subsurface tiles and open ditches. Open ditches not only receive and convey excess
moisture from agricultural fields, but also serve as a pathway to transport nutrients to
downstream waterbodies. The aim of this study was to assess phosphorus
concentrations in the selected agricultural ditches during the vegetation period. The
monitoring results obtained within this study will characterize water quality in the
selected agricultural ditches, which are located in all four geomorphological regions
of minimum runoff as designated by the Regulations on Latvian Building Code LBN
224-15 “Land reclamation systems and hydrotechnical structures”, thus making it
possible to identify the need and importance of establishment of buffer strips along
agricultural ditches to improve water quality.
Overall, 112 agricultural ditches were selected for this study, whose locations evenly
cover the territory of Latvia. The water samples were collected in 107 ditches using a
manual grab sampling approach during one sampling campaign carried out from
September 20 to October 30, 2025, the water flow in 5 ditches had dried out. Water
samples were collected in 0.5 l polyethylene bottles, which were stored in a
refrigerator at 2º – 4º C before transportation to the accredited laboratory. Total
phosphorus (TP) and orthophosphate (PO 4 -P) concentrations were determined
according to the national standards. The geospatial dataset of Corine Land Cover
2018 was applied to extract the information on land use patterns in the catchment
areas of the selected agricultural ditches.
In the case of 70 water samples collected in the agricultural ditches, the estimated
ratio between PO 4 -P and TP was greater than 50% indicating for phosphorus losses
from agricultural fields, where the excess moisture and soluble form of PO4-P are
collected by the subsurface drainage systems and transported to the ditches. By

comparing TP concentrations detected in the selected ditches with the threshold value
of the good water quality relevant for small and slow flowing rivers (0.09 mg l -1 ) as
specified in the River Basin Management Plans in Latvia, it can be concluded that in
the case of 18 ditches the concentrations of TP exceed the threshold value. In these
ditches buffer strips would be a relevant measure to reduce losses of phosphorus from
agricultural fields. No distinct patterns in TP concentrations were observed relative to
spatial representation of the agricultural ditches within the geomorphological regions
of minimum runoff. The analysis of the share of land use and water quality
monitoring results showed that there is a positive, but weak relationship between the
share of agricultural land and TP concentrations in the selected agricultural ditches.
This study was funded by the Ministry of Agriculture of the Republic of Latvia within
the scope of the research project “The assessment of hydrological conditions and
water quality during the vegetation period in agricultural ditches in Latvia”, the
decision No. 10.9.1-11/25/1545-e.

How to cite: Paeglite, R.: The assessment of phosphorus concentrations in agricultural ditches during thevegetation period in Latvia, EGU General Assembly 2026, Vienna, Austria, 3–8 May 2026, EGU26-21359, https://doi.org/10.5194/egusphere-egu26-21359, 2026.

Agricultural ditches are essential components of the hydrological network and agricultural landscape in Latvia, yet they serve as primary pathways for nutrient transport from agricultural fields to downstream water bodies. The water quality monitoring during the vegetation period is needed to understand the levels and patterns of nitrogen losses and identify measures to reduce negative impact of agricultural activities on the environment.

Within this study 112 agricultural ditches representing all four geomorphological regions of minimum runoff in Latvia were selected for water sampling. The water samples were collected in 107 agricultural diches using a manual grab sampling method during the time period from September 20 to October 30, 2025. In 5 ditches the water flow was not observed. In the accredited laboratory the water samples collected were tested for concentrations of total nitrogen (TN), nitrate nitrogen (NO3-N) and ammonium nitrogen (NH4-N) according to the national standard methods. The Corine Land Cover 2018 datasets have been utilized to study the effects of land use distribution on nitrogen concentrations relevant for the catchment areas of the selected ditches.

The monitoring results showed a wide range of concentrations across the study sites. TN concentrations varied from 0.49 to 13.95 mg l-1, while NO3-N between 0.001 and 13.62 mg l-1. The wide range of TN and NO3-N concentrations indicate for a heterogeneous intensity of agricultural activities carried out within the catchment areas of interest, where the intensity agricultural activities differs from very low to very high. The water samples collected in 37 agricultural ditches indicated for the increased ratio (over 75%) between NO3-N and TN concentrations. NO3-N, as a highly soluble and mobile form of nitrogen, is lost from agricultural fields mainly via subsurface drainage systems when the nitrogen surplus is present and excess water percolates through the soil profile until reaches the depth of subsurface drainage systems. The increased ratio between NO3-N and TN concentrations showcase the negative impact of tile drained arable land on nitrogen losses. Contrary, 17 monitoring sites showed a low NO3-N and TN ratio (below 25%) thus indicating for the minor impact of arable land on water quality. NH4-N concentrations in general terms were low with the mean concentration of 0.066 mg l-1, minimum of 0.002 mg l-1 and maximum of 1.609 mg l-1 showing that nitrogen losses from sources of organic origin are not present in the catchments, except of one case.

TN concentrations have a visually inexpressive and statistically insignificant relationship with the share of agricultural lands in the catchment areas of interest. A closer relationship between the two parameters involved in this analysis is limited by the specificity of the data sets applied, when in the cases of increased share of agricultural lands both high and low TN concentrations have been observed.

This study was funded by the Ministry of Agriculture of the Republic of Latvia within the scope of the research project “The assessment of hydrological conditions and water quality during the vegetation period in agricultural ditches in Latvia”, the decision No. 10.9.1-11/25/1545-e.

How to cite: Melbardis, E.: The assessment of nitrogen concentrations in agricultural ditches during the vegetation period in Latvia, EGU General Assembly 2026, Vienna, Austria, 3–8 May 2026, EGU26-21360, https://doi.org/10.5194/egusphere-egu26-21360, 2026.

EGU26-21413 | Posters on site | HS2.3.5

The long-term results of the Agricultural Runoff Monitoring programme in Latvia 

Ainis Lagzdins, Arturs Veinbergs, and Ieva Siksnane

The Agricultural Runoff Monitoring Programme has been implemented in Latvia since 1995 until present. Water quality monitoring activities along with hydrological measurements are carried out at subsequent spatial scales including groundwater (20 wells), experimental plots (1 site with 16 plots), subsurface drainage fields (6 sites), small catchments (10 sites), small and medium size rivers (23 sites). The main objective of the programme is to document and assess the current status and long-term changes in nitrogen concentrations and losses as affected by natural and anthropogenic factors.

Water samples are collected on a monthly basis using a grab sampling approach or composite flow proportional sampling where discharge measurement structures and data loggers are installed. Water samples are analyzed for nitrogen and phosphorus compounds according to the national standards.

The study results show a large variation in NO3-N concentrations among the spatial scales of monitoring with the lowest mean annual concentrations in groundwater (below 1.0 mg l-1) and the highest in the discharge from subsurface drainage fields and experimental plots (over 7.0 mg l-1). Overall, NO3-N concentrations follow the patterns of discharge having the highest concentrations during high flow conditions in winter and spring, while the lowest concentrations during low or no flow conditions in summer and autumn. These patterns highlights the great importance of subsurface and surface drainage systems, which act as pathways for transport of excess water and soluble forms of nitrogen from agricultural fields to surface waters.

It is essential to continue activities within the Agricultural Runoff Monitoring Programme also in the future, especially in the light of need to quantify changes in water quality as related to implementation of the Farm to Fork strategy aiming to reduce the use of fertilisers by at least 20% and nutrient losses by at least 50% by 2030.

How to cite: Lagzdins, A., Veinbergs, A., and Siksnane, I.: The long-term results of the Agricultural Runoff Monitoring programme in Latvia, EGU General Assembly 2026, Vienna, Austria, 3–8 May 2026, EGU26-21413, https://doi.org/10.5194/egusphere-egu26-21413, 2026.

EGU26-21705 | Posters on site | HS2.3.5

Glacier retreat reshapes nutrient dynamics in mountain streams of Norway 

Eliza Płaczkowska, Łukasz Stachnik, Jacob C. Yde, Łukasz Jelonkiewicz, Jon Hawkings, Michał Łopuch, Hanna Raczyk, Jerzy Raczyk, and Małgorzata Szczypińska

Climate change is driving rapid glacier retreat, facilitating the expansion of vegetation into previously unvegetated terrain, and is altering the nutrient dynamics of aquatic ecosystems downstream of glaciers. Here, we measured nutrient concentrations in catchments with varying degrees of glacier coverage in western Norway to determine the likely impacts of glacial retreat on nutrient cycling. Field investigations were conducted during 2024–2025 in five catchments (25–110 km²) draining the largest ice cap in mainland Europe, Jostedalsbreen, and alpine valley glaciers in the Jotunheimen mountain range. These glaciers have undergone sustained thinning and recession since the end of the Little Ice Age (c. 1750 CE). Water chemistry, including concentrations of nutrients, dissolved organic carbon, and suspended sediment, was measured along the longitudinal profiles of the studied streams, and incorporated subglacial, supraglacial, and proglacial waters. Regression analyses revealed that the concentrations of major ions (e.g., Ca²⁺, Na⁺, K⁺, HCO₃⁻, SO₄²⁻) increase as glacier cover within the catchment decreases. This pattern may suggest enhanced chemical denudation and intensified leaching of soil material in non-glaciated areas. In three of the investigated catchments, declining glacier coverage was associated with reduced concentrations of nitrogen compounds (NO₃⁻, NH₄⁺, and total N), indicating that glaciers might play a critical role in the delivery of nitrogen to downstream aquatic systems. Conversely, vegetation likely reduces nitrogen fluxes through biological uptake from soils. Positive Matrix Factorization (PMF) modelling corroborated these findings, identifying distinct sources affecting water chemistry. An atmospheric factor (dominated by Na⁺, Cl⁻, and total N), a biogenic factor (associated primarily with nitrogen compounds), and geogenic factors (linked to mineral weathering and chemical denudation) were distinguished. Biogenic and atmospheric contributions predominated in catchments with ≥60% glacier coverage, whereas geogenic contributions were more pronounced in catchments with <40% glacier cover. Overall, continued glacier retreat and vegetation encroachment are expected to increase the concentration of major ions in streamwaters while diminishing the export of nitrogen compounds, potentially reshaping the biogeochemical functioning of downstream aquatic ecosystems.

How to cite: Płaczkowska, E., Stachnik, Ł., Yde, J. C., Jelonkiewicz, Ł., Hawkings, J., Łopuch, M., Raczyk, H., Raczyk, J., and Szczypińska, M.: Glacier retreat reshapes nutrient dynamics in mountain streams of Norway, EGU General Assembly 2026, Vienna, Austria, 3–8 May 2026, EGU26-21705, https://doi.org/10.5194/egusphere-egu26-21705, 2026.

The global aquatic threat imposed by agriculturally-sourced pollution is further exacerbated due to the shifts in the weather patterns, resulting in changes in catchment hydrology, water cycle, and soil processes. Understanding the timing, extent, and impact of the extreme-weather-events on nutrient losses is hence essential to develop efficient climate-smart adaptation measures to avoid further increases in nutrient pollution in receiving water bodies.

Our research has applied an empirical modelling (EM) approach on +14 years of very high-temporal resolution weather and water quality data from six hydrologically-diverse agriculturally-dominated catchments in Ireland in order to i-detect climate-induced increases in Nitrogen (N) and Phosphorous (P) losses during 2010-2024, and ii- estimate likelihood occurrence of similar loss events until turn of the 21st century using climate change projections. We considered the following criteria to model the historical prevalence of loss-events, and to project the possibility of occurrence in the future under two representative concertation pathways of RCP 4.5 (moderate) and 8.5 (extreme) for three different time periods of 30-years each: effective rainfall (ER)>five mm in one day and/or the day before, ER>10mm over one day, and average air temperature>15℃ over 5 consecutive days.

Although the sensitivity of each catchment to prolonged warm period and intensive short-term precipitation depended highly on the catchment-characteristics, the monthly trend analysis of projected temperature and precipitation indicated very significant increase in the extent of warm and dry periods, as well as the intensity of wet/very wet days, toward the end of the century. The EM captured over 60% of events triggering N losses and up to 80% of P-loss triggering events.

Considering the potential underestimation of projected temperature and precipitation probability, and assuming no changes in N and P inputs in the future scenarios, the average annual number of temperature-related and precipitation-related N-triggering events would reach 120 and 79, respectively, in the far-future RCP 8.5. EM also projected >60% increase in the number of P loss events under both representative pathways while the projections indicated average discharge of over 8 mm per a single event which would directly contribute to increases in mass loads leaving the catchments.

As the water quality is threatened further by the changing weather patterns, it is critical to incorporate the influence of climate change on nutrient losses and develop climate-resilient measures that are tailored to different catchment typologies.

How to cite: Ezzati, G., Murphy, C., and Mellander, P.: Impacts of extreme weather events on water quality and nutrient losses in agricultural catchments: Past, Present, and Future, EGU General Assembly 2026, Vienna, Austria, 3–8 May 2026, EGU26-1028, https://doi.org/10.5194/egusphere-egu26-1028, 2026.

EGU26-1923 | ECS | Orals | HS2.3.6

Global Potential of Potable Reuse as a Water Scarcity Solution Across Coupled Climate and Socioeconomic Future 

Amal Sarfraz, Hassan Niazi, Neal Graham, Thomas Wild, Niko Wanders, Marc F.P. Bierkens, and David Gold

Urban water systems worldwide face escalating scarcity challenges driven by the combined pressures of climate change and socioeconomic development. Population growth and urbanization are concentrating water demand in cities, while climate variability and extremes increasingly threaten reliable supply. Simultaneously, competing demands for human activities and ecosystems functioning intensify pressure on finite freshwater resources, making conventional supply strategies insufficient in many regions.

Potable water reuse (PR), the process of treating and recycling wastewater to produce an alternative source of drinking water, is one promising solution to mitigating urban water scarcity. Here, we quantify the global potential of municipal PR as a water scarcity mitigation strategy and explore how its effects vary across development levels and governance contexts. We use the Global Change Analysis Model (GCAM), an integrated multi-sectoral model capturing long-term interactions between economy, climate, water, energy, and land systems, to assess PR potential within coupled socioeconomic and resource systems. We systematically generate a comprehensive scenario ensemble using combinatorial experimental design, simultaneously examining six key drivers related to water supply, demand, and allocation rules. This exploratory modeling framework enables comprehensive assessment of deep uncertainty while identifying critical factor combinations and threshold conditions where PR delivers improved water security outcomes across 235 global water basins.

Preliminary results highlight that PR can significantly reduce freshwater withdrawals, buffer urban demand during shortages, and indirectly relieve pressure on agricultural systems.  However, our analysis reveals substantial spatial heterogeneity in PR effectiveness. Development level and governance capacity strongly mediate implementation potential, creating clear patterns of implementation inequality i.e. regions with greatest water stress often face the steepest barriers to adoption. Critically, our findings underscore that PR is best viewed as a complementary tool within a broader portfolio alongside conservation, desalination, and improved allocation mechanisms rather than a standalone solution.

How to cite: Sarfraz, A., Niazi, H., Graham, N., Wild, T., Wanders, N., Bierkens, M. F. P., and Gold, D.: Global Potential of Potable Reuse as a Water Scarcity Solution Across Coupled Climate and Socioeconomic Future, EGU General Assembly 2026, Vienna, Austria, 3–8 May 2026, EGU26-1923, https://doi.org/10.5194/egusphere-egu26-1923, 2026.

Algal blooms are a major cause of declining lake water quality and are expected to intensify under climate change. Machine-learning approaches have increasingly been used to predict algal blooms; however, most studies emphasise short-term predictive accuracy rather than longer-term bloom risk. In addition, thermal stratification is often treated as a secondary driver, despite its potential importance in a warming climate. Ensemble models are also frequently applied with limited transparency, restricting interpretability and confidence for decision-making.

To address these gaps, we implemented an interpretable ensemble modelling framework to simulate dynamic chlorophyll-a variability using long-term monitoring data from the southern basin of Lake Windermere, UK. The framework integrates multiple commonly used machine-learning models within a transparent stacking structure, calibrated using Bayesian optimisation, and incorporates post-hoc explanation methods to support interpretation of model behaviour and driver importance.

Results indicate that, alongside meteorological and hydrological drivers, temperature-related variables (particularly indicators of thermal stratification) play an important role in controlling chlorophyll-a variability. Scenario simulations were conducted to explore climate sensitivity, including warming experiments, perturbations to thermal stability, and long-term climate projection scenarios. These experiments suggest that warming and increased water-column stability are generally associated with higher chlorophyll-a concentrations and prolonged periods of elevated bloom risk.

Overall, this study presents a transparent and transferable modelling framework for exploring long-term algal bloom risk under climate change, with relevance for lake management and climate adaptation planning.

How to cite: Ding, D. and Erfani, T.: Interpretable ensemble machine learning for assessing algal bloom risk under climate warming, EGU General Assembly 2026, Vienna, Austria, 3–8 May 2026, EGU26-3493, https://doi.org/10.5194/egusphere-egu26-3493, 2026.

EGU26-5990 | Orals | HS2.3.6 | Highlight

Closing the Loop: Attributing Water Quality Improvement to On-Farm Action 

Richard McDowell

Surface and groundwater quality is influenced by contaminant losses from the farm, and variation caused by climate and time lags caused by the pathways that contaminants take from farms to waterbodies. Using data from 50 years of national and international studies, we find clear evidence that after controlling for variation, we can attribute a degree of confidence in water quality improvements across New Zealand to actions taken on farm designed to mitigate contaminant losses from farms. The degree of confidence varies, depending on how, when and where data have been collected and is subsequently analysed. As a result, the evidence base spans a wide spectrum, from robust, well-funded farm- and catchment-scale studies that monitor water quality and actions across time and space, to well-intentioned but poorly designed studies that collect limited data at few sites over short periods, making it difficult to attribute observed changes to specific farm actions.

To maximise the likelihood of implementing the right actions to improve water quality a five-step framework has been implemented. The framework is designed for farmers, industry bodies, regulators and the community to use as part of a collaborative catchment process focused on action. The process begins with the establishment of a water quality target (Step 1), which requires a plan to reduce contaminant losses—typically by a specified percentage of current levels. The second step sees the land manager identifying mitigation actions for their farm plan. These actions are selected to mitigate the target contaminants, based on the suitability of actions for their farm. The third step ensures actions are implemented in the right place at the right time. This is determined by understanding the current catchment context and risk of contaminant loss, identifying hotspots of risk (e.g., critical source areas) within the farm, and applying suitable and cost-effective actions to maximise outcomes. The fourth step sees appropriate monitoring put in place to connect what's being done on farms with changes in the receiving water body. The final step assesses the level of confidence that improvements in water quality can be attributed to the implemented actions, after accounting for potential confounding factors such as climate variability and changing production. Where well implemented, this framework is able to manage stakeholder expectations about where and when water quality will improve under both voluntary and regulatory regimes.

How to cite: McDowell, R.: Closing the Loop: Attributing Water Quality Improvement to On-Farm Action, EGU General Assembly 2026, Vienna, Austria, 3–8 May 2026, EGU26-5990, https://doi.org/10.5194/egusphere-egu26-5990, 2026.

EGU26-6405 | ECS | Posters on site | HS2.3.6

Linking hydroclimatic hazards and catchment vulnerability to river ecological status under a data-sparse condition using hybrid graph neural networks 

Diep Ngoc Nguyen, Jacopo Furlanetto, Majid Niazkar, Silvia Torresan, and Andrea Critto

River water quality status is increasingly challenged by the combined effects of climate extremes and human activities. Furthermore, monitoring water quality parameters remains sparse and irregular across many river networks to conduct timely and effective assessments. To address these challenges, a new framework was developed to support river network-wide estimation of ecological water quality status. The framework combines a multi-risk approach with deep learning to investigate the relationship between climate hazards, anthropogenic pressures, exposure, and vulnerabilities under hot-dry and wet-dry conditions. It was implemented for the Veneto Region (Italy) to predict annual LIMeco, a nutrient-oxygen physico-chemical index used in regional assessments, for 865 river segments over 2010-2023, with data missingness reaching 66.8%. Hazard conditions were represented by annual hydroclimatic indicators capturing hot and wet/dry conditions and extremes, while anthropogenic pressures were described through land use composition and nutrient load proxies. Exposure and vulnerability were represented through basin characteristics (e.g., soil properties and topography), together with the presence of riparian and wetland areas as proxies of buffering capacity and management levels. To translate these drivers into spatially coherent predictions while acknowledging missing observations due to incomplete datasets, a hybrid spatio-temporal Graph Neural Network (GNN) was implemented in which (i) recent hydroclimatic variability was summarized over a short input window using the Gated Recurrent Units, (ii) information was propagated along upstream-downstream connectivity using GNN, and (iii) eco-hydrological clusters of basins were represented through a data-driven regime label with an unsupervised Machine Learning (ML), derived from the multi-risk indicators, enabling the information transfer between well-monitored and poorly-monitored river segments that have similar climate and land-based regimes. The hybrid spatio-temporal GNN was tested over multiple configurations and against other ML approaches (i.e., Multilayer perceptron and eXtreme Gradient Boosting). The comparison demonstrates that the hybrid GNN achieved the best performances with the highest test accuracies  (RMSE = 0.028; NSE = 0.98) when using the embedded river basin clusters, providing the most stable performance across basin types and missingness levels. This highlighted how the inclusion of physically-based river network dynamics and auxiliary information can help to address missing data compared to other tested methodologies. The proposed framework can support scenario-oriented analysis for decision making and planning, given the representation of management-relevant indicators (e.g., riparian condition, wetland presence, land-use pressure), allowing for exploring future scenarios and responses under climate and socio-economic changes to support adaptation strategies.

How to cite: Ngoc Nguyen, D., Furlanetto, J., Niazkar, M., Torresan, S., and Critto, A.: Linking hydroclimatic hazards and catchment vulnerability to river ecological status under a data-sparse condition using hybrid graph neural networks, EGU General Assembly 2026, Vienna, Austria, 3–8 May 2026, EGU26-6405, https://doi.org/10.5194/egusphere-egu26-6405, 2026.

EGU26-7160 | ECS | Posters on site | HS2.3.6

Multi-Model Climate Projections of Hydrological and Sediment Change in the Ebro River Basin Using SWAT+ 

Arantxa Ortiz-Elorza and Carmelo Juez

ABSTRACT: Rural depopulation and urban expansion have driven widespread natural revegetation in mountainous areas, resulting in substantial land-use changes. Combined with recent climate variability, these processes affect hydrological behavior and sediment dynamics by altering runoff generation, infiltration, and sediment transport. However, their integrated impacts remain poorly quantified at large spatial scales in mountain regions.

This study assesses changes in water and sediment fluxes in the northern sector of the Ebro Basin using the SWAT+ model, a semi-distributed hydrological model operating at a daily time step. The study area was divided into twelve sub-basins, each represented by an individual model. Model calibration and validation were conducted sequentially. Streamflow was first calibrated using observations from more than 30 gauging stations, and performance was evaluated using the Nash–Sutcliffe Efficiency (NSE). Sediment calibration was subsequently performed using reservoir bathymetry data and published sediment yield estimates. The final models achieved NSE values between 0.53 and 0.95, with a basin-wide mean of 0.75, indicating good model performance.

Future hydrological and sediment responses were simulated using climate projections from the NEX-GDDP-CMIP6 dataset. Seventeen climate models were processed at a daily scale and statistically downscaled. Bias correction was applied using Empirical Quantile Mapping (EQM), calibrated over the 2015–2020 period and applied from 2021 onwards. Extreme values were further corrected using a Generalized Pareto Distribution with a Peak-Over-Threshold (GPD/POT) approach, followed by a delta-change adjustment to better match observed conditions.

The overall objective is to compare the impacts of the 17 climate models across the 12 sub-basins. Preliminary results from one sub-basin indicate a consistent decrease in future streamflow, highlighting potential implications for water availability in mountainous Mediterranean basins.

ACKNOWLEDGMENTS: This work is funded by the European Research Council (ERC) through the Horizon Europe 2021 Starting Grant program under REA grant agreement number 101039181 - SEDAHEAD.

How to cite: Ortiz-Elorza, A. and Juez, C.: Multi-Model Climate Projections of Hydrological and Sediment Change in the Ebro River Basin Using SWAT+, EGU General Assembly 2026, Vienna, Austria, 3–8 May 2026, EGU26-7160, https://doi.org/10.5194/egusphere-egu26-7160, 2026.

EGU26-7683 | ECS | Posters on site | HS2.3.6

Event-scale nutrient transport revealed by integrated runoff monitoring and time-lapse imagery 

Giulia Mancini, Chiara Iavarone, Raffaele Pelorosso, Albert Nkwasa, Alessio Patriarca, Fabio Recanatesi, and Maria Nicolina Ripa

Diffuse nutrient pollution during rainfall–runoff events is a major pressure on lake water quality, particularly in agricultural catchments. Short-lived runoff events can deliver disproportionally large nutrient loads, yet event-scale runoff observations are rare due to monitoring limitations. This restricts the design and evaluation of nature-based solutions (NBS) and catchment restoration measures.

Within the Horizon Europe EUROLakes project, Lake Vico (Central Italy) is used as a pilot site to test innovative approaches for monitoring diffuse pollution. Lake Vico is a volcanic lake affected by agricultural nutrient inputs. To better capture event-driven nutrient transport, an experimental surface runoff monitoring setup was established in the Cerreto sub-catchment.

A representative sub-basin was identified based on land use and topography, and an automatic runoff sampling system was installed to trigger autonomously during surface flow events. The system is integrated with a low-cost time-lapse camera acquiring images every 30 minutes, providing continuous visual information on soil moisture conditions and the occurrence of overland flow. Runoff samples are analyzed for key water-quality parameters, including nitrite, ammonium, reactive phosphorus, total nitrogen, and total phosphorus, allowing nutrient dynamics to be quantified at the event scale.

To detect runoff directly from the image time series, a Python-based automated classification workflow is being developed. The method uses two regions of interest per image and simple grayscale features to distinguish dry soil from active runoff, accounting for day-night conditions. The workflow processes the full image archive and produces runoff flags and diagnostic indicators for further analysis.

We present preliminary results from the first monitoring period and assess the performance of the image-based runoff detection. Key uncertainties related to illumination changes, vegetation dynamics, and night-time conditions are discussed. Ongoing work focuses on linking runoff occurrence to rainfall intensity and duration. Beyond site-specific insights, the resulting event-scale runoff and water-quality dataset provides a critical empirical basis for calibrating process-based hydrological models (e.g. SWAT) and supports the evaluation of NBS in data-limited lake catchments.

How to cite: Mancini, G., Iavarone, C., Pelorosso, R., Nkwasa, A., Patriarca, A., Recanatesi, F., and Ripa, M. N.: Event-scale nutrient transport revealed by integrated runoff monitoring and time-lapse imagery, EGU General Assembly 2026, Vienna, Austria, 3–8 May 2026, EGU26-7683, https://doi.org/10.5194/egusphere-egu26-7683, 2026.

EGU26-8622 | ECS | Posters on site | HS2.3.6

Nutrient export from catchments to Singapore’s reservoirs in a changing climate 

Zhaoyang Luo, Jianning Ren, Mengzhu Chen, Kavindra Yohan Kuhatheva Senaratna, Shu Harn Te, Hongjuan Han, Karina Yew-Hoong Gin, and Simone Fatichi

While surface freshwater (i.e., water in lakes, reservoirs, and rivers) plays an essential role in sustaining human life, both its quantity and quality are increasingly threatened by human activities and climate change. Combining field measurements with a mechanistic model T&C-BG, we investigate nutrient export (dissolved organic carbon (DOC), total nitrogen (TN), and total phosphorus (TP)) from catchments to Singapore’s reservoirs considering six land covers (i.e., forest, grassland, golf courses, agricultural land, bare soil, and impervious surfaces). Results show that the T&C-BG model reproduces well measurements of soil nutrients, soil respiration, and nutrient leakage for different land covers. At the plot scale, DOC export tends to increase in the future for all vegetated surfaces because of stimulated plant photosynthesis by CO2 fertilization effects. In contrast, TN and TP exports can either increase or decrease depending on land cover. Increases in TN and TP export occur when net primary production is reduced and hence nutrient uptake decreases; the opposite occurs when net primary production increases. While upscaling to the catchment scale, DOC export increases for all reservoirs in the future but TN and TP export trends vary regionally depending on the distribution of land cover types in upstream catchments. Moreover, regardless of the spatial scale, climate internal variability plays an important role in regulating nutrient exports in all experiments. Our findings provide insights for the sustainable management of surface freshwater resources in a changing climate.

How to cite: Luo, Z., Ren, J., Chen, M., Senaratna, K. Y. K., Te, S. H., Han, H., Gin, K. Y.-H., and Fatichi, S.: Nutrient export from catchments to Singapore’s reservoirs in a changing climate, EGU General Assembly 2026, Vienna, Austria, 3–8 May 2026, EGU26-8622, https://doi.org/10.5194/egusphere-egu26-8622, 2026.

EGU26-10476 | Orals | HS2.3.6

Developing Freshwater Quality Futures for the UK 

Victoria Bell, Stephen Lofts, Dan Lapworth, Martyn Kelly, Ian Vaughan, Andy Whitmore, Marco Bianchi, Hongyan Chen, Helen Davies, Theo Jackson, Ben Marchant, Alice Milne, Nathan Missault, Barbara Palumpo-Roe, William Perry, Ponnambalam Rameshwaran, and Mark Rhodes-Smith

Multiple pressures, both past and present, influence the chemical and biological quality of UK freshwaters. While some of these pressures (e.g. metals, acidification, oxygen-consuming substances) appear to have eased in recent decades, others (e.g. industrial and personal organic micropollutants, nitrogen and phosphorus) remain and may be increasing. Reductions in levels of freshwater pollution following the introduction of regulations (e.g. European Urban Waste Water Treatment Directive) have driven a degree of biological recovery across the UK. Whether these improvements in UK freshwater quality and biodiversity will be maintained long term is of great interest to the public who rely on freshwaters for recreation, to water companies for drinking water supply, to industry and to statutory regulators.

Our Long Term Large Scale Freshwater Ecosystems (LTLS-FE) project aims to understand the effects of multiple pressures and drivers on freshwater quality at a national scale using a multidisciplinary modelling approach. We are working to develop and analyse future scenarios of water quality and biodiversity in UK freshwaters which take account of both climate and socioeconomic change (RCP/SSP combinations).

Here, we present the multidisciplinary modelling approach used in LTLS-FE, which links models of soil processes, agriculture and point source releases of pollutants to surface waters with a hydrological model of transport and transformation in the freshwater environment. These will then be used to drive a national-scale ecological model to predict impacts on freshwater biota. We will present the innovations that have been required to achieve this goal, including a national-scale model of sewage treatment, national datasets of metal fluxes from mine waters and anthropogenic abstractions, and scenarios of pollutant releases from domestic and industrial sources to 2080. We are now in the final year of our four-year project and will demonstrate how well the LTLS-FE freshwater model performs on historical periods before sharing early results of future scenarios.

How to cite: Bell, V., Lofts, S., Lapworth, D., Kelly, M., Vaughan, I., Whitmore, A., Bianchi, M., Chen, H., Davies, H., Jackson, T., Marchant, B., Milne, A., Missault, N., Palumpo-Roe, B., Perry, W., Rameshwaran, P., and Rhodes-Smith, M.: Developing Freshwater Quality Futures for the UK, EGU General Assembly 2026, Vienna, Austria, 3–8 May 2026, EGU26-10476, https://doi.org/10.5194/egusphere-egu26-10476, 2026.

EGU26-12143 | ECS | Orals | HS2.3.6

National scale water quality modelling: Challenges and successes 

Nathan Missault, Mark Rhodes-Smith, Victoria Bell, Helen Davies, Ponnambalan Rameshwaran, Stephen Lofts, Hongyan Chen, Alice Milne, Theo Jackson, Andrew Whitmore, Dan Lapworth, Marco Bianchi, Barbara Palumbo-Roe, Benjamin Merchant, William Perry, Ian Vaughan, and Martyn Kelly

Freshwater quality in the future will be determined by the combined effect of climate change, land-use changes, and socioeconomic developments, with important consequences for ecosystem health and clean water availability. Robust comprehensive modelling frameworks are therefore needed to quantify the impact of these pressures across space and time, while accounting for the uncertainty in projected changes. However, simulating multiple pollutants across complex hydrological systems over multi-decadal periods at national scale presents substantial methodological and practical challenges. Here, we present an integrated modelling framework for UK surface and groundwater quality and discuss challenges and successes in producing reliable national-scale projections.

We present the modelling framework developed within the Long-Term Large-Scale Freshwater Ecosystems (LTLS-FE) project, building on an existing long-term integrated model (LTLS-IM). It dynamically couples process-based representations of surface and subsurface hydrology, agricultural and seminatural soils, sewage and septic tank emissions, and in-stream transport and fate. Using observational datasets, we evaluate modelled freshwater concentrations for a wide range of substances, including fine sediment, macronutrients, metals, and diverse micropollutants such as pesticides, antibiotics, pharmaceuticals, personal care products, industrial chemicals, and polycyclic aromatic hydrocarbons.

The framework is applied to project water quality across the UK from 1981 to 2080 under six future scenarios combining UKCP18 climate projections (RCP2.6–RCP8.5) with different Shared Socioeconomic Pathways (SSP1–SSP5). Simulations are conducted at a two-hourly timestep on a 5 km grid, producing monthly outputs of river flow, temperature, pH, biochemical oxygen demand, pollutant concentrations, and fluxes to the sea.

Challenges include limited pollutant input and validation datasets, particularly for Northern Ireland, as well as slow groundwater equilibration periods. Integrating multiple process-based sub-models while maintaining computational efficiency also required careful model design and optimisation. Despite these challenges, comparisons with national monitoring data show that the framework captures observed spatial patterns, seasonal dynamics, and long-term trends for major pollutant groups. Here we present the project outputs compared against observations and interpret future trends. These results demonstrate the feasibility and value of national-scale, multi-pollutant modelling to support future assessments of water quality risks under future change.

How to cite: Missault, N., Rhodes-Smith, M., Bell, V., Davies, H., Rameshwaran, P., Lofts, S., Chen, H., Milne, A., Jackson, T., Whitmore, A., Lapworth, D., Bianchi, M., Palumbo-Roe, B., Merchant, B., Perry, W., Vaughan, I., and Kelly, M.: National scale water quality modelling: Challenges and successes, EGU General Assembly 2026, Vienna, Austria, 3–8 May 2026, EGU26-12143, https://doi.org/10.5194/egusphere-egu26-12143, 2026.

EGU26-12540 | ECS | Orals | HS2.3.6

Declining dissolved oxygen levels in the world’s rivers due to climate change 

Duncan Graham, Marc Bierkens, Edward Jones, Edwin Sutanudjaja, and Michelle van Vliet

Dissolved oxygen is expected to decline in many of the world’s rivers due to increasing water temperatures under climate change. This may cause significant adverse effects for freshwater ecosystems, such as mass mortality events and fish kills. However, previous studies related to the effects of climate change on dissolved oxygen are mostly carried out at local or regional scales. In our study, we perform the first global-scale analysis of dissolved oxygen concentrations under climate change for both historic (1980-2019) and future periods (2020-2100) (Graham et al., 2025). This involves the development of a hybrid process-based and machine learning model framework of dissolved oxygen concentration at the global-scale. The model framework includes the process-based DynQual surface water quality model and a random forest machine learning model for error correction, trained on roughly 2.6 million observations of dissolved oxygen concentrations.

The hybrid approach shows a significantly improved performance in simulating dissolved oxygen concentrations compared to the process-based model alone. For instance, there is on average a 43% reduction in the normalised Root-Mean-Squared-Error (nRMSE) when applying residual error correction with machine learning. Additionally, the hybrid DynQual_Random Forest model was able to better capture the impacts of extremes compared to the standalone process-based model. We applied the hybrid model globally at 5arcmin (approximately 10km) spatial and daily resolution for the periods 1980-2019 and 2020-2100. Our results show significant decreasing trends in dissolved oxygen concentration for the majority of rivers worldwide, which leads to on average 8.8 ± 2.3 more hypoxia days (with DO < 3 mg l-1) per decade globally over the period 2020-2100. This study highlights the strengths of a hybrid process-based and machine learning modelling framework to capture water quality responses at high spatial and temporal resolution as well as during hydro-climatic extremes. It shows that increasing water temperatures and increasing biochemical oxygen demand (BOD) are likely the key drivers of decreasing dissolved oxygen concentrations under climate change. Furthermore, our study emphasises the importance of dissolved oxygen as a key driver of freshwater ecosystem health in the coming decades.

References

Graham, D.J., Bierkens, M.F.P., Jones, E.R. et al. Climate change drives low dissolved oxygen and increased hypoxia rates in rivers worldwide. Nat. Clim. Chang. 15, 1348–1354 (2025). https://doi.org/10.1038/s41558-025-02483-y

How to cite: Graham, D., Bierkens, M., Jones, E., Sutanudjaja, E., and van Vliet, M.: Declining dissolved oxygen levels in the world’s rivers due to climate change, EGU General Assembly 2026, Vienna, Austria, 3–8 May 2026, EGU26-12540, https://doi.org/10.5194/egusphere-egu26-12540, 2026.

EGU26-14310 | Posters on site | HS2.3.6

Seamless National-Scale Assessment of Legacy Nitrogen Pollution in German Rivers 

Rohini Kumar, Tam Nguyen, Pia Ebeling, Sabine Attinger, and Andreas Musolff

Nitrogen pollution of surface water bodies remains one of the most persistent environmental challenges across European landscapes, largely resulting from widespread agricultural intensification since the early 20th century. In this study, we present a seamless national-scale framework for the comprehensive assessment of nitrogen dynamics in German river systems by combining long-term nitrogen input sources (e.g., mineral fertilizers, manure applications, and wastewater effluents) with a process-oriented modeling framework to estimate both current and legacy sources of nitrogen pollution. We built a harmonized dataset covering both diffuse and point nitrogen sources from the 1950s [1,2] to the present and tracked the terrestrial transfer of nitrogen through soils, groundwater, and river networks. Our analysis is based on the multiscale water quality model mQM [3], which explicitly accounts for nitrogen legacy storage and delayed release and transport processes across terrestrial compartments. Model parameterization follows a stepwise approach: catchment-scale parameters are first constrained using riverine N concentration data from more than 100 gauging stations, compiled within the QUADICA database [4,5]. This allows for a robust basin-scale model configuration covering diverse German landscapes: natural forested regions, intensive croplands, and livestock-based systems; and capturing a range of varying hydroclimatic conditions, subsurface soil and groundwater characteristics, and socioeconomic factors. 

Subsequently, to enable seamless model application across the entire German river network, we apply a transferable model parameterization that utilizes spatial proximity, physiographic similarity, and landscape characteristics using statistical methods and machine-learning techniques (e.g., regression relationships and Random Forests). Our near-century-long data and model-based analysis show pronounced spatial and temporal heterogeneity in N input sources and riverine N concentrations across German landscapes. Regions with excessive nitrogen surplus are associated with livestock-intensive systems in northern Germany as well as mineral fertilizer-dominated cropland regions in central Germany, while differences in catchment functioning and hydroclimatic conditions modulated how excess N signals propagate to riverine N concentration levels. Despite national-scale reductions in nitrogen surplus and substantial improvements in wastewater treatment, there are regions of Germany (e.g., in the Central Elbe River) that continue to exceed critical nitrogen thresholds (>2.5 mg/L). Our analysis provides a seamless framework for assessing nationwide nitrogen pollution and supports the development of intervention strategies for sustainable nitrogen management.

[1] https://doi.org/10.1038/s41597-022-01693-9
[2] https://doi.org/10.5194/essd-16-4673-2024
[3] https://doi.org/1029/2022GL100278
[4] https://doi.org/10.5194/essd-14-3715-2022
[5] https://doi.org/10.5194/essd-2025-450

How to cite: Kumar, R., Nguyen, T., Ebeling, P., Attinger, S., and Musolff, A.: Seamless National-Scale Assessment of Legacy Nitrogen Pollution in German Rivers, EGU General Assembly 2026, Vienna, Austria, 3–8 May 2026, EGU26-14310, https://doi.org/10.5194/egusphere-egu26-14310, 2026.

EGU26-14401 | Posters on site | HS2.3.6

Critical water quality limits for aquatic freshwater biodiversity  

Albert Nkwasa, Maria Theresa Nakkazi, Kyle J. Brumm, Ann van Griensven, and Taher Kahil

Freshwater ecosystems host a disproportionate share of global biodiversity yet are increasingly exposed to declining water quality driven by nutrient enrichment, chemical contamination, thermal stress, salinisation, and emerging pollutants. While water quality standards and regulatory limits exist for many constituents, their relevance for safeguarding freshwater biodiversity remains fragmented, taxon-specific, and unevenly documented across regions and ecosystem types. This review synthesises current knowledge on critical water quality limits associated with adverse responses of freshwater biodiversity, with a focus on identifying lethal and sublethal thresholds across major aquatic taxa and key water quality constituents.

We systematically assess reported biodiversity responses covering fish, amphibians, macroinvertebrates, reptiles, freshwater-adapted mammals, and where evidence exists, groundwater-associated biota to changes in nutrients (nitrogen and phosphorus), temperature, dissolved oxygen, biochemical oxygen demand, salinity, suspended sediments, metals, plastics, pharmaceuticals, and contaminants of emerging concern, including PFAS and microplastics. Reported thresholds are evaluated across lentic and lotic systems to account for ecosystem-specific sensitivities. Where possible, we distinguish between acute (lethal) and chronic (sublethal) response levels and document observed exceedance events.

Beyond synthesising established thresholds, the review explicitly highlights constituents for which biodiversity-relevant limits are poorly defined or absent, as well as geographic regions where water quality degradation is likely occurring but biodiversity impacts remain under-reported. By consolidating dispersed evidence and identifying critical gaps, this review aims to support biodiversity-relevant water quality assessments, inform monitoring and modelling efforts, and provide a foundation for integrating ecological thresholds into freshwater management and policy frameworks under accelerating global change.

How to cite: Nkwasa, A., Theresa Nakkazi, M., J. Brumm, K., van Griensven, A., and Kahil, T.: Critical water quality limits for aquatic freshwater biodiversity , EGU General Assembly 2026, Vienna, Austria, 3–8 May 2026, EGU26-14401, https://doi.org/10.5194/egusphere-egu26-14401, 2026.

EGU26-14851 | Posters on site | HS2.3.6

Nationwide Modeling of River Ammonia-Nitrogen Concentrations in Taiwan Using Machine Learning  

Ching-Ping Liang, Jui-Yu Chang, and Jui-Sheng Chen

Decades of river water quality monitoring in Taiwan have revealed a clear trend of deterioration, with ammonia-nitrogen (NH₃–N) concentrations at several monitoring stations frequently exceeding the regulatory thresholds established by the Ministry of Environment. This degradation arises from the combined influence of natural biogeochemical processes and diverse anthropogenic pressures. Accurately modeling the spatial variability of river water quality is therefore both challenging and essential for protecting riverine ecosystems and public health. In recent years, data-driven machine learning (ML) approaches have demonstrated strong capability in capturing complex, nonlinear relationships in both surface and subsurface water systems. In this study, we develop a predictive model for riverine NH₃–N concentrations using an artificial neural network (ANN) trained on an extensive suite of multivariate datasets compiled across multiple government ministries. Model performance is rigorously evaluated through three-fold cross-validation, confirming that the ANN effectively captures the primary spatiotemporal variability of NH₃–N and provides reliable predictive accuracy. To further interpret the model, SHAP analysis is conducted to identify key predictors. The results show that average precipitation in November, the extent of land undergoing human modification, the density of food-product and animal-feed manufacturing activities, and the forest land-use group are among the most influential drivers of NH₃–N concentrations. Identifying such dominant variables is crucial for guiding evidence-based river water quality management and for formulating targeted pollution mitigation strategies.

How to cite: Liang, C.-P., Chang, J.-Y., and Chen, J.-S.: Nationwide Modeling of River Ammonia-Nitrogen Concentrations in Taiwan Using Machine Learning , EGU General Assembly 2026, Vienna, Austria, 3–8 May 2026, EGU26-14851, https://doi.org/10.5194/egusphere-egu26-14851, 2026.

Groundwater nitrate contamination remains a persistent challenge across Europe, despite decades of regulation and monitoring. Although nitrate pollution is commonly framed as a diffuse agricultural pressure, exceedance patterns are spatially structured and strongly associated with management intensity. This supports a management-relevant modelling pathway: risk mapping can be extended into scenario-based evaluation of mitigation strategies, enabling spatial prioritization and transparent comparison of intervention options. In this study we present a management-focused scenario framework to quantify future changes in groundwater nitrate hotspot risk across Europe on a harmonized grid. Groundwater nitrate monitoring data are linked to land-use composition predictors (fractions of cropland, grassland, forest, wetlands, and impervious surfaces), alongside regional landscape descriptors and climate–hydrological covariates. Model outputs are provided as (i) a continuous probability of hotspot occurrence and (ii) a binary hotspot classification defined by exceedance of the drinking-water nitrate threshold. To improve continental transferability and reduce over-optimistic performance from spatial autocorrelation, model development and evaluation rely on spatial cross-validation and region-based holdouts. The predictive core is an AI-based ensemble designed to capture nonlinear interactions between land systems, hydroclimate, and nitrate outcomes. Management scenarios include: (1) cropland reallocation to grassland/forest to represent extensification and protection-zone land-use transitions; (2) wetland restoration to increase landscape retention and reduce leaching susceptibility; (3) fertilizer-pressure reduction implemented as proportional decreases in agricultural nitrogen intensity. For each strategy, we compare uniform implementation against risk-based targeting applied only in high-probability hotspot cells. Finally, all scenarios are evaluated under 2050 climate conditions (multi-scenario climate projections), allowing assessment of mitigation robustness under altered recharge regimes and climate-driven changes in leaching potential. The framework provides an operational route from EU-scale monitoring to management-ready, climate-aware decision support for prioritizing groundwater nitrate mitigation across Europe.

How to cite: Ahmadi, K., Berndtsson, R., and Naghibi, A.: Assessing groundwater nitrate hotspot mitigation through management scenarios and AI-based risk prediction across Europe under climate change , EGU General Assembly 2026, Vienna, Austria, 3–8 May 2026, EGU26-19546, https://doi.org/10.5194/egusphere-egu26-19546, 2026.

EGU26-19661 | ECS | Posters on site | HS2.3.6

Can Agricultural Nitrate Leaching to Groundwater Be Reduced Without Compromising Crop Yields? 

Vivek Tiwari, Idhayachandhiran Ilampooranan, Rajendran Vinnarasi, and Sharad Kumar Jain

Intensive agricultural production in the Indo-Gangetic Plain has led to widespread overapplication of fertilizers, particularly in sugarcane-based systems, resulting in elevated nitrate concentrations in groundwater. In the Hindon River Basin, the Central Ground Water Board (CGWB) has reported significant nitrate contamination, which poses a threat to both agricultural sustainability and drinking water security. Addressing this degradation while maintaining productivity requires quantitative tools to evaluate management interventions. This study employs the SWAT+ model to evaluate the impact of reduced fertilizer application and alternative irrigation practices on groundwater nitrate leaching and sugarcane yield in the sugarcane-dominated Hindon Basin. The model's ability to represent basin hydrology and crop growth was evaluated through calibration and validation using observed streamflow at two gauging locations, and sugarcane yield data from three districts. The model demonstrated satisfactory performance, with streamflow calibration and validation producing average KGE values of 0.74 and 0.73, respectively, and an average percent bias (PBIAS) of 12% and +9%. Crop yield simulations yielded average KGE values of 0.76 and 0.83 during calibration and validation, respectively, with PBIAS values of -4% and -6%. These results confirm the model's reliability for management-oriented assessments. Four management scenarios were simulated against a baseline that reflected current farmers' practices, as identified through field surveys. Scenarios included fertilizer reductions of 15% and 30%, implemented under both furrow and drip irrigation systems. Groundwater quality responses were evaluated using annual average nitrate percolation below the root zone for leaching, while sugarcane yield was used to assess productivity trade-offs. Across all alternative scenarios, nitrate percolation decreased by 46% to 68% relative to the baseline. Changes in sugarcane yield were minimal, remaining within 1-2% of current practices. Drip irrigation demonstrated greater nitrate reduction compared to furrow irrigation at the same fertilizer levels, highlighting the importance of irrigation efficiency in mitigating nutrient loss. These findings suggest that moderate decreases in fertilizer use, combined with drip irrigation, can significantly reduce groundwater nitrate contamination in the Indo-Gangetic Plain without compromising yields.
Keywords: Nitrate, Agriculture, Fertilizer, Irrigation, Groundwater, SWAT+

How to cite: Tiwari, V., Ilampooranan, I., Vinnarasi, R., and Jain, S. K.: Can Agricultural Nitrate Leaching to Groundwater Be Reduced Without Compromising Crop Yields?, EGU General Assembly 2026, Vienna, Austria, 3–8 May 2026, EGU26-19661, https://doi.org/10.5194/egusphere-egu26-19661, 2026.

EGU26-22282 | Orals | HS2.3.6

Reducing nutrient pollution in European river basins under climate change and evolving EU policy 

Bruna Grizzetti, Angel Udias, Faycal Bouraoui, Olga Vigiak, Francesco Galimberti, Alberto Pistocchi, Alberto Aloe, Michela Zanni, Matteo Zampieri, Chiara Piroddi, and Diego Macias

In Europe, nutrient pollution from intensive farming and high population density degrades water quality, undermining the water needs of humans and natural ecosystems. Water quality outcomes result from the interaction of management actions and a changing climate, making it difficult to separate the influence of each driver. To devise effective mitigation strategies, a clear understanding of river basin dynamics, nutrient source distributions, and projected climate evolution is required, together with region specific load targets that respect the source to sea continuum—including surface water, groundwater, and marine discharge. Water quality models offer tools for exploring future trajectories that consider changes in climate and nutrient source management.

We (i) compiled existing nutrient load targets for European river basins, highlighting their spatial variability; (ii) developed a set of coupled climate change and EU policy scenarios extending to 2050, representing plausible trajectories of precipitation and policy stringency; (iii) applied a scenario modelling framework that links these drivers to basin scale nutrient fluxes, allowing us to quantify the reductions needed to meet the defined targets; and (iv) evaluated a suite of basic nutrient reduction measures (e.g., optimized fertilizer application, enhanced riparian buffers, upgraded wastewater treatment) for their effectiveness in delivering the required load cuts.

This research highlights the nutrient loading reductions needed to achieve European water policy targets for both inland and coastal ecosystems in a changing climate, offering guidance for sustainable water resource strategies.

How to cite: Grizzetti, B., Udias, A., Bouraoui, F., Vigiak, O., Galimberti, F., Pistocchi, A., Aloe, A., Zanni, M., Zampieri, M., Piroddi, C., and Macias, D.: Reducing nutrient pollution in European river basins under climate change and evolving EU policy, EGU General Assembly 2026, Vienna, Austria, 3–8 May 2026, EGU26-22282, https://doi.org/10.5194/egusphere-egu26-22282, 2026.

EGU26-22312 | Orals | HS2.3.6

Mapping hotspots for future water pollution in Africa using SDG indicator 6.3.2  

Maria Theresa Nakkazi, Albert Nkwasa, Jose Tera Orsini, and Ann van Griensven

Efficient monitoring and reporting of Sustainable Development Goal (SDG) indicator 6.3.2 is essential for assessing progress toward good ambient water quality. However, data limitations, particularly in developing regions such as Africa, hinder accurate assessment of water quality in rivers. This study addresses this challenge by employing modelling to map progress of the SDG indicator 6.3.2 in Africa for the reporting years 2020, 2030, 2040 and 2050 under three socio-economic scenarios; SSP1-RCP2.6, SSP3-RCP7.0 and SSP5-RCP8.5. This indicator will provide an overview of the state and trends of future water quality in different African regions and identify hotspots of water pollution. We utilize model simulations from two global water quality models; DynQual and SWAT+ to generate water quality indexes (WQIs) using four core parameter groups at level I reporting namely salinity (Total Dissolved solids), nitrogen (Total Nitrogen), phosphorus (Total Phosphorus) and oxygen (Biological Oxygen Demand). Model simulations are compared to target values to derive country and river basin level WQIs. Additionally, we assess the impact of level II parameters on the overall indicator by adding fecal coliform (FC) to the calculation. Lastly, we compute the percentage of population exposed to the deteriorating water quality across these periods and scenarios. This study's robust methodology for SDG mapping significantly enhances our understanding of future water quality dynamics. The findings will inform targeted interventions, policy formulation, and sustainable water resource management, contributing to the achievement of SDG 6 and broader environmental sustainability objectives across the continent.

How to cite: Nakkazi, M. T., Nkwasa, A., Tera Orsini, J., and van Griensven, A.: Mapping hotspots for future water pollution in Africa using SDG indicator 6.3.2 , EGU General Assembly 2026, Vienna, Austria, 3–8 May 2026, EGU26-22312, https://doi.org/10.5194/egusphere-egu26-22312, 2026.

EGU26-2713 | ECS | Orals | HS2.3.7 | Highlight

Deciphering complex signals: What can science learn from environmental pesticide monitoring?  

Jenny Kröcher, Gunnar Lischeid, and Matthias Pfannerstill

Environmental and water resources agencies run comprehensive monitoring programs of pesticides and their transformation products in surface and groundwater systems to determine water pollution and to comply with the reporting obligations of the EU. Besides, institutions carry out additional monitoring programs serving different purposes, including a review of the registration process, finding evidence for risks that have been underrated so far, determining application errors or improper handling, and deriving recommendations for agricultural and water resources management. However, these programs are often considered to be of marginal value for research. Among others, usually pesticide application and management data are scarce, the input of other sources like, e.g., deposition of trifluoroacetate (TFA), is unknown, soil properties exhibit enormous but purely known spatial heterogeneity, and knowledge about transformation pathways of the active ingredients is limited.

Thus, there is urgent need for developing a blueprint for the analysis of such monitoring data that makes maximum use of the information but avoiding pitfalls of unjustified basis assumptions. We present an approach based on the analysis of a 4.5 years monitoring program with monthly sampling in twenty shallow groundwater wells in the Federal State of Schleswig-Holstein in North Germany. Agricultural management data were available for part of the capture zones of some wells but were not complete. Thus, a forward modelling was not possible. Instead, in a first step we aimed at assessing the effects of vadose zone and aquifer properties, filter screen depth, and weather conditions on the observed spatial and temporal patterns of the concentration of pesticide and transformation products (TP). Canonical correlation analysis of time courses of solute concentration and of groundwater head at the twenty groundwater wells revealed very close resemblance between both. In fact, groundwater head dynamics proved to be a very powerful predictor of pesticide and TP dynamics. This provides clear evidence that most of the observed dynamics reflects transient immobilisation and later remobilisation in the vadose zone rather than direct effects of pesticide application.

In a next step, support vector machine models were set up separately for various substances. They explained more than 90% of the total variance for most substances. There were some cases of characteristic deviation between the observed and simulated concentration that could be ascribed to recent applications of the respective active ingredients. In most cases, however, there was clear evidence for a long-term stock of substances being occasionally flushed to the groundwater during short episodes. In regard to TFA our analysis revealed strong indications for a major and increasing contribution of deposition from non-agricultural sources in peri-urban regions. We conclude that analysis of the residuals of the support vector machine models is a powerful tool for making efficient use of monitoring data, even in face of incomplete data about the boundary conditions.


How to cite: Kröcher, J., Lischeid, G., and Pfannerstill, M.: Deciphering complex signals: What can science learn from environmental pesticide monitoring? , EGU General Assembly 2026, Vienna, Austria, 3–8 May 2026, EGU26-2713, https://doi.org/10.5194/egusphere-egu26-2713, 2026.

EGU26-3135 | Orals | HS2.3.7

Probabilistic modelling of pharmaceutical pollution risk from sewage treatment work discharges using a Bayesian Network: application to a Scottish river catchment 

Miriam Glendell, Mads Troldborg, Zisis Gagkas, Kerr Adams, Camilla Negri, Phil Taylor, Zulin Zhang, Pat Cooper, Alison Brown, Linda May, Ana Corrochano-Fraile, Lindsay Beevers, and Andrew Tyler

Pharmaceuticals are increasingly recognised as a class of emerging contaminants of concern in rivers. Their continuous release from human use and variable removal in sewage treatment works (STWs) can produce ecologically relevant concentrations and contribute to antimicrobial resistance. We developed a probabilistic catchment-scale model based on a Bayesian Belief Network (BN) to quantify pharmaceutical concentrations and the probability of exceeding predicted no-effect concentrations (PNECs) at a monthly time step. The BN embeds a stochastic mass-balance linking monthly prescribing rates, excretion fractions, STW removal efficiencies and river discharge to produce posterior distributions of concentrations for 16 pharmaceuticals at 20 monitoring points in a medium size Scottish catchment. Model inputs were derived from Scotland’s National Health Service (NHS) prescribing records, a literature compilation of excretion and removal data, and a calibrated SWAT hydrological model. Simulated posterior concentration distributions generally agreed with observations and were typically within one order of magnitude for most compounds, indicating satisfactory performance. Highest exceedance probabilities were predicted for azithromycin, diclofenac, ibuprofen and clarithromycin, particularly at heavily impacted sites and during low-flow summer months. Scenario analyses show that future drier summers (UKCP18 RCP8.5) increase exceedance probabilities, and that substantial reductions in prescribing or markedly improved STW removal efficiencies are needed to reduce risks for high-impact compounds. The BN framework transparently captures uncertainty, supports diagnostic inference to prioritise interventions and is readily extensible to include additional sources (e.g. combined storm overflow and septic tanks) and pollutant mixture risk assessment.

How to cite: Glendell, M., Troldborg, M., Gagkas, Z., Adams, K., Negri, C., Taylor, P., Zhang, Z., Cooper, P., Brown, A., May, L., Corrochano-Fraile, A., Beevers, L., and Tyler, A.: Probabilistic modelling of pharmaceutical pollution risk from sewage treatment work discharges using a Bayesian Network: application to a Scottish river catchment, EGU General Assembly 2026, Vienna, Austria, 3–8 May 2026, EGU26-3135, https://doi.org/10.5194/egusphere-egu26-3135, 2026.

1,4-Dioxane is commonly found as a co-contaminant at chlorinated solvent sites, most notably alongside 1,1,1-trichloroethane (1,1,1-TCA). To a lesser extent, it can also occur as a primary contaminant at sites where it is used as a solvent, such as in the pharmaceutical industry. Due to its widespread occurrence and classification as a likely human carcinogen, understanding its environmental fate is of significant interest.

The biodegradation of 1,4-dioxane occurs primarily under aerobic conditions, whereas anaerobic degradation has been shown to be negligible. Aerobic degradation may proceed either metabolically or co-metabolically and is initiated by monooxidation of the dioxane ring, followed by spontaneous oxidation and ring cleavage, ultimately leading to complete mineralization.

An increasing number of laboratory studies have investigated 1,4-dioxane–degrading bacteria, which may facilitate its removal. However, relatively few studies have directly assessed the relevance of these processes under field conditions. The primary objective of this study was to examine the in situ degradation of 1,4-dioxane in groundwater at various sites using compound-specific carbon isotope analysis (δ¹³C). The δ¹³C values of 1,4-dioxane extracted from these sites will be presented and discussed.

How to cite: Bernstein, A.: Degradation of 1,4-Dioxane in Groundwater – Field Study Integrating Compound-Specific Isotope Analysis, EGU General Assembly 2026, Vienna, Austria, 3–8 May 2026, EGU26-3412, https://doi.org/10.5194/egusphere-egu26-3412, 2026.

EGU26-3832 | Orals | HS2.3.7

Tracking antimicrobial resistance pathways in a poultry-intensive catchment 

Priyanka Jamwal, Akash Ashwini, and Abi Tamim Vanak

Antimicrobial resistance (AMR) is an emerging environmental contaminant with direct implications for human and animal health, reinforcing the One Health premise that environmental integrity is foundational to health outcomes. We conducted a pilot catchment-scale study in western India to assess AMR prevalence and to distinguish dominant pathways associated with poultry expansion, poultry litter reuse, and human habitation. Four sub-catchments were selected to represent contrasting antibiotic pressure sources: i.e  dense poultry farming (4 farms km⁻²),  sparse poultry farming (2 farms km⁻²), agricultural fields receiving poultry litter as manure, and  habitation (village), along with a reference control. We evaluated antimicrobial resistance using culture-based enumeration of antibiotic-resistant bacteria (ARB) and isolation of multidrug-resistant (MDR) species, complemented by a multiple antibiotic resistance (MAR) index to compare contamination pressure across settings. Poultry litter contained high ARB loads, with 2.5 × 10^7 CFU g⁻¹ resistant to tetracycline and 1.7 × 10^7 CFU g⁻¹ resistant to erythromycin. Seven MDR bacterial species were identified in litter, and five species had MAR index values > 0.2, indicating substantial antibiotic selection pressure. In contrast, no evidence of AMR bacteria was detected in soil and water samples collected immediately surrounding poultry farms, suggesting that strict disinfection protocols afect the prevelance of AMR around farm premises. However, agricultural soils located approximately 0.5 km from the nearest poultry farm, where poultry litter was applied as manure, showed clear AMR signals, including seven MDR species and two species with MAR index values > 0.2. Soil and water samples from manured (poultry litter) fields exhibited markedly higher resistance than unmanured fields, particularly to erythromycin, ampicillin, vancomycin, penicillin, and ciprofloxacin. Resistance was highest for vancomycin in soil (9%) and penicillin in water (52%) from manured fields. By comparison, unmanured fields exhibited <1% resistance in soil and 15% in water. Escherichia coli and Enterobacter spp. were detected in village and control soils with MAR index values < 0.2, consistent with comparatively lower antibiotic contamination.
Overall, the results indicate that land application of untreated poultry litter, rather than proximity to poultry farms alone, can be a key pathway for spread of ARB and resistance determinants into receiving agricultural environments. The study demonstrates a source-differentiated catchment approach to establish baseline AMR assessment protocols that can help disentangle contributions from animal husbandry, manure management, domestic sewage, and background resistance. We recommend the development and implementation of treatment, handling, and disposal protocols for poultry litter to enable safer agricultural reuse and reduce further AMR propagation.

How to cite: Jamwal, P., Ashwini, A., and Tamim Vanak, A.: Tracking antimicrobial resistance pathways in a poultry-intensive catchment, EGU General Assembly 2026, Vienna, Austria, 3–8 May 2026, EGU26-3832, https://doi.org/10.5194/egusphere-egu26-3832, 2026.

The occurrence of emerging persistent pharmaceuticals (PPPs) in groundwater (GW) systems is a growing environmental concern, particularly in areas under combined urban and agricultural pressure. This study applies an integrated numerical modeling approach to assess the fate and potential sources of PPPs in the Campina de Faro aquifer system (CF), southern Portugal. To simulate the hydrogeological dynamics of the study area, a GW flow model was developed and calibrated using MODFLOW-2005. Calibration was supported by field measurements and literature-derived hydrogeological parameters. Flow model outputs were used to perform backward particle tracking, enabling a probabilistic assessment of contaminant transport pathways and the identification of likely source areas. A reactive transport model was subsequently developed using MT3DMS to simulate the dispersion and fate of selected PPPs, incorporating processes such as advection, dispersion, and biodegradation. Moreover, a principal component analysis (PCA) was conducted which agrees with our modeling hypothesis, thus showing a discontinuity in the Cretaceous formation at the northwestern boundary of the aquifer system. PCA showed that some of the abstraction points are extracting from a different aquifer than previously believed, giving new insight into the conceptual understanding of the study area. The modeling framework demonstrates its effectiveness in delineating areas of contamination, potential sources, and characterization of PPP behavior in GW. This approach provides a valuable support tool for GW quality management and mitigation of risks associated with emerging contaminants such as PPPs in vulnerable aquifer systems.

How to cite: Tufoni, P.: Tracking pharmaceutical contamination in coastal aquifers: An integrated modeling framework for source identification and risk management in the Campina de Faro aquifer system (Portugal), EGU General Assembly 2026, Vienna, Austria, 3–8 May 2026, EGU26-4946, https://doi.org/10.5194/egusphere-egu26-4946, 2026.

The environmental impact of pandemics is often evaluated by measuring disinfectant or drug concentrations in surface waters. This approach assumes that increased used of those chemicals leads directly to higher environmental concentrations. However, this assumption does not consider microbial degradation. Quaternary ammonium compounds (QACs), a group of emerging pollutants which were widely used during the COVID-19 pandemic, offer a clear example of this limitation in riverine systems.

In this study, we investigated the relationship between QAC concentrations and microbial biodegradation capacity in five major Turkish rivers sampled seasonally over one year. Summer samples were used as reference conditions, characterized by low COVID-19 case numbers obtained during the wastewater surveillance program. Winter and spring showed with statistically higher case numbers. Surface waters were analyzed for six QACs using LC-MS/MS. Total QAC concentrations ranged from <2 nM in low-impact rivers to >200 nM in urban-influenced systems. Despite relatively high COVID-19 cases, QAC concentrations during winter and spring often remained low (typically 1-10 nM) in several rivers.

Microbial measurements revealed that low QAC concentrations during peak pandemic periods were not due to reduced inputs but to enhanced biodegradation. Culture-based assays showed strong seasonal enrichment of QAC-degrading bacteria during winter and spring. Quantitative PCR targeting the QAC biodegradation gene qxyA showed copy numbers 2-5 fold higher in winter and spring samples compared to summer reference conditions. In multiple rivers, high qxyA copy numbers coincided with low or non-detectable QAC concentrations. In addition, microbial community resistance to fluoroquinolone antibiotics, which is also related to QAC exposure, substantially increased during winter and spring.

These results demonstrate a feedback mechanism in which increased QAC use selects for specialized degraders that rapidly remove QACs from the water column. As a result, chemical measurements alone underestimate the ecological impact of disinfectant use. Functional markers such as qxyA provide a more reliable indicator of anthropogenic pressure and microbial adaptation in riverine ecosystems under global change.

How to cite: Tezel, U., Altınbağ, R. C., Vardar, S., and Ateş, H.: Biodegradation masks the overall chemical impact of seasonal pandemics on riverine systems: The case of quaternary ammonium disinfectants during COVID-19, EGU General Assembly 2026, Vienna, Austria, 3–8 May 2026, EGU26-5295, https://doi.org/10.5194/egusphere-egu26-5295, 2026.

EGU26-7117 | ECS | Posters on site | HS2.3.7

The Environmental Afterlife of Nitrification and Urease Inhibitors: A meta-analysis of Transformation and Fate 

Eva Weidemann and Matthias Gassmann

After decades of using nitrification and urease inhibitors (NI and UI) in agriculture to delay the rapid conversion of urea into ammonia (UI) as well as the nitrification, to reduce nitrate leaching and to maintain plant-available ammonium in the soil for a longer period, substantial knowledge gaps about their environmental fate still exist.

Synthetic compounds such as NI and UI can pose considerable risks, as their true environmental impacts are sometimes only revealed after extensive use, as demonstrated by historical cases of PFAS, DDT and PCBs. This underlines the necessity of studying the fate of synthetic chemicals as well as their potential transformation products before the damage is done.

For this purpose, an extensive meta-analysis of publications published after 1990, as well as databases such as the registration dossiers provided by the European Chemicals Agency (ECHA), was performed, focusing on transformation behavior, potential transformation paths and products, adsorption behavior in soils as well as physicochemical properties such as water solubility. This analysis included eight NIs and three UIs currently used in commercially available agricultural fertilizers: 1,2,4-triazole (1,2,4-T), 4-amino-1,2,4-triazole (ATC), 3-methyl-1H-pyrazole (3-MP), reaction mass of N-((5-Methyl-1H-pyrazol-1-yl)methyl)acetamide and N-((3-Methyl-1H-pyrazol-1-yl)methyl)acetamide (MPA), 3,4-dimethylpyrazole phosphate (DMPP), reaction mass of 2-(3,4-dimethylpyrazole-1-yl)-succinic acid and 2-(4,5-dimethylpyrazole-1-yl)-succinic acid (DMPSA), Dicyandiamide (DCD), 2-chloro-6-(trichloromethyl)-pyridine (Nitrapyrin) as well as N-(2-nitrophenyl)-phosphoric triamide (2-NPT), N-(n-Butyl)-thiophosphoric triamide (NBPT), N-(n-Propyl)-thiophosphoric triamide (NPPT).

The results showed that the availability of information varies greatly among the inhibitors. DCD, which was already used as a fertilizer at the beginning of the 20th century as well as nitrapyrin, are among the most widely used nitrification inhibitors and those with the most available information about their environmental behavior. Key parameters influencing degradation include temperature, soil water content and inhibitor concentration, which are closely linked to microbial processes; however, prior exposure to soil organisms and soil composition were also found to be influential.

In many publications about inhibitors, such as in the case of DMPP, the dissipation of the substance is focused. However, the whole transformation path and the dissipation processes such as volatilisation can be relevant, as dissipation does not necessarily imply the absence of environmental risk. Furthermore, DT50 values were found to be calculated inconsistently across studies; therefore, all values were recalculated using the same methodology. Also, new data was created using figures from publications which didn’t provide DT50 values or degradation rates were calculated using the emergence of its transformation products.

Information about other NIs, such as ATC, which is not among the most used inhibitors, or DMPSA, which was just introduced to the market in the last years, is scarce or not available. Regarding UIs, much information about the fast-dissipating NBPT is available, such as transformation paths and influences such as concentration and pH value. Almost no information was available about the structurally similar NPPT and scarce information for 2-NPT.

How to cite: Weidemann, E. and Gassmann, M.: The Environmental Afterlife of Nitrification and Urease Inhibitors: A meta-analysis of Transformation and Fate, EGU General Assembly 2026, Vienna, Austria, 3–8 May 2026, EGU26-7117, https://doi.org/10.5194/egusphere-egu26-7117, 2026.

EGU26-9725 | ECS | Posters on site | HS2.3.7

Europe’s grey water footprint of human pharmaceuticals 

Lara Wöhler

Human pharmaceuticals have been detected in surface waters around the globe (Wilkinson et al. 2022), posing risk to ecosystems (Bouzas‐Monroy et al. 2022; Fent et al. 2006) as well as to human exposure through e.g. swimming (Duarte et al. 2022), entering drinking water (Zanni et al. 2025) or the food chain (Sleight et al. 2023). While the presence of pharmaceuticals in Europe has been proven through measurements widely (compared to other global regions) (Dusi et al. 2019), spatially explicit modelling approaches – including historical development of pharmaceutical pollution - rarely exist. This study addresses this shortcoming by presenting the grey water footprint and related water pollution levels of selected human pharmaceuticals across Europe from 1990-2019.

The grey water footprint is a volumetric indicator for water pollution, defined as the ratio of pollutant load to the maximum allowed concentration. For this study, the load was determined based on pharmaceutical sales data, human excretion rates and waste water treatment removal rates (Wöhler et al. 2020). Respective data was acquired through public sources and scientific literature. Both, spatial and temporal gaps were addressed by inter-and extrapolation and assumptions. For the maximum allowed concentration, EU’s WFD water quality standards and literature values are used. Resulting grey water footprints are compared to the available runoff to indicate water pollution levels (WPL) per (sub)catchment.

The results present the first Europe-wide grey water footprint analysis over a timespan of three decades. WPLs make an interpretation of the severity of pollution possible, indicating temporal trends and geographical hotspots.

References

Bouzas‐Monroy, Alejandra, John L. Wilkinson, Molly Melling, and Alistair B. A. Boxall. 2022. “Assessment of the Potential Ecotoxicological Effects of Pharmaceuticals in the World’s Rivers.” Environmental Toxicology and Chemistry 41 (8): 2008–20. https://doi.org/10.1002/etc.5355.

Duarte, Daniel J., Rik Oldenkamp, and Ad M. J. Ragas. 2022. “Human Health Risk Assessment of Pharmaceuticals in the European Vecht River.” Integrated Environmental Assessment and Management 18 (6): 1639–54. https://doi.org/10.1002/ieam.4588.

Dusi, E., M. Rybicki, and D. Jungmann. 2019. The Database “Pharmaceuticals in the Environment” - Update and New Analysis. German Environment Agency (UBA).

Fent, Karl, Anna A. Weston, and Daniel Caminada. 2006. “Ecotoxicology of Human Pharmaceuticals.” Aquatic Toxicology 76 (2): 122–59. https://doi.org/10.1016/j.aquatox.2005.09.009.

Sleight, Harriet, Alistair B. A. Boxall, and Sylvia Toet. 2023. “Uptake of Pharmaceuticals by Crops: A Systematic Review and Meta-Analysis.” Environmental Toxicology and Chemistry 42 (10): 2091–104. https://doi.org/10.1002/etc.5700.

Wilkinson, John L., Alistair B. A. Boxall, Dana W. Kolpin, et al. 2022. “Pharmaceutical Pollution of the World’s Rivers.” Proceedings of the National Academy of Sciences 119 (8): e2113947119. https://doi.org/doi:10.1073/pnas.2113947119.

Wöhler, Lara, Gunnar Niebaum, Maarten Krol, and Arjen Y. Hoekstra. 2020. “The Grey Water Footprint of Human and Veterinary Pharmaceuticals.” Water Research X 7 (May): 100044. https://doi.org/10.1016/j.wroa.2020.100044.

Zanni, Stefano, Vincenzo Cammalleri, Ludovica D’Agostino, Carmela Protano, and Matteo Vitali. 2025. “Occurrence of Pharmaceutical Residues in Drinking Water: A Systematic Review.” Environmental Science and Pollution Research 32 (16): 10436–63. https://doi.org/10.1007/s11356-024-34544-8.

How to cite: Wöhler, L.: Europe’s grey water footprint of human pharmaceuticals, EGU General Assembly 2026, Vienna, Austria, 3–8 May 2026, EGU26-9725, https://doi.org/10.5194/egusphere-egu26-9725, 2026.

EGU26-10553 | ECS | Posters on site | HS2.3.7

Do thermally activated foundations affect trace organic contaminant fate in urban aquifers? A case study from Barcelona 

Sergi Badia, Santiago Gómez, Anna Jurado, Sandra Pérez, Marc Teixidó, and Estanislao Pujades

Urban shallow aquifers are increasingly impacted by trace organic contaminants (TrOCs) originating from diffuse urban sources, often limiting their potential use as alternative water resources. At the same time, low-enthalpy geothermal energy (LEGE) systems are being implemented in cities as a sustainable solution for heating and cooling, inducing subsurface thermal perturbations that may influence biogeochemical processes and contaminant fate. This study investigates how LEGE systems affect the natural attenuation potential of TrOCs in a shallow urban aquifer, using a real-scale case study at the Mercat de Sant Antoni (Barcelona, NE Spain). The site hosts a large thermo-active foundation system directly interacting with the Barcelona plain aquifer. Groundwater was sampled monthly between October 2024 and July 2025 from upstream (TABO) and downstream (MABO) piezometers. Physicochemical parameters were monitored alongside the ongoing analysis of selected TrOCs, including pharmaceuticals, personal care products and pesticides, commonly detected in urban groundwater. Preliminary results have shown differences between up and downstream piezometers of the system regards to groundwater temperatures. These thermal differences are accompanied by marked shifts in redox-sensitive parameters. Dissolved oxygen concentrations decrease from 3–4.5 mg L⁻¹ upstream to values below 2 mg L⁻¹ downstream, while redox potentials shift towards more reducing conditions, reaching values as low as −350 mV at MABO. Electrical conductivity, pH and alkalinity show spatial variability across the system, whereas dissolved organic carbon (DOC) remains within a relatively narrow range (~1–2 mg L⁻¹). Such low-oxygen and reducing conditions downstream are consistent with environments where microbially mediated transformation processes may become more relevant for contaminant attenuation. High-resolution mass spectrometry is being applied for compound detection and quantification, and statistical analyses are ongoing. This contribution presents early observations aimed at assessing whether LEGE-induced perturbations influence TrOC attenuation and which physicochemical conditions control compound persistence or removal.

Acknowledgements: Financial support from MCIU/AEI/10.13039/501100011033 and (i) FEDER “one way to make Europe” through the grant PID2021-128995OA-I00, (ii) FSE+ through the grant RYC2022-037083-I, and (iii) European Union NextGenerationEU/PRTR through the grant CNS2023-144051.

How to cite: Badia, S., Gómez, S., Jurado, A., Pérez, S., Teixidó, M., and Pujades, E.: Do thermally activated foundations affect trace organic contaminant fate in urban aquifers? A case study from Barcelona, EGU General Assembly 2026, Vienna, Austria, 3–8 May 2026, EGU26-10553, https://doi.org/10.5194/egusphere-egu26-10553, 2026.

EGU26-11076 | Posters on site | HS2.3.7

Another parent of 1,2,4-triazole? - Fate and transformation of 4-amino-1,2,4-triazole (ATC) in soil 

Philipp Krug, Eva Weidemann, and Matthias Gassmann

Nitrification inhibitors (NI) and urease inhibitors (UI) have been used in agriculture since the 1970s to inhibit key microbial and enzymatic nitrogen transformation processes in soil. When mixed into nitrogen-fertilizer, they reduce nitrate (NO3-) leaching, extend nitrogen availability in the form of ammonium (NH4+) and decrease ammonia emissions. But are there side-effects of this “magic” compounds?

In a soil column study, the leaching and transformation of five inhibitors (3,4-dimethylpyrazole phosphate [DMPP], dicyandiamide [DCD], 4-amino-1,2,4-triazole [ATC], reaction mass of N-((5-Methyl-1Hpyrazol-1-yl)methyl)acetamide, N-((3-Methyl-1H-pyrazol-1-yl)methyl)acetamide [MPA] and N-(2-nitrophenyl)phosphoric triamide [2-NPT])  were examined in two different field topsoils at two temperatures (13 and 19 °C). After 280 days, ATC showed the highest persistence among all examined NI and UI, with 15 - 30% of the applied mass remaining in the soil. The recovery rate depended on soil temperature, indicating biodegradation as a dominant process. The recovery rates of the other inhibitors were substantially lower (DMPP: 1.1 – 6.7%, DCD: 0.1 – 0.3%, MPA & 2-NPT < 0.1%). Also, evidence was found, that a compound in the soil was transformed into 1,2,4-triazole (TZ), as the masses of TZ increased by a factor of 8.2 - 9.8. Possible parent compounds were identified to be either ATC or pesticides which might have been in soil before the experiment and are known to transform into TZ.

To confirm ATC as a parent compound of TZ, we designed an aerobic transformation study following OECD Test Guidelines 307 for 90 days, with two different soils, two temperatures (16/30 °C) and two soil moistures (20/60% WHC). First preliminary results show that TZ is formed while ATC is degraded.

A second soil column study in which field subsoil was used, identical temperatures and the same masses of inhibitors without fertilizer were applied. The results indicate that at least 60% of the applied ATC mass (90 µg) was transformed into TZ. Only 0 - 0.02% of the applied ATC mass was found in the percolation water, while no ATC was detectable in the soil after 316 days.

Overall, ATC transport showed differences between topsoil and subsoil conditions. At a lower organic carbon content in the subsoil (Corg= 0.16%, 0.36%) compared to topsoil (Corg= 1.10%, 1.36%) no leaching of ATC was observed, and ATC was completely transformed. The clear formation of TZ across all studies confirms ATC as a relevant parent compound of a ubiquitously found metabolite.

How to cite: Krug, P., Weidemann, E., and Gassmann, M.: Another parent of 1,2,4-triazole? - Fate and transformation of 4-amino-1,2,4-triazole (ATC) in soil, EGU General Assembly 2026, Vienna, Austria, 3–8 May 2026, EGU26-11076, https://doi.org/10.5194/egusphere-egu26-11076, 2026.

EGU26-11236 | Orals | HS2.3.7

Decision-Support Tool in QGIS for Pharmaceutical Emission Modelling, Risk Assessment and Mitigation Measures 

Alena Seidenfaden, Cristiano Guidi, Philip Marzahn, and Jens Tränckner

Human pharmaceuticals are essential in healthcare, but their discharge from wastewater treatment plants (WWTPs) poses a growing risk to aquatic ecosystems due to their biological activity at low concentrations. The amended EU Urban Wastewater Treatment Directive (UWWTD) in 2025 mandates quaternary treatment for large WWTPs (>150,000 population equivalents (PE)) to remove micropollutants and requires a risk-based prioritization for mid-sized plants (10,000-150,000 PE). A significant implementation gap has been identified, as the UWWTD does not yet specify a unified risk assessment methodology. In addition, numerous small WWTPs, frequently situated in vulnerable low-flow waters, are not directly addressed despite their cumulative impact and lack of monitoring data.

To address this issue and support decision-making, the APRIORA project developed an improved monitoring concept and a complementary, spatially high-resolution tool to provide estimates of pharmaceutical concentrations and related environmental risks in QGIS. This deterministic, steady-state model calculates annual per-capita loads discharged by each WWTP based on pharmaceutical sales data and WWTP-connected inhabitants. Substance-specific excretion and removal rates are incorporated either based on available monitoring data or literature. Point source emissions are transferred to the river network, and concentrations in different river sections are estimated using flow data. The regionalized yearly average flow data can be either integrated from external sources, or modelled using an integrated hydrological model in the QGIS plugin. Elimination processes occurring in the receiving waters, such as biodegradation, photodegradation and sorption to sediment particles, are neglected to ensure a conservative estimate. The resulting Predicted Environmental Concentrations (PECs) are used for calculating risk quotients (RQ). The modelling approach was piloted in five catchments (Germany, Finland, Latvia, Poland, Sweden).

To support the development of cost-effective mitigation strategies on a catchment scale, the tool allows for scenario assessment. Mitigation measures include: (I) upgrading the treatment type at a WWTP (e.g. from tertiary to quarternary treatment with higher removal efficiency), (II) relocating emissions by merging effluents of smaller WWTPs into larger facilities, and (III) redirecting the discharge point to a larger or less-sensitive receiving water body. The effectiveness of selected mitigation measures is directly visualized in mitigated risk maps. Testing mitigation measures for diclofenac in a German catchment showed that upgrading the three largest WWTPs (>10,000 PE) to quaternary treatment effectively reduced risks directly downstream.  However, this measure alone did not mitigate risks in numerous other sections, underscoring the limited effect of focusing solely on mid-sized plants in rural areas with scattered, smaller WWTPs (Figure 1).

This easy implementable tool is designed for environmental authorities providing a consistent, spatially explicit methodology for prioritizing interventions to close the gap between regulatory requirements and practical water resource management. Beyond pharmaceuticals, the modelling approach is transferable to other substances where point-source emissions can be quantified, e.g., PFAS from industrial sites.

Acknowledgement - The authors thank the IBSR funding programme – co-founded by the European Union (ERDF) – and the APRIORA project.

How to cite: Seidenfaden, A., Guidi, C., Marzahn, P., and Tränckner, J.: Decision-Support Tool in QGIS for Pharmaceutical Emission Modelling, Risk Assessment and Mitigation Measures, EGU General Assembly 2026, Vienna, Austria, 3–8 May 2026, EGU26-11236, https://doi.org/10.5194/egusphere-egu26-11236, 2026.

EGU26-11492 | ECS | Posters on site | HS2.3.7

Determining the microbial degradation of diPAPs and the effect of sorption on their biotransformation 

Philipp Torben Hugger, Binlong Liu, Peter Grathwohl, and Joel Fabregat-Palau

Per- and polyfluoroalkyl substances (PFAS) are a class of widespread anthropogenic chemicals that have raised serious health concerns over the last decades because of their potential as endocrine disruptors and carcinogenic effects. PFAS precursors (i.e., polyfluorinated compounds that are degraded biotically to short-chained, perfluorinated end products) stand out due to their high hydrophobicity and strong sorption to soils. Their strong sorption behaviour significantly slows down degradation; half-life times (DT50) can reach years. This study focuses on polyfluoroalkyl phosphate diesters (diPAPs) and their biodegradation behaviour under aerobic conditions. DiPAPs are used as coatings in paper products and are of particular interest due to their widespread occurrence in the environment, and particularly in Rastatt and Baden-Baden (South-West Germany) where the application of large amounts of contaminated paper sludge to agricultural soils led to a heavy PFAS contamination (Fabregat-Palau et al., 2025).

An uncontaminated soil was suspended in ultrapure water (liquid to solid ratio 10 L/kg) and spiked with 300 µg of 6:2 diPAP to check whether biodegradation occurred over a time span of 100 days. Known degradation products were found in an expected distribution at the end of the experiment. Perfluorohexanoic acid accounted for 23 % of spiked precursor, while perfluoropentanoic acid and perfluorobutanoic acid accounted only for 4.5 % and 0.7 % respectively. Perfluoroheptanoic acid was also detected (0.05 %) as a minor product. Although degradation products indicate defluorination steps, no significant increase in dissolved fluoride could be measured due to high background levels in soil. Concentrations of the intermediate product 5:3 fluorotelomer carboxylic acid showed a small increase at early times, but stagnated and finally decreased again over the course of the experiment, suggesting a kinetic limitation of the degradation further up the reaction chain. During the experimental run of 100 days, only 30 % of 6:2 diPAP was degraded. DT50 values were 247 days, which agrees with the few other data for 6:2 diPAP in other soils. Interestingly, the degradation seemed to speed up towards the end of the experiment. To evaluate the role of sorption, a parallel experiment was set up with an aqueous soil extract (at a liquid to solid ratio of 10 L/kg) that contained the necessary microbes but where all soil particles were filtered out, hence negating interference by sorption. In this system DT50 was 130 days, proving that without sorption biodegradation gets faster due to higher bioavailability of 6:2 diPAP.

Fabregat-Palau, J.; Zweigle, J.; Renner, D.; Zwiener, C.; Grathwohl, P. (2025). Assessment of PFAS Contamination in Agricultural Soils: Non-target Identification of Precursors, Fluorine Mass Balance and Microcosm Studies. J. Hazard. Mat., 490, 137798. DOI: 10.1021/acs.estlett.4c00442

How to cite: Hugger, P. T., Liu, B., Grathwohl, P., and Fabregat-Palau, J.: Determining the microbial degradation of diPAPs and the effect of sorption on their biotransformation, EGU General Assembly 2026, Vienna, Austria, 3–8 May 2026, EGU26-11492, https://doi.org/10.5194/egusphere-egu26-11492, 2026.

EGU26-11581 | Posters on site | HS2.3.7

Hydrologically-informed toxicity risks across river networks for mixtures of micropollutants discharged from wastewater treatment plants 

Olaf Büttner, Saskia Finckh, Dietrich Borchardt, Werner Brack, James Jawitz, and Wibke Busch

Chemicals in the aquatic environment can be harmful to biota and may cause toxic risks to the aquatic ecosystems. A high number of these chemicals originate from households, manufacturing and industries and are released to the aquatic environment as point source when connected to wastewater treatment plants (WWTP´s). A subset of the substances is permanently released and the load is proportional to the number of people connected to WWTPs, while the concentration of these substances shows higher variability. Especially at low discharges of the receiving waters the toxic risk may increase due to reduced dilution.

With a hydrologically informed approach that combines river network hierarchy, river discharge, wastewater loads and spatial allocation of point sources we developed a parsimonious model to calculate the total toxicity risk at each location of wastewater treatment plant (WWTP) discharges. The total toxicity risk was calculated as the sum of individual risks for 42 substances selected from a reference mixture of chemicals being considered as representative for European wastewater treatment plant effluents for a river network in Central Germany with about 300 WWTP´s of various sizes.

The results showed consistent patterns of substance specific cumulative toxicity and allowed an assessment of toxicity risks locally and at catchment scale. Different scenarios were analyzed to evaluate the consequences of different strategies to minimize toxic risks either by (1) source control, (2) relocation of WWTPs or their effluents or (3) end-of-pipe solutions like the 4th treatment level depending on local conditions. With these capabilities the approach and model may support the implementation of the revised European Urban Wastewater Treatment Directive.

How to cite: Büttner, O., Finckh, S., Borchardt, D., Brack, W., Jawitz, J., and Busch, W.: Hydrologically-informed toxicity risks across river networks for mixtures of micropollutants discharged from wastewater treatment plants, EGU General Assembly 2026, Vienna, Austria, 3–8 May 2026, EGU26-11581, https://doi.org/10.5194/egusphere-egu26-11581, 2026.

EGU26-14521 | ECS | Orals | HS2.3.7

Groundwater as an overlooked hotspot of antibiotic resistance in hydrologically connected agricultural catchments 

Tong Chen, Xiaohong Ruan, Douglas I Stewart, and Xiaohui Chen

The intensifying use of antibiotics in agriculture is accelerating the dissemination of antibiotic resistance genes (ARGs) in aquatic environments, posing an increasing threat to global water security. Despite their intrinsic link, surface water and groundwater are frequently studied as isolated compartments, overlooking the role of hydrological connectivity and the combined influence of agricultural pressures on ARG transport and risks. 

This study investigated the antibiotic resistome within a hydrologically connected surface-groundwater system in an agricultural catchment characterized by intensive crop cultivation, livestock farming, and aquaculture. Using metagenomic sequencing and resistance risk assessment, we reveal that groundwater, generally assumed to be protected by natural filtration, is actually a critical yet overlooked hotspot of antibiotic resistance.

Groundwater exhibited approximately twofold higher ARG abundance, diversity, and resistance risk than surface water, dominated by multidrug resistance genes. While surface water resistome was more homogenized by hydrodynamic mixing, groundwater ARG profiles were strongly shaped by hydrogeological conditions and agricultural activity intensity. Livestock-impacted units showed the highest ARG loads and resistance risks in groundwater, reflecting intensive antibiotic usage and manure-derived inputs. Notably, aquaculture impacts were strongly influenced by hydrogeological conditions, with significantly higher ARG abundance and risks observed in high-permeability sandy aquifers compared to clay-dominated settings, likely reflecting rapid vertical infiltration and limited adsorption during subsurface transport.

Our findings identify groundwater as a major reservoir of antibiotic resistance in agricultural regions, emphasizing the urgent need to integrate groundwater into resistance monitoring frameworks and strengthen manure and aquaculture waste management to protect water security.

How to cite: Chen, T., Ruan, X., Stewart, D. I., and Chen, X.: Groundwater as an overlooked hotspot of antibiotic resistance in hydrologically connected agricultural catchments, EGU General Assembly 2026, Vienna, Austria, 3–8 May 2026, EGU26-14521, https://doi.org/10.5194/egusphere-egu26-14521, 2026.

EGU26-16291 | ECS | Posters on site | HS2.3.7

Impact of agro-industrial expansion on heavy metal contamination in water resources of a poorly gauged basin. 

Prabhat Dwivedi and Brijesh Kumar Yadav

Rapid agro-industrial growth has intensified the heavy metal contamination in ungauged regions through changing land use and water quality. It is still unclear how to continuously monitor heavy metal pollution when it is influenced by urban wastewater, agricultural runoff, and industrial discharge. This study assesses the effects of agriculture and industrial expansion on water resources by combining hydrogeochemical assessment, hydrological modeling, and land-use change analysis. Remote sensing data were used to evaluate land-use change from 2005 to 2023, while a hydrological model was developed for the period of 2010-2023 to quantify variations in the water balance components. Seasonal water sampling was conducted across 64 sites in 2023, and samples were analyzed for heavy metals, major ions, and physicochemical parameters. The results indicate that between 2005 and 2023, built-up areas expanded by 1.5%, and agricultural land increased by 0.5%, leading to a 2% reduction in bare land and increased pressure on water supplies. Hydrological modeling revealed that intensified water extraction for industrial and irrigation purposes reduced groundwater recharge by approximately 40%, resulting in a corresponding 41% decline in water yield. These hydrological alterations have exacerbated regional water quality degradation. Water quality analysis showed that aluminum concentrations exceeded permissible limits in all samples during the pre-monsoon season. In contrast, elevated manganese concentrations were detected in all groundwater samples and 96% of surface water samples. Post-monsoon analysis further revealed widespread cadmium and mercury contamination in groundwater, with mercury exceeding safe limits in all samples. Among major ions, nitrate concentrations exceeded permissible limits in 64% of surface water and 12% of groundwater samples, while pH values ranged between 5.5 and 9.1. Collectively, these findings indicate that the reductions in regional water availability are associated with changing land-use patterns that are seasonally regulated and help in driving heavy metal movement across the region. This emphasizes the need for strengthened pollution control strategies, improved wastewater treatment infrastructure, and awareness of water management among stakeholders.

How to cite: Dwivedi, P. and Yadav, B. K.: Impact of agro-industrial expansion on heavy metal contamination in water resources of a poorly gauged basin., EGU General Assembly 2026, Vienna, Austria, 3–8 May 2026, EGU26-16291, https://doi.org/10.5194/egusphere-egu26-16291, 2026.

EGU26-16862 | ECS | Posters on site | HS2.3.7

Distribution and fate of PAHs across multiple biotic and abiotic compartments in aquatic ecosystems 

Hedvika Roztočilová, Vít Kodeš, and Libor Mikl

Aquatic ecosystems are continuously threatened by PAH contamination that represents significant toxicological risks to both environmental and human health. These pollutants enter water bodies mainly through atmospheric deposition or surface runoff, and their environmental fate is governed by complex physico-chemical factors and bioaccumulation processes. To evaluate PAH levels and their distribution patterns, the occurrence of 16 priority compounds was analyzed in various river matrices. The monitoring program included abiotic (bottom sediments, suspended solids, water) and biotic (fish, benthic organisms, biofilm) matrices. Samples were collected at 28 locations covering all major river basins in the Czech Republic during 2025. PAHs were detected in all matrices, with distribution of individual compounds depending on affinity for organic carbon or lipid. Levels of fluoranthene and benzo[a]pyrene in biota exceeded environmental quality standards at a number of monitored locations. Results also revealed spatial variability among the locations, reflecting diverse levels of anthropogenic pressure across the river basins. Overall, multi-matrix monitoring is essential for a comprehensive contamination assessment, as the unique properties of each compartment lead to uneven pollutant distribution in aquatic ecosystems.

How to cite: Roztočilová, H., Kodeš, V., and Mikl, L.: Distribution and fate of PAHs across multiple biotic and abiotic compartments in aquatic ecosystems, EGU General Assembly 2026, Vienna, Austria, 3–8 May 2026, EGU26-16862, https://doi.org/10.5194/egusphere-egu26-16862, 2026.

EGU26-18099 | Posters on site | HS2.3.7

Tracing micropollutants in the land-river continuum: mechanistic insights into antibiotic dynamics via high-resolution process-based modeling 

Hui Xie, Jianwei Dong, Meiqi Shang, Yunliang Li, and Xijun Lai

In agro-ecosystems, heterogeneous sources and variable pathways of non-point source pollution complicate the understanding of antibiotic dynamics across the land-river continuum. A quantitative understanding of the mechanisms governing source-transport-fate processes of antibiotic dynamics remain limited. This study developed a distributed and process-based model to simulate daily fluxes of four tetracyclines (TCs) in an agricultural watershed and to identify key transport mechanisms and rainfall-driven controls. Results revealed that transport processes significantly influence TCs fate, with riverine processes outweighing terrestrial transport and source input. Rivers dissipated 74.3 % of terrestrial TCs, significantly related to cumulative riverine transport distance. Riverbed sediment acted as a source for 92.3 % of the year via diffusion, resuspension, and deposition, and high-flow conditions converted it from source to sink. Extreme rainfall events, heavy rainfall events, and prolonged rainfall events were identified as the three patterns driving antibiotic transport and fate from event-based results. Prolonged rainfall events, often overlooked, pose chronic risks through groundwater discharge and sediment diffusion. These findings underscore the critical role of in-stream processes and three distinct rainfall event patterns in governing antibiotic pollution, highlighting the necessity of integrating riverine management with rainfall-driven strategies in watershed-scale pollution control.

How to cite: Xie, H., Dong, J., Shang, M., Li, Y., and Lai, X.: Tracing micropollutants in the land-river continuum: mechanistic insights into antibiotic dynamics via high-resolution process-based modeling, EGU General Assembly 2026, Vienna, Austria, 3–8 May 2026, EGU26-18099, https://doi.org/10.5194/egusphere-egu26-18099, 2026.

EGU26-18816 | Posters on site | HS2.3.7

Detection, distribution and ecological risk assessment of typical antibiotics in water around Poyang Lake, Southeast of China 

Jiale Li, Yihui Dong, Zhanxue Sun, Yajie Liu, and Zebing Li

Antibiotics are synthetic broad-spectrum antibiotics that are widely used in human medicine, animal husbandry and aquaculture. China is a major producer of antibiotics. Poyang Lake is the largest freshwater lake in China. At present, there are still few research methods and applications for the simultaneous detection of multiple antibiotics in environmental water bodies. In this research, automatic solid phase extraction-ultra high performance liquid chromatography-mass spectrometry technology was used to simultaneously detect 27 antibiotics in 5 categories of macrolides, tetracyclines, quinolones, nitroimidazoles and sulfonamides in water. Based on this method, the concentration and distribution of 27 antibiotics in surface water, groundwater and wastewater of Poyang Lake Basin were analyzed. The ecological risk quotient method was used to evaluate the ecological risk of Poyang Lake Basin, in order to provide data support for ecological environment protection and antibiotic pollution prevention and control in Poyang Lake Basin. The results show that:

(1) Automatic solid phase extraction was used as the pretreatment method for antibiotic detection in water, and the process steps of the technology were optimized. Most of the recovery of ultrapure water was between 51.07% and 112.58%, and the recovery of matrix was between 56.16% and 137.57%. The limits of detection were 0.01-0.44 ng·L-1, and the limits of quantitation were 0.03-1.36 ng·L-1.

(2) The water around Poyang Lake was sampled, and its species characteristics and concentration levels were preliminarily analyzed. There are antibiotic pollutions around Poyang Lake and the tributaries of Ganjiang River, such as Jinjiang River and Yuanhe River. The overall detection of species: Poyang Lake surrounding surface water 24, groundwater 23, Jinjiang 24, Yuanhe at least 20. Overall concentration comparison: surface water around Poyang (26.81~503.06 ng·L-1)> groundwater around Poyang Lake (12.66 ~ 286.85 ng·L-1). Jin River (69.51~ 567.90 ng·L-1) > Yuan River (47.33~ 873.52 ng·L-1).

(3) Compared with other river basins, the surface water around Poyang Lake was polluted by two antibiotics, and the average concentrations of doxycycline and chlortetracycline were 6.93 ng·L-1and 14.54 ng·L-1. The groundwater around Poyang Lake had a high degree of roxithromycin pollution, with an average concentration of 31.86 ng·L-1. The contamination levels of the two antibiotics in Jinjiang were relatively high, and the average concentrations of roxithromycin and sulfamethoxazole were 22.52 ng·L-1 and 188.55 ng·L-1. The contamination levels of the three antibiotics in Yuan River were relatively high, and the average concentrations of roxithromycin, doxycycline and sulfamethoxazole were 33.92 ng·L-1, 7.49 ng·L-1 and 138.07 ng·L-1. On the whole, roxithromycin and sulfamethoxazole in all regions of the Poyang Lake Basin are at high levels, which should be paid full attention.

(4) The risk quotient method was used to evaluate the ecological risk of single antibiotics at each sampling point. The results showed that the antibiotics with medium risk to aquatic organisms in surface water of Poyang Lake Basin were SMX, and the low risk were DOC, CTC, RTM, SMZ and DMZ. Ecological risk: Poyang Lake surface water > Jinjiang > Poyang Lake groundwater > Yuan River.

How to cite: Li, J., Dong, Y., Sun, Z., Liu, Y., and Li, Z.: Detection, distribution and ecological risk assessment of typical antibiotics in water around Poyang Lake, Southeast of China, EGU General Assembly 2026, Vienna, Austria, 3–8 May 2026, EGU26-18816, https://doi.org/10.5194/egusphere-egu26-18816, 2026.

EGU26-19712 | Orals | HS2.3.7

Integrated approach for predicting geogenic contaminants in groundwater 

Julie Lions, Eric Lasseur, Louis Alus, Adrien Claveau, Catherine Lerouge, Veronique Durand, Justine Briais, and Christelle Marlin

Aquifers may naturally contain undesirable and toxic trace elements, known as geogenic contaminants. The presence of these micropollutants poses a major challenge for groundwater management, and has health, economic, and environmental consequences.

Areas with high concentrations, either elevated or exceed the guideline value of water standards, are generally identified through the analysis of groundwater data. However, it should be possible to predict these occurrences based on their presence in the solid matrices of aquifers and their mobilization controlled by the physicochemical conditions of the water.

To better predict the occurrence of inorganic natural pollutants, we have developed a methodology, based on an integrated approach to better understand the distribution of these elements in aquifers, the conditions controlling their presence, and their evolution in groundwaters.

The methodology combines two complementary approaches: i) predictions of geogenic elements content in rocks, including their speciation, using a source to sink methodology are cross-correlating with ii) hydrogeochemistry to identify water-rock interaction processes and the potential mobility of the elements according to physicochemical conditions (e.g., redox conditions). This makes it possible to predict the spatial distribution of geogenic elements (e.g. As, Se, F, etc.) as well as the processes of mobilization in groundwater.

Using a geographic information system (GIS), this study compares predicted occurrences using a source-to-sink (S2S) approach with available data including a large dataset on groundwater quality data (ADES data base, a national database publicly available). By interpretating the chemical composition of water, geochemical modelling via PHREEQC and geological data, it is possible to confirm but also to contribute to the S2S modelling.

The study focuses on aquifers linked to the Massif Central (France). Geological source-to-sink paleomaps and drilling data are used to correlate the availability in sedimentary deposits of elements such as arsenic (As), selenium (Se), fluorine (F), with the main periods of erosion, transfer, deposit and remobilisation between the end of the Cretaceous and the Miocene. Arsenic, in particular, is studied in various geological layers with a focus on its speciation and mobilization in confined aquifers such as the Beauce calcareous confined aquifer (Southern Paris Basin).

This approach presents a real interest in terms of groundwater quality, as it helps to anticipate water quality degradation linked to groundwater exploitation in aquifer impacted by the natural presence of geogenic metals.

This work is part of the PEPR OneWater DEESAC project (France 2030), illustrating a transdisciplinary approach combining geology, geophysics, geochemistry, and hydrogeology.

How to cite: Lions, J., Lasseur, E., Alus, L., Claveau, A., Lerouge, C., Durand, V., Briais, J., and Marlin, C.: Integrated approach for predicting geogenic contaminants in groundwater, EGU General Assembly 2026, Vienna, Austria, 3–8 May 2026, EGU26-19712, https://doi.org/10.5194/egusphere-egu26-19712, 2026.

EGU26-20637 | Orals | HS2.3.7

Tracing Hazardous Substances from Source to River in the Danube River Basin 

Zsolt Jolankai, Mate Krisztian Kardos, Katalin Dudas, Timea Lajko, Vivien Poto, Mark Honti, and Adrienne Clement

In addition to common pollutants such as organic matter and nutrients, an ever-growing range of chemicals increasingly threatens the quality of rivers and lakes, as well as the health of aquatic ecosystems. Understanding the main sources and transport pathways of these substances therefore represents a key scientific and management challenge.

Within the framework of the Tethys project, a hazardous substance emission model was developed for the Danube River Basin (DRB) through close cooperation among nine Danube countries. The modelling work was based on the systematic collection of concentration and emission data for multiple transport pathways, resulting in a substance-specific inventory that served as the foundation for emission modelling.

A common Danube-wide modelling tool was implemented using the MoRE (Modelling of Regional Emissions) framework. The model represents between four and eleven emission pathways for three substance groups: potentially toxic elements (PTEs), including six heavy metals and arsenic; industrial chemicals represented by the two most widespread per- and polyfluoroalkyl substances (PFOS and PFOA); and human pharmaceuticals represented by a widely used analgesic (diclofenac) and a psychoactive compound (carbamazepine). In addition to major point sources, the model accounts for numerous diffuse pathways, including groundwater, surface runoff, tile drainage, erosion, atmospheric deposition, and various legacy pollution sources such as landfills, aerodromes, and industrial disposal sites.

The modelling framework includes a newly developed retention approach that explicitly accounts for riverine retention for each substance group, as well as an uncertainty assessment module designed to quantify parameter uncertainty. This module is implemented within an R-based computational engine of the MoRE model.

Model validation was performed using long-term river monitoring data from existing operational monitoring networks, complemented by additional datasets collected by partner institutions during project implementation. Discharge data were provided by the participating countries.

The modelling results indicate that erosion, groundwater, municipal and industrial wastewater systems are the dominant emission pathways for PTEs, with pronounced spatial variability along the DRB. Point source contributions dominate in the Upper Danube, whereas agricultural-related diffuse pollution becomes increasingly important in the Lower Danube. For PFASs and pharmaceuticals, municipal wastewater represents the main emission pathway in most sub-catchments. In the case of PFASs, soils also act as relevant reservoirs, and associated pathways such as surface runoff, erosion, groundwater flow, and tile drainage may contribute substantially to riverine loads.

How to cite: Jolankai, Z., Kardos, M. K., Dudas, K., Lajko, T., Poto, V., Honti, M., and Clement, A.: Tracing Hazardous Substances from Source to River in the Danube River Basin, EGU General Assembly 2026, Vienna, Austria, 3–8 May 2026, EGU26-20637, https://doi.org/10.5194/egusphere-egu26-20637, 2026.

EGU26-20879 | ECS | Orals | HS2.3.7

From Fields to Rivers: Tracking Neonicotinoid-Dominated Pesticide Contamination in Agro-Urban Waters of Northeastern India 

Kanika Dogra, Manish Kumar, Paromita Chakraborty, and Ritusmita Goswami

India contributes approximately 3.75% of global pesticide consumption and applies comparatively low amounts per unit area (≈0.5 kg ha⁻¹); however, pesticide usage is strongly insecticide-dominated, with insecticides accounting for nearly 80% of total application. This study examines the occurrence, distribution, and transformation of pesticides in surface water and groundwater across agro-urban catchments of Guwahati, Assam, a rapidly urbanizing region influenced by intensive agriculture. Pesticides were widely detected in surface waters, reflecting combined inputs from agricultural runoff, irrigation return flows, and stormwater, whereas groundwater generally contained only trace concentrations (<1 ng L⁻¹), indicating effective subsurface attenuation. Surface water concentrations ranged from 0.01 to 92 µg L⁻¹, with the highest cumulative loads (>100 ng L⁻¹) observed in agro-urban catchments directly receiving agricultural drainage. Neonicotinoid insecticides dominated the chemical profiles, contributing more than 50% of total pesticide mass, with thiamethoxam, imidacloprid, clothianidin, and acetamiprid detected in over 70% of samples at typical concentrations of 10¹–10³ ng L⁻¹ and maxima approaching ~90 µg L⁻¹ at agriculturally influenced sites. Several transformation products, including thiamethoxam-urea and desnitro-imidacloprid, were consistently detected and in some cases exceeded parent compounds, accounting for 20–40% of the total neonicotinoid signal and indicating slow degradation and sustained environmental release. In contrast, herbicides such as 2,4-D, diuron, and metolachlor occurred less frequently (<40%) and at lower concentrations (<5 µg L⁻¹). Strong positive correlations among neonicotinoids and their metabolites (r > 0.7) suggest shared sources and transport pathways, while upstream sites showed lower pesticide diversity, underscoring the dominant influence of agro-urban activities on surface water contamination.

How to cite: Dogra, K., Kumar, M., Chakraborty, P., and Goswami, R.: From Fields to Rivers: Tracking Neonicotinoid-Dominated Pesticide Contamination in Agro-Urban Waters of Northeastern India, EGU General Assembly 2026, Vienna, Austria, 3–8 May 2026, EGU26-20879, https://doi.org/10.5194/egusphere-egu26-20879, 2026.

EGU26-22134 | Posters on site | HS2.3.7

Machine learning reveals flowpath-structured distributions of pesticides and pharmaceuticals 

Shulamit Nussboim and Felicia Orah Rein

Pesticides and pharmaceuticals comprise hundreds of compounds applied in agricultural systems, either directly for pest control or indirectly via irrigation with treated wastewater, posing risks to downstream aquatic ecosystems. Advances in analytical chemistry now allow the simultaneous detection of dozens of micropollutants per sample, yielding extensive datasets. Identifying hydrological controls on compound occurrence from such datasets remains challenging due to strong non-linearities and complex compound behavior.

We investigated two agricultural fields located along the Kishon Stream (Israel), characterized by heavy clay soils and subsurface drainage systems that enable direct sampling of distinct hydrological flowpaths, including subsurface drainage discharge, surface runoff, and shallow groundwater. Sampling focused on first-storm conditions, when compound mobilization is most pronounced. While qualitative differences in compound occurrence among flowpaths were evident, quantitative attribution was hindered by the complexity of compound–flowpath relationships.

To address this, we applied Kernel Canonical Correlation Analysis (KCCA), a machine-learning method that captures non-linear associations through kernel mapping while retaining interpretability in a latent canonical space. KCCA was combined with non-parametric analyses and applied to both the original and transposed datasets. The analysis shows that pesticide and pharmaceutical distributions are strongly structured by hydrological flowpaths. Compound mobility and degradability modulate their occurrence within and across these pathways. We further define a dominant flowpath for individual compounds, identified as the pathway in which a compound attains its maximum representative concentration, providing a concise compound-level descriptor of flowpath association.

These results demonstrate the utility of KCCA for revealing hydrological structure and chemical properties in complex environmental datasets and highlight the importance of flowpath-specific distributions for understanding micropollutant occurrence in agricultural catchments.


How to cite: Nussboim, S. and Rein, F. O.: Machine learning reveals flowpath-structured distributions of pesticides and pharmaceuticals, EGU General Assembly 2026, Vienna, Austria, 3–8 May 2026, EGU26-22134, https://doi.org/10.5194/egusphere-egu26-22134, 2026.

Riverine plastic pollution is commonly quantified using point-based flux measurements, yet the transport pathways and residence times of floating litter between monitoring locations remain poorly understood. This limits both the interpretation of flux data and the effective placement of interception and cleanup strategies. In this study, we investigate whether GPS tracers can be used to characterize the movement patterns of floating plastic in (semi)urban waterways.

Multiple field experiments (±60 sensors) were conducted across Dutch waterways (Alkmaar, Zaandam, Leeuwarden) in different seasons, during which floating GPS trackers were released and tracked over periods ranging from several days to eight weeks. The resulting trajectories were analysed in terms of cumulative distance travelled, lateral distribution within the channel, and temporal movement patterns.

Across all release locations (six in total), transport was found to be highly intermittent: long periods of little to no movement were frequently interrupted by short bursts of rapid displacement, resulting in stepwise cumulative distance curves. Spatially, trajectories showed a strong preference for near-shore transport rather than mid-channel flow. Floating proxies were repeatedly observed to accumulate along banks, where movement was often halted by obstructions such as vegetation, moored vessels, and infrastructure. These stagnation periods strongly influenced overall travel distance and residence time.

The results demonstrate that floating plastic transport in urban water systems cannot be approximated as continuous downstream movement. Instead, it is governed by intermittent mobilisation and frequent temporary retention along channel margins. GPS-based measurements therefore provide critical complementary information to flux monitoring, helping to explain variability in observed litter counts and supporting more effective design and placement of monitoring and interception systems. This approach offers a scalable pathway to bridge the gap between local flux measurements and system-wide transport dynamics of urban plastic pollution.


How to cite: van Wijk, J.: Floating GPS tracker measurements reveal intermittent and shoreline-driven transport of floating plastic in urban waterways, EGU General Assembly 2026, Vienna, Austria, 3–8 May 2026, EGU26-3290, https://doi.org/10.5194/egusphere-egu26-3290, 2026.

EGU26-3434 | ECS | Posters on site | HS2.3.8

Exploring Transferability of Plastic-Water Hyacinth Interaction and Detection in Rivers 

Giel Hagenbeek, Tim van Emmerik, Tianlong Jia, Pummarin Khamdahsag, Kittiphon Boonma, Riccardo Taormina, Thomas Mani, and Marc Rußwurm

Rivers are major pathways for plastic pollution to oceans, with high emissions observed in tropical regions. Invasive water hyacinths (WHs) can trap macroplastics and serve as proxies for detecting river plastic using remote sensing. We explore how this phenomenon and its detection methods are transferable to Thailand’s Chao Phraya River. Along a 62 km river course, up to 78% of floating plastics were trapped in WHs (average 32%), comparable to the Saigon River (58–82%). Although trapped proportions decreased downstream, plastic concentration in WHs was 59 times higher than in open water. Object detection models transferred well for WHs and entangled plastics (Chao Phraya: mAP50 = 68% and 54%; Saigon River: mAP50 = 70% and 52%), but poorly for free-floating plastics (23% vs. 48%). Physical sampling found 14 times more plastics within WHs than imagery, highlighting WHs’ role in trapping plastics and their potential role in monitoring and clean-up efforts.

How to cite: Hagenbeek, G., van Emmerik, T., Jia, T., Khamdahsag, P., Boonma, K., Taormina, R., Mani, T., and Rußwurm, M.: Exploring Transferability of Plastic-Water Hyacinth Interaction and Detection in Rivers, EGU General Assembly 2026, Vienna, Austria, 3–8 May 2026, EGU26-3434, https://doi.org/10.5194/egusphere-egu26-3434, 2026.

EGU26-3830 | Posters on site | HS2.3.8

Spatial Variability and Combined Risk of Metal elements and Microplastics along the River Severn (UK) 

André-Marie Dendievel, Brice Mourier, Lee Haverson, Zoé Iannuzzi, Liam Kelleher, Anna Kukkola, Uwe Schneidewind, and Stefan Krause

In order to better understand the processes of transport and accumulation of microplastics with other co-pollutants, we developed a large-scale study along the UK's longest river, the River Severn (354 km). Our objective is to quantify the concentrations and loads of MPs and metal elements in sediments and surface water, and also to discuss their origin by considering tributary inputs and land-use changes. River Severn successively flows through a diversified landscape with forested uplands and pasturelands, where former mining areas (lead, silver and zinc) are found (Shropshire and Plymlimon). It also presents small towns which originally developed thanks to wool production and heavy industries. Downstream, the river receives inputs from tributaries draining urban and industrial areas (Birmingham Black Country and Coventry), as well as wastewater treatment plant inputs (around Worcester).

Streambed sediments and surface water from 16 sites located along the river were collected during low water conditions to take into account this spatial feature. MP concentrations and polymer types were quantified by using µFT-IR. Metal concentrations (Cd, Cu, Cr, Fe, Ni, Pb, Zn) as well as hydrological and sediment properties (grain size, organic matter – OM, carbonates) were also acquired during the sampling campaign. Pollution Load (PLI) and Polymer Risk (PRI) indices, as well as daily MP fluxes were assessed.

Results highlight multi- contaminated hotspots in the upstream section (PLI>2), mostly because of lead (Pb), zinc (Zn) and cadmium (Cd) due to diffuse pollution from historic mining areas, while MP hotspots were distinct and limited. A gradual growth of metals and MP concentrations and loads as well as an increase of polymer diversity occurred in the downstream direction, in both surface water and sediments. A major multi-pollution hotspot was found south of Worcester (PLI>5), which seems polluted by both diffuse pollution from tributaries (such as the Avon River coming from Coventry) and by local sewage inputs.

The composition of pollution hotspots greatly contrasts along the river, as underlined by various metal and MP concentration and types, most likely coming from point-sources, as well as brought by some tributaries draining urban-industrial areas in the downstream direction. This knowledge gain will help to shape future river water quality management.

How to cite: Dendievel, A.-M., Mourier, B., Haverson, L., Iannuzzi, Z., Kelleher, L., Kukkola, A., Schneidewind, U., and Krause, S.: Spatial Variability and Combined Risk of Metal elements and Microplastics along the River Severn (UK), EGU General Assembly 2026, Vienna, Austria, 3–8 May 2026, EGU26-3830, https://doi.org/10.5194/egusphere-egu26-3830, 2026.

EGU26-5390 | ECS | Orals | HS2.3.8

It's complicated: the relationship between urban features and aquatic plastic pollution 

Paolo Tasseron, Tim van Emmerik, Yanning Qiu, and Martine van der Ploeg

Estimates suggest millions of metric tonnes of plastic enter aquatic ecosystems annually, with urban environments acting as a primary source of this leakage. Within cities, waterways such as rivers, streams, and canals act as arteries to collect and transport land-based plastic waste outside the city boundaries. While the source of cities for aquatic plastic pollution is clear, the understanding of processes governing the journey of plastic through cities and the drivers of transport and accumulation within cities is limited. Here, we characterize the baseline patterns of floating plastic by mapping the spatial distribution and temporal variability of plastic accumulation and transport across Amsterdam, by using a database of nearly 10,000 monitored plastic items with monthly monitoring sessions between November 2022 and October 2023. Plastic accumulation and transport are neither uniform in space nor constant in time. We further identify and explore the explanatory power of site-specific urban features that may drive plastic abundance at the local level. We reduced 87 urban environmental features to 8 principal components, which describe unique gradients in the urban landscape. By correlating these principal components with our plastic observations, we identify that spatial patterns differ substantially between the accumulation of plastics and the transport of plastics. Some plastic types are widely distributed across multiple urban gradients, where others are strongly associated with specific urban contexts. Most plastic types show no significant correlations, highlighting the complex nature and ubiquity of plastic in all urban contexts. We highlight that item-specific data is necessary to disentangle the complex nature of urban plastic pollution. By analyzing which items tend to co-exist, potential clustering of items, and their abundance in the context of specific urban features, we are getting closer to detecting the true sources and drivers of urban plastic pollution. 

How to cite: Tasseron, P., van Emmerik, T., Qiu, Y., and van der Ploeg, M.: It's complicated: the relationship between urban features and aquatic plastic pollution, EGU General Assembly 2026, Vienna, Austria, 3–8 May 2026, EGU26-5390, https://doi.org/10.5194/egusphere-egu26-5390, 2026.

EGU26-5823 | ECS | Orals | HS2.3.8

Microplastic deposition and transport in a highly-modified stream: insights from geomorphic depocenters and sediment analogues 

Samuel Roudbar, Ronald Poeppl, Daniel Le Heron, and Michael Wagreich

Continuous human intervention in the environment has profoundly reshaped natural landforms, often disrupting their environmental functions to serve anthropogenic needs. The Krotenbach, located just south of Vienna (Austria), is a 14.2 km long, highly modified stream engineered to efficiently transport its water discharge. Further downstream from its production zone in the Wienerwald, the river partly flows through and beneath an urban–industrial area before continuing through agricultural land. These two distinctive sections are separated by one of the main highways in Austria, with the sampling area located downstream of this boundary. At the upstream limit of the study section, a wastewater treatment plant continuously contributes approximately 78% of the total river discharge, creating a persistently altered flow regime. This strongly anthropogenic system offers an ideal flume-like field laboratory to study the transport and accumulation of microplastics in riverbed sediments.

Despite its constricted planar morphology, low slope gradient, and limited sediment supply, the most significant depocenters were sampled for microplastic concentrations (>63 µm), sediment grain-size analysis, and total organic carbon content. In addition, all large wood elements and anthropogenic obstacles with sediment retention potential were mapped and quantified using field-based geomorphological indices of sediment connectivity, defined here as the efficiency of sediment transport from point A to point B within a defined system. A sediment connectivity model was therefore developed based on cumulative drainage area, channel slope, and retention indices for large wood and anthropogenic obstacles, to help predict and explain MP deposition patterns.

The primary objective of this research is to evaluate which fluvio-geomorphological sinks have the highest capacity to store microplastic particles (MPs) and to assess the extent to which their preferential occurrence can be explained by particle morphometrics, density, and their response to the relative degree of sub-watershed connectivity. Alongside sedimentary facies characterization, MP datasets were evaluated using a newly developed semi-quantitative sediment retention index to predict the sedimentological component of their riverine transport behaviour. Results show that the index developed for this study satisfactorily captures the physical principles likely governing microplastic transport. Comparisons between observed concentrations and model predictions highlight the sedimentary behaviour of microplastics deposited in riverbed sediments. Both MPs and mineral sediments appear to respond, through their respective fragmentation capacities, to hydraulic sorting under the same energy gradient.

Samples collected six months later, in October 2025, show a net decrease of over 50% in MP concentrations, particularly in sinks characterized by high bed shear stress. This second sampling campaign highlights the short residence time of MPs and the overall high connectivity of such a man-made river system. The role of small urban catchments in plastic pollution dynamics should therefore be prioritized in plastic pollution mitigation and remediation strategies.

All MP concentrations were corrected for contamination using six laboratory blanks and two field blanks. Recovery tests conducted with high-density 125 µm polyethylene yielded a recovery rate of 87.6%. Microplastics were identified through manual mapping using micro-FTIR analysis, with an analytical variability of 2.22% (standard deviation) based on 25% sub-sampling.

How to cite: Roudbar, S., Poeppl, R., Le Heron, D., and Wagreich, M.: Microplastic deposition and transport in a highly-modified stream: insights from geomorphic depocenters and sediment analogues, EGU General Assembly 2026, Vienna, Austria, 3–8 May 2026, EGU26-5823, https://doi.org/10.5194/egusphere-egu26-5823, 2026.

EGU26-6575 | ECS | Posters on site | HS2.3.8

Temporal stability of macroplastic on Dutch riverbanks 

Rahel Hauk, Martine J. van der Ploeg, Tim H.M. van Emmerik, and Adriaan J. Teuling

Is the distribution of macroplastic along rivers stable over time? Rivers transport and accumulate macroplastic litter, and large amounts of macroplastic are deposited on riverbanks. It seems there are factors and variables linked to macroplastic deposition at a specific location, e.g. riparian vegetation or population density. However, the specific transport and deposition processes that lead to a plastic item being deposited on a specific riverbank are not well understood yet. So we took a step back and instead of analyzing local riverbank characteristics that might link to plastic deposition, we investigated the stability of plastic deposition over time. If macroplastic distribution is indeed stable over time, it further indicates that there is a link between macroplastic deposition and site specific factors. 

We adapted a method, which was originally developed to analyse the temporal stability of soil moisture. With that method, we assessed the temporal stability of macroplastic distribution on 229 riverbanks along eight major Dutch rivers. Each location was surveyed between six and eight times from 2020 to 2024. Our results demonstrate clear temporal stability in macroplastic distribution over those four years. Riverbanks were classified into four categories, hotspots, coldspots, and persistently above- or below-average sites, based on their relative plastic concentration over time. Between 10% and 42% of sites along each river were identified as coldspots with a plastic concentration always below average. At the other end, 0% to 8% were persistent hotspots, with a plastic concentration always above average. We also identified that the hotspots contained a disproportionally large amount of macroplastic, between 13% to 35% of macroplastic items for the rivers that had hotspots. 

The proposed method offers a practical and relatively easy approach to investigate the temporal stability of macroplastic distribution between locations. Assessing this temporal stability (or lack thereof) can provide a new perspective on macroplastic pollution in the investigated system. It can also contribute to optimize macroplastic monitoring and focus mitigation measures. Further, the demonstrated spatial and temporal stability implies underlying mechanisms governing macroplastic deposition. This provides a direction for future process-based investigations. 

How to cite: Hauk, R., van der Ploeg, M. J., van Emmerik, T. H. M., and Teuling, A. J.: Temporal stability of macroplastic on Dutch riverbanks, EGU General Assembly 2026, Vienna, Austria, 3–8 May 2026, EGU26-6575, https://doi.org/10.5194/egusphere-egu26-6575, 2026.

EGU26-7802 | ECS | Posters on site | HS2.3.8

Carbonate mineral precipitation enhances microplastic deposition in karst rivers globally 

Huan Wang, Lei Mai, Stefan Krause, and Yi Liu

Rivers represent major pathways for microplastic (MP) transport from land to the oceans. MP transport and deposition processes in rivers are influenced by complex hydraulic flow behavior of the river and its interactions with streambed, vegetation and infrastructure as well as the physicochemical properties of MPs themselves. While there is increasing understanding of the hydrodynamic controls on the transport behavior of MPs of different density, size and shape, the impact of geochemical interaction of MPs with other compounds, including possible co-precipitation with minerals remains poorly understood. We here reveal the potential for enhanced MP deposition from the rivers in karst regions through co-precipitation with carbonate minerals through a large-scale field observation covering the entire Pearl River Basin. This is supported by the substantially greater difference in MP mean density between the river water and sediments in carbonate-dominated basins compared to non-carbonate-dominated basins. Laboratory experiments demonstrate that co-precipitation of CaCO₃ and MPs can occur in rivers of carbonate-dominated basins, which enhances MP deposition on the streambed. The negative surface charge of MPs adsorbs Ca2+ and increases the possibility of CaCO₃ precipitation on the surface of MPs. MPs of smaller size and higher electronegativity, such as polyamide (PA), show greater affinity for Ca2+ and higher deposition ratio from the water column via co-precipitation with CaCO₃. At global scale, regions with high proportion of carbonate bedrocks are characterized by reduced riverine MP exports to the ocean as more of them deposited at the streambed. Our findings underscore the critical role of carbonate mineral precipitation depending on the geological background in regulating fluvial MP deposition and retardation in rivers. This newly described mechanism provides a theoretical basis for future MP mitigation strategies in rivers with different bedrock geology.

How to cite: Wang, H., Mai, L., Krause, S., and Liu, Y.: Carbonate mineral precipitation enhances microplastic deposition in karst rivers globally, EGU General Assembly 2026, Vienna, Austria, 3–8 May 2026, EGU26-7802, https://doi.org/10.5194/egusphere-egu26-7802, 2026.

EGU26-8615 | Orals | HS2.3.8

Hydrodynamics of terrestrial nano- and microplastics: simulating seasonal retention and first-flush emissions 

Tomoya Kataoka, Hiroto Oe, Masahiro Furutani, Yasuo Nihei, and Dai Yamazaki

Several estimations of global plastic emissions exist; however, the photodegradation of plastic litter and the complex hydrological processes on land have not been adequately integrated into these models. This study simulates the generation and emission of nano- and microplastic (NMP) particles using the Catchment-based Macro-scale Floodplain (CaMa-Flood) model to elucidate their hydrodynamics.

First, a photodegradation model for plastic litter was established through accelerated ultraviolet (UV) weathering tests under dry and wet conditions. The mass of plastic litter decreased linearly with the cumulative UV irradiation dose, with wet conditions exhibiting a lower mass decay rate than dry conditions. By incorporating these linear relationships and the ratio of rainy days, we estimated the NMP generation rate across Japan. Subsequently, NMP emissions were diagnosed using a new scheme implemented within the CaMa-Flood model and validated against microplastic observation data from 177 sites. The simulated concentrations showed strong consistency with observed data.

Notably, our simulation focuses on the seasonal variations in the amount of plastic retained on land. We identified a distinct "first flush" effect during the rising stages of floods and observed how spatial distributions of surface runoff influence NMP transport. These results demonstrate that the CaMa-Flood model is a robust tool for understanding the terrestrial hydrodynamics of NMP particles and estimating plastic fluxes. This framework provides a basis for future global-scale estimations to identify NMP accumulation hotspots driven by hydrodynamic processes.

How to cite: Kataoka, T., Oe, H., Furutani, M., Nihei, Y., and Yamazaki, D.: Hydrodynamics of terrestrial nano- and microplastics: simulating seasonal retention and first-flush emissions, EGU General Assembly 2026, Vienna, Austria, 3–8 May 2026, EGU26-8615, https://doi.org/10.5194/egusphere-egu26-8615, 2026.

EGU26-8681 | ECS | Posters on site | HS2.3.8

Transfer of Macroplastic Debris from Low-Tide Tropical Urban Estuaries to the Caribbean Sea: A Case Study from the Ozama-Isabela River  

Rafael Garcia Estevez, Winston Gonzalez, Carlos Sanlley, Thomas Mani, and Anne Marie Mozrall

Key words : Caribbean, GPS, Macroplastics, Monitoring, Rivers, Tracking 

Urban tropical rivers serve as critical pathways for macroplastic transport from land to sea, yet their true ocean-emission potential remains poorly understood. This study represents the first application of satellite-enabled GPS tracking in an insular Caribbean river system to quantify the movement of floating macroplastics. A total of 68 GPS drifters were deployed across the Ozama-Isabela river system in Santo Domingo, Dominican Republic, during three distinct seasonal phases in 2022. Devices were released from main river channels and tributary ravines (cañadas), and their trajectories were recorded over periods of up to three months. Results showed that 54% of drifters reached the Caribbean Sea, with river-released devices exhibiting higher transport efficiency (mean speed: 3.47 km/day) compared to those from cañadas (mean speed: 1.38 km/day). Transport dynamics varied significantly by season, with increased connectivity during high-precipitation periods. Instead of a linear predictive model, statistical analysis of the trajectories revealed a bimodal flow regime governed by a high-velocity central "transport hotline." Gaussian Mixture Models distinguished two physical states: rapid advection in the channel thalweg and static retention at the river margins. Furthermore, a significant lateral asymmetry was identified, with the right bank acting as a preferential retention zone (58% of marginal interactions). These findings demonstrate that plastic export is a binary mechanism determined by the debris' capacity to enter and remain within the central hotline. This study offers new empirical insights for regional management, suggesting that mitigation strategies must prioritize interception in tributaries before waste enters the rapid-transit main channel where capture becomes increasingly difficult. 

How to cite: Garcia Estevez, R., Gonzalez, W., Sanlley, C., Mani, T., and Mozrall, A. M.: Transfer of Macroplastic Debris from Low-Tide Tropical Urban Estuaries to the Caribbean Sea: A Case Study from the Ozama-Isabela River , EGU General Assembly 2026, Vienna, Austria, 3–8 May 2026, EGU26-8681, https://doi.org/10.5194/egusphere-egu26-8681, 2026.

EGU26-8764 | ECS | Posters on site | HS2.3.8

Ozama River Case Study: One-Year Multiple-Camera River Monitoring to Establish Baseline Debris Flux from the Dominican Capital into the Caribbean Sea 

Winston Gonzalez, Rafael Garcia, Carlos Sanlley, Thomas Mani, Stijn Pinson, and Anne Marie Mozrall

Key words: Debris flux, Urban Rivers, Plastic Pollution, Long – term monitoring, Caribbean Sea

Plastic pollution is a globally widespread threat to aquatic habitats. Models estimate that rivers carry up to 2.7 million tonnes of plastic waste into the world’s ocean every year, with the highest emission rates associated with seasons of high rainfall and discharge. The Caribbean is markedly impacted by this problem due to poor waste management and high coastline-to-landmass ratio of its multi-insular landscape. Model numbers are stated under multiple orders of magnitude of uncertainty, due to a lack of long-term, continuous empirical monitoring data. Draining the 3.5 million-inhabitant Dominican capital city of Santo Domingo, the Rio Ozama is estimated to emit between 220–22,000 tonnes (midpoint: 2,200) of plastics per year – one of the largest contributors of plastic pollution to the Caribbean Sea. This study seeks to reduce the uncertainty gap through long-term empirical baseline data. For this, we equipped two bridges across the final kilometers of the Rio Ozama with each four water-facing cameras. The sensors collected hourly debris flux data during daylight for one year (2022–2023). The resulting data indicate a median annual anthropogenic debris flux of approximately 630 tonnes year⁻¹, with an uncertainty range between ~294 and ~1,291 tonnes year⁻¹ (25th–75th percentiles), placing the observed emissions within the lower-to-mid range of previously modelled estimates for the Rio Ozama. The upstream Rosario Bridge recorded a median debris load of ~191 tonnes year⁻¹, while the downstream Mella Bridge registered ~439 tonnes year⁻¹. Expressed as Rosario/Mella, the ratio was ~0.43, indicating that debris loads at the Rosario Bridge were approximately 57% lower than those observed at the Mella Bridge over the ~3.3 km monitored river reach. This downstream increase reflects the substantial contribution of urban ravines (cañadas) and localized waste inputs entering the river between both monitoring points. Seasonal variability in debris flux was lower than expected, suggesting that anthropogenic sources and retention–release mechanisms exert a stronger control on debris transport than hydrological mobilization alone. The continuous, high-frequency dataset provides a robust empirical baseline for calibrating riverine plastic emission models and for assessing the effectiveness of waste management policies and cleanup interventions.


How to cite: Gonzalez, W., Garcia, R., Sanlley, C., Mani, T., Pinson, S., and Mozrall, A. M.: Ozama River Case Study: One-Year Multiple-Camera River Monitoring to Establish Baseline Debris Flux from the Dominican Capital into the Caribbean Sea, EGU General Assembly 2026, Vienna, Austria, 3–8 May 2026, EGU26-8764, https://doi.org/10.5194/egusphere-egu26-8764, 2026.

EGU26-10063 | ECS | Posters on site | HS2.3.8

Numerical modelling framework for micro and macro plastic transport dynamics in surface waters  

Maryam Barati Moghaddam and Michal Kuráž

Plastic pollution in surface waters spans a wide range of particle sizes, yet the transport dynamics of both micro‑ and macro‑plastics remain insufficiently quantified at the catchment scale. Addressing this challenge requires modelling approaches capable of linking realistic hydrological variability with particle‑specific transport behaviour. In this work, we develop a numerical framework that couples large‑scale hydrological simulations with a process‑based transport model for plastics of different size classes. 

We begin by reusing and re‑calibrating the mesoscale Hydrological Model (mHM) using benchmark datasets and hypothetical test cases to generate space–time fields representing flow dynamics across river basins. These hydrological outputs are exported as NetCDF files, providing a consistent and high‑resolution description of discharge and flow conditions in surface waters. To simulate plastic transport, we extend the DRUtES modelling platform by implementing a module that reads the mHM‑generated NetCDF files and solves an ADER‑based advection–dispersion–reaction equation designed to represent the transport dynamics of both micro‑ and macro‑plastic particles under realistic hydrological forcing. This coupled framework enables the simulation of plastic transport across size classes and supports scalable assessments of plastic transport dynamics in river systems. 

How to cite: Barati Moghaddam, M. and Kuráž, M.: Numerical modelling framework for micro and macro plastic transport dynamics in surface waters , EGU General Assembly 2026, Vienna, Austria, 3–8 May 2026, EGU26-10063, https://doi.org/10.5194/egusphere-egu26-10063, 2026.

EGU26-11735 | Posters on site | HS2.3.8

When Plastics Meet Microbes: Biodegradation in Aquatic Environments 

Doris Ribitsch, Karin Binder, and Georg Gübitz

In natural environments, the biodegradation of synthetic polymers depends on microorganisms that colonize polymer surfaces and secrete extracellular enzymes capable of depolymerizing these materials into low-molecular-weight compounds, which can subsequently be taken up and metabolized by the cells. To date, several microorganisms capable of hydrolyzing insoluble polymers have been identified. In contrast, limited information is available about aquatic microorganisms and the extracellular enzymes that mediate the biodegradation and mineralization of water-soluble polymers (WSPs). Water-soluble polymers are increasingly used in a wide range of applications such in cosmetics and home care products, and their incorporation into liquid formulations facilitates their entry into technical systems such as wastewater streams and wastewater treatment plants (WWTPs), as well as into natural aquatic environments.

In this study, we identified microorganisms and their enzymes that are capable of hydrolyzing WSPs. Hydrolases from various Pseudomonas species were identified and produced that hydrolyze structurally different ionic phthalic acid-based polyesters. In addition, the aerobic biodegradation of the polyesters in simulated fresh water with sewage sludge as inoculum was investigated. Beyond phthalic acid–based polyesters, synthetic poly(amino acids) represent another industrially relevant class of water-soluble polymers for which enzymatic biodegradation is still poorly understood. The most commercially successful synthetic poly(amino acid) is the water-soluble, anionic polymer poly(aspartic acid) (tPAA). Despite its widespread use, little is known about the biodegradability of tPAA. In this study, we investigated the interactions between tPAA and hydrolases derived from Sphingomonas sp. KT-1 and Pedobacter sp. KP-2, and assessed the effects of these enzymes on tPAA biodegradation. Detailed analyses using recombinant enzymes were conducted to characterize their activities and to elucidate potential synergistic effects during tPAA degradation. Finally, the individual and combined effects of the hydrolases were evaluated using an OECD 301F biodegradation test, demonstrating the potential of integrating specific enzymes into existing standardized tests to shorten testing times and to gain deeper insights into polymer biodegradation processes.

How to cite: Ribitsch, D., Binder, K., and Gübitz, G.: When Plastics Meet Microbes: Biodegradation in Aquatic Environments, EGU General Assembly 2026, Vienna, Austria, 3–8 May 2026, EGU26-11735, https://doi.org/10.5194/egusphere-egu26-11735, 2026.

EGU26-11995 | Orals | HS2.3.8

Identification of methodological biases to assess global levels of microplastic pollution in rivers 

Miguel Jorge Sánchez-Guerrero Hernández, Rocío Quintana, Sandra Manzano-Medina, and Tim van Emmerik

Studies on microplastic (MPs) pollution in aquatic environments have been conducted for over 20 years, developing and implementing a wide array of sampling and analytical methods to capture their complexity and variability in waters. However, the selection of different sampling equipment, minimum particle size considered, and sample size (sampling volume), have led to a series of potential methodological biases. This could hinder comparison of results and, therefore, understanding actual environmental variability among studies and geographical regions. In the case of different minimum particle size and size range reported, which directly impact the particle counts in the sample (e.g., smaller particles are numerous), correction factors were developed to align the concentrations found to a predefine microplastic size range (Koelmans et al., 2020; Xue et al., 2024). However, other factors, such as the potential bias caused by sampling volume on concentration is not well understood. 

In this work, we developed a statistical model to isolate the effect of sample size in freshwater samples. Literature mining allowed the study of 7506 samples, from 363 studies, collected by the most common sampling equipment: Nets, pumps and bottles (grab sampling). Each of these methods showed a wide range of mesh/filter sizes used and sampling volumes. We first corrected concentrations to a default size range (0.02 mm – 5 mm) using the correction factor by Koelmans et al. (2020) to remove bias caused by size. Second, we identified that the sampling volume and the size-corrected concentration remained negatively correlated (rho = -0.7, p-value < 0.01), indicating an additional methodological bias. Third, we modelled this correlation through a regression analysis, adjusting the parameters to allow a secondary correction due to sampling volume. The residual term of the regression model was interpreted as the actual environmental variability (i.e., spatiotemporal variation in concentration) to preserve the actual differences between sampled sites. Finally, a ‘normalized concentration to a standard volume’ was obtained, minimising both methodological biases.

This normalized concentration allows assessing microplastic contamination level in each sample, irrespective of the method used. The mapping of the corrected concentrations reveals a new regional distribution in the intensity (by orders of magnitude) of the microplastic contamination in global rivers, where those areas oversampled using higher sampling volumes show higher levels of pollution than previously thought and vice versa.

References

Koelmans, A. A., et al. (2020). Solving the nonalignment of methods and approaches used in microplastic research to consistently characterize risk. Environmental science & technology, 54(19), 12307-12315.

Xue, Y., et al. (2024). Standardization of monitoring data reassesses spatial distribution of aquatic microplastics concentrations worldwide. Water Research, 254, 121356.

How to cite: Sánchez-Guerrero Hernández, M. J., Quintana, R., Manzano-Medina, S., and van Emmerik, T.: Identification of methodological biases to assess global levels of microplastic pollution in rivers, EGU General Assembly 2026, Vienna, Austria, 3–8 May 2026, EGU26-11995, https://doi.org/10.5194/egusphere-egu26-11995, 2026.

This study examined the distribution and interaction of microplastics (MPs) between water and sediment matrices across lake and river systems in Krishnagiri District, Tamil Nadu, India, emphasizing the influence of hydrodynamic conditions on their transport and deposition. A total of 3,050 MP particles were detected, with water samples contributing 47.47% (1,185 particles from 21,115 L) and sediments 52.53% (1,865 particles/kg). Fibers dominated water samples (92.4%), whereas sediments exhibited greater MP diversity, including fragments, fiber bundles, beads, films, and foams (26.5%), indicating enhanced accumulation and heterogeneity due to long-term deposition. A strong negative correlation was found between water velocity and MP concentration in water (ρ = –0.82, p = 0.001), suggesting that higher velocities reduce MP retention. No significant correlation was observed between water velocity and sediment MPs (ρ = 0.18, p = 0.5), implying that topography and depositional conditions exert stronger control on MP accumulation. Spatial analysis of water-to-sediment MP concentration ratios revealed that eight of eleven river sites exhibited higher MP loads in sediments, particularly in wider and low-velocity zones, where reduced turbulence promotes MP settling. Confluence points showed elevated MP concentrations in water due to enhanced hydrodynamic mixing, sediment disruption, and resuspension of buried particles. Lakes also exhibited higher MP concentrations per litre than rivers, reflecting their role as long-term sinks. Overall, results demonstrate that hydrodynamics, geomorphology critically govern MP transport, retention, and distribution within freshwater ecosystems, providing insight into their environmental fate and informing mitigation strategies for aquatic plastic pollution.

How to cite: Mohan, K. and Lakshmanan, V. R.: Microplastics in freshwater environments: Influence of topography and water velocity on their distribution in river systems, EGU General Assembly 2026, Vienna, Austria, 3–8 May 2026, EGU26-12271, https://doi.org/10.5194/egusphere-egu26-12271, 2026.

EGU26-13961 | Orals | HS2.3.8

Assessing the state of plastic pollution in Dutch river systems 

Tim H. M. van Emmerik, Naddi Liese, Louise J. Schreyers, Miranda Stibora, Paolo F. Tasseron, Rose Pinto, Christian Schmidt, Gert Everaert, Chelsea Rochman, and Albert A. Koelmans

Rivers play an important role in the global distribution of plastic pollution. Plastics are transported and retained by rivers, and may be exported to sea. Large-scale, long-term and harmonized plastic monitoring data are crucial to better quantify, understand, and reduce plastic pollution in the environment. Global data availability strongly depends on the river compartment (surface, water column, riverbank, sediment) and size range (micro or macro). Despite the surge in data collection efforts, a comprehensive framework to combine those data into actionable plastic pollution indicators is still lacking. Here, we present a methodology to holistically assess the state of plastic pollution for river systems. We defined eight plastic pollution indicators representing different river compartment and size ranges. All indicators can be quantified using commonly used monitoring methods. Indicator values are coupled to effect thresholds of microplastic and macroplastic, and combined to quantify the overall state of plastic pollution. Our method can be applied at multiple spatiotemporal scales. We applied our assessment method to the Netherlands, and included four rivers, two estuaries and five urban water systems. We show that the state of plastic pollution at the annual scale varies strongly between systems, changes over time, and is driven by different indicators (e.g. suspended macroplastic, floating macroplastic or riverbank macroplastic). With our work we aim to contribute to the development of comprehensive, globally applicable tools to assess plastic pollution in rivers.

How to cite: van Emmerik, T. H. M., Liese, N., Schreyers, L. J., Stibora, M., Tasseron, P. F., Pinto, R., Schmidt, C., Everaert, G., Rochman, C., and Koelmans, A. A.: Assessing the state of plastic pollution in Dutch river systems, EGU General Assembly 2026, Vienna, Austria, 3–8 May 2026, EGU26-13961, https://doi.org/10.5194/egusphere-egu26-13961, 2026.

Plastic pollution threatens the health of humans and aquatic and terrestrial ecosystems worldwide. Addressing this threat with effective strategies and solutions requires a clear understanding of the processes that control the fate and transport of mismanaged plastics at various scales, from watersheds to regions and even continents. River corridors serve as dominant pathways and traps for mismanaged plastic generated within the landscape, which eventually reaches the ocean. In this work, we examine the main sources of plastic pollution globally and share findings from a new flow and transport model for plastic waste in riverine environments. Our results show that only about 0.25% of the mismanaged plastic entering rivers since the 1950s is expected to reach the ocean by 2100, with most plastic being stored in freshwater ecosystems. Patterns of plastic buildup and how long it stays depend heavily on (i) topology and geometry of the river network and (ii) the position and trapping efficiency of flow regulation structures, especially large dams. Our model highlights the crucial role of rivers as significant sinks for plastic waste and emphasizes the importance of targeted remediation strategies that consider river network structure and human-made controls when designing interventions and sampling plans. These measures can help maximize benefits and set realistic expectations.

How to cite: Gomez-Velez, J. and Krause, S.: Tracing Plastic Pathways: A Global Perspective on Its Fate and Transport Along River Corridors, EGU General Assembly 2026, Vienna, Austria, 3–8 May 2026, EGU26-14039, https://doi.org/10.5194/egusphere-egu26-14039, 2026.

EGU26-14734 | ECS | Posters on site | HS2.3.8

Microplastics as a potential process tracer for riverbed dynamics in federal waterways 

Marco Pittroff, Constantin Loui, Sascha E. Oswald, Hermann-Josef Lensing, and Matthias Munz

Riverbed sediments are critical transition zones that govern the exchange of water and contaminants, including microplastic particles (MPs), between surface water and groundwater. To improve our understanding of the fate and retention of MPs in these water-saturated, porous systems, we used a freeze-coring technique to obtain undisturbed, water-saturated sediment cores (100 cm in length), even in non-cohesive gravel sediments in two regulated federal waterways. We analyzed the abundance, polymer type, and size of MPs (≥ 100 µm) at 10-cm depth intervals and interpreted the observed vertical MP patterns using microplastics as novel artificial process tracers for sediment dynamics.

In the sandy riverbed of the Main River, we found a mean concentration of 21.7 MP/kg with a depth distribution that remained relatively constant in the upper layers (0–30 cm), decreased in the middle layers (30–60 cm), and markedly increased in deeper layers (60–100 cm). These vertical trends suggest a complex interplay of multiple sedimentary processes and the superimposition of factors controlling riverbed dynamics. In contrast, the gravelly riverbed of the Alpine Rhine showed a low mean concentration of 3.1 MP/kg, despite comparatively high MP concentrations in river water and groundwater, suggesting high MP mobility and limited retention of even large MPs (up to 929 µm) within the coarse sediments.

At both sites, the proportion of small MPs increased with depth; however, the largest MPs were detected in the deepest layers. While this pattern may be explained by particle infiltration processes in the Alpine Rhine, such a mechanism is implausible in the Main River, given its sandy sediment characteristics. Furthermore, low-density buoyant polymers and polymer types with the youngest EPO ages (e.g., PS ≈ 1953, PP ≈ 1954, and PET ≈ 1973) were found in deep, sandy sediments (> 80 cm).

Based on these characteristic vertical MP patterns, we propose using microplastics as a process tracer to infer controlling sediment processes, enhance the geohydraulic characterization of federal waterways, and support the long-term monitoring of sediment relocation in fluvial systems.

How to cite: Pittroff, M., Loui, C., Oswald, S. E., Lensing, H.-J., and Munz, M.: Microplastics as a potential process tracer for riverbed dynamics in federal waterways, EGU General Assembly 2026, Vienna, Austria, 3–8 May 2026, EGU26-14734, https://doi.org/10.5194/egusphere-egu26-14734, 2026.

EGU26-17376 | Orals | HS2.3.8

Database for the setting and rising dynamics of river litter 

James Lofty, Daniel Valero, and Mario Franca

Resolving the vertical velocities and three-dimensional dynamics of macroplastics and other anthropogenic litter is critical for developing comprehensive hydrodynamic models of litter transport in rivers – both vertically in the water column and horizontally across the channel. Employing large settling tanks, with a synchronous multi-camera system and an automated plastic detection algorithm, we reconstruct in three-dimensions the settling and rising trajectories more than 1,000 litter items. This enables characterisation of a litter item’s vertical and horizontal velocities, as well as their drifting gradient, oscillatory motions and settling patterns. Settling and rising velocity distributions are presented for 24 River-OSPAR categories, which represent approximately 80% of the most persistent litter categories found in rivers and on riverbanks, and include items such as plastic bags, food wrappers, and cigarette filters. The velocity distributions for each River-OSPAR category support realistic inputs for hydrological models of litter transport. Individual trajectories are then classified into four regimes – linear, linear drifting, nonlinear and nonlinear drifting – based on lateral displacement and zero-crossing analysis. This classification allows construction of a regime map of settling and rising dynamics as a function of a litter’s geometry and density, delineating regions in which different River-OSPAR categories exhibit distinct settling behaviours. The resulting regime map and velocity statistics provide physically based inputs for hydrodynamic models aimed at predicting the mobilisation, transport, and fate of litter in riverine environments.

How to cite: Lofty, J., Valero, D., and Franca, M.: Database for the setting and rising dynamics of river litter, EGU General Assembly 2026, Vienna, Austria, 3–8 May 2026, EGU26-17376, https://doi.org/10.5194/egusphere-egu26-17376, 2026.

EGU26-19183 | ECS | Orals | HS2.3.8

Plastic retention and export across Europe's rivers 

Miranda Stibora, Tim H.M. van Emmerik, Kryss Waldschläger, Miguel J. Sánchez-Guerrero Hernández, Gert Everaert, and Albrecht Weerts

Rivers play a central role in the global distribution of plastic pollution, as plastics are both retained and exported to sea. Large scale plastic transport models are used to quantify plastic export. Despite recent research showing that the majority of plastic is not transported to sea, most models have overlooked reporting a key process in plastic transport dynamics,  quantifying the retention of plastic in rivers. Moreover, previous models have carried out limited model calibrations, leading to uncertainty in export estimates. These gaps in knowledge have resulted in models potentially over or underestimating plastic export, and providing a limited assessment of the overall plastic pollution of a river system. We propose a new model to explore the state of plastic pollution accounting for both micro- and macroplastic considering both river export and retention on land and in rivers at a European scale. We find that rivers are a significant temporary sink for plastics with a large quantity of plastic being retained in Europe rivers systems on an annual scale. River basins with a large area and input of plastic to land contribute considerably to absolute plastic export and retention. When accounting for population density, we find that small coastal river basins are estimated as having a larger macroplastic export per capita compared to larger basins. Conversely large river basins are estimated as having the largest microplastic export per capita. This outcome shows the complexity of plastic export and retention and reinforces the need to model at a high spatial resolution for accurately characterizing pollution dynamics. We determine that reducing plastic generation and mismanaged inputs to land is fundamental to achieving meaningful reductions in plastic pollution. Finally, we show that using a single indicator (e.g. plastic export or retention in rivers) to determine the most polluted rivers may not be sufficient in determining the overall level of plastic pollution of a river system. By integrating estimates of plastic retention, the final assessment of plastic pollution reveals a different set of high polluting rivers, than if only export estimates were to be used. By carrying out this research we provide a holistic overview of the overall state of pollution in Europe’s rivers by evaluating plastic export and retention estimates using a well calibrated, high resolution model.

How to cite: Stibora, M., van Emmerik, T. H. M., Waldschläger, K., Sánchez-Guerrero Hernández, M. J., Everaert, G., and Weerts, A.: Plastic retention and export across Europe's rivers, EGU General Assembly 2026, Vienna, Austria, 3–8 May 2026, EGU26-19183, https://doi.org/10.5194/egusphere-egu26-19183, 2026.

EGU26-21645 | ECS | Posters on site | HS2.3.8

Monitoring and modelling macroplastic transport in riverine systems from reach to catchment scale 

Gergely Tikász, Gábor Fleit, and Bence Turák

Plastic transport processes in inland fluvial systems remain poorly quantified, particularly at larger spatial and temporal scales. In this study, we aim to investigate macroplastic transport dynamics across multiple river reaches, even river system using a combination of field observations, remote sensing, and modelling approaches, with relevance at catchment scale.

We are developing an integrated monitoring system capable of continuously surveying extended river sections using multiple fixed monitoring stations equipped with IP cameras and automated object detection algorithms. In addition, unmanned aerial vehicles (UAVs) are employed for rapid assessments of highly polluted areas and spatially heterogeneous accumulation zones. The primary output of this system is a continuous time series of macroplastic fluxes across multiple river cross-sections, enabling direct coupling with hydrological, meteorological, and catchment-scale land use data.

To further investigate macroplastic transport pathways, accumulation zones, and remobilization processes, we are also developing and testing GPS-equipped plastic tracers that can be tracked over extended periods with meter-scale positional accuracy. These observations allow the identification of trapping zones, residence times, and remobilization probabilities under varying hydrological conditions, including the influence of extreme events such as floods and low-flow periods.

The collected spatio-temporal datasets address current gaps in long-term, reach-to-catchment scale observations of macroplastic transport in freshwater systems. These data are intended to support and calibrate hydrodynamically driven, particle-based (Lagrangian) transport models, improving our understanding of macroplastic source-to-sink dynamics and the role of hydrological and land use controls on plastic accumulation and export in riverine environments.

How to cite: Tikász, G., Fleit, G., and Turák, B.: Monitoring and modelling macroplastic transport in riverine systems from reach to catchment scale, EGU General Assembly 2026, Vienna, Austria, 3–8 May 2026, EGU26-21645, https://doi.org/10.5194/egusphere-egu26-21645, 2026.

EGU26-21946 | Orals | HS2.3.8

Monitoring microplastic transport in the Rhine River 

Thomas Hoffmann, David Range, David Kamp, and Thomas Ternes

Microplastics (MP) are constantly transported into the oceans via rivers, but riverine transport paths linking MP sources and sinks are insufficiently understood. For a quantification of MP transport in rivers, knowledge on the differential behaviour of MP and natural sediments in aquatic environments is essential. Both underlie the same hydrodynamic forces, namely gravity, buoyancy and drag force but MP exhibits strong contrast to natural sediments in terms of particle density and form enhancing the complexity of MP transport compared to natural sediments. Therefore, the main objective of our research is to gather knowledge on the application and comparison of different sampling techniques to obtain information on the temporal variability of MP in the Rhine River in Germany and identify monitoring techniques to efficiently calculate MP-loads in river systems.

Here we present various monitoring devices to estimate mass-based MP concentrations in the Rhine, and test different algorithms to calculate MP loads, considering the spatio-temporal variability of MP occurrence in rivers. MP concentrations are monitored for one year at Weil am Rhein (at the Swiss-German border), Koblenz and Emmerich (at the German-Dutch border). For the analysis of the collected samples, thermal degradation techniques (Pyr-GC-MS) are applied to obtain mass-based concentrations for polypropylene (PP), polyethylene (PE), polystyrene (PET) and polyvinyl chloride (PVC) for four grain size fractions ranging from 10 to 1000µm.

Total annual MP loads at Koblenz in 2022/23 are 429±125 t derived from the SB and 58±15 t derived from the CFC. Much lower loads derived from the CFC indicate that flow centrifuges might capture large amounts of heavy polymers with densities > 1 g cm-3, but retain only a small fraction of MP particles < 1 g cm-3. CFC sampling is frequently applied for water quality analysis and known for its high sampling efficiency regarding mineral particles. However, monitoring MP using CFCs requires additionally sampling and analysing of the residual water of the CFC, to avoid the loss of low-density polymers.

The comparison of the monitoring using SBs at the three sampling sites reveal significant longitudinal gradients of MP transport along the Rhine. The MP load of PP, PE and PET in 2022/23 increases from 230 t a-1 at the Swiss/German border to 357  t a-1  at Koblenz and 460  t a-1 at Emmerich, with dominating PE loads followed by PP and PS. 

The estimated MP loads are among the highest of the world. Based on a rating analysis MP-load with catchment size, we are able to show that these high loads are linked to the large catchment sizes of the River Rhine compared to othr MP-load estimates.

How to cite: Hoffmann, T., Range, D., Kamp, D., and Ternes, T.: Monitoring microplastic transport in the Rhine River, EGU General Assembly 2026, Vienna, Austria, 3–8 May 2026, EGU26-21946, https://doi.org/10.5194/egusphere-egu26-21946, 2026.

EGU26-634 | ECS | Orals | HS2.3.9

Suspended load effects on microplastic transfer from the water column to the riverbed 

Francesca Uguagliati, Melissa Khozaya, Kryss Waldschläger, Massimiliano Zattin, and Massimiliano Ghinassi

Rivers act as major pathways for microplastic pollution, yet the mechanisms governing the transfer of suspended microplastics from the water column to riverbeds remain poorly understood. We conducted controlled flume experiments under steady, unidirectional flow to quantify the deposition of microplastic fibres within a sandy ripple bed. Polyamide and polyester fibres, introduced at environmentally relevant concentrations, were tracked under clear-water conditions and in flows containing suspended kaolin to simulate enhanced fine-sediment loads. In clear water, fibres remained widely mixed throughout the water column and were only rarely incorporated into sand, indicating efficient downstream transport and limited short-term sequestration. In contrast, the presence of suspended kaolin induced pronounced and elevated near-bed fibre concentrations and substantially increased the incorporation of fibres into the sand bed. Fibre properties influenced this process: higher-density fibres exhibited greater settling tendencies, while curled fibres experienced increased drag and more frequent interactions with both saltating sand grains and suspended particles, promoting their entrapment within the bed. These results demonstrate that suspended fine sediments can markedly enhance microplastic deposition in riverbeds by altering near-bed transport dynamics and promoting physical entrapment within bedforms. Such conditions create accumulation zones that may influence the short-term accumulation and long-term distribution of microplastics in river systems.

How to cite: Uguagliati, F., Khozaya, M., Waldschläger, K., Zattin, M., and Ghinassi, M.: Suspended load effects on microplastic transfer from the water column to the riverbed, EGU General Assembly 2026, Vienna, Austria, 3–8 May 2026, EGU26-634, https://doi.org/10.5194/egusphere-egu26-634, 2026.

EGU26-2405 | ECS | Orals | HS2.3.9

Secondary nanoplastic transport in sand and in soil 

Phillip Vershinin, Ishai Dror, and Brian Berkowitz

The widespread use of plastics since the mid-twentieth century has led to their pervasive accumulation in the environment. As plastics progressively weather and fragment, they generate secondary nanoplastics, which constitute the dominant form of nanoplastics in the environment. Despite their relevance, secondary nanoplastics remain largely understudied due to analytical challenges associated with low concentrations, complex matrices, and the diversity of polymers. Consequently, much of the current literature relies on microplastics or model primary nanoplastics that do not adequately represent environmentally formed secondary nanoplastics.

In this work, we introduce a novel analytical method for quantifying secondary nanoplastics in aqueous solutions and leverage these capabilities to study the transport of four distinct, environmentally relevant plastics (PET, PP, LDPE, and HDPE) and landfill-derived nanoplastics that were weathered naturally for more than 20 years (and thus represent real environmental secondary nanoplastics). We then focus on analysis of the mobility of these secondary nanoplastics through sand and soil columns, examining breakthrough curves and size distributions to elucidate the leading transport mechanism(s) of these particles. Our results show a plastic-specific transport that is influenced by plastic chemistry and the type of porous medium. Aliphatic plastics tend to be retained more than aromatic ones, due to higher hydrophobicity. Size distribution analysis indicates that eluted secondary nanoplastics are generally larger, suggesting that smaller particles aggregate or are retained within the media. Despite chemical similarity, secondary HDPE and secondary LDPE differ in their elution patterns, while secondary PET exhibits increased aggregation due to its extended π-orbital system. Landfill-derived nanoplastics showed greater retention owing to inorganic impurities, which promote smaller aggregation. Additional experiments examining secondary HDPE transport across multiple porous media, including three sand grain sizes and a sandy loam soil, showed generally consistent retention behavior, with the notable exception of fine sand. In fine sand, enhanced retention is likely driven by smaller pore throats that promote particle trapping. Size-resolved elution patterns revealed two distinct particle populations in fine sand, whereas medium and coarse sands, as well as soil, exhibited a shift toward larger eluted particles. In soil, a modest delay in secondary HDPE breakthrough further suggests interactions between secondary HDPE and the soil matrix.

Overall, our findings provide new mechanistic insights into secondary nanoplastic transport and represent a significant step toward a realistic assessment of nanoplastic fate in subsurface environments.

How to cite: Vershinin, P., Dror, I., and Berkowitz, B.: Secondary nanoplastic transport in sand and in soil, EGU General Assembly 2026, Vienna, Austria, 3–8 May 2026, EGU26-2405, https://doi.org/10.5194/egusphere-egu26-2405, 2026.

EGU26-2966 | ECS | Posters on site | HS2.3.9

BIOPHYLM: Biofilm on microplastics - a biophysical perspective 

Eleni Koutsoumpeli, Peter van Oostrum, Guruprakash Subbiahdoss, and Erik Reimhult

The ubiquitous presence of microplastics (MPs) in aquatic environments has become a major threat to ecosystems. In marine and freshwater environments, MPs interact with microorganisms, leading to the formation of biofilms on their surface and creating a complex community called the Plastisphere. This process can alter the particles’ physical and chemical properties and, in turn, affect their ecological risks, environmental transport, and fate. Our understanding of the influence of microbial colonisation on the transport of MPs in aquatic environments remains limited, warranting further research on microbe-MP interactions. The BIOPHYLM project aims to address these knowledge gaps by focusing on a less-investigated, yet significant, plastisphere aspect, which is the lower end of the MP size range, between 1-100 μm. For this purpose, MP particles will be exposed to river water (Donaukanal, Vienna) in a lab-based mesocosm setup and biophysical, colloidal, and high-throughput sequencing approaches will be applied for studying microbe-plastic interactions over time. Notably, the project aims to demonstrate real-time measurements of biofilm growth and MP particle mobility by monitoring the mesocosms with in-line digital holographic microscopy, a novel technology recently developed by BOKU researchers. By linking data from each technique, BIOPHYLM aspires to obtain a holistic view of MP-microbe interactions and fill important knowledge gaps that will improve our understanding of the role of biofilm on MP transport, and thus, reinforce a science-based risk assessment of plastic particles in the aquatic environment.

In this presentation, key elements of the project will be introduced and preliminary findings and results from its first year will be demonstrated.

How to cite: Koutsoumpeli, E., van Oostrum, P., Subbiahdoss, G., and Reimhult, E.: BIOPHYLM: Biofilm on microplastics - a biophysical perspective, EGU General Assembly 2026, Vienna, Austria, 3–8 May 2026, EGU26-2966, https://doi.org/10.5194/egusphere-egu26-2966, 2026.

The prediction of plastic particles’ spatial distribution and their fate in water environments depends on a range of particle properties and environmental factors. Salinity-stratified water columns, commonly found in estuaries, have a major influence on the transport behaviour and the settling velocity of these particles. Water density gradients with depth modify the buoyancy force acting on plastic particles, leading to non-uniform vertical velocity and heterogeneous distribution throughout the water column. On the other hand, intrinsic particle properties, such as polymer density, size and shape, also play an important role, affecting their behaviour within the same environment. In this study, the effects of salinity gradients in settling velocity of plastic particles of different shapes, sizes and polymers are investigated through several experiments carried out in the Laboratory of Hydraulics at the University of Coimbra. To perform the experiments, granular particles of four different types of polymers (PMMA, PS, PVC and PET) were used, with particle densities ranging from 1.047 g/cm3 to 1.372 g/cm3. The experiments were conducted in a transparent acrylic tank with dimensions of 32 cm (width) x 32 cm (length) x 100 cm (height). The tank was filled with water at different salt concentrations, which were previously measured using a conductivity sensor. By means of an auxiliary valve located at mid-height of the tank, it was possible to introduce water with different salinities, producing different stratification profiles. The particles were then carefully released 5 cm below the water surface. Following the particles’ release, images were recorded using high resolution cameras, placed in front of the tank. The acquired images were treated and post-processed using a Particle Tracking Velocimetry (PTV) method to determine the settling velocity of the plastic particles. Based on the experiments carried out, this study highlights the importance of accounting for salinity effects when determining the settling velocity of plastic particles, as higher salinity concentrations lead to reduced settling velocities. As expected, the study demonstrates that higher salinity gradients promote a decrease in the settling velocity of the particles along the water column. This effect is particularly clear in the experiments where the halocline is more evident. In addition, the particles’ density and shape also prove to be important factors, directly influencing the settling velocity.

How to cite: Romero, A. and F. Carvalho, R.: Settling Velocity of plastic particles in Salinity-Stratified Water Columns: An Experimental Investigation, EGU General Assembly 2026, Vienna, Austria, 3–8 May 2026, EGU26-3826, https://doi.org/10.5194/egusphere-egu26-3826, 2026.

EGU26-5166 | ECS | Orals | HS2.3.9

From Surface to Sink: How Plastic Characteristics Dictate Biofilm Formation and Fate.  

Martiño Rial-Osorio, Vicente Pérez-Muñuzuri, and Sara Cloux

The “missing plastic” paradox highlights a critical gap in our understanding of plastic transport in the ocean. A leading hypothesis suggests a significant fraction is vertically distributed within the water column, modulated, among other effects, by biofouling—the colonization of plastic by algae. To investigate this process, we used a biofouling model by Kooi et al. (2017). Our study systematically investigated a wide range of polymer densities representative of the most prevalent plastics found in the marine environment while combining a parametric analysis of the biofouling process to clarify how plastic properties govern biofilm development and subsequent particle dynamics.

The model reveals that biofouling induces complex, oscillatory vertical migrations. Particles experience rapid biofilm growth, increasing their density and sinking. As they descend into colder waters, growth is suppressed, and metabolic losses reduce the biofilm, causing the particles to regain buoyancy and return to the surface to restart the cycle. Our analysis further demonstrates that particle size and density are critical drivers: smaller particles support a larger biofilm relative to their size, while density significantly influences the timescale of sinking onset for larger particles. Long riverine plastic emissions in the eastern Atlantic Ocean were tracked to study the accumulation areas in the ocean as a function of seasonal biofouling patterns and local currents patterns.

These results underscore that accurately modeling biofouling is essential for predicting the fate and distribution of marine plastic pollution in the ocean, moving beyond the simplistic assumption of particles as passive Lagrangian tracers.

How to cite: Rial-Osorio, M., Pérez-Muñuzuri, V., and Cloux, S.: From Surface to Sink: How Plastic Characteristics Dictate Biofilm Formation and Fate. , EGU General Assembly 2026, Vienna, Austria, 3–8 May 2026, EGU26-5166, https://doi.org/10.5194/egusphere-egu26-5166, 2026.

Understanding the dynamics of unintentional microplastic (MP) ingestion by benthos in aquatic environments is crucial for assessing the ecological impacts of MPs. Yet, this process remains poorly understood. To address this, we developed a high-fidelity, two-way coupled numerical model that integrates large-eddy simulation and Lagrangian point-particle tracking techniques. Three key parameters are examined: benthos predation types (filter-feeders, grazers, and burrowers), MP density, and benthos density, with benthos density emerging as the dominant factor. Specifically, an eightfold increase in benthos density results in a 5- to 22-fold rise in ingested MPs. Benthos types influence the final ingestion proportion (defined as the ratio of ingested to released MPs), with grazers showing the highest ingestion efficiency, followed closely by filter feeders—both approximately doubling the ingestion rate observed in burrowers at equivalent benthos density. MP density has minimal inf luence on ingestion across all benthic groups and densities, except under high-density filter-feeder conditions. Two distinct MP transport models during ingestion are identified: (i) a suspension mode observed in filter-feeders and (ii) a sliding mode prevalent in grazers and burrowers. The Rouse number (P) effectively differentiates these models, with the suspension mode dominating when P < 2.5 and the sliding mode dominating when P > 2.5. The Rouse number and spanwise turbulence intensity govern the number of MPs ingested by each benthic individual, while the cumulative predation width of all benthos accounts for the impact of benthos density and types. Consequently, the product of these two parameters serves as a robust predictor for the final MP ingestion proportion, where a strong linear relationship is observed across all simulations.

How to cite: Jiao, M.: Modeling microplastic transport in open channel flows and ingestion dynamics by benthos, EGU General Assembly 2026, Vienna, Austria, 3–8 May 2026, EGU26-5168, https://doi.org/10.5194/egusphere-egu26-5168, 2026.

EGU26-5723 | ECS | Posters on site | HS2.3.9

Investigating the Migration and Transport of Micro/Nano-plastics in Soil Columns: A Systematic Review 

Anjali Anjali, Neeraj Chauhan, Jaswant Singh, Uwe Schneidewind, Reza Dehbandi, and Stefan Krause

Plastics have emerged as a pervasive pollutant in terrestrial ecosystems, posing significant ecological risks and potential threats to human health. The pervasive nature of these plastics and their longevity leave a legacy of micro/nano-plastics (MnPs), which contaminate soil systems and drinking water resources. In recent years, a growing number of experimental studies have investigated the transport behavior of MnPs; however, comprehensive review articles focusing specifically on MnPs transport in soil- and groundwater-based column systems remain limited. The present article aims to systematically compile the existing literature on the migration and mass distribution of MnPs of varying sizes in soil, under the influence of key physicochemical parameters such as pH, ionic strength, surfactants, and solution chemistry. In addition, this review examines the effects of co-contaminants, flow direction, hydraulic forcing, and experimental setup variations on the transport and retention of MnPs within soil columns. The outcomes of the reviewed studies are evaluated through their impacts on breakthrough curves and retention profiles, providing insights into MnPs mobility and accumulation mechanisms. Both labelled and non-labelled MnPs transport studies conducted in column experiments are considered, with particular emphasis on the detection and quantification techniques employed. These include fluorescence-based methods, particle counting approaches (manual and automated), electron microscopy (SEM/TEM), and light scattering techniques such as dynamic light scattering. Finally, the performance of these detection methods is critically compared in terms of sensitivity, accuracy, and applicability, and key methodological limitations and future research challenges in MnPs transport studies are discussed.

How to cite: Anjali, A., Chauhan, N., Singh, J., Schneidewind, U., Dehbandi, R., and Krause, S.: Investigating the Migration and Transport of Micro/Nano-plastics in Soil Columns: A Systematic Review, EGU General Assembly 2026, Vienna, Austria, 3–8 May 2026, EGU26-5723, https://doi.org/10.5194/egusphere-egu26-5723, 2026.

EGU26-7634 | ECS | Posters on site | HS2.3.9

The Effect of Polymer Type and Particle Concentration on Microplastic Transport Mechanisms in Saturated Porous Media 

Kexin Li, Sophie Comer-warner, Faud Alqrinawi, Iseult Lynch, and Stefan Krause

The widespread presence of microplastics (MP) is posing a potential threat to soils and groundwater. However, the mechanisms governing MP transport and retention within porous media and groundwater remain largely unknown. In this study, we provide new evidence for the complex mechanisms governing the transport of different types of MPs within porous media.

Using saturated quartz sand column models, we investigated the transport of five different MP polymer types, including Polyethylene (PE), Polyamide (PA), Polypropylene (PP), Polymethyl methacrylate (PMMA), and Polyethylene terephthalate (PET) at particle concentrations of 5,000; 50,000; and 500,000. MP Breakthrough curves and retention profiles were obtained to determine the polymer type and concentration specific transport and retention rates. Results indicate that MP transport capacity in porous media does not always exhibit linear correlation with MP particle concentrations. Specifically, as the particle injection concentration increased, the transport capacity of PE and PP initially increased and then decreased, reaching a maximum at 50,000. In contrast, the transport capacity of PET and PMMA increased markedly as the injection concentration rose from 5,000 to 50,000, but showed no further significant change when the concentration was increased from 50,000 to 500,000. In addition, biofilm growth on MP particles was found to alter the physicochemical properties of the MP particle surface, thereby modifying particle-matrix interactions and particle retention, and changing the overall MP transport behavior through porous media.

These findings indicate that concentration impacts on particle transport behavior must be fully accounted for when applying column experiments to investigate particle transport, highlighting the importance of determining and applying environmentally realistic MP concentration ranges and particle conditions for testing. Furthermore, biofilm attachment to MP surfaces can alter critical surface properties and particle-matrix interactions, thereby modifying transport rates within subsurface environments.

How to cite: Li, K., Comer-warner, S., Alqrinawi, F., Lynch, I., and Krause, S.: The Effect of Polymer Type and Particle Concentration on Microplastic Transport Mechanisms in Saturated Porous Media, EGU General Assembly 2026, Vienna, Austria, 3–8 May 2026, EGU26-7634, https://doi.org/10.5194/egusphere-egu26-7634, 2026.

EGU26-8104 | ECS | Orals | HS2.3.9

A novel Eulerian-Lagrangian numerical framework to investigate microplastic transport at surface water-sediment interfaces. 

Zijian Chen, Fuad Alqrinawi, Bruño Fraga, and Stefan Krause

Microplastics (MPs) have emerged as widespread and persistent contaminants in fluvial environments. Their transport pathways and retention mechanisms within riverbeds have recently attracted increasing attention. Although stochastic models and experimental studies have shown that streambed sediments can act as important sinks of MPs particles, the hydrodynamic drivers and particle-sediment interactions governing particle exchange across water-sediment interfaces remain insufficiently understood, particularly under complex streambed geometries and variable flows.

In this study, a novel three-dimensional Eulerian-Lagrangian model (MultiFlow3D) is used to investigate MPs transport at surface water-sediment interfaces, resolving turbulence and particle motion in both the free-flow region and the permeable streambed sediments. MPs are simulated as Lagrangian particles, while the streambed sediment is represented through a smooth transition volume penalization numerical treatment that represents the porous bed as spheres. In addition, particle-particle and particle-porous media collision is incorporated to enhance the physical realism of particle interactions.

The model is validated through the reproduction of published laboratory experiments, in which the hydrodynamic flow field and particle transport processes are validated separately. The hydrodynamic component is validated by comparing simulated velocity fields and pressure distributions with experimental measurements, while the particles interactions are validated by reproducing observed particle trajectories, infiltration locations, and retention.

Based on the validation, the influence of different riverbed geometries on the migration of MPs is investigated by testing both sinusoidal and uniform beds. The results indicate that, in most cases, high-pressure regions only develop on the upstream face of bedforms, causing MPs particles to predominantly infiltrate the sediment from the stoss side. However, a secondary high-pressure region may also form under certain conditions on the downstream side, allowing particles to enter the sediment from the lee side. Once infiltrated, most MPs particles remain confined to shallow subsurface layers, with limited penetration depth into the sediment bed.

This study provides mechanistic insight into the combined effects of hydrodynamic pressure distributions and bedform geometry on MPs transport across the water-sediment interface. The proposed modelling approach offers an efficient and physically consistent tool for investigating the environmental fate of MPs in permeable riverbeds and supports improved interpretation of experimental observations.

How to cite: Chen, Z., Alqrinawi, F., Fraga, B., and Krause, S.: A novel Eulerian-Lagrangian numerical framework to investigate microplastic transport at surface water-sediment interfaces., EGU General Assembly 2026, Vienna, Austria, 3–8 May 2026, EGU26-8104, https://doi.org/10.5194/egusphere-egu26-8104, 2026.

EGU26-8308 | Posters on site | HS2.3.9

Transport of Tyre Wear Particles through Porous Media: Effect of Particle Density and Sediment Grain Size 

Shravani Yadav, Brijesh Kumar Yadav, Stefan Krause, and Uwe Schneidewind

Tyre wear particles (TWP), a substantial fraction of microplastics (MPs), have drawn a lot of attention recently because of their pervasiveness in aquatic environments; nevertheless, little is known about the transport behaviour through porous media. Therefore, in this study, column experiments were carried out to investigate the transport behaviour of TWP through porous media with varied sediment grain sizes and particle density. Soda lime glass beads of 10mm and 2mm diameters were used as a porous media material to represent natural sediments, such as fine gravel and coarse sand. Transport of TWPs (1.15 g/cm³) is compared with polypropylene (PP, 0.98 g/cm3) to ascertain the impact of density on MPs transport in porous media. The results show that PP, which is of lower density, was more mobile within the fine gravel media. Despite the buoyant nature of PP and expected less gravitational settling, their movement through porous media was faster and more complete than TWP. In contrast, for the denser TWP, retention in the porous media was higher, perhaps also due to greater surface interaction with the media. However, within the coarse sand, both PP and TWP breakthrough was reduced, with lower peaks and enhanced particle retention in sediments. In this case, mechanical straining and greater surface contact likely dominated over density effects, causing increased retention for both particle types.

This suggests that both particle density and sediment grain size as well as slight differences in surface properties and shapes of TWP and PP have a considerable impact on MP transport in porous media. This research is essential for comprehending the transport dynamics of TWPs in sub-surface environments, hence emphasising the environmental repercussions linked to their extensive distribution.

Keywords: Tyre wear particle, density, glass beads, transport, PP


How to cite: Yadav, S., Yadav, B. K., Krause, S., and Schneidewind, U.: Transport of Tyre Wear Particles through Porous Media: Effect of Particle Density and Sediment Grain Size, EGU General Assembly 2026, Vienna, Austria, 3–8 May 2026, EGU26-8308, https://doi.org/10.5194/egusphere-egu26-8308, 2026.

EGU26-9992 | ECS | Posters on site | HS2.3.9

Simulating the fate and transport of microplastics in a river corridor (Rhine River) 

Shabiha Sultana Rimi, Christian Schmidt, and Jan H. Fleckenstein

The extensive use of plastics has led to a widespread presence of microplastics (MPs) across various environmental compartments. Rivers and their floodplains not only play a crucial role in transporting these particles from terrestrial sources to lakes and oceans, but can also act as temporary sinks. Despite the significance of rivers as transport pathways for MPs to the ocean, our understanding of the dominant transport and retention process in river corridors is still limited. This study investigates the transport, deposition and remobilization processes of MP along a 3.5km reach of the river Rhine between Cologne and Düsseldorf, Germany. 

A three-dimensional hydrodynamic model with the morphological module (D-Morphology) was developed using the Delft3D FM software. Two types of microplastic particles with diameter of 0.1mm and different densities, 1030 kg/m3 Polystyrene and 1195 kg/m3 Polyvinyl Chloride (PVC) were used to assess their transport behavior under different flow scenarios. The model was calibrated against observed water levels on Manning’s roughness coefficient and subsequently validated against an independent data set. A continuous flux of microplastics at a concentration of 1μg/m³ was introduced into the hydrodynamic model at the upstream boundary.

First, results indicate that advection and flow turbulence are the dominant processes governing microplastic transport. Higher discharge rates enhance microplastic transport by increasing suspended concentrations, while reducing the mass of the sedimented particles. The percentage of sedimented Polystyrene was found to be about 2.5% of total input at the end of a simulated flood event in 2021. Resuspension was found to be about 40% of the sedimented mass along the river banks and floodplain during peak flood. During the recession limb of the flood event, sedimented microplastic load increased gradually whereas suspended load decreased. Additionally, the density and size of the microplastic particles along with hydrodynamic conditions significantly influence their spatial distribution and storage within the river corridor.

How to cite: Rimi, S. S., Schmidt, C., and Fleckenstein, J. H.: Simulating the fate and transport of microplastics in a river corridor (Rhine River), EGU General Assembly 2026, Vienna, Austria, 3–8 May 2026, EGU26-9992, https://doi.org/10.5194/egusphere-egu26-9992, 2026.

EGU26-11261 | ECS | Orals | HS2.3.9

An experimental flume study on the retention of Microplastic Fibers and Irregular Microplastics 

Marco La Capra, Daniel Wagner, Seema Agarwal, Jan H. Fleckenstein, and Sven Frei

Pore-scale microplastics (< 10 μm) are emerging contaminants whose behavior and fate in aquatic environments remain poorly understood. While the properties of spherical microplastics (SMPs) in fluvial systems have been studied, those of irregularly shaped microplastics (IMPs) and microplastic fibers (MPFs) remain poorly understood. We investigated how the transport and retention of IMPs and MPFs differ from those of SMPs. We compared the transport dynamics of 8 µm diameter IMPs and MPFs, with diameters ranging from 5 to 10 μm and lengths of 60–250 μm, with reference SMPs of diameters 1, 3, and 10 μm, by continuously monitoring microplastic concentrations in surface water and streambed sediments. Our results demonstrate how particle shape and sediment-particle ratio affect the transport and retention of microplastics in fluvial systems. These differences will have significant implications for the ecological impact and long-term fate of different MPs, including the duration of exposure to benthic organisms and the burial of MPs in deeper sediment layers due to river sedimentation cycles.

How to cite: La Capra, M., Wagner, D., Agarwal, S., Fleckenstein, J. H., and Frei, S.: An experimental flume study on the retention of Microplastic Fibers and Irregular Microplastics, EGU General Assembly 2026, Vienna, Austria, 3–8 May 2026, EGU26-11261, https://doi.org/10.5194/egusphere-egu26-11261, 2026.

EGU26-14887 | ECS | Orals | HS2.3.9

Legacy Plastics Release Toxic Metal(oid)s During Environmental Degradation 

Guillaume Pécheul, Quentin Bollaert, Delphine Vantelon, Margaux Laville, Charlotte Catrouillet, Daniel Funes Hernando, Maxime Pattier, Camille Rivard, Kadda Medjoubi, Jonathan Perrin, Isabelle Bihannic, and Mélanie Davranche

Metallic additives are extensively incorporated into plastics materials to improve their functional properties. Although the use of hazardous substances is now largely restricted in the EU, numerous metal(oid)s, such as lead, cobalt and hexavalent chromium (Cr(VI)), were historically used in plastic formulation1,2. Yet, as these legacy plastics undergo environmental degradation, the fate of the metal(oid)s they contain remains poorly understood.

Chromium speciation in plastics debris collected from beaches in Guadeloupe (France) was first investigated using micro- X-ray absorption spectroscopy (micro-XAS) combined with micro-X-ray  fluorescence (micro-XRF). Chromium was found predominantly as Cr(III) within cobalt chromite (CoCr2O4), but also as toxic Cr(VI) in crocoite (PbCrO4) or potassium chromate (K2CrO4)3. Mineral phases occur as micro- and nanoscale particulate additives embedded within the polymer matrix.

To assess the behavior of such chromium additives during plastic degradation, representative PP fragments, containing high chromium concentrations, were altered in environmentally relevant conditions, following Blancho et al.4. Micro-XAS analyses combined with micro- and nano-XRF imaging reveal that crocoite micro- and nanoparticles dominate chromium speciation in both macro- and microplastics. However, chromium contents and speciation are drastically modified in nanoplastics. A ~95% reduction in total chromium concentration is observed. Remaining chromium occurs as Cr(III) diffused within the polymer matrix.

Micro and nano-tomography imaging, in addition to SEM observations, were conducted to track the processes leading to the fragmentation and the release of toxic additives such as crocoite. In the plastic, before UV-C exposure, particulate additives are embedded in the polymer matrix, with air pockets around them. These additives are separated by more than 100 nanometers. UV-C irradiation induces the development of fracture networks from the plastics surface to subsurface, which connect the additive pockets to each other.

Altogether, this study combining laboratory and field experiments demonstrates a new model for the release of metallic additives during plastic alteration. UV-C exposure creates a network of fractures that compromises the polymer integrity by interconnecting the pockets of additives particles. Subsequent mechanical erosion promotes polymer fragmentation. This two-step process results in the liberation of nanoplastics that are free from metallic particulate additives, which are released on their own. This model is crucial to understand the mechanisms governing the environmental release of toxic metal(oid)s during plastic alteration.


References

1            Bridson et al., (2021), Journal of Hazardous Materials, 414, 125571.

2            Turner and Filella, (2021), Environment International, 156, 106622.

3            Catrouillet et al., (2021), Environ. Sci.: Processes Impacts, 23, 553–558.

4            Blancho et al., (2021) Environ. Sci.: Nano, 8, 3211–3219.

How to cite: Pécheul, G., Bollaert, Q., Vantelon, D., Laville, M., Catrouillet, C., Funes Hernando, D., Pattier, M., Rivard, C., Medjoubi, K., Perrin, J., Bihannic, I., and Davranche, M.: Legacy Plastics Release Toxic Metal(oid)s During Environmental Degradation, EGU General Assembly 2026, Vienna, Austria, 3–8 May 2026, EGU26-14887, https://doi.org/10.5194/egusphere-egu26-14887, 2026.

EGU26-17227 | ECS | Posters on site | HS2.3.9

Enhanced mobility and dynamic retention of nanoplastics in mineral coated porous media. 

Sascha Müller, Tim Haberschek, Mateusz Kasztelan, and Edith Hammer

This study examines the transport and retention of carboxylated and amine-modified polystyrene nanoparticles (NP) in quartz-, kaolinite-, and goethite-coated sands under saturated flow. Column experiments at varying flow velocities (1- 50 m d⁻¹), supported by adsorption kinetics, (X)-DLVO modeling, hydrodynamic torque analysis, and advection-dispersion modeling (ADE), were used to identify controlling factors of NP mobility.

Increasing flow velocity enhanced NP breakthrough and shifted deposition zones further along the column length, indicating a transition from diffusion- to reaction-limited attachment. Deposition followed the order goethite > kaolinite > quartz. Despite similar surface charge, carboxylated polystyrene NP showed unexpectedly strong retention on kaolinite, attributed to hydrogen bonding between carboxyl and kaolinite hydroxyl groups, as indicated by IR spectroscopy, an interaction not captured by DLVO theory. Force tensiometry showed variations in contact angles between various mineral coatings, yet no evidence for earlier proposed “long range” hydrophobic forces between NP and macroscopic surfaces could be found from Peak Force QNM measurements. ADE simulations incorporating reversible attachment-detachment and site blocking best reproduced observations, highlighting the combined roles of hydrodynamics and mineral surface chemistry. The modelling exercise further suggests that the low density of polymeric nanoparticles limits gravitational settling, challenging the transferability of trends established for denser mineral engineered nanoparticles (ENPs) such as silica.

Overall, the results demonstrate greater NP mobility and more dynamic retention in natural, heterogeneous flow systems than inferred from DLVO interactions, as supported by experiments and kinetic ADE modeling.

How to cite: Müller, S., Haberschek, T., Kasztelan, M., and Hammer, E.: Enhanced mobility and dynamic retention of nanoplastics in mineral coated porous media., EGU General Assembly 2026, Vienna, Austria, 3–8 May 2026, EGU26-17227, https://doi.org/10.5194/egusphere-egu26-17227, 2026.

EGU26-17862 | Posters on site | HS2.3.9

Geometric and physical properties of the most persistent litter items in rivers 

Daniel Rebai, James Lofty, Mário J. Franca, and Daniel Valero

Plastic litter in aquatic systems is widely acknowledged as a major environmental concern, yet quantitative information on the physical characteristics of individual litter items - such as their mass, size, and shape - is still scarce. Riverine litter monitoring commonly relies on the River-OSPAR (Oslo–Paris Convention) classification scheme, which defines 109 standardized categories to support harmonized observations and policy development. While this framework offers clear advantages for categorization, it generally reports only item types (e.g. plastic bags) and lacks statistical descriptions of their physical properties. Such quantitative information is essential for multiple applications, including the design of laboratory experiments, the parameterization of numerical models describing litter transport and fate, the optimization of field sampling strategies, and the development of effective clean-up technologies such as racks or retention devices.

Here, we present a meta-analysis of 13 published studies covering 11 rivers on four continents, comprising a total of 240,571 litter items classified using the River-OSPAR index. We use detailed measurements of the longest and intermediate axes (L₁ and L₂) and mass (M) reported for 14,052 items by De Lange (2023), to derive joint probability distributions for these variables for each River-OSPAR category using copula-based statistical methods. These category-specific distributions are combined with observed category frequencies to construct a large synthetic dataset representing global riverine litter characteristics. By introducing assumptions on litter volume and density distributions, we further estimate the smallest axis (L₃), enabling a complete geometric description of individual litter items.

We identify the 25 most persistent litter categories (out of 109) in riverine environments, and we discuss full statistical distributions of L₁, L₂, and L₃, along with derived parameters commonly used in sediment and particle transport modelling, including volume, elongation (L₂/L₁), and flatness (L₃/L₂). All derived distributions are made openly available to support future experimental studies, numerical simulations, and improved monitoring and mitigation strategies for plastic pollution in rivers. This database is the basis for experimental investigation over these 25 most persistent litter categories which we developed at the moment and will be further presented and discussed.

We found that the marginal distribution of flatness peaks at 0.05, whereas the marginal distribution of elongation appears approximately uniform. When considering the joint probability distribution, nearly half of the macrolitter found in riverine environments has longest and intermediate dimensions between 1 and 10 cm and is very flat. Moreover, the ratio of the intermediate to the longest axis can take any value between 0 and 1.

How to cite: Rebai, D., Lofty, J., Franca, M. J., and Valero, D.: Geometric and physical properties of the most persistent litter items in rivers, EGU General Assembly 2026, Vienna, Austria, 3–8 May 2026, EGU26-17862, https://doi.org/10.5194/egusphere-egu26-17862, 2026.

EGU26-18241 | Posters on site | HS2.3.9

Polymer-specific transfer and retention of microplastics at the river–sediment–groundwater interface 

Matthias Munz, Constantin Loui, Marco Pittroff, and Sascha E. Oswald

Microplastic particles (MPs) are ubiquitous contaminants in fluvial systems, yet the processes governing their transport and retention in surface water–groundwater systems remain insufficiently understood. This study emphasizes the combined role of removal along subsurface flow paths from rivers to groundwater, and of lateral river hydrodynamics, in shaping the distribution of MPs in riverbeds.

The spatial distribution of MPs in surface waters, sediment cores, and adjacent groundwater was investigated at two bank filtration sites in north-eastern Germany. The investigations, which took place between October 2022 and March 2024, demonstrate that the accumulation or mobilization of different polymers in riverbed sediments is controlled by a combination of hydrological exchange processes and in-channel hydrodynamics. For instance, ship-induced currents can resuspend particles, thereby preventing their deposition in navigation canals and enhancing their accumulation in riverbanks. While PP and PE dominated surface waters, negatively buoyant polymers such as PET and PVC were enriched in riverbeds and groundwater. PA, although present in surface and groundwater samples, was absent from riverbed sediments, suggesting high subsurface mobility.

This work identifies critical mechanisms controlling the fate of MPs in fluvial systems. It demonstrates that the interface between surface water and groundwater can act as a sink or a conduit, depending on the polymer type. The implications of this phenomenon are significant for the protection of drinking water and the health of freshwater ecosystems, as retention hotspots and transport pathways influence the exposure risk to biota and water resources.

How to cite: Munz, M., Loui, C., Pittroff, M., and Oswald, S. E.: Polymer-specific transfer and retention of microplastics at the river–sediment–groundwater interface, EGU General Assembly 2026, Vienna, Austria, 3–8 May 2026, EGU26-18241, https://doi.org/10.5194/egusphere-egu26-18241, 2026.

EGU26-20053 | ECS | Posters on site | HS2.3.9

Can groundwater geochemistry and contaminants of emerging concern help elucidating microplastic  sources and possible transport pathways?  

Barbara Zambelli Azevedo, Stefan Krause, and Viviana Re

The evidence of microplastics (MPs) in groundwater is still restricted to a few sites worldwide, mostly concentrated in China, South Korea, India, a few European countries, and the USA. Even when field data are presented, they are rarely combined with auxiliary data such as hydrogeological characterisation of the area, description of the well profiles and construction  materials, screen location, water geochemistry, isotopic data, and other contaminants of emerging concern. Because MP pollution is virtually ubiquitous, analysing MPs data by itself can reveal scant information on its possible sources and pathways in the subsurface. This study focuses on the Massaciuccoli Lake Basin (Central Italy), a Ramsar-designated marshy coastal wetland characterised by long-term anthropogenic influence. Over the past century, extensive land reclamation, agricultural intensification, and canalization have altered the natural hydrological regime. Documented land subsidence of approximately 2–3 m over the last 70 years has further modified groundwater gradients and surface–subsurface interactions. The initial step includes building a robust hydrogeological conceptual model of the area, combining landuse, geological background information, stratigraphic profiles, groundwater analysis of major ions and trace elements, water stable isotopes, and contaminants of emerging concern. Secondly, we combine the conceptual model with MP data from five sampling points over two sampling campaigns to help identify MPs sources and pathways in the subsurface environment.  Geologically, the area is characterised as a heterogeneous sequence of marine, transitional, and continental sediments. Stratigraphic logs available for four of the five piezometers indicate an alternation of sand, silt, clay, and peat layers. This stratification promotes both vertical segregation, where low-permeability clay and peat layers restrict downward transport, and lateral compartmentalization, where permeable sandy units act as preferential flow paths. Hydrogeologically, the system is characterized as a shallow unconfined alluvial aquifer with a strong meteoric contribution and direct hydraulic connection to surface waters. Electrical conductivity, major ion chemistry, and the contaminants of emerging concern occurrence patterns indicate that groundwater composition is distinct for each piezometer, suggesting limited lateral mixing and emphasizing localized flow systems. Despite this spatial variability, hydrochemical parameters show only minor temporal variation between sampling campaigns, indicating hydrological stability at the seasonal scale. The combination of stratigraphic heterogeneity and stable flow conditions suggests that MPs detected at individual piezometers are more likely to reflect local sources and short-range transport, rather than basin-scale homogenization. Consequently, MPs are expected to exhibit site-specific distributions, with transport dominated by near-surface flow paths and attenuation occurring through physical retention at lithological boundaries.

How to cite: Zambelli Azevedo, B., Krause, S., and Re, V.: Can groundwater geochemistry and contaminants of emerging concern help elucidating microplastic  sources and possible transport pathways? , EGU General Assembly 2026, Vienna, Austria, 3–8 May 2026, EGU26-20053, https://doi.org/10.5194/egusphere-egu26-20053, 2026.

EGU26-20390 | ECS | Orals | HS2.3.9

Microplastic retention during a flood event by floodplain vegetation and their infiltration into the Rhine floodplain soil  

Markus Rolf, Hannes Laermanns, Lennart Echstenkämper, Pauline Seidel, Marie Gröbner, Svenja Riedesel, Rizwan Khaleel, Martin Wilhelm Dowe, Lukas Holler, Florian Pohl, Heike Feldhaar, Christian Laforsch, Martin G. J. Löder, and Christina Bogner

Floodplains are recognized as significant sinks for sediments and pollutants transported by rivers, particularly during flood events which mobilize and redistribute contaminants like microplastics (MPs). This study investigates the role of floodplain vegetation and rough surfaces in the retention of microplastics and fine sediments during overbank flow, and the subsequent fate of these particles within the soil profile.

The research combined column experiments and field observations to quantify particle deposition. We found that vegetation characteristics are a primary driver for the retention of suspended particles. Specifically, plant biomass and structural diversity were positively correlated with the amount of sediment deposited on the vegetation surface. This suggests that denser and more structurally complex vegetation enhances the capture of both sediments and microplastics from the water column. To differentiate the effects of biological surfaces from purely physical ones, deposition on vegetation was compared with deposition on metal sheets of varying surface areas. The deposition results potentially reveal the impact of surface areas and roughness on microplastic retention.

Following the initial retention process, microplastics can infiltrate into the floodplain soil. The analysis of flood simulated soil column experiments confirm a heterogenous and rapid microplastic breakthrough. Additionally, under field conditions soil profiles confirms that floodplains act as major sinks, with the highest concentrations of MPs found in the upper 38-45 cm of soil depth. However, MPs are not permanently sequestered at the surface. The vertical distribution of microplastics is influenced by particle characteristics such as size and shape and soil properties. Smaller, spherical particles tend to infiltrate deeper into the soil compared to larger fragments and fibers. This downward translocation can be facilitated by processes such as preferential flow through soil structure and biopores.

In conclusion, floodplain vegetation plays a critical role in intercepting microplastics during floods, initiating their transfer from the aquatic to the terrestrial environment. The retention efficiency is closely linked to vegetation biomass and structure. Our findings highlight that vegetation structure is one factor for MP sedimentation from flooding, while soil structure and biopores control infiltration and vertical transport of MP into the soil matrix. Subsequent infiltration and distribution in the soil profile are governed by a complex interplay between MP particle traits, soil texture, and biological activity. These findings highlight the importance of floodings, vegetation cover, soil structure in the transport of microplastics at the interface of aquatic and terrestrial ecosystems.

How to cite: Rolf, M., Laermanns, H., Echstenkämper, L., Seidel, P., Gröbner, M., Riedesel, S., Khaleel, R., Dowe, M. W., Holler, L., Pohl, F., Feldhaar, H., Laforsch, C., Löder, M. G. J., and Bogner, C.: Microplastic retention during a flood event by floodplain vegetation and their infiltration into the Rhine floodplain soil , EGU General Assembly 2026, Vienna, Austria, 3–8 May 2026, EGU26-20390, https://doi.org/10.5194/egusphere-egu26-20390, 2026.

EGU26-20560 | ECS | Orals | HS2.3.9 | Highlight

Navigation-Induced Turbulence as a Driver of Plastic Fragmentation 

Stephanie Oswald, Niels van Lierop, and Frank P. L. Collas

Globally, plastic pollution in aquatic environments has been considered one of the major contemporary environmental concerns. In recent years, an increasing number of studies reported environmental consequences and concentrations of plastic particles in freshwater systems. The observed abundance of plastic particles in ecosystems may be influenced by factors such as the properties of plastic, including size and shape. Plastic items can be differentiated according to their size range and therefore identified by adopting the prefixes macro (> 25 mm), meso (> 5 mm < 25 mm), and micro (< 5 mm). Once large plastics accumulate in the natural environment, they are subject to multiple weathering processes that drive fragmentation and degradation. Plastic items suspended in the water column may be exposed to the strong hydrodynamic forces generated by vessel motion, for instance, turbulent water flow created by the propellers as the vessel moves through the water. Facing that, this study experimentally quantifies the forces needed to fragment plastic items collected in the Rhine River, subsequently, it assesses the likelihood of drag forces exerted by the propeller jet of moving vessels as causes of plastic fragmentation. By examining the forces applied to different categories of plastic items, valuable insights will be gained on the mechanical fragmentation of plastics in a highly navigated river, contributing to better predictions of the spread and transport of plastic items and their risks to wildlife and humans. Among the observed categories, “Plastic film 2.5–50 cm (soft)” exhibited the lowest median force to break compared to all other categories (3.8N), being more susceptible to fragmentation under high jet-induced velocities generated by vessels, showing consistently higher breakage probabilities, exceeding 50% at velocities ≥ 5 m.s⁻¹ and reaching values up to ~80% at 10 m.s⁻¹. On the contrary, the top three categories that exhibited the highest resistance to breaking, with high median values, corresponded to “Plastic cups” (14.09N), “ Sanitary/ wet wipes” (11.24N), and “ Plastic cotton swabs” (11.08N).

How to cite: Oswald, S., van Lierop, N., and P. L. Collas, F.: Navigation-Induced Turbulence as a Driver of Plastic Fragmentation, EGU General Assembly 2026, Vienna, Austria, 3–8 May 2026, EGU26-20560, https://doi.org/10.5194/egusphere-egu26-20560, 2026.

EGU26-21911 | ECS | Posters on site | HS2.3.9

Submesoscale cyclone in the Mediterranean Sea concentrates anthropogenic microfibers 

Giuseppe Suaria, Giovanni Testa, Andrea Paluselli, Salomé La Ragione, Michela Gambale, Maristella Berta, Lorena A Rivera, Amala Mahadevan, Leo Middleton, Francesco M. Falcieri, Stefano Aliani, and Annalisa Griffa

Cyclonic eddies are ubiquitous in the upper ocean, linking large-scale balanced dynamics and smaller-scale unbalanced turbulence. While their role in enhancing primary productivity through nutrient upwelling is well-documented, their impact on the transport and accumulation of anthropogenic pollutants remains poorly understood. Using high-resolution data collected across a submesoscale cyclone in the Western Mediterranean Sea, we reveal that such eddies are fundamentally important in shaping the distribution of man-made contaminants. Our results show a substantial subsurface accumulation of textile microfibers within the cyclone (0.34 MF l⁻¹) compared to surrounding waters (0.09 MF l⁻¹), with this accumulation persisting even after eddysplitting. Concurrently, nutrient upwelling within the cyclone drives a marked increase in chlorophyll-a concentrations in the upper 40 m (0.44 and 0.15 mg m-3 inside and outside, respectively), indicating a coupling between physical and biogeochemical processes. We discuss potential mechanisms, including vertical circulation and mixing dynamics, that may explain the observed patterns. This study highlights the importance of submesoscale processes in shaping the distribution of anthropogenic pollutants, with significant implications for marine ecosystem healthand survey designs.

How to cite: Suaria, G., Testa, G., Paluselli, A., La Ragione, S., Gambale, M., Berta, M., A Rivera, L., Mahadevan, A., Middleton, L., Falcieri, F. M., Aliani, S., and Griffa, A.: Submesoscale cyclone in the Mediterranean Sea concentrates anthropogenic microfibers, EGU General Assembly 2026, Vienna, Austria, 3–8 May 2026, EGU26-21911, https://doi.org/10.5194/egusphere-egu26-21911, 2026.

Flood forecasting in small mountainous catchments is challenging due to strong nonlinearity in runoff generation and short hydrological response times, which are often inadequately represented by conceptual models. The Xin’anjiang (XAJ) model, although widely applied, relies on simplified process representations that limit its ability to capture complex flood dynamics. In contrast, data-driven approaches such as Long Short-Term Memory (LSTM) networks offer high predictive flexibility but suffer from limited physical interpretability. To bridge this gap, we propose an interpretable physics–data hybrid framework (XAJ–LSTM), in which an LSTM network dynamically corrects residuals from the XAJ model while explicitly incorporating physically meaningful state variables. Model interpretability is enhanced using SHapley Additive exPlanations (SHAP), which quantify the contribution of different inputs to flood predictions. The framework is evaluated using 15 flood events observed between 2015 and 2018 in the Qiaodong Village catchment, a representative small mountainous basin in China. The results indicate that the XAJ–LSTM hybrid model significantly outperforms the standalone physical model, improving the Nash–Sutcliffe Efficiency (NSE) from 0.55 to 0.77 and effectively correcting peak flow errors. Moreover, the integration of physical state variables, particularly soil moisture, is crucial for improving predictive accuracy, whereas adding redundant runoff components introduces noise and degrades model performance. SHAP analysis further confirms that antecedent observed discharge and XAJ-simulated discharge are the dominant drivers of the LSTM-based correction. Overall, this hybrid framework improves flood forecasting accuracy while enhancing interpretability, offering a promising approach for physically informed modeling in nonlinear, data-limited catchments.

How to cite: Zhang, X., Cui, C., and Wang, G.: A Physics–Data Hybrid Xin’anjiang Flood Forecasting Model Based on LSTM Residual Correction and SHAP Interpretability, EGU General Assembly 2026, Vienna, Austria, 3–8 May 2026, EGU26-4666, https://doi.org/10.5194/egusphere-egu26-4666, 2026.

Traditional hydrological models have been widely applied to flood simulation across the globe, yet the accurate simulation of peak discharge remains a long-standing shortcoming of these models. Taking the upper reaches of the Dongjiang River and Beijiang River in South China as the study area, this study employed the Variable Infiltration Capacity (VIC) model to capture the peak discharge during flood events. The simulation period was divided into a calibration period (2011–2014) and a validation period 1 (2008–2010) before vegetation changes, as well as a validation period 2 (2015–2020) after vegetation changes. The results demonstrated that the VIC model exhibited good applicability in both the upper Dongjiang River and upper Beijiang River basins. For the upper Beijiang River basin, the Nash-Sutcliffe Efficiency (NSE) and Kling-Gupta Efficiency (KGE) values were both above 0.6 during the calibration period, while these values were close to 0.6 in both validation periods 1 and 2. However, the model consistently underestimated the peak discharge in all periods. To address this limitation, a machine learning approach was introduced by coupling the VIC model with the Bidirectional Long Short-Term Memory (Bi-LSTM) network. Specifically, the soil moisture content, grid-scale runoff simulated by the VIC model, and precipitation data were used as training inputs for the Bi-LSTM model. Meanwhile, the standalone VIC model and pure Bi-LSTM model were set as control groups for comparison. The results indicated that the coupled VIC-Bi-LSTM model outperformed the control groups in capturing both the runoff process and peak discharge in the two basins. During the calibration period, the NSE values of the coupled model reached 0.9, and remained above 0.7 in both validation periods. In addition, scenarios before and after vegetation changes were designed to analyze the performance of the VIC model in simulating runoff under varying underlying surface conditions. The results revealed that the VIC model could effectively capture the impacts of vegetation changes on runoff, with the NSE value in validation period 2 (post-vegetation change scenario) being close to that in validation period 1. Moreover, the coupling with Bi-LSTM enabled more precise simulation of runoff in the upper Dongjiang and Beijiang Rivers under the scenario of altered vegetation cover.

How to cite: Han, G., He, Z., and Sun, H.: Coupling Machine Learning with Physical Models to Improve Peak Flood Simulation under Vegetation and Rainstorm Variability, EGU General Assembly 2026, Vienna, Austria, 3–8 May 2026, EGU26-7108, https://doi.org/10.5194/egusphere-egu26-7108, 2026.

Transit time to baseflow refers to the amount of time between when a water parcel enters a catchment as precipitation and when it exits the system via discharge. It is a key concept that links climate variability, hydrological transport, and biogeochemical processes, with broad implications for both surface water and groundwater quality, resource sustainability, and vulnerability to climate change impacts. Transit time distributions can be inferred from spatially resolved time-series measurements of environmental tracer concentrations, but such observations are typically available only in a limited number of locations such as highly instrumented catchments. Across large regions, physically based numerical models have been shown to accurately describe transit time distributions when compared to tracer data, but these models often require extensive computational resources.

In this study, we examine machine learning approaches for efficient prediction of transit time, specifically investigating their spatial transferability across multiple large domains. We employ a continental scale physically based hydrologic model coupled with Lagrangian particle tracking to quantify transit time to baseflow metrics in four large river basins in the conterminous USA: Upper Colorado (290,000 sq km), Missouri (1,350,000 sq km), Upper Mississippi (490,000 sq km), and Ohio (420,000 sq km). We use results from the physically based model to train machine learning metamodels for predicting transit time metrics with multiple spatial aggregation units, with input predictors describing topography, climate, and geology. Functional input-output relationships learned by metamodels are assessed using model-agnostic explainability techniques and evaluated against theoretical physically based relationships. Spatial cross-validation frameworks are used to evaluate cross-domain predictive accuracy and characterize the influence of input data quantity and distribution similarity between training and target regions. Results from the analysis help elucidate the potential utility and limitations of machine learning metamodels for computationally efficient prediction of transit time metrics in data scarce regions.

How to cite: Soriano, M. and Maxwell, R.: Large-domain transferability of machine learning metamodels for predicting water transit time to baseflow, EGU General Assembly 2026, Vienna, Austria, 3–8 May 2026, EGU26-12440, https://doi.org/10.5194/egusphere-egu26-12440, 2026.

EGU26-16160 | ECS | Posters on site | HS2.3.10

Simulating fecal coliform dynamics at the watershed scale using a modified SWAT model and surrogate model 

Minjeong Cho, Minhyuk Jeung, Daeun Yun, Jiye Park, Gihun Bang, and Sang-Soo Baek

Fecal coliform bacteria are widely used as an indicator of fecal contamination and associated human-health risk in water. This study simulated fecal coliform dynamics in the Bonghwang River using the Soil and Water Assessment Tool (SWAT). The SWAT bacteria subroutine, which considers in-stream bacteria die-off only, was modified to include solar radiation-associated die-off and concurrent growth and die-off within streambed sediments. To address the computational burden of SWAT, a surrogate model was developed using outputs from the modified SWAT model. The surrogate model enabled rapid watershed-scale prediction of fecal contamination by simplifying computations while preserving the predictive accuracy of SWAT. Sensitivity analysis demonstrated that solar radiation is one of the most significant fate factors of fecal coliform. The modified SWAT model improved watershed-scale estimates of bacterial concentrations, while the surrogate model enabled efficient prediction and analysis across the watershed. Overall, this approach provides predictive and reliable information on fecal contamination and can support effective watershed management.

How to cite: Cho, M., Jeung, M., Yun, D., Park, J., Bang, G., and Baek, S.-S.: Simulating fecal coliform dynamics at the watershed scale using a modified SWAT model and surrogate model, EGU General Assembly 2026, Vienna, Austria, 3–8 May 2026, EGU26-16160, https://doi.org/10.5194/egusphere-egu26-16160, 2026.

EGU26-16166 | ECS | Posters on site | HS2.3.10

Development of Simulation System for Water Quality Accident using Deep Learning and Visualization Through Augmented Reality 

Gihun Bang, Minjeong Cho, Jiye Park, Daeun Yun, Minhyuk Jeung, Soobin Kim, and Sang-Soo Baek

With the advancement of industrialization, the number and quantity of hazardous chemical substances being released into the environment continue to increase. Currently, over 40,000 chemical substances are available for use in South Korea, with approximately 400 new chemicals imported and distributed annually. Among these, hazardous substances such as heavy metals and pesticides, when introduced into water systems through industrial activities, agricultural runoff, or accidental spills, pose significant risks to both environmental and human health. These substances are associated with various diseases, carcinogenic risks, and endocrine disruption, necessitating proactive management strategies. Existing water quality monitoring systems primarily function as reactive measures, focusing on incident detection rather than prevention. Although real-time monitoring methods can detect anomalies, they are limited in accurately predicting the transport pathways and concentration variations of hazardous chemicals. Moreover, environmental factors such as flow velocity, precipitation, and temperature significantly impact the dispersion process, which current monitoring approaches fail to adequately incorporate. To overcome these limitations, this study aims to develop a predictive system leveraging deep learning techniques for water pollution incident simulation and forecasting. This model integrates existing hydrodynamic and water quality models (e.g., EFDC, MIKE) with data-driven approaches to enhance predictive accuracy. Additionally, an augmented reality (AR)-based visualization system will be implemented to intuitively display pollutant dispersion and high-risk areas during water pollution incidents. AR devices such as HoloLens will be utilized to provide decision-makers, including environmental management agencies and local governments, with real-time analytical capabilities for rapid response. Furthermore, the system is designed to transition from reactive to preventive response strategies. By applying advanced algorithms, the system will automatically recommend priority response areas for emergency discharges and pollution containment measures. This study aims to enhance response capabilities to increasing water pollution incidents both domestically and internationally. By minimizing environmental and health impacts caused by hazardous chemicals, the proposed system is expected to contribute significantly to public safety. Furthermore, the integration of deep learning and augmented reality technologies represents a substantial advancement in environmental monitoring and predictive modeling.

How to cite: Bang, G., Cho, M., Park, J., Yun, D., Jeung, M., Kim, S., and Baek, S.-S.: Development of Simulation System for Water Quality Accident using Deep Learning and Visualization Through Augmented Reality, EGU General Assembly 2026, Vienna, Austria, 3–8 May 2026, EGU26-16166, https://doi.org/10.5194/egusphere-egu26-16166, 2026.

Climate change is increasing hydro-climatic variability and amplifying water quality risks, posing major challenges for operating large-scale inter-basin water transfer projects. Operators must make real-time decisions while accounting for multiple source waters that exhibit distinct and nonstationary quality characteristics, alongside persistent limitations of process-based models and data scarcity in upstream boundary conditions. To address these challenges, we propose a three-tier hybrid modeling framework that integrates machine learning (ML), process-based hydrodynamic–water quality simulation, and multi-objective optimization to enable coordinated regulation of water quantity and quality in the extended Eastern Route of the South-to-North Water Diversion Project (SNWD).

The framework is driven by continuous observations from monitoring stations distributed along the project route and is implemented as a three-level modeling cascade. Level 1 develops ML-based upstream boundary prediction models using Long Short-Term Memory (LSTM) networks to produce 7-day-ahead forecasts of key water quality variables for heterogeneous source waters (Yellow River water, diversion water, and local water). Forecast targets include CODMn (permanganate index), NH₃–N, total nitrogen (TN), total phosphorus (TP), and dissolved oxygen (DO), while pH is treated as a compliance constraint. This anticipatory component mitigates data scarcity and captures nonlinear inflow dynamics, providing actionable boundary conditions for downstream assessment. Level 2 constructs a mechanism–data fusion module that couples process-based hydrodynamic and water quality models with ML-based corrections informed by real-time monitoring. By assimilating monitoring observations together with future engineering operation plans and diversion demand assessments, the module simulates transport, mixing, and water quality evolution along the transfer route. Level 3 applies multi-objective optimization to generate rolling diversion schedules that balance water supply reliability against pollution risk under climate-stress scenarios. The optimizer outputs updated, implementable schedules as new data and near-term plans become available, supporting operational water management.

A spatio-temporal decoupling strategy is further introduced to separate source-specific variability from in-route transport processes, enabling interpretable attribution of observed water quality changes to different sources and facilitating targeted regulation across critical segments. Operational deployment demonstrates enhanced decision support: the 7-day predictive lead time enables proactive coordination of multi-source diversions, and the optimized rolling regulation reduces concentrations of the regulated indicators (CODMn, NH₃–N, TN, and TP) by approximately 9% while improving Water Quality Index (WQI) scores by about 11% at the critical control section DiSanDian. The proposed hybrid framework provides a scalable and transferable pathway for integrating AI with process-based understanding to improve water quality simulation and real-time management, contributing to climate adaptation and resilience strategies for complex water infrastructure systems.

How to cite: Wang, W., Dong, F., Liu, X., and Peng, W.: From Forecasting to Rolling Optimization: Real-Time Hybrid Modeling for Water Quantity–Quality Regulation in the SNWD Extended Eastern Route, EGU General Assembly 2026, Vienna, Austria, 3–8 May 2026, EGU26-16441, https://doi.org/10.5194/egusphere-egu26-16441, 2026.

EGU26-16503 | ECS | Posters on site | HS2.3.10

Robust Ordinal Algal Alert Prediction Framework Integrating Heterogeneous Spatio-temporal Data and Dual Cross-Validation 

Seungmin Lee, Hoyong Lee, Seonuk Baek, Imee V. Necesito, and Soojun Kim

Harmful Algal Blooms (HABs) pose a significant threat to freshwater ecosystems and public health globally, necessitating reliable early warning systems for effective water resource management. This study presents an end-to-end AI framework designed to predict 4-level ordinal algal alerts in South Korea by systematically integrating heterogeneous spatio-temporal environmental datasets, including GIS-based spatial features, water quality, meteorological, and hydrological data. Our methodological approach involves: (1) extracting spatial features via GIS; (2) optimizing time-lags and interpolating time-series data based on Spearman correlation; and (3) performing ordinal classification using a LightGBM (LGBM) model. To address the ordinal nature of algal alerts, the model was optimized using Optuna with the Quadratic Weighted Kappa (QWK) metric. A rigorous Dual Cross-Validation (CV) framework was employed to assess generalization capabilities: Year-over-Year (YoY) CV with an Embargo technique was used to evaluate temporal performance while preventing data leakage, and Leave-One-Station-Out (LOSO) CV was applied to validate spatial generalization for unobserved locations. Additionally, Isotonic Regression was implemented for probability calibration to enhance the reliability of the predicted outputs. By effectively controlling spatio-temporal information leakage, this study demonstrates superior predictive performance across unobserved timeframes and locations, providing a robust decision-support tool for practical water quality management.

How to cite: Lee, S., Lee, H., Baek, S., Necesito, I. V., and Kim, S.: Robust Ordinal Algal Alert Prediction Framework Integrating Heterogeneous Spatio-temporal Data and Dual Cross-Validation, EGU General Assembly 2026, Vienna, Austria, 3–8 May 2026, EGU26-16503, https://doi.org/10.5194/egusphere-egu26-16503, 2026.

Accurate prediction of nitrate‑nitrogen (NO₃‑N) and total phosphorus (TP) loads is critical for managing water quality in agricultural watersheds, where excess nutrient runoff can contribute to downstream eutrophication. This study applies Random Forest (RF) regression and conditional inference RF to predict monthly NO₃‑N and TP loads at eight monitoring gages within Conservation Reserve Enhancement Program (CREP) watersheds in the Illinois River and Kaskaskia River basins. The machine learning (ML) models were trained using hydroclimatic, land‑use, and nutrient datasets from 2000–2022 and validated with 2023 observations.
The predictor variables included discharge, precipitation, temperature, land use, total Kjeldahl nitrogen (TKN), suspended sediment, and septic system density in the watersheds. Multiple modeling strategies were evaluated, including full‑feature, reduced‑feature (i.e., derived through importance thresholds or removal of collinear nutrient variables), and hyperparameter‑tuned configurations. Model performance was assessed using Nash–Sutcliffe Efficiency (NSE), R², and RMSE, and interpretability was evaluated through feature‑importance metrics and SHAP analyses.
Monthly Random Forest models effectively captured seasonal nutrient dynamics. Discharge consistently emerged as the dominant predictor of NO₃‑N loads, while interactions among variables, particularly TKN and suspended sediment, played major roles in predicting TP. Land use and septic system density exhibited limited predictive influence. Model performance was strong across configurations, with training NSE values exceeding 0.95 and validation NSE frequently above 0.9. However, reduced skill during summer and fall suggested the influence of unrepresented processes such as evapotranspiration. The most stable performance across sites and seasons was achieved with hyperparameter‑tuned, full‑feature models. SHAP analyses revealed clear linkages between hydrologic and biogeochemical processes, while Spearman correlation heatmaps highlighted strong covariation among nutrient loads and moderate coupling with climatic variables.
These results demonstrate the value of machine‑learning approaches such as RF as complementary alternatives to process‑based models like SWAT, offering robust tools for informing nutrient‑reduction strategies and supporting policy decisions in impaired agricultural watersheds.

How to cite: Getahun, E. and Kharosekar, R.: Data‑Driven Modeling of Nutrient Dynamics: Random Forest Predictions of Nitrate and Total Phosphorus Loads in Illinois, EGU General Assembly 2026, Vienna, Austria, 3–8 May 2026, EGU26-16874, https://doi.org/10.5194/egusphere-egu26-16874, 2026.

HS2.4 – Hydrologic variability and change at multiple scales

EGU26-392 | PICO | HS2.4.1

Seasonal redistribution of Forest Evapotranspiration Under Climate Change in Central Germany 

Thanh Thi Luong, Ivan Vorobevskii, Rico Kronenberg, and Matthias Mauder

Forest ecosystems are increasingly exposed to climate-driven shifts in water availability, yet the underlying changes in evapotranspiration (ET) processes remain poorly quantified at landscape scale. Building on a recently established operational soil-moisture monitoring framework for Central German forests (https://life.hydro.tu-dresden.de/BoFeAm/dist_bfa/index.html), we combine long-term observations and climate projections with process-based modeling to examine how climate change affects both the magnitude and the component structure of actual ET. Using the LWF-BROOK90 model, we quantify transpiration, rain and snow interception evaporation, and soil and snowpack evaporation across more than 3,000 forest sites in Central Germany. The model was driven by homogenized historical climate data (1961–2020) and an ensemble of 21 CMIP5 regional climate projections (2021–2100), covering major Central European tree species: Norway spruce (Picea abies), Scots pine (Pinus sylvestris), European beech (Fagus sylvatica), and pedunculate oak (Quercus robur).

Our results show a clear seasonal redistribution and shift of the forest water balance. Springs are projected to become wetter and more evaporative, supporting increased early-season transpiration. In contrast, summers exhibit strong declines in precipitation and reduced ET, accompanied by a substantial rise in soil-moisture stress days (REW < 0.4), particularly in upland conifer forests. Annual ET increases slightly due to higher winter rain interception, driven by a shift from snowfall to rainfall, most notably in Norway spruce. However, these annual increases hide growing summer water limitations, as higher evaporative demand exceeds declining soil-water supply.

By resolving individual ET components, this study highlights how changing climatic conditions propagate through canopy processes, soil moisture dynamics, and species-specific water use. The findings support assessments of forest resilience, help identify drought-tolerant species, and inform expectations of ecohydrological feedbacks in temperate agroforestry landscapes. Looking ahead, our combined monitoring–modeling framework is transferable to other regions where long-term climate data and stand-level information on vegetation and soils are available, supporting improved characterization of water and carbon cycle responses under future climate conditions.

How to cite: Luong, T. T., Vorobevskii, I., Kronenberg, R., and Mauder, M.: Seasonal redistribution of Forest Evapotranspiration Under Climate Change in Central Germany, EGU General Assembly 2026, Vienna, Austria, 3–8 May 2026, EGU26-392, https://doi.org/10.5194/egusphere-egu26-392, 2026.

EGU26-2725 | ECS | PICO | HS2.4.1

Edge effects on evapotranspiration from tropical forest fragments  

Alejandra Valdés-Uribe and Dirk Hölscher

Evapotranspiration (ET) is a key component of forest ecohydrological functioning and land–atmosphere coupling in tropical regions. In fragmented landscapes, forest edges may strongly influence the spatial variability of ET and microclimate, yet this aspect remains insufficiently studied. Here, we examine wet-season ET patterns across 83 forest fragments in western Ecuador using ECOSTRESS satellite observations. A changepoint analysis showed that the frequency of ET shifts increased toward fragment edges, with 61% of cases displaying higher ET near edges. A random forest model with target-oriented cross-validation achieved a spatial prediction accuracy of 64%, identifying elevation, aridity, and distance to edge as the most important predictors. SHAP analysis further emphasized the role of edge effects, revealing greater ET rates near edges, particularly at mid-elevations and in areas with high canopy cover. These patterns likely arise from a combination of climatic conditions, forest structure, edge orientation, and surrounding land-use types in this human-modified landscape. The high spatial variability observed at edges underscores the need to better integrate edge processes into forest hydrology and land–atmosphere models. Our findings suggest that forest edges can locally enhance ET under wet conditions, thereby contributing to microclimatic and hydroclimatic regulation. While this does not substitute for the broader climate function of intact, continuous forest, small remnant fragments may still play a meaningful role in sustaining local hydrological processes in fragmented tropical landscapes.

How to cite: Valdés-Uribe, A. and Hölscher, D.: Edge effects on evapotranspiration from tropical forest fragments , EGU General Assembly 2026, Vienna, Austria, 3–8 May 2026, EGU26-2725, https://doi.org/10.5194/egusphere-egu26-2725, 2026.

EGU26-3105 | ECS | PICO | HS2.4.1

Long-Term Monitoring of Soil and Deadwood Water Content Across Windthrow Post-Disturbance Scenarios 

Paul Richter, Maximilian Behringer, Christian Scheidl, Barbara Kitzler, Tommaso Baggio, and Emanuele Lingua

Deadwood is a substantial part of a healthy forest ecosystem. Natural disturbances such as windthrow can generate large amounts of deadwood and alter forest structure, with cascading effects on ecosystem processes. To study the effect of its biological legacies on soil water retention and the microclimate is of particular interest to support future guidelines and decisions for management (forest regeneration, potential fuel load and fire susceptibility) in post-disturbance scenarios. This also includes an improved understanding of the water storage capacities and responses to precipitation of deadwood across different decay stages. Additionally, deadwood mitigates natural hazards by modulating soil water storage, thereby influencing runoff and flood peaks. Post-disturbance roughness from logs, litter, and root mats can curb erosion, shallow landslides, rockfall, and avalanches; quantifying these effects is key for integrated hazard protection.

In this case study, we take advantage of three adjacent sites (all within a radius of 1 km), ensuring comparable stand history and climatic conditions. The sites include a cleared windthrow area; a windthrow area with unaltered deadwood cover; and an intact mature forest stand. We continuously monitor soil water content across all sites, and additionally measure the water content of a representative log within the uncleared windthrow area. Using TDR sensors (Teros 10, METER Group, Pullman, WA, USA), we track long-term volumetric water content in both soil and deadwood. Soil moisture is measured at one profile per site at 10, 20, and 50 cm depth. To capture spatial variability, two additional TDR sensors were installed near each soil profile at 10 cm depth, complemented by four independently operating TDT sensors (TMS cable, TOMST s.r.o., Prague, Czech Republic) placed at greater distances. To improve the accuracy of deadwood measurements, we established a specific calibration for different decay classes. Precipitation and air temperature are recorded by a stationary weather station located in the cleared windthrow area. High-resolution UAV LiDAR flights provide the basis for analyzing the influence of micro-topography and surface roughness on water storage and deadwood volume along the slope.

How to cite: Richter, P., Behringer, M., Scheidl, C., Kitzler, B., Baggio, T., and Lingua, E.: Long-Term Monitoring of Soil and Deadwood Water Content Across Windthrow Post-Disturbance Scenarios, EGU General Assembly 2026, Vienna, Austria, 3–8 May 2026, EGU26-3105, https://doi.org/10.5194/egusphere-egu26-3105, 2026.

EGU26-5709 | ECS | PICO | HS2.4.1

Effects of Advance Regeneration and Deadwood Retention on Forest Hydrometeorology after Disturbance 

Daniel Svanidze, Wolfgang A. Obermeier, Lukas W. Lehnert, and Ralf Ludwig

Climate change, including an increasing frequency and intensity of disturbances, is progressively threatening the resilience and productivity of forests. In the same time, the demand for ecosystem services provided by forests, such as carbon sequestration, water purification or habitat provision, is steadily increasing. To develop strategies to better cope with this pressure on forests, the LabForest project, funded by the German Federal Ministry of Research, Technology and Space (BMFTR), investigates the effectiveness and efficiency of silvicultural measures in relation with calamities within a living lab in a forest of the Ludwig-Maximilians-University in southern Germany.

Within the LabForest project, two replications of a two factorial experimental design are established on a 1 km2 area. The first factor compares plots with and without advance regeneration (before the calamity), and the second factor compares the post calamity treatment with fully cleared sites versus sites, were all dead wood was gouged and kept on site. This setup includes eight 0.25 ha experimental plots equipped with an extensive measurement network to assess hydrometeorological differences between forest management strategies.

During the first growing season following the disturbance, microclimatic measurements reveal lower mean and maximum soil temperatures at -6 cm depth and reduced diurnal temperature amplitudes at uncleared and gouged compared to cleared sites. These differences diminish above the ground (+2 cm) and are negligible at +15 cm height. Advanced regeneration had a weaker influence on soil and near-ground temperatures than complete clearing. Furthermore, differences in soil moisture patterns and evapotranspiration rates were observed.

The improved understanding of hydrological and micrometeorological conditions associated with the investigated forest management strategies, enables recommendations for establishing economically and ecologically resilient forests to cope with the increasing pressure on forests by anticipated climatic changes and societal demands.

How to cite: Svanidze, D., Obermeier, W. A., Lehnert, L. W., and Ludwig, R.: Effects of Advance Regeneration and Deadwood Retention on Forest Hydrometeorology after Disturbance, EGU General Assembly 2026, Vienna, Austria, 3–8 May 2026, EGU26-5709, https://doi.org/10.5194/egusphere-egu26-5709, 2026.

EGU26-6795 | PICO | HS2.4.1

From Snow to Rain: Declining Snowpack, Earlier Dryness, and Changes to Fire Risk in the Oregon Cascades 

Julian Klaus, Hannah Lilian Kupfer, Lutz Klein, and Catalina Segura

Globally, many mountain catchments transition from snow-dominated to rain-dominated behavior, which raises the question on how drought and wildfire regimes may be altered by these shifts. In 2023, the Lookout Fire burnt about two thirds of the H. J. Andrews Experimental Forest (HJA) in the Oregon Cascades and motivated a range of hydrological studies. Here, we evaluate how future changes to temperature and precipitation patterns, especially shifts from snow to rain, alter hydrological storages and fluxes across (nested) sub-catchments of the HJA.

To evaluate this, we rely on the conceptual hydrological model HBV-light and regional climate projections. We analyzed five catchments within HJA with differences in elevation. Hydrological changes were simulated under RCP 4.5 and RCP 8.5 emission scenarios for the near future (2021–2050) and far future (2071–2100) and compared against observations. Projections for 2071–2100 under RCP 8.5 indicate a strong temperature increase, resulting in a near-total loss (98–100%) of maximum snow water equivalent (SWE) in the study catchments. While winter precipitation is projected to increase by 30%, summer precipitation will decrease by up to 34%. This seasonal redistribution leads to significantly higher winter runoff but exacerbates summer deficits in soil moisture, groundwater, and streamflow.

These changes pose two interconnected challenges for mountain catchments. First, the pronounced shift toward earlier snowmelt and increased winter runoff substantially reduces streamflow and hydrological storages in summer, advancing the onset and prolonging the duration of seasonal dryness. Second, the earlier depletion of soil moisture and groundwater amplifies the spatial and temporal extent of high forest fire risk, enabling fires to occur earlier in the year, to affect larger areas, and to spread into or to start more likely at higher elevations. These patterns are consistent with recent observations of earlier wildfire occurrence and larger burnt areas in the Pacific Northwest. Our findings highlight that snow-to-rain transitions fundamentally alter water availability and disturbance by wildfire in mountain catchments, with implications that likely extend to many temperate mountain regions worldwide.

How to cite: Klaus, J., Kupfer, H. L., Klein, L., and Segura, C.: From Snow to Rain: Declining Snowpack, Earlier Dryness, and Changes to Fire Risk in the Oregon Cascades, EGU General Assembly 2026, Vienna, Austria, 3–8 May 2026, EGU26-6795, https://doi.org/10.5194/egusphere-egu26-6795, 2026.

EGU26-9239 | ECS | PICO | HS2.4.1

Effects of wildfire on stream baseflow sources in varyingly burned forested watersheds 

Lutz Klein, Catalina Segura, and Julian Klaus

Wildfires are among the most transformative disturbances in forested catchments, with profound effects on post-fire water quantity and quality. The severity and extent of wildfires has grown over the past decades raising concerns over their impact on streamflow and water resources. Wildfires affect streamflow through multiple mechanisms, yet their individual effects are highly specific to pre-fire catchment characteristics. In 2023, the Lookout Creek catchment in the H.J. Andrews Experimental Forest (Oregon, USA) was affected by the Lookout Fire, which burned 70 % of the catchment at varying severity. Building on three pre-fire synoptic campaigns (2022–2023), we conducted two post-fire campaigns in 2025, collecting stable water isotope samples along twelve streams spanning unburned to severely burned watersheds. We combine end-member mixing analysis with Spatial Stream Network models to (i) quantify changes in baseflow source contributions after the fire and (ii) identify the landscape controls that govern spatial patterns in streamwater isotopes.

We model campaign-to-campaign isotopic differences to isolate fire-related shifts while accounting for network structure and flow-connected spatial dependence. Additionally, we fit models separately within each campaign to test whether the strength and direction of landscape–isotope relationships have changed through time. Explanatory factors include soil burn severity and vegetation mortality, alongside geomorphic and geologic descriptors that function as proxies for storage and connectivity.

We hypothesize that (i) burn severity and fire-induced vegetation mortality modify flow-generating processes in ways that are detectable as systematic shifts in streamwater isotope composition; and (ii) sub-catchments with greater effective storage and longer flow pathways are more resilient, exhibiting muted isotopic change due to buffering and longer lag times. The anticipated outcome is a process-based assessment of where and why baseflow sources shift after wildfire, and a set of transferable indicators to identify catchments most vulnerable to post-fire alterations in water supply.

How to cite: Klein, L., Segura, C., and Klaus, J.: Effects of wildfire on stream baseflow sources in varyingly burned forested watersheds, EGU General Assembly 2026, Vienna, Austria, 3–8 May 2026, EGU26-9239, https://doi.org/10.5194/egusphere-egu26-9239, 2026.

EGU26-12205 | ECS | PICO | HS2.4.1

Is there strength in numbers? – Assessing cumulative effects of decentralized retention measures in forested catchments 

Elias Amerhauser, Franz Holzleitner, Veronika Lechner, Maximilian Behringer, and Christian Scheidl

Decentralized retention measures in forested catchments are increasingly discussed as a complementary approach to traditional flood protection. Although forests are generally considered to naturally mitigate flooding, the quantitative contribution of small technical retention structures associated with forest infrastructure, such as ditch modifications, culverts, cross-drains, and small retention elements, remains poorly understood and insufficiently integrated into flood risk management strategies. In particular, a lack of transferable planning methodologies and evidence-based evaluation frameworks limits their systematic application.

The AquaSilva project aims to address this issue by developing a structured, model-based approach for assessing and planning decentralized technical retention measures in forested catchments. The project combines a comprehensive inventory of existing measures with hydrological modeling and targeted monitoring. Retention structures in forested environments, including road-related drainage elements and small-scale retention features, are systematically classified based on their hydrological function, spatial context, and technical design.

Hydrological effectiveness is assessed using modeling approaches that allow the representation of runoff generation, flow routing, and temporary storage at the catchment scale. Scenario-based analyses explore the potential effects of individual and combined retention measures under varying hydrological conditions. When applicable, model-based results may be supplemented with empirical evidence from practice to better understand hydrological responses and refine conceptual assumptions.

The methodology is applied in a pilot area in the Vienna Woods, allowing the derivation of practical planning parameters and transferable recommendations. The main outcome is a practice-oriented framework that links hydrological modeling, monitoring, and decision support. By improving the understanding of how decentralized forest retention measures to runoff attenuation and peak flow reduction, the project supports hydrologically sensitive forest infrastructure planning and provides a scientific basis for integrating forest-based measures into flood risk management at catchment scale.

How to cite: Amerhauser, E., Holzleitner, F., Lechner, V., Behringer, M., and Scheidl, C.: Is there strength in numbers? – Assessing cumulative effects of decentralized retention measures in forested catchments, EGU General Assembly 2026, Vienna, Austria, 3–8 May 2026, EGU26-12205, https://doi.org/10.5194/egusphere-egu26-12205, 2026.

EGU26-12799 | PICO | HS2.4.1

 Linking forest management to groundwater recharge: modeling forest floor evaporation in plantation forests 

Tsuyoshi Yamaguchi, Toshihiro Okubo, Kosuke Nakagawa, Yoriyuki Yamada, Asahi Hashimoto, and Yuichi Onda

In Japan, plantation forests have accumulated substantial timber resources; however, fragmented ownership and declining timber prices have resulted in management shortfalls.
Kumamoto Prefecture has enacted an ordinance requiring permit holders in designated priority areas to implement groundwater recharge equivalent to their extraction volume (in principle, 100%) to ensure sustainable groundwater use. If increases in water resources resulting from forest thinning can be scientifically quantified, this ordinance could provide an incentive for forest management under this framework. Currently, groundwater recharge is estimated using a simple coefficient-based formula, and quantitative evaluation remains limited.

Forest water-balance studies have extensively examined canopy interception and tree transpiration; however, knowledge of forest floor evaporation remains limited, despite its importance for accurately assessing changes following thinning. Lysimeters provide high-accuracy measurements of forest floor evaporation but are difficult to operate unattended over long periods. Soil-moisture sensors allow stable continuous measurements but have limited spatial representativeness. In contrast, the eddy covariance method enables non-destructive, wide-area flux observation. While eddy covariance studies have recently been conducted in forests with low tree density, applications in dense forests remain scarce. This study aims to develop a simplified measurement approach and an estimation model for forest floor evaporation to improve water-balance evaluation in managed forests.

Field experiments were conducted during summer (June 28–September 30) in Japanese cypress plantations with stand densities of 454, 927, and 1268 trees ha⁻¹. Forest floor evaporation was measured using lysimeters and an LI-710 evapotranspiration sensor based on a simplified eddy covariance approach. As a simplified method, soil-moisture sensors were installed at depths of 5, 10, and 15 cm. Hourly evaporation rates were derived from each dataset, evaporation between rainfall events was compared, and an estimation model was examined using the measurements together with forest microclimate data.

Across observation periods, forest floor evaporation showed broadly similar temporal patterns among lysimeter, soil-moisture-derived, and simplified eddy-covariance estimates. This consistency suggests that forest floor evaporation can be reasonably represented using simplified measurements under different forest management conditions. Although seasonal variability was not assessed, the results indicate the applicability of sensor-based estimation methods and their usefulness for improving water-balance evaluation related to groundwater recharge in managed forests.

How to cite: Yamaguchi, T., Okubo, T., Nakagawa, K., Yamada, Y., Hashimoto, A., and Onda, Y.:  Linking forest management to groundwater recharge: modeling forest floor evaporation in plantation forests, EGU General Assembly 2026, Vienna, Austria, 3–8 May 2026, EGU26-12799, https://doi.org/10.5194/egusphere-egu26-12799, 2026.

EGU26-13668 | ECS | PICO | HS2.4.1

Sub-daily rainfall-runoff dynamics in tropical headwater catchments under different forest management: insights from Brazil 

Nataly Foronda Ortega, Silvio Frosini de Barros Ferraz, and Larisa Tarasova

Understanding the relationship between forest cover and hydrological processes is challenging due to the high temporal variability of water cycles and their interactions with both land-use and land-change activities. In tropical headwater catchments, rapid responses to intense rainfall events often occur at sub-daily scales, where concentration times are frequently shorter than 24 hours. These event-scale dynamics are particularly sensitive to land cover and forest management, which can strongly modulate runoff generation, storage, and flow timing in headwater catchments. However, hydrological catchments response is commonly analyzed using daily or longer-term aggregated data, potentially obscuring key processes controlling event runoff generation and its timing.

Here we investigate the impact of different forest management strategies on rainfall-runoff event dynamics in five tropical catchments (56–179 ha) located in São Paulo, Brazil. The study area, situated in a transition zone between the Cerrado and Atlantic Forest biomes, comprises catchments with contrasting land uses: actively restored forest (8 years), native vegetation regeneration (more than 13 years), commercial Eucalyptus plantations with short and long cutting cycles (7 and 14 years, respectively), and a mixed forest mosaic with management interventions in small areas (more than 20 years). We use an objective method for identification on discrete rainfall-runoff events based on detrending moving-average cross-correlation analysis (Giani et al., 2022) from continuous hydrometeorological time series of hourly and sub-hourly temporal resolution. A total of three years of monitoring data (2022–2025), covering contrasting wet and dry years, are analyzed, identifying and characterizing each discrete event by its event runoff coefficient, rise time, time scale, and normalized peak discharge. Given their variability dependence on antecedent wetness conditions, events are grouped by season (wet and dry) for each catchment. For each season, median values of event characteristics are calculated over the three-year period and compared across catchments to assess the effects of different forest management strategies on event-scale runoff response.

The results of this study will contribute to the understanding of how land-use changes in tropical regions, whether for commercial or conservation purposes, affect both hydrological processes and functions, and ecosystem services at the headwater scale.

Giani, G., Tarasova, L., Woods, R. A., & Rico-Ramirez, M. A. (2022). An Objective Time-Series-Analysis Method for Rainfall-Runoff Event Identification. Water Resources Research, 58(2), e2021WR031283. https://doi.org/10.1029/2021WR031283

How to cite: Foronda Ortega, N., Frosini de Barros Ferraz, S., and Tarasova, L.: Sub-daily rainfall-runoff dynamics in tropical headwater catchments under different forest management: insights from Brazil, EGU General Assembly 2026, Vienna, Austria, 3–8 May 2026, EGU26-13668, https://doi.org/10.5194/egusphere-egu26-13668, 2026.

EGU26-14394 | ECS | PICO | HS2.4.1

Spatial and temporal drivers of water colour variability in temperate Eucalyptus forested catchments under a changing climate 

Charuni Jayasekara, Felix Smalley, Philip Noske, Sarah Fischer, Thomas Keeble, Mariia Lukinykh, Christoper Lyell, Patrick Lane, Martyn Futter, and Gary Sheridan

Increasing water colour concentrations in freshwater ecosystems worldwide pose significant challenges for treatment and the sustainable supply of drinking water. While this global trend has driven extensive research, studies remain heavily concentrated in boreal peatlands and lowland forests, leaving critical knowledge gaps regarding colour generation mechanisms in other ecosystems. Well-drained eucalyptus-dominated temperate forests of the Southern Hemisphere represent one such understudied system, yet produce water colour concentrations parallel to those from northern catchments. Understanding colour dynamics in these systems is essential for predicting climate change impacts on drinking water supplies across large regions of Australia and similar temperate forests globally. Therefore, we investigated the spatial and temporal drivers of water colour generation across temperate, eucalyptus forest-dominated drinking water catchments in south-eastern Australia to understand current variability and predict responses to future climate scenarios. We combined spatial surveys across diverse topographic gradients spanning 260 km2 of catchments, with a year-long event-based monitoring using automatic samplers at five contrasting study sites, collecting and measuring a total of approximately 650 samples, to capture colour at baseflow and stormflow conditions. Controlled laboratory incubation experiments were conducted for three months, using leaf litter collected across a climate gradient, enabling us to isolate mechanisms of colour generation under different environmental scenarios. Dissolved Organic Carbon concentrations were highly correlated with true colour (r2 = 0.75), indicating that colour originates from organic matter decomposition. Our findings reveal a productivity-moisture paradigm: high-productivity systems receiving high precipitation maintain consistently high colour concentrations year-round (108.5 ± 41.1 PCU: mg Pt-Co Equiv.), due to favourable conditions for microbial decomposition of abundant litter. In contrast, lower-productivity areas show pronounced seasonality, where low colour during dry periods (55 ± 14 PCU: mg Pt-Co Equiv.) due to limited microbial activity, but colour concentrations were more than double during wet seasons (123 ± 39 PCU: mg Pt-Co Equiv.) when accumulated dry litter rapidly decomposes. Supporting laboratory experiments also confirmed this mechanism, where litter stored under prolonged dry conditions generated equivalent colour concentrations (785 ± 193 PCU: mg Pt-Co Equiv.) upon rewetting as continuously moist litter (831 ± 161 PCU: mg Pt-Co Equiv.), regardless of initial field conditions. Event-based monitoring revealed that colour peaks, sometimes reaching 177 PCU: mg Pt-Co Equiv., coincide with hydrograph peaks, with predominantly anticlockwise hysteresis loops (67%) indicating distant catchment sources. The asymptotic discharge-colour relationships, which accounted for 50% of the variability in event-flow colour, suggest a finite pool of soluble organic compounds available for leaching during events. We integrated these data with hydrological models, including PERSiST and INCA-C, to investigate catchment-scale processes and climate projections. Our initial results indicate that predicted climate shifts toward prolonged droughts punctuated by intense rainfall will create a boom-bust dynamic, with extended low-colour periods followed by pronounced colour pulses with subsequent storms, amplifying challenges for drinking water management in a changing climate.

How to cite: Jayasekara, C., Smalley, F., Noske, P., Fischer, S., Keeble, T., Lukinykh, M., Lyell, C., Lane, P., Futter, M., and Sheridan, G.: Spatial and temporal drivers of water colour variability in temperate Eucalyptus forested catchments under a changing climate, EGU General Assembly 2026, Vienna, Austria, 3–8 May 2026, EGU26-14394, https://doi.org/10.5194/egusphere-egu26-14394, 2026.

EGU26-15818 | PICO | HS2.4.1

Water and Carbon feedbacks: How Soil Moisture dynamics shape Gross Primary Productivity across Brazil's contrasting Biomes? 

Jamil Alexandre Ayach Anache, Bruna Emi Okai, Mateo Hernández Sánchez, Pedro de Mello Martins Rocco, Samuel Almeida Dutra Júnior, Luiza Jardim Machado, Heitor de Sousa Pantarotto, Eduardo Mario Mendiondo, Edson Wendland, and André Simões Ballarin

Gross primary production (GPP) constitutes a fundamental component of terrestrial carbon sequestration, underpinning climate equilibrium and the provision of ecosystem services. Among various environmental factors influencing GPP, soil moisture (SM) is critical for the regulation of stomatal conductance and photosynthetic processes. In light of climate change and intensive land use, understanding the impact of soil moisture on plant productivity across diverse Brazilian biomes and ecosystems is of strategic significance. This study conducts a distributed analysis examining the relationship between soil moisture and GPP within six major Brazilian biomes: Amazon, Cerrado, Caatinga, Atlantic Forest, Pampa, and Pantanal. The methodology integrates spatio-temporal remote sensing and reanalysis data for GPP and soil moisture to generate response curves of GPP to soil moisture variations. Random sampling points were established throughout all Brazilian biomes, with GPP and SM time series extracted from the FLUXCOM-X and ERA5 datasets, respectively. Daily means for both variables were calculated for the observational period, and results were evaluated via biome-specific scatter plots. The analysis enabled the identification of areas susceptible to water stress as well as those with acclimatization potential, thereby informing improvements in climate modeling and land use strategies. Distinct patterns emerged among the Brazilian biomes; most exhibited a positive correlation between GPP and SM, except for the Pampa biome in southern Brazil, which is predominantly characterized by open fields and grasslands. Notably, the Amazon and Cerrado displayed contrasting hysteresis patterns in the GPP-SM relationship over the years. In the Amazon, GPP increases during spring and summer at a greater rate than its decline during fall and winter, whereas in the Cerrado, the increase in GPP is more gradual during spring and summer and declines more sharply in fall and winter. Consequently, seasonal responses to water availability vary significantly among the principal Brazilian biomes.

How to cite: Ayach Anache, J. A., Okai, B. E., Hernández Sánchez, M., de Mello Martins Rocco, P., Almeida Dutra Júnior, S., Jardim Machado, L., de Sousa Pantarotto, H., Mendiondo, E. M., Wendland, E., and Simões Ballarin, A.: Water and Carbon feedbacks: How Soil Moisture dynamics shape Gross Primary Productivity across Brazil's contrasting Biomes?, EGU General Assembly 2026, Vienna, Austria, 3–8 May 2026, EGU26-15818, https://doi.org/10.5194/egusphere-egu26-15818, 2026.

EGU26-16476 | ECS | PICO | HS2.4.1

 Spatio-temporal dynamics of topsoil moisture and the influence of tree species on pattern persistence 

Lea Dedden, Julian Brzozon, Stefanie Dumberger, Matthias Gassilloud, Anna Göritz, Markus Sulzer, Christiane Werner, and Markus Weiler

Soil moisture (SM) in the topsoil horizon is a key variable in terrestrial ecosystems, regulating water and energy exchange at the interface between the soil and the atmosphere. In forest ecosystems, SM exhibits pronounced spatio-temporal variability within the active root zone as a result of complex interactions among multiple factors including soil properties, topography, climate and vegetation. Formulating broadly reliable statements about spatio-temporal soil moisture characteristics and its effects remains challenging. Existing research is limited and sometimes contradictory regarding when and to what extent controls such as tree species influence topsoil SM variability across space and time.

This study investigates spatio-temporal dynamics of topsoil SM and their controls in different forest ecosystems. The objectives are to quantify the spatial variability at the plot scale and its temporal evolution from event to seasonal scale, thereby improving our understanding of SM dynamics between wet and dry states and across different mono- and mixed-species forest stands. We investigate the variables governing spatial soil moisture variability and how they modulate SM patterns over time, with a focus on how ecohydrological processes amplify or mitigate SM variability.

SM was recorded in four stands in the ECOSENSE forest in southwestern Germany, using 400 time domain transmissometry sensors (SMT100, Truebner GmbH, Germany) installed at 12 cm depth in a tree-centered design across stands of mixed and pure Douglas fir, Beech and Silver fir. A continuous 2.5-year dataset (2023 – 2025) was analysed using statistical and geostatistical approaches to identify dominating spatial SM patterns during wet and dry periods. Temporal stability was evaluated to determine the pattern persistence. Spatial SM differed significantly among plots during most of the observation period. Mean SM followed a similar annual cycle throughout all plots, with typical maxima in late winter and minima in early fall. Despite comparable soil properties and topography, the pure Beech and Douglas fir plots revealed significant seasonal differences in mean SM. Beech has more prominent autumn wetting, while Douglas fir has stronger spring drying, likely reflecting changes in evapotranspiration dynamics. The individual probability density functions of spatial soil moisture distribution transitioned between wet- or dry-preferential unimodal states and intermediate bimodal states. Across plots, spatial mean SM and the coefficient of variation exhibited an upward-convex relationship: variability was low under dry and wet (<10% or > 30% mean SM) and high under intermediate moisture conditions. The geostatistical variogram analyses showed short autocorrelation lengths, and pronounced spatial variability at few meters’ distance. Temporal stability of SM varied across plots with a range of persistently wet and dry spots. Individual locations deviated by up to 50% from temporally averaged SM at the Beech, Douglas fir and mixed plot, and up to 75% for the Silver fir plot.

Combined with LiDAR derived canopy structure metrics, micro topographic maps, soil properties, and continuous ecohydrological- and meteorological observation, the presented soil moisture dataset provides a unique framework to investigate jointly modulating factors of soil moisture. It enables detailed analysis of wetting-drying cycles, including seasonal and species-specific differences.

How to cite: Dedden, L., Brzozon, J., Dumberger, S., Gassilloud, M., Göritz, A., Sulzer, M., Werner, C., and Weiler, M.:  Spatio-temporal dynamics of topsoil moisture and the influence of tree species on pattern persistence, EGU General Assembly 2026, Vienna, Austria, 3–8 May 2026, EGU26-16476, https://doi.org/10.5194/egusphere-egu26-16476, 2026.

EGU26-17010 | PICO | HS2.4.1

Event-Scale Responses of Forest Water Balance Components to Thinning Revealed by Soil Moisture Dynamics 

Yuichi Onda, Juri Iwamoto, Junko Takahashi, Yusei Uehara, Hiroyasu Nakamura, Asahi Hashimoto, Shiori Takamura, and Kazuya Yoshimura

Forests regulate hydrological processes and support water resources through rainfall partitioning and evapotranspiration, forming the basis of forest water balance. Previous studies have shown that thinning alters stand structure and affects throughfall, forest floor evaporation, and tree transpiration. However, quantifying individual components of the forest water balance within a stand typically requires multiple measurement systems operating simultaneously, making observations technically demanding and labor-intensive. As a result, systematic assessments of water balance responses to forest management remain limited.

In this study, we evaluated the applicability of a soil moisture balance approach for event-scale estimation of forest water balance components using a single soil moisture time series. Field observations were conducted in a Japanese cedar (Cryptomeria japonica) plantation subjected to row thinning. Multi-depth soil moisture sensors were installed at 20 locations in both thinned and control plots at depths of 5, 15, 25, 35, and 45 cm. In addition, two weighing lysimeters equipped with soil moisture sensors were installed in the thinned plot to directly measure soil water dynamics and forest floor evaporation.

During rainfall events, throughfall was estimated from increases in soil moisture within the 0–50 cm soil layer. The estimated throughfall showed excellent agreement with rain gauge measurements. Moreover, its spatial variability successfully reproduced increasing interception associated with canopy volume derived from LiDAR point cloud data. Forest floor evaporation was quantified during rain-free periods using changes in lysimeter weight and soil moisture depletion within the 0–20 cm layer. Tree water uptake was then estimated as the residual of soil moisture decreases in the 0–50 cm layer after accounting for forest floor evaporation, using an empirical relationship between radiation and forest floor evaporation.

The results revealed clear spatial contrasts in evapotranspiration components within the thinned stand: forest floor evaporation dominated in the center of thinning rows, while tree water uptake was more pronounced near tree stems. These findings demonstrate that the soil moisture balance approach enables separation and quantitative evaluation of forest water balance components at the event scale without reliance on large or complex measurement systems. This method provides a scalable and efficient framework for assessing hydrological impacts of forest management and offers valuable insights for sustainable forest and water resource management.

How to cite: Onda, Y., Iwamoto, J., Takahashi, J., Uehara, Y., Nakamura, H., Hashimoto, A., Takamura, S., and Yoshimura, K.: Event-Scale Responses of Forest Water Balance Components to Thinning Revealed by Soil Moisture Dynamics, EGU General Assembly 2026, Vienna, Austria, 3–8 May 2026, EGU26-17010, https://doi.org/10.5194/egusphere-egu26-17010, 2026.

EGU26-18934 | ECS | PICO | HS2.4.1

Bedrock lithology dictates plant water-use niches in Karst ecosystems 

Yali Ding, Yunpeng Nie, Hongsong Chen, and Jinxing Zhou

Conventional models of plant-water relations prioritize climatic and edaphic factors, largely overlooking the foundational role of bedrock. In water-limited karst ecosystems, where soil is thin and hydrology is fracture-controlled, the lithological template may critically govern vegetation function. This study tests the hypothesis that bedrock composition—specifically, the contrast between dolomite and limestone—creates distinct hydrological niches that filter for divergent plant functional strategies, thereby determining ecosystem vulnerability. We conducted a monthly trait-based analysis of 13 dominant woody species across paired dolomite and limestone terrains in Southwest China. We integrated measurements of water-source use (xylem δD and δ¹⁸O) with key leaf economic traits (water content, area, specific area, chlorophyll). We found that dolomite-supported plants exhibit a consistent water-conservative syndrome: significantly lower leaf water content, smaller leaf area, lower specific leaf area, and reduced chlorophyll (P < 0.01). Isotopic data revealed that dolomite plants underwent pronounced seasonal shifts in water acquisition, indicative of reliance on fleeting, shallow moisture pockets. In stark contrast, limestone-supported plants maintained more stable trait values and exploited a more reliable water source, likely from deeper, rock-hosted reservoirs. This fundamental divergence demonstrates that bedrock lithology is a primary selective force, engineering plant hydraulic strategies at the community level. Consequently, dolomite landscapes foster inherently less resilient communities more vulnerable to climatic extremes, while limestone systems support greater hydrological buffering capacity. Our findings establish a bedrock-centric framework for plant hydrology, with urgent implications for predicting climate change impacts and guiding conservation in karst regions and other bedrock-dominated ecosystems worldwide.

How to cite: Ding, Y., Nie, Y., Chen, H., and Zhou, J.: Bedrock lithology dictates plant water-use niches in Karst ecosystems, EGU General Assembly 2026, Vienna, Austria, 3–8 May 2026, EGU26-18934, https://doi.org/10.5194/egusphere-egu26-18934, 2026.

EGU26-20676 | ECS | PICO | HS2.4.1

Forested Watersheds and Water Regulation: A Comparative Assessment of Water Balance Using SWAT+ 

Rishabh Srikar, Manisha Singh, Bhaskar Sinha, Jigyasa Bisaria, and Thomas Thomas

Forests regulate water through coupled ecohydrological processes interlinking land, water and climate. The hydrological response of a region, although driven by climate, is a function of intrinsic watershed properties determined by corresponding land use land cover (LULC) patterns, soil characteristics and topography. The increasing anthropogenic pressure on water resources, exacerbated by climate change and forest land use conversion threatens global and regional water security and availability. Understanding the water balance in forested watersheds using physical models that simulate hydrological responses under different land use types would enable evidence-based decision-making for tropical regions in the Global South. Therefore, this study explores the influence of LULC on streamflow and water balance components to examine differences in water regulation across two watersheds with varying forest density, cover and type. The process based, semi-distributed SWAT+ hydrological model was used for quantification and assessment of key water balance components including precipitation, actual evapotranspiration, surface runoff, lateral flow and percolation for Dindori and Barwani watersheds of Narmada River basin, India. Water balance of the Barwani (1999 to 2006) and Dindori watershed (1989 to 2009) was simulated using earth observation data and calibrated with station datasets. Both watersheds demonstrated satisfactory performance in water balance simulation after calibration. Dindori watershed (higher forest cover and located in the upper catchment area of Narmada River) display greater water regulation through sustained streamflow in dry periods, better percolation and water retention in sub-surface soils as well as recharge deep aquifers when compared to Barwani (lower forest cover and a greater percentage of degraded lands) wherein a greater proportion of water is lost to the atmosphere through ET. The comparative assessment shows how forest cover modulates hydrological partitioning and enhances water resilience in tropical catchments. Integrating process-based, physical models with earth observation data, the study attempts to understand the forest-water dynamics in non-glacial, data-limited river basins and highlights the importance of conserving forested upper catchments for sustaining downstream water availability under changing land-use and climatic variability.  

How to cite: Srikar, R., Singh, M., Sinha, B., Bisaria, J., and Thomas, T.: Forested Watersheds and Water Regulation: A Comparative Assessment of Water Balance Using SWAT+, EGU General Assembly 2026, Vienna, Austria, 3–8 May 2026, EGU26-20676, https://doi.org/10.5194/egusphere-egu26-20676, 2026.

EGU26-932 | ECS | PICO | HS2.4.2

Large-sample hydrologic models poorly simulate interannual variability in seasonal catchments, despite high Nash-Sutcliffe and Kling-Gupta Efficiencies 

Sacha Ruzzante, Wouter Knoben, Thorsten Wagener, Tom Gleeson, and Markus Schnorbus

Variability in river flow can be understood as the sum of irregular, seasonal and interannual variance components. Skillful simulations of irregular events are needed to accurately predict short-duration events such as floods, while skillful simulation of interannual variance is required to accurately predict long-term change and long-duration droughts. However, popular performance metrics such as the Nash-Sutcliffe Efficiency (NSE) and Kling-Gupta Efficiency (KGE) do not distinguish these three variance components. We analyse streamflow simulations from 18 process-based, machine learning, and hybrid hydrologic models from around the globe (22,089 simulated time series in total) to investigate how well large-sample hydrologic models represent each variance component. We find that in highly seasonal (tropical, alpine, and polar) catchments these models achieve very high NSE and KGE values but produce worse-than-average simulations of interannual and irregular variance. Year-to-year variability in streamflow extremes and monthly mean flows is consistently more poorly simulated in highly seasonal catchments than in less-seasonal catchments. This suggests that these hydrologic models have limited skill in predicting long-term responses to climate change in alpine, polar, and tropical regions, which are some of the most vulnerable regimes regarding climate change. There is a need to rethink the value of efficiency scores such as NSE and KGE in large-domain model evaluation, and to complement such approaches with more detailed and more process-based investigations of model performance.

How to cite: Ruzzante, S., Knoben, W., Wagener, T., Gleeson, T., and Schnorbus, M.: Large-sample hydrologic models poorly simulate interannual variability in seasonal catchments, despite high Nash-Sutcliffe and Kling-Gupta Efficiencies, EGU General Assembly 2026, Vienna, Austria, 3–8 May 2026, EGU26-932, https://doi.org/10.5194/egusphere-egu26-932, 2026.

EGU26-1426 | PICO | HS2.4.2

Caravan-Qual: A global scale integration of water quality observations into a large-sample hydrology dataset 

Edward R. Jones, Frederik Kratzert, and Michelle T. H. van Vliet

The last decade has seen a proliferation in efforts to compile, standardise and openly disseminate datasets spanning hundreds to thousands of catchments, driven by the emergence of large-sample hydrology as a sub-discipline in hydrological sciences. While these datasets have facilitated novel research into the field of water quantity (e.g. streamflow prediction), comparable advances for water quality research remain limited1.

Here, we present the first global integration of water quality into large-sample hydrology (named Caravan-Qual). The dataset contains >70 million river water quality observations covering 100 water quality constituents, compiled from a range of national-to-global datasets covering the period of 1980-2025. Water quality data has been standardised to common naming conventions and reporting units, and further processed to remove duplicates, detect outliers and handle observations below detection limits. Leveraging the Caravan2 dataset and open-source software, water quality monitoring stations are matched to streamflow gauges – with ~31% of daily water quality observations paired to a daily streamflow measurement within a 10km distance. Furthermore, meteorological variables (e.g. temperature, precipitation, net radiation) and catchment attributes (e.g. land cover, soil characteristics) are derived for water quality monitoring stations.

Caravan-Qual is openly available at: https://doi.org/10.5281/zenodo.177870663, and is envisaged to facilitate research into topics including:

  • Spatio-temporal analysis of river water quality dynamics at local to global scales.
  • Investigation of the relationships between (constituent-specific) river water quality responses and hydrological, meteorological and catchment characteristics.
  • The development and evaluation of process-based, hybrid and data-driven water quality models across diverse hydrological and climatic conditions.

References

1Jones, E. R., Graham, D. J., van Griensven, A., Flörke, M. & van Vliet, M. T. H. Blind spots in global water quality monitoring. Environmental Research Letters 19, 091001 (2024). https://doi.org:10.1088/1748-9326/ad6919

2Kratzert, F. et al. Caravan - A global community dataset for large-sample hydrology. Scientific Data 10, 61 (2023). https://doi.org:10.1038/s41597-023-01975-w

3Jones, E. R., Kratzert, F. & van Vliet, M. T. H. Caravan-Qual: A global scale integration of water quality observations into a large sample hydrology dataset. Zenodo [DATASET] (2025). https://doi.org:10.5281/zenodo.17787066

How to cite: Jones, E. R., Kratzert, F., and van Vliet, M. T. H.: Caravan-Qual: A global scale integration of water quality observations into a large-sample hydrology dataset, EGU General Assembly 2026, Vienna, Austria, 3–8 May 2026, EGU26-1426, https://doi.org/10.5194/egusphere-egu26-1426, 2026.

EGU26-2853 | ECS | PICO | HS2.4.2

Continental-scale prediction of hydrologic signatures and processes 

Ryoko Araki, Anne Holt, John Hammond, Admin Husic, Gemma Coxon, and Hilary McMillan

Understanding hydrologic processes is essential for developing effective hydrologic models and management strategies. However, we lack a continental-scale, comprehensive knowledge of which processes dominate and how their drivers vary across diverse landscapes.

To address this gap, we synthesize large-sample precipitation and streamflow datasets, from Caravan and USGS GAGES-II, to identify spatial patterns in hydrologic behavior. Then, we apply a random forest machine learning model to examine the predictability of hydrological processes and to understand their climatic and landscape drivers. We use a hydrologic signature approach, where signatures—metrics derived from observed hydroclimatic time series—capture key aspects of hydrologic dynamics. 

Using these hydrologic signatures, we developed a “dominant process map” that highlights the spatial variability of baseflow, overland flow, water balance loss, and storage capacity across the conterminous United States. The map demonstrates clear regional gradients from baseflow to overland flow regimes, as well as transitions from water-retaining to low-storage regions. 

In contrast to previous studies emphasizing climate as the primary driver of these processes, our map highlights substantial influences from landscape features. In the eastern half of the US, baseflow is primarily influenced by soils and geology, while stormflow is controlled by topography. In the western US, climate remains the dominant control of most processes. Metropolitan areas emerged as hotspots influenced by anthropogenic factors.

Our dominant process maps serve as a valuable hypothesis-generating tool for model builders and water managers to estimate regional hydrological processes a priori. Our approach to training random forest models to predict hydrologic signatures is readily applicable to other datasets; this facilitates extrapolating hydrological process knowledge from well-studied catchments to ungaged basins or other large-sample datasets.  

How to cite: Araki, R., Holt, A., Hammond, J., Husic, A., Coxon, G., and McMillan, H.: Continental-scale prediction of hydrologic signatures and processes, EGU General Assembly 2026, Vienna, Austria, 3–8 May 2026, EGU26-2853, https://doi.org/10.5194/egusphere-egu26-2853, 2026.

EGU26-3253 | PICO | HS2.4.2 | Highlight

Groundsource - a Gemini constructed dataset of real world flood events from news 

Oleg Zlydenko, Rotem Mayo, Moral Bootbool, Frederik Kratzert, Amitay Sicherman, Ido Zemach, and Deborah Cohen

A critical barrier to advancing large-sample hydrology and global risk assessment is the absence of a comprehensive, high-resolution historical event dataset. Existing resources are often geographically constrained, lack temporal or spatial precision, or are too sparse to support robust global synthesis. To address this gap, we introduce Groundsource, a novel, large-scale global dataset of historical flood events automatically constructed from diverse online news sources. By leveraging Google’s unique web page annotation capabilities and Gemini's natural language processing, we developed a pipeline to systematically identify and structure information about real-world flood events.
Our methodology first filters millions of news articles to isolate reports of actual, past floods, distinguishing them from warnings, policy discussions, and articles that mentions floods in other contexts. For each relevant article, we prompt Gemini to extract the specific dates and locations of the flooding. This structured data is then geocoded and aggregated to produce the Groundsource dataset. The dataset contains ~800,000 events with an estimated 75% precision.
While acknowledging the limited accuracy of LLM-based data extraction, and the inherent limitations of a news-based approach — such as recency-, population-, and coverage-bias — Groundsource represents a significant leap forward in data availability. As a publicly available, open resource covering over 100 countries, it provides a tool of unprecedented scale. Groundsource enables the research community to investigate global flood seasonality and temporal trends, to synthesize the socio-hydrological footprint of extreme events worldwide, to train data-driven models and to validate global flood forecasting systems. 

How to cite: Zlydenko, O., Mayo, R., Bootbool, M., Kratzert, F., Sicherman, A., Zemach, I., and Cohen, D.: Groundsource - a Gemini constructed dataset of real world flood events from news, EGU General Assembly 2026, Vienna, Austria, 3–8 May 2026, EGU26-3253, https://doi.org/10.5194/egusphere-egu26-3253, 2026.

EGU26-5442 | PICO | HS2.4.2

CAMELS-CZ: a hydro-meteorological time series and attributes database for 453 catchments in Czechia 

Michal Jeníček, Ondřej Ledvinka, Radovan Tyl, Petr Pavlík, Petr Kavka, Adam Vizina, Ondřej Nedělčev, Johnmark Nyame Acheampong, Mateja Fabečić, Mijael Rodrigo Vargas Godoy, Petr Šercl, Jana Bernsteinová, and Jakub Langhammer

Hydrological methods that analyse data from a large sample of catchments with diverse characteristics (large-sample hydrology; comparative hydrology) enable a comprehensive analysis of the hydrological regime and a description of hydrological variability and change in the components of the water balance. Comparative hydrology is better suited for examining the differences and similarities between river basins, thereby supporting their classification and regionalisation. Furthermore, hydrological models significantly streamline the processing of large sets of river basins.

We present CAMELS-CZ (Catchment Attributes and MEteorology for Large-sample Studies – Czechia), a database of catchment attributes for 453 catchments within Czechia, serving as a reference data platform for analysis and modelling using a large sample of catchments. The database provides catchment attributes, as well as hydrological and meteorological time series, in a comparable structure to other existing CAMELS products. The database includes catchments for which daily runoff data are available for at least 15 years. Catchment area ranges from 2 km2 to 10,000 km2 and covers a variety of elevations (200–1,600 m a.s.l.) and runoff regimes (from pluvial to nival-pluvial). Observed time series include runoff, precipitation, air temperature, potential evapotranspiration, and snow water equivalent. In addition to the observed data, the CAMELS-CZ time series was supplemented with simulated data of individual components of the water balance using a semi-distributed bucket-type HBV model. The model was calibrated against observed runoff and snow water equivalent. Simulated time series enable a more detailed assessment of the individual components of the water cycle.

How to cite: Jeníček, M., Ledvinka, O., Tyl, R., Pavlík, P., Kavka, P., Vizina, A., Nedělčev, O., Acheampong, J. N., Fabečić, M., Vargas Godoy, M. R., Šercl, P., Bernsteinová, J., and Langhammer, J.: CAMELS-CZ: a hydro-meteorological time series and attributes database for 453 catchments in Czechia, EGU General Assembly 2026, Vienna, Austria, 3–8 May 2026, EGU26-5442, https://doi.org/10.5194/egusphere-egu26-5442, 2026.

EGU26-6543 | ECS | PICO | HS2.4.2

Changing-CAMELS: A pan-European dataset for non-stationary hydrological modeling under climate and land-use change 

Ashim Maharjan, Alexander Dolich, Patrick Ludwig, Jens Kiesel, Uwe Ehret, and Ralf Loritz

Non-stationarity has long been recognized as a fundamental challenge in hydrological modelling, as climate change and human activities continuously alter catchment properties and the boundary conditions under which hydrological systems operate. However, translating this long-standing recognition into systematic model evaluation remains challenging, as suitable large-sample hydrological datasets that explicitly represent temporal change are still scarce. Most existing datasets adopt a static design, with time-invariant catchment attributes and hydro-meteorological time series limited to retrospective observations, which constrains the systematic testing of hypotheses and models targeting non-stationary hydrological behaviour. Here, we introduce Changing-CAMELS, a pan-European, CAMELS-style dataset explicitly designed to support non-stationary hydrological modelling. Building on the strengths of existing datasets such as CAMELS, Caravan, and EStreams, the developed dataset moves beyond static representations by incorporating time-varying catchment attributes and future climate forcing on a European scale.

In particular, dynamic land-use and land-cover changes are derived from the European LUCAS dataset, providing annual updates to vegetation and land-cover fractions. Simultaneously, the inclusion of both raw and bias-corrected daily-resolution regional and global climate model datasets extends hydro-meteorological forcing beyond the historical period. This integration enables consistent analyses of evolving land cover, shifting climate regimes, and their combined impacts on hydrological responses. Changing-CAMELS covers 4,575 catchments across Europe and harmonizes observations and attributes across national boundaries. By providing both retrospective and prospective information within a unified framework, the dataset allows researchers to systematically evaluate competing hypotheses, compare stationary and non-stationary model formulations, and assess the robustness and uncertainty of hydrological models under climate and land-use change.

How to cite: Maharjan, A., Dolich, A., Ludwig, P., Kiesel, J., Ehret, U., and Loritz, R.: Changing-CAMELS: A pan-European dataset for non-stationary hydrological modeling under climate and land-use change, EGU General Assembly 2026, Vienna, Austria, 3–8 May 2026, EGU26-6543, https://doi.org/10.5194/egusphere-egu26-6543, 2026.

EGU26-7000 | ECS | PICO | HS2.4.2

The UK Hydro-MIP: Evaluating modelled river flows from a diverse set of models over a large sample of British catchments 

Rosanna Lane, Helen Baron, Elizabeth Cooper, and Emma Robinson

Model intercomparison projects (MIPs) have many benefits, including improving understanding of model capabilities, furthering advancements in model development, providing a benchmark of model performance, helping to quantify modelling uncertainties and fostering collaboration. Here, we introduce the UK Hydro-MIP, a community-led hydrological and land surface model intercomparison for streamflow simulation across Great Britain. This MIP encouraged members of the community to submit modelled daily river flows, following an agreed model protocol to ensure consistency in driving data and output formats. A diverse range of model types were represented, including land surface models, physically based to conceptual hydrological models, and machine learning models. The resultant large sample dataset, including modelled river flows and evaluation metrics from over 16 models for over 628 catchments, will be released later this year.

Initial analysis of the dataset was carried out during a hackathon event, where all contributors and stakeholders were invited to an in-person meeting to discuss priorities and analyse results together. Here, we present initial results from the UK Hydro-MIP and the hackathon, highlighting the relative strengths of different modelling approaches and common modelling challenges across Great Britain.

How to cite: Lane, R., Baron, H., Cooper, E., and Robinson, E.: The UK Hydro-MIP: Evaluating modelled river flows from a diverse set of models over a large sample of British catchments, EGU General Assembly 2026, Vienna, Austria, 3–8 May 2026, EGU26-7000, https://doi.org/10.5194/egusphere-egu26-7000, 2026.

EGU26-7548 | ECS | PICO | HS2.4.2

How do geological map details influence hydrological model transferability to ungauged basins in large-sample studies? 

Thiago V. M. do Nascimento, Julia Rudlang, Sebastian Gnann, Jan Seibert, Markus Hrachowitz, and Fabrizio Fenicia

Large-sample hydrology datasets have become increasingly popular in recent years, providing hydro-meteorological time series and catchment attributes for thousands of catchments worldwide. However, the role of such catchment attributes in informing model regionalization, and particularly the effect of their level of spatial detail on prediction in ungauged basins (PUB), remains poorly explored. This study addresses this gap by examining whether catchment attributes derived from geological maps of varying levels of detail improve model regionalization and, in turn, PUB, for both a bucket-type model and a data-driven Long Short-Term Memory (LSTM) model across 130 catchments in two independent basins: the Moselle (27 100 km²) and the Garonne (13 730 km²). We conducted five modeling experiments: a benchmark without geological information and four geology-informed configurations with increasing levels of detail (random, global, continental, and regional). A fold-based space–time cross-evaluation strategy was used to assess model performance on both time periods and catchments unseen during calibration. Performance was evaluated using a modified Nash–Sutcliffe Efficiency (NSE) and a set of streamflow signatures describing flow variability, storage, and regime behavior. Across both basins and model types, benchmark experiments yielded the lowest space–time performance, followed by the random experiment and the global geology experiment, while the experiments using continental and regional geology consistently resulted in higher NSE values. Improvements were strongest for the bucket-type model, with the most detailed geological attributes leading to consistent gains in median performance and robustness. Differences among experiments were more pronounced for streamflow signatures. For the bucket-type model, only the experiments adopting the continental or regional geology reproduced observed signatures with Spearman’s correlations exceeding 0.60, whereas the LSTM model already showed reasonable skill in the benchmark case but still benefited systematically from increasing geological detail. Together, these results demonstrate that incorporating detailed geological information can enhance streamflow representation and model transferability in PUB applications, and that the level of geological detail is a critical, yet often overlooked, factor in large-sample hydrology and regionalization studies.

How to cite: M. do Nascimento, T. V., Rudlang, J., Gnann, S., Seibert, J., Hrachowitz, M., and Fenicia, F.: How do geological map details influence hydrological model transferability to ungauged basins in large-sample studies?, EGU General Assembly 2026, Vienna, Austria, 3–8 May 2026, EGU26-7548, https://doi.org/10.5194/egusphere-egu26-7548, 2026.

EGU26-7752 | ECS | PICO | HS2.4.2

TempER: A large-sample dataset of temperature in European rivers  

Maria H. Grundmann, Camille Heubi, Corentin Chartier-Rescan, Corinna Frank, Giulia Bruno, Paul C. Astagneau, and Manuela I. Brunner

River water temperature affects water quality, ecosystem functions, and the useability of water for humans. While many data sources for water temperature time series exist at regional or national levels, retrieving and preprocessing such data for large-scale and -sample studies is often time-consuming. Therefore, studies have mainly focussed on local or regional scales, leading to widespread knowledge gaps regarding large-scale river water temperature variability and impacts. The recent push towards making large-sample hydrological data available, e.g. streamflow[1,2,3], has improved our understanding of processes and trends across hydrologically diverse regions, yet most of these datasets do not include water temperature.  

With TempER (Temperatures in European Rivers), we present a large-sample, long-term and high-resolution dataset of river water temperature across Europe. We provide daily water temperature data from 4757 stations, covering up to 72 years, alongside streamflow data where available. We also provide catchment outlines and catchment aggregated land-surface attributes, such as land cover, geology and topography, as well as meteorological time series for these stations. We provide water temperature regime indices for all the stations in our dataset, and the raw data where allowed. To enable updates of this dataset, we provide detailed information on how to retrieve data from over 67 sources in 26 countries. This dataset will pave the way for research projects that improve our understanding of water temperature trends, patterns and extremes across large spatial domains through analysis and modelling.  


[1] Addor, N., Newman, A. J., Mizukami, N., and Clark, M. P.: The CAMELS data set: catchment attributes and meteorology for large-sample studies, Hydrol. Earth Syst. Sci., 21, 5293–5313, https://doi.org/10.5194/hess-21-5293-2017, 2017. 

[2] Kratzert, F., Nearing, G., Addor, N. et al. Caravan - A global community dataset for large-sample hydrology. Sci Data 10, 61 (2023). https://doi.org/10.1038/s41597-023-01975-w 

[3] do Nascimento, T.V.M., Rudlang, J., Höge, M. et al. EStreams: An integrated dataset and catalogue of streamflow, hydro-climatic and landscape variables for Europe. Sci Data 11, 879 (2024). https://doi.org/10.1038/s41597-024-03706-1

How to cite: Grundmann, M. H., Heubi, C., Chartier-Rescan, C., Frank, C., Bruno, G., Astagneau, P. C., and Brunner, M. I.: TempER: A large-sample dataset of temperature in European rivers , EGU General Assembly 2026, Vienna, Austria, 3–8 May 2026, EGU26-7752, https://doi.org/10.5194/egusphere-egu26-7752, 2026.

EGU26-8010 | ECS | PICO | HS2.4.2

Impact of reservoirs on river flow from a large sample of catchments in France  

Julia dos Santos da Silva, Bruno J. Lemaire, Francesca Pianosi, and Fanny Sarrazin

Reservoirs are present in many catchments worldwide. They allow to regulate river flow in support of human activities, and they help to reduce flood risk and sustain low flows. They can significantly alter the natural flow of rivers, depending on how they are used and managed, and thus affect ecosystem functioning. However, the large-scale impact of reservoirs on streamflow regimes is not well understood because data on their operating rules are rarely publicly available. Hydrological studies often neglect reservoirs and are often limited to “natural” catchments that are not influenced by human activities.

Here we aim to assess the impact of reservoir regulation on river flow at the national scale in France over the 1970–2020 period, and to determine to what extent the impact varies depending on the reservoir purpose and the physio-climatic conditions. We focus on France, which presents a large variety of landscapes and reservoirs, and where the construction of new reservoirs is envisaged in the face of rising irrigation water demand. We compile a national reservoir dataset by combining data from different sources. We assess their impact by comparing the observed streamflow between 227 regulated catchments and 908 benchmark catchments, that are assumed to be representative of natural flow conditions. We adopt different hydrological signatures that capture different aspects of the streamflow, namely its average value, its inter- and intra-annual variability, and hydrological extremes.

The results show some similarities with those of previous studies in the United Kingdom and the United States, for instance reduced seasonality and flood peaks in regulated compared to benchmark catchments. Notably, we also observe specificities for the French reservoirs that can, among others, increase drought severity. Ultimately, the study allows us to better understand how reservoirs can affect regulated rivers, thus informing their management and their integration into large-scale hydrological models.

How to cite: dos Santos da Silva, J., Lemaire, B. J., Pianosi, F., and Sarrazin, F.: Impact of reservoirs on river flow from a large sample of catchments in France , EGU General Assembly 2026, Vienna, Austria, 3–8 May 2026, EGU26-8010, https://doi.org/10.5194/egusphere-egu26-8010, 2026.

EGU26-9503 | ECS | PICO | HS2.4.2

A global inventory of streamflow and springflow events and their generation processes 

Adriane Hövel, Andreas Hartmann, Shijie Jiang, Hongli Liu, and Larisa Tarasova

Streamflow and springflow events contain essential information on how catchments store and release water as a response to incoming precipitation. When evaluated together with the corresponding hydro-meteorological event conditions, they can reveal the dominant runoff generation processes in a catchment. However, there is currently no consistent, objective approach for identifying and assessing such events on a global scale. To provide an open-access, global inventory of events and their generation processes to the hydrological community, we first employ an objective automated event identification method (Giani et al., 2022) and adapt the algorithm to different climatic conditions. For each of the identified events, we calculate event-scale hydrometric signatures (e.g., event runoff coefficients). In a second step, we classify all identified events based on their hydro-meteorological conditions (e.g., snowmelt, intensive rainfall). To do this, we set up a deep learning model for each catchment and predict streamflow events using observed hydro-meteorological information (precipitation and temperature) and global simulations of a hydrological model for soil moisture and snowmelt. We use explainable machine learning to reveal the importance of each of the predictors during the event build up period and to infer the corresponding generation process for each of the identified events (e.g., snowmelt-induced event, rainfall-induced event during wet antecedent conditions). The global inventory of streamflow and springflow events can provide useful process-oriented information based on event-scale signatures for the evaluation of large-scale hydrological models. Furthermore, it potentially serves as a basis for a more effective parameter regionalization based on similarity of dominant hydro-meteorological event conditions across different locations.

Giani, G., Tarasova, L., Woods, R. A., & Rico‐Ramirez, M. A. (2022). An objective time‐series‐analysis method for rainfall‐runoff event identification. Water Resources Research, 58(2), e2021WR031283. https://doi.org/10.1029/2021WR031283

How to cite: Hövel, A., Hartmann, A., Jiang, S., Liu, H., and Tarasova, L.: A global inventory of streamflow and springflow events and their generation processes, EGU General Assembly 2026, Vienna, Austria, 3–8 May 2026, EGU26-9503, https://doi.org/10.5194/egusphere-egu26-9503, 2026.

EGU26-9793 | PICO | HS2.4.2

RivRetrieve-Python: A Python package for facilitating and unifying access to global streamflow data 

Simon Moulds, Thiago Nascimento, Ryan Riggs, George Allen, and Frederik Kratzert

Large-sample hydrology datasets (e.g. CAMELS) provide structured hydro-meteorological time series data together with time-varying and static catchment attributes. They are fundamental to modern hydrological analysis, supporting hypothesis testing, model development, and the synthesis of generalisable hydrological insights across large and heterogeneous sets of river basins. However, the present generation of large-sample datasets have several shortcomings. First, they are difficult to update as new information becomes available. In addition, they often provide only a small subset of the variables collected at hydrometric gauging sites and usually exclude sub-daily data, while inconsistent naming conventions across the various datasets make data integration challenging. Finally, they may not include the quality flags that are often assigned to individual measurements by the measuring authority. To address these issues, we present RivRetrieve-Python (https://github.com/kratzert/RivRetrieve-Python), a new open source library that provides access to streamflow, stage and river temperature from more than 18 hydrometric APIs with more than 60 000 gauge stations in total at the time of writing (January 2026). An object-oriented design abstracts the implementation details of hydrometric APIs to provide users with a consistent interface irrespective of the data source or variable. We provide helper functions to simplify data retrieval from multiple catchments at once. We suggest that RivRetrieve-Python will streamline global to continental hydrological analysis and enable future research on real-time river monitoring and digital twins, hydrological prediction, and sub-daily hydrological variability and extremes. 

How to cite: Moulds, S., Nascimento, T., Riggs, R., Allen, G., and Kratzert, F.: RivRetrieve-Python: A Python package for facilitating and unifying access to global streamflow data, EGU General Assembly 2026, Vienna, Austria, 3–8 May 2026, EGU26-9793, https://doi.org/10.5194/egusphere-egu26-9793, 2026.

Understanding the primary controls of basin dynamics provides the fundamental basis for transferring hydrological information. When focusing on the rainfall-runoff transformation at high temporal resolutions, catchment similarity should reflect the stochastic nature and temporal sequencing of streamflow. This requires an integrated analysis of the entire hydrograph and its forcings, ensuring that the information embedded in the flow propagation and generation processes is fully captured for regionalization purposes.

In a previous study (Neri et al., 2022), we introduced a novel hydrological signature based on the concept of transfer entropy (TE). This signature quantifies the information flow between the complete time series of meteorological forcings and observed streamflow. The approach leverages these information flows to identify dominant hydrological processes and to characterize and classify basins, under the assumption that similar TE values identify similar catchments. In Neri et al. (2022), the proposed technique was applied to a densely gauged set of Austrian catchments, demonstrating the potential of transfer entropy as an additional instrument for assessing hydrological similarity and for quantifying the connection between different governing processes. Specifically, the method proved capable of distinguishing the predominant or partial roles of snowmelt and evapotranspiration in the region, assessing differences in catchment response times, and highlighting the role of high orographic precipitation in snow-dominated catchments.

In this new study, the proposed approach is tested across diverse large-sample datasets within the Caravan framework (Kratzert et al., 2023), at both national and global scales. The objective of the analysis is to determine whether the potential identified in the previous experiment is generalizable—and to what extent—to more extensive study areas. Furthermore, we investigate how the methodology can be adapted to better identify basin dynamics in regions characterized by significantly higher hydro-climatic variability. Specifically, we explore the use of various meteorological forcings and the application of transfer entropy across multiple time scales. The results, in terms of both indicator values and basin dynamics classification, are interpreted in detail against a set of geo-morphological and climatic catchment features, as well as a set of typical and consolidated streamflow signatures.


References

Kratzert, F., Nearing, G., Addor, N., Erickson, T., Gauch, M., Gilon, O., Gudmundsson, L., Hassidim, A., Klotz, D., Nevo, S., Shalev, G., & Matias, Y. (2023). Caravan—A global community dataset for large-sample hydrology. Scientific Data, 10(1), 61. https://doi.org/10.1038/s41597-023-01975-w

Neri, M., Coulibaly, P., & Toth, E. (2022). Similarity of catchment dynamics based on the interaction between streamflow and forcing time series: Use of a transfer entropy signature. Journal of Hydrology, 614, 128555. https://doi.org/10.1016/j.jhydrol.2022.128555

How to cite: Neri, M. and Toth, E.: A transfer entropy signature to capture hydrological similarity: a global-scale validation of a measure based on the interaction between streamflow and forcing time series, EGU General Assembly 2026, Vienna, Austria, 3–8 May 2026, EGU26-9948, https://doi.org/10.5194/egusphere-egu26-9948, 2026.

EGU26-10361 | ECS | PICO | HS2.4.2

Global climate signals of floods in near-natural rivers  

Emma Ford, Wilson Chan, Amulya Chevuturi, Eugene Magee, Rachael Armitage, Bastien Dieppois, Manuela Brunner, Hannah Christensen, and Louise Slater

Floods are hydro-climatic extremes with severe socioeconomic and environmental consequences. Many studies have examined how large-scale modes of climate variability (e.g., ENSO, NAO) influence floods, but many have relied on catchments influenced by anthropogenic activities, which obscure underlying climate-flood relationships. Here, we use the newly released ROBIN Reference Hydrometric Network, a global dataset of over 3,000 near-natural catchments with daily streamflow records, to provide an observational assessment of climate-flood relationships at the global scale. We first quantify long-term and multi-temporal trends in annual flood peaks and peak-over-threshold events and evaluate their connections with key modes of climate variability across different IPCC regions. Trend analysis reveals how flood metrics have evolved across regions and time periods, while correlation analysis reveals the modes of climate variability that are associated with year-to-year variations in flood peaks and frequencies. A signal-to-noise framework tests whether global mean surface temperature leaves a detectable fingerprint on high flow regimes. This analysis helps to clarify the extent to which climate variability influences flood occurrence and magnitude in near-natural catchments worldwide. Moreover, we propose a machine learning-based process attribution framework to identify climate and catchment controls on floods in near-natural catchments. Preliminary results indicate substantial spatial variability in dominant flood drivers across and within IPCC regions and suggest that large-scale atmospheric circulation modes exert strong, but regionally distinct, influence on seasonal flood frequency. Overall, our findings underscore the importance of regional climate modes in modulating floods and provide the first global baseline on climate-driven changes to floods in near-natural catchments.  

How to cite: Ford, E., Chan, W., Chevuturi, A., Magee, E., Armitage, R., Dieppois, B., Brunner, M., Christensen, H., and Slater, L.: Global climate signals of floods in near-natural rivers , EGU General Assembly 2026, Vienna, Austria, 3–8 May 2026, EGU26-10361, https://doi.org/10.5194/egusphere-egu26-10361, 2026.

EGU26-11939 | PICO | HS2.4.2

So many catchments, so many choices: challenges with large-sample hydrological datasets   

Franziska Clerc-Schwarzenbach, Marc Vis, Ilja van Meerveld, and Jan Seibert

The field of large-sample hydrology is developing at a rapid pace. The increasing availability of hydrometeorological data and information on catchment attributes is primarily thanks to the authors of the various CAMELS datasets and similar datasets, who have put tremendous efforts into creating these resources. This progress has enabled the use of datasets from various regions to conduct large-sample studies. For some regions, large-sample datasets are becoming available at sub-daily resolutions, which will further expand the possibilities for studies in large-sample hydrology. 

Many of these datasets offer multiple time series for a certain variable: for example, precipitation time series originating from different sources, or potential evapotranspiration time series calculated using different equations. Furthermore, there is a considerable number of catchments that are represented in multiple large-sample datasets, either because there is more than one dataset for a particular country (which is the case for Brazil) or because they are included in overarching datasets such as Caravan or EStreams. While this wealth of data is a real treasure, it also poses significant challenges to users of large-sample hydrological data because decisions need to be taken on what data to use (and for what reason). Furthermore, questions on the reliability of the different data are inevitable. Many users end up doing individual data checks on their own or taking more or less random decisions. This reduces the comparability between different studies. 

In this contribution, we present examples of the challenges that arise when working with large-sample hydrological data. We show the results of comparisons between different data sources that are meant to represent the same variable and how these affect model simulations. The presentation aims to stimulate discussion about a more uniform approach to making decisions on which data to use when working with large-sample hydrological datasets. 

How to cite: Clerc-Schwarzenbach, F., Vis, M., van Meerveld, I., and Seibert, J.: So many catchments, so many choices: challenges with large-sample hydrological datasets  , EGU General Assembly 2026, Vienna, Austria, 3–8 May 2026, EGU26-11939, https://doi.org/10.5194/egusphere-egu26-11939, 2026.

EGU26-12200 | ECS | PICO | HS2.4.2

UK-Flow15: Sub-hourly river flow data observations from 1369 river gauges in the UK, 1948-2023 

Felipe Fileni, Hayley J. Fowler, Elizabeth Lewis, Fiona McLay, Gemma Coxon, David Archer, Emma Bruce, Longzhi Yang, Matt Fry, Hollie Cooper, and Ollie Swain

High-resolution (15-min) river flow records date back almost a century in the UK. Nevertheless, these data have historically been used only in small-scale studies or operational contexts. A key reason for this limited applicability is that, unlike rainfall, which benefits from established national sub-daily products that are easily accessible (e.g. CEH-GEAR1hr and GRaD-GB), no equivalent unified sub-daily flow product has been available at the national scale. At the same time, the rapid growth of large-sample studies has transformed the field of hydrology, enabling insights into spatial patterns, flood-generating mechanisms and assessing model performance across regions. However, most large-sample hydrological datasets still rely on daily series, whose coarse temporal resolution is insufficient to represent flood-event dynamics, which often unfold on sub-daily timescales.

The creation of UK-Flow15 (available at https://doi.org/10.5285/211710ac-f01b-4b52-807f-373babb1c368) is motivated by these two limitations: the absence of a national high-resolution flow dataset for the UK and the clear scientific value enabled by large-sample analyses. The new national-scale 15-minute dataset comprises >1.8 billion observations from 1,369 gauging stations, spanning 1948–2023.

Producing UK-Flow15 required extensive harmonisation, metadata reconciliation and cross-checks to resolve structural inconsistencies. Historically, the 15-minute records received far less attention than the daily and AMAX datasets derived from them, leaving the high-resolution series inconsistently digitised, stored in multiple versions and rarely subjected to the same level of quality control or metadata curation.

Furthermore, to ensure the dataset is FAIR, we developed and applied a comprehensive quality-control procedure designed to inform users about data quality and limitations. Flagging involved manual visual inspection of all stations, consistency checks against other UK hydrological products, and automated detection of common anomalies such as spikes, truncations, discontinuities, fluctuations and other artefacts. Additional high-flow checks assess the plausibility of extreme events by comparing them with rainfall at the location and concurrent flows in nearby catchments, highlighting cases where they may be hydrologically inconsistent.

UK-Flow15 and its QC framework form a robust standalone product, providing trustworthy, well-documented sub-hourly flow data. Beyond this, the dataset supports the enhancement of other large-sample products, including CAMELS-GB v2. Additionally, the QC system is also adaptable, offering a methodology that can be extended to the creation of other sub-daily/hourly hydrological datasets.

In this work, we aim to demonstrate how UK-Flow15 was processed, what data it contains and how it can be used. We outline the harmonisation and QC workflow applied to produce consistent national 15-minute records. We present the complete flow series, QC flags and metadata now openly accessible. We highlight applications for large-sample studies, flood-wave characterisation and hydrological model evaluation. We hope the dataset contributes to better-informed decisions on sub-daily flood processes at large scale.

How to cite: Fileni, F., Fowler, H. J., Lewis, E., McLay, F., Coxon, G., Archer, D., Bruce, E., Yang, L., Fry, M., Cooper, H., and Swain, O.: UK-Flow15: Sub-hourly river flow data observations from 1369 river gauges in the UK, 1948-2023, EGU General Assembly 2026, Vienna, Austria, 3–8 May 2026, EGU26-12200, https://doi.org/10.5194/egusphere-egu26-12200, 2026.

EGU26-12386 | ECS | PICO | HS2.4.2

CAMELS-DE-1h: Advancing Large-Sample Hydrological Modeling by Shifting to the Hourly Scale 

Alexander Dolich, Eduardo Acuña Espinoza, Uwe Ehret, Jan Bondy, and Ralf Loritz

CAMELS datasets have been primary accelerators for Large-Sample Hydrology (LSH), providing extensive, harmonized hydro-meteorological data and establishing benchmarks that have fundamentally changed how data-driven models in Hydrology are developed and evaluated. However, to date, these efforts have predominantly focused on daily resolution. While the overall performance of deep learning models for daily rainfall-runoff modelling has reached a high standard - often plateauing with "vanilla" LSTMs - significant challenges remain. These include the accurate representation of flood peaks, drought dynamics, performance under non-stationary conditions, and the capturing of rapid events in small catchments. Although initial LSH studies have explored hourly data, fully exploiting sub-daily information remains an open and pressing challenge. The shift to high-resolution datasets offers the potential to improve modeling extreme floods and their dynamics and to capture runoff generation processes also in smaller catchments. However, this transition requires a reassessment of the current state-of-the-art: do the limitations of daily modelling persist at the hourly scale, are they resolved by higher resolution data, and which entirely new challenges arise?
To address these questions and facilitate the transition to sub-daily LSH, we introduce CAMELS-DE-1h, a comprehensive hourly dataset for Germany. It covers 1626 catchments with streamflow and meteorological forcing data spanning 2001 - 2024. Uniquely, CAMELS-DE-1h includes historical short-term meteorological forecasts (ICON-D2, 48 hours lead time) from 2021 - 2024, both as deterministic and ensemble forecasts. This novelty enables rigorous research regarding the propagation of meteorological uncertainty into hydrological predictions and the development of deep learning models for operational settings. With CAMELS-DE-1h, we provide open-source LSTM benchmarks for both discharge simulation and forecasting, and use these benchmarks to evaluate the transition from daily to hourly simulations. Specifically, we analyze how the transition to hourly resolution alters model behavior regarding peak flow timing and hydrograph shape, and discuss the challenges such as computational costs and the need for evaluation metrics adapted to sub-daily Large-Sample Hydrology.

How to cite: Dolich, A., Acuña Espinoza, E., Ehret, U., Bondy, J., and Loritz, R.: CAMELS-DE-1h: Advancing Large-Sample Hydrological Modeling by Shifting to the Hourly Scale, EGU General Assembly 2026, Vienna, Austria, 3–8 May 2026, EGU26-12386, https://doi.org/10.5194/egusphere-egu26-12386, 2026.

EGU26-12861 | PICO | HS2.4.2

Expanding CAMELS-CH: increasing resolution and including new assets 

Martina Kauzlaric, Bailey J. Anderson, Paul C. Astagneau, Paolo Benettin, Marius Floriancic, Pascal Horton, Basil Kraft, Thiago Nascimento, Jan Schwanbeck, Rosi Siber, Maria Staudinger, Daniel Viviroli, and Maria Grazia Zanoni

New CAMELS (Catchment Attributes and MEteorology for Large-sample Studies) datasets have been increasingly released over the past decade and have allowed for the collection and dissemination of about twenty national datasets, comprising thousands of catchments all around the world. This community effort of providing hydro-meteorological time series alongside relevant catchment attributes is essential for improving hydrological process understanding and modelling across a wide range of conditions. However, the high nonlinearity of the hydrological system and scaling problems in hydrology call for expanding CAMELS datasets to different scales. Most CAMELS datasets provide daily catchment-scale time series, limiting their applicability for sub-daily processes and scaling analyses. Processes such as rainfall–runoff timing, flood generation in mountainous regions, and human flow regulation operate at sub-daily scales and cannot be adequately captured by daily data. Here, we present first efforts to upgrade the existing CAMELS-CH dataset by increasing its temporal and spatial resolution. In addition to hourly hydro-meteorological time-series and statistics extracted at an even higher temporal resolution, we subdivide hydrological Switzerland into topographical catchment units of about 2km2, in order to allow for building nested catchments within the gauged catchments and for performing analyses at different scales. We also include additional attributes related to human influence and the impact of hydropower on streamflow. This dataset will be a valuable resource for different hydrological applications, and will enable the first consistent hydrological benchmarks at different spatial and temporal scales in a highly varying environment such as hydrological Switzerland.

How to cite: Kauzlaric, M., Anderson, B. J., Astagneau, P. C., Benettin, P., Floriancic, M., Horton, P., Kraft, B., Nascimento, T., Schwanbeck, J., Siber, R., Staudinger, M., Viviroli, D., and Zanoni, M. G.: Expanding CAMELS-CH: increasing resolution and including new assets, EGU General Assembly 2026, Vienna, Austria, 3–8 May 2026, EGU26-12861, https://doi.org/10.5194/egusphere-egu26-12861, 2026.

EGU26-12908 | PICO | HS2.4.2

Setting the Bar: Benchmarks for Model Performances in Large-Sample Hydrology 

Jan Seibert, Marc Vis, and Sandra Pool

Large-sample datasets have become available for many regions worldwide, and their availability has changed hydrological catchment modelling. Assessing model performance is an essential component of most large-sample applications. When assessing model performance, an important question is how to interpret the values of performance measures. We have previously shown that the performance of an uncalibrated bucket-type model varies significantly across regions. In humid or snow-dominated catchments,  NSE values of 0.8 or higher can be reached with an uncalibrated model, which are values often considered as good. This implies that using a fixed value for a performance measure to judge model performance, as sometimes suggested in the literature, is inappropriate. Instead, one should consider that given the local hydroclimatic conditions and the available data quality, the performance we should expect from any model in a particular catchment can vary widely. At the same time, a perfect fit (value of 1) is usually impossible to achieve due to model and data errors and uncertainties. Therefore, it is helpful to compare model performances to lower and upper benchmarks.

The purpose of this study was two-fold. First, we examined how to compute lower performance bounds from randomly chosen parameter sets, including guidance for appropriate ensemble sizes, the effects of parameter ranges, and the selection of parameter sets. We also examined the relationships between lower and upper benchmarks and catchment characteristics.  Secondly, we utilised these findings to compute both lower and upper benchmarks for many of the existing CAMELS datasets. By providing these values to the modelling community, we aim to facilitate the broader use of lower and upper benchmarks in large sample hydrological modelling studies. We argue that these values are valuable to the hydrological modelling community, as they provide a basis for benchmarking model performance across the various CAMELS datasets. This will allow assessment of model performance, considering what one could and should expect for a particular catchment. Such assessments are important, for instance, when one seeks to evaluate the adequacy of model structures or compare approaches for the prediction in ungauged basins.

How to cite: Seibert, J., Vis, M., and Pool, S.: Setting the Bar: Benchmarks for Model Performances in Large-Sample Hydrology, EGU General Assembly 2026, Vienna, Austria, 3–8 May 2026, EGU26-12908, https://doi.org/10.5194/egusphere-egu26-12908, 2026.

Catchment descriptors are standard explanatory factors for catchments hydrological signatures, they are widely used to infer dominant hydrological processes, identify and transfer information across similar catchment, and upscale findings from smaller to larger scales. However, conventional approaches for deriving catchment descriptors use spatial averages over the catchment, that overlook the inherent spatial variability arising from geomorphological catchment organization. This could explain the limited accuracy of existing models to predict hydrological responses across catchments. In this study, we examine the potential of topography to capture the spatial variability of catchment descriptors. We weight various catchment descriptors with four topographic metrics reflecting distinct aspects of spatial variability, namely, horizontal channel proximity (distance to nearest drainage), vertical drainage potential (height about the nearest drainage), flow-path length (distance to outlet), and river network hierarchy (stream order). We test their added value of the enhanced descriptors to predict mean values and variability of streamflow event characteristics (event runoff coefficient, time scale, rise time) in 392 German catchments.

Results show considerable improvement in prediction accuracy of mean event rise time and time scale using catchment descriptors weighted with distance to the nearest drainage and outlet compared to standard averaged descriptors. The proximity to the drainage that effectively controls the travel time likely to exert a strong control of shape and timing of event hydrographs. The prediction of the variability of event runoff coefficient improved considerably using when descriptors weighted with height above the nearest drainage. The latter effectively captures the soil moisture levels and channel saturation that likely controls the variability of runoff coefficients. However, predictions of the mean runoff coefficient, and variability of event time scale and rise time exhibited minimal gains. This indicates that these characteristics are rather governed by the climate and soil properties at larger scale, while their smaller scale variability plays only minor role. These findings demonstrate how topographic metrics serve as effective proxies for catchment geomorphological organization. The derived topographically-enhanced catchment descriptors have potential to improve predictions of hydrological signatures

How to cite: Tarasova, L., Ziani, C., and Ribbe, L.: The use of topographically-enhanced catchment descriptors to improve the predictions of streamflow events characteristics across German catchments, EGU General Assembly 2026, Vienna, Austria, 3–8 May 2026, EGU26-13583, https://doi.org/10.5194/egusphere-egu26-13583, 2026.

EGU26-13662 | PICO | HS2.4.2

GRIT-ADB: A Global Hydro-Environmental Attributes Database for the GRIT Hydrography 

Boen Zhang, Michel Wortmann, Yinxue Liu, Simon Moulds, and Louise Slater

Global hydro-environmental databases provide essential information for large-scale hydrological, ecological, and environmental analyses. Most existing global databases are built upon convergent river representations that do not explicitly capture bifurcating river systems. In addition, these databases primarily rely on long-term climatology or static summaries of environmental conditions derived from legacy datasets, limiting their applicability for analyses of hydroclimatic and geomorphological processes. Here we present GRIT-ADB, a new global hydro-environmental database tied to the vectorised Global River Topology (GRIT) database at 30 m resolution that provides a topology-explicit and physically realistic representation of river networks including divergent flow pathways. GRIT-ADB provides standardised hydro-environmental information for 19.6 million km of global streams and rivers. The database comprises around 60 time-varying and static attributes spanning five categories: hydrology, physiography, climate, land cover and use, and soils and geology. Hydro-environmental attributes are derived by aggregating and harmonising data from state-of-the-art global datasets and are accumulated along the river network from headwaters to basin outlets while preserving the topology of divergent flow pathways. The attributes are linked to multiple GRIT scales, including hierarchically-nested subbasins, individual 1km river reaches, and coarser-scale river segments (several kilometres long). By combining a standardised attribute framework with explicit representation of bifurcating river hydrography, GRIT-ADB enables improved large-scale analyses of river connectivity, hydrological extremes, hydro-ecological processes, and environmental change in complex river systems, supporting a wide range of global hydrological and environmental applications.


How to cite: Zhang, B., Wortmann, M., Liu, Y., Moulds, S., and Slater, L.: GRIT-ADB: A Global Hydro-Environmental Attributes Database for the GRIT Hydrography, EGU General Assembly 2026, Vienna, Austria, 3–8 May 2026, EGU26-13662, https://doi.org/10.5194/egusphere-egu26-13662, 2026.

EGU26-14445 | ECS | PICO | HS2.4.2

Memory decay curves describe streamflow dynamics across Europe at multiple timescales 

Mira Anand and Wouter Berghuijs

Streamflow is typically autocorrelated, and the degree to which prior conditions influence river flow informs how we predict future conditions and can drive temporal clustering of hydrological extremes. We introduce a memory decay curve that describes streamflow memory (i.e. autocorrelation) based on two components: initial strength and persistence. These curves effectively summarize the dynamics of catchment memory at monthly to multi-annual timescales, allowing for large-sample inter-catchment comparisons.

We fit these memory decay curves to streamflow measurements from thousands of EStreams stations across Europe from 1980-2021. From these curves, we distinguish four basic memory archetypes based on the combination of strong (or weak) memory and long (or short) persistence. These archetypes exhibit distinct geographic patterns across Europe, with strong and long memory most present in regions with large aquifers or deep bedrock.

Streamflow memory at different timescales shows varied connections to different surface, subsurface, and climate characteristics. We use a random forest model to predict memory from these characteristics at multiple timescales, with the highest skill for seasonal and the lowest skill for yearly predictions. Surface-related features (e.g. topography) influence model predictions at shorter timescales, whereas subsurface feature importances increase with lag time; climate features, in particular aridity, are important across all timescales. We also compare the memory present in observation-based data to the memory produced by modelled streamflow for Europe to understand how well these dynamics are represented in modelled data. The memory decay curves presented in this study demonstrate the presence of hydrologic memory in European catchments at timescales from months to years and can improve the understanding and prediction of streamflow dynamics.

How to cite: Anand, M. and Berghuijs, W.: Memory decay curves describe streamflow dynamics across Europe at multiple timescales, EGU General Assembly 2026, Vienna, Austria, 3–8 May 2026, EGU26-14445, https://doi.org/10.5194/egusphere-egu26-14445, 2026.

All societies, economic sectors, and ecosystems depend on and influence the flows and storages of terrestrial water, both as vital freshwater resources and as sources of flood and drought risk. Robust assessment of the conditions and changes of these flows and storages relies on the availability, consistency, and physical realism of hydro-climatic datasets. Here, we evaluate four widely used global hydro-climatic datasets with harmonized spatiotemporal coverage (Zarei and Destouni, 2024): (i) Obs, based solely on in-situ observations; (ii) Mixed-GLEAM, combining the same observational data with model-based GLEAM evapotranspiration; and the fully model-based reanalysis products (iii) GLDAS and (iv) ERA5. 

Comparatively across these datasets, we analyze long-term means and trends across 1,561 catchments worldwide and for four regions: the Baltic (with 69 catchments), Mediterranean (182), South America (95), and Sub-Saharan Africa (127), over the period 1980–2010. All datasets consistently show large-scale spatial trends of increasing mean temperature, precipitation, evapotranspiration, and runoff from high latitudes toward the equator. In contrast, estimates of water-storage change (DS) and its spatial patterns differ markedly among datasets. GLDAS exhibits near-zero long-term average DS, implying no systematic drying or wetting, whereas ERA5 indicates predominantly strong negative DS (systematic drying), except in the Baltic region where positive DS (systematic wetting) dominates. Temporal trend analyses further show agreement among datasets for rising temperatures, but weaker, often insignificant, and divergent change trends in precipitation, runoff, and evapotranspiration, both in magnitude and direction. Overall, the intercomparison reveals that ERA5 departs substantially from observation-based estimates and from the other datasets, with systematic biases and physically implausible implications for the terrestrial water fluxes and storage changes across regions and globally. 

Physically inconsistent storage-change implications affect inferred runoff-generation processes, hydrological memory, and model parameter transferability in large-sample applications and catchment modeling. The dataset intercomparison results raise fundamental concerns regarding the suitability of ERA5 for large-sample assessments of terrestrial water variability and change. In general, constraining the assessments by catchment-wise water-balance linkages and closure offers a valuable framework for diagnosing dataset realism and advancing unified understanding of the climate-and-water interplay across regions and scales.

Reference: Zarei, M., Destouni, G. (2024). A global multi catchment and multi dataset synthesis for water fluxes and storage changes on land. Scientific Data, 11, 1333.

How to cite: Destouni, G. and Zarei, M.: Understanding Hydro-climatic Variability and Change Across World Regions and Scales: A Multi-Catchment, Multi-Dataset Approach, EGU General Assembly 2026, Vienna, Austria, 3–8 May 2026, EGU26-15027, https://doi.org/10.5194/egusphere-egu26-15027, 2026.

This presentation will introduce version 2 (v2) of the Australian edition of the Catchment Attributes and Meteorology for Large-sample Studies (CAMELS) dataset. Since its initial release in 2021, CAMELS-AUS has been important in advancing research on hydrological change, arid-zone hydrology, and hydrological model refinement, with uptake by researchers both in Australia and internationally. This update significantly expands the dataset's scope and utility. The number of catchments covered has more than doubled, increasing from 222 to 561. Temporal coverage has been extended by eight years, now reaching 2022, compared to 2014 in the previous version. Furthermore, the quality and depth of attribute information has been enhanced, with improvements in information regarding hydrological signatures and streamflow uncertainty quantification. These  changes position CAMELS-AUS v2 as an improved and up-to-date resource for hydrological research and practical applications across Australia. CAMELS-AUS v2 is freely downloadable from https://doi.org/10.5281/zenodo.12575680

How to cite: Fowler, K., Ziqi, Z., and Xue, H.: Updating CAMELS-AUS to increase the catchment sample, lengthen hydrometeorological timeseries, and improve attribute information, EGU General Assembly 2026, Vienna, Austria, 3–8 May 2026, EGU26-16172, https://doi.org/10.5194/egusphere-egu26-16172, 2026.

EGU26-16673 | PICO | HS2.4.2

Is smart sampling helping to train more efficent deep learning model in Hydrology? 

Benedikt Heudorfer and Ralf Loritz

With increasingly large samples being used in deep learning hydrology, the computational cost of training models such as Long Short-Term Memory (LSTM) networks raises fundamental questions about how much (and which type of) data are actually needed. This study investigates the information content of different training data subsets and their impact on predictive skill. To do so, we systematically train LSTM models on progressively larger subsamples of the CAMELS-US dataset, using 11 different ablation/subsampling strategies that emphasize different parts of the training data, associated with different hydrological regimes, statistical representativity, temporal context, and spatial coverage. We then evaluate LSTM performance gains as a function of subsample size.

As training data volume increases, performance gains saturate more or less rapidly depending on the specific strategy tested. Random sampling emerges as the most robust and efficient strategy, achieving strong predictive skill (NSE > 0.7) with roughly 10% of the available data, illustrating high representativity of the full dataset. Temporal ablations reveal that surprisingly short input sequences (≈ 2 weeks) and limited historical records (≈ 2 years) suffice for competitive performance (NSE > 0.7), highlighting the value of including much shorter time series into datasets like CAMELS than previously assumed valuable. In contrast, although high-flow conditions have been shown in literature to be particularly information-rich, exclusively training on extremes underperforms compared to above-mentioned ablation strategies in our setup. Likewise, we show that spatial subsampling substantially limits generalized performance, underscoring the importance of spatial hydro-climatic diversity.

Overall, the results demonstrate that training efficiency in data-driven hydrology is governed more by data representativity than by targeted selection of e.g. specific event types. These findings provide practical guidance for cost-effective model development, pre-training, and experimental design in large-sample hydrologic deep learning.

How to cite: Heudorfer, B. and Loritz, R.: Is smart sampling helping to train more efficent deep learning model in Hydrology?, EGU General Assembly 2026, Vienna, Austria, 3–8 May 2026, EGU26-16673, https://doi.org/10.5194/egusphere-egu26-16673, 2026.

EGU26-16675 | ECS | PICO | HS2.4.2

Feature importance for deep learning rainfall-runoff modeling in the boreal zone 

Iiro Seppä, Daniel Klotz, Carlos Gonzales Inca, and Petteri Alho

Despite deep learning’s recent performance dominance in rainfall-runoff modeling, we still don’t know which variables truly matter in the boreal zone for it. Only a few studies have attempted to determine what variables have largest influence on the prediction quality, and none have done so in the boreal zone. Most feature importance studies have also failed to account for the strong relationships between different covariates present in hydrometeorological datasets and the detrimental effects these pose for many popular feature importance methods. The aim of this study is to address this research gap and increase knowledge on the dominant drivers of rainfall-runoff processes in the boreal zone. More specifically, we sought to create a ranking of feature importances for large selection of catchments and to identify and explain regional differences in the importances.

As a baseline, an ensemble of long short-term memory networks was trained to predict daily runoff for 101 Finnish catchments using 13 dynamic meteorological variables and 36 static attributes from the CAMELS-FI (Catchment Attributes and MEteorology for Large-sample Studies, FInland) dataset. To robustly determine feature importance, three different methods were employed, each involving leaving variables out, retraining the model and evaluating the change in performance, across several performance metrics. The first method was leave-one-covariate-out (LOCO), second was leave-one-covariate-in (LOCI) and third excluded the variable of interest as well as all the correlated variables (leave-one-group-out, LOGO). LOCI was implemented separately to static and dynamic features, such that static features received all dynamic inputs and vice versa.

The results demonstrate significant variations in feature importance both between the different setups and among catchments. The baseline mode performed excellently (mean KGE 0.85). LOCI revealed that snow-related information is more important than precipitation outside the southwest coast of Finland, for multiple metrics related to mean and high flow conditions. This is much further south than previous research has suggested. However, precipitation was the only feature with substantial decline in performance in a LOCO setting (mean KGE 0.74), indicating that it provides information that is both important and unique and that other features are (almost) fully reconstructible from collinear features. Removal of all static attributes reduced the predictive power of the model substantially (mean KGE 0.67). The decline in performance was not spatially uniform. It was greatest in catchments that deviate most from ”average” catchment properties, particularly those with large lake area. The importance of lakes is further supported by the fact that the performance can be mostly restored by reintroducing lake area percentage back to the data (mean KGE 0.79).

This study highlights three key considerations for feature importance analysis in data driven hydrological modeling.

First, focusing solely on global feature importance overlooks regional differences and variables that are important to specific catchments.

Second, hydrologists should account for the correlation structure of hydrological datasets, both when selecting a feature importance method and when interpreting the results.

Third, we argue that the methods examined here measure different aspects of feature importance, and none alone would be sufficient to provide a complete understanding.

How to cite: Seppä, I., Klotz, D., Gonzales Inca, C., and Alho, P.: Feature importance for deep learning rainfall-runoff modeling in the boreal zone, EGU General Assembly 2026, Vienna, Austria, 3–8 May 2026, EGU26-16675, https://doi.org/10.5194/egusphere-egu26-16675, 2026.

EGU26-18868 | ECS | PICO | HS2.4.2

Sensitivities of mean and extreme streamflow to precipitation variability across Europe 

Anna Luisa Hemshorn de Sánchez, Wouter Berghuijs, Anne F. Van Loon, Dimmie Hendriks, and Ype van der Velde

Understanding large-scale patterns in streamflow response to precipitation variability helps identifying places where precipitation changes most strongly affect streamflow. This study presents the sensitivity of annual streamflow of over 8,000 European catchments to annual and seasonal precipitation variability, as measured by observation-based streamflow elasticities. We extend the scope of the conventionally studied mean flows by incorporating annual maximum and minimum flows as well. As anticipated, both annual mean and extreme flows generally increased with higher annual mean precipitation. On average for Europe, a 1% change in annual precipitation on average resulted in an amplified flow response of 1.2% in annual mean flows, an even stronger amplification of 1.3% in annual maximum flows, and a dampened response of 0.9% in annual minimum flows. These elasticities exhibited distinct regional patterns. Northern Poland and the Baltic States featured remarkably insensitive mean and extreme streamflow. Furthermore, annual maximum flows in the mountainous Central Europe were highly sensitive to summer precipitation. In Spain, a high elasticity of mean and maximum flows to winter precipitation was observed. The elasticity of low flows appeared to be more localised and less related to precipitation variability. We then employed a random forest model that incorporated 20 climate and catchment characteristics to examine their relationship with streamflow elasticities and identify the climate characteristics exhibiting the strongest correlation. Despite the high number of characteristics included the model’s capacity to predict the elasticities based on the selected input variables was relatively low, suggesting that some key drivers remain unaccounted for. An important factor influencing streamflow elasticities that was not comprehensively addressed through the random forest input variables is human activity. To further explore the human influence on streamflow response to precipitation, we studied approximately 150 Dutch catchments with varying degrees of human influence. We used six hydrological signatures to group the catchments into typologies of similar behaviour and analysed whether these typologies are related to the degree of management. This research advances our understanding of mean and extreme streamflow responses across regional and large scales.

How to cite: Hemshorn de Sánchez, A. L., Berghuijs, W., Van Loon, A. F., Hendriks, D., and van der Velde, Y.: Sensitivities of mean and extreme streamflow to precipitation variability across Europe, EGU General Assembly 2026, Vienna, Austria, 3–8 May 2026, EGU26-18868, https://doi.org/10.5194/egusphere-egu26-18868, 2026.

Conceptual bucket-type models have been a mainstay in hydrology for decades due to their simplicity and flexibility. With the emergence of large-sample datasets regional applications of these models has become increasingly feasible and relevant. However, challenges remain: how can we ensure consistent modeling across catchment boundaries, and do typical model setups capture the dominant processes shaping regional water cycles?

To address these challenges, we first leverage large datasets, including CAMELS-DE and thousands of groundwater level time series across Germany, to build and validate a conceptual, fully distributed hydrological model at the national scale. Using the SALTO model as an example, we demonstrate how the Parameter Set Shuffling (PASS) approach enables regional calibration while accounting for spatial variability.

We discuss strategies to incorporate anthropogenic impacts into regional water cycle modeling, including reservoirs, dams, drinking water abstraction, and wastewater return flows. By integrating these human influences, our approach provides a more realistic representation of Germany’s hydrology.

Additionally, we introduce an event-based model diagnostic framework that identifies which hydrological conditions are reliably represented by the model structure and highlights the potential of large-sample data to improve regional hydrological modeling.

How to cite: Merz, R. and Wang, Z.:  Scaling Up Buckets – Using large sample data to build a regional hydrological model, EGU General Assembly 2026, Vienna, Austria, 3–8 May 2026, EGU26-18887, https://doi.org/10.5194/egusphere-egu26-18887, 2026.

The rise of Large Sample Hydrology has given hydrologist the data and tools to systematically analyze the behavior and characteristics of catchments across the globe: across different climate regimes, geologies, countries and continents, gaining insights in what are local, versus what are global phenomena. With this work we launch large sample hydrology into the future by providing a unified workflow to derive forcing from any CMIP6 climate model and scenario for any catchment available in the CARAVAN dataset. We will present which regions, from a hydrological point of view, are expected to be hardest hit by climate change.


We present a reproducible, FAIR-by-design workflow built on the eWaterCycle platform that enables climate change impact simulations using multiple hydrological models across any catchment from the CAMELS and CARAVAN datasets. eWaterCycle is a platform that facilitates open and FAIR hydrological modeling research. Different models are seamlessly integrated into eWaterCycle as plugins using software containers and the Basic Model Interface (BMI). Because of the clear separation between experiment and model, running the same experiment with different models is straightforward.

Recently, we hosted the CARAVAN dataset on a remote (OpenDAP) server and added support in eWaterCycle to access catchment data with a single line of code. Combined with our existing functionality to generate hydrological forcing data from any CMIP6 climate model run, this now makes it easy to perform climate change impact analyses for any catchment in the CARAVAN dataset.

We will demonstrate how any hydrological modeler or researcher can use this workflow today. The workflow consists of a collection of Jupyter notebooks that anyone can use to conduct their own climate change impact analyses. We will highlight how these standardized workflows have enabled undergraduate students to independently carry out impact analyses on a region and problem of their own choosing for their thesis.

This is also an open invitation to anyone interested in performing climate change impact analyses or hydrological modeling using the CARAVAN datasets: eWaterCycle is freely available to use, and we welcome collaborations.

How to cite: Hut, R. and Melotto, M.: Climate scenario data for all of CARAVAN shows which regions will be hit hardest by Climate Change, EGU General Assembly 2026, Vienna, Austria, 3–8 May 2026, EGU26-19775, https://doi.org/10.5194/egusphere-egu26-19775, 2026.

EGU26-21812 | ECS | PICO | HS2.4.2

Comparison of deep learning and conceptual models for the prediction of flood statistics in ungauged catchments in France 

Paul Royer-Gaspard, Olivier Robelin, Mathilde Puche, and Magali Troin

Predicting flows in ungauged basins is a key challenge for integrated water resource management and hydrological risk prevention. To fill these gaps, regionalization approaches have generally relied on conceptual or physically-based hydrological models whose parameters are calibrated on gauged rivers and then transferred to ungauged rivers. However, these methods often have significant limitations in terms of robustness and accuracy, particularly when applied in heterogeneous hydrological contexts [1].

With the growing adoption of machine and deep learning by the hydrological community, new opportunities are emerging for operational hydrology. In particular, recurrent neural networks such as Long Short-Term Memory networks (LSTM) have proven to be effective in exploiting large databases of observed flows and climate forcings compared to traditional locally or regionally calibrated approaches [2]. Nevertheless, LSTM is still rarely used in France for prediction outside of a few research projects (e.g. [3,4]).

The objective of this study is to compare an LSTM model with the GR5J model [5,6] in a regionalization exercise with a special focus in flood prediction. The evaluation is carried out on the French catchments of the Explore 2 project, which gather more than 600 catchments [7]. The GR5J model, which stands for Génie Rural Journalier à 5 Paramètres (5-parameter daily rural engineering model), is a widely used reference model in catchment hydrology modeling due to its simplicity and flexibility. GR5J parameters are regionalized with different algorithms, including traditional spatial proximity and catchment similarity methods as well as a machine learning method based on random forest regression [8]. A direct assessment of flood statistics is also performed with random forest regression as a benchmark for flood prediction.

The models are evaluated according to global criteria as well as hydrological signatures representative of flood hazards. The hydrological characteristics of the catchments are analyzed to identify favorable and unfavorable conditions for regionalization.

This study discusses the prospects offered by deep learning for hydrological regionalization and its future integration into operational applications such as hydrological projection.


[1] Guo et al. (2020). https://doi.org/10.1002/wat2.1487

[2] Kratzert et al. (2019). https://doi.org/10.5194/hess-23-5089-2019

[3] Hashemi et al. (2022). https://doi.org/10.5194/hess-26-5793-2022

[4] Puche et al. (2026, in review). http://dx.doi.org/10.2139/ssrn.5286855

[5] Perrin et al. (2003). https://doi.org/10.1016/S0022-1694(03)00225-7

[6] Le Moine (2008). https://hal.inrae.fr/tel-02591478v1

[7] Sauquet et al. (2025). https://doi.org/10.5194/egusphere-2025-1788

[8] Saadi et al. (2019). https://doi.org/10.3390/w11081540

How to cite: Royer-Gaspard, P., Robelin, O., Puche, M., and Troin, M.: Comparison of deep learning and conceptual models for the prediction of flood statistics in ungauged catchments in France, EGU General Assembly 2026, Vienna, Austria, 3–8 May 2026, EGU26-21812, https://doi.org/10.5194/egusphere-egu26-21812, 2026.

EGU26-25 | ECS | Orals | HS2.4.3

Impact of farm dams on streamflow using an objective low-flow threshold from in-stream artificial barriers 

Paulina Gutierrez Ramos, David Robertson, Rebecca Lester, and Ty Matthews

Human activity has significant impacts on the river systems. In-stream infrastructure, such as dams and weirs, creates artificial barriers that impede fish passage during periods of low flow; and off-stream structures, such as agricultural farm dams, intercept and extract water. These structures reduce inflow to rivers and extend the frequency and duration of low flow conditions. While the impacts of water interception by farm dams on long-term streamflow have previously been investigated, the consequences for frequency and duration of low flow periods, are poorly understood.  In this study, we estimated the influence of farms dams on annual streamflow and on low flow requirements that ensure water flows over in-stream weirs of different heights for the Moorabool River catchment located in southeast Australia. Streamflow in the Moorabool River was simulated using the hydrological model Genie Rural a 4 parametres Journalier (GR4J) + CHEAT1 to assess the potential impact of farm dams on low flows, using data between 1980 to 2020. The spatial and temporal distribution of farm dams and their storage capacity was estimated using remote sensing. Low flow requirements were calculated measuring cease-to-flow conditions in three weirs in the river, and a low flow spell analysis was conducted to assess the impact of farm dams. From 1990-2020, the number of farm dam increased by 163% across the catchment. Including farm dams and water extractions in the hydrological model increased its performance as assessed by the NSE and logNSE. Streamflow reduction was estimated to be between 3% to 65%, contingent on the level of water extractions and number of dams in the catchment. The cumulative impact of farm dams resulted in fewer high flow events and low flows of longer duration. Prevalent low flows would potentially affect the ability of water to go over some weirs. This study presents a comprehensive approach to quantify water resources by including farm dams and measuring cease-to-flow conditions over weirs in the hydrological model. Ongoing hydrological assessments provides a holistic estimate of water resources and determining objective minimum flow requirements to adequately overtop small weirs in a catchment.  

Keywords: farm dams, hydrological model, low flows, river barriers.

How to cite: Gutierrez Ramos, P., Robertson, D., Lester, R., and Matthews, T.: Impact of farm dams on streamflow using an objective low-flow threshold from in-stream artificial barriers, EGU General Assembly 2026, Vienna, Austria, 3–8 May 2026, EGU26-25, https://doi.org/10.5194/egusphere-egu26-25, 2026.

EGU26-171 | ECS | Posters on site | HS2.4.3

WATcycle: Water Analysis Tool for the terrestrial water cycle and water budget 

Roniki Anjaneyulu and Abhishek Abhishek

The complexity, uncertainty, and heterogeneity implicit in multisource data and the dilemma in selecting the objective-specific best dataset make the terrestrial water cycle and water budget analyses challenging across scales. Here, we develop a UI/UX based open-access, flexible, and user-friendly Python software, namely  WATcycle (https://github.com/ronikianji/WATcycle). It is useful for varying levels of expertise, reduces the coding overhead, and offers a range of data processing tools. The entire software has six main steps: (1) Data downloading, (2) Data pre-processing, (3) Residual error analysis of water budget components, (4) Validation of datasets with in-situ data, (5) Data plotting, and (6) water budget closure analysis. We test the developed software using a case study on the Amazon basin, which incorporates 79 datasets from various sources, including precipitation, evapotranspiration, surface runoff, TWS, canopy, soil moisture, and groundwater. The spatial plots and trend analysis results correlate with other studies, showing the decreasing trend for precipitation, surface runoff, canopy water storage anomaly, and soil moisture storage anomaly. Meanwhile, evapotranspiration, terrestrial water storage, and groundwater storage anomalies show an increasing trend. Out of these 7 hydrological variables, precipitation and terrestrial water storage anomaly trends are not significant at a 95% significance level. Water budget analysis shows a residual error of -70 to 60 mm/month, which is adjusted using the proportional redistribution water budget closure method. The results show the performance, accuracy, and capabilities of the developed software. It will play a crucial role in skillful inferences for water resource management, risk assessment, and infrastructure planning in the basins globally.

How to cite: Anjaneyulu, R. and Abhishek, A.: WATcycle: Water Analysis Tool for the terrestrial water cycle and water budget, EGU General Assembly 2026, Vienna, Austria, 3–8 May 2026, EGU26-171, https://doi.org/10.5194/egusphere-egu26-171, 2026.

EGU26-1088 | ECS | Posters on site | HS2.4.3

Control of vegetation and temperature on topsoil water losses 

Martin Johannes Baur, Lucas Vargas Zeppetello, Andrew Friend, and Dara Entekhabi

Due to its location at the interface between land surface and atmosphere, soil moisture (SM) plays an important role in modulating energy, water and carbon fluxes. During periods of decreasing SM, SM loss is dependent on evapotranspiration (ET), drainage and changes in plant water storage. Investigating SM loss can give important insights into these processes. Here we use 24 years of global remote sensing data to investigate how SM loss is controlled by vegetation and temperature. We find that positive vegetation anomalies lead to slower SM loss in most areas, except for cold boreal forests. We hypothesize that these effects arise through competing effects of soil shading, transpiration and root water uptake by the vegetation. The effect that positive vegetation anomalies increase SM loss is limited to high SM conditions and disappears at lower SM, likely due to water stress limiting transpiration. By analyzing temperature and vegetation anomalies jointly we find that the relationship between SM loss and temperature varies between regions, but vegetation cover effects persist across the full range of temperature anomalies. Using a simple energy and moisture budget model we can reproduce observed vegetation and temperature effects, supporting the interpretation that vegetation controls topsoil SM loss through shading and transpiration. We also find widespread positive SM loss trends which indicates accelerated topsoil water cycling, likely due to higher atmospheric water demand driven by increasing temperatures.

How to cite: Baur, M. J., Vargas Zeppetello, L., Friend, A., and Entekhabi, D.: Control of vegetation and temperature on topsoil water losses, EGU General Assembly 2026, Vienna, Austria, 3–8 May 2026, EGU26-1088, https://doi.org/10.5194/egusphere-egu26-1088, 2026.

EGU26-1133 | ECS | Posters on site | HS2.4.3

How groundwater trends modulate soil moisture feedback and summer heatwave frequency 

Anastasia Vogelbacher, Milad Aminzadeh, Kaveh Madani, Amir AghaKouchak, and Nima Shokri

Soil moisture plays a key role in land-atmosphere interactions by influencing components of the land surface energy balance. It is highly sensitive to variations in groundwater levels, particularly in shallow aquifers where changes in water availability can alter soil moisture dynamics and thus surface fluxes (Vogelbacher et al., 2024). Ongoing declines observed in many of the world's major aquifers (Jasechko et al., 2024) therefore raise questions about potential shifts in soil moisture regimes and their implications for land-atmosphere interactions. In this study, we investigate how aquifer states (i.e., deepening, shallowing, or remaining stable) affect water vapor and heat exchanges between land and atmosphere by focusing on variations of evaporative and sensible heat fluxes. We relate these shifts to extreme heat variations using summer heatwave frequency as a proxy. Our approach integrates groundwater model outputs with in situ measurements over a 16-year period (2000 to 2015) to identify the dominant response variable for each aquifer by calculating correlations between the aquifer trend and environmental variables (e.g., soil moisture, evaporation, soil temperature). Our findings indicate distinct correlation patterns across deepening and stable aquifers, emphasizing the importance of incorporating groundwater dynamics into assessments of soil-moisture temperature feedback and heatwave risk (Vogelbacher et al., 2026). In this context, improved understanding of groundwater land-atmosphere interactions can inform integrative management frameworks that balance hydrological functioning, ecosystem resilience, and human well-being.


References: 

Jasechko, S., Seybold, H., Perrone, D., Fan, Y., Shamsudduha, M., Taylor, R. G., Fallatah, O., & Kirchner, J. W. (2024). Rapid groundwater decline and some cases of recovery in aquifers globally. Nature, 625 (7996), 715–721. https://doi.org/10.1038/s41586-023-06879-8

Vogelbacher, A., Aminzadeh, M., Madani,K., Shokri, N. (2024). An analytical framework to investigate groundwater‐ atmosphere interactions influenced by soil properties. Water Resources Research, 60, e2023WR036643. https://doi.org/10.1029/2023WR036643

Vogelbacher, A., Afshar, M. H., Aminzadeh, M., Madani, K., AghaKouchak, A., & Shokri, N. (2026). A global analysis of the influence of shallow and deep groundwater tables on relationships between environmental parameters and heatwaves. Environmental Research, 289, 123354. https://doi.org/10.1016/j.envres.2025.123354


How to cite: Vogelbacher, A., Aminzadeh, M., Madani, K., AghaKouchak, A., and Shokri, N.: How groundwater trends modulate soil moisture feedback and summer heatwave frequency, EGU General Assembly 2026, Vienna, Austria, 3–8 May 2026, EGU26-1133, https://doi.org/10.5194/egusphere-egu26-1133, 2026.

Conducting attribution analysis of runoff changes serves as a critical scientific basis for unraveling the mechanisms of hydrological process variability and supporting water resources management decision-making. Water discharge into the sea serves as an integrated indicator of basin-scale runoff evolution, and its variation process provides critical reference for assessing river health status. Based on the variability characteristics of water discharge from Yellow River into the sea (WYRS) and considering the frequent flow cessation events during 1972–1998, this study divided the research period into the pre-flow cessation period (1956–1971), flow cessation period (1972–1998), and post-flow cessation period (1999–2022).An improved attribution framework was proposed by combining the high-intensity anthropogenic water withdrawal and consumption processes with the Budyko theory. The results show that the WYRS has declined significantly (p < 0.01) over the past 67 years. Anthropogenic water consumption (AWC) was the dominant factor driving the sharp decline in WYRS during flow cessation period, accounting for 44.45 %. In contrast, changes in underlying surface conditions caused by ecological restoration measures became the primary driver (100.74 %) of further WYRS reduction in the postflow cessation period. Overall, unlike traditional studies based on the Budyko framework, the findings reveal that in addition to the impacts of indirect human activities such as underlying surface changes on runoff in the Yellow River Basin (YRB), direct human activities like AWC also constitute a non-negligible driving factor. This study provides a novel analytical framework for attributing runoff changes in highly human-impacted basins, offering scientific support for water resource management and ecological conservation in the YRB.

How to cite: Zhu, H.: Attribution analysis of runoff evolution in the Yellow River Basin during 1956–2022: A perspective from water discharge into the sea variability, EGU General Assembly 2026, Vienna, Austria, 3–8 May 2026, EGU26-1477, https://doi.org/10.5194/egusphere-egu26-1477, 2026.

EGU26-3231 | Posters on site | HS2.4.3

A Fish Movement Model for Assessing the Impacts of Total Dissolved Gas Supersaturation Downstream of High Dams 

Jianing Rao, Yuanming Wang, Xin-Tong Li, Ruifeng Liang, and Kefeng Li

Total dissolved gas (TDG) supersaturation induced by high-dam discharge poses a severe threat to fish survival and represents a significant ecological risk in high-dam operations. Conducting fish survival risk assessments under TDG supersaturation is a critical component of environmentally friendly hydropower project construction and safe operation, serving as the scientific foundation for developing effective ecological mitigation measures. Based on historical behavioral experimental data of the endemic Upper Yangtze fish species, Schizothorax prenanti, under TDG supersaturation, combining random forest and hierarchical partitioning. this study identifies exposure time, TDG supersaturation level, and water temperature as the primary drivers influencing fish tolerance in TDG supersaturated water, and TDG supersaturation level and body length emerge as key determinants for avoidance capacity. Prediction formulas for mortality and horizontal avoidance rate were established based on these drivers. A fish tolerance model for TDG supersaturated water was constructed through instantaneous probability transformation, peak mortality definition, and non-negativity constraints. Fish movement behaviors were simplified into three core swimming vectors (random swimming, upstream migration, and horizontal avoidance). After calibrating the weight of each vector, a movement model for fish in TDG supersaturated water was constructed. This model was applied to a spawning ground downstream of a cascade hydropower station in the Yalong River to simulate fish movement trajectories and lethal effects in a dynamically changing TDG-supersaturated environment, including the TDG supersaturation levels experienced by fish, locations of death, and time of death. The results indicated fish possessed the ability to detect tributaries and utilize them to evade high TDG. Therefore, when formulating measures to mitigate the impacts of TDG supersaturation on fish, it is essential to fully consider the spatial patterns of river hydrodynamics and TDG distribution, suggesting to utilize tributaries to creat suitable habitats can enhance fish survival rates. This study marks the first application of fish behavioral patterns derived from laboratory experiments to river simulations. The findings provide technical support for developing fish protection measures downstream of high dams and assessing the ecological risks associated with TDG.

How to cite: Rao, J., Wang, Y., Li, X.-T., Liang, R., and Li, K.: A Fish Movement Model for Assessing the Impacts of Total Dissolved Gas Supersaturation Downstream of High Dams, EGU General Assembly 2026, Vienna, Austria, 3–8 May 2026, EGU26-3231, https://doi.org/10.5194/egusphere-egu26-3231, 2026.

Efforts to slow down groundwater depletion requires reliable estimates of the impacts of irrigation on shallow groundwater levels. However, spatial assessment of the effects of irrigation schedule on groundwater level change is still lacking. Here, we present a linked APSIM-MODDLOW model framework to reveal irrigation-groundwater linkages in the plain area of Ziyahe River Basin by considering irrigation schedules, crop yield, ETa and leakage. The linked APSIM-MODLFOW model effectively simulates grain yield and regional groundwater level fluctuations in the winter wheat-summer maize cropping system of the NCP. We found that the simulated grain yield and evapotranspiration increase rapidly with the increase of irrigation frequency, whereas the yield exhibits a gradual increase when irrigation exceeds three times (70 mm each time). The simulated regional average groundwater levels exhibit an increase under rain-fed and single-irrigation scenarios-with irrigation applied at the jointing stage of wheat-whereas a decline is observed under alternative irrigation regimes. These findings indicate that regional groundwater can be replenished through recharge when irrigation schedules range from single-irrigation (applied at the jointing stage of wheat) to double-irrigation (applied at both the jointing stage and the flowering and grain-filling stage of wheat) The unconfined aquifer maintains extraction-recharge equilibrium under the irrigation amount 70 – 140 mm (1-irrigation to 2-irrigations). Spatial distribution of groundwater flow field revealed that to prevent a decline in regional groundwater levels and reduce grain yield loss, the existing 3-irrigations schedule should be maintained in the southern region of study area and Shijin Irrigation District, while a 1-irrigatoin schedule should be implemented in the northern region. These findings can serve as a reference for regional irrigation and groundwater resource evaluation and management. The linked model framework has important implications for other studies where groundwater variations are highly impacted by agriculture irrigation.

How to cite: Liu, X.: Using a linked APSIM-MODFLOW model framework to quantify the impact of irrigation frequency on groundwater level in a typical groundwater over-exploitation region of NCP , EGU General Assembly 2026, Vienna, Austria, 3–8 May 2026, EGU26-6297, https://doi.org/10.5194/egusphere-egu26-6297, 2026.

EGU26-6530 | ECS | Orals | HS2.4.3

Revegetation and increased precipitation lead to a drying-to-wetting hydrological regime shift in the Loess Plateau of China 

Yingxi Zeng, Cong Wang, Guangyao Gao, Vinícius B. P. Chagas, Shuai Wang, Yu Liu, and Bojie Fu

The hydrological cycle has been intensifying globally during the past decades, causing long-term irreversible impacts on the social ecological system. However, research on hydrological regime shifts and their driving mechanisms remains limited. In this study, we selected 13 basins across the Loess Plateau and classified their hydrological regimes from 1990 to 2020 into distinct types using combined indicators of extreme drought and flood flows. Our analysis identified 2005 as the turning point for extreme flows. Hydrological regimes transitioned from a drying trend phase (1990-2005) to a wetting trend phase (2005-2020), characterized by decreasing drought and flood flows before 2005 but increasing trends thereafter across all basins. This shift exhibits a distinct north–south contrast, with larger changes in extreme flows in the northern region than in the southern region. During the drying phase, increased vegetation cover and water use, coupled with reduced mean available water (Mean P-ET, precipitation minus evapotranspiration), were the primary drivers of intensified drying. The wetting phase was triggered by elevated vegetation cover and maximum 14-day available water (Max. P-ET).​​ Notably, vegetation cover emerged as key driver of the drought flows in both periods (p < 0.001), though its regulatory mechanisms shifted between the two phases. Flood flows were influenced by water use and water availability, showing particular sensitivity to variations in Max. P-ET. The shift in hydrological regime suggests that priority should be given to enhancing flood prevention and regulation in future basin management, especially for the northern regions where they are more susceptible to climate change and human activities.

How to cite: Zeng, Y., Wang, C., Gao, G., Chagas, V. B. P., Wang, S., Liu, Y., and Fu, B.: Revegetation and increased precipitation lead to a drying-to-wetting hydrological regime shift in the Loess Plateau of China, EGU General Assembly 2026, Vienna, Austria, 3–8 May 2026, EGU26-6530, https://doi.org/10.5194/egusphere-egu26-6530, 2026.

EGU26-7170 | Orals | HS2.4.3

Is climate change or abstraction patterns driving historic changes in Danish groundwater levels?  

Ida Seidenfaden, Raphael Schneider, Bertel Nilsson, and Simon Stisen

Media, citizens, and insurance companies in Denmark increasingly report problems and concerns related to rising groundwater levels and groundwater flooding. However, the primary governing causes of these issues remain unclear. The driving factors are believed to include climate-driven changes in precipitation and evapotranspiration, changes in groundwater abstraction, and local anthropogenic alterations of water pathways, such as the renovation of old, leaky sewer systems and the implementation of sustainable drainage systems.

Using groundwater observations from the national well database Jupiter, we investigate the relative impacts of historical climatic changes and changes in groundwater abstraction patterns on observed groundwater levels over the past 33 years in Denmark. This is achieved by selecting long, consistent groundwater time series suitable for trend analysis. Based on these time series, we identify two subsets of monitoring wells: (1) climate-controlled wells and (2) anthropogenically influenced wells, using Transfer Function Noise time-series analysis as implemented in Pastas. The identified groundwater-level trends are compared with trends simulated by the National Hydrological Model of Denmark (DK-model), run with fixed abstraction rates to represent a purely climate-driven signal.

The analysis reveals a pronounced east–west contrast in climatic drivers (precipitation and net precipitation), with increasing trends (wetter) in western Denmark and decreasing trends (drier) in eastern Denmark over the last 33 years. Both the climate-controlled wells and the DK-modelled groundwater levels reproduce this pattern with rising groundwater levels in west (+20 cm over 33yr) and lowering in east (-3 cm over 33yr). Groundwater abstraction patterns in Denmark have changed since the early 1990s, when abstraction levels were significantly higher than today. Wells classified as anthropogenically influenced generally exhibit much larger changes in groundwater-level (often exceeding several meters of increase over the 33 years period) and do not consistently follow the climatic signal, especially for the eastern regions. The analysis shows that while climate impacts can explain moderate increases in groundwater levels in Western Denmark, large increases observed in Eastern Denmark are contributed to changes in abstraction patterns or other anthropogenic factors. This indicates that the most likely drivers behind the growing concerns related to hazards from high groundwater-levels in Denmark are direct anthropogenic changes with climate change playing a secondary role.

How to cite: Seidenfaden, I., Schneider, R., Nilsson, B., and Stisen, S.: Is climate change or abstraction patterns driving historic changes in Danish groundwater levels? , EGU General Assembly 2026, Vienna, Austria, 3–8 May 2026, EGU26-7170, https://doi.org/10.5194/egusphere-egu26-7170, 2026.

EGU26-11488 | ECS | Orals | HS2.4.3

High-Resolution Moisture Recycling Networks for Atmospheric Water Management in South America 

Ho Tin Hung, Wei Weng, Kai-Chih Tseng, Ping Fu, and Li-Pen Wang

Effective water resource governance requires a fundamental transition from isolated catchment-based approaches to a holistic perspective that integrates atmospheric moisture transport. Large-scale vegetation transitions in upwind regions fundamentally modify evapotranspiration fluxes, triggering "green water" feedbacks that influence hydroclimatological extremes in remote downwind territories. However, integrating these teleconnections into management strategies has been hindered by the limitations of data spatiotemporal resolution. Previous model versions (e.g., WAM-2layers v2) were typically constrained to coarse-resolution (1.5°) ERA-Interim input data, which limited the ability to resolve fine-scale moisture pathways and often conflated localized recycling with regional transport due to spatial averaging. In this study, we propose a framework for "Atmospheric Water Management" utilizing the WAM-2layers v3 model, driven directly by high-resolution (0.25°) ERA5 reanalysis data over the last 30 years. This represents a 6-fold increase in spatial resolution, allowing us to capture the full heterogeneity of anthropogenic landscapes. By utilizing this refined grid, we can distinguish specific moisture transport corridors and recycling loops that were previously obscured by the coarse discretization of earlier studies.

Building on this refined climatology, we apply complex network theory to construct a connection-graph of South America's "flying rivers." This approach enables us to pinpoint critical "moisture hubs"—specific geographic nodes where land-surface integrity exerts the strongest control over water security in downwind agricultural sinks, such as the La Plata Basin. We hypothesize that these hubs act as critical atmospheric infrastructure; their degradation via deforestation weakens the continental network's resilience, amplifying drought intensity downstream. Consequently, we argue that these identified hubs should be prioritized as conservation targets within national land-use planning. By quantifying these source-sink dependencies, this work aims to establish process-based thresholds for delimiting "precipitationsheds," supporting spatial planning where land conservation decisions are recognized as essential upstream water management strategies.

How to cite: Hung, H. T., Weng, W., Tseng, K.-C., Fu, P., and Wang, L.-P.: High-Resolution Moisture Recycling Networks for Atmospheric Water Management in South America, EGU General Assembly 2026, Vienna, Austria, 3–8 May 2026, EGU26-11488, https://doi.org/10.5194/egusphere-egu26-11488, 2026.

EGU26-12263 | ECS | Orals | HS2.4.3

Active root zone water storage dynamics reveal changes in ecosystem access to subsurface water 

Shijie Jiang, Georgios Blougouras, and Markus Reichstein

Changes in the terrestrial water cycle reflect not only atmospheric forcing but also how terrestrial ecosystems store and use subsurface water, a component that remains difficult to quantify at large scales. Most observation-based studies rely on surface soil moisture or total water storage anomalies (TWSA) as indicators of ecosystem water availability, although surface soil moisture does not fully represent the water accessed by vegetation, and TWSA integrates multiple storage components that are not necessarily involved in vegetation water use. Here we diagnose active root zone water storage (aSrz), defined as the dynamically operated water volume associated with vegetation water use, using a hybrid ecohydrological framework constrained by precipitation, evapotranspiration, runoff, and terrestrial water storage anomalies. We estimate aSrz and its temporal envelope across the continental United States, and examine its spatial structure and long-term trends. We show that aSrz isolates the vegetation-related component of subsurface water storage and reveals where changes in ecosystem water use are not captured by surface soil moisture or TWSA. Across climate regimes, aSrz remains closely coupled to gross primary productivity anomalies, while surface soil moisture and TWSA often decouple. Regional trends in aSrz further identify where vegetation water access has intensified or weakened relative to ecosystem structure under similar climatic conditions. By explicitly isolating actively exchanged storage, this work provides a new diagnostic for assessing changes in the pace of the terrestrial water cycle.

How to cite: Jiang, S., Blougouras, G., and Reichstein, M.: Active root zone water storage dynamics reveal changes in ecosystem access to subsurface water, EGU General Assembly 2026, Vienna, Austria, 3–8 May 2026, EGU26-12263, https://doi.org/10.5194/egusphere-egu26-12263, 2026.

EGU26-14873 | Orals | HS2.4.3 | Highlight

New evidence on observed and attributable changes in water cycle means and extremes: From regional to global scale 

Sonia I. Seneviratne, Fulden Batibeniz, Bianca Biess, Casimir Fisch, Lukas Gudmundsson, Yann Yasser Haddad, Martin Hirschi, Dominik L. Schumacher, and Xuebin Zhang

Water cycle changes, including changes in droughts, heavy precipitation and floods, count among the most impactful consequences of human-induced climate change. This includes several changes in water cycle extremes on regional scale (Seneviratne et al. 2021; Seneviratne et al., in preparation), as well as changes in global water cycle patterns (Fisch et al. in preparation). In addition, some subregional trends can also be now detected, such as in Switzerland for streamflow and soil moisture drought (Haddad et al. 2024, Hirschi et al. submitted).

This presentation will provide an overview of on-going studies and recent articles on the attribution of regional to global changes in the land water cycle, including new emerging evidence suggesting more detectable and attributable signals of changes in water cycle extremes compared to the assessment of the 6th Assessment Report of the Intergovernmental Panel on Climate Change (Seneviratne et al. 2021).


References:

Fisch, C., D.L. Schumacher, L. Gudmundsson, and S.I. Seneviratne, in preparation: Detecting an externally forced signal in observed terrestrial water storage.

Haddad, Y.Y, L. Gudmundsson, J. Savelsberg, J.B. Garrison, E. Raycheva, T. Wechsler, M. Zappa, G. Hug, and S.I. Seneviratne, 2025: Recent climate impacts on run-of-river hydropower and electricity systems planning in Switzerland. Environ. Res. Lett., 20, 084020.

Hirschi, M., D. Michel, D.L. Schumacher, W. Preimesberger and S.I. Seneviratne, in review: Recent summer soil moisture drying in Switzerland based on measurements from the SwissSMEX network. Earth System Data Discuss. [preprint], https://doi.org/10.5194/essd-2025-416, in review, 2025.

Seneviratne, S.I., X. Zhang, M. Adnan, W. Badi, C. Dereczynski, A. Di Luca, S. Ghosh, I. Iskandar, J. Kossin, S. Lewis, F. Otto, I. Pinto, M. Satoh, S.M. Vicente-Serrano, M. Wehner, and B. Zhou, 2021: Weather and Climate Extreme Events in a Changing Climate. In Climate Change 2021: The Physical Science Basis. Contribution of Working Group I to the Sixth Assessment Report of the Intergovernmental Panel on Climate Change [Masson-Delmotte, V., P. Zhai, A. Pirani, S.L. Connors, C. Péan, S. Berger, N. Caud, Y. Chen, L. Goldfarb, M.I. Gomis, M. Huang, K. Leitzell, E. Lonnoy, J.B.R. Matthews, T.K. Maycock, T. Waterfield, O. Yelekçi, R. Yu, and B. Zhou (eds.)]. Cambridge University Press, Cambridge, United Kingdom and New York, NY, USA, pp. 1513–1766, doi:10.1017/9781009157896.013.

Seneviratne, S.I. et al., in preparation: Extreme climate events from past to future: A 5-year update since the IPCC AR6 report. Manuscript in preparation.

How to cite: Seneviratne, S. I., Batibeniz, F., Biess, B., Fisch, C., Gudmundsson, L., Haddad, Y. Y., Hirschi, M., Schumacher, D. L., and Zhang, X.: New evidence on observed and attributable changes in water cycle means and extremes: From regional to global scale, EGU General Assembly 2026, Vienna, Austria, 3–8 May 2026, EGU26-14873, https://doi.org/10.5194/egusphere-egu26-14873, 2026.

EGU26-14929 | Posters on site | HS2.4.3

Gridded versus on site monthly rainfall centennial dataset for climate variability assessment in Campania Region (Southern Italy) 

Giacomo Nicoletti, Antonia Longobardi, and Paolo Villani

The Mediterranean basin is characterised by significant spatial and temporal precipitation variability and is recognised as one of the major climate change hotspots on a global scale, where recent studies have documented an intensification of the hydrological cycle with reduced seasonal precipitation but increased frequency of extreme events. This inherent variability is further compounded by non-climatic factors related to data availability and quality. Historical hydro-climatic databases are often affected by discontinuities and gaps, while recent monitoring networks provide more accurate observations but shorter records, which are frequently insufficient for robust climate trend analyses. In order to address these limitations, gridded datasets have been developed. However, these products may introduce additional uncertainties and potential distortions into the results.

The present study focuses on the Campania region, in Southern Italy, which is characterised by a complex orography and significant discontinuities in the available historical time series. In the 2000s, the regional hydro-climate monitoring network underwent structural restructuring. New sensors were installed, while the existing ones (historical network) were upgraded with new technology. However, only a few stations retained their original location and characteristics, resulting in a discontinuity between the historical database (1918-1999) and the current one. This discontinuity was overcome by reconstructing a single continuous monthly scale precipitation dataset through geostatistical interpolation on a regular grid with a spatial resolution of 10 × 10 km. This reconstruction enables the analysis of an almost centennial (1918-2023) continuous precipitation time series to investigate long-term variability in regional precipitation regimes, which represents furthermore a key driver to investigate changes in hydrological processes. To evaluate climate trends and the reliability of gridded reconstructions, the non-parametric Mann-Kendall and Sen's tests were applied to precipitation at the annual scale in parallel on both datasets (in situ observations and gridded reconstructions).

The results highlight trends indicative of the complexity documented at the Mediterranean scale. For the historical period (1918-1999), in situ observations reveal a predominantly negative trend, consistent with the pattern observed across the Mediterranean basin during the second half of the 20th century, which may indicate a potential reduction in regional water availability. In contrast, the most recent period reveals an inversion of this tendency, with a prevalence of positive trends. Analysis of the gridded reconstructions also confirms these patterns across most of the region, although some local discrepancies are present. Nevertheless, the majority of detected trends, in both datasets and particularly in the most recent period, are not statistically significant.

How to cite: Nicoletti, G., Longobardi, A., and Villani, P.: Gridded versus on site monthly rainfall centennial dataset for climate variability assessment in Campania Region (Southern Italy), EGU General Assembly 2026, Vienna, Austria, 3–8 May 2026, EGU26-14929, https://doi.org/10.5194/egusphere-egu26-14929, 2026.

Human water management—particularly irrigation water withdrawal and use—strongly reshapes land–atmosphere interactions and modulates regional hydroclimate. Yet representation of irrigation processes in land surface and Earth system models remains limited, constraining our ability to assess water management–climate feedbacks at large scales. In this study, we advance the Common Land Model (CoLM) by developing a two-way coupled irrigation scheme that integrates irrigation demand, application, and water withdrawal processes. The new module estimates irrigation water demand based on soil moisture deficit, represents four major irrigation methods, and links irrigation water supply to multiple water sources by coupling CoLM with a river-routing model and a reservoir operation scheme. This framework explicitly resolves dynamic feedbacks between irrigation demand and water availability from runoff, streamflow, reservoirs, and groundwater.

Comprehensive evaluations over the United States show that the enhanced model realistically reproduces irrigation withdrawals, their spatial distribution, and water source proportions, consistent with reported state-level statistics. The new irrigation scheme substantially improves simulations of surface energy fluxes, near-surface temperature, river discharge, and crop yields for major crops. The improved CoLM has now been incorporated into the ISIMIP3 Water (global) sector model intercomparison project, providing a new tool for coordinated global assessments of human water management impacts.

Applications of the new framework further demonstrate its utility in predicting irrigation-induced climate effects and assessing agricultural water use and scarcity. Overall, this work provides an advanced representation of irrigation–climate–water interactions, offering new opportunities to investigate the co-evolution of climate, water resources, and agricultural production, and to support sustainable water management under a changing climate.

How to cite: Zhang, S., Liang, H., and Dai, Y.: Improving irrigation–climate interactions in land surface modeling: Development, validation, and applications of the two-way coupled irrigation framework in CoLM, EGU General Assembly 2026, Vienna, Austria, 3–8 May 2026, EGU26-16427, https://doi.org/10.5194/egusphere-egu26-16427, 2026.

Rapid onset, swift intensification, and pronounced hydroclimatic stress define flash drought, which emerges from an initial precipitation shortfall combined with persistently elevated air and land surface temperatures. These conditions substantially increase evaporative demand, driving a sharp decline in soil moisture. In contrast to conventional seasonal droughts that develop gradually, flash droughts escalate to peak intensity within two to three weeks and may continue for several weeks (up to 18 pentads). Their abrupt nature poses a serious threat to agricultural productivity, with cascading effects on food security and the national economy, especially under a warm climate. This nature of flash drought imposes significant hydroclimatic stress, and numerous recent studies highlight the urgent need for a deeper understanding of these rapidly developing drought conditions. However, the absence of a consistent and universally accepted definition has hindered efforts to assess and monitor flash droughts effectively. While multiple climatic drivers, including abrupt transitions in monsoon, elevated temperatures, and vapour pressure deficit, contribute to flash drought development, it is unlikely that a single definition can fully capture their complexity. Nevertheless, it is essential to distinguish flash droughts—short-lived, rapid-intensifying events—from conventional droughts, which typically develop gradually and persist over longer timescales.  In this study, we propose a new definition of stand-alone flash drought based on rapid declines in soil moisture, independent of conventional drought classification. This approach enables the recognition of flash droughts as distinct events and underscores their unique characteristics. Using pentad-scale soil moisture data across India, we develop a simple yet robust framework to identify historical flash drought events that have contributed to a reduction in crop yield and vegetation cover, posing significant risks to the national economy. This approach enhances drought characterisation in a changing climate and supports more effective monitoring and impact assessment.

How to cite: Kumari, P. and Vinnarasi, R.: Hydroclimatic Stress in India: Methodological Innovation and Agricultural Relevance of Stand-Alone Flash Droughts, EGU General Assembly 2026, Vienna, Austria, 3–8 May 2026, EGU26-370, https://doi.org/10.5194/egusphere-egu26-370, 2026.

EGU26-448 | ECS | Orals | HS2.4.5

Continental-Scale Dynamics of Flood Extremes: A Unified Spatio-Temporal Modelling Approach 

Poornima Chandra Lekha Posa, Conrad Wasko, Wenyan Wu, and Rajarshi Das Bhowmik

Flood risks are escalating globally as climate change intensifies land–atmosphere interactions, resulting in large-scale flooding. Yet, existing assessments remain constrained by site-based and stationary assumptions that obscure how extreme floods propagate across space and evolve over time. Addressing this gap, we present the first continent-scale analysis of changing spatio-temporal dependence in Australian flood extremes. Towards this, we develop a comprehensive suite of 3,937 spatial and spatio-temporal max-stable process (MSP) models, integrated with large-scale climate modes and physiographic controls. Leveraging annual maximum floods from 325 Hydrologic Reference Stations and a 30-year moving-window framework (1973–2002), we quantify evolving spatio-temporal dependencies in floods and benchmark MSP performance against non-stationary GEV models to assess the added value of jointly modelling spatial dependence and temporal non-stationarity. Results reveal fundamentally different spatial and temporal behaviours of frequent and rare floods. Frequent floods (with a 2-year return period) weaken across much of southern Australia but intensify in the north, reflecting the dominance of local hydrological and topographic controls. Rare floods (with return periods of 25–100 years) exhibit strong spatial heterogeneity and widespread increases along the east coast, southeast, and tropical north, driven primarily by ENSO, IOD, and SAM, which emerge as the strongest modulators of temporal variability. Physiographic gradients, particularly catchment area, elevation, and slope, govern spatial dependence across the continent. A striking north–south divergence in the evolution of flood coherence is uncovered: southern Australia exhibits increasing synchronisation of floods, whereas northern regions show growing spatial fragmentation. Critically, spatio-temporal MSPs capture these dynamic shifts in flood clustering—features that NSGEV models cannot detect—resulting in substantial reductions in uncertainty in rare-flood quantiles, particularly in data-sparse regions. By integrating local catchment attributes and large-scale climate variability into spatial extremes theory, we provide a unified modelling framework that uncovers how Australia’s flood hazard landscape is being structurally reorganised under climate change, offering a new foundation for continent-scale risk assessment, infrastructure planning, and climate-resilient adaptation.

How to cite: Posa, P. C. L., Wasko, C., Wu, W., and Bhowmik, R. D.: Continental-Scale Dynamics of Flood Extremes: A Unified Spatio-Temporal Modelling Approach, EGU General Assembly 2026, Vienna, Austria, 3–8 May 2026, EGU26-448, https://doi.org/10.5194/egusphere-egu26-448, 2026.

EGU26-695 | ECS | Posters on site | HS2.4.5

Assessing SM2RAIN-ASCAT rainfall products for drought monitoring across Morocco 

Said El Goumi, Mustapha Namous, Abdenbi Elaloui, Samira Krimissa, Oussama Nait-Taleb, Hasnaa Chouidda, Nafia Elalaouy, and ElHoussaine Bouras

SM2RAIN-ASCAT is a satellite-based precipitation product that derives rainfall estimates from soil moisture observations using a bottom-up approach. This study evaluates its performance for precipitation estimation and drought monitoring across Morocco by comparing it with in-situ data from 36 ground-based stations covering multiple climate zones. In this context, a range of quantitative and qualitative metrics was used to validate SM2RAIN-ASCAT data against observed precipitation. The Standardized Precipitation Index (SPI) was calculated at 1, 3, 6, and 12-month timescales to assess drought monitoring effectiveness, with performance stratified by climate zone.

Results reveal that correlation coefficients with ground observations increased from 0.45 at the daily time scale to 0.67 at the monthly time scale, with 10-day and monthly aggregations offering the best agreement. The dataset revealed a strong ability to detect rain, attaining monthly Probability of Detection values exceeding 0.75 at 89% of stations. Although the product exhibited a tendency to underestimate intense rainfall events, relative bias remained low at nearly half of the stations, with minimum RMSE values occurring at the monthly scale. Regional performance showed consistent variability, with underestimation in Mediterranean zones and overestimation in arid regions, though drought monitoring capability remained robust.

SPI values for short- to medium-term durations aligned well with ground observations across Morocco's climate zones. Agreement was weak to moderate for 1-month SPI but improved substantially for 3-month and 6-month periods, with correlation coefficients of approximately 0.70 and 0.80, respectively. Long-term drought monitoring using SPI-12 showed particularly strong performance, with excellent agreement at nearly all stations. The product showed superior accuracy in detecting droughts in arid zones against humid zones and wet conditions in hot arid climates compared to wetter climates. These findings suggest that integrating bottom-up SM2RAIN-ASCAT and top-down approaches can enhance precipitation and drought monitoring by addressing the limitations of each method. SM2RAIN-ASCAT is particularly recommended for agricultural drought monitoring and water resource management in arid regions.

Keywords: Standardized Precipitation Index, SM2RAIN-ASCAT, Rainfall, Bottom-up approach, Drought

How to cite: El Goumi, S., Namous, M., Elaloui, A., Krimissa, S., Nait-Taleb, O., Chouidda, H., Elalaouy, N., and Bouras, E.: Assessing SM2RAIN-ASCAT rainfall products for drought monitoring across Morocco, EGU General Assembly 2026, Vienna, Austria, 3–8 May 2026, EGU26-695, https://doi.org/10.5194/egusphere-egu26-695, 2026.

EGU26-1538 | ECS | Posters on site | HS2.4.5

Comparison of regional flood frequency analysis methods for ungauged catchments in West Africa 

Serigne Bassirou Diop, Yves Tramblay, Ansoumana Bodian, Bastien Dieppois, and Taha B.M.J. Ouarda

The estimation of the return levels of floods is constrained by sparse and quality-limited hydrological observations in West Africa, even though floods remain among the most damaging natural hazards in the region. Regional Flood Frequency Analysis (RFFA) provides a pathway to estimate design floods at ungauged catchments, yet the diversity of available approaches calls for a systematic comparison. We assess whether flood quantiles can be reliably regionalized across West Africa using an unprecedented dataset of 211 near-natural catchments. This study compare a Direct Regression Approach (DRA) with three index-flood methods based on spatial proximity, Principal Component Analysis (PCA), and Canonical Correlation Analysis (CCA), all of which are implemented using both statistical and machine-learning models. Evaluation of model performance using relative bias (rBias) and mean absolute relative error (MARE) indicates that index-flood-based approaches consistently outperform DRA. Among all combinations, the CCA–SVR framework achieves the highest accuracy (rBias = -0.03; MARE = 0.21) for both 20- and 50-year flood quantiles. These findings provide robust guidance for flood design in data-scarce environments and support more resilient flood risk management across West Africa.

How to cite: Diop, S. B., Tramblay, Y., Bodian, A., Dieppois, B., and Ouarda, T. B. M. J.: Comparison of regional flood frequency analysis methods for ungauged catchments in West Africa, EGU General Assembly 2026, Vienna, Austria, 3–8 May 2026, EGU26-1538, https://doi.org/10.5194/egusphere-egu26-1538, 2026.

EGU26-1999 | ECS | Orals | HS2.4.5

Event-based analysis of hydrological drought propagation across contrasting river basins 

Alex Crespillo López, Sergio M. Vicente Serrano, and Luís Gimeno Presa

Hydrological droughts are complex spatio-temporal phenomena whose impacts propagate through river networks, affecting water availability, ecosystems, and water management systems (Van Loon, 2015). Understanding how drought events develop and propagate across space remains challenging, particularly when comparing river basins with contrasting hydroclimatic conditions, sizes, and buffering capacities (Wu et al., 2022). Despite the increasing availability of long discharge records, comparative and event-based analyses of hydrological drought propagation are still limited by the lack of scalable and reproducible methodological approaches (Van Huijgevoort et al., 2012).

In this study, we present an event-based framework for the detection, characterization, and propagation analysis of hydrological droughts, designed to enable consistent inter-basin comparisons. Hydrological drought events are identified using threshold-based methods applied to daily discharge series, from which key metrics describing event duration, severity, deficit and lag are derived. Drought propagation is analysed through a network-aware approach that quantifies temporal relationships between upstream and downstream gauging stations along the river network.

The framework has been tested on daily discharge records from the Ebro and Segura River Basins (Spain), representing markedly different basin sizes and hydroclimatic regimes. Results reveal clear contrasts in drought behaviour between both systems. In the Ebro Basin, drought events are associated with large absolute water deficits due to the high-flow regime of the basin, but display comparatively lower relative severity and a weak coupling between event duration and deficit when normalized by local flow conditions, consistent with strong system buffering and spatial heterogeneity. In contrast, the Segura Basin exhibits more recurrent drought events per station, smaller absolute deficits but substantially higher relative severity, longer persistence, stronger coupling between duration and deficit, and a high spatial coherence across the river network, reflecting limited buffering capacity under semi-arid conditions.

These results demonstrate the ability of the proposed framework to capture basin-specific drought regimes and propagation dynamics in a consistent manner. The event-based analysis provides new insights into the controls of hydrological drought persistence and severity and offers a robust basis for comparative drought studies, large-scale impact assessments, and future integration into climate impact analyses and basin-scale hydrological modelling frameworks.

Keywords: Comparative basin analysis; Drought propagation; Hydroinformatics; Hydrological drought; River network connectivity; Spatio-temporal analysis


References
[1] Van Huijgevoort, M. H. J., Hazenberg, P., Van Lanen, H. A. J., & Uijlenhoet, R. (2012). A generic method for hydrological drought identification across different climate regions. Hydrology and Earth System Sciences, 16(8), 2437-2451. https://doi.org/10.5194/hess-16-2437-2012
[2] Van Loon, A. F. (2015). Hydrological drought explained. WIREs Water, 2(4), 359-392. https://doi.org/10.1002/wat2.1085
[3] Wu, J., Yao, H., Chen, X., Wang, G., Bai, X., & Zhang, D. (2022). A framework for assessing compound drought events from a drought propagation perspective. Journal of Hydrology, 604, 127228. https://doi.org/10.1016/j.jhydrol.2021.127228

How to cite: Crespillo López, A., Vicente Serrano, S. M., and Gimeno Presa, L.: Event-based analysis of hydrological drought propagation across contrasting river basins, EGU General Assembly 2026, Vienna, Austria, 3–8 May 2026, EGU26-1999, https://doi.org/10.5194/egusphere-egu26-1999, 2026.

EGU26-2106 | ECS | Posters on site | HS2.4.5

PDSI_CMIP6: A CMIP6-Consistent Palmer Drought Severity Index Dataset 

Jinghua Xiong, Yuting Yang, and Dawen Yang

The self-calibrated Palmer Drought Severity Index is a widely used metric for drought monitoring and climate change assessments but suffers from inherent climatic inconsistencies and lacks comprehensive and reliable estimates under changing climate conditions. We developed a monthly multi-model and multi-scenario sc-PDSI dataset (PDSI_CMIP6) for the period 1850–2094, derived from 11 climate model outputs within the Coupled Model Intercomparison Project 6. The traditional two-layer bucket model in PDSI is replaced with direct hydrological outputs from CMIP6 models, ensuring alignment with CMIP6 projections. The PDSI estimates are validated against soil moisture simulations through correlation and regression analysis. Application of the dataset reveals pronounced spatial heterogeneity in long-term drought trends across continents, with limited global-mean change but notable regional intensification under climate change. PDSI_CMIP6 provides uncertainty-constrained quantifications of terrestrial moisture conditions in a changing climate, faithfully reflecting CMIP6-projected hydrological changes.

How to cite: Xiong, J., Yang, Y., and Yang, D.: PDSI_CMIP6: A CMIP6-Consistent Palmer Drought Severity Index Dataset, EGU General Assembly 2026, Vienna, Austria, 3–8 May 2026, EGU26-2106, https://doi.org/10.5194/egusphere-egu26-2106, 2026.

Detecting the emergence of anthropogenic climate change signals in precipitation is essential for informing adaptation strategies. This study analyses long-term, quality-assured observations from 36 stations across Ireland (1930–2019) to assess trends and emergence in six seasonal precipitation indices. Using a combination of Mann-Kendall trend testing, Theil-Sen slope estimation, and monthly persistence analysis, robust seasonal changes are identified. Emergence is evaluated by regressing local precipitation indices against global mean surface temperature (GMST), with the resulting signal to-noise ratio (SNR) classified as normal, unusual, or unfamiliar relative to early industrial (1850-1900) and modern (1950-1980) baselines. The influence of the North Atlantic Oscillation (NAO) is also assessed using commonality analysis. Results show statistically significant intensification of rainfall extremes, particularly in western Ireland during winter and spring, and in the southeast during summer and autumn. Many stations exhibit significant relationships with GMST, with increases in extreme indices (e.g., Rx5day, SDII) ranging from 12% to 27% per °C of warming, often exceeding thermodynamic expectations. Emergence of unusual climate conditions is already evident at several stations relative to the early industrial baseline, and many are nearing this threshold for the modern baseline. While NAO variability strongly modulates winter precipitation extremes in the west, significant GMST relationships in the SNR analysis indicate that these are still robust climate change signals. Commonality analysis reveals that GMST and NAO jointly explain variability in winter PRCPTOT and Rx5day at western stations, suggesting that natural modes of variability like the NAO may not be independent noise but rather embedded within a warming climate signal, complicating the separation of anthropogenic and natural drivers in attribution studies. Findings also challenge projections of widespread summer drying with warming, instead revealing intensification of short duration extremes in the southeast. As Ireland faces increasingly intense and seasonally variable rainfall extremes, these results highlight the urgency of regionally tailored adaptation strategies grounded in observed climate change signals. These results provide robust observational indications of an intensifying atmospheric water cycle and emerging precipitation extremes over Ireland under anthropogenic warming. 


How to cite: Fordham, S.: The Emergence of a Climate Change Signal in Ireland’s Rainfall Extremes , EGU General Assembly 2026, Vienna, Austria, 3–8 May 2026, EGU26-2807, https://doi.org/10.5194/egusphere-egu26-2807, 2026.

Floods arise from the interaction between near-event precipitation and antecedent soil moisture, which regulates how efficiently precipitation is converted into runoff. Studies often classify floods by generating mechanisms using catchment-level statistics and treat soil moisture implicitly as a bulk proxy, obscuring its direct regulatory role and the influence of specific soil layers on individual flood events. This research utilizes explainable AI tools to quantify the event-scale roles of precipitation and multi-layer soil moisture in flood generation globally. We trained a catchment-shared LightGBM model on the Caravan–GRDC dataset to predict daily streamflow percentiles from 1,385 snow-free catchments. To isolate immediate forcing from antecedent state, we utilized lagged inputs: t−1 for precipitation and t−2 for soil moisture at four depths (0–7, 7–28, 28–100, and 100–289 cm). For 38,317 annual-maximum flood predictions, we applied SHAP to decompose each prediction into predictor contributions and classified events as either precipitation-dominant or soil-moisture-dominant based on the largest absolute SHAP value. Results show that soil moisture is the predominant global flood driver; however, precipitation dominance becomes more frequent toward the highest streamflow percentiles, indicating that the largest peaks often require intense forcing to overcome storage constraints. The two regimes exhibit distinct dynamics: Soil-moisture-dominant floods evolve slowly, with longer rising and recession limbs, and are regulated by shallow subsurface moisture (7–100 cm). They typically occur in larger, flatter, and lower catchments with shallow water tables. Precipitation-dominant floods are flashier, with sharp rising limbs, show stronger sensitivity to the surface moisture (0–7 cm), and are more prevalent in smaller, steeper, high-relief catchments, with deeper water tables. The peak timing predictions reflect the challenge of capturing short-fuse storm dynamics relative to slowly evolving storage states, with well-timed soil-moisture-dominant peaks compared to precipitation-dominant peaks, which exhibited timing delays. This framework provides a scalable, event-based quantification highlighting the catchment control, with soil moisture (especially within the upper meter) acting as an active regulator of runoff generation. The dominance classification supports process-aware forecasting and climate-change adaptation by tracking shifts in flood-generation regimes and indicating whether predictability depends more on storm forcing or antecedent catchment state.

How to cite: Kimchi, Y. and Morin, E.: Event-Scale Drivers of Flood Generation: Large-Sample Assessment of the Roles of Soil Moisture and Precipitation, EGU General Assembly 2026, Vienna, Austria, 3–8 May 2026, EGU26-3289, https://doi.org/10.5194/egusphere-egu26-3289, 2026.

EGU26-3771 | Orals | HS2.4.5

Where can I get this darn number? Estimating 1000-year return periods in ungauged catchment areas using continuous simulation 

Maria Staudinger, Martina Kauzlaric, Eleni Kritidou, and Daniel Viviroli

Estimating extreme flood events with a return period of 1000 years or more is particularly challenging in ungauged catchments. Traditional methods often rely on statistical extrapolation of peak discharges or regionalized design values, both of which are subject to considerable uncertainty. Our study examines whether continuous hydrological simulations could offer a useful second opinion to these traditional methods. The continuous simulations are based on a model chain that starts with a stochastic weather generator, which produces long synthetic time series of precipitation and temperature. These time series then serve as input to a hydrological model. As there are no direct streamflow observations for ungauged catchments, the model parameters must be regionalized to realistically configure the hydrological model. Initial tests, in which gauged catchments were treated as ungauged, were promising, suggesting that continuous simulation using a stochastic weather generation combined with a hydrological model could provide a robust basis for estimating extreme floods in regions with limited data.

How to cite: Staudinger, M., Kauzlaric, M., Kritidou, E., and Viviroli, D.: Where can I get this darn number? Estimating 1000-year return periods in ungauged catchment areas using continuous simulation, EGU General Assembly 2026, Vienna, Austria, 3–8 May 2026, EGU26-3771, https://doi.org/10.5194/egusphere-egu26-3771, 2026.

EGU26-4596 | Orals | HS2.4.5 | Highlight

Reversal of Australian drought trends over recent decades 

Anna Ukkola, Matthew Grant, Elisabeth Vogel, Sanaa Hobeichi, Andy Pitman, Alex Borowiak, and Keirnan Fowler

Australia frequently experiences severe and widespread droughts, causing impacts on agriculture, the economy, and human health. The effects of these droughts can extend beyond national boundaries, influencing the global carbon cycle and global food markets owing to Australia’s position as one of the world’s leading grain exporters. Yet we lack comprehensive understanding of how Australian droughts have evolved over the past century. In this study, we analyse the past changes in seasonal-scale meteorological, agricultural, and hydrological droughts – defined using the 15th percentile threshold of precipitation, soil moisture, and runoff, respectively. We complement these traditional metrics with an impact-based drought indicator built from government drought reports using machine learning. We find that although there have been widespread decreases in Australian droughts since the early 20th century, extensive regions have experienced an increase in recent decades. However, these recent changes largely remain within the range of observed variability, suggesting that they are not unprecedented in the context of the historical drought events. The drivers of these drought trends are multi-faceted, and we show that the trends can be driven by both mean and variability changes in the underlying hydrological variable. Additionally, using explainable machine learning techniques, we unpick the key hydrometeorological variables contributing to agricultural and hydrological drought trends. The influence of these variables varies considerably between regions and seasons, with precipitation often shown to be important but rarely the main driver behind observed drought trends. This suggests the need to consider multiple drivers when assessing drought trends.

How to cite: Ukkola, A., Grant, M., Vogel, E., Hobeichi, S., Pitman, A., Borowiak, A., and Fowler, K.: Reversal of Australian drought trends over recent decades, EGU General Assembly 2026, Vienna, Austria, 3–8 May 2026, EGU26-4596, https://doi.org/10.5194/egusphere-egu26-4596, 2026.

Drought-wetness abrupt alternation (DWAA) represent a classic form of hydroclimatic whiplash, posing escalating threats to global water and food security. Yet, conventional identification frameworks often simplify these shifts as instantaneous binary events, neglecting the critical, evolving physical dynamics during the transition phase. This study challenges the prevailing “instantaneous-transition” assumption by establishing a process-aware identification framework based on pentad-scale soil moisture dynamics.

Applying this framework to multiple datasets (GLDAS-NOAH-2.1, ERA5, and SMCI) across China from 2000 to 2022, we reveal a fundamental temporal asymmetry in DWAA events. Our results show that drought-to-wetness (DTW) transitions typically occur as rapid, explosive shocks, completing within approximately 10 days with a mean transition rate of +30% per pentad. In contrast, wetness-to-drought (WTD) transitions unfold as prolonged depletions, taking roughly one month to conclude with a significantly slower transition rate of -15% per pentad.

This two-fold timescale difference is driven by distinct physical mechanisms: DTW is dominated by external, high-intensity atmospheric precipitation pulses, whereas WTD is constrained by the internal, nonlinear memory of terrestrial water storage and evapotranspiration-driven depletion. Spatially, these events exhibit segregated hotspots, with DTW clustering in the Huai River Basin and WTD concentrated across the broader Yangtze River Basin and southeastern coast. These findings offer a new physical basis for developing asymmetric, mechanism-based identification systems, shifting the paradigm from simple event cataloging to a dynamic understanding of compound hydroclimatic extremes.

How to cite: Xiao, Z. and Yuan, S.: Unraveling the Temporal Asymmetry of Drought-Wetness Abrupt Alternations: A Process-Aware Framework Based on Pentad Soil Moisture, EGU General Assembly 2026, Vienna, Austria, 3–8 May 2026, EGU26-4742, https://doi.org/10.5194/egusphere-egu26-4742, 2026.

Abstract

Abrupt transitions between drought and flood—known as Drought–Flood Abrupt Alternation (DFAA)—constitute an emerging class of compound hydrological extremes with significant implications for risk management. This study introduces a systematic framework for detecting DFAA events across 15 UKBN2 (UK Benchmark Network version 2) catchments (1970–2015) using daily SPEI (Standardized Precipitation–Evapotranspiration Index) and SRI (Standardized Runoff Index) time series. We evaluated 27 detection configurations, varying anomaly thresholds, minimum drought durations, and transition windows, to assess sensitivity and classification robustness.

Threshold selection exerted the greatest influence on event frequency, followed by transition-window length, while drought duration played a comparatively minor role. A baseline configuration (threshold ±0.7; drought ≥14 days; flood ≥1 day; transition ≤14 days) delivered the most hydrologically realistic and spatially coherent results. Under these criteria, SRI consistently identified more DFAA events than SPEI, reflecting rapid runoff responses driven by catchment storage and antecedent wetness. Spatial analysis revealed a pronounced west–east gradient, with higher alternation frequency in wetter, low-permeability upland catchments, while seasonal patterns indicated drought-to-flood transitions predominating during recovery from dry spells.

These findings underscore the critical role of index choice, storage dynamics, and transition timing in shaping DFAA behaviour. The proposed framework provides a reproducible basis for monitoring compound drought–flood risks and delivers essential evidence to support future modelling, operational early warning systems, and climate adaptation strategies.

How to cite: Al-Yousuf, S., Han, S., and Hannah, D.: Assessing the sensitivity of detection criteria for Drought-Flood Abrupt Alternation events in the UK, EGU General Assembly 2026, Vienna, Austria, 3–8 May 2026, EGU26-4982, https://doi.org/10.5194/egusphere-egu26-4982, 2026.

EGU26-5003 | ECS | Orals | HS2.4.5

Future changes in frequency and intensity of meteorological and hydrological droughts in Denmark 

Ruben Häberli, Ole Bøssing Christensen, Peter Thejll, Eigil Kaas, Raphael Schneider, and Ida Karlsson Seidenfaden

Drought frequency is projected to increase in mainland Europe while decreasing in Scandinavia under climate change, placing Denmark in a hydro-climatic transition zone with an uncertain future. This makes Denmark a relevant case for analysing future changes in the meteorological forcing and hydrological response, that can ultimately lead to substantial implications for agriculture and water resource management.

We investigate future changes in drought frequency and intensity in Denmark up to 2100, combining regional climate model simulations (Euro-CORDEX), which were adjusted using observational data to produce Klimaatlas Denmark, and hydrological model outputs from the National Hydrological Model of Denmark. Drought conditions are analysed using standardised indices representing different components of the hydrological cycle, including precipitation (SPI), precipitation-evapotranspiration balance (SPEI), soil moisture (ESSMI), streamflow (SDI) as well as shallow and deep groundwater (SGDI). We compared these indices using a drought multi-threshold method for a consistent comparison across variables.

Results show a clear seasonal signal in meteorological drought, with decreasing frequency in winter and increasing frequency in summer. Accounting for evapotranspiration further amplifies projected summer drought conditions. In contrast, streamflow and groundwater droughts are projected to decrease in frequency towards the end of the century across most of Denmark. However, extreme droughts may still lead to risks of groundwater depletion, due to increased demands for irrigation water abstraction during dry summers.

These findings demonstrate that changes in meteorological drought do not directly translate to streamflow and groundwater drought responses in Northern Europe. Further, they highlight the importance of accounting for drought propagation through multiple compartments of the natural system and the overlying signal of water provisioning when assessing future drought risks.

How to cite: Häberli, R., Christensen, O. B., Thejll, P., Kaas, E., Schneider, R., and Seidenfaden, I. K.: Future changes in frequency and intensity of meteorological and hydrological droughts in Denmark, EGU General Assembly 2026, Vienna, Austria, 3–8 May 2026, EGU26-5003, https://doi.org/10.5194/egusphere-egu26-5003, 2026.

EGU26-5868 | ECS | Posters on site | HS2.4.5

Compound drought and fire effects on runoff generation in southeastern Australia 

Shaozhen Liu, Louise J. Slater, Keirnan Fowler, Sander Veraverbeke, and Wouter Berghuijs

Natural hazards, including drought and wildfire, can substantially modify how catchments generate streamflow following precipitation events. Yet, how drought and fire events alter such rainfall-runoff relationships remains poorly understood. Here, we use nonlinear deconvolution techniques to reveal how runoff responds to rainfall in 155 Australian catchments, and how these responses are altered by the 2017-2019 Tinderbox Drought and the 2019-2020 Australian wildfires. Our results show the Tinderbox Drought typically halved runoff response (i.e. the streamflow response to a unit of rainfall reduced by half), and subsequent fire impacts appeared paradoxical because post-fire runoff generation was simultaneously altered by climate conditions, fire severity, and drought legacies. During the drought, almost all catchments exhibited declines in per-unit-rainfall runoff responses, with stronger declines in catchments that experienced larger rainfall reductions and had low soil infiltration capacities. Post-fire, these responses increased by up to threefold in some regions, but these increases appear to have been driven by higher rainfall rather than by fire effects. In contrast, catchments in other regions experienced little overall change in runoff response, because the runoff reductions driven by drought legacy effects competed with simultaneous strong increases in runoff response induced by the wildfires. This highlights that compound natural hazard effects on runoff generation may reshape hydrological processes in diverse and initially unintuitive ways.

How to cite: Liu, S., J. Slater, L., Fowler, K., Veraverbeke, S., and Berghuijs, W.: Compound drought and fire effects on runoff generation in southeastern Australia, EGU General Assembly 2026, Vienna, Austria, 3–8 May 2026, EGU26-5868, https://doi.org/10.5194/egusphere-egu26-5868, 2026.

EGU26-5966 | ECS | Posters on site | HS2.4.5

Spatiotemporal evolution of drought and flood events in the Amazon: An approach based on complex network theory 

Marina Kolanski, Tais Maia, Bruno Brentan, and André Rodrigues

The Amazon Basin exhibits high hydrological variability and has experienced, in recent decades, an increase in the frequency, intensity, and duration of extreme drought and flood events, with significant impacts on ecosystems, water availability, and socioeconomic activities. Understanding not only the isolated occurrence of these events but also their spatiotemporal evolution and interconnections across different regions of the basin remains a major scientific challenge. In this context, this study proposes an approach based on the Standardized Precipitation–Evapotranspiration Index (SPEI) and complex network theory to investigate the spatiotemporal dynamics of droughts and floods in the Amazon. The analysis is based on monthly time series of precipitation and actual evapotranspiration for 43 Amazonian catchments obtained from the CAMELS-BR dataset. Precipitation is represented using data from the CHIRPS product, while actual evapotranspiration is derived from the GLEAM and ERA5-Land datasets. From the climatic water balance, the SPEI accumulated over a 12-month timescale (SPEI-12) is computed, allowing the characterization of medium- to long-term hydrological anomalies. Drought and flood events are identified using widely adopted thresholds in the literature, and additional attributes such as duration, accumulated intensity, and recovery rate are derived to assess the severity and persistence of hydrological extremes. In the subsequent stage, the SPEI time series are analyzed comparatively to quantify similarities in hydrological behavior among catchments and to identify common patterns in the temporal evolution of drought and flood events. These relationships are incorporated into the construction of dynamic graphs, in which each catchment is represented as a node and the connections reflect hydrological proximity among the time series and extreme events characteristics. The temporal analysis of the graphs enables the investigation of how connectivity among catchments reorganizes during dry and wet periods, as well as the identification of regional groupings and catchments that play structurally important roles in the Amazonian hydrometeorological network. By integrating the characterization of hydrological extremes with dynamic network modeling, this study provides an innovative framework for interpreting the complexity of hydrological variability in the Amazon. The expected results contribute to advancing the understanding of the spatiotemporal evolution of droughts and floods and provide support for the development of monitoring, forecasting, and risk management strategies in one of the regions most vulnerable to climate change.

How to cite: Kolanski, M., Maia, T., Brentan, B., and Rodrigues, A.: Spatiotemporal evolution of drought and flood events in the Amazon: An approach based on complex network theory, EGU General Assembly 2026, Vienna, Austria, 3–8 May 2026, EGU26-5966, https://doi.org/10.5194/egusphere-egu26-5966, 2026.

EGU26-6562 | ECS | Posters on site | HS2.4.5

The influence of precipitation lapse rate in flood estimates using long continuous simulations 

Eleni Kritidou, Martina Kauzlaric, Marc Vis, Maria Staudinger, Jan Seibert, and Daniel Viviroli

Precipitation lapse rates (PLRs) describe how precipitation varies with elevation. PLRs strongly influence the water balance of high-elevation catchments and affect the seasonal dynamics of snow accumulation and related snowmelt runoff, as well as the longer-term mass balance of glaciers. Despite their importance, precipitation variations with elevation remain poorly understood due to the complex and highly localized nature of orographic precipitation as well as the limited availability of high-elevation precipitation observations. Consequently, streamflow simulation in mountainous environments is challenging, and many hydrological studies rely on the simplifying assumption of a constant (usually positive) PLR.

The representation of PLR in both the input data and the hydrological models plays a key role in streamflow simulations. Here, we used a combination of long synthetic time series from a stochastic weather generator (GWEX) and a hydrological catchment model (the HBV model) to study the influence of PLR on runoff simulations for several Swiss catchments.  To better understand the influence of PLR on the simulations, particularly on flood estimates, we conducted two experiments. In the first experiment, we varied the PLR parameter in HBV between 0% and 10% (0%, 2.5%, 5%, 7.5%, and 10%). This parameter redistributes the mean catchment precipitation from GWEX between elevation zones without altering the total precipitation amount. In the second experiment, we applied the same PLRs to first adjust precipitation for the difference between station and mean catchment elevation, before interpolation to mean areal precipitation using Thiessen weights. For each simulation run, GWEX inputs were adjusted using the same PLR that was applied in the hydrological model. Through these experiments, we assessed the sensitivity of flood estimates to changes in PLRs applied solely within the hydrological model and to the combined application of PLRs in both precipitation input and hydrological model.

Our findings show variable responses in the monthly water balance, flood seasonality, and changes in the flood estimates for both experiments, reflecting differences in catchment characteristics. This evaluation highlights the importance of PLRs in hydrological studies and demonstrates that the use of a fixed PLR can be misleading. Instead, PLR assumptions should be context-dependent and carefully considered in hydrological applications. 

How to cite: Kritidou, E., Kauzlaric, M., Vis, M., Staudinger, M., Seibert, J., and Viviroli, D.: The influence of precipitation lapse rate in flood estimates using long continuous simulations, EGU General Assembly 2026, Vienna, Austria, 3–8 May 2026, EGU26-6562, https://doi.org/10.5194/egusphere-egu26-6562, 2026.

EGU26-6934 | ECS | Orals | HS2.4.5

Climatic and socioeconomic drivers of changing flood and drought magnitudes in Europe from 1951 to 2020 

Aloïs Tilloy, Dominik Paprotny, Lorenzo Mentaschi, Stefania Grimaldi, Diego Gomez-Aragon, and Luc Feyen

Hydrological extremes display long-term trends and natural oscillations in response to climatic and socio-economic factors. Knowing how and why these extremes are shifting is crucial for increasing water resilience in Europe. This work analyses trends in floods and droughts in European catchments with an upstream area below 100 km2 between 1951 and 2020. Using hight-resolution climatic and socioeconomic data, the OS LISFLOOD hydrological model and non-stationary extreme value analysis, we disentangle the effects of four drivers on flood and drought magnitudes: dynamics in climate – encompassing climate variability and climate change – land use changes, water demand changes and reservoir construction. We map combined floods and droughts changes into four trajectories: wetting, drying, accelerating, decelerating. The trajectories and their links to different drivers are aggregated at different spatial levels, revealing patterns from local to regional scales in changes of flood and drought magnitudes. We find that on average, flood magnitude rose by 1.5% and drought magnitude fell by 1.3% across Europe since the 1950s, with multidecadal variations. Climate dynamics lead to heterogenous patterns, with an overall wetting of north-western Europe, and a drying in the Mediterranean region. Diverse land use changes (e.g., urbanization, reforestation) have generally increased flood and drought hazard (intensification), while water demand primarily intensified droughts (drying). Reservoirs, conversely, have smoothed extremes and decelerated the hydrological cycle. Our work delivers insights into the intricate connections between climate, society, and water at a refined resolution in European river basins, enabling the development of effective strategies for enhancing resilience to extreme water events under global changes.

How to cite: Tilloy, A., Paprotny, D., Mentaschi, L., Grimaldi, S., Gomez-Aragon, D., and Feyen, L.: Climatic and socioeconomic drivers of changing flood and drought magnitudes in Europe from 1951 to 2020, EGU General Assembly 2026, Vienna, Austria, 3–8 May 2026, EGU26-6934, https://doi.org/10.5194/egusphere-egu26-6934, 2026.

EGU26-7343 | ECS | Posters on site | HS2.4.5

Understanding temporal transitions and spatial connections of high and low flow spells at local and regional scales 

Guilherme Mendoza Guimarães, Maria-Helena Ramos, and Ilias Pechlivanidis

When floods and droughts occur successively before the river catchment is able to recover, their socio-economic and environmental impacts are amplified. While the drivers of individual extremes are well understood, the spatial connections and timescales of transitions between occurrences of high and low flow spells remain understudied, especially regarding their implications for operational risk management. Here we detect and characterize high and low flow spells at the catchment (local) scale as well as at the regional (decision-making) scale of operational flood forecasting centers. We use daily streamflow data from 643 catchments of the CAMELS-FR dataset in France over the 1970-2021 period, and investigate the occurrences of such spells within the 17 regional centers of the national forecasting service (hereafter called ‘SPC’, for ‘Service de Prévision des Crues’ in French). We initially use a mixed threshold approach combined with baseflow estimation as an indicator for catchment recovery to detect the spells and then analyze their frequency, duration, temporal transition and spatial connections (spatially compounding events). Our results show that consecutive occurrences of the same spell type are more predominant, with consecutive high flow spells being more common. Transitions occurring in less than a month from low to high flows show distinct spatial variability, with the shortest transition durations concentrated in the regions of the Rhone-Mediterranean and Rhine-Meuse river basins. These transitions mainly occur in autumn and early winter. On the other hand, transitions from high to low flows are typically slow, developing over more than 90 days. In addition, it is identified that the SPC Alpes du Nord (located in the Rhone-Mediterranean region) shows transition frequencies above the national mean for all transition types, while the SPC Bassin du Nord (in northern France) has lower frequencies in all transition types. We also applied a synchronization approach to investigate spatially compounding events by identifying pairs of catchments with concurrent high flow spells, low flow spells, and opposing spells (e.g. when one catchment is experiencing a high flow spell, while another is experiencing a low flow spell). The analysis allowed us to detect regions with high spatial connectedness, as well as patterns of inter- and intra-annual variability of spatially connected spells. Finally, perspectives on the application of the developed methodology at the European scale are discussed.

This work is funded by EU Horizon Europe project MedEWSa (Mediterranean and pan-European forecast and Early Warning System against natural hazards) under Grant Agreement 101121192.

How to cite: Guimarães, G. M., Ramos, M.-H., and Pechlivanidis, I.: Understanding temporal transitions and spatial connections of high and low flow spells at local and regional scales, EGU General Assembly 2026, Vienna, Austria, 3–8 May 2026, EGU26-7343, https://doi.org/10.5194/egusphere-egu26-7343, 2026.

EGU26-7370 | Orals | HS2.4.5

From precipitation to impact: Understanding the impacts climate non-stationarity through on pace of drought 

Ben Livneh, Matthew Sabin, Nels Bjarke, and Benet Duncan

Theory suggests that a non-stationary, warming climate will intensify the global hydrologic cycle. Yet theoretical expectations of intensification are often at odds with observational records. Understanding how potential acceleration affects the transition between hydrological extremes remains a critical knowledge gap relevant to the session’s goal to better understand the interplay between hydro-climatic states. We investigate the changing pace of the water cycle through the lens of observed lag times between atmospheric drivers and terrestrial drought.

Focusing on the conterminous United States from 1950 to 2020, we employ a multi-metric framework to quantify changes. We begin by analyzing soil water residence time and Water Cycle Intensity (WCI) using data from ERA5-Land, in situ observations and gaged streamflow records. Here, a decrease in residence time indicates a faster turnover, or "flashiness," which fundamentally alters how extremes propagate through the landscape. To link these physical rates to societal impacts, we subsequently analyze drought propagation—specifically the lag time between meteorological drought (Standardized Precipitation Index) and agricultural drought (Standardized Soil Moisture Index). Preliminary hypotheses suggest that as the water cycle accelerates, the buffer capacity of the land surface diminishes, leading to faster propagation of precipitation deficits into soil moisture and runoff deficits. By quantifying these changing lag times, this research provides a new, observationally-driven assessment of how the ‘rate’ of drought is evolving, seeking to provide useful insights for early warning systems and the management of non-stationary transitions between wet and dry extremes.

How to cite: Livneh, B., Sabin, M., Bjarke, N., and Duncan, B.: From precipitation to impact: Understanding the impacts climate non-stationarity through on pace of drought, EGU General Assembly 2026, Vienna, Austria, 3–8 May 2026, EGU26-7370, https://doi.org/10.5194/egusphere-egu26-7370, 2026.

EGU26-7542 | ECS | Orals | HS2.4.5

Global patterns, drivers and trends of multi-year groundwater drought 

Saskia Salwey and Niko Wanders

Groundwater stores a third of all global freshwater and supports water supply, irrigation and ecosystems across the world. As such, groundwater drought can have wide-reaching financial, social and environmental impacts, particularly when drought events are prolonged or multi-year. Although recent work has made significant progress in understanding the drivers and patterns of multi-year meteorological droughts, we do not know how this signal translates into multi-year groundwater drought, where subsurface processes and anthropogenic pumping or abstractions can alter the meteorological signal. This is particularly true at the global-scale, where a major barrier to understanding large-scale groundwater drought dynamics is the difficulty of obtaining consistent and comprehensive groundwater data.

In this research, we use a new global hyper-resolution (30 arc-seconds or ~1 km) groundwater dataset produced by the global groundwater model GLOBGM to investigate the global trends, patterns and drivers of groundwater drought from 1960-2019, with a specific focus on multi-year events. We start by characterizing the relationship between meteorological drought (represented by SPEI-12) and groundwater drought, evaluating how and to what extent the sub-surface plays a role in modulating the meteorological signal. Subsequently, we categorize the global groundwater data based on its relationship with the meteorology to provide a framework for understanding the processes and geo-physical drivers of normal versus multi-year groundwater drought events in each category. We find that 35% of the world has an average groundwater drought duration which is multi-year. In 84% of these locations, the subsurface extends the meteorological drought signal, whilst in the remaining 16% the groundwater appears to be primarily driven by SPEI-12. We found that pooling of meteorological droughts, the presence of abstractions and lag in groundwater response time are the main drivers for multi-year groundwater droughts. Our analysis offers new insights into global-scale drought exposure and can help inform strategies for managing and mitigating future water scarcity risks.

How to cite: Salwey, S. and Wanders, N.: Global patterns, drivers and trends of multi-year groundwater drought, EGU General Assembly 2026, Vienna, Austria, 3–8 May 2026, EGU26-7542, https://doi.org/10.5194/egusphere-egu26-7542, 2026.

EGU26-7629 | ECS | Orals | HS2.4.5

The European Drought Monitor – EO-powered 1-km daily drought monitoring with 6-day latency 

Pallav Kumar Shrestha, Kilian Lenz, Ehsan Modiri, Matthias Kelbling, Afid Nur Kholis, Valentin Simon Lüdke, Husain Najafi, and Luis Samaniego

Droughts are among the costliest of natural disasters in Europe resulting, with average reported losses of about 621 million euros per event [1]. Yet seamless drought monitoring, modelling, and forecasting across spatial scales and time remains a major challenge in hydro-meteorological sciences, in particular when information is needed at actionable kilometre-scale resolution and with low latency. 

We address this need with the high-resolution European Drought Monitor (EDM, https://www.ufz.de/index.php?en=52233) as part of the European Space Agency funded DTE Hydrology Next project. EDM provides continentwide products at 1 km resolution, daily updates, and an operational latency of about 6 days. EDM builds on the precursor system of the German Drought Monitor [2, 3] and on a series of European-scale mHM demonstrations [4–10]. 

EDM runs the mesoscale Hydrologic Model (mHM, https://mhm-ufz.org) on a single pan-European domain. Near-real-time meteorological forcing is taken from ERA5-Land and downscaled to 1 km using external drift kriging (EDK), followed by bias correction using the EMO dataset. Operational production is implemented on an ecFlow backend. EDM provides daily gridded states and fluxes and delivers the soil moisture index (SMI) drought indicator as a core product. 

We evaluate EDM against independent observations across multiple components of the terrestrial water balance. Median streamflow skill is Kling–Gupta efficiency (KGE) = 0.38 across 1466 GRDC gauges. Modeled evapotranspiration shows very high agreement with gridded FLUXNET products (correlation = 0.99). Further evaluation uses Earth observation-based (EO) datasets: ESA CCI soil moisture (correlation = 0.54) and GRACE/GRACE-FO total water storage (correlation = 0.61). Together, these results demonstrate that EDM provides spatially and temporally consistent drought diagnostics across Europe at high resolution. 

Planned developments include (i) upgrading soil moisture physics by replacing the current infiltration-capacity approach with a Richards equation representation [11] to improve volumetric water content realism, (ii) incorporating atmospheric EO products for near-real-time model initialisation, and (iii) exploiting EO constraints for irrigation water-use estimation and reservoir state verification. By providing EO-informed, kilometre-scale drought surveillance, EDM supports the Sendai Framework’s call for improved hazard monitoring and enables timely, locally relevant drought warnings for Europe. 

References

[1] https://www.emdat.be
[2] doi: 10.1088/1748-9326/11/7/074002
[3] doi: 10.5194/hess-26-5137-2022
[4] doi: 10.1175/JHM-D-15-0053.1
[5] doi: 10.5194/hess21-4323-2017
[6] doi: 10.1088/1748-9326/aa9e35
[7] doi: 10.1175/JHM-D-18-0040.1
[8] doi: 10.1038/s41558018-0138-5
[9] doi: 10.1175/BAMS-D-17-0274.1
[10] doi: 10.1029/2021EF002394
[11] doi: 10.1029/2024WR039625

How to cite: Shrestha, P. K., Lenz, K., Modiri, E., Kelbling, M., Kholis, A. N., Lüdke, V. S., Najafi, H., and Samaniego, L.: The European Drought Monitor – EO-powered 1-km daily drought monitoring with 6-day latency, EGU General Assembly 2026, Vienna, Austria, 3–8 May 2026, EGU26-7629, https://doi.org/10.5194/egusphere-egu26-7629, 2026.

Drought–flood abrupt transitions are a manifestation of hydroclimatic volatility and can lead to hydrologic extremes that are influenced by the amplification of wet-dry anomalies through land-surface dynamics and watershed storage. In addition to meteorological forcing, land cover changes can modify infiltration–runoff partitioning, evapotranspiration feedback, and soil-moisture persistence, thereby reshaping where transition hotspots emerge and how abruptly they evolve. This study quantifies drought–flood transition regimes in the semi-arid Ebro basin and evaluates how land cover changes modulate the propagation of hydroclimatic variability into hydrologic regime transitions. 

The Precipitation–Evaporation Anomaly Index (PEAI) is computed from HYPER-P 1km precipitation and GLEAM evapotranspiration, providing a high-resolution description of hydroclimatic deficit–surplus anomalies over 2016–2022. PEAI is integrated with surface soil-moisture anomaly dynamics derived from Sentinel-1 radar to compute high-frequency ΔSM anomalies. These ΔSM anomaly sequences provide the basis for deriving soil-moisture memory (SMM) at fine spatial and temporal scales, with persistence, decay, and instability quantified. Drought–flood transitions are delineated by persistent PEAI anomaly reversals and retained only when accompanied by a coherent ΔSM response, after which events are mapped to delineate hotspots and summarized using metrics of frequency, duration, and abruptness. Land cover change is derived from the Copernicus datasets, which provide annual land-cover maps from 2016 to 2022, and is used to stratify SMM properties and transition metrics to compare transition behavior under similar PEAI variability across areas with different land-cover patterns. 

Results show pronounced dry–wet alternations and spatially heterogeneous soil-moisture memory, with short persistence and elevated instability in recurrent transition zones. These SMM signatures sharpen the delineation of hydroclimatic volatility hotspots and improve the spatial identification of rapid drought–flood abrupt transition events. Transition frequency and abruptness are not explained by PEAI intensity alone; instead, they vary systematically with land-cover patterns, revealing distinct transition regimes across cropland-dominated areas, natural vegetation, and expanding built-up surfaces. Overall, integrating PEAI derived from HYPER-P precipitation and GLEAM evapotranspiration with radar-based ΔSM and SMM provides a physically consistent, high-resolution framework to explain how hydroclimatic volatility propagates into hydrologic extremes through drought–flood abrupt transitions shaped by land cover change in a semi-arid Mediterranean basin. 

How to cite: Serbouti, I. and Brocca, L.: Hotspots of drought–flood abrupt transitions from hydroclimatic volatility to hydrologic extremes under land cover change, EGU General Assembly 2026, Vienna, Austria, 3–8 May 2026, EGU26-9199, https://doi.org/10.5194/egusphere-egu26-9199, 2026.

EGU26-9592 | ECS | Orals | HS2.4.5

Added Value of Earth Observation Constraints for Multi-Model Drought Detection in the Rhine Basin  

Ehsan Modiri, Oldrich Rakovec, Pallav Kumar Shrestha, Almudena García-García, Leandro Avila, Katie Blackford, Elizabeth Cooper, Bram Droppers, Paolo Filippucci, Milan Fischer, Matěj Orság, Pietro Stradiotti, Luca Brocca, Douglas Clark, Wouter Dorigo, Stefan Kollet, Jian Peng, Niko Wanders, and Luis Samaniego

Reliable characterisation of soil-moisture drought is critical for water management, yet hydrological models can diverge substantially because of parametric uncertainty [1] even when forced with identical meteorology. This work is conducted within the ESA 4DHydro initiative (https://4dhydro.eu/) and builds on our EO-constrained parameter estimation framework [2]. We assess whether Earth Observation (EO) data reduce this divergence using a four-model ensemble (CLM, JULES, mHM, PCR-GLOBWB) over the Rhine Basin. We compare three parameter estimation strategies: (i) a non-EO baseline using default model configurations, (ii) EO-only calibration using satellite soil moisture (SM) and evapotranspiration (ET), and (iii) a hybrid EO+Q calibration combining EO constraints with streamflow (Q).

The latter ensures both spatial pattern matching of EO-derived SM, ET, and water balance closure. For the major droughts of 2015, 2018, and 2019, EO-only calibration notably reduces inter-model spread and strengthens the detection of extreme dry conditions, improving ensemble agreement by up to ~0.09 in extreme-event cases. Joint SM+ET calibration provides the best trade-off between sensitivity to extremes and ensemble stability across models.

The EO+Q strategy yields the highest temporal skill, including station-scale improvements (e.g., RMSE reductions of ~0.02 and correlation gains of ~0.06 in independent validation), but also exposes larger between-model differences, especially in Alpine headwaters where snow and glacier processes remain challenging. Overall, EO constraints can meaningfully tighten multi-model drought estimates, while also highlighting persistent structural uncertainties that should be communicated in operational drought early-warning systems.


References:

[1] Samaniego, L., Kumar, R. and Attinger, S., 2013. Multiscale parameter regionalization of a grid-based hydrologic model at the mesoscale. Journal of Hydrology, 476, pp.253–265.

[2] Modiri, E. et al., 2026. Toward improved soil moisture drought representation through Earth Observation constrained parameter estimation: A multi-model ensemble analysis over the Rhine River basin. In submission to HESSD.

How to cite: Modiri, E., Rakovec, O., Shrestha, P. K., García-García, A., Avila, L., Blackford, K., Cooper, E., Droppers, B., Filippucci, P., Fischer, M., Orság, M., Stradiotti, P., Brocca, L., Clark, D., Dorigo, W., Kollet, S., Peng, J., Wanders, N., and Samaniego, L.: Added Value of Earth Observation Constraints for Multi-Model Drought Detection in the Rhine Basin , EGU General Assembly 2026, Vienna, Austria, 3–8 May 2026, EGU26-9592, https://doi.org/10.5194/egusphere-egu26-9592, 2026.

EGU26-9706 | ECS | Posters on site | HS2.4.5

Spatio-Temporal Analysis of Drought: From Identification to Propagation Pathways 

Amrutha Sunil and Sarmistha Singh

Drought develops gradually as a consequence of sustained rainfall shortages and extends through the land surface system, leading to reductions in soil moisture and impacts on agricultural production. In regions such as India, where the climate is strongly influenced by the monsoon, clarifying the linkage between meteorological drought conditions and subsequent agricultural drought is essential for improving drought assessment and early warning capabilities. This study develops a spatio-temporal framework to examine drought propagation by combining statistical drought indices with network-based analysis. Meteorological drought is quantified using the Standardized Precipitation Index (SPI) at multiple accumulation time scales to represent short- and long-term rainfall anomalies. Agricultural drought is represented using the Standardized Soil moisture Index (SSI), which is calculated from soil moisture anomalies. Drought events are identified using run theory, from which their onset, duration, and severity are determined. The relative timing between meteorological and agricultural drought is evaluated by examining lagged correlations between SPI and SSI, which allows the response delay of agricultural drought to be estimated for different regions. The observed lag patterns differ across space, reflecting variations in soil properties, local climate conditions, and interactions between the land surface and the atmosphere. 
                  To assess spatial coherence, separate single-layer spatial networks are constructed for SPI and SSI, where grid cells represent nodes and statistically significant correlations define network connections. Network measures such as degree and betweenness centrality are applied to determine the regions that exert the greatest influence on drought connectivity. The analysis shows that meteorological drought tends to form more widespread and spatially coherent connectivity patterns, whereas agricultural drought exhibits stronger spatial contrasts linked to land-surface processes. These differences indicate that drought does not propagate uniformly but follows region-specific pathways shaped by local response times within the hydrological system. The proposed framework improves understanding of drought evolution from rainfall deficits to soil moisture stress and provides useful insights for drought monitoring, early warning, and climate-resilient agricultural planning.

Keywords: Standardized Precipitation Index, Standardized Soil moisture Index, Drought propagation, Network analysis


How to cite: Sunil, A. and Singh, S.: Spatio-Temporal Analysis of Drought: From Identification to Propagation Pathways, EGU General Assembly 2026, Vienna, Austria, 3–8 May 2026, EGU26-9706, https://doi.org/10.5194/egusphere-egu26-9706, 2026.

Africa’s climate is shaped by a complex interplay between atmospheric and oceanic systems that affect each part of the region rather differently with distinct seasonality. The northernmost and southernmost areas of the continent have a Mediterranean-type climate, with dry-hot summers and moist-moderate winters, which results in distinct seasonality in the hydrological cycle and semi-aridity [1, 2]. The Sahara, a large desert in northern Africa, is located in the subtropics and has an arid climate characterised by highly variable precipitation patterns and water scarcity. A large part of sub-Saharan Africa, however, is under the influence of monsoonal systems, whose dynamics and seasonality are heavily influenced by large-scale meridional temperature gradients that lead to cross-equatorial energy imbalance and shifts of the intertropical convergence zone [3], that is, a narrow low-pressure band where moist air ascends and results in heavy precipitation.

Monsoonal systems are highly crucial for the tropical African countries' socio-economic development, particularly their agriculture, ecosystem, and energy systems. The interaction between monsoonal systems and the large-scale modes of variability, such as the El Niño-Southern Oscillation and the Indian Ocean Dipole [4], gives rise to strong spatial precipitation gradients and pronounced year-to-year variability.

As a result of human-induced warming, the atmospheric and oceanic circulation patterns are expected to change, which can lead to changes in precipitation patterns and distribution, increased evapotranspiration, and increased extreme events such as floods and droughts. In this work, we monitor and project extreme events over Africa, with a particular focus on droughts, to understand how drought propagates from one system to another. We consider drought not as a single event but as a continuous, evolving process [5] with interconnected impacts on the hydrological, agricultural, socio-economic, and overall African energy systems across different timescales.

To address this, we use observational records, reanalysis, climate model historical simulations and projections of different scenarios, and examine different meteorological and impact-based indices to 1) understand the climatology of Africa in the historical/present-day period, 2) analyse the spatiotemporal changes in its hydroclimate within the historical records and in the coming decades, and 3) identify drought events in the past and in the coming decades to check if, and to what extent, Africa's infrastructure can buffer the impacts of extreme events.


References:

[1] Giorgi, F. (2006). Climate change hot-spots. Geophys. Res. Lett, 33, 8707. https://doi.org/10.1029/2006GL025734
[2] Seager, R., et al. (2019). Climate Variability and Change of Mediterranean-Type Climates. Journal of Climate, 32(10), 2887–2915. https://doi.org/10.1175/jcli-d-18-0472.1
[3] Nicholson, S. E. (2018). The ITCZ and the Seasonal Cycle over Equatorial Africa. Bulletin of the American Meteorological Society, 99(2), 337–348. https://doi.org/10.1175/BAMS-D-16-0287.1
[4] Hoell, A., & Funk, C. (2013). The ENSO-Related West Pacific Sea Surface Temperature Gradient. Journal of Climate, 26(23), 9545–9562. https://doi.org/10.1175/JCLI-D-12-00344.1
[5] Van Loon, A. F., et al. (2024). Review article: Drought as a continuum – memory effects in interlinked hydrological, ecological, and social systems, Nat. Hazards Earth Syst. Sci., 24, 3173–3205, https://doi.org/10.5194/nhess-24-3173-2024

How to cite: Tootoonchi, R. and Castelletti, A.: Drought Continuum in Africa: A Multidimensional Assessment of Meteorological, Hydrological, Agricultural, and Socioeconomic Drought, EGU General Assembly 2026, Vienna, Austria, 3–8 May 2026, EGU26-9790, https://doi.org/10.5194/egusphere-egu26-9790, 2026.

EGU26-9836 | ECS | Orals | HS2.4.5

A Multidimensional View of Flood Regimes in the Narmada Basin, India 

Nahida Begum M H, Somil Swarnkar, and Arun Dev Singh

Flood hazards in large river basins are shaped by multiple interacting factors, including how long a flood lasts, how high the peak flow becomes, and how much water passes through the river system. Traditional approaches that focus only on the flood peak often miss important aspects of flood behaviour and can underestimate risks, especially for long, slowly building floods or short, intense flash events. This study provides a basin-wide assessment of flood characteristics in the Narmada River Basin, India, using 50 years of daily streamflow data from 13 monitoring stations. Instead of analysing peak flows alone, we consider three dimensions of flood behaviour—peak discharge, volume, and duration—and combine them into two complementary metrics. The Short-Duration Flood Index (SDFI) highlights quick, intense floods typically driven by burst rainfall and rapid runoff, while the Long-Duration Flood Index (LDFI) represents slower, persistent floods that build up over days as catchments saturate. These indices allow floods to be compared across the entire basin despite large differences in catchment size and hydrologic setting. The analysis reveals clear spatial contrasts in flood behaviour. Upstream mountainous and plateau regions experience more sustained, long-duration floods, reflecting greater storage and slower runoff processes. Mid-basin tributaries show pronounced flashiness and frequent short-duration floods driven by intense rainfall and limited buffering capacity. Downstream areas receive the highest overall flows as water converges from upstream, but exhibit mixed characteristics depending on event type and rainfall distribution. Importantly, the index-based approach identifies severe flood events that traditional peak-only assessments tend to overlook. By capturing both flash floods and slow-building high-volume floods within a single framework, the method provides a more complete picture of basin-wide flood hazard. Although demonstrated in the Narmada Basin, the approach is applicable to other major river systems and can support flood mitigation planning, early-warning design, and water-resource management—especially as climate change continues to alter rainfall patterns and flood regimes.

Keywords: Multivariate flood analysis; Flood indices; Flood frequency analysis; Hydrological extremes; Narmada River Basin

How to cite: Begum M H, N., Swarnkar, S., and Singh, A. D.: A Multidimensional View of Flood Regimes in the Narmada Basin, India, EGU General Assembly 2026, Vienna, Austria, 3–8 May 2026, EGU26-9836, https://doi.org/10.5194/egusphere-egu26-9836, 2026.

EGU26-10554 | ECS | Posters on site | HS2.4.5

Causal Relationships in Sequential Drought–Flood Events Across Multiple Catchments 

Hossein Abbasizadeh, Oldrich Rakovec, and Petr Maca

Understanding hydrological sequential extremes is a major contemporary challenge, particularly when droughts and floods increasingly occur in close succession. Recent studies have primarily focused on identifying consecutive and compound drought-flood events and their characteristics; however, the causal mechanisms linking these events remain largely unexplored. In this study, we investigate the causal relationships between hydrological droughts and subsequent floods, as well as their antecedent conditions, at the catchment scale. Building on established approaches for identifying drought–flood events, we extend the analysis by using the PC (Peter–Clark) algorithm to uncover causal dependencies between the characteristics of pre-event, streamflow drought, transition, and flood phases (Abbasizadeh et. al., 2025). To apply causal discovery, we first identify drought–flood events from 30 years of observed streamflow records across a large sample of catchments in the United States (Rakovec et. al., 2019). We characterize streamflow droughts by their duration and deficit, and floods by their volume, peak discharge, and duration. Using flux variables, namely precipitation, actual and potential evapotranspiration, and baseflow, as well as the state variable terrestrial water storage, we then identify anomalies during the pre-event, drought, and transition phases that lead to flooding. Actual and potential evapotranspiration, baseflow, and terrestrial water storage are derived from the mesoscale Hydrologic Model (mHM) simulation. The catchment characteristics are also included as the potential time-independent drivers of drought-flood events during different phases.  Then the causal discovery method is applied to the pool of drought-flood events derived from all catchments to identify the causal links and their strength between variables. Our results reveal distinct causal links across the different phases, clarifying the conditions under which droughts either amplify or suppress the flood characteristics. These findings advance the understanding of compound and consecutive hydrological drought-flood extremes.


References:

Abbasizadeh, Hossein, Petr Maca, Martin Hanel, Mads Troldborg, and Amir AghaKouchak. "Can causal discovery lead to a more robust prediction model for runoff signatures?." Hydrology and Earth System Sciences 29, no. 19 (2025): 4761-4790.

Rakovec, Oldrich, Naoki Mizukami, Rohini Kumar, Andrew J. Newman, Stephan Thober, Andrew W. Wood, Martyn P. Clark, and Luis Samaniego. "Diagnostic evaluation of large‐domain hydrologic models calibrated across the contiguous United States." Journal of Geophysical Research: Atmospheres 124, no. 24 (2019): 13991-14007.


How to cite: Abbasizadeh, H., Rakovec, O., and Maca, P.: Causal Relationships in Sequential Drought–Flood Events Across Multiple Catchments, EGU General Assembly 2026, Vienna, Austria, 3–8 May 2026, EGU26-10554, https://doi.org/10.5194/egusphere-egu26-10554, 2026.

EGU26-10796 | Orals | HS2.4.5

Contrasting projected changes in European streamflow extremes across global warming levels 

Oldrich Rakovec, Ray Kettaren, Devvrat Yadav, Mirek Trnka, Martin Hanel, and Rohini Kumar

Our study analyses streamflow characteristics across the European domain, focusing on changes in the frequency, magnitude, and duration of low and high streamflow events and their interactions. We use the percentile of the Standardized Runoff Index distribution (SRI-P) as a metric to characterize these hydrological events (dry using SRI-P < 0.2 and wet SRI-P > 0.8). The monthly gridded discharge time series are obtained from the multiscale Hydrological Model (mHM), which was forced by meteorologic data from the ISIMIP3b archive, which has been bias-corrected and downscaled using the latest E-OBS observational dataset. We first perform a historical evaluation (1960-2024) to evaluate the model's ability to capture observed streamflow characteristics against observation-based E-OBS meteorological characteristics. The projections are then analyzed according to different Global Warming Levels (GWLs) to identify non-linear responses in streamflow extremes to warming levels. Increasing global warming from 1.5°C to 3°C (with respect to the 1980-2010 GCM specific baseline) essentially intensify European streamflow toward severe and more extended drought conditions. While Northern Europe is projected strong high-flow events, these extremes lose their strength in the south. Instead, the focus shifts to low-flow extremes, which are growing more severe and frequent. This leaves the Mediterranean in a state of pronounced drying, while Central Europe sits in the middle, highlighting its vulnerability to hydrological risk as wet extremes weaken and droughts intensify, elevating pressure from both ends.

How to cite: Rakovec, O., Kettaren, R., Yadav, D., Trnka, M., Hanel, M., and Kumar, R.: Contrasting projected changes in European streamflow extremes across global warming levels, EGU General Assembly 2026, Vienna, Austria, 3–8 May 2026, EGU26-10796, https://doi.org/10.5194/egusphere-egu26-10796, 2026.

Resilient water-resources planning needs long datasets that capture low-frequency variability and rare, high-impact events beyond the instrumental era. This is particularly important in the Greater Dublin Area (GDA), where increasing water demand and reliance on a small number of linked sources and ageing infrastructure increases exposure to prolonged rainfall deficits. With major investment planned for new supplies and transfers, drought risk should be assessed against a long baseline. Here we develop a multi-method, multi-source reconstruction that extends monthly precipitation totals for the GDA back to 1748, and summer (MJJA) precipitation back to 1200.

Observations for the GDA are derived from the newly developed long-term gridded rainfall product produced by Met Éireann, the national meteorological agency. This extended gridded dataset integrates observations recovered through various citizen science and data rescue initiatives. For the GDA, we further extend monthly precipitation back to 1748 using two complementary approaches. First, we apply statistical reconstruction using physically interpretable circulation and hydroclimate predictors, including long sea-level pressure (SLP) series, pressure-gradient indices, and teleconnection modes. Models are calibrated separately for each calendar month using Lasso regression and random forests and uncertainties estimated using bootstrap resampling. Second, we scale monthly and annual precipitation anomalies for the period 1711-1977 compiled in a UK Met Office Branch Memorandum (No. 77) by Jenkinson et al. (1979) to observed GDA precipitation. This unpublished series combines early instrumental observations with documentary weather diaries (quantified via a graded wet–dry ranking scheme), drawing on UK regional series when Irish data are sparse and increasingly using Irish station records from the late 18th century onwards. Drought events identified from the reconstructed rainfall series are further verified using documentary sources, including the Irish Drought Impacts Database (1733-2019) derived from newspaper records, linking meteorological drought to locally reported impacts. 

Finally, to extend the series further back, UK-based tree-ring records (oak cellulose δ¹⁸O) are used to reconstruct MJJA precipitation back to 1200. These data from central England are calibrated to the GDA using variance scaling and assessed with split-period verification. Together, these evidence streams provide a basis for a multi-centennial precipitation series and drought catalogue for the GDA, suitable for water-resources assessment and planning.

How to cite: Horvath, C.: Integrating Historical, Proxy, and Documentary Evidence for a Multi-centennial Drought Reconstruction for the Greater Dublin Area, Ireland, EGU General Assembly 2026, Vienna, Austria, 3–8 May 2026, EGU26-11294, https://doi.org/10.5194/egusphere-egu26-11294, 2026.

EGU26-11385 | ECS | Orals | HS2.4.5

Reconstructing representative runoff coefficients in small basins using limited historical data 

Pietro Bogoni, Giulia Evangelista, Daniele Ganora, and Pierluigi Claps

Flood events can be highly localized in both time and space. Many of the most severe events observed in recent years have occurred in small catchments, where high flow velocities and the rapid development of floods substantially limit the effectiveness of monitoring and hydrometeorological forecasting. When reconstructing the characteristics of such events, together with the analysis of catchment response times, attention is commonly given to soil infiltration and retention processes. In engineering applications, the runoff coefficient is often used to describe the proportion of rainfall that becomes runoff during an event.

For a given watershed, the runoff coefficient is not a fixed parameter; it varies considerably with event intensity and the physical and hydrological characteristics of the catchment. This study proposes a practical methodology for estimating a representative catchment runoff coefficient where high-resolution rainfall and streamflow time series are lacking. Leveraging more than 1,000 historical events from 60 small to medium-sized catchments in diverse climatic regions of Italy, sourced from national Hydrological Yearbooks, we reconstruct annual runoff coefficients from historical hydrological extremes and compare two estimation methods: an event-based and a frequency-based approach.

A key element of the event-based method is the development of a procedure to associate discharge maxima with their corresponding rainfall maxima in time, which was necessary because, in many cases, the dates of occurrence of extremes (day/month) were not recorded. On the other hand, a frequency-based pairing of rainfall and discharge extremes was shown to provide runoff coefficient estimates that are comparably robust to those obtained with the event-based approach.

Further investigation of case studies characterized by unusually low (below 0.1) or high (above 1) runoff coefficients highlighted several sources of data inconsistency that can compromise estimate reliability. The most common issues include spatial mismatches between rain gauge locations and catchment boundaries, transcription errors in historical datasets, and additional runoff contributions, such as snowmelt in Alpine regions. Recognizing and accounting for these factors allowed for a more consistent and reliable estimation of runoff coefficients.

How to cite: Bogoni, P., Evangelista, G., Ganora, D., and Claps, P.: Reconstructing representative runoff coefficients in small basins using limited historical data, EGU General Assembly 2026, Vienna, Austria, 3–8 May 2026, EGU26-11385, https://doi.org/10.5194/egusphere-egu26-11385, 2026.

EGU26-11405 | Orals | HS2.4.5

A Multi-Model Approach to Return Period Estimates: The Example of Floods 

Carla Sciarra, Luca Ridolfi, and Francesco Laio

Traditionally, hazard assessments have relied on the concept of a T-value (or return period) to define the average frequency of extreme events, which is linked to an exceedance probability. However, despite significant advancements in continuous hazard modeling, the most common method for hazard definition still relies on pre-determined probabilities of exceeding a specific event. As a result, current models typically provide hazard maps for specific return periods, often resulting in limited overlap among the considered return periods.

To address this limitation, we introduce a multi-model expected return period framework for extreme events, which estimates the average frequency of climate hazards by integrating multiple open datasets. This approach offers a novel methodological perspective on return period estimation, providing a statistically robust and user-friendly tool to address model heterogeneity. We demonstrate the framework's applicability by utilizing open and accessible web data on flood hazards, specifically three spatial datasets detailing global inland fluvial flood maps: the World Resources Institute's Aqueduct Floods Project maps (Ward et al., 2020), the European Joint Research Center's (JRC) maps (Dottori et al., 2016), and the maps produced by the CIMA Research Foundation and the United Nations Environment Programme (Rudari et al., 2015).

We introduce here a multi-model expected return period value, TMM, determined by an average function based on the number of active models, i.e., the number of models that provide a valid output for a given cell within their active spatial domain. This concept shifts the perspective on extreme event frequency from evaluating hazard as event-, model-, and return-period-specific to a more integrated hazard estimation approach.

Although demonstrated using flood hazard data, the framework can be adapted to any other spatially-explicit extreme event characterized by return periods, such as drought, cold spells, and wind storms. By leveraging the differences among existing datasets, our mathematical framework adds value to open science efforts, introducing a tool to exploit high-quality, open data from distinct modeling designs. This can particularly benefit socio-economically vulnerable communities. Our work showcases the potential of heterogeneous, open data sources to improve climate knowledge and provides a robust foundation for future research in hazard modeling and climate risk assessment.

How to cite: Sciarra, C., Ridolfi, L., and Laio, F.: A Multi-Model Approach to Return Period Estimates: The Example of Floods, EGU General Assembly 2026, Vienna, Austria, 3–8 May 2026, EGU26-11405, https://doi.org/10.5194/egusphere-egu26-11405, 2026.

Understanding the drivers of hydrological change is essential for sustainable water governance. This study examines long-term hydroclimatic variability and drought evolution in the Kävlingeån Basin, southern Sweden, over the period 1970–2020. Trend analyses of precipitation, runoff, and potential evapotranspiration indicate increasing atmospheric water demand accompanied by declining runoff, suggesting an overall tendency toward drier conditions. Drought indices (SPEI-03 and SPEI-12) further reveal increasing drought persistence and pronounced seasonal asymmetry. Monthly trend analysis of SPEI-03 shows significant drying in March and April, coinciding with the onset of the agricultural growing season, which may pose challenges for crop production and irrigation management in this predominantly agricultural basin. Decadal variability analysis towards wet and dry events indicates that SPEI-12 has shifted toward drier conditions since the 1970s, characterized by a reduction in annual mean wet events and an increased frequency of dry events. In contrast, SPEI-03 exhibits no clear long-term trend, suggesting that short-term water balance variability has remained relatively stable.

Furthermore, attribution analysis of multi-year runoff variations suggests that non-climatic factors potentially contribute more to the observed changes than climatic drivers, including precipitation and potential evapotranspiration, indicated by a set of Budyko framework based analysis at yearly and monthly time scale. This finding indicates that human activities have likely played a substantial role in reshaping the hydrological balance of the basin.

How to cite: An, D. and Persson, K.: Hydroclimatic Variability and Its Implications for Drought and Runoff in the Kävlingeån Basin, Southern Sweden (1970–2020), EGU General Assembly 2026, Vienna, Austria, 3–8 May 2026, EGU26-11952, https://doi.org/10.5194/egusphere-egu26-11952, 2026.

EGU26-13165 | ECS | Posters on site | HS2.4.5

Temporal drought dynamics in Germany: climate and catchment controls 

Maysaa Abdelmajid, Mayra Daniela Peña-Guerrero, Manuela Irene Brunner, Mariana Madruga de Brito, and Larisa Tarasova

Hydrological droughts result from the propagation of meteorological drought through the terrestrial hydrological system. Their temporal dynamics, including onset, development, intermittency, and recovery, show pronounced spatial variability reflecting different climatic and catchment controls. These characteristics are critical for drought risk management because they control the timing, magnitude, and persistence of water deficits, with implications for water supply, agricultural water demand, aquatic ecosystems, and energy production. Despite their importance, these temporal characteristics are seldom examined, and their controlling factors remain insufficiently quantified.

Here, we investigate the climatic and catchment controls on the temporal dynamics of hydrological drought using observations of precipitation, streamflow, and groundwater levels from 132 German catchments for the period 1951 to 2020. Using the Variable Threshold Method, we identify 1,574 hydrological drought events and characterize their onset, development, intermittency, and recovery times. We examine the spatial variability of these characteristics across the study catchments and identify the controls underlying their similarity, including the synchronization between precipitation and evapotranspiration seasonality, catchment storage capacity, and groundwater-surface water interactions (gaining-losing conditions). Within catchments exhibiting similar drought dynamics, we then examine how temporal variations in gaining-losing conditions affect drought onset, development, intermittency, and recovery.

Our findings advance mechanistic understanding of drought dynamics and support improved water resources management under increasing climate variability.

How to cite: Abdelmajid, M., Peña-Guerrero, M. D., Brunner, M. I., de Brito, M. M., and Tarasova, L.: Temporal drought dynamics in Germany: climate and catchment controls, EGU General Assembly 2026, Vienna, Austria, 3–8 May 2026, EGU26-13165, https://doi.org/10.5194/egusphere-egu26-13165, 2026.

Previous work has shown that geomorphic changes can drive changes in channel conveyance capacity that affect flood hazard (Slater et al., 2015; Pinter et al., 2008). However, these prior studies have tended to frame evolving flood hazard as a monotonic trend (in response to gradual channel aggradation or degradation), without detailed consideration of the actual trajectory of change. Here we suggest that the evolution of flood hazard (here represented by changes in water level for a constant discharge) in river systems is sometimes expressed as behaviours consistent with geomorphic punctuated equilibrium (Phillips, 2006), whereby periods of relative stability and/or gradual change are interrupted by abrupt shifts in water levels.

To illustrate this, we present an analysis of the frequency and magnitude of abrupt shifts in water level for constant discharges (so-called specific gauge analysis) using long term (>30 year) records at more than 120 US gauging stations. At each station we first identify linear trends (via Mann-Kendall (MK) testing) in the water level time series, before identifying abrupt discontinuities using a Pruned Exact Linear Time (PELT) algorithm, creating a robust framework for detecting multiple regime shifts within each time series.

Preliminary results reveal that, even for our gauging station study sites – typically considered to be geomorphically stable – both gradual adjustments and abrupt shifts in water level are common across a wide range of return-period flows. We also explore how the prevalence of these instabilities varies in response to driving factors such as sediment connectivity, channel confinement, and flow regulation. These findings have implications for flood risk management, suggesting that static flood maps may be insufficient in dynamic landscapes to represent the actual risks posed to exposed populations and assets.

References:

Phillips, J. D. (2006). Evolutionary geomorphology: thresholds and nonlinearity in landform response to environmental change. Progress in Physical Geography, 30(4), 431-447.

Pinter, N., et al. (2008). Cumulative impacts of river engineering, Mississippi River, USA. Geomorphology, 101(1-2), 147-160.

Slater, L. J., Singer, M. B., & Kirchner, J. W. (2015). Hydrologic versus geomorphic drivers of trends in flood hazard. Geophysical Research Letters, 42(2), 370-376.

How to cite: Gasparotto, A. and Darby, S.: Punctuated Equilibrium in River Systems: Quantifying Abrupt Hydraulic Instability Across Water Level Timeseries, EGU General Assembly 2026, Vienna, Austria, 3–8 May 2026, EGU26-13420, https://doi.org/10.5194/egusphere-egu26-13420, 2026.

EGU26-13436 | ECS | Orals | HS2.4.5 | Highlight | HS Division Outstanding ECS Award Lecture by Larisa Tarasova

Water extremes under change: from processes to impacts 

Larisa Tarasova

A wide variety of processes controls characteristics of water extremes: river floods, droughts, episodes of detrimental streamwater quality. Understanding generation processes of these events may assist in uncovering their emergence and support the interpretation of their changes. Here I show how objective event identification and transferable causative classification frameworks are able to overcome the limitations of locally tailored approaches and detect functional changes in extremes over large spatial domains and long temporal scales.

To pave the way towards more efficient adaptation measures for extremes we need to understand intricate links between their hazard and impact components better. Here I demonstrate how different generation processes of extremes are interlinked with the adaptation efficiency, previous societal experiences and awareness uncovering how they might shape socio-economic impacts. The examples show how bridging across domains can help to improve our preparedness and anticipate future impacts.

How to cite: Tarasova, L.: Water extremes under change: from processes to impacts, EGU General Assembly 2026, Vienna, Austria, 3–8 May 2026, EGU26-13436, https://doi.org/10.5194/egusphere-egu26-13436, 2026.

EGU26-13772 | Orals | HS2.4.5

A multi-purpose modelling framework for improved prediction of hydrological extremes at the European and global scale 

Stefania Grimaldi, Peter Salamon, Carlo Russo, Cinzia Mazzetti, Christel Prudhomme, and Nikolaos Mastrantonas and the team of co-authors

OS LISFLOOD is an open-source, spatially distributed, physically-based hydrological model. Notably, it is used in the operational set-up of the Copernicus Emergency Management Service (CEMS) to generate flood forecasts for the European and Global Flood Awareness Systems (EFAS & GloFAS) and drought indicators for the European and Global Drought Observatories (EDO & GDO). Being part of an operational set-up, OS LISFLOOD and its European and global model domain set-ups benefit from regular upgrades, with the release of EFAS version 6 (1 arcmin spatial resolution, 6 hours temporal resolution) and GloFAS version 5 (3 arcmin spatial resolution, daily temporal resolution) planned in 2026.

In a multi-purpose framework, developments included in EFAS v6 and GloFAS v5 aim to improve the representation of all key hydrological states and fluxes, with specific attention to high and low flows, soil moisture, snow cover, total runoff, and total water storage. For example, improved representation of physical processes (e.g. a diffusive river routing and a revised reservoir routine) enables more accurate simulation of river flow dynamics; updated model inputs (such as meteorological forcings and soil properties) and revised model routines (model state initialization, snow melt, and water losses to the deep groundwater) support more realistic representation of snow cover, soil moisture and total water storage dynamics. Moreover, model parameter calibration used a novel objective function, the Joint Divergence Kling–Gupta Efficiency (JDKGE), designed to optimize performance on both high and low flows.  

This contribution presents the quantitative evaluation of EFAS v6 and GloFAS v5. OS LISFLOOD calibration utilized 2,318 in-situ discharge time series for Europe and 5,230 globally, with an increase of 22% and 162%, respectively, over previous versions. Median modified Kling Gupta Efficiency (‘KGE) exceeds 0.7 for both systems, representing an improvement of +0.08 and +0.21 for the European and global domains, respectively. Examples of high and low flow simulations for different climate zones and socio-economic landscapes allow to uncover the outcomes of modelling choices, explain challenges, and share open questions. European and global set-ups comprehensive evaluation also entails comparisons with relevant hydrological variables for water resilience such as soil moisture and total water storage.

EFAS and GloFAS hydrological reanalysis datasets are available from the Copernicus Early Warning Data Store. In compliance with FAIR principles, OS LISFLOOD source code (with v5 incorporating all recent model improvements) is freely accessible alongside its pre- and post-processing tools, input maps, and calibrated parameter maps. By providing open access to these datasets and modeling tools, we invite the wider community to benefit from the recent developments, collaborate in model evaluation, and contribute to the ongoing evolution of the system.

How to cite: Grimaldi, S., Salamon, P., Russo, C., Mazzetti, C., Prudhomme, C., and Mastrantonas, N. and the team of co-authors: A multi-purpose modelling framework for improved prediction of hydrological extremes at the European and global scale, EGU General Assembly 2026, Vienna, Austria, 3–8 May 2026, EGU26-13772, https://doi.org/10.5194/egusphere-egu26-13772, 2026.

EGU26-14728 | ECS | Orals | HS2.4.5

Changing droughts and floods in the Bay of Bengal: Insights from high-resolution climate simulations 

Santos J. González-Rojí, Martina Messmer, and Shelly Win

The Bay of Bengal region is critically important both climatically and socioeconomically. Its warm waters influence monsoon patterns, which are essential for sustaining agriculture across India, Bangladesh and Myanmar. However, the region is increasingly experiencing floods and prolonged droughts that disrupt water availability and crop production, threatening the livelihood of millions of people. These not only exacerbate food insecurity but also highlight the vulnerability of densely populated coastal areas to climate variability. Understanding the future dynamics makes the Bay of Bengal a crucial area for climate modelling.

To that purpose, we conducted five high-resolution simulations, each spanning 30 years, using the Weather Research and Forecasting (WRF) model under different Shared Socioeconomic Pathways (SSPs) and time periods. The spatial resolution of the domain is 5 km, with hourly outputs stored. The first simulation was run under present climate conditions (1981–2010). For the future, SSP2-4.5 and SSP5-8.5 scenarios were considered, and two distinct periods were simulated: mid-century (2031–2060) and end-of-century (2071–2100).   

The analysis of the Standardized Precipitation Evapotranspiration Index (SPEI) calculated over 6 and 24 months suggest important changes on both short- and long-duration droughts. The probability of short drought occurrence is quadrupled in some areas of central and east India under both scenarios, and tripled in some parts of the Ayeyarwady delta in Myanmar. The severity of the droughts will be exacerbated by the end of the century, particularly over central Myanmar and coastal areas of India in both scenarios. For the long term, SPEI-24 indicates that severe droughts will be found over mainland India under both SSPs. The droughts will intensify also along the western coast of Myanmar and the Ayeyarwady Delta in most of the periods, except for the latest period of SSP5-8.5.

Additionally, changes in flooding are being investigated through flood assessments using coupled HEC-HMS and HEC-RAS modeling over Myanmar. Preliminary findings suggest significant changes in flooding in the Ayeyarwady Delta by the end of the century, with an increase in severity, especially under the SSP5-8.5 scenario. Similarly, flooding is expected to intensify along the Ayeyarwady River from the confluence with the Chindwin River to Magway —covering most of the central dry zone— by the end of the century under SSP-8.5.

Changes in atmospheric dynamics and the monsoon seem to be playing a role in the occurrence of droughts, but further understanding of these connections is needed. Our results highlight emerging patterns of drought and flood risk that warrant closer examination, offering valuable insights for future hydroclimatic assessments and regional planning.

How to cite: González-Rojí, S. J., Messmer, M., and Win, S.: Changing droughts and floods in the Bay of Bengal: Insights from high-resolution climate simulations, EGU General Assembly 2026, Vienna, Austria, 3–8 May 2026, EGU26-14728, https://doi.org/10.5194/egusphere-egu26-14728, 2026.

EGU26-15273 | ECS | Posters on site | HS2.4.5

MLP-based hydrological forecasting in the Madeira River Basin, Amazonia: a prelude toward robust modeling of hydrological extremes 

Júlia Camarano Lüdtke, Bruno Melo Brentan, and André Ferreira Rodrigues

Recent decades have been associated with an apparent intensification of hydrological extremes across the Madeira River Basin (Amazonia), reinforcing the need for forecasting frameworks that are reproducible, leakage-safe, and operationally defensible. An integrated machine-learning workflow is implemented to forecast the downstream Standardized Streamflow Index (SSI-12) at gauging station 15700000, using a strictly time-ordered monthly dataset and an explicitly controlled validation protocol. The supervised learning design is defined via forward target shifting (h = 1) and explicit representation of hydrological memory through antecedent lag terms (1-12 months), consistent with the persistence embedded in accumulated standardized indices. Data preparation comprises temporal harmonization, conversion to consistent numeric formats, and reconstruction of residual gaps through KNN imputation to better preserve multivariate covariability in predictor space. A parsimonious modeling pipeline is adopted, combining standardization (training statistics only) with mutual-information-based feature screening to enforce predictor compactness and reduce redundancy. Hyperparameters and feature subset size are optimized via RandomizedSearchCV under TimeSeriesSplit cross-validation, with NSE used as the primary refit criterion. Final fitting is refined through external early stopping on a held-out validation segment, monitoring a robust Huber loss to stabilize training under heteroscedastic conditions. Out-of-sample skill assessed through RMSE, MAE, R2, NSE, and KGE indicates strong predictability and close phase agreement between forecasts and observations. Nevertheless, a persistence-type baseline remains superior on validation and test partitions, underscoring the pronounced short-term autocorrelation intrinsic to SSI-12 and setting a stringent benchmark for incremental gains. Residual behavior under extremes further indicates heteroscedasticity and systematic peak attenuation, motivating extreme-aware refinements centered on residual learning relative to persistence, event-centric feature engineering incorporating exogenous hydroclimatic drivers, and tail-sensitive optimization to improve fidelity during high-impact episodes.

How to cite: Camarano Lüdtke, J., Melo Brentan, B., and Ferreira Rodrigues, A.: MLP-based hydrological forecasting in the Madeira River Basin, Amazonia: a prelude toward robust modeling of hydrological extremes, EGU General Assembly 2026, Vienna, Austria, 3–8 May 2026, EGU26-15273, https://doi.org/10.5194/egusphere-egu26-15273, 2026.

EGU26-15415 | ECS | Orals | HS2.4.5

Increased Future Streamflow Drought-to-Flood Transitions across Brazilian Catchments 

Dimaghi Schwamback, Abderraman Brandão, Marcos Benso, José Gescilam Uchôa, Jamil A. A. Anache, André Ballarin, Gabriela Gesualdo, and Jullian Sone

Too much and too little water can trigger cascading, multisectoral impacts through floods and droughts, respectively. Although these natural disasters are traditionally analyzed in isolation, their temporal sequencing can produce compounding impacts that exceed the impact of single, independent events. As climate change has already increased the magnitude and frequency of both droughts and floods worldwide, future climatic conditions are also expected to substantially alter the frequency, timing, and characteristics of drought-to-flood transitions.

A few existing studies on these consecutive shifts focus on climate change impacts at a global scale, while the limited number of regional-scale analyses of streamflow drought-to-flood transitions often do not assess how climate change may reshape these transitions at subseasonal and seasonal timescales. Thereby, we shed light on anticipated impacts of climate change on streamflow drought-to-flood transitions across 505 catchments in Brazil by comparing the baseline period (1980-2010) with a near-future period (2015-2040) and a distant-future period (2071-2100) under a medium-emission (SSP2-4.5) and high-emission (SSP5-8.5) scenario derived from 10 bias corrected climate change models. We distinguish between rapid transitions (14 days between extremes) and seasonal transitions (90 days between extremes).

Our results indicate that both rapid and seasonal drought-to-flood transitions in Brazil are projected to more than double by the end of the century under both emission pathways. Notably, approximately 80% of investigated catchments are expected to first experience rapid drought-to-flood transitions in the future, i.e., this share of catchments did not experience such events during the baseline period. This emergence of previously unobserved transitions underscores the urgency of proactive water management to mitigate potential multisectoral impacts of sequential, contrasting extremes. Relative changes substantially increase from the near to distant future under both climate change pathways, with the most pronounced increases occurring in the most populated (e.g., São Paulo in Southeast Brazil) and agricultural-relevant regions (e.g., areas in the Cerrado biome in Mid-West Brazil). Beyond changes in frequency, transition times are also expected to shift. Rapid transitions exhibit increased variability and longer transition times approaching the 14-day threshold, whereas seasonal transitions remain predominantly distributed between 30 and 60 days.

The projected increase in drought-to-flood transition frequency poses significant challenges for water resources management, particularly for systems designed to cope with hydrological extremes independently. Rapid transitions may undermine reservoir operation rules, drought contingency plans, and early warning systems that implicitly assume longer recovery periods between extremes. This is especially critical in densely populated areas, where abrupt shifts from drought to flood can simultaneously strain water storage, allocation, and flood control objectives, amplifying risks to urban water supply and other water ecosystem services. Anticipating these transitions is paramount for adaptive management strategies that incorporate compound-event risk into operational decision-making and adaptation planning.

How to cite: Schwamback, D., Brandão, A., Benso, M., Gescilam Uchôa, J., A. A. Anache, J., Ballarin, A., Gesualdo, G., and Sone, J.: Increased Future Streamflow Drought-to-Flood Transitions across Brazilian Catchments, EGU General Assembly 2026, Vienna, Austria, 3–8 May 2026, EGU26-15415, https://doi.org/10.5194/egusphere-egu26-15415, 2026.

EGU26-15821 | Posters on site | HS2.4.5

A Hierarchical Sociohydrological Model Incorporating Spacial Heterogeneity for Flood Risk Management 

Shinichiro Nakamura, Natsumi Arase, Patricia Ann Sanchez, and Miho Ohara
Flood risk management is shaped by complex feedbacks between hydrological processes and social responses, yet many existing sociohydrological models treat society as a homogeneous entity. This study develops a hierarchical sociohydrological model that explicitly represents socioeconomic heterogeneity by incorporating multiple disaster-vulnerable social groups. The study area is divided into three groups based on topography and socioeconomic characteristics, and group-specific dynamics are modeled by accounting for population movements within and beyond the region, as well as differences in flood memory loss, preparedness levels, and mobility.
 
Key model parameters are estimated using household survey data collected in San Mateo City, the Philippines. Using this empirically grounded model, we evaluate the impacts of alternative flood management strategies through numerical simulations, focusing on variations in levee height and the frequency of disaster preparedness education. The model is applied to contrasting policy scenarios with and without levee protection to assess their differential effects on flood losses across social groups.
 
The results reveal that under a no-levee scenario, flood losses become increasingly uneven over time, with widening disparities among social groups, indicating the amplification of social inequality. In contrast, levee-based scenarios reduce inter-group disparities in cumulative flood losses; however, they also lead to substantially larger losses per event when extreme floods occur. These findings highlight a trade-off between reducing chronic inequality and increasing vulnerability to rare but catastrophic events.
 
By explicitly integrating socioeconomic heterogeneity into sociohydrological modeling, this study demonstrates the importance of distributional analysis in flood risk assessment and adaptation planning. The proposed framework provides a quantitative basis for evaluating equity–efficiency trade-offs in flood management policies and supports the design of more just and effective flood adaptation strategies.

How to cite: Nakamura, S., Arase, N., Ann Sanchez, P., and Ohara, M.: A Hierarchical Sociohydrological Model Incorporating Spacial Heterogeneity for Flood Risk Management, EGU General Assembly 2026, Vienna, Austria, 3–8 May 2026, EGU26-15821, https://doi.org/10.5194/egusphere-egu26-15821, 2026.

EGU26-15972 | Posters on site | HS2.4.5

Modelling hydrological dynamics under dramatic shift from drought to flood in the small mountainous catchment 

Hyeonjun Kim, Wonjin Jang, Cheolhee Jang, and Deokhwan Kim

In summer of 2025, an extreme drought occurred in the east cost region in South Korea. The Gangneung city encountered a critical shortage of water supply from July to mid-September and a ‘state of disaster’ was declared by the government. The Obong reservoir of 100 km2 catchment and 1.4 million m3 storage is operated for the water supply for 200,000 residents and 480 ha of irrigated paddy fields. This severe drought was ended with abnormal rainfall after mid-September and reservoir storage was returned to normal levels.

To better understanding the hydrologic response in small mountainous catchment, the 25 years of climate and hydrologic data (2000~2025) analysed and daily record of water supply (2023~2025) for municipal and irrigation from the reservoir were collected. The catchment characteristics including topography, soil type and shallow aquifer properties were also analysed using DEM and digital soil and land-use map. The hydrological dynamics including soil moisture and groundwater level changes are simulated using physically-based hydrologic model, DWAT (Dynamic Water Resources Assessment Tool). The DWAT is run on a daily time step to generate hydrologic processes in the catchment from the rainfall and climate data (temperature, humidity and wind velocity, sunshine hours).

The hydrologic behaviour was simulated from 2000 to 2025 and the simulations result showed that the dramatic changes of soil moisture after mid-September rainfall and which subsequently increase of streamflow from the catchment. The simulation results highlighted the strong influence of antecedent soil moisture conditions on catchment response. During the drought period, soil moisture was critically low, limiting runoff generation even during heavy rainfall events. For example, on September 13, even the daily rainfall was exceeded 100 mm, the streamflow was not increased significantly because of the low soil moisture in the catchment. Once the soil was saturated, interflow increased streamflow, followed later by baseflow from the shallow aquifer. The water storage of Obong reservoir was lowest to 11.5% in mid-September and dramatically recovered over 90% by 300 mm of rainfall until the early of October.

This study demonstrates the value of long-term hydrologic modelling for understanding drought resilience in small mountainous catchment. The DWAT simulations provided insights into the interactions between rainfall, soil moisture, streamflow, and groundwater, highlighting the critical role of antecedent conditions in shaping hydrologic response. Moreover, the case of Gangneung in 2025 illustrates how extreme droughts may be rapidly reversed by anomalous rainfall, yet such reliance on unpredictable events poses significant risks for water resource management.

This work was supported by Korea Environment Industry & Technology Institute(KEITI) through Water Management Program for Drought Project, funded by Korea Ministry of Climate, Energy and Environment(MCEE).(2022003610002)


How to cite: Kim, H., Jang, W., Jang, C., and Kim, D.: Modelling hydrological dynamics under dramatic shift from drought to flood in the small mountainous catchment, EGU General Assembly 2026, Vienna, Austria, 3–8 May 2026, EGU26-15972, https://doi.org/10.5194/egusphere-egu26-15972, 2026.

EGU26-16610 | ECS | Posters on site | HS2.4.5

Data-based hydrometeorological drought indicators and appropriate temporal aggregation scales for studying drought impacts 

Amy ten Berge, Martijn Booij, and Maarten Krol

Recent consecutive dry summers in North Western Europe caused significant impacts across ecosystems and socio-economic sectors. Climate change is expected to increase the frequency and severity of drought and its impacts. To mitigate drought impacts in the future, it is crucial to improve our understanding on the effects of climate change on drought and its impacts.

A range of meteorological and hydrological drought indicators exists to quantify droughts. Depending on the drought impact of interest, different indicators aggregated over different timeframes (temporal aggregation scales) may be relevant. However, in climate change impact assessments, indicators currently are often used without assessing their relevance for the impact of interest. As a result, it often remains unclear which indicator and associated temporal aggregation scale is most appropriate for a given drought impact in a particular region.

We apply a bottom-up, data-driven approach to determine which hydrometeorological drought indicators are relevant and to identify their appropriate temporal aggregation scales for different drought impacts in the Dutch-German border region. Starting with drought impacts, such as agricultural yield loss, we derive hydrometeorological indicators and their temporal aggregation scales. For example, we analyse the correlation between groundwater table depths with varying temporal aggregation scales and crop yield loss simulated with the WaterVision Agriculture tool. Among the tested temporal aggregation scales (1 to 12 months), a five-month aggregation of groundwater table depth shows the highest correlation with agricultural yield loss. This shows that the groundwater table depth aggregated over the final five months of the cropping season is an important hydrological drought indicator for agricultural yield loss in the Dutch-German border region. Next steps include extending the analysis to other drought impacts and linking hydrological and meteorological indicators.

This analysis improves understanding on the relevance of various hydrometeorological indicators and associated temporal scales for different drought impacts and helps in assessing the effects of climate change on drought impacts in the future.

How to cite: ten Berge, A., Booij, M., and Krol, M.: Data-based hydrometeorological drought indicators and appropriate temporal aggregation scales for studying drought impacts, EGU General Assembly 2026, Vienna, Austria, 3–8 May 2026, EGU26-16610, https://doi.org/10.5194/egusphere-egu26-16610, 2026.

EGU26-16882 | ECS | Posters on site | HS2.4.5

Assessing Nonlinear Responses of Flash Drought Characteristics to Elevation in the Western Himalayan Catchment 

Ravi Kumar, Nitin Joshi, and Deepak Swami

Flash droughts are rapidly developing soil moisture deficits that intensify within weeks and pose growing threats to agriculture, ecology, hydropower, water, and food security. Their behaviour in Himalayan basins remains poorly understood due to complex topographic features, highly heterogeneous soil moisture & land-atmosphere energy fluxes, and the coexistence of snow-fed & rain-fed hydrological regimes. Addressing to this gap and supporting Sustainable Development Goals (SDGs) related to zero hunger (SDG 2), clean water availability (SDG 6), and climate action (SDG 13), this study investigates flash drought characteristics and their elevation dependence in the Indian Indus Basin. Multi-source daily root-zone soil moisture (RZSM) datasets from ERA5, SMAP, FLDAS_CA, and GLDAS (versions 2.1 and 2.2) bilinearly interpolated at 0.1° resolution were evaluated against in-situ measurements from the NGARI network of the International Soil Moisture Networks (ISMN), which identified the ERA5-GLDAS2.1-GLDAS2.2 ensemble as the most reliable RZSM data (R² = 0.7003). The validated RZSM data were converted to 8-day (octad) means, and soil moisture percentiles were computed using an empirical Weibull distribution. The RZSM percentile octads were then used to identify flash droughts in the basin. Flash drought events were detected when percentiles declined from ≥40 to ≤20 within three octads at an intensification rate ≥6.5 percentiles per octad, and persisted below the 20th percentile up to eleven octads. From these events, the mean annual and seasonal onset speeds, durations, severities, and frequencies were quantified. Piecewise linear regression with breakpoints selected using the change in Akaike information criterion (ΔAIC) revealed distinct elevation-dependent regimes. Mean annual flash drought severity, frequency, and duration increased from low to mid-elevation zones (up to ~2000 m) and declined toward higher elevations. Mean annual onset speed was maximum (~17-30 percentile/octad) at low elevations, indicating rapid soil moisture depletion under strong atmospheric demand, whereas higher elevations exhibited slower onset (~6.5-17 percentile/octad), likely due to snowmelt-driven soil moisture replenishment and reduced evaporative demand. Similar elevation dependence regimes of flash drought characteristics were observed seasonally, with maximum frequency (~10-15%) and onset speed (~15-20 percentile/octad) in the monsoon, but the highest duration (~6.5-10 octads) and severity (~100-150) in the post-monsoon. These non-linear elevation responses highlighted the critical role of topography in modulating flash drought evolution in the complex Himalayan basin. This study presents the first elevation-based characterization of flash droughts and demonstrates the value of high-resolution reanalysis-based soil moisture data for enhancing flash drought monitoring in data-scarce mountain basins.

How to cite: Kumar, R., Joshi, N., and Swami, D.: Assessing Nonlinear Responses of Flash Drought Characteristics to Elevation in the Western Himalayan Catchment, EGU General Assembly 2026, Vienna, Austria, 3–8 May 2026, EGU26-16882, https://doi.org/10.5194/egusphere-egu26-16882, 2026.

EGU26-17525 | ECS | Orals | HS2.4.5

Non-stationarity and spatial heterogeneity of extreme discharge and flood return levels in the Brahmaputra Valley, India 

Abhilash Kumar Paswan, Virendra Mani Tiwari, and Manoj Kumar Phukan

Understanding spatial variability in extreme river discharge is crucial for accurately assessing flood risk in extensive, monsoon-dominated river basins. This study highlights the characteristics of extreme discharge and its correlation with flood events along the Brahmaputra River. Extreme hydrological events were identified through a threshold-based methodology, with the 99th percentile of daily discharge established as a benchmark for high-impact flood conditions. To ensure the independence of events, exceedances were declustered using a three-day separation window, retaining only peak discharge values from individual events. The results indicate a pronounced downstream amplification in the magnitude of extreme discharges, characterized by increasing event peaks from upper to lower Assam. This phenomenon reflects the cumulative integration of hydrological processes across the basin, underscoring the influence of basin-wide hydro-climatic factors.  Seasonal analysis reveals that extreme discharge events are predominantly concentrated during the monsoon season, underscoring the critical role of monsoon rainfall and the upstream catchment's response in the genesis of flood events. Furthermore, Flood return periods, computed using declustered peak discharges, yield reach-specific flood estimates, indicating significantly higher 50-year return levels in the downstream sections. A comparative analysis of extreme event characteristics between pre- and post-2000 periods reveals an increase in both mean and maximum flood magnitudes in recent years, suggesting potential non-stationarity in the flood regime. The frequency of smaller flood return periods has increased in recent times, primarily due to shifting precipitation patterns within the basin. Overall, this study demonstrates the longitudinal coherence in the behaviour of extreme discharge along the Brahmaputra River, characterized by the downstream amplification of flood magnitude and the persistence of basin-scale drivers influencing extreme event frequency. These findings underscore the importance of conducting spatially distributed assessments of extreme flows for effective flood risk management in extensive Himalayan river systems under changing hydroclimatic conditions.

How to cite: Paswan, A. K., Tiwari, V. M., and Phukan, M. K.: Non-stationarity and spatial heterogeneity of extreme discharge and flood return levels in the Brahmaputra Valley, India, EGU General Assembly 2026, Vienna, Austria, 3–8 May 2026, EGU26-17525, https://doi.org/10.5194/egusphere-egu26-17525, 2026.

EGU26-18016 | Posters on site | HS2.4.5

Assessing snowfall droughts in mediterranean mountain catchments 

Rafael Pimentel, Pedro Torralbo, Gómez-Beas Raquel, Egüen Marta, Ana Andreu, and Polo María José

The Mediterranean Basin is a region naturally prone to drought due to its climatic variability. These variations are being exacerbated by the current climate change situation, with projections agree that the frequency and severity of these extreme events will increase. Paradigmatically, this region has based its socioeconomic development on activities directly related to water resources, such as agriculture and tourism. In addition, the Mediterranean basin is delimited by mountain ranges close to the sea that draw different-sized catchments where water resources availability is directly linked to snow presence. Therefore, snow dynamics need to be considered when analyzing droughts. Cold and warm winter droughts over these mountains have special characteristics since winter temperatures are around zero and conditions both snow accumulation and ablation directly.

However, the general drought indices, SPI (Standardized Precipitation Index) or SPEI (Standardized Precipitation-Evapotranspiration Index), which are the most widely used tools to characterize droughts, do not explicitly account for snow. New snow drought indices have been proposed, for instance, the Standardized Snow Water Equivalent Index (SSWEI). They are, on the one hand, based on snow variables typically derived from modelling and are subject to large uncertainties over Mediterranean mountain catchments; and, on the other hand, focus mainly on the ablation process. This work proposes to define a new drought index, introducing the concept of snowfall drought in Mediterranean mountain regions. Then, snowfall is the target variable used to define the drought index, the Standardized Snowfall Index (SSNI). The index definition is based on the methodology already proposed when defining other drought indices, evaluating, in this case, eight different candidate distributions, and standardizing their probability using a Normal distribution. The aggregation time selected for the snowfall series was 12 months. HydroGFD3 bias-adjusted reanalysis data (daily time-step and 25 km spatial resolution) for precipitation and temperature during the period 1980-2024 are used in the study. Snowfall is determined using a variable temperature thresholding over the whole Mediterranean Basin (2266 catchments). The SSNI was evaluated against the SPI index to assess the differences in detecting drought between the two indices.

The results show that the candidate distribution selected differed depending on the location of the catchment. That is, the Gamma distribution was the best at capturing the snowfall drought dynamics in high elevation catchments, Log-Logistic in the eastern Mediterranean catchments, and Weibull in the western ones. The number of drought periods also differed spatially, ranging from 0 to 22 episodes with a duration between 0 and 20 months, and a clear relationship between both: the longer the duration, the smaller its frequency. In addition, this new index helps better quantify the effect of a snow deficit in the meteorological drought definition - from all months identified with a drought, 38% of them would not have been classified as drought months, only accounting for precipitation and not for snowfall - and consequently to better understand the drought propagation cascade over the region.

Acknowledgments: This work is part of the project CNS2023-145125, funded by MCIN/AEI/10.13039/501100011033 and European Union “NextGenerationEU”/PRTR.

How to cite: Pimentel, R., Torralbo, P., Raquel, G.-B., Marta, E., Andreu, A., and María José, P.: Assessing snowfall droughts in mediterranean mountain catchments, EGU General Assembly 2026, Vienna, Austria, 3–8 May 2026, EGU26-18016, https://doi.org/10.5194/egusphere-egu26-18016, 2026.

EGU26-18045 | Posters on site | HS2.4.5

Design flood estimation and its uncertainty under current climate in the Czech Republic 

Vojtěch Svoboda and Libuše Barešová

Design flood estimates are essential for the construction and maintenance of hydrological infrastructure. In practice, flood frequency distributions and their parameters are estimated using limited samples of observed data. However, both the estimation process and the data themselves are subject to considerable uncertainty. One of the key challenges in this context is the occurrence of extreme floods. For example, in September 2024, a flood ranking among the most significant hydrological events of the past several decades occurred in the Czech Republic. The Jeseník region was the most affected area. Despite the hydrological drought conditions preceding the event, the flood return period in this region was estimated to be as high as 500 years. An interesting fact is that this region experienced a second extreme flood within less than 30 years (since July 1997). This recurrence highlighted the need to verify existing design flood estimates and proceed with their revision. Frequency analysis of observed annual peak discharges indicates that the design flood with a 100-year return period may be underestimated at some gauging stations in the region by 10–20%. On the contrary, data from recent decades suggest an overestimation of less extreme desing floods with return periods of approximately 1 to 10 years. Consequently, an innovative approach to design flood estimation that incorporates both of these findings is currently being developed.

How to cite: Svoboda, V. and Barešová, L.: Design flood estimation and its uncertainty under current climate in the Czech Republic, EGU General Assembly 2026, Vienna, Austria, 3–8 May 2026, EGU26-18045, https://doi.org/10.5194/egusphere-egu26-18045, 2026.

EGU26-19081 | ECS | Orals | HS2.4.5

Water Quality Responses to Floods and Droughts in the Context of Climate and Land Use Change.  

Ivo Pink, Sim M. Reaney, Martha L. Villamizar Velez, Alistair Boxall, and Aaron Neill

Anthropogenic pressures, including climate and land-use change, are expected to intensify hydrological extremes, such as floods and droughts, in many regions worldwide. These hydrological changes are likely to have cascading effects on water quality, affecting a range of stakeholders and the ecological health of the freshwater system. However, significant uncertainty exists in projections of future catchment-scale hydrological extremes and the resulting effect on different water quality parameters.

In this study, we assess potential future changes in hydrological extremes and associated water quality responses across five hydrologically diverse catchments in Yorkshire, UK. Climate forcing is derived from 12 UK Climate Projections (UKCP) regional climate models at the highest available spatial resolution of 2.2 km. To account for socio-environmental change, three contrasting land use scenarios are considered, ranging from a sustainable transition (SSP1-2.6) to fossil-fuelled industrialisation (SSP5-8.5). The integrated hydrological and water quality model ‘HYdrological Predictions for the Environment’ (HYPE) is applied within a Generalised Likelihood Uncertainty Estimation (GLUE) framework to predict hydrological droughts and floods and the water quality response for an ensemble of climate and land use projections. 

In this talk, we first present how both hydrological droughts and floods are projected to change under future climate and land-use scenarios. We then show how water quality parameters (water temperature, suspended sediments, nitrogen, phosphorus) change during these extreme events. Lastly, we quantify how spatio-temporal uncertainty in climate, land use and HYPE parameterisation propagate through to the simulated flow and water quality parameters.

How to cite: Pink, I., Reaney, S. M., Villamizar Velez, M. L., Boxall, A., and Neill, A.: Water Quality Responses to Floods and Droughts in the Context of Climate and Land Use Change. , EGU General Assembly 2026, Vienna, Austria, 3–8 May 2026, EGU26-19081, https://doi.org/10.5194/egusphere-egu26-19081, 2026.

EGU26-19571 | ECS | Orals | HS2.4.5

A nonstationary copula-based framework for analyzing hydrological drought concurrence and propagation in river networks 

Yuqing Feng, Zhiyong Wu, and Sergio M. Vicente-Serrano

Hydrological drought is among the most impactful hydro-climatic extremes, with effects that often propagate along river networks and affect extensive downstream regions. Although drought processes differ fundamentally from floods in terms of their underlying mechanisms, both types of extremes exhibit pronounced nonstationarity under the combined influence of climate change and human activities, and both require advanced statistical tools to characterize their evolving risks. In particular, the dependence structures among hydrological extremes at different spatial locations remain insufficiently understood, especially from the perspective of river-network connectivity and propagation processes.

In this study, we focus on the nonstationary dependence of hydrological droughts along upstream–downstream river systems and the associated concurrence risk. Using a series of hydrological gauging stations distributed along tributaries and the main stem of the Yangtze River basin, we develop a drought concurrence analysis framework based on extreme value theory and nonstationary copulas to characterize the spatio-temporal evolution of multi-site drought dependence. The framework first identifies and matches drought events at the event scale across multiple stations, ensuring that copula modelling is built upon genuinely concurrent extreme drought processes. This event-based treatment avoids the potential mixing of asynchronous drought events that may arise when copulas are directly constructed from time series at fixed time steps. Subsequently, extreme drought characteristics, such as drought duration, are modelled using extreme value theory for the marginal distributions, while time-varying parameters are introduced in a nonstationary copula to describe the evolution of inter-site drought dependence.

Compared with existing studies, the proposed framework addresses two key limitations in current copula-based drought concurrence analyses: the insufficient representation of true event concurrence and the lack of explicit modelling of nonstationary dependence structures. This integrated approach enables a direct comparison of drought dependence between adjacent (local-scale) and non-adjacent (long-range) upstream–downstream station pairs, providing a unified, probabilistic, and transferable statistical tool for quantifying multi-site extreme drought concurrence risk and its temporal evolution.

The results reveal pronounced nonstationarity in upstream–downstream drought dependence, with clear strengthening or weakening trends over recent decades. Notably, dependence structures inferred from non-adjacent station pairs differ substantially from those estimated using only adjacent stations. This finding highlights the importance of accounting for multi-station propagation effects in drought analysis, rather than relying solely on local relationships. The evolution of dependence structures further leads to significant changes in concurrent drought risk, with particularly strong implications for downstream regions, where streamflow dynamics integrate hydrological signals from multiple upstream sub-basins.

By explicitly linking drought nonstationarity, spatial dependence, and concurrence risk, this study contributes to a more comprehensive understanding of hydrological extremes at the river-network scale. The proposed framework is flexible and can be extended to other drought definitions, different river basins, and even to the joint analysis of droughts and floods. The findings provide valuable scientific insights for drought risk assessment and adaptive water resources management under a changing climate.

How to cite: Feng, Y., Wu, Z., and Vicente-Serrano, S. M.: A nonstationary copula-based framework for analyzing hydrological drought concurrence and propagation in river networks, EGU General Assembly 2026, Vienna, Austria, 3–8 May 2026, EGU26-19571, https://doi.org/10.5194/egusphere-egu26-19571, 2026.

EGU26-19758 | ECS | Posters on site | HS2.4.5

Asymmetric Hydroclimatic Transitions in Europe: Insights into Recovery and System Memory 

Mostafa Khosh Chehreh, Elisa Ragno, and Carlo De Michele

Transitions from dry to wet states challenge water management practices and can lead to severe impacts. Recent studies have investigated dry–wet transitions from a meteorological perspective and focused on the transition itself. By contrast, how the hydroclimatic system behaves before and after the transition remains understudied. Here, we study where and why hydroclimatic transitions in Europe display asymmetric pre- and post-transition behavior using large-sample climate model simulations under pre-industrial, historical, and future climates. Our results show that hydroclimatic transitions across Europe are frequently characterized by asymmetric behavior around regime shifts, rather than balanced recovery. This indicates that some regions experience rapid recovery following dry–wet transitions, while others exhibit persistent anomalies beyond the transition itself. This pattern suggests that hydroclimatic recovery is conditioned by antecedent states, with systems retaining memory of prior dryness or wetness. As a result, transitions may be followed by either abrupt intensification of wet conditions or slow and incomplete recovery, implying differing propensities for post-transition flood amplification or prolonged drought persistence.

How to cite: Khosh Chehreh, M., Ragno, E., and De Michele, C.: Asymmetric Hydroclimatic Transitions in Europe: Insights into Recovery and System Memory, EGU General Assembly 2026, Vienna, Austria, 3–8 May 2026, EGU26-19758, https://doi.org/10.5194/egusphere-egu26-19758, 2026.

EGU26-19994 | Posters on site | HS2.4.5

Generating extreme floods using multi-millennial high-resolution simulations: A proof-of-concept over the UK 

Nans Addor, Jannis Hoch, Natalie Lord, Chris Lucas, Alex Marshall, Jorge Sebastian Moraga, and Oliver Wing

A critical challenge in catastrophe modeling is the requirement for high-resolution stochastic event sets that span tens of thousands of years to accurately sample extreme tail risks. Traditional weather generators often rely on simplified statistical assumptions that struggle to maintain complex multi-variable physical consistencies and to realistically capture climate change. Conversely, dynamical downscaling of General Circulation Models (GCMs) is computationally prohibitive to generate the multi-millennial simulations covering large domains required for robust risk assessment.

We present a computationally efficient modeling chain that leverages generative diffusion models to overcome these limitations. Our framework is rooted in GCM runs, allowing it to account for climate change and capture its impacts across variables, space and varying global warming levels. Specifically, we leverage the CESM2 Single Model Initial-condition Large Ensemble (SMILE) to sample internal natural variability and generate events more extreme than in the historical record. The methodology employs an emulator based on autoregressive video diffusion to produce synthetic GCM-resolution atmospheric states (see presentation EGU26-19946), enabling us to go beyond the length of the SMILE time series. The emulated fields are processed through a diffusion model trained on reanalysis data downscaling them to ~10km resolution (see presentations EGU26-19822 and EGU26-20546). This modeling chain preserves seasonal dependencies and atmospheric patterns while providing the stable, multi-decadal sequences necessary to generate river flow time series using the process-based Wflow hydrological model (see presentation EGU26-4924).

We prove the validity of this framework over the United Kingdom, where we show it successfully reproduces event frequencies and severity, and generates convincing reconstructions of historical events. We discuss the most extreme floods of the simulations and critically assess their realism. Our modelling chain illustrates that the use of machine learning (diffusion models) enables in-house hydroclimatic modelling from the GCM to catchment scale over periods and domain sizes much larger than previously possible.

How to cite: Addor, N., Hoch, J., Lord, N., Lucas, C., Marshall, A., Moraga, J. S., and Wing, O.: Generating extreme floods using multi-millennial high-resolution simulations: A proof-of-concept over the UK, EGU General Assembly 2026, Vienna, Austria, 3–8 May 2026, EGU26-19994, https://doi.org/10.5194/egusphere-egu26-19994, 2026.

EGU26-20212 | ECS | Posters on site | HS2.4.5

Breaking the Limits: Stress Testing Hydrological Models Beyond Observed Extremes 

Bora Shehu, Philipp Tanzeglock, Patricio Yeste, Paul Voit, Maik Heistermann, and Axel Bronstert

How far can hydrological models be pushed before they break down? This study explores that question by exposing a range of modelling approaches—simple conceptual models such as the Direct Runoff Model, more complex conceptual models like HBV-Light and LARSIM, as well as a data-driven model based on LSTM networks —to both real and hypothetical rainfall extremes. Beyond reproducing extreme rainfall events that caused historical floods (Ahr, Münster, and Elbe), the models are subjected to deliberately exaggerated and synthetic rainfall scenarios that challenge the physical and conceptual limits of model design. These “stress runs” reveal how each model responds when rainfall becomes exceptionally intense, prolonged, or short but extreme — conditions that are increasingly relevant under a changing climate.
As a case study, results for the Ahr catchment at an hourly resolution are presented, including analyses of different initial states and calibration periods. By examining model robustness—the ability to produce physically plausible runoff across a wide spectrum of extreme conditions—and identifying failure modes, the study uncovers hidden sensitivities, structural biases, and nonlinear behaviors that standard validation approaches may overlook. The goal is to rethink how robustness is assessed and to advance hydrological models capable of withstanding the extremes of the future.

How to cite: Shehu, B., Tanzeglock, P., Yeste, P., Voit, P., Heistermann, M., and Bronstert, A.: Breaking the Limits: Stress Testing Hydrological Models Beyond Observed Extremes, EGU General Assembly 2026, Vienna, Austria, 3–8 May 2026, EGU26-20212, https://doi.org/10.5194/egusphere-egu26-20212, 2026.

EGU26-20241 | Posters on site | HS2.4.5

Assessment of droughts and extremes over India using CMIP6 simulations 

Amey Pathak, Shashikanth Kulkarni, Kaustubh Salvi, Hima Saji, Harish Gupta, and Banoth Tejaswi

The Indian Summer Monsoon (June–September, JJAS) plays a critical role in regulating water resources, agriculture, and hydroclimatic extremes across India, yet projecting future changes in monsoon variability remains challenging due to the coarse spatial resolution and biases of earth system models (ESMs). In this study, we develop high-resolution (0.25°) projections of monsoon rainfall over India using a statistical downscaling framework that combines weather typing with transfer functions, and we demonstrate how Standardized Precipitation Index (SPI) projections can be used to diagnose future changes in monsoon characteristics. Downscaled simulations from five GCMs are analyzed for a historical period and for two future socioeconomic pathways (SSP2-4.5 and SSP5-8.5). SPI is computed at monthly scale for June, July, August, and September, as well as for the seasonal JJAS total, enabling assessment of both intra-seasonal and seasonal hydroclimatic variability. Evaluation against observations shows that the historical simulations reproduce observed rainfall statistics with high fidelity, capturing both the mean and standard deviation across most regions of India. Furthermore, the downscaled GCMs successfully represent historical extremes, with more than 70% of grid cells capturing observed extreme drought events and over 80% capturing extreme wet events, providing confidence in the robustness of the derived SPI projections. Our next objective is to test the hypothesis that SPI contains discernible signals of key monsoon characteristics, including onset, withdrawal, and intraseasonal variability. If such signals are evident, SPI can serve as a useful diagnostic tool for inferring these features, which are otherwise difficult to predict directly. This framework further enables a range of analyses, including assessment of future projections and evaluation of shifts in the frequency, duration, and intensity of dry and wet spells during the monsoon season under both moderate and high-emission scenarios, thereby revealing changes in intraseasonal variability that may not be captured by seasonal mean rainfall alone.

How to cite: Pathak, A., Kulkarni, S., Salvi, K., Saji, H., Gupta, H., and Tejaswi, B.: Assessment of droughts and extremes over India using CMIP6 simulations, EGU General Assembly 2026, Vienna, Austria, 3–8 May 2026, EGU26-20241, https://doi.org/10.5194/egusphere-egu26-20241, 2026.

EGU26-20588 | ECS | Posters on site | HS2.4.5

Spatial identification of vulnerable regions for combined flood and drought prevention in Southern Germany  

Sanchari Ghosh, Joshua Holzer, and Markus Disse

The increasing frequency of hydro-meteorological extremes in Germany has resulted in significant economic and environmental losses, totaling at least EUR 145 billion in damages between 2000 and 2021. While these events affect the nation at large, the vulnerability of Germany’s administrative districts varies drastically due to local differences in topography, weather patterns, and land-use characteristics. Adaptation to climate risks requires both risk identification and the strategic placement of Decentralised Water Retention Measures (DWRM) capable of buffering both excess and scarcity. We present a Multi-Criteria Decision Analysis (MCDA) framework that ranks the districts in Southern Germany (Baden-Württemberg and Bavaria) based on their climate vulnerability. The proposed framework synthesizes diverse hydro-meteorological indicators into a single index, allowing for an objective comparison of regional risks. This study utilizes the comprehensive dataset provided by the Climate Service Center Germany (GERICS), consisting of 85 regional climate model simulations, evaluating future hydro-meteorological trajectories under three different Shared Socioeconomic Pathway (SSP) emission scenarios and combines an Entropy Weight Method to objectively determine the importance of each indicator by calculating its information utility based on data variance across the study area. Thereafter, the vulnerability of each district was calculated based on the geometric distance to theoretical ideal solutions using the TOPSIS method. The results of this analysis aim to identify persistent hotspots that consistently rank as highly vulnerable across all climate trajectories and emission scenarios. These identified districts will be spatially mapped and linked to their respective hydrological catchments to facilitate future high-resolution hydrological modelling and site-specific engineering assessments.

Using the screening outputs, three representative case study areas are selected in which the water balance will be modelled in detail. Building on this, the aim is to develop a coupled simulation tool, based on SWAT+, that identifies potential decentralized retention areas and evaluates their effectiveness as a combined measure for drought and flood prevention. Once development is complete, the tool will be made publicly available to enable broad application in water resource management and promote knowledge transfer between research and practice. Future results will be disseminated through policy briefs, scientific publications, and participatory workshops to engaged decision-makers and stakeholders from administration and planning at an early stage in the development of sustainable water strategies.

How to cite: Ghosh, S., Holzer, J., and Disse, M.: Spatial identification of vulnerable regions for combined flood and drought prevention in Southern Germany , EGU General Assembly 2026, Vienna, Austria, 3–8 May 2026, EGU26-20588, https://doi.org/10.5194/egusphere-egu26-20588, 2026.

With cascading impacts on agriculture and the livelihoods of millions of people, drought is one of the most severe natural hazards affecting water and food security in India. While meteorological droughts occur due to an initial precipitation deficit, their propagation to streamflow depletion depends fundamentally on the catchment characteristics and natural and man-made water storage, which are increasingly modified by human interventions. Over the southern Indian Peninsula, where human influence on river systems is significant, the impact of large-scale human interventions on streamflow regimes and drought mechanisms remains poorly understood. In this study, we investigate how meteorological droughts propagate into hydrological droughts across 14 major river basins in southern India under natural conditions (i.e., without human influence on streamflow) and anthropogenic conditions (i.e., with human influence). Utilizing daily meteorological data (precipitation and temperature) from IMD and streamflow data (observed and model-simulated), we estimate various drought characteristics and propagation dynamics under natural and anthropogenic conditions for each streamflow station during the period 1986 to 2006.  Our findings indicate that human interventions to river systems notably delay the onset of droughts and reduce recovery periods, especially during severe events. Moreover, we show a significant difference between how natural and managed hydrological systems respond to meteorological droughts in peninsular river basins. Overall, our results highlight the role of human activities in modulating hydrological drought characteristics and emphasize the importance of considering human activities in evaluating drought risk and monitoring.

How to cite: Gupta, U., Aadhar, S., and Sengar, P.: Influence of intensive human activities on the propagation of meteorological to hydrological drought in the Southern Indian Peninsula , EGU General Assembly 2026, Vienna, Austria, 3–8 May 2026, EGU26-20922, https://doi.org/10.5194/egusphere-egu26-20922, 2026.

Compound hydroclimatic extremes, characterized by the simultaneous or sequential occurrence of multiple essential climate variables (ECVs), have significant implications for both water resources management and human health. Climate change is increasingly linked to a rise in the frequency and intensity of extreme temperature and precipitation events worldwide. As such, understanding the interplay between these variables is critical for improving forecasting and formulating effective adaptation strategies. This study investigates the joint occurrences of temperature and precipitation at 78 stations and of temperature and relative humidity extremes at 31 sites, assessing the spatial and temporal variability of these extreme events in Florida’s tropical and subtropical low-lying regions. Influences of climate variability attributed to the El Niño Southern Oscillation (ENSO) on compound extremes are also evaluated using temporal windows that coincide with its two main phases (i.e., warm and cool).  Preliminary findings indicate an increase in mean joint occurrences across several sites, suggesting an emerging trend that warrants further investigation. Nonparametric statistical tests confirm significant changes across two distinct temporal windows. The analysis reveals non-uniform patterns in compound extremes, influenced by both climate change and regional factors, such as the presence of large water bodies and wetlands. Notably, increases in the Heat Index (HI) highlight the growing risks to human health and the rising energy demand in the region. These findings underscore the need for further research to fully understand the spatial and temporal dynamics of compound extremes amid ongoing climate change.

How to cite: Teegavarapu, R. and Melendez, V.: Spatial and Temporal Changes in Compound Extremes in a Tropical Region: Links to Climate Variability and Change., EGU General Assembly 2026, Vienna, Austria, 3–8 May 2026, EGU26-20941, https://doi.org/10.5194/egusphere-egu26-20941, 2026.

EGU26-22288 | Orals | HS2.4.5

Soil Moisture Anomaly Standardized Index (SMASI): A multi-sensor drought index from soil moisture anomalies 

Nirajan Luintel, Maud Formanek, Emanuel Bueechi, Dávid Kovács, Wolfgang Preimesberger, Colin Moldenhauer, and Wouter Dorigo

Droughts have severe global impacts on the environment and economy. They affect crop yield and biodiversity, disrupt water transport, and cause shortages of drinking water. To mitigate these impacts, national weather and environmental agencies operate drought monitoring tools, which are primarily based on weather station data. However, these stations are not homogeneously distributed. Alternatively, satellite remote sensing allows for monitoring droughts contiguously over large areas. Precipitation, vegetation condition, evapotranspiration, and soil moisture estimates from space-borne sensors enable drought monitoring at a large scale. Among them, the soil moisture-based drought index is relevant for plant water availability as it helps to detect the moisture deficit even before the vegetation responds to droughts. Individual satellite sensors have a limited lifespan, and the data from each sensor is usually available for shorter periods of time. Such data are not sufficient to monitor drought conditions, which are long-term phenomena. However, the data can be merged into a long-term record to monitor the drought conditions. In this study, we developed a drought index, the soil moisture anomaly standardized index (SMASI), by merging the standardized soil moisture anomaly from various microwave satellite sensors. SMASI uses soil moisture from sensors that are used to develop the European Space Agency-Climate Change Initiative (ESA-CCI) soil moisture product. The SMASI dataset enables monitoring drought at a global scale with its record spanning more than 35 years. SMASI shows a good agreement with other well-known drought indices such as the standardized precipitation index (SPI) and the standardized precipitation evapotranspiration index (SPEI).

How to cite: Luintel, N., Formanek, M., Bueechi, E., Kovács, D., Preimesberger, W., Moldenhauer, C., and Dorigo, W.: Soil Moisture Anomaly Standardized Index (SMASI): A multi-sensor drought index from soil moisture anomalies, EGU General Assembly 2026, Vienna, Austria, 3–8 May 2026, EGU26-22288, https://doi.org/10.5194/egusphere-egu26-22288, 2026.

EGU26-1264 | ECS | PICO | HS2.4.6

Storyline impact attribution of climate and exposure drivers of compound flood impact from tropical cyclone Idai in Mozambique 

Doris Vertegaal, Bart van den Hurk, Anaïs Couasnon, Dominik Paprotny, and Sanne Muis

While climate change continues to exacerbate extreme weather events worldwide, their impacts can be further amplified or dampened by socio-economic drivers that influence local exposure and vulnerability. These drivers, such as population growth and economic development, are dynamic and influence the impact of extreme events on global and local scales. For example, population growth in flood-prone areas can heighten exposure, whereas economic development can increase economic losses while improving the capacity to cope with a disaster and thus reduce vulnerability. A novel method to quantify the effect of climate change and socio-economic drivers on the impact of these events is through impact attribution assessments.

This research expands a storyline attribution framework for quantifying the effects on climate change on the hazard and impact of compound flooding to also include the effect of socio-economic drivers. An event-based approach for compound flooding from tropical cyclone (TC) Idai in Mozambique is used to disentangle the effect of historical climate and population change. TC Idai hit Mozambique in 2019 and caused over 600 fatalities, affected over 1.8 million people, resulting in $3 billion in damages. Idai is used as a case study, representing an extremely destructive compound flood event in a underrepresented, data-poor, and highly vulnerable region.

Compound flooding is modelled using a state-of-the-art hydrodynamic modelling chain that combines the Super-Fast INundation for coastS (SFINCS) model with the hydrodynamic model Delft3D Flexible Mesh and hydrological model wflow. The climate drivers of compound flooding from TCs that are known to be affected by climate change, such as precipitation, wind and sea-level rise, are adjusted to create scenarios with the climate trend removed. Present-day and historical population scenarios are used as exposure data to assess the effect of population change based on a novel harmonized global population dataset (Paprotny, 2025). By modelling multiple factual and counterfactual scenarios, in which drivers are adjusted individually and jointly, we disentangle their respective contributions to the affected population and fatalities.

This approach advances event-based impact attribution by incorporating non-climatic drivers into assessments of compound flood impacts from TCs. The framework relies solely on global datasets and open-source software which allows worldwide applications, including highly impacted but data-scarce and often underrepresented regions.

How to cite: Vertegaal, D., van den Hurk, B., Couasnon, A., Paprotny, D., and Muis, S.: Storyline impact attribution of climate and exposure drivers of compound flood impact from tropical cyclone Idai in Mozambique, EGU General Assembly 2026, Vienna, Austria, 3–8 May 2026, EGU26-1264, https://doi.org/10.5194/egusphere-egu26-1264, 2026.

EGU26-5039 | ECS | PICO | HS2.4.6

Future extreme flood generation processes in the Alps 

Paul C. Astagneau, Larisa Tarasova, Raul R. Wood, and Manuela I. Brunner

Extreme floods are intensifying in magnitude and frequency in a warming climate. While the current drivers of flood changes are well understood, large uncertainties remain regarding the most extreme floods and their drivers due to internal climate variability. This makes it difficult to disentangle changes due to interannual variability from changes due to climate change. In mountain regions such as the Alps, increasing sub-daily rainfall extremes, together with declining snowmelt contributions and evolving antecedent soil moisture conditions, are expected to substantially alter the generation processes of extreme floods. However, how these changing flood drivers jointly affect future extreme flood events in mountain regions remains poorly understood.

We therefore investigate how the generation processes of extreme floods will change in the Alps. Specifically, we examine 1) how the drivers of moderate and extreme flood events differ in a warming climate, 2) the extent to which increasing sub-daily rainfall extremes can compensate for declining snowmelt, 3) potential changes in the timing and volume of flood events, and 4) whether projected changes in flood generation processes are significant relative to internal climate variability.

To address these questions, we analyse hourly simulations from a hydrological model driven by climate projections from a single-model initial-condition large ensemble (SMILE) for 384 catchments in Switzerland and Austria. The SMILE consists of 50 ensemble members and enables a robust quantification of internal climate variability. To analyse future changes in flood generation processes, we classify the projected floods based on their drivers, including precipitation, snowmelt, soil moisture and their interplay using a flood classification framework. We further analyse flood characteristics using indicators such as time to peak, volume, peak magnitude and seasonality. Preliminary results indicate that (1) snowmelt extremes continue to play a dominant role in driving the most extreme floods at high elevations, but are less important for moderate floods; (2) floods occur more frequently under dry antecedent moisture conditions than before, while requiring higher rainfall intensities to be generated; and (3) flashiness increases more strongly for extreme floods than for moderate floods.

Improving our understanding of future changes in the generation processes of extreme floods is essential for supporting local authorities, who are deciding on how to adapt to the effects of climate change on hydrological extremes.

How to cite: Astagneau, P. C., Tarasova, L., Wood, R. R., and Brunner, M. I.: Future extreme flood generation processes in the Alps, EGU General Assembly 2026, Vienna, Austria, 3–8 May 2026, EGU26-5039, https://doi.org/10.5194/egusphere-egu26-5039, 2026.

EGU26-5835 | ECS | PICO | HS2.4.6 | Highlight

Controls on the Impact of Large Reservoirs on Flood Peaks and Population Exposure at the National Scale in Italy 

Stefano Cipollini, Irene Pomarico, Elena Volpi, and Aldo Fiori

In recent decades, floods have been the most frequent and impactful disasters worldwide, prompting renewed interest in the role of existing hydraulic infrastructures as adaptation measures. Large reservoirs can locally attenuate flood peaks by temporarily storing excess water, but their effectiveness at broader spatial scales remains poorly quantified. Here, we assess the national scale impact of large reservoirs on flood peak attenuation and population exposure in Italy by accounting for both the spatial variability of their effects and the combined influence of multiple reservoirs. We analyze large reservoirs in Italy using a physically based, spatially distributed index that quantifies flood peak reduction along the entire river network. The method represents the combined effect of multiple reservoirs through an equivalent reservoir concept, accounting for travel times, downstream unregulated contributions, and reservoir flood storage capacity. We compute discharge-weighted and population-weighted indices of flood peak reduction under current conditions and under hypothetical retrofit scenarios with increased flood storage capacity. Results show that, while reservoirs can strongly attenuate flood peaks locally (up to 70-80% immediately downstream), their average impact at the national scale is limited. Furthermore, increasing reservoir flood storage capacity only marginally improves this effect. The limited effectiveness is primarily controlled by the spatial configuration of reservoirs within the Italian river network and the location of population centers relative to regulated reaches. These findings indicate that existing reservoirs alone are insufficient as a systemic flood adaptation strategy in Italy, and that effective risk reduction requires spatially coordinated, catchment scale combinations of measures.

How to cite: Cipollini, S., Pomarico, I., Volpi, E., and Fiori, A.: Controls on the Impact of Large Reservoirs on Flood Peaks and Population Exposure at the National Scale in Italy, EGU General Assembly 2026, Vienna, Austria, 3–8 May 2026, EGU26-5835, https://doi.org/10.5194/egusphere-egu26-5835, 2026.

EGU26-7047 | ECS | PICO | HS2.4.6

Evolution of the HANZE flood impact database and preliminary results for 1870-2025 

Amelia Sicińska, Krzysztof Wróblewski, Kamran Tanwari, Andrzej Giza, Paweł Terefenko, Jakub Śledziowski, Christina Corbane, Samuel Roeslin, and Dominik Paprotny

HANZE (Historical Analysis of Natural Hazards in Europe) is a publicly available database that brings together information on flood events and their impacts in Europe. The initial version of the database was created in 2017, and two updates have been published since then.

The current version of the database (HANZE v3 beta) contains 2,687 records of flash, river, coastal and compound floods (1870–March 2025). This is over 1,100 events more than in its original version, which covered the time range from 1870 to 2016. At the same time, since the release of HANZE v2, the spatial coverage of the data has been expanded from 37 to 42 European countries.

The database contains the location (using the European Union’s Nomenclature of Territorial Units for Statistics – NUTS level 3), time and quantitative data on the impacts of past floods. Each of the implemented updates has also included changes in the NUTS classification, up to the current 2024 edition. Information on events was obtained from a variety of sources, including scientific publications, international and national disaster databases, government reports, and news reports. The qualification of a flood for the database was determined by meeting at least one of the following criteria: (1) an area of at least 10km2 was flooded; (2) at least one person died; (3) at least 200 people or 50 households were affected by the flood; (4) the value of the losses was at least 1 million euro.

The next update, which is currently being prepared, will include data up to the end of 2025. New elements will also be introduced, such as recording flood event type using the 2025 Hazard Information Profiles (HIPs), developed by the United Nations Office for Disaster Risk Reduction and the International Science Council. Annual updates of HANZE are planned, which will be accessible through the European Commission’s Risk Data Hub (https://drmkc.jrc.ec.europa.eu/risk-data-hub) and the HANZE website (https://naturalhazards.eu/). The current work is part of a larger update that will include windstorms and wildfires, which will be used to update the database on attribution of floods to climate and socioeconomic change.

In this contribution we present the recent and future updates in the structure and data collection process in HANZE, as well as discuss the spatial and temporal distribution of floods and their impacts in Europe between 1870 and 2025.

How to cite: Sicińska, A., Wróblewski, K., Tanwari, K., Giza, A., Terefenko, P., Śledziowski, J., Corbane, C., Roeslin, S., and Paprotny, D.: Evolution of the HANZE flood impact database and preliminary results for 1870-2025, EGU General Assembly 2026, Vienna, Austria, 3–8 May 2026, EGU26-7047, https://doi.org/10.5194/egusphere-egu26-7047, 2026.

EGU26-7213 | ECS | PICO | HS2.4.6

Flood Generation Processes in North Africa 

Mariame Rachdane, El Mahdi El Khalki, Larisa Tarasova, and Yves Tramblay

Floods and flash floods are among the most frequent and destructive natural hazards worldwide, and North Africa has experienced numerous severe and deadly flood events over recent decades. The magnitude, frequency, and severity of floods in this region exhibit strong spatial and temporal variability, reflecting the combined influence of basin physiography, hydrological processes, and climatic conditions. Ongoing climate change is expected to alter these controls, further complicating the understanding of flood-generation mechanisms and their evolution over time. This study aims to investigate the dominant processes driving flood generation across North Africa and to examine how climate variability and change may influence flood characteristics, trends, and severity. We analyze long-term streamflow records from 163 basins distributed across Morocco, Algeria, and Tunisia, with basin areas ranging from 23 to 20,000 km² and observation periods spanning from 1950 to 2023. Flood events are examined across a wide range of magnitudes, from frequent runoff events to rarer extreme floods, with the objective of identifying dominant flood-generation processes and potential shifts in their relative importance over time.

How to cite: Rachdane, M., El Khalki, E. M., Tarasova, L., and Tramblay, Y.: Flood Generation Processes in North Africa, EGU General Assembly 2026, Vienna, Austria, 3–8 May 2026, EGU26-7213, https://doi.org/10.5194/egusphere-egu26-7213, 2026.

EGU26-7422 | PICO | HS2.4.6

Climate-sensitive Flood Frequency Analysis Based on Flood Event Characteristics 

Luigi Cafiero, Miriam Bertola, Günter Blöschl, Peter Valent, Francesco Laio, and Alberto Viglione

Understanding how flood frequency changes under non-stationary hydroclimatic conditions remains a key challenge in hydrology. This study presents a Bayesian process-based framework for flood frequency analysis that explicitly accounts for the seasonal dependence of rainfall–runoff processes and their sensitivity to climate change. The approach links an event-based rainfall–runoff model with probabilistic representations of storm, soil moisture, and catchment response, allowing the joint propagation of uncertainty from climate drivers to flood quantiles. The process-based structure of the framework also enables the disentangling of individual flood-generating mechanisms, such as the upward shift of the zero-degree isotherm, long-term changes in soil moisture regimes, and variations in precipitation intensity. The framework is implemented in Austrian hotspots, i.e. groups of similar catchments, using long-term hydrometeorological records and regional climate projections (EURO-CORDEX).

Results show that (i) changes in flood frequency are primarily driven by projected increases in precipitation intensity, while temperature and soil moisture act as modulators or amplifiers of this signal; (ii) the expected reduction in soil moisture tends to mitigate frequent floods but has limited influence on rare events; (iii) anticipated shift of flood peaks toward spring in alpine regions due to the rising 0°C line and enhanced snowmelt contribution. The proposed methodology provides a transferable tool for assessing climate-sensitive flood hazards in non-stationary environments.

How to cite: Cafiero, L., Bertola, M., Blöschl, G., Valent, P., Laio, F., and Viglione, A.: Climate-sensitive Flood Frequency Analysis Based on Flood Event Characteristics, EGU General Assembly 2026, Vienna, Austria, 3–8 May 2026, EGU26-7422, https://doi.org/10.5194/egusphere-egu26-7422, 2026.

EGU26-10566 | ECS | PICO | HS2.4.6

Hourly rainfall-flood relationships and risks of systematic flood underestimation in daily-scale analyses 

Leilei He, Liangsheng Shi, Jiawen Shen, Wenxiang Song, Daniel Klotz, and Jakob Zscheischler

Climate change is expected to intensify heavy rainfall with concomitant increases in flood hazards, yet most large-scale flood assessments remain based on daily data. While sub-daily rainfall variability differs fundamentally from daily statistics, its implications for flood generation and risk remain poorly understood at continental scales, largely due to the scarcity of long-term hourly streamflow observations. Consequently, flood hazards inferred from daily-scale analyses may be systematically underestimated. Here, a causally constrained deep learning model for hourly runoff reconstruction is developed, integrating multi-source hourly meteorological forcings with limited observed hourly streamflow and widely available daily discharge constraints. Using this model, we create a multi-decadal reconstruction of hourly runoff for nearly ten thousand basins across the continental United States. Building on these reconstructions, we provide a first assessment of how rainfall-flood relationships differ between hourly and daily timescales and investigate potential flood underestimation arising from daily-scale analyses. We show that sub-daily flood peaks can be masked when aggregated to daily resolution, and examine the temporal evolution and controlling mechanisms of this underestimation across events and catchments, with particular attention on catchment scale, intraday rainfall variability, storm duration, and aggregation timescales. This work highlights the importance of resolving sub-daily flood processes for flood risk assessment and early warning, and provides a foundation for ongoing extensions toward global hourly runoff reconstruction and large-scale sub-daily flood risk analysis under a changing climate.

How to cite: He, L., Shi, L., Shen, J., Song, W., Klotz, D., and Zscheischler, J.: Hourly rainfall-flood relationships and risks of systematic flood underestimation in daily-scale analyses, EGU General Assembly 2026, Vienna, Austria, 3–8 May 2026, EGU26-10566, https://doi.org/10.5194/egusphere-egu26-10566, 2026.

EGU26-14584 | PICO | HS2.4.6

Event-based Attribution of the April 2022 Durban Flood 

Sophie Biskop, Fabian Schreiter, Sven Kralisch, and Francois Engelbrecht

South Africa experienced its most severe flood disaster in recorded history on 11–12 April 2022, when extreme rainfall triggered catastrophic flooding in the greater Durban area, resulting in 544 fatalities. Durban, like many southern African cities, is characterised by rapid urbanisation, the expansion of informal settlements in flood-prone areas, and limited adaptive capacity, leading to high flood risk during heavy rainfall events. Understanding how these interacting drivers shape flood hazard and risk, and disentangling the role of anthropogenic climate change from other controls, remains a key challenge. While attribution studies are increasingly capable of quantifying the effects of climate change on extreme rainfall, equivalent assessments for river flood magnitudes remain scarce. A direct translation of rainfall intensification into flood severity cannot be assumed, as flood generation is strongly modulated by antecedent catchment conditions, runoff processes and river network characteristics. This study applies a hydro-climatic, event-based attribution framework to investigate the April 2022 Durban flood. An ensemble of atmospheric model reconstructions of rainfall during 11-12 April 2022 is used to drive a hydrological model under counterfactual cooler and factual warmer (present-day) climate conditions. By explicitly representing catchment processes, the framework allows us to assess how climate change altered flood magnitude and timing (rather to focus only on rainfall), and to explore the sensitivity of flood magnitude to pre-event hydrological conditions. We find that peak flow in the Mlazi River was substantially increased by climate-change-amplified rainfall totals, thereby establishing a direct causal link between anthropogenic greenhouse gas forcing and the 2022 Durban flood. The results contribute to understanding the relative roles of atmospheric forcing and catchment controls in shaping extreme flood outcomes. Conducted as part of the WaRisCo project within the Water Security in Africa (WASA) programme, this study provides an urgent message for the need for climate-smart Disaster Risk Reduction as well as for longer-term adaptation in the greater Durban area.

How to cite: Biskop, S., Schreiter, F., Kralisch, S., and Engelbrecht, F.: Event-based Attribution of the April 2022 Durban Flood, EGU General Assembly 2026, Vienna, Austria, 3–8 May 2026, EGU26-14584, https://doi.org/10.5194/egusphere-egu26-14584, 2026.

EGU26-15232 | PICO | HS2.4.6

Changes in flood drivers in British Columbia, Canada 

Tara J. Troy, Priyanka Rai, and Rajesh Shrestha

In British Columbia, floods predominantly occur in the late spring and summer months due to snowmelt. However, larger, damaging floods have recently occurred in the fall and winter months, raising the possibility of flood mechanisms varying seasonally. Fall and winter floods often occur after an atmospheric river event, but the weeks and months leading up to the event may play a role in setting up the flood event. For example, the devastating November 2021 floods occurred after a significant heavy precipitation event, but this event followed an extended anomalously wet period prior to the flooding. This study places that flood and others in their historical context, comparing the space-time dynamics of hydrologic conditions leading up the flood events. To identify the role of extended antecedent conditions, we performed a series of model experiments with precipitation and other meteorological variables held to climatology at different lead times. These experiments isolate the relative contribution of an extended antecedent wet condition and of a single, heavy precipitation event in determining a flood event. Such experiments highlight the climate variables of interest when adapting to a potentially changing flood regime due to climate change.

How to cite: Troy, T. J., Rai, P., and Shrestha, R.: Changes in flood drivers in British Columbia, Canada, EGU General Assembly 2026, Vienna, Austria, 3–8 May 2026, EGU26-15232, https://doi.org/10.5194/egusphere-egu26-15232, 2026.

EGU26-15408 | ECS | PICO | HS2.4.6

Climatic and Geomorphic Controls on the Threshold Behavior of Upper Tail Floods 

Jinghan Zhang, Jiacheng Zhuang, Xianyan Wang, James Smith, and Long Yang

North China experienced some of the world’s most extreme floods, with flood peaks exhibiting pronounced heavy-tailed behavior that rivals global flood envelope curves. Unraveling the physical origins of these outliers is essential for reliable flood risk estimation and hydrologic design. Here, we analyze long-term rainfall and streamflow records (1950–2023) from 297 watersheds across North China to attribute the upper tail of flood peaks to storm structure and watershed behaviors. Although the region’s short-duration rainfall intensities are on the upper end of the rainfall spectrum, we find that the most extreme floods are not primarily driven by these high-intensity events. Instead, they are linked to long-duration events with exceptionally large accumulated totals, indicating that accumulated rainfall, rather than intensity alone, is the dominant meteorological control on catastrophic peak discharge. We further identify a threshold-type runoff response: once storm-total rainfall exceeds specific storage capacities, peak discharge increases disproportionately with additional rainfall, sharply widening the magnitude gap between extreme and ordinary floods. Our analyses suggest that this effective storage is governed largely by deep weathered-rock and aquifer systems rather than shallow soil layers. The susceptibility to this threshold behavior depends on the watershed's spatial organization. Integral geomorphic metrics reveal that watersheds in mountain-plain transition zones are structurally predisposed to rapid routing and nonlinear peak amplification once storage is surpassed. These watersheds are characterized by fan-shaped drainage networks and heterogeneous river longitudinal profiles. These findings highlight a latent catastrophic potential in watersheds where historical storms have rarely crossed these controlling thresholds. As climate change drives more persistent extreme rainfall, threshold exceedance may become more frequent, implying a heightened risk of unprecedented floods beyond historical experience.

How to cite: Zhang, J., Zhuang, J., Wang, X., Smith, J., and Yang, L.: Climatic and Geomorphic Controls on the Threshold Behavior of Upper Tail Floods, EGU General Assembly 2026, Vienna, Austria, 3–8 May 2026, EGU26-15408, https://doi.org/10.5194/egusphere-egu26-15408, 2026.

Hydrological regimes are increasingly altered by the combined influences of climate variability, climate change, and anthropogenic interventions, challenging the traditional assumption of stationarity in flood frequency analysis (FFA). For sustainable water resources planning and flood risk management, it is crucial to consider non-stationary nature of flood behaviour. In this study, we examine the spatiotemporal aspects of flood pattern in the Upper Narmada Basin, utilizing a non-stationary flood frequency framework that incorporates the non- stationarity behaviour due to climate variability, climate change and reservoir influence. We develop single-covariate (SC) and multi-covariate (MC) non-stationary models based on Generalized Additive Models for Location, Scale, and Shape (GAMLSS), incorporating climate indices, reservoir metrics, and time as predictors. This study prioritizes the estimation of non-stationary return periods in scenarios driven by climate variability, applying the Expected Waiting Time (EWT) method. The findings show significant non-stationarity in flood return period caused by both climate variability and reservoir influence. This leads in significant variations from return levels calculated under stationary assumptions. The results underscore the risk of underestimating or overestimating flood risks when depending on conventional stationary FFA in a dynamic climate. Thus, it is vital to refine flood return levels with non-stationarity measures for effective and sustainable hydrological planning in climate-sensitive and regulated river basins.

How to cite: Badika, P. and Agarwal, A.: Estimating Climate-Driven Non-Stationary Flood Return Periods Using the GAMLSS model and EWT approach, EGU General Assembly 2026, Vienna, Austria, 3–8 May 2026, EGU26-16834, https://doi.org/10.5194/egusphere-egu26-16834, 2026.

EGU26-18993 | ECS | PICO | HS2.4.6

The evolution of flood risk in Italy across two centuries: disentangling risk drivers to understand past trends and future issues 

Luciano Pavesi, Jose Luis Salinas, Stefano Zanardo, Maxi Sassi, Arno Hilbert, Elena Volpi, and Aldo Fiori

Floods are among the most severe natural hazards globally, with around 1.81-2.3 billion people currently exposed to 1-in-100-year events. Understanding the evolution of flood risk is important for targeting investments and policies to address the drivers that dominate in each period, ensuring effective risk reduction. This requires disentangling the relative contribution  multiple drivers to understand their behavior and adapt strategies as their relative importance changes. This study focuses on two key factors: population dynamics and climate change.

We conduct a national-scale assessment spanning 230 years (1870-2100) using the probabilistic large-scale flood risk model RESCUE-FR to quantify how these drivers have shaped historical trends and will influence future flood exposure in Italy. Our analysis reveals a transition of dominant flood risk drivers. From 1870 to 2000, demographic changes dominated: population growth and migration into flood-prone areas drove an increase in exposure, while climate conditions remained relatively stable. Instead, the future presents a starkly different picture: climate change will be the dominant driver; specifically starting from the second part of this century (year 2060), climate change alone accounts for 57.5% of the projected increase in exposed population, while demographic growth contributes only 12.7%, despite Italy's total population being projected to decline after 2030.

Our findings demonstrate that flood risk management in Italy should adapt to this evolving landscape: from managing exposure in known flood zones,  and preventing development in areas that will become vulnerable under future climate scenarios.

How to cite: Pavesi, L., Salinas, J. L., Zanardo, S., Sassi, M., Hilbert, A., Volpi, E., and Fiori, A.: The evolution of flood risk in Italy across two centuries: disentangling risk drivers to understand past trends and future issues, EGU General Assembly 2026, Vienna, Austria, 3–8 May 2026, EGU26-18993, https://doi.org/10.5194/egusphere-egu26-18993, 2026.

EGU26-19075 | ECS | PICO | HS2.4.6

Informed-Parameter versus Hydrologic Model-Chain Approaches for Flood Quantile Estimation 

Abinesh Ganapathy, Ankit Agarwal, and Nithila Devi Nallasamy

Two approaches, namely the informed-parameter approach and the hydrologic model-chain approach, are widely used to estimate future flood quantiles while accounting for nonstationarity. In the informed-parameter approach, changes in flood quantiles are estimated by conditioning distribution parameters on physical covariates, including meteorological forcings, anthropogenic drivers, and large-scale climate modes. On the other hand, for the model chain approach, meteorological forcings are fed into the hydrological model to simulate flood peaks, which are subsequently used to estimate flood quantiles.

Both approaches have distinct advantages and limitations, such as the multiple linkages involved in the model-chain approach and the relatively simplified process representation in the informed-parameter approach. These characteristics strongly influence the uncertainty associated with flood quantile estimates. However, direct comparisons between these two widely used approaches remain limited. This study presents a preliminary comparative assessment of the informed-parameter and hydrologic model-chain approaches, focusing on how uncertainty propagates into future flood quantile estimates. Overall, the findings of this study aim to support stakeholders in understanding the challenges associated with each approach and in selecting the most suitable method for a given region.

How to cite: Ganapathy, A., Agarwal, A., and Nallasamy, N. D.: Informed-Parameter versus Hydrologic Model-Chain Approaches for Flood Quantile Estimation, EGU General Assembly 2026, Vienna, Austria, 3–8 May 2026, EGU26-19075, https://doi.org/10.5194/egusphere-egu26-19075, 2026.

Hydrological memory refers to previous wetness or dryness, which fundamentally alters the ecosystem's response to a disturbance. It describes how antecedent catchment wetness persists over time and amplifies subsequent flood response. This temporal compounding mechanism poses significant challenges for flood forecasting and reservoir operations in Himalayan basins where climate change is intensifying precipitation variability. The August 2023 Punjab floods, which impacted over 12,000 settlements and resulted in 65 fatalities, demonstrate the influence of hydrological memory in dam-regulated systems. This study employs a hydromet-to-hydraulics framework that begins with atmospheric analysis and goes all the way down to HEC-RAS hydrodynamic modelling and demographic impact assessment. This approach integrates hydrodynamic modelling with forecast aware dam operations to quantify flood exposure patterns.

A detailed spatiotemporal analysis shows that heavy rain in July raised the soil moisture levels in the Beas Basin significantly. The hydrological memory increased the likelihood of August floods, despite the rainfall received being less than the seasonal average. The study employed HEC-RAS hydrodynamic modelling integrated with 2011 census data to evaluate the effectiveness of dam operations. The results showed that controlled dam operations reduced the downstream population exposure by 80%. We proposed a Genetic Algorithm-based optimisation framework with piecewise penalty functions based on SWAT-generated inflow forecasts from GFS precipitation data. It showed that forecast-informed dam operations can more effectively balance flood mitigation with water conservation objectives than manual management. This integrated framework underscores the essential requirement for reservoir management systems that incorporate catchment memory states through continuous soil moisture monitoring and precipitation forecasting.

How to cite: Pathania, A. and Gupta, V.: Hydrological Memory in the Himalayan Compound Floods: A Hydromet-to-Hydraulics Framework for Adaptive Flood Risk Management, EGU General Assembly 2026, Vienna, Austria, 3–8 May 2026, EGU26-19550, https://doi.org/10.5194/egusphere-egu26-19550, 2026.

EGU26-20573 | ECS | PICO | HS2.4.6

Modelling Framework for Composite Vulnerability Index incorporating Game Theory  

Geethika Moorthy and Ankit Agarwal

Vulnerability assessment is one of the key steps in any disaster risk reduction strategy to minimize the impacts of a disaster. The increasing population, urbanization, and climate change necessitate the need for identifying population at greater risk. This study develops a composite flood vulnerability index (FVI) that incorporates game theory for strategic policy making decisions. This framework has been applied to the selected regions in Kerala affected by the 2018 flood. The influences of methodological choices using various sensitive analyses have been incorporated in developing the index. The inductive and deductive approaches such as Principal Component Analysis and Analytical Hierarchy Process are respectively used for the selection and weighting of indicators. Based on preliminary literature studies, around 30 indicators are selected to represent exposure, sensitivity, and adaptive capacity. The theoretical game theory model explores decision impacts by flood policy makers, and incentive structures are assessed based on logical scenarios and literature assumptions. The proposed framework addresses the methodological gaps in traditional flood vulnerability approaches and thus providing actionable insights to the decision makers for policy recommendations and flood preparedness. 

How to cite: Moorthy, G. and Agarwal, A.: Modelling Framework for Composite Vulnerability Index incorporating Game Theory , EGU General Assembly 2026, Vienna, Austria, 3–8 May 2026, EGU26-20573, https://doi.org/10.5194/egusphere-egu26-20573, 2026.

EGU26-20857 | PICO | HS2.4.6

The Mahnitaš Torrent in Croatia as a Historical Link Between Austro-Hungarian Torrent Control and Japanese SABO Engineering 

Dijana Oskoruš, Ivo Andrić, Jelena Loborec, and Hrvoje Meaški

This study explores the Mahnitaš torrential watercourse near Siverić, Croatia, as a unique case illustrating the convergence of Austro-Hungarian torrent regulation practices and early Japanese SABO engineering.

Mahnitaš, an ephemeral tributary of the Čikola River, drains a steep and relatively small catchment in eastern Šibenik-Knin County and exhibits pronounced torrential behavior, characterized by rapid runoff response and short-duration, high-magnitude flow events during intense rainfall. Intensive industrialization at the beginning of the 20th century substantially increased anthropogenic pressure on the natural environment. Mining activities, widespread deforestation, excavation, and the construction of transport infrastructure significantly modified surface runoff conditions, disrupted natural drainage networks, and increased sediment availability. These changes intensified erosion processes, sediment transport, and peak discharges within the catchment. Consequently, the Mahnitaš torrent evolved into a significant hydrological hazard, posing increasing risks to mining facilities, transport corridors, and nearby settlements, thereby necessitating systematic torrent regulation measures to mitigate flood hazards and sediment-related impacts.

This paper outlines the hydromorphological characteristics of the catchment, reviews historical torrent control measures, and examines the role of check dams in erosion control and sediment management. Special emphasis is placed on the Austro–Japanese exchange of technical knowledge at the beginning of the 20th century, particularly the work of Kitao Moroto, whose documentation of the Mahnitaš torrent provides rare visual and technical evidence of early torrent control practices. The study highlights Mahnitaš as an important historical and technical link in the development of modern sediment disaster prevention and SABO engineering.

How to cite: Oskoruš, D., Andrić, I., Loborec, J., and Meaški, H.: The Mahnitaš Torrent in Croatia as a Historical Link Between Austro-Hungarian Torrent Control and Japanese SABO Engineering, EGU General Assembly 2026, Vienna, Austria, 3–8 May 2026, EGU26-20857, https://doi.org/10.5194/egusphere-egu26-20857, 2026.

Compound Drought and Heat Events (CDHEs) pose a growing threat to agricultural systems under a warming climate. This study evaluates mid-century shifts in CDHE characteristics and cropland exposure across Australia using high-resolution CCAM-ACS simulations for Shared Socioeconomic Pathway 1–2.6 (SSP1-2.6) and Shared Socioeconomic Pathway 3–7.0 (SSP3-7.0). An ensemble of seven bias-corrected regional climate models was used to compute the Standardized Precipitation Index (SPI) and Standardized Temperature Index (STI), from which CDHE characteristics were derived. Analyses were performed for the historical (1985–2014) and future (2030–2059) periods, and cropland exposure was quantified through the integration of gridded cropland fractions with CDHE occurrence across the eight Natural Resource Management (NRM) clusters. The findings reveal a nationwide intensification of compound drought–heat stress. CDHE frequency increases by approximately 15–30% under SSP1-2.6, with a sharper 20–60% escalation under SSP3-7.0. The strongest rises occur across the Murray-Basin, Central-Slopes, and East-Coast clusters. Event intensity strengthens by 10–25% in the low-emission future and by 30–50% in the high-emission scenario. Event duration also lengthens across most of Australia, indicating a 5–15% increase, while northern and eastern hotspots experience up to 20–25% longer events. The estimates show systematic rightward shifts across all CDHE metrics, reflecting higher probabilities of more frequent and energetically stronger events. When combined with projected cropland patterns, exposure increases markedly. Historical exposure (≈100–300 km² yr⁻¹) rises to 200–350 km² yr⁻¹ under SSP1-2.6 and up to 250–500 km² yr⁻¹ under SSP3-7.0, with the largest increases across southeastern and southwestern cropping belts. Several NRM clusters begin transitioning toward persistently high-exposure states by mid-century. The attribution analysis shows that most of the mid-century increase in cropland exposure is driven primarily by the climate-change component—far exceeding the contribution of cropland shifts—under both SSP1-2.6 and SSP3-7.0. Overall, the findings highlight a substantial escalation in compound drought–heat risk for Australian agriculture and underline the need for climate-resilient cropping systems and regional adaptation strategies.

How to cite: Rezaiebalf, M. and H.C. Chua, L.: Exploring the Future Cropland Exposure to Compound Drought and Heat Events from High-Resolution CCAM-ACS Simulations over Australia, EGU General Assembly 2026, Vienna, Austria, 3–8 May 2026, EGU26-179, https://doi.org/10.5194/egusphere-egu26-179, 2026.

Streamflow droughts, i.e., below-average river discharge for an extended period, pose significant challenges to the regional water-food-energy nexus. While several assessments have so far analyzed space-time trends in streamflow droughts, mostly driven by the delayed arrival of the monsoon or large-scale climate variability, the spatiotemporal trends in compound streamflow drought characteristics, considering sequential and concurrent multiple anomalous weather and climatic stressors, have not been assessed at the continental scale. We analyze streamflow records from over 250 sites worldwide at a centennial scale (1901–2023) and demonstrate that, globally, the overall frequency of streamflow droughts has increased significantly over time, with a rate of rise for uncompounded streamflow droughts is approximately 5 events/year over the analysis period. While the compound streamflow drought frequency has shown a relatively weaker significant increase in frequency (~0.5 events/year) than the uncompounded streamflow droughts, spatially a significant spatial clustering of compound drought is observed across the arid (44%), followed by sub-humid (23%) climate regimes. Meanwhile, approximately over half (~56%) of catchments show at least a two-fold increase in streamflow drought deficit volume (severity) when drought onset is compounded by hot and dry compounding events, described by lower-than-normal precipitation deficit followed by higher-than-normal potential evapotranspiration within ±2 months of drought initiation, compared to uncompounded streamflow droughts. A higher likelihood of compound droughts is observed during the boreal summer season, spanning from June to August across the Northern Hemisphere, while an intense drought likelihood is apparent during the austral summer season, varying from December to February in the Southern Hemisphere. The results of this study underscore the importance of considering multi-hazard investigation of hydrological droughts for improving drought preparedness within the short- to long-term planning horizons.

How to cite: Raut, A. and Ganguli, P.: Observed Streamflow Record Shows Streamflow Drought Onset during Hot–Dry Compounding Increases the Likelihood of Intense Droughts, EGU General Assembly 2026, Vienna, Austria, 3–8 May 2026, EGU26-207, https://doi.org/10.5194/egusphere-egu26-207, 2026.

EGU26-751 | ECS | Orals | HS2.4.7

A Bayesian Copula Based Integrated Drought Index for Compound Drought Monitoring in India 

Usman Mohseni and Vinnarasi Rajendran

Drought is a complex and persistent hazard affecting agriculture, ecosystems, economic stability, and public health. Traditional univariate drought indices often overlook the interconnected behavior of drought components, limiting their capacity to support holistic drought assessment and early warning. To address this gap, we develop a Bayesian Copula-Based Integrated Drought Index (IDI) that jointly represents meteorological, hydrological, and agricultural drought conditions across India. The framework integrates a modified Standardized Precipitation Index (SPI), Standardized Runoff Index (SRI), and Standardized Soil Moisture Index (SSMI) at multiple monthly timescales using gridded data at 0.25° resolution from 1951 to 2024. An Archimedean copula family is used to characterize the dependence structure among drought drivers. Marginal distributions are selected based on a rigorous comparison of candidate probability models; Gamma for precipitation and GEV for both streamflow and soil moisture, as validated through the Kolmogorov–Smirnov test and Akaike Information Criteria. Model parameters are estimated through Bayesian inference via the Differential Evolution Markov Chain (DE-MC) algorithm, which combines differential evolution with Markov Chain Monte Carlo sampling to ensure robust, efficient convergence and uncertainty quantification. Comparative analysis demonstrates that the IDI outperforms individual indices in representing the spatial extent, persistence, and severity of drought events. By accounting for multi-source drought information within a probabilistic and dependency aware framework, the proposed IDI advances compound drought monitoring capabilities and supports more informed climate adaptation and water management strategies. This approach significantly enhances understanding of drought dynamics and provides policymakers and stakeholders with a stronger decision-support tool amid increasing climate variability.

How to cite: Mohseni, U. and Rajendran, V.: A Bayesian Copula Based Integrated Drought Index for Compound Drought Monitoring in India, EGU General Assembly 2026, Vienna, Austria, 3–8 May 2026, EGU26-751, https://doi.org/10.5194/egusphere-egu26-751, 2026.

Stochastic simulations have been widely applied in water-related risk management, particularly for estimating annual Net Basin Supplies (NBS) in the Lake Champlain–Richelieu River (LCRR) basin. Following the unprecedented flood event in 2011, simulated NBS datasets were required to re-evaluate existing flood-protection infrastructure and to support the development of future mitigation strategies within the basin. Because water-resources operation and flood-management planning are typically conducted at monthly or quarter-monthly resolutions, the simulated annual NBS data must be disaggregated to finer temporal scales. In this study, several existing disaggregation approaches were applied to the simulated annual NBS series, with the objective of reproducing the key statistical characteristics associated with the 2011 flood event in the LCRR basin. The 2011 flood was characterized by its persistence over multiple months, indicating that an appropriate disaggregation framework must be able to maintain both interannual dependence and month-to-month temporal relationships in the resulting monthly series. The analysis shows that currently available parametric and nonparametric disaggregation models exhibit clear limitations, particularly in their ability to preserve sufficient temporal dependence. To address these deficiencies, this study proposes a new random block-based nonparametric disaggregation (RB-NPD) model. In addition, the proposed framework is further enhanced by incorporating a Genetic Algorithm–based mixture scheme to improve the representation of lagged correlations. The results demonstrate that the RB-NPD model provides a viable alternative to existing methods, and that its enhanced version is well suited for disaggregating annual NBS data in the LCRR basin.

How to cite: Lee, T., Kong, Y., and Yoon, Y.: A Random Block-Based Nonparametric Approach for Temporal Disaggregation of Net Basin Supplies in the Lake Champlain–Richelieu River Basin, EGU General Assembly 2026, Vienna, Austria, 3–8 May 2026, EGU26-1978, https://doi.org/10.5194/egusphere-egu26-1978, 2026.

EGU26-3030 | ECS | Orals | HS2.4.7

The Growing Role of Evaporative Demand in Driving Extreme Droughts in the Amazon Basin 

Yizhou Zhuang and Xusheng Tang

The Amazon basin is increasingly threatened by severe droughts, traditionally attributed to precipitation deficits. However, the amplifying role of rising evaporative demand, represented by potential evapotranspiration (PET), is not well quantified. Using a counterfactual decomposition framework based on Standardized Precipitation-Evapotranspiration Index (SPEI) from 1979 to 2024, this study quantifies the contributions of precipitation and PET to drought severity and coverage to better understand the evolving drought mechanisms in the region.

Our analysis of the record-breaking 2024 drought reveals that while precipitation deficit was the primary contributor, surging evaporative demand acted as a strong amplifier, nearly doubling the event's severity compared to a precipitation-only scenario. Consequently, 76% of the basin experienced exceptional drought conditions (or D4 drought, SPEI below 2nd percentile) during the peak of the 2024 event. We identify a fundamental regime shift in the 21st century where the contribution of PET to drought area has systematically increased. The basin is transitioning from a precipitation-dominated regime to a "hot drought" paradigm, where compound events, characterized by moderate rainfall deficits exacerbated by high atmospheric thirst, now drive the majority of exceptional drought coverage. Deconstructing the drivers of this rising evaporative demand shows that it can be attributed almost equally to both regional warming and increased surface shortwave radiation from reduced cloud cover. Overall, this study indicates that global warming and regional radiative feedbacks are making the Amazon basin more susceptible to rapid drying even without extreme rainfall deficits.

How to cite: Zhuang, Y. and Tang, X.: The Growing Role of Evaporative Demand in Driving Extreme Droughts in the Amazon Basin, EGU General Assembly 2026, Vienna, Austria, 3–8 May 2026, EGU26-3030, https://doi.org/10.5194/egusphere-egu26-3030, 2026.

As climate change intensifies hydrological extremes, loss and damage (L&D) increasingly reflects not only the severity of hazards but also patterns of exposure, vulnerability, and the limits of adaptation. While recent research on hydrological extremes has advanced modelling of hazards and compound events, less attention has been paid to empirically linking risk profiles with observed loss and damage and lived adaptation responses. This study addresses this gap by applying a risk-based assessment framework to examine how flood risks translate into economic and non-economic loss and damage across districts in Assam, one of India’s most flood-prone states.

Building on the IPCC risk framework, flood risk is assessed as the interaction of hazard, exposure, and vulnerability using district-level indicators. Observed loss and damage is quantified using official disaster records from 2015–2023, disaggregated across housing, agriculture, livelihoods, infrastructure, and loss of life. The analysis empirically demonstrates that 24% of Assam’s districts fall within high flood-risk zones, experiencing substantial losses including infrastructure damage, loss of lives and livelihoods, and recurrent displacement. In these districts, repeated flooding forces households to abandon permanent homes and reside in temporary chang ghar (kutcha houses), often without secure livelihood options.

A further 61% of districts fall under moderate flood risk, where exposure and vulnerability - rather than hazard intensity - are the dominant drivers of loss and damage. These districts experience significant socio-economic impacts, including loss of life, livelihood disruption, and distress migration, with male household members frequently migrating to nearby districts or other regions as a coping response. The remaining 15% of districts are categorised as low flood risk, yet still experience livelihood-related loss and damage driven primarily by high vulnerability, indicating clear scope for targeted policy interventions to reduce residual risk.

To move beyond aggregated loss metrics, qualitative fieldwork in selected districts explores non-economic loss and damage, including health impacts, psychological distress, livelihood insecurity, cultural loss, and erosion of place attachment. The study further examines locally practised coping, incremental, and transformative adaptation strategies, revealing persistent mismatches between technocratic adaptation interventions and lived realities. Many losses persist despite adaptation efforts, underscoring adaptation limits and positioning loss and damage as a governance challenge rather than a purely technical one.

By empirically linking risk profiles, observed loss and damage, and adaptation practices, this study demonstrates how vulnerability-centred risk assessment can bridge adaptation planning and loss and damage policy, informing more equitable and context-sensitive climate responses in flood-prone regions.

How to cite: Barua, A. and Vyas, S.:  Linking Flood Risk Assessment, Adaptation Limits, and Loss and Damage: Evidence from a Risk-Based Framework in Assam, India , EGU General Assembly 2026, Vienna, Austria, 3–8 May 2026, EGU26-3593, https://doi.org/10.5194/egusphere-egu26-3593, 2026.

EGU26-3875 | ECS | Posters on site | HS2.4.7

Spatio - Temporal Variability of Meteorological Droughts in Central Europe Considering Circulations Type 

Agnieszka Wałęga, Marta Cebulska, Andrzej Wałęga, Agnieszka Ziernicka-Wojtaszek, Wojciech Młocek, and Tommaso Caloiero

In the Polish Carpathians, periods of precipitation deficit have been observed, accompanied by an increasing frequency of dry months, particularly during the cold half of the year. Despite this, research addressing the spatial and temporal variability of meteorological droughts and the main mechanisms governing their occurrence in Central Europe remains limited.

The objective of this study is to analyze the spatial and temporal variability of droughts, expressed using the Standardized Precipitation Index (SPI), in the heterogeneous area of the Polish Carpathians and highland Region in East-Central part of Europe based on long term precipitation data. Additionally, for the first time, drought characteristics assessed using the SPI were discussed in relation to synoptic situation types (circulation types).

The study region is the Upper Vistula Basin located in the southern and south-eastern part of Poland. The area of this region is approximately 51,000 km2, i.e. a quarter of the entire Vistula basin. In this work monthly precipitation form 56 rainfall station were analysed from 1961 to 2022 years. Meteorological droughts were identified using Standardized Precipitation Index (SPI) calculated over 3-, 6-, 9-, and 12-month accumulation periods. For the 3-month SPI, the main climatic mechanisms responsible for extreme drought events were identified based on a circulation type calendar. Trends in extreme drought occurrence were detected using the Mann-Kendall test.

Statistically significant trends of SPI were observed on 52.7% of all analyzed stations, and in most cases, a positive trend was observed, indicating an increase in water resources in the Upper Vistula Basin. Such significant trends occurred more frequently at stations located in the western part of the analyzed region. Long-term droughts, represented by the 12-month SPI, were recorded at all stations, although not in all years. Short-term droughts, defined using the 3-month SPI, occurred most frequently during winter, while droughts based on the 6- and 9-month SPI were most common in winter and spring, and those represented by the 12-month SPI primarily occurred in winter and autumn.

The most intensive drought episode occurred in 1984, when drought conditions based on the 6-month SPI affected 98% of the analyzed region, and those based on the 9- and 12-month SPI covered approximately 90% of the entire region. Drought occurrence followed a clear seasonal pattern, with a dominant 10-year periodicity observed for all analyzed SPI timescales. In addition, Fourier analysis revealed a 2-year periodicity for the 3-, 6-, and 9-month SPI, and a 31-year periodicity for the 12-month SPI.

The results provide insights into the typical climatic conditions in Poland, characterized by strong precipitation seasonality. The study highlighted that short-term extreme droughts, represented by the 3-month SPI, are often caused by anticyclonic situations with high-pressure wedges Ka (anticyclonic wedge or ridge of high pressure) and Wa (west anticyclonic situation), as observed in 52.3% of cases. Overall, the findings provide valuable insight into the spatial and temporal variability of both short- and long-term extreme droughts in Central Europe, with particular relevance for the agricultural sector, which dominates the northern part of the analyzed region, where drought frequency is highest.

How to cite: Wałęga, A., Cebulska, M., Wałęga, A., Ziernicka-Wojtaszek, A., Młocek, W., and Caloiero, T.: Spatio - Temporal Variability of Meteorological Droughts in Central Europe Considering Circulations Type, EGU General Assembly 2026, Vienna, Austria, 3–8 May 2026, EGU26-3875, https://doi.org/10.5194/egusphere-egu26-3875, 2026.

EGU26-4104 | ECS | Posters on site | HS2.4.7

Three-Dimensional Assessment of Drought in Global River Basins 

Xin Feng and Xushu Wu

Understanding the spatiotemporal variability of drought is critical for assessing its impacts on water resources and terrestrial ecosystems. Despite extensive drought research, basin-scale drought characteristics and their long-term changes have rarely been explored globally within a three-dimensional identification framework, particularly from a multi-index perspective. In this study, drought events across 59 major global river basins during 1979–2020 were identified using the standardized precipitation evapotranspiration index (SPEI) combined with a three-dimensional clustering approach. To assess the robustness of drought characterization, results derived from SPEI were further compared with those based on the standardized precipitation index (SPI). Overall, most river basins did not exhibit statistically significant long-term trends in drought occurrence. Spatially, drought events detected by both indices were largely concentrated along river corridors, highlighting the close coupling between drought evolution and basin hydrological structure. Basin size strongly modulates drought behavior: larger basins tend to experience longer-lasting and more severe droughts, whereas smaller basins are characterized by more frequent but weaker events. Temporal analysis revealed pronounced periodicity in drought variability, especially in small- and medium-sized basins, while drought-affected area and severity consistently increased with event duration. Comparative analysis between SPEI and SPI revealed broadly consistent spatial patterns but notable regional differences in drought frequency and severity. In low- and mid-latitude regions, including South America, Central Africa, and parts of Asia, SPEI identified more extensive and persistent drought events than SPI, suggesting a stronger sensitivity of drought characteristics to temperature-related effects. In contrast, high-latitude and temperate basins generally showed similar drought responses across the two indices. Relationships among drought area, severity, intensity, and duration exhibited comparable behaviors for both indices, with drought area and severity tending to increase over time, while drought intensity showed a gradual decline in most basins. Furthermore, atmospheric circulation was found to exert a stronger influence on drought variability in coastal basins than in inland regions. These findings provide new insights into basin-scale drought dynamics and their controlling mechanisms under a three-dimensional perspective.

How to cite: Feng, X. and Wu, X.: Three-Dimensional Assessment of Drought in Global River Basins, EGU General Assembly 2026, Vienna, Austria, 3–8 May 2026, EGU26-4104, https://doi.org/10.5194/egusphere-egu26-4104, 2026.

EGU26-5159 | Posters on site | HS2.4.7

Meteorological drought variability in Poland by means of the ERA5-Land dataset 

Antonio Romio, Roberto Gaudio, Andrzej Walega, Agnieszka Walega, Alessandra De Marco, Francesco Chiaravalloti, and Tommaso Caloiero

In this work, meteorological drought in Poland has been characterized considering the Standardized Precipitation Index (SPI) evaluated at different timescales (3, 6, 12 and 24 months) from the ERA5-Land monthly dataset provided by ECMWF under the framework of Copernicus Climate Change Service Programme. With this aim, trend detection employed Sen’s slope estimator and Mann-Kendall test, and drought characteristics (e.g., quantity, duration, severity, and intensity) were derived using the run theory applied to the SPI values calculated in 4,084 grid points. As a result of the trend analysis, the short-term SPI (3-month) exhibits pronounced spatial and temporal variability, with trends that are generally weak and less spatially coherent. As the aggregation scale increases to 6 months, trend patterns become more structured, reflecting seasonal to interannual precipitation variability. The long-term SPI scales (12- and 24-month) show more consistent and spatially persistent trends, indicating clearer long-term wetting tendencies across the country.

As regards the drought characteristics, considering the average values, the number of drought events decreases markedly as the SPI time scale increases, with the highest number of events observed for the 3-month SPI and the lowest for the 24-month SPI. In contrast, the average drought duration increases with increasing SPI time scale. Droughts identified using longer accumulation periods persist for longer durations, with the 24-month SPI showing the highest median and variability in duration. A similar increasing trend is observed for the average drought severity, where longer SPI scales are associated with more severe drought events, reflecting the cumulative nature of long-term precipitation deficits. The average drought intensity shows a slightly decreasing trend as the SPI time scale increases. Although intensity remains relatively stable across time scales, droughts identified at shorter SPI periods tend to be marginally more intense than those detected at longer accumulation periods. 

With respect to the drought characteristics, considering the extreme values, drought frequency remains relatively stable across the SPI time scales, with only minor variations in median values. In contrast, maximum drought duration exhibits a clear increasing trend with increasing SPI time scales. The short-term SPI identifies extreme droughts with relatively limited durations, whereas the 24-month SPI substantially captures longer extreme drought events, with both higher median values and greater variability, reflecting the ability of longer SPI time scales to represent prolonged drought persistence. A similar pattern is observed for maximum drought severity, which increases markedly with SPI accumulation period. Extreme droughts identified at longer time scales accumulate larger precipitation deficits, resulting in significantly higher severity values, particularly for the 24-month SPI, also showing the widest range of variability. Conversely, maximum drought intensity shows a decreasing trend as the SPI time scale increases. Higher intensity values are associated with shorter SPI periods, while longer accumulation periods tend to smooth short-term variability, leading to less intense but more persistent extreme drought events. Finally, the spatial distribution of the drought characteristics in Poland allows us to identify the areas that could also face water stress conditions in the future, thus requiring drought monitoring and adequate adaptation strategies.

How to cite: Romio, A., Gaudio, R., Walega, A., Walega, A., De Marco, A., Chiaravalloti, F., and Caloiero, T.: Meteorological drought variability in Poland by means of the ERA5-Land dataset, EGU General Assembly 2026, Vienna, Austria, 3–8 May 2026, EGU26-5159, https://doi.org/10.5194/egusphere-egu26-5159, 2026.

Foreland and lowland regions in Europe are highly dependent on water stemming from the alpine water tower. Due to an increasing number of droughts, expected to exacerbate under progressing climate change, these regions experience severe economic and environmental impact. This affects e.g. hydropower production, ecosystem health, agriculture and drinking water supply. To take foreward-looking adaptation measures, there is the need to understand future climatic drought patterns and their impact on streamflow.

In order to evaluate and analyze past and future alpine droughts, a regional single-model initial-condition large ensemble (SMILE) with 50 members from 1991 - 2100, bias-corrected via MBCn and statistically downscaled, is used. This ensemble approach ensures the quantification of natural climate system variability, while improving the robustness of the results in future climate projections. To enhance interpretability and comparability, a global warming level approach is used. For each warming level (1.5°, 2°, 3° and 4°C), combined drought-heat events in summer (June to August) and snow-drought events in winter (December to February) are identified. To assess the impact of these drought events on discharge, a hydrological large ensemble for selected alpine catchments for the period 1991 – 2100 is created with the Water Balance Simulation Model (WaSiM), using the processed data of the SMILE as forcing.

The results of this study indicate, how future climate will change the water balance in selected alpine catchments based on the return frequency of severe drought events in summer and winter and their impact on runoff. Particularly, this study examines the cascading effects of winter snow-droughts on subsequent summer water availability, revealing how reduced snowpack accumulation under warmer conditions intensifies summer compound drought-heat events. By analyzing different global warming levels, the results provide scenario-independent insights, that are relevant for any emission pathways reaching these specific warming levels. This approach allows for direct comparison with policy goals, such as those specified in the Paris Agreement, and provide stakeholders with a concrete framework for assessing climate risks, regardless of the considered time frame.

How to cite: Pentenrieder, M. and Ludwig, R.: Alpine droughts under climate change: Assessing the relationship and impacts of combined summer drought-heat and winter drought events using a hydrometeorological model ensemble, EGU General Assembly 2026, Vienna, Austria, 3–8 May 2026, EGU26-5333, https://doi.org/10.5194/egusphere-egu26-5333, 2026.

Abstract

Recent decades have witnessed intensifying drought across the Arabian Peninsula, yet scientists poorly understand whether precipitation deficits or increased potential evapotranspiration (PET) drive this intensification. This study employs the Standardized Precipitation Evapotranspiration Index (SPEI) and Standardized Precipitation Evaporation Differential Index (SPEDI) at 3, 6 and 12-month timescales to assess drought across the Arabian Peninsula from 1975 to 2024 using ERA5 Land reanalysis data validated against observed meteorological stations. We isolated each variable’s contribution through diagnostic scenarios, holding either PET or precipitation at climatological means while varying the other. Validation results demonstrated exceptional ERA5 Land performance for temperature variables (mean R = 0.99, NSE > 0.89) and adequate performance for precipitation (mean R = 0.72, NSE = 0.48). Temporal analysis revealed intensifying multi-year droughts with drought-affected areas increasing by 20 to 133 percent between the first (1975–1999) and second (2000–2024) periods of the study across all zones. The Frequency Innovative Trend Analysis (F-ITA) confirms a systematic decline in wet anomalies and increases in drought frequency with the southwestern zone experiencing the most pronounced shift, where mild drought rose from 14.6 percent to 37.6 percent for SPEI 12. The SPEI scenarios revealed that PET contributes 68 to 77% of drought trend variability across climatic zones, while the contribution of precipitation is only 23 to 32%. In SPEI scenarios, when PET is held constant (PETclm), significant drying trends largely disappear; conversely, drought intensification exceeds observed trends when precipitation is held constant (Prclm), confirming thermodynamic forcing as the primary driver. The findings demonstrate that rising temperatures will determine future drought severity in the Arabian Peninsula, necessitating fundamental shifts in water resource management from precipitation-centric approaches toward strategies explicitly addressing temperature-driven PET.

Keywords: Drought intensification; SPEI; SPEDI; Potential evapotranspiration; ERA5-Land; Climate change; Arabian Peninsula


Acknowledgment

This work was supported by the Korea Environmental Industry & Technology Institute (KEITI) through Water Management Program for Drought, funded by the Korea Ministry of Climate, Energy and Environment(MCEE)(2480000378).

How to cite: Rahman, G. and Kwon, H.-H.: Drought Trends and Variability in the Arabian Peninsula Using SPEI and SPEDI Indices and their Implications for Climate Adaptation, EGU General Assembly 2026, Vienna, Austria, 3–8 May 2026, EGU26-6261, https://doi.org/10.5194/egusphere-egu26-6261, 2026.

EGU26-6424 | ECS | Posters on site | HS2.4.7

A Copula-Based Framework for Quantifying Compound Pluvial and Fluvial Flood Risks  

Achala Singh, Suyash Shukla, and Priyank J. Sharma

Floods constitute one of the most catastrophic natural hazards globally, precipitating extensive socio-economic disruption, infrastructure failure, and loss of life. Despite their severity, traditional flood hazard assessments frequently rely on univariate paradigms that assume independence between pluvial and fluvial drivers. Such approaches often overlook the critical reality of compound events, where synchronized or successive drivers amplify the total magnitude of the hazard. This study addresses this gap by proposing a rigorous copula-based framework for assessing Compound Pluvial–Fluvial Flood (CPFF) risk. The methodology employs a block maxima approach to capture extreme events, which are subsequently paired through a lag-time analysis to identify temporal synchronization between extreme precipitation and peak streamflow. A significant refinement in this framework is the integration of a bankfull discharge threshold; this serves as a physical constraint to filter the block maxima data, ensuring that only hydraulically significant fluvial events are analyzed. The joint probabilistic behavior of these flood pairs is quantified using bivariate copula functions, facilitating the estimation of joint return periods for both conjunction and disjunction scenarios. This study validated the framework in the Tapi River basin, India, where intense monsoon seasonality prevails. The findings show that flood risk varies significantly across the basin; rather, it is a function of monsoon-driven precipitation patterns, antecedent soil moisture conditions, and basin-scale hydrodynamic responses. A key finding reveals a spatial gradient in synchronization: upstream catchments exhibit lower correlation between pluvial and fluvial extremes, whereas the downstream reaches demonstrate high synchronization and significantly elevated CPFF risk. By quantifying these interactions, this study highlights that conventional univariate models substantially underestimate the hazard potential in downstream areas, providing a more robust evidence base for regional flood mitigation and infrastructure design.


Keywords: Compound floods, Copula, Statistical analysis, Joint return period, Flood risk assessment.

How to cite: Singh, A., Shukla, S., and J. Sharma, P.: A Copula-Based Framework for Quantifying Compound Pluvial and Fluvial Flood Risks , EGU General Assembly 2026, Vienna, Austria, 3–8 May 2026, EGU26-6424, https://doi.org/10.5194/egusphere-egu26-6424, 2026.

EGU26-7245 | ECS | Posters on site | HS2.4.7

Spatio-temporal Analysis of Agricultural Drought Risk across India 

Kasi Venkatesh, Bellie Sivakumar, and Christian J Onof

Agricultural drought poses a major challenge to food security in India, where crop production is largely dependent on the availability of rainfall and soil moisture. Despite extensive research, most drought assessments in India remain region-specific, limiting a holistic understanding of compound agricultural drought risk at the national scale. This study presents a nationwide, district-level assessment of agricultural drought risk across India by integrating drought hazard, exposure, and vulnerability within a unified framework. The assessment is performed for the period 1966–2014 using long-term hydroclimatic, agricultural, and socioeconomic datasets. Agricultural drought hazard is quantified using a copula-based approach that explicitly captures the concurrence of meteorological and soil moisture drought conditions, thereby characterizing compound drought events. Exposure is estimated using percentile-based normalization (5th and 95th percentiles) of population and agriculture-dependent indicators. Vulnerability is evaluated using the Technique for Order Preference by Similarity to Ideal Solution (TOPSIS), incorporating socioeconomic and infrastructural indicators. The results reveal pronounced spatial and temporal variability in agricultural drought risk across India. An elevated risk was found for the Indo-Gangetic Plain, particularly in Uttar Pradesh and Bihar, during the years 1966, 1979, 2009–2011, and 2012. In contrast, north-western India, including Rajasthan, Punjab, and Haryana, experienced heightened compound drought risk during 1987–1988 and 2001–2003. Central India, encompassing Madhya Pradesh and Maharashtra, also emerged as a major hotspot in 1992, 2001–2002, and 2012, while Bihar and Jharkhand exhibited elevated risk in 1983 and 1992. These evolving regional patterns demonstrate the capability of the proposed framework to monitor the spatial progression of agricultural drought risk across districts over time, in association with changes in drought hazard, exposure, and vulnerability, highlighting the importance of regionally targeted drought risk management and adaptation measures.

How to cite: Venkatesh, K., Sivakumar, B., and Onof, C. J.: Spatio-temporal Analysis of Agricultural Drought Risk across India, EGU General Assembly 2026, Vienna, Austria, 3–8 May 2026, EGU26-7245, https://doi.org/10.5194/egusphere-egu26-7245, 2026.

EGU26-7292 | Posters on site | HS2.4.7

Analysis of drought events in Italy evaluated by means of rainfall remote products 

Roberto Coscarelli, Francesco Chiaravalloti, and Gaetano Pellicone

Accurate rainfall estimation is a fundamental prerequisite for effective hydrological drought monitoring. In fact, precipitation represents the primary input to most drought indicators, and even small systematic biases can significantly affect the identification, timing, and severity of drought events. This is particularly relevant for the indices, such as the Standardized Precipitation Index (SPI), which rely exclusively on precipitation time series and are widely used for operational drought monitoring at multiple temporal scales. In regions such as Italy, characterized by complex topography, coastal–mountain interactions, and an uneven distribution of rain-gauge stations, uncertainties in rainfall estimation can therefore propagate directly into drought assessments, potentially limiting the reliability of decision-support systems. To address these limitations, satellite-based precipitation products have become an essential complement to ground observations, providing spatially continuous coverage and near–real-time data. However, their performance varies considerably depending on retrieval methodology, spatial resolution, and prevailing meteorological conditions, making a comprehensive evaluation necessary before their application to drought monitoring.

The objective of this study is to assess how different satellite precipitation products affect SPI-based drought characterization over Italy. Five widely used satellite precipitation products (CHIRPS, GPM, HSAF, PDIRNOW, and SM2RAIN) were selected to represent a broad range of retrieval approaches, including infrared–station hybrid techniques, passive microwave integration, geostationary multi-sensor blending, neural-network–based infrared methods, and soil-moisture inversion algorithms. Their diverse temporal and spatial resolutions make them suitable for both scientific analyses and operational monitoring frameworks.

The SPI data derived from each satellite product were compared. The analysis highlights substantial differences in SPI magnitude, frequency, and duration depending on the input precipitation dataset, emphasizing the sensitivity of drought assessment to rainfall estimation errors. Results indicate that no single satellite product consistently outperforms the others across all metrics and temporal aggregations and suggest that integrating multiple satellite products or adopting hybrid approaches can improve the reliability of SPI-based drought monitoring over complex Mediterranean environments, enhancing early warning capabilities and supporting more informed water-resources management.

This work was funded by the Next Generation EU—Italian NRRP, Mission 4, Component 2, Investment 1.5, call for the creation and strengthening of ‘Innovation Ecosystems’, building ‘Territorial R&D Leaders’ (Directorial Decree n. 2021/3277)—project Tech4You—Technologies for climate change adaptation and quality of life improvement, n. ECS0000009. This work reflects only the authors’ views and opinions; neither the Ministry for University and Research nor the European Commission can be considered responsible for them.


How to cite: Coscarelli, R., Chiaravalloti, F., and Pellicone, G.: Analysis of drought events in Italy evaluated by means of rainfall remote products, EGU General Assembly 2026, Vienna, Austria, 3–8 May 2026, EGU26-7292, https://doi.org/10.5194/egusphere-egu26-7292, 2026.

EGU26-8545 | ECS | Orals | HS2.4.7 | Highlight

Could a Brief Wet Spell Accelerate Drought Onset? Climate-Dependent Mechanisms Behind Onset Speed 

Qiqi Gou and Huiling Yuan

Flash droughts are defined by their unusually rapid onset, yet what controls how fast they develop remains unclear and may differ fundamentally across climate regimes. Here we deliver a global, process-oriented assessment of flash drought onset speed using satellite-derived evaporative stress to characterize land-surface water–energy limitations, and SHAP (Shapley Additive Explanations) to diagnose the dominant hydrometeorological drivers of acceleration. We find that while humid regions experience flash droughts more frequently, events in drylands intensify more rapidly. This contrast reflects differences in energy and water constrains: net radiation plays a greater role in humid regions, whereas surface drying dominates in drylands. Moreover, short-term antecedent moisture recovery followed by rapid drying accelerates onset, with soil moisture depths and timescales exerting region-specific influences. These results reveal climate-dependent mechanisms underlying flash drought intensification and highlight the need for tailored monitoring strategies in diverse hydroclimatic contexts.

How to cite: Gou, Q. and Yuan, H.: Could a Brief Wet Spell Accelerate Drought Onset? Climate-Dependent Mechanisms Behind Onset Speed, EGU General Assembly 2026, Vienna, Austria, 3–8 May 2026, EGU26-8545, https://doi.org/10.5194/egusphere-egu26-8545, 2026.

EGU26-9093 | Orals | HS2.4.7

The energy of floods: an overlooked perspective on flood impact amplification 

Rui Guo, Guenter Bloeschl, and Alberto Montanari

In Autumn of 2000, intense rainfall occurred in the Alpine regions of the Po River basin between 13 and 16 October. The resulting flood wave reached Pontelagoscuro — conventionally considered the basin outlet — on 20 October, when the river discharge peaked at more than 13,500 m³/s, one of the highest values ever recorded. Average rainfall over the 70091 km2 Po River catchment was about 162 mm.

The total mechanical energy released by the rainfall mass over the land surface during 13–16 October, relative to the mean sea level and accounting for both the potential and kinetic energy of raindrops, amounts to approximately 0.13 exajoules. This amount of energy is comparable to more than eight years of electricity consumption by a large metropolitan area such as New York City and corresponds to roughly 2,000 times the energy released by the Hiroshima atomic bomb. While these comparisons do not imply a strict physical equivalence, they provide a framework for contextualizing the magnitude of the energy involved in extreme precipitation and flood-generating processes, and help to explain the destructive potential of flood events, as demonstrated by several recent cases. Consistent with this interpretation, the EM-DAT International Disasters Database reports that the Po River flood in 2000 resulted in 25 fatalities, affected approximately 43,000 people, and caused total economic losses of about 8 billion US dollars (2000 value).

A large fraction of the energy associated to extreme rainfall events is dissipated as heat through friction during surface runoff and river flow, while simultaneously driving hillslope and riverbed erosion and sediment transport, processes that may in turn enhance the overall energy of the flood. Another portion of the energy is temporarily stored within the catchment, particularly in artificial reservoirs, and released at later stages. Part of the energy is conveyed along the river channel and, under ordinary conditions, does not produce significant impacts because it remains confined to areas of low exposure, such as the riverbed and adjacent floodplains.

Flood impacts arise when the trajectories of energy fluxes (i.e. power) intersect with people and societal assets, namely when water spills out from the river bed and spreads into highly exposed areas. Under specific flow conditions, the power associated with the flooding water can increase substantially, leading to a marked amplification of impacts—for example, when floodwaters enter urban streets and vehicles are entrained and transported downstream due to high local power, or when energy accumulates and is subsequently released abruptly. Another reason for impact amplification is associated to the conversion of energy flux into the rate at which damage, disruption, or harm propagates through a human–environment system during a flood. Consequently, the analysis of energy and impact fluxes represents an essential tool for modeling and predicting compound events, flood damage and potential destruction, and designing strategies to increase resilience.

We present a workflow grounded in dynamical systems theory for analyzing, modeling, and predicting the trajectories of energy, power and impact fluxes during flood events, for identifying critical situations for flood impact amplification.

How to cite: Guo, R., Bloeschl, G., and Montanari, A.: The energy of floods: an overlooked perspective on flood impact amplification, EGU General Assembly 2026, Vienna, Austria, 3–8 May 2026, EGU26-9093, https://doi.org/10.5194/egusphere-egu26-9093, 2026.

EGU26-10399 | Posters on site | HS2.4.7

Role of climate change in urban flood-relevant sub-daily rainfall extremes in India 

Arpita Mondal and Aaqib Gulzar

Sub-daily rainfall extremes that drive rapid urban flooding are expected to intensify under anthropogenic climate change. Yet, their attribution remains uncertain due to limited observation records, lack of adequate representation of relevant physical processes and coarse spatio-temporal resolution of climate models. For a rapidly-urbanizing highly-populated country such as India with ambitious growth targets, such extremes are critical as urban flooding is often associated with significant loss of lives, environment and socio-economic damage. We assess the contribution of human-induced climate change to sub-daily extreme rainfall and its implications for urban flooding over the high-density heritage city of Ahmedabad. Two Inter-Sectoral Impact Model Intercomparison Project (ISIMIP3b) ensemble outputs, Hist-Nat (historical natural, a counterfactual driven only by solar and volcanic forcing) and Hist (factual, natural plus anthropogenic forcing) are bias-adjusted and statistically downscaled using ISIMIP3-BASD on six most-recent generation models at 0.25° resolution. Temporal disaggregation of rainfall from daily to hourly scales is carried out using a simple, yet effective k-nearest neighbour (kNN) approach evaluated against observations. Rainfall Intensity-Duration-Frequency (IDF) curves are derived for various return periods relevant to urban flood management. Observations show significant increases in short-duration rainfall intensities for Ahmedabad, ranging from 2.9% to 49.1% across different return periods with rarer events showing larger intensifications.

However, model simulations aren’t consistent with each other in terms of nature of change in rainfall extremes, resulting in equivocal attribution conclusions. While the multi-model mean suggests anthropogenic forcing has intensified short-duration rainfall extremes (1-13 hours) by 5-10% and reduced long-duration events (14-24 hours) by approximately 15%, individual models show divergent responses. These findings highlight limitations of current global climate models in attributing sub-daily rainfall extremes to climate change in the Indian monsoon region where fidelity of such models have been questioned by earlier regional studies on seasonal means. It is interesting to note, however, that based on observations alone, short duration high intensity rainfall extremes are found to be rising in this city, concurrent with expansion of built-up areas, thereby increasing exposure of urban population and environment to the risk of flooding. 

How to cite: Mondal, A. and Gulzar, A.: Role of climate change in urban flood-relevant sub-daily rainfall extremes in India, EGU General Assembly 2026, Vienna, Austria, 3–8 May 2026, EGU26-10399, https://doi.org/10.5194/egusphere-egu26-10399, 2026.

EGU26-10744 | ECS | Orals | HS2.4.7

Climate Forcings, Solar Geoengineering, and Long-term Drought Dynamics over Europe  

Vaibhav Kumar, Luca Brocca, and Jaime Gaona

Europe is experiencing an increasing risk of long-term drought as a result of anthropogenic climate warming, declining snowpack in mountainous regions, and changes in large-scale precipitation regimes. These processes contribute to the intensification of climate extremes and pose growing challenges for water-resource management, ecosystem resilience, and socio-economic stability. While CMIP6 climate projections are widely used to assess future drought risk across Europe, the potential implications of solar geoengineering for the spatio-temporal behaviour of long-term droughts remain unexplored.

This study presents a conceptual, scenario-based framework to examine long-term meteorological drought dynamics over Europe using CESM2 simulations from both CMIP6 shared socioeconomic pathways (SSP2–4.5 and SSP5–8.5) and GeoMIP6 solar geoengineering experiments (G1–G4 and pi-control). Drought conditions are evaluated using SPI-12, and drought characteristics—severity, duration, and intensity—are quantified using run theory to enable consistent comparison across contrasting climate-forcing pathways.

The proposed framework facilitates a structured multi-scenario assessment of drought responses under conventional greenhouse-gas-driven warming and idealized solar-radiation-modification scenarios, while maintaining scientific neutrality regarding the feasibility, deployment, or governance of geoengineering interventions. By jointly examining these pathways, the analysis aims to identify potential shifts in drought persistence, intensification, and large-scale spatial expression, key elements governing the spatio-temporal organization of long-term droughts and compound drought risk.

Overall, this work contributes to a more comprehensive assessment of long-term drought risk in Europe by explicitly linking climate extremes to both traditional climate forcings and hypothetical geoengineering perturbations. The framework is transferable and provides a robust basis for drought risk assessment, supporting adaptation planning and long-term drought governance under deep uncertainty associated with future climate trajectories.

Keywords: Climate extremes; Drought; SPI-12; Solar geoengineering; Europe.   

How to cite: Kumar, V., Brocca, L., and Gaona, J.: Climate Forcings, Solar Geoengineering, and Long-term Drought Dynamics over Europe , EGU General Assembly 2026, Vienna, Austria, 3–8 May 2026, EGU26-10744, https://doi.org/10.5194/egusphere-egu26-10744, 2026.

EGU26-10891 | ECS | Orals | HS2.4.7

Widespread intensification of compound dry and heat wave events at daily scales over global land regions 

Lijun Jiang, Jiahua Zhang, Linyan Bai, Jiaqi Han, Xianglei Meng, Dan Cao, and Ali Salem Al-Sakkaf

Research on compound dry and heat wave events (CDHWs) has been limited by inconsistencies in the temporal resolutions of their constituent hazards, with droughts commonly characterized at monthly scales and heat waves at daily scales. The development of daily-scale drought indices enables the identification of dry events on a daily basis, thereby facilitating more detailed investigations of CDHWs. Using daily Standardized Precipitation Evapotranspiration Index (daily-SPEI) data and heat wave records, CDHWs were identified for the period 1961–2020, and their spatiotemporal variations in frequency, duration, dry severity, and heat intensity were systematically analyzed. Extreme CDHWs were further defined based on the upper thresholds of dry severity and heat intensity across all identified events, and changes in their occurrence probabilities, along with the relative contributions of dry events and heat wave events, were examined.

The results indicate a widespread intensification of CDHWs across global land areas, with particularly pronounced increases in western North America, eastern South America, Europe, northern Africa, and parts of Asia. The frequency of CDHWs shows significant upward trends since the 1990s, with a marked acceleration in recent years. Notably, extreme CDHWs exhibit more severe changes during 1991–2020 compared with 1961–1990. Consequently, the return periods of extreme CDHWs have decreased significantly across nearly all global land regions, with reductions exceeding 60% in many areas. Control variable experiments further demonstrate that changes in heat wave events contribute more to the reduction in return periods of extreme CDHWs than changes in dry events, accounting for approximately 23%–63% and 6%–13%, respectively. Overall, this study advances the understanding of CDHWs at daily temporal scales and underscores the need to place greater emphasis on extreme compound events under rapidly intensifying climate conditions.

How to cite: Jiang, L., Zhang, J., Bai, L., Han, J., Meng, X., Cao, D., and Al-Sakkaf, A. S.: Widespread intensification of compound dry and heat wave events at daily scales over global land regions, EGU General Assembly 2026, Vienna, Austria, 3–8 May 2026, EGU26-10891, https://doi.org/10.5194/egusphere-egu26-10891, 2026.

EGU26-10892 | ECS | Orals | HS2.4.7

Defining thresholds and lags times in drought propagation cascade: a study case in the northern Córdoba (southern Spain) 

Francisco Herrera, Laura Santos, Ana Andreu, Eva Contreras, Raquel Gómez-Beas, Cristina Aguilar, María José Polo, and Rafael Pimentel

Sustainable water resources management constitutes a critical challenge in Mediterranean regions, where water availability is limited. In addition, over these areas climate change projections point to an increasement of frequency and recurrency of extreme events, such as drought, which further intensification of scarcity conditions. Historically, these regions have addressed their climate variability through regulation and storage infrastructures. However, the resulting increase in water availability caused by this infrastructure has promoted the development of highly water-dependent socioeconomic systems (e.g. irrigated agriculture, energy production or tourism), thereby increasing their vulnerability to these extreme events such as drought.  

Drought is a complex phenomenon composed of multiple stages interconnected through a propagation cascade: meteorological drought, driven by precipitation deficits; agricultural drought, linked to soil moisture and vegetation water requirements; hydrological drought, reflected in reduced streamflow and reservoir storage; and socioeconomic drought, which emerges when water shortages impact human activities and services. In this sense, a precipitation deficit does not immediately translate into a reduction in soil moisture or a decrease in streamflow, as drought propagation is modulated by propagation thresholds and lags times. The magnitude and duration of these lags are controlled by multiple factors such as soil characteristics, land uses, and reservoir operation. In Mediterranean mid- mountains catchment this complexity increases due to the variability in precipitation patterns, a complex soil-land interaction and the ephemeral character of the streams.  

In this context, this work analyses the thresholds that trigger the concatenation of droughts and the lag times along the drought propagation cascade in medium-sized Mediterranean mountain basins, with the aim of improving the anticipation and management of water scarcity episodes. The analysis focuses on the northern area of Córdoba regions (southern Spain), where recent drought episodes had had a significant impact on water resources availability, exposing structural vulnerabilities in the supplying system. 80,000 citizens were without running water at home for more than a year.  

A distributed, physically based hydrological model is applied to generate catchment-averaged precipitation, streamflow, and soil moisture for the period 1960-2024. Drought propagation thresholds and lags are quantified through a comparative analysis of standardized drought indices, including the Standardized Precipitation Index (SPI), Standardized Streamflow Index (SSFI), and Soil Moisture Anomaly (SMA), combined with time-series techniques such as cross-correlation and autocorrelation analyses. Finally, the potential benefits of incorporating these identified lags into operational water management will be evaluated, highlighting their value for strengthening early warning systems and water resources planning.  

Acknowledgements: This study has been funded by the call “Grants to develop innovative solutions to address drought, within the framework of the PLAnd Drought Andalusia. 2023 Call” through the project PLSQ-00172-F – “Service for the early detection of alert states in water management under scarcity conditions” (SEGA) 

How to cite: Herrera, F., Santos, L., Andreu, A., Contreras, E., Gómez-Beas, R., Aguilar, C., Polo, M. J., and Pimentel, R.: Defining thresholds and lags times in drought propagation cascade: a study case in the northern Córdoba (southern Spain), EGU General Assembly 2026, Vienna, Austria, 3–8 May 2026, EGU26-10892, https://doi.org/10.5194/egusphere-egu26-10892, 2026.

EGU26-13899 | Orals | HS2.4.7

An event-based, Bayesian approach for estimating floods in urban and natural catchments  

Thomas Skaugen, Deborah Lawrence, Kolbjørn Engeland, and Anne Fleig

Numerous methods have been previously developed for design flood estimation. Where sufficient runoff data are available, statistical methods for flood frequency analysis are often the preferred approach. In cases where such data are scarce, methods involving hydrological simulation are an attractive alternative. Simulation methods range in complexity from the very simple, formula-based, Rational Method to the simulation of runoff using complex hydrological models also with stochastic input. In the simple models, the return period of runoff often inherits the return period from the input, i.e. the precipitation intensity for a given return period. In this case, arbitrary assumptions are often made regarding initial conditions, e.g. soil moisture states. Here, we investigate the relationship between extreme precipitation, precipitation sequences, initial soil moisture states and peak discharge to estimate extreme floods using hydrological simulations. We use the parameters and simulation results of the DDD (Distance Distribution Dynamics) hydrological model to parameterise an event-based model (DDDEvent) which is run for a range of precipitation intensities, precipitation sequences, and initial soil moisture states. When running the event model, a value of a specific precipitation intensity is used and initial soil moisture state and precipitation sequence are stochastically drawn from a gamma distribution and a beta distribution, respectively. This procedure is repeated for a range of precipitation intensities. The (simulated) initial soil moisture states are, in many catchments, found to be correlated with precipitation so we use a (gamma) distribution of antecedent soil moisture states conditioned on precipitation. Results show, expectedly, that varying the soil moisture state and precipitation sequence can give a range of runoff responses to a given precipitation input. When we simulate runoff for a single precipitation intensity and vary the soil moisture states and precipitation sequence, we obtain a conditional distribution of runoff, given the precipitation intensity. Similarly, for a simulated runoff value we find a range of possible precipitation intensities, and we obtain a conditional distribution of precipitation given the runoff value. From such (empirical) conditional distributions we can use Bayes’ theorem to assess the exceedance probability for a fixed value of runoff given the exceedance probability of the precipitation event. Simulation results using synthetic data show that the proposed approach is justified when runoff and precipitation are highly correlated, which is typically the case for extreme precipitation events. The approach is validated against extreme value estimates of floods using flood frequency analysis on long time series from the Norwegian Water Resources and Energy Directorate. Preliminary results for estimating instantaneous floods are promising for catchments where floods are primarily generated by extreme rainfall and snowmelt plays a minor role. The proposed method also has potential for estimating floods in ungauged catchments if reliable extreme value estimates of precipitation exist using a regionalised version of the DDD model.

How to cite: Skaugen, T., Lawrence, D., Engeland, K., and Fleig, A.: An event-based, Bayesian approach for estimating floods in urban and natural catchments , EGU General Assembly 2026, Vienna, Austria, 3–8 May 2026, EGU26-13899, https://doi.org/10.5194/egusphere-egu26-13899, 2026.

EGU26-14199 | ECS | Posters on site | HS2.4.7

Co-evolution of Compound Climate Extremes Across Global Breadbasket Regions  

Amitesh Sabut and Ashok Mishra

Global food production is concentrated in a limited number of highly productive breadbasket regions, making global supply increasingly sensitive to climate shocks and demographic change. Using multi-model CMIP6 projections under three Shared Socioeconomic Pathways, this study assesses future changes in the frequency, duration, and severity of compound drought–heat extremes across global wheat breadbaskets and evaluates their simultaneous occurrence across regions. Results indicate substantial intensification of compound climate stress, with a growing likelihood of concurrent high-impact years affecting multiple breadbaskets, particularly under higher-emission scenarios. These climate risks increasingly intersect with demographic transitions, including aging agricultural workforces and rising dependence of food-importing regions on external supplies, which may constrain adaptive capacity and amplify supply vulnerabilities.

How to cite: Sabut, A. and Mishra, A.: Co-evolution of Compound Climate Extremes Across Global Breadbasket Regions , EGU General Assembly 2026, Vienna, Austria, 3–8 May 2026, EGU26-14199, https://doi.org/10.5194/egusphere-egu26-14199, 2026.

A simple but robust depth-duration-frequency (DDF) model is presented to reveal the asymptotic characteristics of extreme but short-lived (sub-daily) precipitation events that satisfy a peak over threshold (POT) size criterion. Our objective is to reliably estimate the return periods for events of a given intensity (as measured by rainfall depth and duration).

For each depth threshold and duration period (ranging from 15 minutes to 24 hours), the number of qualifying POT events is simply counted over multi-year periods, whether from observations or model output, at each location separately. The distribution of events as a function of their size above the threshold is modelled by a generalized Pareto distribution (GPD), following standard extreme value theory. Those exceedance distributions are shown, to a good approximation, to be independent of location within Ireland. This justifies the aggregation of exceedances from multiple locations, which is a key feature of the model. Aggregation acts as a data multiplier, enabling more reliable estimation of GPD fits and return periods.

The model is applied to intense precipitation observations spanning 30–64 years at 23 stations in Ireland. Three-hourly output from an ensemble of CMIP5 global climate simulations, downscaled to high-resolution over Ireland, were also used to compute both historical and projected future intense event return periods under two different emission scenarios. 

Future numbers of events per time-period are projected to increase by 20-80%, depending on event threshold and duration, location, emission scenario and time-period. Return periods are projected to shorten by factors of 2 or more for the most intense events, as illustrated by return period maps for events of any given size.

Return period uncertainty is quantified mainly by the spread among the different CMIP5 models.  For any given model, however, robustness is demonstrated by the convergence of the empirical exceedance distributions as more stations (or grid-points) are aggregated, which then leads naturally to convergence of the GPD fits.

How to cite: O'Brien, E., Wang, J., Ryan, P., Nolan, P., and Mateus, C.: A Robust Depth-Duration-Frequency Model for Analysis of Extreme Precipitation Events, with Application to Past and Projected Future Climates in Ireland, EGU General Assembly 2026, Vienna, Austria, 3–8 May 2026, EGU26-15190, https://doi.org/10.5194/egusphere-egu26-15190, 2026.

EGU26-16024 | ECS | Orals | HS2.4.7

Graph Neural Network -based identification of homogeneous rainfall regions over Kerala, India 

Namitha Saji and Rajendran Kavirajan

Identifying homogeneous rainfall regions is a fundamental step in regional hydrological analysis. Traditional regionalization approaches often rely on predefined physiographic boundaries or purely statistical clustering, which may inadequately capture complex spatial dependencies in hydroclimatic variables. In regions such as Kerala, India, characterized by complex topography, strong monsoon gradients, and frequent flood events, conventional regionalization methods fail to adequately capture spatial dependence in rainfall variability. This study proposes a Graph Neural Network- based framework for delineating homogeneous rainfall regions to support regional flood frequency analysis and flood risk studies.

Daily gridded rainfall data from the India Meteorological Department (IMD) over Kerala were represented as nodes in a graph, with edges defined by geographical proximity. A two-layer Graph Convolutional Network was trained to learn local rainfall similarity and spatial connectivity. The resulting node embeddings were clustered using the K-means algorithm to identify homogeneous rainfall regions.

Despite using only rainfall information and spatial adjacency, the derived zones closely align with elevation gradients, effectively separating coastal, midland, and western ghats regimes and capturing sharp orographic transitions. This demonstrates that GNN node embeddings can implicitly learn physically meaningful rainfall-topography relationships, providing a robust basis for rainfall regionalization and flood-related hydrocimatic assessments.

How to cite: Saji, N. and Kavirajan, R.: Graph Neural Network -based identification of homogeneous rainfall regions over Kerala, India, EGU General Assembly 2026, Vienna, Austria, 3–8 May 2026, EGU26-16024, https://doi.org/10.5194/egusphere-egu26-16024, 2026.

Climate change intensifies the hydrological cycle leading to concerns in future water availability. The resulting changes in water availability need to be quantified to determine present and future actions needed with regards to water resources management. In this work, we focus on the soil moisture component of the hydrological cycle which is crucial for agriculture and ultimately for ensuring food security. We model future soil moisture levels under the high emissions RCP 8.5 scenario at 34 sites of the UK COsmic-ray Soil Moisture Observing System (COSMOS-UK) network. We do this by bringing together: the Joint UK Land Environment Simulator (JULES) land surface model, long-term field-scale soil moisture measurements from the COSMOS-UK network and 2.2 km convection-permitting UK Climate Projections (UKCP18). As a first step, we use the COSMOS-UK observations to optimise 12 parameters of the Cosby pedotransfer functions used in the JULES model. We then force the optimised JULES model with UKCP18 data to produce soil moisture estimates in three time periods: 1982-2000, 2022-2040 and 2062-2080. We interpret the results in the context of frequency of soil moisture drought events and the impact on individual months. We find that on average across all sites, there is an increase in future extreme soil moisture drought events above 90 days with respect to the historical period. In 2062-2080, the frequency of these events is expected to increase by a factor of between 1.8 and 2.8. We also show that months between May and November have an increased probability of high or more intense plant water stress in this far future period, with months between June and October being at especially high risk. This work has been published in https://doi.org/10.1088/1748-9326/ad7045. 

How to cite: Szczykulska, M., Huntingford, C., Cooper, E., and Evans, J. G.: Future increases in soil moisture drought frequency at UK monitoring sites: merging the JULES land model with observations and convection-permitting UK climate projections, EGU General Assembly 2026, Vienna, Austria, 3–8 May 2026, EGU26-16341, https://doi.org/10.5194/egusphere-egu26-16341, 2026.

EGU26-16836 | ECS | Orals | HS2.4.7

Analysis of drainage-dependent compound flood hazard along the German North Sea coast 

Henning Müller, Julius Engelmann, Christian Jordan, Julius Thierfeldt, Nikolaus Müller, Gabriel David, and Kai Schröter

The controlled drainage of diked hinterlands via sluices and pumping stations is a critical component of flood risk management in low-elevation coastal zones (LECZs), where floods are shaped by the interaction of rainfall, tides, storm surges, and sea-level rise. Effective drainage operation requires consideration of complex flood and tidal dynamics as drainage capacity is primarily impacted by the hydraulic gradient between inland water and downstream marine or estuary systems. As downstream water level dynamics dictate periods of gravity-driven drainage and the efficiency of pump operations, drainage capacity varies over time and depends heavily on tidal and storm surge conditions. Reduced drainage capacity significantly increases hinterland flood hazard, highlighting the importance of concurring and compounding events for flood risk management in LECZ.

To better understand the interaction of flood drivers in low-land drainage areas, we develop a statistical framework to describe the impact of seaside conditions on drainage capacity, focusing on gravity-driven drainage along the German North Sea coast. Using multi-decadal tidal gauge records, high-resolution digital elevation models, and site-specific inland control stages, we derive threshold-based drainage conditions at more than one hundred coastal catchment outlets. We define free-drainage periods as intervals with tidal water levels below the inland control stage and tidal low-water exceedance spells as periods during which consecutive tidal low waters remain above the control stage, preventing gravity-driven drainage processes completely. Based on these characteristics, we statistically analyse the impact of coastal water level conditions on drainage operation. Further, we link them to inland precipitation to analyse situations of increased compound flood hazard where rainfall coincides with reduced or precluded gravity-driven drainage using multivariate extreme value statistics.

Using this approach, we (i) define drainage condition metrics consistently across coastal drainage systems, (ii) quantify the duration, frequency, and temporal trends of compound flood hazard and (iii) demonstrate implications for the water management in LECZ. 

How to cite: Müller, H., Engelmann, J., Jordan, C., Thierfeldt, J., Müller, N., David, G., and Schröter, K.: Analysis of drainage-dependent compound flood hazard along the German North Sea coast, EGU General Assembly 2026, Vienna, Austria, 3–8 May 2026, EGU26-16836, https://doi.org/10.5194/egusphere-egu26-16836, 2026.

Terrestrial Water Storage (TWS) drought is a major hydrological hazard with severe impacts on water resources security, crop yield, natural ecosystem production, and socioeconomic stability. Precipitation has long been assumed as the major driver in the development of TWS drought, but recent work highlights evapotranspiration (ET) as a key additional driver—yet its specific mechanisms and relative importance remain underexplored. In this study, we first derive ET using the terrestrial water budget from observational data (2003–2019) and then propose a diagram to unravel the role of ET anomalies and precipitation minus runoff (PR) anomalies in driving TWS drought intensification and recovery across diverse climate regions. Our results show an asymmetric role of ET in TWS drought dynamics: positive ET anomalies (ET+, ET exceeding climatology) frequently drain TWS and intensify TWS drought, while negative ET anomalies (ET-) preserve TWS and promote TWS recovery. Regional patterns of ET and PR in driving TWS drought development differ markedly. Drought intensification is driven mainly by the combination of ET+ and PR- in arid regions, while ET+ often offsets PR+ to lead drought intensification in humid regions. Drought recovery is predominantly driven by PR+ in hyper-humid and humid regions but is more commonly dominated by ET- than by PR+ in arid and semi-arid regions. These findings provide new perspectives into the complex, indispensable role of ET in TWS drought development, highlighting the need to incorporate ET processes into improved drought monitoring, prediction, and management frameworks.

How to cite: Liu, R. and Liu, L.: The Indispensable Role of Evapotranspiration in Driving Terrestrial Water Storage Drought Development, EGU General Assembly 2026, Vienna, Austria, 3–8 May 2026, EGU26-16856, https://doi.org/10.5194/egusphere-egu26-16856, 2026.

In the natural sciences, statistical learning for the geosphere time series (atmosphere, hydrosphere, cryosphere, lithosphere and biosphere) addresses the substance of uncertainty by treating the Earth as a coupled, multi-scale cyber system (J. Krcho, 1970). The time series are sequences of observation in time that reflect results of interaction subsystems of the Geosphere obtained as sequences of observation in time. The systemic approach shifts analysis from one dimensional time series to discover, describe and model complex interactions and cybernetics feedback loops across scales.

Statistical learning allows extraction of Hilbert Spaces from observations with results defining the Geosystems as fuzzy time-spatial structures (Zadeh) with dimensionality and quantitative characteristics of variability reflected from data. The substance of uncertainty may be defined as an ability for models to describe variability in data. From a natural scientist's perspective, uncertainty is not merely "noise" but a property of the systemic approach to modeling the Earth system's complexity.

The Hydrosphere is the most dynamic of the Geospheres and connects with all of them. The Hydrosphere may be described with nine interacting fuzzy elements: water of seas & oceans, stream runoff shell, water of closed lakes, atmospheric water, water of glaciers, water of permafrost rocks, connate groundwater, water trapped in rocks & minerals of lithosphere, and water of biosphere. The stream runoff shell includes* terrestrial stream network.

Model definition (Minsky, 1969) here includes a concept and kinds of coordinate system; a hierarchy of watersheds in the Hydrosphere; representation results of analysis of empirical data; representation of some* knowledge and new concepts.

Visualization results will be presented following the above concepts with interpretation on the example of two watersheds (USGS 04010500 PIGEON RIVER AT MIDDLE FALLS NR GRAND PORTAGE MN, USGS 06191500 Yellowstone River at Corwin Springs MT). Besides six models of these two mesoscale watersheds based on statistical learning of three types of fuzzy structures, the concept will be illustrated with reference to hydrological maps based on time spatial structure obtained by Statistical Learning with use of empirical data from the Great Lakes watershed of North America.

These models for watershed as an element of cyber model for Geosphere and results obtained them illustrates that the systemic approach with statistical learning on empirical data may be successful to find interactions for other Geospheres and bigger natural systems.

The Scientific Hydrology growled out from multiscale cartography surface and groundwater interaction for evaluating regional and global water resources (a Report by Gilbrich and Struckmeier "50 Years of Hydro(geo)logical Cartography", 2014 UNESCO CGWM IAN BGR) unfortunately as parallel branch to Stochastic Hydrology (Klemeš, Koutsoyiannis). The modern cartography of water resources taking root in concepts from Horton, Strahler, Kudelin, using statistical learning for quantitative description time spatial variability, is the scientific branch of Hydrology. Union of those two branches with joint efforts of scientists and engineers is certainly coming.

How to cite: Shmagin, B. and Krakauer, N.: The Substance of Uncertainty in Systemic Approach: Statistical Learning for Time Series of Geospheres: Natural Scientist's Point of View, EGU General Assembly 2026, Vienna, Austria, 3–8 May 2026, EGU26-17737, https://doi.org/10.5194/egusphere-egu26-17737, 2026.

EGU26-19434 | Orals | HS2.4.7

Spatio‑temporal synergies in compound drought propagation 

Tamara Tokarczyk and Wiwiana Szalinska

Drought propagation is a non‑linear, multiscale process linking meteorological, soil, and hydrological drought through temporal conditioning and spatial coherence within river basins. Understanding these interactions is essential for drought early warning and regional risk assessment, yet their quantification remains challenging, particularly in regions with strong land–atmosphere feedbacks such as Poland. In this study, we apply two complementary methodological frameworks—Causality Chain Model (CCM) and Network Correlation Analysis (NCA)—to characterize the spatio‑temporal evolution of drought over Poland using monthly SPI, SPEI and SRI datasets for 1980–2020.

The CCM identifies robust cause–effect transitions along the sequence meteorological → soil → hydrological drought, with propagation delays (DPT) ranging from 1 to 12 months, depending on regional hydroclimatic conditions and indicator aggregation scales. Metrics including DPCs (Drought Propagation Counts) and DPCs_proc reveal that while not every meteorological drought propagates further, a substantial proportion does, forming statistically significant synergistic sequences. The DIP (Drought Intensity Propagation) index indicates regions where drought intensity amplifies during propagation (DIP > 1), highlighting the role of soil moisture depletion and catchment storage deficits in reinforcing hydrological drought development across Poland.

The NCA provides a spatially explicit perspective, identifying propagation hubs, coherent clusters, and regions with strong cross‑catchment connectivity. High values of Degree Centrality and Closeness Centrality reveal locations acting as spatial initiators or transmission nodes of drought signals. The CDC (Closeness to Drought Center) metric further delineates centres of synchronized drought evolution, enabling recognition of areas with elevated susceptibility to persistent hydrological stress.

By integrating CCM and NCA, this study offers a comprehensive multiscale characterization of drought propagation over Poland, capturing both temporal causality and spatial coherence. The combined framework provides actionable indicators supporting regional drought risk assessment, hydrological regionalization, and climate adaptation planning, improving the capacity to anticipate how drought conditions evolve under future climate variability.

How to cite: Tokarczyk, T. and Szalinska, W.: Spatio‑temporal synergies in compound drought propagation, EGU General Assembly 2026, Vienna, Austria, 3–8 May 2026, EGU26-19434, https://doi.org/10.5194/egusphere-egu26-19434, 2026.

EGU26-20843 | Orals | HS2.4.7

Multi-Hazard Reliability of Reservoirs, Aquifers, and Springs in Basilicata under Snow Drought and NTC18 Regulations 

Marco Faggella, Giampiero D'Ecclesiis, and Andre Ramos Barbosa

The prolonged 2023–2026 drought has exposed critical vulnerabilities in the hydro-infrastructural systems of Southern Italy, where drinking water supply depends on a coupled network of snow-fed reservoirs, spring systems, and karst aquifers. This contribution proposes a multi-hazard analytical framework that links snow drought, hydrogeological deficit, and storage infrastructure reliability, expanding beyond the well-documented Camastra Dam case to include the critical behavior of the Val D’Agri, Fossa Cupa and other regional aquifers. Using drought-propagation models, remote sensed data, and high-resolution in-situ datasets, we analyze how snow-pack deficits propagate through surface reservoirs and karst systems with different lag times, generating asynchronous yet convergent supply failures. The 2019 Camastra Dam’s forced drawdown and 2024 crisis—driven by NTC18 seismic design-reliability regulations, outlet malfunction, and reduced inflow—served as a “early system-scale indicator,” anticipating district-level shortages later confirmed by declining groundwater heads and reduced spring discharge across the southern Apennines. 
Building on these observations, this study proposes a unified reliability framework that integrates: (1) climate drivers (snow drought, reduced recharge), (2) hydrogeological pathways (karst storage, delayed meltwater propagation), (3) infrastructure performance and regulatory constraints (NTD14, NTC18 and related design requirements, outlet failures, storage restrictions), and (4) operational risk for drinking-water districts in Basilicata, Puglia, Campania. Preliminary results reveal the emergence of a system-wide tipping condition in which both reservoirs and karst springs lose buffering capacity—an unprecedented scenario for Southern Italy. 

How to cite: Faggella, M., D'Ecclesiis, G., and Barbosa, A. R.: Multi-Hazard Reliability of Reservoirs, Aquifers, and Springs in Basilicata under Snow Drought and NTC18 Regulations, EGU General Assembly 2026, Vienna, Austria, 3–8 May 2026, EGU26-20843, https://doi.org/10.5194/egusphere-egu26-20843, 2026.

EGU26-23015 | ECS | Posters on site | HS2.4.7

Hydrological drought and flood extremes across Indian river basins using CAMELS-IND 

Shivansh Tiwary and Arpita Mondal

Global climate change is altering hydrological extremes worldwide, yet how droughts and floods evolve jointly and what drives their changes in India remains poorly understood. Using the Catchment Attributes and Meteorology for Large-sample Studies – India (CAMELS-IND) dataset, we analyze long-term changes in hydrological drought and flood extremes across 55 minimally regulated Indian catchments (reservoir index < 0.25) during 1980–2017. Trends in annual minimum 7-day flows (Q7min) and annual maximum daily flows (Qmax) are quantified using robust non-parametric methods, and their concurrent behavior is classified using a quadrant framework. Results reveal widespread drying, with 38% of catchments exhibiting simultaneous declines in low and high flows, while only 13% show opposing trends indicative of divergence between extremes; remaining basins exhibit weak or mixed changes. Median trend magnitudes reach −3.3% per decade for drought flows and −4.5% per decade for flood flows. Fixed-effects panel regression shows that climate variability dominate streamflow changes, while terrestrial water storage anomalies significantly influence both drought and flood extremes, highlighting groundwater’s critical buffering role. In contrast, land-cover change shows weak or negligible effects. These findings provide the first India-scale, observation-based assessment of joint hydrological extremes and underscore emerging risks to long-term water security.

How to cite: Tiwary, S. and Mondal, A.: Hydrological drought and flood extremes across Indian river basins using CAMELS-IND, EGU General Assembly 2026, Vienna, Austria, 3–8 May 2026, EGU26-23015, https://doi.org/10.5194/egusphere-egu26-23015, 2026.

Extreme and persistent rainfall plays a critical role in shaping hydroclimatic risks, yet its long-term behavior at the watershed scale remains poorly characterized. This study examines observed changes in areal precipitation across standardized watersheds over the Korean Peninsula, with an emphasis on rainfall persistence, spatial variability, and extreme events. Daily areal precipitation for the period 1973–2024 was calculated from surface observations of the Korea Meteorological Administration using the Thiessen polygon method to improve spatial representativeness.

The analysis identifies clear multi-decadal shifts in precipitation characteristics. Mean annual areal precipitation increased from the 1970s to the early 2000s, reaching approximately 1,370 mm, before showing a slight decrease in recent years. Despite this moderation in mean values, heavy rainfall events exceeding 50.0 mm day⁻¹ exert a dominant influence on annual precipitation totals, with a strong correlation (Pearson r ≈ 0.95). This indicates that year-to-year variability in water availability is largely controlled by a small number of intense rainfall events rather than by changes in average conditions.

Spatial variability of heavy rainfall has increased notably since the early 2000s, as reflected by a rising coefficient of variation among watersheds. Rainfall persistence analysis further shows that moderate rainfall events (≥10.0 mm day⁻¹) commonly persist over consecutive days, with a mean Rainfall Persistence Index of approximately 1.4, highlighting the importance of sustained wet periods for hydrological processes. Frequency analysis based on the Generalized Extreme Value distribution reveals that, in the post-2013 period, estimated 100-year return levels of daily areal precipitation exceed 800 mm in several watersheds, indicating an increased potential for extreme rainfall hazards.

Overall, the results demonstrate that hydroclimatic change over the Korean Peninsula is expressed more strongly through shifts in rainfall persistence, spatial heterogeneity, and extremes than through changes in mean precipitation. The findings support the use of watershed-scale areal precipitation analyses for improved assessment of climate-related hydrological risks.

How to cite: Ham, H.: Observed Changes in Extreme and Persistent Areal Precipitation over Standardized Watersheds in the Korean Peninsula, EGU General Assembly 2026, Vienna, Austria, 3–8 May 2026, EGU26-23250, https://doi.org/10.5194/egusphere-egu26-23250, 2026.

Climate change is intensifying hydro-climatic variability in mountainous regions, where complex terrain, limited data availability, and rising anthropogenic pressures already challenge sustainable water-resources management. This research analyses the combined influence of extreme weather, drought variability, water-resource components (blue and green water), and demographic change on the future water security of a mountainous catchment. An integrated framework was applied using downscaled CMIP6 projections to examine future changes in hydro-meteorological extremes under 2°C and 3°C global warming levels (GWLs), as well as near-future (2021-2050) and far-future (2071-2100) periods. A calibrated hydrological model was used to quantify blue water (surface water), green water (soil moisture and evapotranspiration), and the Streamflow Drought Index (SDI). These indicators, combined with future population projections, were incorporated into a Fuzzy Analytic Hierarchy Process (FAHP), enabling identification of sub-catchments that are most vulnerable to future water scarcity. Results indicate a significant increase in hydro-climatic extremes. Under SSP5-8.5, extreme temperature indices (TXx, TNx) rise sharply, and annual rainfall increases by up to 31% by century’s end, accompanied by a 50-77% increase in very heavy precipitation events (R95p, R99p). High flows (Q95) exhibit notable amplification (+30%), while low flows (Q05) decline across most sub-catchments, highlighting increasing hydrological variability. Blue water availability is projected to rise by 22-44%, whereas green water flow increases moderately (+15-28%). In contrast, green water storage shows minimal or negative trends, suggesting declining soil moisture resilience despite higher rainfall. Hydrological drought analysis shows a basin-wide shift toward negative SDI values, indicating the rise of mild to moderate drought conditions even under wetter climates, driven by altered runoff timing, intensified evapotranspiration, and declining low-flow. Integrating eight hydro-climatic, hydrological, and socio-demographic indicators, the fuzzy AHP framework identifies four out of nine sub-catchments as highly vulnerable under SSP2-4.5, driven by rapid population growth (up to +40%), rising drought stress, and limited green-water buffering. Under SSP5-8.5, although higher rainfall reduces vulnerability in some areas, intensified extremes and shifting hydrological regimes expand moderate-risk zones across the basin. Findings reveal rising rainfall yet declining effective water, worsening low flows, and drought, highlighting the need for catchment-specific, climate-resilient water-management strategies.

How to cite: Prakash, P. and Chembolu, V.: Assessing Hydrological Variability and Water Scarcity in a Mountainous River Catchment under Climate and Demographic Change, EGU General Assembly 2026, Vienna, Austria, 3–8 May 2026, EGU26-321, https://doi.org/10.5194/egusphere-egu26-321, 2026.

EGU26-584 | ECS | Posters on site | HS2.4.11

How Does Climate Change Alter the Partitioning of Rainfall into Blue and Green Water and Drive Water Scarcity? 

Mahammad Rafi Chakkaralla and Dr. Vamsi Krishna Vema

Water scarcity is emerging as a critical challenge under changing climatic conditions, especially in semi-arid river basins, where rainfall variability governs the balance between blue and green water resources. Achieving the United Nations Sustainable Development Goals - 6 (Clean Water and Sanitation) and 13 (Climate Action) requires a clear understanding of how climate change alters hydrological processes and drives water scarcity. This study presents an integrated, model-based framework to evaluate the influence of climate change on the partitioning of precipitation into blue water (surface runoff and sub-surface runoff) and green water (soil moisture) and the resulting implications for water availability in the Upper–Middle Godavari (UG–MG) basin, India. A physically based SWAT hydrological model was developed, calibrated, and validated for 1979–2020 and forced with climate projections from SSP245 and SSP585 scenarios from CMIP6. The framework quantified blue water resources (BWR), green water resources (GWR), and associated scarcity indices by integrating irrigation, domestic, and industrial demands with environmental flow requirements. The basin receives an average annual precipitation of 770 mm, which is partitioned into 137 mm (17.8 %) of BWR and 629 mm (81.7 %) of GWR. Future projections indicate a 10–40 % increase in rainfall, accompanied by consecutive high-intensity rainfall events that are projected to enhance BWR by 50–100 % in some of the sub-basins. In contrast, GWR declines by up to 30 %, particularly in agricultural regions where rising temperatures (+3.5 °C under SSP585) intensify evapotranspiration and reduce soil-moisture retention. The BWR/PCP ratio is projected to exceed 30 %, signifying a shift toward runoff-dominated hydrological regimes. The results suggest that climate change is transforming the UG–MG basin from a green-water-dominated to a runoff-driven system, simultaneously heightening downstream flood risks and agricultural water deficits. The findings emphasize the urgency of adaptive and integrated water management strategies to restore the blue–green water balance and advance progress toward SDGs 6 and 13.

Keywords: Blue water resources; Green water resources; Climate change; SWAT model; Rainfall partitioning; water scarcity

How to cite: Chakkaralla, M. R. and Vema, Dr. V. K.: How Does Climate Change Alter the Partitioning of Rainfall into Blue and Green Water and Drive Water Scarcity?, EGU General Assembly 2026, Vienna, Austria, 3–8 May 2026, EGU26-584, https://doi.org/10.5194/egusphere-egu26-584, 2026.

EGU26-1067 | ECS | Orals | HS2.4.11

Global Climate and Vegetation Controls on Evapotranspiration Change Revealed by Budyko-informed Machine Learning 

Yao Li, Shijie Jiang, Georgios Blougouras, Baoqing Zhang, and Alexander Winkler

Evapotranspiration (ET) is a central component of the water and energy cycle, jointly affected by climate and vegetation. Under ongoing climate change and large-scale greening, a key challenge is to quantify how much of observed ET change is driven by vegetation, rather than by co-varying precipitation and atmospheric demand. Strong multicollinearity among climate, ET, and leaf area index (LAI) in observations hinders robust estimation of ET’s sensitivity to vegetation. Even though the classical Budyko framework can separate climatic and vegetation controls, it relies on fixed functional forms, limiting its ability to represent the strongly state-dependent and region-specific ET responses across climate and vegetation regimes. Therefore, we incorporate the Budyko framework within a data-driven model. This enables us to disentangle the influence of climate and LAI on ET, by combining global observations and established water-energy balance constraints. Using local derivatives and counterfactual experiments, we estimate the sensitivities of ET to climatic factors and LAI, and decompose ET changes into contributions from climate and vegetation. Our results show that ET sensitivity to LAI increases and then decreases with rising LAI, peaking in transitional regimes where neither water nor energy fully dominate. At the global scale, climatic contributions to ET change are spatially diverse, whereas LAI increases almost everywhere enhance ET. Even though climatic effects are typically stronger locally, their opposing signs across regions cancel out when aggregated globally. Therefore, during 2001-2020, the global ET increases correspond mainly to LAI trends. By leveraging this Budyko-informed model, which reduces the influence of multicollinearity, we can obtain a more robust separation of climatic and vegetation drivers of ET. These findings highlight the dynamic role of vegetation in regulating terrestrial water loss, which directly affects how reforestation and greening impacts on water resources are interpreted.

How to cite: Li, Y., Jiang, S., Blougouras, G., Zhang, B., and Winkler, A.: Global Climate and Vegetation Controls on Evapotranspiration Change Revealed by Budyko-informed Machine Learning, EGU General Assembly 2026, Vienna, Austria, 3–8 May 2026, EGU26-1067, https://doi.org/10.5194/egusphere-egu26-1067, 2026.

The Indian Subcontinent comprises approximately 5,700 dams, many of which are decades old, to fulfill the water demands of the agricultural, domestic, and industrial sectors. However, hydrological response and water availability in these dam catchments have either significantly changed or are expected to change under global warming. To effectively manage the water resources storage and water supply in the densely populated and agriculturally driven region, here, we assessed the changes in hydrological components and water availability in 5700 dams over India during the observed (1951-2022) and future warming climate (2031-2065: mid period; 2066-2100; end period). Using the Variable Infiltration Capacity (VIC) model, we simulated water budget components across the Indian Subcontinent during both the observed period and the future period to evaluate alterations in hydrological response and water availability. Our results showed that runoff-induced water availability has increased significantly in the Sabarmati, Pennar, Cauvery, and South Coast River basins, and decreased in the Ganga and Brahmaputra River basins, during the observed period. Moreover, we found that the majority of Indian dam catchments (except those in the Ganga and Brahmaputra River Basins) experienced a significant increase in monsoon precipitation and total runoff over the past three decades (1986-2022). Based on future analysis, we also found that nearly half of the dam catchments in the end period under SSP5-8.5 experienced around a 25% increase in monsoon precipitation and total runoff, which affects the reservoir operation and dam functionality in a future warming climate.

How to cite: Tiwari, M. and Aadhar, S.: Altered Hydrological Response and Water Availability of Indian Dams under Observed and Changing Climate, EGU General Assembly 2026, Vienna, Austria, 3–8 May 2026, EGU26-1096, https://doi.org/10.5194/egusphere-egu26-1096, 2026.

EGU26-1771 | ECS | Posters on site | HS2.4.11

Differentiating Surface and Subsurface Runoff Elasticity to Climate and Landscape Changes Using a Modified Budyko Framework 

Girum Getachew Demeke, Jr-Chuan Huang, and Yi-Ying Chen

Abstract

Understanding the significant influence of climate and landscape changes is essential for managing water resources; however, the individual effects of climate and landscape on surface and subsurface runoff are not well understood. In this study, we quantified the contributions of precipitation (P), potential evapotranspiration (PET), and landscape parameter (n) changes to the elasticity of surface and subsurface runoff using a modified Budyko Framework (e.g., Choudhury–Yang equation) across six Ethiopian sub-basins. Trend and breakpoint analyses (Mann–Kendall and Pettitt tests) divided the long-term runoff data (1964–2023) into two distinct periods for attribution. We examined runoff elasticity, as the percentage change in mean annual runoff for a given percentage change in P, PET, and n. The results revealed that, on average, P decreased by 1.33 mm/year, and PET increased by 1.72 mm/year, resulting in a decline in the long-term total, surface, and subsurface runoff by 19.7 mm, 7.6 mm, and 12.4 mm, respectively, between the two periods.  Crucially, the runoff components exhibited distinct hydrological responses; surface runoff elasticity was primarily governed by change in P (49.3%), followed by PET (26.2%) and n (24.5%), emphasizing its dominant link to water availability, particularly in arid sub-basins. The subsurface runoff elasticity showed greater sensitivity to landscape change and energy balance, being predominantly influenced by change in PET (33.6%) and n (39.7%). Large positive deviations in n (n2-n1) rapidly shift runoff sensitivity from climate control to landscape domination. Overall, climate forcing (changes in P and PET) accounted for 66.7% of the runoff elasticity, confirming its primary role. These findings provide fundamental new insights into catchment partitioning behaviors, mandating that water management strategies adopt a component-specific approach tailored to the differential elasticities of surface and subsurface flow systems in complex catchments.

Keywords

Budyko framework, Climate change, landscape parameter, Runoff components, Runoff elasticity

How to cite: Demeke, G. G., Huang, J.-C., and Chen, Y.-Y.: Differentiating Surface and Subsurface Runoff Elasticity to Climate and Landscape Changes Using a Modified Budyko Framework, EGU General Assembly 2026, Vienna, Austria, 3–8 May 2026, EGU26-1771, https://doi.org/10.5194/egusphere-egu26-1771, 2026.

EGU26-3328 | Orals | HS2.4.11

Variability of the hydrological regime in Irish Rivers under Climate Change 

Fiachra O'Loughlin and Salman Khan

Climate change is altering the hydrological cycle, with implications for riverine ecosystems that are expected to vary over space and time. This study assesses projected changes in streamflow regimes for 27 Irish rivers across three future periods (2006–2035, 2036–2065, and 2066–2095) relative to a baseline period (1976–2005). Changes in hydrological behaviour are quantified using seven flow regime metrics that represent the magnitude, variability, frequency, and duration of the flow. These metrics include the 5th percentile daily streamflow (Q5), 99th percentile daily streamflow (Q99), maximum monthly mean streamflow (MaxMonthQ), Richards–Baker Flashiness Index (RBI), interdecile range ratio (QmaxIDR), low-flow event duration (LowDur), and the number of high-flow events (HighNum), capturing changes in both low- and high-flow conditions. The metrics are derived from daily streamflow simulated using the SMART model driven by five regional climate models under both RCP4.5 and RCP8.5 scenarios.

The results, based on the ensemble median, indicate a consistent decline in low flow magnitude across all catchments and periods, with larger reductions under RCP8.5. In contrast, LowDur exhibits both increases and decreases depending on catchment and period relative to the baseline. High-flow magnitude increases at all but two stations, while changes in the frequency of high-flow events (HighNum) are mixed across periods and catchments. MaxMonthQ shows an overall increasing trend. QmaxIDR increases across most rivers indicating greater flow variability. The result show a widespread moderate increase in RBI, suggesting a progressively flashier flow regimes across Irish rivers under future climate scenarios. These findings help identify rivers and future periods that are the most vulnerable to alternation of the hydrological, highlighting the increased risks of both drying and flooding and their potential effects on aquatic ecosystems under climate change.

How to cite: O'Loughlin, F. and Khan, S.: Variability of the hydrological regime in Irish Rivers under Climate Change, EGU General Assembly 2026, Vienna, Austria, 3–8 May 2026, EGU26-3328, https://doi.org/10.5194/egusphere-egu26-3328, 2026.

EGU26-3386 | Posters on site | HS2.4.11

Understanding the occurrence of zero-flow stream gauge observations in Slovakia 

Katarina Jeneiova, Katarina Melova, Zuzana Danacova, and Lubica Lovasova

The case study in Slovakia was based on mean daily discharge records in catchments smaller than 50 km². The objective was to quantify the occurrence, duration, and temporal patterns of zero-flow conditions and to assess their relevance for water management and ecological resilience. An analysis of temporal clustering showed, that zero-flow events often occurred in multi-day episodes. Seasonal analysis indicated that August, September, and October were the months with the highest occurrence of zero-flows. The occurrence of zero-flow events across multiple years implies, that they may become more frequent in the future, as a result of climate change. The study underscores the importance of maintaining long-term hydrological monitoring networks, as such datasets are essential for understanding hydrological processes, evaluating their impacts and development of adaptation strategies.

How to cite: Jeneiova, K., Melova, K., Danacova, Z., and Lovasova, L.: Understanding the occurrence of zero-flow stream gauge observations in Slovakia, EGU General Assembly 2026, Vienna, Austria, 3–8 May 2026, EGU26-3386, https://doi.org/10.5194/egusphere-egu26-3386, 2026.

EGU26-5105 | ECS | Posters on site | HS2.4.11

Quantifying Temporal Shifts in Catchment Water Storage Using a Time-Varying Budyko Framework in Taiwan 

Yu-Cheng Chen, Tsung-Yu Lee, and Shin-En Chen

   As the impacts of climate change intensify and water demand continues to increase, assessing future water resources has become an important issue. In Taiwan, the precipitation–runoff relationship exhibits a decoupled behavior. Although annual precipitation has increased in most catchments, the corresponding increase in runoff has been smaller than expected or has even declined.

  A parametric Budyko framework was employed to quantify the temporal evolution of 54 catchments across Taiwan in Budyko space from 1970 to the present. The results indicate that Budyko curves constructed using 11-year moving windows provide a robust representation of long-term catchment water balance behavior. Moreover, the catchment landscape parameter (m value) shows an increasing trend over time in most Taiwan’s catchments, implying a gradual enhancement of catchment water storage capacity. This finding suggests that assuming a fixed m value for future runoff may lead to overestimation.

  To better understand the drivers of changes in m, this study explores the relationships between variations in m and changes in soil moisture, land use, groundwater levels, and streamflow. By capturing the temporal dynamics of the catchment landscape, this approach aims to improve the robustness of future water resource assessments based on the Budyko framework.

How to cite: Chen, Y.-C., Lee, T.-Y., and Chen, S.-E.: Quantifying Temporal Shifts in Catchment Water Storage Using a Time-Varying Budyko Framework in Taiwan, EGU General Assembly 2026, Vienna, Austria, 3–8 May 2026, EGU26-5105, https://doi.org/10.5194/egusphere-egu26-5105, 2026.

EGU26-6662 | Orals | HS2.4.11

Climate change projections with the National Hydrological Model of Denmark reveal an intensified seasonality of the hydrological cycle 

Raphael Schneider, Simon Stisen, Lars Troldborg, and Ida Karlsson Seidenfaden

Climate change is expected to substantially alter the hydrological cycle in temperate regions. Denmark, where groundwater and surface water are tightly coupled, provides an ideal test case to investigate the propagation of climate change signals through the hydrological system, due to good data availability and an existing well-established national-scale hydrological model. The Danish National Hydrological Model (DK-model) is a physically based, distributed model that has previously been shown to reproduce the observed propagation of drought and hydrological anomalies throughout the hydrological cycle.

Here, we analyse the climate change impact on the Danish hydrology, as simulated by the DK-model forced by an ensemble of 17 downscaled and bias-corrected climate models (RCP8.5) until the end of the 21st century. The climate projections indicate an increase in net precipitation at the annual scale, driven primarily by wetter winters, while summers experience increased net precipitation deficits. The resulting climate change signals across the hydrological cycle are assessed using both absolute values and standardized indices for soil moisture, streamflow, and shallow and deep groundwater.

Model results show that increased net precipitation and increased seasonality are translated into different hydrological responses. Fast reacting, surface-near compartments (soil moisture) shift towards drier conditions during summer and wetter conditions during winter. In contrast, deep groundwater shows a consistent rise across all seasons, reflecting the overall increase in precipitation. Shallow groundwater and streamflow show intermediate behaviour dominated by large increases in winter and a mixed signal for summer. Despite these differences, all compartments experience an increase in seasonality, expressed as larger amplitudes between annual minimum and maximum states. Notably, climate models show stronger agreement on increasing seasonality than on the direction of absolute changes.

Moreover, the increased seasonality is also reflected in the hydrological drought indices which indicate increased soil moisture droughts during summer and, at the same time, an increase in wet anomalies during winter. The development of streamflow and groundwater droughts is more complex due to the partial buffering of drier summers by wetter winters. Yet, results clearly indicate a similar trend towards increased seasonality. Overall, the results demonstrate that, despite significant precipitation increases, climate change in Denmark is projected to amplify seasonal extremes rather than uniformly shift hydrological states towards wetter conditions, with important implications for water resources management, agriculture, ecosystems, and infrastructure.

How to cite: Schneider, R., Stisen, S., Troldborg, L., and Seidenfaden, I. K.: Climate change projections with the National Hydrological Model of Denmark reveal an intensified seasonality of the hydrological cycle, EGU General Assembly 2026, Vienna, Austria, 3–8 May 2026, EGU26-6662, https://doi.org/10.5194/egusphere-egu26-6662, 2026.

EGU26-7481 | ECS | Posters on site | HS2.4.11

Assessing climate-driven changes in crop water demand using CMIP6 data: implications for water management and decision making 

Eugenio Straffelini, Aurora Ghirardelli, Eros Borsato, Daniele Mirolo, and Paolo Tarolli

Climate change is affecting water availability and irrigation management in agricultural systems, particularly where climatic pressures interact with technical and regulatory constraints. This study presents a case study developed through collaboration between academic research and local water management authorities, specifically the Piave land reclamation consortium (Consorzio di Bonifica Piave, northeastern Italy). This study investigates how projected climatic changes may impact hydrological conditions and crop water availability within a complex socio-ecological system. We used climate projections (CMIP6; CMCC-ESM2 model; SSP5-8.5 scenario) to assess changes in temperature, precipitation, potential evapotranspiration, and aridity indicators. These variables were combined with crop-specific coefficients to estimate irrigation water requirements for the main crops cultivated (maize, soybean, wheat, alfalfa, and vineyard) under near-term (2021–2040) and future (2041–2060) climate scenarios. The analysis focuses on relative changes in irrigation demand and their implications for water management. Results indicate a systematic increase in irrigation demand per unit area across all analysed crops. Projected changes show relative increases in specific irrigation requirements of 10–15% for arable crops and over 20% for forage crops, while key crops for the area such as grapevine, historically characterised by very low irrigation requirements (or no irrigation), exhibit the highest relative increases. These trends are mainly driven by increased evaporation rather than changes in total precipitation, leading to a growing imbalance between water demand and effective water availability during the irrigation season. Climatic pressures are also aggravated by technical and regulatory constraints, such as environmental flow requirements defined under historical hydrological conditions, which reduce operational flexibility during drought periods. Despite uncertainties inherent in climate and hydrological modelling, the proposed approach provides a bottom-up framework for informed decision making. The methodology is also transferable to specific sub-areas of the consortium, supporting targeted planning and project design aimed at enhancing irrigation resilience under future climate conditions.

How to cite: Straffelini, E., Ghirardelli, A., Borsato, E., Mirolo, D., and Tarolli, P.: Assessing climate-driven changes in crop water demand using CMIP6 data: implications for water management and decision making, EGU General Assembly 2026, Vienna, Austria, 3–8 May 2026, EGU26-7481, https://doi.org/10.5194/egusphere-egu26-7481, 2026.

EGU26-9764 | ECS | Posters on site | HS2.4.11

Active subsurface storage as a resilience factor of Luxembourgish catchments under a changing climate 

Samuel Courtois, Davide Zoccatelli, Christian Vincenot, and Laurent Pfister

The Budyko framework is widely used in hydrology to describe how long-term catchment behaviour is constrained by the balance between annual precipitation (the water budget) and the evapotranspiration capacity (the energy budget). These two factors jointly determine a catchment’s position on the Budyko diagram. Under a stationary climate, this position is expected to fluctuate around an equilibrium state; under climate warming, this equilibrium may shift.

Combining experimental and operational stream gauge networks with remote-sensing products, we analyse the positions of 61 catchments in Luxembourg on the Budyko diagram over the period 1995–2025. Owing to its relatively homogeneous climate, Luxembourg provides a particularly suitable case study for isolating the influence of non-climatic controls on these positions, such as geology and its underlying contribution to storage capacity.

Our results show that departures from the Budyko curve are explained by differences in active catchment storage, which are closely linked to geologic variations. Catchments with higher active storage capacities tend to plot above the Budyko curve, remain closer to an energy-limited regime, and are therefore less exposed to drying. This analysis highlights the role of catchment geology, and more specifically its capacity to store and release water over multiple years, as a key resilience factor of the water cycle under a warming and increasingly arid climate.

How to cite: Courtois, S., Zoccatelli, D., Vincenot, C., and Pfister, L.: Active subsurface storage as a resilience factor of Luxembourgish catchments under a changing climate, EGU General Assembly 2026, Vienna, Austria, 3–8 May 2026, EGU26-9764, https://doi.org/10.5194/egusphere-egu26-9764, 2026.

Evapotranspiration (ET ) in irrigation districts is a key proxy of actual water consumption, reflecting the shifting agricultural water demand under the combined pressures of climate change and human activities. Accurate attribution of ET variations is essential for sustainable agricultural water management but remains challenging due to the complex interplay of hydrological drivers. The Budyko framework provides a physically-based approach to partition these influences. However, the traditional Budyko framework is not applicable the irrigation area.

In this study, we used an extended Fu’s formula within the Budyko framework to explicitly incorporate the impacts of irrigation activities on the water-energy balance. We defined "equivalent precipitation" (Pe) —the sum of irrigation water ( I ) , precipitation (P ) , and groundwater evaporation (𝐸𝑇gw ) , as the water availability. This framework was applied to 364 large irrigation districts across China to quantify ET from 2010 to 2017 and evaluate the extended Budyko framework’s applicability at the irrigation district scale.Then, we calculate the elasticity coefficients for IPPe、ω (the optimal values of Budyko parameter)potential evaporation (ETo) to quantify the sensitivity of ET to each forcing factor of ET change via a dimensionless elasticity-based attribution method.

Our results indicate that:

  • (1) Framework Applicability: We found that the extended Budyko framework demonstrates good applicability in irrigation districts. Compared with the ET results from water balance calculations and the results from the MOD16A3 dataset, the relative error of annual evapotranspiration was less than 10% in 87.91% (320 samples) of the irrigated areas, and the root mean square error was less than 60 mm in 80.77% of the irrigated areas (294 sample points). The calculation error was smallest in the humid region.
  • (2) Parameter ω’s distribution: The optimal values of Budyko parameter w in the extended Fu’s formula exhibit significant regional distribution characteristics, showing a pattern different from that of natural watersheds. The more humid the irrigated area, the larger the value of w in the fitted equation, reflecting the impact of human irrigation activities on hydrological conditions.
  • (3) Attribution Analysis: In arid and semi-arid regions, evapotranspiration is jointly limited by water and energy, exhibiting the highest sensitivity to parameter ω, with elasticity coefficients of 3.073 and 1.879, respectively. This is followed by sensitivity to energy, with elasticity coefficients of 0.754 and 0.413, and then sensitivity to irrigation, with elasticity coefficients of 0.709 and 0.239, respectively. As the climate becomes wetter, the system transitions to an energy-limited state; therefore, ET becomes more sensitive to ETo, while its sensitivity to ω and irrigation significantly decreases. In humid regions, the elasticity coefficient to irrigation is only 0.091, to potential evapotranspiration is 0.752, and to ω is 0.722.

How to cite: Li, M. and Huo, Z.: Attribution of Evapotranspiration Variations in 364 Large Irrigation Districts across China: Quantifying the effects of irrigation via an extended Budyko Framework, EGU General Assembly 2026, Vienna, Austria, 3–8 May 2026, EGU26-11862, https://doi.org/10.5194/egusphere-egu26-11862, 2026.

EGU26-11924 | ECS | Orals | HS2.4.11

Combining climate, land use and water use scenarios to project possible futures of a meso-scale Mediterranean catchment 

Nico Hachgenei, Inès Créti, Flora Branger, Nicolas Robinet, Guillaume Nord, Marina Coquery, Nathan Pellerin, and Pauline Dusseux

Hydrological extremes (floods and low flows) are an important societal issue in Mediterranean areas. Dry summers limit the available water resource, while flash floods cause material and human damage. Both extremes are expected to intensify under future climate. There are strong links between changes in the water cycle and changes in human activity in both directions: on the one hand, limitations of water resources constrain societies to adapt their activities and, on the other hand, changes in human activity can further change the pressure on water resources.

It is therefore essential to anticipate how territories should adapt and transform their land uses in response to increasing pressures on water resources. We uniquely combine land use and land cover (LULC) scenarios co-constructed with local stakeholders, hourly climate projections and a spatially distributed hydrological model in order to evaluate the impact of management choices on hydrological variables and the societal implications of these changes.

An interdisciplinary prospective study at 2050 horizon was conducted in the Mediterranean Claduègne catchment (43 km²; Ardèche, France), characterized by rural mixed land use (extensive agriculture, forests, small towns and tourism). This study was based on surveys with 16 key local stakeholders (farmers, elected officials, planners, residents, etc.). Semi-structured interviews and focus groups were used to identify past and current drivers of change, and to explore plausible futures. Three contrasting scenarios were established. These LULC scenarios contain modeled future land cover maps, as well as descriptions of changes in agricultural practices and water management strategies.

The scenarios were fed into a hydrological model along with two contrasting climatic projections, in order to establish six potential future pathways for the middle of the century. We used the spatially distributed process-based hydrological model J2000P at hourly resolution. Besides natural hydrology, the model represents human activity, such as irrigation, livestock farming, and drinking and waste water fluxes, as well as specific water resource management strategies like hillslope reservoirs and external water importations.

We assessed the territorial impact of the three LULC scenarios under climate change, on low flows and contributions of the main hydrological components (overland flow and groundwater). We discuss the capacity of each scenario to sustain diversified agricultural activities with or without external water input to the catchment, and the ability to supply the catchment with drinking water, particularly during critical periods.

The climatic conditions determined the future change of high flow extremes and groundwater contributions, while both climate and LULC significantly impacted low flow extremes, overland flow contribution and the streamflow during the driest period of the year. The capability to sustain agricultural activity in the future depends on additional solutions such as hillslope reservoirs. The extent of this dependency varies across LULC scenarios and climate projections. Additional water importations may be needed some summers in order to sustain drinking water supply for the population. However, these additional solutions rely on management choices that raise economic issues, dependency on infrastructure, and questions of social acceptability.

How to cite: Hachgenei, N., Créti, I., Branger, F., Robinet, N., Nord, G., Coquery, M., Pellerin, N., and Dusseux, P.: Combining climate, land use and water use scenarios to project possible futures of a meso-scale Mediterranean catchment, EGU General Assembly 2026, Vienna, Austria, 3–8 May 2026, EGU26-11924, https://doi.org/10.5194/egusphere-egu26-11924, 2026.

EGU26-15748 | Posters on site | HS2.4.11

Spatiotemporal Evolution of Flow Decline and Water Consumption in a Highly Regulated Transboundary River: The Lower Rio Grande/Bravo 

Ana Casillas, Tian Dong, Haiqing Xu, Jude Benavides, and Sylvia Dee

Long-term flow variability in transboundary rivers reflects the combined influence of water availability, management, and usage across space and time. However, integrating historical flow with evolving water-use data remains challenging, as assessments are often conducted within national frameworks despite shared watersheds among at least two nations. Moreover, water discharge and usage data are often fragmented across multiple sources. This study presents a 125-year discharge record (1900–2025) from historical Water Bulletins and modern observations at 12 internationally operated gauging stations, delivering a spatiotemporal assessment of long-term flow evolution and water-budget components in the Lower Rio Grande/Bravo (LRG). Extending from below Falcon Dam Reservoir to the Gulf (~460 river km), the LRG is regulated between the U.S. and Mexico by three major dams (Falcon, Anzaldúas, and Retamal) and eight weirs below Anzaldúas. Supplying ~98% of regional water consumption for more than 2.8 million people at a binational scale, the river has been altered by anthropogenic activities since the late 1800s, with agricultural irrigation accounting for ~85% of current annual withdrawals. To address data discontinuities, flow records were evaluated using four representative 16-year hydrological regimes—natural (1900–1915), pre-dam (1935–1950), post-dam (1974–1989), and modern (2010–2025) —analyzed in conjunction with modern binational usage records across major water sectors (agricultural, municipal, and other uses). Below Falcon Dam, median annual inflow declined by ~64% in the last 125 years, while downstream outflow decreased by ~96%, resulting in a near 100% modern Gulf-delivery deficit relative to natural conditions (i.e., no freshwater delivery to the Gulf from the median basis). While binational water use is dominated by irrigation (~58% U.S., ~26% Mexico), downstream losses exceed what can be attributed to irrigation alone. Findings show upstream delivery reduction as the primary driver of long-term decline, accounting for 54.7% [31.8–91.4%] of total flow reduction relative to natural conditions, while binational water use represents a substantial but secondary contribution, accounting for 33.5% [30.5–43.8%], and unknown losses (e.g., evapotranspiration) follow with minor impacts. Insights from this work aim to inform sustainable, binational water management under increasing urban, agricultural, and climatic pressures across transboundary river systems.

How to cite: Casillas, A., Dong, T., Xu, H., Benavides, J., and Dee, S.: Spatiotemporal Evolution of Flow Decline and Water Consumption in a Highly Regulated Transboundary River: The Lower Rio Grande/Bravo, EGU General Assembly 2026, Vienna, Austria, 3–8 May 2026, EGU26-15748, https://doi.org/10.5194/egusphere-egu26-15748, 2026.

EGU26-16814 | Posters on site | HS2.4.11

A new scenario free procedure to determine flood peak changes in the Harz Mountainsin response to climate change projections 

Frido Reinstorf, Marcus Beylich, and Uwe Haberlandt

A new scenario free method for determining changes of flood peaks considering climate change is developed. Compared to existing methods, it accounts for heavy rainfall changes by a newly developed factor with two seasons and establishes a numerical relationship to a greater number of relevant climate predictors. For easier application, it is based on frequently available daily measurements. A functional test of the factor for heavy rainfall changes and its adjustment algorithm for the precipitation time series is performed. Using a regional AR5 ensemble, for the first time the error and the uncertainty of a new scenario free method are estimated and compared with an existing method. The new method is applied in the Harz Mountains, where the sensitivity of the region to different climate predictors is investigated.

The adjusting algorithm for precipitation is able to adjust the time series while maintaining mass balance. The new method has a lower error than the reference method, with better matches of changes in the median of the climate ensemble as well as the most ensemble members. In general, the uncertainty of the seasonal results is below the climate uncertainty of the AR5 ensemble. Regarding future flood peaks, the regional catchments are most sensitive to mean precipitation changes, followed by heavy rainfall changes especially in the winter season. Mean temperature changes are of minor significance, but the catchments characteristics are important. The new method can be recommended for assessments of climate change impacts on floods in low to average mountain regions in Germany and Europe.

How to cite: Reinstorf, F., Beylich, M., and Haberlandt, U.: A new scenario free procedure to determine flood peak changes in the Harz Mountainsin response to climate change projections, EGU General Assembly 2026, Vienna, Austria, 3–8 May 2026, EGU26-16814, https://doi.org/10.5194/egusphere-egu26-16814, 2026.

EGU26-17044 | ECS | Orals | HS2.4.11

How do droughts influence catchment response and flood dynamics? 

Alessia Matano, Anne van Loon, Manuela Irene Brunner, and Wouter Berghuijs

Droughts can substantially alter catchment hydrological behaviour by modifying  vegetation productivity and composition, soil hydraulic properties, surface water-groundwater interactions, and water storage. These changes can persist beyond the drought period, shaping catchment response to precipitation and subsequent flood dynamics. Yet, the influence of drought characteristics on catchment response remains unclear.

Here, we present a global-scale analysis of drought influence on catchment response to precipitation, using long-term satellite and in-situ observations from thousands of catchments worldwide. By employing multivariate statistical analysis, our analysis shows that drought events generally lead to significantly lower streamflow than expected from the historical norm. While arid and semi-arid regions show lower resilience to drought-induced changes in the streamflow-precipitation relationship, wet catchments, such as those in snow-influenced climates, show greater resilience due to their water-buffering mechanisms. In catchments with non-stationary streamflow-precipitation relationships, severe and prolonged droughts can lead to both positive and negative shifts in catchment response. These shifts can have implications for subsequent flood severity and flood timing.

Overall, our findings highlight the importance of accounting for drought characteristics and regional hydroclimatic differences when assessing catchment responses to precipitation and flood risk under and following drought conditions.

How to cite: Matano, A., van Loon, A., Irene Brunner, M., and Berghuijs, W.: How do droughts influence catchment response and flood dynamics?, EGU General Assembly 2026, Vienna, Austria, 3–8 May 2026, EGU26-17044, https://doi.org/10.5194/egusphere-egu26-17044, 2026.

The choice of potential evapotranspiration (PET) methods in hydrological modelling can result in contrasting estimates of meteorological drought and low flows in the context of climate change, but their effects on other drought types and the associated hydrological components are still unknown. This study aims to systematically assess the effects of a temperature-based (T-based) method and a Penman-Monteith (PM) method on 1) historical hydrological simulations, and 2) projected changes in hydrological components, meteorological, agricultural and hydrological droughts under climate scenarios in mainland Norway. The distributed version of the hydrological model HBV with two PET methods was driven by six regional climate projections under three emission scenarios. The results show that the PET methods provide similar historical discharge simulations but different spatial distribution of hydrological components. The T-based method always estimates higher PET and evapotranspiration, lower soil moisture and runoff and longer severe droughts than the PM method under climate scenarios, especially in Eastern, Central and Northern Norway. The discrepancies of projected changes between the two PET methods generally increase linearly with temperature change. Among various drought types, agricultural drought projections are the most sensitive to the choice of PET method.

How to cite: Huang, S., Wong, W. K., Tveito, O. E., and Haddeland, I.: Impacts of empirical and physical evaporation methods on changes in hydrological components and drought indices under climate change scenarios, EGU General Assembly 2026, Vienna, Austria, 3–8 May 2026, EGU26-18815, https://doi.org/10.5194/egusphere-egu26-18815, 2026.

EGU26-19469 | ECS | Orals | HS2.4.11

Searching for extremes: A framework for decision-relevant stress tests using weather types 

Mason Durant, Chris Counsell, Fai Fung, and Robert Wilby

Climate change is expected to alter the frequency, duration, timing and severity of droughts. Traditional top-down approaches to assessing the performance of water supply systems under different climatic conditions can miss drought vulnerabilities, particularly where drought characteristics may be altered under climate change. Stress-tests under a bottom-up framework offer a way of identifying water supply system vulnerabilities to droughts more severe and extreme, and with different characteristics, to those experienced historically.

An inverse stochastic approach was developed to elicit weather type transitions that cause severe and extreme droughts for a water supply system in mid-west Wales, United Kingdom. Droughts are defined at the start of the process by the end-user, focussing on drought characteristics where consequences are decision-relevant. The inverse stochastic approach (using a Markov Chain stochastic model trained on historical synoptic weather types) then perturbs the likelihood of weather type transitions to produce the user-specified droughts.

The approach provides actionable insights for water managers by identifying water supply system vulnerabilities to different drought dynamics, as well as indicating how implausible the droughts would need to be in order to reach the targeted drought definitions. The impacts of climate change can be included by incorporating changes in weather types from validated climate models, using a range of methods from simple changes in future occurrence, to more complex stochastic models trained on future weather types.

How to cite: Durant, M., Counsell, C., Fung, F., and Wilby, R.: Searching for extremes: A framework for decision-relevant stress tests using weather types, EGU General Assembly 2026, Vienna, Austria, 3–8 May 2026, EGU26-19469, https://doi.org/10.5194/egusphere-egu26-19469, 2026.

The KliWES 3.0 project investigated the historical and future development of the water balance in Saxony under changing climatic conditions. The simulations covered the reanalysis period 1961–2020 as well as the future up to the year 2100 using 21 climate projections. A comprehensive hydrological modeling was carried out for the entire Free State of Saxony (≈22,200 km²), including the opencast mining areas of Lusatia. The water balance of this region is characterized by decades of lignite mining and the associated intensive groundwater management, which led to a cumulative regional deficit of approximately 4 billion m³ by 2020. By flooding of the former opencast mines and the gradual reduction of groundwater drainage a large-scale recovery of groundwater levels shell be achieved within the coming decades, despite the expected reduction in water availability due to climate change.

The state-wide water balance calculations for Saxony are based on the ArcEGMO model, which was improved by the integration of a floodplain approach. Furthermore, ERA5 land data were used to determine the potential grass reference evaporation. To evaluate the robustness of the model, a comparison between ArcEGMO, BROOK90, Raven 3, and Raven 4 was carried out in the catchment area of the Spree River in Saxony.

BROOK90 is a 1d site model, which was used as validation for actual evaporation due to its detailed description of vertical soil-plant-atmosphere processes. Raven is a modular, object-oriented open-source model that allows flexible combinations of different hydrological process modules – from precipitation-runoff concepts and various snowmelt models to a wide range of evapotranspiration and soil moisture approaches. It can replicate both conceptual and physically based model structures. The current version, Raven 4.1, offers significant enhancements over Raven 3, in particular an integrated optimization module based on a linear solver for water management. This allows operating rules, reservoir target specifications, and water management discharge rules to be embedded directly into the hydrological system model - a functionality that is highly relevant in the context of the Lusatian opencast mining landscape.

The results of the model comparison are examined with regard to structural differences, the sensitivity of the models to climatic changes, and the extent to which the choice of model influences the assessment of future water availability and runoff development. Particular focus is placed on the representation of anthropogenically modified systems in which management measures play a central role. The analysis demonstrates how model structure and process understanding shape the interpretation of future hydrological scenarios, and the resulting uncertainties for water management.

How to cite: Hauffe, C., Hünersen, H., and Schütze, N.: Comparative simulations of past and future water balances with the models ArcEGMO, BROOK90 and Raven in managed catchments – Does the model selection have an influence?, EGU General Assembly 2026, Vienna, Austria, 3–8 May 2026, EGU26-19499, https://doi.org/10.5194/egusphere-egu26-19499, 2026.

EGU26-20543 | ECS | Orals | HS2.4.11

The Impact of Model Parameter Calibration on Future Extreme Event Predictions in the Ganges Basin 

Supriya Tiwari, Ehsan Forootan, and Maike Schumacher

The increasing intensity and frequency of Extreme Hydrological Events (EHEs), such as floods and droughts, underscores the urgent need to understand how the water cycle is changing. To project what lies ahead, it is essential to investigate the past by identifying when, where, and how EHEs occur and how they shape current land–atmosphere interactions. Land surface models (LSMs) are widely used for this purpose, yet their accuracy is often limited by region-specific observations, structural simplifications, and challenges in model calibration. In many data-scarce regions, such as the Ganges River Basin, uncalibrated LSMs are frequently applied to reconstruct past hydrological conditions and to estimate potential future changes. However, the extent to which model calibration improves such projections remains poorly understood, particularly given strong spatial and seasonal variability.

In this study, we investigate how model calibration influences projections of EHEs using the Variable Infiltration Capacity (VIC) model. We compare three VIC model setups: an uncalibrated model to establish the baseline for our investigations; a single-site calibration against monthly in-situ streamflow observations at the basin outlet, Farakka; and a sequential multi-site calibration using available monthly in-situ streamflow observations at 12 stations across the basin to constrain basin-scale water balance, seasonal streamflow patterns, and interannual variability. The three model versions are then forced with precipitation and temperature from multiple Global Climate Models (GCMs) under different Shared Socioeconomic Pathway (SSP) scenarios. Historical simulations are used to define high- and low-flow thresholds and baseline variability, providing a reference for interpreting future projections. The resulting simulated streamflow is analyzed at monthly, seasonal, and annual scales to identify dominant drivers and regional contrasts, providing a basis for interpreting future changes relative to historical conditions.

The findings aim to support the development of hydrological monitoring frameworks with improved representation of regional- to large-scale processes, particularly in data-scarce basins, to strengthen disaster mitigation and climate risk assessment strategies.

How to cite: Tiwari, S., Forootan, E., and Schumacher, M.: The Impact of Model Parameter Calibration on Future Extreme Event Predictions in the Ganges Basin, EGU General Assembly 2026, Vienna, Austria, 3–8 May 2026, EGU26-20543, https://doi.org/10.5194/egusphere-egu26-20543, 2026.

EGU26-21087 | ECS | Posters on site | HS2.4.11

Assessing Water Availability and Drought Dynamics in the Po River District Using the GEOframe Modelling System - the Sesia River basin case 

Gaia Roati, Marco Brian, Hossein Salehi, Shima Azimi, Giuseppe Formetta, Daniele Andreis, John Mohd Wani, Andrea Farina, Francesco Tornatore, and Riccardo Rigon

The Po River Basin represents one of the most socio-economically and environmentally critical regions in Europe, supporting agriculture, hydropower production, ecosystems, and urban water supply. Its hydrological regime is strongly influenced by climate variability and change, particularly through alterations in snow accumulation and melt processes in Alpine headwaters. In this context, improving the quantification and forecasting of water availability is essential to support adaptive water management strategies.

For this reason, since 2021, a collaboration between the Po River Basin District Authority and the University of Trento has focused on the application of the GEOframe modelling system to the entire Po River District. The primary objective is to provide a spatially and temporally consistent assessment of water availability across the basin, supporting planning and decision-making activities of the Basin Authority under current and future climate conditions.

GEOframe is a fully open-source, semi-distributed, conceptual hydrological modelling system capable of simulating the complete water balance, including snow accumulation and melt, evapotranspiration, soil water dynamics, and river discharge. The model was implemented at daily temporal resolution and fine spatial scale across the Po River District, accounting for the region’s complex topography and pronounced climatic gradients. Model calibration was performed using an extensive set of hydrometeorological observations collected by regional and local authorities, primarily through the ARPA monitoring networks, enabling the integration of heterogeneous datasets and the representation of spatial variability across sub-catchments.

Following calibration, the modelling framework was applied to analyse drought periods during the 2010–2020 decade, focusing on the Sesia River catchment as a representative and particularly complex study area within the Po River District. The Sesia basin is indeed characterised by a strong altitudinal gradient, significant Alpine headwaters with glacierised areas, and highly anthropised lowland sectors, making it especially sensitive to both climatic variability and human water use pressures. This complexity provides a robust test case for evaluating model performance across contrasting hydrological regimes.

The analysis focused on the response of the main hydrological components during drought conditions, with particular emphasis on snow-related processes, given their critical role in regulating seasonal water availability. Simulated snow water equivalent (SWE) data were compared against the SWE dataset by Dall’Amico et al., enabling a more precise evaluation of the snow component in the water balance.

Results highlight the strong influence of reduced snow accumulation and earlier snowmelt on water availability during drought conditions, particularly in Alpine subcatchments, with cascading effects on downstream flows in more heavily anthropized areas. The comparison with the reference SWE dataset confirms the ability of GEOframe to reproduce both interannual variability and spatial patterns of snow storage, while also revealing key sensitivities relevant for drought monitoring and seasonal forecasting.

Overall, this study demonstrates the suitability of the open-source GEOframe modelling system not only for detailed basin-scale analyses, but also for consistent, large-scale applications across the entire Po River District. The results provide actionable insights for water management authorities, supporting improved drought preparedness, strategic planning, and adaptive water management under current and future climate variability.

How to cite: Roati, G., Brian, M., Salehi, H., Azimi, S., Formetta, G., Andreis, D., Wani, J. M., Farina, A., Tornatore, F., and Rigon, R.: Assessing Water Availability and Drought Dynamics in the Po River District Using the GEOframe Modelling System - the Sesia River basin case, EGU General Assembly 2026, Vienna, Austria, 3–8 May 2026, EGU26-21087, https://doi.org/10.5194/egusphere-egu26-21087, 2026.

EGU26-274 | ECS | Orals | HS2.4.12

Projecting Summer Hydroclimate Extremes in Central Europe from Winter NAO 

Cong Jiang, Chris Soulsby, Hjalmar Laudon, Songjun Wu, and Doerthe Tetzlaff

Summer droughts have become more frequent and severe in Central Europe, threatening water security and ecosystem resilience. In this study, we examine the link between large-scale climate variability, particularly the winter North Atlantic Oscillation (NAO), and summer hydroclimate and drought propagation across the region. We combine teleconnection diagnostics, reanalysis data, and a process-based, isotope-enabled ecohydrological model to assess how winter NAO variability influences summer droughts and their propagation through the Soil–Plant–Atmosphere Continuum (SPAC) within a representative lowland catchment in the North European Plain. Positive NAO phases in winter are associated with reduced summer precipitation and sustained deficits in soil moisture, streamflow and groundwater, indicating hydrological responses with a lag of up to ten months. We also found that winter precipitation has become less sensitive to NAO variability, while summer droughts are now more strongly linked to preceding positive winter NAO phases, likely reflecting climate-driven changes in atmospheric circulation. Integrating large-scale atmospheric variability with local ecohydrological processes sheds new light on how internal climate modes modulate drought propagation and provides new opportunities to improve seasonal drought prediction and adaptive water-resource planning in Europe’s drought-sensitive landscapes.

How to cite: Jiang, C., Soulsby, C., Laudon, H., Wu, S., and Tetzlaff, D.: Projecting Summer Hydroclimate Extremes in Central Europe from Winter NAO, EGU General Assembly 2026, Vienna, Austria, 3–8 May 2026, EGU26-274, https://doi.org/10.5194/egusphere-egu26-274, 2026.

EGU26-1750 | ECS | Orals | HS2.4.12

Non-stationary low-flow frequency analysis with mixed Weibull components and Copula-based dependence framework 

Farhana Sweeta Fitriana, Svenja Fischer, Gabriele Weigelhofer, Johannes Laimighofer, and Gregor Laaha

Abstract

Extreme low flow is a defining aspect of river regimes, posing significant risks to water management through reduced water availability and deteriorating water quality. Reliable estimates of design low flows for given non-exceedance probabilities are therefore essential. Traditional low-flow frequency analysis assumes independent and identically distributed (i.i.d.) data, an assumption increasingly violated under climate change and by distinct summer-winter generation processes. In snow-influenced climates, annual low flows can arise from events in both seasons with potential seasonal dependence, that challenges conventional models. This study extends traditional low-flow frequency analysis to non-stationary conditions by jointly accounting for temporal trends, process heterogeneity, and seasonal dependence. Building on the mixed distribution and mixed copula frameworks of Laaha (2023a, 2023b), the approach is extended to non-stationary conditions using the three-parameter Weibull distribution, allowing the seasonal low-flow distributions to change over time. The resulting models are evaluated across the European Reference Observatory of Basins for INternational hydrological climate change detection (ROBIN) dataset. Results indicate that neglecting non-stationarity when present can misrepresent low-flow severity, particularly for longer return periods. By preserving the conceptual consistency of the previous stationary modelling framework, the proposed non-stationary framework improves the statistical description of extreme low-flow events and provides an enhanced basis for low-flow frequency analysis, offering new insights into past and current low-flow behaviour under climate change.

Keywords: Non-stationary frequency analysis, low flow, drought, climate change, seasonality

Reference

Laaha, G. (2023a). A mixed distribution approach for low-flow frequency analysis – Part 1: Concept, performance, and effect of seasonality. Hydrol. Earth Syst. Sci., 27(3), 689-701. https://doi.org/10.5194/hess-27-689-2023

Laaha, G. (2023b). A mixed distribution approach for low-flow frequency analysis – Part 2: Comparative assessment of a mixed probability vs. copula-based dependence framework. Hydrol. Earth Syst. Sci., 27(10), 2019-2034. https://doi.org/10.5194/hess-27-2019-2023


How to cite: Fitriana, F. S., Fischer, S., Weigelhofer, G., Laimighofer, J., and Laaha, G.: Non-stationary low-flow frequency analysis with mixed Weibull components and Copula-based dependence framework, EGU General Assembly 2026, Vienna, Austria, 3–8 May 2026, EGU26-1750, https://doi.org/10.5194/egusphere-egu26-1750, 2026.

EGU26-2955 | Posters on site | HS2.4.12

Verification of simplified flash flood inundation modeling using Scalgo Live and the SWMM model 

Beniamin Więzik and Andrzej Wałęga

The increasing frequency of short-duration, high-intensity rainfall events enhances the risk of flash floods, particularly in urbanised and low-lying areas where drainage systems are heavily loaded. In response to the need for rapid hazard assessment, simplified modeling tools are increasingly applied to provide fast estimates of flood inundation. The aim of this study is to verify whether simplified flash flood modeling performed using the Scalgo Live environment can be considered a reliable tool for preliminary flood risk analysis.

The analyses were conducted for a low-lying catchment located in southern Poland, characterized by a complex drainage system consisting of open channels and melioration ditches. Simulations were performed for intense short-duration rainfall scenarios with a probability of occurrence of p = 1%, as well as for variants including the implementation of a retention basin. Results obtained with Scalgo Live were subsequently verified using the hydrodynamic SWMM model.

The results indicate a significant increase in inundation extent and water volume with increasing rainfall duration. The flooded area increased from approximately 4.5 ha for a 15-minute rainfall event to more than 15 ha for a 24-hour event, while the volume of stagnant water rose from about 9.6 × 10³ m³ to over 4.2 × 10⁴ m³. The largest inundation extent was observed for the 24-hour rainfall scenario . Scalgo Live enabled a clear identification of critical sections of the drainage system where hydraulic capacity was exceeded. Comparison with the SWMM model showed good agreement in the location of inundated areas and hydraulic overloads. The implementation of a retention basin resulted in a clear reduction of inundation extent. The results confirm that Scalgo Live is a useful tool for rapid, preliminary flash flood risk assessments.

How to cite: Więzik, B. and Wałęga, A.: Verification of simplified flash flood inundation modeling using Scalgo Live and the SWMM model, EGU General Assembly 2026, Vienna, Austria, 3–8 May 2026, EGU26-2955, https://doi.org/10.5194/egusphere-egu26-2955, 2026.

EGU26-3469 | Posters on site | HS2.4.12

Climate Extremes over the Brazilian Caatinga Based on Performance-Based Projections from Selected NEX-GDDP-CMIP6 Models 

Cristiano Prestrelo de Oliveira, Pedro Rodrigues Mutti, Eduardo Nunes Cho-Luck, Marina Siqueira, Giovanninni Batista, Rayane Ferreira Costa, Maria Leidinice da Silva, Felipe Jeferson de Medeiros, and Wendy Lu Aramayo Alonso

The Caatinga biome, located in northeastern Brazil, is a semi-arid region highly exposed to hydroclimatic variability, recurrent droughts, and increasing thermal stress. As the driest and socioeconomically most vulnerable region of the country, robust assessments of climate extremes are essential to support adaptation and resilience planning. This study investigates historical climate extremes and future projections over the Caatinga using a performance-based subset of three bias-corrected global climate models from the NEX-GDDP-CMIP6 dataset: CESM2, TaiESM1, and MRI-ESM2-0.

The historical evaluation covers the period 1981-2014 and is based on gridded observations and reanalysis data. ERA5 exhibits good agreement with observations for percentile-based temperature indices (TN10p, TN90p, TX10p, TX90p) and the Warm Spell Duration Index (WSDI). However, large Percent Bias values (>80%) are identified over the São Francisco River Basin, indicating regional discrepancies. For precipitation extremes, the R20mm frequency index reveals dominant drying trends in the same basin, highlighting a regional hotspot of hydroclimatic stress.

Observed extremes show a clear intensification of hot events, while increasing consecutive dry days (CDD) exacerbate drought impacts across the Northeast. The northern Caatinga and the central-southeastern sector associated with the São Francisco Basin exhibit consistent drying signals, despite an increase in the frequency of extreme precipitation events since the 1980s. In contrast, coastal areas show a reduction in the frequency of hot days, alongside a general decline in annual precipitation totals and extreme rainfall frequency across most of the Caatinga.

Future projections are analyzed for near-term (2021-2040), mid-term (2041-2060), and long-term (2081-2100) periods, indicating a substantial reduction in total precipitation and an intensification of compound heat-dryness extremes. These changes pose severe risks to water availability, ecosystem stability, and human livelihoods, threatening millions of people and reinforcing the urgency of climate adaptation policies in semi-arid regions.

How to cite: Prestrelo de Oliveira, C., Rodrigues Mutti, P., Nunes Cho-Luck, E., Siqueira, M., Batista, G., Ferreira Costa, R., Leidinice da Silva, M., Jeferson de Medeiros, F., and Lu Aramayo Alonso, W.: Climate Extremes over the Brazilian Caatinga Based on Performance-Based Projections from Selected NEX-GDDP-CMIP6 Models, EGU General Assembly 2026, Vienna, Austria, 3–8 May 2026, EGU26-3469, https://doi.org/10.5194/egusphere-egu26-3469, 2026.

EGU26-3715 | ECS | Orals | HS2.4.12

Historical climatic time series analysis of ENSO influence on surface and groundwater levels in Central Mexico 

Selene Olea Olea, Priscila Medina-Ortega, Betsabé Atalia Sierra García, Ariadna Camila Salgado-Albiter, Lorena Ramírez-González, Eric Morales-Casique, and Nelly L. Ramírez Serrato

The historical climatic data provide valuable information to understand the groundwater behavior. When groundwater and surface data levels are combined with climatic records, the water levels present the influence of El Niño–Southern Oscillation. However, there is no comprehensive record of surface and groundwater levels in Mexico, which limits this focus. This is the first study to evaluate the influence of the ENSO on hydrogeological dynamics in a groundwater flow system (GFS) placed in Central Mexico. The methodology consisted of compiling groundwater and surface water levels from multiple sources and data sets of historical time series of precipitation, runoff, and spatial/temporal variability patterns across different ENSO phases. The main results indicate that precipitation and surface runoff exhibit a strong response to El Niño and La Niña events, resulting in distinct hydrological anomalies that impact the recharge and discharge dynamics of the basin. Indicators show decreases in precipitation and groundwater levels during El Niño events, and increases in precipitation and surface water levels during La Niña events.

Multidecadal trends indicate that land use and vegetation changes significantly modify the hydrological response to ENSO by intensifying evapotranspiration, altering infiltration rates, and affecting the interaction between groundwater and surface water. These analyses allow us to understand the complex relationship between historical climate data and water levels, linked to natural processes and anthropogenic processes, especially those associated with water extraction. 

This study provides an example for evaluating climate and hydrological changes linked to anthropogenic activities to improve sustainable management of water resources.


How to cite: Olea Olea, S., Medina-Ortega, P., Sierra García, B. A., Salgado-Albiter, A. C., Ramírez-González, L., Morales-Casique, E., and Ramírez Serrato, N. L.: Historical climatic time series analysis of ENSO influence on surface and groundwater levels in Central Mexico, EGU General Assembly 2026, Vienna, Austria, 3–8 May 2026, EGU26-3715, https://doi.org/10.5194/egusphere-egu26-3715, 2026.

EGU26-7215 | ECS | Posters on site | HS2.4.12

Modeling Hydrological Responses to Climate Change in Morocco’s Upper Tassaoute Basin 

Sana Elomari, El Mahdi El Khalki, Oussama Nait-Taleb, and Abdenbi Elaloui

Climate change poses an escalating threat to global water resources, with semi-arid regions such as Morocco being particularly vulnerable due to high climatic variability and limited adaptive capacity. In these regions, data scarcity and uncertainties related to data availability and quality frequently hinder robust assessments of climate change impacts. Recent advances in data science and remote sensing offer promising alternatives to overcome these limitations. This study investigates the potential of PERSIANN-CDR satellite-based precipitation product, for assessing climate change impacts on water resources. The capability of PERSIANN-CDR to reproduce observed precipitation patterns and associated hydrological responses is evaluated through a comparative analysis using observed precipitation data. Results indicate that PERSIANN-CDR generally underestimates peak precipitation events and total rainfall amounts compared to in-situ observations. Runoff is simulated using two hydrological approaches: the GR2M conceptual rainfall–runoff model and the Thornthwaite climatic water balance method, both driven by observed meteorological data and PERSIANN-CDR precipitation.

Furthermore, climate change impacts are quantified using future climate projections from 5 climate models, under two scenarios: RCP4.5 and RCP8.5 for the periods 2030-2060 and 2061-2090. Changes in key hydrological indicators, including precipitation, runoff, and water balance components, are analyzed for both observation-based and satellite-based simulations. Results consistently show a marked temperature increase of 2–3 °C across all models, accompanied by a general decline in precipitation ranging from -40% to -80%, despite notable inter-model variability. These climatic changes translate into substantial reductions in runoff, with stronger decreases projected under the high-emission scenario and during the dry season. Monthly analyses reveal pronounced seasonal contrasts, highlighting the increased sensitivity of low-flow periods to climate forcing. Overall, surface water availability is projected to decrease by -60 to -80% (GR2M) and -70 to -80% (Thornthwaite) when using observed data, and by -50 to -80% (GR2M) and -50 to -90% (Thornthwaite) when using PERSIANN-CDR forcing. The results highlight the strengths of satellite-based precipitation datasets for climate change impact studies and demonstrate their relevance as a complementary or alternative data source in regions with sparse observations.

How to cite: Elomari, S., El Khalki, E. M., Nait-Taleb, O., and Elaloui, A.: Modeling Hydrological Responses to Climate Change in Morocco’s Upper Tassaoute Basin, EGU General Assembly 2026, Vienna, Austria, 3–8 May 2026, EGU26-7215, https://doi.org/10.5194/egusphere-egu26-7215, 2026.

EGU26-8647 | ECS | Orals | HS2.4.12

Understanding the interplay between rainfall intermittency and streamflow events 

Steven Thomas, Conrad Wasko, Danlu Guo, Ulrike Bende-Michl, and Murray Peel

Rainfall variability plays a key role in how we are impacted by flood events, but also how we manage our water storages for flood mitigation and replenish our water resources. The sequencing between wetter and drier periods typically results in a natural fluctuation of rainfall-streamflow response but also modulates streamflow extremes. This relationship is being be impacted by anthropogenic climate change, with unprecedented extreme events and changes to long-term catchment dynamics. Several factors contribute to how rainfall variability influences streamflow event variability, including the rainfall event total, rainfall frequency, rainfall intensity and antecedent catchment conditions. In this study, we investigate changes to these rainfall variability factors and their relationship to streamflow event variability.

Our investigation is performed at the catchment scale for 467 Hydrological Reference Stations (HRS) catchments across Australia, utilising catchment-aggregated daily rainfall and gauged daily streamflow from 1950 to 2022. We investigate long-term trends in the frequency, duration and intensity of wet and dry rainfall spells across annual and seasonal timescales. We also identify streamflow events for each catchment and calculate key hydroclimate conditions before and during the event, such as the length of the rainfall dry spell before the event. These conditions are then used to better understand the different drivers of streamflow event volumes across Australia.

We find that southern and eastern Australia experience a drying trend with more dry days, shorter wet spells and greater intermittency with increases in the number of wet and dry spells per year. Northern and northwestern Australia experiences a wetting trend with more wet days, longer wet spells and increases in annual rainfall totals and rain intensity. These results are seasonally dependent, with stronger trends during periods where the majority of rainfall falls. The most important factors in driving streamflow event volumes are rainfall and soil moisture. We also find that the relationship between dry spells and streamflow event volumes is weak across Australian catchments despite a strong correlation with annual streamflow volumes. This highlights that event scale dynamics differ from the annual scale and the need to expand this analysis of the drivers of streamflow events alongside drivers of annual streamflow.

How to cite: Thomas, S., Wasko, C., Guo, D., Bende-Michl, U., and Peel, M.: Understanding the interplay between rainfall intermittency and streamflow events, EGU General Assembly 2026, Vienna, Austria, 3–8 May 2026, EGU26-8647, https://doi.org/10.5194/egusphere-egu26-8647, 2026.

Climate change is progressively altering the hydrological regime of Mediterranean coastal regions, with direct implications for groundwater recharge and the vulnerability of coastal aquifers to saltwater intrusion. This study assesses changes in the hydrological balance of south-eastern Sicily, with a focus on the Ragusa province, adopting a regional-scale approach rather than a single-basin analysis.

Historical climate data and future projections of temperature and precipitation were analysed to estimate the spatial and temporal evolution of the main components of the hydrological balance. Results indicate a marked decrease in effective precipitation, together with increasing temperatures and evapotranspiration. Under the high-emission RCP8.5 climate scenario, regional-scale groundwater recharge is projected to decline by approximately 40–45% from 2071–2100 relative to 1971–2000, with substantial spatial variability.

The strongest reductions are observed in coastal and low-lying areas, where the diminished freshwater input may significantly affect aquifer equilibrium. Such a deterioration of the regional hydrological balance represents a critical predisposing factor for saltwater intrusion, particularly in areas already subjected to intense groundwater abstraction.

These findings highlight the relevance of regional-scale hydrological balance assessments for identifying areas of increased vulnerability and for supporting sustainable groundwater management strategies in Mediterranean coastal environments under changing climatic conditions.

How to cite: Barone, S., Sebastiano, I., and Luca, C.: Regional-scale assessment of climate-driven hydrological balance changes and implications for coastal aquifer recharge in south-eastern Sicily, EGU General Assembly 2026, Vienna, Austria, 3–8 May 2026, EGU26-9509, https://doi.org/10.5194/egusphere-egu26-9509, 2026.

EGU26-10692 | ECS | Orals | HS2.4.12

Dynamically induced streamflow variability in UK river catchments 

Anna Murgatroyd, James Carruthers, and Hayley Fowler

Understanding historical and future changes to seasonal and extreme flow regimes is crucial for both water resources planning and flood risk management. Historically, inter-annual to multi-decadal variability in seasonal flow has been influenced by variability in atmospheric circulation over the UK, and by long-term changes in the mean state of atmospheric circulation. Having trust in future hydrological projections therefore requires (1) a thorough understanding of the representation of this atmospheric circulation induced variability in climate models, and (2) confidence that climate models are capable of reproducing periods of atmospheric circulation patterns associated with wet or dry conditions.

In this work, we apply a novel dynamical adjustment methodology based on synoptic-scale weather patterns to a century long reconstruction of seasonal standardised streamflow index (SSI) for catchments in the UK. This methodology isolates the influence of atmospheric circulation variability on SSI, exhibiting clear seasonality and spatial patterns. In some catchments, this ‘dynamical’ SSI component explains a high proportion of variability in total seasonal SSI.

Using the same synoptic-scale weather patterns, we find that UKCP18 climate models underestimate seasonal variability in the dynamical component of SSI. We demonstrate that the differences in distribution between observations and model simulations must be due to differences in weather pattern frequency and/or clustering, rather than rainfall biases. Our findings raise questions about the suitability of climate models in projecting streamflow trends and understanding future seasonal extremes.

How to cite: Murgatroyd, A., Carruthers, J., and Fowler, H.: Dynamically induced streamflow variability in UK river catchments, EGU General Assembly 2026, Vienna, Austria, 3–8 May 2026, EGU26-10692, https://doi.org/10.5194/egusphere-egu26-10692, 2026.

EGU26-11240 | ECS | Orals | HS2.4.12

Observed Variability and Projected Change in South American Flood Regimes 

Ingrid Petry and Fernando Fan

Assessing future changes in hydrological extremes requires accounting for both externally forced climate change and internal climate variability, which can substantially modulate flood magnitude and frequency. Here, we synthesize observational and modelling evidence to examine how these drivers jointly shape flood regimes across South America, with implications for both flood risk and ecosystem dynamics.

Using multi-decadal streamflow observations, we show that internal climate variability associated with the El Niño–Southern Oscillation (ENSO) strongly alters the likelihood of extreme hydrological events. Flood probabilities increase by more than 120% during El Niño in the La Plata Basin and during La Niña in the northern Amazon. Streamflow extremes respond more strongly than precipitation, indicating cumulative hydrological amplification of climate variability.

Complementing these findings, hydrodynamic–hydrological simulations forced by the CMIP6 ensemble reveal heterogeneous future flood responses under climate change. Flood magnitude and frequency are projected to intensify markedly in southern Brazil, where events may become up to five times more frequent, while major wetlands such as the Amazon and Pantanal are projected to experience reduced flood occurrence, with potential negative ecological consequences. These contrasting responses arise from competing influences of increasing extreme precipitation and enhanced evapotranspiration, as well as substantial spread across climate model realizations.

Together, these results demonstrate that internal climate variability can amplify, mask, or temporally offset forced changes in flood regimes, leading to divergent but physically plausible outcomes.

How to cite: Petry, I. and Fan, F.: Observed Variability and Projected Change in South American Flood Regimes, EGU General Assembly 2026, Vienna, Austria, 3–8 May 2026, EGU26-11240, https://doi.org/10.5194/egusphere-egu26-11240, 2026.

EGU26-11519 | Posters on site | HS2.4.12

Climate-driven historical changes in streamflow extremes and consequences for reservoir inflows over the Upper Po river basin (Italy) 

Giuseppe Formetta, Francesca Pianosi, Riccardo Busti, Daniele Andreis, Gaia Roati, Rafael Pimentel, Riccardo Rigon, and Manuel Del Jesus Penil

Over the past few decades, extreme hydrological events, particularly floods and droughts, have increased across the European Alps.

Changes in the frequency and duration of wet and dry extremes may complicate reservoir management by intensifying tradeoffs among water supply, flood control, and ecosystem needs. Prolonged droughts can limit the ability to maintain minimum release requirements, while increased precipitation may raise storage levels and flood risks.

In this study, we present a preliminary assessment of changes in the frequency and duration of wet and dry extreme events in two anthropized, snow-dominated catchments of the upper Po River basin, with a specific focus on variations in reservoir inflows. The aim is to improve understanding of upstream streamflow variability and to support future reservoir and watershed management.

We use the GEOframe hydrological modeling system to simulate the complete hydrological cycle including snow water equivalent, soil moisture, and river discharge at ~1km2 - daily resolution. We exploit the potential of recently developed meteorological datasets for rainfall and air temperature covering the study area over the past 30 years. Model simulations are calibrated using historical streamflow observations and validated through both in situ data and independent validation based on MODIS MOD10A2 satellite observations of snow-covered areas.

This modeling effort provides insights into historical hydrological changes in hydrological extreme events, particularly those affecting inflow discharges to the analyzed reservoirs, and establishes a foundation for future analyses of projected hydrological changes and reservoir operation over a changing environment.

This work is supported by the project WATER4ALL JTC2022” - WaterMA-WaDiT - “Water Management and Adapation based on Watershed Digital Twins” CUP: E63C23001680007

How to cite: Formetta, G., Pianosi, F., Busti, R., Andreis, D., Roati, G., Pimentel, R., Rigon, R., and Del Jesus Penil, M.: Climate-driven historical changes in streamflow extremes and consequences for reservoir inflows over the Upper Po river basin (Italy), EGU General Assembly 2026, Vienna, Austria, 3–8 May 2026, EGU26-11519, https://doi.org/10.5194/egusphere-egu26-11519, 2026.

Understanding how groundwater systems will respond to climate change is essential for water-scarce regions such as the Algarve, southern Portugal, where groundwater plays a central role in sustaining agriculture and ecosystems. Previous studies in Portugal have demonstrated that climate teleconnections influence aquifer recharge processes across interannual to decadal timescales, with NAO identified as the dominant driver in southern Portugal and EA and SCAND contributing to higher-frequency variability. However, most existing analyses have focused on historical observations, offering limited insight into future groundwater behavior under projected climate change.

This study integrates climate mode analysis with deep learning-based projections to assess future groundwater variability in the Algarve. Spectral analyses of historical piezometric and precipitation records were first conducted to characterize dominant variability regimes and classify aquifers into annual, mixed, and low-frequency dominated systems. These classifications were then incorporated into deep learning models trained using CMIP6 climate model outputs, namely precipitation and temperature. Groundwater levels were projected under multiple Shared Socioeconomic Pathway (SSP) scenarios for mid-century (2030–2050) and late-century (2050–2100) periods.

The preliminary results indicate a general decline in groundwater levels across Algarve aquifers under all future climate scenarios, with the magnitude and temporal structure of change varying by aquifer type. Aquifers characterized by strong low-frequency variability exhibited more pronounced long-term declines, suggesting increased vulnerability to persistent climate forcing. In contrast, systems dominated by annual variability showed greater short-term responsiveness but less pronounced long-term trends. Across scenarios, a reduction in low-frequency variability was observed, indicating a potential loss of groundwater system inertia and reduced buffering capacity against prolonged droughts.

The analysis further suggests that climate teleconnections will continue to play a significant role in shaping projected groundwater dynamics, with NAO remaining the primary large-scale driver and EA and SCAND influencing higher-frequency modulations. The findings offer valuable guidance for regional groundwater management and provide a transferable framework for assessing climate-driven groundwater variability in other Mediterranean and Atlantic coastal regions.


This work is supported by FCT, I.P./MCTES through national funds (PIDDAC): LA/P/0068/2020 - https://doi.org/10.54499/LA/P/0068/2020 , UID/50019/2025,  https://doi.org/10.54499/UID/PRR/50019/2025, UID/PRR2/50019/2025

How to cite: Tjugaeva, A. and Neves, M. C.: Projecting Climate-Driven Groundwater Variability in the Algarve using Deep Learning-Based Projections, EGU General Assembly 2026, Vienna, Austria, 3–8 May 2026, EGU26-11823, https://doi.org/10.5194/egusphere-egu26-11823, 2026.

EGU26-12824 | ECS | Posters on site | HS2.4.12

Identifying hotspots for the emergence of unprecedented precipitation extremes in Sub-Saharan Africa under climate change 

Stanley Oramah, Bastien Dieppois, Job Ekolu, Charles Onyutha, Gabriel Stecher, Albert Nkwasa, Serigne Bassirou Diop, Yves Tramblay, Benjamin Sultan, Jessica Northey, and Marco van de Wiel

The likelihood of unprecedented precipitation extremes is increasing across Sub-Saharan Africa (SSA), yet where and when future events may exceed the full range of historical experience remains understudied. While previous studies have documented historical trends and projected changes in precipitation extremes across sub regions of Africa, integrated SSA-wide assessments explicitly identifying hotspots of record-breaking precipitation extremes remain limited.

Here, we present a sub-continental, SSA-wide assessment of the emergence of unprecedented precipitation extremes under future climate change. Unprecedented extremes are defined as future events (2030-2100) that exceed the observed and simulated range during a historical reference period (1950-2014). Using precipitation-based extreme metrics relevant to water security (e.g., maximum 1-day rainfall, maximum 5-day rainfall, consecutive wet and dry days, maximum and minimum seasonal rainfall amount), derived from Coupled Model Intercomparison Project – Phase 6 (CMIP6) multi-model large-ensembles, we explicitly assess the future time and regional hotspot of emergence of record-breaking precipitation conditions. We also examine changes in the probability of emergence of unprecedented extremes and their potential large-scale ocean-atmospheric drivers (e.g., El Nino-Southern Oscillation, Atlantic Multidecadal Variability, and Indian Ocean Dipole), while accounting for uncertainties associated with both model physics and internal climate variability.

By systematically identifying where and when observed and retrospectively simulated precipitation limits are exceeded, this study offers a new sub-continental perspective on the emergence of unprecedented hydroclimatic conditions and provides a robust foundation for assessing future water security risks and supporting climate-resilient planning in Sub-Saharan Africa under increasing hydroclimatic uncertainty.

How to cite: Oramah, S., Dieppois, B., Ekolu, J., Onyutha, C., Stecher, G., Nkwasa, A., Diop, S. B., Tramblay, Y., Sultan, B., Northey, J., and van de Wiel, M.: Identifying hotspots for the emergence of unprecedented precipitation extremes in Sub-Saharan Africa under climate change, EGU General Assembly 2026, Vienna, Austria, 3–8 May 2026, EGU26-12824, https://doi.org/10.5194/egusphere-egu26-12824, 2026.

EGU26-16194 | ECS | Posters on site | HS2.4.12

Unprecedented drying of the Ganga River over the past 1,300 years 

Dipesh Singh Chuphal and Vimal Mishra

The Ganga River basin is home to over 600 million people and holds significant economic and cultural importance. However, the Ganga River is experiencing a recent drying trend, threatening both water and food security. Using streamflow reconstructions spanning 1,300 y (700–2012 C.E.) from instrumental data, paleohydrological records, and hydrological modelling, we show that recent drying from 1991 to 2020 is unprecedented in the past millennium. Streamflow decline since the 1990s, driven by frequent and prolonged droughts, is 76% more intense than its closest historical analogue of the 16th-century drought. This drying exceeds natural variability, highlighting the dominant role of anthropogenic factors. Despite CMIP6 models projecting increased streamflow under warming scenarios, the recent decline indicates complexities associated with future water availability projections. Our findings underscore the urgent need to examine the interactions among the factors that control summer monsoon precipitation, including large−scale climate variability and anthropogenic forcings. Better constraints on these processes in climate models will be essential for improving future monsoon projections and implementing adaptive water management strategies to secure the Ganga basin’s freshwater availability under a changing climate.

How to cite: Singh Chuphal, D. and Mishra, V.: Unprecedented drying of the Ganga River over the past 1,300 years, EGU General Assembly 2026, Vienna, Austria, 3–8 May 2026, EGU26-16194, https://doi.org/10.5194/egusphere-egu26-16194, 2026.

EGU26-16270 | Orals | HS2.4.12 | Highlight

Drought variability in a wet country (the UK): when observation-based trends and hydroclimate projections disagree, how might we move forward?  

Jamie Hannaford, Stephen Turner, Amulya Chevuturi, WIlson Chan, Lucy Barker, maliko Tanguy, Simon Parry, Stuart Allen, and Katie Facer-Childs

Whenever record-breaking flood and drought events occur, they are held up as a manifestation of anthropogenic warming – which is entirely reasonable given physical reasoning and typical projections for the future. However, to contextualise such claims it is also vital to analyse long-term observations of river flow to detect and attribute emerging trends. While there is often good agreement between these lines of evidence, there are sometimes discrepancies in the strength or even the direction of change in observations compared to climate projections. This can present a profound challenge to policymakers and adaptation planners: how to proceed given deep uncertainty in future projections, especially if conflicting with lived historical experience?

In this presentation, we tackle this question using hydrological droughts in the UK as a case study. Recent major droughts[LB1]  (including in 2025) have led to growing concerns that droughts are becoming more severe in the UK, despite it generally being perceived as a wet country. Firstly, we appraise the evidence for any trends towards worsening hydrological droughts in the UK. The UK has a well-established monitoring programme and hence provides a good international case study for addressing this question. We assess the evidence for changes in the well-gauged post-1960 period, before considering centennial scale changes using reconstructions. A further challenge with hydrological extremes (compared to climate variables) is that observed trends in river flows can reflect catchment alterations rather than climatic variability. Hence, we provide a synthesis of our understanding of the drivers of change in hydrological drought, both climatic and in terms of direct human disturbances to river catchments (e.g. changing patterns of water withdrawals, impoundments, land use changes). These latter impacts confound the identification of climate-driven changes, and yet human influences are themselves increasingly recognised as potential agents of changing drought regimes. Perhaps surprisingly, we find little evidence of compelling changes towards worsening drought, apparently at odds with climate projections for the relatively near future and widely-held assumptions of the role of human disturbances in intensifying droughts. Nevertheless it leaves water managers and policymakers at an impasse.

Hence, we set out recommendations for guiding research and policy alike. Two major themes emerge: 1) integration of observational trend studies with hydroclimate modelling using ‘large ensemble’ approaches, seeing the observed past as only one instance among ‘worlds that might have been’ to help better frame emerging risks and develop stress tests; 2) improved understanding of the drivers of change, moving beyond largely correlation-based links with climate forcings towards understanding underlying atmosphere-oceanic processes, while simultaneously better discriminating the ‘human factor’ (i.e. water withdrawals or land use) – a grand challenge but one which new datasets and methods are making more feasible. While our focus is the UK, we envisage the themes within this presentation will resonate with the international community and we conclude with ways our findings are relevant more broadly.

How to cite: Hannaford, J., Turner, S., Chevuturi, A., Chan, W., Barker, L., Tanguy, M., Parry, S., Allen, S., and Facer-Childs, K.: Drought variability in a wet country (the UK): when observation-based trends and hydroclimate projections disagree, how might we move forward? , EGU General Assembly 2026, Vienna, Austria, 3–8 May 2026, EGU26-16270, https://doi.org/10.5194/egusphere-egu26-16270, 2026.

EGU26-17593 | Orals | HS2.4.12

Evaluating a hydrological modelling tool for integration with climate models across Europe 

Peter Greve, Amelie Schmitt, and Sina Schreiber

The growing global population and associated socio-economic development are increasing water demand. At the same time, the overexploitation of water resources, particularly in regions with limited availability, leads to mounting water scarcity that is expected to further intensify under projected climate and socio-economic change. Consequently, assessments of current and future water resources need to account for the coupled effects of climate change, human water management practices, and hydrological processes. Despite the widespread relevance of these interactions, significant gaps remain in our understanding of the interplay between (i) human water management, (ii) local-to-basin-scale hydrology, and (iii) hydroclimatological and atmospheric responses. A major reason for this is that many state-of-the-art Earth system models misrepresent or omit critical processes, such as river routing, sectoral water withdrawals, groundwater pumping, and dam/reservoir operations. These limitations constrain our ability to consistently quantify impacts across scales and disciplines and complicate the evaluation of management interventions and their hydroclimatic feedbacks.

Here, we evaluate the performance and highlight the wide range of applications of Climate-CWatM (C-CWatM), a newly developed flexible modelling tool for simulating water resources management and river routing. C-CWatM uses land-surface model outputs as inputs and provides a coupling interface designed for quick integration with existing climate and Earth system models. We force C-CWatM using raw land-surface outputs obtained from high-resolution regional climate model simulations across the EURO-CORDEX domain. To evaluate its performance, we compare simulated discharge between 1990 and 2010 with observed data from medium-sized European river basins. Our findings indicate reasonable performance, even when using raw, non-bias-corrected, unconstrained climate model output for runoff and other land-surface variables as input. We further evaluate the performance of C-CWatM against dedicated hydrological simulations using the offline hydrological model CWatM, driven by tailored, bias-corrected forcing datasets. The results demonstrate a strong agreement in both spatial and temporal discharge patterns, highlighting the effectiveness of C-CWatM in hydrological and water resources simulation for integration with climate models.

Due to its flexible, open-source, and accessible design, C-CWatM represents a critical step towards fully coupled modelling of climate–water–human interactions. The implementation of a coupled modelling system that includes C-CWatM can close the gap between water management, hydrology, and land–atmosphere interaction, supporting more consistent assessments of future water availability, hydroclimatic extremes, and the associated adaptation strategies.


How to cite: Greve, P., Schmitt, A., and Schreiber, S.: Evaluating a hydrological modelling tool for integration with climate models across Europe, EGU General Assembly 2026, Vienna, Austria, 3–8 May 2026, EGU26-17593, https://doi.org/10.5194/egusphere-egu26-17593, 2026.

EGU26-18656 | ECS | Posters on site | HS2.4.12

Better Exploration of Drought Risks Under Climate Change Uncertainties using Locally Relevant Climatic Drivers 

‪Hassan Mohammed, Franciscus Eduard Buskop, Frederiek Sperna Weiland, and Adriaan J. Teuling

Drought is expected to intensify under climate change, leading to increasing impacts on society and ecosystems. Well-informed preparedness against these changes is confronted by substantial uncertainty in regional climate responses, as different Global Climate Models (GCMs) produce a wide range of changing signals under the same emission scenario. Multi-model means are commonly used to address this uncertainty which may mask the inter-model variability, and in some cases, the opposing signals across models further reduce the overall change, thereby limiting the risk exploration. Recent work suggests that clustering GCMs based on local impact drivers can improve the representation of plausible future climates and their associated extremes. In this study, we apply the climatic impact-driver (CID) clustering approach to explore future drought risk in the Guadalquivir River Basin, Spain. Both hydrological and agricultural drought were quantified using outputs from the wflow_sbm model and crop water requirements. Seasonal CMIP6 changes in precipitation and potential evapotranspiration (PET) were analyzed using the random forest scoring technique to identify the dominant climatic drivers for drought impact. Our results indicate that winter and autumn precipitation deficits are the main drivers of streamflow drought, while winter increases in PET act as a secondary driver of extreme and multi-year hydrological drought. In contrast, summer and spring increases in PET  emerge as the dominant driver of agricultural drought. Based on these identified drivers, we are going to cluster the GCMs for different future horizons to compare the resulting impact ranges with traditional emission-based ensembles. This ongoing research suggests that drought-specific clustering provides a more informative set of impact scenarios than SSPs. As such it supports robust adaptation planning for water managers under uncertain climate change impacts in Mediterranean river basins.

How to cite: Mohammed, ‪., Buskop, F. E., Sperna Weiland, F., and Teuling, A. J.: Better Exploration of Drought Risks Under Climate Change Uncertainties using Locally Relevant Climatic Drivers, EGU General Assembly 2026, Vienna, Austria, 3–8 May 2026, EGU26-18656, https://doi.org/10.5194/egusphere-egu26-18656, 2026.

EGU26-20172 | ECS | Orals | HS2.4.12

Neural Network Modelling of Climate Change and Reservoir Impacts on Upper Miño River Flow 

Helena Barreiro-Fonta and Diego Fernández-Nóvoa

Climate change is altering the global hydrological cycle and, when combined with human interventions such as reservoir operations, the river flow regime is further modified. Given the strong spatial heterogeneity of these impacts and the basin-specific nature of hydrological responses, regional studies are essential to assess local vulnerabilities. This study investigates projected changes in streamflow in the upper Miño River basin (northwestern Iberian Peninsula), including the impact of the Belesar reservoir, by comparing historical conditions (1985–2014) with future projections (2070–2099) under the SSP5-8.5 and SSP2-4.5 scenarios. Artificial neural networks were employed to model basin hydrology by estimating streamflow from temperature and precipitation data, and to simulate reservoir operations, achieving satisfactory validation performance.

Under the high-emission SSP5-8.5 scenario, results indicate a projected intensification of hydrological variability, with the 10th percentile, used to define low-flow conditions, decreasing by approximately 10%, whereas the percentile corresponding to a one-year return period (high-flow conditions) increases by about 5%, with the mean streamflow declining by more than 15%. Under the more moderate SSP2-4.5 scenario, changes are less pronounced, with a ~5% reduction in the low-flow percentile and a more moderate decrease in mean streamflow, while the high-flow percentile is expected to decrease by around 30 %, exhibiting an opposite trend to the extreme emission scenario. Reservoir operation was analysed under the SSP5-8.5 scenario to assess its regulatory capacity under future extreme conditions. Results show that reservoir management could mitigate projected impacts by redistributing water seasonally, more than doubling summer downstream flows compared to future natural conditions and reducing winter extremes, with peak flows lowered by approximately 15%. Overall, while future natural conditions are projected to become more critical, both moderate emission pathways and effective reservoir operation can substantially alleviate adverse hydrological impacts.

How to cite: Barreiro-Fonta, H. and Fernández-Nóvoa, D.: Neural Network Modelling of Climate Change and Reservoir Impacts on Upper Miño River Flow, EGU General Assembly 2026, Vienna, Austria, 3–8 May 2026, EGU26-20172, https://doi.org/10.5194/egusphere-egu26-20172, 2026.

EGU26-20177 | Posters on site | HS2.4.12

A Multi-model Bias-corrected Large-Ensemble for High-resolution Climate Impact Assessment in Sub-Saharan Africa 

Bastien Dieppois, Stanley Oramah, Job Ekolu, Charles Onyutha, Matteo Rubinato, and Marco Van De Wiel

Sub-Saharan Africa (SSA) is increasingly exposed to unprecedented climate extremes, posing critical challenges to water and food security. Hydrological and agricultural climate-change impact assessments commonly rely on downscaled and bias-corrected climate model simulations to drive hydrological and sectoral impact models. In many regions, including Sub-Saharan Africa, existing studies predominantly apply bias correction to single realisations from multi-model climate ensembles, which limits the explicit sampling of internal climate variability and constrains robust quantification of climate-change impacts and associated uncertainty. To account for internal variability in regional climate change projections, single model initial-condition large ensembles (SMILEs) can be used. Across diverse case studies in Europe and North America, different approaches have been developed to downscale and bias-correct SMILEs while preserving internal climate variability. However, these approaches have so far been applied almost exclusively to individual SMILEs, have not been extended to multiple SMILEs within a unified bias-correction framework, and remain unexplored in the SSA context.

This study presents the first multi-model, bias-corrected large-ensemble for high-resolution climate impact assessment in Sub-Saharan Africa, using Uganda as a demonstrative case study. The framework integrates six CMIP6 SMILEs (MPI-ESM1-2-LR, ACCESS-CM2, IPSL-CM6A-LR, MIROC6, CanESM5, and UKESM1-0-LL), together providing more than 150 climate simulations sampling both internal climate variability and inter-model structural uncertainty. Bias correction is applied at monthly scale using the CDF-t method, following the ensemble-based and individual-member-based implementations proposed by Ayar et al. (2021). The correction functions are trained over the historical period 1950–2014, using ERA5-Land as the reference dataset, resulting in bias-corrected regional climate scenarios at 8 km spatial resolution.

The resulting bias-corrected multi-model large ensemble is intended for use in hydrological and agricultural impact modelling over selected Ugandan catchments to support future analyses of hydroclimatic change, variability, and extremes. Beyond this case study, the framework is designed as a scalable prototype for the future development of a pan-SSA multi-model, bias-corrected large-ensemble climate dataset to support climate-impact assessments and adaptation planning.

How to cite: Dieppois, B., Oramah, S., Ekolu, J., Onyutha, C., Rubinato, M., and Van De Wiel, M.: A Multi-model Bias-corrected Large-Ensemble for High-resolution Climate Impact Assessment in Sub-Saharan Africa, EGU General Assembly 2026, Vienna, Austria, 3–8 May 2026, EGU26-20177, https://doi.org/10.5194/egusphere-egu26-20177, 2026.

EGU26-389 | ECS | Posters on site | HS2.4.13

Spatiotemporal attribution of runoff changes in the upper Yangtze River Basin using the SWAT+ model 

Yu Han, Ping-an Zhong, Yujie Wang, Xinyuan Qian, Mengxue Ben, and Zixin Song

Runoff in the UYRB has changed due to the combined effects of climate change and human activities. However, comprehensive spatiotemporal attribution studies are still lacking. This study analyzes and attributes runoff changes across different temporal scales (annual, drawdown, and refill periods) and spatial scales (entire basin and five zones). The effects of climate change and land use/land cover change (LUCC) on runoff are quantified using the SWAT+ model. The main driving factors are identified by comparing their contributions with observed runoff changes.

From the baseline period (1961-2000) to the impact period (2001-2023), annual runoff in the UYRB decreased by 34.60 billion m³/yr, while runoff increased by 21.53 billion m³/yr during the drawdown period and decreased by 40.29 billion m³/yr during the refill period. These trends were generally consistent across all zones. Climate change was the dominant factor driving annual runoff changes (77.69%), followed by increased water consumption (13.41%) and LUCC (5.85%). Climate change reduced annual runoff in most zones due to the combined effect of reduced precipitation and increased potential evapotranspiration. However, during the drawdown and refill periods, reservoir operation emerged as another significant driving factor influencing runoff changes. This study provides valuable insights into water resource management in a changing environment.

How to cite: Han, Y., Zhong, P., Wang, Y., Qian, X., Ben, M., and Song, Z.: Spatiotemporal attribution of runoff changes in the upper Yangtze River Basin using the SWAT+ model, EGU General Assembly 2026, Vienna, Austria, 3–8 May 2026, EGU26-389, https://doi.org/10.5194/egusphere-egu26-389, 2026.

EGU26-924 | ECS | Orals | HS2.4.13

An Analysis of Baseflow and Runoff Variability of Jamaican Watersheds 

Seychelle Woods and Kegan Farrick

Understanding how Caribbean watersheds respond to climatic and landscape pressures is essential for
water-resource management in Small Island Developing States (SIDS). Jamaica’s rivers provide domestic
supply, irrigation, hydropower potential, and ecosystem services, yet limited work compares long-term
hydrological behavior across basins with contrasting geology, land cover, and rainfall regimes. This study
examines hydrological change in the Martha Brae, Rio Minho, and Rio Grande watersheds using daily
discharge (1981–2010) separated into baseflow and runoff with WETSPRO. Rainfall trends were assessed
using station data, and monotonic trends were quantified using the Mann–Kendall and Sen’s slope tests.
Dominant lithologies and land-cover classes were identified using geological maps and LULC datasets.


The results show clear divergence in hydrological trajectories across the three basins. In the
metamorphic–volcanic Rio Grande, baseflow increases weakly (τ = 0.0625; Sen’s slope = 2.03×10⁻⁴),
total flow shows a minimal rise (τ = 0.0182), and runoff slightly declines (τ = –0.0426). A significant
increase in rainfall (τ = 0.186, p = 0.021) indicates that rainfall is the main driver, with high forest cover
and permeable lithology promoting enhanced infiltration and groundwater recharge. In the karstic Martha
Brae, modest increases in total flow (τ = 0.065) and baseflow (τ = 0.0783; Sen’s slope = 5.45×10⁻⁵)
correspond with significantly rising rainfall (τ = 0.206, p = 0.012). Here, geology dominates, as the high
storage capacity of limestone aquifers regulates flow and buffers climatic variability. In the alluvial, semi-
arid Rio Minho, small increases in total flow (τ = 0.0801), runoff (τ = 0.0184), and baseflow (τ = 0.0940;
Sen’s slope = 3.64×10⁻⁵) occur despite no significant rainfall trend (τ = –0.025, p = 0.76), showing that
land cover and low-permeability sediments exert the strongest control by limiting infiltration and
sustaining weak baseflow.


These findings have critical implications for Jamaican water supply. Karst basins may continue to provide
reliable dry-season flows due to strong groundwater buffering, while alluvial, agriculturally disturbed
basins remain highly vulnerable to drought and flash-flood extremes. Strengthening forest cover,
protecting recharge zones, and improving land-management practices will be central to enhancing
Jamaica’s climate-resilient water-resource security.

How to cite: Woods, S. and Farrick, K.: An Analysis of Baseflow and Runoff Variability of Jamaican Watersheds, EGU General Assembly 2026, Vienna, Austria, 3–8 May 2026, EGU26-924, https://doi.org/10.5194/egusphere-egu26-924, 2026.

EGU26-1011 | ECS | Orals | HS2.4.13

Hydrologic and Climatic Signatures of Reservoir Operations Using Long-term Panel Data 

Sruthakeerthi Puthenpura and Kasiapillai S Kasiviswanathan

Reservoirs play a vital role in regulating the spatial and temporal distribution of water resources and meeting downstream demands. However, the impacts of reservoirs on hydrometeorological factors, and how they affect sustainable water management are mostly overlooked in the existing literature. Hence, this research investigates panel regression methodologies to analyze the impacts of reservoirs across 49 catchments in Peninsular India, with specific stress upon the synchronous and lagged impacts of reservoir expansion on groundwater storage, baseflow, and other hydrological states and fluxes. The study found that reservoir expansion had statistically significant effects on both hydrological and climatic factors in Peninsular India, with more than 65% of all tested relationships showing significance. Reservoirs were found to significantly increase evapotranspiration and groundwater storage during the monsoon and post-monsoon seasons. Fixed Effects models, which demonstrated significant basin-specific limitations on hydrological responses, received the majority of the support.  Reservoir operations were found to have an impact on regional temperature and precipitation in addition to groundwater, soil moisture, and evaporation. This demonstrates that there is a quantifiable feedback between the atmosphere and the land. In contrast, baseflow responses were feeble and mostly insignificant, reflecting the buffered nature of subsurface channels. Groundwater storage emerged as the most sensitive variable. As a result, the region's reservoirs mainly influence groundwater storage rather than surface factors, indicating a change in the water balance where reservoirs improve subsurface retention and mitigate seasonal shortages. This study highlights the need for integrated reservoir and climate management strategies by showing the potential of a strong novel approach based on panel regression for interpreting the effects of reservoirs on catchment-scale hydrology.

How to cite: Puthenpura, S. and Kasiviswanathan, K. S.: Hydrologic and Climatic Signatures of Reservoir Operations Using Long-term Panel Data, EGU General Assembly 2026, Vienna, Austria, 3–8 May 2026, EGU26-1011, https://doi.org/10.5194/egusphere-egu26-1011, 2026.

Pakistan, endowed with substantial water and glacier resources in the Upper Indus Basin (UIB), relies heavily on the Tarbela Reservoir for hydropower generation, irrigation, and flood control. As the world's largest earth-fill dam, Tarbela spans a 169,600 km² catchment with an average annual inflow of 79 billion cubic meters, supplying approximately 33% of Pakistan's energy needs. However, climate change-induced variations in precipitation, temperature, and melt patterns pose risks to its reliability. This study assesses the reservoir's response for hydropower generation using the Hydrologic Engineering Center's Reservoir System Simulation (HEC-ResSim) model, integrating historical hydrological data to simulate operations under observed conditions.

Using the data sourced from the Water and Power Development Authority (WAPDA), three modules  of HEC-ResSim's were used: Watershed Setup for defining stream alignments, reservoirs, and computational points; Reservoir Network for configuring physical parameters (e.g., elevation-storage-area relationships) and operational rules (e.g., flood control, conservation, and inactive levels); and Simulation for running daily computations with HEC-DSSVue for data management and visualization. Alternatives incorporated time-series inputs from DSS files, with Excel used for supplementary calibration and analysis.

Simulations replicated reservoir behavior, revealing seasonal dynamics: low inflows and power generation in winter (December-February) due to reduced melt, peaking in monsoon (June-September) from rainfall and snowmelt. Annual power generation fluctuated, with notable dips (e.g., around 2013) attributed to water scarcity or operational constraints, despite consistent capability. Inflow-outflow comparisons highlighted storage roles in regulating flows. Model accuracy was validated for 2012-2014 against observed data, yielding Nash-Sutcliffe Efficiency (NSE) of 0.987, Index of Agreement of 0.99, and R² of 0.99, confirming robust simulation of power outputs relative to inflows.

Results underscore climate vulnerabilities, with flow variations over decades impacting generation efficiency amid unpredictable weather, floods, and droughts. The ongoing Tarbela 5th Extension (adding 1,530 MW via three 510 MW units, increasing total capacity from 4,888 MW to 6,418 MW) promises enhanced utilization. Conclusions emphasize HEC-ResSim's utility for real-time decision-making and scenario evaluation. Future studies could employ advanced versions, incorporate climate projections (e.g., from CMIP6), and compare pre- and post-extension scenarios to optimize sustainable hydropower amid UIB's evolving hydrology.

How to cite: Butt, A. Q., Shangguan, D., and Wu, J.: Evaluating Hydrological Alterations Due to Climate Change: Insights from HEC-ResSim Simulations in the Indus river fed Tarbela Reservoir , EGU General Assembly 2026, Vienna, Austria, 3–8 May 2026, EGU26-2100, https://doi.org/10.5194/egusphere-egu26-2100, 2026.

Urban precipitation reflects complex land–atmosphere interactions. However, the potential influence of vegetation change surrounding cities on urban precipitation remains insufficiently understood.

In this study, we examine the relationship between peri-urban vegetation change and urban precipitation variability by integrating satellite-based vegetation indicators, evapotranspiration modelling frameworks, and atmospheric moisture tracking techniques across a large set of cities worldwide. This approach enables quantification of how vegetation-induced evapotranspiration contributes to urban precipitation variability through atmospheric moisture transport.

Our analysis reveals a coherent hydroclimatic link in which changes in peri-urban vegetation are associated with variations in evapotranspiration and subsequent in urban precipitation. We further explore how this coupling varies across different atmospheric conditions, vegetation landscapes, and urban environments. The results indicate that there are substantial inter-urban differences in the strength of vegetation–precipitation coupling.

By clarifying the interaction mechanism among vegetation changes, evapotranspiration and urban precipitation, this study contributes to a broader understanding of land–atmosphere interaction and hydrological variability. The findings highlight that peri-urban vegetation is an important component of the hydrological cycle and provide insights for understanding hydrological variability under changing environmental conditions.

How to cite: Li, J.: Exploring the Role of Peri-Urban Vegetation Change in Urban Precipitation Variability, EGU General Assembly 2026, Vienna, Austria, 3–8 May 2026, EGU26-2167, https://doi.org/10.5194/egusphere-egu26-2167, 2026.

Drought represents a significant hydroclimatic hazard in arid regions of Asia and Africa, where climate change exacerbates evaporative demand, leading to intensified moisture stress, agricultural disruptions, and water insecurity. This study evaluates the Evaporative Demand Drought Index (EDDI) as a complementary tool to traditional precipitation-based indices, such as the Standardized Precipitation Index (SPI) and Standardized Precipitation-Evapotranspiration Index (SPEI), for monitoring drought dynamics, with a focus on flash droughts and evapotranspiration-driven anomalies. Utilizing high-resolution ERA5-Land reanalysis data (0.1° spatial resolution) from 1983 to 2023, EDDI was computed using the Penman-Monteith formulation across multiple timescales, including sub-weekly (1–3 weeks) and monthly (1–12 months) periods. The analysis encompassed diverse arid zones classified by the Intergovernmental Panel on Climate Change, including the Sahara (SAH), Mediterranean (MED), Arabian Peninsula (ARP), West Central Asia (WCA), Eastern Europe (EEU), West Siberia (WSB), East Siberia (ESB), East Central Asia (ECA), and Tibetan Plateau (TIB). Performance assessment involved modified Mann-Kendall trend tests, Sen’s slope estimation, Spearman rank correlations, run theory for drought characterization (duration, severity, intensity, peak, and frequency), and a case study of the 2010 drought event. Results revealed pronounced spatial and temporal heterogeneities in drought patterns. EDDI exhibited stronger drying trends compared to SPI and SPEI, driven by significant increases in reference evapotranspiration (ETo; 2.0–5.16 mm year⁻¹) and temperature (0.02–0.05°C year⁻¹) across most regions, except the TIB, where wetting trends predominated due to elevational effects. In hyper-arid areas such as SAH and ARP, EDDI identified significant drying in 45–60% of grid cells, in contrast to SPI's wetting signals, underscoring EDDI's sensitivity to atmospheric demand independent of precipitation. Spearman correlations between EDDI and SPEI were notably strong (ρ ranging from -0.83 to -0.91 at 1-month scales), exceeding those with SPI (-0.41 to -0.79), particularly in SAH (-0.91 for EDDI-SPEI). Drought frequency intensified post-2000 in all regions except TIB, with EDDI capturing higher severity in SAH and ARP due to elevated ETo. Run theory analysis showed that, at longer timescales, drought duration, severity, and intensity increased, while frequency decreased; EDDI consistently indicated more acute conditions than SPI in water-limited environments. During the 2010 drought, EDDI detected the onset 2–4 weeks earlier than SPI in ARP and SAH, highlighting its utility for rapid-onset events through sub-monthly sensitivity to ETo anomalies. Spatial progression revealed severe drought (category C4) expanding in SAH and EEU at 6–12-month scales, with EDDI and SPEI aligning more closely than SPI, reflecting the influence of vapor pressure deficits and land-atmosphere feedbacks grounded in the Budyko framework. These findings affirm EDDI's role as an indirect proxy for drought stress via evaporative demand, complementing precipitation-focused indices in arid settings where ETo dominates. Limitations include potential overestimation in irrigated areas and assumptions of stationarity under non-stationary climate conditions. Integration of EDDI into operational early warning systems could enhance proactive management, supporting adaptive strategies like water allocation and resilient agriculture amid projected aridification.

How to cite: Ogunrinde, A. and Ali Shah, S.: Enhancing Drought Early Warning in Arid Asia and Africa: Comparative Performance of the Evaporative Demand Drought Index under Climate Change, EGU General Assembly 2026, Vienna, Austria, 3–8 May 2026, EGU26-2958, https://doi.org/10.5194/egusphere-egu26-2958, 2026.

EGU26-3627 | Posters on site | HS2.4.13

Impacts of Land Use Change on Catchment Hydrological Variables under Climate Change 

Chen-Min Kuo, Patcharaporn Chanthaharn, Zhi-Mou Chen, and Ching-Nuo Chen

Climate change is altering precipitation regimes and temperature conditions, thereby modifying hydrological processes and water availability at the catchment scale. At the same time, land use change driven by human activities reshapes land surface characteristics, imperviousness, and energy balance, further influencing evapotranspiration and runoff generation. Understanding the combined effects of climate variability and land use change is therefore essential for assessing future hydrological responses and supporting sustainable water resources management. This study investigates the impacts of land use change under climate change on key hydrological variables in the Mudan Reservoir catchment in southern Taiwan, with a particular focus on changes in evapotranspiration and runoff.

Historical land use data from multiple periods are first compiled into a consistent land use database with unified classification schemes and spatial resolution. Land use transition patterns, temporal trends, and spatial hotspots of change are analyzed to characterize historical land use dynamics. Future land use scenarios are then simulated using the Patch-generating Land Use Simulation (PLUS) model, which integrates land expansion analysis and patch-based cellular automata to capture both transition mechanisms and realistic landscape patterns. These simulations provide spatially explicit land use projections at different future time horizons, serving as a foundation for hydrological analysis.

Climate forcing is derived from statistically downscaled AR6 climate projections provided by the Taiwan Climate Change Projection and Information Platform (TCCIP), representing future changes in precipitation and temperature. A long-term catchment water balance framework is established to quantify major hydrological components, including precipitation, evapotranspiration, and runoff. The relationship between land use composition and hydrological partitioning is examined, with particular emphasis on the evapotranspiration-to-precipitation ratio (ET/P) and runoff response under different land use conditions. A simplified land use–ET/P relationship is developed and applied in conjunction with future land use scenarios and climate projections to assess changes in evapotranspiration and runoff.

The results provide insights into how land use change and climate change jointly influence hydrological variability in reservoir catchments. By explicitly linking human-driven land use dynamics with climate-induced hydrological change, this study contributes to a better understanding of coupled human–natural systems and offers scientific support for reservoir operation and adaptive water resources management under a changing climate.

How to cite: Kuo, C.-M., Chanthaharn, P., Chen, Z.-M., and Chen, C.-N.: Impacts of Land Use Change on Catchment Hydrological Variables under Climate Change, EGU General Assembly 2026, Vienna, Austria, 3–8 May 2026, EGU26-3627, https://doi.org/10.5194/egusphere-egu26-3627, 2026.

The Haihe River Basin in northern China is one of the most water-stressed regions characterized by limited natural water resources, intensive groundwater exploitation, and a water use structure dominated by agricultural irrigation. In recent years, partial groundwater recovery has been observed in some areas, driven by large-scale water diversion projects, groundwater abstraction control policies, improved irrigation efficiency, and favorable climatic conditions. However, whether this recovery represents a sustainable transition or a temporary, human-regulated phenomenon under climate variability remains unclear.

In this study, we employ a coupled surface–subsurface hydrological model (CWatM–MODFLOW) to quantify the combined impacts of climate change and human water use on basin-scale water resources. The model explicitly represents surface water–groundwater interactions and dynamically simulates irrigation water demand and other sectoral water withdrawals within the hydrological system.

Model simulations with multiple future climate scenarios are conducted to investigate potential changes in water availability, water demand, and their combined effects on the spatial and temporal patterns of water stress across the basin. By jointly analyzing projected water resources and irrigation-dominated water consumption, this study aims to disentangle the relative contributions of climate forcing and anthropogenic activities to future water scarcity and groundwater sustainability in the Haihe River Basin.

The outcomes of this work are expected to improve understanding of how climate change and human water use may influence water availability and stress patterns in the Haihe River Basin.

How to cite: Chen, Y. and Zhang, J.: Disentangling Climate and Anthropogenic Impacts on water resources in the Haihe River Basin using a coupled surface–subsurface model, EGU General Assembly 2026, Vienna, Austria, 3–8 May 2026, EGU26-4173, https://doi.org/10.5194/egusphere-egu26-4173, 2026.

Against the backdrop of escalating global climate change and human activities, vegetation cover dynamics, as a vital ecological indicator, have profound implications for ecosystem protection, making its monitoring an imperative for sustainable management. The Northwest Plain Region of Shandong Province, a vital agricultural and economic zone in China, experiences vegetation dynamics that significantly influence regional climate regulation and water resource conservation. By integrating normalized difference vegetation index (NDVI) with climatic and anthropogenic data, trend analysis, partial correlation, and GeoSHAP were used to comprehensively assess the spatiotemporal evolution and key driving factors of vegetation cover in the Northwest Plain of Shandong Province (2000–2024). The findings indicate an overall upward trend in vegetation cover, particularly in areas with concentrated human activities. Climatic factors, such as evaporation and temperature, exhibit a positive correlation with vegetation growth, while land use changes emerge as one of the key drivers influencing vegetation dynamics. The findings offer a scientific foundation for ecological protection and land management in the Northwest Plain of Shandong and similar regions, supporting informed decision-making for effective vegetation restoration and conservation strategies.

How to cite: Sun, J., Shi, Y., and Huang, J.: The Impact of Climate Change and Human Activities on Spatiotemporal Variations in Vegetation Coverage in the Northwest Plain Region of Shandong Province, China, EGU General Assembly 2026, Vienna, Austria, 3–8 May 2026, EGU26-4465, https://doi.org/10.5194/egusphere-egu26-4465, 2026.

EGU26-5668 | Orals | HS2.4.13

Attributing and Scaling Climate Change Impacts on Floods Through Causal Chains 

Conor Murphy, Mohamed Bile, Saoirse Fordham, Robert L. Wilby, Sean Donegan, Ed Hawkins, Jamie Hannaford, Louise Slater, Tom Matthews, Shaun Harrigan, and Ciara Ryan

Understanding whether and why observed flood hazards are changing remains a central challenge for hydrology. While event-based attribution has advanced rapidly, robust attribution of changes in observed flood series remains difficult due to the integration of exogenous climatic forcing with endogenous catchment change (e.g. urbanisation, landuse change) and data quality challenges (especially for extremes). Here we develop and apply a causal-chain framework to detect, attribute, and scale changes in annual maximum floods using observational data. Taking the Shannon catchment in Ireland as an exemplar, we i) identify causal chains to reconstruct annual maximum instantaneous discharge from flood-relevant precipitation indices, ii) separate climate-driven and residual components of observed change, iii) evaluate the emergence of a climate change signal in causal chains by regressing (multiple linear regression) local precipitation indices onto global mean surface temperature (GMST), and iv) employ these results to scale local changes in flood magnitude to observed and future changes in GMST. Results show that increases in flood magnitude across the catchment are predominantly climate-driven, with multi-day precipitation totals representing antecedent conditions, particularly annual 30-day maxima and the number of very wet days in winter, emerging as the dominant causal pathways. These precipitation indices exhibit detectable warming-related signals that have emerged from variability and explain a substantial proportion of observed increasing flood trends at all sites (ranging between 28 and 93 percent). Residual trends highlight the role of endogenous catchment factors, especially data quality, changing hydrometric conditions and arterial drainage. By linking local flood discharge directly to GMST via causal chains, the framework quantifies catchment-specific flood sensitivity expressed as percentage change per degree of warming, enabling scaling to future warming levels. Results indicate that flood sensitivity per degree increase in GMST varies substantially across catchments, ranging from 8 to 18 percent per degree warming across the catchment sample. The approach provides an observation-based framework for flood attribution, leveraging established methods to bridge trend detection, process understanding, and climate scaling. Moreover, the approach can identify sensitive catchments, sentinel indices for monitoring floods and help better inform adaptation strategies. The approach is readily transferable to other catchments and hydrological extremes.

How to cite: Murphy, C., Bile, M., Fordham, S., Wilby, R. L., Donegan, S., Hawkins, E., Hannaford, J., Slater, L., Matthews, T., Harrigan, S., and Ryan, C.: Attributing and Scaling Climate Change Impacts on Floods Through Causal Chains, EGU General Assembly 2026, Vienna, Austria, 3–8 May 2026, EGU26-5668, https://doi.org/10.5194/egusphere-egu26-5668, 2026.

Water-related ecosystem services (WES) underpin water security but are increasingly threatened by concurrent climate change and land-use change. Yet reliable, generalizable attribution evidence remains limited, because most studies are single-basin and do not explicitly separate climatic and anthropogenic drivers. Here, we implement a scenario-based attribution framework that uses controlled scenario contrasts (climate-only, land-use-only, and coupled scenarios) to quantify and compare the relative contributions of climate and land-use change to two key WES (i.e., water yield and water purification services), and to project WES trajectories for 2020-2100. Using the InVEST Annual Water Yield and Nutrient Delivery Ratio modules, we estimate annual water yield and total nitrogen (TN) export across 17 representative watersheds in China spanning diverse hydroclimatic and landscape settings, and assess WES responses across scenario types. Results show a clear contrast in dominant drivers: climate change affects water yield more than water purification, whereas land-use change affects water purification more than water yield. Climate change contributed >90% to water yields in 15 out of the 17 watersheds; it was 79.4% in the Hei River and only 11.2% in the Yarkant River. For TN export, climate change had a larger influence than land-use change in eight watersheds, exceeding 95% in the Min and Mintuo rivers. For TN export (water purification), climate change had a larger contribution than land-use change in 8 of the 17 watersheds ( >95% in the Min and Mintuo rivers), whereas land-use change dominated in the remaining 9 watersheds ( >95% in the Dongting Lake and Hei River basins). These cross-watershed attribution results identify where climate adaptation versus land-use management is likely to be most effective for sustaining water yield and water quality under future change. The aim of this study is to provide cross-basin attribution evidence that helps target climate adaptation and land-use management to sustain water yield and water quality under future change.

How to cite: Huang, X., Yu, C., and Xu, Z.: Predicting water ecosystem services under prospective climate and land-use change scenarios in typical watersheds distributed across China, EGU General Assembly 2026, Vienna, Austria, 3–8 May 2026, EGU26-7783, https://doi.org/10.5194/egusphere-egu26-7783, 2026.

EGU26-9115 | ECS | Orals | HS2.4.13

Agricultural management and Climate Change Impacts on Catchment-Scale Water Fluxes − the Role of  Soil Organic Carbon 

Malve Heinz, Bettina Schaefli, Annelie Holzkämper, and Christoph C. Raible

Soil organic carbon (SOC) can be heavily influenced by climate change via temperature-enhanced SOC mineralization and by agricultural management via soil degradation from intensive agriculture. In contrast, climate-mitigation leads to sequestering of carbon and increasing SOC and can enhance soil water retention, which may support agricultural production under increasing summer droughts.  Here, we investigate how agricultural management–induced changes in soil organic carbon (SOC) interact with climate change to shape future catchment-scale hydrology.  The study area is the Broye catchment in western Switzerland. The study employs scenario-based hydrological simulations with the distributed hydrological model mHM, which is driven by CH2025 climate scenarios for Switzerland. These newly available scenarios combine CMIP5-based EURO-CORDEX regional climate simulations and statistical downscaling techniques with insights from CMIP6, to obtain high-resolution (1km × 1km) Swiss climate scenarios. With this model chain, we contrast a no-adaptation pathway characterized by management- and warming-driven SOC decline with SOC-enhancing management pathways that promote SOC accumulation (organic amendments, minimum tillage, or biochar application). We present and discuss the hydrological responses to the two pathways, focussing on changes in evapotranspiration, runoff, and low-flow frequency and evaluate the robustness of responses to climate projection uncertainty. Given that climate projections are often large sources of uncertainty in hydrological simulations, robustness is evaluated based on inter-model agreement, allowing us to distinguish which SOC-induced changes in key processes and metrics (e.g., evapotranspiration, discharge, and low-flow frequency) are consistent and which remain ambiguous.

How to cite: Heinz, M., Schaefli, B., Holzkämper, A., and Raible, C. C.: Agricultural management and Climate Change Impacts on Catchment-Scale Water Fluxes − the Role of  Soil Organic Carbon, EGU General Assembly 2026, Vienna, Austria, 3–8 May 2026, EGU26-9115, https://doi.org/10.5194/egusphere-egu26-9115, 2026.

Abstract

Groundwater-dependent ecosystems (GDEs) play a crucial role in maintaining ecological stability and biodiversity, particularly in arid and semi-arid regions. However, in many areas, the location and extent of GDEs remain unidentified, and existing protective measures are insufficient. This study investigates terrestrial GDEs within the North China Plain (NCP), a region increasingly affected by groundwater depletion due to rapid urbanization and intensive agriculture. By integrating multi-source remote sensing datasets, Random Forest (RF) modeling, and GIS-based Multi-Criteria Decision Analysis (MCDA), we mapped the spatial distribution and assessed the temporal dynamics of GDEs across the region. Predictor variables included hydrological and vegetation indices, land cover, and topographic factors. The RF model was trained on georeferenced points and optimized through hyperparameter tuning. Spatiotemporal analysis revealed divergent trends in GDE distribution, with declines likely driven by groundwater stress or land degradation, while expansions likely attributed to improved groundwater recharge, increased ecological conservation efforts, and land use changes. Comparative analysis indicates that most of the GDEs identified in recent years have newly emerged, while a moderate proportion remained stable. Moderate-to high-probability GDE zones identified via MCDA were consistently classified as GDEs by the RF model, highlighting the robustness of this integrated framework. These findings offer critical insights into the evolving distribution of GDEs and provide a decision-support framework for ecological monitoring and sustainable groundwater management.

Keywords: Groundwater-dependent ecosystems; Terrestrial GDE; North China Plain; Random Forest; Multi-Criteria Decision Analysis; GDE dynamics

How to cite: Batsuuri, B.: Spatial Identification and Dynamics of Groundwater-Dependent Ecosystems in the North China Plain: An Integrated Random Forest and Multi-Criteria Decision Analysis Approach, EGU General Assembly 2026, Vienna, Austria, 3–8 May 2026, EGU26-9975, https://doi.org/10.5194/egusphere-egu26-9975, 2026.

EGU26-10156 | ECS | Posters on site | HS2.4.13

A proposed framework for disentangling land use change from other influences on catchment hydrology 

Fadilath Kate, Louise Mimeau, and Jean-Philippe Vidal

Assessing the evolution of the hydrology of a catchment with multiple human influences over a long period remains an open question. Among these influences, changes in land use represent a potentially major driver of long-term hydrological change. Over the past centuries, many catchments have experienced significant transformations in land cover and water uses, leading to substantial consequences on flow regime and water balance components. In France, forested area has significantly increased over the past 150 years, and this land use long-term dynamics is reflected in Allier catchment (Massif Central) covering approximately 2700 km2. Originally dominated by 46% of cultivated land in the late 19th century, this catchment experienced a decline to 17% in the 21th century to the benefit of forests, which increased from 16% to 47% over the same period.

This study aims to analyze how long-term change in land use and other human activities has modified the catchment hydrology, and to quantify the relative contribution of each type of influence. The proposed methodology is based on hydrological modelling with J2000, a spatially distributed model that allows to reconstruct different water balance components, taking into account land use dynamics, water withdrawals, and reservoir management. Historical information from maps, archives, combined with hydroclimatic data, is used to define 3 30-year periods considered as stationary over a 150-year timeline. Model simulations are performed for each period considering uncertainty related to data availability and quality in order to evaluate changes in streamflow dynamics and water balance components.

This work presents the overall framework of a project aiming at representing historical long-term land use changes in hydrology modelling. By focusing on the historical evolution of land use, the project explores the impact of all anthropogenic drivers on the hydrology of the catchment. Results are expected to enhance the interpretation of past hydrological changes and to open perspectives for future modelling in anthropogenic catchments.

How to cite: Kate, F., Mimeau, L., and Vidal, J.-P.: A proposed framework for disentangling land use change from other influences on catchment hydrology, EGU General Assembly 2026, Vienna, Austria, 3–8 May 2026, EGU26-10156, https://doi.org/10.5194/egusphere-egu26-10156, 2026.

EGU26-13344 | Posters on site | HS2.4.13

How do anthropogenic activities affect key hydrological indicators in German catchments? 

Tam Nguyen, Christian Siebert, Andreas Musolff, Jan Fleckenstein, and Ralf Merz

For more than a millenia, human activities have significantly altered various aspects of the hydrological cycle through structural interventions and land-use and land-cover changes. Understanding the magnitude and impacts of these alterations is critical to define a near-natural water cycle. In this study, we clustered more than 1,500 German catchments from the CAMELS-DE dataset into near-natural and non-natural groups based on a comprehensive set of criteria. These criteria regard artificial structures (e.g., dam, reservoir, weir, and others in-stream structures), land-use land-cover characteristics (e.g., fraction of agricultural and artificial lands), and water abstractions (e.g., surface and groundwater abstractions). We then selected a range of hydrological indicators, including actual evapotranspiration, runoff-related metrics, soil moisture, groundwater recharge, and groundwater-level dynamics to evaluate the impact of alterations. Values for these indicators will be derived for both near-natural and non-natural catchment groups using publicly available in situ observations, remote-sensing products, and hydrological modelling approaches. By comparing hydrological indicators across catchment groups while accounting for topographical and geological catchment characteristics, this study aims to improve our understanding of the impacts of human activities on different components of the hydrological cycle to ultimately restore near-natural and resilient conditions.

How to cite: Nguyen, T., Siebert, C., Musolff, A., Fleckenstein, J., and Merz, R.: How do anthropogenic activities affect key hydrological indicators in German catchments?, EGU General Assembly 2026, Vienna, Austria, 3–8 May 2026, EGU26-13344, https://doi.org/10.5194/egusphere-egu26-13344, 2026.

EGU26-13658 | ECS | Posters on site | HS2.4.13

Land Cover Change Modulates River Flow Responses to Climate Variability in Central Chile 

Rossana Escanilla-Minchel, Joseph Holden, and Mark Smith

There are growing concerns regarding the hydrological impacts of native forest loss and exotic plantation expansion; yet these effects remain poorly constrained in regions where climate variability associated with the El Niño–Southern Oscillation (ENSO) may mask underlying land cover change signals. In addition, legacy soil conditions inherited from previous land uses can further modulate hydrological responses. This study examines the combined influence of land cover change, and ENSO variability on river flow dynamics in coastal catchments of central Chile.

Using a 45-year hydroclimatic dataset (1979–2023), we analysed seasonal and annual streamflow trends across four catchments with contrasting land cover trajectories. Significant streamflow declines were detected in four catchments, particularly during summer, when water availability is most critical. Catchments experiencing 4–9% native forest loss exhibited reduced baseflows, whereas catchments with largely preserved native forest cover maintained or even increased summer flows. Interaction analyses indicate that native forest cover enhances precipitation–runoff conversion, while exotic plantations reduce runoff efficiency (precipitation × land cover interactions; R² = 0.46–0.77, negative slopes). ENSO phases alone explained little streamflow variability (R² < 0.04), but significant ENSO-precipitation interactions across all catchments (p < 0.001) highlight an indirect, yet consistent, climatic influence.

To extend these observational findings and explore underlying hydrological processes, a physically-based hydrological model (SWAT) was implemented for the study catchments. Model calibration and validation show satisfactory performance, providing a robust basis for scenario-based simulations. Ongoing modelling explores the relative and combined impacts of land cover change and climate variability on streamflow under current conditions. The integration of long-term observations with process-based modelling offers new insights into how vegetation change modulates hydrological resilience to climate variability, with important implications for water security and ecosystem management in this type of regions.

How to cite: Escanilla-Minchel, R., Holden, J., and Smith, M.: Land Cover Change Modulates River Flow Responses to Climate Variability in Central Chile, EGU General Assembly 2026, Vienna, Austria, 3–8 May 2026, EGU26-13658, https://doi.org/10.5194/egusphere-egu26-13658, 2026.

EGU26-20232 | Orals | HS2.4.13

Modeling Climate Change and Human Pressure in Karst Systems: Insights from Mediterranean Springs in France and Morocco 

Enola Fabre, Hervé Jourde, Yves Tramblay, Lahoucine Hanich, and Pascal Brunet

The Mediterranean basin is particularly vulnerable to climate change. These changes are potentially impacting groundwater resources and aquifer recharge. In this context, reducing vulnerability to hydrological extremes (drought and flooding) and preserving both the quantity and quality of the resource are two key priorities for public authorities. Hydrogeological simulations are conducted based on different climate scenarios to provide information on how the resource may evolve in various scenarios. The hydrographic basin of the Lez spring is located in southern France. It is a basin composed of Upper Cretaceous and Lower Jurassic rocks, which are highly karstified. The spring of this basin is used to supply drinking water to the Montpellier metropolitan area (approximately 400,000 residents), generating strong pressure on this resource. The hydrogeological catchment of the Asserdoune karst spring, located in northern Morocco, is actively used to supply Beni Mellal (280,000 residents) with drinking water. The two main objectives of this study are (i) to assess long-term trends in climatic (rainfall, temperature, potential evapotranspiration) and hydrological variables (spring and river discharges) and (ii)  to develop hydrological projections based on CMIP6 climate projections under the SSP2-4.5 and SSP5-8.5. For the Lez spring, these climate projections are coupled with anthropogenic withdrawal projections, developed in collaboration with water managers. The trend analysis results indicated a strong increase in temperature and evapotranspiration, but contrasting trends in precipitation between France and Morocco.  The modeling of groundwater recharge and availability under different climatic and anthropogenic scenarios could provide a better understanding of the evolution of the resource at different time horizons, and support the decisions taken by water resource managers. 

How to cite: Fabre, E., Jourde, H., Tramblay, Y., Hanich, L., and Brunet, P.: Modeling Climate Change and Human Pressure in Karst Systems: Insights from Mediterranean Springs in France and Morocco, EGU General Assembly 2026, Vienna, Austria, 3–8 May 2026, EGU26-20232, https://doi.org/10.5194/egusphere-egu26-20232, 2026.

HS2.5 – Global and (sub)continental hydrology

EGU26-861 | ECS | Orals | HS2.5.1

Re-conceptualising the continental-scale co-evolution of hydrological and nitrogen cycles under water age framework 

Songjun Wu, Chris Soulsby, Yi Zheng, and Doerthe Tetzlaff

A key limitation in advancing ecohydrological understanding stems from the long-standing neglect of explicitly representing water velocities in models. Consequently, hydrological and water quality modelling often remains a grey box—capable of reproducing streamflow or solute dynamics, yet often for the wrong reasons. Stable water isotopes can bridge this knowledge gap, as their dynamics reflect integrated effects of transport and mixing along hydrological flow paths. Therefore, we developed EcoTWIN, a tracer-aided, fully distributed, process-based ecohydrological model that simultaneously tracks water, isotopes, and nitrogen fluxes. The model was applied to 3,821 European catchments at 5-km spatial and daily temporal resolution (1980–2024), and validated against discharge, in-stream isotope, and nitrate data from 1,218 sites, as well as remote sensing products and literature reports.

Through isotopic simulation, EcoTWIN provides novel insights into the velocities of the water cycle, complementing previous research focusing primarily on its celerity and magnitude. This allows a re-conceptualisation of the co-evolution of water and nitrogen cycles through the lens of water velocity. Under this water age framework, distinct hydrological–biogeochemical regimes were mapped along multiple geographic and hydroclimatic gradients across Europe, revealing how water velocity governs nitrogen retention versus export since 1980s. By quantifying the variability of transport (soil residence time) and reaction timescales (time required to remove nitrogen storage via denitrification and plant uptake), we identified four co-evolutionary schemes of water and nitrogen cycling over 1980-2024, which were dominated by the magnitudes of hydrological acceleration/deceleration: moderate hydrological shifts mitigated nitrogen leaching, whereas intense acceleration/deceleration of water cycling exacerbated soil nitrogen leaching/accumulation.

Projections towards 2100 further revealed an uncertain future of coupled water–nitrogen dynamics. Under low-emission scenario (SSP1-2.6), moderate hydrological shifts lengthened reaction times and enhanced biological uptake/denitrification, thus alleviating nitrogen leaching. In contrast, intensified droughts under high-emission scenario (SSP5-8.5) may trigger pronounced deceleration of water cycling in Eastern and Southern Europe, leading to moisture-driven suppression on nitrogen uptake and subsequent nitrogen accumulation. Such dual vulnerability of water quantity and quality is likely not confined to Europe but extends to Central and East Asia where water storage decline is ongoing and projected to intensify. This underscores the need to further extend water age frameworks to the global scale to better understand the coupled hydrological–biogeochemical resilience under climate change. Such insights can inform sustainable land management strategies to safeguard water quality and ecosystem resilience in a warming world.

How to cite: Wu, S., Soulsby, C., Zheng, Y., and Tetzlaff, D.: Re-conceptualising the continental-scale co-evolution of hydrological and nitrogen cycles under water age framework, EGU General Assembly 2026, Vienna, Austria, 3–8 May 2026, EGU26-861, https://doi.org/10.5194/egusphere-egu26-861, 2026.

EGU26-862 | ECS | Posters on site | HS2.5.1

Continental-scale assessment of hydrological cycle across Europe under anthropogenic warming 

Vishal Thakur, Yannis Markonis, Simon Michael Papalexiou, and Oldrich Rakovec

Climate change is fundamentally altering the spatial and temporal dynamics of the hydrological cycle, with profound implications for water security, ecosystem stability, and regional climate resilience. Building on the framework of Thakur et al. (2025), which evaluated how PET-method choices influence historical hydrological trendswe extend the framework to future conditions using CMIP6-based ISIMIP3b projections. We assess changes in precipitation (P), runoff (Q), total water storage (TWS), and actual evapotranspiration (AET) at 1°C, 2°C, and 3°C global warming levels across 553 European catchments. Using 165 mesoscale Hydrologic Model (mHMsimulations per catchment (five GCMsthree SSPs, 11 PET methods, we introduce a framework to detect emerging hydrological cycle patterns based on trend combinations. quantify projection agreement using the Data Concurrency Index (DCI) and characterize uncertainty with two complementary metrics that capture variability (ψ) and temporal inconsistency (χ) for each warming level and hydrological variable. 

Our findings show a marked expansion in the spatial extent of negative trends in P, Q, and TWS with increasing warming, while AET trends are positive in over 96% of catchments.  More than two-thirds of catchments follow clear wetting (W1) or drying (D1) hydrological cycle patterns, with D1 becoming increasingly dominant at higher warming levels. PET methods offer consistent directional agreement, but GCMs contribute the most disagreement, particularly for Q and TWS. Even with these coherent signals, uncertainty (ψ and χ) remains substantial and increases with warming. Although the PET contribution increases, it consistently remains below that from GCMs and SSPs. 

Reference:

Thakur, V., Markonis, Y., Kumar, R., Thomson, J. R., Vargas Godoy, M. R., Hanel, M., and Rakovec, O.: Unveiling the impact of potential evapotranspiration method selection on trends in hydrological cycle components across Europe, Hydrol. Earth Syst. Sci., 29, 4395–4416, https://doi.org/10.5194/hess-29-4395-2025, 2025

How to cite: Thakur, V., Markonis, Y., Papalexiou, S. M., and Rakovec, O.: Continental-scale assessment of hydrological cycle across Europe under anthropogenic warming, EGU General Assembly 2026, Vienna, Austria, 3–8 May 2026, EGU26-862, https://doi.org/10.5194/egusphere-egu26-862, 2026.

EGU26-2789 | ECS | Posters on site | HS2.5.1

Advancing our understanding of water quality requires a multi-scale approach to groundwater-surface water connections 

Imke Brakebusch and Robert Reinecke and the TRAILS

Both groundwater quality and quantity must be considered to meet the demand for safe drinking water for humans, irrigation water for agriculture, process water for industry, and to sustain ecosystem health. While groundwater quality processes at the catchment or aquifer scale have been studied intensively, such studies are lacking at the regional-to-continental and especially global scale. This gap may be the missing link to better assess long-term effects that may develop into creeping catastrophes, as well as the impacts of climate change and the associated intensification of hydrological extremes on groundwater quality. We hypothesize that the key to understanding groundwater quality processes lies in a multi-scale approach that represents interactions between groundwater and surface water, including coastal systems. With multi-scale, we refer to the necessity of understanding processes at their respective temporal (e.g., long-lasting legacy effects vs. extreme events) and spatial (pore scale, catchment vs. large or even global scale) scales and their connectiveness in which spatially small and temporally short impacts might emerge into future impacts that are spatially large and temporally long. To develop this multi-scale understanding, we require an inventory of dominant processes across temporal and spatial scales, informed by local-scale knowledge that already exists. Perceptual models can be effectively used not only to represent expert knowledge graphically but also to identify knowledge gaps and clearly communicate the assumptions embedded in our current understanding of dominant processes. This poster outlines the DFG-funded TRAILS (Towards a multi-scale understanding of gRoundwater quAlity InterLinkageS) network's efforts to gain this multi-scale understanding of groundwater. It presents our initial efforts towards a collective perceptual model, informed by existing literature, that identifies the dominant processes affecting groundwater quality across multiple temporal and spatial scales. Our goal is to use this knowledge to apply existing knowledge in new contexts and to gain new multi-scale understanding towards developing new approaches, such as large-scale modeling tools.

How to cite: Brakebusch, I. and Reinecke, R. and the TRAILS: Advancing our understanding of water quality requires a multi-scale approach to groundwater-surface water connections, EGU General Assembly 2026, Vienna, Austria, 3–8 May 2026, EGU26-2789, https://doi.org/10.5194/egusphere-egu26-2789, 2026.

EGU26-4903 | ECS | Posters on site | HS2.5.1

Propagation of meteorological drought to groundwater in Europe 

Aimee Lenthall, Shams Rahman, and Fai Fung

Groundwater is a vital natural resource, providing the primary source of freshwater for billions of people across the globe and supporting a diverse range of groundwater-dependent ecosystems. Groundwater drought, which is defined as a prolonged period of below-normal groundwater levels, threatens our reliance on this important resource. This can lead to a wide variety of detrimental impacts on society, the environment and the economy. Despite this, our understanding of groundwater drought has historically been restricted. This can be attributed to the poor availability of in-situ groundwater data, as well as limitations in our understanding of how effectively existing models are able to simulate groundwater drought. By combining newly available in-situ observations from nearly 2,000 wells, provided by the International Groundwater Resources Assessment Centre (IGRAC), with a continental-scale model over Europe, this study addresses this knowledge gap. In addition to characterising groundwater drought, this study evaluates the capability of the model to propagate meteorological droughts to groundwater across the continent, using in-situ observations for validation.

How to cite: Lenthall, A., Rahman, S., and Fung, F.: Propagation of meteorological drought to groundwater in Europe, EGU General Assembly 2026, Vienna, Austria, 3–8 May 2026, EGU26-4903, https://doi.org/10.5194/egusphere-egu26-4903, 2026.

EGU26-4978 | ECS | Posters on site | HS2.5.1

Flood monitoring with high-resolution TWS data from satellite gravimetry 

Yuqian Guo, Andreas Güntner, Milena Latinovic, and Bruno Merz

The wetness conditions of a river basin, besides rainfall characteristics, are important factors for the amount of runoff that is generated, eventually leading to a flood event. Satellite gravimetry with GRACE and its successor mission GRACE Follow-On (GRACE-FO) allows for retrieving terrestrial water storage (TWS) anomalies by measuring temporal variations of the Earth’s gravity field.

In this study, we use TWS anomalies derived from daily GRACE/GRACE-FO data downscaled to a 50 km global resolution. This opens the possibility of estimating the wetness conditions before and during flood events. We collect a set of historical flood events at the global scale from multiple sources, including Dartmouth Flood Observatory (DFO). To complement our analysis, we use additional datasets, such as the GRDC global river discharge database. Within these datasets, flood events are identified as periods where hydrometeorological time series (e.g., river discharge, cumulative precipitation, or soil moisture) exceed certain thresholds. During flood events, we check whether exceptionally high storage or discharge anomalies can be observed in the GRACE-based high-resolution TWS. The evaluation is based on correlation analysis of the temporal event dynamics to assess the consistency in the timing and magnitude of peaks. Furthermore, we assess which regional scales (down to <100,000 km²), flood types, and hydro-climatological zones yield the most prominent signals. We expect stronger TWS anomalies for rainfall-driven floods and flood events of larger magnitude. The results can contribute to improving global flood monitoring and flood early warning systems.

How to cite: Guo, Y., Güntner, A., Latinovic, M., and Merz, B.: Flood monitoring with high-resolution TWS data from satellite gravimetry, EGU General Assembly 2026, Vienna, Austria, 3–8 May 2026, EGU26-4978, https://doi.org/10.5194/egusphere-egu26-4978, 2026.

EGU26-5500 | ECS | Orals | HS2.5.1

Reconceptualizing global groundwater risk beyond stress metrics 

Sara Nazari, Robert Reinecke, and Nils Moosdorf

Groundwater, Earth’s largest source of liquid freshwater, sustains ecosystems and provides freshwater supply for billions of people worldwide. Increasing reliance on groundwater resources, together with climate-driven changes in recharge, places growing pressure on aquifers, contributing to depletion and threatening both ecosystem integrity and socio-economic stability. Global assessments of groundwater stress remain largely based on hydroclimatic indicators, offering limited insight into how physical pressures translate into societal consequences, or why similar levels of groundwater stress can lead to markedly different outcomes across regions. Here, we advance a global approach to groundwater risk assessment that moves beyond stress metrics by jointly considering physical groundwater pressures, the presence of human populations and groundwater-dependent assets, and the societal capacity to cope with and respond to stress. Applied globally at high spatial resolution for the early 21st century, this approach enables a systematic exploration of how spatial patterns of groundwater risk evolves when societal conditions are explicitly taken into account. Rather than focusing on single indicators, the analysis highlights pronounced spatial heterogeneity in risk patterns and demonstrates how societal conditions can amplify or dampen the severity of groundwater-related impacts, even under comparable levels of physical stress. We will identify regions where groundwater risk is most sensitive to changes in societal capacity, as well as priority areas where targeted investments in governance, infrastructure, and social resilience could most effectively reduce future groundwater risk under rising water demand and climate change.

How to cite: Nazari, S., Reinecke, R., and Moosdorf, N.: Reconceptualizing global groundwater risk beyond stress metrics, EGU General Assembly 2026, Vienna, Austria, 3–8 May 2026, EGU26-5500, https://doi.org/10.5194/egusphere-egu26-5500, 2026.

EGU26-6094 | ECS | Posters on site | HS2.5.1

Performance of Non-Linear Evaporation Complementary Relationships: A Global Basin-Scale Intercomparison 

Xuxin Lei, Lei Cheng, Lu Zhang, Chenhao Fu, Shuai Wang, and Pan Liu

Long-term catchment water balance is generally described as precipitation (P) equaling the sum of runoff (Q) and evaporation (E). While P and Q are reliably observed, accurately observing or estimating E remains a great challenge. The generalized complementary relationship (GCR), as the latest development of the complementary principle, addresses this by describing land-atmosphere interactions through various functions, including sigmoid (denoted as H18), polynomial (B15), exponential (G21), and power (S2, S1, and S0), offering a promising approach for long-term watershed evaporation estimation. Evaluating the performance of these different functions is key to enhance estimation accuracy and support better hydrological modeling at the catchment scale. The modeling performance and parameters of six typical GCR functions are investigated in global 2112 catchments. Results indicated that all non-linear GCR functions can  well estimate multi-year average evaporation, with a determination coefficient (R2) of 0.93 ± 0.06. Performance and parameters exhibit obvious spatial variability, which depend on catchment attributes to a certain extent. Specifically, model performance demonstrates higher linear correlation with net radiation, water vapor pressure deficit, and normalized difference vegetation index (NDVI); whereas parameters are more strongly linked to aridity index (AI), NDVI. All six GCR-based functions perform well in catchments with moderate humidity by properly calibrating shape and complementary parameters, but some (i.e., H18, G21, S0, and S1) have limitations or become inapplicable under extremely wet or dry conditions.

How to cite: Lei, X., Cheng, L., Zhang, L., Fu, C., Wang, S., and Liu, P.: Performance of Non-Linear Evaporation Complementary Relationships: A Global Basin-Scale Intercomparison, EGU General Assembly 2026, Vienna, Austria, 3–8 May 2026, EGU26-6094, https://doi.org/10.5194/egusphere-egu26-6094, 2026.

EGU26-6151 | ECS | Posters on site | HS2.5.1

Multi-source comparison of recent terrestrial evapotranspiration trends: Introducing a topology framework. 

Johanna R. Thomson, Yannis Markonis, Riya Dutta, Simone Fatichi, Martin Hanel, Akash Koppa, Petr Maca, Mijael Rodrigo Vargas Godoy, and Athanasios Paschalis

Evapotranspiration (ET) plays a central role in the terrestrial water cycle by coupling water, energy, and carbon exchanges between land and atmosphere. A Recent intercomparison of global ET products (Thomson and Markonis, 2024) revealed substantial uncertainties in estimated ET trends, including strong product dependence in magnitude, spatial patterns, statistical significance, and even trend direction.

Here, we extend this work by introducing a topology framework that categorizes ET products based on their trend signatures. We processed and harmonized 14 global ET products—derived from reanalysis, remote sensing, synthesis approaches, and land surface models—onto a common 0.25° × 0.25° grid for the period 2000–2019. ET trends and associated significance were estimated using a block-bootstrapped Theil–Sen estimator at the grid scale and across meaningful spatial groupings, including IPCC reference regions, biomes, land-cover classes, Köppen–Geiger climate zones, elevation classes, and evaporation quantiles.

Using this catalogue of recent ET trends and trend indices, such as the dataset concurrence index (DCI), we construct product-specific topologies by ranking the area fraction associated with characteristic behaviors including positive and negative signal boosters, and several forms of opposition.

Globally, we find that “top negative signal boosters” are also “top outliers”. This means that top outliers are products that produce significant negative trends where all other significant trends are positive. This is caused by a majority of products producing positive trends. However, “top positive signal boosters” tend to be “top signal opposers”. These products have significant positive trends where the majority of products have nonsignificant trends. Both tendencies are true for a range of p-value thresholds. As a result, apparent large-scale ET trend signals are often driven by a limited number of products rather than by broad inter-product agreement.

These topologies transform complex multi-product trend information into intuitive categories, enabling systematic identification of product-specific uncertainties and agreement patterns in large-scale ET trend assessments. This framework provides a new basis for categorizing ET products supporting interpretation of large-scale ET changes and data selection.

Thomson, J. and Markonis, Y.: Multi-source analysis of recent changes in global terrestrial evapotranspiration, EGU General Assembly 2024, Vienna, Austria, 14–19 Apr 2024, EGU24-917, https://doi.org/10.5194/egusphere-egu24-917, 2024.

How to cite: Thomson, J. R., Markonis, Y., Dutta, R., Fatichi, S., Hanel, M., Koppa, A., Maca, P., Vargas Godoy, M. R., and Paschalis, A.: Multi-source comparison of recent terrestrial evapotranspiration trends: Introducing a topology framework., EGU General Assembly 2026, Vienna, Austria, 3–8 May 2026, EGU26-6151, https://doi.org/10.5194/egusphere-egu26-6151, 2026.

EGU26-6188 | Orals | HS2.5.1

MPR-enabled hydro-thermal soil physics in mHM: scaling and transferability tests 

Luis Samaniego, Afid Kholis, Pallav Kumar Shrestha, Ehsan Modiri, and Julia Boike

Obtaining accurate large-scale estimates of top-soil water content is a grand challenge in land-surface modelling [1]. Soil moisture (SM) is a key climate variable for understanding changes in the terrestrial water cycle [2], monitoring drought evolution [3], predicting drought severity [4], and improving flood forecasting by constraining antecedent wetness [5].  Predicting SM in extreme climates (paramo or permafrost) is further complicated by the coupling of soil water flow and heat transport. Decades of research have been invested in this subject, yet a scalable and transferable solution has not emerged.

Evidence from controlled multi-model experiments with harmonised forcings, geodata, and initial conditions (e.g., ESA https://4dhydro.eu/) suggests that epistemic uncertainty in simulated SM is dominated by model structure, soil parameterisations, and the scaling of soil properties.  The spread can be substantial; Wang et al. noted that "differences in model-predicted soil moisture can be quite large" [6]. A common narrative is that Richards-equation-based (RE) land-surface models are impractical at the kilometre scale: their effective parameters are difficult to infer, transfer across scales is often unsuccessful [7], and calibration against control variables such as streamflow is considered computationally intractable.  Simpler infiltration-capacity (IC) schemes or conceptual models, while readily calibrated against streamflow, are often assumed to yield poorer SM dynamics.

We revisit these assumptions by embedding a fast RE solver—the SLI module as implemented in CABLE [8,13]—into the mesoscale Hydrologic Model (mHM) and parameterising it with Multiscale Parameter Regionalization (MPR) [9].  MPR uses pedo-transfer relationships, high resolution physiographic datasets, and upscaling operators to derive effective, scale-consistent soil hydraulic parameters, while mHM provides the distributed water-balance and streamflow (Q)-based calibration framework. This design targets transferability across basins and resolutions. Using the results of Kholis et al. [10], we show that, when implemented in mHM, RE and IC yield similar streamflow performance under consistent calibration, while their SM states diverge. RE- and IC-based simulations agree on SM anomalies, but differ in volumetric water content, with discrepancies increasing with soil depth. The SLI module adds a thermal diffusion equation to mHM-RE, enabling joint tests of SM and soil temperature (Ts). We evaluate across German sites using station-based soil moisture and soil temperature observations and report mean daily performance of KGE(Q) = 0.89, KGE(SM) = 0.40 and KGE(Ts) = 0.90. In addition, we will present a first cold-region application using the 20-year Bayelva permafrost record (1998–2017) from Spitsbergen [11].

We conclude that (1) MPR enables practical parameterisation and scale transfer of RE across locations, (2) an RE+MPR SM module can be optimised without sacrificing streamflow skill, and (3) the mHM-RE infrastructure enables consistent multi-variable evaluation (SM and Ts), including EO-based benchmarking where available. Next steps include benchmarking against CryoGrid[12] and CABLE[13], extending evaluation to alpine and paramo observatories to probe combined hydro-thermal realism, and developing a long-term global SM reconstruction to advance state-of-the-art drought monitoring [2].

References:

[1] 10.1029/2010WR010090 
[2] 10.1126/science.adw5851
[3] 10.1088/1748-9326/11/7/074002
[4] 10.1029/2021EF002394
[5] 10.1038/s41467-024-48065-y
[6] 10.1175/2008JCLI2586.1
[7] 10.22541/essoar.174982768.80043676/v1
[8] 10.1016/j.jhydrol.2010.05.029
[9] 10.1029/2008WR007327
[10] 10.1029/2024WR039625
[11] 10.5194/essd-10-355-2018
[12] 10.5194/gmd-16-2607-2023
[13] 10.1002/2017MS001100

How to cite: Samaniego, L., Kholis, A., Shrestha, P. K., Modiri, E., and Boike, J.: MPR-enabled hydro-thermal soil physics in mHM: scaling and transferability tests, EGU General Assembly 2026, Vienna, Austria, 3–8 May 2026, EGU26-6188, https://doi.org/10.5194/egusphere-egu26-6188, 2026.

EGU26-6578 | ECS | Orals | HS2.5.1

Using river flood event drivers for model-intercomparison – a process-based analysis of global water models 

Lina Stein, Nirmal Kularathne, Robert Reinecke, Larisa Tarasova, Hannes Müller Schmied, Peter Burek, Simon N. Gosling, Manolis Grillakis, Aristeidis Koutroulis, Naota Hanasaki, Sebastian Ostberg, Yusuke Satoh, and Thorsten Wagener

Global water models are valuable tools for predicting river flood hazard in data‑scarce regions and under future climate scenarios. Their ability to produce spatially coherent projections means that their results can be used broadly for global or large‑scale scientific analysis and policy planning. However, the complexity of these models, together with the large volume of data they generate, creates challenges for evaluating how well they represent key processes. At long‑term climatic timescales, global water models show marked differences in the controlling processes for water‑balance components, as previous studies revealed. At event timescales, accurate representation of hydro‑meteorological dynamics requires consideration of multiple flood drivers, such as precipitation, soil moisture, or snowmelt.

In this analysis we compare simulations from six global water models (CWatM, H08, LPJmL, JULES‑W2, MIROC, and WaterGAP2) that were run within the international model‑comparison framework ISIMIP3a. We evaluate event drivers at the spatial scale of individual model cells (0.5°). We define high‑flow events as annual runoff maxima that exceed the 2‑year flood threshold. We classify potential drivers (short extreme rainfall, long extreme rainfall, soil moisture and snowmelt proxies). Drivers can be identified either individually or in combination with others (e.g., snowmelt + rainfall, soil moisture + rainfall, etc.).

We find that, in some models, extreme rainfall (short rain or short + long rain) often dominates high‑flow events, while other models show more influence from combinations of drivers such as snow or soil moisture. Except in snow‑dominated regions, all models share one feature: short extreme rainfall, either alone or combined with other factors, is part of the dominant flood driver almost everywhere. This has potentially significant consequences for future estimates of flood frequency under changing conditions. Still, the importance of antecedent soil moisture in flood generation remains ambiguous among the models, which contrasts with current process understanding and observation‑based analyses. This and other results demonstrate that process‑based model intercomparison provides valuable guidance for model development.

How to cite: Stein, L., Kularathne, N., Reinecke, R., Tarasova, L., Müller Schmied, H., Burek, P., Gosling, S. N., Grillakis, M., Koutroulis, A., Hanasaki, N., Ostberg, S., Satoh, Y., and Wagener, T.: Using river flood event drivers for model-intercomparison – a process-based analysis of global water models, EGU General Assembly 2026, Vienna, Austria, 3–8 May 2026, EGU26-6578, https://doi.org/10.5194/egusphere-egu26-6578, 2026.

EGU26-6682 | ECS | Orals | HS2.5.1

Advancing Large-Scale Water Cycle Understanding in the Danube River Basin by GRACE/-FO Data Assimilation 

Çağatay Çakan, Ehsan Forootan, Emmanuel Nyenah, Petra Dӧll, and Maike Schumacher

Extreme events such as droughts and floods can have severe socioeconomic and ecological impacts, particularly in transboundary basins like the Danube - the most international river basin in the world. Accurate water monitoring in this region is essential for effective water management and risk mitigation. Hydrological models play a key role in simulating these processes. However, their accuracy is often limited by structural uncertainties, parameterization errors, and imperfect forcing data. Data assimilation (DA) frameworks have proven effective in reducing these uncertainties, especially for terrestrial water storage (TWS) and its individual components. In this study, we assimilate satellite-derived TWS anomalies from the Gravity Recovery and Climate Experiment (GRACE) and its successor GRACE-FO into the WaterGAP Global Hydrology Model (WGHM) for the highly regulated Danube River Basin. Our results indicate that assimilating GRACE/-FO data into WGHM leads to notable improvements in water storage representation across the entire basin, reducing model uncertainties and aligning simulations more closely with independent observations. For example, high correlations of around 0.90 are observed for both the groundwater and soil water components after DA (0.82 and 0.93 for open loop run, respectively) indicating accurate representation of drying and wetting patterns. Although DA does not significantly improve streamflow simulations, they still exhibit reasonable Nash-Sutcliffe Efficiency (NSE) values of around 0.50. These findings highlight the potential of satellite-based DA frameworks to strengthen large-scale hydrological modeling and to support sustainable water resource management in transboundary basins.

How to cite: Çakan, Ç., Forootan, E., Nyenah, E., Dӧll, P., and Schumacher, M.: Advancing Large-Scale Water Cycle Understanding in the Danube River Basin by GRACE/-FO Data Assimilation, EGU General Assembly 2026, Vienna, Austria, 3–8 May 2026, EGU26-6682, https://doi.org/10.5194/egusphere-egu26-6682, 2026.

EGU26-7393 | ECS | Posters on site | HS2.5.1 | Highlight

Hydrological drought extents in a warming world in large Alpine river basins  

Joren Janzing, Niko Wanders, Paul Astagneau, and Manuela Brunner

Climate change affects different hydrological drought characteristics, including their spatial extent. This drought property is crucial for water management, as drought size can limit the effectiveness of drought mitigation strategies such as water transfers. As droughts propagate through the hydrological cycle, hydrological drought extent is influenced by meteorological factors such as precipitation and land-surface conditions such as soil moisture and snow cover. Each of these components responds differently to climate change and it remains unclear how their combined changes influence hydrological drought extent in the future. 

Here, we study the influence of climate change on spatial extent in droughts around the European Alps. We use climate projections from a single-model initial-condition large ensemble (SMILE) to run the PCR-GLOBWB model (at 1km resolution) over 4 major Alpine river basins (Danube, Rhine, Rhone, and Po rivers) until 2100. Using the resulting simulations, we study trends in drought extent, specifically focusing on the different components of the hydrological system such as meteorological, soil moisture and hydrological droughts.  

Our results indicate that trends in drought extent vary depending on the hydro-climatological characteristics of the Alpine basins considered. Furthermore, we highlight that trends in meteorological drought extent do not translate directly to trends in the extent of other hydrological components due to land surface processes. These findings can contribute to a better understanding of drought extent evolution, which can inform future water management decisions and lead to more robust drought mitigation strategies. 

How to cite: Janzing, J., Wanders, N., Astagneau, P., and Brunner, M.: Hydrological drought extents in a warming world in large Alpine river basins , EGU General Assembly 2026, Vienna, Austria, 3–8 May 2026, EGU26-7393, https://doi.org/10.5194/egusphere-egu26-7393, 2026.

EGU26-7645 | Posters on site | HS2.5.1

Strengthening global hydrological data sharing and capacity for climate science and water services  

Katie Facer-Childs, Lucy Barker, Sayali Pawar, Steve Turner, Jamie Hannaford, Harry Dixon, Alan Jenkins, Sulagna Mishra, Luis Roberto Silva Vara, Michael Schwab, Johanna Korhonen, Washington Otieno, and Dominique Berod

Global water systems are under increasing pressure from climate change, hydrological extremes, and competing demands on limited freshwater resources. Robust, interoperable data and data sharing infrastructures are essential to advance scientific understanding, support operational forecasting, and inform effective water management and climate adaptation strategies. The Reference Observatory of Basins for INternational hydrological climate change detection (ROBIN) and the Global Hydrological Status and Outlook System (HydroSOS) represent complementary international efforts to unify and leverage hydrological data for science and service delivery. 

ROBIN, coordinated by the UK Centre for Ecology & Hydrology, addresses critical gaps in global streamflow observations by integrating long-term, near-natural catchment data to form a global Reference Hydrometric Network. This open-access dataset, comprising >3000 of quality-controlled streamflow records from near-natural catchments spanning diverse climates and geographies, is shared under common standards and protocols to enable global-scale climate change trend detection, model evaluation, and large-scale hydrological research. The initiative also fosters long-term collaboration among researchers and institutions, promoting shared infrastructure, code libraries, and harmonised metadata to support international scientific agendas. ROBIN is aligning its data-sharing processes with the GRDC, ensuring interoperability and complementarity between datasets, and strengthening the long-term international hydrological data legacy. Through collaboration with the FRIEND-Water and EUROFRIEND networks, ROBIN is increasing its emphasis on social hydrology, enabling analyses that better capture human–water interactions, vulnerability, and adaptation alongside climate-driven hydrological change. 

The World Meteorological Organization’s HydroSOS builds operational capacity for standardised hydrological status assessments and sub-seasonal to seasonal outlooks across spatial scales. HydroSOS enhances national and regional water information systems by linking local observations, forecasts, and global services to produce consistent products for water resources management, disaster risk reduction, and climate resilience. Developed and supported by the UKCEH, the HydroSOS portal provides open access to these standardised “change from normal” assessments, enabling transparent comparison of hydrological conditions across countries and regions. It emphasises the value of consistent and standardised hydrological information among National Meteorological and Hydrological Services, contributing to united global water information frameworks and decision support tools. 

Together, ROBIN and HydroSOS exemplify synergistic efforts to overcome current and historical fragmentation in hydrological data and services. By promoting open data practices, harmonised standards, and shared technical capacity, these initiatives enable a more integrated global hydrological data ecosystem that supports science, policy, and operational services in the face of evolving environmental challenges and a need to improve resilience to extreme hydrological events both now and in the future. 

How to cite: Facer-Childs, K., Barker, L., Pawar, S., Turner, S., Hannaford, J., Dixon, H., Jenkins, A., Mishra, S., Silva Vara, L. R., Schwab, M., Korhonen, J., Otieno, W., and Berod, D.: Strengthening global hydrological data sharing and capacity for climate science and water services , EGU General Assembly 2026, Vienna, Austria, 3–8 May 2026, EGU26-7645, https://doi.org/10.5194/egusphere-egu26-7645, 2026.

EGU26-8333 | ECS | Orals | HS2.5.1

Representing river–floodplain interactions in large lowland basins: development and evaluation of a floodplain module within mHM 

Carlos Antonio Fernandez-Palomino, Stephan Thober, Sebastian Müller, Valentin Simon Lüdke, Pallav Kumar Shrestha, and Luis Samaniego-Eguiguren

Almost one-quarter of the global population resides on floodplains, although they cover only about 6.6% of the Earth’s land surface. Floodplains play a central role in regulating river discharge in large lowland river systems, yet their seasonal hydrological function is still poorly represented in large-scale hydrological models. In such systems, river–floodplain interactions control the attenuation, timing, and seasonal persistence of high flows during the wet season. Neglecting these effects leads to simulated hydrographs with unrealistically sharp flood peaks and a limited representation of sustained elevated flows throughout the wet season.

Here, we present the development and evaluation of a floodplain module integrated into the mesoscale hydrologic model (mHM) [1]. Each river reach is represented as a coupled river–floodplain system in which water exceeding the bankfull channel capacity is temporarily stored in an adjacent floodplain compartment. Floodplain storage capacity is derived from high-resolution topographic information using the Height Above Nearest Drainage (HAND) concept, yielding reach-specific height–area–volume relationships. At each routing time step, the available water volume is partitioned between the channel and the floodplain assuming a uniform water level shared by both compartments within the reach. Only the channel volume is routed downstream using the selected routing scheme (e.g. Muskingum–Cunge) in the multiscale Routing Model (mRM) module of mHM [2]. This module is also scalable, as it is based on the Subgrid Catchment Conservation (SCC) concept [3], enabling the simulation of river–floodplain interactions at different routing resolutions while ensuring hydrological connectivity and preserving subgrid-scale catchment contributions.

Simulations for the Ucayali River Basin (Upper Amazon, Peru) show that accounting for floodplain storage attenuates and delays flood peaks and enhances wet-season persistence of high flows. Overall, the results indicate that the proposed module improves the representation of wet-season discharge dynamics in the Ucayali River Basin and is transferable to other floodplain-dominated catchments.

Keywords

floodplains; river routing; large-scale hydrology; mHM; HAND; Amazon Basin


References

[1] Samaniego, L., Kumar, R., & Attinger, S. (2010). Multiscale parameter regionalization of a grid-based hydrologic model at the mesoscale. Water Resources Research, 46(5), 1–25. https://doi.org/10.1029/2008WR007327

[2] Thober, S., Cuntz, M., Klebling, M., Kumar, R., Mai, J., & Samaniego, L. (2019). The multiscale Routing Model mRM v1.0: Simple river routing at resolutions from 1 to 50 km. Geoscientific Model Development, 12, 2501–2521. https://doi.org/10.5194/gmd-12-2501-2019

[3] Shrestha, P. K., Samaniego, L., Rakovec, O., Kumar, R., & Thober, S. (2025). A novel stream network upscaling scheme for accurate local streamflow simulations in gridded global hydrological models. Water Resources Research, 61, e2024WR038183. https://doi.org/10.1029/2024WR038183

How to cite: Fernandez-Palomino, C. A., Thober, S., Müller, S., Lüdke, V. S., Shrestha, P. K., and Samaniego-Eguiguren, L.: Representing river–floodplain interactions in large lowland basins: development and evaluation of a floodplain module within mHM, EGU General Assembly 2026, Vienna, Austria, 3–8 May 2026, EGU26-8333, https://doi.org/10.5194/egusphere-egu26-8333, 2026.

Human alterations to the hydrologic cycle, such as groundwater pumping, surface water diversions, and interbasin transfers, are often the dominant drivers of water availability and stress in the Anthropocene. However, large-scale hydrological models (LSHMs) have historically struggled to represent these anthropogenic fluxes with sufficient granularity, largely due to a scarcity of standardized, open-access data. Consequently, models often rely on coarse estimates or static coefficients that mask critical spatial and temporal heterogeneity.

In this presentation, I will provide an overview of a new suite of high-resolution, open-access datasets that describe water infrastructure and use across the United States at an unprecedented scale. I will highlight three foundational data products: (1) a comprehensive inventory of interbasin water transfers (IBTs) characterizing over 600 projects and their conveyance volumes; (2) the United States Groundwater Well Database (USGWD), which standardizes attributes for over 14.2 million wells to map subsurface infrastructure and aquifer access; and (3) the United States Water Withdrawals Database (USWWD), providing user-level historical time series for nearly 190,000 unique water users across all economic sectors. Collectively, these datasets offer a new empirical basis for parameterizing and validating the "human" components of LSHMs. I will discuss the implications of these data for reducing model uncertainty, specifically in closing local water budgets and characterizing the complex spatial connectivity introduced by infrastructure.

Finally, I will outline current initiatives to expand this data-intensive framework globally. As the field moves from data scarcity to data abundance, the modeling community plays a critical role in shaping how these data are structured and utilized. I will conclude by discussing how the large-scale hydrology community can contribute to and benefit from these emerging global data products to better predict the present and future state of water resources in a changing environment.

How to cite: Marston, L.: High-Resolution Data of Human-Water Systems to Advance Large-Scale Hydrologic Modeling, EGU General Assembly 2026, Vienna, Austria, 3–8 May 2026, EGU26-8565, https://doi.org/10.5194/egusphere-egu26-8565, 2026.

EGU26-9422 | ECS | Orals | HS2.5.1

Small streams, large impacts: headwaters control the non-perennial fraction of the global river network 

Nicola Durighetto, Francesca Barone, and Gianluca Botter

The systematic wetting and drying of river channels exert a fundamental control on hydrological connectivity and biogeochemical functioning of watersheds. Quantifying the proportion of river networks that cease to flow seasonally or episodically is therefore essential, yet remains highly uncertain due to sparse observations and persistent underrepresentation of small streams in large-scale analyses. In this contribution, we integrate global-scale hydrological simulations with detailed field-based evidence from experimental catchments spanning diverse climatic regions to derive revised estimates of non-perennial stream occurrence worldwide. Our findings show that non-perennial streams are far more prevalent than previously recognized, both regionally and globally. When headwater streams are comprehensively accounted for, non-perennial reaches account for more than 70% of the global river network length, with upper estimates approaching 78%. Even in comparatively humid regions, such as Italy and the eastern United States, non-perennial streams represent over half of the total network length. Our analysis further demonstrates that the dominance of small upland channels allows wetting–drying dynamics to propagate their influence well beyond headwaters, leaving relevant signatures that persist even at the scale of large basins. These results highlight the need to systematically incorporate channel intermittency into large-scale hydrological models and assessments, with important implications for water resources evaluation, ecosystem functioning, and river management under ongoing climatic and environmental change.

How to cite: Durighetto, N., Barone, F., and Botter, G.: Small streams, large impacts: headwaters control the non-perennial fraction of the global river network, EGU General Assembly 2026, Vienna, Austria, 3–8 May 2026, EGU26-9422, https://doi.org/10.5194/egusphere-egu26-9422, 2026.

EGU26-9613 | Posters on site | HS2.5.1

ESA CCI River Discharge precursor project: current status and challenges 

Sylvain Biancamaria and the CCI River Discharge precursor project

River discharge is an Essential Climate Variable (Global Climate Observing System, 2022) which has been included in the ESA Climate Change Initiative (CCI) program since 2023, through a precursor project (https://climate.esa.int/en/projects/river-discharge/, CCI RD). Currently, no satellite instrument can directly measure river discharge, this project is a proof-of-concept and aims at estimating river discharge using Earth Observation and ancillary data. The objective is to deliver consistent discharge estimates from 2002 to 2025, at 50 locations across 18 selected river basins around the world. The CCI RD extends in situ discharge time series, using four robust methods: (1) estimating discharge through a rating curve approach using ancillary in situ discharge data and multiple satellite radar altimeter long time series of water surface elevation, (2) exploiting near-infrared (NIR) multispectral data, to compute the dry/wet pixel reflectance ratio linked to the river flow variations, (3) computing discharge from river width derived from optical images and ancillary discharge data using nonparametric stochastic quantile mapping approach, and (4) combination of these 3 approaches. These products are already available online: https://catalogue.ceda.ac.uk/uuid/dbba9cfe8d104648b19e39f4c2da1a27/. This presentation provides a general overview of the generated discharge products, their validation against ground observations, and their assimilation into basin-scale hydrology models . Furthermore, we will presents preliminary climate assessment based on these products.

How to cite: Biancamaria, S. and the CCI River Discharge precursor project: ESA CCI River Discharge precursor project: current status and challenges, EGU General Assembly 2026, Vienna, Austria, 3–8 May 2026, EGU26-9613, https://doi.org/10.5194/egusphere-egu26-9613, 2026.

EGU26-9907 | ECS | Orals | HS2.5.1

Global overlooked multidimensional water scarcity 

Wenfeng Liu and Zhonghao Fu

Freshwater resources are fundamental to supporting humanity, and measures of water scarcity have been critical for identifying where water requirements and water availability are imbalanced. Existing water scarcity metrics typically account for blue water withdrawals (i.e., from surface-/groundwater), while the contribution of green water (i.e., soil moisture) and water quality – dimensions with important implications for multiple societal sectors ­– to water scarcity remain unclear. Here we introduce the concept of multidimensional water scarcity that explicitly assesses all three of these dimensions of water scarcity and evaluates their individual and combined effects. We find that 22-26% of the global land area and 58-64% of the global population are exposed to some form of water scarcity annually, with multidimensional (i.e., blue, green, and quality) water scarcity particularly high in India, China, and Pakistan. Examining seasonal water scarcity, we estimate that 5.9 billion people (or 80% of the world’s population in 2015) were exposed to at least one dimension of water scarcity for at least one month per year and that 1-in-10 people (10%) were exposed to multidimensional water scarcity at least one month per year. Our findings demonstrate that the challenges of water scarcity are far more widespread than previously understood. As such, our assessment provides a more holistic view of global water scarcity issues and points to previously overlooked scarcity where action needs to bring human pressure on freshwater resources into balance with water quantity and quality.

How to cite: Liu, W. and Fu, Z.: Global overlooked multidimensional water scarcity, EGU General Assembly 2026, Vienna, Austria, 3–8 May 2026, EGU26-9907, https://doi.org/10.5194/egusphere-egu26-9907, 2026.

EGU26-11312 | ECS | Orals | HS2.5.1

Rivers in Earth System Modelling: CaMa-Flood supporting land surface model development at the km-scale 

Jasper Denissen, Gianpaolo Balsamo, Gabriele Arduini, Ervin Zsoter, Michel Wortmann, Maliko Tanguy, Estibaliz Gascon, Cinzia Mazzetti, Christel Prudhomme, Oisin Morrison, Peter Dueben, Irina Sandu, Benoit Vanniere, and Christoph Rüdiger

Global streamflow modelling is crucial, as it underlies our capacity to forecast riverine floods able to devastate infrastructure and ecosystems, and adversely affect human lives. To that end, the hydrodynamic Catchment-based Macro-scale Floodplain model (CaMa-Flood) has been included in ECMWF’s Land Surface Modelling System (ecLand), and consequently in the Integrated Forecasting System (IFS). Precipitation, which is partitioned into infiltration and runoff by ecLand’s land surface processes, is eventually converted into streamflow through CaMa-Flood. This means streamflow carries an imprint of both meteorology and land surface processes. This is particularly relevant, as runoff is not available as an observation, while streamflow is, making the latter a key variable for the aggregated evaluation of modelled land surface processes. As this analysis is done under the auspices of the Destination Earth project, it presents the additional possibility to evaluate land surface processes across all operational spatial scales up to the km-scale and temporal scales from daily to hourly. For example, through running daily CaMa-Flood simulations driven with runoff forcing from the control ensemble member and from the Continuous-Extremes Digital Twin (C-EDT), the land surface’s hydrological processes can be evaluated at the spatial resolutions of ~9km and ~4.4km, respectively. Comparing results from these daily simulations with streamflow observations, we found that the C-EDT generates insufficient surface runoff in orographic regions. This stems from the sub-grid runoff parameterization in ecLand, which generates less surface runoff at higher resolutions for the same amount of precipitation, and is therefore not scale-adaptive.

Beyond providing hydrological simulations, CaMa-Flood is used in this study as a diagnostic tool for hydrological processes to guide future development of ecLand. More specifically, we have implemented scale-specific orographic parameters in the model’s runoff-generating algorithm, aiming to provide consistent orographic surface runoff generation across spatial scales. Runoff partitioning is important for flood extremes on timescales of a few days, because it directly modulates the magnitude of the flood peak. In addition, it affects the soil moisture, and consequently sub-surface runoff and streamflow on timescales of months to years. Therefore, the efficacy of these adaptations is tested with both long-term land surface experiments with ecLand/CaMa-Flood and fully-coupled 5-day meteorological forecasts with IFS/CaMa-Flood at spatial resolutions of ~29km, ~9km and ~4.4km. For the forecasts on shorter time scales, we assess the flood peak magnitude, timing and durations errors. For the long-term integrations from 1990 – 2025, streamflow time series allow a robust evaluation of the simulations against the observations, and its components as a measure of goodness-of-fit. Moving beyond the KGE, a cross-spectral analysis is applied to evaluate the time signature of the hydrological processes undelrying streamflow and occurring at different time scales, which is especially useful considering the partitioning between surface (fast) and sub-surface (slow) runoff. Through addressing these scale-dependent issues, ample surface runoff generation is ensured, allowing the river hydrology simulated by CaMa-Flood to benefit fully from running meteorology and the land surface at the km-scale. 

How to cite: Denissen, J., Balsamo, G., Arduini, G., Zsoter, E., Wortmann, M., Tanguy, M., Gascon, E., Mazzetti, C., Prudhomme, C., Morrison, O., Dueben, P., Sandu, I., Vanniere, B., and Rüdiger, C.: Rivers in Earth System Modelling: CaMa-Flood supporting land surface model development at the km-scale, EGU General Assembly 2026, Vienna, Austria, 3–8 May 2026, EGU26-11312, https://doi.org/10.5194/egusphere-egu26-11312, 2026.

EGU26-11935 | Orals | HS2.5.1

Integrated Isotope Hydrology for Assessing Water Resource Vulnerability Across the Asia–Pacific Region 

Md Moniruzzaman, Tirumalesh Keesari, Cath E. Hughes, Charles Darwin Racadio, Chinzorig Sukhbaatar, Diksha Pan, Dang Duc Nhan, Gerelt-Ot Dashdondog, Lakam Mejus, Min Naing, Mark A. Peterson, Mohd Muzamil Mohd Hashim, Nouman Mujahid, Ratan Kumar Majumder, Sitthideth Nonthaxay, Tri Retno Dyah Larasati, Zhonghe Pang, and Melanie Vital

The Asia–Pacific region encompasses hydrologically diverse and climate-vulnerable systems, where groundwater security is increasingly threatened by over-exploitation, climate change, urbanization, and salinization. This regional synthesis, developed under the IAEA Technical Cooperation Project RAS7040, integrates environmental isotopes (δ¹⁸O, δ²H, d-excess, ³H), hydrochemical indicators, and numerical modeling to delineate groundwater recharge processes, surface–groundwater interactions, and salinization mechanisms across contrasting hydroclimatic settings, including coastal, urban, alpine, riverine, and arid basins. Multi-country case studies from Lao PDR, Pakistan, Mongolia, China, Bangladesh, Indonesia, Vietnam, Australia, and the Philippines demonstrate the robustness of isotope-based diagnostics for resolving complex groundwater systems. Across the region, results consistently identify local meteoric precipitation as the dominant recharge source, while revealing pronounced contrasts in recharge timing, aquifer vulnerability, and salinity evolution governed by climate variability, land use, and geological framework. In densely populated coastal plains, such as Bangladesh, shallow aquifers exhibit active seawater intrusion, clearly traced by diagnostic Cl⁻–δ¹⁸O mixing relationships, whereas deeper confined aquifers commonly contain isolated paleo-salinity or remain largely protected from modern marine ingress. In high-altitude glacier-fed catchments (e.g., the Mingyong Basin, China), isotope-based hydrograph separation quantifies increasing seasonal meltwater contributions to river discharge, highlighting climate-driven shifts in runoff generation and long-term water storage. In Mongolia’s Kherlen River Basin, groundwater and surface water plot close to the Global Meteoric Water Line, indicating minimal evaporative modification prior to recharge. Strong seasonal contrasts in precipitation isotopes—from highly depleted winter values (δ¹⁸O ≈ −30‰) to enriched summer rainfall (δ¹⁸O ≈ −12‰)—demonstrate that groundwater recharge is dominated by warm-season precipitation, with clear isotopic evidence of river–groundwater exchange in alluvial reaches. In arid to semi-arid regions of Pakistan, stable isotopes are critical for quantifying evaporation losses, identifying recharge zones, and distinguishing irrigation return flow from natural recharge in intensively managed aquifer systems. In Australia, isotope (δ¹⁸O, δ²H, ³H) and hydrochemical investigations of the Thirlmere Lakes conclusively identify evaporation as the dominant mechanism driving lake-level decline, with a secondary, multi-decadal groundwater recharge component. Urban aquifers in major cities (e.g., Hyderabad, Metro Manila, Karachi) show heightened vulnerability to anthropogenic contamination and reduced recharge, diagnosed through isotopic enrichment patterns and complementary tracers such as nitrate isotopes. In the riverine systems of Lao PDR and Vietnam, isotopic apportionment clarifies Mekong and Red River connectivity with adjacent alluvial aquifers, providing essential insights for transboundary water management. When coupled with Bayesian mixing models and variable-density flow simulations, the integrated isotope–geochemical approach effectively differentiates modern seawater intrusion from relic salinity, quantifies river–aquifer interactions, and constrains recharge source elevations and catchment domains. This synthesis underscores the value of regional scientific coordination to harmonize methodologies, identify transboundary groundwater linkages, and upscale local findings. Overall, it demonstrates that isotope-based evidence is indispensable for science-informed policy, supporting managed aquifer recharge, regulation of abstraction, and early-warning systems for salinization and water-quality degradation, thereby advancing climate-resilient water governance across the Asia–Pacific region.


Key words: Isotope Hydrology, Groundwater Recharge, Seawater Intrusion, Aquifer Vulnerability, Water Resource Management, Asia–Pacific Region

How to cite: Moniruzzaman, M., Keesari, T., Hughes, C. E., Racadio, C. D., Sukhbaatar, C., Pan, D., Nhan, D. D., Dashdondog, G.-O., Mejus, L., Naing, M., Peterson, M. A., Mohd Hashim, M. M., Mujahid, N., Majumder, R. K., Nonthaxay, S., Dyah Larasati, T. R., Pang, Z., and Vital, M.: Integrated Isotope Hydrology for Assessing Water Resource Vulnerability Across the Asia–Pacific Region, EGU General Assembly 2026, Vienna, Austria, 3–8 May 2026, EGU26-11935, https://doi.org/10.5194/egusphere-egu26-11935, 2026.

EGU26-12671 | ECS | Orals | HS2.5.1

A catchment-scale analysis of the impact of land data assimilation on surface fluxes and river discharge with a land surface model 

Francesca Covella, Jasper M. C. Denissen, Christoph Rüdiger, David Fairbairn, and Harrie-Jan Hendricks-Franssen

Hydrological modelling plays a crucial role in Earth System Models at many scales, affecting results in numerical weather predictions through surface fluxes and storages. Data assimilation is used in weather models to ascertain accurate initial conditions for weather forecasts based on observations. At the land surface, the land data assimilation system (LDAS) exploits observational data to update selected fields of the state vector, such as soil moisture or snow cover. In turn, soil moisture and snow cover affect the terrestrial water cycle through the partitioning of runoff components, and consequently streamflow.

Whereas LDAS configuration choices are usually driven by improvements in meteorology, here we aim to investigate how they impact streamflow. To this end, several LDAS configuration are used to run ECMWF’s Land Surface Modelling System (ecLand), which generates grid-wise runoff routed as streamflow in rivers by the Catchment-based Macro-scale Floodplain (CaMa-Flood) hydrological model. Two experiments, one with snow analysis and the other with soil moisture analysis, are compared against the baseline without any data assimilation over 1990-2023 using meteorological forcing from ERA5. In addition, a baseline experiment without any data assimilation is run. Therefore, differences in the model output of these experiments can be attributed to the data assimilation procedure. Snow cover analysis uses ESA-CCI data from 1990 to 2010, and IMS snow cover data from 2010 to 2023. The soil moisture analysis assimilates ERS-SCAT products from 1992 to 2006 and ASCAT soil moisture products from 2007 to 2023, as well as gridded SYNOP observations of 2-m temperature and relative humidity.

Streamflow is the main diagnostic variable to quantify the impact of LDAS on river hydrology, as observational data is available. A filtering procedure was applied to the Global Runoff Data Centre (GRDC) dataset to ensure sufficient observations to represent local climatology: at least 25 daily values per month, for seasonal representation, and a minimum of 19 years over the 33-year period. Monthly climatologies of simulated discharge and surface fluxes are calculated to identify catchment-scale patterns. Surface fluxes, such as evapotranspiration and (sub-)surface runoff, and streamflow output of the respective experiments are compared for 342 gauged catchments, across 209 distinct river systems in the northern hemisphere.

The Kling–Gupta Efficiency and its components are computed for each catchment, allowing the assessment of bias, correlation, and variability separately. Assessments show a widespread impact of LDAS configuration on the hydrological skill of ecLand-Cama-Flood system: for 48% of the stations the baseline experiment has a higher hydrological skill, while 20% of the stations benefit from snow cover analysis and 32% from soil moisture analysis. Then, to assess hydrological processes across horizontal and vertical spatial scales, performance of data assimilation is analysed as function of catchment characteristics such as upstream drainage area, orography, and spatial variability of orography.

This study pinpoints catchments where river hydrology benefits or is negatively impacted by land data assimilation and directly supports further development of ecLand.

How to cite: Covella, F., Denissen, J. M. C., Rüdiger, C., Fairbairn, D., and Hendricks-Franssen, H.-J.: A catchment-scale analysis of the impact of land data assimilation on surface fluxes and river discharge with a land surface model, EGU General Assembly 2026, Vienna, Austria, 3–8 May 2026, EGU26-12671, https://doi.org/10.5194/egusphere-egu26-12671, 2026.

EGU26-14399 | ECS | Posters on site | HS2.5.1

How Turbulence Regulates Evaporation from Flowing Water Surfaces 

Lintong Hou, Milad Aminzadeh, Dani Or, Justus Patzke, Peter Fröhle, and Nima Shokri

Abstract: The role of turbulence in heat and mass exchange across flowing water surfaces remains poorly understood.  Insights from oceanic wavy surfaces offer useful analogies [1], yet, fundamental differences in directional hydrodynamics and near-surface turbulence limit their direct applicability to flowing rivers and streams. Evidence suggests that intermittent turbulence-interfacial interactions observed from rapid IR imagery of flowing surfaces regulate evaporation rates. A laboratory flume with adjustable bottom roughness and flow configurations was used to generate distinct turbulent and mixing regimes [2]. Synchronized high-speed infrared surface thermography and vertically resolved micro-thermocouple measurements captured the transient evolution of the thermal skin layer and near-surface eddy diffusion characteristics. Preliminary results from shallow-water flows indicate that increased turbulence intensity, reflected in surface thermal fluctuations enhance evaporation rates relative to placid surfaces under similar conditions. Surface renewal theory was employed to quantify the contribution of turbulent renewal events on exchange rates across contrasting flow regimes. Results provide new insights into turbulence-driven interfacial processes and offer a mechanistic basis for improving representations of evaporation dynamics across variable flow conditions in riverine systems.

Reference
[1] Gerbi, G. P., Trowbridge, J. H., Terray, E. A., Plueddemann, A. J., & Kukulka, T. (2009). Observations of turbulence in the ocean surface boundary layer: Energetics and transport. Journal of Physical Oceanography, 39(5), 1077-1096.
[2] Hou, L., Aminzadeh, M., Or, D., Patzke, J., Fröhle, P., & Shokri, N. (2025). Evaporation dynamics from flowing water surfaces (No. EGU25-2716). Copernicus Meetings.

How to cite: Hou, L., Aminzadeh, M., Or, D., Patzke, J., Fröhle, P., and Shokri, N.: How Turbulence Regulates Evaporation from Flowing Water Surfaces, EGU General Assembly 2026, Vienna, Austria, 3–8 May 2026, EGU26-14399, https://doi.org/10.5194/egusphere-egu26-14399, 2026.

EGU26-14743 | Orals | HS2.5.1

Unlocking local knowledge production for global water systems analysis  

Wouter Buytaert, Seifu Tilahun, Athanasios Paschalis, Sara Bonetti, Bramha Vishwakarma, Patricio Crespo, Fabian Drenkhan, Samuel Agyei-Mensah, Boris Ochoa-Tocachi, Ana Mijic, Rossella Arcucci, Ben Moseley, and Ben Howard

Global freshwater systems are critically threatened by environmental change and over-exploitation, stressing the need for novel, transformative solutions. As social-hydrological systems are diverse and complex, water-related risks and decision-making needs are often strongly embedded in a locally specific context. Therefore, such solutions need to be informed by solid scientific evidence while remaining tailored to local realities, knowledge, and practices. However, the current generation of global water system models struggles to produce evidence that is accurate, tailored, and actionable at the local scale.

Here we outline an approach to support local knowledge co-production and its integration  with existing and emerging data sources in global water system models. We focus on three knowledge sources that are currently underrepresented in global modelling approaches: non-statutory monitoring, citizen observations, and local knowledge.

We show how data science methods such as semantic data models, distributed workflows, and machine learning can be leveraged to develop novel knowledge integration pipelines. These pipelines explicitly represent data provenance and track epistemic and aleatoric uncertainties across heterogeneous data sources. When combined with flexible modelling frameworks, this approach provides a blueprint for next generation simulation systems that bridge global modelling and local decision-making. Such systems enable the identification, prioritization, and targeted reduction of local knowledge gaps, thereby enhancing the relevance and legitimacy of global water assessments for regional and community-level action.

How to cite: Buytaert, W., Tilahun, S., Paschalis, A., Bonetti, S., Vishwakarma, B., Crespo, P., Drenkhan, F., Agyei-Mensah, S., Ochoa-Tocachi, B., Mijic, A., Arcucci, R., Moseley, B., and Howard, B.: Unlocking local knowledge production for global water systems analysis , EGU General Assembly 2026, Vienna, Austria, 3–8 May 2026, EGU26-14743, https://doi.org/10.5194/egusphere-egu26-14743, 2026.

EGU26-14960 | ECS | Orals | HS2.5.1

Snow Matters: Emulator-Driven Calibration Across a Large Sample of Snow Stations 

Nicolás Vásquez, Darri Eythorsson, Dave Casson, Ignacio Aguirre, Cyril Thébault, Wouter Knoben, Shadi Hatami, Frank Han, and Martyn Clark

Calibrating complex physically based hydrological models remains a major challenge due to the high computational demands of traditional optimization algorithms. Furthermore, if conducted, local calibration at several sites can lead to an uneven spatial distribution of parameters, imposing additional challenges when transferring parameter values from gauged to ungauged areas. As a result, simulations from complex models often rely on default parameter values that yield poor model performance. Recent studies have shown that machine learning emulators can speed up calibration and regionalization of model parameters while maintaining predictive accuracy similar to that of traditional optimization algorithms and improving the spatial distribution of parameters. However, most studies using emulators focus on streamflow, while there is a great opportunity to support improved process modelling using large datasets. Here, we focus on snow, a critical component of hydrological systems, and show how improved calibration of snow-related parameters could enhance the consistency of hydrologic model simulations. In this study, we assess whether emulators can (1) improve snow simulations across North America and (2) regionalize snow parameters across the continent. To this end, we use 770 snow stations located in Canada and the United States. We compare the performance of a conceptual model (FUSE: Framework for Understanding Structural Errors) and a physically based model (SUMMA: Structure for Unifying Multiple Modeling Alternatives), each calibrated using both traditional algorithms and emulator-based approaches. Our results show that snow simulations using SUMMA achieve performance comparable to that of FUSE with a fraction of the simulation runs usually required by optimization algorithms, suggesting that complex models can perform similarly to (calibrated) conceptual models. Further, when conducting local calibration, the use of large-sample emulators improves the smoothness of the spatial distribution of parameters, which, for parameter regionalization purposes, translates into smoother spatial distributions of parameter values in large geographic areas. This suggests that emulators can mitigate the effect of the highly irregular response surface during parameter calibration, thereby enhancing the robustness of simulations across large domains. Thus, this work offers new insights into the potential of emulators to enhance process-based modeling and snow representation across large, diverse regions. 

How to cite: Vásquez, N., Eythorsson, D., Casson, D., Aguirre, I., Thébault, C., Knoben, W., Hatami, S., Han, F., and Clark, M.: Snow Matters: Emulator-Driven Calibration Across a Large Sample of Snow Stations, EGU General Assembly 2026, Vienna, Austria, 3–8 May 2026, EGU26-14960, https://doi.org/10.5194/egusphere-egu26-14960, 2026.

EGU26-15264 | ECS | Posters on site | HS2.5.1

Large-Scale Evidence of Non-stationarity in Brazilian Streamflows Across Hydrographic Regions  

João Maria de Andrade, Alfredo Ribeiro Neto, and Rodolfo Nóbrega

We investigate non-stationarity in streamflow regimes across Brazil through a large-scale assessment of trends in annual maximum, mean, and minimum discharges under climate variability and change. The analysis is based on daily streamflow records from 515 Brazilian catchments with at least 30 years of continuous observations (1980–2010), obtained from the Catchment Attributes for Brazil (CABra) dataset. For each catchment, annual maximum discharge (Qmax), annual mean discharge (Qmean), and annual minimum 7-day average discharge (Q7,min) were derived using the hydrological year. The primary objective was to identify coherent spatial patterns of hydrological change across major hydrographic regions and to determine which components of the flow regime are most sensitive to non-stationary signals. With this design, we aim to address two research questions: (i) Do non-stationary signals exhibit distinct spatial patterns across Brazil’s diverse hydroclimatic regions? (ii) Which streamflow metrics (high, mean, or low flows) are most sensitive to long-term changes? We adopt a regionalized assessment approach, applying the non-parametric Mann–Kendall test and Sen’s slope estimator to quantify the significance and magnitude of trends. The findings reveal a marked spatial dichotomy and strong metric-dependent sensitivity to non-stationarity. A pervasive decline in minimum flows (Q7,min) is observed across central and northeastern Brazil, indicating a systematic loss of catchment buffering capacity and baseflow resilience. Specifically, the São Francisco basin emerges as the most critically affected region, where 86.3% of catchments exhibit significant reductions in Q7,min  and 45.2% show decreasing trends in  Qmean. Similarly pronounced declines in low flows were identified in the Parnaíba (70%), East Atlantic (>60%), and Tocantins–Araguaia (54%) basins. Conversely, the Amazon basin displays an intensification of the regional hydrological cycle, with approximately 20–27% of catchments showing increasing trends across all flow metrics ( Qmax, Qmean, and Q7,min). Outside the Amazon, trends in  Qmax remain largely stable, suggesting that changes in extreme high flows are less widespread than those affecting low-flow conditions. Overall, our results demonstrate that minimum streamflows are the most sensitive indicators of non-stationarity in Brazilian hydrology. The severe depletion of baseflows—particularly in the São Francisco basin—poses significant risks to water security, hydropower generation, and the viability of large-scale interbasin water transfer projects. The study underscores the limitations of the stationarity assumption in traditional water management and emphasizes the urgent need for region-specific adaptation strategies to manage the increasing vulnerability to hydrological droughts. 

How to cite: Andrade, J. M. D., Ribeiro Neto, A., and Nóbrega, R.: Large-Scale Evidence of Non-stationarity in Brazilian Streamflows Across Hydrographic Regions , EGU General Assembly 2026, Vienna, Austria, 3–8 May 2026, EGU26-15264, https://doi.org/10.5194/egusphere-egu26-15264, 2026.


Rice-based agricultural systems account for the largest share of global agricultural water use and are a major source of methane emissions, yet their hydrological dynamics remain among the least constrained water fluxes in hydrological, land-surface, and greenhouse gas models. This is largely due to difficulty of cloud cover in optical data use in monsoon regions and a lack of validation data for natural and irrigation related soil moisture dynamics due to insufficient ground truthing data and poor resulting satellite product quality.

The implications are becoming more acute due to climate change as major rice-growing regions in India are shifting their practices and adapting to new realities by either decreasing or increasing water use. These further increases the uncertainties in already coarse irrigation and soil moisture products that currently drive models. With rice being both severely affected by climate change and methane emissions from water management in rice fields a key mitigation opportunity – these uncertainties propagate into hydrological and emission assessment globally and locally. Fortunately, recent advances in remote sensing such as AI-driven embeddings such as a AlphaEarth, new satellites such as the NISAR L-Band, and continuously increasing computational power and deep learning, promise rapid improvements in filling this crucial data gap – but to materialize these promises, ground truthing benchmark datasets will be required to adequately validate and compare these new approaches.

Here, we present our Rice Water Benchmark (RIWA) dataset that were are currently developing across India, Cambodia, the Philippines and Vietnam with multiple colleagues and partners. The dataset contains sub-weekly soil moisture and water level readings from more than 300 rice fields across multiple seasons that capture spatial and temporal heterogeneity of soil water status. We further present initial results for how these datasets can be used to evaluate different remote sensing approaches for predicting soil moisture and water management in rice fields – that can also be applied to other crops – and how this matters for hydrological and methane modelling applications.

Besides, we discusses challenges for data quality that include consistency, deployment of low-cost devices, spatial representativeness and the need for auxiliary data such as irrigation events timings from regular phone surveys. By developing harmonized and transparent global datasets for water use in agriculture will be crucial to fully utilize the promise of advances in remote sensing, digital hydrology and digital agriculture and the use of AI for global cereal systems, of which rice provides an important stress test due to its complex water management regimes.

How to cite: Urfels, A., Deb, P., Sankar, H. N., and Arenas-Calle, L.: Rice systems as a stress test for hydrological and methane modelling: Developing rice water (RIWA) benchmark dataset for remote sensing of soil moisture and water levels in rice fields across Asia, EGU General Assembly 2026, Vienna, Austria, 3–8 May 2026, EGU26-15574, https://doi.org/10.5194/egusphere-egu26-15574, 2026.

Drylands are confronting dual challenges of intensifying drought and insufficient water vapor supply, which threaten regional ecosystem stability and food security. As a critical moisture source, terrestrial evapotranspiration (ET) may buffer such risks by enhancing regional water vapor cycling; however, the role of ET increase induced by vegetation restoration in supplying water vapor to downwind drylands remains poorly understood. This study investigates the drought-mitigating effect of ET increase driven by vegetation restoration (initiated by the Grain-for-Green Program since 2001) on China’s Loess Plateau, focusing on its impact on downwind dryland regions. Results indicate that since 2001, vegetation restoration on the Loess Plateau has substantially increased annual mean ET. Simulations using a Lagrangian-trajectory-based PyTraject method show an expanded water vapor transport contribution range, with the northeast direction as the primary pathway, indicating a notable increase in water vapor supply. By integrating a Copula model with extreme water vapor deficit scenario analyses, we identified key convergence zones where water vapor export from the Loess Plateau significantly alleviates drought severity in downwind dryland areas. Further analysis reveals that regions more strongly influenced by this water vapor transport exhibit lower actual drought occurrence probabilities—particularly in May–June, when ET increase from vegetation restoration can reduce the probability of severe drought in downwind dryland regions by up to 7%. This study demonstrates that under vegetation restoration, the Loess Plateau plays a stable and sustained regulatory role in supplying water vapor to downwind drylands, thereby enhancing drought resilience and supporting ecosystem stability and food security in these regions.

How to cite: Wang, C. and Yang, T.: Loess Plateau Vegetation Restoration Enhances Water Vapor Transport to Mitigate Drought in Downwind Drylands, EGU General Assembly 2026, Vienna, Austria, 3–8 May 2026, EGU26-15613, https://doi.org/10.5194/egusphere-egu26-15613, 2026.

EGU26-16162 | ECS | Orals | HS2.5.1

Assessing Spatial Redistribution of River Runoff Using a Relative Centroid Index (RCI): Insights from Multi-Model and Remote Sensing Data Comparisons 

Peirong Lin, Ziyun Yin, Dai Yamazaki, Louise Slater, Haomei Lin, and Fenghe Zhang

Anthropogenic activities, such as water withdrawals and inter-basin transfers, cause significant spatial redistribution of river runoff along channel networks. However, this process is poorly constrained in large-scale hydrological models (LHMs) traditionally calibrated against streamflow time series only at basin outlets. To address this gap, we employ a novel Relative Centroid Index (RCI), a normalized metric quantifying the upstream/downstream shift of the runoff "center of mass" within a basin, which serves as a novel metric to evaluate how well models capture such spatial footprints. We first calculate benchmark RCI values (RCI_gauge) at over 200 globally distributed basins with sufficient gauge density. We then evaluate the capability of four major model-based global river discharge products to replicate these observed RCI patterns at gauge locations. They involve GRADES, its enhanced versions GRFR and GRADES-hydroDL, and GRDR which adds a river width data assimilation module. Furthermore, we explore the potential of remote sensing (Landsat, SWOT) to provide complementary spatial distribution information, despite potential biases in absolute magnitude. Preliminary analysis suggests systematic biases in model-simulated RCI particularly in highly human regulated basins, while remote sensing shows promise in capturing relative spatial patterns. This work provides a new framework to diagnose spatial inaccuracies in LHMs and highlights the value of multi-source observations for improving the representation of human-altered hydrological processes.

How to cite: Lin, P., Yin, Z., Yamazaki, D., Slater, L., Lin, H., and Zhang, F.: Assessing Spatial Redistribution of River Runoff Using a Relative Centroid Index (RCI): Insights from Multi-Model and Remote Sensing Data Comparisons, EGU General Assembly 2026, Vienna, Austria, 3–8 May 2026, EGU26-16162, https://doi.org/10.5194/egusphere-egu26-16162, 2026.

EGU26-17030 | ECS | Posters on site | HS2.5.1

Advancing Large-Scale Hydrological Modeling for Climate Studies through Multi-Source Assimilation of ESA CCI Products  

Malak Sadki, Kaushlendra Verma, Vanessa Pedinotti, Simon Munier, Gaëtan Noual, Gilles Larnicol, Sylvain Biancamaria, Adrien Paris, Laetitia Gal, Philippe Mourot, and Clément Albergel

Large-scale hydrological models simulating river dynamics for climate studies face limitations from structural, forcing, and process uncertainties. Data assimilation, by integrating observations, mitigates these limitations.  In this context, satellite remote sensing (radar altimetry, multispectral sensors) offers long-term spatially distributed hydrological data, compensating for declining in situ monitoring networks.

This study builds on the ESA Climate Change Initiative (CCI) River Discharge precursor project, which develops long-term global satellite-derived discharge and water surface elevation (WSE) datasets for climate applications. A first phase of the project (during year 2024) evaluated the assimilation of either CCI discharge or WSE products into regional to global hydrological models (CTRIP and previously calibrated version of MGB). This evaluation highlighted the added value of discharge products in terms of information content, temporal sampling, and uncertainty characteristics (Sadki et al., 2024, HESS Discuss., https://doi.org/10.5194/hess-2024-328). Building on these results, the present work advances multi-source data assimilation strategies using improved and newly developed CCI products.

Ensemble Kalman filter experiments, conducted with CTRIP-HyDAS and MGB-HYFAA assimilation systems over the Niger and Congo basins, assess the contribution of increased spatial and temporal sampling and the joint assimilation of discharge and WSE observations. Early results highlight the key role of increased temporal density in correcting model biases and internal variability, while revealing the complementary effects of combining spatially dense WSE observations with hydrologically consistent discharge information. 

Overall, this work provides new insights into robust multi-observation data assimilation strategies for large-scale hydrological modeling in a climate studies context.

How to cite: Sadki, M., Verma, K., Pedinotti, V., Munier, S., Noual, G., Larnicol, G., Biancamaria, S., Paris, A., Gal, L., Mourot, P., and Albergel, C.: Advancing Large-Scale Hydrological Modeling for Climate Studies through Multi-Source Assimilation of ESA CCI Products , EGU General Assembly 2026, Vienna, Austria, 3–8 May 2026, EGU26-17030, https://doi.org/10.5194/egusphere-egu26-17030, 2026.

EGU26-17335 | Orals | HS2.5.1

A Comparison of Data-Driven Regionalization Frameworks for Large-Scale Hydrological Modelling 

Peter Salamon, Olivier Chalifour, Carlo Russo, Stefania Grimaldi, and Maria Luisa Taccari

The Regionalization of parameters remains a major challenge for large-scale hydrological modeling, especially in regions with limited data where direct calibration against streamflow observations is not feasible. In this study, we compare two data-driven regionalization frameworks to a classical approach based on the physical and climatic proximity of catchments. The first framework relies on a modified Kling–Gupta efficiency (‘KGE) emulator coupled with a distributed evolutionary algorithm in Python (DEAP)-based evolutionary calibration framework. A deep neural network (DNN) and a random forest (RF) are trained using the "the most recent calibration dataset of the Copernicus Emergency Management Service Global Flood Awareness System (CEMS GloFASv5), which includes over 5000 catchments spanning a wide range of hydroclimatic, physiographic and land use conditions. Static catchment attributes and long-term climatic descriptors serve as predictors, and the target variable is the modified KGE obtained from an extensive parameter history generated by DEAP-based evolutionary calibration of the hydrological model OS LISFLOOD. To promote robust generalization across climates, we split the dataset into training, validation, and testing subsets using a climate-stratified sampling strategy that preserves key indicators, such as aridity, mean precipitation, and precipitation seasonality. Once trained, the emulator is embedded within an evolutionary algorithm to identify parameter sets that maximize the emulated ‘KGE for target catchments, thereby avoiding repeated hydrological simulations. The second framework uses a surrogate modeling approach that combines an LSTM-based emulator of OS LISFLOOD with a reinforcement learning-driven regionalization strategy. The surrogate model is trained to reproduce OS LISFLOOD's dynamic behavior, while a separate LSTM agent explores the parameter space and proposes parameter sets iteratively. This exploration is guided by a reward function based on a ‘KGE, which is computed from the surrogate model outputs. This enables efficient parameter optimization without the need for direct hydrological simulations. The transfer and optimization of parameters are governed by implicitly learned similarities in a latent feature space. Both data-driven approaches are evaluated by comparing the modified KGE achieved by OS LISFLOOD simulations using the inferred parameters with that achieved by the conventional regionalization method relying on explicit physical or geographical distance metrics. Preliminary results suggest that both data-driven methods reproduce large-scale spatial patterns of model performance and yield KGE values comparable to those obtained with the classical approach. While the current results are similar to existing methodologies, they suggest that emulator-based optimization and surrogate modeling are viable alternatives for large-scale regionalization with potential for further refinement.

How to cite: Salamon, P., Chalifour, O., Russo, C., Grimaldi, S., and Taccari, M. L.: A Comparison of Data-Driven Regionalization Frameworks for Large-Scale Hydrological Modelling, EGU General Assembly 2026, Vienna, Austria, 3–8 May 2026, EGU26-17335, https://doi.org/10.5194/egusphere-egu26-17335, 2026.

EGU26-18560 | ECS | Orals | HS2.5.1

The new EU-Hydro 2.0 production: A Copernicus high-resolution hydrography dataset across Europe based on latest generation elevation and ancillary data 

Linda Moser, Bernhard Lehner, Achim Roth, Jan Huch, Guia Marie Mortel, Martin Huber, Veronica Sanz, Günther Grill, Patrick Sogno, Antje Wetzel, Tejasvi Hora, Felix Bachofer, Stefan Ram, Meera Prajapati, Georg Stern, Jana Luksikova, Wegscheider Stephanie, Ines Ruiz, Carolin Keller, Silvia Rovira, Natalia Ortigosa, Quirico D'Amico, Valentina Iorio, and Jose Miguel Rubio Iglesias

The new EU-Hydro 2.0 production is tackling the requirements of a modern hydrographic reference product within the pan-European hydrological domain, uniting the requirements of both the hydrographic mapping and the hydrological monitoring communities. The EU-Hydro 2.0 dataset is part of the Copernicus Land Monitoring Service (CLMS) portfolio, implemented by the European Environment Agency (EEA). The current EU-Hydro v1.3 dataset offers detailed information on the geographical distribution and spatial characteristics of water resources throughout Europe, such as river networks, surface water bodies and watersheds. However, its use for hydrological modelling remained limited due to shortcomings in data structure, resolution, and quality. The new version of EU-Hydro (EU-Hydro 2.0) builds on new, advanced hydrological conditioning algorithms that improve hydrological representation and consistency of current methods. As a result, it supports various use cases beyond mapping, including hydrological modelling and prediction as well as environmental assessments related to river connectivity and the evaluation of anthropogenic impacts, all with the goal to strengthen water resilience across Europe.

The EU-Hydro 2.0 production is underway and planned to be made available towards the end of 2026. It builds upon a latest generation Digital Elevation Model (DEM): the Copernicus DEM, a pan-European DEM available at 10m resolution, based on the TanDEM-X mission, supported by the Copernicus DEM at 30m resolution for catchments that flow in and out of the EEA38+UK area. The production of EU-Hydro 2.0 involves best-suitable and most recent ancillary data of hydrography, land cover, and infrastructure, as well as VHR satellite data for quality control, editing (e.g., river corrections, coastline mapping) and validation. The product suite consists of eight main layers: The three main raster products are the hydrologically conditioned DEM (Hydro-DEM), the flow direction (Hydro-DIR) and the flow accumulation (Hydro-ACC) products, supported by additional raster layers for expert hydrological use. The five vector products are the river network (Hydro-NET), water bodies (Hydro-WBO), basins and sub-watersheds (Hydro-BAS), a product on artificial hydrographic structures (Hydro-ART) and a coastline (Hydro-COAST). In addition, a cartographically enhanced river product in focus regions (Carto-NET) is being produced. All layers are interrelated, scalable and logically consistent.

A ramp-up phase was carried out between 2024-2025 in six test sites of different hydrological and terrain characteristics (full Po catchment, N-Sweden, S-Spain, Slovenia/Croatia, Central Türkiye, and boundary area Romania/Moldova). An independent validation of the different layers in the test sites, considering geometry, topology, attribution and complex interrelations between different layers was performed, in order to evaluate fitness for potential mapping and modelling use cases. The validation utilized national/regional reference data and very high resolution (VHR) image interpretation and concluded that every layer is generally performing well, with some layers exceeding expectations whereas for other layers some issues on harmonization remain to be addressed. The approach aims at transparency and automation to the extent possible, supported by manual corrections where needed to increase quality and meet user requirements. By applying efficient and reproducible data processing, further updates of EU-Hydro into the future can be facilitated.

How to cite: Moser, L., Lehner, B., Roth, A., Huch, J., Mortel, G. M., Huber, M., Sanz, V., Grill, G., Sogno, P., Wetzel, A., Hora, T., Bachofer, F., Ram, S., Prajapati, M., Stern, G., Luksikova, J., Stephanie, W., Ruiz, I., Keller, C., Rovira, S., Ortigosa, N., D'Amico, Q., Iorio, V., and Rubio Iglesias, J. M.: The new EU-Hydro 2.0 production: A Copernicus high-resolution hydrography dataset across Europe based on latest generation elevation and ancillary data, EGU General Assembly 2026, Vienna, Austria, 3–8 May 2026, EGU26-18560, https://doi.org/10.5194/egusphere-egu26-18560, 2026.

EGU26-20180 | Orals | HS2.5.1

Growing cold-season dominance of European streamflow 

Wouter Berghuijs, Sebastian Carugati, Mira Anand, Markus Hrachowitz, Gregor Laaha, Benjamin Campforts, and Kate Hale
Seasonal variations in streamflow govern hydrological extremes and water availability for both society and ecosystems. In snow-influenced catchments, climate warming commonly shifts streamflow toward winter, whereas trends in streamflow seasonality in rain-fed catchments are more heterogeneous and often remain poorly quantified. Here, we reveal pan-European trends in streamflow seasonality across both rain- and snow-fed catchments using mass centers derived from directional statistics for 8,911 catchments spanning 1980–2023. Streamflow in rain-fed catchments is concentrated in the cold season, with recent decades exhibiting a strengthening of this cold-season dominance. In contrast, snow-influenced catchments (typically characterized by late-spring and summer-centered flows) have experienced a recent weakening of streamflow seasonality. This systematic attenuation aligns with declining snow fraction, reduced snow storage, and rising evaporative demand. The increasing seasonality observed in rain-fed catchments is driven primarily by enhanced evaporative demand and reduced annual precipitation, rather than changes in precipitation seasonality. Collectively, these trends indicate that across Europe, water availability is increasingly constrained during the warm season, when societal and ecosystem demands are generally highest.

How to cite: Berghuijs, W., Carugati, S., Anand, M., Hrachowitz, M., Laaha, G., Campforts, B., and Hale, K.: Growing cold-season dominance of European streamflow, EGU General Assembly 2026, Vienna, Austria, 3–8 May 2026, EGU26-20180, https://doi.org/10.5194/egusphere-egu26-20180, 2026.

EGU26-20566 | ECS | Posters on site | HS2.5.1

Improving river-floodplain relationship in PARFLOW-CLM in continental West Africa as an early step to build an multi source hydrologic reanalysis 

Pedro Felipe Arboleda-Obando, Jean-Martial Cohard, Alexandre Zoppis, Hector Basile, and Thierry Pellarin

Advances in hydrology science are opening new opportunities for using hydrology models as part of larger information systems in order to produce hydrologic reanalysis datasets. These products or services are especially important in areas with limited field-based information. These have to be consistent in terms of available data and in terms of water budget. In this regard, models that integrate surface and groundwater hydrology at fine resolution, based on physical principles, such as the PARFLOW-CLM model, offer advantages as they are fed by measurable parameters, they can be run at large scale, and provide results at high spatial and temporal resolution. Finally these models are able to be upgraded with missing or poorly represented processes.

One example of this continuous improvement is the representation of floodplains: these wetlands correspond to areas that are regularly flooded by large rivers and maintain a complex relationship between surface water, groundwater, and land surface fluxes. Furthermore, due to the flooding conditions, floodplains present highly damageable hydrological risk and high-frequency saturated soil conditions, which favour a significant hotspot of biodiversity, sustain key ecosystem services for human communities, and regulate hydrological flows. But floodplain dynamics are difficult to represent in large-scale hydrologic models because of the control that small-scale topography exerts on water flow and storage. Furthermore in the case of a fine resolution, the simulation must involve the use of explicit relationships and physics-based equations with a high computational cost.

A zone where these difficulties are clearly depicted is the Continental West Africa (CONWA). The CONWA domain covers an area of 3.5 million km² that contains some of the world's largest floodplains, such as the inland Niger River delta. It also covers other smaller intermittent endorheic ponds, with not measured data, and where the combination of wetlands, rivers and aquifers controls both low water levels in dry seasons, downstream high water levels, and induces preferential recharge pathways.

In these perspectives PARFLOW-CLM is implemented in the CONWA domain at 1 km² resolution using the ERA-5 reanalysis, IMERG precipitation dataset, and Copernicus Leaf Area Index data. The methodology representing floodplains prescribe an anisotropic layer near the surface in areas that are “regularly flooded” to allow up-slope flows driven by water head gradient. This anisotropic layer is defined by a depth and a tensor factor affecting horizontal permeability, and allows river grids to connect to neighboring floodplain grids when the water level is high enough to flood them.

We will focus our analysis in disentangle and evaluate the effects of floodplains in three main variables: river discharge seasonality, evapotranspiration, and groundwater storage. These results are important to improve the representation of key hydrologic elements in large-scale hydrology models and Earth system models, and constitute a step toward creating a multi source hydrologic reanalysis system.

How to cite: Arboleda-Obando, P. F., Cohard, J.-M., Zoppis, A., Basile, H., and Pellarin, T.: Improving river-floodplain relationship in PARFLOW-CLM in continental West Africa as an early step to build an multi source hydrologic reanalysis, EGU General Assembly 2026, Vienna, Austria, 3–8 May 2026, EGU26-20566, https://doi.org/10.5194/egusphere-egu26-20566, 2026.

EGU26-20604 | ECS | Orals | HS2.5.1

GEB: a socio-hydrological model for risk management on a European scale 

Tim Busker, Jens de Bruijn, Maurice Kalthof, Hans de Moel, Veerle Bril, Tarun Sadana, Rafaella Oliveira, Lars Tierolf, Carolina Carral, Roy Pontman, Joshua Kiesel, Lisanne van Amelsvoort, Wouter Botzen, and Jeroen Aerts

We present the Geographical, Environmental and Behavioural (GEB) socio-hydrological model at the pan-European scale. The model is agent-based, representing the interactions between (local) hydrology and human water management for hundreds of millions of people across Europe. For this, GEB couples an agent-based adaptation model, a fully distributed hydrological model (originally forked from CWatM), and a hydrodynamic model (SFINCS). Within GEB, people can dynamically respond to their environment, and the decisions that agents make also can affect the environment. For example, farmer agents can change their crops and adopt other measures such as wells in response to droughts, which in turn affects ground- and surface water in the hydrological model. Household agents can adapt to changes in flood risk and respond to flood events by wet- or dry-proofing their house. All adaptation decisions consider heterogeneity in the agent population, such as differences in age and education level. The model architecture allows for a fully automated setup of the model. To initialize the model, and to allow for parallel computing, river basins are automatically clustered based on size and proximity, after which those clusters are run in parallel using an efficient Snakemake workflow. The new hydrological model in GEB simulates hydrological fluxes on an hourly timestep. To validate the model, we compare simulated discharge with discharge observations from the Global Runoff Data Centre (GRDC) dataset, focussing on high flows during flood events. Subsequently, the skill scores (e.g. Kling–Gupta efficiency, KGE) are compared to state-of-the-art hydrological models such as LISFLOOD. GEB is currently used for a wide range of applications, such as (but not limited to) assessments of drought and flood risk, extreme weather impacts (e.g. hail), multi-risk, household adaptation measures, nature-based solutions and early warning. The model is open source and can be accessed via https://github.com/GEB-model/GEB.

How to cite: Busker, T., de Bruijn, J., Kalthof, M., de Moel, H., Bril, V., Sadana, T., Oliveira, R., Tierolf, L., Carral, C., Pontman, R., Kiesel, J., van Amelsvoort, L., Botzen, W., and Aerts, J.: GEB: a socio-hydrological model for risk management on a European scale, EGU General Assembly 2026, Vienna, Austria, 3–8 May 2026, EGU26-20604, https://doi.org/10.5194/egusphere-egu26-20604, 2026.

Estimating evapotranspiration (ET) in areas with limited data remains a challenge, yet it is crucial for water and agricultural management. The Surface Flux Equilibrium (SFE) method is a promising approach, as it estimates the evaporative fraction (EF) using only temperature and humidity observations, assuming that the surface and air reach a steady balance when drying from sensible heat and moistening from ET become similar. In this study, we explore the conditions in which the assumptions of the SFE theory do not hold and identify the variables that can help correct the resulting biases using the ERA5 reanalysis dataset over the Indian landmass. We find that in water-limited regions, the temperature difference between the land and atmosphere can be used to correct biases in SFE-based EF estimates when there are longer intervals between two rainfall events, while relative humidity can be used to correct biases in areas with more frequent rain. In energy-limited regions, net radiation controls the surface flux imbalance and can therefore be used for bias correction. Incorporating these region-specific variables into machine learning models significantly improves SFE’s EF estimates. Our results highlight the value of identifying and using physical indicators to enhance the accuracy of SFE under non-equilibrium conditions.

How to cite: Muzaffar, G. and Apurv, T.: Understanding and Correcting Non-Equilibrium Biases in Surface Flux Equilibrium-Based Evaporative Fraction Estimation., EGU General Assembly 2026, Vienna, Austria, 3–8 May 2026, EGU26-189, https://doi.org/10.5194/egusphere-egu26-189, 2026.

Potential Evapotranspiration (PET) is a relevant input for hydrological modelling and assessing water balance components. PET estimation usually requires meteorological inputs to simulate key radiative and aerodynamic processes.

The reference Penman-Monteith method estimates PET as a function of net solar radiation, pressure, humidity, wind speed, maximum and minimum air temperature. Except for temperature, reliable observations of the other variables are rarely available in most regions of the world; consequently, simpler empirical formulas have been developed to reproduce PET using only a subset of variables. Net solar radiation is probably the most critical input because it plays a major role in evaporative processes, but is very challenging to measure and is often unavailable. This study focuses on three widely used empirical expressions that, in addition to temperature, apply different approaches to approximate the solar radiation at the surface:

  • Oudin formula1 uses, in addition to temperature, the extra-terrestrial radiation value, which depends only on latitude and day of the year.
  • Hargreaves formula2 improves the estimation of surface solar radiation using diurnal temperature variation to compute a sky clearness factor, simulating the fraction of extraterrestrial solar radiation absorbed by the atmosphere.
  • a modified version of Hargreaves formula3 also includes precipitation in the sky clearness computation.

Here we test the robustness of these three formulas in estimating daily PET across diverse global regions. Our purpose is to assess whether increasing the formula complexity, estimating surface solar radiation including temperature variation and then also precipitation, can improve daily PET estimation.

Leveraging worldwide meteorological data of thousands of basins from the large-sample hydrological dataset Caravan4, we initially compared the daily PET estimates produced by the above cited formulas with the reference values based on the Penman-Monteith method. Significant differences were observed among climatic regions: the Hargreaves formula generally performed best, but all methods exhibit biases in particular contexts.

Secondly, we conducted a series of calibration experiments, modifying the original parameterization of the formulas by optimizing their fit to the reference Penman-Monteith in the study basins. We optimized the empirical coefficients for all the basins, both globally and within homogeneous hydro-climatic regions, and analyzed the spatial pattern of performance. Then, we divided the basins into training and validation sets using a distance-based criterion within each region. We performed new calibrations to assess whether the fitted formulas remained valid across different catchments.


References:

1Oudin, L. et al. (2005). Which potential evapotranspiration input for a lumped rainfall–runoff model? Journal of Hydrology, 303(1–4), 290–306. https://doi.org/10.1016/j.jhydrol.2004.08.026

2Hargreaves, G.H. & Samani Z.A. (1985). Reference Crop Evapotranspiration from Temperature. Applied Engineering in Agriculture, 1(2), 96–99. https://doi.org/10.13031/2013.26773

3Droogers, P., & Allen, R. G. (2002). Estimating reference evapotranspiration under inaccurate data conditions. Irrigation and Drainage Systems, 16(1), 33–45. https://doi.org/10.1023/A:1015508322413

4Kratzert, F. et al. (2023). Caravan—A global community dataset for large-sample hydrology. Scientific Data, 10(1), 61. https://doi.org/10.1038/s41597-023-01975-w

How to cite: Selleri, G., Neri, M., and Toth, E.: Global-scale calibration of three empirical PET formulas: evaluation of simple meteorological variables as proxies for solar radiation, EGU General Assembly 2026, Vienna, Austria, 3–8 May 2026, EGU26-1103, https://doi.org/10.5194/egusphere-egu26-1103, 2026.

EGU26-2367 | ECS | PICO | HS2.5.2

Improving hydrological modeling in the Tigris–Euphrates River Basin through water-use adjustments and representation of water transfers 

Abdullah Hasan, Seyed-Mohammad Hosseini-Moghari, and Petra Döll

Human intervention directly affects the terrestrial water cycle by altering river flow regimes through water abstractions, artificial reservoirs, and water transfers. Incorporating human impacts into hydrological modeling is not straightforward. In recent decades, several global hydrological models (GHMs), including WaterGAP (Water Global Assessment and Prognosis), PCR-GLOBWB (PCRaster Global Water Balance), and H08, have incorporated representations of human interventions such as water use and reservoir operations. In addition, WaterGAP accounts for water transfers between adjacent grid cells, while H08 represents long-distance aqueduct water transfers at 55 locations worldwide, none of which are located in the Tigris–Euphrates River Basin (TERB). Despite these advances, model performance remains limited in heavily modified basins such as the TERB. This limitation is mainly due to the lack of high-quality water-use estimates and incomplete representation of alterations to the natural system, in particular, the location and the flow rates of artificial water transfers. In this study with the GHM WaterGAP, we assess the importance of explicitly representing such interventions, focusing on the upstream Euphrates River, primarily within Syria. A comparison of observed mean annual streamflow at Atatürk Dam, 823.7 m3/s for the period 1992-2011, and the Syrian-Iraqi border, 535.90 m3/s for the period 2015-2020, reveals a water loss of 287.8 m3/s between the two streamflow gauging stations. In contrast, WaterGAP simulates a smaller water loss of 82.93 m3/s with a mean annual streamflow of 638.23 m3/s at the Atatürk Dam for the period 1992-2011 and 555.3 m3/s at the Syrian-Iraqi border for the period 2015-2020. Although the upstream-downstream water loss is partially represented by WaterGAP, the remaining discrepancies between the observed and simulated streamflow losses cannot be corrected through a basin-wide uniform calibration of model parameters alone but require an adjustment of simulated water abstractions. To address this, we used the FAO (Food and Agriculture Organization) water use dataset, which suggests that water abstractions in Syria are nearly twice as high as those represented in WaterGAP; accordingly, we doubled the water abstractions in Syria. Moreover, analysis of Google Earth imagery revealed a water transfer from the Assad reservoir, located on the Euphrates River in Syria, to areas outside TERB. Based on this observation, we identified the corresponding grid cells using Google Earth imagery and implemented a demand-based water transfer from the Assad reservoir to these external areas. We assumed that whenever water demand occurred in these grid cells, it was supplied by the Assad reservoir. By doubling the water abstractions in Syria and incorporating the demand-based water transfer from the Assad reservoir to adjacent areas, WaterGAP successfully simulates a mean annual water loss of 242.33 m3/s, which is close to the observed value. These findings highlight the necessity of adjusting the simulation of human impacts in heavily modified basins as a prerequisite for a meaningful calibration of model parameters

How to cite: Hasan, A., Hosseini-Moghari, S.-M., and Döll, P.: Improving hydrological modeling in the Tigris–Euphrates River Basin through water-use adjustments and representation of water transfers, EGU General Assembly 2026, Vienna, Austria, 3–8 May 2026, EGU26-2367, https://doi.org/10.5194/egusphere-egu26-2367, 2026.

EGU26-2524 | PICO | HS2.5.2

Assessment of inter-product uncertainty in GRACE/GRACE-FO-derived terrestrial water storage 

Seyed-Mohammad Hosseini-Moghari and Petra Döll

Terrestrial water storage anomalies (TWSA) derived from the Gravity Recovery and Climate Experiment (GRACE) and its successor, GRACE Follow-On (GRACE-FO), provide essential information for assessing regional and global water storage changes. Several processing centers produce GRACE(-FO) TWSA products intended for use by non-geodesy experts, particularly for validating and calibrating large-scale hydrological models. However, discrepancies among these TWSA products remain poorly understood within the hydrology community. In this study, we quantify differences among six GRACE(-FO) TWSA products—three leakage-corrected spherical harmonic solutions (HydroSat, COST-G, and GFZ-GravIS) and three mascon solutions (CSR-M, GSFC-M, and JPL-M)—for the period April 2002 to December 2024 across 15 large river basins (>210,000 km²). We compare linear trends and seasonal amplitudes and apply the Generalized Three-Cornered Hat (GTCH) method to identify which products deviate most and least from the others. Our results show substantial variability in both trends and seasonal amplitudes across products and basins. For example, in the Uruguay Basin, the trend estimated by HydroSat is 1.77 mm/yr, whereas GFZ-GravIS reports -5.08 mm/yr. In the Churchill Basin, the seasonal amplitudes of the detrended time series range from 84 mm (GFZ-GravIS) to 45 mm (JPL-M), with a median of 57 mm. In another case, the mean range of TWSA across products in the Bravo Basin is 1.7 times larger than the median seasonal amplitude across the same products. According to the GTCH results, GFZ-GravIS shows the largest disagreements with the other products across all 15 basins, whereas GSFC-M and COST-G achieve the highest agreement in 7 and 5 basins, respectively. These results demonstrate that reliance on a single GRACE(-FO) product can mislead hydrological model evaluation. We therefore recommend using ensemble-based approaches and explicitly accounting for GRACE TWSA uncertainty when employing these products as reference data.

How to cite: Hosseini-Moghari, S.-M. and Döll, P.: Assessment of inter-product uncertainty in GRACE/GRACE-FO-derived terrestrial water storage, EGU General Assembly 2026, Vienna, Austria, 3–8 May 2026, EGU26-2524, https://doi.org/10.5194/egusphere-egu26-2524, 2026.

The Haihe River basin (HRB) is the homeland for 120 million people with the 10% of total production of grains in China. HRB has experienced serious water storage depletion due to ongoing socio-economic development, population growth, and additional water stress from climate change, thus resulting in a series of eco-environmental problems, such as land subsidence, seawater invasion, and river blanking. To tackle these issues, multiple water transfer projects have been built to supply water to the HRB from other river basins. One of the most famous is the Middle Route of the South-to-North Water Transfers (SNWT) Project, which began its operation in late 2014. Up till now, the SNWT-diverted water has been used for compensating environmental flow, replenishing reservoirs recharging aquifers, and replacing urban groundwater pumping. This raises the widely concerned issue of whether the terrestrial water storage (TWS) and water budget in HRB have changed unexpectedly after the implementation of SNWT.

This study assesses monthly changes of TWS and water budget in the HRB from 2003 to 2023 by using Gravity Recovery and Climate Experiment (GRACE) satellite and ancillary datasets. We quantify the extent and contribution ratio of each water budget factor to TWS change before and after the SNWT operation using hierarchical analysis. Results show that the annual rate of TWS in HRB shifted from -17.0 mm/a (during 2003-2014) to +4.8 mm/a (during 2015-2023), which can be mainly attributed to the combined impacts of the intense precipitation infiltration in 2021 and the additional water recharge from the SNWT. Precipitation is identified as the main factor dominating regional TWS change, followed by evapotranspiration, runoff, and the water transfer volume. The averaged contribution ratios of these four factors are calculated as 57.0%, 34.0%, 7.49%, and 1.6%, respectively. Most importantly, we found that the contribution ratios of runoff and water transfer volume increased while those of precipitation and evapotranspiration decreased after the SNW'T operation, indicating a new change of HRB's water budget after water transfer.

Although the annual trend of TWS in HRB is increasing over the timespan of SNWT operation (2015-2023), the annual trend of TWS is still decreasing when focusing only on the timespan of 2022-2023. Such decrease in TWS can either be interpreted as a normal recessionary of TWS following the over-recharge from intense precipitation in 2021, or it can be recognized as representing the ongoing TWS depletion in spite of the implementation of SNWT. If viewed from the perspective of regional water budget, the inflow of water from the SNWT operation will certainly moderate the depleting trend of TWS in HRB. Yet whether the SNWT-diverted water can completely halt the TWS depletion or even cause the TWS recovery, still require further analysis and assessment based on the longer-term observational data of TWS change in HRB. The findings of this study highlight the notable impacts of large-scale water transfer and intense precipitation on the water cycle of HRB, and such impacts may become more obvious with the continued operation of SNWT in the future.

How to cite: Zhang, C., Shen, H., and Pan, Y.: Assessing the Impact of Interbasin Water Transfer on Terrestrial Water Budget: A GRACE-Based Case Study in China’s Haihe River Basin, EGU General Assembly 2026, Vienna, Austria, 3–8 May 2026, EGU26-2924, https://doi.org/10.5194/egusphere-egu26-2924, 2026.

EGU26-4324 | ECS | PICO | HS2.5.2

Simulation of Evapotranspiration and Its Response to Environmental Changes in the Semi-Humid and Semi-Arid Regions of Northern China 

Wenyang Cao, Pei Wang, Renjie Guo, Zifan Zhang, Zhihui Zhao, Jiayin Liu, Yuan Yuan, and Yiran Liu

Abstract: The semi-humid and semi-arid region of Northern China is a typical climatic transition zone characterized by water scarcity and ecological fragility. As water resources constitute the critical constraint on sustainable development in this region, investigating evapotranspiration (ET)—the primary pathway of water loss—is imperative. This study employed a Soil-Plant-Atmosphere Continuum (SPAC) model to characterize hydro-thermal transfer processes within the vegetation-soil system from 2001 to 2020, quantifying both total ET and its components. Model validation demonstrated robust performance against in-situ observations, with coefficients of determination (R2) for latent heat flux, net radiation, and land surface temperature ranging from 0.48 to 0.95 across four representative sites. Spatially, ET decreased from southeast to northwest, with a multi-year regional average of 439.53 ± 32.80 mm. ET exhibited distinct seasonal variability, peaking in summer (235.61 ± 24.15 mm) followed by spring (111.13 ± 13.02 mm), autumn (74.13 ± 9.07 mm), and winter (18.38 ± 3.46 mm). Partitioning analysis revealed that the multi-year average vegetation transpiration (T) and soil evaporation (Es) were 244.53 ± 30.16 mm and 195.00 ± 15.52 mm, respectively, yielding a mean transpiration fraction (T/ET) of 0.54 ± 0.04. The spatial pattern of T/ET was demarcated by the Greater Khingan – Taihang Mountains, showing higher values in the east, lower values in the west, and peak values along the boundary line and its vicinity. Seasonal divergence was pronounced: transpiration dominated in summer (T/ET reaching 0.64 ± 0.05), whereas soil evaporation prevailed in other seasons, reducing T/ET to 0.17 ± 0.04 in winter. ET and its components showed significant sensitivity to environmental changes. Spearman analysis indicated strong correlations (r > 0.8) with downward shortwave radiation (Rs), vapor pressure deficit (VPD), and leaf area index (LAI). Random Forest and SHAP analyses further revealed different key factors influencing the processes: Rs, VPD, and LAI were the primary drivers for total ET; soil evaporation was mainly influenced by Rs, relative humidity, and VPD; and transpiration was mainly driven by LAI and Rs, with importance values of 0.35 and 0.17, respectively. Notably, LAI was crucial in controlling the T/ET ratio, with an importance value of 0.46. These findings offer vital scientific insights for ecosystem conservation and water resource management in the semi-humid and semi-arid regions of Northern China.

Keywords: Evapotranspiration; Numerical simulation; SPAC model; T/ET ratio; Climate change; Leaf Area Index; Semi-humid and semi-arid regions of Northern China.

How to cite: Cao, W., Wang, P., Guo, R., Zhang, Z., Zhao, Z., Liu, J., Yuan, Y., and Liu, Y.: Simulation of Evapotranspiration and Its Response to Environmental Changes in the Semi-Humid and Semi-Arid Regions of Northern China, EGU General Assembly 2026, Vienna, Austria, 3–8 May 2026, EGU26-4324, https://doi.org/10.5194/egusphere-egu26-4324, 2026.

EGU26-5046 | ECS | PICO | HS2.5.2

Advancing Global Precipitation Estimation Using Next-Generation Gravity Missions 

Muhammad Usman Liaqat, Stefania Camici, Francesco Leopardi, and Luca Brocca

The Gravity Recovery and Climate Experiment (GRACE) and its Follow-On mission (GRACE-FO) provide valuable observations of terrestrial water storage (TWS) dynamics from regional to global scales. However, their limited spatio-temporal resolution impedes the reliable separation of individual hydrological fluxes, especially precipitation. To overcome these challenges, a joint collaboration between NASA and ESA initiated the Mass change and Geosciences International Constellation (MAGIC), aiming to deploy next-generation gravity missions with enhanced spatio-temporal resolution to better monitor hydrological extremes such as droughts and floods. The primary objective of this work is to examine the impact of improving the spatio-temporal resolution of NGGM and MAGIC on precipitation estimation by developing multiple synthetic experiments globally. Precipitation used as forcing in an Earth System Model (ESM) is compared against reference precipitation, with ERA5-Land precipitation serving as the benchmark, to evaluate the reliability of the SM2RAIN approach (Brocca et al., 2014) when driven by equivalent water height (EWH) data (in the past it was implemented by using surface soil moisture data). The global correlation analysis shows median and mean correlation coefficients of 0.74 and 0.69, respectively, indicating satisfactory performance of the EWH-based SM2RAIN framework across most terrestrial regions. Stronger correlations are observed over Northern Hemisphere mid-latitudes, including Europe, northern Asia, and North America, reflecting robust performance in temperate climates, while reduced performance is evident in several tropical regions such as central Africa, parts of the Amazon Basin, and Southeast Asia. Subsequently, synthetic experiments were developed using filter and unfiltered configurations of GRACE-C, NGGM, and MAGIC missions. The performance of NGGM and MAGIC filtered configurations indicates their capability to capture precipitation dynamics effectively as compared to unfiltered ones. The results of the study clearly highlight the benefit of NGGM and MAGIC missions in improving our capability to estimate various hydrological components, particularly for precipitation estimation relying on satellite data as inputs.

How to cite: Liaqat, M. U., Camici, S., Leopardi, F., and Brocca, L.: Advancing Global Precipitation Estimation Using Next-Generation Gravity Missions, EGU General Assembly 2026, Vienna, Austria, 3–8 May 2026, EGU26-5046, https://doi.org/10.5194/egusphere-egu26-5046, 2026.

Climate change induced precipitation pattern changes along with the increasing forest area have affected the hydrological processes in Taiwan’s mountainous watersheds. Recent studies pointed out that despite the increasing rainfall, the ratio of precipitation that turns into runoff decreases, implying more water storage in watersheds. However, a contradictory decreasing trend in groundwater level was also discovered, highlighting the importance of water budget reassessment. To figure out where the missing water is stored, observed precipitation, runoff data and model evapotranspiration data from Taiwan Climate Change Projection Information and Adaption Knowledge Platform (TCCIP) will be integrated to infer total dynamic storage by water balance equation. To further distinguish the composition of total dynamic storage, recession analysis and sensitivity function will be applied to derive direct storage and indirect storage, which represent the storage that drives streamflow and the remainder of it, respectively. Finally, the combination of total water storage data (from GRACE or GNSS), soil water content data (such as TerraClimate), observed groundwater levels or other potentially relevant data will be used to validate the results. The objectives of this study include: (1) Accessing the water budget under climate and land use changes in Taiwan’s mountainous watersheds and (2) Identifying the distribution of the water stores in the watersheds.

How to cite: Chen, S.-E. and Lee, T.-Y.: Water balance under climate and land use changes in Taiwan’s mountainous watersheds, EGU General Assembly 2026, Vienna, Austria, 3–8 May 2026, EGU26-5205, https://doi.org/10.5194/egusphere-egu26-5205, 2026.

EGU26-5940 | ECS | PICO | HS2.5.2

The value of high model resolution for streamflow in small and large near-natural European river basins 

Emmanuel Nyenah, Kan Lei, Martina Flörke, Robert Reinecke, and Petra Döll

Macroscale hydrological models typically operate at a coarse spatial resolution, which limits their ability to assess locally relevant impacts of climate change. Recent advances in available forcing data, computational resources, and calls for higher-resolution modelling have led to the development of models running at 5 arcmin or finer resolutions. However, evaluations of streamflow performance in several studies assessing whether higher resolution improves streamflow simulations remain inconclusive. While some studies report improved streamflow performance with increasing resolution, others find that higher spatial resolution does not necessarily translate into better model performance. To better understand these inconsistencies, we apply the 5 arcmin and 30 arcmin spatial resolutions of the latest version of the global hydrological model, WaterGAP, to investigate the impact of spatial resolution on streamflow performance in 131 near-natural European basins for the period 1950–2024. Basins are classified as small (3,000–9,000 km², 20 basins) or large (>9,000 km², 111 basins) to assess the added value of higher spatial resolution. Both model versions are run without calibration. Our results show comparable performance (KGE-based performance ratio is within ±20%) between model resolutions in 73% of large basins. The 5 arcmin version shows increased performance in 4.5% of large basins and decreased performance in 22.5% of large basins compared to 30 arcmin model resolution.   In small basins, the 5 arcmin version shows comparable performance to the 30 arcmin version in 55% of basins, performs worse in 30% of basins, and outperforms the 30 arcmin version in only 15% of cases, despite expectations that higher resolution should better capture spatial variability. Overall, median streamflow performance is lower in the 5 arcmin version compared to the 30 arcmin version, both in large (KGE5 arcmin = 0.46, KGE30 arcmin = 0.53) and small (KGE5 arcmin = 0.41, KGE30 arcmin = 0.45) basins.  This lower performance is primarily due to the overestimation of the long-term mean streamflow in both resolutions for both large and small basins, with the overestimation being slightly worse in the 5 arcmin version. It should be noted that median streamflow variability is underestimated in small river basins but is captured well in large river basins, with the 5 arcmin version showing better median streamflow variability than the 30 arcmin version. Also, correlation (timing) is improved as resolution increases. This limited ability to reproduce streamflow variability and long-term mean discharge, which has also been reported in the literature, may explain the inconsistencies in streamflow performance regarding the benefits of increased spatial resolution. These result underscores the need for targeted enhancements in model parameterization and forcing data to improve variability and bias performance .

How to cite: Nyenah, E., Lei, K., Flörke, M., Reinecke, R., and Döll, P.: The value of high model resolution for streamflow in small and large near-natural European river basins, EGU General Assembly 2026, Vienna, Austria, 3–8 May 2026, EGU26-5940, https://doi.org/10.5194/egusphere-egu26-5940, 2026.

EGU26-6085 | ECS | PICO | HS2.5.2

Unraveling Scale Effects in Naturalized Runoff Processes: Insights from Interpretable Machine Learning Across the Yellow River Basin 

Fenghua You, Shanshui Yuan, Liliang Ren, Chenglong Cao, Xiuqin Fang, Shanhu Jiang, Yi Liu, and Xiaoli Yang

Effective water resource management requires a comprehensive understanding of runoff processes across spatial scales and their interconnections. However, scale effects pose major challenges to deriving a universal spatial scaling law when extrapolating runoff research from fine to broad scales. Previous studies have mainly focused on relatively small catchments (<100 km²), potentially overlooking the heterogeneity of environmental drivers affecting runoff processes. Furthermore, traditional point-based, short-term, or infrequent measurements are insufficient to accurately capture nonlinear behavior of runoff processes. To address these issues, we integrated global runoff data products with interpretable machine learning approaches to analyze runoff processes across spatially nested basins within the Yellow River Basin. Spatial scale effects and their driving factors are systematically evaluated, extending the analysis to the river-basin scale (>100 km²). Our results indicate that the runoff coefficient of most sub-basins in the Yellow River Basin exhibits multi-scaling behavior, with spatial patterns varying across scales. Rather than following a single trend, the scale effects of the runoff coefficient are complex and non-monotonic. In smaller sub-basins, the spatial distribution of precipitation primarily controls runoff scale effects, whereas in larger sub-basins, land-use patterns become the dominant governing factor.   

How to cite: You, F., Yuan, S., Ren, L., Cao, C., Fang, X., Jiang, S., Liu, Y., and Yang, X.: Unraveling Scale Effects in Naturalized Runoff Processes: Insights from Interpretable Machine Learning Across the Yellow River Basin, EGU General Assembly 2026, Vienna, Austria, 3–8 May 2026, EGU26-6085, https://doi.org/10.5194/egusphere-egu26-6085, 2026.

EGU26-9464 | ECS | PICO | HS2.5.2

A data-driven framework for estimating monthly irrigation water withdrawals at the catchment scale  

Paul Zarpas, Maria-Helena Ramos, Gaëlle Tallec, Denis Allard, and Fanny Sarrazin

Exploring future hydrological conditions and supporting decision-makers require datasets of irrigation water withdrawals (IWW) that capture spatial, interannual, and seasonal variabilities. Most databases do not meet these criteria, as they are typically limited to specific regions and time periods and are often available only at the annual time scale. The quantification of IWW has recently received increased attention through machine-learning approaches that can model the complex relationship between IWW and explanatory factors. However, methodological challenges remain in temporally disaggregating annual IWW data and in assessing the robustness and uncertainty of machine-learning-based estimates.

In this work, we present a comprehensive data-driven framework for estimating monthly IWW at the catchment scale. Our approach allows for the interpolation and extrapolation of IWW, for uncertainty quantification, and for the temporal disaggregation of annual IWW to a monthly resolution. Interpolation is performed using Random Forest (RF) algorithms, which are evaluated using five spatio-temporal cross-validation experiments. Prediction uncertainty distributions are modeled using Generalized Additive Models for Location Scale and Shape (GAMLSS) and observed error structures. Extrapolation of annual IWW is then achieved using a Generalized Additive Model (GAM). Finally, annual IWW data are disaggregated to monthly values using the contribution of monthly meteorological and soil wetness predictors.

The methodology is applied to 656 French catchments using the French Water Withdrawals National Database (BNPE), which makes available annual IWW values since 2008 at the local administrative level, and open-source predictors, such as area equipped for irrigation, crop type and monthly meteorological data. RF models achieve high predictive skill (r² ≈ 0.99), but performance declines sharply under spatio-temporal data removal (r² ≈ 0.4), underscoring the the importance of rigorous validation and comprehensive uncertainty quantification. A SHapley Additive exPlanations (SHAP) analysis reveals physically consistent relationships between predictors and their contribution to model predictions. Monthly disaggregated IWW are consistent with seasonal patterns simulated by four global hydrological models, with peak values occurring in summer. We demonstrate the value of the modelling framework at the catchment scale by extending the dataset backward in time and by projecting IWW into the future.

This work received funding from the European Life Revers'Eau project.

How to cite: Zarpas, P., Ramos, M.-H., Tallec, G., Allard, D., and Sarrazin, F.: A data-driven framework for estimating monthly irrigation water withdrawals at the catchment scale , EGU General Assembly 2026, Vienna, Austria, 3–8 May 2026, EGU26-9464, https://doi.org/10.5194/egusphere-egu26-9464, 2026.

EGU26-9921 | PICO | HS2.5.2

The water balance of the large river basins of Northern Kazakhstan estimated by remote sensing and global datasets combined with hydrologic information 

Vadim Yapiyev, Abdikaiym Zhiyenbek, Nurlan Ongdas, Zarina Saidaliyeva, Aidos Makhanov, Sifan Koriche, and Egor Prikaziuk

Kazakhstan is a large country located in the center of Eurasia.  The quantity and quality of its water resources strongly depend on the specific cold and dry climate conditions with strong continentality, and land-locked topography. The country faces significant climatic risks and water management challenges, yet comprehensive baseline data for its regional river basins remains fragmented and largely unknown to the global community. In this study, we address these gaps by evaluating the water balance of regional river basins of Northern part of Kazakhstan—Zhaiyk-Caspian, Tobyl, Torgai, Sarysu, Nura, Yesil, and Ertis and additional inter-basins, focusing on the recent period when Earth-Observation Satellite data became available (21st century). Consequently, this research integrates ground-based hydrometeorological observations (such as river runoff and precipitation) with satellite-based products for precipitation, terrestrial evaporation and total water storage (such as MSWEP, GLEAM and GRACE), as well as global climate reanalysis datasets (ERA5), to quantify water fluxes and storage over the last 20 years. Our results show that: 1) total terrestrial water storage inferred from GRACE remained in a steady state in the study region apart from Zhaiyk-Caspian basin where it decreased by approximately by 200 mm from 2002 to 2022; 2) the water budget is dominated, in terms of inputs, by cold season (October-March) precipitation and in the loss term by warm season (April-September) evapotranspiration, with strong evaporation control; 3) the water balance closure and storage change from P-E and GRACE show good correspondence; 4) new evaporation sensor data show that best global ET remote sensing product (GLEAM) and model output (ERA5) datasets overestimate terrestrial evaporation in the study region due to water limitation. 

How to cite: Yapiyev, V., Zhiyenbek, A., Ongdas, N., Saidaliyeva, Z., Makhanov, A., Koriche, S., and Prikaziuk, E.: The water balance of the large river basins of Northern Kazakhstan estimated by remote sensing and global datasets combined with hydrologic information, EGU General Assembly 2026, Vienna, Austria, 3–8 May 2026, EGU26-9921, https://doi.org/10.5194/egusphere-egu26-9921, 2026.

Groundwater is a critical resource that sustains life and livelihood on Earth. Changing climatic patterns and increased groundwater withdrawal to meet the demands of irrigation and municipal water supply have stressed the world’s major aquifer systems. Although groundwater is the largest available freshwater resource, it is often poorly monitored and hence poorly managed, particularly in data-scarce regions. Satellite-based Interferometric Synthetic Aperture Radar (InSAR) has emerged as a powerful tool for monitoring aquifer systems worldwide. In this study, we utilize nearly two decades (2007-2024) of InSAR measurements to investigate the temporal evolution of land subsidence in the Delhi National Capital Region of India. The observations revealed two major subsidence zones, located in the Dwarka (12 km²) and Gurgaon (1 km²) areas, with subsidence rates of up to 6.0 cm/year, which were observed between 2007 and 2010 in response to increased groundwater extraction. Post-2016, the subsidence zone near Dwarka began to show uplift (~2 cm/year) in response to rising groundwater levels. The areas north of Gurgaon, which had subsided by nearly 1m during 2014-18 at a rate of almost 15 cm/year, started to show a marked reduction in subsidence rate (from 15 cm/year to 7 cm/year) after 2019. Although these subsidence zones, located within the Administrative Boundary of Delhi (ABD), showed uplift/significant reduction in subsidence rate, Faridabad, a town outside the ABD, continued to subside till 2023. The rebound of the aquifer system and a substantial reduction in the subsidence rate are attributed to extensive groundwater management practices mandated within the ABD. The recovery of the stressed aquifer system, nearly 1.5 m after 2018, despite decreasing rainfall, further highlights the role of human intervention. 

How to cite: Syed, T. H. and Kumar, H.: Space-Time Evolution of Land Subsidence in India: Evidence for Recovery of Stressed Aquifer Systems, EGU General Assembly 2026, Vienna, Austria, 3–8 May 2026, EGU26-10024, https://doi.org/10.5194/egusphere-egu26-10024, 2026.

EGU26-11049 | ECS | PICO | HS2.5.2

Multi-variable validation and calibration of the mesoscale Hydrologic Model (mHM) using independent observations of the soil water balance 

Julian Schlaak, Friedrich Boeing, Felix Thomas, Luis Samaniego, Martin Schrön, Falk Böttcher, and Andreas Marx

Distributed hydrological models such as the mesoscale Hydrologic Model (mHM) are commonly calibrated against discharge observations, implicitly assuming that good agreement with discharge reflects a realistic representation of internal states and fluxes. However, discharge-only calibration may lead to parameter equifinality and insufficiently constrained simulations of soil moisture, evapotranspiration, and groundwater recharge. This limits the interpretability of model results for drought analysis, water balance assessment, and management-oriented applications.

Within the MOWAX (“Monitoring- and modelling concepts as a basis for wate rbudget assessments in Saxony”) project, we assess the consistency of the simulated soil water balance of mHM using a comprehensive, multi-variable validation framework for Saxony (Germany). To better represent regional soil heterogeneity, the model setup incorporates high-resolution soil information based on the BK50 soil map. Model outputs are evaluated against independent observational data sets representing all major components of the terrestrial water balance across different spatial and temporal scales. These include observed discharge at multiple gauging stations, estimates of actual evapotranspiration derived from eddy-covariance measurements at ICOS sites and gridded Fluxcom products, long-term mean groundwater recharge from an independent BGR raster data set, and area-representative soil moisture observations from a Cosmic-Ray Neutron Sensing (CRNS) station at Cunnersdorf.

We conduct a conventional calibration of mHM using discharge observations only and select parameter sets that achieve high runoff performance. These parameter sets are subsequently evaluated with respect to their ability to reproduce independently observed soil moisture dynamics, evapotranspiration patterns, and groundwater recharge estimates. This step explicitly tests whether good discharge performance coincides with physically plausible internal model behavior. First results suggest that discharge-only calibration can be associated with a large spread in simulated soil moisture states despite similarly good runoff performance. The inclusion of soil moisture information as an additional constraint appears to reduce this spread and to improve the consistency of simulated soil water storage dynamics. However, the degree to which these constraints translate into improved agreement with independent evapotranspiration and groundwater recharge estimates is explicitly assessed and discussed.

The MOWAX project is funded by the European Regional Development Fund (EFRE) and by tax revenue on the basis of the budget approved by the Saxon state parliament (funding code 100702604).

How to cite: Schlaak, J., Boeing, F., Thomas, F., Samaniego, L., Schrön, M., Böttcher, F., and Marx, A.: Multi-variable validation and calibration of the mesoscale Hydrologic Model (mHM) using independent observations of the soil water balance, EGU General Assembly 2026, Vienna, Austria, 3–8 May 2026, EGU26-11049, https://doi.org/10.5194/egusphere-egu26-11049, 2026.

EGU26-11645 | PICO | HS2.5.2

Estimating the components of the hydrological budget of the Alpine lakes using the GEOFrame modeling system 

Pierluigi Claps, Pietro Bogoni, Giuseppe Formetta, Giulia Evangelista, and Riccardo Rigon

The Italian Alpine region faces significant challenges in water resource management due to competing demands from agriculture, hydropower production, and flood risk mitigation. Rising temperatures and ongoing glacier retreat pose unprecedented pressures, highlighting the need for an improved understanding of hydrological cycle components. This region hosts numerous Alpine lakes that play a key role in water storage, including the four largest – Lake Maggiore, Lake Como, Lake Iseo, and Lake Garda – which together provide up to 1.2 billion m³ of storage capacity over a catchment area exceeding 12000 km².

The aim of this work is to give an overview of the modelling framework and the calibration procedures that were performed on this area using the GEOFrame-NewAge hydrological modeling system, an open-source, modular platform based on Java components, designed to represent the complex physical processes of the hydrological cycle.

The upstream lake catchments were discretized into sub-basins and modelled using a semi-distributed approach, with processes evaluated at sub-basin centroids based on spatially averaged properties. A major focus was placed on harmonizing regional meteorological datasets, as preliminary analyses revealed a systematic underestimation of precipitation at high-elevation gauges. This required a re-evaluation of input data using historical sources and atlases, particularly for the Swiss catchment of Lake Maggiore. Evapotranspiration estimates were improved by introducing a semi-distributed net radiation scheme computed on a 1500 m grid, which enhanced model performance compared to centroid-based calculations.

Model calibration was challenging due to the dense network of water infrastructures that alter natural flow regimes and bypass many gauging stations. Calibration therefore relied on selected hydrometric stations and time periods minimally affected by anthropogenic influences, enabling a consistent basin-wide calibration. Using the Kling-Gupta Efficiency as the objective function, the model achieved excellent performance, with calibration and validation values often exceeding 0.8. Post-processing analyses also showed good agreement with long-term averages of key hydrological components.

By enabling the estimation of impacts on long-term water availability, this successfully calibrated model provides a powerful tool to quantify water scarcity, optimize reservoir management, and minimize conflicts among stakeholders, especially under a changing climate.

How to cite: Claps, P., Bogoni, P., Formetta, G., Evangelista, G., and Rigon, R.: Estimating the components of the hydrological budget of the Alpine lakes using the GEOFrame modeling system, EGU General Assembly 2026, Vienna, Austria, 3–8 May 2026, EGU26-11645, https://doi.org/10.5194/egusphere-egu26-11645, 2026.

EGU26-11978 | ECS | PICO | HS2.5.2

ESA CCI Land Evaporation: Towards a long-term consistent satellite-based global evaporation dataset 

Kwint Delbare, Oscar M. Baez-Villanueva, and Diego G. Miralles and the ESA-CCI Consortium

Land evaporation is an essential component of the terrestrial water, energy, and carbon cycles, yet its large-scale behaviour remains poorly understood. This limited understanding relates to the scarcity and uneven distribution of ground-based measurements (particularly across the Global South), the difficulties in modelling the complex interplay of vegetation processes, atmospheric turbulence, and soil–vegetation–atmosphere dynamics, and the inability to observe evaporation directly from space. This uncertainty limits our ability to quantify land–atmosphere feedbacks, monitor hydrological extremes such as droughts and heatwaves, understand the influence of climate change on water availability, and enhance the resilience of agricultural systems, emphasising the need for accurate, long-term, and observation-based global records.

Given the relevance of land evaporation for climate, it has recently been identified by the Global Climate Observing System (GCOS) and the European Space Agency (ESA) as an Essential Climate Variable (ECV). ESA through its Climate Change Initiative (CCI) has recently launched the CCI Land Evaporation initiative, which aims to provide an observationally constrained dataset for climatological research that is aligned with GCOS requirements and climate community needs.

To achieve this goal, the ESA CCI Land Evaporation initiative will integrate satellite observations with state-of-the-art process-based and machine learning modelling. Long-term (1980-present), spatially consistent daily estimates of land evaporation and its associated ECV products—transpiration, interception loss, bare soil evaporation, as well as latent and sensible heat—will be generated using a novel algorithm following a multi-physics strategy.  Processes will be constrained by satellite data and represented by multiple alternative formulations derived from an extensive literature review. Multi-physics permutations will be evaluated through perturbation experiments, and estimates will be compared against eddy-covariance observations to identify the algorithmic configuration that achieves the highest performance while maximising simplicity and reliance on satellite data. The modular design will also enable the quantification of epistemic uncertainty, which will be provided for each one of the variables comprising the Land Evaporation CCI dataset.

Overall, this presentation will summarise the objectives, methodological framework, algorithm development, and anticipated contributions of the ESA CCI Land Evaporation initiative to climate monitoring and long-term assessment of the terrestrial water cycle.

How to cite: Delbare, K., Baez-Villanueva, O. M., and Miralles, D. G. and the ESA-CCI Consortium: ESA CCI Land Evaporation: Towards a long-term consistent satellite-based global evaporation dataset, EGU General Assembly 2026, Vienna, Austria, 3–8 May 2026, EGU26-11978, https://doi.org/10.5194/egusphere-egu26-11978, 2026.

EGU26-13401 | ECS | PICO | HS2.5.2

Entropy-Based Quantification of Hydrological Variability in Peninsular Indian River Basins 

Muhammed Sabir, Nargiz Naushad, Sooryasree Suresh, Vishnu Sreekumar, and Gowri Reghunath

Hydrological variability in river basins arises from complex, non-linear interactions between climatic forcing and catchment characteristics that are often inadequately captured by conventional statistical measures. In hydro-climatically diverse regions such as Peninsular India, there is a need for scale-consistent and assumption-free approaches to quantify both variability and process interdependence. This study applies an information-theoretic framework to characterise hydrological variability and process connectivity across river basins in Peninsular India. Long-term hydrological data, including daily precipitation and streamflow data for a large number of catchments, were obtained from the CAMELS-IND dataset. Analyses were conducted at daily, monthly, and annual time scales to investigate scale-dependent behaviour. Prior to the information-theoretic analysis, trends of various hydrological processes were assessed using non-parametric methods, including the Mann–Kendall test, to identify potential temporal changes in hydrological regimes. Shannon entropy and mutual information measures were used to quantify the variability and uncertainty of various hydrological processes and process relationships across spatial and temporal scales. Trend analysis indicates spatially heterogeneous precipitation and streamflow behaviour across river basins of Peninsular India, with stations exhibiting increasing, decreasing, and non-significant trends. Precipitation entropy is generally higher than streamflow entropy across catchments, suggesting differences in variability between climatic inputs and runoff responses. Mutual information analysis further reveals scale-dependent variations in rainfall–runoff dependence across catchments. The results highlight the potential of information-theoretic metrics for characterising hydrological variability and rainfall–runoff relationships in data-scarce and hydro-climatically heterogeneous regions.

How to cite: Sabir, M., Naushad, N., Suresh, S., Sreekumar, V., and Reghunath, G.: Entropy-Based Quantification of Hydrological Variability in Peninsular Indian River Basins, EGU General Assembly 2026, Vienna, Austria, 3–8 May 2026, EGU26-13401, https://doi.org/10.5194/egusphere-egu26-13401, 2026.

Since 2002, the Gravity Recovery and Climate Experiment (GRACE) and its successor, GRACE Follow-On (GRACE-FO), has enabled the estimation of Terrestrial Water Storage (TWS) anomalies (ΔS), significantly improving our ability to constrain water balance components at regional scales. These observations also provide new insights into large-scale drainage dynamics by allowing direct examination of the storage–discharge (S–Q) relationship, a fundamental element to conceive lumped rainfall–runoff models.

In many catchments, including those in the Amazon basin, the empirical S–Q relationship can be reasonably approximated by a deterministic function Q=ƒ(ΔS, t), where t denotes time. Substituting this function into the water balance equation yields a mass-conserving rainfall–runoff model expressed as a nonlinear first-order differential equation in ΔS . This formulation supports forward simulation of discharge and storage given precipitation and evapotranspiration (P, ET) and is amenable to assimilation of discharge observations using techniques such as Bayesian smoothing. More importantly, the model can be rearranged to perform inverse estimation — also known as “hydrology backward”— to infer net recharge (P-ET) from observed discharge Q.

In this study, we examine 50 catchments of varying size within the Amazon basin and estimate for each of them the function ƒ using two approaches: (1) by fitting a spline, which can incorporate time dependence, and (2) a Single-Hidden-Layer Feedforward Neural Network (SLFN) trained via the Extreme Learning Machine (ELM), a lightweight learning algorithm which does not require iterative backpropagation. Forward simulations (P, ET → ΔS, Q) demonstrate good skill in reconstructing hydrographs, independently of the catchment size, with some limitations in reproducing TWS anomalies during high-flow periods. For inverse modeling, we focus on reconstructing evapotranspiration (P, Q → ET) using for the precipitation a combination of various products. We show that although the estimated uncertainty on ET remains substantial, the resulting estimates are broadly consistent with existing independent ET datasets.

How to cite: Douch, K. and Goracci, G.: A data-driven framework for forward and inverse hydrology in large basins: insights from GRACE(-FO) and discharge observation, EGU General Assembly 2026, Vienna, Austria, 3–8 May 2026, EGU26-13671, https://doi.org/10.5194/egusphere-egu26-13671, 2026.

Hydrological dynamics in Mediterranean regions are strongly controlled by temperature-driven evapotranspiration processes and marked spatial heterogeneity in soil properties and land use. In such settings, both the choice of evapotranspiration formulation and the representation of soil water storage play a decisive role in grid-based water budget modeling.

In this study, a recently developed high-resolution (1 km), monthly, grid-based water budget model (HYGRID-M) was applied to investigate the sensitivity of the simulated hydrological components to key methodological assumptions. The model was based on the temperature-driven Hargreaves equation for the estimation of reference evapotranspiration (ETo). The analysis focused on the effects of (i) soil water storage representation, comparing a uniform 1 m soil depth baseline with spatially heterogeneous soil depths; (ii) land use representation, considering both static and time-varying land use across the simulation period; and (iii) evapotranspiration parameterization, comparing the constant Hargreaves coefficient with a regionally calibrated coefficient. The analysis was conducted for the Southern Apennines District over the period 2000–2023. Land use dynamics were represented using static and time-varying configurations derived from the CORINE Land Cover database, while soil physical properties were derived from European Soil Data Centre (ESDAC) datasets and used to estimate soil hydraulic parameters through pedotransfer functions. Model outputs were evaluated by comparing simulated monthly actual evapotranspiration (AET) against independent satellite-based products (GLASS, ETMonitor, and MOD16), as well as against estimates derived from the BIGBANG model.

Results indicated that soil depth heterogeneity was the dominant factor influencing model performance. Compared to uniform soil depth assumptions, heterogeneous configurations improved agreement with reference AET datasets, reducing MAE and RMSE by ~2 and ~3 mm month⁻¹, respectively, and yielding higher KGE values. Although district-scale runoff metrics exhibited limited sensitivity, monthly runoff (Q) varies by up to ~30% in response to soil depth, particularly in winter. Land use dynamics further affected both AET and Q, with monthly Q variations reaching ~45%, whereas evapotranspiration parameterization had a comparatively minor impact, with differences of approximately 5%. Overall, these findings highlighted the critical importance of explicitly representing spatial heterogeneity in soil water storage and land use dynamics for improving large-scale water budget simulations in Mediterranean environments.

How to cite: Aung, H. H., Sileo, B., Fiorentino, M., and Dal Sasso, S. F.: A high-resolution grid-based water budget model for Mediterranean river basin districts: sensitivity to soil heterogeneity and evapotranspiration parameterization, EGU General Assembly 2026, Vienna, Austria, 3–8 May 2026, EGU26-14872, https://doi.org/10.5194/egusphere-egu26-14872, 2026.

Plants are key regulators of global terrestrial water cycles, acting as the conduit for transporting soil moisture to the atmosphere via transpiration. Plants are also already being impacted by the changing environment, as demonstrated by the large forest mortality of central and southern Europe in the last decade. In addition to these negative effects, increasing CO2 concentrations are expected to make plants more efficient at taking up carbon per unit of water loss, a phenomenon currently accounted for in most earth system models. The complex potential positive and negative effects of a changing climate on plants, as well as the potential reverberations across the broader water cycle, is a key unknown when making climate projections into the future.

Despite how central plants are to the global terrestrial water cycle, current model estimates of global transpiration to evapotranspriation (T/ET) in the CMIP 6 (Coupled Model Intercomparison Project) models disagree, ranging from 20-60% for the historical period. The broad uncertainty in estimated global transpiration represents a major source of uncertainty, both in our current understanding of the control of plants on water cycles, as well as in how global water cycle feedbacks might play out in the next 100 years.

New data driven estimates of transpiration from FLUXCOM-X, which models ecosystem fluxes using remote sensing, in situ eddy covariance measurements and machine learning, representing a new opportunity for an independent diagnostic to evaluate global transpiration estimates, such as those from the CMIP 6 models. A key advantage to the new FLUXCOM-X transpiration estimates is full spatiotemporal coverage as 0.05° spatial and hourly temporal resolution over more than 20 years, allowing diagnostics to account for spatial regions and temporal periods with highest disagreement, such as green up, peak growing season, and during precipitation events. Going forward, utilizing the data driven products of transpiration and evapotranspiration as a new diagnostic of model functioning will help guide model development and lower climate projections into the future.

How to cite: Nelson, J.: Reconciling Global Transpiration Estimates of Process and Data Driven Models , EGU General Assembly 2026, Vienna, Austria, 3–8 May 2026, EGU26-15126, https://doi.org/10.5194/egusphere-egu26-15126, 2026.

This presentation details the development of an experimental protocol for benchmarking multiple existing snow water equivalent (SWE) datasets. Given the lack of standardized SWE product and model intercomparison, a systematic community evaluation protocol is needed to provide coherent comparisons of existing products. Utilizing SWE estimates from lidar-based ASO (Airborne Snow Observatory) as ‘ground-truth’ (uncertainties notwithstanding), we evaluate the performance of more than a dozen publicly available SWE estimation approaches in the US (including SNODAS, UA SWE, US National Water Model, UCLA SWE, SWEML, NLDAS2 (VIC, Noah, and Mosaic), ERA5-Land, CU SWE, and CONUS404). Over 400 scenes of spatially continuous ASO SWE at the catchment scale are used for benchmarking the aforementioned SWE estimation methods and establishing a protocol for evaluating future products. The approach involved processing SWE products into catchment spatial resolutions, based on a common hydrofabric, to enable standardized cross-product evaluation. Multiple performance metrics are evaluated to quantify performance related to the ASO observations, including the dependence of SWE performance against elevation, aspect and land cover factors. We also assess whether, given their differences in accuracy, different products lead to different predictability for seasonal, basin-scale runoff. The catchment SWE protocol contributes to the NOAA CIROH (Cooperative Institute for Research to Operations in Hydrology) Hydrologic Prediction Testbed. As the collection of standardized results from multiple products and development groups grows, it will enable the tracking the performance and advancement of SWE estimation products, enabling evidence-based review and adoption of new SWE estimation techniques into applications, including operational prediction.

How to cite: Wood, A. and Ritchie, E.: A testbed approach for benchmarking multiple gridded snow datasets and their relative value for seasonal runoff prediction, EGU General Assembly 2026, Vienna, Austria, 3–8 May 2026, EGU26-15896, https://doi.org/10.5194/egusphere-egu26-15896, 2026.

This work shows how the recently developed Mexico's High Resolution Climate Database (MexHiResClimDB) has been extended to include Reference Evapotranspiration obtained with the Hargreaves method. With this extended database and using as reference the 1961-1990 period, it has been found that aridity has increased in Mexico, which affects surface water storage and potential groundwater recharge. The impact of this increased aridity on water resources is shown for the Cutzamala System, which is comprised of seven reservoirs that provide 14 m3/s, representing nearly 30% of the water supplied to Mexico City and its Metropolitan Area. This work also shows that nation-wide studies on climate variability have to focus at the watershed level in order to quantify its impact on water resources.

How to cite: Carrera-Hernandez, J. J.: Nation-wide climate variability in Mexico and its effect on water resources, EGU General Assembly 2026, Vienna, Austria, 3–8 May 2026, EGU26-15931, https://doi.org/10.5194/egusphere-egu26-15931, 2026.

EGU26-19895 | ECS | PICO | HS2.5.2

ESA CCI SM v9: advancements in global satellite soil moisture records 
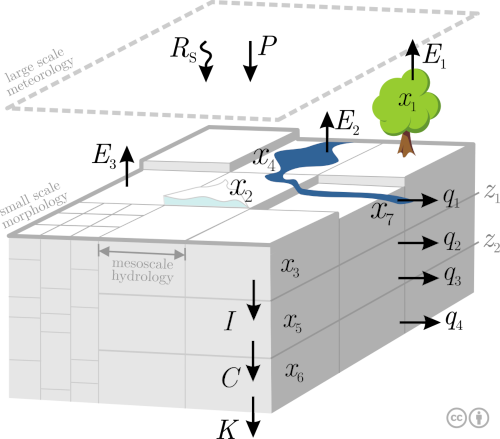
Colin Moldenhauer, Wolfgang Preimesberger, Johanna Lems, Dávid D.Kovács, Alexander Gruber, Maud Formanek, Richard de Jeu, Diane Duchemin, Nemesio J. Rodríguez-Fernández, Bethan L. Harris, and Wouter Dorigo

Soil moisture plays a pivotal role in the Earth system, exerting a profound impact on a wide range of environmental and climatic processes. Consequently, accurate monitoring of soil moisture is essential for climate research, environmental management, and the development of adaptation strategies under changing climate conditions. For these purposes, datasets developed within the ESA CCI Soil Moisture (SM) project provide homogenized long-term records of surface soil moisture. The newest suite of products, ESA CCI SM v9.2, consists of daily, global soil moisture estimates derived from a large set of historic and operational microwave sensors. Its data spans a period of over 45 years, produced both from passive and active observation systems. To address advancing user requirements, a set of science products complements the original SM Climate Data Records: A) gap-free surface soil moisture, filling data gaps due to missing satellite overpasses by means of a statistical method, B) satellite-only sensor harmonization, providing a record independent of land surface model data. In addition, v9 introduces three novel datasets: C) estimates of root-zone soil moisture, necessary to assess processes beyond the soil surface layer, D) increased spatial resolution of 0.1°, enabling research on mesoscale land-atmosphere interactions and E) soil freeze/thaw state, an important parameter for the interpretation and flagging of soil moisture retrievals.

How to cite: Moldenhauer, C., Preimesberger, W., Lems, J., D.Kovács, D., Gruber, A., Formanek, M., de Jeu, R., Duchemin, D., Rodríguez-Fernández, N. J., Harris, B. L., and Dorigo, W.: ESA CCI SM v9: advancements in global satellite soil moisture records, EGU General Assembly 2026, Vienna, Austria, 3–8 May 2026, EGU26-19895, https://doi.org/10.5194/egusphere-egu26-19895, 2026.

EGU26-20340 | ECS | PICO | HS2.5.2

The mesoscale Hydrologic Model mHM v6 – the next generation: Modular, Extensible, and Scalable Hydrological Modeling 

Sebastian Müller, Stephan Thober, Pallav Kumar Shrestha, Carlos Antonio Fernandez-Palomino, Afid Nur Kholis, Simon Lüdke, Matthias Kelbling, Rohini Kumar, Sabine Attinger, and Luis Samaniego


The mesoscale Hydrologic Model (mHM), first released in 2010, is today used both to advance process understanding and to provide operational services for the water sector and the wider public (e.g. the German drought monitor). mHM v5, released in 2014, established a highly modular hydrologic modeling framework. Here, we present mHM v6 – the next-generation mHM release, addressing key limitations of mHM v5 in three areas:

1. Modularity: While mHM v5 offered multiple implementations of individual processes, it was not possible to run selected components in isolation (e.g., soil-water dynamics, runoff generation, or routing). mHM v6 expands the stand-alone usage of core components, enabling workflows such as routing externally provided runoff fields (e.g., from observations, reanalyses, or other models) without requiring a full mHM hydrologic simulation. This lowers the barrier for targeted studies and supports multi-model intercomparisons.

2. Extensibility: mHM v5 provided Python bindings to access internal state variables and parameters, allowing users to manipulate these during runtime (e.g., for data assimilation, sensitivity analyses, and experimentation). mHM v6 strengthens coupling capabilities via coupling frameworks such as YAC and FINAM, complemented by Python bindings for flexible orchestration and prototyping. In addition, mHM v6 introduces a redesigned internal code structure based on object-oriented design, simplifying the addition of new process options (e.g., alternative vegetation representations) and new process components.

3. Scalability: mHM v6 introduces a revised routing framework based on a directed acyclic graph (DAG) representation of the river network with built-in OpenMP parallelization. This enables efficient simulations on increasingly large and high-resolution river networks, supporting applications from regional to continental and global scales.

Beyond these core developments, mHM v6 integrates and harmonizes several recent extensions into a unified modeling workflow. This includes floodplain simulation within the routing network, explicit representation of lakes and reservoirs, and subgrid catchment conservation (SCC) options to represent catchments smaller than the grid size while conserving points of interest (e.g., streamflow gauges and dams). On the land-surface side, mHM v6 incorporates a Richards-equation-based approach for soil infiltration, solved with an efficient numerical scheme (Ross’ fast method).

We demonstrate mHM v6 through (i) global river-network routing experiments based on the MERIT Hydro river network, quantifying the performance gains from the new parallel routing scheme, and (ii) a standalone routing setup driven by externally provided runoff to illustrate component-level workflows. We further outline how the same routing component can be embedded into coupled modeling chains via YAC/FINAM and Python-based orchestration. Overall, mHM v6 positions mHM as both a community hydrologic model and a reusable building block for modern, integrated, and scalable hydrologic workflows.

Website: https://mhm-ufz.org/

Papers describing mHM
  • Samaniego et al 2010: https://agupubs.onlinelibrary.wiley.com/doi/full/10.1029/2008WR007327
  • Kumar et al 2013: https://agupubs.onlinelibrary.wiley.com/doi/full/10.1029/2012WR012195

How to cite: Müller, S., Thober, S., Shrestha, P. K., Fernandez-Palomino, C. A., Nur Kholis, A., Lüdke, S., Kelbling, M., Kumar, R., Attinger, S., and Samaniego, L.: The mesoscale Hydrologic Model mHM v6 – the next generation: Modular, Extensible, and Scalable Hydrological Modeling, EGU General Assembly 2026, Vienna, Austria, 3–8 May 2026, EGU26-20340, https://doi.org/10.5194/egusphere-egu26-20340, 2026.

Individual components of the continental water cycle still show considerable variation inbetween available data products. At the same time, the research community is trying to identify processes and their changes in increasingly more detail across several domains of the hydrosphere.

Within the Collaborative Research Cluster (CRC) 1502 DETECT, we have developed the LAMBDA framework in order to assess and analyse available water flux products. Here, we evaluate essential climate variables such as precipitation (P), evaporation (E), terrestrial water storage (TWS) change (dS/dt), and river discharge (Q) by means of kernel-integrated monthly water mass fluxes in the terrestrial water budget equation over multiple time scales. We focus on the water balance equation in its form dS/dt+Q=P-E, which states that net flux P-E between atmosphere and surface must be balanced by the combination of TWS change and river discharge.

(1) In our central assessment 2003-01/2020-12 over the EURO-CORDEX region, we assessed budget flux components for 35 major river catchments, including a wide selection of observational and reanalysis products. In the master run (P: GPCC, E: GLEAMv4.2a, Q: GRDC, S: COST-G) we find that a total of 26 (74%) catchments show drying P-E behaviour, and 22 (63%) in terms of dS/dt+Q. Out of the 23 basins with a maximum P-E net flux of +25 mm/month, 91% show drying trends in P-E, and 87% show negative trends in the combination of TWS and river discharge; a finding that supports the "dry-gets-drier — wet-gets-wetter" hypothesis to some extent.  

(2) While dP/dt, across Europe, is heterogeneously distributed (-1.5±3.0 mm/month/10a), E more consistently increased by 1.2±1.4 mm/month/10a, which leads to an averaged combined P-E trend of -2.7±3.4 mm/month/10a.  On average, TWS losses increased (-0.4±1.0 mm/month/10a), and discharge declined by 0.6±2.3 mm/month/10a, i.e. combined -0.9±2.6 mm/month/10a. Which means that — in contrast to absolute fluxes — dS/dt+Q change appears, on average, ~equally caused by a decline in discharge and TWS; the trends, however, exhibit large uncertainties.

In total, a flux budget misclosure of -2.0±5.8 mm/month remains. Trend-wise and on average, these residuals become more negative (-1.8±2.7 mm/month per decade). The stated ±1σ ranges are a measure of variability across the assessed domains. 

(3) In terms of inter-component variation, we find that even at targets that are comparably well covered with P observations (e.g. Rhine), monthly precipitation values from a selection of sources vary by 10 mm (>10% of mean) on average. Multi-annual averages range from comparably ‘dry’ 70 mm/month (CRU) to as much 89 mm/month (ERA5, IMERG). At the same time, we assessed averaged evaporation to range from as low as 44 mm/month (GLEAM v4.2a) up to 58 mm/month (GLEAM v4.2b), with a mean of 51.3±7.6 mm/month (15%). Across Europe, we find that especially the observation-heavier E products drive winter-time STDs up to 50% of the monthly cross-product mean (10% during summer).

While this illustrates clearly how researchers risk achieving spurious budget closure through implicit or explicit “cherry‑picking” of terms-components, it appears that long-term trends across different data products are comparably stable for interpretation.

How to cite: Gutknecht, B. D. and Kusche, J.:  Assessment of continental water mass balance components 2003--2020 over EURO-CORDEX in the DETECT LAMBDA framework, EGU General Assembly 2026, Vienna, Austria, 3–8 May 2026, EGU26-21824, https://doi.org/10.5194/egusphere-egu26-21824, 2026.

A refined understanding of how hydrological processes act as key drivers of terrestrial carbon dynamics is essential for improving assessments of atmospheric CO2 fluxes and strengthening climate change mitigation strategies. This study characterizes the spatiotemporal dynamics of net primary productivity (NPP), a fundamental indicator of terrestrial CO2 sequestration capacity, across South Korea from 2004 to 2019 using the Carnegie–Ames–Stanford Approach (CASA) model, with particular emphasis on hydrological drivers. The CASA framework was implemented by integrating Moderate Resolution Imaging Spectroradiometer (MODIS) remote sensing products with meteorological variables, enabling consistent estimation of vegetation productivity across diverse land-cover types. Pronounced increases in NPP were observed in deciduous broadleaf forests and croplands, whereas urban areas exhibited declining trends, reflecting contrasting trajectories in ecosystem productivity linked to land use patterns.

To quantify the roles of individual hydrological drivers, we evaluated the seasonal contributions of precipitation, temperature, and groundwater storage (GWS). Precipitation and temperature inputs were derived from ground-based meteorological station observations and spatially interpolated using the Barnes objective analysis method to generate continuous spatiotemporal datasets. GWS was derived from satellite observations, combined with machine learning model to capture spatiotemporal variability in subsurface water availability. Elevated temperatures and increased GWS during spring and autumn—corresponding to the major growing season—served as strong positive drivers of vegetation productivity, while summer NPP was predominantly influenced by precipitation variability. Beyond the widely recognized roles of temperature and precipitation, the analysis underscores groundwater as a critical and previously underappreciated driver of spatiotemporal NPP variability.

By clarifying the contribution of groundwater to terrestrial CO2 uptake, the findings provide essential guidance for enhancing carbon-flux monitoring strategies and for managing ecosystems that rely substantially on subsurface water resources. More broadly, the results highlight the importance of incorporating groundwater dynamics and the full suite of hydrological drivers into assessments of carbon cycle processes and into comprehensive climate adaptation and mitigation frameworks.

(Acknowledgments) This work was supported by a National Research Foundation of Korea (NRF) grant funded by the Korean government (MSIT) (RS-2022-NR072257). This work was also supported by the Management Technology for Groundwater Dams in Water Supply Vulnerable Areas Program of the Korea Environmental Industry & Technology Institute (KEITI), funded by the Ministry of Environment (MOE) (RS-2025-01842973).

How to cite: Seo, J. Y. and Lee, S.-I.: Spatiotemporal variability analysis of remote sensing–derived net primary productivity and its hydrological drivers , EGU General Assembly 2026, Vienna, Austria, 3–8 May 2026, EGU26-2020, https://doi.org/10.5194/egusphere-egu26-2020, 2026.

Accurate soil moisture (SM) forecasting is essential for hydrological and agricultural applications, particularly in the face of non-stationary climate conditions. This study developed a two-tiered modeling framework that combined a rolling forecast mechanism with non-stationary vine copula-based quantile regression models to improve SM forecast accuracy. Non-stationarity in hydrometeorological variables was assessed using the Mann-Kendall trend test, revealing statistically significant trends in over 97% of Yunnan Province, China. Then, a non-stationary vine copula model was constructed by embedding time-varying covariates into both marginal distributions and inter-variable dependence structures, enabling the model to dynamically capture both marginal and structural non-stationarity. Three temporal forecasting strategies—prediction, forecasting, and rolling forecast—were implemented to evaluate model adaptability and robustness. Model performance was benchmarked against three AI-based models (eXtreme Gradient Boosting (XGB), Random Forest (RF), and Long Short-Term Memory (LSTM)) and traditional quantile regression approaches. A suite of evaluation metrics was employed, including deterministic scores (e.g., Kling-Gupta Efficiency, KGE), probabilistic accuracy (e.g., coverage ratio, CR), and extreme-value diagnostics (e.g., total quantile error, TQE). Results demonstrated that non-stationary vine copula models outperformed stationary ones, achieving KGE values exceeding 0.90 in most regions, with structural (49.63%) and marginal (42.17%) non-stationarities contributing most to accuracy improvement. Among the methods, the rolling forecast with a sliding time window of 50 years emerged as the most reliable method, effectively mitigating "fake precision" by addressing biases from future information. Furthermore, the proposed model successfully identified and characterized agricultural droughts, including their frequency, duration, and severity. Taking the 2009~2010 winter-spring drought in Yunnan Province as an example, the model accurately captured its spatiotemporal evolution, demonstrating its potential in agricultural risk management and drought mitigation. Overall, this study highlights the necessity of incorporating non-stationarity in SM forecasting and presents a robust, interpretable, and operationally feasible framework for supporting drought preparedness and agricultural decision-making under climate uncertainty.

How to cite: Yu, C. and Wang, D.: A dynamic soil moisture forecast framework considering non-stationary margins and structures, EGU General Assembly 2026, Vienna, Austria, 3–8 May 2026, EGU26-2418, https://doi.org/10.5194/egusphere-egu26-2418, 2026.

EGU26-2604 | ECS | Orals | HS2.5.3

A national-scale framework for mapping flood-regulating ecosystem services in cold and cryosphere-influenced regions 

Dylan Ruth, Camille Ouellet Dallaire, and Richard Schuster

Quantifying and visualizing how natural landscapes regulate floods remains a challenge for continental- and national-scale modelling. Few frameworks exist that incorporate both hydrological processes and ecosystem functions to identify where landscapes provide natural flood protection, and even fewer are applicable to regions where cryospheric processes strongly influence hydrology. Using Canada as the study area, this work presents an emerging national-scale modelling framework designed to quantify and map flood-regulating ecosystem services (FRES) using open-source global hydrological datasets.

The presented workflow utilizes sub-basin delineations from HydroBASINS and associated attribute layers from HydroATLAS to parameterize surface and subsurface hydrological characteristics. First, important indicators such as vegetation cover, land use, slope, and soil properties are synthesized into a comprehensive indicator to represent landscape capacity for runoff attenuation. Then, to improve applicability to cold environments, additional variables representing snow, glaciation, and permafrost are incorporated to reflect cryospheric controls on flood-regulating processes. 

To explicitly link ecosystem functions to hydrological processes, an eco-hydrological model adapted from global hydrography concepts is being implemented. This routing approach traces upstream contributions of flood-regulating capacity through connected river networks, allowing downstream flood risks to be evaluated against upstream landscape properties. The resulting maps can identify sub-basin hotspots where natural landscapes are expected to provide disproportionate flood protection benefits. These outputs also facilitate multi-scale analysis of FRES through the aggregation of FRES indicators from sub-basin to national extents by utilizing the hierarchically nested sub-basin structure of HydroBASINS.

The proposed approach aims to provide a scalable and tractable workflow that bridges hydrological reasoning with ecosystem service assessment at the national and continental scale. Ultimately, this framework will serve as a foundation for directly including natural flood protection into large-scale water management, conservation planning, and climate adaptation strategies across Canada and other cold-region contexts.  

How to cite: Ruth, D., Ouellet Dallaire, C., and Schuster, R.: A national-scale framework for mapping flood-regulating ecosystem services in cold and cryosphere-influenced regions, EGU General Assembly 2026, Vienna, Austria, 3–8 May 2026, EGU26-2604, https://doi.org/10.5194/egusphere-egu26-2604, 2026.

EGU26-2733 | Orals | HS2.5.3

Coupling Differentiable Modules of Reservoir Operation and Rainfall-Runoff Processes for Streamflow Simulation   

Tongtiegang Zhao, Zexin Chen, Bingyao Zhang, and Yu Li

Reservoir operation modules are essential for hydrological modeling in human-regulated catchments. This presentation is concentrated on testing the coupling of reservoir operation and rainfall-runoff processes under the framework of differentiable parameter learning (dPL). Specifically, the Community Water Model (CWatM)'s reservoir operation module is coupled with the Hydrologiska Byråns Vattenbalansavdelning (HBV) model; the differentiable fully coupled model (FCM) uses one long short-term memory (LSTM) network to calibrate all parameters using outflow; and the differentiable loosely coupled model (LCM) sets up two LSTM networks respectively for inflow and outflow. For comparison, the differentiable HBV is calibrated by outflow. The results of 77 reservoirs highlight that the dPL is effective in improving the efficiency of the conventional models. The median Kling-Gupta efficiency is improved from 0.53 for HBV to 0.59 for differentiable HBV, from 0.52 for FCM to 0.61 for differentiable FCM and from 0.54 for LCM to 0.60 for differentiable LCM. Zooming into the hydrological processes, it is found that the differentiable HBV fits reservoir outflow by underestimating recession coefficients and overestimating the baseflow index. The differentiable FCM fits the outflow but not the inflow since it tends to overestimate the maximum storage of the upper soil layer. The differentiable LCM fits both inflow and outflow with one LSTM estimating the parameters of HBV and the other LSTM estimating those of CWatM's reservoir operation module. For ungauged catchments, the differentiable LCM outperforms differentiable FCM in reproducing inflow and outflow. Overall, the dPL is effective in simulating the hydrological processes for human-regulated catchments.

How to cite: Zhao, T., Chen, Z., Zhang, B., and Li, Y.: Coupling Differentiable Modules of Reservoir Operation and Rainfall-Runoff Processes for Streamflow Simulation  , EGU General Assembly 2026, Vienna, Austria, 3–8 May 2026, EGU26-2733, https://doi.org/10.5194/egusphere-egu26-2733, 2026.

The Yellow River Basin (YRB) is one of the world’s most densely populated regions that has suffered greatly from water resources shortage, serious soil erosion and high sediment loads, over-cultivation and ecological degradation in the past centuries. Since 1960, especially in the last 20 years, the middle reaches of the Yellow River have experienced large-scale soil and water conservation projects, including terraces, check dams and ecological restoration. The soil-water conservation (SWC) could have multi-faceted impacts on water, sediment and carbon-related processes. It’s crucial to assess the potential impacts of these human-induced transitions to provide guidance for the sustainable development in the YRB, as well as in other river basins around the world.

We first assess the multi-faceted impacts of SWC measures using a distributed ecohydrological model, which accounts for both the effects of hillslope SWC (HSWC) (i.e., terracing, afforestation, etc.) and river-network SWC (i.e., check dams) explicitly. During the study period (1961-2024), the YRB was characterized by a mismatch between the source areas of runoff and sediment. While the magnitude of runoff showed a pattern of initial decrease followed by a subsequent increase, soil erosion intensity exhibited an overall significant reduction throughout the period. Quantitatively, the erosion intensity decreased by 48.9% during 1981-2000 and 71.8% during 2001-2024 relative to the 1961-1980 baseline. An exponentially decreasing relationship between soil erosion intensity and the area of hillslope conservation measures was also found. Check dams along the river channel further intercepted approximately 4.52 billion m3 of sediment. The combined effects of these intervention measures caused the magnitude of sediment reduction to significantly exceed that of runoff volume.

We also investigate the water-sediment-carbon changes in response to intensive ecological restoration in the middle Yellow River basin. According to the results, ecological restoration promoted synergies between carbon sequestration and sediment control and led to improved water use efficiency (WUE). The actual Leaf Area Index and Gross Primary Productivity (GPP) showed improvements in region-averaged values by +0.56 m2 m-2 yr-1 (+7.4 %) and + 52 gC m-2 yr-1 (+10.9 %) compared to those under natural conditions. Furthermore, WUE changes indicated higher GPP gain per unit evapotranspiration. Meanwhile, trade-offs were also found when taking account of the water yield reduction. During 1982–2019, ecological restoration significantly increased actual evapotranspiration (+8.3 mm yr-1; +2.2 %) and decreased runoff (-7.6 mm yr-1; -12.7 %). Two indicators evaluating the cost-effectiveness of ecological restoration, i.e., carbon sequestration and sediment settlement at the cost of per unit runoff decline, remained positive with the average values of 6.12 kgC and 0.22 ton sediment load at the cost of per m3 water yield during 2000–2019, respectively. Nevertheless, both indicators showed downward trends, indicating decreasing marginal benefits brought by the ecological restoration measures which could have approached the optimal scale in the middle YRB. These results provide a scientific basis and quantitative indicators for sustainable water-carbon-sediment management.

How to cite: Yang, D.: Water-sediment-carbon effects of ecological conservation in the Yellow River Basin, EGU General Assembly 2026, Vienna, Austria, 3–8 May 2026, EGU26-2915, https://doi.org/10.5194/egusphere-egu26-2915, 2026.

Terrestrial ecosystems play a foundational role in modulating the global hydrological cycle and sequestering atmospheric CO2. Their functional integrity, however, is increasingly challenged by shifting environmental constraints on soil moisture and energy availability. While recent decades have seen significant advances in Earth system modeling and remote sensing, the precise mechanisms by which climate change alters vegetation sensitivity to water stress—and subsequently drives shifts in hydrological regimes—remain a subject of ongoing investigation. This study investigates long-term spatial and temporal transitions between energy-limited and water-limited regimes at a global scale from 1950 to 2025. To address the inherent uncertainties in multi-source datasets, we employ a robust collocation analysis that integrates remote sensing products with high-resolution reanalysis data. By applying a joint-solution methodology alongside an array of sensitivity experiments, we seek to disentangle the respective influences of climatic forcing and vegetative feedbacks on observed hydrological shifts. Our preliminary findings suggest a discernible historical transition in eco-hydrological dynamics. There is evidence of a contraction in energy-limited regions, potentially linked to increasing surface net radiation. Notably, the data indicates that areas experiencing a simultaneous increase in radiative demand and a decline in root-zone soil moisture are most susceptible to transitioning toward water limitation. Furthermore, our initial analysis points toward a strengthening coupling between vegetation transpiration and root-zone soil moisture, which may act as a critical feedback mechanism. These emerging results underscore the potentially pivotal role of evolving vegetation sensitivity to water stress in reshaping global ecosystem-water dynamics. By refining our understanding of these energy-water regime shifts, this work aims to contribute to more accurate benchmarking of Earth system models and provide insights into the resilience of regional hydrological systems under a changing climate.

How to cite: li, C.: Drivers of Global Shifts in Ecosystem Energy and Water Limitation: The Role of Evolving Vegetation Sensitivity to Water Stress, EGU General Assembly 2026, Vienna, Austria, 3–8 May 2026, EGU26-3286, https://doi.org/10.5194/egusphere-egu26-3286, 2026.

EGU26-3900 | ECS | Orals | HS2.5.3

Quantifying Streamflow Alteration in a River Basin of South-Western India 

Shyam Sundar Bhardwaj and Madan Kumar Jha

Climate change and anthropogenic activities have significantly altered the natural flow regimes, leading to hydrological instability and exacerbating extreme events in different parts of the world. In this study, long-term changes in the hydrological regime of the Chaliyar River Basin were evaluated using daily streamflow data from 1986 to 2022. For this purpose, the Indicators of Hydrologic Alteration (IHA), quantile-based environmental flow metrics, and Flow Duration Curves (FDCs) were employed to quantify flow patterns in the river basin. The range of variability approach indicated that 42.4% of the hydrologic parameters fall into the high-alteration category. The mean river discharge increased by 105% to 438% from January to May during the study period, indicating a pronounced shift in flow during the dry and pre-monsoon seasons. The analysis of low-flow characteristics revealed the strongest response with a 440% increase in the 1-day minimum discharge and a 448% rise in the Baseflow Index, signifying a substantial baseflow contribution. On the other hand, the flow regime became more unstable, as evidenced by a 155% increase in the frequency of high-flow pulses and a 193% increase in the frequency of low-flow pulses. The quantile analysis underpins this transition, indicating a significant increase in the normal low-flow discharge (Q90–Q95), whereas the intensity of the most substantial floods (Q1–Q10) remained relatively stable. These findings provide a quantitative roadmap for evidence-based river management, which can enable policymakers to address the challenges of intensified flow variability in the basin under changing environmental conditions.

How to cite: Bhardwaj, S. S. and Jha, M. K.: Quantifying Streamflow Alteration in a River Basin of South-Western India, EGU General Assembly 2026, Vienna, Austria, 3–8 May 2026, EGU26-3900, https://doi.org/10.5194/egusphere-egu26-3900, 2026.

EGU26-3911 | ECS | Posters on site | HS2.5.3

Understanding the Hydrological Interconnections: A Network and Relationship Matrix Approach 

Ran Mo, Mohanna Zarei, and Georgia Destouni

Water within the terrestrial environment is fundamentally interconnected. A single unit of precipitation follows multiple pathways: infiltrating soils, being taken up by vegetation, evaporating, undergoing freeze-thaw cycles, percolating into groundwater, flowing as surface and subsurface runoff, and being withdrawn or artificially recharged by human activities. However, quantitative understanding of the magnitudes of these flux fractions, as well as their temporal, regional, and global-scale variability, remains limited.

To address this gap, we develop a standard relationship matrix framework to represent flux exchanges—such as rainfall, evapotranspiration, and runoff—within the terrestrial water cycle. This framework incorporates two derived matrices termed “contribution” and “delivery”, which together characterize transfer rates and efficiencies among key subsystems: the atmosphere, oceans, pedosphere, and anthroposphere. These matrices help identify principal “donor” and “receiver” compartments within the terrestrial water system, revealing the dominate pathway of both blue and green water. Furthermore, we re-examine the terrestrial water cycle from a network-based perspective. By constructing water-cycle networks at global and regional scales—treating subsystems as nodes and fluxes as links—we apply a suite of network analysis methods to quantify key structural features. Metrics such as node strength, closeness, betweenness, and clustering are used to identify critical nodes, pivotal flux pathways, and structurally dominant subnetworks, thereby revealing the central subsystems and major flux routes in the water cycle.

Through these approaches, we systematically identify primary water flux pathways across regions with differing climate and land-use types, analyze their temporal dynamics, and thereby elucidate the principal factors shaping regional and global terrestrial water cycle patterns. Notably, the partitioning of surface streamflow to groundwater differs across regions, contributing to distinct terrestrial water network configurations. The influence of groundwater dynamics warrants further consideration in future studies.

How to cite: Mo, R., Zarei, M., and Destouni, G.: Understanding the Hydrological Interconnections: A Network and Relationship Matrix Approach, EGU General Assembly 2026, Vienna, Austria, 3–8 May 2026, EGU26-3911, https://doi.org/10.5194/egusphere-egu26-3911, 2026.

Northeast China is an important industrial base and grain production region. Understanding terrestrial water storage (TWS) variations in Northeast China is crucial for the sustainable development of water resources and food security. TWS retrievals from the Gravity Recovery and Experiment (GRACE) and GRACE Follow-On (GRACE-FO) missions provide invaluable information to monitor TWS variations in the study domain. However, GRACE TWS retrievals have a coarse resolution in both space and time, which limits their application at finer scales. The study investigated the capability of ground-based Global Navigation Satellite System (GNSS) vertical displacement measurements to represent TWS variations in Northeast China with a finer spatial resolution. Afterward, TWS retrievals from GRACE and vertical displacements from GNSS will be assimilated into a land surface model to improve the hydrological process modeling in Northeast China. Preliminary results showed that after removing the non-hydrologic loading effects (e.g., non-tidal ocean loading, glacier isostatic adjustment, and thermal expansion) from GNSS data, the processed GNSS vertical displacement can reflect the seasonal and inter-annual variation of TWS in the study domain. However, the agreements of vertical displacements between GNSS and GRACE are inferior to findings in other regions, which may be explained by the weaker TWS variability, complex freeze-thaw process of ground, and extensive anthropogenic in this region. GRACE data assimilation (GRACE DA) in northeast China showed improved estimates of TWS and its constituent components, particularly across mountain regions. However, the degraded snow estimation from GRACE DA was also revealed. It is anticipated that the dual-assimilation of GRACE and GNSS data can take advantage of both data sets and benefit the estimates of snow, soil moisture, and groundwater in Northeast China.

How to cite: Yin, G., Hu, W., and Zhang, Z.: Toward Dual-Assimilation of Terrestrial Water Storage for Improving Land Hydrological Modeling in Northeast China, EGU General Assembly 2026, Vienna, Austria, 3–8 May 2026, EGU26-4151, https://doi.org/10.5194/egusphere-egu26-4151, 2026.

EGU26-4378 | Posters on site | HS2.5.3

Refining global water cycle components under a changing climate 

Yongqiang Zhang, Günter Blöschl, Haoshan Wei, Dongdong Kong, Ning Ma, Thorsten Wagener, Jing Tian, Jun Xia, Congcong Li, Longhao Wang, Francis H.S. Chiew, L. Ruby Leung, Xingcai Liu, Hongxing Zheng, Xuanze Zhang, and Changming Liu

Accurate quantification of global water-cycle components remains a major challenge in Earth system science. In this study, we refine historical and future estimates of global river flow by applying an emergent constraint (EC) approach, which integrates outputs from 26 Earth System Models (ESMs) with observed streamflow from 50 large river basins (covering 26.9% of global land area). For the historical period (1980–2014), we estimate global river flow at  39.1±5.4×10³ km3 yr-1 and a river flow-to-precipitation ratio of 0.35±0.03 , both lower than previous assessments. Land evapotranspiration is estimated at 73.4±6.2×10³ km3 yr-1. Under future climate change, the EC-constrained projection indicates a global river flow increase of ,7.8±5.5 mm yr-1 K-1, which is 9.3% lower than the ESM ensemble mean and reduces inter-model uncertainty by 66%. Our results highlight a systematic overestimation of river flow increases in current ESMs, underscoring the importance of incorporating observational constraints and human impacts to improve the reliability of hydrological projections. This study provides a benchmark for global water-cycle partitioning and supports more accurate water resource planning under climate change.

This work is supported by the National Natural Science Foundation of China (Grant No. 42330506 and 42361144709), the Talent Program of the Ministry of Science and Technology of China, and the PIFI outstanding international team project by the Chinese Academy of Sciences.

How to cite: Zhang, Y., Blöschl, G., Wei, H., Kong, D., Ma, N., Wagener, T., Tian, J., Xia, J., Li, C., Wang, L., Chiew, F. H. S., Leung, L. R., Liu, X., Zheng, H., Zhang, X., and Liu, C.: Refining global water cycle components under a changing climate, EGU General Assembly 2026, Vienna, Austria, 3–8 May 2026, EGU26-4378, https://doi.org/10.5194/egusphere-egu26-4378, 2026.

Study Region: The Hailar River Basin in northeastern China, the Xijiang River Basin in southern China, and the Dongjiang River Basin in southeastern China.
Study Focus: Changes in runoff timing under concurrent climate change and large-scale afforestation are still poorly understood in typical catchments. This study analyses four decades of daily streamflow together with reanalysis climate data and satellite-derived forest cover in the three basins, all affected by major afforestation projects. Center timing, flood timing and spring flood timing indices are derived using circular statistics, and generalized additive models are applied to quantify nonlinear relationships between timing indices and hydroclimatic and vegetation variables and to separate the relative contributions of climate variability and forest expansion.
New Hydrological Insights for the Region: Runoff time has shifted significantly under the combined influence of climate change and forest expansion, with changes in flood timing being more pronounced than shifts in mean runoff timing. Afforestation delays flood timing much more strongly in the  semi-arid basin than in the humid, whereas in humid regions earlier and more concentrated precipitation can still advance floods. Changes in precipitation regime and antecedent soil moisture emerge as primary controls on center timing and spring flood timing. These findings highlight that afforestation policies must be tailored to local hydroclimatic context, while implementing it more cautiously in water-scarce basins to balance flood mitigation against water availability.

How to cite: Zhou, X.: Contrasting runoff response times regulated by vegetation and climate changes in typical dry and wet basins, EGU General Assembly 2026, Vienna, Austria, 3–8 May 2026, EGU26-4486, https://doi.org/10.5194/egusphere-egu26-4486, 2026.

EGU26-4688 | Orals | HS2.5.3

Declining runoff sensitivity to precipitation following permafrost degradation: Insights from event-scale runoff response in the Yellow River source region 

Zhuoyi Tu, Taihua Wang, Juntai Han, Hansjörg Seybold, Shaozhen Liu, Cansu Culha, Yuting Yang, and James Kirchner

Frozen ground, including permafrost and seasonally frozen ground (SFG), is a critical element of the cryosphere that strongly regulates hydrological processes in cold regions. It has been debated whether frozen ground degradation will make landscapes more, or less, sensitive to precipitation inputs; either outcome has profound implications for water resources and climate resilience. Using a data-driven approach based solely on observations, we quantify four decades of changes in event-scale runoff responses to daily precipitation in the source region of the Yellow River on the northeastern Tibetan Plateau. We apply Ensemble Rainfall–Runoff Analysis (ERRA), which infers hydrologic impulse responses directly from precipitation–runoff data without relying on model assumptions. This enables the assessment of nonlinear, nonstationary, and spatially heterogeneous hydrologic behavior across different frozen ground types and precipitation intensities. Results show that, relative to 1979–1998, the permafrost zone during 1999–2018 experienced a 47% reduction in peak runoff response per unit precipitation and a 32% decrease in the 25-day runoff coefficient, while the SFG region showed no substantial changes. The weakened runoff response in the permafrost zone, particularly under high-intensity precipitation (>10 mm d⁻¹), likely reflects enhanced infiltration and subsurface storage associated with thaw-induced deepening of the active layer. These findings highlight the power of data-driven approaches in detecting hydrological regime shifts and provide critical insights for drought mitigation and flood risk assessment in permafrost-affected regions.

How to cite: Tu, Z., Wang, T., Han, J., Seybold, H., Liu, S., Culha, C., Yang, Y., and Kirchner, J.: Declining runoff sensitivity to precipitation following permafrost degradation: Insights from event-scale runoff response in the Yellow River source region, EGU General Assembly 2026, Vienna, Austria, 3–8 May 2026, EGU26-4688, https://doi.org/10.5194/egusphere-egu26-4688, 2026.

EGU26-5043 | Orals | HS2.5.3

How the maximum power limit constrains precipitation dynamics and their responses to global climate change 

Axel Kleidon, Sarosh Alam Ghausi, and Tejasvi Ashish Chauhan

Precipitation is the consequence of condensation within the atmosphere, which is intimately connected to the release of latent heat within the air.  Latent heating creates buoyancy, that is, it accelerates air, while precipitation removes moisture from the atmosphere, that is, it dehumidifies air.  Both of these basic aspects of precipitation involve physical work.  Here, we use a thermodynamic systems approach to constrain this work and thereby precipitation and its response to global climate change.  The central starting point is to view the release of latent heat as the fuel to drive a moist heat engine that generates the work to accelerate and dehumidify air.  We then maximise the fraction of that work that goes into the generation of motion, consistent with previous, successful applications of the maximum power limit to the surface energy balance and poleward heat transport.  This yields another constraint on the dynamics, which then provides temporal and spatial scales associated with precipitation, such as convective rainfall events and the Hadley circulation.  We then show that this relatively simple, yet physical formulation can directly be used to understand precipitation changes found in observations and models, such as the intensification and shortening of convective rainfall events, decreases in cloud cover, deviations from Clausius-Clapeyron scaling in the scaling of extreme rainfall events, as well as the “wet-gets-wetter” hypothesis.  These phenomena are directly consequences of the dynamics driven by condensational heating, and these become more powerful due to the simple fact that warmer air can hold more moisture, but also that moisture serves as the fuel for these dynamics.  In addition to providing a simple, physical picture of these hydrological responses within the atmosphere, the approach also suggests potential shortcomings in climate models with respect to resolving these dynamics.

How to cite: Kleidon, A., Ghausi, S. A., and Chauhan, T. A.: How the maximum power limit constrains precipitation dynamics and their responses to global climate change, EGU General Assembly 2026, Vienna, Austria, 3–8 May 2026, EGU26-5043, https://doi.org/10.5194/egusphere-egu26-5043, 2026.

Hydrological systems are undergoing significant changes due to the combined effects of climate change, land surface alterations, and increasing human pressures. As a result of these influences, streamflow regimes show variations across temporal and spatial scales. Understanding the spatial and temporal variability of streamflow regimes and how they are affected by climate, anthropogenic factors and catchment characteristics are crucial for improving water resource management and for addressing challenges in ungauged basins.

This study presents a catchment classification framework based on the analysis of streamflow regime variability across Türkiye and applies a multi-method framework using observed discharge records obtained from 214 gauging stations. Streamflow regimes were identified using two different approaches and for this purpose the Agglomerative Hierarchical Clustering algorithm was utilized. The first approach is Functional Data Clustering with B-spline representations of monthly streamflow records. This approach enables the identification of streamflow regimes through hydrograph shape. The second approach utilizes Hydrologic Index-Based Clustering and uses a set of monthly flow indices. The resulting regime classifications obtained from both methodologies were compared to evaluate consistency, reliability, and hydrological interpretability of detected streamflow regimes across Türkiye.

To understand spatial and temporal variability in streamflow regimes, regime classification framework was first applied to the full observation period (1997–2015) to characterize long-term regime behavior and then subsequently to overlapping five-year sub-periods derived using a moving-window approach. This approach enabled the detection of potential streamflow regime shifts over time across Türkiye. The identified regime types were then correlated with an integrated dataset of climate indices, catchment attributes, land cover, soil type, and geology to investigate the controls on streamflow regime variability. Finally, a Random Forest Classification framework was used to assess the relative importance of multiple drivers and to enable the prediction of streamflow regimes in ungauged basins.

The results reveal that streamflow regimes have spatially distinct patterns and temporal variability across Türkiye. The findings also emphasize the critical role of elevation and precipitation seasonality in this variability. The consistency between the two classification approaches further supports the reliability of the identified regimes. Overall, the integrated framework combining streamflow regime classification, detection of regime shifts, and data-driven approach provides a basis for understanding streamflow variability and its dominant controls across hydrologically diverse and ungauged basins.

How to cite: Varli, D. and Yilmaz, K. K.: From Streamflow Regime Identification to Regime Prediction in Ungauged Basins: Catchment Classification Across Türkiye, EGU General Assembly 2026, Vienna, Austria, 3–8 May 2026, EGU26-5921, https://doi.org/10.5194/egusphere-egu26-5921, 2026.

Large-scale ecological restoration is a critical strategy for combating land degradation, yet its hydrological consequences, particularly regarding evapotranspiration (ET) partitioning, remain uncertain due to complex spatial heterogeneity and non-linear vegetation-water feedbacks. To address this, we developed a novel "zonal and screened" attribution framework that integrates the Two-Source Energy Balance (TSEB) model with Bayesian Ridge Regression to disentangle the driving mechanisms of ET and its components (transpiration, Ec; soil evaporation, Es) on the Loess Plateau (2000–2020). Methodologically, this zoned framework significantly outperformed traditional global modeling, reducing the prediction error for Ec by a median of 24.3% in heterogeneous transition zones. Results indicate a fundamental shift in the regional water cycle: ET increased by 9.31 mm/yr, primarily driven by a surge in Ec (10.24 mm/yr). Crucially, the driving mechanisms exhibited distinct spatiotemporal divergence: while vegetation restoration dominated Ec in the hilly-gully regions (Zones A and B), climatic factors controlled the arid sandy areas (Zone C). Furthermore, we identified two universal non-linear regulation mechanisms: a "V-shaped" response for Es (shading vs. interception) and an "Inverted U-shaped" response for Ec (saturation effect). Specifically, the optimal Leaf Area Index (LAI) threshold for transpiration in Zone A shifted from 0.47 (2000–2010) to 0.42 (2011–2020), signaling intensified water stress. These findings challenge the "one-size-fits-all" greening policy and advocate for a paradigm shift towards "green-water synergy" management. We propose actionable strategies, including thinning dense plantations to maintain LAI near optimal thresholds and prioritizing water-saving agriculture in arid zones, to ensure the sustainability of ecological engineering in water-limited regions globally.

How to cite: Xu, Y. and Zuo, D.: Transition to transpiration-dominated evapotranspiration on the Loess Plateau: spatially divergent driving mechanism and threshold effect after two decades of reforestation, EGU General Assembly 2026, Vienna, Austria, 3–8 May 2026, EGU26-6396, https://doi.org/10.5194/egusphere-egu26-6396, 2026.

EGU26-6594 | ECS | Orals | HS2.5.3

More Frequent Extreme Floods Revealed by Observation-Constrained Projections 

shugao xu, gang zhao, yu zhang, qianyang wang, haoyu ji, jingshan yu, and bruno merz

Current cascade-type models are the dominant approach for projecting future extreme floods, but they suffer from major limitations, including substantial bias, large uncertainty and coarse spatial resolution. To address these issues, we developed an observation-constrained framework that integrates flood estimates, based on historical data and regional flood frequency analysis, with changes in design floods from cascade-type model projections, enabling 1-km resolution projections across 28.2 million river pixels worldwide. Our analysis reveals that cascade-type models overestimate the historical 100-year flood by about 160% globally, while forcing-based corrections still exhibit considerable bias. Further, our observation-constrained approach reduces multi-model uncertainty by a median of 22.8% globally compared to cascade-type modeling. Under a high-emissions scenario, 83% of the global land mass shows increasing flood frequency. Globally, the historical 100-year flood is projected to have a median return period of about 36 years – more frequent than suggested by cascade-type model projections. Our results highlight the acceleration of flood risks, which may leave communities unprepared for intensifying climate impacts.

How to cite: xu, S., zhao, G., zhang, Y., wang, Q., ji, H., yu, J., and merz, B.: More Frequent Extreme Floods Revealed by Observation-Constrained Projections, EGU General Assembly 2026, Vienna, Austria, 3–8 May 2026, EGU26-6594, https://doi.org/10.5194/egusphere-egu26-6594, 2026.

EGU26-6685 | Orals | HS2.5.3

Model reveals human water use impact on shifts of terrestrial water storage patterns 

Maike Schumacher, Çağatay Çakan, Stine Gjørup Klemmensen, Emmanuel Nyenah, Petra Döll, and Ehsan Forootan

World-wide demands of drinking water, irrigation, livestock, domestic use, manufacturing and thermal power are satisfied by surface water and/or groundwater extraction. Although necessary for the well-being of humans and animals, as well as plant and energy production, climate change impacts on and overconsumption of our water resources lead to severe water scarcity that approximately half of the world’s population are regularly facing. Shifts in water storage patterns and water-related hazards can be observed from space by dedicated satellite missions or simulated by global hydrological models. However, quantifying the relative contribution of fundamental drivers of terrestrial water storage (TWS) changes is still a major scientific challenge, e.g., due to a lack of data or processes in models and the limited vertical and spatial resolution of satellite data sets.

Thus, in this study, we attempt to reveal the human water use impact on shifts of TWS patterns under changing climate. We compare two decades (2003-2023) of TWS changes simulated by the WaterGAP Global Hydrology Model (WGHM) while (a) disregarding and (b) considering surface water and groundwater extraction to isolate the human impact on the terrestrial water cycle. The identified patterns are compared to observations from the satellite gravity missions GRACE and GRACE-FO to better understand the individual contributions on current satellite-based continental wetting and drying trends. In addition, the relative contribution of individual water storage components to TWS is calculated, where groundwater overconsumption shows significant impacts on shifting TWS patterns. We present the largest river basins (>200.000 km2) world-wide and a country-based assessment to identify regions under acute or chronic water stress.

How to cite: Schumacher, M., Çakan, Ç., Klemmensen, S. G., Nyenah, E., Döll, P., and Forootan, E.: Model reveals human water use impact on shifts of terrestrial water storage patterns, EGU General Assembly 2026, Vienna, Austria, 3–8 May 2026, EGU26-6685, https://doi.org/10.5194/egusphere-egu26-6685, 2026.

While critical to humans and ecosystems, groundwater accessibility is threatened by climate change, which alters groundwater recharge and can lead to water table decline. However, quantifying groundwater response to climatic changes remains highly uncertain. Modeling efforts are constrained by the oversimplification of processes, a lack of data for calibration and validation, and an uncertainty regarding processes and state variables. Improving our understanding of hydrological systems requires better quantification of the relationship between individual system inputs (climate signals) and outputs (groundwater table). However, this task is challenging, as groundwater is an integral part of the Earth system, where complex feedback mechanisms and multiple interacting factors and drivers (confounders) complicate the investigation of single processes. Topography, for example, is a core driver of groundwater flow and determines water table depth as well as where recharge and discharge areas develop. Geological properties like permeability and porosity strongly influence groundwater flow, response time, and storage capacity. Infiltration from surface waters is often the main source of groundwater recharge in drylands and may blur the direct influence of precipitation. Consequently, the nature and strength of the climate-groundwater connection are likely to vary across different environmental contexts. In particular, the subsurface's damping effect complicates a climate-groundwater analysis. Damping is described as the delay and smoothing of an output signal (i.e., water table) in a system compared to the input signal (i.e., precipitation). This effect is not only dependent on static subsurface characteristics but also nonstationary and nonlinear. Finding a relationship between precipitation and groundwater time series with classical correlation analysis remains, therefore, often unsuccessful. Here, we propose analyzing in situ groundwater time series and other groundwater-associated variables using statistical methods that account for confounders and damping. We compare the performance and feasibility of methods like (1) partial cross-correlation, (2) deconvolution, (3) clustering of pulse-response functions (a byproduct from deconvolution), (4) clustering functional relationships between climate variables and groundwater, and (5) causal interference methods (i.e., PCMCI–CMI). We give an overview of the advantages and disadvantages of every tested method. We aim to provide clarity in a landscape of numerous available methods and to offer practical guidance for holistic analyses that encounter similar challenges.

How to cite: Bäthge, A. and Reinecke, R.: Quantifying the impact of climate drivers on groundwater dynamics in diverse environmental settings and heterogeneous time series data – a method comparison, EGU General Assembly 2026, Vienna, Austria, 3–8 May 2026, EGU26-7389, https://doi.org/10.5194/egusphere-egu26-7389, 2026.

EGU26-8321 | ECS | Orals | HS2.5.3

Changing moisture transport as a driver of continental drying 

Victoria M. H. Deman, Damián Insua-Costa, and Diego G. Miralles

Land available water has declined across many regions over recent decades, reflecting widespread aridification and increasing pressure on terrestrial systems. These changes are commonly attributed to shifts in precipitation, enhanced evaporative demand, and increasing soil moisture limitations under warming. However, the extent to which changes in large-scale atmospheric moisture transport contribute to declining continental water availability remains poorly understood. 

To address this gap, we develop a four-decade (1979–2024) global dataset of atmospheric trajectories based on the Lagrangian transport model FLEXPART driven by ERA5 data, and evaluate the atmospheric moisture transport using a novel attribution framework. This framework allows us to link changes in the continental water balance (P–E) to shifts in moisture source–sink relationships, including continental evaporation recycling, defined as the fraction of land evaporation that returns as precipitation over land.  

Our results show that the declining continental P–E is associated with a relative decrease of evaporation recycling and a relative increase in the export of land-evaporated moisture towards the oceans.  These changes cannot be directly explained by changes in terrestrial evaporation. Instead, they respond to changes in large-scale circulation, together with reduced precipitation efficiency and longer atmospheric residence times. 

These results demonstrate that thermodynamic and dynamical changes in atmospheric moisture transport provide a missing link between observed P–E declines and continental aridification, with important implications for future land water availability. 

How to cite: Deman, V. M. H., Insua-Costa, D., and G. Miralles, D.: Changing moisture transport as a driver of continental drying, EGU General Assembly 2026, Vienna, Austria, 3–8 May 2026, EGU26-8321, https://doi.org/10.5194/egusphere-egu26-8321, 2026.

EGU26-8584 | ECS | Posters on site | HS2.5.3

Globally observed changes in the timing of water availability attributed to climate change 

Yijia Ren, Qiuhong Tang, and Gang Zhao

Streamflow, a key measure of water availability, follows a prominent seasonal cycle characterized by its amplitude and phase representing the range between high- and low-flow and their timing. This natural rhythm has profound implications for both ecosystems and human societies. However, evidence for whether anthropogenic warming has altered the timing of water availability remains limited to specific regions. Here, we synthesize a global large-sample hydrology dataset and use the centroid timing of mass of streamflow as a robust metric to quantify changes in the phase of seasonal cycle of streamflow. We find that approximately 20% of gauging stations show statistically significant timing shifts. By integrating multiple gridded runoff products derived from observation-based reconstruction, reanalysis and land surface models, we further identify a globally coherent yet contrasting change pattern. Importantly, this pattern is reproduced only by climate model simulations that include anthropogenic climate forcing, providing evidence for a detectable fingerprint on the timing of global water availability.

How to cite: Ren, Y., Tang, Q., and Zhao, G.: Globally observed changes in the timing of water availability attributed to climate change, EGU General Assembly 2026, Vienna, Austria, 3–8 May 2026, EGU26-8584, https://doi.org/10.5194/egusphere-egu26-8584, 2026.

Water resource optimization allocation is essential for maintaining ecological balance, promoting economic development, and ensuring social stability within river basins. However, many existing studies treated ecological water requirements as static baselines in allocation models, failing to address the dynamic utilization of water resources efficiently under varying hydrological conditions. In the Tao’er River Basin, a typical semiarid river basin, the combined effects of climate change and human activities have led to a severe imbalance between water supply and demand, particularly in regard to the competition between ecological water replenishment for the Xianghai Wetland, agricultural irrigation, and social water use. There is an urgent need for optimized water resource allocation to ensure the coordinated and sustainable development of these sectors. In this study, we developed the WEP-L model, a coupled natural–societal system, using various ecohydrological monitoring data to analyze the water supply‒demand balance under different hydrological conditions. We proposed an allocation plan that considers ecological marginal benefits, agricultural needs, and water use guarantees: 1.04 × 10⁸ m3 for ecological supplementation and 5.16 × 10⁸ m3 for agricultural water in the flat year, adjusted to 0.94 × 10⁸ m3 and 3.60 × 10⁸ m3 in the dry year, respectively. Furthermore, by incorporating reservoir water supply rules into the WEP-L model, we simulated the feasibility of intra-annual water allocation. The proposed allocation scheme concentrates ecological water in spring during flat years and distributes it at a ratio of 80% in spring and 20% in autumn during dry years. This study emphasizes the dynamic adjustment of ecological water resources on the basis of environmental conditions and societal needs, aiming to maximize ecological and social benefits. It provides scientific support for optimizing ecological water allocation and offers practical guidance for wetland conservation, agricultural water management, and water resource policy-making.

How to cite: Yan, Y.: Collaborative allocation of water resources considering ecological marginal benefits in a semiarid and cold region, EGU General Assembly 2026, Vienna, Austria, 3–8 May 2026, EGU26-9107, https://doi.org/10.5194/egusphere-egu26-9107, 2026.

EGU26-9130 | ECS | Posters on site | HS2.5.3

Global Assessment of Reservoir Impacts on Near-Surface Temperature 

Yafei Wang, Pan Liu, Huan Xu, and Weibo Liu

Large reservoirs have expanded rapidly worldwide over recent decades, substantially altering surface water distribution and land–atmosphere interactions. While reservoir-induced temperature effects have been documented at local and regional scales, their global characteristics and controlling factors remain poorly constrained. Using a dataset of 348 reservoirs and spatially consistent reanalysis data constrained by in situ observations (2001-2020), with elevation effects explicitly corrected, we quantified near-surface air temperature differences between reservoir-adjacent areas and surrounding reference regions. About 67% of reservoirs are associated with local cooling, particularly in arid and continental regions. Reservoirs reduce daytime extreme temperature by 0.14 °C on average and increase nighttime extreme temperature by 0.04 °C, showing a general pattern of daytime cooling and nighttime warming and narrowing the diurnal temperature range. Notably, the mitigating effect on extreme high temperatures has strengthened significantly over the 20-year period. Attribution analysis using mixed-effects modeling indicates that reservoir-induced thermal responses are primarily regulated by water body characteristics (area, capacity, regulation, and shape) and modulated by regional climate. These findings provide an observation-constrained global characterization of reservoir-induced temperature effects and highlight the role of large reservoirs in modifying land-atmosphere thermal interactions across diverse climatic settings.

How to cite: Wang, Y., Liu, P., Xu, H., and Liu, W.: Global Assessment of Reservoir Impacts on Near-Surface Temperature, EGU General Assembly 2026, Vienna, Austria, 3–8 May 2026, EGU26-9130, https://doi.org/10.5194/egusphere-egu26-9130, 2026.

Reliable long-term estimates of terrestrial evapotranspiration (ET) and gross primary production (GPP) are fundamental for understanding ecohydrological responses to climate change, yet remain challenged by satellite sensor transitions and forcing inconsistencies. Here, we build upon the diagnostic Penman–Monteith–Leuning (PML) model to introduce PML-V2.2, an extended 45-year ET and GPP dataset (1980–2024). By bridging multiple satellite epochs, PML-V2.2 provides a globally consistent record that supports both high-resolution near-present monitoring and robust long-term ecohydrological attribution.

Driven by bias-corrected MSWEP precipitation and MSWX meteorological forcing, PML-V2.2 leverages a multi-sensor simulation and consolidation framework to provide an extended data record. The dataset comprises three complementary products: (1) PML-V2.2a, an 8-day 500-m MODIS-based product (2000–2024) optimized for near-present monitoring; (2) PML-V2.2b, a half-month 0.1° AVHRR-based record (1980–2020) for long-term climate attribution; and (3) PML-V2.2c, a consolidated half-month 0.1° product (1980–2024) ensuring 45-year temporal continuity. The model was calibrated using 208 eddy-covariance flux sites with a refined parameterization that explicitly distinguishes irrigated from rainfed croplands, reducing agricultural biases in ET and GPP by ~7.5% and ~15%, respectively. Cross-validation against flux observations demonstrates robust performance across various plant functional types (with most NSE values > 0.60 and absolute bias < 5%), while water-balance validation across 152 large river basins yields excellent agreement (NSE = 0.89–0.91).

Globally, mean annual ET and GPP over 1980–2024 are estimated at 65.6 103 km3 yr−1 and 147.0 PgC yr−1, respectively. Both exhibit significant (p < 0.05) increasing trends, with ET rising by 0.015 103 km3 yr2 and GPP by 0.338 PgC yr2, indicating enhanced ecosystem productivity and water-use efficiency, partially moderated by CO2-induced physiological water savings. By providing an internally consistent, observation-constrained long-term record, PML-V2.2 offers a robust foundation for global ecohydrological studies, including drought impacts, carbon–water coupling, and model benchmarking under a changing climate.

How to cite: Xu, Z. and Zhang, Y.: PML-V2.2: Extended global terrestrial evapotranspiration and gross primary production dataset from 1980 to near present, EGU General Assembly 2026, Vienna, Austria, 3–8 May 2026, EGU26-9536, https://doi.org/10.5194/egusphere-egu26-9536, 2026.

EGU26-9707 | ECS | Posters on site | HS2.5.3

Land use change-driven streamflow fluctuations and implications for soil erosion modeling in Southern Brazil 

Aydogan Avcioglu, Rosalie Vandromme, Thomas Grangeon, Jean Paolo Gomes Minella, Olivier Evrard, Marcos Tassano, Néverton Scariot, Elzon Rippel, Cláudia Alessandra Peixoto de Barros, and Olivier Cerdan

The expansion of cropland has been demonstrated to be a significant disturbance to the environment, capable of altering hydrological processes, often resulting in modified streamflow characteristics and sediment fluxes. South America, especially Brazil, has undergone a significant - nearly double - increase in cropland since 2000, alongside temporally fluctuating land use and land cover (LULC) changes. However, the hydrological consequences of these changes continue to be a subject of debate in this region.

Here, we investigate the reciprocal effects of climate and LULC alterations on streamflow by conducting trend analysis and analyzing long-term time series data of streamflow and precipitation (i.e., 38 years of data provided by the National Water Agency (ANA) of Brazil) over 78 catchments. Additionally, we use the WaterSed model to simulate runoff and soil erosion in response to specific sequences of rainfall events occurring in the selected catchments.

A considerable and statistically significant increase has been observed in soybean croplands following a shift from other temporary crops (such as maize, wheat, oats, etc.), which was also associated with a statistically significant reduction of 34% in the catchment’s runoff coefficient. In contrast, we found that the annual trends related to rainfall and streamflow were statistically insignificant. A 27 % increase in water demand is also interpreted as an important proxy that is linked to the expansion of soybean croplands, supporting a decrease in the runoff coefficient. Consequently, we may primarily attribute these alterations to LULC changes. These outcomes will be used to calibrate a soil erosion model (WaterSed) to understand the impact of potential LULC changes on water and sediment fluxes in the future.

How to cite: Avcioglu, A., Vandromme, R., Grangeon, T., Gomes Minella, J. P., Evrard, O., Tassano, M., Scariot, N., Rippel, E., Peixoto de Barros, C. A., and Cerdan, O.: Land use change-driven streamflow fluctuations and implications for soil erosion modeling in Southern Brazil, EGU General Assembly 2026, Vienna, Austria, 3–8 May 2026, EGU26-9707, https://doi.org/10.5194/egusphere-egu26-9707, 2026.

EGU26-9962 | ECS | Posters on site | HS2.5.3

Variability in river channel conveyance reshapes global flood hazard and exposure 

Laura Devitt, Jeff Neal, Andrew Nicholas, Stephen Darby, Andrea Gasparotto, Yinxue Liu, Ekta Aggarwal, Hannah Cloke, Louise Slater, Julian Leyland, and Dan Parsons

Global flood hazard models are central to assessing flood risk, informing adaptation planning, and interpreting the impacts of climate change on hydrological extremes. However, these models rely on structural assumptions that introduce substantial but poorly quantified uncertainty. One such assumption is that bankfull discharge corresponds to a fixed two-year return period, effectively prescribing a uniform river channel conveyance capacity globally and shaping discharge-inundation relationships across flood magnitudes.

Here, we quantify how uncertainty in river channel conveyance propagates through global flood hazard and population exposure estimates and assess its magnitude relative to climate-driver changes in discharge. Using global bankfull discharge estimates from a geomorphological-hydrological modelling framework, we derive change factors that adjust discharge-inundation relationships within a global flood hazard model. This enables adjusted estimates of flood hazard and exposure that reflect regional channel-floodplain interactions rather than a uniform global assumption.

Accounting for bankfull variability leads to systematic and spatially coherent changes in global flood exposure. Sub-Saharan Africa shows a robust net increase in exposure across return periods, including a 1.4 million increase (11%) for the 20-year flood. In contrast, several large river basins exhibit net reductions in exposure, such as a 7.5 million decrease across the Ganges-Brahmaputra basin. However. This basin-scale signal masks substantial internal variability, with Bangladesh seeing a net increase in exposure of 10% for the 20-year flood.

We compare these effects with climate-driven changes in flood hazard and assess how the uncertainty in river channel conveyance compares with the magnitude of projected climate signals. These results highlight how structural uncertainties in global flood hazard models cascade into risk assessments, with important implications for interpreting present day flood exposure and future climate impacts.

How to cite: Devitt, L., Neal, J., Nicholas, A., Darby, S., Gasparotto, A., Liu, Y., Aggarwal, E., Cloke, H., Slater, L., Leyland, J., and Parsons, D.: Variability in river channel conveyance reshapes global flood hazard and exposure, EGU General Assembly 2026, Vienna, Austria, 3–8 May 2026, EGU26-9962, https://doi.org/10.5194/egusphere-egu26-9962, 2026.

EGU26-11120 | ECS | Posters on site | HS2.5.3

Understanding discrepancies in simulated evaporative fluxes across the land biosphere models 

Deva Charan Jarajapu, Haoshan Wei, Yongqiang Zhang, and Thorsten Wagener

Land biosphere models which simulate interactive carbon and vegetation dynamics, are critical for understanding and predicting the water and carbon cycles. However, significant discrepancies exist among models regarding simulated variables, raising questions about the accuracy of the underlying process representations. In this study, we use land biosphere models from the TRENDY (Trends and Drivers of Terrestrial Sources and Sinks of Carbon Dioxide) project to understand the discrepancies in evaporative fluxes, including canopy evaporation, transpiration, evapotranspiration, and soil evaporation. Particularly, we try to understand how we can identify differences in process representation that cause these discrepancies. Initial results suggest that models differ from each other and significantly overestimate or underestimate the sensitivity of fluxes compared to data products such as GLEAM, FLUXCOM-X-BASE, and PML. These findings indicate a critical gap in how current models parametrize the coupling between vegetation structure and evaporative fluxes, which may explain part of the uncertainty in future projections.

How to cite: Jarajapu, D. C., Wei, H., Zhang, Y., and Wagener, T.: Understanding discrepancies in simulated evaporative fluxes across the land biosphere models, EGU General Assembly 2026, Vienna, Austria, 3–8 May 2026, EGU26-11120, https://doi.org/10.5194/egusphere-egu26-11120, 2026.

EGU26-13191 | Orals | HS2.5.3

Global Streamflow Seasonality Responses to Vegetation Phenology Shifts Across Diverse Hydroclimatic Regimes 

Juntai Han, Yuting Yang, Hui Guo, Zhuoyi Tu, Jinghua Xiong, Yuhan Guo, and Changming Li

Vegetation phenology has shifted globally over recent decades, yet its influence on streamflow seasonality remains insufficiently quantified. Here we present a global, catchment-scale assessment of streamflow seasonal responses to vegetation phenology changes using long‐term observations from ~3000 river basins spanning diverse hydroclimatic regimes. Our results reveal that where vegetation phenology advances, streamflow is systematically redistributed within the year, characterized by reduced spring and summer discharge and enhanced winter streamflow, reflecting increased growing-season water consumption by vegetation. In addition, streamflow timing responds coherently to phenological shifts, advancing in concert with earlier vegetation activity, with particularly pronounced responses in cold regions. In these regions, early-season streamflow timing exhibits a significant advancement driven jointly by earlier snowmelt and vegetation green-up, indicating a dual forcing that amplifies the sensitivity of runoff timing to phenological change in snow-affected catchments. Furthermore, phenological advancement is associated with a weakening of streamflow seasonality, primarily resulting from decreased summer flows and increased spring flows, thereby reducing intra-annual runoff variability.

How to cite: Han, J., Yang, Y., Guo, H., Tu, Z., Xiong, J., Guo, Y., and Li, C.: Global Streamflow Seasonality Responses to Vegetation Phenology Shifts Across Diverse Hydroclimatic Regimes, EGU General Assembly 2026, Vienna, Austria, 3–8 May 2026, EGU26-13191, https://doi.org/10.5194/egusphere-egu26-13191, 2026.

EGU26-14646 | ECS | Orals | HS2.5.3

Detecting an externally forced signal in observed terrestrial water storage 

Casimir Fisch, Lukas Gudmundsson, Dominik L. Schumacher, and Sonia I. Seneviratne

The response of terrestrial freshwater storage to anthropogenic climate forcing is a fundamental yet poorly constrained aspect of global hydrological change. Detection and attribution studies have identified human influence in several components of the hydrological cycle, including precipitation and runoff (e.g. Zhang et al., 2007; Marvel et al., 2019; Gudmundsson et al., 2021). However, attribution of observed changes in terrestrial water storage (TWS) has remained elusive due to the short length of observational records, substantial internal climate variability, and the confounding influence of direct human water management.

Here we use observations from NASA’s Gravity Recovery and Climate Experiment (GRACE), which provide a uniquely robust, spatially explicit measure of terrestrial water storage change, together with a formal detection and attribution framework (Santer et al., 2013) informed by simulations from the Coupled Model Intercomparison Project Phase 6 (CMIP6). We show that the observed GRACE TWS record contains a spatially coherent signal that exceeds the range of simulated unforced variability, strengthens over time, and is robust across alternative fingerprint constructions and GRACE processing choices.

The detected fingerprint is characterised by large-scale wetting and drying patterns broadly consistent with modelled responses to anthropogenic forcing across many regions. Regional deviations are primarily concentrated in intensively irrigated and groundwater-dependent areas, indicating the superimposed influence of direct human water use and remaining model limitations. Additional analyses using reanalysis products and observationally constrained climate model simulations provide complementary context for interpreting the emergence of this signal. Together, these results provide the first fingerprinting evidence of anthropogenically forced change in global terrestrial water storage and establish continental freshwater storage as a detectable and attributable component of the climate system.

References

Zhang, X. et al. Detection of human influence on twentieth-century precipitation trends. Nature 448, 461–465 (2007).

Marvel, K. et al. Twentieth-century hydroclimate changes consistent with human influence. Nature 569, 59–65 (2019).

Gudmundsson, L. et al. Globally observed trends in mean and extreme river flow attributed to climate change. Science 371, 1159–1162 (2021).

Santer, B. D. et al. Identifying human influences on atmospheric temperature. PNAS 110, 26–33 (2013).

How to cite: Fisch, C., Gudmundsson, L., Schumacher, D. L., and Seneviratne, S. I.: Detecting an externally forced signal in observed terrestrial water storage, EGU General Assembly 2026, Vienna, Austria, 3–8 May 2026, EGU26-14646, https://doi.org/10.5194/egusphere-egu26-14646, 2026.

EGU26-15003 | Orals | HS2.5.3

Evolving relationships between atmospheric water vapor and precipitation over Europe under climate change 

Hoyoung Cha, Jongjin Baik, Jeongwoo Han, Carlo De Michele, Wooyoung Na, and Changhyun Jun

Abstract

Understanding how atmospheric water vapor translates into precipitation is fundamental to assessing future changes in the hydrological cycle under climate change. While integrated water vapor (IWV) is a key precursor of precipitation, the temporal stability of their relationship and its evolution under different climate scenarios remain uncertain, particularly at continental scales. In this study, we investigate long-term changes in the statistical relationship between precipitation and water vapor across Europe using an ensemble of Coupled Model Intercomparison Project Phase 6 (CMIP6) climate model simulations. Historical and future projections under contrasting climate change scenarios were analyzed to examine how precipitation–vapor coupling evolves from the pre-industrial period through the end of the 21st century. To enable consistent comparison across regions and time periods, precipitation and IWV were transformed into standardized indices (Standardized precipitation index, Standardized integrated water vapor) based on probabilistic distributions. Correlation and cross-correlation analyses were then applied to quantify both the strength of coupling and the response times between precipitation and atmospheric water vapor. The results reveal pronounced regional differences in the precipitation–vapor relationship across Europe, with stronger coupling observed in parts of Western Europe compared to other regions. Under the Shared Socioeconomic Pathways 8.5, the precipitation–vapor relationship exhibits a tendency to weaken over time, suggesting a growing decoupling between precipitation and water vapor. In addition, precipitation responses were found to systematically lag changes in IWV by several weeks to months, highlighting the importance of considering temporal delays in hydroclimatic assessments. These findings provide new insights into the evolving dynamics of precipitation–vapor interactions under climate change and offer a basis for improving the interpretation of large-scale hydrological responses in climate model projections.

Keywords: Atmospheric Water Vapor, Precipitation, Precipitation-vapor Coupling, Climate Change, Cross-correlation, Europe


Acknowledgment

This research was supported by the National Research Foundation of Korea(NRF) grant funded by the Korea government (MSIT) (RS-2024-00334564 & RS-2021-NR060085), the Korea Environmental Industry & Technology Institute (KEITI) through Wetland Ecosystem Value Evaluation and Carbon Absorption Value Promotion Technology Development Project, funded by Korea Ministry of Environment (MOE) (RS-2022-KE002066), and Water Management Program for Drought, funded by the Korea Ministry of Climate, Energy and Environment (MCEE) (RS-2022-KE002032).

How to cite: Cha, H., Baik, J., Han, J., De Michele, C., Na, W., and Jun, C.: Evolving relationships between atmospheric water vapor and precipitation over Europe under climate change, EGU General Assembly 2026, Vienna, Austria, 3–8 May 2026, EGU26-15003, https://doi.org/10.5194/egusphere-egu26-15003, 2026.

EGU26-15552 | Orals | HS2.5.3

Overcoming the Northern Hemisphere snow-water resources paradox 

Chiyuan Miao and Yuanfang Chai

Although Earth system models (ESMs) overestimate historical land surface warming, paradoxically, they also overestimate snow amounts in the Northern Hemisphere (NH). This apparent contradiction constitutes a snow-water resources paradox, but the underlying mechanisms of this paradox remain unclear. Combining ground-based datasets and ESMs, we found that the snow-water resources paradox can be explained by the overestimation of the frequency of light snow by ESMs. Using spatially-distributed emergent constraints, we show that this paradox persists in the mid- (2041–2060) and long-term (2081–2100) projections over more than half of the NH’s land surface, with the frequency of freezing days underestimated by 12%–19% and snow water equivalent (SWE) overestimated by 41%–47%. The constrained projections indicate that the raw ESMs overestimate future NH snowmelt runoff by 17%–24% (over 33%–35% of the NH’s land surface). This extensive and long-standing snow-water resources paradox poses a serious adaptation planning risk in that the degree of future snowmelt water available for agriculture, industry, ecosystems and domestic life may well be less than suggested by unadjusted ESM projections.

How to cite: Miao, C. and Chai, Y.: Overcoming the Northern Hemisphere snow-water resources paradox, EGU General Assembly 2026, Vienna, Austria, 3–8 May 2026, EGU26-15552, https://doi.org/10.5194/egusphere-egu26-15552, 2026.

Understanding streamflow–sediment relationships in large rivers is essential for effective ecosystem conservation and sediment management. However, the multi-scale regimes of streamflow–sediment load in the Yellow River, shaped by the combined influences of climate variability and intensive human activities, remain inadequately understood. This study investigates streamflow–sediment coupling patterns at annual, monthly, and flood-event scales using long-term observations (1950s–2022) from six mainstem stations along the Yellow River. The results reveal pronounced spatiotemporal variability in streamflow–sediment relationships and hysteresis behaviors along the river mainstem. At the annual scale, streamflow and sediment load generally exhibit a linear relationship. At both the monthly and annual maximum flood-event scales, power-law sediment rating curves effectively describe the relationships between discharge (Q) and sediment concentration (SC), expressed as SC = aQb. Notably, the goodness of fit (R2) of the annual and monthly streamflow–sediment relationships exhibits a declining trend over time, indicating increasing nonstationarity. Despite this overall weakening, a robust linear coupling between ln(a) and b persists in the sediment rating curves at both monthly and flood-event scales, with a remarkably consistent regression slope (approximately −0.14) across different periods. In addition, pronounced hysteresis patterns are observed at both intra-annual and flood-event scales. These hysteresis loops evolve from simple clockwise forms, indicative of sediment supply limitation, toward more complex figure-eight patterns, reflecting enhanced sediment resuspension and altered sediment delivery dynamics. Overall, the results highlight the scale-dependent and dynamically evolving nature of sediment transport processes in the Yellow River, underscoring the need for adaptive, multi-scale sediment management strategies under changing climatic and anthropogenic influences.

How to cite: Yin, S. and Gao, G.: Multi-Scale Streamflow–Sediment Relationships and Regime Shifts in the Yellow River Mainstream, EGU General Assembly 2026, Vienna, Austria, 3–8 May 2026, EGU26-15778, https://doi.org/10.5194/egusphere-egu26-15778, 2026.

EGU26-16073 | ECS | Posters on site | HS2.5.3

Unintended Groundwater Depletion in Inner Mongolia Driven by Grazing Ban-Induced Irrigation Expansion 

Jiangmeng Li, Yongqiang Zhang, and Zhenwu Xu

Vegetation greening is significantly altering hydrological cycles in arid regions. However, current research often emphasizes direct hydrological effects, largely neglecting the underlying policy-driven mechanisms. By integrating GRACE/FO, MODIS LAI, and ISIMIP3a data (2003–2024), we reveal distinct hydrological responses across the Mongolian Plateau. Results show that Inner Mongolia, China experienced 2.73×10⁴ km2 grassland restoration and 5.64×10⁴ km2 cropland expansion, compared to 1.92×10⁴ km2 and 1.25×10⁴ km2 in Mongolia. Despite a synchronous precipitation increase (3.87 and 2.45 mm/yr), TWS trends diverged sharply: severe depletion in Inner Mongolia (-2.11 km³/yr) versus a marginal decline in Mongolia (-0.25 km³/yr). Deriving groundwater anomalies via water balance residuals confirms that groundwater depletion in Inner Mongolia (-2.73 km³/yr) is the primary driver of the TWS decline. Notably, ISIMIP3a natural simulations maintain a coupled TWS-precipitation increase, contrasting with the stark decoupling observed in reality; this divergence identifies policy-driven irrigation as the primary cause. We urge integrating anthropogenic processes into models and adopting adaptive policies to enhance regional resilience.

How to cite: Li, J., Zhang, Y., and Xu, Z.: Unintended Groundwater Depletion in Inner Mongolia Driven by Grazing Ban-Induced Irrigation Expansion, EGU General Assembly 2026, Vienna, Austria, 3–8 May 2026, EGU26-16073, https://doi.org/10.5194/egusphere-egu26-16073, 2026.

EGU26-16143 | ECS | Posters on site | HS2.5.3

Quantifying future water demand in the Rhine river basin under climate and socioeconomic change 

Devi Purnamasari, Frederiek Sperna Weiland, Adriaan Teuling, and Albrecht Weerts

The Rhine river basin has increasingly faced severe summer droughts, resulting in critically low water availability for different water users. Rising temperatures combined with reduced precipitation have also intensified irrigation areas during summer (Purnamasari et al., 2025a). Concurrently, land use and land cover changes, population growth, and economic development are likely to reshape future water consumption patterns. These climatic and socioeconomic drivers present major challenges for sustainable water resources management in the Rhine basin. To address this, we developed a methodology to quantify future water demand in the Rhine basin by integrating climate projections from the KNMI’23 scenarios with socioeconomic development pathways. The socioeconomic development pathways are build upon previous work by Purnamasari et al. (2025b).Our approach combines projected changes in climate variables with land use and land cover dynamics, population growth, and economic trends to estimate evolving water use patterns across different sectors. By linking spatially explicit water demand scenarios with a distributed hydrological model, we capture spatiotemporal changes in hydrological processes under multiple plausible futures. The results highlight potential future hotspots of water deficit, supporting informed decision-making on water allocation, drought mitigation, and long-term water resources planning in the Rhine basin under climate and socioeconomic change. The approach is readily transferable to other European river basins and beyond. This work is part of the ongoing Horizon Europe project Stars4Water.

Purnamasari, D., Teuling, A. J., and Weerts, A. H.: Identifying irrigated areas using land surface temperature and hydrological modelling: Application to Rhine basin, Hydrology and Earth System Sciences, https://doi.org/10.5194/hess-29-1483-2025, 2025.

Purnamasari, D., van Verseveld, W. J., Buitink, J., Sperna Weiland, F. C., Dalmijn, B., Teuling, R., and Weerts, A. H.: Improving realism of high-resolution hydrological modeling with anthropogenic water use: A study on the Rhine Basin, ESS Open Archive, 2025.

How to cite: Purnamasari, D., Weiland, F. S., Teuling, A., and Weerts, A.: Quantifying future water demand in the Rhine river basin under climate and socioeconomic change, EGU General Assembly 2026, Vienna, Austria, 3–8 May 2026, EGU26-16143, https://doi.org/10.5194/egusphere-egu26-16143, 2026.

EGU26-16864 | ECS | Orals | HS2.5.3

ReDF-Net: task-oriented fusion of gridded and in-situ information for daily runoff forecasting 

Zhuo Yang, Dong Wang, Xiaoyu Ye, and Chenlu Yu

The growing availability of reanalysis gridded products and in-situ observations offers new opportunities for multi-source data fusion in catchment-scale runoff forecasting. However, many existing multi-modal approaches decouple gridded feature extraction from sequence prediction, rely on simple concatenation that struggles with high-dimensional spatiotemporal information, and provide limited quantitative interpretation of the relative contribution of heterogeneous inputs. Here we present ReDF-Net, a task-oriented residual–attention framework for daily (t+1) runoff forecasting that explicitly fuses ERA5-Land surface soil moisture with in-situ observations. ReDF-Net employs a modified residual network to extract compact representations from sequences of daily gridded soil moisture fields, with the historical time window encoded as input channels. Learnable softmax attention weights are embedded within the residual blocks to adaptively reweight features during end-to-end training, ensuring that gridded feature learning is directly optimized by the forecasting loss. The attention-aggregated gridded representation is then fused with site-based predictors and fed into a time-series forecasting backbone for runoff prediction. Beyond predictive accuracy, we quantify global multi-source feature contributions using the converged attention weights and interpretability analysis, and contrast model behavior during flood and non-flood periods to facilitate process-consistent interpretation. The framework is evaluated at Yichang station in the Yangtze River basin and Lanzhou station in the Yellow River basin, and benchmarked against representative recurrent forecasting models. Results demonstrate that task-oriented fusion of ERA5-Land surface soil moisture and in-situ observations improves daily runoff forecasting skill while maintaining training stability, and provides transparent attribution of how different data sources support runoff prediction. The proposed approach offers an interpretable pathway for advanced data–model fusion of hydrological variables at the catchment scale.

How to cite: Yang, Z., Wang, D., Ye, X., and Yu, C.: ReDF-Net: task-oriented fusion of gridded and in-situ information for daily runoff forecasting, EGU General Assembly 2026, Vienna, Austria, 3–8 May 2026, EGU26-16864, https://doi.org/10.5194/egusphere-egu26-16864, 2026.

EGU26-17191 | ECS | Orals | HS2.5.3

Regional controls on blue-green water partitioning under climate change in CMIP6 

Simon P. Heselschwerdt, Abhinav Dengri, and Peter Greve

Hydrological systems are undergoing rapid change under increasing greenhouse gas concentrations, yet substantial uncertainty remains regarding how precipitation is partitioned into blue (runoff) and green (transpiration) water flows across regions (blue–green water partitioning). Global assessments can reveal dominant large-scale signals, but they may mask regional differences in controlling mechanisms that are critical for climate-impact interpretation and climate-service applications. Here, we investigate regional controls on blue-green water partitioning using Coupled Model Intercomparison Project Phase 6 (CMIP6) simulations.

We analyse blue-green water partitioning in historical simulations and two contrasting future scenarios (SSP1-2.6 and SSP3-7.0), quantified from monthly runoff, transpiration, and precipitation, and evaluated in multi-decadal means. To ensure interpretability at typical CMIP6 spatial resolution, we focus on selected large-scale IPCC AR6 reference regions and use multi-model ensemble statistics to characterise spread and agreement. We further assess differences across individual Earth system models to contextualise ensemble behaviour and sources of uncertainty.

To identify the main factors shaping regional changes in blue-green water partitioning, we apply statistical learning methods that relate partitioning changes to candidate controls representing precipitation characteristics, atmospheric demand, soil moisture conditions, and vegetation functioning. We use an ensemble-based framework with interpretability diagnostics to assess the relative importance of these controls across regions and scenarios. This regional perspective aims to complement global analyses by highlighting where and why controlling factors differ across hydroclimatic regimes, providing decision-relevant context for ecosystem-relevant green-water changes and runoff-relevant blue-water availability in a changing climate.

How to cite: Heselschwerdt, S. P., Dengri, A., and Greve, P.: Regional controls on blue-green water partitioning under climate change in CMIP6, EGU General Assembly 2026, Vienna, Austria, 3–8 May 2026, EGU26-17191, https://doi.org/10.5194/egusphere-egu26-17191, 2026.

South America and Sub-Saharan Africa host some of the world’s most dynamic and societally critical terrestrial water cycles, yet their hydro-climatic responses to ongoing climate warming remain incompletely understood. Here, we assess spatial patterns, temporal trends, and hydrological extremes of precipitation, runoff, evapotranspiration, and water storage change across 222 hydrological catchments (95 in South America and 127 in Sub-Saharan Africa) over the period 1980–2010, based on and comparing four widely used global datasets.

Across both regions, the datasets robustly indicate widespread warming over the study period. For the mean water fluxes of precipitation, runoff, and evapotranspiration, most datasets show weak and often statistically insignificant trends. Among the datasets, ERA5 implications emerge as systematically anomalous, yielding strongly divergent results of persistent water-storage depletion driven by physically unrealistic evapotranspiration behavior.

Analyses of hydrological drought- and flood-related water-flux extremes reveal both shared and contrasting regional signals. In South America, wet-season high-flux extremes increase in magnitude in the Amazon Basin, indicating heightened flood risk, while the magnitudes of dry-season low-flux extremes decrease across much of the continent, indicating increasing drought risk, particularly in the La Plata Basin. In Sub-Saharan Africa, the highest 5% of monthly precipitation and runoff extremes intensify in the wettest season, whereas severe drought hazards, characterized by zero precipitation and runoff, persist in the driest season. Regional variability is pronounced, with catchments in Namibia showing wetting trends, yet still experiencing severe drought extremes.

Together, these results underscore the multi-faceted and region-specific nature of terrestrial hydro-climatic change in the Global South. They highlight the importance of comparative multi-dataset analyses combined with integrated water-balance diagnostics across many catchments to improve process understanding, distinguish physically plausible long-term change signals and extreme short-term variations, and more robustly assess changing flood and drought risks in a warming climate.

How to cite: Destouni, G. and Zarei, M.: Hydro-climatic Variability, Change, and Extremes Across South America and Sub-Saharan Africa: Insights from Multi-Catchment, Multi-Dataset Analyses, EGU General Assembly 2026, Vienna, Austria, 3–8 May 2026, EGU26-17633, https://doi.org/10.5194/egusphere-egu26-17633, 2026.

EGU26-17825 | ECS | Orals | HS2.5.3

Disentangle the individual effects of eCO2 on ET across vegetation types 

Jinfeng Zhao, Zhou Sha, Shikun Sun, Shijie Jiang, and Alexander J. Winkler

Evapotranspiration (ET) is experiencing profound shifts in response to elevated CO2 (eCO2), with critical implications for hydrological cycles and ecosystems. It is widely recognized that CO2 enrichment modulates ET components through three distinct pathways: radiative forcing (intensifying the greenhouse effect), physiological effects (regulating stomatal conductance), and structural effects (enhancing vegetation productivity and leaf area index). However, these changes in the coupled biosphere-atmosphere processes and their interactions, which potentially compensate for or amplify one another, make them difficult to disentangle and assess individually. Consequently, there is little consensus on the individual and combined effects of eCO2 on ET through radiative climate change, plant physiological changes and structural changes, not to mention the variability among vegetation types.

In this work, we establish a "bottom-up" attribution framework based on counterfactual sensitivity experiments, and employed an optimized Shuttleworth-Wallace dual-source model to decouple the specific impacts of eCO2 on plant transpiration, soil evaporation, and precipitation interception. The research primarily addresses two pivotal questions: (1) What are the isolated and the combined effects of eCO2 on ET across different propagation pathways? (2) How do these effects vary across different vegetation types?

Preliminary results indicate that the negative physiological effects and positive radiative effects largely offset each other, with the absolute magnitude of their individual contributions far exceeding the positive structural effects. The ET response exhibits significant inter-biome heterogeneity, and physiological effects dominate the response magnitude across all vegetation types, with the exception of croplands and deciduous broadleaf forests. These findings suggest that further increases in CO2 concentrations may intensify physiological regulation to a threshold that triggers a regime shift in ET from an increasing to a decreasing trend. These findings allows us to project the impact of futureCO2 concentrations on the interaction processes of water between the biosphere and atmosphere.

How to cite: Zhao, J., Sha, Z., Sun, S., Jiang, S., and J. Winkler, A.: Disentangle the individual effects of eCO2 on ET across vegetation types, EGU General Assembly 2026, Vienna, Austria, 3–8 May 2026, EGU26-17825, https://doi.org/10.5194/egusphere-egu26-17825, 2026.

EGU26-18119 | ECS | Posters on site | HS2.5.3

Future Shifts in European River Flow Regimes under Climate Change 

Jisha Joseph and Fred Hattermann

River flow regimes across Europe are increasingly influenced by climate change in addition to direct human interventions. Rising air temperatures, shifts in the spatiotemporal patterns of precipitation, and changes in terrestrial and snow water storage are expected to modify hydrological processes across European river basins, with direct implications for water availability and the frequency and magnitude of hydrological extremes. Alterations of flow regimes represent a further direct consequence of climate change. Such changes can have profound consequences for riverine ecosystems, as aquatic species composition and biodiversity have evolved under relatively stable natural flow conditions and are sensitive to climate-driven hydrological change. This study assesses climate change induced shifts in natural river flow regimes at the continental scale using the Soil and Water Integrated Model (SWIM). The model is calibrated against observed discharge from the Global Runoff Data Centre (GRDC) and remotely sensed evapotranspiration from MODIS using multi-objective optimization, with meteorological forcing from the E-OBS dataset. Future projections are driven by bias-adjusted climate forcing from ISIMIP3b, based on an ensemble of ten global climate models and three socioeconomic pathways (SSP1-2.6, SSP3-7.0, and SSP5-8.5). Hydrological alterations are quantified using the Indicators of Hydrologic Alteration (IHA) framework and Range of Variability Analysis (RVA), capturing changes in the magnitude, timing, frequency, and duration of high- and low-flow events. To explore potential ecological implications, changes in selected IHA metrics are linked to the Shannon diversity index using a previously derived empirical relationship, allowing estimation of biodiversity responses at hydrological stations lacking ecological observations. Natural flow conditions support higher ecological diversity and provide a reference for assessing climate induced deviations. Results are analyzed at fine spatial resolution across major European river basins, enabling the identification of sub-basins experiencing particularly strong hydrological alterations. The study aims to provide a comprehensive assessment of future flow regime shifts across Europe and to improve understanding of their potential hydrological and ecological consequences under climate change.

How to cite: Joseph, J. and Hattermann, F.: Future Shifts in European River Flow Regimes under Climate Change, EGU General Assembly 2026, Vienna, Austria, 3–8 May 2026, EGU26-18119, https://doi.org/10.5194/egusphere-egu26-18119, 2026.

EGU26-18821 | Orals | HS2.5.3

WSIMODanywhere: Ready-to-use integrated water system modelling anywhere in England from open data 

Ana Mijic, Eduardo Rico Carranza, Robin Maes Prior, Jiayi Tang, Wangdong Zong, and Barnaby Dobson

WSIMOD is an integrated water modelling framework that enables the representation of flow and water quality interactions across scales, sectors, and processes within complex water systems. Due to its integrated and flexible nature, WSIMOD allows for hydrological processes, infrastructure, land use, and management decisions to be jointly simulated. Recent developments have significantly expanded its analytical capabilities, including bespoke modelling of wetlands, improved representation of groundwater dynamics, and integration with optimisation-based approaches, strengthening its relevance for applied water management and policy analysis.

Despite these advances, a key barrier to wider adoption remains the substantial effort required to preprocess heterogeneous datasets and configure integrated water system models for specific catchments. This limits model reuse, slows uptake by practitioners, and constrains comparative analysis for regional and national applications. To address these challenges, we present WSIMODanywhere, an automated pipeline for data preprocessing, model generation, and initial parameterisation for any catchment or sub-catchment in England. The model can be accessed via an interactive web interface, free of charge for research, allowing users to select a geographic area and obtain a ready-to-use WSIMOD configuration created using openly available, pre-processed datasets. We present baseline historic simulations of WSIMODanywhere from regional to national scale, and discuss model performance when using a baseline, uncalibrated and data-driven configuration of WSIMOD, in which parameters are estimated solely from publicly available data without site-specific calibration. We then outline a pipeline for further model improvement through regional fine-tuning and additional data integration and discuss potential applications of a national-scale integrated water system model.

How to cite: Mijic, A., Rico Carranza, E., Maes Prior, R., Tang, J., Zong, W., and Dobson, B.: WSIMODanywhere: Ready-to-use integrated water system modelling anywhere in England from open data, EGU General Assembly 2026, Vienna, Austria, 3–8 May 2026, EGU26-18821, https://doi.org/10.5194/egusphere-egu26-18821, 2026.

EGU26-19048 | ECS | Posters on site | HS2.5.3

Attribution of trends in modeled and observed surface water fluxes 

Josephin Kroll, Ruth Stephan, Melissa Ruiz-Vásquez, and Rene Orth

Evaporation and runoff are the major surface water fluxes. Together they determine water availability on land, which ecosystems and humans rely on. The mechanisms driving trends in evaporation and runoff in the context of global change are not fully understood, which is also reflected in a significant uncertainty of projections of these water fluxes across Earth system models. To better understand trends in surface water fluxes and model discrepancies, we examine whether i) trends in total precipitation or ii) changes in the partitioning of precipitation to evaporation and runoff primarily control those changes. While changes in the partitioning are partly related to trends in total precipitation, additional factors such as land cover change and altered precipitation variability act as important contributors.
We analyze the trends in surface water fluxes across the 21st century utilizing data from several Earth system models. We compute differences in the mean daily partitioning of precipitation as well as mean daily precipitation between the first and last 25 years of the century. We find that changes in runoff are primarily driven by changes in precipitation partitioning, while changes in evaporation are dominated by changes in precipitation amount. However, for both surface water fluxes the spatial pattern of the relative importance of total precipitation versus precipitation partitioning varies among models. Our results highlight the importance of considering both changes in precipitation amount as well as changes in partitioning when investigating long-term trends in surface water fluxes.
Additionally, we will compare Earth system model simulations with observation-based data to test the robustness of our conclusions. Understanding the drivers of trends in surface water fluxes can inform related process-based modelling. This enables more accurate projections of the terrestrial water cycle as a basis for more targeted long-term regional water management.   

How to cite: Kroll, J., Stephan, R., Ruiz-Vásquez, M., and Orth, R.: Attribution of trends in modeled and observed surface water fluxes, EGU General Assembly 2026, Vienna, Austria, 3–8 May 2026, EGU26-19048, https://doi.org/10.5194/egusphere-egu26-19048, 2026.

In intensely irrigated regions, groundwater levels are strongly influenced by crop water consumption and human activities. Although machine learning methods have proven effective for groundwater prediction, few studies have explicitly incorporated irrigation water use as a key predictor. In this study, we developed a groundwater prediction framework that integrates precise agricultural water consumption using machine learning techniques, with Shijiazhuang in China as the study area. Crop water consumption was simulated by coupling multi-source data with the AquaCrop model. A Random Forest-based groundwater prediction framework was then constructed to explore the effects of irrigation water consumption on groundwater level changes from 2018 to 2024. Sentinel-2A remote sensing imagery was employed to extract regional crop cultivation patterns, achieving an Overall Accuracy (OA) greater than 0.94 and a Kappa coefficient exceeding 0.89. Subsequently, AquaCrop model was applied to simulate crop yields and water consumption, with simulated yields showing strong agreement with official statistics, thus enabling the generation of a long-term time series of crop water consumption. Building on these results, the simulated irrigation water consumption was incorporated into the groundwater level prediction model. The performance of models using different predictor combinations was compared. Results show that including water consumption significantly enhanced the predictive accuracy, reducing root mean square error (RMSE) by 6.34%, 4.17%, and 3.97% in the three groups, and reducing the average error by 9.09%, 19.33% and 21.37% respectively. Spatially, model errors were also notably reduced. Overall, this study demonstrates that integrating irrigation water consumption into a groundwater model can effectively quantify the response of groundwater levels to climatic and anthropogenic factors, providing a scientific basis for groundwater resource management and ecological restoration.

How to cite: Zhang, J. and Yang, J.: Enhancing Groundwater Level Predictions by Integrating Precise Agricultural Water Consumption with Machine Learning Algorithms, EGU General Assembly 2026, Vienna, Austria, 3–8 May 2026, EGU26-21736, https://doi.org/10.5194/egusphere-egu26-21736, 2026.

HS3 – Hydroinformatics

EGU26-892 | ECS | Orals | HS3.1

Assessing the Influence of Socio-Economic and Environmental Drivers on Water Availability Ecosystem Services: A Geographically Weighted Regression approach 

Gabriel Silva, Pedro Silva, Marcos Benso, Leonor Patricia Morellato, and Eduardo Mendiondo

Addressing water availability ecosystem service in human water resources is fundamental for the development of strategies that encompass sustainable pathways in a climate changing era. The total amount of water available for human activities is essential to economic development, influencing food production, power generation, human well-being, and healthy environments. Although key drivers of water availability, such as precipitation and land use, are well established in the literature, other potentially influential factors remain underexplored, including population density, GDP per capita, the human development index (HDI), water governance indicators, and total water demand. In this work, we developed a new concept for water management through the lens of ecosystem services approach. This framework emphasizes understanding the socio-economic and environmental drivers that influence water yield, aiming to enhance human well-being by promoting best practices in water management. This perspective enables a deeper understanding of the mechanisms influencing water availability beyond conventional assessment methods, while prioritizing management and restoration strategies. In this context, hydroinformatics enables advanced spatial analysis for examining water availability and ecosystem services. By integrating data analytics and machine learning (Random Forest) with traditional modeling approaches, it is possible to uncover complex relationships between socio-economic and environmental drivers and their spatial influence on water resources. At the same time, combining with Geographically Weighted Regression (GWR) tool, it is possible to analyze how socio-economic and environmental factors influence water availability ecosystem services across different geographic regions. This is possible because GWR captures spatial variability by estimating local rather than global relationships. Finally, this methodology will be applied globally using Level 5 basins from HydroATLAS, allowing the identification of regional heterogeneities, cross-scale patterns, and dominant local drivers of water availability. This global application provides a robust basis for comparing basins and supporting targeted management and policy interventions. The results are expected to provide a global understanding of how human and environmental factors jointly regulate water availability, supporting the design of more adaptive, equitable, and resilient water management strategies.

How to cite: Silva, G., Silva, P., Benso, M., Morellato, L. P., and Mendiondo, E.: Assessing the Influence of Socio-Economic and Environmental Drivers on Water Availability Ecosystem Services: A Geographically Weighted Regression approach, EGU General Assembly 2026, Vienna, Austria, 3–8 May 2026, EGU26-892, https://doi.org/10.5194/egusphere-egu26-892, 2026.

EGU26-981 | ECS | Orals | HS3.1

Modeling hysteresis in stage-discharge: Physics and Artificial Intelligence based Approach 

Rijurekha Dasgupta, Subhasish Das, Gourab Banerjee, and Asis Mazumdar

The stage-discharge rating curve is crucial for flow estimation in open channels. The power relationship between discharge (Q) and stage (h) is used conventionally to evaluate the discharge from stage measurements. However, this relationship performs poorly under unsteady conditions, varying bed roughness and alteration of cross-sectional geometry. Hysteretic behavior is often found in the rating curves showing different discharges under identical stages because of the unsteadiness. Attempts have been made by the scientific community to develop such Q-h relationship that can be able to capture this hysteresis along with easy computations. Jones' formula comprises steady state discharge and temporal gradient of h is one of the equations that have been used for modeling this hysteresis. Symbolic regression (SR) has also been applied to trained machine learning (ML) models to derive site-specific explicit mathematical Q-h equation of high accuracy. However, the SR-based relationship does not exhibit the realistic hysteretic nature of rating curves. This study aims to find a robust stage-discharge relationship that shall capture the realistic hysteretic nature while having high accuracy. To achieve this, a Physics-Informed Neural Network (PINN) is developed incorporating the Jones formula into its loss function along with the data-driven error term and a term to calibrate the parameters of the Jones formula. Further, SR is implemented using the PySR module to derive a mathematical equation that fits the prediction of the PINN. This equation has no differential term and incorporates the stage on time t, stage on time (t-1) and steady state discharge. For the Q-h data with 15-minute temporal resolution of the River Brays of the USA, the rating curves derived from the Jones formula and this PINN-SR are compared based on their abilities to capture the hysteretic nature of the Q-h relationship. Four metrics of hysteresis capturing performance and an overall score are used for comparison. All data are normalized to avoid mixed units in the overall score. The hysteresis area error to check the magnitude is found to be 1.574 for Jones formula and 0.129 for PINN-SR. For fitting accuracy, the average of Root Mean Square Errors (RMSEs) for rising and falling limbs are 0.425 and 0.360, the hysteresis width errors are 0.007 and 0.138, and the Direction-Aware Dynamic Time Warpings (DTWs) are 18.225 and 5.752. The overall error scores for hysteresis are 5.058 and 1.595 for the Jones formula and PINN-SR-based rating curves, respectively. These results indicate the superior performance of PINN-SR-based rating curve over the Jones formula in capturing the hysteresis under unsteady flow conditions. 

How to cite: Dasgupta, R., Das, S., Banerjee, G., and Mazumdar, A.: Modeling hysteresis in stage-discharge: Physics and Artificial Intelligence based Approach, EGU General Assembly 2026, Vienna, Austria, 3–8 May 2026, EGU26-981, https://doi.org/10.5194/egusphere-egu26-981, 2026.

EGU26-1060 | ECS | Posters on site | HS3.1

Data-Driven Regionalization of Surface Discharge in Unmonitored Catchments of the Baltic Sea Drainage Basin 

Arya Vijayan, Youn Airiaud, and Zahra Kalantari

A significant share of freshwater discharge from Baltic Sea drainage basin (BSDB) originates from unmonitored or poorly monitored coastal catchments, which increases uncertainty in regional water balance assessments and in estimates of nutrient and pollutant loads to the Baltic Sea. This study presents a data-driven regionalization framework designed to estimate surface discharge in unmonitored Baltic Sea catchments at monthly, seasonal, and annual scales for the period 2001-2020. A large-sample dataset for about 720 monitored basins is compiled using Global Runoff Data Centre discharge records together with hydro-meteorological and land-surface predictors, including precipitation, evapotranspiration and temperature, topographic attributes, and land-cover fractions. Predictors are selected based on the catchment water balance and processed consistently across all basins using zonal statistics. Multiple linear Regression (MLR) and Random Forest (RF) models are trained on specific discharge, and several modelling configurations are evaluated, including temporal grouping, geographical neighbouring strategies, clustering approaches and the inclusion of correlated variables. A hybrid correction method helps identify which parts of each BSDB are monitored and which are not, making sure discharge is predicted only for the unmonitored areas. The most effective configuration was combined temporal grouping with geographical neighbouring, and it achieved satisfactory performance (NSE > 0.5) for roughly 75% of basins and very good performance (NSE > 0.75) for more than half of basins. Median absolute percentage errors were below 30%. Land use characteristics (e.g. crop land, forest, waterbodies) provide important explanatory power alongside climatic and topographical variables.  The framework provides consistent discharge estimates for ungauged coastal basins in the Baltic Sea region and can be applied in other areas where data is limited to support regional water balance and pollutant load assessment.

How to cite: Vijayan, A., Airiaud, Y., and Kalantari, Z.: Data-Driven Regionalization of Surface Discharge in Unmonitored Catchments of the Baltic Sea Drainage Basin, EGU General Assembly 2026, Vienna, Austria, 3–8 May 2026, EGU26-1060, https://doi.org/10.5194/egusphere-egu26-1060, 2026.

EGU26-2375 | ECS | Posters on site | HS3.1

Integration of time-series analysis, satellite data and machine learning in water balance assessment for the Kis-Balaton Water Protection System 

Adél Petneházy, Márk Szijártó, István Fórizs, György Czuppon, Fruzsina Kapolcsi, Zsófia Látrányi-Lovász, Adrienne Clement, and István Gábor Hatvani

The Kis-Balaton Water Protection System (KBWPS) is a complex, semi-constructed wetland habitat consisting of three separate units that play a significant role in protecting water quality of Lake Balaton, the largest shallow freshwater lake in Central Europe (Bhomia et al., 2021). Previously, it was noted that the water balance of the KBWPS can only be determined with high uncertainty; specifically, the seasonal variation in the ratio of evaporation to transpiration. Hovewer, estimating evaporation is one of the most crucial factors in water balance calculations. Until now, a “homogeneous method” developed for Fertő/Lake Neusiedl (Bhomia et al., 2021) has been applied for the KBWPS, which is rather an oversimplification for the highly heterogeneous lake and marsh complex of KBWPS. Therefore, the aim of the current study is to develop a system-specific approach tailored to the KBWPS’ spatial heterogeneity.

To quantify and predict the system’s hydrological behaviour, a Long Short-Term Memory (LSTM) model was developed to estimate daily outflow discharge at a single outlet point. The model was trained using meteorological variables and observed daily discharge time series, allowing the network to capture temporal dependencies and delayed system responses. In parallel, monthly Sentinel-2 imagery and daily in-situ measurements were analysed using trend analysis and seasonal decomposition to investigate the temporal variability of key hydro-meteorological parameters. NDVI-based satellite estimates were applied to characterise evapotranspiration dynamics. A comprehensive statistical analysis of time series, including air humidity, air temperature, wind conditions, and water chemistry data, was carried out to identify correlations between the individual parameters. The applied statistical and machine learning methods effectively captured the temporal dynamics of the system.  

In addition, Sentinel-2 satellite data was used to refine the spatial structure of vegetation, which influenced directly the transpiration. The development of a vegetation delineation methodology, based on NDVI classification, contributes to more accurate determination of water balance components by separating water surfaces from vegetation-covered areas.

Another uncertain element of the system is the yield data series from the point-shape civil engineering structure, which connects the Kis-Balaton hydrological system to Lake Balaton. Formerly, the correction of the yield time-series was required human resources. To reduce measurement errors and decrease the need for the manual correction, a deep learning-based model is under development, which determines seasonal correction factors. To address this problem, precipitation and wind speed data are also used as suitable predictors in addition to the daily water flow time series.

The expected outcome of the research is a comprehensive, scientifically sound methodology that will enable more accurate water balance calculations for Kis-Balaton and contribute to more efficient water management support for the system in the long term.

The research was supported by the National Multidisciplinary Laboratory for Climate Change, RRF-2.3.1–21-2022–00014 project.

Bhomia, R. K., Clement, A., Látrányi-Lovász, Z., Kaur, R., Rousseau, D., Louage, F., Wang, Q., Hatvani, I. G. (2021). Case studies of (semi) constructed wetlands treating point and non-point pollutant loads to protect downstream natural ecosystems. In Reference module in earth systems and environmental sciences. Elsevier.

How to cite: Petneházy, A., Szijártó, M., Fórizs, I., Czuppon, G., Kapolcsi, F., Látrányi-Lovász, Z., Clement, A., and Hatvani, I. G.: Integration of time-series analysis, satellite data and machine learning in water balance assessment for the Kis-Balaton Water Protection System, EGU General Assembly 2026, Vienna, Austria, 3–8 May 2026, EGU26-2375, https://doi.org/10.5194/egusphere-egu26-2375, 2026.

As urban flood risks intensify due to climate change and rapid urbanization, robust assessment of drainage system resilience has become increasingly important. This study proposes a deep learning–based framework to evaluate flood resilience in urban drainage networks (UDNs) using node-level hydraulic predictions. The framework integrates Graph Neural Networks (GNNs) and Transformer models to predict water depth at each network node under multiple storm scenarios. GNNs capture spatial dependencies and network topology within the drainage system, while the Transformer models temporal rainfall–runoff dynamics. Flooding conditions at nodes are identified by applying depth-based thresholds to the predicted water levels, enabling the generation of time-resolved flood maps across the network. Flood resilience is assessed at the node level by adapting the Simple Urban Flood Resilience Index (SUFRI). Three indicators are considered: normalized flood depth at nodes, recovery time required for water levels to return to normal conditions, and flooding frequency. These indicators are combined to derive resilience scores for individual nodes, which are further weighted according to their hydraulic and topological importance within the network, considering factors such as flow capacity, connectivity, and redundancy. System-level resilience is obtained by aggregating the weighted node-level resilience scores. The proposed framework is applied to a real-world urban drainage system to evaluate resilience under diverse storm scenarios. Results reveal critical nodes and vulnerable regions that disproportionately influence overall system performance. Based on the analysis, targeted optimization strategies—such as capacity enhancement, redundancy improvement, and recovery acceleration—are suggested to mitigate future flood risks. The framework provides a scalable and data-efficient decision-support tool for urban flood resilience assessment and infrastructure planning, particularly in data-scarce urban environments.

Acknowledgement
This work was supported by the National Research Foundation of Korea(NRF) grant funded by the Ministry of Science and Technology (RS-2024-00356786) and Korea Environmental Industry & Technology Institute grant funded by the Ministry of Environment (RS-2023-00218973).

How to cite: Li, S. and Park, J.: Assessing flood resilience in urban drainage networks using deep learning–based hydraulic predictions, EGU General Assembly 2026, Vienna, Austria, 3–8 May 2026, EGU26-4692, https://doi.org/10.5194/egusphere-egu26-4692, 2026.

River discharge is a key hydrological issue for the river and water resources management. Recently, climate change is likely exacerbating the frequency and intensity of the extreme flood events, which indicates continuous monitoring of water discharge and its variation at different time scales are of prime important, especially for large river basins. The stage–discharge relationship or rating curve in a river is very useful because it allows computing the discharges from measured water levels at a gauge station. A single-valued rating curve can be used for a nearly steady regime. However, a complex relationship between stage and discharge should be established when there is a non-stationary regime due to, for example, the operation of artificial constructions, such as dams and weirs. This study aims to evaluate the stage-discharge relationship considering weir operation. A machine learning architecture, gated recurrent unit (GRU), is developed to determine the complex relationship between water level and discharge at the Yeoju Bridge which is located between Gangcheon and Yeoju weirs. To consider both of the upstream and downstream weir operation, observed upstream and downstream water levels of individual weirs are included as GRU inputs. The root mean squared error (RMSE) is adopted to assess the GRU performance. Our findings show that the GRU model considering the effect of weir operation can estimate the discharge with satisfactory accuracy by establishing the relationship between stage and discharge. The approach introduced in this study enables the estimation of discharge in stream networks with abundant artificial constructions, such as weirs and estuary barrages, where streamflow is highly affected by their operations.

This study was supported by the Korea Environmental Industry andTechnology Institute (KEITI) (Grant number: 2022003460001)

How to cite: Jun, K. S. and Li, L.: Analysis of non-unique stage–discharge relationship affected by downstream weir operation using a deep learning method, EGU General Assembly 2026, Vienna, Austria, 3–8 May 2026, EGU26-6125, https://doi.org/10.5194/egusphere-egu26-6125, 2026.

EGU26-6713 | ECS | Posters on site | HS3.1

Active Learning–Based Surrogate Optimization Algorithm for Calibrating Computationally Expensive Geophysical Models 

Qingyi Yang, Ruochen Sun, Marco Mancini, and Giovanni Ravazzani

The reliability of computationally expensive geophysical and environmental models for simulating land surface processes strongly depends on accurate parameter calibration. However, traditional optimization algorithms often require thousands of model evaluations, making them unsuitable for such complex models. We propose an adaptive surrogate modeling-based optimization algorithm with active learning (ASMOAL), an efficient calibration framework that integrates surrogate modeling with a trust-region active learning strategy. At each iteration, ASMOAL adaptively selects informative parameter samples within a trust region, prioritizing high-potential and physically plausible regions, and updates the surrogate to guide the search toward improved solutions with limited model runs. 

We first evaluate ASMOAL on nine benchmark functions to verify convergence behavior and robustness. Then the algorithm is applied to three geophysical models with increasing complexity: the Variable Infiltration Capacity (VIC) model and the Xinanjiang (XAJ) model in two river basins in China, and the flash–Flood Event–based Spatially distributed rainfall–runoff Transformation (FeST) in two river basins in Italy. In addition, we conduct parameter sensitivity analysis to investigate how parameter relevance and interactions shape the search dynamics and accuracy of ASMOAL. The results demonstrate that sensitivity patterns can vary across basins and models, and that accounting for sensitivity information is critical for interpreting calibrated parameters and reducing the risk of equifinality. Moreover, the proposed algorithm exhibits improved convergence, calibration accuracy, and robustness compared to existing surrogate-based methods. The results also reveal that the optimal parameters obtained by ASMOAL tend to cluster within physically meaningful regions, highlighting the importance of focused search. The proposed ASMOAL algorithm offers a promising solution for enhancing parameter calibration in a wide range of computationally expensive geophysical and environmental models.

How to cite: Yang, Q., Sun, R., Mancini, M., and Ravazzani, G.: Active Learning–Based Surrogate Optimization Algorithm for Calibrating Computationally Expensive Geophysical Models, EGU General Assembly 2026, Vienna, Austria, 3–8 May 2026, EGU26-6713, https://doi.org/10.5194/egusphere-egu26-6713, 2026.

EGU26-8108 | ECS | Orals | HS3.1

Semi-Supervised Deep Learning for Streamflow Prediction in Data-scarce Regions 

Tianlong Jia, Guoding Chen, and Uwe Ehret

Accurate streamflow prediction is essential for reliable water resource management and flood forecasting. Recently, deep learning methods, especially Long Short-Term Memory (LSTM), have demonstrated state-of-the-art performance for streamflow prediction when trained in supervised learning (SL) settings. However, robust SL requires large volumes of “labeled” training data, including meteorological inputs paired with corresponding streamflow observations as ground truth. Globally, this poses a problem as only a small fraction of catchments worldwide are monitored with stream gauges. This leaves most regions with abundant “unlabeled” meteorological data but limited 'labels', i.e. discharge observations. This data scarcity limits SL model performance in data-scarce regions, and also limits model generalization and transferability.

To overcome this challenge, we propose a two-stage semi-supervised learning (SSL) method for streamflow prediction based on the Contrastive Predictive Coding (CPC) approach [1]. CPC is a self-supervised learning method that extracts informative feature representations from sequential data (e.g., meteorological time series) without labeled targets (e.g., streamflow observations), by contrasting correct future predictions against incorrect ones. In the first stage, we use CPC to pre-train an encoder (i.e., fully connected layers) and an LSTM network followed by a projection head (i.e., a linear layer without bias), using a large amount of meteorological data (28 years). In the second stage, we add a linear layer to the pre-trained encoder and LSTM, and fine-tune the model for streamflow prediction using a small amount of meteorological data paired with streamflow observations (1 year).

We demonstrate the effectiveness and robustness of our methodology on the CAMELS-DE dataset [2]. We conduct a thorough comparison with a baseline supervised learning model with the same LSTM network. The results suggest that our method improves both in-sample and out-of-sample generalization performances over the SL method, when only a limited amount of discharge data is available. Additionally, the results demonstrate that transfer learning via CPC pre-training provides informative representations for streamflow prediction task, enabling faster convergence and higher model training efficiency, compared to the baseline model trained from scratch.

Our findings highlight a promising direction to leverage self-supervising learning methods for developing hydrological foundation models. Foundation models have revolutionized artificial intelligence applications across diverse domains, and hold large promise for hydrological applications. By scaling our proposed approach with larger and more diverse datasets, we can make significant strides towards multiple downstream prediction tasks, including predicting climate-driven variables (e.g., discharge, groundwater, and soil moisture).


References:

[1] Oord, A. V. D., Li, Y., & Vinyals, O. (2018). Representation learning with contrastive predictive coding. arXiv preprint arXiv:1807.03748.

[2] Loritz, R., Dolich, A., Acuña Espinoza, E., Ebeling, P., Guse, B., Götte, J., ... & Tarasova, L. (2024). CAMELS-DE: hydro-meteorological time series and attributes for 1555 catchments in Germany. Earth System Science Data Discussions, 2024, 1-30.

How to cite: Jia, T., Chen, G., and Ehret, U.: Semi-Supervised Deep Learning for Streamflow Prediction in Data-scarce Regions, EGU General Assembly 2026, Vienna, Austria, 3–8 May 2026, EGU26-8108, https://doi.org/10.5194/egusphere-egu26-8108, 2026.

EGU26-8281 | Orals | HS3.1

Do We Need Deep Learning Models? Assessing the Complexity of Machine Learning Models for Seasonal Streamflow Forecasting Across Diverse Subbasins 

Amin Elshorbagy, Duc-Hai Nguyen, Muhammad Naveed Khaliq, Fisaha Unduche, and M. Khaled Akhtar

Over the past few years, the of use machine learning (ML) models in hydrology has shifted towards deep learning (DL), perhaps because of the icreasing availability of big data and ready-to-be-deployed software tools. It seems that the underlying assumption is that more complex (DL) models are desired, however, there are less efforts to systematically investigate and validate this perception. Deep learning models like LSTM have greatly improved sequential data forecasting, but their success depends on large labeled datasets, limiting their effectiveness in data-scarce domains. This study investigates whether complex ML models offer significant advantages over simpler approaches in predicting seasonal streamflow in Canada. Using a comprehensive case study, we examine multiple subbasin types—mountain, prairie, and non-prairie—along with headwater and downstream locations, exhibiting both natural and human-influenced regulated flow regimes. These variations introduce distinct hydrological behaviors, making them an ideal testbed for assessing model complexity requirements. Our case study includes 135 subbasins from the Canadian Nelson-Churchill River Basin, comprising the vast area starting from the Rocky mountains up to the Hudson Bay, with the monthly temporal resolution and spatial scales of the order of 200 km2 to ~1.0 x10⁶ km2, as reflected by drainage areas of all subbasins.

We implemented a suite of ML techniques, ranging from traditional algorithms to advanced DL architectures. Specifically, we compared models developed based on Artificial Neural Networks (ANNs), Random Forests (RF), Long Short-Term Memory (LSTM) networks, attention-based LSTM networks, and stacked LSTM configurations. Each model was trained and tested using historical flow data across multiple subbasins, with performance evaluated through metrics, such as Nash-Sutcliffe Efficiency and Percent Mean Bias Error. We also experimented with alternative sets of input features, i.e., (i) all potential hydrometeorological inputs, (ii) correlation and partial mutual information-based inputs, and (iii) causality-based inputs.

Our findings reveal that while simpler models like RF and ANNs perform adequately in certain contexts—particularly in headwater subbasins with natural flow regimes—complex architectures, such as LSTM and stacked LSTM configurations demonstrate superior performance for downstream and regulated basins, where flow patterns exhibit higher variability and nonlinearity. In contrast, attention-based LSTM networks do not appear to outperform other options across certain basins. Interestingly, the benefits of DL models are not uniform across all subbasin types; prairie and non-prairie basins show mixed results, suggesting that model complexity should be tailored to basin characteristics rather than universally applied. These results highlight the importance of context-driven model selection to inform operational forecasting. Thus, water managers can leverage simpler models in less complex basins to reduce computational costs and data requirements, while reserving advanced architectures for highly regulated or downstream basins where accuracy gains justify the added complexity. This approach can potentially optimize resource allocation, enhance forecast reliability, and support informed decision-making in water allocations, reservoir operations, and drought/flood preparedness. Additionally, in the absence of data and computational constraints, multi-model outputs can be synthesized further through fusion modelling techniques to enhnace overall prediction accuracy.

How to cite: Elshorbagy, A., Nguyen, D.-H., Khaliq, M. N., Unduche, F., and Akhtar, M. K.: Do We Need Deep Learning Models? Assessing the Complexity of Machine Learning Models for Seasonal Streamflow Forecasting Across Diverse Subbasins, EGU General Assembly 2026, Vienna, Austria, 3–8 May 2026, EGU26-8281, https://doi.org/10.5194/egusphere-egu26-8281, 2026.

EGU26-8326 | ECS | Orals | HS3.1

A stacking ensemble machine learning framework with terminal bias correction for flood prediction 

Xinyu Chang, Jun Guo, Tianlong Jia, Hui Qin, and Yi Liu

The accuracy and robustness of flood forecasting have long been constrained by model structural uncertainties and runoff generation mechanisms. Single hydrological models or machine learning approaches not only show limited performance improvements but also struggle to achieve balanced simulation of both high-flow and low-flow processes. To address this, this study proposes for the first time a stacking ensemble machine learning framework (TBC-SEML) that integrates multi-model state awareness, terminal bias correction, and interpretability analysis. The framework leverages classical hydrological models (GR4J, HYMOD, SIMHYD) to acquire multi-model state datasets, establishing comprehensive evaluation metrics (NPCEM) as the optimization objective to enhance capture of high-flow processes. Furthermore, this study innovatively proposes a terminal bias correction based on Auto-Regressive with Extra Inputs and Weighted Least Square (ARX-WSL), and the excessive dominance of flood peak on weight estimation is suppressed by the flow attenuation coefficient β. Building on this, eight types of base learners are integrated, including Random Forest (RF), ExtraTrees, XGBoost, LightGBM and CatBoost, Multilayer Perceptron (MLP), Support Vector Regression (SVR), and K-Nearest Neighbors (KNN). Bayesian methods are used to optimize the hyperparameters of the base learners, and a meta-learner is constructed based on linear regression. Meanwhile, the SHAP interpretability analysis method is introduced to quantify the predictive contributions of base learners and state variables, enhancing model transparency. This highly diverse and heterogeneous stacking ensemble framework not only enhances the complementarity among base learners but also achieves good synergy between accuracy, stability, and interpretability, providing a new paradigm for intelligent hydrological forecasting that combines high performance and transparent decision support.

How to cite: Chang, X., Guo, J., Jia, T., Qin, H., and Liu, Y.: A stacking ensemble machine learning framework with terminal bias correction for flood prediction, EGU General Assembly 2026, Vienna, Austria, 3–8 May 2026, EGU26-8326, https://doi.org/10.5194/egusphere-egu26-8326, 2026.

EGU26-8478 | ECS | Posters on site | HS3.1

Integration of Temporal Meteorological and Geospatial Data for Flood Susceptibility Modelling in Canada using a Hybrid CNN-ConvLSTM Model 

Karen Elaine Dunbar, Heather McGrath, and Usman Khan

Flooding is the costliest disaster in Canada, yet traditional flood susceptibility modelling is computationally expensive for large-scale applications and often relies on static geospatial features while excluding temporal antecedent conditions. This study uses the Canadian Flood Archive maintained by Natural Resources Canada (NRCan) to develop a large-scale flood susceptibility model for Canada's major drainage areas. The model integrates static terrain derivatives, dynamic climate variables, and semi-static geospatial variables using a hybrid Convolutional Neural Network-Convolutional Long Short-Term Memory (CNN-ConvLSTM) framework. The Canadian Medium Resolution Digital Elevation Model (MRDEM) was used to derive geospatial features, including height above nearest drainage (HAND), Euclidean distance to rivers (EUC), slope, aspect, topographic position index (TPI), and terrain ruggedness index (TRI). Semi-static geospatial variables include land cover (available every 5 years) and the annual normalized difference vegetation index (NDVI), which were temporally matched to each historical flood event. The static and semi-static features were coupled with Daymet meteorological data (precipitation, temperature extremes, snow water equivalent) spanning 1–3-month antecedent windows. The performance of the 2D hybrid CNN-ConvLSTM model will be compared with an Extreme Gradient Boosting (XGBoost) baseline. While XGBoost has performed well in prior research, the hybrid CNN-ConvLSTM is hypothesized to offer superior interpretability of flooding mechanisms. By leveraging the temporal sequence of meteorological drivers, the model captures complex spatiotemporal dependencies that traditional machine learning methods cannot. A preliminary sensitivity analysis of temporal sequence lengths (1-3 months) and resampling ratios (0.1-0.7) showed that the CNN-ConvLSTM architecture achieved the highest predictive accuracy (F1 = 0.89) with a 3-month sequence length and a resampling ratio of 0.5. These initial findings suggest that capturing the full spring snowmelt-to-rainfall cycle is critical for flood susceptibility mapping in Canadian watersheds.

How to cite: Dunbar, K. E., McGrath, H., and Khan, U.: Integration of Temporal Meteorological and Geospatial Data for Flood Susceptibility Modelling in Canada using a Hybrid CNN-ConvLSTM Model, EGU General Assembly 2026, Vienna, Austria, 3–8 May 2026, EGU26-8478, https://doi.org/10.5194/egusphere-egu26-8478, 2026.

EGU26-8757 | ECS | Orals | HS3.1

Hydrologically constrained genetic programming for interpretable rainfall–runoff model discovery 

Naila Matin, Viraj Vidura Herath Herath Mudiyanselage, Abhishek Saha, Lucy Marshall, and Vladan Babovic

Data-driven rainfall–runoff models often deliver high predictive skill but provide limited insight into hydrological processes. Classic conceptual models, by contrast, are transparent and process-based but rely on a limited collection of empirically designed structures, so choosing and adapting an appropriate model across diverse catchments remains difficult. To bridge this gap, this study explores a hydrologically constrained genetic-programming (GP) framework that automatically discovers basin-specific conceptual model structures from a shared library of hydrological building blocks. Model structures are assembled from modular storages, flux functions, and routing components adapted from the Modular Assessment of Rainfall–Runoff Models Toolbox (MARRMoT) [1], which assembles and standardizes the storage and flux formulations of 47 established conceptual models. GP, an evolutionary algorithm, is then used to operate on structural flags and parameter values, selecting and combining these components into explicit model equations. Each candidate’s reservoir system is then assembled automatically and advanced with a mass-conserving implicit time-stepping scheme. Calibration uses a multi-objective NSGA-II algorithm, so structural choices and parameters are explored within a single optimization loop.

The framework is evaluated on CAMELS-US basins through three experiments. In a snow-dominated mountain catchment (Buffalo Fork, 13011900), the discovered structure reproduces the snowmelt-driven regime and flow-duration curve in the test period with high efficiency (held-out test period NSE ≈ 0.85). Uncertainty analyses indicate that a snow–soil–single-routing backbone is consistently retained. A transfer experiment to a hydrologically similar basin (Johnson Creek, 13313000) shows that directly reusing the Buffalo Fork structure and parameters already yields useful skill (NSEtest ≈ 0.72), while a short “hot-start” GP run seeded with this transferred solution can reach NSEtest ≈ 0.84, capturing most of the benefit of a much longer optimization (~40× fewer generations, at a small fraction of the computational cost). To evaluate the framework in a broader hydro-climatic context, it is benchmarked against the conceptual and LSTM rainfall–runoff models from the CAMELS benchmark study by Kratzert et al. [2]. We use 18 representative CAMELS-US basins (one medoid per HUC-2 region), asking the system to self-evolve a distinct model structure tuned to the hydro-climate of each basin from the same shared component library. In this multi-basin setting, the GP-derived models achieve a median NSEtest of about 0.70, generally match or exceed the conceptual benchmarks, and remain competitive with the LSTM variants. The results indicate that hydrologically constrained automated model discovery can help narrow the accuracy-interpretability trade-off, yielding transparent, physically consistent rainfall-runoff models and suggesting a potential path toward structure transfer in data-sparse or ungauged basins.

[1] L. Trotter, W. J. M. Knoben, K. J. A. Fowler, M. Saft, and M. C. Peel, “Modular Assessment of Rainfall–Runoff Models Toolbox (MARRMoT) v2.1: an object-oriented implementation of 47 established hydrological models for improved speed and readability,” Geosci. Model Dev., vol. 15, pp. 6359-6369, 2022.

[2] F. Kratzert, D. Klotz, G. Shalev, G. Klambauer, S. Hochreiter, and G. Nearing, “Towards learning universal, regional, and local hydrological behaviors via machine learning applied to large-sample datasets,” Hydrol. Earth Syst. Sci., vol. 23, pp. 5089-5110, 2019.

How to cite: Matin, N., Herath Mudiyanselage, V. V. H., Saha, A., Marshall, L., and Babovic, V.: Hydrologically constrained genetic programming for interpretable rainfall–runoff model discovery, EGU General Assembly 2026, Vienna, Austria, 3–8 May 2026, EGU26-8757, https://doi.org/10.5194/egusphere-egu26-8757, 2026.

EGU26-9281 | ECS | Posters on site | HS3.1

 A Physics-Informed Machine Learning Method for Long-Term Hydropower Output Simulation and Scheduling 

Zhenzhen Liu, Pan Liu, and Lei Cheng

Accurate simulation of hydropower output characteristics is a prerequisite for optimizing long-term reservoir scheduling. However, traditional empirical formulas often fail to capture the complex non-linear relationships between hydraulic head, turbine discharge, and power output, while purely data-driven models lack adherence to physical laws. This paper proposes a Physics-Informed Machine Learning (PIML) method that couples physical prior knowledge with data-driven modeling. By embedding strictly defined physical constraints—specifically dynamic head-dependent capacity limits, hydraulic monotonicity, and tailwater elevation effects—into the loss function of a Deep Neural Network (DNN), the proposed model guarantees physically consistent predictions. The PIML model is further integrated as a high-fidelity surrogate into a long-term scheduling optimization model solved by Particle Swarm Optimization (PSO). Case studies on the Shuibuya Hydropower Station demonstrate that the PIML method achieves high simulation accuracy with an RMSE of 12.25 MW and zero physical violations. Furthermore, under identical hydrological conditions, the PIML-based scheduling strategy increases annual power generation by 4.72% and reduces the water consumption rate by 4.50%, effectively identifying high-efficiency operating zones compared to traditional methods.

How to cite: Liu, Z., Liu, P., and Cheng, L.:  A Physics-Informed Machine Learning Method for Long-Term Hydropower Output Simulation and Scheduling, EGU General Assembly 2026, Vienna, Austria, 3–8 May 2026, EGU26-9281, https://doi.org/10.5194/egusphere-egu26-9281, 2026.

EGU26-9368 | ECS | Posters on site | HS3.1

A graph-theoretic framework for the systematic representation and generation of conceptual hydrological model structures 

Jonas Wischnewski, Niels Schütze, and Thomas Wöhling

The development of transparent and trustworthy hydrological modes requires careful attention to the choices made throughout the modeling process, including the assumptions made about the model structure. However, the structures of conceptual models are often defined indirectly through equations and the code implementation. This limits reproducibility, comparability and transparency of its structural assumptions. Moreover, the is currently no consistent unifying framework that represents the multitude of conceptual model structures found in hydrological modeling literature, making systematic analysis and comparison difficult. 

We introduce a graph-theory based framework for explicitly and coherently representing conceptual model structures, where model compartments are represented as nodes and fluxes as directed edges. This allows mode structures to be defined independently of specific process formulations, while mass balance equations are derived directly from the graphs topology, ensuring consistent balances across all model compartments.

Representing conceptual model structures in an algebraic graph form, also allows to compare, analyze and manipulate in a ways that is difficult to achieve with pure equation-based representations. Graph and matrix encoding allows us to enumerate, compare and modify model structures in a controlled way, enforcing explicit constraints like hydrological plausibility, connectivity and closure. This representation forms a theoretical foundation for flexible and multi-model hydrological frameworks, allowing for the construction, testing and communication of different model hypotheses in a consistent way. Additionally, the graph-based representation support harmonious and unambiguous visual depictions of conceptual model structures, strengthening communication of modelling assumptions alongside their mathematical formulation. 

Using examples of watershed models, we illustrate how conceptual models correspond to specific graph and matrix configurations and how structural differences are reflected in the resulting system of ordinary differential equations. In particular, we show that the incidence matrix provides a direct algebraic mapping between hydrologic model structure and the governing system of ordinary differential equations, where state derivatives are obtained as the balance of incoming and outgoing fluxes associated with each node. Moreover, we demonstrate how the graph–matrix representation can be used to systematically sample a space of candidate model structures by permuting adjacency matrices under predefined structural constraints. Invalid or implausible structures are excluded through rule-based filtering, yielding a structured yet unconstrained exploration of the admissible model space. 

How to cite: Wischnewski, J., Schütze, N., and Wöhling, T.: A graph-theoretic framework for the systematic representation and generation of conceptual hydrological model structures, EGU General Assembly 2026, Vienna, Austria, 3–8 May 2026, EGU26-9368, https://doi.org/10.5194/egusphere-egu26-9368, 2026.

Bangladesh is disaster-prone due to its location, heavy monsoon rainfall, and frequent cyclones, with floods causing major loss of life and property. Accurate and timely flood forecasting and warning systems are essential to reduce flood-related damage and human suffering. Currently, the national flood forecasting system provides reasonably accurate predictions only for short lead times of up to three days (FFWC, 2021). Improving medium to long range flood forecasting with lead times of 5–10 days is therefore critical for enhanced flood preparedness.

This study investigates artificial intelligence-based approaches for medium-range river flow forecasting with a five-day lead time at Hardinge Bridge station in the Ganges basin. Multiple input variables, including precipitation, precipitable water, soil moisture storage, and satellite-derived river water levels, were used. Artificial Neural Network (ANN), Support Vector Machine (SVM), Random Forest (RF), and Gradient Boosting Machine (GBM) algorithms were applied to simulate river water level as an alternative to traditional hydrologic model-based forecasting. Predictions were evaluated against the Bangladesh Water Development Board’s Flood Forecasting and Warning Centre (FFWC).

For each algorithm, 70% of data were used for training, 15% for testing, and 15% for independent validation. Various input combinations, or model scenarios, were examined. The scenario including all variables performed best. Among algorithms, Random Forest showed superior performance, with RMSE of 0.28 m, a coefficient of determination (R²) of 0.99, and a Nash Sutcliffe Efficiency (NSE) of 0.99. Upon evaluating the R² value by comparison in a percentage scale, it was observed that best RF model of scenario-01 demonstrated an improvement of approximately 38% over FFWC's Prediction of water level.

This research establishes that the machine learning algorithms, particularly RF, offers a promising alternative to traditional flood forecasting methods, with significant accuracy in predicting water level at Hardinge bridge station in the Ganges basin.  Its capacity to use satellite-derived data improves flood forecasting and leads to more reliable predictions, potentially improving flood preparedness and risk management in Bangladesh.

How to cite: Mahmud, Md. A. and Hossain, Md. B.: Five Days Lead Time Water Level Forecasting in the Ganges–Padma River Using Satellite and Reanalysis Data with Machine Learning, EGU General Assembly 2026, Vienna, Austria, 3–8 May 2026, EGU26-9860, https://doi.org/10.5194/egusphere-egu26-9860, 2026.

EGU26-10180 | ECS | Orals | HS3.1

Fast and uncertainty-aware super-resolution of compound flooding using latent diffusion models 

Viraj Vidura Herath Herath Mudiyanselage, Abhishek Saha, Sanka Rasnayaka, and Lucy Marshall

Upscaling coarse-grid flood maps to achieve fine-grid accuracy using machine learning has emerged as a promising hybrid pathway for operational flood mapping, as fine-grid hydrodynamic models remain computationally prohibitive for real-time and ensemble-based applications. In this context, latent diffusion models (LDMs), a class of generative AI models, have recently demonstrated superior accuracy and generalisability in flood map super-resolution. However, despite their inherently stochastic nature, it remains unclear to what extent LDM-generated ensembles provide meaningful representations of predictive uncertainty in flood depth estimates.

In this study, we develop a conditional latent diffusion framework to generate fine-grid high-resolution flood depth maps using coarse-grid flood simulations and digital elevation models (DEMs) as conditioning inputs. The approach is demonstrated for a coastal floodplain near Tacloban, Philippines, which is subject to complex compound flooding driven by inland rainfall and storm surge. Hydrodynamic simulations are performed using a subgrid-based shallow water solver. The coarse-grid model contains approximately 95 times fewer computational cells than the fine-grid model and executes around 188 times faster, albeit with reduced accuracy (pixel-wise RMSE of 81.2 cm for maximum flood depth map).

Fine-grid model outputs are treated as deterministic ground truth, allowing uncertainty arising solely from the stochastic behaviour of the LDM to be isolated. By repeatedly sampling the trained model for identical inputs (up to 100 stochastic runs), we systematically evaluate accuracy–uncertainty–cost trade-offs using RMSE and pixel-wise 90% confidence interval (CI) coverage of flood depths.

Results show that individual stochastic predictions substantially improve upon the coarse-grid baseline but exhibit notable variability, with RMSE ranging between approximately 19–24 cm (Figure 1). Ensemble averaging rapidly enhances accuracy, with ensemble-mean RMSE converging within 20–40 runs, yielding 26–14 times speed-up compared to fine-grid hydrodynamic simulations. However, despite increasing ensemble size, empirical 90% CI coverage stabilises at around 70%, indicating systematic under-capture of uncertainty. Increasing the number of reverse diffusion steps from 500 to 1000 does not significantly alter this behaviour (Figure 2) suggesting that uncertainty limitations are not driven by insufficient sampling resolution.

Further analysis indicates that uncertainty under-representation arises from overly strong conditional signals learned during training rather than ensemble size. Introducing controlled stochastic perturbations (Figure 2), into the latent representation of coarse-grid flood maps at inference time increases ensemble spread and substantially improves CI coverage, reaching approximately 86% for a noise factor of 0.2, while only marginally increasing RMSE (~0.3 cm).

The study highlights three key insights: (i) stochastic LDM ensembles provide a practical balance between accuracy and computational efficiency for operational flood mapping; (ii) increasing ensemble size alone yields diminishing returns for uncertainty representation under strong conditioning; and (iii) future research should focus on incorporating uncertainty-aware conditioning during training and leveraging advanced diffusion solvers to further reduce inference cost. Together, these findings establish a principled pathway toward fast, uncertainty-aware flood inundation modelling using generative AI.

Figure 1: Accuracy–uncertainty–cost trade-off.

Figure 2: Uncertainty coverage–accuracy trade-off.

How to cite: Herath Mudiyanselage, V. V. H., Saha, A., Rasnayaka, S., and Marshall, L.: Fast and uncertainty-aware super-resolution of compound flooding using latent diffusion models, EGU General Assembly 2026, Vienna, Austria, 3–8 May 2026, EGU26-10180, https://doi.org/10.5194/egusphere-egu26-10180, 2026.

EGU26-10651 | ECS | Orals | HS3.1

Uncertainties in differentiable parameter learning calibration 

Bram Droppers, Marc F.P. Bierkens, and Niko Wanders

Recently, differentiable parameter learning was presented as a deep-learning calibration method that estimates transfer relationships between physical characteristics and calibration parameters (Tsai et al., 2021). Such methods are especially important for large-scale hydrological models, as these transfer relationships allow for estimating consistent and seamless parameter fields in regions without observations. Although parameter learning calibration is shown to efficiently improve the simulation performance, the uncertainties related to this approach are poorly understood.

Our study distinguishes and quantifies the various sources of parameter learning calibration uncertainties with a structured set of calibration experiments using a synthetic dataset generated with a physically based global hydrological model. As the “true” parameters are known in each experiment, our study can distinguish and quantify uncertainties related to: the transfer function form, deep-learning surrogate gradient transfer, deep-learning surrogate performance, geographical bias in available observations, and non-uniqueness.

Our results show that the parameter learning calibration approach is robust under a wide range of possible transfer function forms, gradient transfer through a deep-learning surrogate model, and geographical biases in available observations. In addition, parameter learning calibration is somewhat robust non-uniqueness issues. However, parameter learning is most sensitive to errors in the deep-learning surrogate model's predictions or, conversely, the observations. Moreover, estimated parameters improve the simulation performance even when they are erroneous, indicating better results for the wrong reasons.

Our study highlights the significant potential of deep learning to understand and extrapolate relationships from potentially limited observational data. However, when using the parameter learning calibration approach, care should be taken to select the appropriate parameters and introduce some form of regularization to avoid unrealistic parameterizations.  

References

Tsai, W. P., Feng, D., Pan, M., Beck, H., Lawson, K., Yang, Y., ... & Shen, C. (2021). From calibration to parameter learning: Harnessing the scaling effects of big data in geoscientific modeling. Nature communications12(1), 5988.

How to cite: Droppers, B., Bierkens, M. F. P., and Wanders, N.: Uncertainties in differentiable parameter learning calibration, EGU General Assembly 2026, Vienna, Austria, 3–8 May 2026, EGU26-10651, https://doi.org/10.5194/egusphere-egu26-10651, 2026.

EGU26-10817 | Posters on site | HS3.1

Deep Learning-Based Segmentation of Land Drainage Systems from High-Resolution Aerial Imagery 

Štěpán Marval, Tomáš Princ, and Lucie Poláková

Approximately 30% of the agricultural land in the Czech Republic (around 1 million hectares) has been drained, which significantly affects the water regime and water availability in the landscape. The largest expansion of agricultural drainage systems occurred during the communist and socialist era, particularly between the 1950s and 1980s. Old paper project documentation for these systems has often not been preserved, archival records are highly fragmented, and many existing plans do not correspond to the actual implementation.

Accurate mapping of drainage systems is essential for understanding detailed hydrological processes in the landscape, as well as for designing measures to mitigate their negative impacts. Automatic detection of drainage systems represents an important step toward comprehensive mapping of functional drainage structures. Traditional approaches based on manual interpretation of aerial imagery are time-consuming and practically infeasible for large areas. Therefore, the presented project proposes and tests a method using convolutional neural networks for the segmentation of drainage lines from high-resolution aerial imagery. The aim is to assess the potential of up-to-date machine learning techniques for automated extraction of drainage systems in landscapes with varying vegetation cover.

A critical component of the workflow is the preparation of training data, including manual annotation of drainage lines, creation of mask layers, and data augmentation to enhance model generalization. Preliminary results will be presented, including segmentation examples and discussion of key limitations, such as sensitivity to vegetation cover.

Segmentation is implemented using the U-Net architecture, widely applied for pixel-level classification tasks in geosciences. The encoder is based on ResNet34, enabling hierarchical feature extraction and improving robustness to texture and illumination variability in aerial imagery. The implementation was carried out in PyTorch using the Segmentation Models PyTorch library. Skip connections between corresponding levels ensure preservation of spatial details and accurate localization of linear structures typical of drainage systems.

Results indicate that deep neural networks significantly accelerate and improve the accuracy of drainage feature identification, opening new possibilities for various landscape analyses, incl. hydrology, agricultural management, landscape planning, nature protection etc. Future work will focus on expanding the training dataset, optimizing hyperparameters, and validating the model on a large set of aerial images.

How to cite: Marval, Š., Princ, T., and Poláková, L.: Deep Learning-Based Segmentation of Land Drainage Systems from High-Resolution Aerial Imagery, EGU General Assembly 2026, Vienna, Austria, 3–8 May 2026, EGU26-10817, https://doi.org/10.5194/egusphere-egu26-10817, 2026.

EGU26-11233 | ECS | Orals | HS3.1

Introducing earthkit-hydro: an efficient graph-based library for scalable hydrological modelling and analysis 

Oisín M. Morrison and Corentin Carton de Wiart

Although numerical representations of river networks are fundamental to hydrological modelling and analysis, their performant and flexible use remains challenging due to inherent spatial dependencies and graph-based structure. Many existing tools are constrained by limited computational efficiency and a lack of support for diverse river network formats. This makes it difficult to compare and analyse data and model outputs from multiple sources.

To address these limitations, we present earthkit-hydro, the hydrological component of ECMWF’s earthkit software for Earth system science workflows. Earthkit-hydro provides a unified interface for operations on river networks, including accumulations, catchment-level statistics, catchment delineation, distance calculations, and computing topological properties. The library supports a wide range of river network formats, including bifurcating river networks, and integrates with major Python array libraries such as NumPy, Xarray, PyTorch, and JAX. In addition, earthkit-hydro is well suited for machine-learning applications, offering GPU support and differentiable operations.

We also present an application to AIFL, ECMWF’s global machine-learning model for streamflow prediction. In this context, earthkit-hydro provides an efficient way of processing ECMWF’s meteorological forecasts by transforming meteorological variables into the catchment-based metrics required as input by AIFL.

How to cite: Morrison, O. M. and Carton de Wiart, C.: Introducing earthkit-hydro: an efficient graph-based library for scalable hydrological modelling and analysis, EGU General Assembly 2026, Vienna, Austria, 3–8 May 2026, EGU26-11233, https://doi.org/10.5194/egusphere-egu26-11233, 2026.

EGU26-11460 | ECS | Posters on site | HS3.1

River system understanding through machine learning in Digital Twins 

Jan Olsman, Joshua Johnson, Ville Mäkinen, and Eliisa Lotsari

There is a fast development in technical solutions for water management. Digital Twins are among these fast-developing technologies, offering a platform for scientists, policy makers, and other stakeholders to exchange knowledge. However, the Digital Twins require also efficient hydrological information gain. New measurement techniques are causing a rapid growth of data, often resulting in scattered or incomplete datasets. Machine learning can be used to detect patterns, identify relations between variables, and fill data gaps. Typically, machine learning needs high-quality and long-term data for training. This is not always available, especially for variables that are obtained from short-term field campaigns.

This study explores traditional machine learning algorithms to optimize hydrological information gain from large datasets. Data from four study sites in three intensively studied Finnish rivers are used as a case study. The rivers are in the south, middle, and north of Finland and cover climatic conditions from boreal to sub-arctic. The approach involves the development of a simple application that enables users to gain maximum understanding with minimal user input. The main goals of the application are to detect patterns, recognize different river conditions and seasonality, fill data gaps, identify variable importance under different environmental conditions, and provide insights on variable relationships. The case study shows differences in seasonality, and therefore, differences in variable importance between the different rivers.

How to cite: Olsman, J., Johnson, J., Mäkinen, V., and Lotsari, E.: River system understanding through machine learning in Digital Twins, EGU General Assembly 2026, Vienna, Austria, 3–8 May 2026, EGU26-11460, https://doi.org/10.5194/egusphere-egu26-11460, 2026.

EGU26-12509 | ECS | Posters on site | HS3.1

Non-parametric multidimensional uncertainty estimation employing a hybrid approach 

Rui Marinheiro and José Pedro Matos

A good understanding of uncertainty is of paramount importance in the hydrological sciences, notably in streamflow prediction. Over recent decades, hydroinformatics has played a key role in advancing hydrological prediction through the exploration of physically inspired and conceptual models and data-driven approaches. In particular, machine learning (ML) models demonstrate strong predictive skills. Despite this, limited interpretability and potentially weak extrapolation under extreme conditions remain major disadvantages of ML applications [1,2].

To address these limitations, a hybrid framework that combines conceptual hydrological modelling with machine learning–based probabilistic forecasting is proposed. The  so-called Generalized Pareto Uncertainty (GPU) framework can be used to train an ensemble of models (potentially physically based) so that it reliably reproduces the predictive uncertainty of the output [3]. In this case, GPU is employed with the conceptual HYdrological Predictions for the Environment (HYPE) model. By embedding hydrological knowledge into a data-driven uncertainty framework, the proposed approach seeks to improve robustness, generalization, and physical consistency of streamflow forecasts.

GPU relies on finding a multi-objective optimal surface (something akin to a double Pareto surface) that selects model parameters that span the full range of exceedance of simulations—at the extremes, forcing some models to always underpredict and others to always overpredict—while simultaneously searching for optimal error metrics (e.g., Nash-Sutcliffe efficiency, King-Gupta efficiency, mean absolute error, etc.). One promising feature of the framework is that it is not constrained to one type of error metric or even two dimensions (exceedance and error metric), potentially even opening avenues for addressing equifinality challenges.

The methodology is applied to the Nabão and Douro river basin in Portugal, one basin in Sweden, and one in Ireland. The performance of three modelling strategies is compared: (i) a standalone conceptual model (HYPE), (ii) GPU combined with artificial neural networks (missing indirect foreknowledge about hydrological processes), and (iii) a hybrid approach that incorporates HYPE models as ensemble members. Results show that the inclusion of conceptual hydrological information leads to clear improvements in the quality of the predictive uncertainty estimates, including its resolution, reliability, and aggregate metrics (e.g., CRPS).

In this work, we clarify the concept behind GPU, demonstrate its results, address challenges, and discuss potential innovative applications.

[1] Baste, S., Klotz, D., Acuña Espinoza, E., Bardossy, A., & Loritz, R. (2025). Unveiling the limits of deep learning models in hydrological extrapolation tasks. Hydrology and Earth System Sciences, 29(21), 5871–5891. https://doi.org/10.5194/hess-29-5871-2025

[2] Nearing, G. S., Kratzert, F., Sampson, A. K., Pelissier, C. S., Klotz, D., Frame, J. M., Prieto, C., & Gupta, H. v. (2021). What Role Does Hydrological Science Play in the Age of Machine Learning? In Water Resources Research (Vol. 57, Issue 3). Blackwell Publishing Ltd. https://doi.org/10.1029/2020WR028091

[3] Matos, J. P., Hassan, M. A., Lu, X. X., & Franca, M. J. (2018). Probabilistic Prediction and Forecast of Daily Suspended Sediment Concentration on the Upper Yangtze River. Journal of Geophysical Research: Earth Surface, 123(8), 1982–2003. https://doi.org/10.1029/2017JF004240

How to cite: Marinheiro, R. and Matos, J. P.: Non-parametric multidimensional uncertainty estimation employing a hybrid approach, EGU General Assembly 2026, Vienna, Austria, 3–8 May 2026, EGU26-12509, https://doi.org/10.5194/egusphere-egu26-12509, 2026.

The transition from intermittent water supply (IWS) to continuous water supply (CWS) is a critical goal for global water security, but it continues to be hampered by the difficulty of precisely determining the resources required for 24-hour service. Traditional water audits are often designed for ideal systems with CWS and rely on static, annual, or system-wide water balances that fail to capture temporal variability. This study addresses Network Input Volume (NIV), which represents the daily amount of water delivered to consumers from the service reservoir supplying the city, and hours of supply (SH). By focusing on dynamic system behavior instead of static averages, this approach provides water companies with a more nuanced operational perspective for planning infrastructure transitions in data-scarce environments.

The methodology was applied to the Tillo district of Siirt, Turkey using service reservoir outlet data and recorded hours of supply from January to August 2023. To account for the network's inherent scholastic structure, we used regression analysis across bi-monthly periods, including both 95% confidence intervals and forecast bands. Our findings reveal a strong positive correlation between NIV and SH, but this varies considerably across seasons. For the March-April period, the adapted regression suggests a CWS threshold of approximately 600 m³/day. Specifically, the wider forecast range indicates that continuity could theoretically be ensured at values as low as 390 m³/day, whereas at 650 m³/day, at least 15 hours of supply is guaranteed.

As climatic demand increases towards the summer months, the model captured a significant increase in requirements. Extrapolations for the May-June and July-August periods showed that the CWS thresholds would rise to approximately 870 m³/day and 970 m³/day, respectively. However, the analysis also identified a critical hydraulic phenomenon: "compensatory flow". On days when water returned following periods of supply shortages, the system experienced temporarily elevated NIV values as it compensated for the previous deficit. This cumulative adjustment dynamic demonstrates that the relationship between input and supply is not merely instantaneous but is shaped by the system's memory of previous IWS cycles.

Consequently, this research shows that the seasonal and daily relationship between SH and NIV is another point to consider during the transition to CWS. This daily monitoring approach, which goes beyond annual balances and captures daily and seasonal variability, allows water companies to establish realistic metrics for the transition. Furthermore, these findings highlight the importance of integrated controls that account for both physical losses and human-induced demand shifts, providing a replicable model for improving urban water resilience in similar contexts worldwide.

How to cite: Yamac, E., Collins, R., and Speight, V.: Determining Minimum Network Input Volume for The Transition from Intermittent Water Supply (IWS) To Continuous Water Supply (CWS): A Seasonal Analysis of Supply Hours in Tillo, Turkey, EGU General Assembly 2026, Vienna, Austria, 3–8 May 2026, EGU26-13718, https://doi.org/10.5194/egusphere-egu26-13718, 2026.

EGU26-13951 | ECS | Posters on site | HS3.1

Let the data speak: Catchments as non-autonomous dynamical systems via a modulated storage–discharge function 

Sergio Callau Medrano, Wolfgang Nowak, Sergey Oladyshkin, and Jochen Seidel
Physics-based hydrological models frequently estimate subsurface fluxes and storage behaviour in catchments from limited observations. As a result, simulations rely on oversimplified, static descriptors of subsurface processes. To address those limitations, data-driven approaches emerge as an alternative; nevertheless, many of these methods either rely on restrictive assumptions -such as discharge depends solely on storage derived from recession periods- or represent the internal state of the catchments implicitly, without an interpretable characterisation of the storage-discharge dynamics. Here, we introduce a data-driven framework for rainfall-runoff modelling that represents catchments as non-autonomous dynamical systems using a modulated discharge-storage sensitivity function. The approach implements the recession-based sensitivity function proposed by Kirchner (2009), which characterises the baseline drainage behaviour of groundwater-dominated catchments. In our formulation, the derived recession-based function serves as a limiting reference constraining a dynamic storage-discharge sensitivity function that is continuously modulated by net atmospheric forcing through an explicit state-forcing relationship. As a result, the storage-discharge relationship varies with different hydro-meteorological conditions and returns to the recession-based formulation when atmospheric forcings are negligible relative to the discharge. Our framework accounts for changes in the dynamical structure of watersheds during rising and recession periods without requiring calibration parameters and is primarily applicable to catchments where discharge is controlled by their storage-state dynamics. Initial tests show that our framework captures forcing-dependent variations in storage-discharge sensitivity functions and provides additional diagnostic insight into catchment behaviour during rising limbs and recession. Ongoing work evaluates the robustness of different hydro-climatic settings and explores the method’s potential to characterise storage-forcing interactions in groundwater-dominated catchments.

How to cite: Callau Medrano, S., Nowak, W., Oladyshkin, S., and Seidel, J.: Let the data speak: Catchments as non-autonomous dynamical systems via a modulated storage–discharge function, EGU General Assembly 2026, Vienna, Austria, 3–8 May 2026, EGU26-13951, https://doi.org/10.5194/egusphere-egu26-13951, 2026.

EGU26-15537 | ECS | Orals | HS3.1

Urban Precipitation Estimation Using GOES-16 Infrared Observations and Random Forest Models 

Luisa Alfaro Valencia, Sergio Arturo Rentería Guevara, René Lobato Sánchez, and Sergio Alberto Monjardín Armenta

Accurate precipitation estimation is fundamental for the analysis of hydrological processes, especially in urban areas with limited rain-gauge networks. The objective of this study was to develop two models based on the Random Forest (RF) algorithm for the detection of rainy and non-rainy days and for the estimation of daily precipitation during the wet season in the city of Culiacán, Sinaloa, Mexico. For this purpose, in situ meteorological station data and variables derived from images from the GOES-16 geostationary satellite were used, employing only spectral bands available 24 hours a day, specifically bands 7, 9, 13, 14, and 15. As part of the preprocessing stage, a parallax correction and a temporal adjustment were performed to harmonize the different data sources. Additionally, a prior classification of the days under analysis was implemented to reduce the radiometric heterogeneity of the training dataset. According to the main results, the rainfall detection model showed satisfactory performance, with an accuracy of 88%, a sensitivity of 86%, and a specificity of 89%, indicating an adequate ability to identify the presence and absence of precipitation. In turn, the precipitation estimation model achieved a correlation coefficient (R) of 0.74, a mean absolute error (MAE) of 6.59 mm, and an RMSE of 14.26 mm, demonstrating a good capacity to capture temporal variability, although with a tendency to overestimate intense events. The variable importance analysis showed that infrared bands 13 (10.3 μm) and 14 (11.2 μm) dominate the estimation in most groups, while the band 7 (3.9 μm) band becomes more relevant in events associated with microphysical processes. In conclusion, the integration of GOES-16 data and machine learning models have shown to be a viable alternative for complementing precipitation information in urban areas with scarce rain-gauge instrumentation; however, its application to other regions or periods requires model retraining.

How to cite: Alfaro Valencia, L., Rentería Guevara, S. A., Lobato Sánchez, R., and Monjardín Armenta, S. A.: Urban Precipitation Estimation Using GOES-16 Infrared Observations and Random Forest Models, EGU General Assembly 2026, Vienna, Austria, 3–8 May 2026, EGU26-15537, https://doi.org/10.5194/egusphere-egu26-15537, 2026.

Spatiotemporal Characteristics of Precipitation and Drought Variability in Taiwan Using Multi-dimensional Complementary Ensemble Empirical Mode Decomposition


Abstract

Most time series observed in natural systems are nonlinear and nonstationary, particularly under the influence of climate change. Taiwan has experienced increasingly frequent drought events in recent decades. Droughts are characterized by their gradual development, cumulative impacts, and lack of clear early warning signals, which makes their detection and analysis challenging.


To address these issues, this study applies Multi-dimensional Complementary Ensemble Empirical Mode Decomposition (MCEEMD) to analyze long-term temperature and precipitation data in Taiwan from 1960 to 2023. MCEEMD is an effective time–frequency analysis method designed for nonlinear and nonstationary time series. It enables the decomposition of multi-dimensional signals into a set of Intrinsic Mode Functions (IMFs), allowing both spatial and temporal characteristics of climate variables to be examined. Through these IMFs, meaningful instantaneous frequencies and long-term trends in the signals can be identified.


This study considers both stochastic and deterministic influences by reconstructing the IMFs into two components based on their autocorrelation coefficients. The relationships between temperature, precipitation variability, and drought-related characteristics are then examined, providing insights into the spatiotemporal behavior of drought events in Taiwan.


Key word: Multi-dimensional Complementary Ensemble Empirical Mode Decomposition(MCEEMD ),Intrinsic Mode Functions (IMFs)

How to cite: Tang, C.-H. and Tsai, C. W.: Spatiotemporal Characteristics of Precipitation and Drought Variability in Taiwan Using Multi-dimensional Complementary Ensemble Empirical Mode Decomposition, EGU General Assembly 2026, Vienna, Austria, 3–8 May 2026, EGU26-15993, https://doi.org/10.5194/egusphere-egu26-15993, 2026.

Accurate streamflow prediction remains challenging in monsoon-dominated basins characterized by extreme flow variability. This study evaluated three machine learning approaches for daily streamflow forecasting using 39 years of data (1980-2018) of the Basantpur station, Mahanadi basin, India from the CAMELS-India dataset which are (1) Optuna- optimized Genetic Programming (GP) for interpretable symbolic regression, (2) Optuna- optimized bidirectional LSTM networks, and (3) a novel GP-LSTM meta-learning framework that predicts optimal hyperparameters from time series statistical features.

Analysis of highly skewed flow distributions (97.66% of values <5,000 m³/s) using the False Nearest Neighbor method identified six-day embedding dimensions. For regular flow conditions without extreme outliers, the optimized LSTM achieved superior performance (NSE = 0.92, KGE = 0.93, R² = 0.92) compared to GP (NSE = 0.86, KGE = 0.87, R² = 0.86). However, GP demonstrated lower absolute errors (RMSE = 197.68 vs. 210.46 m³/s) and produced interpretable mathematical expressions that revealed lag-dependent hydrological relationships.

The meta-learning framework showed the best results when tested on complete datasets, including those with extreme events. By extracting thirty-two statistical features that cover central tendency, time-based autocorrelation, complexity measures, and spectral properties, the GP- based meta-model learns to predict the best LSTM configurations for different flow patterns. This flexible approach performed better on test data with outliers, showing improved predictions for rare but important flood events.

The results suggest that standard deep learning is effective in normal conditions. However, meta-learning frameworks, which adjust model structure based on flow characteristics, provide better reliability for operational flood forecasting in complex monsoon-influenced areas. This proposed hybrid meta-learning framework aims to combine the strengths of both methods. Our initial implementation, though, reveals challenges that need more effort.

How to cite: Singh, D. and Jothiprakash, V.: Streamflow Forecasting using Genetic Programming, LSTM, and Hybrid Meta-Learning GP-LSTM model in Monsoon-Dominated Basins, EGU General Assembly 2026, Vienna, Austria, 3–8 May 2026, EGU26-16415, https://doi.org/10.5194/egusphere-egu26-16415, 2026.

EGU26-16777 | ECS | Orals | HS3.1

Towards a Quality Management System for Flow Modelling: Integrating Uncertainty Analysis in Conceptual Development 

Fabian Knepper, Peter Oberle, and Mário J. Franca

Numerical flow models are essential tools in hydraulic engineering and form the basis for a wide range of planning and decision‑making processes. Rapid advances in data availability, modelling techniques, and computational power enable increasingly detailed simulations and appealing visualizations, yet this can also lead to overconfidence in the models and obscure errors, while also complicating the assessment of model robustness. Building on an earlier international survey highlighting the lack of standardized procedures in current practice, the DWA (German Association for Water, Wastewater and Waste) working group WW‑1.7 “Qualitätssicherung und -management beim Einsatz mehrdimensionaler Strömungsmodelle” is developing a structured quality management (QM) system for all participants in the process of flow modeling.

This contribution presents the first conceptual version of this QM system. A guiding design principle is the balance between comprehensive and in-depth quality assurance and the clearly expressed need for intuitive and time‑efficient tools. Requirements and expectations of different stakeholder groups are systematically incorporated into the framework to ensure broad acceptance and usability.

A central component of the development concept is a supporting uncertainty analysis designed to identify critical modelling processes that should be given special consideration in the quality management system. The approach aims to systematically assess how variations in data and key modelling parameters influence model outcomes and contribute to overall uncertainty. To this end, selected modelling processes are examined across several representative test cases. The results are used to refine the prioritization and structuring of QM components by indicating which modelling steps require enhanced quality assurance and documentation.

The development concept presented here provides insight into ongoing efforts toward a comprehensive and robust QM framework, with the aim of enhancing transparency, robustness, and reproducibility in hydraulic flow modelling and reducing the dependence of modelling quality on individual or institutional backgrounds.

How to cite: Knepper, F., Oberle, P., and Franca, M. J.: Towards a Quality Management System for Flow Modelling: Integrating Uncertainty Analysis in Conceptual Development, EGU General Assembly 2026, Vienna, Austria, 3–8 May 2026, EGU26-16777, https://doi.org/10.5194/egusphere-egu26-16777, 2026.

EGU26-17348 | Posters on site | HS3.1

On the information content of reservoirs’ storage and discharge for the predictability of one another 

Ali Nazemi and Amirhossein Mirdarsoltany

Mass balance equation is the fundamental governing equation that links reservoirs’ inflow, storage and discharge; yet, it remains unclear to what extent each component can be inferred from the others. This is particularly the case when considering large samples of reservoirs with wide range of capacities and operational purposes. Here, we use an entropy-based framework to investigate the predictability of reservoirs’ storage and discharge based on the information of content of one another. Using the time series data of inflow, storage, and discharge from 52 reservoirs across the globe, we treat mass balance with two parallel approaches. First, we examine how well discharge can be constrained by antecedent storage and inflow. Second, we assess the predictability of storage based on discharge and inflow. Marginal and conditional entropies are used to measure and quantify information flows from one variable to the other and to evaluate how much uncertainty is reduced when additional information is introduced. We apply this approach to observational data as well as simulated data obtained from reservoir algorithms. Our results reveal considerable variability in entropy measures across reservoirs and between the two approaches. The suggested framework can be considered as flexible and empirical means for assessing reservoir algorithms and for evaluating the role of data assimilation in improving reservoir simulations in hydrology and land-surface models.

How to cite: Nazemi, A. and Mirdarsoltany, A.: On the information content of reservoirs’ storage and discharge for the predictability of one another, EGU General Assembly 2026, Vienna, Austria, 3–8 May 2026, EGU26-17348, https://doi.org/10.5194/egusphere-egu26-17348, 2026.

EGU26-20702 | Orals | HS3.1

Reconstructing multi-decadal daily river water temperature in the Seine RiverBasin (France) with a bidirectional LSTM and basin-location embeddings 

Guillaume Metayer, Agnès Rivière, Damien Corral, Valérie Roy, and William Thomas

Long-term hydrological time series are essential for planning effective water-resource management strategies that balance competing water and energy uses and preserve ecosystem functioning. In particular, long-term large-scale surface water temperature (SWT) time series are crucial for enhancing understanding of climate change impacts and for quantifying uncertainties in the occurrence of critical periods affecting water and energy uses, as well as ecosystem balance. However, these datasets inevitably contain missing observations, and long-term data series with large spatial coverage remain scarce. Modeling approaches provide valuable tools for estimating surface water temperature dynamics when observations are missing. Owing to their low data requirements and fast computation times, statistically based approaches are well suited to large spatial scales, where physically based approaches often become impractical to apply. Among statistically based methods, recurrent neural networks, such as Long Short-Term Memory (LSTM) models, have recently shown considerable potential for time series imputation (Cao et al., 2018 https://doi.org/10.48550/arXiv.1805.10572; Che et al., 2018 https://doi.org/10.1038/s41598-018-24271-9) and for simulating hydrological variables, including SWT (e.g. Saadi et al., 2025 https://doi.org/10.5194/egusphere-2025-3393). The aim of the present work was to develop and assess an approach for reconstructing long-term SWT time series at the scale of a large river basin using an LSTM model. The study was conducted at the scale of the Seine River Basin, including nearly 80 monitoring stations providing daily SWT observations, and relied on continuous meteorological data from 1958 to 2025 derived from the SAFRAN system (Vidal et al., 2010 10.1002/joc.2003). The developed model was designed to simulate a one-year daily SWT sequence, considering both dynamic and static inputs. Dynamic inputs include one-year sequences of meteorological data and the daily SWT time series to be reconstructed, as well as masks used to identify missing values in the SWT input (Quian et al., 2024 arXiv:2405.17508v1). Static inputs include features characterizing the monitoring stations, such as hydrological (mean and low-flow discharges), geographical and meteorological features. The model architecture is composed of two sequential modules: (i) a bidirectional LSTM that encodes basin-scale temporal dynamics from dynamic inputs, and (ii) a multilayer perceptron that combines the LSTM’s final hidden states with a learned embedding representing the target monitoring station to generate the full annual SWT sequence. This approach enables the reconstruction of daily SWT across the basin over multiple decades, handling a wide range of missing-data situations - from sporadic gaps to entirely missing time series - by leveraging covariates and influential drivers, primarily meteorological factors.  

How to cite: Metayer, G., Rivière, A., Corral, D., Roy, V., and Thomas, W.: Reconstructing multi-decadal daily river water temperature in the Seine RiverBasin (France) with a bidirectional LSTM and basin-location embeddings, EGU General Assembly 2026, Vienna, Austria, 3–8 May 2026, EGU26-20702, https://doi.org/10.5194/egusphere-egu26-20702, 2026.

EGU26-20836 | ECS | Posters on site | HS3.1

TETRA – From Methodology to Operational Tools for Water-Based AI Projects  

Maximilian Zenner, Tobias Hellmund, Jürgen Moßgraber, Issa Hansen, Salvador Peña Haro, Divas Karimanzira, Linda Ritzau, Florence Le Ber, and Gaëlle Lortal

TETRA – From Methodology to Operational Tools for Water-Based AI Projects

Maximilian Zenner, Tobias Hellmund, Jürgen Moßgraber, Issa Hansen, Salvador Peña Haro, Divas Karimanzira, Linda Ritzau, Florence Le Ber, Gaëlle Lortal

Fraunhofer IOSB, Karlsruhe, Germany (maximilian.zenner@iosb.fraunhofer.de)

The development of efficient and interoperable tools for monitoring water resources remains essential to ensure the sustainable availability of this vital resource for both society and ecosystems. Recent events such as the fish die-off in the Oder River further emphasize the urgent need for improved river monitoring and protection strategies.

Building on work previously presented, the TETRA project aims to enable and accelerate the practical adoption of artificial intelligence (AI) in water management, while fostering a shared European AI ecosystem through close collaboration between German and French partners. To establish a harmonized approach, the project builds on the PAISE methodology for the development of AI-based products and adapts it to the domain of public water management.

Since the previous contribution, TETRA has progressed toward an operational data pipeline: SEBA contributes an automatic data pipeline for its in-situ measurement stations into the FROST server. The acquired datasets include velocity profiles and bathymetric measurements, which are accessed by the TETRA knowledge base and visualized through an interactive web application.

The application provides a map-based overview of sensor stations and a dedicated analysis view featuring 3D visualizations of velocity and bathymetry profiles (s. Figure 1), including filtering options such as water level and temporal range. Ongoing work focuses on refining the UI/UX to further support data exploration and expert-driven analysis.

Figure 1: 3D visualization of a river’s surface velocity profile over time

Initial experiments in AI-based analysis revealed that the currently available measurement data are not yet sufficient in volume to robustly train data-driven models. To address this limitation, synthetic datasets derived from numerical simulations are used as a first step to evaluate model behavior and feasibility. While not a substitute for real-world measurements, this approach provides initial insights and establishes a foundation for future integration of increasing amounts of real sensor data.

In parallel, significant progress has been achieved within the restoration use case: ICUBE has advanced ontology-driven methods for the automated population of a case-based reasoning knowledge base from unstructured texts using large language models, while THALES has developed a semantic search module enabling concept-based retrieval of multilingual restoration documents beyond keyword-based search.

This research has received funding from the BMBF’s (Bundesministerium für Bildung und Forschung) directive on the funding of Franco-German projects on the topic of artificial intelligence, Federal Gazette of 20th June 2022.

How to cite: Zenner, M., Hellmund, T., Moßgraber, J., Hansen, I., Peña Haro, S., Karimanzira, D., Ritzau, L., Le Ber, F., and Lortal, G.: TETRA – From Methodology to Operational Tools for Water-Based AI Projects , EGU General Assembly 2026, Vienna, Austria, 3–8 May 2026, EGU26-20836, https://doi.org/10.5194/egusphere-egu26-20836, 2026.

This study presents assessment of different types of water balances that exist within and in the surrounding of the crop using different methods like, 1) frequency analysis of crop specific growth threshold-based water balance; 2) field-scale vadose zone-based water balance. Moreover, a process-based crop water productivity modelling tool was also implemented with two distinct scenarios to simulate the working principle of Subsurface drainage system (SSDS) with CD approach along with adequate assumptions and knowledge of its limitations to simulate SSDS with CD approach for computation of climate and unsaturated soil zone-based fluxes of water balances. The process-based modelling tool also presents the quantification of the benefits to implement SSDS with Controlled Drainage (CD) approach in an agricultural case study field in the Northern Finland in terms of overall crop yield and the Crop Water Use Efficiency (CWUE). The modelling efforts with necessary calibration showed improved overall model performance to predict the crop yield that was measured using R2 and RMSE. The result of crop yield and CWUE was observed as improved on an average from 0.38 & 1.04 tons/ha to 0.92 & 0.40 tons/ha respectively for Scenario1 and from 0.38 & 1.04 tons/ha to 0.92 & 0.40 tons/ha respectively for Scenario2. 22 years average Crop water use efficiency (CWUE) for Scenario1 was observed on an overage of 2.25 kg/m3 and for Scenario2 was on an overage of 2.28 kg/m3. The field-scale vadose zone-based soil water balances were computed through the implementation of the finite difference techniques to govern the soil water fluxes and the equations governing the steady-state groundwater table management. Comprehensive in-situ data collected during 2021 -2022 cropping season and processed using machine learning techniques like multi-linear regression to predict the missing datasets demonstrated the application of hybrid modelling techniques in which process-based modelling blended with machine learning techniques for agricultural water resources management. The volumetric water content (m3.m-3) simulated through combined model approach showed satisfactory results when compared with in-situ datasets with an accuracy of (RMSE) 0.038 and 0.023. This approach also simulated water depth inside agricultural drainage control structure (ADCS) of SSDS with CD approach, and estimation about the total daily controlled discharge from ADCS. The study finally discussed a tri-modular smart, and pro-active decision support system (DSS) that integrates a comprehensive database module required to assess current and future condition of weather, field, and crop development; a data integration and analysis module to collect different datasets, analyse collected dataset using machine learning techniques and process-based numerical techniques; a decision support module to communicate with the user about different operations related to SSDS with CD approach. A DSS which aims to deliver sustainable development goals (SDGs) and relevant initiatives for Nordic agriculture associated with the state of water, agriculture and the environment in multiple ways.

How to cite: Ghag, K. S., Liedes, T., Klöve, B., and Torabi Haghighi, A.: Field-scale assessment of crop yield, crop water use efficiency, and water balances using different techniques to devise an ICT-based decision support solution for sub-surface drainage system with controlled drainage approach in Nordic agriculture, EGU General Assembly 2026, Vienna, Austria, 3–8 May 2026, EGU26-21611, https://doi.org/10.5194/egusphere-egu26-21611, 2026.

Climate-driven alterations of river flow regimes are increasing the occurrence of hydrological droughts and low-flow conditions in many humid watersheds, raising new challenges for basin-scale water management. In the Bécancour River basin (Québec, Canada), these pressures coincide with the expansion of cranberry production, a water-intensive agricultural activity supported by irrigation and reservoir-based water storage. Based on an initial watershed-scale assessment of individual and cumulative agricultural, municipal, and industrial water withdrawals, the first step of this research identifies agricultural water use—and particularly cranberry production—as a water use type that becomes especially influential under low-flow conditions. This highlights the need for a detailed, daily representation of cranberry farm-level water demand and reservoir operations, which cannot be adequately captured by conventional hydrological models alone. Building on this foundation, a Cranberry Farm Water Management Model is developed to explicitly simulate daily water use, storage, and recirculation processes. The model is coupled with HYDROTEL, a distributed hydrological model, allowing direct assessment of the impacts of cranberry farming practices on streamflow dynamics of the hydrographic network of the watershed. The outputs of this coupled framework then will serve as a basis for integration with a socio-economic model, enabling the analysis of farmer behavior, governance regulations, and feedback between water availability and management decisions. Together, this integrated socio-hydrological model provides a structured platform for evaluating future climate change scenarios and exploring mitigation and adaptation strategies for sustainable water governance in the Bécancour River basin. Accordingly, this communication focuses on the development and structure of the Cranberry Farm Water Management Model, as the central building block of this broader socio-hydrological governance framework.

How to cite: Rousseau, A. N., Khoramshokooh, N., and Gumiere, S. J.: Socio-Hydrological Governance for Watershed-Scale Water Management:Evaluating the Influence of Cranberry Production on Water Availability for Various Agricultural, Municipal and Industrial Water Uses, EGU General Assembly 2026, Vienna, Austria, 3–8 May 2026, EGU26-22182, https://doi.org/10.5194/egusphere-egu26-22182, 2026.

EGU26-22691 | ECS | Orals | HS3.1

Multi-Objective Optimization Framework for Managed Aquifer Recharge: A case study in Akrotiri, Cyprus 

Mohammad Taani, Falk Händel, Constantinos Panayiotou, Jana Glass, Catalin Stefan, and Traugott Scheytt

The implementation of managed aquifer recharge (MAR) systems, which have the potential to store surface water underground for future use or environmental advantages, has become increasingly popular due to the world's growing water scarcity. It has been demonstrated that MAR is a successful strategy for mitigating the effects of climate change on the world's water supplies as well as on issues related to spatiotemporal water shortages. However, conflicting goals, such as maximizing recharge efficiency while reducing total operational costs, must be balanced while designing MAR systems. This study aims to create a novel framework for a multi-objective optimization of MAR systems to handle such kind of trade-offs and also support decision-making.
This work introduces the first design steps and the general structure of a framework that integrates the capabilities of the existing web-based groundwater modelling platform INOWAS (www.inowas.com) with a hybrid evolutionary algorithm. The framework effectively explores optimal solutions in complex solution spaces by combining groundwater models implemented on the INOWAS platform with tools from the MODFLOW family (MODFLOW-2005, MT3DMS, SEAWAT) with global search capabilities (e.g., Genetic algorithm) and local refining methods (e.g., Simplex algorithm). The evaluation of the first design steps of the proposed framework was conducted with python, and not through direct implementation on the INOWAS platform.
The proposed framework is applied to the Akrotiri River Basin, a coastal region in the southern part of the Republic of Cyprus, facing complex and competing water management challenges. The region faces a number of key challenges related to water-scarcity, such as seawater intrusion into the coastal aquifer, overexploitation of the groundwater resources, deterioration of hydrochemical water quality, lack of sufficient monitoring infrastructure and low trust from local farmers in current water management strategies. Soil aquifer treatment (SAT) has been implemented at the site since 2016 through the infiltration of tertiary-treated wastewater using seventeen recharge ponds. The proposed framework integrates groundwater flow and transport modeling with a multi-objective optimization algorithm to simultaneously enhance groundwater quantity and quality, mitigate saltwater intrusion, protect drinking wells from any negative impact of injectant flow, hence supporting the reliability of water supply. Several meaningful trade-offs between these competing objectives are explicitly explored. Solutions are expressed as pareto fronts, which represent sets of optimal trade-off solutions that are non-dominated with respect to one another and superior to all other solutions in the search space.

How to cite: Taani, M., Händel, F., Panayiotou, C., Glass, J., Stefan, C., and Scheytt, T.: Multi-Objective Optimization Framework for Managed Aquifer Recharge: A case study in Akrotiri, Cyprus, EGU General Assembly 2026, Vienna, Austria, 3–8 May 2026, EGU26-22691, https://doi.org/10.5194/egusphere-egu26-22691, 2026.

EGU26-166 | Orals | HS3.3

Northward March of Climate-Sensitive Pathogens: Predicting the Unpredictable with Earth Observations  

Antarpreet Jutla, Sunil Kumar, and Rita Colwell

Climate change is reshaping the dynamics of waterborne pathogens, creating unprecedented challenges for public health, aquaculture, and environmental resilience. Among these, Vibrio species—emerging as sentinel organisms for climate-sensitive pathogens—illustrate the profound ecological shifts underway. Historically confined to warmer waters, vibrios are now expanding their range northward, driven by rising sea surface temperatures, altered salinity regimes, and changing ocean circulation patterns. This poleward migration is not merely an ecological curiosity; it poses tangible risks to human health through seafood consumption and recreational water exposure, and threatens aquaculture industries that sustain global food security.

Unlike conventional pathogens that can be controlled through eradication strategies, climate-sensitive pathogens such as vibrios cannot be eliminated from natural ecosystems. Their persistence and adaptability underscore the urgent need for predictive frameworks rather than reactive interventions. Here, we propose an innovative approach that leverages Earth observation systems to forecast pathogen dynamics under changing climatic conditions. Satellite-derived data on sea surface temperature, chlorophyll concentration, and salinity, combined with in-situ monitoring and advanced modeling, enable near-real-time risk assessments of pathogen proliferation. These predictive tools can inform early-warning systems, guiding public health advisories and aquaculture management before outbreaks occur.

Using vibrios as a model, we demonstrate how Earth observations can be integrated with ecological and epidemiological models to anticipate hotspots of pathogen emergence. Our analysis highlights the role of ocean warming and stratification in creating favorable conditions for vibrios, particularly in temperate regions previously considered low-risk. The northward expansion of vibrios into areas such as the North Atlantic and Baltic Sea exemplifies the cascading impacts of climate change on microbial ecology and human vulnerability. These shifts challenge traditional paradigms of disease control and demand a proactive, systems-based approach that links climate science, microbiology, and public health.

The implications extend beyond vibrios. Climate-sensitive pathogens—including enteric bacteria and viruses—are responding to the same environmental drivers, amplifying risks to water quality and food safety. By harnessing Earth observations, we can move from crisis response to anticipatory governance, building resilience in water, health, and environmental systems. This paradigm shift is critical for safeguarding communities and ecosystems in an era of accelerating climate change.

While eradication of climate-sensitive pathogens is unattainable, prediction is achievable—and essential. Earth observation technologies offer a powerful lens for understanding and forecasting pathogen behavior, enabling innovative solutions for resilient systems. The northward march of vibrios is a warning signal; our capacity to predict and prepare will determine whether it becomes a manageable challenge or a global health crisis.

How to cite: Jutla, A., Kumar, S., and Colwell, R.: Northward March of Climate-Sensitive Pathogens: Predicting the Unpredictable with Earth Observations , EGU General Assembly 2026, Vienna, Austria, 3–8 May 2026, EGU26-166, https://doi.org/10.5194/egusphere-egu26-166, 2026.

EGU26-2253 | ECS | Orals | HS3.3

Bridging the Data Latency Gap for Real-Time Precipitation Monitoring: A U-Net CNN Approach Using GOES-16 in the Tropical Andes 

Mateo Velez, Paul Muñoz, Esteban Samaniego, María José Merizalde, and Rolando Célleri

Timely precipitation information is essential for resilient water resources management disaster risk reduction, and climate adaptation, particularly in mountainous and data-scarce regions. While Satellite Precipitation Products (SPPs) such as IMERG Early Run (IMERG-ER) offer valuable spatial and temporal coverage, their latency of more than 4 hours limits their use for real-time applications, including flash flood early warning and operational decision-making. This study presents a hydroinformatics-based solution to bridge this critical latency gap by combining deep learning with near-time geostationary satellite observations. We developed a U-Net convolutional neural network driven by GOES-16 infrared imagery to emulate IMERG-ER precipitation fields with a latency of only minutes. The framework is applied to the Jubones river basin (3,340 km²) in the tropical Andes of Ecuador, a region characterized by complex topography and limited ground observations. The model was trained using five years (2019–2023) of GOES-16 data and evaluated across 15 spectral input configurations. Results show that a combination of water vapor (6.2, 6.9, 7.3 µm) and longwave infrared bands (8.4, 11.2 µm) yielded the best performance, effectively capturing atmospheric moisture dynamics and cloud-top characteristics. The proposed approach successfully reduced precipitation data latency from 4 hours to approximately 11 minutes. Model evaluation yielded an RMSE of 0.46 mm/h, a Pearson correlation of 0.60, and a Critical Success Index of 0.53. While performance decreased for high-intensity precipitation due to data imbalance, the model performed robustly for low-intensity precipitation (<3 mm/h), which accounts for 97% of events in the study area and is critical for hydrological monitoring and water management. Overall, the results demonstrate how integrating deep learning with geostationary satellite data can enhance near-real-time precipitation monitoring, supporting climate resilience, early warning systems, and operational hydrology in vulnerable and data-limited regions.

How to cite: Velez, M., Muñoz, P., Samaniego, E., Merizalde, M. J., and Célleri, R.: Bridging the Data Latency Gap for Real-Time Precipitation Monitoring: A U-Net CNN Approach Using GOES-16 in the Tropical Andes, EGU General Assembly 2026, Vienna, Austria, 3–8 May 2026, EGU26-2253, https://doi.org/10.5194/egusphere-egu26-2253, 2026.

EGU26-4109 | ECS | Orals | HS3.3 | Highlight

Assessing the Impact of Spatiotemporal Representation on Agricultural Water Accounting Using Satellite Data 

Ximena Anell Parra, Gerald Augusto Corzo Perez, and Ronald Ernesto Ontiveros Capurata

Satellite-based water accounting is increasingly used to estimate agricultural water demand in regions facing growing pressure from climate variability, land-use change, and limited availability of in situ observations. However, most operational applications rely on spatially aggregated satellite products that implicitly assume homogeneous conditions within basins or irrigation districts, thereby overlooking the spatiotemporal structure of hydrometeorological variability and associated measurement errors. The implications of this simplification for agricultural water accounting outcomes remain insufficiently quantified.

This study evaluates how agricultural water accounting results differ when spatiotemporal variability is explicitly represented, compared to conventional approaches that apply satellite products without detailed spatial and temporal reconstruction. A comparative framework is developed and applied to the Actopan River Basin in Veracruz, Mexico, which supplies Irrigation District 035 La Antigua, a region of high agricultural relevance dominated by sugarcane cultivation. Satellite-derived precipitation and reference evapotranspiration products for the period 2018–2024 are analyzed under two contrasting methodologies: (i) a baseline approach using non-interpolated satellite data, and (ii) a high-resolution approach incorporating spatiotemporal interpolation and error characterization.

Results show that neglecting spatial and temporal variability leads to systematic differences in estimated water balance components (P–ET), with implications for the magnitude, timing, and spatial distribution of agricultural water demand. Incorporating spatiotemporal structure enables identification of localized deviations that are masked under aggregated representations and provides a more realistic basis for accounting of crop water use. The analysis further demonstrates how systematic spatial and temporal discrepancies can be characterized and learned to improve consistency in water accounting calculations.

The proposed framework highlights the importance of scale-aware methodologies in satellite-based agricultural water accounting and is transferable to data-scarce basins where decision-making increasingly depends on remotely sensed information.

How to cite: Anell Parra, X., Corzo Perez, G. A., and Ontiveros Capurata, R. E.: Assessing the Impact of Spatiotemporal Representation on Agricultural Water Accounting Using Satellite Data, EGU General Assembly 2026, Vienna, Austria, 3–8 May 2026, EGU26-4109, https://doi.org/10.5194/egusphere-egu26-4109, 2026.

EGU26-10167 | ECS | Orals | HS3.3

Unsupervised Machine Learning to Quantify Climate-Model Uncertainty for Resilient Water Resources Planning 

Selam Belay Sahlu, Gerald Corzo, David Gold, Caroline Newton, and Chris Zevenbergen

Future climate change projections are characterised by uncertainties associated with Global Climate Models (GCMs) and emission scenario (SSPs). Different GCMs and SSPs represent key climate processes differently, yielding divergent projections rather than a single “best” future. In turn, this propagates into decision uncertainty for long-term water-resources management and planning. Climate model uncertainty analysis therefore provides a structured framework to identify, quantify, decompose, and communicate these uncertainties in water resource modelling. This helps bound plausible futures by emphasizing ranges of outcomes rather than single point estimates. This study develops an integrated framework that leverages unsupervised machine learning to characterize and quantify climate-model uncertainty for long-term water-resources management and planning. The framework integrates ranking, clustering, and scenario-discovery methods. We analyze outputs from 24 climate models from the Coupled Model Intercomparison Project Phase 6 (CMIP6) alongside observed reanalysis from the Princeton dataset. Monthly precipitation and temperature are evaluated across multiple locations within the basin to account for spatial heterogeneity. Model ranking was performed by evaluating each climate model against the observed reanalysis dataset. Performance was assessed using mean bias and percent bias, along with metrics capturing seasonality, spatial patterns, and interannual variability for basin-scale monthly temperature and precipitation. For each GCM, engineered features describing annual and seasonal change were then used for clustering. Unsupervised grouping was followed by classification based on Bayes decision theory. Within each cluster, a representative medoid was identified by minimizing the sum of Euclidean distances to all other members, yielding the most central model in that group. Cluster labels Low, Normal, and High projection were assigned by computing the percent change in simulated mean streamflow from the hydrological simulations for each climate model. Results indicate that the representative medoids are GISS-E2-1-G (Low projection), CanESM5 (Normal projection), and EC-Earth3 (Wet projection). The remaining GCMs are then probabilistically assigned to clusters with reference to these central medoids. The framework is demonstrated for the Blue Nile Basin to support long-term water-resources planning under climate uncertainty. This study extends the application of unsupervised machine learning for characterizing and quantifying climate-model uncertainty, with the objective of resilient water resource planning across multiple, dynamically evolving future possibilities.

How to cite: Sahlu, S. B., Corzo, G., Gold, D., Newton, C., and Zevenbergen, C.: Unsupervised Machine Learning to Quantify Climate-Model Uncertainty for Resilient Water Resources Planning, EGU General Assembly 2026, Vienna, Austria, 3–8 May 2026, EGU26-10167, https://doi.org/10.5194/egusphere-egu26-10167, 2026.

EGU26-11084 | ECS | Orals | HS3.3

Hybrid Approach for Flood Forecasting in Urban Innovation Districts (HIDS–Unicamp): Integrating PCSWMM, Neural Networks, and Explainable Artificial Intelligence 

Ana Elisa Pinheiro e Silva, Luiz Felipe de Araújo Figueiredo, Gerald Augusto Corzo Perez, and José Gilberto Dalfré Filho

Flood intensification due to climate variability and urbanization necessitates advanced forecasting tools, particularly in regions undergoing rapid transformation where drainage infrastructure data is often scarce. This study presents a methodological framework for flood forecasting in the Ribeirão Anhumas watershed (Campinas, Brazil), specifically applied to the International Hub for Sustainable Development (HIDS–Unicamp). As an innovation district currently under implementation, HIDS represents a unique opportunity to integrate predictive modeling into early-stage urban planning.

The methodology addresses data scarcity by integrating physical modeling with machine learning. We have established a simulation environment using PCSWMM to replicate hydrological behavior under distinct infrastructure scenarios. These simulations, driven by high-resolution precipitation (10-min) and geospatial data (1 m DTM), generate the necessary synthetic training data for regions where sensor networks are yet to be deployed. The proposed architecture is designed to perform a binary classification of flood occurrence (Flood/No Flood), utilizing a multi-model approach: Recurrent Neural Networks (RNNs) for temporal dynamics, Convolutional Neural Networks (CNNs) for spatial patterns, and Graph Neural Networks (GNNs) to explicitly model the hydrological connectivity of the watershed.

In this contribution, we present the complete data processing pipeline and the defined model architecture. The study focuses on evaluating the comparative performance of these architectures using classification metrics (accuracy, precision, recall, F1-score, and ROC curve). Furthermore, to ensure the model is transparent for decision-makers, we outline the application of Explainable AI (XAI) techniques, specifically SHAP and LIME. These are intended to identify the contribution of input variables to flood predictions, bridging the gap between "black-box" deep learning and interpretable hydrological processes. The final results aim to demonstrate how hybrid modeling can support the strengthening of early warning systems and resilience strategies in developing urban territories.

How to cite: Pinheiro e Silva, A. E., de Araújo Figueiredo, L. F., Corzo Perez, G. A., and Dalfré Filho, J. G.: Hybrid Approach for Flood Forecasting in Urban Innovation Districts (HIDS–Unicamp): Integrating PCSWMM, Neural Networks, and Explainable Artificial Intelligence, EGU General Assembly 2026, Vienna, Austria, 3–8 May 2026, EGU26-11084, https://doi.org/10.5194/egusphere-egu26-11084, 2026.

EGU26-13966 | Orals | HS3.3

Will you live an unprecedented life? 

Wim Thiery, Luke Grant, Inne Vanderkelen, Lukas Gudmundsson, Erich Fischer, and Sonia I. Seneviratne

Climate extremes such as heatwaves, river floods, droughts, crop failures, including aspects of wildfires and tropical cyclones, are increasingly attributable to anthropogenic climate change. Yet how this translates into unprecedented levels of extreme event exposure in one’s lifetime remains unclear. Here we show that, neglecting adaptation, many of today’s youth will experience unprecedented exposure to extremes during their lifetimes. For the events above, the share of people facing unprecedented lifetime exposure is projected to at least double from 1960 to 2020 birth cohorts under current mitigation policies aligned with a global warming pathway reaching 2.7 °C above pre-industrial temperatures by 2100. In a 1.5 °C pathway, ∼50% of people born in 2020 will experience unprecedented lifetime exposure to heatwaves. If global warming reaches 3.5 °C by 2100, this rises 30 to ∼90% of this birth cohort. For the same cohort and warming pathway, ∼30% will live with unprecedented exposure to crop failures and ∼10% to river floods. Further, under current policies, two indicators of vulnerability show that the most vulnerable experience significantly more unprecedented exposure to heatwaves than the least vulnerable. Our results call for sustained greenhouse gas emissions reductions to lower the burden of climate change on young generations

How to cite: Thiery, W., Grant, L., Vanderkelen, I., Gudmundsson, L., Fischer, E., and Seneviratne, S. I.: Will you live an unprecedented life?, EGU General Assembly 2026, Vienna, Austria, 3–8 May 2026, EGU26-13966, https://doi.org/10.5194/egusphere-egu26-13966, 2026.

EGU26-14563 | ECS | Orals | HS3.3

Spatiotemporal dynamics of pedestrian flood hazard in urban areas: beyond peak inundation maps 

Manuel Antonio Contreras Martínez, Gerald Augusto Corzo Perez, and German Ricardo Santos Granados

Extreme urban floods increasingly threaten pedestrians, yet hazard assessments often emphasise peak inundation maps and overlook the duration and overlap of instability conditions that drive real-life exposure and operational decisions. We evaluate the spatiotemporal evolution of pedestrian hazard during a 3-h, 100-year design storm simulated with a coupled rainfall–flood (1D–2D) model for Cúcuta, Colombia (130.5 ha). Every 5 min, gridded flow velocity (V) and water depth (h) were extracted and translated into four hazard levels using widely adopted pedestrian stability indicators (V, h, and V·h). We quantify (i) the fraction of wet area in each hazard class through time (normalised by the instantaneous wet area and by the event’s maximum wet footprint) and (ii) persistence (time above thresholds per cell/sector) and simultaneity (co-occurrence of medium-high/high classes among the three indicators).
The wet footprint expands rapidly and peaks at ~60 min before draining incompletely. Velocity shows an impulsive response, with high-V corridors emerging near the rising limb and collapsing shortly after the peak, while hazardous depths persist longer and concentrate in low-drainage sectors. The combined indicator V·h delineates a critical hazard window (~40–120 min), when threshold exceedance and indicator overlap are maximised, identifying recurrent hotspots and the time intervals most relevant for pedestrian management. The proposed curve-plus-persistence framework complements peak hazard mapping by providing quantitative criteria to prioritise interventions and define operational time windows for closures and warning measures.

How to cite: Contreras Martínez, M. A., Corzo Perez, G. A., and Santos Granados, G. R.: Spatiotemporal dynamics of pedestrian flood hazard in urban areas: beyond peak inundation maps, EGU General Assembly 2026, Vienna, Austria, 3–8 May 2026, EGU26-14563, https://doi.org/10.5194/egusphere-egu26-14563, 2026.

EGU26-15341 | ECS | Orals | HS3.3

Use of Machine Learning techniques to identify scenarios for implementing Nature-based Solutions that best prevent flooding 

Luiz Felipe de Araújo Figueirêdo, Ana Elisa Pinheiro e Silva, Gerald Augusto Corzo Perez, and José Gilberto Dalfré Filho

A paradigm shift is taking place in the way urban rainwater drainage is thought about, with the understanding that conventional drainage structures, known as gray infrastructures, end up collecting large volumes of water on impermeable surfaces, causing problems downstream. It is therefore necessary to consider systems that favor the interception and infiltration of water into the soil so that surface runoff is treated at the point where it is generated. Such systems are known as Nature-based Solutions (NbS), which comprise a set of structures that simulate natural drainage processes. These must be carefully designed and positioned to act at points in the urban landscape that, if impermeable, would favor water accumulation. This study consists of using Machine Learning (ML) techniques to identify the NbS layout that provides the best flood protection in an area of the city of Campinas, Brazil. To this end, a model in PCSWMM software is used, which will involve the implementation of eight NbS: bio-retention cell, infiltration trench, permeable pavement, rain barrel, vegetative swale, rain garden, green roof, and rooftop disconnection. Different rainfall scenarios are simulated to assess surface runoff generation in each subcatchment. The same volume of precipitation is considered, which is temporally and spatially distributed differently in each rainfall scenario, allowing the identification of differences in the floods generated. Using a database derived from the simulation results, Artificial Neural Networks (ANN) are applied to create a predictive model of surface runoff generated in a given rainfall event. An analysis of the variability of runoff in the different subcatchments is then performed, identifying how much the source of flow generation varies spatially when the rainfall configuration is modified. The NbS are then dimensioned with the help of the rainfall configuration most likely to cause flooding. The hydrological model is simulated several times, varying the positioning and quantity of NbS throughout the subcatchments, in order to generate data that, when applied to ANN, identifies the implementation scenario that best combats flooding in the studied area. The NbS are allocated so that each scenario generates the same implementation cost according to the Brazilian price benchmark, making each scenario have the same intensity of NbS allocation. The study presents a new methodology for sizing sustainable solutions, showing how much the use of ML techniques can assist in the design process of rainwater drainage for new developments. The study area considered is the Campinas International Hub for Sustainable Development, which hosts universities and research institutions. It will be expanded over the next few years, and the implementation of NbS on site will serve as a living laboratory for students who, on a daily basis, will be able to see in practice how sustainable solutions contribute to flood control.

How to cite: de Araújo Figueirêdo, L. F., Pinheiro e Silva, A. E., Corzo Perez, G. A., and Dalfré Filho, J. G.: Use of Machine Learning techniques to identify scenarios for implementing Nature-based Solutions that best prevent flooding, EGU General Assembly 2026, Vienna, Austria, 3–8 May 2026, EGU26-15341, https://doi.org/10.5194/egusphere-egu26-15341, 2026.

Changing climatic conditions have led to hydroclimatic extremes, posing significant risks to water availability, agricultural productivity, and food security in climate-sensitive regions. The Brahmaputra River basin, situated in northeastern India, largely within the state of Assam,  is particularly vulnerable to climate change, as rain-fed rice cultivation in this area is highly dependent on the monsoon.This study assesses historical and projected climate-yield relationships at the district level in Assam using a machine learning framework.

The present analysis utilizes hourly ECMWF ERA5 surface-level data (AgERA5), which includes agrometeorological variables such as 2 m temperature, total precipitation, and reference evapotranspiration. Agricultural drought stress has been evaluated using the Standardized Precipitation–Evapotranspiration Index (SPEI), sourced from the global SPEI database. The Expert Team on Climate Change Detection and Indices (ETCCDI) indices were employed to evaluate climate extremes, including various temperature indices (annual maximum and minimum of daily maximum and minimum temperatures: TXX, TXN, TNX, TNN), diurnal temperature range (DTR), and precipitation extremes (maximum 1-day and 5-day precipitation amounts: RX1day, RX5day).

These indices were temporally correlated with district-level rice yield data and spatially aggregated across the Upper, Middle, and Lower Brahmaputra Basin regions. Long Short-Term Memory (LSTM) neural networks were applied to capture the nonlinear and temporal relationships between agrometeorological variables, climate extremes, and rice yield variability. To account for model uncertainty, multi-model ensemble spreads from CMIP6 projections under SSP2-4.5 and SSP5-8.5 scenarios were utilized.

The study's findings indicate a warming trend throughout Assam, coupled with increasing evapotranspiration demand and declining SPEI values, signifying heightened moisture stress during the rice-growing season. Yield variability is more significantly influenced by nighttime temperature extremes (TNX and TNN) and reductions in diurnal temperature range than by midday heat extremes. Multi-day extreme rainfall events (RX5day) negatively affect yields in flood-prone areas of the Upper and Middle Brahmaputra Basin and display mixed effects in regions with comparatively limited moisture; overall, precipitation extremes show substantial spatial variability. Scenario-based projections reveal greater yield volatility and an increased risk of yield decline under SSP5-8.5 compared to SSP2-4.5. This research framework provides a scalable and practical decision-support tool to enhance early warning systems for agro-meteorological variability, support climate-resilient agricultural planning, and inform evidence-based policy development.

How to cite: Shukla, S. and Corzo, G.: Machine Learning–Based Attribution of Hydroclimatic Extremes and Agricultural Yield Risk in the Brahmaputra Basin, Assam, India under CMIP6 Scenarios, EGU General Assembly 2026, Vienna, Austria, 3–8 May 2026, EGU26-17392, https://doi.org/10.5194/egusphere-egu26-17392, 2026.

EGU26-22011 | Posters on site | HS3.3

Improving Soil Moisture and Evapotranspiration Simulations in an Intensively Irrigated Arid Region Using Noah-MP 

Qiuju Li, Hongli Zhao, Hao Duan, and Gerald Augusto Corzo Perez

Intensively managed irrigation districts in arid regions pose major challenges for land surface and hydrological modeling due to strong anthropogenic disturbances and highly nonlinear soil–vegetation–atmosphere interactions. The Hetao Irrigation District (HID), one of the largest irrigated areas in northern China, exemplifies such complexities, where conventional land surface models often struggle to realistically represent soil moisture (SM) dynamics and evapotranspiration (ET) processes. In this study, we improve the performance of the Noah Land Surface Model with Multi-Parameterization options (Noah-MP) by integrating global sensitivity analysis and parameter optimization. The model was driven by long-term meteorological forcing, and dominant parameters related to soil hydraulic properties and vegetation phenology were identified as key controls on simulated soil moisture and ET. These parameters were subsequently optimized using the Shuffled Complex Evolution (SCE-UA) algorithm, jointly constrained by in-situ observations and remotely sensed SM and ET products. The calibrated model shows a consistent improvement in reproducing observed soil moisture dynamics and better captures the seasonal variability of ET associated with irrigation practices. In particular, the optimized parameter set enhances the representation of irrigation-induced soil wetting and crop growth cycles, leading to more realistic land–atmosphere exchange processes. This study highlights the importance of multi-source observational constraints and parameter sensitivity-informed calibration for land surface modeling in human-dominated environments. The proposed framework provides a transferable approach for improving hydrological simulations in heavily managed arid irrigation districts.

How to cite: Li, Q., Zhao, H., Duan, H., and Corzo Perez, G. A.: Improving Soil Moisture and Evapotranspiration Simulations in an Intensively Irrigated Arid Region Using Noah-MP, EGU General Assembly 2026, Vienna, Austria, 3–8 May 2026, EGU26-22011, https://doi.org/10.5194/egusphere-egu26-22011, 2026.

EGU26-1167 | ECS | Posters on site | HS3.4

Enhancing Streamflow Simulations Through Input Data Denoising 

Injila Hamid and Vinayakam Jothiprakash

Hydrological models are vital for understanding water resources and their responses to environmental and climatic changes, but their accuracy depends strongly on input data quality. This study evaluates how noise reduction in meteorological inputs influences the performance of the SWAT hydrological model for the lower Columbia River basin. Wavelet Transform (WT) was applied for partial denoising, while Singular Spectrum Analysis (SSA) was used for both partial and full noise removal. SSA allows extraction of trend, periodic, and noise components individually from time series data. Results indicate that partial denoising using WT significantly improves model performance, increasing the correlation coefficient (r) and Nash–Sutcliffe Efficiency (NSE) by 2 to 5%, Kling-Gupta Efficiency (KGE) by 16%, and reducing RSR by 4%, along with a notable reduction in PBIAS (from −4.7 to +1.3). The partially denoised WT model achieved r = 0.91, NSE = 0.81, PBIAS = 1.30, KGE = 0.88, and RSR = 0.45, outperforming both the base and fully denoised models. The comparative analysis shows that completely removing noise offers limited benefits and may suppress natural variability, while partial denoising provides an optimal balance between data reliability and model precision. These findings highlight the importance of appropriate input-data preprocessing in improving hydrological model performance and reducing uncertainty in water resource assessments.

How to cite: Hamid, I. and Jothiprakash, V.: Enhancing Streamflow Simulations Through Input Data Denoising, EGU General Assembly 2026, Vienna, Austria, 3–8 May 2026, EGU26-1167, https://doi.org/10.5194/egusphere-egu26-1167, 2026.

EGU26-1351 | ECS | Orals | HS3.4

Geostatistical active learning for expanding monitoring networks for environmental decision making 

Felix Henkel, Jonathan Frank, Thomas Suesse, and Alexander Brenning

The expansion and optimisation of environmental monitoring networks requires the efficient use of limited resources to improve spatial predictions to ensure the protection of human health and ecosystems.

Network densification is a spatial sampling problem that is often addressed by pointwise-prediction uncertainty approaches, which ignore (1) the impact of a new site on its neighbourhood and (2) the binary decision task motivating the monitoring. Active learning (AL) is a machine learning technique that iteratively selects new locations based on the current maximum uncertainty in the available training data. We therefore recast network densification as an AL task and propose model-agnostic acquisition criteria, including a decision-aligned focal logit criterion that prioritises neighbourhoods whose exceedance probabilities lie near regulatory thresholds. A look-ahead criterion based on the expected reduction in prediction standard error (SE) is also examined. In a groundwater nitrate concentration case study, the focal logit criterion consistently selected more informative sites than traditional dispersion- or prediction-SE-based criteria, yielding up to 58 % greater gains in exceedance-mapping accuracy (Cohen’s κ)). Focal logit and SE criteria outperformed pointwise counterparts by ~45 % on average, while the look-ahead criterion performed well but at much higher computational cost.

The proposed framework is simple, generalisable to other environmental pollutants (such as air pollutants), and supports a transparent, decision-oriented monitoring design.

How to cite: Henkel, F., Frank, J., Suesse, T., and Brenning, A.: Geostatistical active learning for expanding monitoring networks for environmental decision making, EGU General Assembly 2026, Vienna, Austria, 3–8 May 2026, EGU26-1351, https://doi.org/10.5194/egusphere-egu26-1351, 2026.

Decisions concerning the management of natural resources are often based on binary criteria that determine whether a specific environmental target is met or exceeded. A common example is the designation of “polluted” areas, where mitigation measures must be implemented once concentrations surpass a regulatory threshold. In practice, maps of such exceedances are commonly derived from regionalized concentration estimates. However, most conventional spatial interpolation and prediction procedures introduce systematic bias in the estimated extent of polluted areas.

To overcome this issue, we apply a bias-corrected mapping procedure that is compatible with any geostatistical or machine learning method capable of providing valid probability estimates. For the case study, we mainly focus on a trans-Gaussian regression-kriging (TRGK) framework, selected for its interpretability and transparent decomposition of predictions. To assess the potential added value of nonparametric approaches, we additionally compare TRGK with quantile regression forest (QRF) in a sub-region.

The TRGK model follows a structured, non-stationary design: (i) raw concentrations are transformed to log10 scale; (ii) a nationwide global linear model captures broad-scale relationships; (iii) major hydrogeological districts serve as units for local linear refinements to account for non-stationarity; (iv) residuals are transformed using a Gaussian anamorphosis; and (v) the transformed residuals are interpolated via ordinary kriging, from which probability estimates are derived. This setup improves flexibility while maintaining interpretability and coherent uncertainty quantification.

Bias correction is performed by estimating the total exceedance area implied by the data and determining a calibrated probability threshold that ensures an unbiased delineation of the polluted area. In this study, we jointly evaluate a threshold exceedance criterion and a temporal trend criterion.

Groundwater nitrate mapping at national scale represents a challenging test case due to strong non-normality, spatial heterogeneity, and pronounced non-stationarity. The approach nonetheless performs robustly. Linear model components exhibit R2 values between 0.15 and 0.62, while semivariogram practical ranges vary from 0.3 to 22.3 km. In the sub-region comparison, QRF showed a small discrimination advantage over TRGK (AUC 0.86 vs. 0.82) but relied more heavily on calibration (underestimation without calibration 94.9% vs. 5.1%).

Overall, the results demonstrate that the bias-corrected probability-based framework provides a flexible, robust and- when coupled with geostatistics- transparent solution for large-scale pollution mapping.

How to cite: Frank, J., Suesse, T., Jiang, S., and Brenning, A.: Bias-corrected pollution mapping with non-stationary geostatistics and spatial machine learning for environmental decision making: The case of groundwater nitrate, EGU General Assembly 2026, Vienna, Austria, 3–8 May 2026, EGU26-1406, https://doi.org/10.5194/egusphere-egu26-1406, 2026.

Hydrological extreme records in many regions in the world may include observations from different genesis and levels of extremeness forming a characteristic “separation phenomenon’ that limits the effectiveness of traditional distributions such as the Gumbel and log-Pearson Type III models, and in such mixed extreme populations, the Two-Component Extreme Value (TCEV) distribution is better suited. However, conventional fitting approaches tend to emphasize the abundant ordinary data because of the scarcity of right-tail observations, which results in inaccurate predictions of high quantiles. Nevertheless, accurate representation of the upper tail (i.e., the high-value ranges of the cumulative distribution function, CDF) is essential for flood risk evaluation and the design of hydraulic structures. To address this issue, this study introduces a new TCEV fitting approach (SR-MWS) aimed at improving right-tail performance. In the new proposal, the dataset is first approximated using a piecewise two linear regression, and the slope ratio between the two parts (R = S1/S2) is used to assess whether TCEV modeling is appropriate or not (if R > 1.5, the dataset is regarded as suitable for TCEV fitting). Following, three weighting strategies—linear, quadratic, and exponential—are applied sequentially to obtain the final TCEV parameters. A partitioned scoring framework is then used to select the most suitable weighting scheme, emphasizing the mid-to-upper CDF range F(x) ∈ [0.6, 1.0], which corresponds to return periods from about 2.5 years to more than 200 years, while also considering overall fit quality. Our results show that the proposed method yields more accurate estimates for extreme values than conventional techniques and exhibits consistent performance for both peak-flow and precipitation datasets. Beyond hydrological applications, it provides an automated and robust tool for modeling extreme events and supporting risk assessment in fields characterized by mixed-population data with a pronounced dog-leg structure.

How to cite: Valdes-Abellan, J., Ta, L., and Yu, C.: New Proposal for maximum hydrological events fitting showing the ‘separation phenomenon’ with flexible TCEV Distribution , EGU General Assembly 2026, Vienna, Austria, 3–8 May 2026, EGU26-1449, https://doi.org/10.5194/egusphere-egu26-1449, 2026.

EGU26-1813 | Orals | HS3.4

Residual error modelling for hourly streamflow predictions 

Cristina Prieto, Dmitri Kavetski, Fabrizio Fenicia, James Kirchner, David McInerney, Mark Thyer, and César Álvarez

 Statistical residual error modelling for hourly streamflow predictions

Cristina Prieto1,2,3, Dmitri Kavetski4,1, Fabrizio Fenicia3, James Kirchner2,5,6, David McInerney4, Mark Thyer4, and César Álvarez1


(1) IHCantabria—Instituto de Hidráulica Ambiental de la Universidad de Cantabria, Santander, Spain

(2) Department of Environmental Systems Science, ETH Zürich, Zürich, Switzerland

(3) Eawag, Swiss Federal Institute of Aquatic Science and Technology, Dübendorf, Switzerland

(4) School of Civil, Environmental and Mining Engineering, University of Adelaide, Adelaide, SA, Australia

(5) Swiss Federal Research Institute WSL, Birmensdorf, Switzerland

(6) Department of Earth and Planetary Science, University of California, Berkeley, California, USA


Water plays a critical role in societal stability through both its excess and scarcity. Extreme hydrological events can cause substantial human and economic losses, while water scarcity affects essential services such as drinking water supply, food production, and hydropower generation. Reliable streamflow predictions are therefore fundamental for environmental assessments, flood risk management, and Integrated Water Resources Management (IWRM).

Hydrological models are central tools for understanding catchment behaviour and generating predictions to support water-resources assessment, planning, and management. However, their predictive performance strongly depends on the temporal resolution at which they are applied.

At hourly time scales, hydrological processes and associated uncertainties become markedly more complex, particularly in small and mesoscale catchments. Flood peaks may last only a few hours, so daily streamflow predictions can substantially underestimate peak magnitudes; antecedent wetness conditions can evolve rapidly; and the dominant processes controlling short-term streamflow dynamics differ from those governing longer term behavior. For example, over longer time scales, predictions are primarily constrained by mass balance, whereas short-term predictions depend more strongly on dynamics and flow routing.

In addition to classical sources of uncertainty related to data, model structure, and parameters, hourly streamflow predictions often exhibit bias, heteroscedasticity, temporal autocorrelation, and non-stationarity.

Despite their importance, hourly streamflow prediction and uncertainty characterisation have received comparatively less attention than daily-scale studies.

In this work, we use a conceptual hydrological model to generate deterministic hourly streamflow predictions and quantify predictive uncertainty using a residual error modelling framework. Case-study catchments include hydrologically diverse basins in Europe and the United States. Bias, heteroscedasticity, and temporal dependence in model residuals are addressed using Box–Cox transformations and autoregressive and moving average (ARMA) models.

Results indicate that a logarithmic transformation combined with an autoregressive model of order three (AR(3)) provides the most consistent performance across catchments. This work advances streamflow prediction by developing statistically rigorous methods for post-processing the residuals of conceptual hydrological models at the hourly time scale, supporting more reliable hourly streamflow predictions for integrated water resources management and decision-making.

How to cite: Prieto, C., Kavetski, D., Fenicia, F., Kirchner, J., McInerney, D., Thyer, M., and Álvarez, C.: Residual error modelling for hourly streamflow predictions, EGU General Assembly 2026, Vienna, Austria, 3–8 May 2026, EGU26-1813, https://doi.org/10.5194/egusphere-egu26-1813, 2026.

EGU26-3193 | ECS | Orals | HS3.4

Designing Sampling Strategies for the Efficient Estimation of Parameterized Spatial Covariance Models 

Olivia L. Walbert, Frederik J. Simons, Arthur P. Guillaumin, and Sofia C. Olhede

Spatial data in the Earth and environmental sciences acquired by instrument collection or simulation are constrained to finite, discrete, (ir)regular grids whose geometry is delineated by a boundary within which missingness, either random or structured, may exist. We model (ir)regularly sampled Cartesian spatial data as realizations of discrete two- and three-dimensional random fields whose covariance structure we estimate parametrically with a spectral-domain maximum-likelihood estimation strategy using the debiased Whittle likelihood, which efficiently counters the effects of aliasing and spectral leakage that arise from finite sampling and boundary effects. We work with the general, flexible Matérn class of covariance functions, which characterizes the shape of a field through three parameters that quantify its amplitude, smoothness, and correlation length. We quantify parameter covariance analytically and asymptotically based on the parametric model and sampling grid alone, agnostic of observed data. Our uncertainty quantification allows us to study how sampling geometry imparts uncertainty on a covariance model and provides a path for optimizing the design of a sampling grid to reduce error for an anticipated model. We formulate several approaches for interrogating our model residuals to interpret where real Earth data depart from the null hypotheses of Gaussianity, stationarity, and isotropy. We explore select case studies that demonstrate the broad applicability of our models across Earth science disciplines and develop software in MATLAB and Python for implementation by domain scientists, in hydrology, and elsewhere.

How to cite: Walbert, O. L., Simons, F. J., Guillaumin, A. P., and Olhede, S. C.: Designing Sampling Strategies for the Efficient Estimation of Parameterized Spatial Covariance Models, EGU General Assembly 2026, Vienna, Austria, 3–8 May 2026, EGU26-3193, https://doi.org/10.5194/egusphere-egu26-3193, 2026.

EGU26-5236 | Orals | HS3.4

Which grid points are statistically significant? Revisiting false discovery rate correction in geospatial data 

Michael Schutte, Leonardo Olivetti, and Gabriele Messori

Scientific publications in the geosciences routinely assess statistical significance in spatially distributed environmental and geophysical data. When statistical significance is indicated, it is most often assessed independently at each grid point, while formal adjustment for multiple testing is rarely applied. However, applying multiple testing corrections, such as the global false discovery rate (FDR) approach is not always straightforward, as environmental and geophysical data are often spatially correlated.

In our work, we highlight how neglecting multiple testing correction can substantially inflate the number of false positives. We further show that commonly used FDR implementations can yield counterintuitive and potentially misleading results when applied to strongly spatially correlated data.

To illustrate the latter point, we provide an example based on near-surface air temperature composites following sudden stratospheric warmings. We first show that when anomalies are spatially coherent, restricting the spatial domain can increase the FDR-adjusted significance threshold. As a result, the same underlying field may display a larger share of statistically significant grid points solely due to domain selection. We analyze the origin of this behavior from a rank-based perspective and discuss its implications for spatial inference and uncertainty quantification in environmental sciences.

Based on these insights, we propose practical recommendations for robust and transparent significance assessment, such as spatially aggregated or spatially aware alternatives. Our results highlight both the need to account for multiple-testing and potential issues with a naïve application and interpretation of FDR correction. While illustrated using atmospheric data, the findings are directly relevant to hydrology and other environmental sciences where statistical significance is assessed across spatial fields.

How to cite: Schutte, M., Olivetti, L., and Messori, G.: Which grid points are statistically significant? Revisiting false discovery rate correction in geospatial data, EGU General Assembly 2026, Vienna, Austria, 3–8 May 2026, EGU26-5236, https://doi.org/10.5194/egusphere-egu26-5236, 2026.

EGU26-7544 | ECS | Posters on site | HS3.4

Toward Stable Groundwater–Surface Water Coupling in Landscape Evolution Models 

Farshid Alizadeh, Raphael Bunel, Nicolas Lecoq, and Yoann Copard

Integrated landscape-evolution models require groundwater models that are computationally efficient, groundwater component that remains stable over multidecadal simulations, and strong coupling with surface hydraulics and sediment transport. In CLiDE, which is built on CAESAR–Lisflood, the backward-Euler groundwater update is simple, but as grid resolution or hydraulic diffusivity increases, it becomes highly restrictive due to the diffusion-type Courant–Friedrichs–Lewy (CFL) stability constraint. We present a redesign of CLiDE’s groundwater module that provides two complementary pathways: a behavior-preserving optimized explicit solver and a fully implicit formulation based on backward-Euler time integration. The implicit approach uses a Picard iteration to address the nonlinearity of unconfined transmissivity and the sparse symmetric positive-definite systems with a preconditioned conjugate-gradient solver. We benchmark both solvers across 25 years in fully coupled hydro-geomorphic experiments at the 104 km² Orgeval catchment in north-central France using hourly and daily groundwater coupling intervals. The implicit solver achieves a water mass balance at the catchment scale within 0.1% while remaining unconditionally stable at daily time steps and achieving solutions comparable to the hourly implicit solution. Groundwater head diagnostics are typically within 0.01 m of each other. The consistency in outlet hydrographs, inundation patterns, and long-term sediment-export behavior indicates that daily implicit coupling, in this case, can be selected based on process time scales, and not on numerical stability. Moreover, the optimized explicit solver accelerates the legacy scheme by 1.3 to 1.6 times refinements to specific algorithms, with no change in numerical outputs. Collectively, these advances enhance CLiDE's capability for additional fully coupled, long-duration simulations and suggest a preference between efficiency-oriented explicit updates and robustness-oriented implicit integration.

How to cite: Alizadeh, F., Bunel, R., Lecoq, N., and Copard, Y.: Toward Stable Groundwater–Surface Water Coupling in Landscape Evolution Models, EGU General Assembly 2026, Vienna, Austria, 3–8 May 2026, EGU26-7544, https://doi.org/10.5194/egusphere-egu26-7544, 2026.

EGU26-7835 | ECS | Orals | HS3.4

Reliable Predictive Resolution in GeospatialModelling 

Meng Lu and Jiong Wang

High-resolution geospatial prediction and satellite image downscaling are increasingly enabled by advances in machine learning and the availability of fine-scale covariates. However, predicted maps are often delivered on arbitrary grids that are not justified by the sampling density of observations. While uncertainty can be quantified at unobserved locations, the spatial scales over which predictions are supported by the data and the modelling process are typically not characterized. Besides computational and storage costs, critical consequences including over-interpretation, modelling noise, and most importantly, the apparent predictive resolution of spatial products can be misleading for downstream applications, potentially affecting scientific conclusions. An example is the use of predicted air pollution maps in health cohort studies to assess exposure–response relationships. This raises a fundamental but under-addressed question: what is the finest spatial resolution at which predictions are meaningfully supported by the data (and model)?

We investigate how to meaningfully determine the predictive resolution in regression models by linking sampling density and model parameters in the frequency domain through spectral analysis. Two challenges are 1) to identify the sampling density in the multi-dimensional feature space, where the sampling typically becomes irregular; and 2) how to relate the frequency in the feature space to the spatial resolution. Using simulated and real-world geospatial datasets, we show that some arbitrarily selected output resolutions in existing literatures could exceed the data-supported predictive resolution, and could induce unnoticed biases or change-of-support issues in downstream analyses.

How to cite: Lu, M. and Wang, J.: Reliable Predictive Resolution in GeospatialModelling, EGU General Assembly 2026, Vienna, Austria, 3–8 May 2026, EGU26-7835, https://doi.org/10.5194/egusphere-egu26-7835, 2026.

Stochastic rainfall models are probabilistic tools able to simulate synthetic rainfall datasets with statistical properties that resemble those from observations, which makes them particularly suitable to assess the uncertainty of rainfall estimates and to conduct sensitivity analysis of hydro-meteorological modeling chains. When the focus of the modeling is on spatial and temporal patterns, models based on space-time Gaussian random fields (GRFs) are often used because they enable modeling rainfall at any point of the space-time domain from sparse and heterogeneous data (typically observations from a rain gauge network).

In this presentation I will explore how a new model of space-time, multivariate and non-stationary GRF can be leveraged to improve stochastic rainfall modeling. A parametric transform function is combined with the GRF to account for rainfall intermittency and skewed marginal distribution, which results in a so-called trans-Gaussian (or meta-Gaussian) model. Among the many applications achieved by this flexible trans-Gaussian model I will examine how spatial non-stationarity can model orographic effects, and how multivariate modeling can be used to embed rainfall into a stochastic weather generator including five different variables (rainfall, temperature, wind, solar radiation and humidity).

How to cite: Benoit, L.: Stochastic rainfall modeling using spatio-temporal, multivariate and nonstationary trans-Gaussian random fields, EGU General Assembly 2026, Vienna, Austria, 3–8 May 2026, EGU26-7961, https://doi.org/10.5194/egusphere-egu26-7961, 2026.

EGU26-9994 | ECS | Posters on site | HS3.4

Probabilistic mapping of groundwater nitrate pollution using a Bayesian Gaussian process model 

Kassandra Jensch, Márk Somogyvári, and Tobias Krüger

Nitrate groundwater pollution threatens the quality of drinking water and is directly linked to intensive fertiliser inputs on agricultural fields. To reduce pollution from agricultural sources, areas with, or at risk of, elevated nitrate concentrations must be designated as Nitrate Vulnerable Zones (NVZs) under the European Nitrates Directive. In Germany, as elsewhere in Europe, the designation of NVZs follows a binary classification scheme that does not account for uncertainties in the underlying data and interpolation method. We present an alternative geostatistical framework that explicitly introduces uncertainties into the established designation framework, enabling a more accurate assessment of nitrate groundwater pollution. Using a Bayesian Gaussian process model, nitrate concentrations in groundwater were predicted across the federal state of Brandenburg, Germany, where nitrate pollution is an acute problem. Our model specifically incorporates measurement errors as well as systematic biases from different observation types. The model allows for the calculation of exceedance probabilities which provides a continuous representation of nitrate pollution risk across space, relative to the legal nitrate limit of 50 mg/L. We show that the majority of agricultural land in the study area has at least a 50% probability of exceeding this limit. Additionally, measurement errors were identified as the main source of uncertainty in estimated nitrate concentrations, leading to relatively wide posterior predictive distributions. The results indicate that areas with high exceedance probability extend beyond currently designated NVZs. Unlike the established designation workflow, the proposed approach accounts for the complex reality and uncertainty of nitrate pollution in groundwater and can be readily extended to other countries in the EU and beyond. This enables a more robust and transparent designation of NVZs, and demonstrates the value of explicitly incorporating uncertainty into environmental modelling in high-profile policy settings.

How to cite: Jensch, K., Somogyvári, M., and Krüger, T.: Probabilistic mapping of groundwater nitrate pollution using a Bayesian Gaussian process model, EGU General Assembly 2026, Vienna, Austria, 3–8 May 2026, EGU26-9994, https://doi.org/10.5194/egusphere-egu26-9994, 2026.

EGU26-12514 | ECS | Orals | HS3.4

How environmental conditions influence satellite detection of rainfall events 

Chun Zhou, Li Zhou, Luca Brocca, and Dui Huang

Precipitation serves as a critical link between climate and hydrology, with variability shaped by environmental factors that regulate satellite detection under complex conditions. Physical response mechanisms under varying temperature, soil moisture, and pressure remain insufficiently assessed. Using global gauge precipitation and ERA5-Land reanalysis data, we identified HIT, MISS, FALSE events and examined their differential responses to key environmental variables. We demonstrate that HIT events tend to occur under intermediate environmental conditions, with both products sharing similar responses but GSMaP exhibiting slightly smoother temperature signals and IMERG stronger soil-moisture-related variability. MISS events, linked to colder, wetter backgrounds, are associated with larger spread, while FALSE events arise mainly in warm, dry regimes with low soil moisture and more fluctuations in IMERG. Environmental factors modulate detection, with warmer and wetter conditions favoring HIT and suppressing FALSE, while pressure plays a weaker, secondary role. These findings support satellite-based global hydrology and climate-resilience assessment.

How to cite: Zhou, C., Zhou, L., Brocca, L., and Huang, D.: How environmental conditions influence satellite detection of rainfall events, EGU General Assembly 2026, Vienna, Austria, 3–8 May 2026, EGU26-12514, https://doi.org/10.5194/egusphere-egu26-12514, 2026.

EGU26-13518 | Orals | HS3.4

Trend or persistence: what are we really detecting in annual low-flow time series? 

Gregor Laaha and Johannes Laimighofer

Trends in annual low-flow time series are central to water resources and drought management, yet estimates are strongly affected by serial persistence, and dependence can make persistence appear as trend. We compare nonparametric and parametric methods under short-term autocorrelation and long-term persistence (LTP) and evaluate their reliability with European streamflow data and simulation-based experiments.

For short-term autocorrelation, modified Mann–Kendall approaches with block-bootstrap-based significance correction (BBSMK) and simultaneous bias-corrected prewhitening yield robust results; alternative variants inflate significance and produce implausible findings. Parametric ARIMAX models indicate that, when analyses are based on the water year, only a small share of series require higher autoregressive orders, whereas calendar-year aggregation induces more complex correlation structures and, in turn, unreliable (too low) significance rates.

Under long-term dependence, the nonparametric Mann–Kendall–LTP approach markedly lowers the fraction of significant trends, while FARIMAX models (external trend + LTP) produce similar rates to BBSMK. Yet AIC-based selection typically replaces LTP with short-term autocorrelation, indicating that what appears as persistence is often explainable by short-range dependence.

We finally assess misclassification in parametric and nonparametric trend models under LTP using nature-based simulations across record lengths. Calibrated to stream-gauge records, the simulations test whether series with deterministic trends and short-term autocorrelation—but without true LTP—are misclassified as LTP, and how such misclassification biases trend estimates. Across four scenarios (high/low LTP × significant/non-significant trend), LTP misclassification and trend-detection errors are elevated: with a trend present, short-term autocorrelation is often mistaken for LTP, biasing estimates and reducing power. At hydrologically typical record lengths, errors remain substantial, declining only for extremely long series (1,000–10,000 years); misclassification of short-term correlation as LTP persists even then.

Overall, under common record lengths and dependence structures, deterministic trends are often misinterpreted as long-term persistence—and, conversely, genuine persistence can be mistaken for trend. Therefore, LTP-based trend analyses should be interpreted with caution; typical hydrological records are too short for reliable LTP inference.

How to cite: Laaha, G. and Laimighofer, J.: Trend or persistence: what are we really detecting in annual low-flow time series?, EGU General Assembly 2026, Vienna, Austria, 3–8 May 2026, EGU26-13518, https://doi.org/10.5194/egusphere-egu26-13518, 2026.

This study investigates multilevel flood susceptibility mapping at the national scale in North Macedonia, utilizing 328 historical flood events, 14 conditioning factors derived from a digital elevation model, simplified lithology, and computed direct runoff. The methodology integrates fuzzy set theory (Fuzzy), analytic hierarchy process (AHP), weighted linear combination (WLC), and random forest (RF) approaches. The two-stage process employs distinct sets of conditioning factors in sequential flood susceptibility mapping: first, generating Fuzzy/AHP/WLC predictions and pseudo-absence data, and second, producing five RF predictions by varying pseudo-absences and binary cutoffs. Validation results indicate that the very high susceptibility class (0.8–1.0) of the Fuzzy/AHP/WLC model predicted 46.6% of flood pixels within 31.6% of the total area. In comparison, the very high susceptibility class of the RF models predicted 88.5%, 78.3%, 60.6%, 48.5%, and 28.3% of flood pixels within 54.7%, 42.2%, 30.5%, 27.0%, and 25.1% of the total area, respectively. The RF models achieved area under the curve (AUC) values exceeding 0.850, with a maximum of 0.966. Furthermore, a standard deviation map derived from the RF models identified regions of high and low uncertainty, highlighting areas for potential methodological improvement and targeted sampling. The results also show the promise of the multilevel approach for mapping flood susceptibility and call for more research into its potential for future studies and real-world applications.

How to cite: Gorsevski, P. and Milevski, I.: Multilevel flood susceptibility mapping by fuzzy sets, analytical hierarchy process, weighted linear combination and random forest, EGU General Assembly 2026, Vienna, Austria, 3–8 May 2026, EGU26-14278, https://doi.org/10.5194/egusphere-egu26-14278, 2026.

Spatial statistics provides a principled framework for analyzing environmental variables that exhibit spatial dependence, enabling inference and prediction in systems governed by heterogeneous processes. In many hydrogeological applications, the most informative perspective emerges from fusing complementary datasets, for example, sparse groundwater observations and spatially exhaustive remote sensing products. This data fusion is rarely straightforward because data sources often differ in sampling design, uncertainty, and, crucially, spatial support (the area or footprint represented by a measurement). When observations collected at one support are used to predict at another, the change-of-support problem can induce biased variances and degraded predictions if scale effects are ignored. Here, we integrate groundwater levels from a monitoring network with multi-resolution remote sensing covariates to improve groundwater depth mapping while explicitly accounting for support differences. The study targets groundwater level prediction in Southeast Brazil, where relief compartments and land-use patterns generate strong spatial heterogeneity in recharge and water consumption. We combine in situ groundwater table depths observed at 56 monitoring locations with (i) geomorphological information derived from the 30 m TanDEM‑X dataset and (ii) land-surface water consumption represented by 10 m evapotranspiration estimates from SAFER (Simple Algorithm for Evapotranspiration Retrieving). These covariates encode terrain-driven controls and land-use effects that are not fully captured by point measurements alone. Spatial dependence within and across variables is modeled using the Linear Model of Coregionalization (LMC), enabling coherent estimation of direct and cross-variograms. To ensure consistency across supports, we address support homogenization by regularizing point-support variances and cross-structures to a common block support defined on the prediction grid. This regularized LMC is then used within a collocated block cokriging (CBCK) framework, which applies collocated block covariates to enhance block-scale groundwater predictions. Model performance demonstrates substantial gains from explicitly treating change of support and incorporating multi-resolution covariates. CBCK yields reliable groundwater depth predictions with root mean squared error (RMSE) of 0.41 m, markedly outperforming ordinary block kriging (OBK) estimations (RMSE = 2.89 m) and improving upon prior CBCK implementations that relied on coarser (500 m) evapotranspiration inputs (RMSE = 0.49 m). Beyond accuracy improvements, the resulting maps better reflect the coupling between land-use water demand, terrain-driven controls, and groundwater levels, supporting groundwater management decisions relevant to agronomic planning and ecosystem sustainability. The proposed methodology is transferable to other aquifer systems and can be adapted to alternative remote sensing products and field measurements to explore climate, land use, and hydrogeology interactions across spatial scales.

How to cite: Lilla Manzione, R. and de Oliveira Ferreira Silva, C.: Multi-source data fusion to enhance groundwater levels prediction: merging monitoring networks and orbital remote sensing datasets, EGU General Assembly 2026, Vienna, Austria, 3–8 May 2026, EGU26-22108, https://doi.org/10.5194/egusphere-egu26-22108, 2026.

EGU26-302 | Posters on site | HS3.5

Deep learning–enhanced emulation of hydrodynamic models for improved flood inundation prediction 

Yogesh Bhattarai, Ganesh R Ghimire, and Sanjib Sharma

Floods are among the most frequent and destructive natural disasters. Accurate predictions and timely warnings are critical for mitigating flood risk. However, flood prediction remains challenging due to limited availability of high-resolution data for model calibration and validation, high computational demands for near-real-time simulations, and large uncertainties surrounding sophisticated flood inundation modeling chain. This study focuses on improving riverine flood inundation predictions by leveraging artificial intelligence and machine learning algorithms to fuse data and models, accelerate computation, and automate end-to-end predictive workflow. We develop machine learning based postprocessors to correct systematic biases in hydrodynamic model outputs by learning from historical prediction errors. We also train and evaluate a hybrid Convolution Neural Network architecture coupled with a transformer to produce high-resolution inundation maps, combining local spatial feature extraction with long-range attention mechanisms to capture watershed-scale connectivity. Finally, we construct a surrogate of the fully physics-based GPU-enabled hydrodynamic model, Two-dimensional Runoff Inundation Toolkit for Operational Needs (TRITON) to generate rapid inundation simulations. Our results highlight strong tradeoffs between model complexity (standalone, hybrid, and surrogate modeling approaches), the size and quality of training datasets, available computational resources, and overall prediction accuracy, showing the pathway toward real-time flood inundation forecasting. Improved predictions of flood inundations can provide actionable insights to enhance emergency management, reduce disaster risk, and build community resilience. 

How to cite: Bhattarai, Y., Ghimire, G. R., and Sharma, S.: Deep learning–enhanced emulation of hydrodynamic models for improved flood inundation prediction, EGU General Assembly 2026, Vienna, Austria, 3–8 May 2026, EGU26-302, https://doi.org/10.5194/egusphere-egu26-302, 2026.

EGU26-746 | ECS | Posters on site | HS3.5

A Hybrid Deep Learning Approach: Constructing prediction intervals for Streamflow forecasting 

Pattabiraman Balasundaram and Kasiapillai S Kasiviswanathan

Quantifying reliable uncertainty information in streamflow forecasts is essential for informed decision-making in water resources management and operation. Conventionally deterministic forecasts often fail in decision accuracy and overlook aleatoric uncertainty in the nonstationary hydrological behavior. While hydrological models (conceptual, process-based, empirical) can represent the underlying physical processes, deep learning models come with higher forecast accuracy, substituting the complex processes through complex neural structure. This paper presents a hybrid deep learning (DL) approach to construct reliable prediction intervals (PI) for streamflow predictions optimized through two novel objective functions. The paper applied the variational mode decomposition (VMD) technique on the target streamflow information to capture the underlying nonstationary feature and thus achieve improved predictive accuracy. Subsequently, prediction of each decomposed model are reconstructed using constrained particle swarm optimization (PSO). The developed approach is tested using Long Short-Term Memory (LSTM) model in Contiguous United States (CONUS) under various hydrological setting: i) PI-LSTM with dual objective functions (with and without Data Integration), ii) PI-LSTM-VMD with dual objective functions (with and without Data Integration). The proposed frameworks have yielded reliable predictions achieving median Nash Sutcliffe efficiency (NSE) 0.91 and 0.87 for PI-LSTM (with Data Integration) and PI-LSTM-VMD (with Data Integration) respectively along with the median coverage probability over 90% in both cases. The performances were robust across the basins with relatively minimum prediction width (relative average width) under 0.9 in both cases. Although the LSTM networks are largely beneficial with data integration (DI), the proposed frameworks showed relatively poor performance without DI which further emphasis the necessity to look on the guiding the deep learning models with promising data inputs.

How to cite: Balasundaram, P. and Kasiviswanathan, K. S.: A Hybrid Deep Learning Approach: Constructing prediction intervals for Streamflow forecasting, EGU General Assembly 2026, Vienna, Austria, 3–8 May 2026, EGU26-746, https://doi.org/10.5194/egusphere-egu26-746, 2026.

This study presents a robust streamflow forecasting framework based on an Encoder-Decoder LSTM architecture designed for the Dadu River Basin, a major tributary of the upper Yangtze River with a drainage area of 77,700 $km^2$ and annual precipitation increasing from 600 to 1500 mm northwest-to-southeast. The model integrates multi-source heterogeneous data, including ERA5-Land reanalysis products, local grid precipitation, and historical runoff observations. A key innovation is the State Transfer Module, which maps compressed historical catchment features into the decoder’s initial state to simulate the transformation from antecedent conditions to future runoff processes. The framework was validated across eight reservoirs on the Dadu River main stem, representing diverse regulation capacities including daily, seasonal (Houziyan), and annual (Pubugou) regulation During the 2024–2025 test period, the model achieved an average Mean Relative Error (MRE) of 18.2%, significantly outperforming traditional deterministic (24.7%) and similarity-based (21.0%) methods. Specifically, Nash-Sutcliffe Efficiency (NSE) values reached 0.89 at Houziyan and 0.88 at Pubugou, demonstrating superior skill in capturing flood peaks and recession trends. With minute-level training and second-level inference efficiency, this deep learning approach provides a reliable core technology for long-lead (10-day) operational forecasting and cascaded reservoir management

How to cite: Zhang, R.: Operational Streamflow Forecasting for Cascaded Reservoirs in the Dadu River Basin: A Deep Learning Approach Based on Encoder-Decoder LSTM and Multi-Source Data Integration, EGU General Assembly 2026, Vienna, Austria, 3–8 May 2026, EGU26-1975, https://doi.org/10.5194/egusphere-egu26-1975, 2026.

EGU26-2049 | Posters on site | HS3.5

Deep Learning for Crack Detection in Hydraulic Structures 

Wen-Cheng Liu, Wei-Che Huang, Yen-Ting Yu, Yi-Hong Li, and Bai-Jun Wang

Taiwan is situated in a subtropical region and is surrounded by the ocean, resulting in abundant rainfall and frequent typhoons. As a result, flood-control infrastructure plays a critical role in disaster mitigation. In addition, Taiwan lies within an active seismic zone, where hydraulic structures such as levees and dams are susceptible to earthquake-induced cracking, potentially impairing flood protection and water-supply functions and increasing overall risk. This study develops a crack-detection system for hydraulic structures using the Mask R-CNN deep learning model. The network was trained with 300 images of hydraulic structures and subsequently evaluated using 50 additional images. The proposed system achieved an accuracy of 80%, precision of 81%, recall of 95%, and an F1-score of 88%. Furthermore, the effects of transfer learning on model performance were investigated. The results indicate that two iterations of transfer learning led to notable improvements across all evaluation metrics, confirming that deep learning approaches can provide accurate and efficient crack detection for hydraulic infrastructure.

How to cite: Liu, W.-C., Huang, W.-C., Yu, Y.-T., Li, Y.-H., and Wang, B.-J.: Deep Learning for Crack Detection in Hydraulic Structures, EGU General Assembly 2026, Vienna, Austria, 3–8 May 2026, EGU26-2049, https://doi.org/10.5194/egusphere-egu26-2049, 2026.

EGU26-2512 | Posters on site | HS3.5

Benchmarking fine-tuning strategies for LSTM rainfall-runoff models in the Mekong basin 

Rocco Palmitessa, Connor Chewning, Jakob Luchner, and Elbys Jose Meneses

Neurohydrological models, particularly Long Short-Term Memory (LSTM) networks, are increasingly recognized as valid alternatives to conceptual and physics-based Global Hydrological Models (GHMs). Literature suggests that regionally trained and fine-tuned LSTMs typically outperform models trained exclusively on single catchments. To systematically address the benefits of different fine-tuning strategies, this study tested three approaches across 60 catchments in the Mekong basin. We subsequently compared historical LSTM forecasts with simulations from DHI’s GHM, a well-calibrated physics-based model. The objective was to generate insights regarding when data-driven models demonstrate superiority over physics-based counterparts and to identify which fine-tuning approach is most effective for this region.

The study utilized ERA5 forcing data and HydroATLAS basin properties formatted to the CAMELS standard, combined with streamflow observations from 60 non-public stations across the Mekong basin. We selected an off-the-shelf LSTM model from the NeuralHydrology package, pre-trained on the global CARAVAN dataset, and applied three distinct fine-tuning strategies: direct fine-tuning of the Global model to Local data (GL), fine-tuning to Regional data (GR), and a two-step process fine-tuning first on Regional and then on Local data (GRL). For each model, we performed a hyperparameter sweep to maximize the Kling-Gupta Efficiency (KGE). The dataset was divided into 15 years for training, followed by 5 years for validation and 5 years for testing. Performance was benchmarked against the DHI-GHM using KGE and Nash-Sutcliffe Efficiency (NSE) metrics.

Analysis indicates that the GL approach yields the highest KGE in nearly half of the basins, while the GRL approach proves superior in the remaining half; notably fine, the likelihood of GRL being the best-performing approach increases with basin area. Overall, -tuning LSTMs on both regional and local streamflow (GRL) improved performance compared to strictly regional (GR) or local fine-tuning (GL), with the median KGE increasing from 0.65 to 0.72. While this result does not fully match the overall accuracy of the DHI-GHM in the test period (median KGE of 0.75), the fine-tuned LSTM outperformed the physics-based model in all catchments with poorly described processes—such as irrigation abstraction and infiltration after overtopping—where the DHI-GHM yielded a KGE below 0.6. In well-calibrated catchments, performance was comparable. Furthermore, the performance gap narrows when expressed in NSE, as the LSTM model outperformed the DHI-GHM in terms of mean NSE, despite a lower median NSE.

These findings suggest that while calibrated physics-based models remain robust, neurohydrological approaches offer distinct advantages in representing complex or unmodeled physical processes. The study highlights that the optimal training strategy is scale-dependent, with multi-step fine-tuning providing greater benefits for larger basins. Ultimately, the ability of LSTMs to outperform traditional models in areas with complex anthropogenic or structural challenges suggests they are a vital, complementary tool for enhancing hydrological predictability.

How to cite: Palmitessa, R., Chewning, C., Luchner, J., and Meneses, E. J.: Benchmarking fine-tuning strategies for LSTM rainfall-runoff models in the Mekong basin, EGU General Assembly 2026, Vienna, Austria, 3–8 May 2026, EGU26-2512, https://doi.org/10.5194/egusphere-egu26-2512, 2026.

EGU26-2703 | ECS | Posters on site | HS3.5

HydroForecast: A Deep Learning-Based Probabilistic Flood Forecasting Model 

Bohan Huang, Wentao Li, Zhu Liu, and Qingyun Duan

Floods pose substantial risks to human society and ecosystems, making accurate flood forecasting essential for disaster mitigation and water resources management. However, reliable prediction remains challenging especially in data-scarce regions, where process-based models rely heavily on site-specific calibration and exhibit limited transferability. Here we present a unified global flood forecasting framework that combines systematic catchment attributes screening with a generative deep-learning-based probabilistic hydrological forecasting model, HydroForecast. Through importance ranking and stepwise forward feature selection, the framework first identifies a representative and non-redundant set of catchment attributes. Leveraging these attributes together with meteorological forcings, we construct the HydroForecast model, which directly learns the underlying discharge distribution and generates ensemble predictions without relying on restrictive parametric prior assumptions. Evaluated across more than 3,000 basins worldwide, HydroForecast consistently outperforms a Skewed Laplace–based LSTM benchmark, delivering more accurate flood peak prediction, improved event detection, and reliable uncertainty quantification. Additional analyses demonstrate that our model maintains stable performance in reservoir-regulated basins, while exhibiting pronounced performance differences across climate regimes that reflect the varying degrees of predictive difficulty associated with distinct hydro-climatic conditions. Together, these results highlight the strong potential and reliability of HydroForecast for large-sample flood forecasting and for improving predictive capability in ungauged regions.

How to cite: Huang, B., Li, W., Liu, Z., and Duan, Q.: HydroForecast: A Deep Learning-Based Probabilistic Flood Forecasting Model, EGU General Assembly 2026, Vienna, Austria, 3–8 May 2026, EGU26-2703, https://doi.org/10.5194/egusphere-egu26-2703, 2026.

EGU26-3440 | ECS | Orals | HS3.5

Improving Flood Prediction and Warning through Probabilistic Deep Learning and Reinforcement Learning 

Sanika Baste, Sebastian Lerch, Daniel Klotz, and Ralf Loritz

Deterministic model predictions can struggle to adequately capture extreme events such as floods and droughts, which are of particular relevance in hydrology. This limitation arises because deterministic models collapse the conditional runoff distribution to a single point estimate. Probabilistic modeling provides a promising way to address this issue by explicitly representing uncertainty and assigning non-zero probabilities to a range of possible outcomes, including rare and extreme events, thereby capturing the full range of plausible hydrological responses. Motivated by this perspective, we investigate how long short-term memory (LSTM) based probabilistic models can be used for rainfall–runoff simulation across Switzerland. 

Overall, the probabilistic models show good calibration, although some miscalibration remains at the extremes. Differences between models mainly manifest in how uncertainty is distributed: some approaches produce narrower but lighter-tailed distributions, while others yield broader distributions with heavier tails. These trade-offs highlight that probabilistic models differ not only in sharpness but also in how they represent extreme outcomes. We also observe this trade-off in terms of the models’ single-point accuracy metrics. When evaluating the mean of the probabilistic predictions using the Nash–Sutcliffe efficiency (NSE), none of the probabilistic approaches outperform the deterministic LSTM in terms of average predictive accuracy. However, a clear advantage emerges when focusing on the tail of the discharge distribution. For the most extreme events (top 0.1% of the sorted discharge values), the deterministic LSTM underestimates more than 90% of observed values (since it provides estimates of an expectation), whereas probabilistic predictions can capture a substantially larger fraction of these extremes within their upper predictive bounds. 

Building on the additional information provided by probabilistic runoff predictions, we further show how such forecasts can be translated into discrete and actionable flood warnings using reinforcement learning. To this end, we introduce a Flood Risk Communication Agent (FRiCA) that operates on probabilistic runoff predictions and learns decision rules for issuing warnings of varying intensity. The FRiCA is implemented as an LSTM-based policy network and is trained by rewarding correct warning levels while penalizing the underestimation of flood severity. Results indicate that the FRiCA outperforms simple fixed heuristics, such as issuing warnings based on the predictive mean or a fixed high quantile (e.g., the 99th percentile). While this behavior already demonstrates the potential of reinforcement learning for improved flood risk communication, it also motivates future work toward more flexible and context-dependent decision strategies that adapt to varying hydrological and societal contexts.

How to cite: Baste, S., Lerch, S., Klotz, D., and Loritz, R.: Improving Flood Prediction and Warning through Probabilistic Deep Learning and Reinforcement Learning, EGU General Assembly 2026, Vienna, Austria, 3–8 May 2026, EGU26-3440, https://doi.org/10.5194/egusphere-egu26-3440, 2026.

Deep learning models, such as long-short-term-memory (LSTM) networks, are becoming widely adopted as the tool of choice for rainfall-runoff forecasting, reflecting their impressive performance in goodness-of-fit tests.  Nonetheless it remains unclear exactly how this impressive performance is achieved, and concerns have been raised regarding the functional realism embedded in such models (Bayati et al., 2026) and their ability to extrapolate beyond the range of their training data (Baste et al., 2025).  An underlying problem (with both machine learning models and conventional mechanistic models) is that they are trained and tested almost exclusively using goodness-of-fit measures relative to observed discharge time series.  Such goodness-of-fit tests emphasize some aspects of model behavior but obscure others.


Thirty years ago, Kirchner et al. (1996) proposed a more diagnostic approach to model evaluation, in which the relationships of primary interest are statistically extracted from both the model behavior and the real-world data, and then compared.  When carefully done, this can highlight relationships of interest between the relevant forcing factors and outcome variables.  Here I illustrate this approach by comparing LSTM behavior with real-world rainfall-runoff relationships, using nonlinear and nonstationary impulse response functions from Ensemble Rainfall-Runoff Analysis (ERRA).  These impulse response functions are analogous to classical unit hydrographs, but with the important distinction that they can depend nonlinearly on precipitation intensity and antecedent wetness or other time-varying attributes.  They serve as dynamic fingerprints of how measured and modeled streamflows respond to precipitation, and how that response is shaped by ambient conditions and catchment characteristics.  Examples of this approach, and insights derived from it, will be presented.

How to cite: Kirchner, J.: Assessing behavior and performance of deep learning models using dynamic fingerprints of hydrological behavior, EGU General Assembly 2026, Vienna, Austria, 3–8 May 2026, EGU26-3597, https://doi.org/10.5194/egusphere-egu26-3597, 2026.

EGU26-4532 | ECS | Posters on site | HS3.5

Interpreting LSTM and MC-LSTM internal states with hydrological physics 

Inmaculada González Planet and Carmelo Juez

The use of artificial neural networks (ANNs) in hydrological modelling has gained increasing popularity due to their ability to represent non-linear relationships and complex system dynamics.  In particular, Long Short-Term Memory (LSTM) networks have become the state-of-the-art approach for streamflow simulations, as they incorporate memory cells and gating mechanisms capable of learning both short- and long-term dependencies. However, standard LSTM models have limitations for predicting extreme high-flow events and suffer from limited interpretability due to their lack of explicit physical grounding.

The Mass-Conserving LSTM (MC-LSTM) is a variant of the standard LSTM architecture designed to address the lack of physical consistency by embedding mass conservation directly into the internal model structure. Hence, the information stored in MC-LSTM cell states is expected to correspond more directly to hydrological processes contributing to the basin water balance.

This study analyses and compares the internal processes of standard LSTM and MC-LSTM networks trained on four snowmelt-dominated watersheds located in the Central Spanish Pyrenees. We first evaluate the ability of both models to conserve water volume, showing that the MC-LSTM maintains volumetric consistency due to the imposed physical constraint, whereas the standard LSTM exhibits substantial discrepancies between observed and simulated volumes. We then investigate the learning behaviour of the MC-LSTM using two independent physical datasets not included as model inputs: snow and evapotranspiration (ETO), both of which play a key role in the local water balance. Using a wavelet-based methodology, snow-cells and ETO-cells are identified within the MC-LSTM cell state. Snow-cells exhibit Pearson correlations exceeding 0.5 across all watersheds, while ETO-cells reproduce the observed variability despite low temporal correlation. Furthermore, ETO-cells show a limited contribution to the model output, consistent with their physical role as water losses.

Overall, this analysis highlights the limitations of standard LSTM models in representing volumetric consistency and physical conservation processes, while demonstrating the enhanced physical interpretability of the MC-LSTM architecture, which achieves comparable or superior performance to standard LSTM models while preserving hydrological coherence.

Acknowledgments: This work is funded by the European Research Council (ERC) through the Horizon Europe 2021 Starting Grant program under REA grant agreement number 101039181-SED@HEAD.

How to cite: González Planet, I. and Juez, C.: Interpreting LSTM and MC-LSTM internal states with hydrological physics, EGU General Assembly 2026, Vienna, Austria, 3–8 May 2026, EGU26-4532, https://doi.org/10.5194/egusphere-egu26-4532, 2026.

EGU26-5631 | ECS | Orals | HS3.5

Uncertainty Quantification for Deep Learning Streamflow Reconstruction in Ungauged Basins 

Nicolas Lazaro, Tobias Siegfried, and Sandro Hunziker
Reconstructing historical streamflow in ungauged basins remains a fundamental challenge in hydrology. This is especially true in data-sparse regions where infrastructure planning requires long-term discharge records that do not exist. Deep learning models trained on large-sample datasets can predict streamflow at locations excluded from training. However, a critical question persists: without observations, how can we assess reconstruction reliability? In this work, we develop and evaluate a framework for streamflow reconstruction in truly ungauged basins. We use two recurrent neural network architectures—Long Short-Term Memory (LSTM) and Mamba—trained on globally distributed catchments from the Caravan dataset. Training basins are selected using shape-based time-series clustering with Dynamic Time Warping. This ensures hydrological similarity to target regions. Models are driven by fused multi-source precipitation products (ERA5-Land, CHIRPS, MSWEP, CPC) alongside static catchment attributes. No local calibration is required. We propose ensemble disagreement—the spread among independently trained model instances from cross-validation—as a proxy for reconstruction quality. On a 100-basin holdout set, we demonstrate a negative correlation between ensemble disagreement and Nash-Sutcliffe Efficiency: basins where models agree tend to achieve higher reconstruction skill. This relationship provides practitioners with a principled basis for assigning confidence to streamflow reconstructions in ungauged basins, even in the absence of ground truth.
 

How to cite: Lazaro, N., Siegfried, T., and Hunziker, S.: Uncertainty Quantification for Deep Learning Streamflow Reconstruction in Ungauged Basins, EGU General Assembly 2026, Vienna, Austria, 3–8 May 2026, EGU26-5631, https://doi.org/10.5194/egusphere-egu26-5631, 2026.

EGU26-6492 | ECS | Posters on site | HS3.5

Operational Discharge Forecasting in Central Asia using Deep Learning  

Sandro Hunziker, Nicolas Lazaro, and Tobias Siegfried

Accurate short-term streamflow forecasts are critical for water resources management, hydropower operations, and early warning of hydrological hazards. This need is particularly pronounced in Central Asia, where water is predominantly stored as seasonal snow and glacier ice in the high mountain region and released during the warm season, sustaining extensive irrigated agriculture and hydropower production in the region.  

The Swiss Agency for Development and Cooperation supports the strengthening of the operational hydrological forecasting capabilities of National Hydrometeorological Services across Kazakhstan, Kyrgyzstan, Tajikistan, Turkmenistan, and Uzbekistan (SAPPHIRE Central Asia project). SAPPHIRE co-designs, develops, and deploys operationally open-source forecasting tools that integrate existing and machine-learning-based forecasting methods in these organizations. 

As part of this work, we evaluate the performance of three state-of-the-art time-series forecasting architectures—the Temporal Fusion Transformer (TFT), the Time-Series Dense Encoder (TiDE), and the Time-Series Mixer (TSMixer)—for operational 10-day-ahead streamflow prediction across more than 100 gauges in Kazakhstan, Kyrgyzstan, and Tajikistan. 

The models are trained jointly across all basins within each country to enhance spatiotemporal generalization. Probabilistic forecasts are produced using a quantile loss function, thereby representing aleatoric uncertainty. Model skill is assessed against observed discharge and benchmarked against periodic linear regression models for both 5-day and 10-day averaged forecasts. 

Results indicate that all three deep learning models consistently outperform the existing benchmark approaches, with particularly pronounced improvements at the  
10-day forecast horizon. For example, in Kyrgyzstan and Tajikistan, mean absolute errors get reduced by 30% - 37%. The auto-regressive information from past discharge emerges as the most influential predictor, underscoring its central role in snow- and glacier-melt-dominated runoff regimes of high-mountain Central Asia. 

These advances directly strengthen the forecasting capacity of the Central Asian Hydrometeorological Services and improve the quality of information available to their diverse user base—including national water management authorities responsible for irrigation allocation, hydropower operators optimizing reservoir releases, agencies managing climate-sensitive infrastructure such as roads and airports, and transboundary water management institutions like the Interstate Commission for Water Coordination (ICWC). By demonstrating the operational viability of modern deep learning approaches within existing institutional frameworks, this work contributes to more reliable and actionable hydrological information across one of the world's most water-stressed transboundary regions. 

How to cite: Hunziker, S., Lazaro, N., and Siegfried, T.: Operational Discharge Forecasting in Central Asia using Deep Learning , EGU General Assembly 2026, Vienna, Austria, 3–8 May 2026, EGU26-6492, https://doi.org/10.5194/egusphere-egu26-6492, 2026.

EGU26-7297 | ECS | Posters on site | HS3.5

A deep learning model of river water levels   

Giulia Blandini, Simone Gabellani, Francesco Avanzi, Mirko D'Andrea, Lorenzo Campo, Francesco Silvestro, Marco Falzacappa, Fabio Santamaria, and Luca Ferraris

At the national level in Italy the FloodPROOFs hydrological forecasting chain is operational for flood forecasting, monitoring and emergency management. It is based on the physically based and spatially distributed hydrological model Continuum. While highly reliable, such modelling chains are often computationally demanding, posing limitations for rapid simulations and large-scale operational applications. 

To investigate whether artificial intelligence can support flood forecasting and support and integrate FloodPROOFs with comparable or better skill while significantly reducing computational costs, this study presents an AI-based framework for river water-level emulation designed for operational flood monitoring. The framework integrates a limited yet heterogeneous set of data sources typically available in real-time contexts, including topographic information derived from Digital Elevation Models, meteorological forcings from in situ measurements (precipitation and air temperature), and observed river water levels provided by the National System of Civil Protection and shared in myDEWETRA platform. 

 Convolutional Neural Networks are employed to capture the nonlinear spatial and temporal interactions between terrain characteristics, atmospheric forcing, and hydrological response. The model is trained and fine-tuned using observed water-level time series, enabling the direct simulation of river stage dynamics and the detection of critical threshold exceedances relevant for civil protection warning procedures. 

The proposed framework operates at high spatial resolution over the Italian peninsula while maintaining low computational requirements, making it suitable for near-real-time applications at the centre of the work of the Italian Civil Protection. Its demonstrated generalization capability allows deployment across multiple spatial scales, from individual catchments to regional and national domains. Overall, the results highlight the potential of AI-driven emulators as complementary tools to traditional hydrological modelling chains, enhancing the efficiency and robustness of operational flood forecasting and decision-support systems for civil protection services. 

How to cite: Blandini, G., Gabellani, S., Avanzi, F., D'Andrea, M., Campo, L., Silvestro, F., Falzacappa, M., Santamaria, F., and Ferraris, L.: A deep learning model of river water levels  , EGU General Assembly 2026, Vienna, Austria, 3–8 May 2026, EGU26-7297, https://doi.org/10.5194/egusphere-egu26-7297, 2026.

EGU26-7423 | ECS | Posters on site | HS3.5

Learning 2D Shallow Water Equations with Physics-Informed Neural Operator Networks 

Robert Keppler, Julian Koch, and Rasmus Fensholt

Our study explores the use of Physics-Informed Neural Operators (PINOs) for solving the two-dimensional shallow water equations (2D SWE) in the context of flood modeling. In contrast to Physics-Informed Neural Networks (PINNs), which require retraining for each new set of initial or boundary conditions, PINOs learn the underlying solution operator, enabling rapid inference across a wide range of conditions without retraining.

We assess the performance of PINOs through a sequence of numerical experiments with increasing physical complexity, including a radial dam-break scenario, constant boundary conditions with and without friction, and time-dependent boundary conditions. Existing PINO frameworks were adapted and extended to accommodate these experimental settings.

The results demonstrate that PINOs can accurately capture key flood-relevant dynamics, particularly water depth, while achieving substantial computational speed-ups of up to four orders of magnitude compared to conventional numerical solvers. Relative test errors for water depth were as low as 0.3% for the radial dam-break case, increasing to 10.9% in the presence of bottom topography, 7.3% with friction, and 9.0% under time-dependent boundary conditions. Larger errors were observed for the velocity components.

The combination of competitive accuracy and significant computational acceleration highlights the potential of PINOs for time-critical applications such as flood forecasting. Overall, this work positions PINOs as a promising alternative to traditional numerical solvers for the 2D SWE, offering an effective balance between computational efficiency and solution fidelity. Future research will focus on improving predictive accuracy, expanding the diversity of training functions, and enhancing applicability to real-world flood scenarios.

How to cite: Keppler, R., Koch, J., and Fensholt, R.: Learning 2D Shallow Water Equations with Physics-Informed Neural Operator Networks, EGU General Assembly 2026, Vienna, Austria, 3–8 May 2026, EGU26-7423, https://doi.org/10.5194/egusphere-egu26-7423, 2026.

EGU26-7509 | ECS | Posters on site | HS3.5

Investigating Factors Influencing Upper Bound Performance of ML-Based Streamflow Simulations. 

Ashish Kumar, Sonja Jankowfsky, Edom Moges, Arno Hilberts, Shuangcai Li, and Anongnart Assteerawatt

Machine learning (ML) techniques are transforming hydrological modeling, yet their ability to predict extreme streamflow events remains uncertain. Among these techniques, Long Short-Term Memory (LSTM) networks have emerged as a powerful tool for streamflow prediction, capable of capturing complex temporal dynamics and long-term dependencies inherent in hydrological data. In this study, we aim to identify the factors that influence the upper limit of discharge values simulated by LSTM models—a critical aspect for improving extreme event prediction. This limit is shaped by multiple considerations, including the diversity and quality of training data, model architecture, and optimization objectives. Data preprocessing and calibration strategies further impact performance, while challenges such as input biases and insufficient emphasis on rare events can constrain the model’s ability to capture extremes. Ultimately, predictions remain bounded by physical laws and theoretical principles, ensuring outputs are credible and consistent with real-world hydrological behavior. Understanding these factors provides valuable insights for enhancing model robustness, improving flood risk assessment, and guiding the development of scalable approaches for simulating extreme hydrological events under changing climate conditions.

How to cite: Kumar, A., Jankowfsky, S., Moges, E., Hilberts, A., Li, S., and Assteerawatt, A.: Investigating Factors Influencing Upper Bound Performance of ML-Based Streamflow Simulations., EGU General Assembly 2026, Vienna, Austria, 3–8 May 2026, EGU26-7509, https://doi.org/10.5194/egusphere-egu26-7509, 2026.

EGU26-8409 | ECS | Orals | HS3.5

Spatiotemporal Deep Learning for Snow-Water Equivalent Prediction 

Colin Fenster, Adrienne Marshall, Soutir Bandyopadhyay, and Daniel McKenzie

Automated Snow Telemetry (SNOTEL) networks provide critical hydrologic data with broad global socioeconomic, political, and environmental impacts. In the Western United States and European Alps, Snow Water Equivalent (SWE) is the backbone of the agricultural industry in addition to being a key source of municipal drinking water, making SWE forecasting critical for water policy and management as climate change alters year-to-year accumulation. While process-based snow models have long been used to predict SWE, machine learning approaches have risen to prominence in recent years due to their strong performance relative to observations.

SNOTEL measurements exhibit strong spatial (among neighboring sites) and temporal (day to day) correlations. However, despite the use of modern high-parameter approaches to explain spatial relationships, deep learning methods for SWE prediction fail to account for patterns among proximate locations, thus yielding inaccurate SWE predictions. We propose a novel approach to this problem by first using a Gaussian whitening process to remove spatial correlation from SWE measurements, static station features, and meteorological forcings before leveraging deep learning for temporal prediction; specifically, we train a Long Short-Term Memory (LSTM) model to learn SWE seasonality. This allows the LSTM to learn a clean temporal signal at each location without needing to implicitly approximate the underlying spatial covariance structure. After prediction, we re-introduce spatial dependence through the inverse of the whitening transformation, yielding spatially sound SWE estimates consistent with the original covariance.

The separation of spatial and temporal components makes this model more accurate than previous LSTM and high-parameter methods: we show our low-parameter process attains 22% better predictive success than the daily climatology baseline using Root Mean Squared Error (RMSE) and exceeds predictive accuracy of modern attention-based models with more than 92% of SNOTEL stations achieving Nash-Sutcliffe Efficiency (NSE) values greater than 0.5 while surpassing mean/median NSE of previous field-leading LSTM approaches. The success of this approach for point estimation provides a novel method for SWE accumulation forecasting on subseasonal scales or projecting SWE with future climate change data while motivating and supporting future work in predicting a large-scale, spatiotemporally complete SWE map.

How to cite: Fenster, C., Marshall, A., Bandyopadhyay, S., and McKenzie, D.: Spatiotemporal Deep Learning for Snow-Water Equivalent Prediction, EGU General Assembly 2026, Vienna, Austria, 3–8 May 2026, EGU26-8409, https://doi.org/10.5194/egusphere-egu26-8409, 2026.

EGU26-8698 | Orals | HS3.5

Learning the Kalman Gain: An End-to-End Deep Learning–Kalman Filter Hybrid Framework for Hydrological State Updating 

Yiqun Sun, Xin Tian, Hamid Moradkhani, Qiongfang Li, Peng Shi, Simin Qu, and Qihui Chen

Hydrological data assimilation (DA) is commonly implemented with Kalman-type filters whose performance depends strongly on prescribed (often time-invariant) process and observation error covariances. In real catchments, however, model errors are non-stationary and state-dependent, making covariance tuning difficult and poorly transferable across events and forecast horizons. Pure deep learning models can be flexible but may drift from process constraints and provide limited interpretability for state corrections.

We propose a differentiable deep learning–Kalman filter hybrid DA framework that learns a time-varying Kalman gain inside the recursive loop of a process-based hydrological model. Specifically, we preserve the Kalman-style update structure while an LSTM-based gain module ingests model states and innovations and outputs an assimilation gain for state updating at each time step. The coupled system (physical model + neural gain) is implemented end-to-end and trained via backpropagation through time, enabling adaptive corrections without manual covariance calibration.

We evaluate the framework using hourly data and benchmark against an optimized Unscented Kalman Filter (UKF). The proposed method matches UKF performance at short lead times but shows increasing advantages for longer horizons, consistent with improved control of error accumulation under non-stationary errors. Results demonstrate that the proposed method achieves superior forecast accuracy at the 24-hour lead time (NSE ≈ 0.75), surpassing the UKF benchmark. Crucially, even though both models were optimized primarily for short-term updates, KalmanNet exhibits superior stability in extended rollouts.The results suggest that learning the assimilation gain within a physically based model provides a robust pathway for hydrological DA under complex, state-dependent error dynamics while preserving process constraints through explicit model equations.

How to cite: Sun, Y., Tian, X., Moradkhani, H., Li, Q., Shi, P., Qu, S., and Chen, Q.: Learning the Kalman Gain: An End-to-End Deep Learning–Kalman Filter Hybrid Framework for Hydrological State Updating, EGU General Assembly 2026, Vienna, Austria, 3–8 May 2026, EGU26-8698, https://doi.org/10.5194/egusphere-egu26-8698, 2026.

EGU26-9230 | ECS | Posters on site | HS3.5

Enhancing the Robustness of Deep Learning Hydrological Models in High-Latitude Catchments 

Bilal liaqat, Tua Nylén, Ville Kankare, and Petteri Alho

As climate change accelerates, hydrological models are increasingly required to predict water resources under climatic conditions they have never seen before. While modern data-driven approaches, such as machine learning models, have shown higher accuracy in reproducing historical streamflow, their ability to generalize to unseen future climates remains a critical concern. These data driven models often learn statistical patterns that maximize performance on training data but fail when facing new weather patterns or extreme events. Current research into improving model robustness has largely focused on conceptual models in temperate, rain-dominated catchments. This leaves the applicability of these techniques unverified in high-latitude, snow-dominated catchments, such as Finland. These regions face distinct challenges, particularly the complex, non-linear processes of snow accumulation and melt. Because these processes are highly sensitive to temperature thresholds, standard data-driven models may struggle to capture them consistently when extrapolating to warmer future conditions. Furthermore, widely used stability techniques have rarely been adapted for the specific architecture of machine learning models. This study proposes to investigate whether integrating residual stability constraints, mathematical penalties that force model errors to remain consistent over time, can improve the transferability of AI models in boreal catchments. Rather than relying solely on minimizing error, we aim to explore training schemes that prioritize time-invariance, ensuring that the model's behavior does not degrade significantly between different climatic periods. We outline a framework to test these stability-based training methods on a large dataset of Finnish catchments. By comparing standard AI training against stability-constrained approaches, this research aims to determine if trading a small amount of historical accuracy can yield models that are more physically plausible and robust for future climate scenarios. This work seeks to bridge the gap between advanced machine learning techniques and the unique hydrological needs of cold-climate regions.

How to cite: liaqat, B., Nylén, T., Kankare, V., and Alho, P.: Enhancing the Robustness of Deep Learning Hydrological Models in High-Latitude Catchments, EGU General Assembly 2026, Vienna, Austria, 3–8 May 2026, EGU26-9230, https://doi.org/10.5194/egusphere-egu26-9230, 2026.

EGU26-9982 | ECS | Posters on site | HS3.5

Simulation-based Inverse Mapping Framework for Runoff Prediction 

Min Kwan Choi, Yong Oh Lee, and Dongkyun Kim

While accurate parameter estimation in physically-based hydrological models is critical, applying supervised learning for this purpose presents inherent limitations. This is because supervised learning requires parameter ground truth as labels, yet obtaining spatially complete observations of these physical parameters in real-world basins is practically impossible. To address this challenge, this study proposes a "simulation-based inverse mapping framework" capable of reconstructing the spatial distribution of physical parameters solely from flow data, without relying on observed parameter ground truth. This approach utilizes a physically-based hydrological model as a data generator. The training dataset is constructed by filtering Sobol-sequence-generated parameter candidates; only realistic combinations that satisfy physical constraints—specifically the Budyko water balance and the negative correlation between NDVI and Curve Number (CN)—are selected. Furthermore, the Cross-Entropy Method (CEM) was employed to refine the training data, optimizing for both hydrological plausibility and predictive accuracy. The developed deep learning model is trained to take observed flow time series as input and inversely predict the basin's physical parameter fields (e.g., CN, hydraulic conductivity). When applied to the test period, the model demonstrated high flow reproduction performance with a satisfactory Nash–Sutcliffe Efficiency (NSE). In conclusion, this study demonstrates that by integrating physical modeling processes with the computational power of deep learning, it is possible to effectively estimate hydrological parameters and achieve reliable runoff analysis, even in the absence of parameter ground truth.

How to cite: Choi, M. K., Lee, Y. O., and Kim, D.: Simulation-based Inverse Mapping Framework for Runoff Prediction, EGU General Assembly 2026, Vienna, Austria, 3–8 May 2026, EGU26-9982, https://doi.org/10.5194/egusphere-egu26-9982, 2026.

EGU26-10485 | Posters on site | HS3.5

Assessing robustness and uncertainty in rainfall–runoff modelling using LSTM ensembles 

Andras Bardossy and Ralf Loritz

Long Short-Term Memory (LSTM) networks are widely used for rainfall–runoff modelling and have demonstrated strong performance in regional applications. A key advantage of LSTMs is their ability to learn from large samples of catchments, in contrast to traditional approaches that rely on individual catchment-by-catchment calibration. The objective of this abstract is to assess the robustness of regional LSTM models with respect to their behaviour at the individual catchment scale. To this end, ensemble training and simulation experiments were conducted using the CAMELS-GB and CAMELS-US datasets. An identical LSTM architecture was trained 100 times with different random weight initializations, and model performance was evaluated separately for each catchment. For a substantial number of basins, model performance varied strongly across realizations, with considerably larger variability observed for the CAMELS-US dataset. Excluding catchments with known data quality issues or highly nonlinear responses led only to minor improvements and a modest reduction in performance spread. Furthermore, large differences between validation and test performance were frequently observed, indicating that model skill is often not stable across evaluation periods for individual catchments. The results indicate that uncertainty estimates derived from ensembles of random initializations appear overconfident and do not reflect the full epistemic uncertainty.

How to cite: Bardossy, A. and Loritz, R.: Assessing robustness and uncertainty in rainfall–runoff modelling using LSTM ensembles, EGU General Assembly 2026, Vienna, Austria, 3–8 May 2026, EGU26-10485, https://doi.org/10.5194/egusphere-egu26-10485, 2026.

EGU26-11131 | Orals | HS3.5

Ask me anything: Toward open-purpose modeling in hydrology 

Fedor Scholz, Uwe Ehret, and Anneli Guthke

The recent success of large language models stems in part from the foundation model approach. Foundation models are trained to learn general representations that can be adapted to a range of downstream tasks with little to no retraining. Not having to train a new model from scratch for each task saves resources and accelerates scientific discovery. In this contribution, we present a foundation model approach for probabilistic multivariate geoscientific time series modeling. The proposed neural network architecture learns the joint distribution of multivariate hydrological time series data. This is achieved by training the model to infer subsets of target variables from subsets of predictor variables in an alternating manner. Thereby, the model learns to generate conditional predictions of any involved variable from whatever variables are available. This includes the standard task of predicting discharge from precipitation, but also allows backward inference of variables upstream in the causal pathway. Such anticausal modeling is inherently uncertain. Our approach acknowledges this by its probabilistic variational inference design. We train and evaluate our model on a detailed, heterogeneous, real-world hydrological dataset. We investigate the model's ability to capture dependencies among multiple time series and to accurately reconstruct missing variables with calibrated uncertainty estimates. Furthermore, we compare the performance of our open-purpose model to that of multiple traditional single-purpose models trained for specific inference tasks. Our results suggest that the foundation model approach is feasible in hydrology and allows resource-efficient modeling across diverse inference tasks.

How to cite: Scholz, F., Ehret, U., and Guthke, A.: Ask me anything: Toward open-purpose modeling in hydrology, EGU General Assembly 2026, Vienna, Austria, 3–8 May 2026, EGU26-11131, https://doi.org/10.5194/egusphere-egu26-11131, 2026.

The Upper Yellow River serves as the basin's primary water conservation zone and multi-year regulation reservoir. However, the region exhibits frequent alternations between persistent wet and dry cycles, along with abrupt regime shifts, which significantly amplify the uncertainty and complexity of water resource regulation. Under these complex conditions, traditional hydrological models often suffer from deteriorating forecast accuracy and limited lead times, failing to support precise and adaptive decision-making. To address these challenges, this study proposes a Physics-AI coupled framework that integrates Knowledge Graphs (KG) with Large Language Models (LLMs) to create a closed loop from perception to decision-making. First, a multimodal KG was constructed to standardize heterogeneous data and, more critically, to encode hydrological evolution rules as logical constraints for physical reasoning. Driven by this cognitive foundation, we developed a multi-scale forecasting system: the Parallel LSTM-and-Sequence-GPT (PLSG) for daily-scale medium-term forecasting, and the physics-informed Hydro-LSTM for monthly-scale long-term runoff reconstruction. To bridge the gap between forecasting and operation, accurate runoff inputs are integrated into a Mixture of Experts (MoE) framework. Here, autonomous agents dynamically configure scheduling workflows to execute multi-objective optimization, ensuring adaptability across diverse hydrological scenarios. Validation results show that the PLSG model improved 15-day forecast accuracy by 31.3% against baselines, while Hydro-LSTM achieved a NSE of 0.65–0.857. This framework not only enhances forecast resilience but also enables autonomous multi-objective optimization with transparent decision-making pathways, providing a robust and interpretable tool for complex water system management.

How to cite: Hou, M. and Wei, J.: Coupling Knowledge Graphs with Large Language Models for Integrated Runoff Forecasting and Reservoir Operation: A Case Study of the Upper Yellow River, EGU General Assembly 2026, Vienna, Austria, 3–8 May 2026, EGU26-12011, https://doi.org/10.5194/egusphere-egu26-12011, 2026.

EGU26-12266 | ECS | Posters on site | HS3.5

Probabilistic streamflow prediction in ungauged natural catchments with Temporal Fusion Transformers 

Rafael Francisco and José Pedro Matos

Accurate prediction of streamflow is essential for sound water resources management but remains a complex task due to the dynamic nature of hydrological processes, imprecision in meteorological data, and measurement challenges. Recent advancements in deep learning have demonstrated the potential of data-driven models to extract and identify complex temporal dependencies in large hydro-meteorological datasets (e.g. [1-2]).

This work evaluates the ability of Temporal Fusion Transformers (TFTs) to predict daily streamflow across catchments in Mainland Portugal, using meteorological input data derived from ERA5-Land (reanalysis dataset) and geomorphological descriptors. TFTs are a relatively novel deep-learning architecture that is being explored in hydrology (e.g., [3-4]). It incorporates the well-tested Long Short-Term Memory (LSTM) architecture with transformers, potentially offering possibilities of improved performance and partial explainability of predictions.

The methodology for the application to ungauged catchments relies on straightforward cross-validation with holdout samples. Although all considered catchments are monitored by gauging stations, streamflow observations at the various locations are selectively hidden from the model during calibration and validation, allowing a full controlled emulation of ungauged conditions on the test subsets.

Model performance is benchmarked against calibrated Hydrologiska Byråns Vattenbalansavdelning (HBV) hydrological models. Results show that TFTs achieve comparable predictive skill in ungauged settings when compared to locally calibrated HBV counterparts, while providing probabilistic predictions with limited explainability.

The capability for specialization is also investigated. Indeed, it is shown that retraining a general-purpose “ungauged” TFT on a previously unknown time series, even with only a limited number of observations, can lead to substantial improvements in predictive skill.

The proposed framework offers a practical and scalable solution for streamflow estimation in data-scarce and ungauged catchments. By relying on globally available data and static catchment characteristics, the approach can be transferred to regions with limited measurement networks, reducing dependence on long-term observations. The probabilistic outputs further enhance decision-making by explicitly quantifying predictive uncertainty, a critical factor for risk-informed planning, supporting operational water resources management and early warning systems.

[1] Kratzert, F., Klotz, D., Brenner, C., Schulz, K., and Herrnegger, M.: Rainfall–runoff modelling using Long Short-Term Memory (LSTM) networks, Hydrol. Earth Syst. Sci., 22, 6005–6022, https://doi.org/10.5194/hess-22-6005-2018, 2018.

[2] Frame, J. M., Kratzert, F., Klotz, D., Gauch, M., Shalev, G., Gilon, O., Qualls, L. M., Gupta, H. V., and Nearing, G. S.: Deep learning rainfall–runoff predictions of extreme events, Hydrol. Earth Syst. Sci., 26, 3377–3392, https://doi.org/10.5194/hess-26-3377-2022, 2022. 

[3] Koya, S. R., Roy, T.: Temporal Fusion Transformers for streamflow prediction: Value of combining attention with recurrence. J. Hydrol., 637, 131301. https://doi.org/10.1016/j.jhydrol.2024.131301, 2024.

[4] He, M., Jiang, S., Ren, L., Cui, H., Qin, T., Du, S., Zhu, Y., Fang, X., Xu, C.: Streamflow prediction in ungauged catchments through use of catchment classification and deep learning. J. Hydrol., 639, 131638. https://doi.org/10.1016/j.jhydrol.2024.131638, 2024.

How to cite: Francisco, R. and Matos, J. P.: Probabilistic streamflow prediction in ungauged natural catchments with Temporal Fusion Transformers, EGU General Assembly 2026, Vienna, Austria, 3–8 May 2026, EGU26-12266, https://doi.org/10.5194/egusphere-egu26-12266, 2026.

EGU26-12499 | ECS | Posters on site | HS3.5

Integration of Generated Weather Data into LSTM Training to Improve the Simulation of Extreme Flood Events 

Paul Reis, Alexander Dolich, Antara Dasgupta, Paul Hassenjürgen, Sergiy Vorogushyn, Viet Dung Nguyen, and Ralf Loritz

Deep learning, especially Long Short-Term Memory (LSTM) networks, has become popular in recent years for rainfall-runoff modelling. However, recent studies show that LSTM performance is constrained by a theoretical threshold, limiting the simulation of extreme discharge events. While the internal structure of the LSTM is one contributing factor, another contributor is the limited availability and diversity of hydro-meteorological training data of extremes, as major floods only represent a small fraction of the observed data.

To mitigate the underrepresentation of extreme hydrological events in the training data, this study investigates the effectiveness of data augmentation for rainfall-runoff modelling with LSTMs. Pre-generated artificial meteorological time series from the non-stationary climate-informed weather generator (nsRWG) are used to increase the representation of extreme events in the training data. The study area covers the region of North Rhine-Westphalia, Germany, and consists of 100 alternative precipitation and temperature scenarios spanning the past 70 years. Discharge for the catchments is simulated using an HBV model based on the nsRWG outputs. By combining observed time series from the CAMELS-DE dataset with artificial samples, the training set is enriched with additional extreme events, including samples that are more extreme in magnitude than those in the observed data. This augmented dataset is used to assess whether model performance in predicting extreme events can be improved. We aim to (1) assess whether data augmentation can shift the theoretical threshold limit of the LSTM, (2) quantify this limit, (3) optimize the integration of the weather generator data during training, and (4) evaluate overall predictive performance and, in particular, whether the prediction of extreme floods improves with the augmented training data.

How to cite: Reis, P., Dolich, A., Dasgupta, A., Hassenjürgen, P., Vorogushyn, S., Nguyen, V. D., and Loritz, R.: Integration of Generated Weather Data into LSTM Training to Improve the Simulation of Extreme Flood Events, EGU General Assembly 2026, Vienna, Austria, 3–8 May 2026, EGU26-12499, https://doi.org/10.5194/egusphere-egu26-12499, 2026.

Deep learning rainfall–runoff models can achieve high predictive accuracy, yet still rely on correlation-driven shortcuts that are not defensible as catchment-scale mechanisms. This raises a central question: how far can correlation-driven learning be trusted to produce simulations that are hydrologically realistic, not just statistically accurate? To address this, we evaluate functional realism, defined as the extent to which a model’s internal functioning aligns with defensible mechanisms of streamflow generation. We propose a hydrology-specific Explainable AI (XAI) framework that extracts nonlinear, lag-dependent, time-varying impulse response functions (IRFs) describing how an LSTM internally maps isolated impulses in precipitation (P), temperature (T), and PET to simulated streamflow. Applied to 672 North American catchments where the LSTM demonstrated strong predictive skill, the IRFs reveal systematic functional inconsistencies masked by accuracy: in over 70% of rain-dominated catchments, short-term rises in T are associated with increased simulated streamflow and enhanced celerity even without rainfall; in snow-dominated catchments, PET is frequently treated as a proxy driver of snowmelt-related flow. We then discuss plausible origins of spurious functional learning, including seasonal confounding, heterogeneous regime mixing during training, simplicity bias (shortcut learning), and omitted drivers or missing processes. We also outline practical routes to reduce spurious learning by directly addressing these sources through input handling, regime-aware training, and targeted model adjustments.

How to cite: Bayati, A., Ameli, A. A., and Razavi, S.: Interrogating the Functional Realism of Deep Learning Rainfall–Runoff Models: Diagnostic Insights and Mitigation Strategies, EGU General Assembly 2026, Vienna, Austria, 3–8 May 2026, EGU26-13847, https://doi.org/10.5194/egusphere-egu26-13847, 2026.

Deep learning models are increasingly used for operational river discharge forecasting, yet it remains unclear which hydrological processes their internal representations actually encode. Here, we show that high forecast skill can arise even when hydrological routing dynamics are statistically hidden in raw discharge time series and therefore not learnable by LSTM models.

In a multi-station river network, we find that the discharge field is overwhelmingly dominated by a synchronous storage (“bathtub”) mode, while routing-related variability is confined to weak components that are masked by noise and synchrony. Inter-station delays are small relative to this dominant variability, causing propagation signals to be effectively indistinguishable in the raw time series.

We demonstrate this using a sequence of pre-model diagnostics. Principal component analysis (PCA) shows that nearly all variance is explained by the synchronous storage mode. Cross-correlation analysis and signal-to-noise ratio (SNR) diagnostics confirm that routing signals have low visibility relative to dominant low-frequency variability. When the data are transformed into an innovation representation using a vector autoregressive (VAR) model, routing-related structure becomes more apparent, indicating that it is masked rather than absent.

Consistent with these data-space constraints, LSTM models trained on raw discharge time series achieve high predictive skill by exploiting short-term correlations and high-SNR inputs rather than learning propagation dynamics. SHAP attribution analysis shows that the same correlation-driven features dominate predictions across all forecast horizons, with increasing attribution at longer lead times reflecting growing uncertainty rather than newly learned hydrological structure. More generally, this implies that claims of physical learning by data-driven models require that the relevant dynamics are statistically identifiable in the data; model complexity and interpretability cannot recover processes that are masked by dominant variability.

These results demonstrate a clear separation between predictability and learnability: when synchronous variability dominates the data, routing dynamics are statistically inaccessible to sequence models trained on raw time series. They highlight a common but often implicit assumption in recent machine-learning application, that the chosen data representation already exposes the relevant physical structure. In Earth system applications, this assumption frequently fails. Without pre-model identifiability checks, increasing architectural complexity primarily reinforces dominant shortcuts rather than revealing new process information, leading to models that are inherently sensitive to distributional shift and brittle under non-stationary conditions.

How to cite: Korving, H.: High Skill, Shallow Learning: Why Hydrological Routing Is Not Learnable from Raw Time Series by LSTMs, EGU General Assembly 2026, Vienna, Austria, 3–8 May 2026, EGU26-13955, https://doi.org/10.5194/egusphere-egu26-13955, 2026.

EGU26-15643 | ECS | Orals | HS3.5

Deep Learning the River Network: Message-Passing LSTMs for Robust Stream Water Temperature Prediction  

Claudia Corona, Henry Johnson, Daniel Philippus, and Terri Hogue

Predicting stream water temperature (SWT) under non‑stationary hydroclimatic conditions is essential for ecosystem management yet remains challenging for deep learning applications in hydrology due to spatially structured network processes and disturbance‑driven variability. We present a graph‑informed deep learning framework that combines Long Short‑Term Memory (LSTM) networks with message passing and multi‑head attention to jointly capture temporal dynamics and upstream connectivity for daily SWT forecasting. 

Sagehen Creek, a snowmelt‑dominated montane watershed in the northern Sierra Nevada (California, United States, U.S.), served as a benchmark for evaluating robustness in climate‑sensitive mountain systems. Its pronounced seasonality, groundwater influence, and sensitivity to climate variability provide an ideal setting to assess model robustness in underrepresented montane systems and demonstrate practical scalability to larger river networks. The architecture integrates shared LSTM layers for temporal feature extraction with a graph‑based message‑passing module that weights upstream contributions via multi‑head attention. Inputs include meteorological drivers (air temperature, precipitation, solar radiation), land cover, elevation, and seasonality (day of year), derived from long‑term observations and national datasets. Hyperparameters were tuned using Bayesian methods to improve model accuracy and reliability. Applied to Sagehen Creek and thousands of gages across the U.S., the model achieves strong performance in gaged settings (RMSE ≈ 1.32°C) and maintains comparable skill in ungaged scenarios (RMSE ≈ 1.35 °C), demonstrating generalization across heterogeneous basins. Explicit representation of seasonality improves predictions of extremes, and attention weights provide insight into upstream influence. 

Overall, this work advances deep learning in hydrology by introducing a scalable, network‑aware architecture suited to non‑stationary conditions, employing structured training methods to improve reliability, and enabling ungaged predictions with minimal reliance on local observations. These results demonstrate the potential for network‑aware deep learning approaches to support more flexible and transferable hydrologic prediction strategies as environmental conditions evolve. Future work aims to include systematic comparisons with traditional statistical models to better contextualize performance gains and clarify where deep learning provides distinct advantages for SWT forecasting. 

How to cite: Corona, C., Johnson, H., Philippus, D., and Hogue, T.: Deep Learning the River Network: Message-Passing LSTMs for Robust Stream Water Temperature Prediction , EGU General Assembly 2026, Vienna, Austria, 3–8 May 2026, EGU26-15643, https://doi.org/10.5194/egusphere-egu26-15643, 2026.

Long Short-Term Memory (LSTM) networks have recently emerged as a leading deep learning architecture for hydrological forecasting due to their ability to represent nonlinear and long-term dependencies in time series data. However, the selection of input variables and temporal lags for LSTM networks is often heuristic and characterized by the inclusion of all available forcings and wide lag windows. This practice can yield over-parameterized models that are prone to overfitting. Causal discovery–based feature selection offers a principled alternative to heuristic input configuration. While these methods have shown promise in improving model interpretability and generalization in statistical and machine learning contexts, their integration with deep learning architectures remains underexplored. Here, we present a workflow that integrates causal inference for time series as a preprocessing step for LSTM-based hydrological forecasting in an operational hydropower context. Using subdaily multivariate hydroclimatic time series from the Lake Erie basin in Ontario, Canada, we apply the PC-MCI algorithm to infer directed causal relationships and characteristic temporal lags among streamflow, lake levels, meteorological forcings, and hydropower-relevant predictor variables. The resulting causal graphs provide a model-agnostic, interpretable basis for defining the predictor sets and lag structures that form the input configuration of an encoder–decoder LSTM model. Ongoing work evaluates whether causally informed configurations improve forecast skill and generalization relative to conventional variable‑selection strategies and assesses the computational and operational trade-offs of the proposed workflow.

How to cite: Myrol, L. and Adamowski, J.: Causally Informed Input and Lag Selection for LSTM-based Hydrological Forecasting in the Lake Erie Basin, EGU General Assembly 2026, Vienna, Austria, 3–8 May 2026, EGU26-15905, https://doi.org/10.5194/egusphere-egu26-15905, 2026.

EGU26-15929 | Orals | HS3.5 | Highlight

The Hydrologic Modeler’s Evolving Role in the Age of AI 

Alden Keefe Sampson

Our community has defined its expertise by the ability to construct, calibrate, and refine complex modeling processes. Now, agentic coding tools and off-the-shelf time series foundation models are dramatically reducing the time and effort required to produce a streamflow model or prediction. As we enter the age of AI, where should human hydrologists focus, and what is our role in the modeling process?

We are moving away from the increasingly commodified nuts and bolts of model building and toward a role defined by scientific judgment. While this shift implies the loss of an aspect of our jobs many of us love, the roles that remain are increasingly impactful and important, and perhaps even more fun. I argue that two roles are becoming central and share examples of how they are already being practiced effectively. First, precise problem definition and success criteria: what should we create, and how do we know if it worked? Second, bridging users and science: assessing model fitness for use, mapping societal water problems to available solutions, and helping decision makers synthesize a proliferation of data.

As other aspects of our work become faster, this talk will highlight skills like modeling intuition, clear specification writing, data curation, and technical communication, and discuss how hydrologic scientists can build strength in areas that will maximize impact in the dynamic years ahead.

How to cite: Sampson, A. K.: The Hydrologic Modeler’s Evolving Role in the Age of AI, EGU General Assembly 2026, Vienna, Austria, 3–8 May 2026, EGU26-15929, https://doi.org/10.5194/egusphere-egu26-15929, 2026.

Gradient-based methods are increasingly used in hydrologic model calibration, data assimilation, and hybrid physics–machine learning frameworks. However, most existing approaches rely on finite differences, automatic differentiation, or surrogate emulators, which are computationally expensive, memory-intensive, and sensitive to numerical noise, especially for long time series and nontraditional objective functions. We present a general framework for exact, scalable gradient computation in conceptual hydrologic models based on analytic forward sensitivity equations. By augmenting the governing ODEs with sensitivity states, a single model integration simultaneously yields hydrologic states, fluxes, and the full parameter Jacobian. These sensitivities are independent of the objective function, enabling exact gradients for any differentiable loss, including least squares, absolute residuals, NSE, KGE, flow-duration-curve metrics, and robust M-estimators, without re-running the model or invoking automatic differentiation. We implement this approach in a suite of widely used conceptual models (including HBV, HYMOD, Hmodel, GR4J, SAC-SMA, and Xinanjiang) within a unified computational framework with a high-performance C++ core and MATLAB/Python interfaces. We demonstrate its scalability using a large-sample experiment based on the CAMELS data set, comprising 671 catchments across the contiguous United States. Compared to automatic and numerical differentiation, our approach reduces calibration times from hours to minutes while improving numerical stability, convergence behavior, and interpretability. This work establishes analytic forward sensitivities as a transparent, physics-consistent, and computationally efficient foundation for large-sample hydrology and process-based model learning.

How to cite: Vrugt, J. and Frame, J.: Exact and scalable gradient-based learning of conceptual hydrologic models using analytic forward sensitivities, EGU General Assembly 2026, Vienna, Austria, 3–8 May 2026, EGU26-15984, https://doi.org/10.5194/egusphere-egu26-15984, 2026.

EGU26-16720 | ECS | Orals | HS3.5

Is it ready to apply Large Language Models to frontline hydro practice? Taking the flooding forecasting agent as an example 

Baoying Shan, Qingyi Yang, Jia Feng, Shunan Zhou, Xun Zhang, Xudong Zhou, Haiqing Pu, Siqian Qiu, Yongkang Xu, Xu Shan, Xiaoyi Dong, Nuo Lei, Haiyang Qian, Bing Li, and Carlo De Michele

The rapid advancement of Large Language Models (LLMs) has triggered transformative changes across many domains, yet their application in operational hydrology forecasting remains largely unexplored. This raises a question: can LLMs meaningfully support frontline hydrological practice?

Flood forecasting provides an ideal testbed for this question. In operational settings, real-time forecasting relies heavily on forecasters' subjective judgment: interpreting meteorological patterns, assessing antecedent soil moisture, and making rapid decisions under deep uncertainty. While numerical hydrological models provide quantitative process simulations, the systematic and scalable cognitive expert judgment component still remains challenging. Moreover, operational demands for around-the-clock availability and consistent quality challenge the limited labour capacity.

Building on recent LLM advances, we present an intelligent flood forecasting agent that bridges this gap. The system integrates LLM reasoning capabilities with structured hydrological workflows, combining professional reproducibility with adaptive flexibility. A natural language interface enables forecasters to interact using everyday expressions, substantially lowering adoption barriers. The agent is currently undergoing systematic testing in a representative catchment. Preliminary results demonstrate promising consistency and robustness.


How to cite: Shan, B., Yang, Q., Feng, J., Zhou, S., Zhang, X., Zhou, X., Pu, H., Qiu, S., Xu, Y., Shan, X., Dong, X., Lei, N., Qian, H., Li, B., and De Michele, C.: Is it ready to apply Large Language Models to frontline hydro practice? Taking the flooding forecasting agent as an example, EGU General Assembly 2026, Vienna, Austria, 3–8 May 2026, EGU26-16720, https://doi.org/10.5194/egusphere-egu26-16720, 2026.

Deep learning models based on Long Short-Term Memory (LSTM) networks are increasingly applied in rainfall runoff modeling, yet their behavior in heavily glacierized catchments remains understudied. We train a regional, lumped LSTM model for 49 glacier and snowmelt influenced catchments in Iceland using the LamaH-Ice dataset, driven by a regional atmospheric reanalysis and informed by static catchment attributes. We assess model performance in these basins, examine whether cryospheric processes are learned implicitly from streamflow alone, evaluate the role of static attributes, and test whether multitask learning with cryospheric targets improves discharge predictions.

We find that the model predicts daily streamflow robustly across most basins, achieving high skill during the test period. Model skill remains largely unchanged when physiographic attributes are randomly shuffled or replaced by simple climate statistics, but declines noticeably when static attributes are omitted. Counterfactual experiments in which glacier fraction is set to zero show summer discharge reductions that increase with the degree of glacier coverage. Using linear probes, we show that the LSTM implicitly learns signals related to remotely sensed snow cover and glacier albedo when trained only on streamflow.

We further explore a multitask learning configuration in which the LSTM is trained to predict both streamflow and satellite derived snow cover. The linear probes reveal that this setup improves the model’s internal representation of cryospheric variables but does not improve discharge predictions compared to a single task streamflow model.

Overall, we demonstrate that LSTM based hydrological models can simulate streamflow skillfully in glacierized catchments, with static catchment attributes supporting physical interpretation of model behavior. We further show that these models can internalize physically meaningful cryospheric information without explicit supervision, while highlighting limitations of multitask learning using remote sensing observations for improving streamflow predictions in glacierized catchments.

How to cite: Helgason, H. B. and Nijssen, B.: Hydrological modeling with LSTMs in glacier and snowmelt fed catchments: the role of catchment attributes and multitask learning, EGU General Assembly 2026, Vienna, Austria, 3–8 May 2026, EGU26-18516, https://doi.org/10.5194/egusphere-egu26-18516, 2026.

EGU26-19024 | ECS | Posters on site | HS3.5

Data-driven reconstruction of Amazon water levels with deep learning leveraging river topology 

Ruben Cartuyvels, Karim Douch, and Diego Fernandez Prieto

Data-driven models are emerging as complementary approaches to numerical methods across the Earth sciences, offering the potential to be computationally efficient and free from physical parameterization bias. We present a neural network trained only on observations, integrating spatially and temporally sparse data from various altimeter instruments, to predict a dense reconstruction of water levels for the Amazon River network. Dense estimates for water level can enable better parameterizations of hydraulic models as well as accurate modeling of discharge in small- to medium-sized catchments.

The Amazon basin hosts the largest rainforest in the World, making the monitoring of its rivers particularly important. Historical records of water level rely on in-situ flow gauges maintained by basin authorities (e.g. ANA in Brazil), offering temporally dense but geographically sparse observations. Since the 1990s, satellite altimetry has provided global yet sparse observations in ungauged areas. The recent SWOT mission introduces unprecedented spatial density thanks to its wide-swath InSAR sensor but lacks historical depth. To synthesize these disparate sources into a homogeneous product, we train an attention-based graph neural network for spatial and temporal densification via masked reconstruction. The model is trained to predict SWOT measurements conditioned on classical altimetry for 2023-2025, so it learns to infer the denser measurements taking only classical altimetry as input. River topology information from the SWORD database determines the decoding order and sparsifies attention interactions in the model architecture, with the aim of learning spatiotemporal dynamics in a physically consistent manner.

We empirically validate the model on spatially and temporally held-out evaluation sets that include in-situ measurements from ANA gauges and benchmark it against an existing hybrid statistical-physical approach. We predict a first version of a reconstruction consisting of daily water level estimates for every SWOT reach in the Amazon basin between 2000 and 2025. This study contributes to the development of neural networks that unify sparse, non-overlapping sensor data without relying on physical approximations. In the future we will integrate complementary observations such as river width derived from imagery or SAR, and extend the framework to other major river basins globally.

How to cite: Cartuyvels, R., Douch, K., and Fernandez Prieto, D.: Data-driven reconstruction of Amazon water levels with deep learning leveraging river topology, EGU General Assembly 2026, Vienna, Austria, 3–8 May 2026, EGU26-19024, https://doi.org/10.5194/egusphere-egu26-19024, 2026.

EGU26-19178 | ECS | Posters on site | HS3.5

A scalable, spatially distributed approach to runoff simulation and river routing 

Basil Kraft, Martina Kauzlaric, Aeberhard William H., Zappa Massimiliano, and Gudmundsson Lukas

We introduce DROP (Deep Runoff Prediction and Propagation), a scalable deep learning framework for spatially distributed runoff simulation and river routing across large hydrological networks. Reliable representation of runoff generation and streamflow propagation is critical for hydrological forecasting and water resources management, yet remains computationally challenging at high spatial resolution. DROP addresses this challenge by jointly learning runoff dynamics and downstream flow propagation within a single, spatially explicit modeling framework.

The model is trained on daily discharge observations from 273 gauged catchments in Switzerland, covering more than 22,000 drainage units at approximately 2 km² resolution. Using static drainage unit attributes and meteorological forcings, DROP predicts local runoff and routes flow through the river network. The architecture is designed for computational efficiency and generalization across very diverse hydrological regimes, enabling domain-wide simulations without basin-specific calibration.

Evaluation across multiple spatial experiments shows that DROP substantially outperforms baseline deep learning models (lumped LSTMs), achieving relative improvements of up to 60 % in discharge performance metrics (Kling–Gupta Efficiency; KGE) for catchments not seen during training. The model enables rapid inference, allowing simulation of daily discharge over the full domain within seconds on a single GPU. These results demonstrate that spatially explicit deep learning models can provide accurate, efficient, and scalable alternatives to traditional hydrological models for large-scale runoff simulation and river routing, with strong potential for integration into operational forecasting and Earth system modeling frameworks.

How to cite: Kraft, B., Kauzlaric, M., William H., A., Massimiliano, Z., and Lukas, G.: A scalable, spatially distributed approach to runoff simulation and river routing, EGU General Assembly 2026, Vienna, Austria, 3–8 May 2026, EGU26-19178, https://doi.org/10.5194/egusphere-egu26-19178, 2026.

EGU26-19179 | Orals | HS3.5

A Physics-consistent Foundation Model for Learning Earth Surface Dynamics 

Qingsong Xu, Jonathan L. Bamber, Paul Bates, and Xiao Xiang Zhu
Accurate prediction of climate-driven land–surface responses is crucial for effective natural resource management, hazard mitigation, and adaptation to growing societal pressures. Existing environmental models, including both process-based approaches and task-specific machine learning methods, often exhibit limited spatial transferability due to sparse observations, structural rigidity, or sensitivity to non-stationary climate conditions. Recently, foundation models have demonstrated emergent capabilities that surpass those of task-specific systems, offering a unified paradigm adaptable to diverse Earth surface processes. However, most existing Earth foundation models (e.g., TerraMind, Prithvi, DOFA, Pangu, and Aurora) primarily scale model size without adequately addressing computational efficiency or embedding the intrinsic physical laws within the large data.

We introduce EarthDynamics, a physics-consistent foundation model for learning Earth surface dynamics that integrates physical priors with computational efficiency. EarthDynamics comprises three interrelated components. First, multi-modal encoding schemes are developed to jointly represent dynamic meteorological forcings, such as precipitation and temperature, and static geophysical attributes, including watershed properties and terrain characteristics. Second, a physics-consistent Transformer architecture is designed to explicitly embed physical constraints, including conservation laws and first-order derivatives, within the pretraining framework, thereby enhancing generalization, improving computational efficiency, and reducing dependence on large training datasets. Third, task-specific head networks enable multi-scale and multi-task inference of key environmental variables, including water levels, streamflow, and landslide occurrence.

Through the integration of these components, EarthDynamics provides a unified and extensible framework for process-informed forecasting across Earth surface systems. The model demonstrates robust performance across a wide range of dynamic tasks, including spatiotemporal simulations of geodynamic processes (e.g., shallow water equations and the Navier–Stokes equations), as well as real-world applications such as flood dynamics, landslide dynamics, rainfall–runoff process, and soil moisture forecasting. EarthDynamics consistently outperforms state-of-the-art supervised learning approaches and fine-tuned vision-based foundation models. EarthDynamics has the potential to serve as foundational infrastructure for water resource management, flood risk assessment, and environmental protection, enabling reliable and scalable predictions under climate change from regional to global scales.

How to cite: Xu, Q., Bamber, J. L., Bates, P., and Zhu, X. X.: A Physics-consistent Foundation Model for Learning Earth Surface Dynamics, EGU General Assembly 2026, Vienna, Austria, 3–8 May 2026, EGU26-19179, https://doi.org/10.5194/egusphere-egu26-19179, 2026.

EGU26-19382 | ECS | Posters on site | HS3.5

Coupling Rainfal-Runoff and Shallow-Water Hybrid Models: A Reliability Test of Piecewise Versus End-to-End Learning 

Sarth Dubey, Shaonli Mishra, and Udit Bhatia

River-fed urban flooding is highly sensitive to boundary inflow hydrographs, yet many cities lack streamflow gauges at the location where the river enters the city. In such settings, inundation is typically governed by a coupled chain of processes: (a) routing from the nearest upstream gauge, (b) rainfall-driven lateral inflows from the intervening catchment, and (c) shallow-water dynamics within the city. Recent advances have progressed independently in deep learning and differentiable or hybrid formulations for each component, but this raises a central question: when these models are coupled, do errors propagate transparently, or do they compensate in ways that appear accurate while remaining physically biased? A key gap is demonstrating whether end-to-end coupling improves urban flood predictions or instead amplifies uncertainty and bias across modules.

We develop a hybrid framework that couples these three modules and supports both piecewise (module-wise) training and joint end-to-end learning, enabling explicit diagnosis of error propagation. A synthetic training dataset is generated using physics-based flood simulations to provide consistent supervision for runoff generation, routing behaviour, and inundation response. Evaluation then focuses on historical flood events in Surat, Gujarat, using remote-sensing inundation extent maps as an event-scale observational benchmark. The experimental design is structured to isolate the marginal effect of coupling by tracking how uncertainties in lateral inflow and routing translate into boundary hydrograph bias and, ultimately, mismatch in predicted inundation extent.

The analysis is framed around reliability rather than raw accuracy: it investigates when end-to-end coupling reduces boundary-condition uncertainty versus when it enables compensating errors that mask upstream bias at the urban scale. By comparing independently assessed sub-modules against the coupled system, the study aims to clarify how errors accumulate across the hydrology-to-inundation pipeline and under which hydrologic regimes. This provides a pathway toward reliable and rapid end-to-end hybrid systems for river-fed urban flood modeling.

How to cite: Dubey, S., Mishra, S., and Bhatia, U.: Coupling Rainfal-Runoff and Shallow-Water Hybrid Models: A Reliability Test of Piecewise Versus End-to-End Learning, EGU General Assembly 2026, Vienna, Austria, 3–8 May 2026, EGU26-19382, https://doi.org/10.5194/egusphere-egu26-19382, 2026.

EGU26-20392 | ECS | Posters on site | HS3.5

Deep Learning-Based Projection of Caspian Sea Level Variations under Climate Change Scenarios: A Spatially-Explicit Non-Stationary Approach 

Anandharuban Panchanathan, Mohamad Javad Alizadeh, Indiana Olbert, Mehdi Moayeri, and Sara Jamali

The Caspian Sea, the world’s largest enclosed water body, exhibits significant level fluctuations driven by complex hydroclimatic processes across its vast watershed. Projecting future sea level variations remains challenging due to non-linear interactions, non-stationary climate dynamics, and the basin’s response to anthropogenic climate change. This study develops a novel spatially-explicit deep learning framework to project Caspian Sea level variations under multiple Shared Socioeconomic Pathway (SSP) scenarios.

Our methodology integrates gridded climate data from CMIP6 models with a hybrid CNN-Transformer architecture that explicitly accounts for: (1) spatial heterogeneity across major sub-basins (Volga, Kura, Ural, Terek watersheds), (2) temporal non-stationarity in evaporation, precipitation, and river discharge patterns, and (3) dynamic land-water boundaries in shallow coastal zones. The model employs multi-head attention mechanisms to capture long-range dependencies in climate teleconnections while maintaining physical consistency through a water balance constraint layer.

A critical innovation is our treatment of non-stationary processes where future evaporation rates may exceed historical ranges. We implement adaptive normalization and time-varying parameter modules that learn evolving climate patterns without relying solely on historical statistics. For regions projected to desiccate under extreme scenarios, we incorporate dynamic masking that temporally deactivates precipitation-evaporation fluxes in exposed grid cells.

Spatial analysis reveals differential impacts across sub-basins, with the northern shallow zones showing heightened sensitivity. The attention weights highlight the dominant role of Volga discharge variability and Caspian surface evaporation in controlling decadal-scale level changes.

This physics-informed deep learning approach provides computationally efficient, probabilistic projections while maintaining interpretability through attention visualization and uncertainty quantification. The framework is transferable to other enclosed basins facing similar non-stationary climate challenges.

How to cite: Panchanathan, A., Alizadeh, M. J., Olbert, I., Moayeri, M., and Jamali, S.: Deep Learning-Based Projection of Caspian Sea Level Variations under Climate Change Scenarios: A Spatially-Explicit Non-Stationary Approach, EGU General Assembly 2026, Vienna, Austria, 3–8 May 2026, EGU26-20392, https://doi.org/10.5194/egusphere-egu26-20392, 2026.

The Earth system is characterized by complex, nonlinear interactions where the combination of multiple drivers can lead to extreme or compound events with significant impacts. While traditional statistical methods often struggle to capture these multivariate dependencies, deep learning models have emerged as powerful tools for forecasting hydro-climatic time series. However, their utility in Earth system science is currently limited by a lack of transparency. While  ML/DL is useful in predicting extremes, the explainability of the physical mechanisms or compound drivers is limited. Furthermore, standard interpretability techniques applied to geophysical data are often misleading, as they tend to highlight dominant seasonal cycles rather than the dynamic, event-specific interactions that are crucial for scientific discovery. This research proposes a diagnostic framework that repurposes the internal decision-making process of an attention-based encoder-decoder LSTM as a hypothesis generation tool, specifically targeting the latent drivers of extreme and compound events, exemplified here by drought. 

Using multivariate Terrestrial System Modeling Platform simulation data, we trained an attention-based encoder-decoder LSTM where 14 climatological variables serve as both input features and prediction targets in round robin training experiments, generating a comprehensive 14×14 matrix of target-specific attention maps. To transition from predictive modeling to physical interpretation, we apply a post-hoc analysis pipeline to deseasonalize the model's attention weights, which effectively filters out the model’s background behavior, isolating time periods of anomalies. We hypothesize that these anomalies, specifically the extreme 1st and 99th percentile attention, signal instances where standard linear relationships break down. This forces the model to rely on complex, transient feature interactions to maintain predictive accuracy. 

In order to understand the complex dynamics of these events and to disentangle the driving factors from the resultant effects, we employed stacked time series visualisations with multi-scale event windows (±15 and ±90 days). We compared the attention anomalies directly against the anomalies from the simulation results. This granular approach identified distinct attention signatures, revealing dynamic shifts in feature importance, such as an increased focus on surface sensible heat flux and pressure, which were specific to anomalous periods. While our analysis is mainly focused on drought evolution, these synchronized shifts suggest a capacity to reveal the multi-driver interactions of compound events. Consistent patterns across historical events demonstrate that the model’s reliance on specific inputs spikes significantly during these windows, effectively isolating potential compound drivers. By pinpointing exactly when and where system dynamics shift, this framework transforms the LSTM from a passive predictor into an active tool for scientific discovery. It provides domain scientists with targeted starting points for studying the physical precursors of compound climate extremes.

How to cite: Onay, B. and Kollet, S.: Deseasonalized Attention for Scientific Discovery of Extreme and Compound Climate Events, EGU General Assembly 2026, Vienna, Austria, 3–8 May 2026, EGU26-20642, https://doi.org/10.5194/egusphere-egu26-20642, 2026.

EGU26-20929 | ECS | Posters on site | HS3.5

Can LSTM Neural Hydrology help us trade space for time in rainfall-induced megafloods? 

Philipp Tanzeglock and Bora Shehu

The catastrophic July 2021 flood in the Ahr Valley (Rhineland-Palatinate, Germany) highlights the urgent need to improve our understanding and modelling of rainfall-induced megafloods. Conventional conceptual hydrological models often fail to accurately simulate flood peaks during such extreme events. Owing to their very rare occurrence, megafloods are typically absent from calibration periods, as available discharge observations are too short in time. In contrast, the spatial coverage of discharge observations is steadily increasing. Hydrologically and physiographically similar catchments may therefore provide valuable information on flood response behavior that has not yet been observed in the catchment of interest. In this study, we investigate whether spatial information can compensate for limited temporal observations by applying a long short-term memory (LSTM) neural network within the Neural Hydrology framework (Kratzert et al., 2021), which is capable of learning patterns from large datasets and transferring them to similar, yet distinct, hydrological settings.

For this purpose, in this study, we use a large dataset of catchments across Central Europe and Germany with observed discharge and meteorological data from 1970 onwards to model hourly discharge at Ahr Valley. A series of experiments is designed using different combinations of temporal coverage and sets of physiographically similar catchments to evaluate their ability to reproduce flood behavior at Ahr Valley. The methodological framework consists of two steps: (i) training the Neural Hydrology model on a set of similar catchments (excluding the Ahr catchment) using split-sample validation, and (ii) validating the trained models for extreme flood events, including the 2021 megaflood, at several Ahr sub-catchments.

By systematically comparing different configurations of spatial and temporal information, we address the following questions: Can time be successfully traded for space when simulating the 2021 Ahr megaflood? How can hydrologically similar catchments be identified most effectively? And can neural hydrology outperform the conventional conceptual models used operationally for the Ahr event (LARSIM and HBV-Light)

How to cite: Tanzeglock, P. and Shehu, B.: Can LSTM Neural Hydrology help us trade space for time in rainfall-induced megafloods?, EGU General Assembly 2026, Vienna, Austria, 3–8 May 2026, EGU26-20929, https://doi.org/10.5194/egusphere-egu26-20929, 2026.

Deep learning approaches are increasingly being used in hydrological modelling due to their ability to represent the nonlinear relationships that characterise rainfall–runoff processes. Despite this growing interest, their use for improving hydrological understanding remains limited. In particular, issues related to interpretability, spatial attribution, and model robustness persist, especially in catchments with sparse or uneven data coverage. Moreover, many deep learning applications represent catchments in a lumped manner, making it difficult to identify how different subcatchments contribute to flood generation. This study investigates spatial runoff contributions during flood events by representing hydrological connectivity with graph neural networks (GNNs). The graph-based rainfall–runoff modelling framework is applied to the Upper Medway catchment (~220 km²), located south of London. The catchment is conceptualised as a directed graph, where the nodes are represented by 34 subcatchments, generated from a digital elevation model, alongside their static features (area, slope, land use), and the edges encode the downstream hydrological connections of the river network. Rainfall inputs are aggregated at the subcatchment scale from 10 rain gauges using sub-hourly (15min) data, while sub-hourly discharge observations from two gauging stations provide the basis for model training and evaluation. Additionally, the model's robustness and information redundancy were explored through a sensitivity analysis involving the omission of certain rainfall gauges. Finally, the model behaviour is assessed through event-based simulations and compared to established hydrological modelling approaches in the catchment. Instead of focusing on predictive accuracy, the aim of this study is to investigate the learned graph representations, especially how information from upstream subcatchments propagates through the network and influences simulated responses at the catchment outlet. The limitations related to data resolution, event definition, uncertainty representation, and transferability are discussed, and future work will focus on refining model architecture and addressing evaluation strategies.

How to cite: Antunes Meira, M. and Xuan, Y.: Exploring Spatial Contributions to Flood Generation Using Graph Neural Networks: A Case Study on the Upper Medway Catchment, EGU General Assembly 2026, Vienna, Austria, 3–8 May 2026, EGU26-21095, https://doi.org/10.5194/egusphere-egu26-21095, 2026.

EGU26-22456 | ECS | Posters on site | HS3.5

GraphRiverCast: A Topology-Informed Foundation Model for Global River Hydrodynamics 

Hancheng Ren, Gang Zhao, Louise Slater, Dai Yamazaki, and Bo Pang

Accurate and rapid river forecasting is essential for global water cycle management but faces a persistent dichotomy: physics-based models offer structural consistency but are computationally intensive and difficult to calibrate efficiently, while data-driven approaches offer efficiency but often lack physical interpretability and struggle in data-scarce regions. To bridge this gap, we introduce GraphRiverCast (GRC), a topology-informed AI foundation model that forecasts multivariate river hydrodynamics at a global scale. Unlike conventional raster-based AI approaches, GRC explicitly encodes river network topology into a graph neural architecture. This design underpins a novel "pretrain-finetune" paradigm: the model first learns generalizable river hydrodynamic mechanisms from global physics-based simulations (pre-training), and then adapts to specific basins using sparse in-situ observations (fine-tuning). Our results demonstrate that topological awareness is essential for maintaining predictive accuracy and stability in "ColdStart" mode where initial states are unavailable. Furthermore, we show that fine-tuning with local data propagates observational constraints through the network topology, systematically improving performance even in ungauged river reaches. GRC thus establishes a scalable, physics-aligned framework that effectively synthesizes global hydrodynamic knowledge with local data applicability.

How to cite: Ren, H., Zhao, G., Slater, L., Yamazaki, D., and Pang, B.: GraphRiverCast: A Topology-Informed Foundation Model for Global River Hydrodynamics, EGU General Assembly 2026, Vienna, Austria, 3–8 May 2026, EGU26-22456, https://doi.org/10.5194/egusphere-egu26-22456, 2026.

EGU26-107 | ECS | Orals | HS3.6

Machine Learning Integration Strategies for Process-based Ecohydrological Modeling: Addressing Epistemic Uncertainties of Water Mixing Dynamics in Tree Water 

Hyekyeng Jung, Chris Soulsby, Songjun Wu, Christian Birkel, and Dörthe Tetzlaff

Compared to process-based models (PBMs), higher prediction accuracy of machine learning models (MLMs) has been repeatedly reported in ecohydrological research. This might indicate the higher efficiency of data-driven MLMs for extracting and generalising information from the data, especially when traditional PBMs are often challenged by epistemic uncertainties in process representation. To preserve ‘modelling as a learning tool’, integrating MLMs into PBMs is a promising avenue to leverage MLMs for data assimilation, and PBMs for holistic explainability of processes across the Critical Zone (i.e., the thin crust of the Earth including vegetation).
One example of an ecohydrological process with high epistemic uncertainties is the mixing mechanism of root uptake water from soils by trees. Due to limited process understanding together with high uncertainties of isotope measurements in trees, usually mixing dynamics in tree water storage in ecohydrological models show poor representation.
Here, we use data from a comprehensive monitoring campaign which has been conducted during the growing season of 2020 at a plot site with two willow trees and grass in southeastern Berlin, Germany, including daily or sub-daily in-situ measurements of hydrological characteristics and stable water isotopes in precipitation, soils, vegetation, and neighboring open water bodies. Using the data, a baseline ecohydrological PBM (EcoHydroPlot) was used to simulate water flow and isotope dynamics across the Critical Zone. In addition, MLMs with different strategies for integration were applied: Firstly, as an additional module to the PBM, a post-hoc result-analyzing MLM was trained with the error of the PBM. Secondly, a hybrid model was built that replaces equations for mixing mechanism of root-uptake water in PBM with a data-driven ML algorithm. An eXplainable AI (XAI) tool was applied to help understand uncertainties in the PBM and process representation in MLM.
By comparing these approaches using different criteria of prediction accuracy and interpretability, we identified an optimal strategy for leveraging MLM capabilities within PBM frameworks in addressing the process of tree water mixing with high epistemic uncertainties, potentially extending the concept of ‘modeling as a learning tool’ to MLM-integrated PBMs.

How to cite: Jung, H., Soulsby, C., Wu, S., Birkel, C., and Tetzlaff, D.: Machine Learning Integration Strategies for Process-based Ecohydrological Modeling: Addressing Epistemic Uncertainties of Water Mixing Dynamics in Tree Water, EGU General Assembly 2026, Vienna, Austria, 3–8 May 2026, EGU26-107, https://doi.org/10.5194/egusphere-egu26-107, 2026.

EGU26-928 | ECS | Posters on site | HS3.6

Sensitivity of machine-learning crop-type mapping to feature selection and hyper-parameter tuning. 

Mayra Perez, Frédéric Satgé, Jorge Molina, Renaud Hostache, Ramiro Pillco, Elvis Uscamayta, Diego Tola, Lautaro Bustillos, and Celine Duwig

To improve crop yields and economic incomes, farmers consistently adapt their practices to climate and market fluctuations, resulting in highly variable crop field distribution and coverage in space and time. As these dynamics ilustrate, up-to-date crop-type mapping is essential to understand farmers’ needs and supporting them in adopting sustainable practices. With global coverage and frequent temporal observations, remote sensing data are generally integrated in machine learning models to monitor crop-type mapping dynamics. Unlike physical-based models that rely on straightforward use, the implementation of machine-learning approaches depends on deep interaction with users. In this context, the study assesses the output sensitivity of these models to features selection and hyper-parameter calibration, both of wich rely on user consideration. To do so, Sentinel-1 (S1) and Sentinel-2 (S2) features are integrated into five distinct models (RF, SVM, LGB, HGB, XGB), considering different features selection (VIF and SFS) and hyper-parameter calibration set-up. Results show that pre-process modeling VIF feature selection discards features that wrapped SFS feature selection keeps, resulting in less reliable crop-type mapping compared to using SFS. Additionally, hyper-parameter calibration appears to be sensitive to the input feature and its consideration after any the feature selection improved the crop-type mapping. In this context a three-step nested modelling set-up including a first hyper-parameters calibration followed by a wrapped feature selection (SFS) and another hyper-parameter calibration, lead to the most reliable model outputs. Across the considered region, LGB and XGB (SVM) are the most (less) suitable model for crop-type mapping and models reliability improved when integrated S1 and S2 features rather than the consideration of S1 or S2 alone. Finally, crop-type maps are derived across different regions and periods to highlight the benefits of the proposed method to monitor crops’ dynamics in space and time.

How to cite: Perez, M., Satgé, F., Molina, J., Hostache, R., Pillco, R., Uscamayta, E., Tola, D., Bustillos, L., and Duwig, C.: Sensitivity of machine-learning crop-type mapping to feature selection and hyper-parameter tuning., EGU General Assembly 2026, Vienna, Austria, 3–8 May 2026, EGU26-928, https://doi.org/10.5194/egusphere-egu26-928, 2026.

Hydrological modelling is essential for water resource management, decision making, extreme events forecasting, and for advancing an integrated understanding of the water cycle. In this context, two main approaches dominate: physics-based (or process-based) models, which simulate hydrological processes such as streamflow using fundamental physics equations, and data-driven models, which use statistical or machine learning techniques to map inputs to outputs. Although Artificial Intelligence (AI) techniques have shown promising results in predictive accuracy, particularly in data-rich basins, their inherently black-box nature raises concerns about whether their internal representations align with real hydrological processes. This is especially critical when models are applied to extreme events, non-stationary conditions, or scenarios beyond the training distribution, where high performance metrics alone may not guarantee reliable or physically meaningful predictions. In this study, we evaluated the performance of a Long Short-Term Memory (LSTM) model for drought modelling modeling and assessed how effectively it could represent real-world hydrological behavior in the Rio Grande do Sul watersheds available in the Catchment Attributes and Meteorology for Large-sample Studies (CAMELS-BR) dataset. The focus on these basins is particularly relevant given the region's hydrological importance, susceptibility to extreme events (e.g., droughts and floods), and distinct characteristics compared to temperate regions, where most legacy models were developed. The model was trained using data from 55 different basins across the state. This multi-basin approach allows the LSTM to learn universal hydrological patterns while maintaining the ability to predict low flow conditions in individual watersheds. The model inputs combined dynamic hydrological variables (e.g., precipitation and evapotranspiration) with static catchment attributes  (e.g., aridity, soil properties, and topography). Accumulated rainfall features were constructed over 3-30 day windows to capture watershed memory effects as a proxy to soil moisture dynamics. In addition, Explainable AI (XAI) techniques together with hydrological signatures (e.g. runoff ratio, baseflow index and elasticity) were applied to assess the physical soundness of the LSTM model in the region. Following this, the internal structure of the LSTM - particularly the cell states - were analyzed and compared with hydrological behavior (e.g., soil water accumulation, groundwater dynamics, rainfall inputs) in both situations where XAI and hydrological signatures highlighted, or did not highlight, physical consistency. The LSTM’s effectiveness in Brazilian watersheds highlighted its potential as a complementary tool for low flow and drought modelling, offering a valuable alternative for water resources management. XAI analyses and hydrological signatures highlighted the physical soundness of the multi-basin model, but also indicated that improvements were needed, as the internal structure did not consistently track physical hydrological behavior in some cases, hindering the extrapolation of the LSTM model to assess drought conditions in different meteorological settings (e.g., climate change scenarios).

How to cite: Canellas, E., Perdigão, R., Brentan, B., and Rodrigues, A.: Beyond Accuracy: Trustworthy LSTM-Based Hydrological Modelling Assessed with XAI and Hydrological Signatures — A Case Study in Rio Grande do Sul, Brazil, EGU General Assembly 2026, Vienna, Austria, 3–8 May 2026, EGU26-1116, https://doi.org/10.5194/egusphere-egu26-1116, 2026.

EGU26-1275 | ECS | Posters on site | HS3.6

Diffusion-Based Physics-Aware Modeling of Subsurface Soil Moisture 

Vidhi Singh, Abhilash Singh, and Kumar Gaurav

Accurate characterization of soil moisture at subsurface depths is essential for hydrological modeling, agricultural management, and climate risk assessment. However, in-situ subsurface measurements remain sparse and often discontinuous due to logistical and operational constraints, especially in data-limited regions. This creates a pressing need for approaches that can reliably infer deeper soil moisture states from surface observations, which are more readily available from both remote sensing platforms and ground-based sensors. This study proposes a probabilistic, physics-aware denoising diffusion model designed to estimate soil moisture at subsurface depths using only surface moisture measurements. The model integrates smoothness and curvature regularization terms inspired by Fickian diffusion theory as weak physics to guide the learning process, without requiring explicit or site-specific physical parameters, thereby enhancing its practicality and ensuring broader applicability across diverse hydroclimatic conditions. The model is trained and evaluated across 20 global ISMN (International Soil Moisture Network) sites at 10, 20 and 40 cm depths with hourly observations spanning six distinct Köppen–Geiger climate classes and four high-resolution African stations with 10-min data.

Across global stations, the model demonstrated consistently high predictive skill (R² ranging from 0.91 to 0.99) with lower errors in climates characterized by stable seasonal patterns, and comparatively higher uncertainty in regions affected by freeze-thaw dynamics or monsoonal variability. Benchmarking against 17 state-of-the-art algorithms using Dolan–Moré profiles showed strong and reliable performance across depths and metrics. A stochastic robustness analysis with 30 random seeds and varying ensemble sizes indicated that moderate-sized ensembles provide an effective balance between accuracy and stability. Sensitivity experiments with white, autocorrelated, and structured noise revealed that the 20 cm layer is most susceptible to surface-level perturbations, while deeper layer remain comparatively resilient. The model also highlighted a strong performance on higher-resolution datasets, with prediction errors tightly centered around zero and exhibiting very low standard deviation. The generalisation of the proposed diffusion-based model across spatial, temporal, and climatic variability highlights its potential as a lightweight and transferable alternative for hydrological forecasting in data-scarce or operationally constrained environments.

How to cite: Singh, V., Singh, A., and Gaurav, K.: Diffusion-Based Physics-Aware Modeling of Subsurface Soil Moisture, EGU General Assembly 2026, Vienna, Austria, 3–8 May 2026, EGU26-1275, https://doi.org/10.5194/egusphere-egu26-1275, 2026.

The Yellow River Basin (YRB) is among the most water-scarce, sediment-laden, and anthropogenically impacted river basins worldwide. Rainfall–runoff and runoff–sediment relationships in the YRB have traditionally been investigated using process-based hydrological models, which are computationally demanding and difficult to apply at large spatial scales. Here, a physics-guided LSTM–GNN (Long Short-Term Memory and Graph Neural Network) framework was proposed to simulate coupled water–sediment processes across the YRB. Using sub-basin delineation and upstream–downstream connectivity derived from the physically based Geomorphology-Based Ecohydrological Model (GBEHM), the framework employs LSTM to learn local runoff and sediment generation within individual sub-basins, and GNN to represent topology-constrained routing along the river network. The coupled model generated monthly streamflow and sediment data for 718 sub-basins over the period 1982–2017. Compared with a baseline model that neglects physical river-network topology (total NSEflow=0.78, NSEsediment=0.62; median NSEflow=0.09, NSEsediment=0.13), the proposed framework demonstrated significantly improved predictive performance (total NSEflow=0.89, NSEsediment=0.85; median NSEflow=0.42, NSEsediment=0.32) during the test period (2013–2017), especially at stations in large tributaries and the main stream, with high connectivity and large catchment areas. These results show that the proposed LSTM-GNN framework can effectively serve as a surrogate of the process-based model with high accuracy, highlighting its potential for simulating upstream–downstream coupled hydrological processes in super-large river basins.

How to cite: Li, S., Yang, H., Wang, T., and Yang, D.: Coupled Water–Sediment Modelling in the Yellow River Basin Using a Physics-Guided LSTM–GNN Framework Incorporating River Network Topology, EGU General Assembly 2026, Vienna, Austria, 3–8 May 2026, EGU26-2784, https://doi.org/10.5194/egusphere-egu26-2784, 2026.

Vegetation mapping is a key step in wetland monitoring, management, and conservation. Remote sensing image classification offers an excellent solution for vegetation mapping due to its high temporal and spatial resolution. In spite of these advantages, remote sensing classification of wetland vegetation is usually limited to a small number of target classes and lack explanation of the input features importance. To address this limitation, this study presents a detailed wetland vegetation classification, which is followed by an explainability study.

The study was conducted in the Biebrza wetlands located in NE Poland, covering approximately 220km2. These wetlands are situated around the Biebrza River, which floods yearly, producing a characteristic vegetation zonation. The training and validation data for vegetation classification was a vegetation survey conducted in 2015 and kindly provided by the Biebrza National Park.

The input features for classification was obtained from fusing VIS-IR data from Sentinel-2, thermal data from Landsat-8, and Synthetic Aperture Radar (SAR) data from Sentinel-1. The Sentinel-2 data consisted of four images (one image per season), each with eleven bands. The Landsat-8 data also comprised four images, with one thermal band per image. The Sentinel-1 data included 24 dual-polarization (VV+VH) images (one image per month, varied by ascending and descending orbit). All image data were acquired within the 2014-2017 period and resampled to 10-meter spatial resolution.

The "ranger" Random Forest implementation in R was used as the classifier. The classifier was trained on a stratified random 50% of the vegetation data points and validated on the remaining 50%. The built-in permutation feature importance algorithm was used to indicate the most important bands for the classification.

The classification-based vegetation map highly reflected the characteristic vegetation zonation of the Biebrza wetlands. The overall accuracy was 0.994 and the Kappa index was 0.993. The most important band for the classification was the Landsat-8 thermal image from the winter season. However, the thermal bands from the remaining seasons were relatively unimportant. The next most important bands were the Sentinel-2 VIS-IR images from the spring and fall seasons, particularly the red, red-edge, and SWIR bands. The SAR data from Sentinel-1 were the least important of all data used; the most important Sentinel-1 band (19th position) was VH from September, descending orbit.

How to cite: Berezowski, T.: Explainable machine learning for detailed wetland vegetation classification using remote sensing data, EGU General Assembly 2026, Vienna, Austria, 3–8 May 2026, EGU26-5240, https://doi.org/10.5194/egusphere-egu26-5240, 2026.

EGU26-5408 | Orals | HS3.6

Global estimation of the median annual maximum flood (QMED) using explainable machine learning  

Valeriya Filipova, David Leedal, and Sam Clayton

Reliable estimation of the median annual maximum flood (QMED) is central to flood risk assessment and the design of hydraulic infrastructure, particularly in ungauged basins. Traditional index-flood approaches typically delineate homogeneous regions and estimate QMED using linear regression on a small set of catchment descriptors. However, these assumptions are often violated in practice, leading to substantial prediction uncertainty. 

Here, we explore the potential of explainable machine-learning models to estimate QMED at large scale. Using data from approximately 8,500 catchments and more than 60 climatic, physiographic, and geomorphological descriptors, we train non-linear models (XGBoost and TabNet) to predict QMED for ungauged basins. To promote physically plausible behaviour, model training incorporates constraints on specific discharge alongside standard performance metrics. A key feature of the approach is the extensive use of DEM-derived terrain and river-network descriptors, which can be computed consistently from widely available global elevation datasets. 

Model interpretability is addressed using global and local explainability techniques, enabling identification of the dominant controls on QMED and how their importance varies spatially. Across independent test data, the models show strong predictive skill (R² > 0.8, median absolute percentage error ~30%). Notably, in many regions models trained on large, globally diverse datasets outperform those trained solely on local data, even where substantial local records are available. 

These results indicate that combining globally consistent physiographic information with interpretable, non-linear machine-learning models offers a promising alternative to traditional regional regression methods for QMED estimation, with potential benefits for flood risk assessment in data-sparse regions. 

How to cite: Filipova, V., Leedal, D., and Clayton, S.: Global estimation of the median annual maximum flood (QMED) using explainable machine learning , EGU General Assembly 2026, Vienna, Austria, 3–8 May 2026, EGU26-5408, https://doi.org/10.5194/egusphere-egu26-5408, 2026.

EGU26-5540 | ECS | Posters on site | HS3.6

A Deep Ensemble Learning Framework with Interpretability for Long-Term Streamflow Forecasting under Multiple Uncertainties 

Xinyuan Qian, Ping-an Zhong, Bin Wang, Yu Han, Yukun Fan, Yiwen Wang, Sunyu Xu, Zixin Song, and Mengxue Ben

Accurate and reliable long-term streamflow forecasting plays a crucial role in sustainable water resource management and risk mitigation. However, forecast performance is often constrained by multiple sources of uncertainty and the limited interpretability of deep learning models. To address these challenges, this study proposes an explainable hierarchical optimisation framework for long-term streamflow forecasting based on ensemble learning. The proposed framework systematically integrates a Dempster–Shafer (DS) evidence theory-based predictor selection strategy to reduce input uncertainty, an improved loss function designed to enhance model sensitivity to extreme flow events, and a Stacking ensemble scheme that combines the complementary strengths of multiple deep learning models, thereby overcoming the limitations of individual models in complex hydrological systems. In addition, SHapley Additive exPlanations (SHAP) are employed to improve model interpretability and to quantify the contributions of different predictors.

The effectiveness of the proposed framework is demonstrated through long-term streamflow forecasting at Hongze Lake. The results indicate that: (1) the DS-based predictor selection method substantially enhances both forecasting accuracy and stability, with Nash–Sutcliffe efficiency (NSE) values increasing by 0.10–0.18; (2) the improved loss function significantly strengthens model robustness under extreme high-flow conditions, reducing the mean absolute percentage error (MAPE) by 63.11%, 55.33%, and 23.6% for the MLP, LSTM, and Transformer models, respectively; (3) the Stacking ensemble model consistently outperforms individual base models by reducing forecast errors (RMSE decreased by 17–25%), improving the representation of large-scale variability (MAPE reduced by 21.6–26.8%), and more accurately capturing streamflow dynamics (NSE increased by 0.12–0.20), effectively mitigating multi-source uncertainties; and (4) SHAP-based interpretability analysis reveals pronounced monthly variations in predictor importance and confirms the dominant influence of antecedent streamflow on long-term forecasts. Overall, the proposed framework markedly improves the accuracy, robustness, and transparency of long-term streamflow forecasting and shows strong potential for application in other data-driven hydrological forecasting tasks.

How to cite: Qian, X., Zhong, P., Wang, B., Han, Y., Fan, Y., Wang, Y., Xu, S., Song, Z., and Ben, M.: A Deep Ensemble Learning Framework with Interpretability for Long-Term Streamflow Forecasting under Multiple Uncertainties, EGU General Assembly 2026, Vienna, Austria, 3–8 May 2026, EGU26-5540, https://doi.org/10.5194/egusphere-egu26-5540, 2026.

EGU26-5830 | ECS | Posters on site | HS3.6

Global groundwater recharge estimation through hybrid modeling 

Jiaxin Xie, Zavud Baghirov, Markus Reichstein, and Martin Jung

Groundwater provides drinking water for billions and supports nearly half of irrigated agriculture, yet global renewable groundwater availability—quantified as groundwater recharge—remain highly uncertain. Here, we simulate global groundwater recharge using a hybrid model that seamlessly integrates machine learning with physical processes. The hybrid model substitutes machine learning for poorly represented hydrological processes while retaining established physical equations, such as water balance. By leveraging diverse Earth system observations—including streamflow-derived groundwater discharge, satellite-retrieved terrestrial water storage anomalies, and flux tower evapotranspiration—the hybrid model effectively integrates process knowledge with multi-source data constraints to improve the accuracy of global groundwater recharge simulations. Such integration may also deepen our process understanding of groundwater recharge.

How to cite: Xie, J., Baghirov, Z., Reichstein, M., and Jung, M.: Global groundwater recharge estimation through hybrid modeling, EGU General Assembly 2026, Vienna, Austria, 3–8 May 2026, EGU26-5830, https://doi.org/10.5194/egusphere-egu26-5830, 2026.

Soil moisture is a fundamental hydrological variable that governs groundwater recharge and agricultural productivity. Accurate long-term forecasting is essential for water resource management, yet it remains challenging due to significant observational noise in sensor data and the error propagation inherent in traditional deep learning models. While physics-based models struggle with site-specific calibration and Neural Ordinary Differential Equations (Neural ODEs) often fail to recover stable continuous dynamics from noisy, discretely sampled signals, there is a clear need for a more robust forecasting framework.

In this work, we propose EulerNet, a pragmatic discrete-time framework designed for high-fidelity soil moisture prediction. Instead of attempting to reconstruct complex latent continuous-time vector fields, EulerNet explicitly models the fixed-step mapping required for operational forecasting. The architecture integrates an Euler-style residual update to parameterize one-step tendencies, ensuring numerical stability through its incremental integration form. To mitigate the impact of sensor noise, we incorporate a Random Synthesizer feature mixer. By employing input-independent alignment matrices rather than dynamic self-attention, the Random Synthesizer acts as an implicit regularizer, preventing the model from overfitting to spurious, noise-induced correlations.

We evaluated EulerNet using high-noise in-situ observations. In a one-month autoregressive rollout, the model achieved exceptional performance with R2 = 0.7977, RMSE = 0.0039, and RMAE = 0.0083. These results demonstrate that for fixed-step environmental forecasting, a specialized discrete-time formulation can effectively bypass the complexities of continuous-time modeling while maintaining high stability and accuracy under significant noise. Our findings provide a practical and efficient alternative for modeling complex Earth system dynamics from real-world observational data.

How to cite: Kang, W.: EulerNet: A Robust Discrete-Time Framework for Long-Term Soil Moisture Forecasting Under Significant Observational Noise , EGU General Assembly 2026, Vienna, Austria, 3–8 May 2026, EGU26-8707, https://doi.org/10.5194/egusphere-egu26-8707, 2026.

Accurate rainfall-runoff analysis is vital for flood prediction, water resources management, and climate impact assessment. While data-driven hydrological models such as Long Short-Term Memory (LSTM) networks have shown promise, developing a globally applicable framework that is accurate, interpretable, and computationally efficient remains a grand challenge, primarily because most catchments worldwide are ungauged. We address this by employing HYdrologic Prediction with multi-model Ensemble and Reservoir computing (HYPER). This hybrid method combines Bayesian Model Averaging (BMA), a multi-model ensemble, with Reservoir Computing (RC), a type of machine learning model. The framework infers model weights for ungauged basins by linking catchment attributes to the model weights learned from gauged basins. While this model has previously demonstrated higher accuracy and lower uncertainty compared to LSTMs, particularly when training data is limited, its global applicability remains unassessed. Therefore, in this study, we evaluate the global applicability of HYPER using a pseudo-ungauged approach, where gauged basins are treated as ungauged for validation. We challenge the conventional assumption that more data is better by investigating whether selecting a strategic subset of gauged basins for training outperforms using the entire available dataset. Initial experiments revealed that prediction accuracy remained robust regardless of whether 90 % or only 3 % of available basins were used for training. Furthermore, training on basins from a single, hydrologically similar region often yielded higher accuracy than training on a diverse multi-regional dataset. To identify the optimal training subset, we compared three distinct data selection methods: 1) Greedy selection, which identifies donor basins by selecting the nearest neighbors within the static catchment attribute state space; 2)  Physics-Informed selection, which calculates the distance between target and candidate basins while applying heavier penalty weights to slope and aridity to strictly enforce physical similarity; and 3) Meta-Learning, which utilizes a Random Forest to learn the relationship between attribute differences and model weight correlations, subsequently predicting donor basins expected to have the highest weight correlation with the target. While all three methods outperformed the baseline of using all available data (Kling-Gupta Efficiency (KGE): 0.12), the Physics-Informed and Meta-Learning approaches achieved the highest consistency and accuracy. Even when only 5 out of 1,505 basins were used for training, these methods achieved KGE scores of 0.26 and 0.31, respectively, effectively bridging the performance gap toward fully gauged basins (KGE: 0.54). These findings demonstrate that for global prediction in ungauged regions, data quality, especially the strategic selection of training basins, is more important than data quantity, marking a step towards robust, globally applicable runoff analysis.

How to cite: Funato, M. and Sawada, Y.: Data Quality over Quantity: Optimized Data Selection for Data-driven Global Prediction in Ungauged Basins, EGU General Assembly 2026, Vienna, Austria, 3–8 May 2026, EGU26-9189, https://doi.org/10.5194/egusphere-egu26-9189, 2026.

EGU26-10856 | ECS | Orals | HS3.6

Calibration of a Long Short-Term Memory (LSTM) rainfall-runoff model using remote sensing soil water content estimations 

Tibor Rapai, Petra Baják, István Gábor Hatvani, András Lukács, and Balázs Székely

Long Short-Term Memory (LSTM) neural networks have proven their excellence in basin-level discharge prediction, provided there is an adequate amount of high-quality time series data available for training, including meteorological forcings and streamflow gauge measurements. Such data-driven black-box models can successfully learn the complex behavior of delayed hydraulic responses; however, they cannot yet be easily applied in water management practice, and model transfer attempts to ungauged catchments have not been entirely successful.

In our previous work, we explored an approach to characterizing near-surface flow regimes, starting from a full catchment model and then applying a single LSTM network layer within a semi-distributed subbasin setup reflecting downstream topography. Application to the Tarna River catchment area in Hungary (2,116 km2) showed that transfer learning from the full catchment model (achieving an NSE of 0.91 on the training set and 0.66 on an independent test set) to a downstream chain of gauged Hydrological Response Units (HRUs) is a powerful tool for investigating a semi-distributed HRU network. The entire setup, however, involves a much higher level of complexity, and the available detailed meteorological data and gauge measurements in only two-thirds of the subbasins did not provide sufficient information for the single LSTM model to fully predict the HRU network processes.

Because these models apply “virtual water amounts” stored in the hidden cells of the LSTM network for discharge estimation, their internal variables lack direct physical interpretability. In the present research, we investigate how data fusion during calibration with Gravity Recovery and Climate Experiment (GRACE) data, downscaled using soil water content and evapotranspiration products from the ECMWF Reanalysis (ERA5) database, can improve predictive performance, and help to verify our working hypothesis regarding the theoretical connection between Near Surface Water Content (NSWC) and LSTM cell states.

These results can also validate interpretations derived from our model concerning baseflow contributions and recharge-discharge classification of subbasins, while promising realistic transferability of the pre-trained lumped catchment model to all subbasins and broader general applicability of the proposed method. We hypothesize that the daily change dynamics of Terrestrial Water Storage (TWS) and NSWC – the latter playing a decisive role in gravitational flows within the Critical Zone – are strongly correlated.

Accordingly, we propose using downscaled TSW estimates to (1) introduce a new term into the loss function based on our working hypothesis relating median LSTM cell state values to the normalized dynamics of NSWC, and (2) add a new input dimension approximating total runoff as precipitation minus evapotranspiration and infiltration.

Furthermore, the current model extension, still based on 0.1 ° gridded input data, prepares the ground for future developments that incorporate high-spatial-resolution satellite remote sensing data, such as Sentinel-2 NDWI, to support local-scale hydrological applications efficiently. Integrating satellite data products with different temporal and spatial resolutions is not a straightforward calibration step for rainfall-runoff models, as pixel-wise normalization of measurements requires complex physically based geostatistical methods compatible with model logic to avoid performance deterioration.


How to cite: Rapai, T., Baják, P., Hatvani, I. G., Lukács, A., and Székely, B.: Calibration of a Long Short-Term Memory (LSTM) rainfall-runoff model using remote sensing soil water content estimations, EGU General Assembly 2026, Vienna, Austria, 3–8 May 2026, EGU26-10856, https://doi.org/10.5194/egusphere-egu26-10856, 2026.

EGU26-12259 | ECS | Posters on site | HS3.6

Global Rooting Depth Inferred based on Machine Learning 

Shekoofeh Haghdoost, Shujie Cheng, Oscar Baez-Villanueva, and Diego G. Miralles

Rooting depth Zr is a key variable controlling plant water uptake, soil–vegetation interactions, and land–atmosphere feedbacks. Despite its importance, global estimation of Zr remains challenging due to sparse in situ observations and strong spatial heterogeneity driven by climatic, edaphic, and vegetation controls. The interaction among these factors increases complexity, limiting the performance of traditional process-based models and leading to substantial uncertainty in large-scale applications. In this context, machine learning offers a data-driven alternative that can integrate heterogeneous datasets and capture nonlinear relationships and complex interactions among environmental variables, providing a flexible framework for improving large-scale estimates of rooting depth.

In this research, we investigate the environmental drivers of rooting depth at the global scale and develop a new spatially explicit Zr dataset using advanced machine learning methods. Our framework integrates multiple globally consistent datasets, including satellite-derived vegetation metrics (LAI, NDVI), land-surface temperature, and gridded climate variables (precipitation, radiation). These are complemented by soil hydraulic and physical attributes from global soil databases and detailed topographic information, providing a complete representation of environmental controls relevant to rooting depth. A Random Forest model is employed to capture the nonlinear relationships between the predictor set and observed rooting depths. Model interpretability is subsequently assessed using Shapley Additive exPlanations (SHAP), thereby quantifying the contribution of each environmental variable to model predictions.

The optimized model is subsequently applied at the global scale to generate a global Zr dataset using globally available plant, soil, and climate variables. By accounting for their combined effects, the model provides a spatially continuous representation of rooting depth across diverse regions. Model performance is evaluated using leave-one-out cross-validation (LOOCV), whereby each observation is iteratively excluded from the training dataset and used for independent validation. In addition, the resulting predictions are compared against existing global rooting depth datasets to evaluate large-scale consistency. The new Zr dataset enables improved drought monitoring capabilities through more realistic estimates of plant available water; it may enhance water resource assessments by refining infiltration and groundwater recharge estimates, and it helps reduce uncertainty in land surface and climate models by better representing soil-vegetation interactions. Overall, this work provides a robust data-driven approach for estimating Zr globally, independent of process-based assumptions, and relevant for diverse ecohydrological applications striving towards more accurate characterizations of terrestrial water and carbon cycling.

Keywords: rooting depth, machine learning, soil vegetation interactions, global hydrology, ecohydrology, Earth system modeling

How to cite: Haghdoost, S., Cheng, S., Baez-Villanueva, O., and G. Miralles, D.: Global Rooting Depth Inferred based on Machine Learning, EGU General Assembly 2026, Vienna, Austria, 3–8 May 2026, EGU26-12259, https://doi.org/10.5194/egusphere-egu26-12259, 2026.

EGU26-12581 | ECS | Posters on site | HS3.6 | Highlight

Causal Analysis for Model Evaluation in Large Sample Hydrology 

David Strahl, Urmi Ninad, Sebastian Gnann, Karoline Wiesner, and Thorsten Wagener

Hydrological and land surface models rely on strong prior assumptions about system functioning, including which processes are represented, their parametrization and how they are simplified across space and time. Model evaluation, however, is often based on measures of predictive performance that provide limited insights into whether models capture underlying processes correctly. Causal discovery methods offer a complementary perspective by learning causal interaction networks directly from time series data to reveal how system components influence each other. Here, we apply the PCMCI+ algorithm for causal discovery in combination with a causal effect estimation to hydrometeorological observations and model simulations from 671 U.S. catchments to infer monthly causal interaction networks and associated effect strengths. We show that inferred interaction strengths vary systematically across gradients of water and energy availability and reflect structural differences in how three hydrological models represent key processes of snow and evapotranspiration dynamics. Our results illustrate how causal inference can complement traditional model evaluation approaches in complex environmental systems by providing process-level insights that help bridge theory, observations, and models across disciplines.

How to cite: Strahl, D., Ninad, U., Gnann, S., Wiesner, K., and Wagener, T.: Causal Analysis for Model Evaluation in Large Sample Hydrology, EGU General Assembly 2026, Vienna, Austria, 3–8 May 2026, EGU26-12581, https://doi.org/10.5194/egusphere-egu26-12581, 2026.

EGU26-17878 | Posters on site | HS3.6

Estimating the timing of the peak snowmelt floods in unregulated boreal catchments using machine learning techniques. 

Sadegh Kaboli, Ville Kankare, Cintia Bertacchi Uvo, Petteri Alho, Ali Torabi Haghighi, and Elina Kasvi

The timing of peak snowmelt floods in boreal environments has undergone significant changes, characterized by nonlinear and complex patterns. This timing determines when coastal areas of boreal rivers experience the greatest inundation during the spring season. It is highly sensitive to climate change and directly influences local fauna and flora. Despite its critical role in flood risk management, the prediction of spring flood timing, along with the identification of its key drivers and most influential factors, remains insufficiently studied in boreal regions.

In this study, we investigate the potential for predicting the timing of annual maximum snowmelt floods by applying a thermal definition of the spring season, along with various climatological and hydrological indices. The analysis is based on a comprehensive daily dataset available with varying record lengths of at least 50 years, available since the early 1960s and extending to 2023 across multiple unregulated Finnish catchments. Among the most important dynamic features are daily discharge records, high-resolution gridded temperature data, and atmospheric teleconnection indices. Additionally, key static catchment characteristics, such as area, slope, and geographical position, are also incorporated into the modeling process, along with other relevant variables.

Machine learning algorithms, including Random Forest and SHAP (SHapley Additive exPlanations) values for feature importance, are applied to identify the most influential factors shaping the timing of annual maximum snowmelt floods and to assess the overall predictability of these events across multiple catchments. The study introduces a novel approach using a thermal definition of spring. The findings provide new indices and actionable thresholds that can help identify areas where adaptation measures should be prioritized.

How to cite: Kaboli, S., Kankare, V., Bertacchi Uvo, C., Alho, P., Torabi Haghighi, A., and Kasvi, E.: Estimating the timing of the peak snowmelt floods in unregulated boreal catchments using machine learning techniques., EGU General Assembly 2026, Vienna, Austria, 3–8 May 2026, EGU26-17878, https://doi.org/10.5194/egusphere-egu26-17878, 2026.

EGU26-17916 | ECS | Orals | HS3.6

Combining LSTMs with a Single-Model Large Ensemble for Runoff and Water Temperature Projections in Bavaria 

Alexander Sasse, Ralf Ludwig, Julius Weiß, and Kerstin Schütz

Both river runoff and river water temperature are experiencing highly dynamic alterations, posing serious threat to aquatic ecosystems and water resources management under climate change. Data-driven models such as Long Short-Term Memory (LSTM) networks have demonstrated remarkable skill in hydrological prediction, yet their application under non-stationary climate conditions remains challenging due to limited generalization to unseen catchments and conditions beyond the training distribution. We address these challenges by combining LSTM architectures with single-model initial condition large ensemble (SMILE) climate projections to assess non-stationary, non-linear hydrological responses considering the full range of internal climate variability and climate change, enabling robust assessment of rare and extreme events in Bavaria, Germany.

Our study builds on the ClimEx project, which provides a 50-member ensemble of climate simulations (1950–2099, RCP8.5 emission scenario) at 12 km resolution over Europe using the Canadian Regional Climate Model CRCM5.

We present two complementary application cases operating daily and at 3-hourly temporal resolution: i) For discharge prediction, we train an LSTM on observed runoff across 98 Bavarian catchments, validated against simulations from the process-based Water balance Simulation Model (WaSiM). The architecture processes dynamic meteorological forcings through stacked LSTM layers while incorporating static catchment attributes, using a composite loss function that balances performance across high and low flows. The trained model is then driven by the ClimEx ensemble to generate probabilistic discharge projections for future climate. ii) For water temperature (Tw) prediction, we developed an Entity-Aware LSTM (EA-LSTM) framework trained on observations from 44 Bavarian gauging stations, a subset of the 98 catchments constrained by Tw data availability, extended with nine French river basins to broaden the climatic gradient encountered during training. The EA-LSTM architecture explicitly separates static catchment attributes (elevation, slope, upstream river length) from dynamic meteorological forcings, using static features to parameterize the input gate rather than concatenating them at every timestep. This allows the network to learn site-specific temporal dynamics without overfitting individual locations.

To enhance model interpretability, we apply explainable AI (XAI) techniques including permutation-based feature importance analysis. Results reveal that air temperature and radiation dominate Tw predictions overall, while topographic attributes gain importance under thermal extremes, indicating the model captures physically meaningful process controls. Additionally, robustness tests with perturbed static inputs confirm smooth performance degradation rather than abrupt collapse, suggesting the EA-LSTM learns generalizable attribute-response relationships rather than memorizing site identities.

Both cases demonstrate how combining diverse training data with ensemble-based climate projections enables more robust predictions of hydrological extremes under climate change, while XAI methods provide transparency into learned representations.

How to cite: Sasse, A., Ludwig, R., Weiß, J., and Schütz, K.: Combining LSTMs with a Single-Model Large Ensemble for Runoff and Water Temperature Projections in Bavaria, EGU General Assembly 2026, Vienna, Austria, 3–8 May 2026, EGU26-17916, https://doi.org/10.5194/egusphere-egu26-17916, 2026.

EGU26-18384 | Orals | HS3.6

Physics-constrained or physics-ignored? An entropy-based approach to diagnose if your hybrid model effectively skips conceptual constraints 

Anneli Guthke, Manuel Álvarez Chaves, Eduardo Acuna Espinoza, and Uwe Ehret

Despite great success of deep learning models in many applications of hydrological prediction, they still face limitations in predicting extreme events or in generalizing to unseen conditions, which raises questions about their fidelity and applicability beyond purely operational purposes. Physics-informed hybrid modelling is often proposed as a way to install interpretability and enable trustworthy data-driven predictions that are in agreement with theoretical knowledge. Yet, the community is still in search of best practices for how to construct physics-informed machine learning models – several “entry points” for physics knowledge exist, i.e., the loss function, the model inputs, or the architecture. Here, we focus on the latter, and on arguably the most “constrained” form of bringing in physics into a hybrid model: a traditional, process-based (conceptual) hydrological model is combined with a data-driven component (here: a long short-term memory network, LSTM) that modifies its parameters over time, as learned by training on observed discharge values. For this apparently well-constrained scenario of hybrid modelling, we raise the question if it can faithfully be called “physics-constrained”, or if the data-driven component is able to overwrite these constraints for the sake of increased performance.

To objectively address this question, we introduce an entropy-based method to quantify the “activity” of the data-driven component in acting against the conceptual constraints. This metric is complemented with a diagnostic workflow to better understand the internal functioning of the resulting, effective hybrid model structure in predicting discharge. Through didactic examples, inspired by real-world case studies, we present the method and build an intuition of what our entropy-based metric represents. Further, we discuss selected results from a large-sample case study on CAMELS-GB to illustrate the variety of findings and insights we had: (1) Performance heavily relies on the data-driven component, and the physics constraints often even make the prediction problem harder instead of adding helpful information; (2) the data-driven component tends to overwrite the constrained architecture “silently”, but this can be detected with our proposed workflow; (3) even nonsensical-at-first-sight constraints can in fact increase performance, as the hybrid model is transformed into a  new structure that is parsimonious and efficient; (4) claiming interpretability on the basis of prescribed constraints is risky at best – before calling a hybrid model of this type interpretable, we should carefully check what’s happening inside. Overall, these findings provide fundamental guidance towards (hybrid) model building and will help us find better ways to reconcile knowledge and information in data for trustworthy models.

How to cite: Guthke, A., Álvarez Chaves, M., Acuna Espinoza, E., and Ehret, U.: Physics-constrained or physics-ignored? An entropy-based approach to diagnose if your hybrid model effectively skips conceptual constraints, EGU General Assembly 2026, Vienna, Austria, 3–8 May 2026, EGU26-18384, https://doi.org/10.5194/egusphere-egu26-18384, 2026.

Understanding how rainfall is transformed into streamflow is a cornerstone of hydrological science. Despite decades of progress, it remains uncertain whether physical or semi-empirical process equations formulated at the field scale can be transferred to the catchment scale without loss of realism. We assumed that this scale-mismatch is a key reason why conventional conceptual/process-based models often fail to achieve simulation accuracy comparable to purely data-driven deep learning models. Motivated by ensemble rainfall–runoff analysis (ERRA), which suggests that streamflow can be expressed as a convolution between precipitation and a nonlinear catchment response function, we develop an LSTM-based framework to learn catchment-scale response functions for each hydrological process directly from data while retaining physically consistent structure.

The proposed framework couples a generic bucket model architecture with an LSTM that acts as a nexus optimizer. Physical consistency is enforced through residual-style loss regulation, embedding mass-conservation constraints within the training objective. Within this setting, key processes, including canopy interception, infiltration, evapotranspiration, river routing, and groundwater recharge, emerge as extractable functions of meteorological forcing sequences rather than being prescribed a priori. We founded that the learned catchment-scale response functions exhibit pronounced nonlinearity and memory effects. Our results further indicate that catchment-scale process representations effectively mix field-scale empirical relationships with precipitation spatiotemporal heterogeneity, and that the deformation from field to catchment scale response function is strongly driven by the spatial heterogeneity of precipitation intensity. By restructuring the learning pathway to reduce recurrent dependencies, the framework supports efficient parallel training while maintaining physical consistency. The approach aims to simultaneously simulate streamflow and induce catchment scale response functions, offering a pathway to diagnose why conventional models fail and to advance process discovery via data-driven induction.

How to cite: Liu, C.-Y. and Hsu, S.-Y.: Deep Learning as a Nexus Optimizer: Extracting Hydrological Response functions for Rainfall-Runoff Simulation, EGU General Assembly 2026, Vienna, Austria, 3–8 May 2026, EGU26-21276, https://doi.org/10.5194/egusphere-egu26-21276, 2026.

EGU26-1739 | ECS | Posters on site | HS3.8

Missing data imputation in epidemiology: a comparison between MICE and Machine Learning methods 

Mahmoud Hashoush, Emmanuelle Cadot, and Franco Alberto Cardillo

Missing data represents a challenge in large-scale epidemiological studies as it can introduce a strong and negative bias in the final estimates when not handled appropriately. This issue is particularly relevant in environment health research due to complex relationships between the exposure to risk factors and delayed outcomes. In this work, we evaluate the effectiveness of statistical and Machine Learning (ML) approaches to fill in missing values in data we collected to assess the potential impact on public health of gold mining activities in the Ecuadorian Amazon.

There is growing concern regarding the adverse effects on human health in the Ecuadorian Amazon caused by the environmental impact of gold mining activities in the area. To investigate potential associations with adverse birth outcomes, we collected data published by the Ecuadorian National Institute of Statistics and Census (INEC) relative to the annual live birth and fetal death cases in the years from 2014 to 2023. As it is typical in large-scale epidemiological studies, the data contain a proportion of missing values, likely related to the registration and the data entry process. 

Addressing missing values is considered important for the correct assignment of cases from one hand and the characterisation of risk factors from another. Furthermore, it enables the modelling process when searching for associations between exposure and outcome without erroneous under- or over-reporting of odds ratios (Type I and Type II errors). Currently, the most common approach in epidemiology is to use statistical methods and, specifically, Multivariate Imputation by Chained Equations (MICE), normally instantiated with parametric conditional models. MICE imputes missing values by repeatedly predicting each incomplete variable from the others using standard regression models. In most applications, these predictions rely on linear or generalised linear relationships between variables. This can reduce its effectiveness in predicting missing values in presence of complex, non-linear interactions about variables. Machine Learning represents an interesting alternative as it capture complex, non-linear relationships beyond the linear models typically assumed in MICE, are more flexible with respect to departures from missing-at-random patterns, and reduce the risk of model misspecification by relying on data-driven, implicit model selection rather than requiring the analyst to pre-specify an imputation model.

In this study, we present a robust experimental comparison between MICE and several ML-based imputation approaches applied to the Ecuadorian birth data. We assess their performance and discuss the respective strengths and limitations within an epidemiological context.

How to cite: Hashoush, M., Cadot, E., and Alberto Cardillo, F.: Missing data imputation in epidemiology: a comparison between MICE and Machine Learning methods, EGU General Assembly 2026, Vienna, Austria, 3–8 May 2026, EGU26-1739, https://doi.org/10.5194/egusphere-egu26-1739, 2026.

The lack of extensive and functional ground observation networks introduces satellite-based rainfall products as an alternative. However, these datasets require prior evaluation. This study investigates the performance of four satellite- and gauge-based rainfall products: the Climate Hazards Group Infrared Precipitation with Station data version v2.0 (CHIRPS); Precipitation Estimation from Remotely Sensed Information using Artificial Neural Networks Climate Data Record (PERSIANN); Tropical Applications of Meteorology using Satellite data and ground-based observations (TAMSAT); and the Global Precipitation Climatology Centre full daily data (GPCC).

The assessment was conducted using grid-to-point comparisons at different time scales, and hydrological modelling over the Mono River Basin, located in the Republics of Benin and Togo. To assess the suitability of the four products for flood purposes, a two-step approach was applied: (1) a satellite-only approach in which each product was used as input to the HBV-light hydrological model for runoff simulation, and (2) an observation-satellite approach in which gaps in observation data were filled using each product prior to the hydrological modelling. In all simulations, areal precipitation was derived with kriging before being input into HBV-light. On the one hand, the simulation with CHIRPS-only showed poor performance (NSE = -0.08 during calibration and -0.22 during validation), while the simulations with PERSIANN-only, TAMSAT-only, and GPCC-only yielded moderate performance, with NSE values ranging from 0.5 to 0.67. On the other hand, simulations with the observation-satellite combinations also showed moderate performances, with NSE values between 0.55 and 0.69, including for the observation-CHIRPS case.

The poor performance of the CHIRPS-only simulation, combined with the similar performance of all observation-satellite combinations, indicates that the quality of the satellite product used for gap filling plays a limited role. Moreover, the absence of significant improvement when using observation-satellite combinations compared to their satellite-only counterparts (except for CHIRPS) suggests that gap filling with satellite products does not necessarily enhance data quality. These results indicate that, in the Mono River Basin, gap filling may not be necessary when spatial interpolation methods such as kriging are applied.

How to cite: Houngue, N.: When More Data Is Not Better: Evaluating Satellite Rainfall Products in a Data-Scarce River Basin, EGU General Assembly 2026, Vienna, Austria, 3–8 May 2026, EGU26-3102, https://doi.org/10.5194/egusphere-egu26-3102, 2026.

EGU26-3221 | Orals | HS3.8

Disentangling Sources of Uncertainty in Hydrologic Projections Using Multiple Climate Forcings, Bias-Correction Techniques, and Shared Socioeconomic Pathways 

Rocky Talchabhadel, Sunil Bista, Saurav Bhattarai, Subash Poudel, Amisha Bhandari, Sandhya Khanal, Aashish Gautam, Yogesh Bhattarai, Sanjib Sharma, and Nawa Raj Pradhan

Meteorological forcings under different climate scenarios exert substantial control over hydrologic-hydrological processes in watersheds and river systems. This study presents a comprehensive assessment of uncertainty in hydrologic projections by integrating a wide range of climate forcings, multiple bias-correction approaches, and several Shared Socioeconomic Pathways (SSPs). Specifically, we (i) quantify the total uncertainty in projected hydrologic responses, (ii) attribute uncertainty to individual sources, and (iii) examine how uncertainty propagates along the hydroclimatic modeling chain. The analysis is demonstrated for a range of watersheds using a fully calibrated Soil and Water Assessment Tool (SWAT) model. The hydrologic simulations are forced by outputs from thirty global climate models (GCMs) participating in the Coupled Model Intercomparison Project Phase 6 (CMIP6), obtained from the NASA Earth Exchange Global Daily Downscaled Projections (NEX-GDDP-CMIP6) dataset at a spatial resolution of 0.25° (~25 km) under two SSPs. To further refine the climate inputs, a linear bias-correction method is applied to daily temperature and precipitation time series to align long-term mean monthly values during the reference period (1985–2014) with PRISM observations. A total of four bias-correction scenarios are considered: (1) original NEX-GDDP-CMIP6 data, (2) precipitation-corrected data, (3) temperature-corrected data, and (4) jointly corrected temperature and precipitation data. This framework yields four forcing scenarios for each GCM–SSP combination, resulting in a total of 240 simulations (4 × 30 GCMs × 2 SSPs) for each watershed. Streamflow changes are evaluated for the near-future period (2031-2060) and far future period (2061-2090), relative to the historical baseline (1985-2014). Changes in probability distributions and cumulative distribution functions are analyzed across climate models, bias-correction methods, and SSPs. In addition, the relative contributions of individual uncertainty sources are quantified at monthly, seasonal, and annual time scales. By systematically accounting for uncertainties arising from climate forcings, bias-correction techniques, and socioeconomic pathways, this study provides a robust characterization of the range of plausible hydrologic futures. Such uncertainty-informed streamflow projections are essential for water-resources planning, flood and drought risk management, and the development of effective long-term water-management strategies.

How to cite: Talchabhadel, R., Bista, S., Bhattarai, S., Poudel, S., Bhandari, A., Khanal, S., Gautam, A., Bhattarai, Y., Sharma, S., and Pradhan, N. R.: Disentangling Sources of Uncertainty in Hydrologic Projections Using Multiple Climate Forcings, Bias-Correction Techniques, and Shared Socioeconomic Pathways, EGU General Assembly 2026, Vienna, Austria, 3–8 May 2026, EGU26-3221, https://doi.org/10.5194/egusphere-egu26-3221, 2026.

EGU26-6637 | Posters on site | HS3.8

GeoAI-based augmentation of multi-source urban GIS 

Salem Benferhat, Nanée Chahinian, Carole Delenne, Ines Couso Blanco, Luciano Sanchez Ramos, and Zoltan Kato
This presentation addresses a major challenge: fully leveraging the potential of geospatial data to improve Geographic Information Systems (GIS). Using urban flooding as a case study, it aims to integrate heterogeneous data sources of varying nature and quality levels in order to enhance both the expressiveness and reliability of GIS.
 
This work presents ongoing and planned research activities within the ATLAS CHIST-ERA project, which is entirely dedicated to this objective through a multidisciplinary approach. The project mobilizes complementary expertise in GIS, artificial intelligence, machine learning, computer vision and 2D/3D image analysis and object detection, statistics, urban network mapping, as well as geoalignment techniques.
 
The presentation is structured around two main objectives, both oriented toward GIS enrichment, with direct applications for flood risk management.
 
The first objective consists of combining and integrating external data within GIS. This approach enables seamless data integration and facilitates the revision, completion, and enrichment of existing datasets, while improving their expressiveness, particularly through the introduction of 3D representations. Such enriched representations are essential for accurately modeling surface runoff, flow paths, and hydraulic connectivity in urban environments subject to flooding.
 
The second objective focuses on integrating imperfect or uncertain data, such as amateur videos, crowdsourced observations, or data lacking precise georeferencing. To address these limitations, the project relies notably on the use of variational autoencoders for processing imprecise data, and proposes uncertainty and imprecision management mechanisms aimed at improving data quality by reducing inaccuracies and explicitly modeling confidence levels.
 
Acknowledgments :
This work was supported by the CHIST-ERA project ATLAS "GeoAI-based augmentation of multi-source urban GIS" under grant numbers CHIST-ERA-23-MultiGIS-02 and ANR-24-CHR4-0005 (French National Research Agency).

How to cite: Benferhat, S., Chahinian, N., Delenne, C., Couso Blanco, I., Sanchez Ramos, L., and Kato, Z.: GeoAI-based augmentation of multi-source urban GIS, EGU General Assembly 2026, Vienna, Austria, 3–8 May 2026, EGU26-6637, https://doi.org/10.5194/egusphere-egu26-6637, 2026.

EGU26-6933 | ECS | Orals | HS3.8

Integration and Alignment of Multiple Water Network Data Sources 

Omar Et-targuy, Carole Delenne, Salem Benferhat, and Ahlame Begdouri

Wastewater network management relies on geographic data from multiple sources, which creates significant integration challenges: spatial inconsistencies, incomplete coverage, and varying levels of precision.

Although different data sources may cover the same portion of the network, they are generally produced in different contexts or at different times. This can result in discrepancies in the descriptions of the physical infrastructure of the wastewater network: some elements may be accurately represented in one source but absent in another, while other objects may be described slightly differently across sources. Furthermore, for certain parts of the network, the structure itself may vary depending on the source. Consequently, any operation to merge datasets or build a global network representation requires matching the objects described by each source in order to identify those corresponding to the same physical element, to recognize objects present in multiple sources, and to distinguish those with no correspondence in other datasets.

In this work, we propose a data integration methodology to address disparities among these data sources and to match the various elements of wastewater networks. This approach establishes correspondences between multiple datasets representing the same infrastructure from different sources. By combining spatial and structural information, the method identifies matching components across datasets and produces a unified representation that leverages the complementary information from each source while resolving conflicts and inconsistencies.

The approach has been validated on real-world wastewater network data from multiple sources and covering different time periods. The results demonstrate high integration accuracy. This methodology enables a complete and consistent representation of wastewater networks, addressing the challenges of data heterogeneity inherent in multi-source infrastructure management.

How to cite: Et-targuy, O., Delenne, C., Benferhat, S., and Begdouri, A.: Integration and Alignment of Multiple Water Network Data Sources, EGU General Assembly 2026, Vienna, Austria, 3–8 May 2026, EGU26-6933, https://doi.org/10.5194/egusphere-egu26-6933, 2026.

EGU26-7251 | Orals | HS3.8

 Cross-analysis of Multisource Data for Geolocation of Non-georeferenced Urban Infrastructure Data 

Thanh Ma, Salem Benferhat, Minh Thu Tran Nguyen, Nanée Chahinian, Carole Delenne, and Thanh-Nghi Do

Geographic Information Systems (GIS) are reference tools for representing, storing, analyzing, and visualizing geolocated data, particularly those related to urban infrastructures such as water networks. In addition to GIS reference data, there exists a significant amount of complementary data, referred to here as external data, generally produced in specific contexts such as urban network maintenance. When properly exploited, these external data sources, which are rich in information, can enhance GIS and help address the issue of missing data. However, these external data are often not geolocated, which makes their integration into GIS particularly complex.

The main objective of this work is to propose artificial intelligence–based methodologies to geolocate non-georeferenced external data, particularly maps related to urban water networks, by leveraging multisource data cross-analysis. The proposed approach relies on the joint exploitation of geolocated GIS data and external data lacking geolocation. It consists in analyzing maps using object detection techniques to extract characteristic elements, such as buildings or specific structures, which are then matched with corresponding entities available in the relevant GIS. By exploring different geographic areas of the same spatial extent as the maps and assessing the degree of similarity between the extracted elements and those referenced in the GIS, the method enables the identification of the most plausible area of correspondence and, ultimately, the geolocation of the maps in question.

This work addresses several major challenges in the context of geolocating external data using GIS data. The first challenge concerns the identification and selection of relevant elements capable of effectively guiding the search within available GIS. The second challenge lies in accounting for the sometimes limited reliability of object detection systems during the matching process. The third challenge involves defining appropriate similarity measures and selecting sufficiently discriminative elements for the matching process. Finally, the fourth challenge is algorithmic in nature, given that a map generally represents only a limited portion of a GIS, which raises issues similar to those encountered in large-scale matching approaches.

Acknowledgments :
This work was supported by the CHIST-ERA project ATLAS "GeoAI-based augmentation of multi-source urban GIS" under grant numbers CHIST-ERA-23-MultiGIS-02 and ANR-24-CHR4-0005 (French National Research Agency).

How to cite: Ma, T., Benferhat, S., Tran Nguyen, M. T., Chahinian, N., Delenne, C., and Do, T.-N.:  Cross-analysis of Multisource Data for Geolocation of Non-georeferenced Urban Infrastructure Data, EGU General Assembly 2026, Vienna, Austria, 3–8 May 2026, EGU26-7251, https://doi.org/10.5194/egusphere-egu26-7251, 2026.

EGU26-7685 | ECS | Posters on site | HS3.8

Data assimilation to retrieve unknown bathymetry in shallow water model 

Flavien Baudu, Carole Delenne, Thibault Catry, Sophie Ricci, Ludovic Cassan, Vincent Herbreteau, and Renaud Hostache

Floods are among the most destructive and costly natural disasters. While risk assessment and management have helped mitigate their impact in recent decades, climate change is expected to increase both their frequency and severity. This underscores the urgent need for predictive tools to better anticipate and prevent the adverse effects of flooding. Two-dimensional Shallow-Water (SW) hydraulic models offer a reliable solution for flood prediction, providing critical information such as floodplain extent, water levels and flow velocities. However, these models require boundary conditions (such as input flows), precise topography and bathymetry (i.e. riverbed geometry) as well as parameters to be calibrated (such as terrain roughness.  Unfortunately, such data are often sparse or entirely unavailable in many regions due to the high cost and logistical challenges of in situ measurements. In particular, if the topography can be obtained using LiDAR acquisition of Numerical Terrain Models, the bathymetry remains unaccessible because LiDAR signal does not pass through the water surface.

In this context, Data Assimilation (DA)—a method that optimally combines uncertain models with observations—becomes particularly valuable for estimating such missing data or parameters. Our study proposes an innovative approach to reconstruct riverbed geometry by assimilating flood extent information derived from satellite imagery, specifically Synthetic Aperture Radar (SAR) data, which can reliably detect floodwater extents.

To account for observational uncertainty, we generate a probabilistic flood map from SAR images, where each pixel’s value represents its probability of being water, based on observed backscatter. Using a tempered particle filter (TPF), we assimilate multiple SAR-derived probabilistic flood maps into an ensemble of hydraulic simulations (referred to as "particles"). These simulations share the same model architecture but incorporate randomly sampled riverbed geometries. 

To evaluate our methodology, we conducted a synthetic twin experiment based on a real-world case study of the River Severn near Tewkesbury, UK—a region prone to frequent flooding. We first perform a hydraulic simulation (the "control run") using a reference riverbed geometry and realistic boundary conditions. From this simulation, we generate several synthetic probabilistic flood maps, which were then assimilated into a second simulation to estimate the riverbed geometry using the TPF.

Our results demonstrate the effectiveness of this approach: the estimated riverbed geometry closely matches the reference. Additionally, contingency maps reveal strong agreement between the flood extents predicted by the control run and those obtained through the DA experiment.

How to cite: Baudu, F., Delenne, C., Catry, T., Ricci, S., Cassan, L., Herbreteau, V., and Hostache, R.: Data assimilation to retrieve unknown bathymetry in shallow water model, EGU General Assembly 2026, Vienna, Austria, 3–8 May 2026, EGU26-7685, https://doi.org/10.5194/egusphere-egu26-7685, 2026.

EGU26-7760 | Posters on site | HS3.8

Anomaly detection in wastewater pipeline videos using self-attention 

Carole Delenne, Ti-Hon Nguyen, Minh-Thu Tran-Nguyen, and Salem Benferhat

Data related to urban infrastructures often come from multiple sources and exist in a wide variety of formats, such as Geographic Information Systems (GIS), textual information, numerical databases, images, or videos, which can make their processing, querying, and analysis complex. This work falls within this context and aims to propose new approaches for the management of heterogeneous data in stormwater and wastewater networks.

More specifically, we focus on video data, particularly Closed-Circuit Television (CCTV) inspection videos of sewer pipelines. These videos are essential for the management and maintenance of urban networks. On the one hand, they enable the identification of anomalies that may affect the integrity of pipelines, such as blockages or structural degradation. On the other hand, they provide key information on the structural properties of pipelines and networks, including pipe diameter and the direction of wastewater flow.

We propose a classification algorithm for wastewater inspection videos aimed at detecting major anomalies in CCTV inspection sequences of sewer networks, with a particular emphasis on identifying variations in pipe diameter, internal cracks, chemical corrosion, and the presence of turbid water within the pipelines. This task is crucial for predictive maintenance and hydraulic modeling of sewer systems. Information related to the identification of variations in pipe diameter can also be leveraged to enrich and complete missing pipe diameter attributes in Geographic Information Systems.

Our approach is based on the Video Vision Transformer (ViViT) and TimeSformer architectures, which effectively capture both spatial and temporal relationships in video data. We also describe various methodologies for generating training datasets from a subset of manually annotated images. Experimental results obtained on real-world CCTV sewer inspection videos provided by Montpellier Méditerranée Métropole demonstrate promising performance in anomaly detection.

How to cite: Delenne, C., Nguyen, T.-H., Tran-Nguyen, M.-T., and Benferhat, S.: Anomaly detection in wastewater pipeline videos using self-attention, EGU General Assembly 2026, Vienna, Austria, 3–8 May 2026, EGU26-7760, https://doi.org/10.5194/egusphere-egu26-7760, 2026.

EGU26-7776 | ECS | Posters on site | HS3.8

CawSAR: an open-source framework for preprocessing hydroclimatic data in physically based hydrological modelling 

Tristan Bourgeois, Nicolas Flipo, Marie Pettenati, and Hervé Noel

Water resource management is a major challenge for the coming decades. Its effective application across diverse territories therefore relies on an accurate representation of hydrological processes, generally achieved through physically based distributed hydrological models which in turn depend on spatially consistent and representative hydroclimatic forcing. At regional scales, capturing local variability in hydroclimatic drivers (precipitation, temperature, evapotranspiration) often requires combining datasets with different spatial resolutions and methodological assumptions.

Within the Eau-SPRA project (ADEME, France 2030 Programme), the CaWaQS model (Flipo et al., 2022; Flipo et al., 2023) is applied to the Loire River basin to support socio-hydrological modelling from regional to local scales. CaWaQS is a coupled distributed surface–subsurface hydrological model simulating both river discharge and groundwater dynamics. It currently lacks an explicit snow representation, which can significantly affect hydrological dynamics across scales, particularly in large river basins such as the Loire and under climate change conditions (Valéry et al., 2014).

To address these challenges, we developed CawSAR (CaWaQS Snow Accounting Routine), an open-source Python-based preprocessing framework designed to harmonize multi-source climate data (e.g. reanalysis products, radar observations) over a target study area. Based on a 3D matrix representation (time, x, y) of climate fields, it integrates multiple functionalities within a single, reproducible workflow. Climate data are harmonized through systematic downscaling, upscaling and regridding performed on a grid-cell basis using physical external-drift adjustments (altimetric gradient). CawSAR also enables cross-comparison of climate data sources across different spatio-temporal scales and implements a degree-day snow model to compute snow accumulation and melt. Finally, it generates liquid input time series (sum of liquid rainfall and snowmelt) fully compatible with the CaWaQS core model, ensuring direct integration into hydrological simulations.

Applied to the Loire basin, CawSAR illustrates how physically based preprocessing and multi-source harmonization enhance hydroclimatic forcing consistency for regional-scale hydrological modelling.

How to cite: Bourgeois, T., Flipo, N., Pettenati, M., and Noel, H.: CawSAR: an open-source framework for preprocessing hydroclimatic data in physically based hydrological modelling, EGU General Assembly 2026, Vienna, Austria, 3–8 May 2026, EGU26-7776, https://doi.org/10.5194/egusphere-egu26-7776, 2026.

EGU26-9507 | ECS | Posters on site | HS3.8

From Imperfect Sewer Data to Coherent Topology: A Graph-Based Approach  

Batoul Haydar, Nanée Chahinian, and Claude Pasquier

Urban sewer networks are critical infrastructures that support residents' everyday life and ensure the collection and transportation of wastewater and stormwater. Yet operational datasets describing these networks are frequently imperfect: pipes may be missing, connectivity may be fragmented, and flow direction may be inconsistent due to incomplete attributes (e.g., invert levels, slope) or digitizing errors. We present a topology-focused study that transforms sewer data into a directed network by combining (i) graph-based representation and (ii) geometry-based consistency checks and rules. Starting from a directed (multi)graph built from available pipe and node geometries, which represent the edges and nodes in the graph, we detect topological anomalies including disconnected components, missing connections, dead ends, and closed loops.

When two pipes converge at a manhole with no outgoing pipe, it forms a non-outlet sink. To resolve this, we apply a two-stage methodology: edge orientation to reduce flow inconsistencies and resolve any sink nodes, followed by targeted edge addition to reconnect remaining disconnected components when reversals alone are insufficient. We test feasibility of the approach on a large open-access urban sewer dataset. The results illustrate how topology-oriented methods can still be applied to establish a well-connected network when data attributes are missing or unreliable.

How to cite: Haydar, B., Chahinian, N., and Pasquier, C.: From Imperfect Sewer Data to Coherent Topology: A Graph-Based Approach , EGU General Assembly 2026, Vienna, Austria, 3–8 May 2026, EGU26-9507, https://doi.org/10.5194/egusphere-egu26-9507, 2026.

EGU26-11107 | Orals | HS3.8

The effects of droughts on pumping fields at the watershed scale: building a model from a heterogeneous dataset. 

Jordan Labbe, Hélène Celle, Julie Albaric, Pierre Nevers, Gilles Mailhot, Jean-Luc Devidal, and Nathalie Nicolau

Water management is becoming an increasingly complex task that must account for not only climate change but socio-economic pressures as well. This is particularly true in the case of alluvial aquifers which are often connected to surface waters, thus requiring a watershed scale policy. Conflicts of use might emerge especially during droughts which are occurring more frequently. In this context, the alluvial aquifer of the Allier River (France) is an interesting case study. This is a major regional resource for drinking water, industries and irrigation which extends over 210 km long between Langeac and the confluence with the Loire River. The Naussac dam keeps the Allier River at a minimum flow rate and secures water uses downstream, but the summer drought of 2023 was extreme and the dam was almost completely emptied. If this situation were to repeat itself over a longer period, the consequences on the productivity of pumping fields implanted on the alluvial aquifer are unknown. This work is part of the MODALL² project in which we propose to build a transient model of the alluvial aquifer using MODFLOW (Groundwater Vistas 8). One of the main challenges is to gather and organize a set of often heterogeneous data (incomplete time series, spatial data sparsely distributed etc.) from various sources. With the intention of improving the existing network, 50 additional water loggers have been deployed for groundwater level monitoring. 30 Electrical Resistivity Tomography (ERT) profiles were carried out to refine the thickness of alluvial deposits on the well-fields and thus, the geometry of the model. Given the elongated dimension of the alluvial aquifer, the study area is divided into 9 sub-models with which a ‘cascade modelling’ is performed. The purpose is to better understand how droughts spread across the whole hydrosystem and to what extent the pumping fields will be affected. ERT surveys have revealed that the thickness of alluvial deposits varies significantly from one site to another, ranging from 5 to 15 m downstream where the alluvial plain is more widespread. Hydrodynamic data show the influence of the river on groundwater level variations depending on the distance from the river. Lastly, the heterogeneity of the input datasets introduces uncertainty into the model that will need to be estimated. Beyond the potential to use modeling to anticipate future water crises, this work also proposes a methodology for handling large-scale heterogeneous datasets.

How to cite: Labbe, J., Celle, H., Albaric, J., Nevers, P., Mailhot, G., Devidal, J.-L., and Nicolau, N.: The effects of droughts on pumping fields at the watershed scale: building a model from a heterogeneous dataset., EGU General Assembly 2026, Vienna, Austria, 3–8 May 2026, EGU26-11107, https://doi.org/10.5194/egusphere-egu26-11107, 2026.

EGU26-11579 | ECS | Orals | HS3.8

A comparative benchmark of tabular, sequential, and graph-based models for well-log imputation 

Wendinkonté Fabrice Cédric Sawadogo, Romain Chassagne, and Olivier Atteia

Well-log datasets commonly contain missing values due to acquisition issues, operational constraints, and economic limitations, which complicate quantitative subsurface analysis and useful extraction of information in geothermal and more largely subsurface characterisation. Imputation is therefore a key preprocessing step, yet many existing approaches primarily focus on within-well continuity and treat the problem as a depth-wise or time-series task, often overlooking spatial redundancy between neighbouring wells.

In this contribution, we compare three complementary modeling paradigms for well-log imputation: tabular machine-learning methods, sequential deep-learning models, and spatially informed graph-based approaches. The comparison is conducted within a unified and reproducible experimental framework based on cross-well validation and realistic missingness scenarios, including isolated gaps as well as extended block-wise and complete log-wise gaps.

Results highlight clear differences in behaviour across modeling families. Tabular methods exhibit limited robustness when missing values become structured, while sequential models improve depth-wise continuity but remain sensitive to large gaps and absent logs. In contrast, spatially informed graph-based models show increased stability by exploiting inter-well relationships, leading to more coherent reconstructions at the field scale.

These results suggest that evaluating imputation quality solely through local error metrics is insufficient for realistic subsurface applications. By emphasizing the importance of spatial coherence and inter-well information, this study supports the use of spatially aware formulations as a valuable alternative to purely depth-wise approaches for geothermal and broader subsurface characterization workflows.

How to cite: Sawadogo, W. F. C., Chassagne, R., and Atteia, O.: A comparative benchmark of tabular, sequential, and graph-based models for well-log imputation, EGU General Assembly 2026, Vienna, Austria, 3–8 May 2026, EGU26-11579, https://doi.org/10.5194/egusphere-egu26-11579, 2026.

EGU26-11636 | ECS | Orals | HS3.8

Unsupervised pattern recognition for imperfect datasets: a visual workflow for plausibility checks and regime diagnosis in high-dimensional environmental time series 

Kenneth Gutiérrez, Gunnar Lischeid, Gökben Demir, Maren Dubbert, Alexander Knohl, and Christian Markwitz

Data imperfection is characterized by fragmentation, sensor failures, and high-dimensional noise. This remains a persistent challenge in environmental monitoring. As observation networks expand to capture heterogeneous soil-atmosphere interactions, traditional quality control methods based on rigid statistical thresholds often struggle to distinguish between sensor errors and genuine, non-linear system dynamics. This study presents a methodological development for knowledge extraction from imperfect and fragmented data, employing a multivariate visualization workflow that combines Principal Component Analysis (PCA) and Self-Organizing Maps (SOM) with Sammon Mapping.

We applied this unsupervised learning approach to a high-dimensional dataset (~100 variables) from a field-scale agricultural system, including measurements of soil moisture and temperature, eddy covariance-derived CO2, energy fluxes, radiation, wind, precipitation, groundwater level and discharge.

This allowed us to compare a discontinuous period in 2024 against a continuous period in 2025. The results demonstrate the method's robustness in extracting coherent structural patterns despite data incompleteness. While PCA effectively isolated the dominant thermodynamic baselines from high-frequency hydrologic events, the topological SOM projection provided a rapid, visual plausibility check.

The visualization facilitated the identification of possible irregularities in the sensors as spatial outliers in the 2024 dataset, facilitating instant anomaly detection without manual time-series inspection. Furthermore, the method successfully captured shifts in system dynamics, such as the decoupling of surface moisture from groundwater, validating its utility for identifying physical regimes in heterogeneous data. We conclude that this visual workflow offers a scalable, data-driven solution for moving from raw, imperfect observations toward actionable system diagnostics, bridging the gap between data acquisition and process understanding in complex environmental observatories.

How to cite: Gutiérrez, K., Lischeid, G., Demir, G., Dubbert, M., Knohl, A., and Markwitz, C.: Unsupervised pattern recognition for imperfect datasets: a visual workflow for plausibility checks and regime diagnosis in high-dimensional environmental time series, EGU General Assembly 2026, Vienna, Austria, 3–8 May 2026, EGU26-11636, https://doi.org/10.5194/egusphere-egu26-11636, 2026.

EGU26-11928 | Posters on site | HS3.8

A Disjunctive Interpretation Approach to Missing Data Based on Clustering Quality 

hamza khyari and Salem Benferhat

Data completion is a major challenge in many applications, particularly in Geographic Information Systems (GIS) for water networks. Numerous approaches have been proposed to address this problem, ranging from classical statistical methods to artificial intelligence-based techniques.

In this presentation, we address the problem of missing or imprecise data in water network GIS by proposing a clustering-based data completion approach. For a given attribute with missing or uncertain values, each possible value in the attribute domain is considered as a candidate for completion. Each candidate is evaluated by analyzing its impact on the clustering of the entire dataset: inserting a candidate value induces a specific global clustering, whose quality is assessed using appropriate clustering validity criteria. The value that yields the highest-quality clustering, namely the one that best captures the intrinsic structure of the data, is selected as the final completion value.

To cope with the combinatorial explosion resulting from multiple attributes with missing values and large domains, several strategies are employed to reduce the number of candidate completions, including aggregation mechanisms, while maintaining both the effectiveness and efficiency of the proposed approach.

How to cite: khyari, H. and Benferhat, S.: A Disjunctive Interpretation Approach to Missing Data Based on Clustering Quality, EGU General Assembly 2026, Vienna, Austria, 3–8 May 2026, EGU26-11928, https://doi.org/10.5194/egusphere-egu26-11928, 2026.

EGU26-14633 | Posters on site | HS3.8

Composing Transparent Quality Control Pipelines from Basic Anomaly Descriptions 

Peter Lünenschloß, David Schaefer, and Jan Bumberger

Quality control (QC) and data cleaning remain major bottlenecks in geoscientific data analysis as data volumes, dimensionality, and heterogeneity continue to increase. While machine- and deep-learning-based approaches have demonstrated impressive performance in selected applications, their practical adoption is often constrained by the availability of sufficiently large labelled training datasets and by the effort required to calibrate and adapt model hyperparameters across datasets and domains, particularly in unsupervised flagging scenarios. Conversely, rule-based, deterministic, and statistical QC approaches offer greater transparency and interpretability, but are frequently tailored to specific data structures and lack the flexibility required to robustly generalise to varying observational contexts and non-ideal data distributions.

We present a software framework that addresses this gap by enabling the formulation of QC pipelines in terms of a small set of basic anomaly descriptions, such as outliers, noisy regimes, and data gaps. These anomaly notions are intuitively understood by domain experts, while their systematic combination allows the representation of a wide range of anomaly patterns encountered in geoscientific observations.

The parameters of these compositions are then automatically calibrated with the data at hand, resulting in an instantiated QC pipeline. By internally reducing the calibration problem to the fitting of individual anomaly descriptions defined by only a small number of well-understood parameters, the optimisation achieves robust convergence even with a limited number of supervised examples. Within the framework, such examples can be generated interactively during pipeline construction by domain specialists themselves or imported from existing sources. This design lowers the entry barrier for effective automated quality control while enabling the explicit integration of domain knowledge into the calibration process.

The framework is implemented as a new module within the open-source quality-control software SaQC, thereby integrating seamlessly with existing data import, preprocessing, and flag management workflows. Calibrated QC pipelines can be exported and stored as portable, human-readable configuration files in a tabular format. These configurations can subsequently be loaded and applied using the SaQC application to new and unseen datasets, enabling reproducible and automated quality control.

In the poster, we present the conceptual design of the framework and demonstrate its application to a hydrological dataset, highlighting the transparent, combinatorial configuration interface and the integrated supervision workflow.


How to cite: Lünenschloß, P., Schaefer, D., and Bumberger, J.: Composing Transparent Quality Control Pipelines from Basic Anomaly Descriptions, EGU General Assembly 2026, Vienna, Austria, 3–8 May 2026, EGU26-14633, https://doi.org/10.5194/egusphere-egu26-14633, 2026.

EGU26-14708 | ECS | Orals | HS3.8

A Knowledge Graph–Based Approach for reconciling Geological information 

Imadeddine laouici and Fatma Chamekh

The understanding of the subsurface relies on integrating heterogeneous geological information originating from geological maps, geological models, and textual sources such as reports and scientific publications. In current practice, these sources remain rarely homogenized and are reconciled manually by domain experts, mostly in the context of 3D geomodel construction projects. Even when information is reconciled, existing methods offer limited support for expert knowledge integration, traceability of interpretations, and automated wholistic consistency checking.

We propose SemTrack, an ontology-based integration approach designed to formalize, reconcile, and exploit multi-source geological information within a unified knowledge graph. In this framework, SemTrack integrates structured information extracted from maps and numerical geological models with unstructured knowledge derived from textual documents, all aligned through a dedicated modeling ontology. The resulting knowledge graph supports logical reasoning and knowledge inference using SWRL rules to ensure the consistency of geological constraints and allows to explicitly encode expert interpretations record. This enables the automation of conceptual inconsistencies detection, transparent inference of implicit geological relationships, the completion of missing information across multiple sources, and advanced complex querying of initially heterogenous geological information.

How to cite: laouici, I. and Chamekh, F.: A Knowledge Graph–Based Approach for reconciling Geological information, EGU General Assembly 2026, Vienna, Austria, 3–8 May 2026, EGU26-14708, https://doi.org/10.5194/egusphere-egu26-14708, 2026.

EGU26-15597 | Posters on site | HS3.8

Quality Control of Redundant Water Level Gauges in South Korea River Gauging Stations 

TaeWoong Ok, ChiYoung Kim, KiYong Kim, and ChanWoo Kim

In South Korea, river stage gauging stations operate redundant water level gauges to mitigate instrument malfunctions and anomalous measurements. Currently, redundant gauges are installed at over 60% of gauging stations, reflecting their widespread implementation; however, their quality management and practical utilization remain limited. In many cases, installation and operational conditions are not fully accounted for in observed water levels, leading to significant discrepancies between primary and redundant gauges. These discrepancies may arise from river characteristics, artificial configuration errors, or site-specific conditions.


This study investigates the causes of discrepancies between primary and redundant gauges and proposes appropriate correction methods. Anomaly detection was first conducted on redundant gauge measurements using limit tests, duration tests, and regression tests to ensure data reliability. Based on this, the relationships between primary and redundant gauge readings were analyzed using simple regression, multiple regression, and nonparametric LOESS (Locally Estimated Scatterplot Smoothing) regression. These procedures not only facilitated the derivation of site-specific correction methods but also supported the preliminary development of a real-time quality control program, moving beyond conventional manual, non-real-time quality management.


Nevertheless, because the causes of discrepancies and installation conditions vary by site, site-specific correction strategies are required, and ongoing monitoring and refinement of measurements and corrections remain necessary. Furthermore, real-time utilization of redundant gauges is challenging at newly established stations. Despite these limitations, the proposed correction strategies have the potential to go beyond simple substitution of primary gauge readings, enabling higher-quality hydrological data production and improved quality control. These strategies are expected to enhance real-time hydrological monitoring systems and strengthen the reliability of national hydrological data management frameworks.

Keywords : Redundant, Water Level Gauging, Uncertainty, Operational Monitoring


Acknowledgements

This work was supported by Korea Environment Industry & Technology Institute(KEITI) through Research and Development on the Technology for Securing the Water Resources Stability in Response to Future Change Project, funded by Korea Ministry of Climate, Energy, Environment(MCEE)(RS-2024-00332300).

How to cite: Ok, T., Kim, C., Kim, K., and Kim, C.: Quality Control of Redundant Water Level Gauges in South Korea River Gauging Stations, EGU General Assembly 2026, Vienna, Austria, 3–8 May 2026, EGU26-15597, https://doi.org/10.5194/egusphere-egu26-15597, 2026.

EGU26-15843 | Posters on site | HS3.8

Comparative Evaluation of Daily Streamflow Gap-Filling Using Paired Upstream–Downstream Gauges 

Chi Young Kim, Chanwoo Kim, and Taewoong Ok

Complete daily streamflow time series are essential for sustainable water resources management and reliable hydrological modelling; however, even short data gaps can substantially reduce the usability of streamflow records. Recurrent missing data may lead to inefficient model calibration, decreased reliability of peak and low-flow estimates, and biased hydrological statistics. Therefore, rather than leaving missing values unfilled, it can be beneficial to infill daily streamflow using appropriate methods and to provide flags indicating imputed periods. 
In South Korea, streamflow monitoring prior to 2008 primarily focused on flood-related observations, resulting in relatively limited daily streamflow records; since then, the production of continuous daily streamflow data for water resources management has expanded. As of 2024, daily streamflow records from more than 420 gauging stations are managed and disseminated, yet a non-negligible number of stations still contain missing values due to various causes such as river works and uncertainties in stage–discharge relationships associated with the operation of hydraulic structures. 
This study comparatively evaluates gap-filling techniques using paired upstream–downstream gauging stations located in basins with diverse rainfall regimes and hydrological characteristics. We assess conventional methods widely used in practice (scaling, linear regression, and equi-percentile/quantile-based approaches) under different missing-data conditions and benchmark them against an extended long short-term memory (extended LSTM) time-series model designed for streamflow infilling. Performance is evaluated using the Nash–Sutcliffe efficiency (NSE), root mean square error (RMSE), and percent bias (PBIAS). In addition, flow duration curves (FDCs) are compared to examine each method’s ability to reproduce the post-infilling flow regime distribution. The outcomes are expected to support condition-dependent selection of gap-filling strategies and to improve the reliability of daily streamflow datasets with explicit quality flags.

How to cite: Kim, C. Y., Kim, C., and Ok, T.: Comparative Evaluation of Daily Streamflow Gap-Filling Using Paired Upstream–Downstream Gauges, EGU General Assembly 2026, Vienna, Austria, 3–8 May 2026, EGU26-15843, https://doi.org/10.5194/egusphere-egu26-15843, 2026.

EGU26-17357 | Posters on site | HS3.8

A Preliminary Analysis of High Water Events in Venice Based on Multi-Decadal Observations and Clustering 

Franco Alberto Cardillo, Angela Andrigo, Francesco De Biasio, Franca Debole, Marco Favaro, Alvise Papa, Umberto Straccia, and Stefano Vignudelli

High water events in Venice are a recurrent phenomenon, as the city is located only slightly above mean sea level and is directly influenced by water-level variations within the lagoon. Flooding occurs when several physical processes act in combination. The astronomical tide determines the baseline water level, which is subsequently modulated by seiche oscillations in the Adriatic Sea, meteorological forcing (e.g. wind stress and atmospheric pressure), and slower, low-frequency geophysical processes and sea level rise. When these factors co-occur, even if individually moderate, large portions of the city may experience flooding.

Repeated flooding has significant economic and social impacts, limits pedestrian and naval traffic and contributes to the degradation of buildings and cultural heritage. To mitigate these effects, a range of protective measures is implemented and coordinated by an early warning system. The effectiveness of these measures depends on their timely activation. However, mitigation actions are associated with substantial economic costs and may themselves generate negative impacts if deployed unnecessarily. For instance, interruptions to public transport services affect daily activities, while the operation of the MOSE barrier entails considerable financial costs. Accurate and reliable forecasts are therefore essential to balance flood protection with the economic and social costs of mitigation measures.

Current forecasting systems primarily estimate water levels and peak values, and these are typically estimated at a limited number of locations. These systems are based on sophisticated statistical and hydrodynamic models. Although they perform well in most situations, their accuracy can be affected by uncertainties in atmospheric forcing and by limitations in representing the full variability of high water events. This work explores the potential of complementary approaches based on the analysis of observational data rather than explicit physical modelling.

Data-driven approaches, in particular Machine Learning (ML) methods, analyze historical data without relying on predefined, human-designed model structures. ML models are able to capture recurring patterns and complex feature interactions that are difficult to incorporate into traditional numerical models. Among these approaches, clustering techniques aim to identify recurrent types of events based on similarities in their temporal evolution and associated meteorological conditions. This enables events characterized by similar water levels to be differentiated according to the combinations of underlying meteorological drivers, thereby providing additional information to support forecasting and response planning.

In this work, we present a preliminary analysis based on several clustering approaches, including k-means, DBSCAN, and deep learning–based methods, applied to a multi-decadal atmospheric dataset and to the longest available reconstructed hourly sea-level records for the northern Adriatic Sea, specifically developed for this study. We compare the resulting event classifications and discuss how cluster-derived information may complement existing forecasting systems in support of flood-mitigation strategies for the city of Venice.

How to cite: Cardillo, F. A., Andrigo, A., De Biasio, F., Debole, F., Favaro, M., Papa, A., Straccia, U., and Vignudelli, S.: A Preliminary Analysis of High Water Events in Venice Based on Multi-Decadal Observations and Clustering, EGU General Assembly 2026, Vienna, Austria, 3–8 May 2026, EGU26-17357, https://doi.org/10.5194/egusphere-egu26-17357, 2026.

Managing multi-source data requires flexible approaches and tools to model many types of imperfections surrounding them and, and more braodly, to deal with uncertainties of multiple origins, namely aleatory (representing randomness) and epistemic uncertainty (related to imperfect knowledge). While the first origin can be adequately represented using classical probabilities, there is no simple, single answer for epistemic uncertainty. New theories of uncertainty based on "imprecise probabilities" have been developed in the literature to go beyond the systematic use of a single probabilistic law. In this communication, I analyze the application of these methods for quantifying uncertainty in various real-world cases of natural hazard assessment (earthquakes, floods, rockfalls) in terms of their advantages and disadvantages compared to the traditional probabilistic approach. On this basis, I draw lessons to support decision making under uncertainty and identify open questions and remaining challenges, in particular the integration of spatio-temporal geodata, the use of full process high-fidelity numerical models, and interfacing with AI-based approaches.

I acknowledge financial support of the French National Research Agency within the HOUSES project (grant N°ANR-22-CE56-0006).

How to cite: Rohmer, J.: Dealing with imperfect knowledge in natural hazard assessments: beyond classical probabilities and challenges, EGU General Assembly 2026, Vienna, Austria, 3–8 May 2026, EGU26-17687, https://doi.org/10.5194/egusphere-egu26-17687, 2026.

EGU26-19993 | ECS | Orals | HS3.8

Uncertainty produced in a 15-minute gridded rainfall product for the UK.  

Tom Keel, Matt Fry, and Sam Counsell

Reliable rainfall datasets are an essential foundation for hydrological research. The most extensive rainfall information is collected from rain gauge networks, which provide high-frequency observations on rainfall intensity at those locations, or their data can be interpolated onto a regular grid to provide consistent region-wide estimates.

For the UK, there are two major daily gridded rainfall products: (1) CEH-GEAR developed by the UK Centre for Ecology & Hydrology, and (2) HadUK-Grid developed by the Met Office. In each case, they are built from a selection of rain gauges from a multi-nation rain gauge network spanning Great Britain. Decisions made at each stage of rainfall data preparation, about collection, formatting, quality control and then gridding, introduce uncertainty into the resulting gridded rainfall products.

In this talk, we discuss plans for CEH-GEAR 15 min, a new sub-daily 1 km product developed as part of the UK’s multi-year Flood & Drought Research Infrastructure (FDRI) project. We detail each step of its production, from raw rain gauge to gridded rainfall estimates, and systematically discuss the sources of uncertainty introduced at each stage. 15-minute rainfall measurements tend to be highly variable in space and time, and intense storms or long dry periods create practical challenges for preparing gridded rainfall estimates. So, we quantify the sensitivity of those estimates to decisions made about quality control and data blending during notable rain events across the UK. We also present the associated open-source tools developed as part of FDRI, including RainfallQC, that aim to support reproducible rainfall data processing and alleviate some of the challenges in sub-daily rainfall data preparation.

How to cite: Keel, T., Fry, M., and Counsell, S.: Uncertainty produced in a 15-minute gridded rainfall product for the UK. , EGU General Assembly 2026, Vienna, Austria, 3–8 May 2026, EGU26-19993, https://doi.org/10.5194/egusphere-egu26-19993, 2026.

EGU26-23039 | Posters on site | HS3.8

Managing Incomplete Urban Reference Data for Risk-Oriented Geoscience Applications: Lessons from the CERES Project 

Gracianne Cécile, Youssef Fouzai, Mirga Bokidingo, Caterina Negulescu, Yves Lucas, Gilles Grandjean, and Fatima Chamekh

Assessing exposure and vulnerability to natural hazards increasingly relies on national geospatial reference datasets. However, these datasets are often incomplete, heterogeneous and inconsistent across spatial scales, which limits their direct usability for multi-hazard risk analysis. In France, the BD TOPO building database exemplifies these challenges, with a large share of buildings lacking key attributes such as usage type, despite their importance for vulnerability assessment.
This contribution presents the approach developed within the CERES project (Cartography and Characterization of Exposed Elements from Satellite Imagery) to address reference data incompleteness and multi-source integration challenges in a geoscience risk context. Focusing on a large study area in the Centre-Val de Loire region, we first quantify and analyze the spatial and semantic gaps of BD TOPO building attributes, showing that more than 40% of buildings are labelled with unknown usage. We then demonstrate how deep learning applied to very high-resolution aerial imagery can be used to probabilistically infer missing semantic information, significantly reducing uncertainty while explicitly accounting for classification ambiguities.
Beyond data completion, we highlight the difficulties encountered when jointly exploiting heterogeneous datasets originating from national mapping agencies, land cover products, socio-economic statistics and hazard layers. These include spatial misalignments, inconsistent scales of representation, varying levels of reliability, and the absence of a shared data model. To address these issues, CERES proposes a multi-scale data structuring framework combining data modelling and processing designed to preserve data provenance, uncertainty and semantic traceability across sources.
By articulating reference data analysis, machine-learning-based enrichment and database design, this work provides a concrete illustration of current practices and challenges in managing imperfect geospatial data for geoscience applications. The results underline the necessity of coupling data-driven approaches with explicit data governance and modelling strategies to produce robust, transparent and reusable datasets for territorial risk assessment.

How to cite: Cécile, G., Fouzai, Y., Bokidingo, M., Negulescu, C., Lucas, Y., Grandjean, G., and Chamekh, F.: Managing Incomplete Urban Reference Data for Risk-Oriented Geoscience Applications: Lessons from the CERES Project, EGU General Assembly 2026, Vienna, Austria, 3–8 May 2026, EGU26-23039, https://doi.org/10.5194/egusphere-egu26-23039, 2026.

HS4 – Hydrological forecasting

EGU26-2858 | ECS | PICO | HS4.1

Probabilistic Flood Mapping and Impact Analysis from Downscaled Compound Flood Ensembles in Southeast Texas 

Mark Wang, Paola Passalacqua, Ethan Coon, Saubhagya Rathore, and Gabriel Perez

Flooding is one of the costliest natural disasters; from 1980 to 2024 it has cost the United States over $200 billion cumulatively according to NOAA. Texas has been impacted by extreme flood events, including Hurricane Harvey (2017), Tropical Storm Imelda (2019), and the July 2025 floods which tragically caused over 100 fatalities. We focus on Southeast Texas, where low-relief terrain contributes to compound floods driven by fluvial and pluvial forcings. This work is part of the Southeast Texas Urban Integrated Field Laboratory (SETx-UIFL), where we collaborate with regional stakeholders—representing local government agencies, practitioners, community organizations, and industry partners—through task forces with whom we identify areas of concern, share scientific findings, and co-create actionable flood information. Compound flooding is computationally expensive to model at high resolution because coupled physical models are necessary to accurately capture compound flood processes and feedbacks. We downscale coarser results from the Advanced Terrestrial Simulator (ATS), a fully distributed surface-subsurface hydrologic model that includes compound fluvial-pluvial flood processes, to map flood inundation at residential block scale (1 to 3 m). We force ATS with ensembles of synthetic storm events generated using flood frequency analysis and stochastic storm transposition. We develop and apply a volume-conservative downscaling technique to the ensembles of ATS flood output, increasing resolution from an unstructured mesh with element edge length O(100 m) to a regular grid with element edge length O(1 m). We compute probabilistic flood maps by calculating the annual recurrence interval (ARI) at each pixel in our downscaled product, and validate against an extensive local gage network and FEMA's 100-year ARI floodplain. To translate probabilistic flood maps into actionable information co-developed with stakeholders, we perform impact analysis on urban centers within our study area: we intersect downscaled inundation maps with population data, building footprints, and transportation infrastructure. We also classify flood depths using human-meaningful thresholds to communicate flood impacts intuitively. This approach provides a nuanced understanding of flood risk by illustrating spatial variations in flood probability and quantifying impacts on people and infrastructure. 

How to cite: Wang, M., Passalacqua, P., Coon, E., Rathore, S., and Perez, G.: Probabilistic Flood Mapping and Impact Analysis from Downscaled Compound Flood Ensembles in Southeast Texas, EGU General Assembly 2026, Vienna, Austria, 3–8 May 2026, EGU26-2858, https://doi.org/10.5194/egusphere-egu26-2858, 2026.

EGU26-5012 | ECS | PICO | HS4.1

Advancing the UK Hydrological Outlook using skill-based forecast blending 

Burak Bulut, Wilson Chan, Amulya Chevuturi, Katie Facer-Childs, Mark Rhodes-Smith, Helen Davis, Victoria Bell, John Wallbank, Steven Wells, Robert J. Moore, and Steven J. Cole

The UK Hydrological Outlook (UKHO) provides sub-seasonal to seasonal forecasts of river flows and groundwater levels, providing insight into possible future hydrological conditions over the UK (https://ukho.ceh.ac.uk/). In 2012 the extreme drought–flood transition highlighted the need for a proactive anticipatory system to support better water resource management, and led to development of the UKHO. Since then the UKHO has evolved to provide ensemble forecasts encompassing multiple methods, including Ensemble Streamflow Prediction (ESP) and Historical Weather Analogues (HWA), applied at a daily time-step for multiple lead-times using the catchment-based airGR model (GR6J) and the grid-based Grid-to-Grid/Water Balance Model (G2G-WBM). Work is ongoing to extend the suite of models to include additional catchment models that have previously been successfully applied to UK catchments (e.g., Hydrologiska Byråns Vattenbalansavdelning, HBV and the Probability Distributed Model, PDM). However, use of multiple ensemble methods and models can make it challenging for users and decision-makers to interpret their probabilistic forecasts effectively, especially when compared to the simplicity of a single deterministic forecast. To address this challenge, it is essential to integrate these diverse procedures to deliver skilful, standardized, and easy-to-interpret forecasts. Here, we aim to advance the UKHO by first applying bias correction and then blending ensemble forecasts based on the skill of each method and model for individual catchments at different lead times, to produce consolidated probabilistic predictions that can be utilised more simply. We evaluate several blending techniques designed for probabilistic forecasts, combining the individual strengths of different methods and models while preserving the ensemble spread, which is essential for representing forecast uncertainty. This approach will inform water resource management and support hydrological hazard mitigation by delivering forecasts that are both comprehensive and easy to understand and use for operational decision-making.

How to cite: Bulut, B., Chan, W., Chevuturi, A., Facer-Childs, K., Rhodes-Smith, M., Davis, H., Bell, V., Wallbank, J., Wells, S., Moore, R. J., and Cole, S. J.: Advancing the UK Hydrological Outlook using skill-based forecast blending, EGU General Assembly 2026, Vienna, Austria, 3–8 May 2026, EGU26-5012, https://doi.org/10.5194/egusphere-egu26-5012, 2026.

EGU26-5477 | ECS | PICO | HS4.1

Evaluating loss functions for extreme streamflow predictions 

Georgia Papacharalampous, Francesco Marra, Eleonora Dallan, and Marco Borga

Accurately predicting hydrological extremes is critical for effective flood risk and water resources management, yet it remains a major scientific and operational challenge. A wide range of loss functions is available for evaluating predictive performance, ranging from well-established hydrological metrics to less known alternatives drawn from the broader statistical literature. These loss functions differ in their mathematical properties and implicit assumptions, which might lead to substantially different model behaviour and predictive skills when they are used for model calibration.

We compile and systematically evaluate a comprehensive suite of loss functions for calibrating hydrological models, with a particular emphasis on the prediction of streamflow extremes. By comparing their performance across a range of conditions, we highlight how the choice of calibration objective influences model sensitivity to high and extreme flows. Our findings provide practical guidance for selecting appropriate loss functions in hydrological modelling applications, with the aim of improving the reliability and robustness of predictions for high-impact hydrological events.

Acknowledgements: This work was funded by the Research Center on Climate Change Impacts - University of Padova, Rovigo Campus - supported by Fondazione Cassa di Risparmio di Padova e Rovigo.

How to cite: Papacharalampous, G., Marra, F., Dallan, E., and Borga, M.: Evaluating loss functions for extreme streamflow predictions, EGU General Assembly 2026, Vienna, Austria, 3–8 May 2026, EGU26-5477, https://doi.org/10.5194/egusphere-egu26-5477, 2026.

EGU26-7321 | PICO | HS4.1

From Strategy to Action: Strengthening Global Hydrological Research within WMO 

Ilias Pechlivanidis and Stefan Uhlenbrook and the WMO TT-HydroResearch members

The WMO Research Board Task Team on Hydrology Research (TT-HydroResearch) operated from September 2023 to December 2025 with the objective of strengthening coordination, coherence, and strategic direction of hydrological research within the World Meteorological Organization (WMO). The Task Team supported integration across WMO research programmes, including the World Weather Research Programme and the World Climate Research Programme, while fostering strong links with external scientific and operational communities such as UNESCO-IHP, IAHS, HEPEX, EGU, and AGU. A central mandate of TT-HydroResearch was the review and update of the WMO Hydrology Research Strategy 2022-2030 (known now as WMO Operational Hydrology Research Strategy 2030) and the Plan of Action for Hydrology, ensuring alignment with emerging scientific challenges, operational priorities, and societal needs.

This contribution presents the rationale, objectives, and key outcomes of the Task Team’s work, with a particular focus on advancing research-to-operations (R2O) and operations-to-research (O2R) pathways in global hydrological monitoring, process understanding, and prediction. By identifying priority research gaps, promoting interdisciplinary collaboration, and strengthening the interface between science and services, TT-HydroResearch contributes to enhanced predictive capabilities and more effective hydrological services under conditions of climate change, increasing extremes, and growing water-related risks.

How to cite: Pechlivanidis, I. and Uhlenbrook, S. and the WMO TT-HydroResearch members: From Strategy to Action: Strengthening Global Hydrological Research within WMO, EGU General Assembly 2026, Vienna, Austria, 3–8 May 2026, EGU26-7321, https://doi.org/10.5194/egusphere-egu26-7321, 2026.

EGU26-9484 | ECS | PICO | HS4.1

Rainfall-Driven Flash Flood Detection: A Framework for Ungauged Basins 

Adina Brandt and Uwe Haberlandt

Flash floods have the potential to damage infrastructure and buildings, and pose a considerable threat to human life. The short lag times associated with flash floods (typically a few hours) present a significant challenge to existing flood warning systems. These systems currently rely on rainfall and runoff measurements, as well as hydrological models. Consequently, they are of limited applicability in ungauged catchments. This is a critical issue given that climate change is intensifying extreme rainfall and thereby increasing the potential for flash flooding.

This study investigates the detection of flash floods based solely on rainfall characteristics, thus eliminating dependency on runoff measurements and hydrological infrastructure. Using high-resolution radar rainfall data and 15-minute runoff observations, 1,330 extreme rainfall-runoff events are selected across 147 German catchments with an area of up to 100 km². These events are subsequently classified as either flash or non-flash floods using a rainfall-runoff-based classification scheme as a reference, with 103 of the selected events identified as flash floods. For each event, various space-time rainfall characteristics are quantified. A random forest model for flash flood detection is then trained using only the rainfall metrics and static catchment attributes. The main aim is to assess the potential for rainfall-driven flash flood detection without relying on runoff. In addition, the most relevant rainfall characteristics associated with flash floods are identified, thereby improving our understanding of the underlying drivers.

In future work, the developed detection approach will be combined with real-time rainfall nowcasting to enable earlier prediction and warning of flash floods.

How to cite: Brandt, A. and Haberlandt, U.: Rainfall-Driven Flash Flood Detection: A Framework for Ungauged Basins, EGU General Assembly 2026, Vienna, Austria, 3–8 May 2026, EGU26-9484, https://doi.org/10.5194/egusphere-egu26-9484, 2026.

EGU26-9497 | ECS | PICO | HS4.1 | Highlight

Integrating IoT Monitoring Data and Machine Learning for Flash Flood Forecasting: A Case Study in Amalfi 

Rosa Menichini, Gaetano Pecoraro, and Michele Calvello

Flash floods represent a major hydrogeological hazard in fast-responding coastal catchments of southern Italy, where intense and short-duration rainfall can lead to sudden increases in stream water levels. In this context, the Amalfitan coast area constitutes a particularly relevant case study, as it has been historically affected by extreme meteorological events, flash floods, and hydrogeological instability, resulting in significant impacts on urban areas and infrastructure. This study presents the development and evaluation of a Random Forest algorithm, aimed at predicting stream water levels and analyzing conditions likely to trigger flash floods.

The model relies exclusively on dynamic data continuously acquired through an IoT-based monitoring network deployed within the study basin, installed in the municipality of Amalfi. The network includes soil water content and soil suction sensors installed at shallow depths, allowing the characterization of hydrological conditions within the topmost soil layers. These measurements are complemented by a stream level sensor and rain gauges distributed across the basin. The integration of these variables enables the definition of relationships between weather forcing and hydrogeological response of the catchment.

The available dataset was split into training and testing subsets to evaluate model performance. The Random Forest model predicted stream water level dynamics and identified potential flash flood conditions, with accuracy assessed using established performance metrics. The integration of in-situ IoT monitoring data and Machine Learning provides a powerful approach for flash flood prediction, as continuous environmental measurements can be automatically analyzed to identify early-warning signals, capture complex interactions between rainfall and stream water level, and support real-time decision-making in highly dynamic catchments. The future integration of the model into an operational early warning system is considered as a potential advancement, with the aim of enhancing flood risk management and mitigation strategies in Amalfi and similar high-risk catchments.

How to cite: Menichini, R., Pecoraro, G., and Calvello, M.: Integrating IoT Monitoring Data and Machine Learning for Flash Flood Forecasting: A Case Study in Amalfi, EGU General Assembly 2026, Vienna, Austria, 3–8 May 2026, EGU26-9497, https://doi.org/10.5194/egusphere-egu26-9497, 2026.

EGU26-12033 | PICO | HS4.1

Flash Flood Monitoring in Vienna, Austria (FlaMoVie) 

Ronald Pöppl, Janek Walk, and Philipp Marr

From September 12-20, 2024 heavy rainfall events and massive flooding occurred in Austria due to the low-pressure system "Boris". Lower Austria and Vienna were severely affected by flooding and associated on- and off-site impacts. Flash flood discharge values in Vienna's torrent systems were particularly extreme – some experiencing a 1000-year event magnitude. It is evident that heavy precipitation events have shown a clear increasing trend in recent decades due to climate change, and these events are highly likely to continue to increase in the future, in some cases with still unforeseeable consequences. The project FlaMoVie (Flash Flood Monitoring Vienna, 2024–2026) is dedicated to (i) investigate the causes, course, and potential consequences of flash flood events in Viennese torrent catchments, and (ii) assess the determination of associated hydrological and geomorphological effects (incl. different climate change scenarios) using a hydro-geomorphological monitoring and modelling approach. In this contribution, we will highlight some monitoring results derived from multi-temporal Terrestrial Laser Scanning, field mapping/measurements, and hydrometeorological gauge data of the Alsbach system, i.e. a ca. 2 km² large flash-flood-prone, densely forested, torrential catchment in the northwest of Vienna, Austria. Field data is further integrated in CAESAR-Lisflood landscape evolution modelling using yielding high-resolution rates of erosion and sedimentation across the catchment. The investigations at the Alsbach allow to deduce important implications for the hydro-geomorphological response to torrential rainfall in forested small-scale headwaters in Viennese torrent catchments.

How to cite: Pöppl, R., Walk, J., and Marr, P.: Flash Flood Monitoring in Vienna, Austria (FlaMoVie), EGU General Assembly 2026, Vienna, Austria, 3–8 May 2026, EGU26-12033, https://doi.org/10.5194/egusphere-egu26-12033, 2026.

EGU26-12724 | PICO | HS4.1

Artificial Intelligence-driven early warning system for flood risk management in urban areas 

Raffaele Albano, Muhammad Asif, Mayank Mishra, Ruggero Ermini, and Aurelia Sole

Rapid urbanization and climate change are increasing the frequency and severity of floods, posing significant threats to both lives and infrastructure. To mitigate these risks, it is essential to enhance the alerting and communication mechanisms for pluvial flash floods, thereby improving community resilience and reducing losses.

This study proposes an effective, citizen-oriented Early Warning System (EWS) implemented and tested in the heritage city of Matera, Italy. This EWS aims to empower citizens by improving their understanding of local flood risks, enabling them to assess their personal exposure and the potential characteristics of floods that may affect them. This knowledge allows individuals to make informed decisions about when to act and which life-saving measures to take.

The system integrates Artificial Intelligence (AI) for flood monitoring, flood modeling, and risk communication.  Internet of Thing (IoT)-based cameras combined with deep learning algorithms, specifically the You Only Look Once (YOLO) model, estimate flood water depth and car submergence levels. Additionally, flood surface velocity can be computed using the Fudaa-LSPIV (Large-Scale Particle Image Velocimetry) method. A deep convolutional neural network (CNN) model has been developed for rapid and accurate real-time prediction of water depth and flow velocity of forecasted urban flash flood scenarios. The EWS includes threshold-based alerts concerning flood instability for pedestrians and vehicles, accompanied by signals and designed symbols for communicating risk and self-protection measures to enhance citizen resilience.

 Overall, the proposed citizen-oriented EWS is not intended to replace existing systems from competent authorities but to complement existing systems by fostering "flood literacy" among citizens. Furthermore, this research can assist municipal authorities in emergency management by providing reliable information about the timing of flood recession, which is crucial for prioritizing the accessibility of affected areas and determining which roads should be restored for traffic in the short term.

How to cite: Albano, R., Asif, M., Mishra, M., Ermini, R., and Sole, A.: Artificial Intelligence-driven early warning system for flood risk management in urban areas, EGU General Assembly 2026, Vienna, Austria, 3–8 May 2026, EGU26-12724, https://doi.org/10.5194/egusphere-egu26-12724, 2026.

EGU26-13490 | PICO | HS4.1

Ensemble flood forecasting in small catchment using AI-based and deterministic rainfall runoff models – a performance comparison 

Jens Grundmann, Michael Wagner, Tanja Morgenstern, Robert Mietrach, and Niels Schütze

Reliable flood forecasting systems are an important prerequisite for local authorities and flood defence units to prepare for potential flooding at an early stage and to initiate the required measures. Small catchments in mountain ranges pose particular challenges in this regard, as they respond very quickly to rainfall. Furthermore, forecasts of rainfall in terms of their spatial and temporal extent and the associated impact on the areas are subject to a high degree of uncertainty. Ensemble rainfall forecasts as input data for rainfall-runoff (RR) models allow for the evaluation of the uncertainty of the resulting runoff. However, this requires fast-computing RR models to cope with the simulation effort, for which artificial intelligence methods are being used increasingly. Against this background, two hydrologic ensemble forecasting systems (EFS) are compared and evaluated that have been in operational use for small catchments in Saxony, Germany, for two years.

System 1, called EFS-howa, was developed in the HoWa-PRO research project, and its predictions can be tracked via the warning platform https://howapro.de/. As an RR model, it includes the event-based, deterministic hydrological model DeHM. DeHM covers the hydrologic processes for runoff formation and concentration, channel routing, and the simulation of flood retention dams. Measured discharge and water level data are assimilated within the forecasting process. For the hydrological ensemble forecast, rainfall data for observation and prediction from established products of the German Weather Service are used (radar-based QPE: RADOLAN-RW, radar-based nowcasting: RADOLAN-RV, ensemble QPF: ICON-D2-EPS). The runoff forecast lead time is 48 hours, and new forecasts are released every half hour if the QPF indicates a potential flood threat.

System 2, called EFS-kiwa, was developed in the KIWA research project, and its predictions can be tracked via the web demonstrator http://howa-innovativ.hydro.tu-dresden.de/WebDemoKiwa/. The RR model is a regional AI model (based on LSTMs) that was developed using measured RR data and hydrologic characteristics from 52 small and medium-sized catchments in Saxony, Germany. The current setup of the regional AI-RR model is based on hourly measurements of rainfall (using RADOLAN-RW), runoff, and rainfall forecasts. Thus, it achieves runoff forecasts with a lead time of up to 24 hours. The regional AI-RR model also allows for the fast and robust processing of ensemble rainfall forecasts from ICON-D2-EPS, enabling runoff forecasts with uncertainty/reliability information.

Both systems are evaluated in terms of their performance. Across various forecast lead times, different metrics such as KGE or percentage peak error, as well as threshold-based metrics such as false alarm ratio or area under the ROC curve (AUC), are calculated to explore the quality of both forecasting systems. The differences between the two demonstrators are highlighted by means of the selected metrics and specific simulation results. The associated benefits, advantages, and disadvantages for flood early warning are discussed.

How to cite: Grundmann, J., Wagner, M., Morgenstern, T., Mietrach, R., and Schütze, N.: Ensemble flood forecasting in small catchment using AI-based and deterministic rainfall runoff models – a performance comparison, EGU General Assembly 2026, Vienna, Austria, 3–8 May 2026, EGU26-13490, https://doi.org/10.5194/egusphere-egu26-13490, 2026.

EGU26-16015 | ECS | PICO | HS4.1

Evaluation of quantitative precipitation forecasts over a monsoon-dominated catchment in Kerala 

Shruthi H Babu and Sathish Kumar D

Numerical Weather Prediction (NWP) models have become an integral part of hydrological forecasting and research. Despite their advances and applications in hydrology, these models exhibit significant inherent errors due to imperfect representations of atmospheric physics, inaccuracies in initial conditions, and limitations in parameterisation schemes. Consequently, accurate quantitative precipitation forecasts (QPFs), which are critical for flood forecasting and early warning systems, remain challenging to obtain. Considering these limitations, it is essential to systematically evaluate available global QPFs derived from various NWP models before employing them as forcing inputs for hydrological models. This study evaluates the skill and reliability of three global quantitative precipitation forecast products archived in the TIGGE database - ECMWF, NCEP and NCMRWF, over the Chaliyar river basin, Kerala, against the gauge-based observation data for the Indian summer monsoon season from 2018 to 2023. The forecasts are evaluated at multiple lead times using a comprehensive set of deterministic and probabilistic metrics. The skill of the control forecasts is quantified by the correlation coefficient and root-mean-square error (RMSE), whereas perturbed forecasts were assessed using the mean Continuous Ranked Probability Score (CRPS). The analysis indicated that the NCMRWF model achieved the highest correlation skill, with values of 0.64 and 0.41 at 1-day and 2-day lead times, respectively, outperforming both ECMWF and NCEP. In terms of forecast errors, RMSE values indicated that ECMWF produced lower errors than NCMRWF and NCEP at both 1-day and 2-day lead times. In terms of probabilistic performance, NCMRWF achieved the lowest mean CRPS at a 1-day lead time, followed by ECMWF and NCEP. However, its probabilistic skill declined at the 2-day lead time, as indicated by higher CRPS values. Overall, both deterministic and probabilistic evaluations indicated that NCMRWF outperforms the other two models for the study area. As envisaged, forecasting skill significantly declined with increasing lead time across all models. These results highlight the need for further improvements, such as ensemble post-processing, to enhance the reliability of operational forecasting applications.

How to cite: H Babu, S. and Kumar D, S.: Evaluation of quantitative precipitation forecasts over a monsoon-dominated catchment in Kerala, EGU General Assembly 2026, Vienna, Austria, 3–8 May 2026, EGU26-16015, https://doi.org/10.5194/egusphere-egu26-16015, 2026.

Probabilistic forecasts, when optimally calibrated, have the ability to encode both the current state of knowledge and the uncertainty about the future value of a variable. Forecasting systems developed by experts and trained on data, and optimized using proper scoring rules, are therefore well positioned to produce calibrated probabilistic forecasts. Conversely, prediction markets capture the collective state of knowledge of their participants in the form of market-implied probabilities.

If participants in such markets have access to a forecasting system, as well as additional information (e.g. local or contextual knowledge), they can trade against the forecast and thereby recalibrate the implied probabilities. This interaction has the potential either to improve forecast quality or, alternatively, to increase confidence in the forecasting system among the participants it outperforms. An additional benefit is that participation in prediction markets can help users and stakeholders develop better intuition for probabilistic forecasts and uncertainty.

In this presentation, we discuss several potential set-ups for connecting forecasting models, users, local experts, and armchair hydrologists through prediction and betting markets. We highlight theoretical connections to proper scoring rules and information-theoretic forecast evaluation, as well as practical considerations related to implementation using publicly available platforms, including their promises and limitations. Finally, the presentation will include an opportunity for the audience to put their (play-)money where their skill is and take a chance.

How to cite: Weijs, S.: Prediction markets as a bridge between probabilistic hydrological forecasting and user beliefs, EGU General Assembly 2026, Vienna, Austria, 3–8 May 2026, EGU26-16576, https://doi.org/10.5194/egusphere-egu26-16576, 2026.

EGU26-18013 | PICO | HS4.1

An Index-Based Approach for Flash Flood Hazard Assessment in Germany Using Freely Available Geospatial Data 

Christian Geiß, Simone Raven, Patrick Aravena Pelizari, Hannes Taubenböck, and Klaus Greve

Flash floods are among the most destructive and unpredictable hydrometeorological hazards, frequently causing severe economic damage and loss of life. In Germany, the intensity and frequency of such events are projected to increase under ongoing climate change, underscoring the need for robust flood risk management supported by comprehensive spatial data and hazard information. However, a simple, homogeneous, and nationwide model for flash flood hazard assessment is still lacking.

This study presents the development and testing of an uncalibrated, index-based approach for flash flood hazard assessment in Germany, utilizing exclusively freely available and nationwide homogeneous geospatial datasets. Based on an extensive literature and data review, the Flash Flood Potential Index (FFPI) was identified as a suitable indicator for estimating flash flood susceptibility. A Python-based model was developed to calculate the FFPI using four key parameters—slope, land use, tree density, and soil type—derived from open national geodata. The relative weighting of these parameters was determined using the Analytic Hierarchy Process (AHP) method. The model was applied to three study areas in Germany representing diverse topographic and land cover conditions, and tested with varying parameter weightings and digital elevation model (DEM) resolutions.

In addition, a novel, supplementary module was implemented to compute FFPI-weighted flow accumulation, enabling the identification of downstream areas potentially affected by flash flood propagation. Test results indicate that the proposed modelling framework and additional module are suitable for flash flood hazard assessment across Germany, with four out of five predefined model expectations satisfactorily fulfilled. With further calibration and refinement, the model is expected to provide a cost-effective, transferable, and operationally simple tool for nationwide flash flood hazard estimation, contributing to improved risk management and early warning capacities under changing climatic conditions.

How to cite: Geiß, C., Raven, S., Aravena Pelizari, P., Taubenböck, H., and Greve, K.: An Index-Based Approach for Flash Flood Hazard Assessment in Germany Using Freely Available Geospatial Data, EGU General Assembly 2026, Vienna, Austria, 3–8 May 2026, EGU26-18013, https://doi.org/10.5194/egusphere-egu26-18013, 2026.

EGU26-20130 | PICO | HS4.1

Probabilistic rainfall and flash flood nowcasting on pan-European scale 

Seppo Pulkkinen, Heikki Myllykoski, Calum Baugh, and Marc Berenguer

We present probabilistic warning tools for flood hazards and risks based on deep learning (DL) techniques. The scope is on nowcasting heavy rainfall and associated flash floods in short time ranges (0-3 hours) and at high spatial and temporal resolutions (2 km and 15 minutes). Rainfall nowcasts are produced from pan-European OPERA radar composites by using a convolutional neural network based on the SimVP architecture. Two post-processing techniques are applied to enhance the utility of the DL-based nowcasts. First, underestimation of heavy rainfall is reduced by applying quantile mapping. Second, ensembles that provide realistic estimates of forecast uncertainty are generated by utilizing a stochastic technique. With these enhancements, the DL-based nowcast is shown to outperform the traditional extrapolation-based nowcasting techniques. The rainfall nowcasts are translated into color-coded hazard levels by using user-specified thresholds and statistically optimized probability thresholds that maximize hits and minimize false alarms. These are further translated into flood risk levels by using exposure information. Real-time feed of the warning products is displayed in a web platform developed in the EU-funded INLINE project. Demonstrations of the proposed methodology are given using major flood events during the years 2024 and 2025 that affected multiple European countries.

How to cite: Pulkkinen, S., Myllykoski, H., Baugh, C., and Berenguer, M.: Probabilistic rainfall and flash flood nowcasting on pan-European scale, EGU General Assembly 2026, Vienna, Austria, 3–8 May 2026, EGU26-20130, https://doi.org/10.5194/egusphere-egu26-20130, 2026.

EGU26-20249 | ECS | PICO | HS4.1

Post-Event Evaluation of Rainfall Estimates and Forecasts for Major Floods in Southern Brazil 

Rafaela Cristina de Oliveira, Ingrid Petry, Fernando Mainardi fan, and Matheus Sampaio Medeiros

Antecedent precipitation estimates and precipitation forecasts are critical inputs for flood forecasting systems, particularly in basins where flood response is strongly controlled by short-term rainfall variability rather than by slowly evolving catchment states. In regions with sparse rain gauge networks, satellite-based precipitation products and numerical weather prediction (NWP) models are therefore frequently relied upon, despite their known uncertainties.

This study presents a post-event evaluation of rainfall estimates and forecasts during four recent major flood events in the state of Rio Grande do Sul, southern Brazil — a region that has experienced recurrent and increasingly severe flooding in recent years. The analysis considers both simulation and operational forecasting contexts, assessing the performance of near–real-time satellite precipitation products (IMERG Early Run and GSMaP Near Real-Time) and short-range precipitation forecasts from two widely used NWP systems: ECMWF and NCEP.

Satellite products were evaluated against telemetric rain gauge observations for historical flood events (2023–2025) as well as for a longer reference period (2018–2025), using standard performance metrics. Results indicate that IMERG Early Run outperformed GSMaP Near Real-Time in terms of bias and overall representativeness, particularly under data-scarce conditions.

The analysis of NWP forecasts during the extreme April–May 2024 flood revealed substantial limitations even at a 24-hour lead time. Rainfall underestimations of up to 60 mm (basin-average) were identified in the Guaíba basin during peak impact periods, while spatial displacement of rainfall maxima further reduced forecast usability.

These results highlight that improvements in hydrological modeling alone are insufficient to enhance flood forecasting reliability. Advancing rainfall estimation and predictability — through improved satellite products, enhanced data merging strategies, and more accurate meteorological forecasts — remains a critical challenge for flood early warning systems in Southern Brazil and similar hydroclimatic regions.

How to cite: Cristina de Oliveira, R., Petry, I., Mainardi fan, F., and Sampaio Medeiros, M.: Post-Event Evaluation of Rainfall Estimates and Forecasts for Major Floods in Southern Brazil, EGU General Assembly 2026, Vienna, Austria, 3–8 May 2026, EGU26-20249, https://doi.org/10.5194/egusphere-egu26-20249, 2026.

EGU26-20477 | ECS | PICO | HS4.1

Evaluating a Prototype Europe-Wide Landslide Early Warning System: High-resolution comparative analysis in Catalonia and Alpes Maritimes 

Liza Adriana Tapia Hurtado, Marc Berenguer, Séverine Bernardie, Shinju Park, and Daniel Sempere-Torres

Rainfall-induced landslides pose a major threat to communities across Europe. This study analyses the performance of a prototype Landslide Early Warning System developed within the GOBEYOND project (Project: 101121135) that uses datasets (landslide susceptibility and precipitation) available across Europe.

The prototype is driven by gauge-adjusted precipitation composites from EUMETNET OPERA and the ELSUS v2 susceptibility map (Wilde et al., 2018). The system is designed to provide real-time landslide warnings in regions where local models are not available. Rather than replacing existing systems, the prototype aims to fill gaps in continental-scale monitoring.

The system’s performance is evaluated in two distinct contexts. In Catalonia (NE Spain), the framework is applied to a continuous inventory (2024–2025) to systematically benchmark the European prototype against the local system, which utilizes high- resolution susceptibility data and radar-gauge QPE. Conversely, in the Alpes-Maritimes (SE France), the analysis adopts a targeted approach, focusing on the validation of specific recent events using inventory data.

To account for uncertainties in inventory data (affected by location inaccuracies or imprecise reported dates), the study combines EDuMaP with a fuzzy approach. Preliminary results demonstrate that performance is sensitive to the temporal evaluation window. Extending the window from 24 to 72 hours more than doubled the proportion of correctly detected landslide events, suggesting that the prototype successfully identifies the hazardous conditions when accounting for reporting delays.

The European prototype effectively captures widespread triggering conditions, but its current calibration results in excessive over-forecasting. Therefore, it serves as a valuable baseline hazard indicator for regions with limited data, establishing a homogeneous observation standard across the continent.

How to cite: Tapia Hurtado, L. A., Berenguer, M., Bernardie, S., Park, S., and Sempere-Torres, D.: Evaluating a Prototype Europe-Wide Landslide Early Warning System: High-resolution comparative analysis in Catalonia and Alpes Maritimes, EGU General Assembly 2026, Vienna, Austria, 3–8 May 2026, EGU26-20477, https://doi.org/10.5194/egusphere-egu26-20477, 2026.

Mountain regions exhibit complex topography and climate patterns, leading to highly variable meteorological conditions that complicate the prediction of heavy rainfall, flash floods, and landslides. Gridded radar rainfall data are therefore essential for monitoring and forecasting intense storms in mountainous catchments where rain gauge observations are limited. The reliability of near-real-time radar rainfall products depends on individual radar data quality, radar compositing techniques, and bias correction procedures. Hydrological modelling is a key component of operational Early Warning Systems (EWS) for monitoring and forecasting runoff conditions; however, model accuracy remains sensitive to uncertainties in measurement instruments, rating curves, and rainfall inputs. This study aims to investigate the impact of rainfall input quality on the accuracy of flood simulations in a mountainous catchment in northern Thailand, namely the Klong Suan Mak basin. Radar compositing was performed using data from three weather radar stations: Omkoi (approximately 180 km northwest), Takhli (approximately 170 km southeast), and Chainat (approximately 167 km southeast) relative to the Klong Suan Mak basin, with a quality-index-based approach applied to rainfall estimation. A spatially distributed, physically based hydrological model for flash flood simulation was driven by three rainfall inputs: (i) rain gauge observations, (ii) an event-based bias-corrected radar composite, and (iii) an hourly Kalman filter–based bias-corrected radar composite. Model calibration was performed using the Flow Duration Curve (FDC) approach in logarithmic scale, based on discharge observations and spatial rainfall inputs during the 2022 flood events.

Results clearly indicate that the sparse rain gauge network in the mountainous region yields the poorest flood simulation performance. In contrast, radar-based rainfall products exhibit more complex behavior: although the hourly Kalman filter–based product provides the highest rainfall data quality, variability in its bias factor increases uncertainty in model parameter estimation. By comparison, the event-based bias-corrected radar composite with a single bias factor yields more stable model parameters, making it more suitable for both calibration and validation across multiple events. Consequently, the event-based radar rainfall product was adopted as the baseline input to stabilize model parameters and subsequently integrated with the dynamic Kalman filter–based product, leading to a significant enhancement in model performance and improving prediction accuracy by up to 32%, particularly during high-discharge periods where the dynamic Kalman filter–based radar rainfall data exhibited a significant improvement in efficiency. This integrated approach has strong potential to support multi-hazard mitigation, including landslides and soil erosion. When combined with short-term radar rainfall nowcasting, it could provide critical lead time for disaster preparedness and national early warning systems.

How to cite: Bogaard, T., Puttaraksa Mapiam, P., and Budrach, T.: Influence of High-Resolution Radar Rainfall Data Quality on Flash Flood Simulation Performance for Operational EWS in Mountainous Thailand, EGU General Assembly 2026, Vienna, Austria, 3–8 May 2026, EGU26-21318, https://doi.org/10.5194/egusphere-egu26-21318, 2026.

Drought is one of the most serious natural hazards worldwide, and its impacts have become more severe with climate change. Between 2000 and 2019, drought affected more than 35% of the global population. It has significant socio-economic and environmental consequences, particularly in regions highly dependent on rainfall for agriculture.  As global water demand is expected to rise by over 50% by 2050, understanding and managing drought risk has become more important than ever.

In India, around 70% of crop water requirements rely on monsoon rainfall, making drought a major threat to both food security and rural livelihoods. Maharashtra is among the most drought-prone states in the country. In 2023, nearly two-thirds of the state experienced drought-like conditions. The existing drought declaration process in India follows the Manual for Drought Management (2016) and incorporates parameters such as rainfall, crop conditions, groundwater levels, and reservoir storage. However, the declaration timeline (October 31 for Kharif and March 31 for Rabi), limited real-time monitoring, and data availability challenges hinder timely relief and mitigation efforts. Although dashboards like the India Drought Monitor and Maharashtra Drought Assessment Tool (MahaMADAT) provide district-level insights, there remains a gap in localized drought monitoring and early warning systems.

This study focuses on improving localised drought monitoring by analysing Drought Trigger-1 conditions in Maharashtra at the sub-district level from 2001 to 2023. The analysis uses multiple combinations of the Standardized Precipitation Index (SPI) at 1,3,6,9,12,15,18,21,24 time-scales along with dry spell thresholds of 1 mm and 2.5 mm. By combining multiple SPI time scales with 2 different dry spell thresholds, the study evaluates how often and where Trigger-1 conditions are met across different years and climatic phases.

The results provide a clearer picture of the spatial and temporal patterns of drought in Maharashtra during the 21st century. This work highlights critical hotspots where drought conditions frequently emerge and identifies years with widespread trigger activation. By examining spatial and temporal drought trends, the study provides insights into how current drought assessments can be improved. The findings can support more effective drought early warning by strengthening the understanding of trigger behaviour at a finer scale than currently available in national dashboards.

The finding will also contribute to the development of more effective early warning frameworks, supporting policymakers, researchers, and disaster management authorities in mitigating the impact of drought in Maharashtra and similar regions.

How to cite: Fatima, S. and Udmale, P. D.: Drought (trigger-1) assessment in Maharashtra at Sub-district Level in the 21st century using multiple SPI and Dry Spell combinations, EGU General Assembly 2026, Vienna, Austria, 3–8 May 2026, EGU26-721, https://doi.org/10.5194/egusphere-egu26-721, 2026.

EGU26-875 | ECS | Orals | HS4.2

Analysing drought-state transition dynamics across Great Britain using a multi-tier Markov framework 

Nishant Gaur, Encarni Medina-Lopez, and Lindsay Beevers

Drought is one of the most widespread hydroclimatic hazards, characterised by slow onset, long duration, and complex propagation. While Markov chains have recently gained attention for drought prediction, their potential to characterise changing drought-state dynamics has not yet been fully explored. This study proposes a multi-tier Markov chain (MC) framework to evaluate shifts in drought transition behaviour across 133 catchments in Great Britain under observed and future climate conditions.

Using SPI- and SSI-based drought classifications defined over seven discrete categories, 7×7 MC matrices were constructed for each catchment. The analysis employs the eFLaG dataset derived from the UKCP18 regional climate projections, combining simulations from 12 regional climate models and four hydrological models (G2G, GR6J, GR4J, PDM). Three time periods were assessed: the observed baseline (1989-2018), the near future (2020-2049), and the far future (2050-2079), yielding three MC transition matrices per catchment.

The first tier of the framework applies a non-parametric permutation test to determine whether differences between transition matrices across time periods represent statistically significant shifts rather than sampling variability. For catchments exhibiting significant changes, the second tier decomposes each matrix into interpretable components- such as persistence (matrix trace), upward and downward mobility, and direction-specific transitions (Wet to Wet, Dry to Dry, Wet to Dry, Dry to Wet). This approach identifies which transition pathways drive observed temporal changes and whether future climates are associated with increased persistence, greater drying tendencies, or altered recovery patterns.

The proposed multi-tier MC framework provides a systematic means to detect, localise, and interpret evolving drought-state dynamics, offering insights relevant for water-resource planning and climate-adaptation strategies. The results will contribute to an improved understanding of potential future changes in spatio-temporal drought behaviour across Great Britain and demonstrate the broader utility of Markov chains for drought-risk assessment beyond purely predictive applications.

How to cite: Gaur, N., Medina-Lopez, E., and Beevers, L.: Analysing drought-state transition dynamics across Great Britain using a multi-tier Markov framework, EGU General Assembly 2026, Vienna, Austria, 3–8 May 2026, EGU26-875, https://doi.org/10.5194/egusphere-egu26-875, 2026.

EGU26-1924 | ECS | Posters on site | HS4.2

histMDH: Introduction to a Global Multi-sectoral Drought Hazard Reference Dataset for 1981-2020 

Neda Abbasi, Tina Trautmann, Jan Weber, Petra Döll, Harald Kunstmann, Christof Lorenz, Tinh Vu, Stephan Dietrich, Malte Weller, and Stefan Siebert

Drought occurrences have become more frequent across all continents in recent years, leading to greater emphasis on understanding their impacts on water resources and socioeconomic conditions. Despite the existence of several global drought monitoring systems, a comprehensive multisectoral approach, that integrates the impact on water, agriculture, ecosystems and society, is still lacking. We therefore present a multi-sectoral global drought hazard monitoring dataset (histMDH) for the period of 1981-2020 covering five key sectors: water supply, riverine and non-agricultural land ecosystems, and both rainfed and irrigated agriculture. With a period of 40 years coverage, histMDH is suitable to be used as the baseline/reference period for a near real-time monitoring and forecasting system, part of which will be used in an operational system in future. The dataset is derived from a modelling chain using the ERA5 reanalysis data (produced by the European Centre for Medium-Range Weather Forecasts) as climate forcing for two global models: Global Crop Water Model (GCWM) and Global Hydrological Model (WaterGAP) to generate a suite of multi-sectoral drought hazard indicators (DHI). The resulting gridded monthly dataset comprises eleven DHIs (two meteorological, seven hydrological, and two agricultural), spanning 1981–2020. The DHIs defined can be used to identify droughts across different sectors and consequently define their characteristics and intersectoral impacts. The suitability of the DHIs for drought monitoring was assessed using multiple independent data sources at global and regional scales. As an open-access dataset, histMDH provides a critical baseline for near real-time drought hazard monitoring and forecasting within operational systems. It offers valuable support for decision-making in water management, agriculture, and food and water security monitoring. Furthermore, the spatio-temporal variability of DHIs at global and regional scales enables the identification of drought-prone regions, allowing to mitigate drought impacts and transition to more resilient agricultural, ecological and water supply systems.


How to cite: Abbasi, N., Trautmann, T., Weber, J., Döll, P., Kunstmann, H., Lorenz, C., Vu, T., Dietrich, S., Weller, M., and Siebert, S.: histMDH: Introduction to a Global Multi-sectoral Drought Hazard Reference Dataset for 1981-2020, EGU General Assembly 2026, Vienna, Austria, 3–8 May 2026, EGU26-1924, https://doi.org/10.5194/egusphere-egu26-1924, 2026.

This study analyzes trade-offs in water supply during shortages and droughts, focusing on sustainable measures at various demand nodes. It introduces drought-specific methods and optimal strategies. The methodology includes: (1) deriving an analytical solution for the water shortage index in a cross-watershed, network-flow, diverse supply system; (2) drought low-flow frequency analysis; (3) designing low-flow events using the Alternating Block Method; (4) a multi-objective simulation optimization model for resource allocation; (5) pattern analysis of water supply for industrial, livelihood, and agricultural needs; and (6-7) trade-off analysis of fallow strategies with cross-watershed diversion using recycled and hyporheic water. To address extreme events, the model's objective shifts from a yearly water shortage index to a ten-day modified shortage index (MSI), aiming to reduce tap and irrigation shortages. Decision variables include dam releases, tap and irrigation water supply, and regional diversion, with constraints on flow continuity and physical limits. The cross-watershed reservoir network-flow allocation model in Taiwan is developed using GAMS. Without agricultural fallow during the 2020 drought, tap water shortages would reach 29.43%, 18.13%, and 12.58% in Hsinchu, Taoyuan, and Banxin. Opening the Taoyuan-Hsinchu support pipeline reduces shortages by 4.16%-5.58% under non-fallow and fallow scenarios. Optimal fallow can cut shortages in Shimen and Taoyuan by 35.39% and 28.41%, respectively. During 200-year drought scenarios, shortages only occur in Hsinchu by 13.81%-15.32%, and pipeline operation reduces shortages to below 0.11%. To bring shortages below 3%, fallows are necessary across all areas during long-lasting, high-return droughts, where shortages maximum rise to 95.67%. Recycled water further helps reduce shortages in Shimen and Taoyuan by up to 9.18%.

How to cite: Huang, C.-L. and Hsu, N.-S.: Analytical trade-off simulation-optimization of drought-resistant water supply allocation strategies under various demands using a multi-objective cross-watersheds network-flow model , EGU General Assembly 2026, Vienna, Austria, 3–8 May 2026, EGU26-2158, https://doi.org/10.5194/egusphere-egu26-2158, 2026.

EGU26-2254 | Orals | HS4.2

Comprehensive Management of Agricultural Drought Risk: Integrating the Climate-Water-Food Nexus  

Hela Hammami, Saroj Kumar Chapagain, Azin Zarei, and Niels Schütze

Agricultural Drought Risk constitutes one of the most significant and long-term damaging impacts of climate change, primarily contributing to food insecurity. Despite the large number of previous research activities on drought risk management, some countries remain excluded from the global drought studies while vulnerable communities are still exposed to famine and livelihood loss. This critical gap prove that the applied drought assessment techniques faced successive refinements over time including dataset and methodologies but exhibit notable limitation regarding both spatial assessment and theoretical consistency.

The present study examines a comparative analysis of agricultural drought risk across two Tunisian watersheds, Medjerda and Merguellil, which are characterized by distinct climatological conditions. The analytical framework integrated the three core components of agricultural drought risk: hazard, vulnerability, and exposure while adopting a resource nexus perspective to capture the interdependencies among the selected indicators of each component.  

Drought indicators were collected from remotely sensed data over the period 2016-2024 considered as the latest drought period in Tunisia. The hazard indicators were represented by Precipitation condition index (PCI), Temperature condition index (TCI), Vegetation condition index (VCI) and Soil moisture condition index (SMCI). The vulnerability indicators included Runoff, Ground Water (GW), Primary Productivity (NPP) and Nighttime Light (NL). The exposure indicators were cropping area and population density. All indicators were normalized to ensure integration within drought analysis framework. This study employed two temporal lags initially addressing the short-term dynamics of drought hazard on a monthly scale followed by yearly assessment of drought risk components. The combination process of drought indicators was conducted by three objective weighting techniques: Principal Component Analysis (PCA), Gaussian Mixture Model (GMM) and Entropy to create time series of drought risk maps.

The spatial structure of obtained drought risk maps was analyzed using spatial pattern indices, including the Gini Index, along with four landscape metrics: Number of Patches (NP), Landscape Shape Index (LSI), Shannon’s Diversity Index (SHDI), and Contagion Index (CONTAG). These indices were considered as objective functions within multiple Pareto optimization scenarios to identify the most relevant spatial configuration of drought risk maps.  

The optimization results provided robust evidence indicating that the entropy-based approach was the most effective method in drought risk monitoring. The Medjerda watershed, which is characterized by sub-humid regime, faced strong drought variability with a severe drought period recorded in 2023, while drought risk trend remained gradual in the semi-arid watershed, Merguellil, showing slight change in 2022 and 2023.

The drought assessment determined the contribution of drought indicators in creating each component, the highest weight was assigned to VCI within monthly and yearly hazard component. Considering the vulnerability component, NPP exhibited the highest contribution followed by GW in the case of Medjerda and NL in the case of Merguellil. The cropping area had highest weight within exposure component. The results offer an objective and reliable assessment of the temporal drought risk variability and quantitatively reveal the climate–water–food nexus shaping drought risk. Overall, the study confirms the viability of using integrated risk assessment for sustainable water-use in agriculture. 

How to cite: Hammami, H., Chapagain, S. K., Zarei, A., and Schütze, N.: Comprehensive Management of Agricultural Drought Risk: Integrating the Climate-Water-Food Nexus , EGU General Assembly 2026, Vienna, Austria, 3–8 May 2026, EGU26-2254, https://doi.org/10.5194/egusphere-egu26-2254, 2026.

EGU26-2342 | ECS | Orals | HS4.2

Forecasting groundwater drought in data-scarce regions using a machine learning approach and Med-CORDEX climate projections: the case of the Haouz aquifer (Morocco) 

Imane El Bouazzaoui, Aicha Ait El Baz, Yassine Ait Brahim, Hicham Machay, and Blaid Bougadir

Groundwater is a critical resource in semi-arid regions, particularly in the Haouz plain of central Morocco, where climatic variability and growing anthropogenic pressures are causing increased stress on aquifer systems. This study aims to assess future groundwater drought in the Haouz aquifer under conditions of data scarcity by integrating regional climate projections from the Med-CORDEX initiative with advanced machine learning techniques. The research is driven by the need for reliable, spatially resolved forecasts in regions where hydrological and groundwater data are limited or unavailable. The core methodology involves the use of meteorological drought indices to quantify drought events based on climate variables. These indices were calculated using historical and projected climate data derived from Med-CORDEX simulations under two Representative Concentration Pathways: RCP 4.5 and RCP 8.5. In the absence of dense ground-based monitoring networks, the study relies on ERA5 reanalysis data and virtual station datasets to create an input matrix suitable for predictive modeling. Machine learning models were trained to estimate groundwater drought conditions using climate predictors and geographical variables. Among the models tested, Random Forest exhibited superior performance, capturing non-linear interactions and delivering high predictive accuracy (R² > 0.9). The results reveal a significant intensification of drought conditions over time, particularly in the long term under the RCP 8.5 scenario, with increased occurrence and severity of extreme drought events projected in the latter half of the 21st century. The western part of the aquifer is identified as highly vulnerable, experiencing the most pronounced drought intensification. In contrast, the eastern portion shows a degree of resilience, maintaining near-normal drought conditions even under severe climate scenarios. This spatial variability underscores the importance of localized groundwater management strategies. The study concludes that coupling regional climate projections with machine learning offers a promising approach for groundwater drought forecasting in data-scarce environments. The modeling framework developed is scalable and adaptable to similar hydrological systems facing data limitations. 

How to cite: El Bouazzaoui, I., Ait El Baz, A., Ait Brahim, Y., Machay, H., and Bougadir, B.: Forecasting groundwater drought in data-scarce regions using a machine learning approach and Med-CORDEX climate projections: the case of the Haouz aquifer (Morocco), EGU General Assembly 2026, Vienna, Austria, 3–8 May 2026, EGU26-2342, https://doi.org/10.5194/egusphere-egu26-2342, 2026.

EGU26-2755 | ECS | Orals | HS4.2

Monitoring Spatiotemporal Drought Events by Moving Coincidence Index Approach 

Cem Demir, Abdurrahman Ufuk Şahin, and Arzu Özkaya

Drought is a complex and multi-dimensional natural hazard including hydro-climatic driven and socio-economic aspects. The impacts of drought are generally shaped by spatial variability, duration and its persistence as well. Therefore, monitoring and forecasting drought are challenging task in many folds: i) Traditional drought indices such as Standardized Precipitation Index (SPI) or its variant Standardized Precipitation-Evapotranspiration Index (SPEI) are highly accepted but such indices often focus on the deviations from normal conditions within a particular time scale, which limits their ability to capture comprehensive assessment of a given region. ii) These indices require a statistical distribution describing variable of climatic factors in concern, which is extremely difficult to obtain a unique distribution that may fit to basin characteristic entirely. iii) Those are not capable of assessing drought severity and persistence over a basin. To overcome these limitations, Successive Coincidence Deficit Index (SCDI) was previously introduced in order to establish drought severity, persistence, and spatial characteristics. This study offers a new variant of SCDI, referred to as Moving Coincidence Index (MCI) based on the idea that identifies drought events triggered by simultaneous occurrence of precipitation deficits and temperature anomalies, without relying on probability distribution fitting or data normalization. The proposed MCI was applied to the Upper Tigris River Catchment (UTRC), Türkiye, which is one of important trans-boundary catchments in the Middle East. Historical analyses were conducted using long-term gauge-based precipitation and temperature observations for the period 1972–2011. The propose methodology was extended to investigate future drought behavior by using bias-corrected CMIP6 climate projections under SSP1-2.6, SSP2-4.5, and SSP5-8.5 scenarios. Drought characteristics were evaluated across multiple temporal windows (1-, 3-, 6-, and 12-month) to represent meteorological, agricultural, and hydrological drought processes. Results from the historical period indicate that MCI effectively captures prolonged and successive drought conditions and provides consistent spatial patterns when compared with commonly used drought indices. Shorter time scales reveal highly localized drought behavior, while longer accumulation periods highlight persistent and basin-wide drought structures. Future projections show a pronounced increase in drought persistence and spatial coherence, particularly under higher emission scenarios. The application of MCI for CMIP6 projections enables the identification of potential changes in the spatial distribution and seasonal characteristics of coincident hot–dry conditions across the basin. As a conclusion, the integration of MCI with CMIP6 projections provides a robust and flexible framework for assessing present and future drought dynamics. The findings suggest critical insights for climate adaptation strategies, reservoir operation, and sustainable water resource management in drought-prone and transboundary river basins.

How to cite: Demir, C., Şahin, A. U., and Özkaya, A.: Monitoring Spatiotemporal Drought Events by Moving Coincidence Index Approach, EGU General Assembly 2026, Vienna, Austria, 3–8 May 2026, EGU26-2755, https://doi.org/10.5194/egusphere-egu26-2755, 2026.

EGU26-3343 | ECS | Orals | HS4.2

Seasonal Predictability of Hydrometeorological Drought in Sweden 

Yiheng Du, Claudia Canedo Rosso, Svea Bertolatus, and Ilias G. Pechlivanidis

Drought poses a growing risk to society and ecosystems in Sweden, creating major challenges for water supply, agriculture, and emergency response. Although the country has long been regarded as water-rich, recent drought events have exposed significant vulnerabilities and highlighted the need to improve national preparedness. Within this context, the ACT4Drought project, funded by the Swedish Research Council (FORMAS), aims to co-develop an actionable service for drought and water scarcity at sub-seasonal to seasonal (S2S) timescales. We use bias-adjusted seasonal meteorological forecasts from the ECMWF SEAS5 prediction system, which provides ensemble forecasts up to seven months ahead. These forecasts are used to drive the Swedish national hydrological model (S-HYPE) and generate forecasts of soil moisture, discharge and related drought indicators. We evaluate the seasonal predictability of droughts across meteorological, agricultural and hydrological aspects, using the Standardized Precipitation Index (SPI), Standardized Precipitation and Evapotranspiration Index (SPEI), Standardized Soil Moisture Index (SSMI), and Standardized Streamflow Index (SSI) at 1 to 3-month aggregations, and assess their forecast skill across initialization times, lead times and spatial domains. By identifying where and when seasonal forecasts reliably capture drought conditions, this work provides a foundation for more robust operational drought early warnings and advances Sweden’s capacity for drought preparedness.

How to cite: Du, Y., Canedo Rosso, C., Bertolatus, S., and Pechlivanidis, I. G.: Seasonal Predictability of Hydrometeorological Drought in Sweden, EGU General Assembly 2026, Vienna, Austria, 3–8 May 2026, EGU26-3343, https://doi.org/10.5194/egusphere-egu26-3343, 2026.

EGU26-3402 | Posters on site | HS4.2

Constructing a global ground truth: A news-derived dataset for socioeconomic drought event validation 

Yonatan Nakar, Grey Nearing, Rotem Mayo, Oleg Zlydenko, Frederik Kratzert, Moral Bootbool, Amitay Sicherman, Ido Zemach, and Deborah Cohen

Meteorological drought indices (e.g., SPI) and composite products (e.g., USDM) serve as standard benchmarks for evaluating drought forecasting models. However, these metrics are physical proxies rather than direct measures of societal impact. A precipitation deficit does not always manifest as a drought. Yet, when a true drought impacts agriculture, water supply, or ecosystems, it is typically reported in local or national media. To capture this reality, we introduce a comprehensive global dataset of socioeconomic drought events, designed to serve as an independent ground truth for model validation.

Our approach utilizes a scalable, two-stage pipeline. We first filter global web news data to identify candidate articles, followed by a targeted analysis of approximately 600,000 texts using Gemini. Unlike traditional keyword scraping, the LLM allows for nuanced semantic filtering. It explicitly distinguishes between natural drought events and water scarcity driven by infrastructure failure or mismanagement, ensuring the dataset reflects climatological hazards rather than human operational errors.

The resulting dataset provides verifiable event timelines for specific geographic regions. We extract precise location names from the text and map them to geospatial polygons, creating a structured record of where and when impacts occurred.

To utilize this dataset for validation, we propose a "3D Event Matching" strategy. We aggregate a given model’s pixel-wise forecasts into continuous spatiotemporal objects ("blobs") and compare them against the reported news polygons. This allows us to validate physical models against the entire lifecycle of a drought event, rather than requiring pixel-perfect alignment with isolated reports.

By providing a global, independent record of when and where droughts were actually felt by society, this work offers a necessary complement to physical and reanalysis data for next-generation drought forecast model development.

How to cite: Nakar, Y., Nearing, G., Mayo, R., Zlydenko, O., Kratzert, F., Bootbool, M., Sicherman, A., Zemach, I., and Cohen, D.: Constructing a global ground truth: A news-derived dataset for socioeconomic drought event validation, EGU General Assembly 2026, Vienna, Austria, 3–8 May 2026, EGU26-3402, https://doi.org/10.5194/egusphere-egu26-3402, 2026.

EGU26-5388 | ECS | Posters on site | HS4.2

Unravelling the Transfer Mechanisms and Time Lags between Meteorological, Agricultural and Hydrological Droughts Varying with Aquifer Vertical Heterogeneity 

Yinan Ning, Muhammad Haris Ali, Reynold Chow, and Joao Pedro Nunes

Drought is a complex natural hazard that propagates through the hydrological cycle, often evolving from meteorological anomalies to agricultural water deficit and eventually hydrological stress. Understanding spatiotemporal dynamics and the propagation between these different drought types is crucial for effective water resource management, yet the quantitative characterization of the specific transition rates and time lags remains challenging, particularly when considering the vertical heterogeneity of aquifers.

This study investigates the evolution and propagation of drought in the Aa of Weerijs catchment, Netherlands, over the period 1993–2024. We employed a multi-index approach, utilizing the Standardized Precipitation (Evapotranspiration) Index (SPI/SPEI) to characterize meteorological drought, the Palmer Drought Severity Index (PDSI) as a proxy for agricultural water deficits, and the Standardized Groundwater Index (SGI) for groundwater drought at various depths, reflecting the response of different aquifer systems. By applying run theory for drought event detection and event coincidence analysis for matching different types of drought events, we quantified both the propagation time lags and transition probabilities. The lagged correlation analysis was further employed to examine the statistical relationships across varying temporal delays.

Our preliminary results reveal that, 1) Significant intensification of drought severity is observed in the recent decade for some monitoring wells; 2) Depth-dependent propagation characteristics were confirmed, with deeper monitoring points generally showing higher correlation coefficients and varied propagation rates, though not all stations exhibited a simple “deeper equals longer lag” pattern; 3) SPEI-based propagation was consistently weaker than SPI-based in both correlation and propagation rate, suggesting evapotranspiration may reduce the efficiency or detectability of meteorological drought propagation into groundwater; 4) PDSI showed the strongest coupling with SGI across nearly all stations and depths, often with the highest propagation rate.

This research highlights the critical role of aquifer depth in modulating drought propagation and emphasizes the non-linear transfer behaviours within the hydrological cycle. The findings provide scientific evidence for developing depth-specific drought early warning systems and optimizing regional water allocation strategies under a changing climate.

How to cite: Ning, Y., Ali, M. H., Chow, R., and Nunes, J. P.: Unravelling the Transfer Mechanisms and Time Lags between Meteorological, Agricultural and Hydrological Droughts Varying with Aquifer Vertical Heterogeneity, EGU General Assembly 2026, Vienna, Austria, 3–8 May 2026, EGU26-5388, https://doi.org/10.5194/egusphere-egu26-5388, 2026.

EGU26-5676 | ECS | Orals | HS4.2

Innovative trend analysis method for drought indicators and pattern detection of the Urmia lake basin, Iran 

Naghmeh Ziafati, Keivan Khalili, Hossein Rezaie, Nasrin Fathollahzadeh Attar, Mario Jorge Rodrigues Pereira da Franca, and Ali Pourzangbar

Effective drought and water-resource management is a fundamental challenge worldwide. In recent decades, the intensification of drought has become a serious challenge in northwestern Iran, particularly in the Lake Urmia basin, where rising temperatures and declining heavy rainfall have accelerated water scarcity. Therefore, monitoring drought and studying its trends is crucial.

This study evaluates drought patterns at seven meteorological stations using the Standardized Precipitation Index (SPI) and the Standardized Precipitation-Evapotranspiration Index (SPEI) at 3, 12, and 24-month time scales. The Innovative Trend Analysis (ITA) method, supported by the Seasonal Kendall test, was used to identify and assess drought behavior.

The ITA method clearly showed drought trends, whereas the Seasonal Kendall test often failed to detect any trends in short-term data. The results showed that the stations of Tabriz and Urmia have more dry and normal periods, while wet periods have reduced, indicating a reduction in overall moisture. Mahabad, Saqqez, Maragheh, and Sarab had a decrease in all categories (dry, normal, and wet), which demonstrates severe and persistent drought. SPEI also identified short-term droughts in Mahabad and Tekab, which SPI was unable to capture.

Frequency analysis using McKee’s classification showed that most months fall within the normal range; however, ITA trends indicated that the intensity and persistence of normal periods are decreasing in many stations. These results indicate that ITA trends can identify which stations enter drought rapidly, retain moisture stability, and is critical for water storage planning and early warning systems.

Overall, the integration of SPI and SPEI with statistical and trend methods provides a comprehensive framework for drought monitoring in semi-arid regions. The findings suggest that the use of ITA is highly effective for water resource management, long-term change prediction, and strengthening adaptation strategies in the sensitive and critical Lake Urmia basin.

How to cite: Ziafati, N., Khalili, K., Rezaie, H., Fathollahzadeh Attar, N., Rodrigues Pereira da Franca, M. J., and Pourzangbar, A.: Innovative trend analysis method for drought indicators and pattern detection of the Urmia lake basin, Iran, EGU General Assembly 2026, Vienna, Austria, 3–8 May 2026, EGU26-5676, https://doi.org/10.5194/egusphere-egu26-5676, 2026.

Groundwater dynamics shape how drought is experienced in landscapes: they regulate the persistence of streamflow, controlling the duration and magnitude of ecological stress linked to low flows, and govern recovery trajectories long after rainfall deficits ease. Despite this, groundwater is often weakly represented in routine drought characterization, largely because piezometric records are sparse, discontinuous, and unevenly distributed, and because groundwater responses are filtered through storage, geology, and time-lagged recharge processes that obscure simple attribution to atmospheric anomalies. Robust and comprehensive drought diagnostics and early warning need methods that link meteorological forcing to interpretable indicators of groundwater storage and release.

The analysis is conducted in near natural headwater catchments in southern Spain, thereby reducing the influence of pumping. We propose a triangulation approach to characterize drought propagation using three complementary components: meteorological drought forcing measured with Standardized Precipitation- Evapotranspiration Index (SPEI), groundwater drought state obtained from piezometric data, measured with the Standardized Groundwater Index (SGI), and groundwater-controlled discharge behaviour captured through a simple baseflow proxy extracted from gauged streamflow and Terraclimate modelled runoff data (Abatzoglou et al., 2018).

Meteorological drought is represented by the SPEI evaluated across accumulation windows from 1 to 48 months. Observed groundwater head series are quality-controlled, filled in and regularised using transfer-function noise timeseries modelling with the Pastas software (Collenteur et al., 2019) to obtain continuous records, from which SGI is computed using a month wise non-parametric standardisation. Baseflow is derived from observed discharge and runoff data using a consistent separation approach, and standardised to enable direct comparison with SGI as a second, catchment-integrated representation of groundwater state.

We explore drought propagation by mapping correlations and response lags between SPEI and both groundwater anomaly indicators, SGI and standardized baseflow, identifying the dominant memory windows and seasonality of sensitivity. Predictive performance is then assessed using regressions for interpretable relationships between groundwater response and the most informative SPEI scales, and Random Forest regression to capture further interactions. We stratify and interpret these relationships by lithology, aquifer properties and catchment size. We further test whether SPEI–groundwater relationships exhibit structural changes over time, via moving-window correlations, wavelet analysis and segmented analyses across sub-periods and seasons.

Across sites, the triangulation reveals coherent but aquifer-dependent propagation patterns, which are presented with narratives and diagrams of drought propagation pathways. SGI and baseflow-based state indicators consistently align with SPEI at intermediate to long accumulation windows, reflecting nuanced modulation in storage and recession dynamics. Importantly, baseflow proxies complement SGI by providing a continuous, integrated signal of groundwater release that can support and strengthen monitoring, especially where piezometric data are sparse. The combined framework delivers operationally relevant SPEI trigger windows and predictive models for anticipating groundwater-related anomalies in Mediterranean environments.


References
Abatzoglou, J. T., Dobrowski, S. Z., Parks, S. A., & Hegewisch, K. C. (2018). TerraClimate, a high-resolution global dataset of monthly climate and climatic water balance from 1958–2015. Scientific data, 5(1), 1-12.
Collenteur, R. A., Bakker, M., Caljé, R., Klop, S. A., & Schaars, F. (2019). Pastas: Open source software for the analysis of groundwater time series. Groundwater, 57(6), 877-885.

How to cite: Serrano-Acebedo, P. and Limones, N.: Two groundwater stories, one drought: Standardized Groundwater Index and baseflow proxies under climatic forcing in near-natural aquifers in southern Spain, EGU General Assembly 2026, Vienna, Austria, 3–8 May 2026, EGU26-6912, https://doi.org/10.5194/egusphere-egu26-6912, 2026.

EGU26-7136 | Orals | HS4.2

Diachronic drought assessment of Greek water-supply reservoirs using open EO and reanalysis data 

Alexandros Konis, Athanasios Askitopoulos, Vasiliki Pagana, and Charalampos (Haris) Kontoes

Conventional drought monitoring in Greece has largely relied on in-situ measurements (rain gauges, reservoir records) to infer meteorological and hydrological indices. Despite the fact that the gauge measurements are valuable, most of the mountains basins lack of them. Moreover, reservoir information is not always frequent or openly available and meteorological indicators alone do not always reflect the evolving situation in major water-supply reservoirs. For this reason, Satellite Earth observation in combination with reanalysis data provide a strong complement. Satellite imagery allows reservoir water extent to be mapped directly and repeatedly, while meteorological data capture the spatial variability across entire river basins, supporting both situational awareness and longer-term analysis.

In this study, an open-data, long-term monitoring pipeline was implemented in Google Earth Engine, combining freely available satellite and reanalysis datasets. Monthly reservoir surface-water extent (2017–2025) was derived from Sentinel-2 optical imagery using multiple water indices (NDWI, MNDWI, AWEI) with consistent cloud/shadow masking and monthly compositing. A key element for “long-memory” drought assessment was added through the JRC Global Surface Water Monthly Recurrence dataset (1984–2021) from post-processed satellite retrievals, which provided an historical baseline. ERA5-Land reanalysis data were used to characterize climate conditions, including precipitation for the calculation of Precipitation Index SPI (3/6/12 months), temperature anomalies, a heat-ratio metric (share of days with daily Tmax above the historical 90th percentile) and snow cover fraction for relevant mountainous headwaters.

The above methodology was applied for two water-supply systems under clear “emergency” pressure: the Attica system, where Mornos is the main source and Evinos supports it via transfer, and the Aposelemis system in Crete, which also depends on inflows linked to the Lasithi area. During 2024-2025 Attica experienced persistently low reservoir levels, with 2025 being among the lowest conditions since the Evinos reservoir was integrated and broadly comparable to the 2007–2008 major drought. In 2025, the Mornos reservoir declined from ~65% of its historical maximum extent in May to ~51% by September, marking the lowest levels recorded in the past two decades, despite limited meteorological relief during winter 2024/25. Evinos showed stronger monthly fluctuations, with values in the most stressed months commonly around ~60% of seasonal maxima. In Crete, Aposelemis shifted from high reservoir capacity during 2019–2022 (often ~80–90% of maximum extent) to a prolonged decline after 2023, reaching approximately one-third of maximum reservoir coverageduring 2025. This evolution is consistent with persistent precipitation deficits and increased heat stress across the region.

The integrated EO–reanalysis assessment showed that drops in reservoir levels often follow meteorological drought indicators with a delay of months to even years, highlighting the need for continuous monitoring. Using Google Earth Engine and open satellite and reanalysis data, a scalable open-data pipeline was developed for near-real-time drought tracking and water-resource awareness, supporting proactive drought management in Greece and other Mediterranean basins.

How to cite: Konis, A., Askitopoulos, A., Pagana, V., and Kontoes, C. (.: Diachronic drought assessment of Greek water-supply reservoirs using open EO and reanalysis data, EGU General Assembly 2026, Vienna, Austria, 3–8 May 2026, EGU26-7136, https://doi.org/10.5194/egusphere-egu26-7136, 2026.

EGU26-7623 | Posters on site | HS4.2

Assessing the relationship between soil moisture drought and cereal yield anomalies in Europe 

Carmelo Cammalleri, Vanesa Garcia-Gamero, and Enzo Fortin

Drought can arguably be considered the most important natural hazard affecting agricultural production worldwide. In rainfed crops, in particular, severe soil water deficit conditions can have direct impacts on crop yields, negatively affecting the local economy. Among rainfed crops, cereals are the most prominent production in Europe, accounting for about 20% of global production.

In this study, soil moisture drought conditions modelled following a global scale hydrological model (LISFLOOD) are used to explain cereal yield anomalies recorded over European regions (NUTS2) by Eurostat for the period 1991-2023. Due to the spatio-temporal mismatch between yield records (annual, over NUTS2 regions) and modelled soil moisture (daily, over a regular grid), different strategies are tested to assess the relationship between the two quantities. By focusing on the years affected by drought conditions, and the consequent expected reduction in yield, ranked zero-clustered correlation metrics are used to quantify the correspondence.

Over most of the regions, a positive and significant correlation between drought occurrence and yield reduction is observed, even if this is not the case for a few of the study regions. Overall, the temporal aggregation of soil moisture data over different seasons seems to play a major role in strengthening/weakening the relationship between soil moisture drought and yield reduction, with notable spatial patterns in the outcome. The typical European growing season, April-September, corresponds to the optimal case in most of the regions, but both earlier and later seasons (as well as shorter ones) are also observed in a non-negligible fraction of cases.  

A method to optimize the best aggregation strategy is proposed, by jointly minimizing the number of different solutions and maximizing the rank correlation. This optimization aims at providing a simple approach that can be used to infer the expected yield reductions given the antecedent modelled soil moisture status across European regions.

Acknowledgements: This work is partially funded by the European Union under the HORIZON-CL4-2023-SPACE-01-32 project “Strengthening Extreme Events Detection for Floods and Droughts” (SEED-FD), CUP: D43C23003660006 - 2023. 


How to cite: Cammalleri, C., Garcia-Gamero, V., and Fortin, E.: Assessing the relationship between soil moisture drought and cereal yield anomalies in Europe, EGU General Assembly 2026, Vienna, Austria, 3–8 May 2026, EGU26-7623, https://doi.org/10.5194/egusphere-egu26-7623, 2026.

EGU26-7813 | Posters on site | HS4.2

Evaluation of ERA5-Land reanalysis data for drought monitoring: Comparison with observation-based drought indices in Sicily 

David J. Peres, Nunziarita Palazzolo, Tagele Mossie Aschale, Gaetano Buonacera, and Antonino Cancelliere

Effective drought monitoring using standardized indices relies on long, continuous hydrometeorological records. Reanalysis datasets such as ERA5-Land are widely adopted because of their spatial completeness and temporal consistency; however, systematic biases in precipitation and temperature may affect derived drought indicators, including SPI and SPEI. This study evaluates the performance of ERA5-Land for drought monitoring in Sicily, a region characterized by complex topography, frequent drought events, and the availability of long-term observational data.

ERA5-Land precipitation and temperature were evaluated against a gridded observational dataset spanning 1951–2013 using correlation, Nash–Sutcliffe Efficiency (NSE), and RMSE metrics. Temperature was well represented by ERA5-Land, with correlations exceeding 0.9 and NSE values above 0.8. In contrast, precipitation showed lower accuracy, with correlations between 0.6 and 0.8, NSE values frequently below 0.5, and RMSE ranging from 20 to 80 mm.

These biases influenced the resulting drought indices. Multi-year SPI and SPEI (24–48 months) showed acceptable agreement with observational estimates (linear correlations of 0.75–0.9), whereas short-term indices displayed poor performance, in some cases yielding negative NSE values. Overall, the findings demonstrate that while ERA5-Land data can support drought monitoring in Mediterranean regions, their use may require careful bias correction, particularly for short-term drought assessment and for operational use in agriculture and water resources management under complex climatic and topographic conditions.

How to cite: Peres, D. J., Palazzolo, N., Aschale, T. M., Buonacera, G., and Cancelliere, A.: Evaluation of ERA5-Land reanalysis data for drought monitoring: Comparison with observation-based drought indices in Sicily, EGU General Assembly 2026, Vienna, Austria, 3–8 May 2026, EGU26-7813, https://doi.org/10.5194/egusphere-egu26-7813, 2026.

EGU26-7941 | ECS | Orals | HS4.2

From Near-Surface to Root-Zone Soil Water Losses: A Physically Based Model for Drought Monitoring  

Aurora Olivero, Tommaso Martini, Alessio Gentile, Davide Gisolo, Davide Canone, and Stefano Ferraris

Effective drought monitoring in agricultural systems requires accurate estimation of root zone soil moisture to assess crop water stress and optimize irrigation decisions, yet translating continuous satellite-derived surface soil moisture into root zone dynamics remains a significant challenge.

This study presents muSEC (multilayer Surface Evaporative Capacitor), a physically based model developed from the recently proposed Surface Evaporative Capacitor (SEC) framework. muSEC links surface observations to deeper soil layers during drydown periods through a two-stage evaporation formulation and simplified vertical redistribution scheme, maintaining physical parameters across different soil types.

Spatial variability was assessed by evaluating the model across sites with contrasting soil textures and land uses, combining Time Domain Reflectometry and Cosmic Rays in situ measurements with NASA SMAP satellite retrievals. The latter provide high temporal resolution and show strong correlation with ground observations. When compared against models of varying complexity, muSEC demonstrated robust performance in reproducing soil moisture dynamics at multiple depths, thereby confirming its potential to predict agricultural water availability and drought conditions from satellite-derived surface observations.

This model framework enables deeper root-zone drought forecasting from readily available satellite surface observations, thus supporting the development of effective early warning systems and improved irrigation management in water-scarce agricultural regions.


This work is part of the NODES project, which has received funding from the Italian Ministry of University and Research (MUR) under the PNRR – M4C2, Investment 1.5 (grant no. ECS00000036). Additional support was provided by the PRIN 2022 Project SUNSET (grant no. 202295PFKP) and by the 2021 Funding Programme of Fondazione CRT (grants no. 2022.0998, 2023.0369, and 2025.0780).

How to cite: Olivero, A., Martini, T., Gentile, A., Gisolo, D., Canone, D., and Ferraris, S.: From Near-Surface to Root-Zone Soil Water Losses: A Physically Based Model for Drought Monitoring , EGU General Assembly 2026, Vienna, Austria, 3–8 May 2026, EGU26-7941, https://doi.org/10.5194/egusphere-egu26-7941, 2026.

EGU26-8330 | Orals | HS4.2

 Determination of Spatial and Temporal Drought Patterns Over CONUS Using Unsupervised Machine Learning Clustering Algorithms  

Olivier Prat, Iype Eldho, David Coates, Brian Nelson, Michael Shaw, and Steve Ansari

The Standardized Precipitation Index (SPI) is computed over CONUS using daily precipitation estimates from the NOAA Daily U.S. Climate Gridded Dataset (NClimGrid-Daily). From the NClimGrid-SPI (1951-present; 0.05°x0.05°), we derive historical hydro-climatological conditions and drought information from the Drought Severity and Coverage Index (DSCI) which combines drought levels into a single areal value (from 0 to 500). One of our objective is to better understand drought dynamic and particularly how drought episodes evolve from short term rainfall deficit (i.e., less than three months) to persistent drought condition (i.e., beyond nine months). To investigate how those cascading effect work, we use a Machine Learning (ML) approach to identify spatio-temporal patterns of drought episodes over CONUS. Several unsupervised ML clustering algorithms are tested using an ensemble of features including drought duration, rainfall accumulation, drought severity (maximum DSCI, time of maximum DSCI), seasonality (drought beginning and end dates), location (latitude, longitude). Results show that the most severe drought events (i.e., DSCI > 350) are those that have the longest durations and for which drought relief is associated with higher rainfall accumulation regardless of the location considered. Furthermore, there is an apparent consistency across accumulation scales and the number of parameters selected with an optimum number of clusters around four. The Euclidian distance ML models tested seems to be able to define spatiotemporal areas of similar drought patterns. Differences between models are observed in terms of spatial definitions and predominance  of a cluster at a given location. The strongest prevalence of a given cluster has allowed to isolate areas of coherence such as the Pacific Northwest, the PNW, the Eastern Seaboard and the Southeast, and the Southwest area along the MX-US border. Domain delineations are weaker for areas such as the Rockies, the Midwest, and the Great Plains. While the SPI algorithm assumes a Gamma (McKee et al., 1993) or a Pearson III (Guttman, 1998) distribution for monthly rainfall accumulation periods, results show that this assumption might not be optimal depending on the domain considered and the accumulation period when applied to daily drought monitoring.

How to cite: Prat, O., Eldho, I., Coates, D., Nelson, B., Shaw, M., and Ansari, S.:  Determination of Spatial and Temporal Drought Patterns Over CONUS Using Unsupervised Machine Learning Clustering Algorithms , EGU General Assembly 2026, Vienna, Austria, 3–8 May 2026, EGU26-8330, https://doi.org/10.5194/egusphere-egu26-8330, 2026.

EGU26-9489 | Posters on site | HS4.2

PREMHYCE: a national platform for low-flow forecasting in France 

François Tilmant, François Bourgin, Didier François, Matthieu Le Lay, Charles Perrin, Fabienne Rousset, Jean-Pierre Vergnes, Jean-Marie Willemet, Claire Magand, Alice Guerin, and Stéphanie Pitsch

Improving droughts forecasting - whether meteorological, agricultural, or hydrological - is a major challenge for the protection of natural ecosystems and for many economic sectors, including agriculture, energy production, drinking water supply, navigation, and tourism. To provide public water managers with robust low-flow forecasting tools in a context of climate change, the French Office for Biodiversity (OFB) and the Water and Biodiversity Direction (DEB) have supported, since 2011, an initiative aimed at developing a national operational low-flow forecasting platform. This platform, known as PREMHYCE, is the result of a long-term scientific and technical collaboration between INRAE, Météo-France, the University of Lorraine, BRGM, and EDF (Tilmant et al., 2023).

PREMHYCE relies on five hydrological models and ensembles of meteorological scenarios to produce probabilistic streamflow forecasts, enabling the estimation of risks of falling below low-flow thresholds (typically vigilance, alert, reinforced alert, or crisis levels). Forecast lead times range from a few days to several weeks, depending on management objectives and catchments considered. The platform provides daily streamflow forecasts at more than 1,300 gauging stations across the French hydrographic network, with lead times of up to 90 days. These forecasts are made available to more than fifty operational services across mainland France and Réunion Island. They are used to anticipate low-flow periods within local and national decision-making bodies.

In recent years, the PREMHYCE platform has evolved and been upgraded as part of a research project (ANR CIPRHES, 2021–2025), including developments in meteorological forecasting, hydrological modelling, uncertainty quantification, and improvements of the user interface in close collaboration with end users.

This communication aims to present the PREMHYCE forecasting chain, its main functionalities, its range of applications, and its recent developments.


Key words: low-flow forecasting, water management, hydrological modelling


Reference:

Tilmant, F., Bourgin, F., François, D., Le Lay, M., Perrin, C., Rousset, F., Vergnes, J.-P., Willemet, J.-M., Magand, C., and Morel, M. (2023). - PREMHYCE, une plateforme nationale pour la prévision des étiages. Sciences Eaux & Territoires. 42, 17–21, https://doi.org/10.20870/Revue-SET.2023.42.7297.


Acknowledgements:

This work was financially supported by the French National Research Agency (ANR) (grant ANR-20-CE04-0009) within the CIPRHES project, by the French Office for Biodiversity (OFB) and by the Water and Biodiversity Direction (DEB, at the Ministry for ecology).

How to cite: Tilmant, F., Bourgin, F., François, D., Le Lay, M., Perrin, C., Rousset, F., Vergnes, J.-P., Willemet, J.-M., Magand, C., Guerin, A., and Pitsch, S.: PREMHYCE: a national platform for low-flow forecasting in France, EGU General Assembly 2026, Vienna, Austria, 3–8 May 2026, EGU26-9489, https://doi.org/10.5194/egusphere-egu26-9489, 2026.

EGU26-9630 | ECS | Posters on site | HS4.2

When does a drought end? Monitoring the duration and recovery of soil moisture droughts in Germany 

Friedrich Boeing, Julian Schlaak, Luis Samaniego, Rohini Kumar, Martin Schroen, Stephan Thober, and Andreas Marx

The impacts of drought events in recent years have demonstrated that monitoring droughts is essential even in generally water-rich countries such as Germany. In particular, the persistence of long-lasting, multi-year drought conditions [0] has increased awareness of drought risks. However, information on the current duration of droughts and the regional characteristics of historical drought duration is mostly not routinely presented in existing monitoring systems.

The UFZ German Drought Monitor (https://www.ufz.de/droughtmonitor/) [2] provides near-real-time information on current drought conditions in Germany through maps of a simulation-based soil moisture index [3] and plant-available water at a spatial resolution of approximately 1 km. While this information captures current drought intensity, drought impacts depend not only on prevailing conditions but also on drought duration and the cumulative water deficit.

To enhance the relevance of this information for water management during drought events, we derive two operational metrics addressing the following questions: (i) how unusual is the current drought in terms of its duration, and (ii) how much water is required to terminate drought conditions? Duration is computed as consecutive days below a percentile-based threshold relative to a long-term reference period at each grid cell. The required recovery water is expressed as the cumulative soil-water input needed to raise plant-available water back to the termination threshold, accounting for current seasonality and antecedent deficit.

We demonstrate the derivation of indicators describing current and historical drought durations, as well as the water amounts required for drought recovery. Using past drought events in Germany, we illustrate their added value and show how these metrics can be integrated into an operational drought monitoring system developed within the MOWAX project [3] to improve the assessment and communication of ongoing drought conditions. Furthermore, coupling these indicators with seasonal forecasts such as provided in the will enable probabilistic assessments of drought recovery, directly supporting timely management decisions regarding water restrictions.


References:

[0] Rakovec et al., Earth’s Future, 2022

[1] Boeing et al., Hydrol. Earth Syst. Sci., 2022

[2] Samaniego et al., J. Hydrometeorol., 2013

[3] MOWAX project :“Monitoring- and modelling concepts as a basis for water budget assessments in Saxony” (https://www.ufz.de/index.php?en=51826)

How to cite: Boeing, F., Schlaak, J., Samaniego, L., Kumar, R., Schroen, M., Thober, S., and Marx, A.: When does a drought end? Monitoring the duration and recovery of soil moisture droughts in Germany, EGU General Assembly 2026, Vienna, Austria, 3–8 May 2026, EGU26-9630, https://doi.org/10.5194/egusphere-egu26-9630, 2026.

EGU26-10126 | ECS | Orals | HS4.2

Meteorological Drought Monitor for two transboundary regions in Southern Africa 

Jonas Appenheimer, Elke Rustemeier, Markus Ziese, and Peter Finger

We address a need for hydrometeorological early warning and information systems (EWIS) in Southern Africa. In the project 'Co-Design of Hydrometeorological Information system for Sustainable Water Resource Management in Southern Africa' (Co-HYDIM-SA) we want to enhance water security in the two transboundary regions: Cuvelai-Cunene and Notwane (Namibia and Angola; Botswana and South Africa.

The Global Precipitation Climatology Centre (GPCC) has many years of experience in hosting an operational and publicly available global drought monitoring service, by combining the Standardized Precipitation Index (SPI) and the Standardized Precipitation Evapotranspiration Index (SPEI). For the SPI (SPEI) the 'gamma' ('log-logistic') distribution is fitted to the cumulative distribution function of the precipitation (climatic water balance) data. The main challenge of drought monitoring in the focus region is data scarcity. Therefore, we opted for the well-known and widely used SPI and SPEI, because these rely solely on precipitation and temperature data when calculating the potential evapotranspiration following Thornthwaite (1948). Nevertheless, observation data is difficult to acquire. Only few parameters are available and gaps in time series from stations are often present. That’s why, we work on a flexible data input in the operational system, where we can decide which data source should be used. For precipitation we mainly rely on the gridded GPCC dataset based on station data, whereas for temperature the gridded dataset from the Climate Prediction Center (CPC) is used. Furthermore, we plan to include satellite products (GIRAFE, CHIRPS, GPCP) and reanalysis (ERA5-Land) datasets. For the data acquisition and the implementation of the product, the collaboration with stakeholders in the focus region is essential. Therefore, they are included in the decision making and informed about our progress. The ‘co-design’ approach is an essential part of the project and is achieved by a close partnership with local Universities and a regular contact to the stakeholders.

At the EGU26 I want to present the Co-HYDIM-SA project, my findings and challenges we have encountered. Until today, we have calculated time series for the two Drought Indices (SPI, SPEI) and compared them with specific drought events. In general, the indices are consistent with the described droughts. One disadvantage of the SPI is that it has limitations during the dry season, especially for short term data aggregation. Whereas, the SPEI is characterized by its all-year round usability, due to the integration of potential evapotranspiration in addition to the precipitation data. As a next step, we will compare the grid data to station time series and evaluate the results by calculating skill scores.

References:

  • Thornthwaite, C. W. (1948). An Approach toward a Rational Classification of Climate. Geographical Review, 38(1), 55–94. https://doi.org/10.2307/210739

How to cite: Appenheimer, J., Rustemeier, E., Ziese, M., and Finger, P.: Meteorological Drought Monitor for two transboundary regions in Southern Africa, EGU General Assembly 2026, Vienna, Austria, 3–8 May 2026, EGU26-10126, https://doi.org/10.5194/egusphere-egu26-10126, 2026.

EGU26-11664 | ECS | Orals | HS4.2

Assessing the accuracy of multi-sectoral drought hazard indicators from the OUTLAST drought monitoring and seasonal forecasting system at the global scale 

Tina Trautmann, Neda Abbasi, Jan Weber, Tinh Vu, Stephan Dietrich, Petra Döll, Harald Kunstmann, Christof Lorenz, and Stefan Siebert

With droughts increasing in frequency and severity worldwide, reliable monitoring and forecasting systems, along with transparent accuracy assessment, are crucial for effective drought management and decision-making. Here, we evaluate the performance of three drought hazard indicators (DHIs) provided by the global, multi-sectoral drought hazard monitoring and forecasting system that has been developed within the OUTLAST project and is available via the WMO’s HydroSOS website. In OUTLAST, a consistent framework is applied to produce sector-specific DHIs for global monitoring and seasonal forecasts of droughts. To do so, climate data from ERA5 (for monitoring) and bias-corrected SEAS5 (for seasonal forecasts) are used to calculate meteorological DHIs as well as to force the Global Crop Water Model and the global hydrological model WaterGAPto derive agricultural and hydrological DHIs, respectively.

This study aims to assess the performance of three DHIs from multiple sectors, including (1) the standard precipitation index (SPI), (2) the rainfed crop drought hazard indicator (RFCDI), and (3) the empirical percentiles of streamflow (Q-EP), in an informative and user-friendly way. This is done by (a) a comprehensive comparison of OUTLAST DHIs against the same DHIs calculated with independent, preferably observation-based data, such as (1) remote sensing-based precipitation, (2) remote sensing-based actual and potential evapotranspiration, and (3) in-situ observed streamflow of large river basins, all for the historic period 1981-2020; and (b) a detailed evaluation of the capability of two example seasonal forecasts, issued in March 2018 and March 2022, to predict Northern Hemisphere spring and summer droughts across sectors. For each DHI, four drought classes are defined, with drought conditions being identified by a return period of at least five years.

For the historic period, the derived drought classes agree in about 50% of drought months globally (Q-EP: 49%, RFCDI: 51%), with higher agreement in the case of SPI (59%). The agreement is in general highest in temperate and cold climate zones, except for RFCDI, which performs best in arid regions (61%), where Q-EP only has a small agreement with in-situ streamflow droughts (36%). SPI has the lowest agreement in tropical regions (44%), where the agreement of RFCDI and Q-EP is slightly higher (46% resp. 47%). This low agreement of OUTLAST-SPI with remote sensing-based SPI reflects the known high uncertainties of ERA5 precipitation (which is used in OUTLAST) in the tropics, that partly propagates to modelled RFDCI and Q-EP. Differences between different DHIs and climate zones reflect the uncertainties and limitations of both the individual models used to compute the OUTLAST DHIs and the independent data sets used for comparison. At the same time, the consistent framework to produce multi-sectoral DHIs allows to analyze the effect of drought- and error-propagation in the hydrological cycle on the ability to capture observed drought conditions by model-based DHIs.

The results of these comparisons will be provided to the users of the OUTLAST drought hazard monitoring and forecasting system, and by that support informed drought management and decision-making across multiple sectors worldwide.

How to cite: Trautmann, T., Abbasi, N., Weber, J., Vu, T., Dietrich, S., Döll, P., Kunstmann, H., Lorenz, C., and Siebert, S.: Assessing the accuracy of multi-sectoral drought hazard indicators from the OUTLAST drought monitoring and seasonal forecasting system at the global scale, EGU General Assembly 2026, Vienna, Austria, 3–8 May 2026, EGU26-11664, https://doi.org/10.5194/egusphere-egu26-11664, 2026.

EGU26-11980 | Orals | HS4.2

Quantifying the Sub-seasonal Predictability Limit of 1-km Soil Moisture Drought in Germany 

Husain Najafi, Pallav Kumar Shrestha, Friedrich Boeing, Matthias Kelbling, Stephan Thober, Oldrich Rakovec, and Luis Samaniego

Skillful sub-seasonal to seasonal (S2S) hydrologic forecasts are essential for proactive, risk-based water management, yet the practical boundary of their usefulness - the predictability limit - remains poorly quantified for high-resolution drought indicators. Here, we use the operational High-resolution Sub-seasonal Hydroclimatic Forecasting System, HS2S (https://www.ufz.de/HS2SForcasts4Germany), providing daily ensemble soil-moisture forecasts for Germany since 2020, and quantify predictability limits with CRPS (Continuous Ranked Probability Score), a strictly proper scoring rule for probabilistic forecasts.

HS2S couples the mesoscale Hydrologic Model (mHM; https://mhm-ufz.org) with ECMWF extended-range ensemble meteorological forecasts. In the latest version of the forecasting system (Hs2S v0.2), 51 atmospheric ensemble forecasts are interpolated from 10~km to 1~km using external drift kriging and subsequently bias-corrected, enabling near-real-time hydrologic forecasting and uncertainty estimates.

We quantify predictability limits for recent drought conditions in Germany, focusing on the persistent multi-year drought of 2018--2022 and the acute drought conditions observed in 2025. Using the Soil Moisture Index (SMI; total soil column), we diagnose how forecast skill decays with lead time (up to 42~days) and how this decay varies across space. To contextualize the added value of meteorological forcing versus hydrologic persistence, we benchmark HS2S against (i) an Ensemble Streamflow Prediction (ESP)-style reference that propagates initial hydrologic conditions with historical meteorological sequences and (ii) a purely statistical ARIMA baseline. We further isolate the contribution of initial hydrologic conditions, derived from high-density German Weather Service (DWD) station observations, and show how land-surface "memory'' can extend useful predictability beyond that provided by meteorological forcing alone. The results provide a benchmark for further impact-based drought early warning studies and identify actionable windows of opportunity in which high-resolution forecasts add decision-relevant value.

How to cite: Najafi, H., Shrestha, P. K., Boeing, F., Kelbling, M., Thober, S., Rakovec, O., and Samaniego, L.: Quantifying the Sub-seasonal Predictability Limit of 1-km Soil Moisture Drought in Germany, EGU General Assembly 2026, Vienna, Austria, 3–8 May 2026, EGU26-11980, https://doi.org/10.5194/egusphere-egu26-11980, 2026.

EGU26-12171 | ECS | Posters on site | HS4.2

Drought analysis in Southern Germany using ecosystem-inspired resilience measures 

Selma Hajric, Jan Bliefernicht, Thomas Rummler, Wolfgang Buermann, and Harald Kunstmann

Soil moisture is an essential variable for drought analysis in hydrology because it reflects weather variability, antecedent conditions, and available water storage in a joint manner, and it is strongly affected by local site characteristics such as soil texture and land use. While standard metrics used to describe hydrological drought (e.g., magnitude, intensity, severity, duration) are useful for anticipating potential impacts of drought on dependent processes (e.g., agricultural failure, groundwater and streamflow recharge), they only partially describe the response of the soil moisture system itself. In this study, we aim to analyse soil moisture and drought variability inspired by a resilience quantification approach from ecosystem science, which jointly considers disturbance impact (e.g., magnitude and intensity) and recovery rate. For the pilot studies in Southern Germany, we used long-term soil moisture data (2000 to 2020) at high spatiotemporal resolution (daily, 2 km) generated by an advanced atmospheric-hydrological modelling system, WRF-Hydro, driven by reanalysis data (ERA5). In contrast to observational products, modelled data allow us to analyse soil moisture variability across different soil depths. Suitable resilience indicators are selected and applied to daily soil water storage to examine how drought responses vary with depth. Preliminary results indicate a strong influence of soil depth on soil moisture dynamics, with particularly pronounced drought events and low recovery rates in the deepest soil layer. The next step is to quantify the recovery rate of droughts across different site characteristics (e.g., land use, soil type) within the entire study domain. This study contributes to the development of a resilience assessment framework for hydrology to support monitoring, early warning, and risk assessment of droughts.

How to cite: Hajric, S., Bliefernicht, J., Rummler, T., Buermann, W., and Kunstmann, H.: Drought analysis in Southern Germany using ecosystem-inspired resilience measures, EGU General Assembly 2026, Vienna, Austria, 3–8 May 2026, EGU26-12171, https://doi.org/10.5194/egusphere-egu26-12171, 2026.

EGU26-12556 | ECS | Orals | HS4.2

Role of precipitation deficits versus increased evapotranspiration for dry soils in Europe 

Heiner Ochse, Melissa Ruiz-Vásquez, and René Orth

Soil moisture dynamics are governed by the balance between water supply from precipitation and atmospheric demand driving evapotranspiration. Thereby, the relative roles of precipitation (P) deficits and enhanced evapotranspiration (ET) for inducing dry soils are unclear, including their variation across regions and drought phases. However, this is crucial because heat-driven drying and rainfall deficits imply distinct drought evolution patterns, different drought responses to global change, and require different water management strategies. 

In this study, we identify anomalously low surface soil moisture events and compare concurrent precipitation deficits with actual ET anomalies in a consistent framework. More specifically, we separate each dry event into two development and two recovery phases, and classify each phase into P-dominated, ET-dominated, Compound-dominated (P deficit with increased ET), or non-dominant regimes. We use gridded observation-based datasets over Europe at a daily resolution covering the study period 2001–2021.

Across Europe, the drought development phase is mostly characterized as Compound-dominated in humid to transitional climate regions in central and northern Europe. By contrast, in more arid Mediterranean regions, we find P-dominated regimes toward which become more frequent as drought development progresses. The weaker role of ET in southern Europe has to do with less amount of vegetation and more vegetation water limitation which constrains transpiration as a main contributor of ET, while atmospheric water demand is actually high in these regions. 

For the drought recovery phase we find mostly compound-dominated regimes. This indicates that rainfall events contribute to overcoming the peak dry soil moisture anomalies while this is supported by reduced ET. The latter may be relatively cloudy and colder-than-usual weather associated with precipitation as well as drought legacy effects limiting vegetation functioning and hence transpiration beyond the actual water deficit period.

While the overall results are robust, regional patterns depend on the choice of datasets and thresholds used in the identification of dry events. Overall, our analysis provides a physically interpretable typology of soil drought evolution that can support drought diagnosis and early-warning systems.

How to cite: Ochse, H., Ruiz-Vásquez, M., and Orth, R.: Role of precipitation deficits versus increased evapotranspiration for dry soils in Europe, EGU General Assembly 2026, Vienna, Austria, 3–8 May 2026, EGU26-12556, https://doi.org/10.5194/egusphere-egu26-12556, 2026.

Abstract                                                                                                                      

Climate change and anthropogenic activities are threatening the spatiotemporal variabilities of water resources (Samimi et al., 2022; Swain et al., 2020). Particularly, arid and semi-arid regions like the Mediterranean are highly vulnerable to hydroclimatic variabilities and drought-related risks. In this regard, reservoirs play a vital role in moderating hydrologic variabilities and help to buffer water demand deficits (Giuliani et al., 2021). However, many reservoirs are still managed with static rule-based operations, which do not have the flexibility to account for evolving hydrometeorological information, such as inflow forecasts, nor do they readily adapt to changes in climate regimes or water use priorities Tu et al., 2003). In this study, a risk-aware stochastic model predictive control (SMPC) (Castelletti et al., 2023) was proposed for adaptive reservoir operation under uncertain future conditions for the Olivo reservoir located within the Imera Meridionale River basin (IMRB), Sicily, Italy. The proposed SMPC accounts for extreme deficit risk through conditional value-at-risk (CVaR). The framework aims to evaluate the value of using seasonal streamflow forecasts for multi-objective reservoir management within the SMPC framework by comparing four operating strategies: i) baseline standard operating policy (SOP) without forecast, ii) Deterministic model predictive control (MPC) with perfect forecast (pseudo-observed streamflow as forecast), iii) Deterministic MPC using climatological (monthly means from pseudo-observations) as forecast, and iv) SMPC driven by ensemble seasonal streamflow forecast. The results indicated that the ensemble-based SMPC provides significantly better performance over the climatological forecast, demonstrating the positive value of using ensemble forecasts. The perfect forecast-driven MPC provides the upper bound of achievable performance and is used to penalize the forecast. Conversely, the climatological forecast-driven MPC and SOP have shown lower performance in response to hydro climatological extremes, which reflects the averaging effect of the climatological forecast and the blindness of SOP about the future. Overall, the findings may support water managers in risk-aware proactive management of the reservoir stems in the IMRB.


Keywords,

SMPC, Forecast Value, FIRO, Conditional Value-at-Risk, Drought, SOP, IMRB


References.

Castelletti, A., Ficchì, A., Cominola, A., Segovia, P., Giuliani, M., Wu, W., Lucia, S., Ocampo-Martinez, C., De Schutter, B., Maestre, J.M., 2023. Model Predictive Control of water resources systems: A review and research agenda. Annu Rev Control 55, 442–465. https://doi.org/10.1016/j.arcontrol.2023.03.013

Giuliani, M., Lamontagne, J.R., Reed, P.M., Castelletti, A., 2021. A State-of-the-Art Review of Optimal Reservoir Control for Managing Conflicting Demands in a Changing World. Water Resour Res. https://doi.org/10.1029/2021WR029927

Samimi, M., Mirchi, A., Townsend, N., Gutzler, D., Daggubati, S., Ahn, S., Sheng, Z., Moriasi, D., Granados-Olivas, A., Alian, S., Mayer, A., Hargrove, W., 2022. Climate Change Impacts on Agricultural Water Availability in the Middle Rio Grande Basin. J Am Water Resour Assoc 58, 164–184. https://doi.org/10.1111/1752-1688.12988

Swain, S.S., Mishra, A., Sahoo, B., Chatterjee, C., 2020. Water scarcity-risk assessment in data-scarce river basins under decadal climate change using a hydrological modelling approach. J Hydrol (Amst) 590. https://doi.org/10.1016/j.jhydrol.2020.125260

Tu, M.-Y., Hsu, N.-S., W-G Yeh, W., 2003. Optimization of Reservoir Management and Operation with Hedging Rules. J Water Resour Plan Manag 2, 86–97. https://doi.org/10.1061/ASCE0733-94962003129:286

How to cite: Tekle, S. L., Bonaccorsso, B., Block, P., and Zaniolo, M.: From static rules to adaptive policies: developing a forecast-informed reservoir operation for balancing irrigation and ecosystem needs, a case study of Olivo reservoir, Sicily, Italy, EGU General Assembly 2026, Vienna, Austria, 3–8 May 2026, EGU26-12708, https://doi.org/10.5194/egusphere-egu26-12708, 2026.

EGU26-12924 | Posters on site | HS4.2

Comparative Analysis of Drought Indices in the Horn of Africa 

Tamirat Dessalegn Haile, Paolo Burlando, Jan Dirk Wegner, and Peter Molnar

Successful drought identification and characterization are essential for effective drought risk assessment and management, requiring advanced characterization methods and the careful selection of drought indices and aggregation timescales capable of representing diverse drought features. Despite the wide range of existing drought indices, their general applicability is often constrained by dominant local conditions (climate regime, hydrology, land surface characteristics, and data availability) and the necessity to choose a suitable aggregation timescale for operational applications. This study aims to identify suitable drought indices to effectively characterize and monitor drought in the Horn of Africa (HoA). A combined cluster-area- and shape-based filtering approach, followed by three-dimensional (2D space and 1D time) connectivity, was employed to capture drought dynamics simultaneously in space and time. A range of drought indices with varying levels of complexity was evaluated and compared, including indices derived from single variables such as precipitation or soil moisture, as well as more complex multivariate indices based on combinations of multiple variables, including precipitation, potential evapotranspiration, soil moisture, normalized difference vegetation index (NDVI), and surface temperature. The performance of these indices was assessed against historical drought records reported by governmental and non-governmental organizations. The findings demonstrate that multivariate indices generally outperform univariate ones, with indices incorporating potential evapotranspiration showing high performance; however, no single index consistently excelled across all evaluation criteria. Considering both computational complexity and effectiveness in identifying drought-affected areas and capturing temporal characteristics, the combined use of the standardized precipitation evapotranspiration index (SPEI)–based indices, SPEI6 and SPEI9, is recommended for drought monitoring, planning, and management in the HoA, a region dominated by arid and semi-arid climates and recurrent, spatially extensive drought events.


How to cite: Haile, T. D., Burlando, P., Wegner, J. D., and Molnar, P.: Comparative Analysis of Drought Indices in the Horn of Africa, EGU General Assembly 2026, Vienna, Austria, 3–8 May 2026, EGU26-12924, https://doi.org/10.5194/egusphere-egu26-12924, 2026.

EGU26-12986 | Orals | HS4.2

Drought as a Continuum: quantifying global Spatiotemporal Connectivity of Drought Events 

Arthur Hrast Essenfelder, Andrea Toreti, Carmelo Cammalleri, and Sergio Vicente-Serrano

Droughts are systemic hazards with far-reaching consequences for food security, economic stability, and the environment. While traditionally characterised by deviations from normal conditions over static spatial areas or point-based time series, droughts are increasingly recognised as dynamic continuous processes with large memory effects that propagate through interlinked hydrological, ecological, and socio-economic systems (i.e. “drought as a continuum”). Despite this conceptual shift, gaps remain in capturing the evolving nature of droughts as they move across space and persist through time. This study presents a novel object-based tracking framework based on a three-dimensional Density-Based Spatial Clustering of Applications with Noise (DBSCAN) for identifying and characterising droughts as explicit spatiotemporal entities at the global scale. The proposed methodology integrates in a novel way the Standardized Precipitation-Evapotranspiration Index (SPEI) at two complementary scales: SPEI-01 to capture rapid onset and SPEI-03 to monitor evolving persistence. The spatiotemporal identification of drought events is achieved through a two-stage clustering process: first, a 2D DBSCAN identifies spatial clusters from instantaneous intensity values; second, these entities are integrated into a 3D DBSCAN framework to establish connectivity across the temporal dimension, defining cohesive drought events globally. Additionally, we introduce a novel Drought Event Index, a composite metric synthesising an event’s duration, pace, extent, and intensity into a single metric that enables direct comparison of drought events across diverse geographical locations and historical periods. Methods are applied to the ERA5 reanalysis dataset for the period 1940-2025. Results indicate a marked increase in the frequency and intensity of drought events in recent decades compared to the period 1950-1990, while accurately identifying the spatiotemporal dynamics of recent significant events around the globe, such as the 2018 and 2022 drought events in Europe, and the unprecedented 2019-2025 multi-year droughts in South America. The proposed methodological framework evaluates dynamics often unaccounted for by static analysis, thus enabling the quantitative assessment of droughts as a continuum at the global scale and across different timescales.

How to cite: Hrast Essenfelder, A., Toreti, A., Cammalleri, C., and Vicente-Serrano, S.: Drought as a Continuum: quantifying global Spatiotemporal Connectivity of Drought Events, EGU General Assembly 2026, Vienna, Austria, 3–8 May 2026, EGU26-12986, https://doi.org/10.5194/egusphere-egu26-12986, 2026.

EGU26-13290 | ECS | Posters on site | HS4.2

Early-Season Streamflow Prediction in the N’fis Basin (Morocco) Using Teleconnection indices and Machine Learning 

Mohamed Naim, Brunella Bonaccorso, and Shewandagn Tekle

Anticipating early-season streamflow is essential for water management in semi-arid basins where reservoir decisions remain largely reactive. In the N’fis Basin (Morocco), we investigate whether large-scale climate signals, combined with machine-learning methods, can improve short-lead streamflow outlooks. Using monthly observations from 1982–2021, we evaluate three approaches—Random Forest (RF), Partial Least Squares Regression (PLSR), and Multiple Linear Regression (MLR)—for lead times of one to three months (t+1 to t+3). Predictor selection is based on correlation analysis and multicollinearity diagnostics, and model skill is assessed through RMSE and R². Streamflow anomalies are expressed using the Standardized Streamflow Index (SSI), which provides a normalized measure of hydrological drought directly linked to water availability. Results show that incorporating climate indices improves early identification of low-flow conditions relative to persistence-based benchmarks. Predicted SSI anomalies capture major drought periods, demonstrating the value of climate-informed models for anticipatory reservoir management. These findings could support the potential development of forecast-informed reservoir operations (FIRO) in the region, contributing to more proactive drought forecasting.

How to cite: Naim, M., Bonaccorso, B., and Tekle, S.: Early-Season Streamflow Prediction in the N’fis Basin (Morocco) Using Teleconnection indices and Machine Learning, EGU General Assembly 2026, Vienna, Austria, 3–8 May 2026, EGU26-13290, https://doi.org/10.5194/egusphere-egu26-13290, 2026.

EGU26-14348 | Orals | HS4.2

Investigating the Predictability of Terrestrial Water Storage at Subseasonal to Seasonal Scale to support drought and food insecurity early warning in Data-Sparse Regions 

Shraddhanand Shukla, Weston Anderson, Bailing Li, Benjamin Cook, Abheera Hazra, Kimberly Slinski, and Amy McNally

Earth System Science Interdisciplinary Center, University of Maryland

Terrestrial Water Storage (TWS) integrates information from various important sources of moisture, each with distinct temporal and spatial dynamics, including groundwater, soil moisture, and surface water storage. TWS anomalies, hence, can serve as an indicator of drought, and are being used operationally, such as by the U.S. Drought Monitor. TWS can be simulated by land surface models and observed from satellites like GRACE/GRACE-FO, providing extensive spatial and temporal coverage in near-real time, which is particularly attractive in data-sparse regions that are also food insecurity hot spots. FLDAS (Famine Early Warning Systems Network Land Data Assimilation System)-Forecasts provide TWS forecasts at the subseasonal to seasonal scale (S2S). While past research has found the TWS forecasts to be a skillful predictor of Leaf Area Index (used as a surrogate of vegetative productivity) at 3 months lead time, further research is needed to facilitate operational application of TWS forecasts in supporting food insecurity early warning. This presentation summarizes recent research that (i) evaluates the skill of TWS forecasts from the FLDAS-forecasts system relative to GRACE/GRACE-FO observations and highlights the inter-model differences that lead to differences in TWS forecasts, (ii) investigates the role that each of the TWS components plays in the predictability of TWS at the S2S scale, and highlights the role of rootzone soil moisture in TWS predictability. Together, these analyses provide insights into both the promise and limitations of producing S2S forecasts of TWS using either land surface models or statistical models. We focus our analysis on data-sparse, food-insecure regions in Africa where data limitations are widespread and any improvement in forecast skill can be translated into improved early warnings of agricultural drought.

How to cite: Shukla, S., Anderson, W., Li, B., Cook, B., Hazra, A., Slinski, K., and McNally, A.: Investigating the Predictability of Terrestrial Water Storage at Subseasonal to Seasonal Scale to support drought and food insecurity early warning in Data-Sparse Regions, EGU General Assembly 2026, Vienna, Austria, 3–8 May 2026, EGU26-14348, https://doi.org/10.5194/egusphere-egu26-14348, 2026.

EGU26-14790 | Orals | HS4.2

Drought forecasting for improved water management and  

Abror Gafurov, Till Weiss, and Nurana Akhundzada

Droughts have become increasingly frequent in recent years across Central Asia, posing significant challenges to water management, agriculture, and socio-economic stability in the region. Accurate forecasting of droughts is crucial for mitigating their impacts, yet effective prediction relies on comprehensive and high-quality datasets from the source areas. In Central Asia, however, such datasets are often sparse or incomplete, limiting traditional monitoring and forecasting approaches. To address this challenge, we employ remote sensing datasets to forecast potential drought occurrence across the region. By leveraging satellite-derived indicators of snow cover, vegetation index (NDVI), and precipitation anomalies, we develop predictive models capable of identifying areas at risk of drought even under limited ground-based observations. The results demonstrate the potential for remote sensing approaches to fill critical data gaps, providing timely and actionable information for decision-makers. Implementation of these forecasts at the policy level can support proactive drought management, resource allocation, and adaptation strategies, ultimately enhancing regional resilience to increasing drought frequency.

We have integrated the developed methodology of drought forecasting into MODSNOW-Tool as an additional functionality of forecasting droughts. 

How to cite: Gafurov, A., Weiss, T., and Akhundzada, N.: Drought forecasting for improved water management and , EGU General Assembly 2026, Vienna, Austria, 3–8 May 2026, EGU26-14790, https://doi.org/10.5194/egusphere-egu26-14790, 2026.

EGU26-15101 | ECS | Orals | HS4.2

Identifying drought-affected paddy rice fields using satellite-based temporal vegetation dynamics 

Hyochan Kim, Jongjin Baik, Hoyoung Cha, Kihong Park, Seoyeong Ku, and Changhyun Jun

This study presents a data-driven framework for identifying drought-affected paddy rice fields associated with actual agricultural drought events in South Korea. The proposed approach examines spatiotemporal patterns of multiple vegetation- and moisture-related indices derived from high-resolution satellite observations to distinguish paddy fields experiencing water stress from normal growing conditions. Spectral–temporal characteristics of paddy fields and barren land are analyzed to detect paddy pixels exhibiting barren-like behavior during drought periods. The framework is demonstrated over Chungcheongnam-do, a major agricultural region where severe water shortages in paddy fields were reported during recent drought events. A Long Short-Term Memory (LSTM) model is employed to capture temporal dependencies in vegetation dynamics. Satellite observations from non-drought years are used for model training and validation, and the trained model is subsequently applied to drought years to identify anomalous paddy field responses. Drought-affected paddy areas are delineated based on the persistence and duration of barren-like conditions relative to the crop phenological cycle. To enhance interpretability, permutation-based feature importance analysis is conducted to assess the contribution of individual indices and to identify those most effective in distinguishing drought-affected conditions. By establishing quantitative criteria for delineating previously ambiguous drought-impacted paddy areas, the proposed framework provides a basis for improved assessment of agricultural drought impacts and supports more robust monitoring of crop stress under variable hydroclimatic conditions.

Keywords: Agricultural Drought, Paddy Rice Fields, Vegetation Dynamics, Satellite Remote Sensing, Data-driven Framework

Acknowledgement

This work was supported by the Korea Environmental Industry & Technology Institute (KEITI) through Water Management Program for Drought, funded by the Korea Ministry of Climate, Energy and Environment (MCEE). (RS-2022-KE002032) and was supported by the National Research Foundation of Korea(NRF) grant funded by the Korea government(MSIT) (RS-2024-00334564). Also, This research was supported by the Basic Science Research Program through the National Research Foundation of Korea(NRF) funded by the Ministry of Education(RS-2024-00356439) and was supported by the National Research Foundation of Korea (NRF) (RS-2021-NR060085) funded by the Korea government (MSIT).

How to cite: Kim, H., Baik, J., Cha, H., Park, K., Ku, S., and Jun, C.: Identifying drought-affected paddy rice fields using satellite-based temporal vegetation dynamics, EGU General Assembly 2026, Vienna, Austria, 3–8 May 2026, EGU26-15101, https://doi.org/10.5194/egusphere-egu26-15101, 2026.

EGU26-15992 | ECS | Posters on site | HS4.2

Drought Analysis Using Complementary Relationship Between Evapotranspiration and Atmospheric Evaporative Demand 

Yuju Chun, Hyeonho Jeon, Daeha Kim, Shinhyeon Cho, and Minha Choi

Drought is a critical natural disaster which can cause significant environmental and socioeconomic impacts such as agricultural loss and water shortages. Under climate change, increasing aridity and rising land surface temperatures have intensified drought frequency and severity. Therefore, effective drought monitoring is essential for early warning systems which can reduce the vulnerability of ecosystem and society from impacts of prolonged water shortages. Detection of drought is conducted using various meteorological/hydrological factors, which includes remote-sensing based methods. Drought reflects the relation between water supply and demand. While traditional studies focused on precipitation as a main variable, recent researchers have emphasized evapotranspiration as a key driver of drought dynamics. Complementary Relationship (CR) between evapotranspiration (ET) and atmospheric evaporative demand can show the relation of supply and demand efficiently. While CR-based drought indices have shown improved performance to land-atmosphere connection, critical challenges remain. These challenges are primarily associated with the assumptions of the Bouchet hypothesis and the limited availability of long-term ET data. In this study, ET was calculated using a CR-based approach driven by meteorological data and satellite-based datasets to provide better spatial continuity and long-term consistency. The approach enables the representation of seasonal variability, and its performance was evaluated through comparison with conventional drought indices. This study suggests a CR-based drought monitoring method that offers a robust and data-efficient framework, particularly in regions with limited ground observations.

Keywords: Drought, Evapotranspiration, Climate Change, Complementary Relationship, Atmospheric Evaporative Demand

Acknowledgment

This research was supported by the BK21 FOUR (Fostering Outstanding Universities for Research) funded by the Ministry of Education (MOE, Korea) and National Research Foundation of Korea (NRF). This work is financially supported by Korea Ministry of Land, Infrastructure and Transport (MOLIT) as 「Innovative Talent Education Program for Smart City」. This work was supported by Korea Environment Industry & Technology Institute (KEITI) through Water Management Program for Drought Project, funded by Korea Ministry of Climate, Energy and Environment (MCEE)(RS-2023-00230286). This work was supported by the National Research Foundation of Korea (NRF) grant funded by the Korea government (MSIT) (RS-2024-00416443). This work was supported by the National Research Foundation of Korea (NRF) grant funded by the Korea government (MSIT) (RS-2022-NR070339).

How to cite: Chun, Y., Jeon, H., Kim, D., Cho, S., and Choi, M.: Drought Analysis Using Complementary Relationship Between Evapotranspiration and Atmospheric Evaporative Demand, EGU General Assembly 2026, Vienna, Austria, 3–8 May 2026, EGU26-15992, https://doi.org/10.5194/egusphere-egu26-15992, 2026.

EGU26-16283 | ECS | Posters on site | HS4.2

 Continuous Spectral Transformation for Forecasting Hydroclimatic Extremes 

Sunil Thapa, Liangjing Zhang, Ashish Sharma, and Ze Jiang

Accurate hydrological forecasting at local scales is often constrained by the limited ability to effectively translate large-scale climate predictors into reliable local predictions. To improve this translation, wavelet-based predictor refinement methods operating in the discrete domain, such as Wavelet System Prediction (WASP), have been applied; however, these approaches are constrained by limitations inherent to the Discrete Wavelet Transform (DWT), including limited scale resolution. More importantly, it primarily adjusts predictor amplitude in the time-frequency domain and does not address spectral mismatches arising from phase and amplitude misalignment between predictors and responses, leading to reduced predictive reliability.

Here, we introduce Continuous Spectral Transformation (CST), a framework that leverages continuous wavelets to simultaneously adjust variance structure and phase misalignment by exploiting their high-resolution continuous scales in the frequency domain. CST enables precise redistribution of predictor variance across continuous frequency bands while simultaneously correcting phase alignment. The performance of CST is evaluated through a rigorous validation scheme spanning synthetic experiments, including chaotic systems, and a real-world drought forecasting application.

Results from the real-world application demonstrate the clear superiority of CST, with correlation improvements of 40–61% relative to models using raw and WASP-transformed predictors, effectively transforming marginally skilful forecasts into operationally reliable predictions. CST establishes a robust and physically interpretable framework for predictor refinement in hydroclimatic forecasting and offers strong potential for enhancing decadal-scale projections of hydrological extremes and other climate-driven extreme events.

Keywords: Hydroclimatic extremes, Wavelet analysis, Continuous Spectral Transformation

How to cite: Thapa, S., Zhang, L., Sharma, A., and Jiang, Z.:  Continuous Spectral Transformation for Forecasting Hydroclimatic Extremes, EGU General Assembly 2026, Vienna, Austria, 3–8 May 2026, EGU26-16283, https://doi.org/10.5194/egusphere-egu26-16283, 2026.

EGU26-16440 | ECS | Orals | HS4.2

Scale-Dependent Gradient Boosting Algorithms for SPEI Drought Prediction 

Siddhant Panigrahi and Vikas Kumar Vidyarthi

The drought monitoring and forecasting are essential for effective water resources management and decreasing climate risks because of increasing climatic variability. In order to simulate the 12-month Standardized Precipitation Evapotranspiration Index (SPEI-12), this paper evaluates the appropriateness and the comparative performance of gradient boosting-based machine learning models namely; Gradient Boosting Regressor, Extreme Gradient Boosting (XGBoost), Light Gradient Boosting Machine (LightGBM), and Categorical Boosting (CatBoost). A rigorous evaluation methodology is adopted to ensure scientific accuracy and applicability of the operation where statistical goodness of fit measures, hydrological efficiency measures, diagnostics of errors, bias measures, test of significance, and accuracy of threshold-based drought classification are all undertaken. According to the results, the learning capacity of all gradient boosting models is high in the course of the training, and R2 and NSE values are between 0.98 and 0.99, which suggests that the variability of SPEI-12 is depicted well. LightGBM and CatBoost outperformed the other approaches in both R2, NSE, and KGE values and lower RMSE and bias in the testing stage, therefore, the models were the most predictable and applicable. It is interesting to note that LightGBM is generally accurate and efficient, whilst CatBoost is more resistant to outliers, which is demonstrated by lower average relative error. LightGBM is the most superior approach when compared to other model with evaluation metrics (R2 of 0.87, NSE of 0.86, KGE of 0.83, and the lowest RMSE of 0.37). Evaluation using the threshold indicates the operational strength of the proposed framework, and all models were highly accurate in detecting moderate and severe situations of drought. In 67.23% of the test cases the model correctly forecasted an event of drought at a tolerance of 10% which rose to 90.64% at a tolerance of 100 percent which is corroborated by the fact that it is a realistic model that can be useful in an operational drought early warning system. Models were most effective under intense drought conditions with a high degree of accuracy of over 90 percent at the 100 percent mark, which means that it is reliably applicable in detecting severe drought conditions that are necessary in emergency response planning. The model performance was strongly validated by means of the rigorous statistical analysis using various statistical metrics which included: R2 NSE, KGE, RMSE, P-Bias, and F-statistics. This multimeric method ensured comprehensive evaluation that can be used in operation in different climatic regions. In general, the findings indicate that machine learning models based on the gradient boosting are a valid and useful approach to predict the drought index over the long run. This paper demonstrates the unique advantages of boosting techniques in the long-term drought index (SPEI-12) modelling and the importance of selecting and validating the model with numerous statistical measures. The proposed approach holds tremendous potential in improving risk assessment for drought monitoring.

How to cite: Panigrahi, S. and Kumar Vidyarthi, V.: Scale-Dependent Gradient Boosting Algorithms for SPEI Drought Prediction, EGU General Assembly 2026, Vienna, Austria, 3–8 May 2026, EGU26-16440, https://doi.org/10.5194/egusphere-egu26-16440, 2026.

Climate change intensifies drought risks in Taiwan, particularly threatening the Zhuoshui River Basin—a region critical for agriculture, industry, and domestic water supply. Traditional drought monitoring systems focus primarily on meteorological and hydrological indicators but fail to capture cascading impacts across socio-economic and environmental systems. This study develops a Drought Impact-Based Forecasting (DIBF) framework that bridges hydrological predictions with multisectoral risk assessment, providing actionable early warnings for integrated drought management.
The framework integrates hydrological forecasting and risk-impact assessment through three components. First, Recurrent Nonlinear Autoregressive with Exogenous Inputs (R-NARX) models predict groundwater levels and river discharge 1–3 months ahead. The models achieve test R² of 0.84 for groundwater estimation and above 0.91 for discharge forecasting at major gauging stations (Jiji Weir, Zhangyun Bridge, and Xikou), demonstrating stable predictive capability across the basin's key monitoring locations. A Self-Organizing Map coupled R-NARX (SOM-R-NARX) model enhances spatial resolution by generating grid-based groundwater prediction maps (overall RMSE = 1.36 m, R² = 0.51), enabling spatially-explicit hazard assessment across the basin.
The core innovation lies in the DIBF module, which systematically integrates multisectoral drought risks through a Fuzzy Inference System (FIS). The system synthesizes: (1) Hazard factors from rainfall-based, groundwater-based, and streamflow-based drought indices validated for the basin; (2) Exposure factors quantifying industrial water demand, agricultural irrigation requirements (first-crop rice production areas), groundwater-dependent activities, and population reliance on surface water; and (3) Vulnerability factors assessing adaptive capacity across agricultural systems (crop sensitivity, irrigation infrastructure), industrial sectors (water storage, alternative sources), environmental dimensions (groundwater overdraft risks, ecological flows), and social aspects (water allocation conflicts, vulnerable populations). These heterogeneous risk factors—represented in both qualitative expert knowledge and quantitative measurements from interdisciplinary research—are transformed into interpretable impact scores through fuzzy rule-based reasoning.
A risk matrix combining forecast likelihood and impact severity delivers a four-level warning classification (green–yellow–orange–red) with sector-specific response recommendations: irrigation adjustments for agriculture, water allocation shifts for industry, groundwater pumping restrictions for environmental protection, and inter-sectoral coordination for social stability. The system provides 1–3 month lead-time forecasts with sub-basin spatial disaggregation.
Applied to Taiwan's most water-stressed basin, this framework operationalizes DIBF principles through transparent fuzzy inference, explicitly linking hydrological forecasts to multisectoral impacts and synthesizing cross-disciplinary risk knowledge into unified, actionable information. The approach provides a replicable template for drought early warning systems that support evidence-based decision-making balancing industrial, agricultural, environmental, and social priorities under climate change.

Keywords: Drought impact-based forecasting(DIBF);Hydrological forecasting;Groundwater-streamflow interactions;Fuzzy inference system

How to cite: Shiu, S.-K., Chang, F.-J., and Chang, L.-C.: A Fuzzy Inference–Based Framework for Drought Impact-Based Forecasting and Early Warning: Integrating Hydrological Forecasting with Multisectoral Risk Analysis, EGU General Assembly 2026, Vienna, Austria, 3–8 May 2026, EGU26-16770, https://doi.org/10.5194/egusphere-egu26-16770, 2026.

EGU26-17298 | Orals | HS4.2

Drought Scan: an impact-oriented drought monitoring system bridging precipitation and hydrological response 

Arianna Di Paola, Ramona Magno, Edmondo Di Giuseppe, Sara Quaresima, Leandro Rocchi, and Massimiliano Pasqui

Drought monitoring systems often rely on multiple standardized indices computed at fixed time scales, leaving end users with fragmented information and weak links to actual impacts. Here we present Drought Scan (DS), an operational drought monitoring and forecasting system designed to provide a synoptic, impact-oriented view of drought at the river-basin scale.

DS is entirely driven by basin-aggregated monthly precipitation and builds on a continuous multi-scale representation of standardized precipitation anomalies (SPI from 1 to 36 months). The core of the system is a synthetic indicator, D(SPI), obtained through a weighted aggregation of multi-scale SPI values. The weighting scheme is optimized against observed river discharge, maximizing the correlation between D(SPI) and standardized monthly streamflow (SQI1). As a result, unlike conventional indices, D(SPI) acts as a proxy of hydrological stress, despite being derived solely from precipitation. This makes the indicator explicitly impact-oriented and directly interpretable in terms of water availability.

The system integrates three complementary components: (i) a multi-scale SPI heatmap that reveals drought triggers, persistence, and propagation across temporal scales; (ii) the D(SPI) indicator, which condenses this information into a single, basin-specific drought signal calibrated on hydrological response; and (iii) the cumulative deviation from normal (CDN), which captures the long-term memory of wet and dry phases and contextualizes drought severity within multi-year precipitation regimes.

By construction, DS bridges the meteorological–hydrological continuum without relying on hydrological modeling or extensive ancillary data. Once an impact-oriented indicator is defined from precipitation alone, the system naturally lends itself to be applied into forecast estimates at sub-seasonal and seasonal scales: projected precipitation can be propagated through the same framework to obtain forecasts of D(SPI), i.e. forecasts of drought conditions expressed in terms of expected hydrological stress. Different forecasting approaches can be adopted (numerical such as those provided by Copernicus Climate Change Service or those estimated by machine learning algorithms), but the emphasis remains on the indicator and its interpretability rather than on the predictive technique itself. To facilitate this interpretation, forecasts are coupled with probabilistic scenarios that also can allow the quantification of rainfall needed to recover from drought phases.

DS is conceived as a climate service tool developed within the Drought Central framework (www.droughtcentral.it), suitable for monitoring, early warning, and scenario exploration, and designed to translate complex drought dynamics into information that is robust, transparent, and operationally meaningful for water management and decision-making.

How to cite: Di Paola, A., Magno, R., Di Giuseppe, E., Quaresima, S., Rocchi, L., and Pasqui, M.: Drought Scan: an impact-oriented drought monitoring system bridging precipitation and hydrological response, EGU General Assembly 2026, Vienna, Austria, 3–8 May 2026, EGU26-17298, https://doi.org/10.5194/egusphere-egu26-17298, 2026.

EGU26-17850 | ECS | Orals | HS4.2

Atmospheric Drought under Climate Change: Vapour Pressure Deficit Trends and Impacts in Czechia 

Tímea Kalmár and Romana Beranová

Vapour pressure deficit (VPD) is a key indicator of atmospheric dryness, plant water stress, stomatal conductance, and crop productivity. Under climate change, rising air temperatures increase the capacity of the atmosphere to hold water vapor, leading to higher VPD even in regions where precipitation has not declined.  Atmospheric drought is therefore an important but still underrepresented component of drought risk assessments, which have traditionally focused on precipitation and soil moisture alone. In Central Europe, recent heatwaves and drought events have caused substantial agricultural and ecological impacts, but the long-term behaviour of VPD and its interaction with soil moisture remain not fully clarified.

The objective of this study is to assess long-term changes in atmospheric drought, evaluating the reliability of reanalysis-based VPD, and quantifying the coupling between atmospheric conditions, soil moisture, and agricultural productivity in Czechia. The results will support improved drought monitoring and impact assessment in the context of ongoing climate change.

This study analyses VPD from station observations and reanalysis data in Czechia for 50 years (1975-2024), together with soil moisture data from reanalysis and annual crop yield data. The performance of reanalysis-based VPD is evaluated against station observations using bias, root-mean-square error, correlation, and their ability to reproduce observed extreme VPD events. This comparison assesses whether reanalysis data are suitable for studying atmospheric drought and extremes at regional scale. Long-term changes in VPD and soil moisture are evaluated using non-parametric trend methods. Analyses are performed for annual and growing-season means as well as for drought-relevant metrics, including maximum VPD and the annual number of extreme VPD days. The relationship between atmospheric and soil drought is investigated across daily to monthly time scales. Impacts on agriculture are assessed by relating annual crop yields to growing-season VPD and soil moisture.

How to cite: Kalmár, T. and Beranová, R.: Atmospheric Drought under Climate Change: Vapour Pressure Deficit Trends and Impacts in Czechia, EGU General Assembly 2026, Vienna, Austria, 3–8 May 2026, EGU26-17850, https://doi.org/10.5194/egusphere-egu26-17850, 2026.

EGU26-17930 | Posters on site | HS4.2

Drought impacts reported in Norwegian media from 2000 to 2018 and their relation to drought indices 

Lena M Tallaksen, Frøya Pharo, Sigrid J Bakke, Anne K Fleig, and Akhilesh Nair

Traditional forecast and early warning systems focus primarily on hydrometeorological variables such as precipitation, temperature, streamflow and water levels. To better mitigate the consequences of such events a shift from hazard to impact-based forecasting and prediction is encouraged (WMO, 2016; 2021). In response, this study i) introduces the Norwegian Drought Impacts Database (NODID), and ii) assesses links between drought indices (SPI and SPEI) and impacts. NODID consists of reported drought impacts across various sectors in Norway following the sector specific classification system introduced by Stahl et al. (2016). Currently, the database contains 302 reports detailing 356 drought impacts from 2000 to 2018 sourced from Norwegian media, primarily through the media archive Atekst, which is Norway’s most extensive text archive covering approx. 100 newspapers and journals as well as the Norwegian News Agency back to the mid-eighties. The dataset revealed distinct patterns in drought impacts according to seasonality, regional differences, and sector-specific vulnerabilities. The sectors most affected were agriculture and livestock farming, energy and industry, public water supply, and wildfires. The years 2002, 2014, 2017 and especially 2018 showed the largest numbers of reported impacts across sectors. Extremely low SPI and SPEI values (< -2) were associated with drought impacts during summer, whereas reported impacts were not necessarily related to low SPI/SPEI values. Further work will explore statistical links between impacts and drought indices in a more comprehensive way. The insight gained from this study provides novel information to decision makers, can help identify key societal and environmental vulnerabilities to drought, and guide drought management and adaptation.

References

Stahl, K., Kohn, I., Blauhut, V., et al. (2016) Impacts of European drought events: insights from an international database of text-based reports, Nat. Hazards Earth Syst. Sci., 16, 801–819, https://doi.org/10.5194/nhess-16-801-2016, 2016.

WMO Guidelines on Multi-hazard Impact-based Forecast and Warning Services. WMO-No. 1150 (2015, 2021).

How to cite: Tallaksen, L. M., Pharo, F., Bakke, S. J., Fleig, A. K., and Nair, A.: Drought impacts reported in Norwegian media from 2000 to 2018 and their relation to drought indices, EGU General Assembly 2026, Vienna, Austria, 3–8 May 2026, EGU26-17930, https://doi.org/10.5194/egusphere-egu26-17930, 2026.

EGU26-18904 | Posters on site | HS4.2

Linking groundwater abstraction to anthropogenic land subsidence in Northern Madrid, Spain: A numerical modelling perspective 

Subhashish Dey, Luis Cueto-Felgueroso, Miguel Marchamalo, and Jose M. Bastias

Unsustainable extraction of groundwater all over the world has led to a rapid decline in global groundwater levels, and this decline has been linked to land subsidence, a serious geohazard that poses a threat to present infrastructure, livelihoods and the built environment. Here, we particularly deal with the region of northern Madrid, where we have developed a numerical model to simulate the land subsidence driven by groundwater abstraction in the region. The numerical model is constrained, supplemented and evaluated using groundwater level data from monitoring wells in the region and land displacement data from satellite observations. From the amalgamation of what we see from the change in piezometric levels and simulated surface deformation, we conclude that the model represents subsidence during periods of intense abstraction and partial uplift in times of recovery phases when the groundwater levels rise. The numerical model necessarily helps us to form a connection as to how changes in groundwater levels in the Madrid region are translated and linked to ground motion and subsidence in the system. This, in the end, also helps us support and form better groundwater management scenarios and policies.

How to cite: Dey, S., Cueto-Felgueroso, L., Marchamalo, M., and M. Bastias, J.: Linking groundwater abstraction to anthropogenic land subsidence in Northern Madrid, Spain: A numerical modelling perspective, EGU General Assembly 2026, Vienna, Austria, 3–8 May 2026, EGU26-18904, https://doi.org/10.5194/egusphere-egu26-18904, 2026.

EGU26-18915 | ECS | Posters on site | HS4.2

Enhancing soil moisture-based drought monitoring in the Austrian Alps with satellite based snow masking 

Carina Villegas-Lituma, Samuel Massart, Gabriele Schwaizer, and Juraj Parajka

Alpine regions supply critical water resources for Austrian hydropower generation (60% of electricity), yet climate-change-driven droughts increasingly threaten energy production and downstream users. Effective drought early warning systems require reliable soil moisture monitoring; however, operational satellite-based surface soil moisture (SSM) products derived from scatterometer and Synthetic Aperture Radar (SAR) observations currently lack adequate snow cover masking in alpine terrain. While droughts do not occur during snow-covered periods, unmasked snow-covered backscatter introduces extreme values unrelated to actual soil moisture changes. These false signals distort statistical baselines used for anomaly detection, leading to misidentified drought events and compromised drought indicators. Existing operational products include HSAF ASCAT SSM (6.25 km) masks for all snow-affected locations, limiting spatial-temporal coverage for drought assessment, and HSAF DIREX SSM (500 m), which applies static masks regardless of seasonal snow dynamics. Satellite-based daily snow detection offers a solution by filtering unreliable soil moisture observations and enabling accurate identification of true soil moisture anomalies.

This study evaluates these soil moisture products across the Austrian Alps with and without daily snow products from combined Sentinel-3 SLSTR and OLCI data (~200 m). We validate accuracy through comparison with ERA5-Land reanalysis and in-situ soil moisture measurements. Results demonstrate that satellite-based daily snow masking substantially improves soil moisture accuracy. Both ASCAT and DIREX SSM show increased correlation with ERA5-Land. In-situ validation for ASCAT SSM reveals significant bias reduction from 0.1–0.25 m³/m³ to 0.05–0.20 m³/m³ when snow-contaminated observations are properly filtered. Validation against the 2018 Alpine drought (Central Europe's most severe in recent history) confirms that integrating daily snow products substantially improves drought indicator reliability, offering a transferable framework for early warning systems across snow-affected mountain regions worldwide.

How to cite: Villegas-Lituma, C., Massart, S., Schwaizer, G., and Parajka, J.: Enhancing soil moisture-based drought monitoring in the Austrian Alps with satellite based snow masking, EGU General Assembly 2026, Vienna, Austria, 3–8 May 2026, EGU26-18915, https://doi.org/10.5194/egusphere-egu26-18915, 2026.

In regulated basins, drought impacts emerge when a meteorological signal is accumulated by storage and transformed by operations. We analyze the 2022 to 2024 episode in the Flumendosa system in Sardinia by coupling the climate signal from multi-scale SPI and SPEI for 1950 to 2024 at 9, 12, 24, and 36 months with a monthly Standardized Reservoir Storage Index (SRSI, 2006 to 2024) that normalizes reservoir volumes by season. The 1950 to 2021 baseline provides context for the recent evolution, and a scale and lag analysis links storage dynamics to antecedent climate at decision-relevant horizons.

Three features stand out. In 2022, SPI and SPEI at 12 and 24 months remained close to normal, yet SRSI declined through the year, indicating erosion of carryover despite the absence of a strong multi-season meteorological deficit. In 2023, short-horizon deficits at 9 to 12 months propagated into storage, with SRSI entering stressed classes for extended periods. By 2024, the system behaved as storage-limited, and intermittent climatic relief at short scales did not rebuild capacity because multi-season memory and operations had locked in a low-storage state.

The diagnostics are consistent with this progression. Coupling between SRSI and SPEI is strongest and most stable at 24 to 36 months with short lags of about zero to two months, reflecting the multi-season integration of reservoir systems, while 9 to 12 months best capture onset timing. Framed as onset at 9 to 12 months, operations and carryover at 12 to 24 months with SRSI, and persistence at about 36 months, the workflow explains why territories under similar meteorology can exhibit markedly different service outcomes. The method yields decision-ready outputs, including SRSI thresholds for restriction staging and carryover targets to protect next-season resilience, and it is reproducible and transferable to other Mediterranean, reservoir-dominated basins.

How to cite: Boulariah, O., Viola, F., and Deidda, R.: From drought to systemic shortage: a storage-aware diagnostic (SPI/SPEI–SRSI) for the interconnected Flumendosa system, Sardinia (1950–2024), EGU General Assembly 2026, Vienna, Austria, 3–8 May 2026, EGU26-19162, https://doi.org/10.5194/egusphere-egu26-19162, 2026.

EGU26-19634 | ECS | Orals | HS4.2

On the Value of Graph Attention Network for Interpretable Drought Forecasting 

Ye Tuo, Moritz Wirthensohn, Xiaoxiang Zhu, Jian Peng, and Markus Disse

Machine learning is now widely used for environmental forecasting. Although predictive skill often varies only modestly across architectures, interpretability remains a persistent challenge, reducing transparency and limiting stakeholders’ ability to understand model behavior, build trust, and apply forecasts in practice. Balancing accuracy and interpretability are therefore essential for scientific credibility and real-world decision-making. In this context, Graph Attention Network (GAT) is particularly promising. Graph representations encode spatial dependencies and capture complex non-Euclidean relationships, such as upstream–downstream hydrological connectivity or large-scale teleconnections, that conventional grid-based models often struggle to represent. Attention mechanisms then adaptively weight information from different neighbors, helping the model focus on the most informative signals while offering a transparent view of which connections drive each prediction. Here, we evaluate the transferability and representational capacity of GAT for soil-moisture drought forecasting by modeling hydrological response units (HRUs) as nodes in a soil-moisture interdependence graph that preserves connectivity between locations. Beyond predictive accuracy, our analyses show that the model learns stable, physically meaningful relationships and yields interpretable hydrological insights. Feature-importance results reveal consistent links between key predictors and drought dynamics across both space and time. Attention diagnostics indicate pronounced seasonality: weights respond to the relative variability of source-node inputs, producing alternating dominance of high- and low-elevation sources between winter and summer. Spatially, the model consistently prioritizes same-elevation connections, suggesting that it internalizes distinct hydrological regimes in its learned representation. We also highlight three ongoing efforts: 1) extending evaluation to additional climatic regions to test transferability; 2) exploring hybrid GAT–sequence architectures to better capture temporal dynamics, while carefully assessing potential trade-offs in systematic, physically meaningful interpretability; and 3) developing an easy-to-use, open-source codebase to support broader use and reproducibility.

How to cite: Tuo, Y., Wirthensohn, M., Zhu, X., Peng, J., and Disse, M.: On the Value of Graph Attention Network for Interpretable Drought Forecasting, EGU General Assembly 2026, Vienna, Austria, 3–8 May 2026, EGU26-19634, https://doi.org/10.5194/egusphere-egu26-19634, 2026.

EGU26-20109 | ECS | Orals | HS4.2

Evaluating probabilistic distributions for drought forecasting system in the Netherlands 

Rhoda A. Odongo, Samuel J. Sutanto, Hester Biemans, and Spyridon Paparrizos

In the Netherlands, flood forecasting and early warning systems are well established and operationally embedded. However, despite an increasing frequency of drought events and impacts over the past decades, drought early warning systems remain comparatively less developed. This gap is critical, as growing climate variability is expected to intensify agricultural, ecological, and hydrological stress even in temperate regions. Standardized drought indices such as the Standardized Precipitation Index (SPI) and Standardized Streamflow Index (SSI) provide an established framework for drought monitoring and forecasting, but they strongly depend on the underlying probability distributions used to represent hydroclimatic variability and extremes. Poor distribution choices can distort index values and reduce forecast reliability, especially for moderate to extreme drought events.

In this study, we develop an enhanced drought early warning approach for the Netherlands using SPI (1-, 3-, 6-, and 12-month) and SSI (1- and 3-month) accumulation periods. Forecasts are derived from the operational European Flood Awareness System (EFAS) and ECMWF SEAS5 seasonal predictions. Reference indices are computed from historical precipitation and streamflow using ERA5-Land and EFAS datasets. For each grid cell, candidate distributions are fitted to accumulated monthly variables, and the dominant distribution is selected for standardization. To ensure the selected distributions remain valid under forecast conditions, we evaluate distribution performance using ECMWF hindcasts, applying a lead-month climatology framework (fitting and testing distributions per initialization month and lead time). Forecast indices are then evaluated against reference indices.

The use of correct distributions is expected to improve SPI/SSI forecast performance and enhance skill in predicting moderate to extreme drought events, particularly at short to medium lead times. This work supports operational integration of drought early warning into the Dutch forecasting center.

How to cite: Odongo, R. A., Sutanto, S. J., Biemans, H., and Paparrizos, S.: Evaluating probabilistic distributions for drought forecasting system in the Netherlands, EGU General Assembly 2026, Vienna, Austria, 3–8 May 2026, EGU26-20109, https://doi.org/10.5194/egusphere-egu26-20109, 2026.

EGU26-20246 | Orals | HS4.2

Advances in drought monitoring using an operational hydrological model 

Andrea Ficchì, Davide Bavera, Stefania Grimaldi, Francesca Moschini, Alberto Pistocchi, Carlo Russo, Cinzia Mazzetti, Michel Wortmann, Christel Prudhomme, Peter Salamon, and Andrea Toreti

Recent improvements of the hydrological, open source (OS) LISFLOOD model aimed to support both flood- and drought-related applications. The latest model upgrades are very promising for drought monitoring use cases, for which the sources of improvements can be grouped into four main areas: (i) updated meteorological forcings improving the quality of the gridded model inputs; (ii) revised static maps providing an improved representation of catchment morphology and soil properties; (iii) structural model revisions that enhance the physical consistency of simulated water fluxes; and (iv) the adoption of a new calibration objective function, the Joint Divergence Kling–Gupta Efficiency (JDKGE), which improves low-flow performance while maintaining or improving accuracy for high flows compared to the previous calibration using the Kling–Gupta Efficiency.

In this study, we evaluate the cumulative effect of these developments with a focus on drought monitoring and forecasting applications. Using multi-source observational data and different benchmarking strategies, we evaluate the accuracy and physical consistency of the new operational LISFLOOD model setup of the European and Global Flood Awareness Systems (EFAS version 6 and GloFAS version 5) of the the Copernicus Emergency Management Service (CEMS). The evaluation focuses on two key hydrological variables for drought monitoring, namely river flows and soil moisture, at the European and global scale. Beyond the two raw variables, we examine the performance of drought indicators, including the Low Flow Index and Soil Moisture Index from the European and Global Drought Observatories (EDO and GDO), and assess their ability in detecting drought events, using both hazard observations and impact data as reference. Results from long-term simulations show substantial improvements in drought detection thanks to the new developments in OS LISFLOOD and associated CEMS setups. Similar improvements in drought forecasting skill are also anticipated and will be investigated in further work.

How to cite: Ficchì, A., Bavera, D., Grimaldi, S., Moschini, F., Pistocchi, A., Russo, C., Mazzetti, C., Wortmann, M., Prudhomme, C., Salamon, P., and Toreti, A.: Advances in drought monitoring using an operational hydrological model, EGU General Assembly 2026, Vienna, Austria, 3–8 May 2026, EGU26-20246, https://doi.org/10.5194/egusphere-egu26-20246, 2026.

Drought is defined in a variety of different ways. One method is through the use of the SPEI (Standardised Precipitation and Evapotranspiration Index) derived from the HadUK4 by the UK CEH (Centre for Ecology and Hydrology) and made available at 1km for the UK only and globally through a new product, the Global Multi-Index Drought (GMID) at 0.1º . After an exhaustive test of various dependent variables, three variables were chosen for deep learning training, 1km LST from the VIIRS instrument onboard the NASA-NOAA satellites is combined with Precipitation and Soil-evapotranspiration monthly datasets then downscaled to 1km from 0.1º to train a deep learning model to forecast 1 km SPEI. These forecasts can then be compared with the aforementioned 1km (UK only) and 0.1º (UK, Ireland and France) SPEI and GMID datasets respectively. Examples will be shown of the UK , Ireland and France regions. Farmers, NGOs, government scientists and policy makers require drought forecasts at near human scale and as far ahead as possible for water conservation planning. These 1km results need to be downscaled to human level at 10m.

An unique processing system for generating 10m spectral and broadband albedo which is part of the Copernicus Global Land Monitoring Service called S2GM (Sentinel-2 Global Mosaic) has been employed to generate 10m products [1,2]. From these spectral albedos, simple vegetation indices such as NDVI can be derived over a monthly time period and NDVI can be employed to downscale the 1km forecasts up to 10m. This application of a composited product eliminates the problems of cloud cover at mid-latitudes which Sentinel-2 sampling every 5-daily has. Examples from the 2022 and 2025 droughts will be shown for the UK, Ireland and France (UKIF). The monitoring of drought through the water extent of reservoirs using S2GM monthly composite spectral albedos will also be shown as an independent method of drought assessment.

The GTIF-UKIF drought capability results will be shown in the context of crop-type and vegetation productivity at the 10m level using an unique webGIS system developed for all the Green Transition Information Factory (GTIF) capabilities (gtif-uk-ireland-france.net). These results indicate that this drought monitoring and forecasting method may have the potential to be rolled out across the rest of Europe and southwards across Africa to provide forecasts 3-6 months ahead of a drought.

The authors would like to thank ESA for contract no. 4000144118/24/I-NS, Burak Bulut of UK CEH for the SPEI and GMID datasets and Gillian Watson for the NDVI processing and downscaling of the SPEI.

Cited references
[1] Muller J.P., Song R. Brockley D., Whillock M., 2023. Sentinel-2 Global Mosaic HR-Albedo Algorithm Theoretical Basis Document S2GM-UCL-ATBD-v3.1 https://s2gm.land.copernicus.eu/help/documentation

[2] Muller, J-P., Song, R., Griffiths, P., 2025. Bi-facial PV solar power systems for mixed use of arable and grassland, an evaluation over GB and Ireland taking into account environmental exclusion areas. DOI: 10.5194/egusphere- EGU25-18951 

How to cite: Muller, J.-P., Song, R., and Griffiths, P.: Forecasting drought using SPEI at the 10m level with ERA5 and Sentinel-2 spectral albedo products as part of ESA-GTIF project for the UK, Ireland and France., EGU General Assembly 2026, Vienna, Austria, 3–8 May 2026, EGU26-20482, https://doi.org/10.5194/egusphere-egu26-20482, 2026.

EGU26-21651 | ECS | Orals | HS4.2

Assessment of the potential of combined geodetic-based drought indices for studying climate change in Europe 

Artur Lenczuk, Christopher Ndehedehe, Anna Klos, and Janusz Bogusz

Europe is undergoing increasingly extreme events, especially droughts that have become more frequent and severe. The observed conditions lead to water scarcity, agricultural impacts, and river flow issues, with projections indicating worsening conditions despite some regional variability. It is therefore crucial to find methods that can monitor drought conditions such as intensity, categories, and patterns, and that can assess the pacing of those changes over Europe. In recent years, there is an increasing application of geodetic techniques such as the Gravity Recovery and Climate Experiment (GRACE) and the Global Positioning System (GPS) in hydroclimatic research that enable monitoring of the continental water storage and Earth's displacement by observing the gravity field variations or the changes in the position of permanent stations, respectively. The recalculation of these changes into Drought Severity Index (DSI) provides a successful method for studying drought characteristics. However, limitations of both techniques, such as GRACE signal leakage and systematic errors of GPS, do not allow for an unambiguous assessment of drought. Thus, in our study, we overcome the limitations of both geodetic techniques by calculating a Multivariate DSI (MDSI) based on a combination of time series using the Frank copulas concept. We focus on emphasizing the potential of MDSI in describing drought characteristics compared to GRACE-DSI and GPS-DSI, as well as the sensitivity of DSIs to regional and local hydroclimatic and hydrometeorological changes recorded in Europe. In view of the sensitivity of both techniques to different temporal signals, we also take a step further by defining a new modified MDSI (mMDSI), which is the next step in climate change research. We divide GRACE-derived and GPS-observed displacement series into three temporal scales, i.e., short-term, seasonal, and long-term, which we then convert to DSI. The total mMDSI is defined as a combination of various temporal signals of GRACE-DSI and GPS-DSI. We perform spatial and temporal analyses to identify patterns of climate change, e.g., wetting/drying hotspots, and assess the reliability of mMDSI/MDSI by comparison with various meteorological and hydrological datasets. We prove that MDSI and mMDSI are key methods for decision-makers that may be applied in establishing preventive strategies to mitigate the effects of droughts in regions indicating ‘warning’ conditions.

How to cite: Lenczuk, A., Ndehedehe, C., Klos, A., and Bogusz, J.: Assessment of the potential of combined geodetic-based drought indices for studying climate change in Europe, EGU General Assembly 2026, Vienna, Austria, 3–8 May 2026, EGU26-21651, https://doi.org/10.5194/egusphere-egu26-21651, 2026.

EGU26-22001 | Posters on site | HS4.2

Changes in water balance, drought and aridity over Romania since 1901 

Marius-Victor Birsan, Diana Dogaru, and Laura Lupu

Drought assessment in Romania since 1961 is well documented. However, studies coveringing longer time intervals in the region are scarce, and employ either modeled or sparse observational data. This study presents a 123-year analysis of water balance, drought and aridity over Romania using monthly, homogenized data from 156 meteorological stations belonging to the RoCliHom dataset. Drought is analyzed by means of two well known indices, namely the Standardized Precipitation Index (SPI) and the Standardized Precipitation Evapotranspiration Index (SPEI). Changes in aridity are investigated with the De Martonne Aridity Index. The non-parametric Mann-Kendall test is used for trend detection – which allows a direct comparison with the vast majority of studies on aridity and drought over the Romanian territory. Trend magnitude is computed with Sen's slope estimator (also known as Kendall-Theil robust line). 

How to cite: Birsan, M.-V., Dogaru, D., and Lupu, L.: Changes in water balance, drought and aridity over Romania since 1901, EGU General Assembly 2026, Vienna, Austria, 3–8 May 2026, EGU26-22001, https://doi.org/10.5194/egusphere-egu26-22001, 2026.

EGU26-22079 | ECS | Orals | HS4.2

Improving Long-term Drought Forecasting with a novel Hybrid Deep Learning model based on Standardized Groundwater Level Index 

Sandeep Samantaray, Abinash Sahoo, and Deba P Satapathy

Among other water resources, surface water, subsurface water, groundwater, and water supply are all adversely impacted by drought, a natural occurrence. As a type of hydrological drought, groundwater drought reflects both the unique features of the aquifer and human caused disturbances to the hydrological system. It is evident that human activity has both direct and indirect effects on the worsening of groundwater drought. Groundwater withdrawals are frequently used to meet water needs during hydrological and agricultural droughts because groundwater storage offers resilience. As a result, excessive groundwater extraction may make drought more severe. Quantitatively characterizing groundwater drought is extremely difficult due to the complex nature of groundwater flow systems and the difficulties in obtaining field observations pertaining to aquifers. By offering early warnings, long-term drought forecasting is essential to reducing drought risks.

Accurate long-term drought forecasting has long been of interest to researchers, but it is difficult because accuracy typically declines with forecasting period. This study's main goal is to present a novel hybrid deep learning model, Deep Feedforward Natural Networks (DFFNN), improved by War Strategy Optimization (WSO), for high accuracy long lead time drought forecasting. One of the vital aquifers in Odisha (Keonjhar district) was monitored for groundwater drought using the Standardized Groundwater Level Index (SGI), and forecasts were made for a range of lead times, including 1, 3, 6, 9, 12, and 24 months. For this study, monthly groundwater level data from 10 observation wells over a 25-year period (1996–2021) were collected. The observation wells were chosen based on their uniform distribution within the aquifer area and the completeness of their data records. The WSO algorithm was used to optimize important DFFNN parameters, such as the number of neurons and layers, learning rate, training function, and weight initialization. Two well known optimizers, Particle Swarm Optimization (PSO) and Grey Wolf Optimization, were used to validate the model's performance. 

Outcomes revealed that DFFNN-WSO model attained superior performance for SGI 24 (t + 12) with a coefficient of determination (r2) of 0.9847, Root Mean Square Error (RMSE) of 0.1035, willmott index of agreement (IoA) of 0.9812; for SGI 24 (t + 9) with r2 = 0.8965, IoA = 0.8906 and RMSE = 0.1942; for SGI 12 (t + 6) with r2 = 0.8473, IoA = 0.8352 and RMSE = 0.2315; for SGI 24 (t + 3) with r2 = 0.7915, IoA = 0.7846 and RMSE = 0.2693; and for SGI 24 (t + 1) with r2 = 0.7725, IoA = 0.7642 and RMSE = 0.3187 at the W5 station. Analysis of results indicated that DFFNN-WSO model outperformed all applied models consistently at all locations, and it considerably enhanced drought forecasting accurateness, with highest improvements for SGI 24 (t + 12) and moderate gains for SGI 24 (t + 1). The suggested model is a useful tool for real time drought monitoring and management since it offers precise and timely drought predictions, allowing for well-informed decision making to lessen the effects of drought.  

Keywords: Deep Feedforward Natural Networks (DFFNN); War Strategy Optimization; Standardized Groundwater Level Index (SGI); Water scarcity; Keonjhar

How to cite: Samantaray, S., Sahoo, A., and Satapathy, D. P.: Improving Long-term Drought Forecasting with a novel Hybrid Deep Learning model based on Standardized Groundwater Level Index, EGU General Assembly 2026, Vienna, Austria, 3–8 May 2026, EGU26-22079, https://doi.org/10.5194/egusphere-egu26-22079, 2026.

EGU26-2058 | PICO | HS4.4

An operational basin-scale flood forecasting and dynamic risk analysis system: a case study from Sichuan Province, China 

Tuo Wang, Daling Cao, Wenjie Jiang, Hongtao Wan, Zhigang Wang, and Qiaoting Qin

Since the launch of the national integrated natural disaster risk survey in 2022, followed by the flood risk mapping programme in 2025, an integrated basin-scale flood forecasting and risk analysis framework has been progressively developed to support operational flood warning and risk management in Sichuan Province. The framework integrates a multi-source refined database, basin-scale coupled hydrological–hydrodynamic models, and an operational dynamic flood simulation platform for major rivers.

At the data level, GIS and BIM technologies are integrated to construct L1–L3 refined three-dimensional databases for key basins, integrating fundamental geographic information, socio-economic and POI data, flood hazard investigation results, inundation extents for typical return periods, risk zoning products, as well as building distributions, oblique photography, BIM models, and near-real-time rainfall and hydrological observations. This results in a unified, updatable data foundation that supports operational flood simulation and loss assessment.

At the modelling level, an integrated basin-scale hydrological modelling system is coupled with one- and two-dimensional hydrodynamic models. By using meteorological forecasts as forcing, the system supports end-to-end simulation from forecast precipitation, through rainfall–runoff generation, to river flood routing, thereby enhancing temporal continuity and spatial accuracy for operational flood forecasting.

At the application level, an operational dynamic flood simulation and analysis platform has been developed for major rivers. Under operational conditions, the platform integrates real-time and forecast data to support multi-area and multi-scenario flood simulations, prediction of water levels and discharge at key cross-sections, and assessment of inundation extent and potential losses. The platform provides technical support for flood warning issuance, emergency evacuation, and risk management decision-making. It has been operationally deployed in the Minjiang, Dadu, Tuojiang, Fujiang, and Qujiang river basins, and is currently being extended to the Jialing and Qingyi river basins.

How to cite: Wang, T., Cao, D., Jiang, W., Wan, H., Wang, Z., and Qin, Q.: An operational basin-scale flood forecasting and dynamic risk analysis system: a case study from Sichuan Province, China, EGU General Assembly 2026, Vienna, Austria, 3–8 May 2026, EGU26-2058, https://doi.org/10.5194/egusphere-egu26-2058, 2026.

EGU26-2210 | PICO | HS4.4

Flood risk management at municipality level in Navarra, northern Spain. 

Javier Loizu, Luis Sanz, Ana Varela, Eva Zaragüeta, Ana Castiella, and Arantxa Ursua

In Navarra - a 10,000 km² region in northern Spain with 700,000 inhabitants - 50 municipalities are required to implement a local plan for flood risk management.

The Regional Flood Risk Management Plan of Navarra identifies these 50 municipalities based on their level of risk. It also establishes the structure of each local plan, which must follow four standardized documents.

Municipal plans include one pre-emergency level and four emergency levels: 0, 1, 2, and 3. The pre-emergency level does not necessarily need to be communicated to the public. The emergency levels are defined as follows:

  • Level 0: Flooding has not yet begun, but streamflow has significantly increased.
  • Level 1: Expected flooding will affect low-lying areas near riverbanks.
  • Level 2: Severe damage is expected in urban areas.
  • Level 3: The regional government assumes control of the local plan because the situation exceeds local capacity.

The activation of each emergency level of the plan has to be communicated to the population.

To prepare a plan, we visit each municipality and hold technical meetings with local authorities and staff, including the local police. We inspect strategic locations where local resources have historically acted to minimize flood damage. Typical actions include door-to-door warnings, street closures, and on-site alerts in public buildings such as schools or nursing homes.

The most critical task in drafting the plan is defining the thresholds that trigger each emergency level. These thresholds are based on historical rainfall and streamflow data within the river catchment. Usually, streamflow data from upstream measuring stations is used, while in small catchments, accumulated rainfall over a specific time period is also considered.

Once the paper version of the plan is complete, it is transferred to a digital platform that enables coordinated operations by local authorities (mayors and other officials) and staff. This platform includes both a mobile app and a web-based interface, offering:

  • Real-time data updates every 10–15 minutes (from different observing networks: regional government, Spanish Meteorological Agency, Water Agencies, etc.).
  • Easy activation of emergency levels.
  • GIS maps showing the location of all planned actions.
  • A mass SMS alert system for rapid communication with the population using predefined messages.

Since 2018, technicians from the Government of Navarra and Orekan have worked to implement these operational and consistent structures. They are based on local knowledge gathered from municipal staff, site visits, and collaborative planning. Information about the plans is shared with residents through detailed leaflets and public information sessions in each municipality.

How to cite: Loizu, J., Sanz, L., Varela, A., Zaragüeta, E., Castiella, A., and Ursua, A.: Flood risk management at municipality level in Navarra, northern Spain., EGU General Assembly 2026, Vienna, Austria, 3–8 May 2026, EGU26-2210, https://doi.org/10.5194/egusphere-egu26-2210, 2026.

Every week, somewhere on our planet, people die in a flood. We can now predict many types of floods well before any rain has even fallen, or the storm has even begun to form. We have spent billions of Euros setting up sophisticated flood prediction systems that undertake billions of calculations to predict when and where floodwaters will be. But what is the point of all of this if nobody can understand the danger that they are in, or imagine their homes and lives swept away? The floods in Germany in 2021 and in Valencia in September 2024 showed failures to prevent deaths. But was this a failure of forecasting science, or a failure of imagination?

How to cite: Cloke, H.: Preparing for floods in an uncertain future: forecasting, warning and imagination, EGU General Assembly 2026, Vienna, Austria, 3–8 May 2026, EGU26-2765, https://doi.org/10.5194/egusphere-egu26-2765, 2026.

EGU26-3982 | ECS | PICO | HS4.4

Building a National Operational Flood Forecast System for Denmark: Evaluating Top-Down vs. Bottom-Up and Process-Based vs. Data-Driven Modeling Strategies  

Conrad Brendel, Grith Martinsen, Raphaël Payet-Burin, Sanita Dhaubanjar, Cecilie Thrysøe, Lucas Dalgaard Jensen, Phillip Aarestrup, Maggie H. Madsen, Jonas W. Pedersen, Charlotte A. Plum, Emma D. Thomassen, René Capell, Jafet Andersson, and Michael Butts

The construction of three separate national-scale flood forecast models for the operational flood forecast system for Denmark presents a unique opportunity to compare “top-down” vs. “bottom-up” modeling approaches and “process-based” vs. “data-driven” model types. To implement an operational flood forecast model for Denmark as quickly as possible, a “top-down” process-based hydrological model (E-HYPE DK) was first extracted from the pan-European E-HYPE model developed from European and global data sources. A separate process-based model, DK-HYPE, as well as a data-driven model, DK-LSTM, were developed for Denmark from the “bottom-up” using national data sources combined with high-resolution catchment delineations and more detailed model process representations.

Evaluation of the two modeling approaches showed a trade-off between time invested and societal benefit. Overall, the top-down E-HYPE DK model provided benefit early in the project by providing rapid access to model results which could be used to guide the development of the entire forecast chain and warning system. In contrast, the bottom-up DK-HYPE model developed later in the project, provided better model performance and higher-resolution outputs than the top-down model but required longer time to develop and deploy. While the addition of local high resolution forcing data and hydrological properties in DK-HYPE certainly contributed to the improved performance, changing the representation of groundwater process better captured the importance of surface water-groundwater interactions in Danish river systems. 

Results from the project also highlighted trade-offs between the process-based and data-driven models. Compared to the process-based HYPE models, the data-driven DK-LSTM model required the shortest time for development and offered the best match between simulated and observed discharges. However, the data-driven model had difficulty in making predictions for events outside the training conditions (e.g. storms with unusually high precipitation) and did not provide information about internal variables that are provided by the process-based models (e.g. local runoff and soil moisture) which can be valuable for operational decision making.

The DK-HYPE model is now operational, providing public warnings for high river flows. The DK-LSTM is currently used as a supporting model during warning situations.

How to cite: Brendel, C., Martinsen, G., Payet-Burin, R., Dhaubanjar, S., Thrysøe, C., Dalgaard Jensen, L., Aarestrup, P., H. Madsen, M., W. Pedersen, J., A. Plum, C., D. Thomassen, E., Capell, R., Andersson, J., and Butts, M.: Building a National Operational Flood Forecast System for Denmark: Evaluating Top-Down vs. Bottom-Up and Process-Based vs. Data-Driven Modeling Strategies , EGU General Assembly 2026, Vienna, Austria, 3–8 May 2026, EGU26-3982, https://doi.org/10.5194/egusphere-egu26-3982, 2026.

EGU26-4632 | PICO | HS4.4

Impact-based forecasting of river floods in a Peruvian Andean-Amazonian basin: first results in the Madre de Dios River, Peru. 

Waldo Lavado-Casimiro, Danny Saavedra, Renato Collado, Cristian Montesinos, Oscar Felipe, and Haris Sanahuja

Impact-based forecasting (IBF) represents a significant advance in disaster risk management when considering the vulnerabilities of the population, livelihoods and exposed assets. In this paper we present the scaling up of PANDORA, an IBF tool developed for the Andean-Amazonian region of Peru, using the Madre de Dios River (MDR) as a case study. This initiative is in the framework of the BID Project: Hydrological and hydrodynamic monitoring and forecasting system for river floods in the Andean-Amazonian region of Peru, Ecuador and Bolivia.
PANDORA integrates a large-scale hydrological-hydrodynamic model (MGB) with precipitation forecasts, generating probabilistic flow projections with a five-day horizon. These forecasts are contrasted with flood thresholds associated with return periods of 2, 5 and 10 years, corresponding to moderate, severe and extreme levels of severity, respectively. 
The intersection between the potentially flooded areas and the exposed elements (population, educational and health centres, transport routes and agricultural areas) allows us to estimate impacts at different political and administrative levels. Given the limited availability of hydrometeorological data in the MDR region, altimetry satellite information was incorporated to improve the performance and validation of the MGB model. The system was evaluated against the flood event recorded in February 2021, obtaining satisfactory results despite the limitations identified. Overall, PANDORA shows a high potential to support local decision-making in flood risk management using IBF.

How to cite: Lavado-Casimiro, W., Saavedra, D., Collado, R., Montesinos, C., Felipe, O., and Sanahuja, H.: Impact-based forecasting of river floods in a Peruvian Andean-Amazonian basin: first results in the Madre de Dios River, Peru., EGU General Assembly 2026, Vienna, Austria, 3–8 May 2026, EGU26-4632, https://doi.org/10.5194/egusphere-egu26-4632, 2026.

Since the early 2020s, artificial intelligence (AI) has gained substantial attention across both industry and academia. In the field of water resources, AI-based approaches for improving the prediction of floods, water supply, droughts, and related hydrological phenomena have been actively explored. More recently, the emergence of agentic AI, in which large language models (LLMs) orchestrate multiple AI tools for analysis, prediction, and operational services, has attracted increasing attention.

Despite these advances, most research efforts remain focused on model development, while the establishment of sustainable operational systems, such as those enabled by machine learning operations (MLOps), remains limited. This gap is particularly evident in water resources applications, where continuous retraining, performance evaluation, and system-level reproducibility are critical for real-world deployment.

In this study, we propose NeuralRiverOps, an operational framework that integrates MLOps and agentic AI for multi-point flood prediction in large-scale river basins using long short-term memory (LSTM) networks. First, we design a workflow that supports sequential model development and prediction from upstream to downstream and from tributaries to main streams, leveraging the neuralhydrology Python library as the core modeling engine. Second, to enable systematic model retraining, storage, inference, and performance evaluation, we construct an MLOps pipeline based on MLflow. PostgreSQL is employed for structured time-series data management (e.g., rainfall, dam releases, and river water levels), while MinIO is used for scalable object storage, such as trained LSTM models. Furthermore, we develop an agentic AI system that allows users to interactively invoke the MLOps pipeline through a chat-based interface. This system is implemented using Ollama as an open-source LLM platform and OpenWebUI as the conversational interface. All components - including AI models, MLflow, PostgreSQL, MinIO, Ollama, and OpenWebUI - are containerized and orchestrated using Docker Compose to enhance computational reproducibility, scalability, and maintainability.

The proposed framework demonstrates a practical architecture for integrating agentic AI into analytical systems and highlights the essential role of MLOps in the sustainable operation of AI models for disaster preparedness, such as flood and drought forecasting. This study provides a pathway for future research to move beyond isolated model development toward robust, operational AI systems supported by MLOps and agentic AI.

How to cite: Choi, Y., Yang, H., Kim, S., and Ryu, J.: NeuralRiverOps: An Operational Framework for Implementing MLOps and Agentic AI in LSTM-based Flood Forecasting for Large-scale River Basins, EGU General Assembly 2026, Vienna, Austria, 3–8 May 2026, EGU26-6212, https://doi.org/10.5194/egusphere-egu26-6212, 2026.

EGU26-6332 | PICO | HS4.4

An Operational Flash Flood Early Warning System for the Kingdom of SaudiArabia 

Giulia Sofia, Emmanouil Anagnostou, Platon Patlakas, Ioannis Chaniotis, Zaphiris Christidis, Andreas Kallos, Syed Zaidi, Fawaz Mohammed Alzabari, and Mohammed Ahmed Alomary

Extreme rainfall events can trigger flash floods that pose serious risks to communities, infrastructure, and critical services, particularly in arid and rapidly urbanizing environments. In the Kingdom of Saudi Arabia, short hydrological response times, strong spatial variability of precipitation, complex topography, and limited observational data significantly challenge flood early warning capabilities, which affect emergency management at the national scale. Addressing these challenges requires integrated and scalable hydro-meteorological forecasting systems capable of operating across large spatial domains while resolving convective weather events and associated localized flood impacts in urban/suburban areas.
This study presents a nationwide, operational flash flood early warning system developed for the Kingdom of Saudi Arabia. The system is designed to provide consistent coverage across the country while capturing fine-scale weather, hydrological and hydrodynamic processes relevant to flash flooding in arid environments. It operates over 137 hydrological domains, representing more than 6,000 outlets, delivering 2D flood simulations at a spatial resolution of 30 m nationwide, with enhanced resolution of up to 2.5 m in selected urban areas.
The forecasting framework is structured as an end-to-end modeling chain that links atmospheric forcing, hydrological response, hydraulic flood propagation, and infrastructure impacts. High-resolution numerical weather predictions generated by the Weather Research and Forecasting (WRF) model are combined with real-time radar and rain gauge observations to produce hourly ensemble weather and precipitation forecasts and hindcasts. These meteorological inputs drive a distributed hydrological model (CREST), which simulates runoff generation across arid catchments using spatially explicit information on topography, land cover, soil properties, and drainage networks. A reservoir management module is fully integrated within the modeling chain, allowing the system to account for reservoir storage dynamics, controlled releases, and spillway operations, and to assess the influence of dam infrastructure on downstream flood evolution.
Hydrological outputs are used as boundary conditions to a two-dimensional hydrodynamic model, which simulates floodplain dynamics, water depths, and inundation extents.
All model components are coupled within a WebGIS-based operational platform that displays deterministic and ensemble weather and hydrologic forecasts, probabilistic flood warnings, and real-time nowcasting products. Flood hazard information is delivered through interactive maps, warning levels, and time series, to support decision- making by civil protection authorities and emergency managers at national and local scales.
The functionality and operational performance of the system are demonstrated through its application on a recent extreme rainfall and flash flood events that affected the entire region of Saudi Arabia in the period of December 9-16, 2025. The system successfully captured the timing, spatial extent, and severity of flooding across multiple domains, providing useful lead times and high-resolution inundation maps. This case study highlights the robustness, scalability, and operational value of the framework, demonstrating its potential to enhance flood preparedness through early warning, and risk management across the Kingdom of Saudi Arabia under increasing hydro- meteorological extremes.

How to cite: Sofia, G., Anagnostou, E., Patlakas, P., Chaniotis, I., Christidis, Z., Kallos, A., Zaidi, S., Alzabari, F. M., and Alomary, M. A.: An Operational Flash Flood Early Warning System for the Kingdom of SaudiArabia, EGU General Assembly 2026, Vienna, Austria, 3–8 May 2026, EGU26-6332, https://doi.org/10.5194/egusphere-egu26-6332, 2026.

EGU26-7569 | PICO | HS4.4

Seasonal forecast of streamflow and suspended sediment in the Blue Nile Basin, Ethiopia 

Axel Bronstert, Morteza Zargar, Till Francke, Worku Kindie, Fasikaw Zimale, and Kunstmann Harald

The demand for seasonal hydrologic forecasts is significant and various applications for water resources management are increasing. Since some years, the lead time is going up to several months or a season. However, the uncertainty is also increasing with lead time.

We assess the potential of seasonal streamflow and sediment forecasting as a tool for management of water resources and sediment flow in the Upper Blue Nile Basin (UBNB) of Ethiopia, upstream the GERD (Great Ethiopian Renaissance Dam). A coupled hydro-meteorological seasonal forecasting system requires a performance evaluation of both numerical weather prediction (NWP) models and hydrological models to accurately represent atmospheric and hydrological conditions. We evaluate the ECMWF-SEAS5 precipitation product in conjunction with the large-scale process-oriented hydro-sedimentological model WASA-SED. The aim is to generate forecasts for streamflow and suspended sediment fluxes with a lead time of up to seven months for the UBNB.

Three different large-scale rainfall “products” were tested and compared ref. their representativity of observed rainfall. We show that such a rainfall evaluation is indispensable for hydrological simulation as well as for seasonal forecasting. We consider this step a “hydrological verification” of rainfall data.

Seasonal streamflow and sediment flux data were than forecasted for June to December of the year, based on the seasonal meteorological forecast in the preceding month. An ensemble of 51 regional meteorological forecast members in daily resolution and 7 months lead time, each initiating on the first day of each month, was used. A post-processing step with an autoregressive model was applied to adjust for forecast biases in seasonal streamflow predictions. Results indicate that the coupled meteorological/hydrological models skilfully predict rainfall and discharge on a seasonal scale for the Blue Nile Basin.

How to cite: Bronstert, A., Zargar, M., Francke, T., Kindie, W., Zimale, F., and Harald, K.: Seasonal forecast of streamflow and suspended sediment in the Blue Nile Basin, Ethiopia, EGU General Assembly 2026, Vienna, Austria, 3–8 May 2026, EGU26-7569, https://doi.org/10.5194/egusphere-egu26-7569, 2026.

EGU26-10194 | ECS | PICO | HS4.4

Machine-learning Identification of Critical Sub-Basins for Optimized FEWS Design 

Mahtab Helmi, Francesco Cappelli, Mahdi Dastourani, Manfred Kleidorfer, and Salvatore Grimaldi

Flood Early Warning Systems (FEWS) are among the most effective non-structural measures for reducing flood risk, particularly in data-scarce regions with rapid hydrological responses. However, designing efficient FEWS requires balancing forecasting skill with the economic costs of dense monitoring networks. Identifying the most influential observation points is therefore essential for reliable flood forecasting with minimal instrumentation.

In this study, we propose a data-driven framework to identify critical sub-basins whose monitoring provides the greatest benefit for flood early warning. The framework integrates long-term stochastic rainfall simulation, semi-distributed hydrological modeling, machine learning, and feature importance analysis. High-resolution synthetic rainfall time series are generated using a multifractal-based stochastic approach and used to drive a hydrological model, resulting in an extensive virtual database of flood events across multiple sub-basins. Simulated sub-basin discharges are then used as predictors in a Random Forest model to forecast outlet discharge at different lead times.

Feature Importance Measures (FIM) quantify the relative contribution of each sub-basin to flood forecasting performance, enabling identification of a reduced set of hydrologically dominant sub-basins. The methodology is demonstrated in the semi-arid, mountainous Torghabeh River Basin (northeastern Iran), where limited hydrometric infrastructure and short response times pose significant challenges for flood monitoring. Results show that only a subset of sub-basins exerts dominant control on outlet flood response, while many others contribute marginally. The identified influential sub-basins vary with the forecasting lead time, highlighting the importance of tailoring FEWS design to operational objectives.

Overall, the proposed framework offers a flexible approach for optimizing FEWS design, supporting evidence-based decisions on sensor placement and providing new insights into the internal organization of flood-generating processes.

How to cite: Helmi, M., Cappelli, F., Dastourani, M., Kleidorfer, M., and Grimaldi, S.: Machine-learning Identification of Critical Sub-Basins for Optimized FEWS Design, EGU General Assembly 2026, Vienna, Austria, 3–8 May 2026, EGU26-10194, https://doi.org/10.5194/egusphere-egu26-10194, 2026.

EGU26-11763 | PICO | HS4.4

Operational data assimilation of Earth observation hydrological data across contrasted river basins: insights from the SEED-FD project 

Vanessa Pedinotti, Malak Sadki, Osvaldo Luis Barresi, Nicola Martin, and Yonas Alim

Operational hydrological forecasting systems still suffer from uneven performance across regions, particularly in data-scarce environments, where errors in model states and parameters propagate rapidly and limit short- to medium-range forecast skill. Within the SEED-FD (Strengthening Extreme Events Detection for Floods and Droughts) project, we investigate how multi-source data assimilation strategies can be configured to improve the propagation of observational information into short- to medium-range hydrological forecasts under operational constraints.

We implement and evaluate data assimilation workflows based on an Ensemble Kalman Filter (EnKF) within the GLOFAS system, as used in the Copernicus Emergency Management Service (CEMS) Hydrological Forecast Modelling Chain. Multiple observation types are considered, including in-situ river discharge, satellite-derived discharge and water levels, and altimetric water level observations from Earth Observation (EO) missions. Assimilation experiments are conducted across several contrasted river basins representative of diverse hydro-climatic and socio-environmental conditions, including the Niger, Paraná, and Juba–Shebelle basins.

The analysis focuses on short- to medium-range streamflow forecasts and examines how different assimilation configurations influence the persistence and propagation of corrections beyond the assimilation window. In particular, we compare state-only approaches, including filtering and smoothing strategies, with exploratory joint state-parameter estimation experiments, with the aim of identifying configurations that maximize the temporal impact of observational information while remaining compatible with operational requirements. Ensemble-based methods are employed throughout the study to ensure consistency with probabilistic forecasting frameworks.

This work presents the results of these experiments and discusses key scientific aspects relevant to the design of data assimilation strategies for improving the propagation of corrections in large-scale operational flood and drought forecasting systems.

How to cite: Pedinotti, V., Sadki, M., Barresi, O. L., Martin, N., and Alim, Y.: Operational data assimilation of Earth observation hydrological data across contrasted river basins: insights from the SEED-FD project, EGU General Assembly 2026, Vienna, Austria, 3–8 May 2026, EGU26-11763, https://doi.org/10.5194/egusphere-egu26-11763, 2026.

EGU26-13889 | ECS | PICO | HS4.4 | Highlight

From weather patterns to warnings: supporting multi-day bathing water advisories using synoptic weather regimes  

Karolina Krupska, Linda Speight, James Stephen Robinson, and Hannah Cloke

Climate change is intensifying short-duration heavy rainfall over Northwestern Europe, increasing the frequency of rapid hydrometeorological impacts. These events increase the probability of short-term bathing water (BW) pollution, especially in catchments affected by combined sewer overflows and agricultural runoff. In England, mandatory monitoring of all storm overflows has revealed 450,398 recorded spills in 2024, leaving bathers unacceptably exposed. Coinciding increases in self-reported illness following contact with polluted BW highlight the need to reconsider how BW quality is forecast in the context of increasing extreme rainfall regimes.

Operational BW forecasts in England currently combine radar nowcasts, deterministic (UKV) rainfall forecasts, wind and UV data in a multiple linear regression model. Crucially, the forecast is issued once in the morning and not revised later in the day, even if rainfall forecasts change, providing only static, same-day guidance and constraining bathers’ ability to make informed decisions. While improvements in numerical weather prediction and monitoring remain critical, recent UK bathing water regulatory reforms increase the operational value of anticipating sustained or clustered pollution episodes across the bathing season and beyond, rather than relying on single-day exceedances.

Here we explore the use of synoptic weather patterns as a complementary framework for anticipating multi-day bathing water pollution risk. Synoptic weather patterns describe persistent, physically coherent circulation regimes. They influence not only how much rain falls, but also the type of rainfall (frontal versus convective) and the accompanying conditions (wind, cloud cover and solar irradiance). Using the Met Office 30-class daily weather pattern (WP) catalogue, microbiological data and 1 km Nimrod radar composites for South West England (May–September 2012–2023), we derive daily rainfall depth, intensity and wet fraction and link these, together with WP, to the site-day intestinal enterococci exceedances (IE ≥ 63 cfu/100 mL) used to inform operational advice against bathing.

We collapse 30 synoptic weather patterns into four physically interpretable families: Cyclonic Atlantic (frontal), Showery maritime/unsettled, Convective extremes, and Settled anticyclonic quiet. In observed data, “advice against bathing” varies significantly by family; it is highest under Cyclonic Atlantic and elevated under Showery maritime/unsettled. We use these families to construct plausible bathing water season storylines (persistent wet, persistent dry, dry with storm outbreaks, and transition scenarios wet to dry and dry to wet). For each storyline, we simulate 5,000 May–September seasons by resampling historically observed, physically coherent daily driver “packages”.

Comparing rainfall-only and weather pattern-based statistical models under a fixed advisory frequency shows that pattern-based approaches identify fewer, longer advisory windows, while rainfall-only methods produce shorter, intermittent alerts. In practice, this would mean fewer stop-start bathing advisories and clearer identification of sustained periods when extra attention, sampling, or precautionary messaging is needed. Since weather patterns can often be forecast several days ahead, this suggests that synoptic-scale information can support more actionable multi-day guidance for bathing water management, monitoring, and public communication.

How to cite: Krupska, K., Speight, L., Robinson, J. S., and Cloke, H.: From weather patterns to warnings: supporting multi-day bathing water advisories using synoptic weather regimes , EGU General Assembly 2026, Vienna, Austria, 3–8 May 2026, EGU26-13889, https://doi.org/10.5194/egusphere-egu26-13889, 2026.

EGU26-15958 | PICO | HS4.4

A near real-time flood depth estimation system for practical disaster management applications 

Hideaki Kitauchi, Akihiro Nagao, Masato Nakamura, and Takashi Igari

For local governments, it is essential to quickly and accurately understand the extent of flooding damage caused by typhoons, linear rainbands, or other heavy rainfall events in order to make critical decisions such as broadcasting evacuation notices or requesting emergency assistance to national government. In recent years, various systems have been developed to quickly predict and assess flood damage, but high implementation costs, computational demands, or operational complexity have become barriers to widespread adoption. Here, we develop a flood depth estimation system that keeps implementation as well as computational costs down while meeting practical needs of disaster management applications.

Using actual flood measurements obtained by low-cost water level sensors and digital elevation model (DEM), the system estimates flooded areas and depths in near real-time based on the sum of the measured flood depth and the ground elevation at each sensor location and visualize them quickly on the system. The system also includes features designed for convenience during imminent disasters, such as alerting every evacuation warning level, regularly saving and exporting flood depth maps and logs.

Additionally, estimating flood areas from past heavy rainfall events and validating these estimates, we assess the system accuracy. By involving disaster management personnels in using the system, we build a solution that is easy to operate even in the field during emergencies.


Figure 1. A schematic diagram of the system.


REFERENCES

  • Idehara, A. and K. Hirano, 2020: Quick Estimation Method of Flood Inundation Mapping using Single Point Information, Report of the National Research Institute for Earth Science and Disaster Prevention (NIED), 85
    (https://dil-opac.bosai.go.jp/publication/nied_report/PDF/85/85-1idehara.pdf, 2026.1.12).
  • NIED: https://midoplat.bosai.go.jp/web/shinsui/index.html (2026.1.12).
  • ArcGIS Online: https://www.esri.com/en-us/arcgis/products/arcgis-online/overview (2026.1.12).

How to cite: Kitauchi, H., Nagao, A., Nakamura, M., and Igari, T.: A near real-time flood depth estimation system for practical disaster management applications, EGU General Assembly 2026, Vienna, Austria, 3–8 May 2026, EGU26-15958, https://doi.org/10.5194/egusphere-egu26-15958, 2026.

Risk can be defined as the likelihood of a certain level of impact occurring. The Flood Forecasting Centre (FFC) communicate the flood risk in England and Wales using a risk matrix. This risk matrix compares the likelihood and impact to conclude the overall flood risk. This is communicated through the Flood Guidance Statement (FGS), which is issued daily. A similar risk matrix is used across the UK, including by the UK Met Office (UKMO) and the Scottish Environment Protection Agency (SEPA). However, currently there are differences in how the risk matrices are used and communicated. Recent storm events, such as Storm Bert, have highlighted the importance of clear and consistent messaging of risk across events and organisations to ensure that users of the risk matrix make appropriate decisions.

To address this issue, the FFC have been part of the Common Warnings Framework (CWF). This has included working alongside the UKMO and SEPA, as well as Environment Agency (EA), Natural Resources Wales (NRW) and Department of Infrastructure Northern Ireland (DfI). The research work, led by the UKMO, has been based around the Common Alerting Protocol (CAP). CAP has been used as a guide on how likelihood and impacts can be communicated. The main outcome of this work has been to agree a commonality in communicating flood risk. This will provide greater clarity, consistency and visibility around flood risk for emergency services, government and the public. The FFC have established a taskforce this year to deliver the changes to the flood risk matrix in time for winter 2026/2027.

Alongside the Common Warnings Framework, the FFC are exploring making more use of ensemble data. Working with the UKMO and EA, this has involved using meteorological ensemble data to drive hydrological ensemble output. A primary aim is to make the assessment of the likelihood of flooding impacts more objective and consistent during and between events. This is to improve flood incident management action. This approach has been trialled this winter with preliminary results expected during 2026.

This presentation will explain the upcoming changes to the FGS flood risk matrix. It will highlight how the flood risk matrix has evolved with time, the benefits the changes will make and how the changes link to the output from the ensemble trial. This includes looking at how useful ensemble based meteorological and hydrological summary tools may be for flood forecasters and decision makers, with the overall aim to improve the communication of risk. With more ensemble data becoming available this does create additional challenges in communicating risk. This presentation will also discuss the work the FFC has started in this area, looking at what AI can offer around impact assessments and communicating risk.

How to cite: Lattimore, C., Millard, J., Miller, C., Turner, R., Duke, A., and Fenwick, K.: Common Warnings Framework for flood risk in England and Wales – improving communication language for flood risk and how ensembles and AI may provide more objective risk assessment  , EGU General Assembly 2026, Vienna, Austria, 3–8 May 2026, EGU26-17584, https://doi.org/10.5194/egusphere-egu26-17584, 2026.

EGU26-19110 | ECS | PICO | HS4.4

Insights on using flood impact data for evaluating hydrometeorological warnings in Sweden 

Jiří Svatoš, Shirin Karimi, Remco van de Beek, Jonas Olsson, and Niclas Hjerdt

The accuracy of flood warnings should ideally be evaluated on real impact data, although such data are often difficult to obtain and work with. The Swedish Meteorological and Hydrological Institute (SMHI) has recently acquired records of flood-affected roads and emergencies attended by fire and rescue services in Sweden over the last 25 years. We analysed whether the impacts were covered by flood-related warnings and whether they coincided with hydrometeorological conditions exceeding flood warning thresholds from hindcast data. Here we present our experiences on tackling challenges associated with using the impact dataset, insights into what type of flood events the warning system handles well and how it can be developed further.

The existing SMHI warning methodology explained only 26% of the reported flood impacts, although this proportion increased to 43% after filtering out minor and isolated impacts. Incorporating runoff data from a recently developed sub-daily hydrological model further increased the proportion of explained impacts to 54%. Sub-daily runoff was especially effective in explaining summer flood impacts from cloudbursts in small flashy streams, illustrated through a case study of the Västernorrland flood in September 2025. Notably, total runoff generated in subcatchments was a more important predictor of flood impacts than streamflow, while precipitation did not account for almost any impacts alone without coinciding hydrological causes. Nevertheless, impacts from winter processes, such as urban snowmelt and rain-on-snow floods, remain poorly represented in the warning system. Our findings highlight the importance of filtering impact records prior to evaluation and reveal the benefit of utilising high-resolution hydrological models with outputs beyond streamflow in operational flood warning systems.

How to cite: Svatoš, J., Karimi, S., van de Beek, R., Olsson, J., and Hjerdt, N.: Insights on using flood impact data for evaluating hydrometeorological warnings in Sweden, EGU General Assembly 2026, Vienna, Austria, 3–8 May 2026, EGU26-19110, https://doi.org/10.5194/egusphere-egu26-19110, 2026.

EGU26-21091 | PICO | HS4.4

Co-evaluation of integrated pan-European rainfall and flood impact forecasts for cooperation in emergency management 

Marc Berenguer, Shinju Park, Calum Baugh, Karen O'Regan, Seppo Pulkkinen, and Heikki Myllykoski

The INLINE project aims at advancing on EWS capabilities with tools to anticipate the impacts caused by storms, heavy rain and floods to support the decision-making workflows of various levels of Civil Protection Agencies (CPAs), including their coordination and cooperation.

To achieve this, the project is developing impact-forecasting products and functionalities with European coverage, which are being tested in real time over a 15-month demonstration period. Results are co-evaluated with the participation of a number of end-users (both partners and stakeholders integrated in the INLINE Community of Interest) to assess their operational value.

This study presents results form the first months of the demonstration (starting in September 2025) focusing on (i) the skill of the products to anticipate the occurrence of the most significant events, and the magnitude of the resulting impacts; and (ii) the first results obtained with end-users during recent high-impact events in their regions.

How to cite: Berenguer, M., Park, S., Baugh, C., O'Regan, K., Pulkkinen, S., and Myllykoski, H.: Co-evaluation of integrated pan-European rainfall and flood impact forecasts for cooperation in emergency management, EGU General Assembly 2026, Vienna, Austria, 3–8 May 2026, EGU26-21091, https://doi.org/10.5194/egusphere-egu26-21091, 2026.

EGU26-22800 | PICO | HS4.4

Improvements to GMU iFlood using Machine Learning for Real-time Flood Modeling Corrections 

P. J. Ruess, Andre de Souza de Lima, and Celso Ferreira

Real-time flood modeling is increasingly important given the increased frequency and intensity of severe storms and flood damage. Machine learning provides unique opportunities for improving modeling outcomes, adjusting model outputs in real-time which can then be used as input data to inform subsequent predictions. In this work, we focus on improving George Mason University’s (GMU) iFlood Integrated Flood Forecast System. iFlood currently provides high-accuracy flood forecasts from twice-daily runs over the tidal region of the Potomac River from Lesieta to Little Falls, covering the Washington Metropolitan region and including coastal areas of the National Capital, Alexandria, and Arlington. iFlood has been operating for multiple years and is currently included in local forecast ensembles used by local weather forecasters to make valuable flood assessments. Our results explore how various machine learning techniques can be used to alter flood predictions, assessing impacts on model outputs as well as changes to computational dependencies.

How to cite: Ruess, P. J., de Souza de Lima, A., and Ferreira, C.: Improvements to GMU iFlood using Machine Learning for Real-time Flood Modeling Corrections, EGU General Assembly 2026, Vienna, Austria, 3–8 May 2026, EGU26-22800, https://doi.org/10.5194/egusphere-egu26-22800, 2026.

EGU26-668 | ECS | Posters on site | HS4.5

Integrated Early Warning System Based on Community Monitoring and Artificial Intelligence: Methodological Framework for the Mulato River Sub-basin (Mocoa, Colombia) 

David Román-Chaverra, Claudia-Patricia Romero-Hernández, and Javier Rodrigo-Ilarri

This work presents the methodological framework of the HIDROANDES project, involving the participatory installation of rainfall and streamflow monitoring stations in indigenous and rural communities of the Mulato River sub-basin (Mocoa, Colombia). Precipitation and water level measurements constitute the foundation for the development of an integrated early warning system aimed at reducing vulnerability to rapid-onset flooding events.

The proposed methodology consists of three interconnected components. First, real-time community-based monitoring, in which local actors operate hydrometeorological stations, generating geo-referenced datasets while integrating traditional knowledge and ensuring inclusive participation. Second, AI-assisted hydrological modelling, based on neural networks trained with locally generated and synthetic data to capture the specific hydrological response dynamics of the basin. Third, a generation of tailored alerts, designed according to the socio-territorial characteristics of each community and supported by fast-response predictive models capable of issuing warnings within seconds.

The central hypothesis of this research states that AI-driven, locally tailored hydrological models trained with community-generated data will provide faster and more accurate flood predictions than conventional hydrological models, especially in steep, fast-responding Andean basins such as the Mulato River.

This methodological approach is expected to strengthen local capacities for risk management, improve anticipatory response to extreme events, and provide a replicable framework for early warning systems in vulnerable Andean–Amazonian watersheds.

Keywords: community-based monitoring, early warning systems, artificial intelligence, participatory hydrology, rapid-response basins, flood risk management.

How to cite: Román-Chaverra, D., Romero-Hernández, C.-P., and Rodrigo-Ilarri, J.: Integrated Early Warning System Based on Community Monitoring and Artificial Intelligence: Methodological Framework for the Mulato River Sub-basin (Mocoa, Colombia), EGU General Assembly 2026, Vienna, Austria, 3–8 May 2026, EGU26-668, https://doi.org/10.5194/egusphere-egu26-668, 2026.

EGU26-848 | ECS | Posters on site | HS4.5

Evaluating a Pan-European Flood Impact Forecasting System: A Multi-Criteria Framework Integrating Hydrological Skill and End-User Perspectives 

Xinyu li, Marc Berenguer, Shinju Park, and Daniel Sempere-Torres

Flood forecasting is evolving from predicting hydrological variables to estimating potential impacts, bridging the gap between hazard anticipation and decision-making. Flood impact forecasts are obtained by combining hazard forecasts with the relatively high-resolution exposure datasets; e.g., population density, health and education facilities, transport networks, and energy infrastructure, to support decision-making before and during the event. However, the evaluation of the impact forecast remains challenging. Beyond hydrometeorological forecast skill, a meaningful evaluation of impact forecasts must incorporate ground truth evidence of real-world impacts and feedback from operational end-users.

A Pan-European real-time flood impact forecasting system has been designed within the European project INLINE. The system uses precipitation forecasts generated by seamless blending of probabilistic radar-based nowcasts and the precipitation simulations of the ECMWF EPS (maximum lead time: 120 hours). These are the inputs to estimate the flash flood hazard probabilities throughout Europe, which are integrated with high-resolution open-source exposure datasets to estimate flash flood impacts. INLINE is conducting a 15-month large-scale demonstration with an extensive Community of Interest (COI) including hydrological institutions, civil protection agencies, and emergency managers.

This study presents a multi-criteria evaluation framework applied to assess the performance of the system during the demonstration period. The evaluation integrates four components: (i) Hydrometerological skill, comparing the blended forecast product against radar and gauge observations to evaluate accuracy, reliability and timeliness; (ii) Impact-based verification, evaluating the forecasted impact levels against a newly created real-world impact database, which collects impact information using an LLM-based algorithm through news and social media; (iii) User-centric operational value, quantifying the system’s usefulness, clarity and operational relevance through structured surveys within the COI; and (iv) added value, comparing the complementary of the project developments with the current operational tools used by stakeholders to quantify the improvement for emergency management.

Several representative flood events are analysed in detail to showcase the applicability of the evaluation framework applied to the different developments of the project, and particularly impact-based forecasts. The results underline the importance of combining technical performance metrics with real-world impacts and stakeholder perspectives to guide future operational implementation.

How to cite: li, X., Berenguer, M., Park, S., and Sempere-Torres, D.: Evaluating a Pan-European Flood Impact Forecasting System: A Multi-Criteria Framework Integrating Hydrological Skill and End-User Perspectives, EGU General Assembly 2026, Vienna, Austria, 3–8 May 2026, EGU26-848, https://doi.org/10.5194/egusphere-egu26-848, 2026.

EGU26-867 | ECS | Posters on site | HS4.5

Real-Time Impact-Based Flood Forecasting in the Piracicaba Basin, Brazil 

Rodrigo Perdigão Gomes Bezerra, Bruno Brentan, Pedro Solha, Julian Eleutério, and André Rodrigues

Impact-based flood forecasting remains a major challenge for early warning systems, particularly in regions subject to rapid hydrological transitions and high societal vulnerability. Conventional approaches relying on pre-computed inundation maps and fixed impact thresholds often fail to capture event-specific dynamics, anticipate cascading impacts, and support timely emergency response. This study presents a real-time impact-based forecasting system that integrates physics-enhanced LSTM streamflow prediction, two-dimensional hydrodynamic simulation, and automated GIS-based impact assessment within a unified Python framework.

The workflow begins with a physics-enhanced LSTM model trained to provide short-range streamflow forecasts at key upstream stations. These forecasts drive an automatically executed HEC-RAS 2D model, producing time-evolving floodplain conditions beyond the static assumptions of threshold-based systems. By adopting dynamic simulations rather than pre-calculated inundation products, the system captures spatially and temporally explicit flood characteristics—advancing the representation of timing, extent, and hydraulic intensity during extreme or atypical events.

Hydrodynamic outputs are post-processed through a Python module that derives key impact metrics, including (i) direct economic losses via depth–damage functions, (ii) exposed and affected population, (iii) disruption of transportation links, (iv) impacts on critical facilities (e.g., hospitals, schools, emergency services), and (v) flood arrival times at operationally relevant locations. The arrival-time analysis provides essential lead-time information for emergency mobilisation, substantially enhancing situational awareness.

The system is demonstrated in the 8,850 km² upstream drainage area of the Piracicaba Basin (São Paulo, Brazil), a region characterised by hydrological sensitivity, rapid urbanisation, and recurrent flood emergencies. Results show that integrating machine learning, hydrodynamic modelling, and automated geospatial impact quantification improves the timeliness, accuracy, and operational relevance of flood warnings. The framework advances beyond hazard-centric forecasts by delivering transparent, event-specific impact information essential for effective early action.

All components of the framework rely on free and open-source tools, and all scripts developed in this study are openly available on GitHub to support transparency, reproducibility, and operational scalability.

How to cite: Perdigão Gomes Bezerra, R., Brentan, B., Solha, P., Eleutério, J., and Rodrigues, A.: Real-Time Impact-Based Flood Forecasting in the Piracicaba Basin, Brazil, EGU General Assembly 2026, Vienna, Austria, 3–8 May 2026, EGU26-867, https://doi.org/10.5194/egusphere-egu26-867, 2026.

EGU26-5009 | ECS | Posters on site | HS4.5

A Vorticity-Based Indicator for Typhoon Intensity Forecasting 

Pan Xia

Accurate tropical cyclone (TC) intensity forecasting remains challenged due to the lack of high-spatiotemporal-resolution observations of inner-core dynamics. This study introduces a novel structural indicator, Area-Mean Vorticity (VORm), derived from minute-scale FY-4B atmospheric motion vectors using the SPA-FABI framework. We identify a distinct "U-shaped" lifecycle in vorticity variability, identifying anomalous high-frequency fluctuations as robust precursors for TC rapid intensity change. Integrating VORm into linear (MLR, R2=0.97, RMSE=5.239 kt) and non-linear (XGBoost, RMSE=5.778 kt) models significantly enhances 6-hour forecast skill, with VORm ranking as a top-tier indicator alongside other well-known dynamical and thermodynamic environmental drivers. In physical terms, a critical synergy is established: environmental factors such as sea surface temperature (SST) define the theoretical ceiling of potential intensity, while VORm quantifies the efficiency of the TC inner-core engine in realizing this potential. Furthermore, SHAP (Shapley Additive Explanation) analysis also reveals that VORm serves as a low-variance "anchor" signal, stabilizing predictions against environmental uncertainty. Operationally, VORm fills the critical gap for real-time, high-fidelity structural predictors, offering a novel and effective pathway to reduce short-term TC intensity forecast errors.


How to cite: Xia, P.: A Vorticity-Based Indicator for Typhoon Intensity Forecasting, EGU General Assembly 2026, Vienna, Austria, 3–8 May 2026, EGU26-5009, https://doi.org/10.5194/egusphere-egu26-5009, 2026.

EGU26-7318 | Posters on site | HS4.5

Methodical framework of the PRE4IMPACT-AT project: Exploiting explainable machine learning for impact-based early warning and trend analysis in Austria 

Dominik Imgrüth, Raphael Spiekermann, Matthias Schlögl, Sebastian Lehner, Katharina Enigl, Leonhard Schwarz, Gregor Ortner, Vera Meyer, Jasmina Hadzimustafic, Juraj Parajka, Peter Valent, Jürgen Komma, Valentin Gebhart, David N. Bresch, Douglas Maraun, and Stefan Steger

Recent extreme precipitation events across Europe, including those in autumn 2024, underscore the need to strengthen proactive disaster risk reduction through improved impact-based early warning. In Austria, precipitation-related hazards such as landslides, flash floods and hailstorms repeatedly result in considerable impacts on people, infrastructure and economic assets. These challenges are expected to intensify under ongoing climate and environmental change. In response, European national meteorological and hydrological services are increasingly pursuing a paradigm shift in their warning strategies, from traditional weather warnings towards impact-based warnings (IbW). IbW focus on the consequences of weather events (“what the weather will do”) rather than solely on meteorological conditions (“what the weather will be”). However, data-driven and applicable approaches to predict precipitation-induced impacts at the national scale remain limited.

The PRE4IMPACT-AT project is part of the Austrian Climate Research Programme (ACRP) and addresses this gap by developing explainable and user-oriented impact-based predictive models for precipitation-related hazards in Austria. This contribution presents the overall project concept and the methodological framework, exemplified through a recent transferable and generalizable approach (Steger et al., 2025; https://doi.org/10.5194s/egusphere-2025-4940). PRE4IMPACT-AT focuses on processes whose impacts that typically occur in temporal and spatial proximity to precipitation events, namely landslides, flash floods and hailstorms.

Adopting a risk-oriented perspective, PRE4IMPACT-AT first conceptualizes impacts as the outcome of interacting atmospheric drivers, biophysical and geomorphological preconditions, and socioeconomic exposure and vulnerability. These relationships are formalized using an impact-chain framework, which supports the systematic identification and prioritization of key impact drivers for each hazard type. In subsequent steps, the selected drivers are parameterized and harmonized using a wide range of national datasets, including meteorological and geo-environmental information, as well as socioeconomic data. Model training relies on available national and international damage databases (landslides, flash floods) and agricultural insurance loss data (hail). Based on these datasets, explainable machine learning is applied to derive spatiotemporal predictive rules linking static and dynamic drivers to observed impacts. The resulting models aim to characterize typical impact conditions, with a strong emphasis on interpretability to enhance transparency and allow plausibility checks. The models are evaluated in hindcast and nowcast settings to assess their suitability for short-term impact-based warning applications. In addition, long-term analyses, synthesizing large numbers of hindcasts, are used to identify trends in critical conditions and emerging patterns. Finally, individual hazard-specific models are combined to provide a multi-hazard impact perspective. A core element of PRE4IMPACT-AT is continuous user engagement through iterative evaluation workshops with stakeholders who hold warning mandates. Overall, the project contributes to advancing impact-based forecasting, early warning and climate impact assessment by providing Austria with a transparent and operationally relevant foundation, while offering transferable insights for national services facing similar challenges across Europe. 

This project is funded by the Climate and Energy Fund in the course of the Austrian Climate Research Programme (ACRP) and the FFG (www.ffg.at). The FFG is the central national funding agency and strengthens Austria’s innovative capacity. 

How to cite: Imgrüth, D., Spiekermann, R., Schlögl, M., Lehner, S., Enigl, K., Schwarz, L., Ortner, G., Meyer, V., Hadzimustafic, J., Parajka, J., Valent, P., Komma, J., Gebhart, V., Bresch, D. N., Maraun, D., and Steger, S.: Methodical framework of the PRE4IMPACT-AT project: Exploiting explainable machine learning for impact-based early warning and trend analysis in Austria, EGU General Assembly 2026, Vienna, Austria, 3–8 May 2026, EGU26-7318, https://doi.org/10.5194/egusphere-egu26-7318, 2026.

EGU26-7652 | ECS | Posters on site | HS4.5

Drought impact-based forecasting of crop yield in Sweden through a machine-learning framework  

Claudia Canedo Rosso, Babak Mohammadi, Martina Merlo, Matteo Giuliani, Ilias Pechlivanidis, and Yiheng Du

Drought forecasting is a key component of agricultural risk management, yet important gaps still remain in linking drought hazard indicators to measurable impacts on crop yields. To translate hydro-climatic drought information into actionable insights for agricultural decision-making, a systematic investigation of relationships between hazard variables and impact indicators is needed to support process understanding and predictive modelling.

In this study, we focus on selected crop yield anomalies in Sweden as key agricultural impact indicators, and characterise the timing, magnitude, and persistence of drought-related yield reductions. Then, we identify their links to drought hazard indicators, e.g.  a set of meteorological, soil moisture, and hydrological drought indicators across relevant spatial and temporal scales, and explore their explanatory and predictive power. Building on the Framework for Index-based Drought Analysis (FRIDA), we leverage Machine Learning algorithms to elucidate the non-linear relationships between drought hazard indicators and crop yield impacts. Our results contribute to advancing impact-based drought early warning in Sweden and supports the development of more actionable drought information for agricultural stakeholders.

How to cite: Canedo Rosso, C., Mohammadi, B., Merlo, M., Giuliani, M., Pechlivanidis, I., and Du, Y.: Drought impact-based forecasting of crop yield in Sweden through a machine-learning framework , EGU General Assembly 2026, Vienna, Austria, 3–8 May 2026, EGU26-7652, https://doi.org/10.5194/egusphere-egu26-7652, 2026.

EGU26-7705 | Orals | HS4.5

Impact-based prediction of building damage from surface water floods using machine learning. 

Pascal Horton, Markus Mosimann, Severin Kaderli, Andreas Paul Zischg, and Olivia Martius

In Switzerland, surface water floods (SWF) account for approximately 23% of the financial losses to property caused by floods. Improving the understanding of these events is therefore essential to enhance prevention and risk mitigation efforts. However, SWF impacts are challenging to forecast, as they result from the interaction of multiple processes and are strongly influenced by local conditions, building exposure, and vulnerability.

We develop a data-driven model to predict potential damages, trained on damage data provided by the Swiss Mobiliar Insurance Company and the Building Insurance of the Canton of Zurich (GVZ). The objective is to predict the probability of damage to buildings caused by SWFs using gridded hourly precipitation data and morphological properties.

We compare several approaches, including a simple threshold-based method, logistic regression, random forests, and deep learning models such as Convolutional Neural Networks (CNNs) and Transformers. The relevance of spatio-temporal patterns in precipitation fields is assessed using 1-D, 2-D, and 3-D CNNs. Variants of Transformer architectures are also evaluated.

How to cite: Horton, P., Mosimann, M., Kaderli, S., Zischg, A. P., and Martius, O.: Impact-based prediction of building damage from surface water floods using machine learning., EGU General Assembly 2026, Vienna, Austria, 3–8 May 2026, EGU26-7705, https://doi.org/10.5194/egusphere-egu26-7705, 2026.

EGU26-8039 | Orals | HS4.5 | Highlight

Early Warning Systems in the Global South: challenges and innovative approaches 

Lauro Rossi, Anna Mapelli, Andrea Libertino, Simone Gabellani, Lorenzo Alfieri, Nicola Testa, Laura Poletti, Eleonora Panizza, Paolo Fiorucci, Andrea Trucchia, Niccolò Perello, Giorgio Meschi, Mirko D'Andrea, Edoardo Cremonese, Michel Isabellon, Luca Trotter, and Alessandro Masoero

Early warning systems (EWS) are widely recognized as one of the most effective tools for protecting lives and livelihoods from natural hazards. The Early Warnings for All initiative, launched by the United Nations Secretary-General in 2022, aims to ensure universal protection from hazardous hydrometeorological, climatological, and related environmental events through life-saving, multi-hazard early warning systems, anticipatory action, and strengthened resilience by 2027. However, despite substantial advances in forecasting capabilities over recent decades, the practical implementation of effective and actionable EWS remains challenging, with pronounced regional disparities, particularly in developing and fragile contexts.

This talk presents real-world experiences from the implementation of impact-based early warning systems in developing countries. It highlights key operational challenges across the early warning–early action chain, including gaps in risk and impact data, institutional coordination constraints, and difficulties in translating forecasts into timely and trusted decisions. The contribution also discusses opportunities offered by innovative approaches, such as the collaborative co-production of early warnings in transboundary river basins, impact-based forecasting frameworks, AI-supported forecasts, and the integration of local knowledge in operational EWS.

How to cite: Rossi, L., Mapelli, A., Libertino, A., Gabellani, S., Alfieri, L., Testa, N., Poletti, L., Panizza, E., Fiorucci, P., Trucchia, A., Perello, N., Meschi, G., D'Andrea, M., Cremonese, E., Isabellon, M., Trotter, L., and Masoero, A.: Early Warning Systems in the Global South: challenges and innovative approaches, EGU General Assembly 2026, Vienna, Austria, 3–8 May 2026, EGU26-8039, https://doi.org/10.5194/egusphere-egu26-8039, 2026.

EGU26-8138 | ECS | Orals | HS4.5

Towards the Operational Implementation of Seasonal Drought Impact-based Forecasting with Explainable Machine Learning 

Konstantinos Azas, Edoardo Cremonese, Lauro Rossi, Arthur Hrast Essenfelder, Luca Trotter, Antonello Provenzale, and Andrea Ficchì

Accurate drought impact forecasting is fundamental for effective decision-making, yet forecasting drought impacts rather than hazards remain difficult due to the complex, non-linear relationship in which they can materialise. Impact-based drought forecasting at seasonal timescales is particularly challenging, thereby benefitting from methods that ensure reliability and transparency. Here, we present a novel machine-learning (ML) framework for drought impact-based forecasting that explicitly evaluates model performance, actionability, and explainability. 

The study is structured as a sequence of experiments. First, an autoencoder and several ML models—Gradient Boosting (XGB), Random Forest (RF), and Support Vector Machine (SVM) are trained with observed drought hazard indicators at multiple aggregations (e.g. SPI-12, SPI-24, SPEI-1, SPEI-3, SPEI-6, FAPAR-1, FAPAR-3, SMA-1, SMA-3) up to the current date to understand the data and how ML models perform to predict water scarcity levels in Italy, chosen as the drought impact indicator. The U-Net and ConvLSTM models were chosen as baseline models, as they directly predict gridded water scarcity levels. The framework is then extended by incorporating seasonal climate forecasts (precipitation and temperature) up to six months ahead to enable real-time impact prediction. Model sensitivity to spatial resolution is evaluated by testing inputs at 1 km and 25 km scales. To ensure that results are physically meaningful, explainable AI (xAI) techniques are applied to quantify predictor importance using SHAP, identify spatial hotspots using Integrated Gradients, and determine the most informative periods of the year using Partial Dependence Plots. 

Results show clear performance differences among models. Tree-based approaches, particularly Gradient Boosting and Random Forest, consistently outperformed deep learning baselines at both spatial resolutions. At 1 km resolution, xAI identifies SPEI-6 and SMA-1 as the most influential predictors, while at 25 km resolution SPEI-6 and FAPAR-3 emerge as the dominant drivers. Model performance improves at coarser resolution, with tree-based models providing the most accurate and robust predictions. Overall, the study (i) presents a workflow for assessing the effectiveness of ML in enhancing the seasonal prediction of drought impacts, (ii) leverages xAI to evaluate the relationship between the drought hazard indicators and drought impact data, including the most informative periods of the year and the spatial hotspots; and (iii) enabling real-time drought impact-based forecasting at seasonal scale. 

How to cite: Azas, K., Cremonese, E., Rossi, L., Hrast Essenfelder, A., Trotter, L., Provenzale, A., and Ficchì, A.: Towards the Operational Implementation of Seasonal Drought Impact-based Forecasting with Explainable Machine Learning, EGU General Assembly 2026, Vienna, Austria, 3–8 May 2026, EGU26-8138, https://doi.org/10.5194/egusphere-egu26-8138, 2026.

EGU26-9458 | ECS | Orals | HS4.5

Using ML for the prediction of flood-related emergency calls 

Jordi Morales Casas, Agata Lapedriza, Andreas Kaltenbrunner, and Xavier Llort

As weather-related disasters become more frequent and severe, there is a growing global push toward impact-based early warning systems, exemplified by initiatives such as EW4All. This transition positions machine learning (ML) and artificial intelligence (AI) as powerful tools for integrating meteorological hazard data with information on vulnerability and exposure into data-driven forecasting systems. In this work, we explore the use of 112 emergency calls as high-resolution impact proxies for an ML-based prediction problem. Specifically, we develop a model that combines rainfall-related weather data and static vulnerability-exposure layers to predict, at a municipal and hourly resolution, whether flood-related impacts will occur in the next hour. This study spans a period of over six years (October 2018 to February 2025) in Catalonia, northeastern Spain.

To address the severe temporal class imbalance and uncertainty characteristics of emergency calls data, we define a custom walk-forward evaluation scheme that ensures the same number of positive samples across comparable time periods. We then distribute municipalities into three distinct population density groups (low, medium, and high) and train one model for each one. This stratification enables us to evaluate performance across diverse population dynamics and varying data availability. The resulting models are compared against operational methodologies, such as climatology-based weather warnings issued by meteorological agencies. Our results show that the ML approach represents a substantial improvement in two of the three groups. The model for the lowest-density group, however, struggles due to a substantial lack of impact data, highlighting a key roadblock for data-driven algorithm development in sparsely populated regions.

To gain a more complete understanding and improve model trust and explainability, we perform a series of experiments: a feature importance analysis using SHAP (SHapley Additive exPlanations), ablation studies over different feature groups, and training models on individual feature sets. From these results, we can ascertain how the combination of varied data sources (such as weather radar, station sensors, or call history) can result in more powerful predictions than using single sources in isolation.

Finally, we present a methodology for characterizing the different stages of a rainfall event, as performance is expected to vary throughout its evolution. We distinguish five stages based on observed rain in the previous and following hours: The first hour with rain, intermediate hours, the last hour with rain, the hours immediately after the event, and hours without rain. Evaluating all approaches following this framework adds a valuable dimension to the performance analysis and further improves explainability. The results demonstrate that our models outperform the baselines across all event stages, from the initial onset of rain to the hours after precipitation has stopped. This highlights the strong potential of even relatively simple ML pipelines to deliver timely, localized anticipation of weather-related impacts.

How to cite: Morales Casas, J., Lapedriza, A., Kaltenbrunner, A., and Llort, X.: Using ML for the prediction of flood-related emergency calls, EGU General Assembly 2026, Vienna, Austria, 3–8 May 2026, EGU26-9458, https://doi.org/10.5194/egusphere-egu26-9458, 2026.

EGU26-9728 | ECS | Posters on site | HS4.5

Integrating Machine Learning for Flood Impact Prediction in Swedish Operational Forecasting and Warning Services 

Shirin Karimi, Conrad Brendel, Klara Lindqvist, Niclas Hjerdt, and Yiheng Du

Flooding is a natural hazard arising from complex and non-linear interactions between hydrometeorological forcing and landscape characteristics, and therefore cannot be reliably represented using simple empirical relationships. The objectives of this study are (1) to identify which hydrological and physiographic variables, or which combinations of them, are most strongly associated with flood-related consequences, and (2) to develop a national-scale flood susceptibility framework for Sweden that can be integrated with forecast information to support operational warning decisions.

The novelty of this work lies in the use of a large, nationwide impact dataset consisting of road closure records from 2000–2023, provided by the Swedish Traffic Agency, as the target for training and validation of a data-driven impact model. Each road closure location is characterized using a comprehensive set of predictors derived from the SHYPE hydrological model — including precipitation, runoff, soil moisture, groundwater storage, and short-term intensity metrics (e.g. 3-hour maxima) — together with topographic and environmental descriptors such as slope, elevation range, upstream contributing area, distance to water bodies and culverts, and land-use classes.

An Extreme Gradient Boosting (XGBoost) classifier was used to learn the relationship between these predictors and observed impacts. The model achieves strong predictive skill (accuracy = 0.977), with a balanced confusion matrix indicating strong ability to distinguish impacted and non-impacted areas. Feature importance analysis reveals that short-term hydrological response dominates model behavior. Surface runoff is the most influential predictor, followed by local runoff and groundwater storage, highlighting the critical role of near-surface hydrological dynamics in translating meteorological forcing into damaging outcomes. Topographic and land-use variables, such as slope and industrial land cover, further modulate susceptibility, emphasizing the influence of local terrain and exposure.

The resulting framework enables the generation of a dynamic flood susceptibility map for Sweden. When driven by real-time or forecast hydrometeorological inputs, the model can function as a “copilot” for forecasters, indicating where events are most likely to produce consequences. This would support more targeted warnings, reduces false alarms, and strengthens proactive risk communication in vulnerable areas.

How to cite: Karimi, S., Brendel, C., Lindqvist, K., Hjerdt, N., and Du, Y.: Integrating Machine Learning for Flood Impact Prediction in Swedish Operational Forecasting and Warning Services, EGU General Assembly 2026, Vienna, Austria, 3–8 May 2026, EGU26-9728, https://doi.org/10.5194/egusphere-egu26-9728, 2026.

EGU26-13437 | ECS | Orals | HS4.5

From forecasts to action: testing a new impact-based flood early warning system 

Rafaella Oliveira, Tim Busker, Jens de Bruijn, Hans de Moel, Roy Pontman, Wouter Botzen, and Jeroen Aerts

Flood Forecasting and Early Warning Systems (FFEWS) are key to reduce flood impacts by providing timely information to individuals, communities, and authorities. However, during the July 2021 floods in Europe, major gaps were observed between forecasts, warnings, and protective actions. In the impacted region of Limburg in the Netherlands, only 55% of people in flood-prone areas received an evacuation warning, and just 41% took emergency measures. This highlights a critical weakness in the FFEWS chain: the translation of forecasts into actionable warnings that effectively trigger response. Impact-based forecasting (IbF) has been promoted as an important step in bridging this gap, shifting the focus from hazard forecasting to forecasting societal consequences of potential flooding. Despite increasing interest in IbF, most FFEWS still focus mainly on hazards and are not tailored to forecast users and the specific actions they can trigger. Moreover, FFEWS effectiveness is often only assessed by the skill of flood hazard warnings, while there is little research on whether warnings lead to effective responses. To address this issue, we developed an impact-based flood forecasting, early warning, and response system (IbF-FEWS) using the Geographical, Environmental, and Behavioral (GEB) platform. This system consists of three novel interconnected components: (i) a flood forecast module, in which probablistic ensemble rainfall forecasts force a combined hydrological-hydrodynamic model to generate ensemble forecasted flood maps; (ii) a warning module, in which these flood maps are transformed into lead-time–dependent flood probability maps and evaluated against two action-based hazard thresholds: damaging water-level ranges and exposure of critical infrastructure. Each threshold is associated with recommended emergency measures (e.g. placing sandbags). Then, for each postal code, flood probabilities are filtered using a predefined probability threshold to identify flooded areas, after which the fraction of affected buildings or flooded area within the postal code area is evaluated to determine whether a warning is issued; and (iii) a decision-making module, in which households decide whether to implement the recommended measures based on their responsiveness to warnings, modeled as a binary state classifying households as either responsive or non-responsive. We demonstrate the system for the July 2021 flood event in the Geul catchment in the South of the Netherlands, showing how probabilistic, impact-based, and action-oriented warnings can lead to earlier and more effective early action. The results demonstrate the potential reduction in flood damage had such a system been operational during the 2021 event.

How to cite: Oliveira, R., Busker, T., de Bruijn, J., de Moel, H., Pontman, R., Botzen, W., and Aerts, J.: From forecasts to action: testing a new impact-based flood early warning system, EGU General Assembly 2026, Vienna, Austria, 3–8 May 2026, EGU26-13437, https://doi.org/10.5194/egusphere-egu26-13437, 2026.

EGU26-15034 | Orals | HS4.5

From risk knowledge to effective early actions: a novel framework and application for impact-based early warning with a pilot study in Eastern Africa 

Davide Cotti, Samira Pfeiffer, Maria Dewi, Augustine Kiptum, Judith Musa, Vincent Okoth, Mark Lelaono, Ezra Limo, Jully Ouma, James Nyaga, Paul Mwangi, Frankline Rono, Lorenzo Alfieri, Eva Trasforini, Ahmed Amdihun, Marco Massabo, Saskia Werners, and Michael Hagenlocher

Impact-based early warning (IbEW) aims at integrating knowledge about risks and impacts with timely, understandable and actionable warnings, thus enabling targeted early actions that can help reduce risks in the face of impending hazards. However, applications are still scarce, and an established risk-informed framework to guide assessment and inform early actions has yet to emerge. Drawing on the outcomes of a research project in Eastern Africa, with pilot studies in Kenya and Ethiopia, we have developed an IbEW application for drought and flood risks, spanning from conceptualization to co-development and implementation, informed by a novel IbEW framework. Drought risks are of particular significance in the region, with recent events exacting disruptive tolls on the lives and livelihoods of millions of people. To capture their characteristics and warn for these impacts, we have developed a drought IbEW methodology for rainfed agriculture (informed by co-developed conceptual risk models) that combines spatial hazard information (using the combined drought indicator - CDI), dynamic exposure of cropland (by accounting for crop-specific calendar variability and phenological stages), and contextual warning information on multiple dimensions of vulnerability of rainfed farming households and specific vulnerable groups (women and girls, persons with disabilities, and people in camps setting). Focusing on three staple crops (maize, wheat, sorghum), our application produces automated assessments of multiple combinations of drought hazard, crop types, phenological stages, and possible impacts on crop production quantity at both dekadal and monthly accumulation periods, packaging contextualized warning messages in an intuitive narrative format. Our system was co-developed with and validated by national and subnational experts and stakeholders through multiple stages, and aims to deliver actionable information to people at risk and to organizations and institutions responsible for disaster response and risk management.

How to cite: Cotti, D., Pfeiffer, S., Dewi, M., Kiptum, A., Musa, J., Okoth, V., Lelaono, M., Limo, E., Ouma, J., Nyaga, J., Mwangi, P., Rono, F., Alfieri, L., Trasforini, E., Amdihun, A., Massabo, M., Werners, S., and Hagenlocher, M.: From risk knowledge to effective early actions: a novel framework and application for impact-based early warning with a pilot study in Eastern Africa, EGU General Assembly 2026, Vienna, Austria, 3–8 May 2026, EGU26-15034, https://doi.org/10.5194/egusphere-egu26-15034, 2026.

Typhoon Hagibis (2019), one of the most powerful storms to strike Japan in recent years, caused widespread flooding and severe damage. Impact-based forecasting play a critical role in planning effective mitigation measures and enhancing disaster preparedness and responses. In this study, we employ the Integrated Land Simulator (ILS) coupled with the Nonhydrostatic Icosahedral Atmospheric Model (NICAM) to evaluate the effects of typhoon intensity modification on flood damage mitigation associated with Typhoon Hagibis.

To systematically assess uncertainties in typhoon forecasts, we conducted ensemble simulations consisting of a control run and ten ensemble members. The results show that the spatial distribution of heavy rainfall and flooding is closely linked to the typhoon track. When the typhoon track shifted westward, heavy rainfall and flooding expanded over southwestern Japan. In contrast, eastward shifts in the typhoon track led to increased heavy rainfall and flooding in central Japan, with particularly strong impacts over the densely populated Kanto region.

To further investigate the effects of typhoon intensity modification on flood damage mitigation, the central pressure of the typhoon was artificially increased by 1 to 15 hPa at 1-hPa intervals on 10 and 11 October.  These intensity modification experiments demonstrate that human intervention generally led to reductions in heavy rainfall and flood damage across Japan. Moreover, modifications applied on October 10 resulted in greater reductions in both heavy rainfall and flood damage than those applied on October 11.

These findings highlight the critical importance of both the intensity and timing of human intervention in influencing flood risk. By simulating different modification intensities and timings and explicitly evaluating the role of weather modification, this study advances our understanding of flood hazards and provides valuable insights for improving disaster preparedness and flood mitigation strategies.

How to cite: Li, X., Yoshimura, K., Nasuno, T., and Yamada, Y.: Impact-Based Ensemble Flood Forecasting in Japan: Effects of Typhoon Intensity Modification on Flood Damage Mitigation during Typhoon Hagibis (2019), EGU General Assembly 2026, Vienna, Austria, 3–8 May 2026, EGU26-16290, https://doi.org/10.5194/egusphere-egu26-16290, 2026.

In recent years, with improvements in weather forecasting technology, the development of long-term flood forecasting has advanced globally. This technology is expected to mitigate damage from large-scale floods, which occur infrequently but cause immense damage. However, it is also anticipated to be highly effective against frequent high-water events that occur routinely. This is particularly relevant for urban rivers, where frequent high-water limits the utilization of waterfront areas. Therefore, this study aims to expand the scope of long-term flood forecasting to address these high-frequency events, using the Oto River in Okazaki City, Aichi Prefecture, Japan, as a case study. We analyzed the impact of long-term flood forecast information on the decision-making of waterfront stakeholders through group interviews and workshops with 28 participants, including riverside business owners, municipal river managers, and academic experts.

The findings revealed that the level of demand for long-term flood forecasts varies significantly depending on the type of riverside use. For use that contains many physical installations or hardware, such as urban furniture and temporary structures, the evacuation process requires significant physical effort and time. Therefore, a high accuracy forecast with a lead time of 24 hours or more is essential, as it ensures a safe evacuation timeframe while avoiding unnecessary evacuations due to false alarms. Conversely, for “soft operations” like event hosting or rental businesses, a shorter lead time of 12 to 18 hours was shown to be an ample amount of time to determine event feasibility the day before and notify customers, allowing continued operations while controlling business risk.

A notable finding was that, regardless of whether the usage style was physical installations or soft operation based, when prediction accuracy exceeded 40-60%, users became more willing to accept risk, and the number of waterfront usage ideas increased dramatically. Furthermore, private businesses demonstrated a flexible stance, accepting false alarms in forecasts as an “insurance” cost for business continuity. With this approach, the construction of physical installations, which previously have been impossible due to high risks and strict standards, can broaden the types of businesses that can operate on the riverside, realizing a future urban landscape where permanent installations are standard. Based on these findings, it can be concluded that implementing long-term flood forecasting has the potential to significantly enhance the value of river spaces in daily life, extending beyond providing disaster prevention information for evacuation actions. By presenting appropriate lead times and accuracy levels, it suggests the potential to foster a new urban culture that coexists with waterfronts while accounting for flood risks, ultimately creating more diverse and resilient riverside urban spaces.

How to cite: Horie, K., Nakamura, S., and Morita, H.: The Impact of Long-Term Flood Forecasting on Waterfront Utilization and Stakeholder Decision-Making - A Case Study of the Oto River in Okazaki City, Japan, EGU General Assembly 2026, Vienna, Austria, 3–8 May 2026, EGU26-16815, https://doi.org/10.5194/egusphere-egu26-16815, 2026.

EGU26-17171 | Orals | HS4.5

Flood hotspot mapping using static and dynamic data: A case study of the European Floods in 2021 

Nikolai Skuppin, Nina Maria Gottschling, Sébastien Dujardin, Andrés Camero, Sandro Martinis, Benjamin Palmaerts, and Hannes Taubenböck

Floods are increasing in frequency and severity. Flood forecasting is ever improving and is already of high quality at national to regional level. However, there are fundamental limits in flood forecasting, especially at sub-regional to building level, making observations indispensable. Unfortunately, observations are often hampered by limitations in frequency, accuracy and the covered area. It is crucial to bridge the gap between modeling and observations to obtain situational awareness and to guide rescue forces and further data acquisitions. One possible approach is the use of focus maps, which combine multiple proxy layers into one common proxy of risk. These have been successfully applied to identify hotspots of areas affected by earthquakes or floods. This work uses the concept of focus maps and applies it to Ahr valley and Vesdre valley, two of the main affected areas of the European floods in July 2021. The work presents a thorough survey of static and observational proxy layers, such as flood hazard maps, satellite derived flood maps and Facebook user activity data, with various coverage (global, European, national). It tests how well individual layers and their combinations approximate the areas affected by the floods and finds that already few data layers suffice to obtain a strong approximation. Furthermore, it shows that Facebook user activity data provides a valuable source to identify the onset time of the flood event and to identify the affected regions. However, the user activity data is too coarse and noisy to obtain accurate predictions. By combining the dynamic data with readily available static proxy layers of higher spatial resolution a risk proxy is obtained, which could potentially scale to other areas of interest.

How to cite: Skuppin, N., Gottschling, N. M., Dujardin, S., Camero, A., Martinis, S., Palmaerts, B., and Taubenböck, H.: Flood hotspot mapping using static and dynamic data: A case study of the European Floods in 2021, EGU General Assembly 2026, Vienna, Austria, 3–8 May 2026, EGU26-17171, https://doi.org/10.5194/egusphere-egu26-17171, 2026.

Impact-based forecasting uses hydrometeorological information to trigger timely early actions, but real-world events show a gap between early warning and action. This paper addresses this bottleneck by examining how people interpret uncertainty in warnings and the impact this has on their actions.

We introduce the Uncertainty Lens Framework (ULF), which analyses how perceived uncertainty shapes threat, ownership, and coping appraisals in flood risk contexts. The ULF combines Protection Motivation Theory, decision heuristics and the Safe Development Paradox to explain why uncertainty can trigger protective action in some settings but lead to delay, denial or delegation in others. In this study, we apply the ULF to the 2021 flood in Germany, using quotations from newspapers and open-ended survey responses that capture the reasoning of affected residents during the event.

Three 'illusions of safety' that suppress early action emerge: (1) experience-based normalisation ('we've seen floods before'), (2) responsibility delegation ('someone else will handle this'), and (3) overconfidence in systems and protection ('the infrastructure/authorities will protect us'). These illusions are reinforced when uncertainty is implicit, inconsistently acknowledged or communicated without stable anchors to help people contextualise unprecedented escalation.

We therefore advocate proactive uncertainty management also for impact-oriented services and warning systems. Rather than trying to eliminate uncertainty, services should incorporate it into risk communication and policy design by deliberately establishing anchors and availabilities that help people understand residual risk from immediate and potential future exacerbation. Crucially, uncertainty communication must be embedded in sustained community-level engagement and long-term risk awareness so that warnings issued during an event are interpreted in the context of shared mental models, established trust relationships and preparedness measures.

How to cite: Höllermann, B. and Heidenreich, A.: Why Accurate Flood Warnings Still Fail: Behavioural Mechanisms of Uncertainty Interpretation and Implications for Impact-Oriented Services, EGU General Assembly 2026, Vienna, Austria, 3–8 May 2026, EGU26-17685, https://doi.org/10.5194/egusphere-egu26-17685, 2026.

EGU26-18323 | Orals | HS4.5

Continuous Risk Monitoring and Assessment (CRMA) for Operational Impact-Based Forecasting: A Bayesian Network method for Flood and Drought Hazards in East Africa  

Nishadh Kalladath, Robert Tucci, Hillary Koros, Owiti Zablone, Afroza Mahzabeen, Masilin Gudoshava, and Ahmed Amdihun

Continuous Risk Monitoring and Assessment (CRMA) is widely used in financial auditing and cyber-risk management to update risks in real-time and escalate them as conditions evolve. Hydrometeorological early warning systems typically operate in a cycle of repeated hazard and threshold monitoring, usually daily for floods and monthly or seasonally for droughts. The current study introduces a method tailored for operational Impact-Based Forecasting (IBF) for flood and drought hazards in East Africa, developed under the Complex Risk Analytics Fund(CRAF'd) project. The method formalizes existing monitoring practices into a continuous, conditional, evidence-driven hydrometeorological risk assessment process, in which evolving observations, forecasts, and expert knowledge are systematically integrated, documented, and auditable across time.  

 The method combines forecast and observation indicators using probabilistic Bayesian networks to aggregate risks and provide decision support. For drought, it uses multi month Combined Drought Indicators (CDI) as observed antecedent conditions, along with ECMWF SEAS5 standard precipaiton index (SPI) ensemble forecasts across agricultural seasons. For floods, antecedent rainfall and soil saturation indicators from satellite observations are fused with short-range ensemble precipitation forecasts from NOAA GEFS. In both hazard contexts, Bayesian Networks encode expert knowledge through Conditional Probability Tables(CPT) to represent compound risk mechanisms, temporal persistence, spatial coverage, and data confidence, enabling transparent, uncertainty quantification and reproducible inference of evolving risk states.  

The output produces admin-2–level traffic-light risk communcation categories linked to anticipatory action decision pathways. Validation results from pilot study demonstrate that Bayesian Networks implemented using the Python pgmpy library enable cost-effective and repeatable continuous risk monitoring when combined with analysis-ready, cloud-optimized datasets. The results show that parsimonious hazard modelling, using Prefect automation tool for operational impact-based forecasting, a calendar-based web app, and structured CPT management support transparent risk assessment, traceable record-keeping, and auditable decision histories. Integration with storymaps complements this method by enabling event-based climate storylines that link risk knowledge with operational decision communication. 

How to cite: Kalladath, N., Tucci, R., Koros, H., Zablone, O., Mahzabeen, A., Gudoshava, M., and Amdihun, A.: Continuous Risk Monitoring and Assessment (CRMA) for Operational Impact-Based Forecasting: A Bayesian Network method for Flood and Drought Hazards in East Africa , EGU General Assembly 2026, Vienna, Austria, 3–8 May 2026, EGU26-18323, https://doi.org/10.5194/egusphere-egu26-18323, 2026.

EGU26-19313 | ECS | Posters on site | HS4.5

Exploring weather and traffic conditions in traffic accidents using one-class learning  

Irene Garcia-Marti, Kirien Whan, Tessa van Dijk, Andrew Stepek, Annemieke Schönthaler, Else van den Besselaar, Karlijn Zaanen, Rosina Derks, Sam Ubels, and Tim den Dulk

Ensuring road safety is a critical responsibility for public organizations such as road network operators, emergency services, and national meteorological services (NMS). Traffic accidents arise from a complex interplay of environmental and human factors, making proactive risk management essential for road network operations. In practice, emergency services and road operators predominantly collect high-precision records of accident locations, resulting in presence-only datasets that lack explicit non-accident observations. 

Unlike traditional accident modeling approaches that rely on labeled non-accident data or synthetically constructed negative classes, this study investigates one-class learning as a natural and operationally realistic framework for traffic accident analysis. Researchers at the Royal Netherlands Meteorological Institute (KNMI) explore the use of AI/ML methods to model high-resolution presence-only accident data using five years of traffic accident locations (2018–2022) provided by the Dutch road authority. Each accident is characterized by a set of weather and traffic intensity features describing the conditions under which it occurred. 

Traffic accidents are modeled using neural one-class classification to obtain a high-dimensional embedding of accident conditions, which is subsequently analyzed using dimensionality reduction techniques to identify clusters of accidents with similar environmental signatures. By learning directly from observed accident occurrences, the approach enables the identification and comparison of recurring accident patterns associated with specific weather and traffic conditions, providing a structured basis for further analysis of weather-related traffic risk. 

How to cite: Garcia-Marti, I., Whan, K., van Dijk, T., Stepek, A., Schönthaler, A., van den Besselaar, E., Zaanen, K., Derks, R., Ubels, S., and den Dulk, T.: Exploring weather and traffic conditions in traffic accidents using one-class learning , EGU General Assembly 2026, Vienna, Austria, 3–8 May 2026, EGU26-19313, https://doi.org/10.5194/egusphere-egu26-19313, 2026.

EGU26-20343 | ECS | Orals | HS4.5

From impact data to impact-based warnings: developing an impact-centred database to support local warning validation 

Erika Meléndez-Landaverde, Daniel Sempere-Torres, Víctor González, and Rubén Sanz-García

Despite major advances in the accuracy and lead time of hydrometeorological forecasting, significant gaps persist in the early warning-early action chain, limiting the ability of warnings to trigger timely and effective protective actions at the municipal level. Impact-based early warning systems have emerged as a promising pathway to address these gaps; however, their operational implementation, particularly the systematic availability, integration and usability of impact data for warning validation and improvement, remains a key challenge.

In this contribution, we present an impact database environment designed to collect, structure and support the analysis of observed impacts from hydrometeorological events. The database links reported impacts to forecasts, warning levels and predefined response actions, and is dynamically populated through a mobile application that enables users to submit geolocated impact reports, including text descriptions, images and links to official information sources. A central component of the database is its connection to in situ sensors, forecasts and warning thresholds, enabling comparisons of observed impacts with forecasted conditions and triggered warning levels to support warning validation and refinement. In parallel, artificial intelligence techniques are being integrated to support the organisation and filtering of incoming impact reports, and to explore the extraction of event-based impact information, with the aim of informing future impact-based warning threshold assessment.

This impact database ecosystem is embedded within the Site-Specific Early Warning System (SS-EWS) architecture, an operational framework for designing and implementing impact-based warnings at vulnerable locations to trigger self-protection actions. The SS-EWS, including the database prototype, is currently being implemented, improved and evaluated in close collaboration with civil protection and emergency authorities across vulnerable municipalities in Europe within the Horizon Europe GOBEYOND project, and in Catalonia (Spain) through the SAAI project, providing a broad co-design and real-world evaluation environment.

How to cite: Meléndez-Landaverde, E., Sempere-Torres, D., González, V., and Sanz-García, R.: From impact data to impact-based warnings: developing an impact-centred database to support local warning validation, EGU General Assembly 2026, Vienna, Austria, 3–8 May 2026, EGU26-20343, https://doi.org/10.5194/egusphere-egu26-20343, 2026.

EGU26-20831 | ECS | Posters on site | HS4.5

Impact-based flood forecasting in India: evaluation of FHIM-India for fluvial flood impacts in Kerala 

Ali Mashhadi, Steven J. Cole, Steven C. Wells, Xilin Xia, and Robert J. Moore

Recent advances in ensemble meteorological forecasting, hydrological modelling, and flood inundation mapping have substantially improved flood hazard prediction. However, major gaps persist in translating hazard information into understandable, trusted, and actionable warnings based on the impacts of flood events, limiting the effectiveness of early warning–early action systems. A key challenge lies in linking hydrological hazard forecasts with exposure and vulnerability information to support impact-based decision-making. 

Constructing and evaluating flood disaster risk forecasts remains a complex and uncertain process, particularly due to the multi-dimensional and spatially heterogeneous nature of vulnerability and exposure data. Impact-based Forecasting (IbF) of flooding seeks to address these challenges by explicitly connecting flood hazard forecasts to potential societal impacts in space and time. 

FHIM-India – Flood Hazard Impact Model for India – is an impact-based flood forecasting framework that integrates ensemble numerical weather predictions, distributed hydrological modelling (Grid-to-Grid), and hydrodynamic flood simulations (SynxFlow) with exposure and vulnerability datasets. Here, FHIM-India is evaluated for fluvial flood impacts in the state of Kerala, south-western India using over 30 years of recorded impacts. 

The FHIM-India framework is repurposed to generate daily flood impact hindcasts for multiple districts in Kerala over the period 1991–2022 using observed rainfall data as input. Modelled impact indicators related to affected population and property are evaluated against reported historical impact data. The performance of the impact-based hindcasts is assessed relative to warnings derived using fixed rainfall threshold-based approaches. 

Results indicate that FHIM-India improves the identification and spatial discrimination of mid- to high-severity flood events compared with warnings based on fixed rainfall thresholds. The framework demonstrates strong potential for use in operational impact-based flood forecasting to support early warning systems and risk-informed decision-making.

How to cite: Mashhadi, A., Cole, S. J., Wells, S. C., Xia, X., and Moore, R. J.: Impact-based flood forecasting in India: evaluation of FHIM-India for fluvial flood impacts in Kerala, EGU General Assembly 2026, Vienna, Austria, 3–8 May 2026, EGU26-20831, https://doi.org/10.5194/egusphere-egu26-20831, 2026.

EGU26-22105 | ECS | Posters on site | HS4.5

River Flood Impact Forecasting to Support Humanitarian Anticipatory Action 

Eliane Kobler, Jamie McCaughey, Luca Severino, Lukas Riedel, Marc van den Homberg, Aklilu Teklesadik, Leonardo Milano, and David Bresch

Millions of people worldwide are affected by river floods each year. To facilitate early action, humanitarian organisations have adopted anticipatory action frameworks that link pre-agreed activities and their funding with forecasted peak river flow thresholds. However, the scale of humanitarian needs is primarily determined by flood impacts rather than hazard magnitude alone, limiting the effectiveness of streamflow-based triggers.

In the Humanitarian Action Challenges project we work closely with our humanitarian partners, UN OCHA and the Netherlands Red Cross, to engage with national Red Cross societies and key stakeholders in Ethiopia, Nigeria, and Uganda. The goal of the project is to move beyond streamflow thresholds alone to additionally provide impact forecasts, such as estimates of affected populations, in order to improve anticipatory action of humanitarian organisations. 

As a first step, and to assess the feasibility of this approach, we analyse past river flood events in Ethiopia, Nigeria, and Uganda. We combine flood extents derived from Global Flood Awareness System (GloFAS) discharge forecasts and JRC hazard maps with geospatial data on population exposure and vulnerability using the open-source risk assessment platform CLIMADA. Modelled affected populations are compared with reported impacts using an event severity ranking. No systematic bias is observed, with both over- and underestimation across events. Rankings are highly sensitive to the inclusion of flood protection standards from the FLOPROS dataset. Comparisons with remotely sensed flood extents and analyses of model drivers highlight key limitations and sources of uncertainty for trigger calibration. These preliminary insights support the development of impact forecasts and the design of impact-based triggers for anticipatory action by humanitarian partners.

How to cite: Kobler, E., McCaughey, J., Severino, L., Riedel, L., van den Homberg, M., Teklesadik, A., Milano, L., and Bresch, D.: River Flood Impact Forecasting to Support Humanitarian Anticipatory Action, EGU General Assembly 2026, Vienna, Austria, 3–8 May 2026, EGU26-22105, https://doi.org/10.5194/egusphere-egu26-22105, 2026.

EGU26-23190 | Posters on site | HS4.5

Designing Sub-Regional Anticipatory Action for Hurricanes in the Eastern Caribbean 

Marc van den Homberg, Aklilu Teklesadik, Corina Markodimitraki, Mahée-Théa Viton, Jérémy   Mouton, Mathilde Duchemin, Lisette de Valk, and Memory Kumbikano

Small Island Developing States (SIDS) in the Eastern Caribbean face escalating hurricane risk under climate change, with impacts driven by compound hazards including extreme wind, rainfall, and storm surge. Anticipatory Action (AA) mechanisms—where predefined actions are activated based on forecast thresholds—offer a means to translate advances in climate and weather prediction into timely, risk-reducing interventions. However, designing robust, decision-relevant trigger models that balance forecast skill, uncertainty, and operational feasibility remains a key challenge, particularly in multi-country contexts.

We studied the feasibility of a sub-regional Early Action Protocol (EAP) covering Saint Kitts and Nevis, Dominica, and Antigua and Barbuda, and focused specifically on how to design a sub-regional trigger model. Using stakeholder consultations, analysis of national disaster management systems, analysis of historical and synthetic events by modelling wind, surge, and rainfall, and review of existing forecasting products, we assessed trigger options across temporal scales, compound hazard components, and impact relevance.

Results show that the wind and track forecasts from the US National Hurricane Centre demonstrated substantial improvements in accuracy over recent decades. The NHC’s 48-hour track error now averages about 90 km, meaning that areas at risk can be identified with an acceptable uncertainty in terms of storm size and asymmetry. Early actions possible within this lead time can include mobilizing communities, cash distributions, and prepositioning stock. Also, the NHC forecast is the official source, widely adopted by the respective national agencies in the three countries. In the future, the trigger model could be improved by, for example, ECMWF’s AIFS, Google DeepMinds GraphCast, or Microsoft Research’s Aurora, as these have demonstrated the ability to deliver medium-range forecasts with skill comparable to or surpassing traditional numerical models. While these AI models are not yet operational tools at national centres, they are available for experimental use and could be incorporated through the Caribbean Institute for Meteorology and Hydrology (CIMH) as complementary resources for rapid local updates and scenario planning within a newly developed anticipatory framework. In that case, a layered trigger architecture could be designed, containing: (i) probabilistic tropical cyclone track and intensity forecasts; (ii) impact-oriented thresholds linked to rainfall accumulation, wind exposure, and storm surge; and (iii) contextual readiness criteria reflecting response capacities.

Our study highlights key design principles for anticipatory trigger models in SIDS now and in the future: transparency, simplicity, tolerance to forecast uncertainty, and alignment with decision timelines for early action. By articulating how forecast information can be operationalised across borders, this contribution advances the integration of climate services and anticipatory humanitarian action in highly exposed island regions. A sub-regional trigger model can leverage shared meteorological information and pooled technical expertise, while allowing country-specific activation thresholds to account for differing exposure and coping capacities. A future initiative will focus on scaling up to Barbados and Belize.

How to cite: van den Homberg, M., Teklesadik, A., Markodimitraki, C., Viton, M.-T., Mouton, J.  ., Duchemin, M., de Valk, L., and Kumbikano, M.: Designing Sub-Regional Anticipatory Action for Hurricanes in the Eastern Caribbean, EGU General Assembly 2026, Vienna, Austria, 3–8 May 2026, EGU26-23190, https://doi.org/10.5194/egusphere-egu26-23190, 2026.

Urban flood risks are characterized by substantial uncertainties, which pose challenges for deterministic inundation predictions in risk-informed applications. Consequently, ensemble-based probabilistic flood forecasting has gained increasing attention for its ability to indicate the likelihood of extreme inundation events and associated damage risks. This study presents an efficient and generalizable diffusion-based super-resolution (SR) framework for rapid, ensemble-based, high-resolution urban flood forecasting. The framework first employs a two-dimensional hydrodynamic model to simulate flood dynamics over extensive urban areas at a coarse spatial resolution (100 m). The resulting simulations are subsequently downscaled to a fine spatial resolution (5 m) using a conditional diffusion model that performs single-step, distillation-free super-resolution. By leveraging the inherent stochasticity of diffusion models, the framework naturally supports ensemble generation, allowing for uncertainty quantification in high-resolution inundation predictions. Applied to the Beijing Sub-Center, the model efficiently simulates the spatiotemporal flood dynamics of a 24-hour rainfall event in less than 10 minutes, producing high-fidelity, fine-scale flood inundation maps at substantially reduced computational cost. The integrated framework provides a scalable and uncertainty-aware pathway for real-time, high-resolution urban flood forecasting and ensemble-based scenario analysis in large metropolitan regions.

How to cite: Yin, B. and Li, R.: Efficient and Generalizable Ensemble Urban Inundation Forecasting with Diffusion-Based Super-Resolution, EGU General Assembly 2026, Vienna, Austria, 3–8 May 2026, EGU26-2411, https://doi.org/10.5194/egusphere-egu26-2411, 2026.

EGU26-2739 | ECS | Orals | HS4.6

A Local-Remote AutoGRU Model for Long-Term Monthly Precipitation Forecasting in Asian Monsoon Region 

Yichen Yang, Congcong Li, Zhongjing Wang, Xiaoze Chen, Dan Liu, and Boosik Kang

Long-term precipitation forecasting is a critical issue for water resource management, disaster mitigation, and agricultural production. However, due to the uncertainty and dependency on global cycle events and various impacts, seasonal precipitation forecasting remains a challenge in terms of both lead time and accuracy. To address the problem, a Local-Remote AutoGRU model was developed based on the background of the Asian Monsoon Region (AMR). The structure of the model consists of four key components: screening and selection prediction factor from local and global cycle events; decomposition and extraction prediction features, including trends, periodicities, and correlations; employing the Gated Recurrent Unit (GRU) machine learning algorithm to explore the relationship between monthly precipitation and input series; and finally, composing and reconstructing the prediction series. This integrated strategy enables the prediction of monthly precipitation by leveraging local precipitation periodicity and tendency, global cycle events and grid location information. The results across 6.33 million km2 Asian Monsoon Region demonstrated the proposed model’s remarkable performance. It achieved an overall NSE of 0.816 in the total area and all 12 lead months, representing a 21.69% accuracy improvement over baseline models. Additionally, the study revealed that the ENSO-related global cycle events play the primary drivers in the AMR, contributing 25.86–33.47% impacts to monthly precipitation in 7-10 months in advance, only next to the local precipitation periodicity. This study provides an effective approach for long-term monthly precipitation forecasting, particularly for the AMR.

How to cite: Yang, Y., Li, C., Wang, Z., Chen, X., Liu, D., and Kang, B.: A Local-Remote AutoGRU Model for Long-Term Monthly Precipitation Forecasting in Asian Monsoon Region, EGU General Assembly 2026, Vienna, Austria, 3–8 May 2026, EGU26-2739, https://doi.org/10.5194/egusphere-egu26-2739, 2026.

EGU26-2999 | ECS | Orals | HS4.6

Predictability and skill of large-scale extreme droughts using global bias-corrected seasonal forecasts (SEAS5-BCSD) 

Jan Niklas Weber, Christof Lorenz, Tanja Schober, Hannes Dehn, and Harald Kunstmann

Devastating large-scale droughts are increasing in frequency and severity under climate change, posing major challenges for preparedness and mitigation. Reliable information on the timing, extent, and intensity of droughts is therefore crucial. Seasonal forecasts with lead times of up to twelve months offer potential for early drought warning, but raw model output is often affected by substantial biases and temporal drifts relative to reanalysis products such as ERA5, limiting its direct applicability.

Here, we assess the skill of a global bias-corrected ECMWF SEAS5 seasonal forecast dataset (SEAS5-BCSD, DOI: in preparation), processed using the Bias Correction and Spatial Disaggregation (BCSD) method, for predicting extreme drought events at multiple time scales. For the period 1981–2024, we analyze 36 major droughts selected based on spatial extent and mean Standardized Precipitation Evapotranspiration Index (SPEI), representing the two most severe events per continent (excluding Antarctica) and accumulation period (1-, 3-, and 6-month SPEI).

Forecast performance is evaluated using probabilistic skill metrics including the Continuous Ranked Probability Skill Score (CRPSS) and the Brier Skill Score (BSS). Results show positive CRPSS skill relative to climatology for all analyzed droughts, with SEAS5-BCSD consistently outperforming uncorrected forecasts across all metrics. One-month droughts exhibit the highest predictability, while three- and six-month droughts show comparable but slightly reduced skill. Predictability varies regionally, with African droughts showing the highest skill and North American droughts the lowest. Forecast skill is highest for moderate drought thresholds (SPEI < −1) and decreases for more severe events (SPEI < −1.5 and −2), though remaining superior to climatology in most cases.

Overall, the results demonstrate that bias-corrected seasonal forecasts substantially enhance the predictability of extreme large-scale droughts and provide clear added value over both climatology and uncorrected seasonal forecasts.

How to cite: Weber, J. N., Lorenz, C., Schober, T., Dehn, H., and Kunstmann, H.: Predictability and skill of large-scale extreme droughts using global bias-corrected seasonal forecasts (SEAS5-BCSD), EGU General Assembly 2026, Vienna, Austria, 3–8 May 2026, EGU26-2999, https://doi.org/10.5194/egusphere-egu26-2999, 2026.

Reliable medium- and long-term streamflow forecasting is critical for water resources management and hydropower generation. This study proposes a 60-day streamflow forecasting framework that systematically integrates a convolutional neural network (CNN) for bias correction of precipitation forecasts from the UK Met Office (UKMO) numerical weather prediction model, the Geomorphology-Based Eco-Hydrological Model (GBEHM) for streamflow simulation, and an autoregressive with exogenous input (ARX) model for statistical post-processing. Applying the proposed framework to the Upper Yangtze River Basin, results indicate that the CNN model reduces the areal-averaged precipitation root mean square error (RMSE) by around 35% and elevates the temporal correlation coefficient (TCC) from 0.62 to 0.74 against raw UKMO forecasts across the 60-day horizon, with performance gains amplifying at longer lead times. Subsequently, when driving the GBEHM with corrected precipitation and applying ARX post-processing, the streamflow forecasts exhibit substantial enhancements with a reduction in RMSE of 36%, a decrease in relative error (RE) from 48.2% to 17.4%, and an increase in Nash–Sutcliffe efficiency (NSE) from 0.33 to 0.72 compared to those driven by raw forecasts in terms of 60-day mean performance. Error decomposition identifies precipitation forecast errors which intensify with lead time as the dominant source of uncertainty for medium- and long-term streamflow forecasting, while confirming that hydrological model uncertainty remains a significant component, highlighting that the selection of a robust hydrological model is crucial for enhancing the reliability and predictive skill of the streamflow forecasts. By systematically leveraging the CNN to mitigate drifting meteorological biases, the GBEHM to capture physical catchment dynamics, and the ARX to minimize residual errors, the proposed framework yields volumetrically accurate and temporally consistent forecasts across an extended 60-day horizon, providing valuable decision support and sufficient lead time for regional water management.

How to cite: Liu, Z., Yang, H., and Yang, D.: A 60-day streamflow forecasting framework coupling deep learning bias correction with process-based hydrological modeling in the Upper Yangtze River Basin, EGU General Assembly 2026, Vienna, Austria, 3–8 May 2026, EGU26-3301, https://doi.org/10.5194/egusphere-egu26-3301, 2026.

EGU26-3462 | ECS | Orals | HS4.6

Coupled Risk-aware Agent-Based Framework and Hydrodynamic Modelling for Urban Flood Impact Assessment 

Saeid Najjar-Ghabel, Farzad Piadeh, Kourosh Behzadian, and Atiyeh Ardakanian

Agent-based modelling (ABM) is increasingly recognised as an essential tool for urban flood risk assessment to analyse the response of people and transport systems under dynamically evolving flood conditions [1,2]. However, the dynamic evolution of risk awareness and the exchange of risk-related information during flood events remain inadequately represented in many existing modelling approaches [3, 4]. This study presents an integrated flood-impact assessment framework that couples a hydrodynamic flood model with a risk-based ABM to evaluate the impact of flooding on travelling population groups and road network performance.

Flood modelling is simulated using a hydrodynamic model calibrated through the sequential uncertainty-fitting algorithm, providing reliable spatio-temporal flood characteristics. These hydraulic outputs are dynamically linked to an ABM representing urban populations with realistic daily activity. People’s behavioural adaptation is governed by a novel risk priority index, which evolves based on direct flood exposure, institutional communication, and risk-information exchange. People are assumed to interact together through Watts-Strogatz small-world network, enabling realistic diffusion of risk awareness across the population.

Results show that flood-induced road closures trigger sharp increases in travel times. Agent-based analysis revealed that, among population groups, adults experienced the highest total flood exposure, followed by seniors and children. Moreover, travel mode strongly influences vulnerability, with cycling users experiencing the highest exposure levels, followed by public transit, walking, and driving users. The proposed framework provides a robust decision-support tool for evaluating how risk awareness and social interaction through an agent-based model influence road users and road network performance.

References

[1] Bakhtiari, V., Piadeh, F., Chen, A. S., & Behzadian, K. (2024). Stakeholder analysis in the application of cutting-edge digital visualisation technologies for urban flood risk management: A critical review. Expert Systems with Applications, 236, 121426. https://doi.org/10.1016/j.eswa.2023.121426

[2] Najjar Ghabel, S.,  Zarghami, M., Akhbari, M., & Nadiri A.A.  (2019). Groundwater Management in Ardabil Plain Using Agent-Based Modeling, Iran-Water Resources Research 15, 1–16.

[3] Kunreuther, H., & Pauly, M. (2006). Rules rather than discretion: Lessons from Hurricane Katrina. Journal of Risk and Uncertainty, 33(1–2), 101–116. https://doi.org/10.1007/s11166-006-0173-x

[4] Lo, A. Y. (2013). The role of social norms in climate adaptation: Mediating risk perception and flood insurance purchase. Global Environmental Change, 23(5), 1249–1257. https://doi.org/10.1016/j.gloenvcha.2013.07.019

How to cite: Najjar-Ghabel, S., Piadeh, F., Behzadian, K., and Ardakanian, A.: Coupled Risk-aware Agent-Based Framework and Hydrodynamic Modelling for Urban Flood Impact Assessment, EGU General Assembly 2026, Vienna, Austria, 3–8 May 2026, EGU26-3462, https://doi.org/10.5194/egusphere-egu26-3462, 2026.

Urban and pluvial flooding increasingly threaten green infrastructure, particularly trees, which play a critical role in urban resilience, drainage, and ecosystem services [1]. Despite their importance, the physical mechanisms governing tree uprooting under pluvial flood conditions remain poorly quantified, especially with respect to flow characteristics, soil properties, and planting design [2].

This study presents a comprehensive experimental investigation into the impact of pluvial flooding on tree stability, with a specific focus on uprooting processes under controlled hydraulic conditions. More than 200 flume experiments were conducted using bonsai trees as scaled physical analogues of urban trees. The experiments were designed to systematically examine the influence of flow intensity, planting configuration, and soil depth on tree uprooting. Tests were carried out with both single-tree and two-tree arrangements to assess the effects of interaction between neighbouring trees. A wide range of flow conditions was imposed, representing low, medium, and high-intensity pluvial flooding scenarios, while soil depth was varied to simulate different urban planting constraints.

The results demonstrate that tree uprooting is strongly governed by design layout parameters, particularly tree height and the spacing between trees. Closely spaced trees exhibited altered flow patterns and load distributions, leading to either increased stability due to flow shielding or enhanced vulnerability due to soil disturbance, depending on the configuration. Soil depth was found to be a critical controlling factor, with shallower soils significantly reducing root anchorage capacity and increasing the likelihood of uprooting under flood conditions.

Analysis of flow intensity revealed the existence of a threshold behaviour. While low-intensity flows generally resulted in negligible structural response, medium- and high-intensity flows produced comparable levels of hydrodynamic loading, with no substantial increase in uprooting probability beyond a critical flow threshold. This indicates that once a certain hydraulic forcing is exceeded, additional increases in flow intensity do not proportionally amplify adverse impacts. Instead, the transition across this threshold marks the onset of significant instability and uprooting risk.

These findings highlight the non-linear nature of tree–flow–soil interactions during pluvial flooding and underscore the importance of considering layout design and subsurface constraints in urban tree planting strategies. The identification of critical thresholds for adverse impacts has practical implications for flood-resilient urban planning, suggesting that appropriate spacing, height selection, and soil depth provision can substantially enhance tree stability under extreme rainfall events.

[1] Piadeh, F., Bakhtiari, V., Piadeh, F. (2026). Automated novel real-time framework for rainfall data imputation in flood early warning systems, Engineering Applications of Artificial Intelligence, 1164(B), p.113348. https://doi.org/10.1016/j.engappai.2025.113348

[2] Défossez, P., Veylon, G., Yang, M., Bonnefond, J.M., Garrigou, D., Trichet, P., Danjon, F. (2021). Impact of soil water content on the overturning resistance of young Pinus Pinaster in sandy soil, Forest Ecology and Management, 480, p.118614.

How to cite: Piadeh, F.: Threshold Behaviour and Design Controls on Tree Uprooting during Pluvial Flood Events: A Hybrid AI and Experimental Flume-Based Study , EGU General Assembly 2026, Vienna, Austria, 3–8 May 2026, EGU26-5199, https://doi.org/10.5194/egusphere-egu26-5199, 2026.

EGU26-5615 | ECS | Orals | HS4.6

A non-explicit representation of macropores in the SVS land surface scheme improves streamflow simulations under frozen soil conditions 

Benjamin Bouchard, Vincent Vionnet, Étienne Gaborit, and Vincent Fortin

Soil freezing is a major cold region process that influences the hydrological behavior of northern catchments during winter rainfall or snowmelt events. Growing ice within the soil matrix reduces the pore space available for water to infiltrate, while the presence of soil macropores in structured soils maintains rapid water percolation even in frozen conditions. Representing the complex effect of soil freezing on water infiltration in land surface models is therefore a challenging task. This is especially the case for operational systems where the integration of a physical process must improve or maintain reasonable model performance and minimize the increase in complexity and computational cost. In this study, we propose a conceptual approach to represent the effect of macropores on frozen soil infiltration into the Soil, Vegetation and Snow (SVS) land-surface scheme used within the operational prediction systems of Environment and Climate Change Canada (ECCC). In this approach, the macropores are activated when soil moisture exceeds 55% of the available pore space. We assessed the impact of this new approach on streamflow simulations at more than 580 hydrometric stations located in the Great Lakes-St. Lawrence domain over a five-year period. The conceptual representation of macropores results in a major upgrade to the soil freezing scheme of SVS with an improvement of the Kling-Gupta Efficiency (KGE) at 88% of the stations (KGEmed = 0.55; KGEmed = 0.28) as it better captures the timing and amplitude of peak flows. Detailed analysis of a decomposed hydrograph shows that the macropore configuration increases SVS soil drainage (slow response) and reduces surface runoff and lateral flow (quick response). The SVS experiment with macropores also results in accurate simulations of freezing depth and surface meteorological variables (i.e. air and dew point temperature) which paves the way for an operational implementation of this new configuration in the numerical weather and hydrologic prediction systems at ECCC.

How to cite: Bouchard, B., Vionnet, V., Gaborit, É., and Fortin, V.: A non-explicit representation of macropores in the SVS land surface scheme improves streamflow simulations under frozen soil conditions, EGU General Assembly 2026, Vienna, Austria, 3–8 May 2026, EGU26-5615, https://doi.org/10.5194/egusphere-egu26-5615, 2026.

EGU26-7573 | Orals | HS4.6 | Highlight

The C3S Water Service: Operational seasonal forecasts and climate change projections co-developed for the water sector  

Katie Facer-Childs, Lucy Barker, Stephan Thober, Peter Berg, Inge de Graaf, Matthias Kelbling, Katharina Klehmet, Kit Macleod, Luis Samaniego, Raffaele Vignola, Edwin Sutanudjaja, Niko Wanders, Shaun Harrigan, and Chiara Cagnazzo and the C3S Water Service Team

The Copernicus Climate Change Service (C3S) Water Service is an operational hydrological information system delivering authoritative water and hydroclimate information at European and global scales, spanning current conditions, seasonal forecasts, and long-term climate projections. Commissioned by ECMWF on behalf of the European Commission, the C3S Water Service supports climate change adaptation and resilient water management across sectors by delivering data via interactive web applications and the Copernicus Climate Data Store (CDS). The service is delivered by a consortium of European research centres, universities and operational hydrometeorological organisations, ensuring rigorous scientific underpinning while promoting operational sustainability and user-oriented design.  

The operationalisation of the C3S Water Service advances beyond experimental prototypes, engaging users to co-develop and deliver timely, quality-controlled hydrological information at global and regional scales. Meeting universal user needs, it provides variables such as river discharge, soil moisture, runoff, and snow water equivalent, alongside specific indicators defined by users, tailored to their sectors. This supports operational decision-making for flood and drought risk, water resources planning, and climate risk assessments.  

The C3S Water Service adopts a multi-model ensemble framework, enabling a seamless service from seasonal outlooks to multi-decadal assessments and climate projections. Consistent re-gridding and bias adjustment are applied to the climate input data for both the seasonal forecasting system and the hydroclimate projections production. The seasonal forecast models currently used are the ECMWF SEAS5 model and CMCC-SPS3.5, with the inclusion of more systems planned over the coming years. For climate projections, a selection of members from the CMIP6 ensemble is used for the Global domain, and CMIP6 EURO-CORDEX members for the European domain. The hydrological models ECLand, HYPE, JULES, LISFLOOD, mHM, PCR-GLOBWB and VIC-WUR are applied consistently across both time horizons at a resolution of 5 km over Europe, and 0.1 deg. (approximately 10 km) globally. In addition, the service provides the processed meteorological forcing data, allowing future inclusion of additional hydrological models with minimal effort. 

Critically, the C3S Water Service is founded on an iterative development and community engagement strategy to refine product scope, improve usability, and co-develop applications that meet evolving scientific and operational needs. Through ongoing workshops, user forums, and collaborative research activities, we invite hydrologists, hydroclimate modellers, data scientists, water practitioners, and policy makers to contribute insights, test emerging products, and shape the future trajectory of the service. 

How to cite: Facer-Childs, K., Barker, L., Thober, S., Berg, P., de Graaf, I., Kelbling, M., Klehmet, K., Macleod, K., Samaniego, L., Vignola, R., Sutanudjaja, E., Wanders, N., Harrigan, S., and Cagnazzo, C. and the C3S Water Service Team: The C3S Water Service: Operational seasonal forecasts and climate change projections co-developed for the water sector , EGU General Assembly 2026, Vienna, Austria, 3–8 May 2026, EGU26-7573, https://doi.org/10.5194/egusphere-egu26-7573, 2026.

EGU26-8946 | ECS | Orals | HS4.6

Spatiotemporal Graph Neural Network for River Discharge Prediction 

Lukas Ninnemann and Jochen Schanze

Discharge prediction is essential for water resource management, enabling a better understanding of hydrological variability and its response to environmental and human factors. We present a Spatio-Temporal Graph Geural Network (STGNN) model predicting hourly river discharge for the upper Weiße Elster, flowing into the Saale river a tributary of the Elbe. The STGNN is a novel graph-based Long Short-Term Memory (LSTM) neural network jointly modeling spatial connectivity and temporal dynamics. It uses elevation, land‑use and soil data as well as approximately one year of temporally aggregated weather variables, but no previous discharge to generate one prediction at the 8793 nodes of this catchment. It was evaluated against a traditional random forest regression model and a graph neural network without explicit temporal structure, outperforming them across multiple metrics, achieving a $R^2$ of 0.763, a Root Mean Square Error (RMSE) of 9.54e-3 mm/h and a Kling–Gupta Efficiency (KGE) of 0.753. The trained STGNN was applied to the nearby Schwarzwasser catchment and achieved a KGE of 0.618, highlighting is ability to generalize. These results show that data-driven modeling can profit from physical realism and offer an adaptable framework combining predictive accuracy and generalizability to support water resource management.

How to cite: Ninnemann, L. and Schanze, J.: Spatiotemporal Graph Neural Network for River Discharge Prediction, EGU General Assembly 2026, Vienna, Austria, 3–8 May 2026, EGU26-8946, https://doi.org/10.5194/egusphere-egu26-8946, 2026.

The focus of this activity is on seasonal meteorological forecasts (time horizon greater than one month), which are crucial for implementing strategies to manage hydroelectric reservoirs, especially for large-capacity plants where water resources can be stored during wetter seasons to ensure availability during dry periods.

Seasonal forecasts are a cutting-edge product, consisting of a statistical synthesis of meteorological information up to seven months ahead. Since the atmosphere is a chaotic system, forecast evolution is sensitive to errors in initial conditions, limiting the ability to predict weather variations beyond 15 days. However, longer-term forecasts are possible by considering components of the Earth system that evolve more slowly than the atmosphere, such as the oceans. Seasonal forecasts rely on an ensemble of different atmospheric evolutions, from which average values and expected anomalies for upcoming seasons can be derived, compared to historical periods with available reference climatology.

Currently, there is limited evidence in the literature of using seasonal forecasts in the hydroelectric context. In this activity, their performance is assessed at the national scale of Italy for the ensemble mean of key meteorological variables: 2-meter temperature and precipitation. For temperature, results show a fair level of performance in the early months, suggesting added value compared to simple climatology, with degradation as the forecast horizon extends. For precipitation, performance is generally lower than for temperature, and the model struggles to provide more useful information than climatology at longer horizons. Snow is also considered, revealing a significant underestimation by the forecast model, and a simple correction method is proposed.

How to cite: Sperati, S.: Preliminary Assessment of Seasonal Weather Forecasts for Water Resources Management, EGU General Assembly 2026, Vienna, Austria, 3–8 May 2026, EGU26-9554, https://doi.org/10.5194/egusphere-egu26-9554, 2026.

Reliable subseasonal streamflow forecasting is essential for flood risk management, reservoir operation, and water allocation in large monsoon-dominated river basins such as the Godavari River Basin, India. However, forecast skill remains constrained by uncertainties in meteorological forcing and hydrological model structure, particularly at longer lead times. This study evaluates the relative contributions of precipitation input uncertainty and hydrological model uncertainty within a 1–4 week (up to 30-day) streamflow forecasting framework by integrating subseasonal-to-seasonal (S2S) precipitation forecasts with a physics-based distributed hydrological model. Deterministic and ensemble precipitation forecasts from the S2S Hydrological Simulation System are used to drive the Soil and Water Assessment Tool (SWAT), with precipitation bias correction implemented through empirical quantile mapping using the India Meteorological Department (IMD) 0.25° × 0.25° gridded rainfall dataset. The Godavari basin is discretized into headwater, midstream, and large downstream sub-basins, and simulated streamflow forecasts are evaluated against Central Water Commission (CWC) daily discharge observations. Forecast performance is assessed across lead times using both deterministic and probabilistic skill metrics, including coefficient of determination (R²), Nash–Sutcliffe efficiency (NSE), root mean square error (RMSE), percent bias (PBIAS), and flow-regime-specific diagnostics for high-flow (≥90th percentile) and low-flow (≤10th percentile) conditions. Results show a systematic decline in forecast skill with increasing lead time, with substantial variability across precipitation products, basin scales, and flow regimes. Bias correction of S2S precipitation significantly reduces systematic discharge errors and enhances forecast skill up to 3–4 weeks, particularly for low-flow conditions and larger downstream sub-basins. While hydrological model structure dominates forecast uncertainty at shorter lead times, precipitation forcing uncertainty becomes the primary source of error at longer lead times. Overall, the study demonstrates the value of jointly evaluating meteorological and hydrological uncertainties and highlights the potential of subseasonal hydrological forecasting to support operational flood early warning and water management decisions in large, regulated, monsoon-driven river basins.


How to cite: Singh, A. and Rathinasamy, M.: Subseasonal Streamflow Forecasting in the Godavari River Basin: Assessing Meteorological and Hydrological Uncertainties under Monsoon Conditions, EGU General Assembly 2026, Vienna, Austria, 3–8 May 2026, EGU26-10524, https://doi.org/10.5194/egusphere-egu26-10524, 2026.

EGU26-10919 | ECS | Posters on site | HS4.6

Climate Change Impacts on Alpine Springs: Shifts in Discharge Seasonality and Water Availability 

Martin Masten, Magdalena Seelig, Simon Seelig, Matevž Vremec, Thomas Wagner, and Gerfried Winkler

Spring water is a vital resource and a cornerstone of Austria’s drinking water supply, providing roughly half of the national demand and serving as the sole source in some regions. Ongoing climate change is rapidly modifying hydrological conditions, particularly in the Alpine region. Understanding the future evolution of spring discharge dynamics is therefore essential for the sustainable management of Austria’s water resources. This study investigates the impact of climate change on 76 alpine springs distributed across Austria. For each spring, several potential catchments are delineated and a rainfall–runoff model incorporating a snow module is used to determine the most plausible catchment. Subsequently, the model is driven by climate input data from three RCP scenarios (2.6, 4.5, and 8.5) to assess climate change impacts up until the year 2100. Comparing three model periods (historical reference, near future, and far future) enables a systematic assessment of temporal changes and climate change impacts. Analyses are carried out for individual springs and for hydrologically classified groups with specific discharge characteristics. The results reveal a pronounced shift in seasonal discharge especially for fast-responding and snow-dominated springs, characterized by a strong increase in discharge during spring months for snow-dominated springs and a marked decrease in summer discharge for both fast-responding and snow-dominated springs. Furthermore, the timing of the 7-day minimum flow shifts into the summer season for all spring groups. Examining the spatial patterns of individual springs across Austria reveals that, in the near future, a decrease in total discharge is projected in the southwest of Austria under all RCP scenarios. In contrast, the far future shows an improvement for alpine springs under RCP 2.6 and 4.5, whereas under RCP 8.5, decreases in total discharge are projected to become more widespread across Austria. These findings offer a meaningful reference for future water management planning in Austria, highlighting potential trends while acknowledging scenario-based uncertainties.

How to cite: Masten, M., Seelig, M., Seelig, S., Vremec, M., Wagner, T., and Winkler, G.: Climate Change Impacts on Alpine Springs: Shifts in Discharge Seasonality and Water Availability, EGU General Assembly 2026, Vienna, Austria, 3–8 May 2026, EGU26-10919, https://doi.org/10.5194/egusphere-egu26-10919, 2026.

EGU26-13096 | ECS | Orals | HS4.6

AI-driven Early Warning of Process Anomalies in Wastewater Treatment Plants Using Real-time Monitoring Data 

Sen Yang, Kourosh Behzadian, Chiara Coleman, Timothy G. Holloway, and Luiza Campos

Reliable early warning is crucial for the operational stability of urban wastewater treatment infrastructure in response to emergencies that might threaten the environment and human health. In sewage treatment works (STWs), process anomalies can be driven by extreme influent loads, episodic operational interventions, or sensor faults. Therefore, under these multivariate, non-stationary conditions, it is challenging to ensure timely and robust practical response based on manual supervision alone. This study presents an AI-driven analytical framework for real-time early warning of process anomalies using multi-source sensor monitoring data. The framework offers a pipeline to transform continuous, real-time monitored sensor data into fixed-length time-series windows suitable for deep learning and real-time inference. A deep unsupervised learning model is innovatively introduced to learn multivariate dynamics and cross-variable dependencies of normal operation modes, and then to generate window-level scoring and map it to early warning alerts. To improve the interpretability, window-level alerts are aligned with timestamped, manually recorded event management logs to distinguish between sensor malfunctions and process disturbances. The framework is demonstrated on a multi-year real-world urban STW’s dataset, and evaluated based on detection timeliness, false alarm behaviour, and consistency with logged operational events. Results indicated that the proposed framework is a feasible approach to integrate contextual evidence with AI-driven early warning alarms. It also offers a promising powerful tool to support real-time anomaly diagnosis and decision-making for STWs’ operators.

How to cite: Yang, S., Behzadian, K., Coleman, C., Holloway, T. G., and Campos, L.: AI-driven Early Warning of Process Anomalies in Wastewater Treatment Plants Using Real-time Monitoring Data, EGU General Assembly 2026, Vienna, Austria, 3–8 May 2026, EGU26-13096, https://doi.org/10.5194/egusphere-egu26-13096, 2026.

EGU26-13909 | ECS | Orals | HS4.6

Seasonal meteo-hydrological forecasts: a two-level bias-corrected high-resolution modelling chain in a coastal Mediterranean area 

Luca Furnari, Fabio Cortale, Christof Lorenz, Harald Kunstmann, Giuseppe Mendicino, and Alfonso Senatore

Seasonal hydro-meteorological forecasts are increasingly crucial for water resource management and risk mitigation in Mediterranean coastal regions, where climate variability and anthropogenic pressures create complex challenges. However, the application of global seasonal prediction systems at local scales remains limited by systematic biases and coarse spatial resolution, which hinder their operational use in decision-making processes. This contribution presents a two-level BCSD (Bias Correction Spatial Disaggregation) seasonal forecasting system applied to a complex orographic Mediterranean area.

The system is based on the application of EQM (Empirical Quantile Mapping), as described by Lorenz et al. (2021), and focuses on precipitation and 2m air temperature variables from 1981 to 2024. The original product is the SEAS5 ensemble forecast released by ECMWF, with a horizontal resolution of approximately 36 km. The first level covers all of southern Italy and uses ERA5-Land as the reference dataset, yielding a horizontal resolution of approximately 9 km, whereas the second level, which can be seen as a refinement, focuses on the Calabria region and uses an observed, high-quality dataset, achieving a horizontal resolution of 5 km. Finally, a water balance model, calibrated over the Crati catchment, the main Calabrian river (southern Italy), has been intensively tested, focusing on the streamflow prediction. The performance has been evaluated using bias, spatial correlation, and the CRPSS (Continuous Ranked Probability Skill Score) metrics.

The results reveal systematic biases in raw SEAS5 predictions, with precipitation consistently underestimated by up to 20 mm/month, particularly during transitional months (May, June, and September), whereas 2m air temperature exhibits a persistent warm bias of approximately +1°C. The first-level BCSD correction substantially reduces these errors across southern Italy, yielding positive CRPSS values for precipitation, especially during the summer season (JJA), and marked improvements in temperature predictions (CRPSS > 0.40). The spatial correlation increases, with precipitation average increasing by 19% and temperature by 16%. However, compared with observation, residual biases persist at the catchment scale, with winter precipitation (NDJ) remaining underestimated by more than 60 mm/month over the Crati, and autumn temperatures (SON) slightly overestimated. The implementation of the second-level BCSD effectively addresses these local-scale discrepancies, enhancing the spatial correlation and CRPSS skill scores and ensuring that the hydrological model receives minimally biased forcings, predicting realistic streamflow.

This two-stage correction framework demonstrates the system's capability to preserve probabilistic forecast skill while enabling reliable impact assessments through the hydrological modeling chain, thereby bridging the gap between global seasonal predictions and local water resource management applications. As a further step, the first-level BCSD has been operationally implemented and is freely available at https://cesmma.unical.it/cwfv2/seasonal.html, as requested by several local stakeholders. In the future, the second-level BCSD and the hydrological impacts evaluation will be operationally implemented.

Reference: Lorenz, C., et al. Bias-corrected and spatially disaggregated seasonal forecasts: a long-term reference forecast product for the water sector in semi-arid regions, Earth Syst. Sci. Data, 13, 2701–2722, https://doi.org/10.5194/essd-13-2701-2021, 2021.

How to cite: Furnari, L., Cortale, F., Lorenz, C., Kunstmann, H., Mendicino, G., and Senatore, A.: Seasonal meteo-hydrological forecasts: a two-level bias-corrected high-resolution modelling chain in a coastal Mediterranean area, EGU General Assembly 2026, Vienna, Austria, 3–8 May 2026, EGU26-13909, https://doi.org/10.5194/egusphere-egu26-13909, 2026.

EGU26-13978 | Orals | HS4.6

A framework for automated event-based monitoring of flood forecast performance 

Maliko Tanguy, Gwyneth Matthews, Jasper M.C. Denissen, Ervin Zsoter, Michel Wortmann, Cinzia Mazzetti, Christel Prudhomme, Thomas Haiden, Benoît Vannière, Irina Sandu, and Christoph Rüdiger

The Destination Earth (DestinE) programme of the European Commission is developing high-resolution digital twins of the Earth system to improve the simulation of extreme weather events and their impacts. Within this initiative, the global Extremes Digital Twin (G-EDT) provides meteorological simulations at 4.4 km resolution that are coupled to ECMWF’s Land Surface Modelling System (ecLand) and the CaMa-Flood routing model to produce global river discharge forecasts. As digital twins move towards operational use, there is a growing need for automated approaches to assess forecast performance as events unfold, rather than relying solely on manual, delayed, aggregated evaluations. In this context, continuous verification becomes an integral part of operational monitoring, supporting both scientific development and system oversight.

This contribution presents the methodology behind an automated framework for weekly post-event flood analysis, designed to support near-real-time monitoring of flood activity and forecast skill. The system runs on a fixed weekly cycle and analyses recent hydrological conditions using river discharge reanalysis as a proxy for observations. Flood events are identified based on exceedance of return-period thresholds.

Individual station exceedances are grouped into spatially coherent flood events using a density-based clustering approach. For each detected event, river discharge forecasts are evaluated using event-based metrics that target key flood characteristics, including peak timing error, peak magnitude error and flood duration error, assessed across lead times and affected locations. In addition, contingency-table-based verification is applied to threshold exceedances, enabling assessment of forecast event detection and discrimination using metrics derived from hits, misses, false alarms and correct negatives, such as the equitable threat score (ETS) and critical success index (CSI).

Beyond weekly reporting, the framework supports temporal analysis of forecast performance, allowing changes in skill to be tracked over time and across evolving model configurations. While the current implementation focuses on DestinE flood predictions, the methodology is generic and extensible, with planned integration of additional systems and observational datasets.

How to cite: Tanguy, M., Matthews, G., Denissen, J. M. C., Zsoter, E., Wortmann, M., Mazzetti, C., Prudhomme, C., Haiden, T., Vannière, B., Sandu, I., and Rüdiger, C.: A framework for automated event-based monitoring of flood forecast performance, EGU General Assembly 2026, Vienna, Austria, 3–8 May 2026, EGU26-13978, https://doi.org/10.5194/egusphere-egu26-13978, 2026.

EGU26-14951 | ECS | Orals | HS4.6

Real-Time Flood Risk Assessment Using Coupled Agent-Based and AI-Driven Flood Forecasting Models 

Saeid Najjar-Ghabel, Kourosh Behzadian, Farzad Piadeh, and Atiyeh Ardakanian

Real-time flood risk assessment requires integrated frameworks that not only forecast flood dynamics accurately [1] but also capture how people respond to rapidly changing hazard conditions [2,3]. This study develops a novel real-time flood impact assessment framework that couples AI-driven flood forecasting (Long Short-Term Memory) with an agent-based model (ABM) to evaluate human mobility disruption and behavioural adaptation during flood events.

The outputs of the flood forecasting model are dynamically transferred to an ABM that represents urban populations, daily activity schedules, and transport networks. Agent (i.e., road users with different demographic attributes) decision-making is governed by a novel risk priority index (RPI), which integrates direct flood exposure, official communication, and demographic vulnerability of agents. Watts-Strogatz small-world network was used to consider the interaction of agents and realistically represent information diffusion, allowing the dissemination of risk awareness.

Results reveal substantial real-time impacts on urban mobility, with significant increases in travel times, particularly during peak hours. Moreover, incorporating behavioural adaptation through the RPI in agent-based modelling highlights the critical role of flood-risk information sharing among. A balanced combination of personal flood experience (Individual RPI) and socially shared information (average RPI of neighbouring agents) leads to faster and more effective formation of risk awareness across the population. The proposed AI-driven, agent-based framework enables real-time evaluation of flood impacts on population groups and transport systems, offering a powerful tool for emergency response planning and operational flood risk mitigation by local authorities.

References

[1] Piadeh F., Bakhtiari, V., Piadeh, F. (2026). Automated novel real-time framework for rainfall data imputation in flood early warning systems, Engineering Applications of Artificial Intelligence, 1164(B), p.113348. https://doi.org/10.1016/j.engappai.2025.113348

[2] Qin, H., Liang, Q., Chen, H., De Silva, V. (2024). A Coupled Human and Natural Systems (CHANS) framework integrated with reinforcement learning for urban flood mitigation. Journal of Hydrology643, 131918.  https://doi.org/10.1016/j.jhydrol.2024.131918

[3] Bakhtiari, V., Piadeh, F., Chen, A.S., Behzadian, K. (2024). Stakeholder analysis in the application of cutting-edge digital visualisation technologies for urban flood risk management: A critical review. Expert Systems with Applications, 236, 121426. https://doi.org/10.1016/j.eswa.2023.121426

How to cite: Najjar-Ghabel, S., Behzadian, K., Piadeh, F., and Ardakanian, A.: Real-Time Flood Risk Assessment Using Coupled Agent-Based and AI-Driven Flood Forecasting Models, EGU General Assembly 2026, Vienna, Austria, 3–8 May 2026, EGU26-14951, https://doi.org/10.5194/egusphere-egu26-14951, 2026.

EGU26-15051 | ECS | Orals | HS4.6

Event-based hydrological modeling for real-time flood forecasting under data-scarce conditions: insights from a subtropical watershed in Brazil 

Aryane Araujo Rodrigues, Mônica Navarini Kurz, Samuel Beskow, Tamara Leitzke Caldeira, Henrique Fuchs Bueno Repinaldo, and Mateus da Silva Teixeira

Flood forecasting and early-warning systems have become a central non-structural strategy to mitigate the impacts of increasingly frequent hydrometeorological extremes. These challenges have become particularly critical in southern Brazil, where unprecedented flood events in 2023 and especially in 2024 resulted in record river and lagoon water levels, widespread inundation, and severe social and economic impacts. In response to these events, the state of Rio Grande do Sul has fostered scientific and technological initiatives focused on real-time hydrological forecasting systems. Within this region, the Piratini River watershed has experienced recurrent and severe urban flooding along its main urban reach, particularly affecting the municipalities of Pedro Osório and Cerrito, with historical events and more recent episodes in 2023–2024 that resulted in extensive urban inundation and persistent social and economic impacts, reinforcing its strategic relevance for hydrometeorological monitoring and early-warning actions. This watershed drains approximately 4,700 km² upstream of the main urbanized river reach, representing an intermediate-scale watershed that remains underrepresented in event-based hydrological modeling studies, particularly under conditions of limited real-time hydrometeorological monitoring, which predominantly focus on smaller catchments. Since 2023, this context has marked the beginning of structured hydrological forecasting activities, developed in direct collaboration with municipal governments and Civil Defense agencies to support decision-making during flood emergencies. Within the real-time, hourly hydrological forecasting framework being developed for this watershed, event-based hydrological modeling using the Hydrologic Engineering Center – Hydrologic Modeling System (HEC-HMS) has been adopted to represent rainfall–runoff processes. The objective of this study is to assess the robustness and structural sensitivity of different event-based conceptual hydrological model configurations implemented in HEC-HMS, addressing key operational questions related to the suitability of different combinations of loss, rainfall–runoff transformation, and routing methods, the impact of spatial discretization on model robustness under limited rainfall and streamflow monitoring, and the role of antecedent hydrological conditions and rainfall temporal concentration in controlling flood generation. Five recent extreme rainfall–runoff events were analyzed using multiple combinations of loss methods, rainfall–runoff transformation methods, baseflow representation, and channel routing schemes, as well as two spatial discretization thresholds, based on rainfall inputs from automatic rain gauges with poor spatial coverage across the watershed and on water level and streamflow data from the Pedro Osório non-automatic gauging station. These data were used for model calibration and validation, and model behavior was subsequently assessed using standard goodness-of-fit and error metrics. Results indicate that model robustness is strongly influenced by the combination of hydrological methods adopted, with configurations including explicit channel routing providing a more realistic representation of flood wave routing. Coarser spatial discretization produced more stable and robust simulations, suggesting reduced parameter uncertainty under limited rainfall station density. Finally, antecedent hydrological conditions and rainfall temporal concentration were identified as critical constraints on flood generation and forecasting reliability. The findings enhance the understanding of flood response mechanisms in subtropical lowland watersheds and provide technical guidance for the design of parsimonious and reliable event-based hydrological models to support operational flood forecasting, highlighting their relevance for climate risk adaptation in developing countries.

How to cite: Araujo Rodrigues, A., Navarini Kurz, M., Beskow, S., Leitzke Caldeira, T., Fuchs Bueno Repinaldo, H., and da Silva Teixeira, M.: Event-based hydrological modeling for real-time flood forecasting under data-scarce conditions: insights from a subtropical watershed in Brazil, EGU General Assembly 2026, Vienna, Austria, 3–8 May 2026, EGU26-15051, https://doi.org/10.5194/egusphere-egu26-15051, 2026.

EGU26-15417 | ECS | Orals | HS4.6

Drought-heat conditions in Swiss rivers: Operational forecasts and future projections 

Ryan S. Padrón, Massimiliano Zappa, Luzi Bernhard, and Konrad Bogner

The services provided by streams and rivers are conditioned by water quantity as well as quality. Streamflow and water temperature are important for aquatic biodiversity, drinking water provision, electricity production, agriculture, and recreation. We inform users about the ongoing hydro-meteorological conditions in Switzerland through the platform www.drought.ch/de, with a focus on drought-related hazards. Here we provide operational probabilistic forecasts of daily runoff anomalies and maximum water temperature for the next 32 days. These forecasts are generated twice per week using ensemble meteorological forecasts as input to the process-based PREVAH hydrological model (runoff) and to a Deep Learning Temporal Fusion Transformer (TFT) model (water temperature).

In part one, we present the setup of our TFT model and assess its predictive skill. The continuous rank probability score (CRPS) is 0.70 °C averaged over all 32 lead times, 54 stations, and 90 forecasts distributed over 1 year. It degrades from 0.38 °C at a lead time of 1 day to 0.90 °C at a lead time of 32 days, largely driven by the uncertainty of the meteorological ensemble forecasts.

In part two, we use Swiss climate projections to obtain future scenarios of streamflow (PREVAH model) and stream water temperature (TFT model). Our results highlight a projected intensification of combined drought-heat conditions under further warming. Events with an average occurrence probaility of 2% over the last 30 years are expected with 26% probability under an additional 2 ºC of warming in Switzerland. This steep increase illustrates the challenges that lay ahead to maintain the services that rivers provide today.

How to cite: Padrón, R. S., Zappa, M., Bernhard, L., and Bogner, K.: Drought-heat conditions in Swiss rivers: Operational forecasts and future projections, EGU General Assembly 2026, Vienna, Austria, 3–8 May 2026, EGU26-15417, https://doi.org/10.5194/egusphere-egu26-15417, 2026.

EGU26-16226 | ECS | Orals | HS4.6

Development of an LLM-agent-based physics–AI hybrid Model for urban flood hazard prediction 

Yoonnoh Lee, Younghun Lee, Minchang Kim, and Sangchul Lee

 Recent increases in urban flooding necessities the development of real-time autonomous prediction models to support forecasting and decision-making. Urban flooding is caused by the combined effects of multiple factors, such as the expansion of impervious surfaces and limitations in drainage pipe capacity. Due to this complexity, predicting urban flooding only with rainfall–runoff is insufficient. Physics–data-based hybrid approaches have been proposed to improve prediction reliability by compensating individual’s limitations. However, hybrid models that require repetitive physics-based simulations face limitations in real-time applications due to high computational costs and long execution times. To overcome these limitations, this study applies an agent-based approach that integrates and coordinates the urban flood hazard estimation process within hybrid modeling frameworks. The proposed framework consists of three agents interconnected through a graph-based orchestration structure to form an iterative analytical workflow of execution, validation, and improvement. The first agent performs physics-based hydrological modeling to reproduce rainfall–runoff processes and the temporal response of urban drainage systems. It also automates model calibration, validation, and optimal model selection. The second agent spatially predicts flood susceptibility using machine learning models based on topography, land use, soil characteristics, drainage infrastructure, and historical flood data. The models applied in this process include random forest, extreme gradient boost, artificial neural networks, long short-term memory, and tabular data–oriented foundation models (TabPFN). The final agent integrates the results of the first two agents to conduct a hazard assessment that simultaneously reflects the probability of urban flooding and its potential intensity. The integrated flood hazard modeling framework enables automated, near-real-time prediction of urban flood hazards. It can serve as a foundational dataset for advancing future urban inundation forecasting and warning systems and decision-support frameworks.

How to cite: Lee, Y., Lee, Y., Kim, M., and Lee, S.: Development of an LLM-agent-based physics–AI hybrid Model for urban flood hazard prediction, EGU General Assembly 2026, Vienna, Austria, 3–8 May 2026, EGU26-16226, https://doi.org/10.5194/egusphere-egu26-16226, 2026.

EGU26-16447 | ECS | Posters on site | HS4.6

Spectrum Transformation Enhanced Spatiotemporal Learning for Decadal Hydrological Forecasts 

Liangjing Zhang, Sunil Thapa, Ashish Sharma, and Ze Jiang

Decadal hydrological prediction underpins strategic decisions in water security, infrastructure investment, and disaster risk reduction by extending actionable guidance beyond seasonal horizons. Large-scale climate indices often exhibit longer predictability than regional precipitation itself and leveraging them into multiyear hydrological prediction can be more effective than relying directly on raw decadal forecasts. Still, decadal predictability is constrained by two barriers: (1) scarce training samples in decadal climate prediction project (DCPP) and (2) spectral mismatch between climate predictors and hydrological responses. Although machine learning (ML) models have high capacity, independent grid-lead training routinely overfits DCPP forecasts and therefore fails to outperform regression model baselines. We overcome these limits by coupling spectral alignment using wavelet prediction system (WASP) with a spatiotemporal merging architecture. WASP decomposes relevant climate predictors into multi-scale components and learns frequency-targeted weights to align predictor spectra with local hydrological responses. Spatiotemporal merging then pools information across space and leads, expanding the effective sample size, stabilizing complex learners, and promoting spatiotemporally coherent outlooks.

Applied to Australian drought forecasting, the framework systematically shows an increasing prediction skill in 87% of grids with a mean gain of 0.16 in correlation relative to the regression model. Event-based diagnostics show more faithful results of extreme events, including the 2002 Millennium Drought and wet spells around 2001. This method also skilfully forecasts the prolonged 2018–2020 Australian drought.

Our results elucidate the critical dependency of decadal drought prediction skill on the interplay between model complexity and predictor quality: Spatiotemporal pooling stabilizes training in complex models and improves generalization instead of overfitting when trained independently. Crucially, we identify a predictability horizon beyond 36 months where skill peaks and the advantage of WASP over raw predictors vanishes, indicating that decadal forecast quality is limited by the performance of the underlying dynamical climate models rather than by post-processing techniques. These advances provide practical value for agencies such as WaterNSW in Australia, offering scientific guidance for reservoir operation, integrated water resources planning and climate resilient adaptation strategies for national communities and ecosystems.

How to cite: Zhang, L., Thapa, S., Sharma, A., and Jiang, Z.: Spectrum Transformation Enhanced Spatiotemporal Learning for Decadal Hydrological Forecasts, EGU General Assembly 2026, Vienna, Austria, 3–8 May 2026, EGU26-16447, https://doi.org/10.5194/egusphere-egu26-16447, 2026.

EGU26-18681 | ECS | Posters on site | HS4.6

Assessment of water shortages in catchment areas under climate change: a conceptual modelling approach to quantifying the need for adaptation measures 

Karel Píša, Petr Pavlík, Adam Vizina, Martin Hanel, and Tomas Ghisi

Quantifying the impacts of adaptation measures against climate change is essential for water management authorities, farmers, and climate change research teams. There are many approaches to adaptation, ranging from the overall organisation of farming methods and field layouts to specific interventions targeted at particular problems. This study focuses on addressing the scarcity of water resources under pressure from human needs, particularly for agriculture. This is done through simulating hydrological balance under future climate change scenarios (CMIP6) using hydrological model BILAN that is calibrated with respect to both runoff and observed (satellite-derived) evapotranspiration. The impact of adaptation measures on the climate is reflected in changes to evapotranspiration, which can be measured. Therefore, evapotranspiration is the second calibrating variable. Daily evapotranspiration data were derived from MODIS land surface temperature (LST) data using the DisALEXI model at a spatial resolution of 500 metres. The study was performed on catchments in the Czech Republic and Austria, ranging in size from small (~10 km²) to large (~10,000 km²), in the Danube River tributary area. The total domain was approximately 45 000 km². Results show that multi-objective calibration has no significant negative effect on model performance in runoff and evapotranspiration generation, with NSE values of around 0.65 being calculated for runoff and evapotranspiration, respectively. A set of hydrological balance scenarios was developed and analysed from two complementary perspectives. The scenarios determine information on potential water shortages within a given catchment, quantifying the need for compensation through adaptation measures. And the assessment of the ability of the model to simulate compensation of runoff shortages within other hydrological balance components by calibrating the model using the historical observed meteorological data and scenario runoff data.


Acknowledgement: This work originated in the Centrum Voda project, funded by the Technology Agency of the Czech Republic (project no. SS02030027)


How to cite: Píša, K., Pavlík, P., Vizina, A., Hanel, M., and Ghisi, T.: Assessment of water shortages in catchment areas under climate change: a conceptual modelling approach to quantifying the need for adaptation measures, EGU General Assembly 2026, Vienna, Austria, 3–8 May 2026, EGU26-18681, https://doi.org/10.5194/egusphere-egu26-18681, 2026.

EGU26-19119 | ECS | Posters on site | HS4.6

Sub-Seasonal to Seasonal Reservoir Storage Forecasting Using an Attention-Based Temporal Fusion Transformer 

Dibyaranjan Parida, Saran Aadhar, Amar Deep Tiwari, and Anugya Shukla

Reservoirs play a vital role in water resources management by supporting irrigation, hydropower generation, urban water supply, flood mitigation, drought preparedness, and food security, particularly in monsoon-dominated regions. However, accurate forecasting of reservoir storage remains challenging due to the combined influences of climate variability and anthropogenic regulation, which limit the reliability of traditional hydrological and statistical models. In this study, we systematically evaluate four deep learning approaches Long Short-Term Memory (LSTM), Gated Recurrent Unit (GRU), Convolutional LSTM (CNN–LSTM), and the Temporal Fusion Transformer (TFT) for reservoir storage prediction across 79 major reservoirs in India. The models are trained using multivariate inputs that comprise historical storage, precipitation, and temperature data spanning the years 2000–2023. Our results demonstrate that the TFT consistently outperforms the recurrent and convolutional baselines, achieving testing coefficient of determination (R²) values exceeding 0.95 across most reservoirs and reducing prediction errors by approximately 20–30% relative to LSTM- and GRU-based models. Building on this superior performance, we conduct sub-seasonal to seasonal forecasts with lead times of up to three months. The TFT exhibits strong drought detection capability, with Probability of Detection values exceeding 0.8 for 1–3-month lead times. Furthermore, purely data-driven TFT forecasts outperform simulations that incorporate external precipitation and temperature forecasts from the Climate Forecast System Version 2 (CFSv2), highlighting the robustness of the learned temporal representations. Overall, this study demonstrates the potential of transformer-based deep learning models to enhance reservoir storage forecasting and early warning capabilities, offering a promising pathway for improving adaptive reservoir operations and water resources management under hydroclimatic variability.

How to cite: Parida, D., Aadhar, S., Tiwari, A. D., and Shukla, A.: Sub-Seasonal to Seasonal Reservoir Storage Forecasting Using an Attention-Based Temporal Fusion Transformer, EGU General Assembly 2026, Vienna, Austria, 3–8 May 2026, EGU26-19119, https://doi.org/10.5194/egusphere-egu26-19119, 2026.

EGU26-19226 | Posters on site | HS4.6

River channel geometry representation from ADCP bathymetry complemented by UAV-based LiDAR for flood modelling in a data-scarce river watershed 

Laura Martins Bueno, Eduardo Luceiro Santana, Samuel Beskow, Tamara Leitzke Caldeira, Aryane Araujo Rodrigues, Reginaldo Galski Bonczynski, Denis Leal Teixeira, Gustavo Adolfo Karow Weber, and Aniele Ribas Alves

How to cite: Martins Bueno, L., Luceiro Santana, E., Beskow, S., Leitzke Caldeira, T., Araujo Rodrigues, A., Galski Bonczynski, R., Leal Teixeira, D., Adolfo Karow Weber, G., and Ribas Alves, A.: River channel geometry representation from ADCP bathymetry complemented by UAV-based LiDAR for flood modelling in a data-scarce river watershed, EGU General Assembly 2026, Vienna, Austria, 3–8 May 2026, EGU26-19226, https://doi.org/10.5194/egusphere-egu26-19226, 2026.

Real-time flood forecasting and early warning systems (RTFF–EWS) have become central to contemporary flood risk management, particularly as climate change intensifies the frequency, magnitude, and spatial complexity of flood events. Recent advances demonstrate a clear shift from conventional physics-based forecasting towards integrated digital ecosystems that combine multi-source data acquisition, advanced analytics, artificial intelligence, and immersive decision-support interfaces. This study synthesises state-of-the-art tools and emerging research directions shaping next-generation RTFF–EWS.

On the data side, dense Internet of Things (IoT) sensor networks, remote sensing (radar, LiDAR, satellites, drones), and crowd-sourced information now enable near–real-time monitoring of hydrological and hydraulic states across urban and catchment scales. These heterogeneous data streams are increasingly fused through machine learning (ML) and deep learning (DL) frameworks, including recurrent neural networks, long short-term memory models, and hybrid physics-informed approaches, to enhance forecast lead time, accuracy, and robustness under data scarcity and uncertainty. Natural language processing (NLP) and large language–based pipelines (LLP) further extend RTFF capabilities by extracting actionable intelligence from unstructured data such as social media, emergency reports, and textual observations, improving situational awareness during rapidly evolving flood events.

Beyond forecasting, digital visualisation technologies are redefining how flood information is communicated and operationalised. Virtual reality (VR), augmented reality (AR), mixed reality (MR), and digital twins (DT) provide immersive and interactive representations of flood dynamics, impacts, and response options. These tools enable scenario testing, stakeholder engagement, and decision rehearsal across the full flood risk management cycle, from preparedness and response to recovery. Digital twins, in particular, are emerging as integrative platforms that couple real-time sensor data, predictive models, and visual interfaces into living representations of urban water systems. Despite these advances, key challenges remain, including data reliability, computational demands, interoperability across platforms, and the translation of complex model outputs into inclusive, actionable warnings for diverse stakeholders. This study also shows plausible deployment pathways for contemporary digital technologies, particularly NLP/LLP-enabled information extraction and AI-driven multi-agent frameworks, and demonstrates how their integration with RTFF–EWS can support adaptive, interpretable, and decision-centred flood risk management under real-world operational constraints.

How to cite: Behzadian, K., Piadeh, F., and Razavi, S.: Advances in Real-Time Flood Forecasting and Early Warning Systems: Integrating Artificial Intelligence, Digital Twins, and Immersive Visualisation Technologies, EGU General Assembly 2026, Vienna, Austria, 3–8 May 2026, EGU26-19746, https://doi.org/10.5194/egusphere-egu26-19746, 2026.

EGU26-20102 | ECS | Orals | HS4.6

Flood Warnings Risks: Spatial and Temporal Distribution of Flood Warning Alerts in London 

Nicola Cekalska and Kourosh Behzadian

The growing reliance on early flood warning systems reflects broader advances in real-time flood forecasting, where increasing data availability, modelling complexity, and the integration of data-driven and AI-based approaches have been identified as critical enablers for effective urban flood risk management [1]. To investigate if flood warning distribution is affected by hydrological variables, socioeconomic vulnerabilities or physical exposure, this study evaluates the spatial and temporal trends of the Environment Agency (EA)’s flood warnings between 2006-2024 within London boroughs.

By applying a comprehensive methodology incorporating GIS analysis, socioeconomic correlation analysis and time-series integration, Flood Alert (FA), Flood Warning (FW) and Severe Flood Warning (SFW) data were analysed using EA’s open-access data. Significant spatial variations were identified within the analysis. Riparian boroughs along the River Thames corridor experienced significantly higher FW rates (>293 alerts per borough approximately per year) compared to non-riparian boroughs (<80 alerts per borough), implying that hydraulic exposure was the primary source of flooding. Temporal analysis presented significant winter seasonality, with approximately 55% of total FW distributed between 2006-2024 confirming limited soil moisture conditions and Atlantic-driven storm activity. Summer FA’s decreased within recent years despite climate change predictions estimating increased convective rainfall, indicating either potential inadequate warning levels of pluvial risks or enhanced operational discrimination.

Regardless of population and exposure controls, distribution analysis presented severe equality implications. London boroughs with increased deprivation projected disproportionately higher FW effects per capita. The trend remained consistent throughout the study period, demonstrating compound vulnerability across the intersection of reduced adaptive capacity and physical hazard exposure. Identifying specific city hotspots (Newham, Tower Hamlets, Southwark) involving higher FA, FW, SFW frequencies occurring simultaneously with socio-economic disadvantages, aging drainage systems and limited green infrastructure.

Findings suggest the requirement for change in policy and procedures for flood risk management, including the development of locally adapted, topography-specific operational guidelines for hydrologically maintained confluence zones; improved accountability via open reporting of operational metrics for lead times and false alarm rates; increased socioeconomically inclusive flood communication strategies, prioritising the engagement of vulnerable communities; improved monitoring design to mitigate coverage gaps; and adoption of comprehensive flood risk frameworks, integrating socioeconomic vulnerability risk assessments with physical exposure controls.

This study enrichens the understanding of operations of urban flood warning systems with complex socioeconomic and technical environments. The methodology and research findings demonstrate reproducible procedures for the analysis of operational flood warning systems within local and regional scales, promoting evidence-based advancements in urban resilience planning in accordance with UK Flood and Water Management Act 2010 and EU Floods Directive (2007/60/EC).

How to cite: Cekalska, N. and Behzadian, K.: Flood Warnings Risks: Spatial and Temporal Distribution of Flood Warning Alerts in London, EGU General Assembly 2026, Vienna, Austria, 3–8 May 2026, EGU26-20102, https://doi.org/10.5194/egusphere-egu26-20102, 2026.

EGU26-21913 | ECS | Posters on site | HS4.6

Unified flood modeling with generative physical distillation neural network under data scarcity 

Xiaoyan Cao, Yao Yao, and Huapeng Qin

Over the past thirty years, floods have been the most frequent natural disaster globally, affecting billions of people and causing trillions of dollars in losses. Fast, accurate, high-resolution forward and inverse flood modeling is urgently required to mitigate the socioeconomic effects. Although machine learning offers fast flood simulations, high-resolution spatiotemporal modeling is fundamentally constrained by data scarcity and physical inconsistencies. Here we present a generative physical distillation neural network (GPDNN) that distills physical laws into neural networks via multi-path parallel generation, and we theoretically prove that it can approximate universal flood dynamic systems without observations. GPDNN is the first unified flood modeling network that supports forward forecasting (i.e., seen event extrapolation and unseen event generalization) and inverse parameter estimation for common flood types. Specifically, GPDNN is the first observation-free machine learning method that provides near-instantaneous and globally physically consistent flood dynamics forward forecast up to 24 h ahead at high spatiotemporal resolution. Simulations of dam-break floods, riverine floods, and urban inundation are found to incur errors that are one to two orders of magnitude lower than existing methods based on dense observations. Furthermore, GPDNN has high accuracy and robustness in inverse analyses of hydraulic parameters under both spatially homogeneous and heterogeneous conditions with sparse or even noisy observations. Our work has knock-on benefits for flood risk assessment, forecasting, and management.

How to cite: Cao, X., Yao, Y., and Qin, H.: Unified flood modeling with generative physical distillation neural network under data scarcity, EGU General Assembly 2026, Vienna, Austria, 3–8 May 2026, EGU26-21913, https://doi.org/10.5194/egusphere-egu26-21913, 2026.

Reservoir regulation reshapes high-flow dynamics, yet the event-scale limits of flood moderation remain poorly quantified at national scales. We develop a framework to compare naturalized (NAT) and regulated (DAM) high-flow responses for 223 Indian reservoirs by coupling Noah-MP runoff with vector-based mizuRoute routing (2000–2022). High-flow events are identified using scenario-specific P99 thresholds and evaluated at the inflow peak (T) and the subsequent recession day (T+1) to quantify peak attenuation and the storage states that determine remaining flood buffer. Reservoirs reduce peak magnitudes relative to NAT conditions across all storage classes, from large (>1,000 MCM) to small (<1,000 MCM) systems. However, T+1 diagnostics reveal a consistent limitation: reservoirs exit most events nearly saturated, with a median post-event storage of 99.8 % of capacity and 74 % of events exceeding 90 % capacity. The T+1 storage fraction-attenuation relationship exhibits a near-zero slope across storage sizes, indicating that larger reservoirs attenuate more but still approach full capacity, while smaller reservoirs saturate even more rapidly. Instances where strong attenuation coincides with appreciable storage headroom are rare (<5 %). These findings highlight a national-scale constraint: Indian reservoirs effectively moderate individual peaks but rapidly expend available storage buffer, increasing vulnerability to multi-peak or persistent inflow sequences.

How to cite: Sharma, P., Saharia, M., and Mizukami, N.: Event-Scale Limits of Reservoir Flood Moderation: Peak Attenuation, Storage Saturation, and Capacity Size-Dependent Constraints Across India, EGU General Assembly 2026, Vienna, Austria, 3–8 May 2026, EGU26-502, https://doi.org/10.5194/egusphere-egu26-502, 2026.

EGU26-812 | ECS | Orals | HS4.7

Moving toward probabilistic dam breach modeling and flood inundation mapping 

Sunil Bista, Ganesh R. Ghimire, and Rocky Talchabhadel

Intensifying hydrologic and environmental extremes are making aging dams around the world increasingly vulnerable as many of them have surpassed their design service life and are classified as high-hazard potential dams. Traditionally used deterministic dam breach analysis methods can underestimate flood risk since they do not necessarily capture an entire spectrum of possible outcomes and their associated uncertainties. This study presents an alternative probabilistic approach for dam breach analyses and flood risk assessments accommodating various modeling approaches and uncertainty quantification techniques. We integrate stochastic simulation methods with a computationally efficient flood modeling tool to enable large-ensemble analysis. We explicitly consider uncertainties in three key components: (1) breach parameters - breach geometry and timing derived from empirical prediction methods, (2) forcings - rainfall characteristics, including depth, temporal patterns, and antecedent soil moisture, and (3) downstream hydraulic conditions and hydrodynamic responses. Advanced sampling strategies, such as copula methods, are adopted to propagate uncertainties from different sources through the modeling chain while maintaining computational efficiency.
The framework is demonstrated through the application to a recent Sanford Dam failure case, where we compare different breach prediction methods and evaluate their impacts on downstream flood characteristics. The deterministic breach model is first validated against observed failure characteristics and downstream flood impacts before extending to probabilistic analysis. Multivariate analysis reveals that breach formation timing characteristics exert stronger influence on peak outflow and flood wave arrival time than geometric breach parameters. Generated probabilistic flood inundation maps showing overall probability, flood depth, and timing provide critical information for emergency response and resilience planning. Initial results that probabilistic approach provides refined confidence bounds for flood risk estimates, informing decision-making with quantified uncertainty. Incorporating future projections highlights that extreme rainfall intensification could increase dam overtopping probabilities, with the magnitude depending on projection scenarios. Our study infuses evidence-based comparison of modeling approaches and supports a more realistic dam-break flood risk assessment for aging dams under non-stationary environmental conditions, informing emergency planning, and infrastructure management strategies.

How to cite: Bista, S., Ghimire, G. R., and Talchabhadel, R.: Moving toward probabilistic dam breach modeling and flood inundation mapping, EGU General Assembly 2026, Vienna, Austria, 3–8 May 2026, EGU26-812, https://doi.org/10.5194/egusphere-egu26-812, 2026.

EGU26-4139 | ECS | Orals | HS4.7

A lake water level prediction method based on data augmentation and Physics-Informed Neural Networks with imbalanced data 

lingjiang lu, Tao Yan, Yongcan Chen, Haoran Wang, Tong Yang, and Zhaowei Liu

Over the past three decades, lake water level fluctuations have intensified due to climate change and increasing water demand, creating an urgent need for accurate and efficient prediction methods. However, existing deep learning-based surrogates often suffer from two major limitations: the lack of physically informed guidance for hyper-parameter selection, which increases computational costs, and the scarcity of extreme water level samples, which leads to imbalanced datasets and reduced accuracy. To address the limitations, this study proposes a novel Physics-Informed Neural Network (PINN) framework that integrates data augmentation with physically guided hyper-parameter selection. The framework employs boundary water level time series as input, incorporates mass-conservation constraints, and applies a clustering-based augmentation method to enrich extreme event samples. Its applicability was validated in the Lower Lake of Nansi Lake in China. Evaluation using Root Mean Squared Error (RMSE) and Nash–Sutcliffe Efficiency (NSE) shows that incorporating physical constraints robustly improves predictive accuracy, with performance even surpassing that of a classical LSTM model. Physically guided hyper-parameter selection further enhances both training efficiency and accuracy, and the proposed augmentation method reduces RMSE by 69.1% under extreme conditions. Compared with an existing augmentation method, the proposed method can shorten training time by 63.35% with better prediction performance. The final surrogate achieves RMSE = 0.021 m and NSE > 0.94 (against observations), requiring only 2.42% of the computational time of a traditional hydrodynamic model. These results highlight the framework’s potential for reliable real-world water level prediction and its transferability to other hydrological systems.

How to cite: lu, L., Yan, T., Chen, Y., Wang, H., Yang, T., and Liu, Z.: A lake water level prediction method based on data augmentation and Physics-Informed Neural Networks with imbalanced data, EGU General Assembly 2026, Vienna, Austria, 3–8 May 2026, EGU26-4139, https://doi.org/10.5194/egusphere-egu26-4139, 2026.

Abstract

The Manimala River Basin (Kerala, India) experienced extensive inundation during the 2018 Kerala flood, underscoring the need for robust, interpretable, and spatially explicit susceptibility assessments to support risk-informed planning. This study develops a flood susceptibility model for the basin using a Random Forest (RF) classifier and explains its behaviour using an explainable AI framework. A set of hydro-morphometric and land-surface conditioning factors was compiled, including rainfall, vertical distance to channel network (VCDN), slope angle, soil texture, distance to streams, land use/land cover (LULC), topographic wetness index (TWI), and terrain curvature metrics (upslope and downslope curvature). The RF model was trained for binary classification of flooded and non-flooded locations, and predictive skill was evaluated using both discrimination and classification metrics. The model achieved strong performance, with an area under the receiver operating characteristic curve (AUROC) of 0.90, overall accuracy of 0.82, sensitivity of 0.83, specificity of 0.81, and an F1-score of 0.83, indicating reliable detection of flood-prone locations while maintaining balanced error rates. The susceptibility map was reclassified into three levels to facilitate interpretation and application. The areal distribution shows that 12.62% of the basin falls within the high-susceptibility class, 15.43% within the moderate class, and 71.95% within the low class, providing a basin-scale overview of priority zones for mitigation and preparedness. Model interpretability was addressed using SHapley Additive exPlanations (SHAP). The SHAP summary and mean absolute contribution rankings indicate that rainfall and VCDN exert the strongest influence on RF outputs, followed by slope angle and soil texture, whereas streams, LULC, TWI, and curvature variables contribute comparatively less. These results emphasize the dominant role of hydro-climatic forcing and drainage-related controls, modulated by terrain and substrate characteristics, in shaping flood susceptibility within the Manimala basin. Overall, the proposed RF–SHAP workflow delivers a high-performing and transparent susceptibility product that can support targeted management actions and communication of drivers underlying predicted flood-prone areas.

How to cite: Rajendran, R. and Rangarajan, S.: Explainable Artificial Intelligence and Machine Learning for Flood Susceptibility Modelling in a Tropical River Basin., EGU General Assembly 2026, Vienna, Austria, 3–8 May 2026, EGU26-5538, https://doi.org/10.5194/egusphere-egu26-5538, 2026.

EGU26-7001 | Orals | HS4.7

Mapping Urban Flood Resilience using GIS: A Case Study of Pune City, India 

Shashank Deore and Sushrut Vinchurkar

Rapid urbanization combined with changing rainfall patterns has significantly increased the frequency and intensity of urban flooding in Indian cities. Pune, located along the Mula–Mutha river system, has experienced recurrent flood events in recent years, highlighting the need for a comprehensive assessment of urban flood resilience. This study aims to develop a spatial Flood Resilience Index (FRI) for Pune City to support informed urban planning and infrastructure decision-making. A GIS-based multi-criteria decision analysis framework is adopted to integrate physical, environmental, and socio-economic indicators influencing flood resilience. Key indicators include drainage density, road network density, land-use pattern, impervious surface extent, green cover, population density, and proximity to river channels. Indicator weights are derived using the Analytical Hierarchy Process (AHP), and all spatial layers are normalized and aggregated at the ward level using QGIS. The resulting Flood Resilience Index enables the classification of city wards into very low, low, moderate, high, and very high resilience categories. Preliminary results indicate significant spatial variability in flood resilience across Pune, with densely built-up and low-lying wards along river corridors exhibiting lower resilience levels. The study demonstrates the effectiveness of open-source GIS tools in developing an urban flood resilience assessment framework that can assist policymakers and city managers in prioritizing flood mitigation and resilience-enhancing interventions.

Keywords: Urban flooding, Flood resilience index, GIS, AHP, Pune City

How to cite: Deore, S. and Vinchurkar, S.: Mapping Urban Flood Resilience using GIS: A Case Study of Pune City, India, EGU General Assembly 2026, Vienna, Austria, 3–8 May 2026, EGU26-7001, https://doi.org/10.5194/egusphere-egu26-7001, 2026.

The accuracy of urban flood inundation modelling is fundamentally limited by the scarcity of ground truth data, which impedes reliable forecasting for disaster risk reduction. This study proposes a novel framework to validate flood model simulations using insurance claim records. We applied a 2D hydraulic model (FloodMap-HydroInundation2D) to simulate a pluvial flood event in Ningbo, China. The simulated maximum inundation extent was validated against georeferenced insurance claims, revealing strong spatial agreement and demonstrating the practicability of such non-traditional datasets. A comparative assessment with social media data further contextualized the performance of the insurance-based validation. Sensitivity analysis highlighted hydraulic conductivity as a key parameter influencing model accuracy, offering valuable insights for parameter optimization. To address inherent locational uncertainties in claims data, a buffer-based validation method was developed and tested, which enhanced the robustness of the model assessment. This work provides a transferable approach for integrating non-traditional observations to improve flood model reliability, thereby supporting flood risk management and emergency decision-making.

How to cite: Gao, D.: Validation of urban flood inundation modelling with insurance claims, EGU General Assembly 2026, Vienna, Austria, 3–8 May 2026, EGU26-8473, https://doi.org/10.5194/egusphere-egu26-8473, 2026.

EGU26-10527 | ECS | Posters on site | HS4.7

Evaluating fluvial flood mapping for flood early warning, Ry River Denmark  

Charlotte Agata Plum, Maggie Henry Madsen, Anders Nielsen, Dennis Trolle, and Michael Butts

Until recently, flood early warning in Denmark was based on weather and marine forecasting for extreme rainfall and sea water levels. In 2022, the Danish Meteorological Institute (DMI) was appointed as the national authority for flood forecasting for Denmark, and was tasked with developing and implementing a national flood forecasting and early warning system. The initial goal for these developments was to provide timely, reliable and relevant data to support decision-making by local and national emergency services prior to major flood events.

Initial efforts were focused on the development of a rapid, nationwide flood extent mapping for addressing both pluvial flooding from intense summer cloudbursts and coastal flooding associated with elevated sea water levels and storm surges. In parallel, a national hydrological forecasting system has been successfully developed and the forecasted discharges now form the basis for fluvial flood early warning for the Danish emergency services (2024) and for the general public (2025). However, there remains a critical need for forecasts of flood extent, ahead of extreme events, along the river systems. The key challenge is to deliver flood extent forecasts with sufficient lead time and reliability to support decision-making by authorities during time-critical emergency situations.

In this study, we explore the trade-off between computationally efficient but approximate methods against more accurate but computationally more demanding hydrodynamic simulations for the case study area Ry River (Ryå). The Ryå catchment drains a relatively large – and low-gradient– area of 590 km², but drainage capacity has become increasingly constrained. This has become evident from prolonged and more frequent flooding of intensively cultivated agricultural areas. Ryå represents many of the river modelling and forecasting cases in Denmark but is particularly challenging because of the low slopes.

In particular, we compare and evaluate three methods of varying complexity for estimating flood extent. These are, in order of increasing complexity: 1. GIS-based, static mapping from measured or simulated water levels, 2) an approximate 1D-2D hydrodynamic coupled model obtained by simplifying the governing (St. Venant) equations (LISFLOOD-FP) and 3) a full 2D hydrodynamic modelling of the river and floodplains (HEC-RAS). Performance comparisons, for selected flood events during 2019-2024, are carried out using optical drone imagery together with both radar-based and optical satellite data. We evaluate model run time and accuracy and in the end also the usefulness of the tools to build models covering larger areas of Denmark and being run on-demand. The goal is to determine which methods can, with sufficient accuracy, be used in a semi-operational manner in DMI’s warning setup.

How to cite: Plum, C. A., Henry Madsen, M., Nielsen, A., Trolle, D., and Butts, M.: Evaluating fluvial flood mapping for flood early warning, Ry River Denmark , EGU General Assembly 2026, Vienna, Austria, 3–8 May 2026, EGU26-10527, https://doi.org/10.5194/egusphere-egu26-10527, 2026.

EGU26-11095 | ECS | Orals | HS4.7 | Highlight

Co-creating next-generation cloudburst warnings using ensemble forecasts and surface flood modelling 

Cecilie Thrysøe, Jonas Wied Pedersen, Irene Livia Kruse, Elena Durando, Matilde Oliveti, Emanuele Artù Cassin, Tommaso Destefanis, Martina Di Rita, and Emma Dybro Thomassen

Extreme rainfall and cloudburst events are becoming increasingly frequent in Europe, placing growing pressure on urban drainage systems and local water utilities. In Denmark, current heavy-rainfall warnings are largely municipality-based binary alerts, which utilities often experience as too frequent, insufficiently localised, and difficult to translate into early operational action. Limited communication of forecast uncertainty and warning thresholds that are not aligned with drainage system design standards further reduce their practical value. As a result, many utilities primarily respond to cloudburst impacts after events occur rather than acting proactively.

This presentation presents the concepts and overall workflow of a co-created urban flood warning framework developed within the Horizon Europe CLEAR-EO project and the Danish funded initiative (VUDP) on future precipitation and flood warnings. The framework is designed to translate probabilistic rainfall forecasts into surface flood impact information that supports earlier and more confident decision-making by water utilities.

Within CLEAR-EO, we develop a modular, end-to-end workflow that links ensemble-based precipitation forecasts with near-real-time EO satellite data and high-resolution surface data. When rainfall thresholds are exceeded, the workflow activates an urban surface flood model that routes water across the urban terrain while accounting for drainage capacity and infiltration, enabling on-demand simulation of pluvial flood impacts. The modelling chain produces spatially explicit, probabilistic flood indicators, including flood depth, spatial extent, and warning levels at sub-metre resolution.

This presentation introduces the overall warning workflow, data integration strategy, and key design choices emerging from the combination of ensemble forecasting, EO-based datasets, surface flood models, and close collaboration and co-creation with end users. A key component of the framework is the generation of hydrologically conditioned, high-resolution DSM, which provides the topographic basis for urban drainage modelling and flood simulations. The workflow integrates classified airborne LiDAR point clouds with semantic infrastructure information from OpenStreetMap, improving drainage connectivity while preserving geometric fidelity. Early experiences indicate that co-developing probabilistic, impact-based warning products that explicitly communicate forecast uncertainty can strengthen utilities’ ability to act earlier and more precisely under uncertain cloudburst conditions.

Ongoing work will further refine the modelling chain, strengthen validation, and extend the approach to additional European case studies, contributing to the development of future national and local heavy-rainfall warning services.

How to cite: Thrysøe, C., Pedersen, J. W., Livia Kruse, I., Durando, E., Oliveti, M., Artù Cassin, E., Destefanis, T., Di Rita, M., and Thomassen, E. D.: Co-creating next-generation cloudburst warnings using ensemble forecasts and surface flood modelling, EGU General Assembly 2026, Vienna, Austria, 3–8 May 2026, EGU26-11095, https://doi.org/10.5194/egusphere-egu26-11095, 2026.

Floods are the most frequent natural hazard worldwide, causing severe impacts on human populations and leading to substantial economic and environmental losses. In recent decades, the frequency and intensity of flood events have increased significantly, largely due to the growing occurrence of extreme climatic phenomena. Consequently, flood susceptibility mapping has become a crucial tool for flood hazard assessment, management, and mitigation. This study aims to predict and map flood-prone areas in Calabria region (southern Italy) by integrating historical flood data, Geographic Information Systems (GIS), and the Maximum Entropy (ME) modeling approach. A catalogue of flood events impact recorded in the study region between 2000 and 2025 by documentary sources was systematically analyzed within a GIS environment. A total of 270 flood occurrence points affected by flood damage were identified and mapped; 70% of these were randomly selected to construct a balanced training dataset and calibrate the prediction model, while the remaining 30% were used for validation. For the application of the ME method, the flood inventory was combined with fifteen flood-predisposing factors, including lithology, soil texture, land use, normalized difference vegetation index (NDVI), precipitation, elevation, local relief (LR), slope, curvature, topographic position index (TPI), sediment transport index (STI), topographic wetness index (TWI), drainage density (DD), distance to streams, and distance to roads. The validation of the flood-prone areas model was performed based on accuracy, kappa coefficient, and receiver operating characteristic curve (ROC) and its associated area under the curve (AUC). The results indicate very good predictive performance of the model, with success and prediction rates of 89.7% and 86.3%, respectively. In addition, the jackknife test highlighted the significant contribution of soil texture, TWI, precipitation, distance to streams, and land use to the spatial prediction of flood occurrence. The produced flood-prone areas map provides a valuable tool for disaster risk management and mitigation planning, offering significant support to decision-makers in reducing both economic losses and flood-related risks to human life.

How to cite: Conforti, M. and Petrucci, O.: Spatial prediction of flood-prone areas in the Calabria Region (Southern Italy) using historical flood inventories and Maximum Entropy approach, EGU General Assembly 2026, Vienna, Austria, 3–8 May 2026, EGU26-12503, https://doi.org/10.5194/egusphere-egu26-12503, 2026.

EGU26-14562 | ECS | Posters on site | HS4.7

A Minimal High-Resolution Urban Flood Model for Data-Scarce Regions 

Rahul Singh and Rajarshi Das Bhowmik

Currently urban flooding poses a growing threat to urban and semi-urban cities across India, mainly due to climate change and rapid unplanned urbanization. Many existing urban flood models require extensive hydrological, hydraulic, and infrastructure data, which are often unavailable in developing or data scarce regions. Our work addresses this challenge by proposing a minimal input modelling approach.

In this study, we develop a high-resolution urban flood simulation model using only rainfall and Digital Elevation data, significantly reducing the dependency on detailed datasets such as land use/land cover and drainage network information. The model framework is implemented in MATLAB using a matrix-optimized water redistribution algorithm combined with flood water routing. This enables efficient simulation of water accumulation and propagation across both flat and complex urban terrains, while allowing simulations over large urban areas.

The model is currently being deployed for Bengaluru urban region in India, which is often prone to flooding during monsoon season, flood inundation maps for multiple time durations were generated using artificial rainfall inputs and a 1-m high resolution DEM. By requiring minimal input data while maintaining high spatial detail, the proposed framework provides a scalable solution for urban flood hazard assessment in data limited regions, supporting early-stage risk mapping and climate resilient urban planning.

How to cite: Singh, R. and Das Bhowmik, R.: A Minimal High-Resolution Urban Flood Model for Data-Scarce Regions, EGU General Assembly 2026, Vienna, Austria, 3–8 May 2026, EGU26-14562, https://doi.org/10.5194/egusphere-egu26-14562, 2026.

EGU26-16399 | ECS | Posters on site | HS4.7

Integrating WRF-Hydro and DART for Ensemble Streamflow Forecasting in a Highly Regulated Basin with Anthropogenic Intervention 

Yaewon Lee, Bomi Kim, Jiwon Choi, and Seong Jin Noh

Streamflow forecasting in anthropogenically altered river basins presents substantial challenges, particularly where dam and weir operations strongly modify natural flow regimes. In such systems, conventional hydrologic models often have limited capability to represent the non-linear effects of reservoir regulation, resulting in rapid degradation of forecast skill during extreme events. This study evaluates an ensemble-based hydrologic data assimilation (DA) framework applied to the Nakdong River Basin, South Korea, a highly regulated river system characterized by a dense network of dams and multi-functional weirs. We implement a coupled modeling framework integrating the WRF-Hydro system with the Data Assimilation Research Testbed (DART) to investigate the applicability of DA in a managed hydrologic environment. The WRF-Hydro reservoir module is used to explicitly represent storage and release processes, while DART provides ensemble Kalman filter–based assimilation. A central challenge is the mismatch between modeled natural flows and observed regulated discharges. To address this, streamflow and dam storage (or water level) observations are assimilated to update both natural hydrologic states and managed infrastructure states. The framework is evaluated for an extreme rainfall event in August 2022, demonstrating that joint updating of streamflow and reservoir states improves the ensemble representation of human-induced timing and magnitude. Remaining challenges related to error covariance specification in operationally controlled systems are discussed, underscoring the importance of explicitly accounting for anthropogenic intervention in hydrologic DA systems to improve flood forecasting in regulated basins.

How to cite: Lee, Y., Kim, B., Choi, J., and Noh, S. J.: Integrating WRF-Hydro and DART for Ensemble Streamflow Forecasting in a Highly Regulated Basin with Anthropogenic Intervention, EGU General Assembly 2026, Vienna, Austria, 3–8 May 2026, EGU26-16399, https://doi.org/10.5194/egusphere-egu26-16399, 2026.

EGU26-18141 | Orals | HS4.7

DeepWaive: A Scalable and Fine-Tunable AI Foundation Model for Probabilistic 2D Inundation Forecasting  

Julian Hofmann, Adrian Holt, Gregor Johnen, and Sascha Welten

Operational flood forecasting and risk management requires high-resolution, spatially and temporally explicit predictions of inundation dynamics alongside robust uncertainty quantification. In practice, forecast skill is strongly constrained by uncertainties in meteorological forcing, boundary conditions, and human controls (e.g., reservoir releases) as well as inherent model uncertainties. While physics-based 2D hydrodynamic models provide physically consistent inundation dynamics, their computational cost make it impractical to generate several of ensemble members needed for uncertainty quantification  and the real-time exploration of “what-if” intervention scenarios.

We present DeepWaive, a physics-informed Foundation Model, that translates precipitation- or discharge-driven boundary conditions and static geospatial input into transient, spatially explicit 2D inundation dynamics within seconds. By leveraging deep-learning architectures trained on synthetic 2D hydrodynamic simulations, DeepWaive achieves zero-shot transferability to previously unseen basins without the need for domain-specific re-training. Crucially, the model architecture maintains the flexibility for optional site-specific fine-tuning, allowing for further optimization using either regional hydrodynamic models or in-situ sensor data to meet localized precision requirements. Benchmarking against classical numerical solvers demonstrates high predictive fidelity, with R² values ranging from 0.85 to 0.97, achieved alongside acceleration factors of 105–106. The model maintains scalability for domains up to 40,000 km2 and event durations exceeding 24 hours.

Building on this capability, we develop an ensemble-to-probability workflow that propagates meteorological and hydrological forecast ensembles, and alternative reservoir release scenarios, through DeepWaive to generate probabilistic inundation products (e.g., spatial exceedance probabilities for depth and velocity thresholds) and impact-relevant summary metrics.

Within the Indo-German FLAIR project (Flood Forecasting using AI for Regional Sustainability, funded by BMBF), DeepWaive provides the fast dynamic core required to (i) quantify and communicate forecast uncertainty, (ii) support rapid sensitivity analyses of key uncertainty sources, and (iii) enable tight coupling to consortium modules on EO-derived flood variables, data assimilation, and reservoir operation optimization.

How to cite: Hofmann, J., Holt, A., Johnen, G., and Welten, S.: DeepWaive: A Scalable and Fine-Tunable AI Foundation Model for Probabilistic 2D Inundation Forecasting , EGU General Assembly 2026, Vienna, Austria, 3–8 May 2026, EGU26-18141, https://doi.org/10.5194/egusphere-egu26-18141, 2026.

Real-time control (RTC) of drainage pumping stations offers substantial potential for urban flood mitigation, yet the computational burden of physics-based models severely limits their utility in rapidly evaluating alternative control strategies during flood events. Although many artificial intelligence methods have achieved rapid urban flood prediction, they have not yet been able to model the flood response to infrastructure control. We develop a data-driven surrogate modeling framework that rapidly predicts flood dynamics (maximum flood extent and peak water depth) under varying pumping operation scenarios. We employ high-resolution finite volume hydrodynamic simulations integrated with pumping control modules to generate an extensive training dataset spanning diverse rainfall events and control configurations across a highly urbanized catchment (approximately 100 km²). Specifically, in the test set, the spatial Root Mean Squared Error (RMSE) is less than 0.05 m, and the structural similarity index (SSIM) exceeds 0.95. The prediction is completed in under one second, representing a three-orders-of-magnitude speed-up compared to the numerical model. This method provides an effective tool for the emergency management of urban flooding

How to cite: Wang, B., Cao, X., and Qin, H.: A Data-Driven Surrogate Approach for Real-Time Evaluation of Pumping Control Strategies in Urban Flood Management, EGU General Assembly 2026, Vienna, Austria, 3–8 May 2026, EGU26-21367, https://doi.org/10.5194/egusphere-egu26-21367, 2026.

EGU26-39 | ECS | Posters on site | HS4.10

Deep Learning for Monthly Precipitation Prediction in Mountainous Terrain: From Individual Architectures to EnsembleStrategies 

Manuel Ricardo Pérez Reyes, Marco Javier Suárez Barón, and Óscar Javier García Cabrejo

We evaluate hybrid deep learning architectures and ensemble strategies for monthly precipitation prediction over Boyacá, Colombia (3,965 CHIRPS grid cells, 145–5,490 m elevation, horizons 1–12 months). Three spatial encoding paradigms are compared: convolutional (ConvLSTM), spectral (Fourier Neural Operator hybrids), and graph-based (Graph Neural Network with Temporal Attention, GNN-TAT). GNN-TAT matches ConvLSTM accuracy (R2: 0.628 vs 0.642) with 95% fewer parameters and lower variance, leveraging elevation-weighted edges for interpretable spatial reasoning. Beyond individual models, late fusion via Ridge regression (R2=0.668) improves over all single architectures by exploiting complementary grid-based and graph-based error structures. Conversely, early fusion stacking collapses to R2=0.212, showing that combining predictions preserves inductive biases while merging intermediate representations destroys them. We also report the first evaluation of State Space Models (Mamba) for regional precipitation, which fail to transfer from sequence modeling (R2=0.200). Three operational guidelines emerge: graph-based encoders are efficient alternatives in complex terrain, ensemble gains depend on late-stage combination, and documenting architectural failures narrows the search space for future practitioners. All experiments use standardized CHIRPS/SRTM inputs and fixed random seeds for reproducibility.

Keywords: monthly precipitation prediction, deep learning, hybrid architectures, Graph Neural Networks, ConvLSTM, ensemble learning, mountainous terrain, Colombian Andes, State Space Models

Related Publications:
1. Pérez Reyes, M.R.; Suárez Barón, M.J.; García Cabrejo, Ó.J. Spatiotemporal Prediction of Monthly Precipitation: A Systematic Review of Hybrid Models. Hydrology Research (IWA Publishing), under review — Revision 3.

2. Pérez Reyes, M.R.; Suárez Barón, M.J.; García Cabrejo, Ó.J. Hybrid Deep Learning Architectures for Multi-Horizon Precipitation Forecasting in Mountainous Regions: Systematic Comparison of Component-Combination Models in the Colombian Andes. Hydrology (MDPI), accepted.

3. Pérez Reyes, M.R.; Suárez Barón, M.J.; García Cabrejo, Ó.J. A Data-Driven Deep Learning Framework for Monthly Precipitation Prediction in Complex Mountainous Terrain: Systematic Evaluation of Hybrid Architectures, Ensemble Strategies, and Emerging Paradigms. Hydrology (MDPI), ready for submission.

How to cite: Pérez Reyes, M. R., Suárez Barón, M. J., and García Cabrejo, Ó. J.: Deep Learning for Monthly Precipitation Prediction in Mountainous Terrain: From Individual Architectures to EnsembleStrategies, EGU General Assembly 2026, Vienna, Austria, 3–8 May 2026, EGU26-39, https://doi.org/10.5194/egusphere-egu26-39, 2026.

EGU26-1094 | ECS | Posters on site | HS4.10

Developing a Flood Inundation Forecasting System for India.  

Priyam Deka, Ved Prakash, Niranjan  Kondapalli, and Manabendra Saharia

Flood forecasts are a crucial component of flood hazard mitigation strategies and forecasted flood inundation maps are essential for transitioning from forecast information to decision-making to reduce flood risk. A national medium-range streamflow forecasting system has been developed with ILDAS as its physical modeling core and integrated with an AI-based postprocessor. The forecasting system consists of integrated Noah-MP and mizuRoute that produce daily streamflow forecasts with 1-5 days lead time at more than half a million streams across the country. While the system is computationally very efficient, extending it to generate inundation forecasts remains a drawback, as vector-based routing models do not produce inundation maps. To bridge this gap, we integrate TRITON, a GPU-accelerated 2D hydrodynamic model with improved terrain representation, into the system to simulate flood inundation. A GPU-based hydrodynamic model has computational superiority over a CPU-based model and hence reduces forecast generation time, which is a major bottleneck in inundation forecasting systems. In this framework, streamflow forecasts from the existing system are taken as input to the GPU-based model, which generates inundation forecasts with lead times of 1-5 days across India, along with streamflow and water level forecasts. Initial results show reasonable forecast skills when compared with observed water level data and SAR-based flood maps. The system demonstrates its potential to support operational flood preparedness and disaster risk management, and is also an important step towards building an impact-based flood forecasting system for India.

How to cite: Deka, P., Prakash, V., Kondapalli, N., and Saharia, M.: Developing a Flood Inundation Forecasting System for India. , EGU General Assembly 2026, Vienna, Austria, 3–8 May 2026, EGU26-1094, https://doi.org/10.5194/egusphere-egu26-1094, 2026.

EGU26-1781 | Orals | HS4.10

Physics-Guided Deep Learning for Rainfall-Runoff Modeling: Integrating Physical Constraints and Data-Driven Approaches 

Kang Xie, Zhangkang Shu, Zhongrui ning, Yuli Ruan, Yalian Zheng, Peng Liu, Guoqing Wang, Juliang Jin, and Jianyun Zhang

This study addresses the limitations of traditional deep learning models in hydrological forecasting, which often lack physical interpretability and struggle with extreme events. We propose a hybrid framework that combines data-driven deep learning with physical constraints to enhance model accuracy and robustness. Traditional deep learning models (e.g., LSTM) have shown promise in rainfall-runoff prediction but are criticized for their "black-box" nature and poor performance under extreme conditions, while physical-based models, though interpretable, are computationally expensive and rely on detailed parameterization. To bridge this gap, we integrate physical constraints (e.g., water balance, monotonicity) into LSTM networks through three key approaches: extreme event constraints that add penalties for violating physical laws, monotonicity constraints ensuring runoff increases with rainfall intensity via ReLU-based loss functions, and hard constraints projecting outputs to strictly adhere to hydrological laws. Applied to 2683 basins globally, our physics-guided LSTM (PHY-LSTM) improved the Nash-Sutcliffe Efficiency (NSE) by 0.10 and reduced the Root Mean Square Error (RMSE) by 15% compared to standard LSTM, with a 20% enhancement in flood peak prediction using synthetic extreme samples. Additionally, we identified time-varying parameters across climate zones, revealing trends in water storage capacity (1.7mm/decade in wet regions, -0.6mm/decade in arid regions). This framework bridges data-driven efficiency and physical interpretability, enabling reliable predictions under extreme conditions and providing insights into hydrological processes, validated globally and applicable to water resource management and climate change impact assessments.

How to cite: Xie, K., Shu, Z., ning, Z., Ruan, Y., Zheng, Y., Liu, P., Wang, G., Jin, J., and Zhang, J.: Physics-Guided Deep Learning for Rainfall-Runoff Modeling: Integrating Physical Constraints and Data-Driven Approaches, EGU General Assembly 2026, Vienna, Austria, 3–8 May 2026, EGU26-1781, https://doi.org/10.5194/egusphere-egu26-1781, 2026.

EGU26-2903 | ECS | Posters on site | HS4.10

Advancing Multi-step Streamflow Forecasting with an Embedding Multi-Layer Perceptron 

Yinghui Li and Soohyun Yang

Reliable multi-step streamflow prediction is essential for effective water resources management. In recent years, deep learning (DL) approaches have been increasingly adopted for streamflow forecasting as alternatives to process-based hydrological models. These approaches have partially reduced the reliance on high-quality and comprehensive hydrological observations required for robust parameterization of the process-based models. Nonetheless, the predictive performance of DL-based hydrological models often deteriorates as the forecast horizon extends, posing critical challenges to their reliability and practical applicability. Moreover, due to the scarcity of storage-related observations, most existing DL-based hydrological models are primarily driven by flux variables (e.g., precipitation and streamflow), while watershed memory effects related to storage regulation remain largely underrepresented. To address these limitations, this study proposes a multi-step streamflow forecasting model that incorporates a proxy representation of watershed memory through a DL approach, namely the Embedding Multi-Layer Perceptron (E-MLP). The proposed model was developed using only precipitation and streamflow time-series, without relying on explicit storage-related variables. Two widely used DL models, i.e., Long Short-Term Memory (LSTM) and Multi-Layer Perceptron (MLP) models, were employed as benchmark approaches. Each model was evaluated in a flood-prone watershed, the Upper Wapsipinicon River watershed near Anamosa gauging station (USGS-05421740) in Iowa, United States. Comparative analyses across the three models demonstrated that incorporating a proxy representation of watershed memory yielded more stable predictive skill at longer forecast horizons, effectively mitigating performance degradation with increasing lead time. These findings highlight the critical role of watershed memory in DL-based streamflow forecasting and point to a viable pathway toward more robust multi-step forecasting frameworks.

Acknowledgements

This work was supported by the Creative-Pioneering Researchers Program through Seoul National University and by the National Research Foundation of Korea (NRF) grant funded by the Korea government (MSIT) (No. RS-2025-00523350). Additional support was provided by the National Institute of International Education of Korea (NIIED-230724-0041) and the China Scholarship Council (CSC No. 202208230007).

How to cite: Li, Y. and Yang, S.: Advancing Multi-step Streamflow Forecasting with an Embedding Multi-Layer Perceptron, EGU General Assembly 2026, Vienna, Austria, 3–8 May 2026, EGU26-2903, https://doi.org/10.5194/egusphere-egu26-2903, 2026.

EGU26-3180 | ECS | Orals | HS4.10

Robust hourly flood forecasting using LSTM: Handling missing inputs and integrating discharge observations 

Eduardo Acuna Espinoza, Frederik Kratzert, Martin Gauch, Manuel Álvarez Chaves, Ralf Loritz, and Uwe Ehret

Long Short-Term Memory (LSTM) networks have demonstrated state-of-the-art performance for operational flood forecasting at the daily scale (Nearing et al., 2024). Recent advances have extended LSTM-based models to higher temporal resolutions through multi-frequency LSTM architectures (Acuña Espinoza et al., 2025) and introduced robust strategies for handling missing data, such as masked-mean embeddings (Gauch et al., 2025).

Building on this work, we introduce an LSTM-based approach that allows producing hourly flood forecasts in an operational setting, while being robust to missing data. Moreover, using masked-mean embeddings plus teacher-forcing (Williams et al., 1989) and noise injection strategies during training, allows the model to integrate observed stream flow observations when available, for enhanced prediction accuracy, while keeping the flexibility to operate without this signal. 

To evaluate model performance, we benchmarked the new approach against LARSIM, the current operational model in many federal states in Germany. Our results show that the LSTM-based architecture outperforms the LARSIM model in predictive accuracy, while additionally offering robustness to missing inputs and faster inference times.

These findings highlight the potential of deep learning–based models for operational flood forecasting at an hourly resolution, while introducing strategies to increase robustness and add valuable information, when available. 


Reference:

Acuña Espinoza, E., Kratzert, F., Klotz, D., Gauch, M., Álvarez Chaves, M., Loritz, R., & Ehret, U. (2025). Technical note: An approach for handling multiple temporal frequencies with different input dimensions using a single LSTM cell. Hydrology and Earth System Sciences, 29(6), 1749–1758. https://doi.org/10.5194/hess-29-1749-2025

Gauch, M., Kratzert, F., Klotz, D., Nearing, G., Cohen, D., & Gilon, O. (2025). How to deal with missing input data. Hydrology and Earth System Sciences, 29(21), 6221–6235. https://doi.org/10.5194/hess-29-6221-2025

Nearing, G., Cohen, D., Dube, V., Gauch, M., Gilon, O., Harrigan, S., Hassidim, A., Klotz, D., Kratzert, F., Metzger, A., Nevo, S., Pappenberger, F., Prudhomme, C., Shalev, G., Shenzis, S., Tekalign, T. Y., Weitzner, D., & Matias, Y. (2024). Global prediction of extreme floods in ungauged watersheds. Nature, 627(8004), 559–563. https://doi.org/10.1038/s41586-024-07145-1

Williams, R. J., & Zipser, D. (1989). A learning algorithm for continually running fully recurrent neural networks. Neural computation, 1(2), 270-280.

How to cite: Acuna Espinoza, E., Kratzert, F., Gauch, M., Álvarez Chaves, M., Loritz, R., and Ehret, U.: Robust hourly flood forecasting using LSTM: Handling missing inputs and integrating discharge observations, EGU General Assembly 2026, Vienna, Austria, 3–8 May 2026, EGU26-3180, https://doi.org/10.5194/egusphere-egu26-3180, 2026.

EGU26-4502 | ECS | Posters on site | HS4.10

A physics-informed machine learning framework for event-scale urban flood intensity prediction at the sub-seasonal time scales in data-scarce cities 

Ali Haider, Arpita Mondal, Reza Khanbilvardi, and Naresh Devineni

Urban flooding poses persistent challenges in rapidly urbanizing regions, where the lack of ground-based observations limits both flood characterization and predictive modeling. In many flood-prone cities, physics-based hydrologic and hydrodynamic models are constrained by the availability of high-resolution drainage data, boundary conditions, and event-specific calibration, limiting their applicability for rapid or scalable urban flood assessment. To address this gap, we present a scalable, physics-informed machine learning framework for predicting event-scale urban flood intensity at 10 m resolution and at the sub-seasonal time scales without reliance on ground flood calibration.

The proposed approach integrates multi-sensor information, including SAR-derived flood intensity, with high-resolution hydro-meteorological and geospatial predictors that encode rainfall forcing, terrain controls, urban morphology, and surface imperviousness. A key component of the framework is the use of physically interpretable static predictors, such as height above nearest drainage (HAND), to represent drainage proximity and inundation potential, thereby introducing hydrologically meaningful constraints into the learning process. Flooding is modeled as a continuous spatial variable rather than a binary state, enabling a more realistic representation of flood severity and spatial heterogeneity across urban landscapes.

The framework is applied to Mumbai, India, as a primary testbed and evaluated across multiple rainfall-driven flood events. Model performance is assessed through cross-event consistency and spatial generalization, internal agreement with independently derived flood intensity patterns, and coherence with known flood-prone zones shaped by drainage networks and urban form. Results demonstrate stable and physically plausible flood intensity predictions across events without local recalibration, highlighting the framework’s capacity to generalize in the absence of in situ flood measurements.

By combining observation-driven learning with physically informed predictors, this work advances a transferable pathway for high-resolution urban flood intensity prediction in data-scarce environments. The proposed framework is intended to support scalable flood risk assessment and early-stage decision-making in rapidly urbanizing regions facing increasing flood hazards.

How to cite: Haider, A., Mondal, A., Khanbilvardi, R., and Devineni, N.: A physics-informed machine learning framework for event-scale urban flood intensity prediction at the sub-seasonal time scales in data-scarce cities, EGU General Assembly 2026, Vienna, Austria, 3–8 May 2026, EGU26-4502, https://doi.org/10.5194/egusphere-egu26-4502, 2026.

EGU26-5096 | Posters on site | HS4.10

Random Forest–Based Projection of Streamflow Drought Index from Meteorological Drought Indices under RCP Climate Scenarios 

Igor Leščešen, Milan Josić, Slobodan Gnjato, Ana M. Petrović, Zbyněk Bajtek, and Pavla Pekárová

Reliable projections of hydrological drought are essential for climate-resilient water management; however, many basins lack calibrated, process-based models. Here, we develop and test a purely data‑driven framework to forecast the Streamflow Drought Index (SDI) for the Sava River basin, using only widely available meteorological drought indices, and apply it to project future drought conditions under different climate scenarios. We assembled a monthly dataset for 1961–2020 comprising the Standardized Precipitation Index (SPI), a standardised temperature index (STI), the Standardised Precipitation–Evapotranspiration Index (SPEI), and SDI derived from observed streamflow. All indices are approximately standardised and show frequent negative excursions, indicating recurrent meteorological and hydrological droughts. Correlation analysis revealed that short-term precipitation anomalies significantly influence the linear control of SDI. Specifically, SPI at a one-month lag exhibits the strongest association (r ≈ 0.50), followed by contemporaneous SPI (r ≈ 0.44) and a two-month lag (r ≈ 0.24). By contrast, STI and SPEI lags exhibit negligible correlations, indicating that temperature-driven evaporative demand plays a secondary role in the initial onset of drought in this temperate, precipitation-dominated basin. We evaluated several machine-learning models for one-month-ahead SDI prediction, including Random Forest (RF), XGBoost, Elastic Net, Support Vector Regression (SVR), and a Multilayer Perceptron. Models were trained on the first 80% of the record and evaluated on the remaining 20% using a strictly chronological split. For RF, key hyperparameters (number of trees, maximum depth, leaf size and feature subsampling) were tuned using Randomized Search with Time Series Split cross‑validation. A linear‑scaling bias correction was applied to align the mean and variance of predicted SDI with observations in the training period. Random Forest clearly outperformed the alternative models. In the independent test period (2009–2020), the bias‑corrected RF achieved MAE ≈ 0.62, RMSE ≈ 0.83, and NSE ≈ 0.49, explaining almost half the variance in SDI. KGE ≈ 0.65 indicates good joint reproduction of correlation, variability and bias. The model accurately captured the timing and sign of most wet and dry episodes, while moderately underestimating the most extreme peaks. Other algorithms exhibited similar or larger errors and substantially lower KGE, confirming RF as the most suitable SDI forecasting approach in this index‑only setting. Finally, we drove the optimised RF with SPI/STI/SPEI projections from RCP2.6, RCP4.5 and RCP8.5 to generate monthly SDI projections for 2021–2050. Hydrostripes and distributions show clear scenario‑dependent changes: RCP2.6 maintains mainly mild, short‑lived droughts; RCP4.5 produces more persistent and clustered deficits; and RCP8.5 yields the most frequent and severe hydrological droughts. The framework demonstrates that a carefully tuned Random Forest, using only standardised meteorological indices, can provide skilful and interpretable SDI projections to support climate‑informed drought risk management.

Acknowledgment: This research was supported by the “Streamflow Drought Through Time” project funded by the EU NextGenerationEU through the Recovery and Resilience Plan of the Slovak Republic within the framework of project no. 09I03-03-V04-00186.

How to cite: Leščešen, I., Josić, M., Gnjato, S., Petrović, A. M., Bajtek, Z., and Pekárová, P.: Random Forest–Based Projection of Streamflow Drought Index from Meteorological Drought Indices under RCP Climate Scenarios, EGU General Assembly 2026, Vienna, Austria, 3–8 May 2026, EGU26-5096, https://doi.org/10.5194/egusphere-egu26-5096, 2026.

EGU26-5701 | ECS | Posters on site | HS4.10

Integrating Radar Nowcasting and Machine Learning in an Advanced Early-Warning System for Milan’s Hydraulic Node 

Enrico Gambini, Manuel Mazza, Gabriele Franch, Rishabh Wanjari, and Alessandro Ceppi

In recent decades, climate change has led to a significant increase in the frequency and intensity of extreme weather events, such as heavy rainfall and flash floods, resulting in higher hydrogeological risk and increased vulnerability of both ecosystems and urban infrastructures. These phenomena, characterized by strong spatial and temporal variability, are particularly impactful in urban areas, where impervious surfaces, high population density, and the presence of critical infrastructure amplify consequences of flooding and inundation.

The hydraulic system of Milan represents a critical case study: natural watercourses and artificial canals are closely intertwined with the urban fabric. In particular, floods of the River Seveso recurrently cause inundation in the northern part of the city, producing widespread damage to people, infrastructure, and mobility.

In this context, the ability to accurately forecast meteorological and hydrological variables at very short lead times is crucial for risk management and the development of timely early-warning systems. This study proposes the use of machine learning models, such as LDCast and GPTCast, developed by MeteoSwiss and the Bruno Kessler Foundation in Trento, respectively, for radar-based nowcasting. The estimates produced by these models are subsequently coupled both as input for physically based hydrological models and within artificial intelligence algorithms developed by the Politecnico di Milano.

The objective of the study is to evaluate the overall performance of this forecasting system and to demonstrate how it might represent a significant advancement in the implementation of very short-term early-warning systems.

How to cite: Gambini, E., Mazza, M., Franch, G., Wanjari, R., and Ceppi, A.: Integrating Radar Nowcasting and Machine Learning in an Advanced Early-Warning System for Milan’s Hydraulic Node, EGU General Assembly 2026, Vienna, Austria, 3–8 May 2026, EGU26-5701, https://doi.org/10.5194/egusphere-egu26-5701, 2026.

EGU26-5780 | ECS | Posters on site | HS4.10

Deep learning for the assimilation of process-based hydrological models 

Francis Lapointe, Lingling Zhang, Justine Hamelin, Svetoslav Radenkov, Younes Kaddache, Marie-Amélie Boucher, John Quilty, and James. R Craig

In hydrology, neural networks (NN) are often used to replace hydrological models. While they have been proven to perform well for forecasting and simulating streamflow, they may not always be adequate when transparency and process understanding are required. However, NN can also be used as complements to process-based hydrological models (e.g., physics-based or conceptual) as part of a forecasting chain. For instance, in Boucher et al. (2020), an ensemble of multilayer perceptrons was used to perform data assimilation of streamflow in the GR4J conceptual model, which yielded promising results.

Building on the approach introduced in Boucher et al. (2020), the research presented here aims to improve the NN-based data assimilation method and to alleviate its limitations. To achieve this, multilayer perceptrons are replaced by long short-term memory (LSTM) networks, with an additional attention component. Both streamflow and snow are assimilated, the main focus being on the latter. For this reason, this new methodology has been tested on watersheds located in Canada, Norway and Sweden, including the Mistassibi watershed, which was also used in Boucher et al. (2020). Each watershed has been modelled using two hydrological model structures (GR4J and HMETS) within the Raven modelling framework.

Results show a successful assimilation of both streamflow and snow, which translates into improved daily streamflow simulations compared to the open-loop (according to the CRPS and reliability diagrams), for all catchments and for both models. In particular, results for Mistassibi show an improvement of the post-assimilation simulations compared to Boucher et al. (2020). This presentation will explain those results in detail and also describe the next steps to further expand and generalize the proposed data assimilation method.

How to cite: Lapointe, F., Zhang, L., Hamelin, J., Radenkov, S., Kaddache, Y., Boucher, M.-A., Quilty, J., and Craig, J. R.: Deep learning for the assimilation of process-based hydrological models, EGU General Assembly 2026, Vienna, Austria, 3–8 May 2026, EGU26-5780, https://doi.org/10.5194/egusphere-egu26-5780, 2026.

EGU26-6669 | ECS | Orals | HS4.10

A National Scale Hybrid Model for Enhanced Groundwater Depth Estimation 

Jun Liu, Raphael Schneider, Lars Troldborg, Yueling ma, Reed Maxwell, and Julian Koch

Groundwater is an essential part of the hydrological system and is increasingly affected by climate variability and human pressures. Spatial and temporal variation of groundwater depth (GWD), defined as the depth to the saturated zone below ground surface, is a key variable for assessing groundwater–surface interactions and for evaluating risks to infrastructure, land use, droughts and flooding. In-situ measurements of GWD are often too sparse to capture its variability both in time and space and modelling becomes a necessity for consistent assessment.

In this study, we evaluated hybrid machine learning (ML) models that combine the strengths of existing hydrological simulations from Physically Based Models (PBM) with the predictive power of ML methods for improved GWD estimation in Denmark. The hybrid model reduced mean bias of PBM GWD estimates from 1.65 m to 0.21 m and decreased the Root Mean Square Error (RMSE) by about 1.5 m at national scale. Furthermore, we demonstrated that increasing the availability of GWD observations over time and space enhances model performance.

We also illustrated the flexibility and effectiveness of the hybrid approach for GWD estimation across scales, and results showed that the hybrid model developed with coarse spatial resolutions can be effectively used for high-resolution GWD estimation while maintaining a satisfactory level of accuracy. Specifically, the mean RMSE is reduced from 2.66 m for the model trained and applied at 500 m to only 2.30 m for the model trained at 500 m but applied at 10 m. Similarly, for the model trained at 100 m but applied at 10 m for prediction the RMSE is reduced from 2.35 m to 2.28 m.

This study highlights the potential of hybrid modeling as a practical solution for improving groundwater quantification accuracy and shows avenues for higher-resolution estimates.

How to cite: Liu, J., Schneider, R., Troldborg, L., ma, Y., Maxwell, R., and Koch, J.: A National Scale Hybrid Model for Enhanced Groundwater Depth Estimation, EGU General Assembly 2026, Vienna, Austria, 3–8 May 2026, EGU26-6669, https://doi.org/10.5194/egusphere-egu26-6669, 2026.

EGU26-8196 | ECS | Posters on site | HS4.10

On the potential of neural reservoirs for learning flow dynamics from data to enhance rainfall–runoff modeling 

Ngo Nghi Truyen Huynh, Pierre-André Garambois, Mouad Ettalbi, François Colleoni, Ngoc Bao Nguyen, and Benjamin Renard

Advancing hydrological modeling requires simultaneous improvements in predictive skill and process understanding. While conceptual rainfall–runoff models remain widely used for their physical interpretability and reasonable robustness, their empirical flux formulations limits flexibility and generalizability across contrasting hydro-climatic conditions. Recent hybrid modeling studies [1,2] have shown that integrating neural networks or universal differential equations into conceptual models for flux correction can improve performance while preserving physical constraints. Following this perspective, we introduce a new modeling paradigm termed « neural reservoir », in which traditional empirical reservoir flux laws are replaced by physics–neural operators [3]. These operators are constructed by combining neural operators with shape functions derived from functional analysis of the original flux equations, ensuring mass balance and physically admissible bounds while remaining fully flexible and trainable. This framework enables the learning of internal water fluxes governing reservoir dynamics directly from data, while retaining the interpretability and structural consistency of reservoir-based models. Preliminary results show that the neural reservoir consistently outperforms both classical conceptual and purely data-driven LSTM benchmark models, while exhibiting physically meaningful behaviors and enhanced responsiveness to hydro-climatic variability. Ongoing work focuses on extending the evaluation to large-sample and national-scale settings, as well as on integrating additional data sources to further refine process representation.


[1] Huynh, N. N. T., Garambois, P.-A., Renard, B., et al. (2025). A distributed hybrid physics–AI framework for learning corrections of internal hydrological fluxes and enhancing high-resolution regionalized flood modeling. Hydrol. Earth Syst. Sci., https://doi.org/10.5194/hess-29-3589-2025.

[2] Huynh, N. N. T., Garambois, P.-A., Colleoni, F., et al. ( 2026). A hybrid physics–AI approach using universal differential equations with state-dependent neural networks for learnable, regionalizable, spatially distributed hydrological modeling. Geosci. Model Dev., https://doi.org/10.5194/gmd-19-1055-2026.

[3] Huynh, N. N. T., Garambois, P.-A., Ettalbi, M., et al. (2026). Physics-Constrained Neural Reservoirs: A Powerful Neural Replacement of Conceptual Hydrological Laws for Learning Spatially Distributed Flow Dynamics. ESS Open Archive, https://doi.org/10.22541/essoar.177100580.07190684/v1.

How to cite: Huynh, N. N. T., Garambois, P.-A., Ettalbi, M., Colleoni, F., Nguyen, N. B., and Renard, B.: On the potential of neural reservoirs for learning flow dynamics from data to enhance rainfall–runoff modeling, EGU General Assembly 2026, Vienna, Austria, 3–8 May 2026, EGU26-8196, https://doi.org/10.5194/egusphere-egu26-8196, 2026.

EGU26-8502 | Posters on site | HS4.10

A ConvLSTM surrogate model to predict high-resolution daily snow water equivalent in Norway 

Leandro Avila, Kolbjørn Engeland, Trine Jahr, and Stefan Kollet

In regions where the hydrological cycle is strongly influenced by seasonal snow dynamics, accurate estimation and prediction of Snow Water Equivalent (SWE) are essential for water resource management, hydropower planning, and flood forecasting. While traditional methods like in-situ observations, numerical models, and remote sensing provide robust and reliable approaches for monitoring SWE, challenges remain with respect to ungauged regions and precdictions. These include the difficulty of installing measurement stations in certain regions and resulting observation scarcity, high computational costs, complex parametrization, and low spatial resolution or limited temporal data availability.

Data-driven methods enable the creation and transfer of surrogate models capable of learning complex spatiotemporal relationships between meteorological forcings and SWE dynamics directly from high-fidelity simulations. This study develops a surrogate model using a Convolutional Long Short-Term Memory (ConvLSTM) architecture to provide high-resolution daily SWE estimates and forecasts for Norway. Specifically, the ConvLSTM is trained to emulate the operational SeNorge snow model, creating a portable and computationally efficient tool that can generate accurate SWE fields from diverse meteorological inputs.

The proposed ConvLSTM framework integrates spatial and temporal dependencies by processing sequences of gridded meteorological forcings (precipitation and temperature), static topographic features, and cyclical temporal indicators. To enable robust multi-day forecasting, the model employs an autoregressive training scheme with scheduled sampling. This approach gradually shifts the model from using true SWE values to its own previous predictions as inputs during training, effectively reducing error accumulation within a 7-day prediction horizon.

To evaluate the potential for areal transfer of the surrogate model for pan-European applications, we additionally forced the trained architecture with bias-corrected meteorological data from the ERA5-Land reanalysis. The results demonstrate that the ConvLSTM surrogate model accurately captures the spatiotemporal evolution of SWE across Norway's complex terrain, which suggests that the model indeed learned general physical relationships between input feature and target. Therefore, when driven by SeNorge data, the model achieves good fidelity with a median KGE of 0.8, effectively replicating seasonal accumulation, peak SWE magnitudes, and melt dynamics. Notably, when forced with the global ERA5 reanalysis dataset, the model maintains robust performance (KGE ~ 0.60), indicating its ability to generate reliable SWE estimates and potential transferability to other regions worldwide. .

This work is funded by the European Union’s HORIZON Research and Innovation Actions Program under Grant Agreement No. 101059372 (STARS4Water project) and the BMBF BioökonomieREVIER funding scheme with its BioRevierPlus project (funding reference 031B1137D/031B1137DX). 


How to cite: Avila, L., Engeland, K., Jahr, T., and Kollet, S.: A ConvLSTM surrogate model to predict high-resolution daily snow water equivalent in Norway, EGU General Assembly 2026, Vienna, Austria, 3–8 May 2026, EGU26-8502, https://doi.org/10.5194/egusphere-egu26-8502, 2026.

EGU26-8720 | ECS | Posters on site | HS4.10

Real-time Flood Forecasting Model for Taipei City Using IoT Sensor Networks 

Safeeda Safar, Tzai-Hung Wen, and Yuan-Mei Hua

Urban flooding is intensifying under climate change and rapid urbanization, particularly in densely built metropolitan basins with limited drainage capacity. Taipei City, located within a low-lying alluvial basin and frequently affected by typhoons and short-duration extreme rainfall, experiences recurrent flash flood hazards. Conventional urban flood forecasting systems primarily rely on static rain gauge or satellite precipitation products, which suffer from coarse temporal resolution, sparse spatial coverage, and high forecast latency, constraining effective real-time early warning.

This study develops an IoT-enabled real-time urban flood forecasting framework for Taipei City by assimilating high-frequency rainfall observations into an operational hydrologic-hydraulic modeling chain. The Keelung River basin is selected as a representative urban catchment. Rainfall observations at a 10-minute temporal resolution are retrieved from Taiwan’s Civil IoT SensorThings API and dynamically injected into a HEC-HMS rainfall-runoff model within the HEC-RTS forecasting environment. The hydrologic model employs the SCS Curve Number method for loss estimation, SCS Unit Hydrograph for runoff transformation, linear reservoir baseflow representation, and Muskingum channel routing. Model calibration and validation are conducted using observed discharge data from historical typhoon events.

Model performance is evaluated using Kling-Gupta Efficiency(KGE), Nash-Sutcliffe Efficiency(NSE), RMSE, and percent bias. The system targets a KGE ≥ 0.75 while achieving a minimum 15-minute reduction in warning latency compared to traditional hourly gauge-driven simulations. The simulated discharge hydrographs are designed for coupling with a 2D HEC-RAS hydraulic model to generate urban flood inundation maps, with spatial performance assessed using an IoU threshold of ≥ 0.65.This study demonstrates that assimilating high-frequency IoT rainfall observations into an operational urban flood forecasting framework can significantly reduce warning latency without degrading hydrologic or hydraulic predictive skill.

How to cite: Safar, S., Wen, T.-H., and Hua, Y.-M.: Real-time Flood Forecasting Model for Taipei City Using IoT Sensor Networks, EGU General Assembly 2026, Vienna, Austria, 3–8 May 2026, EGU26-8720, https://doi.org/10.5194/egusphere-egu26-8720, 2026.

High resolution gravity field data sets provide valuable information about the wetness state of a catchment, which is a useful indicator in flood early warning systems.

The HiGrav Project aims to increase the temporal and spatial resolution of GRACE/GRACE-Follow-On (FO) data and derived terrestrial water storage anomalies (TWSAs) and wetness index data. Further, the project will assess the utility of this enhanced information basis for flood forecasting in terms of forecast accuracy and flood early warning reliability.

We will explore if downscaled GRACE/GRACE-FO data sets are useful to improve flood forecasting and warning at a regional scale (areas of around 10.000 km²). For this purpose, the semi-distributed, process-based hydrological model PANTA-RHEI will be used. The model is used operationally by the Flood Forecasting and Warning Centre in Lower Saxony (NLWKN - HWVZ). An extended PANTA RHEI model will be developed to dynamically assimilate high-resolution GRACE/GRACE-FO TWS data for regional flood forecasting by associating these data with model parameters and state variables that represent catchment water storage in terms of e.g. soil moisture and snow using machine learning. The performance of the extended model will be assessed in the Aller-Leine-Oker, Ilmenau, Hase, Wümme, Hunte, Vechte, Große Aue river basins in Lower Saxony with catchment areas between 3.000 and 15.000 km² using hindcast simulations in the period from 2017 to 2025 which includes significant flood events.

 With this contribution, we aim to present our scientific motivation, discuss the methodological framework, ideas and anticipated outcomes.

How to cite: Özgür, S. and Schröter, K.: Enhancing regional Flood Early Warning Systems using High-Resolution GRACE/GRACE-FO total water storage (TWS) and wetness index data, EGU General Assembly 2026, Vienna, Austria, 3–8 May 2026, EGU26-9818, https://doi.org/10.5194/egusphere-egu26-9818, 2026.

EGU26-10432 | ECS | Posters on site | HS4.10

The combined impact of data assimilation and machine learning post-processing in improving flood forecasts 

Gustavo Gabbardo dos Reis, Paul C. Astagneau, François Bourgin, Vazken Andréassian, and Charles Perrin

Accurate streamflow forecasts are essential for flood risk management and impact mitigation. In recent years, the coupling of hydrological models with machine learning techniques has gained increasing attention to improve forecast skill, with post-processing emerging among the various existing approaches to correct systematic model errors. However, the interaction between machine learning post-processing, data assimilation and calibration strategies remains insufficiently explored. In this study, we assess the contribution of machine learning-based post-processing to hourly streamflow forecasts across 687 catchments in metropolitan France, covering a wide range of hydroclimatic conditions. Streamflow forecasts are generated using the GR5H-RI hydrological model under three forecasting approaches that differ in calibration strategy and use of data assimilation. Two machine learning models, Random Forest and Multilayer Perceptron, are applied to post-process raw forecasts at lead times of 3, 6, 12 and 24 hours. Forecast performance is evaluated using both continuous skill metrics relative to persistence and threshold-based metrics for flood event detection. Results show that post-processing consistently improves forecast skill at short lead times, especially for catchments with slower hydrological responses. The largest relative gains are observed for open-loop forecasts (i.e., without data assimilation), indicating that post-processing can mitigate the absence of state updating, although it does not fully replace it. Neural network-based post-processing slightly outperforms tree-based models in continuous metrics, while differences are more limited for event detection. Overall, results highlight the complementary roles of data assimilation and machine learning post-processing and demonstrate the potential of such frameworks for operational flood forecasting.

How to cite: Gabbardo dos Reis, G., Astagneau, P. C., Bourgin, F., Andréassian, V., and Perrin, C.: The combined impact of data assimilation and machine learning post-processing in improving flood forecasts, EGU General Assembly 2026, Vienna, Austria, 3–8 May 2026, EGU26-10432, https://doi.org/10.5194/egusphere-egu26-10432, 2026.

EGU26-10649 | Posters on site | HS4.10

A Regionalization-Guided LSTM Model for Flood Forecasting in Data-Scarce Catchments 

Kejia Ye, Zhongmin Liang, Yiming Hu, Jun wang, and Binquan Li

Flood forecasting in data-scarce catchments remains a major challenge due to limited observations and heterogeneity among basins. In this study, a regional long short-term memory model (R-LSTM) is proposed, in which runoff data are scalarised using catchment attributes, to reduce local influences and generate unified geomorphological-runoff factors for regional modeling. The proposed model is evaluated in the Jiaodong Peninsula, China, and compared with local LSTMs and regional LSTMs that incorporate catchment attributes in different ways. Results indicate that the R-LSTM consistently outperforms the benchmark models, especially in flood peak simulation. These findings demonstrate the effectiveness of the proposed regionalization strategy, providing a reference for flood forecasting in data-scarce regions.

How to cite: Ye, K., Liang, Z., Hu, Y., wang, J., and Li, B.: A Regionalization-Guided LSTM Model for Flood Forecasting in Data-Scarce Catchments, EGU General Assembly 2026, Vienna, Austria, 3–8 May 2026, EGU26-10649, https://doi.org/10.5194/egusphere-egu26-10649, 2026.

EGU26-10806 | ECS | Posters on site | HS4.10

Sub-seasonal to seasonal ensemble streamflow forecasting using a Handoff forecast LSTM 

Zoë Jack, Florian Surmont, Bob E Saint Fleur, Otis Cooper, and Eric Gaume

Despite recent advances in operational streamflow forecasting systems, anticipating and forecasting droughts and associated low-flow conditions remain major challenges in hydrology, with substantial impacts on water-dependent sectors such as agriculture and industry. Enhancing sub-seasonal to seasonal streamflow forecasting is therefore critical for improving water resources management. This study investigates the performance of a Handoff forecast Long Short-Term Memory (LSTM) architecture (Nearing et al., 2024) for probabilistic streamflow forecasting at lead times extending up to six months, with a particular emphasis on low-flow conditions.

The Handoff forecast LSTM is trained regionally on a subset of 292 basins from the Catchment Attributes and MEteorology for Large-sample Studies - FRance dataset (CAMELS-FR) (Delaigue et al., 2025), after excluding basins affected by unreliable low-flow measurements. Model training relies on basin-averaged hydro-meteorological reanalysis data provided by CAMELS-FR. Evaluation of the model is conducted using ensemble streamflow forecasts generated from historical scenarios and meteorological ensemble predictions from the SEAS5 model from the European Center for Medium-Range Weather Forecasts (ECMWF) (Johnson et al., 2019)

The generated ensemble streamflow forecasts are evaluated using a set of probabilistic metrics such as the Continuous Ranked Probability Score (CRPS), the Brier Score, the Area under the ROC curve, and the Talagrand diagram, and using the natural streamflow climatology as a reference. In addition, a sensitivity analysis of static catchment attributes is performed to assess their relative contribution to model performance and to better understand the drivers of predictability across basins.

Delaigue, O., Guimarães, G. M., Brigode, P., Génot, B., Perrin, C., Soubeyroux, J.-M., Janet, B., Addor, N., & Andréassian, V. (2025). CAMELS-FR dataset: a large-sample hydroclimatic dataset for France to explore hydrological diversity and support model benchmarking. Earth System Science Data, 17(4), 1461–1479. https://doi.org/10.5194/essd-17-1461-2025

Johnson, S. J., Stockdale, T. N., Ferranti, L., Balmaseda, M. A., Molteni, F., Magnusson, L., Tietsche, S., Decremer, D., Weisheimer, A., Balsamo, G., Keeley, S. P. E., Mogensen, K., Zuo, H., & Monge-Sanz, B. M. (2019). SEAS5: The new ECMWF seasonal forecast system. Geoscientific Model Development, 12(3), 1087–1117. https://doi.org/10.5194/gmd-12-1087-2019

Nearing, G., Cohen, D., Dube, V., Gauch, M., Gilon, O., Harrigan, S., Hassidim, A., Klotz, D., Kratzert, F., Metzger, A., Nevo, S., Pappenberger, F., Prudhomme, C., Shalev, G., Shenzis, S., Tekalign, T. Y., Weitzner, D., & Matias, Y. (2024). Global prediction of extreme floods in ungauged watersheds. Nature, 627(8004), 559–563. https://doi.org/10.1038/s41586-024-07145-1

How to cite: Jack, Z., Surmont, F., Saint Fleur, B. E., Cooper, O., and Gaume, E.: Sub-seasonal to seasonal ensemble streamflow forecasting using a Handoff forecast LSTM, EGU General Assembly 2026, Vienna, Austria, 3–8 May 2026, EGU26-10806, https://doi.org/10.5194/egusphere-egu26-10806, 2026.

Distributed hydrological models are the mainstream paradigm for watershed hydrological simulation, integrating heterogeneous factors through spatial discretization and demonstrating significant advantages in revealing the spatial differentiation patterns of hydrological processes. However, the high-dimensional parameter space leads to high computational costs and low robustness in parameter calibration in traditional distributed hydrological models. Taking Weihe River Basin and Water Allocation and Cycle Model (WACM), a traditional distributed hydrological model, as the study area and base model, this study proposed a surrogate Deep Neural Operator (DeepONet) model to enhance the calibration efficiency. The surrogate DeepONet uses a branch network to project the high-dimensional model parameters into a compact latent space and a trunk network to encode the spatiotemporal coordinates of runoff outputs, jointly learning a nonlinear mapping from parameters to runoff that replaces direct calibration in the original parameter space and thus greatly reduces both the effective parameter dimensionality and the computational cost of calibration. The results show that the median Kling–Gupta Efficiency (KGE) coefficient across all gauging stations exceeds 0.85, whereas the parameter calibration time is reduced to less than 10% of that required by traditional genetic algorithms. In addition, the surrogate model achieved high accuracy in runoff prediction, with KGE values above 0.80 at these ungauged stations. This study demonstrates that the deep integration of physical mechanisms and data-driven approaches can effectively enhance the trade-off in the efficiency-accuracy dilemma in hydrological simulations and presents a sound solution for high-dimensional parameter calibration in distributed hydrological models.

How to cite: Wang, T.: DeepONet Surrogate for Accelerating Distributed Hydrological Model Simulations, EGU General Assembly 2026, Vienna, Austria, 3–8 May 2026, EGU26-10995, https://doi.org/10.5194/egusphere-egu26-10995, 2026.

EGU26-11062 | ECS | Orals | HS4.10

Hybrid surrogate modeling of compound flood events using SFINCS-LSG  

Dirk Eilander, Roel de Goede, Tim Leijnse, and Niels Fræhr

Compound floods arise from interacting drivers such as rainfall, river discharge, and coastal surge, posing challenges for risk assessment due to their stochastic nature. Traditional hydrodynamic models, while accurate, are computationally expensive for ensemble forecasting and probabilistic analysis. Surrogate models offer a promising alternative, but most existing approaches focus on single drivers or static flood conditions, limiting their applicability to compound events. The hybrid SFINCS–LSG surrogate model addresses these gaps by integrating low-resolution SFINCS simulations with Empirical Orthogonal Function (EOF) decomposition and Sparse Gaussian Process learning to emulate high-resolution flood dynamics. Two case studies, Charleston, USA, and Brisbane, Australia, were selected to evaluate model performance under diverse flood conditions. Training datasets were generated by scaling historical events decomposed to individual flood drivers to ensure coverage of diverse flood conditions. Model skill was assessed against high-fidelity SFINCS simulations using Critical Success Index (CSI) for flood extent and Root Mean Square Error (RMSE) for flood depth. Our results showed that SFINCS–LSG achieved speed-ups of 50–150× compared to high-fidelity SFINCS simulations with good accuracy. The median RMSE for flood depth was 0.06 m for the Charleston and a CSI of 0.96 and 0.91 respectively. However, performance varied by flood type due to large variability in extent between coastal and compound or pluvial-fluvial events. The compression of spatial information through EOF analysis introduced noise, which constrained the model’s ability to reproduce dominant flood driver zones. Despite these limitations, the approach demonstrates potential for real-time forecasting and probabilistic risk analysis where many simulations are required. This research advances state-of-the art surrogate models by capturing dynamic spatiotemporal flood evolution under multi-driver conditions rather than static peak inundation. Overall, the SFINCS–LSG framework offers a scalable solution for accelerating compound flood modelling at very limited loss of accuracy.

How to cite: Eilander, D., de Goede, R., Leijnse, T., and Fræhr, N.: Hybrid surrogate modeling of compound flood events using SFINCS-LSG , EGU General Assembly 2026, Vienna, Austria, 3–8 May 2026, EGU26-11062, https://doi.org/10.5194/egusphere-egu26-11062, 2026.

EGU26-11106 | ECS | Posters on site | HS4.10

Reservoir Inflow Prediction using Machine Learning Techniques 

Yuvraj Nanasaheb Dhivar and Madan Kumar Jha

Accurate forecasting of reservoir inflow is crucial for effective water management, especially in regions with limited water resources and high demand from various sectors, including irrigation, domestic, and industrial uses. For the effective planning and management of reservoir operations, flood control, hydroelectric power generation, and drought mitigation, predicting reservoir inflow plays a crucial role. With the rapid increase in population and industrialization, uncertainty in reservoir storage has increased, leading to a risk of water stress and compromised water security. Therefore, predicting reservoir inflow is crucial for reservoir operation and efficient water management. The inflow prediction is challenging due to the complex and dynamic nature of the rainfall-runoff process in a river basin. Hydrological models provide a simplified representation of real hydrological systems; despite this, due to the complexities and uncertainties in hydrological processes, it is challenging to achieve accurate predictions. In recent years, machine learning (ML) techniques have been widely used for simulating the streamflow due to their accuracy in capturing complex and non-stationary relationships between rainfall and streamflow. However, these ML models do not account for the physical characteristics of the watershed. Therefore, to increase the accuracy of prediction by gaining a better understanding of the hydrological patterns, physics-based, hybrid machine learning models have been developed in this study and applied in a river basin of Maharashtra, India. A physics-based HEC-HMC model was combined with ML models, such as long short-term memory (LSTM) and extreme gradient boosting (XGBoost), to develop a hybrid ML model using 2001 to 2021 hydro-meteorological data. The hybrid ML model was found to be capable of predicting the inflow (QIF) into the reservoir. The daily values of hydro-meteorological variables, viz., rainfall, temperature, relative humidity, wind speed, and reservoir inflow, were used to simulate the HEC-HMC model. The HEC-HMS simulated reservoir inflow (Qh), along with its lagged values (Qh-1, Qh-2), reservoir storage, rainfall, evaporation loss, and other factors, were used as inputs to the machine learning models. The preliminary results indicated that Qh, Qh-1 and lag-1 rainfall variables are essential inputs to machine learning models for the accurate prediction of the reservoir inflow. 

How to cite: Dhivar, Y. N. and Jha, M. K.: Reservoir Inflow Prediction using Machine Learning Techniques, EGU General Assembly 2026, Vienna, Austria, 3–8 May 2026, EGU26-11106, https://doi.org/10.5194/egusphere-egu26-11106, 2026.

EGU26-11200 | ECS | Orals | HS4.10

Exploring reservoir network structures for rainfall–runoff modelling 

Juan F. Farfán-Durán, Thiago V. M. do Nascimento, Dmitri Kavetski, and Fabrizio Fenicia

Catchment hydrology relies on models with complementary strengths and limitations in terms of physical interpretability, data requirements, structural flexibility, and predictive performance. Conceptual process-based models provide parsimony and physical meaning, but often sacrifice predictive performance. Data-driven approaches offer greater flexibility and predictive skill, yet often sacrifice interpretability and physical consistency. Hybrid strategies seek to combine these strengths, but many existing implementations rely on loosely constrained components that obscure process understanding.

In this study, we explore a structured reservoir network architecture for rainfall–runoff modelling as an intermediate approach between conceptual hydrological models and fully data-driven approaches. Rather than framing the method as a neural network, we focus on assembling physically interpretable reservoir elements into a network structure that can be calibrated using gradient-based optimization while preserving hydrological meaning.

The proposed model represents runoff generation through multiple parallel reservoir chains, each governed by a conceptual soil moisture balance with physically interpretable parameters. Excess rainfall from each chain is routed using convolution with a gamma transfer function to represent delayed runoff response. The routed contributions are combined through convex weighting, enabling a transparent and controlled aggregation of parallel runoff pathways. The overall architecture remains mass-conservative and avoids black-box recurrent components.

The approach is evaluated across multiple catchments within the Moselle basin (27,100 km²), which exhibits substantial heterogeneity in elevation and land use. The model is driven by daily precipitation and potential evapotranspiration and evaluated against observed discharge. Performance is assessed using the Nash–Sutcliffe Efficiency and hydrological signatures, and results are compared to the GR4J conceptual model under identical calibration conditions.

Results indicate that the proposed reservoir network achieves performance comparable to or slightly better than GR4J, with a mean validation NSE of 0.70 compared to 0.67. Improvements are particularly evident for low-flow metrics and flow-duration curve characteristics. Beyond predictive performance, the model enables interpretation of the relative contributions and temporal dynamics of parallel runoff generation pathways.

Overall, this work demonstrates the potential of reservoir network architectures as a transparent and flexible modelling framework for rainfall–runoff simulation and process exploration. Future work will focus on incorporating additional catchment information, such as permeability and physiographic descriptors, and on extending the approach toward regional-scale applications across heterogeneous catchments.

How to cite: Farfán-Durán, J. F., V. M. do Nascimento, T., Kavetski, D., and Fenicia, F.: Exploring reservoir network structures for rainfall–runoff modelling, EGU General Assembly 2026, Vienna, Austria, 3–8 May 2026, EGU26-11200, https://doi.org/10.5194/egusphere-egu26-11200, 2026.

EGU26-11878 | ECS | Orals | HS4.10

AI-based seasonal probabilistic hydrological forecasts across Europe 

Claudia Bertini, Yiheng Du, Schalk Jan van Andel, and Ilias Pechlivanidis

Artificial Intelligence (AI) approaches are nowadays well-established tools to make hydro-meteorological forecasts. While several AI-based models are available to provide probabilistic meteorological (e.g. Lang et al., 2024) or hydrological (Nevo et al., 2022) short-range predictions at global scale, seasonal hydrological probabilistic forecasts at large scale are still lagging behind. Here, we present the updated results of our AI-based seasonal hydrological forecasts across the European hydro-climatic gradient (Bertini et al., 2025). We use an Encoder-Decoder model trained at the pan-European scale with a combination of in-situ hydrological observations, reanalysis data from the process-based E-HYPE hydrological model, and bias-adjusted seasonal meteorological forecasts from the ECMWF SEAS5 prediction system. The model is trained over 500 catchments across Europe, grouped in 11 clusters based on their hydrological regime (Pechlivanidis et al., 2020), and the predictions are compared against both climatology and the E-HYPE streamflow forecasts. Compared to our previous results, the updated Encoder-Decoder model provides improved deterministic and probabilistic performances, proving once again the potential of AI approaches for operational hydrological forecasting.


Lang, S., Alexe, M., Chantry, M., Dramsch, J., Pinault, F., Raoult, B., ... & Rabier, F. (2024). AIFS--ECMWF's data-driven forecasting system. arXiv preprint arXiv:2406.01465.

Nevo, S., Morin, E., Gerzi Rosenthal, A., Metzger, A., Barshai, C., Weitzner, D., ... & Matias, Y. (2022). Flood forecasting with machine learning models in an operational framework. Hydrology and Earth System Sciences, 26(15), 4013-4032.

Bertini, C., Du, Y., van Andel, S. J., and Pechlivanidis, I.: AI-based seasonal streamflow forecasts across Europe’s hydro-climatic gradient, EGU General Assembly 2025, Vienna, Austria, 27 Apr–2 May 2025, EGU25-10567, https://doi.org/10.5194/egusphere-egu25-10567, 2025.

Pechlivanidis, I.G., Crochemore, L., Rosberg, J., & Bosshard, T. (2020). What are the key drivers controlling the quality of seasonal streamflow forecasts? Water Resources Research, 56, e2019WR026987. https://doi.org/10.1029/2019WR026987

How to cite: Bertini, C., Du, Y., van Andel, S. J., and Pechlivanidis, I.: AI-based seasonal probabilistic hydrological forecasts across Europe, EGU General Assembly 2026, Vienna, Austria, 3–8 May 2026, EGU26-11878, https://doi.org/10.5194/egusphere-egu26-11878, 2026.

EGU26-13650 | Orals | HS4.10

AIFL: A New Global Flood Forecasting Model Trained on CARAVAN 

Maria Luisa Taccari, Kenza Tazi, Oisín M. Morrison, Andreas Grafberger, Juan Colonese, Corentin Carton de Wiart, Christel Prudhomme, Cinzia Mazzetti, Matthew Chantry, and Florian Pappenberger

Reliable global streamflow forecasting is essential for flood preparedness, yet data-driven models often suffer from a performance gap when transitioning from historical reanalysis to operational forecast products. This study introduces AIFL (Artificial Intelligence for Floods), a deterministic LSTM-based model designed for global daily streamflow forecasting. Trained on 18,588 basins curated from the CARAVAN dataset, AIFL utilizes a novel two-stage training strategy to bridge the reanalysis-to-forecast domain shift. The model is first pretrained on 40 years of ERA5 reanalysis to capture robust hydrological processes, then fine-tuned on operational Integrated Forecasting System (IFS) control forecasts to adapt to the specific error structures and biases of operational numerical weather prediction. To our knowledge, this is the first global model trained end-to-end within the CARAVAN and MultiMet ecosystem. Evaluated on an independent temporal test set (2021–2024), AIFL achieves a median KGE’ of 0.66 and a median NSE of 0.53. Benchmarking results show that AIFL is highly competitive with current state-of-the-art global systems, maintaining a transparent and reproducible forcing pipeline while demonstrating exceptional reliability in extreme event detection. The resulting model provides a streamlined and operationally robust baseline for the global hydrological community. 

How to cite: Taccari, M. L., Tazi, K., M. Morrison, O., Grafberger, A., Colonese, J., Carton de Wiart, C., Prudhomme, C., Mazzetti, C., Chantry, M., and Pappenberger, F.: AIFL: A New Global Flood Forecasting Model Trained on CARAVAN, EGU General Assembly 2026, Vienna, Austria, 3–8 May 2026, EGU26-13650, https://doi.org/10.5194/egusphere-egu26-13650, 2026.

EGU26-13767 | ECS | Posters on site | HS4.10

Machine Learning Emulator for Large-Sample Hydrologic Model Calibration across Multiple FUSE Structures 

Shadi Hatami, Nicolás Vásquez, Cyril Thébault, Wouter Knoben, Darri Eythorsson, Simon Michael Papalexiou, and Martyn Clark

Large-sample hydrologic studies often require calibrating multiple model structures across numerous catchments, which can be computationally intensive with traditional optimization algorithms. Alternatively, recent advances in Machine Learning (ML) have enabled computationally frugal calibration strategies that rely on model emulators. Such approaches leverage information across sites, enabling improved calibration efficiency and parameter transferability to unseen catchments. However, exploring the parameter space using emulators is challenging because of emulator error and the need to explore high-dimensional parameter spaces. In this work, we investigate ML-based emulation and optimization strategies designed to improve parameter-space exploration, with the broader goal of supporting reproducible and computationally feasible large-sample hydrologic simulation. To this end, we use the Framework for Understanding Structural Errors (FUSE), which systematically represents alternative process formulations through multiple model configurations. Our framework is calibrated for 1,070 catchments across North America, spanning a wide range of hydroclimatic conditions. We develop Random Forest (RF) and Quantile Random Forest (QRF) emulators to approximate the relationship between model parameters, catchment attributes, and the Kling–Gupta Efficiency (KGE). While RF provides point estimates, QRF captures predictive uncertainty through conditional quantiles. These emulators are integrated into two calibration strategies: (1) a standard Genetic Algorithm (GA) that efficiently searches for high-performing parameter sets, and (2) a two-step hybrid optimizer that first performs a broad global search using Markov chain Monte Carlo sampling and then refines promising solutions using local gradient-based optimization. By more fully evaluating the parameter space and avoiding premature convergence, the two-step strategy captures a more diverse ensemble of near-optimal parameter solutions. This diversity is particularly valuable for emulator-based calibration, as it allows the emulator to be retrained iteratively on a broader range of the parameter space, improving robustness and reducing reliance on narrowly sampled regions. These improvements are expected to support more stable parameter estimates and improved hydrologic simulations across a large sample of catchments. Overall, this hybrid framework enables reproducible and computationally efficient calibration across multiple model structures and hundreds of catchments, providing a scalable pathway for integrating ML emulators into large-sample hydrologic modeling workflows.

How to cite: Hatami, S., Vásquez, N., Thébault, C., Knoben, W., Eythorsson, D., Papalexiou, S. M., and Clark, M.: Machine Learning Emulator for Large-Sample Hydrologic Model Calibration across Multiple FUSE Structures, EGU General Assembly 2026, Vienna, Austria, 3–8 May 2026, EGU26-13767, https://doi.org/10.5194/egusphere-egu26-13767, 2026.

EGU26-14714 | ECS | Posters on site | HS4.10

Training a differentiable conceptual functional equivalent of the US national water model to estimate parameters for use in NextGen 

Ziyu Li, Andy Wood, Daniel McKenzie, and Jonathan M. Frame

Hydrologic model calibration can be challenging even with sufficient observations to constrain local model parameters, and far more difficult when estimating parameters across large domains – a process known as parameter regionalization. In recent years, the use of machine learning in differentiable hydrologic modeling has shown potential to address this regionalization problem. Here, a neural network learns to predict model parameters from meteorological forcings and geophysical catchment attributes by updating its weights using gradient-based optimization to minimize a loss function that quantifies the discrepancy between the conceptual model’s simulations and the observations. Such a model trained over a large set of basins at once will learn regional hydrological behaviors and can be used for parameter regionalization. We investigate whether this approach can be used to determine static parameters for NOAA’s Next Generation Water Resources Modeling Framework (NextGen), specifically for the National Water Model Conceptual Functional Equivalent (CFE) model by embedding a differentiable version (dCFE) into the NeuralHydrology (NH) platform for training and extracting the trained neural network to use in CFE parameter regionalization across CONUS. We introduce two ways of extracting static parameters from the neural network, and compare these to dynamic parameters obtained using the same workflow. This presentation describes this effort, including the validation of NH-dCFE to dCFE and CFE, successes in three modes of training, and the challenges encountered. We also offer recommendations on strategies to advance this parameter estimation approach in the future.

How to cite: Li, Z., Wood, A., McKenzie, D., and Frame, J. M.: Training a differentiable conceptual functional equivalent of the US national water model to estimate parameters for use in NextGen, EGU General Assembly 2026, Vienna, Austria, 3–8 May 2026, EGU26-14714, https://doi.org/10.5194/egusphere-egu26-14714, 2026.

EGU26-14903 | ECS | Orals | HS4.10

Accurately and Efficiently Predicting High-Resolution Inundation using a Hybrid Machine Learning and Physics-Based Approach 

Amelia Peeples, Elena Leonarduzzi, Laura E. Condon, and Reed M. Maxwell

Predicting high-resolution inundation at large spatial and temporal scales is important in understanding future water availability and flood risk. Classically, hydrologic models have been used to model inundation, but the computational expense associated with applying hydrologic models at large scales has motivated the use of other methodologies, such as machine learning. We propose a hybrid physics-based and machine learning modeling approach to produce high-resolution inundation maps at a much lower computational cost than high-resolution physics-based modeling while still maintaining high accuracy. This methodology is then tested in a representative watershed in Colorado, USA.


The proposed hybrid physics-based and machine learning modeling approach consists of a coarse spatial resolution hydrologic model and a random forest downscaling postprocessing step. First, a 1km resolution integrated surface-subsurface hydrologic model, ParFlow-CLM, is ran for the spatial and temporal domain of interest. Then, the resultant modeled inundation as well as additional climate and geographical parameters are fed into a random forest model which predicts inundation at a higher spatial resolution. We tested this methodology in a 1800km2 watershed in Colorado, USA during the 2019 water year to predict modeled inundation produced by a 100m resolution hydrologic model. In our test case, this hybrid methodology predicted whether each fine resolution cell is inundated at each hourly timestep correctly >97% of the time and maintained high accuracy in unseen timesteps as well as in unseen locations within the same region. We will also discuss next steps to predict real-world inundation by training the random forest model on 30m resolution satellite data. This study shows the potential for this methodology to be applied at the continental scale to predict high-resolution inundation accurately and efficiently.

How to cite: Peeples, A., Leonarduzzi, E., Condon, L. E., and Maxwell, R. M.: Accurately and Efficiently Predicting High-Resolution Inundation using a Hybrid Machine Learning and Physics-Based Approach, EGU General Assembly 2026, Vienna, Austria, 3–8 May 2026, EGU26-14903, https://doi.org/10.5194/egusphere-egu26-14903, 2026.

Structural uncertainty in physics-based models (PBMs) and the limited generalisability of purely data-driven techniques limit the ability of predicting daily streamflow in catchments in data-scare region. In order to enhance prediction accuracy and geographic transferability, this study proposes a coupled physics-based-machine learning (PBM-ML) framework that combines knowledge of hydrological processes with data-driven learning. The framework was tested in multiple catchments with different hydroclimatic conditions, encompassing basins in Japan and New Zealand. PBM-derived states and fluxes were fed into machine-learning models after a PBM (SWAT) was first calibrated to simulate daily streamflow. The Nash-Sutcliffe efficiency (NSE) and coefficient of determination (R2) were used to evaluate the performance of the model. Coupled PBM-ML models consistently performed better than standalone SWAT in all basins. Testing NSE improved from 0.69-0.76 for SWAT to 0.80-0.89 for coupled models in New Zealand and from 0.67-0.68 to 0.74-0.86 in Japan. SWAT-LSTM had the best prediction ability among the hybrid methods. Regionalization approaches were used to investigate the transferability of the model. The coupled models retained robust performance under partially gauged and fully ungauged conditions. These findings demonstrate that PBM-ML coupling could enhance streamflow prediction and transferability in data-scarce regions.

How to cite: Anand, V., Oki, T., and Singh, S. K.: A coupled physics-based and machine-learning approach for enhancing daily streamflow simulations in data-scarce regions, EGU General Assembly 2026, Vienna, Austria, 3–8 May 2026, EGU26-15401, https://doi.org/10.5194/egusphere-egu26-15401, 2026.

EGU26-15490 | ECS | Posters on site | HS4.10

Comparative analysis of gridded and station-based meteorological data for deep learning-based streamflow prediction 

Minchang Kim, Younghun Lee, Yoonnoh Lee, and Sangchul Lee

Accurate streamflow prediction is fundamental for water resource management and disaster response. However, predicting streamflow with station-based meteorological observations faces challenges due to low spatial density. In contrast, gridded meteorological data provide spatially continuous information, leading to improved streamflow prediction accuracy. Deep learning (DL) models have been widely adopted in water management and mostly use precipitation as an input. Therefore, this study tests whether gridded precipitation improves the predictive accuracy of DL models for streamflow in the Miho River Watershed, South Korea. Modified Korean Parameter-elevation Regression on Independent Slopes Model (MK-PRISM) is used as gridded precipitation. The MK-PRISM data with 1 km spatial resolution consider elevation, topographic facet, and coastal proximity. This study utilizes six meteorological variables: precipitation, average temperature, maximum temperature, minimum temperature, wind speed, and relative humidity. Three DL models, Long Short-Term Memory (LSTM), Bidirectional LSTM (Bi-LSTM), and Convolutional Neural Networks-LSTM (CNN-LSTM), are used in this study. Five experimental cases are developed for this study. Cases 1 through 4 utilize LSTM and Bi-LSTM, while Case 5 implements a CNN-LSTM. Case 1 uses station-averaged data across the watershed. Case 2 employs the average of MK-PRISM at the watershed level. Case 3 uses meteorological data from individual stations. Case 4 utilizes the average of MK-PRISM at the sub-basin level. Finally, Case 5 employs a CNN-LSTM to use the original format of MK-PRISM as input data. The results of this study will demonstrate the advantages of gridded precipitation to predict streamflow with DL models and propose a suitable format of gridded precipitation.

How to cite: Kim, M., Lee, Y., Lee, Y., and Lee, S.: Comparative analysis of gridded and station-based meteorological data for deep learning-based streamflow prediction, EGU General Assembly 2026, Vienna, Austria, 3–8 May 2026, EGU26-15490, https://doi.org/10.5194/egusphere-egu26-15490, 2026.

EGU26-15667 | ECS | Posters on site | HS4.10

Machine learning-based seasonal forecasting of dissolved organic matter to support drinking water management at the source  

Ricardo Paíz, Daniel Mercado-Bettín, Rafael Marcé, Eleanor Jennings, and Valerie McCarthy

The amount of dissolved organic matter (DOM) in freshwaters impacts many processes in aquatic ecology and, therefore, on derived ecosystem services such as water supply. Surface drinking water sources (e.g., lakes and reservoirs), in particular, are increasingly subjected to unforeseen increases in both the concentration and variability of DOM. This makes it more difficult to deal with such water along the drinking water cycle (abstraction, treatment, storage and network distribution), which can affect tap quality and users through the unintentional formation of toxic disinfection by-products (DBPs). DBPs such as trihalomethanes (THMs) and haloacetic acids (HAAs) are known to affect human health under long-term exposure, increasing risks for different cancers and congenital malformations. Anticipating seasonal changes in DOM in source waters is therefore important for both improved drinking water source protection measures and a reduction of DBPs in supplies.

Ecological forecasting provides a way to support water quality management by generating predictions of future environmental conditions within decision-relevant timeframes. In lakes, DOM dynamics often vary strongly at intra-annual and seasonal scales, suggesting that seasonal forecasts could help managers anticipate periods of increased treatment risk and plan mitigation measures in advance. However, forecasting DOM remains challenging due to the complex interactions between in-lake processes and catchment-scale drivers. Recent applications of machine learning have shown skill in simulating historical DOM dynamics in lakes, offering opportunities to extend these approaches to forecasting.

In this study, we developed a seasonal forecasting framework to predict monthly average concentrations of surface fluorescent DOM (fDOM) one to seven months ahead. The framework consists of a machine-learning workflow that simulates daily fDOM using random forest regression, and is applied to two contrasting study sites: a lake in Ireland and a reservoir in Spain. Forecasting is driven by a set of predictors selected based on their relative importance in historical simulations and their availability in open-access seasonal forecast datasets.

The workflow integrates meteorological variables, soil conditions, hydrological outputs, lake model variables and a seasonal indicator. Forecast skill and uncertainty were evaluated over multiple periods (1993–2023, 1993–2016 and 2016–2023) to reflect changes in forecast input characteristics, and results were compared against a climatological baseline. The analysis highlights how seasonal forecasts of DOM can support drinking water management by providing information on expected conditions in source waters in advance. The framework is designed to be transferable to and tested in other lake and reservoir systems where similar data are available.

How to cite: Paíz, R., Mercado-Bettín, D., Marcé, R., Jennings, E., and McCarthy, V.: Machine learning-based seasonal forecasting of dissolved organic matter to support drinking water management at the source , EGU General Assembly 2026, Vienna, Austria, 3–8 May 2026, EGU26-15667, https://doi.org/10.5194/egusphere-egu26-15667, 2026.

EGU26-15738 | Orals | HS4.10

Advancing integrated continental-scale hydrologic forecasting through democratized data and ML-accelerated modeling 

Reed Maxwell, Leonardo Sandoval, Yueling Ma, Amelia Peeples, Marie Joe Sawma, Amy Defnet, George Artavanis, Andrew Bennett, and Laura Condon

Today water and resource managers face a significant challenge managing systems that are rapidly evolving in a warming climate, where historical observations are no longer a reliable guide. Capturing interactions from bedrock to treetops is important to understand water stresses and is a critical gap in our current models. Simulations with integrated hydrology models (that solve the 3D Richards' equation and 2D shallow water equations in a globally-implicit manner) provide robust results out to continental scales, yet are computationally expensive. Groundwater-surface water are tightly coupled and can have a large impact on watershed dynamics, yet are challenging for all models to accurately resolve.

We have developed a hybrid physics-based, machine learning digital twin over the entire continental US (CONUS). This proof-of-concept forecast system runs operationally, providing all hydrologic states and fluxes from bedrock to the top of the canopy at hourly timesteps and greater than 1km resolution. Automated comparison to observations is enabled through the HydroData platform, supporting continuous evaluation and model improvement. This talk will highlight the technical challenges of combining integrated hydrologic modeling with machine learning in a national forecast system, including physics-based approaches that improve solver performance by more than an order of magnitude for continental-scale simulations. Machine learning emulators embedded within integrated hydrology models can also drastically reduce computational burden and provide 30m spatial resolution for groundwater and surface water. We advance a vision that deploys these models and openly available forcing and parameter datasets to understand future water challenges from local to continental scales.

How to cite: Maxwell, R., Sandoval, L., Ma, Y., Peeples, A., Sawma, M. J., Defnet, A., Artavanis, G., Bennett, A., and Condon, L.: Advancing integrated continental-scale hydrologic forecasting through democratized data and ML-accelerated modeling, EGU General Assembly 2026, Vienna, Austria, 3–8 May 2026, EGU26-15738, https://doi.org/10.5194/egusphere-egu26-15738, 2026.

EGU26-15795 | ECS | Orals | HS4.10

Improving Operational Extreme Flood Forecasting and Climate Change Impact Assessment with Physics-Embedded Differentiable Modeling 

Yalan Song, Wencong Yang, Chaopeng Shen, Haoyu Ji, Leo Lonzarich, Tadd Bindas, Kamlesh Sawadekar, and Jiangtao Liu

Flash flooding is one of the deadliest natural hazards worldwide, causing severe loss of life and infrastructure damage. Predicting extreme flood events remains highly challenging because they often fall outside the range of historical observations, involve small-scale storm processes that are poorly resolved by existing forecasting systems, and include nonlinear flood-generation mechanisms that are inadequately represented in current models.  Although pure AI models, such as LSTMs, generally outperform traditional hydrologic models in simulation accuracy, they often fail to predict extreme streamflow beyond a certain threshold and tend to underestimate extremes due to structural limitations, such as bounded activation functions. Differentiable models (DMs), which jointly train neural networks with process-based models, can overcome these limitations through interpretable physical modules and physically consistent representations, thereby achieving improved accuracy in extreme-event prediction compared with LSTMs. Here, we will demonstrate (1) how DMs improve extreme-event predictions and how dynamic parameters contribute to this improvement; (2) the feasibility of high-resolution, hourly differentiable models for operational extreme flood forecasting by resolving short-lived, small-scale storms; (3) the importance of incorporating different nonlinear flood-generation mechanisms; and (4) the robustness of DMs for long-term climate change impact assessment.

How to cite: Song, Y., Yang, W., Shen, C., Ji, H., Lonzarich, L., Bindas, T., Sawadekar, K., and Liu, J.: Improving Operational Extreme Flood Forecasting and Climate Change Impact Assessment with Physics-Embedded Differentiable Modeling, EGU General Assembly 2026, Vienna, Austria, 3–8 May 2026, EGU26-15795, https://doi.org/10.5194/egusphere-egu26-15795, 2026.

EGU26-15989 | Orals | HS4.10

Streamflow Forecasting at Ungauged Locations Using Deep Learning Networks, Driven by Soil Moisture States and Meteorological Data 

Muhammad Khaliq, Vanshika Dina, Laxmi Sushama, and Amin Elshorbagy

Traditionally streamflow forecasting is accomplished using process-based hydrological models. These models could range from simple lumped type to more detailed distributed models. Lumped type models are easy to setup while distributed models require considerable skill and experience for setup. Due to the growing availability of large amounts of spatial and temporal data from various sources, such as remote sensing and re-analyses, and recent advances in the computational power, machine learning models are gaining momentum for solving applied engineering problems, triggering conceptual shifts perhaps led by rapid progress in data science and availability of ready-to-be-deployed software tools. These models have the ability to extract complex dynamical nonlinearities without explicitly defining the involved physical processes and their governing mathematical formulations, as is followed in the case of hydrological models. It is believed that new trends and conceptual shifts are essential for generating new knowledge, challenging or validating prevailing assumptions, and enhancing operational applications, which may include several water management-related functions, hydropower generation operations, and flood risk management across a range of temporal and spatial scales.

In this study, two deep learning variants of machine learning models, i.e., (1) the attention-based encoder-decoder bidirectional long short-term memory (AB-ED-BiLSTM) network and (2) the attention-based encoder-decoder bidirectional gated recurrent units (AB-ED-BiGRU) network, were tested on multiple watersheds selected from the Ottawa River Basin, Canada. After developing and successfully evaluating watershed-specific models, regional versions of both models were developed and tested based on the leave-one-watershed-out strategy to emulate an ungauged scenario. Both models were driven mainly by soil moisture states of watersheds and meteorological data in order to evaluate their usefulness for streamflow forecasting at ungauged locations. Although not as ideal as one would desire, these models demonstrated reasonable skill in forecasting streamflow with one to seven days lead time when assessed in terms of coefficient of determination, Nash-Sutcliff Efficiency, and Kling-Gupta Efficiency performance metrics. However, considerable discrepancies were noticed in simulating peak flow values for certain watersheds. Overall results of the study suggest that soil moisture driven machine learning models can potentially be used to develop streamflow forecasting tools for ungauged locations, with AB-ED-BiGRU being computationally an inexpensive option compared to the AB-ED-BiLSTM model. Additional investigations will be required to improve their performance further, e.g., by employing multiple soil moisture products, available through remote sensing and re-analyses sources, and ensemble modelling techniques. Based on continuous scientific progress, emerging machine learning frameworks and architectures, and better understanding of the origins and limitations of existing models, improved hydrological forecasting at ungagged locations can be made possible. In essence, this study contributes towards enhancing our understanding of the role of soil moisture in developing machine learning based streamflow modelling and forecasting tools to support operational applications at ungauged locations, which are often neglected when developing real-time streamflow forecasting systems.

How to cite: Khaliq, M., Dina, V., Sushama, L., and Elshorbagy, A.: Streamflow Forecasting at Ungauged Locations Using Deep Learning Networks, Driven by Soil Moisture States and Meteorological Data, EGU General Assembly 2026, Vienna, Austria, 3–8 May 2026, EGU26-15989, https://doi.org/10.5194/egusphere-egu26-15989, 2026.

EGU26-16407 | ECS | Posters on site | HS4.10

Accelerating Urban Flood Data Assimilation: Coupling Physics Guided AI Emulators with Real Time Observations 

Hyuna Woo, Bomi Kim, Hyeonjin Choi, Minyoung Kim, Eun Taek Shin, Chang Geun Song, and Seong Jin Noh

Timely and reliable urban flood forecasting is essential for mitigating damage and supporting emergency decision-making. Ensemble data assimilation can improve forecast reliability by updating model states with observations, but real-time use with high-resolution hydrodynamic models is often constrained by computational cost. We propose an integrated forecasting framework that couples a physics-guided AI emulator with data assimilation to enable efficient, high-resolution spatiotemporal inundation prediction. The emulator is trained on high-fidelity hydrodynamic simulations and reproduces key flood dynamics with substantially lower runtime than conventional solvers, allowing large ensembles generated by perturbing initial conditions and meteorological forcings to quantify uncertainty. Real-time inundation-depth observations are assimilated to update evolving flood states, using both synthetic data for controlled testing and ground-based depth information derived from surveillance-camera imagery for real-event conditions. The framework is applied for an urban drainage basin in Seoul, South Korea. The presentation will discuss key challenges for real-time urban flood assimilation, including observation uncertainty and representativeness, intermittent availability and latency, and the balance between ensemble size and update frequency. We also examine how emulator design affects physical consistency during assimilation and outline remaining limitations for operational deployment.

How to cite: Woo, H., Kim, B., Choi, H., Kim, M., Shin, E. T., Song, C. G., and Noh, S. J.: Accelerating Urban Flood Data Assimilation: Coupling Physics Guided AI Emulators with Real Time Observations, EGU General Assembly 2026, Vienna, Austria, 3–8 May 2026, EGU26-16407, https://doi.org/10.5194/egusphere-egu26-16407, 2026.

Karst aquifers provide vulnerable water resources accounting for 25 % of the world groundwater resources. Croatian karst aquifers are also well known as highly karstified aquifers presenting very valuable and sensitive water resources. State of the art of the karst flow and transport modelling indicates that only hybrid distributed models, also known as hydrological integrated flow and transport models, can potentially resolve complex karst Multiphysics, especially interrelation between matrix and conduit exchange flow dynamics. However, there are many limitations of distributed hydrological karst models to successful application in practice, especially at the scale of whole watershed. The main problem is requirement for so many parameters and measurements to completely describe complex karst processes. Despite progress of computational resources, hydraulic and specially geophysics equipment and measurement technologies, lot of information usually remain unresolved. The most missing information are usually matrix heterogeneity distribution (i.e. hydraulic conductivity, sorption, porosity), unsaturated (i.e. Van Genunchten) parameters and conduit network structure (depth, spatial location of conduits and/or its diameters and dimensions). Computationally expensive numerical distributed hydrological karst models could be replaced by surrogate models such as deep learning neural networks (for instance see review of Herrmann and Kollmansberger, 2024). Therefore, we discuss here Multiphysics modelling of flow and transport karst process from the classical analytical and numerical approaches to the novel machine learning approaches such as Physical Informed Neural Network - PINN. Particularly, novel advantages of inverse PINN modelling are discussed, especially due to parameter deduction, uncertainty quantification and modelling efficiency.


How to cite: Gotovac, H.: Multiiphysics karst flow and transport modelling: From the classical numerical to the novel machine learning approaches, EGU General Assembly 2026, Vienna, Austria, 3–8 May 2026, EGU26-16554, https://doi.org/10.5194/egusphere-egu26-16554, 2026.

EGU26-16581 | ECS | Posters on site | HS4.10

How to deal w___ missing input data 

Martin Gauch, Frederik Kratzert, Daniel Klotz, Grey Nearing, Deborah Cohen, and Oren Gilon

Hydrologic deep learning models have made their way from research to applications. More and more national hydrometeorological agencies, hydro power operators, and consulting companies are building Long Short-Term Memory (LSTM) models for operational use cases. However, all of these efforts are confronted with similar sets of challenges—issues that are different from those in controlled scientific studies. One common issue is the question: how to deal with missing input data? Operational systems depend on the real-time availability of various data products—most notably, meteorological forcings. Additional forcings generally improve the model performance, but at the same time, every new dependency increases the likelihood of an outage in one of the input data products. 

In a recent study, we evaluated different solutions to generate predictions even when some of the meteorological input data do not arrive in time, or not arrive at all (Gauch et al., 2025). In this presentation, we will introduce these methods and discuss how they can help (1) operational forecasters to run reliable real-time flood forecasting systems, and (2) researchers and modelers to build accurate models that leverage as much data as possible.


Gauch, M., Kratzert, F., Klotz, D., Nearing, G., Cohen, D., and Gilon, O.: How to deal w___ missing input data, Hydrol. Earth Syst. Sci., 29, 6221–6235, 2025.

How to cite: Gauch, M., Kratzert, F., Klotz, D., Nearing, G., Cohen, D., and Gilon, O.: How to deal w___ missing input data, EGU General Assembly 2026, Vienna, Austria, 3–8 May 2026, EGU26-16581, https://doi.org/10.5194/egusphere-egu26-16581, 2026.

EGU26-17199 | ECS | Posters on site | HS4.10

Leveraging Weather Foundation Models for Hydrological Applications: Enhancing Hydrological Prediction through Sophisticated Decoder Design 

Seulgi Kim, Donggeon Lee, Subin Kim, and Hyunglok Kim

In recent years, data-driven models have demonstrated remarkable performance in capturing complex land-atmosphere interactions. In particular, the emergence of weather foundation models, which are pre-trained on vast unlabeled meteorological datasets through self-supervision and can be applied to diverse downstream tasks, has introduced robust backbones capable of representing global atmospheric dynamics. However, fine-tuning these massive models to specific downstream hydrological tasks presents significant challenges. Full fine-tuning is computationally prohibitive, and even parameter-efficient fine-tuning methods, such as Low-Rank Adaptation, also have an amount of computational overhead over the large embedding dimensions of foundation models. Furthermore, modifying the backbone's weights can be a risk of catastrophic forgetting or destabilize the learned representations, which are essential for maintaining their physical consistency during iterative long-term forecasts.

To address these challenges, this study investigates a transfer learning approach that utilizes a weather foundation model backbone with lightweight decoders. This strategy allows the model to handle the robust feature space of the pre-trained backbone while maintaining computational efficiency and architectural stability. We design and evaluate two representative classes of lightweight decoder architectures that differ in their structural complexity and information integration strategy. The first decoder adopts a minimalistic mapping scheme that directly transforms the latent representations of the foundation model into hydrological estimates, allowing us to assess whether the backbone features alone contain sufficient information for soil moisture inference. The second decoder employs a more expressive architecture capable of capturing multi-scale spatial dependencies and structural coherence in the output fields. A key architectural distinction between the two decoders lies in their input configuration: the simpler decoder relies exclusively on backbone representations, whereas the more advanced decoder additionally incorporates prior hydrological state information to reinforce physical consistency and temporal continuity.

Our results indicate that both lightweight decoders successfully reconstruct patterns of hydrological variables (e.g., soil moisture), demonstrating that the weather foundation models' backbone contains sufficient information to infer hydrological variables effectively. This study highlights the immense potential of weather foundation models as a new paradigm for hydrological research, providing a stable and efficient pathway to achieve high-fidelity results without the need for exhaustive fine-tuning.

How to cite: Kim, S., Lee, D., Kim, S., and Kim, H.: Leveraging Weather Foundation Models for Hydrological Applications: Enhancing Hydrological Prediction through Sophisticated Decoder Design, EGU General Assembly 2026, Vienna, Austria, 3–8 May 2026, EGU26-17199, https://doi.org/10.5194/egusphere-egu26-17199, 2026.

Recently, advances in deep learning (DL) have enabled the development of various surrogate modeling approaches to emulate traditional land surface models (LSMs), which typically require expensive computational resources. These surrogate models provide computationally efficient alternatives to conventional LSMs. In this study, we develop a DL-based autoregressive surrogate model to predict surface soil moisture (SSM) using meteorological forcing variables and the previous SSM state as inputs.

The developed surrogate model is further employed as a forecast model within a land data assimilation (LDA) framework, replacing the traditional LSMs. Since the true SSM state is unknown in the real-world applications, the fraternal twin experiments are conducted using a synthetic ground truth SSM, which is generated from an LSM nature run. In addition, a synthetic imperfect LSM SSM is generated by applying spatially correlated noise to the synthetic ground truth. Then, the surrogate model is trained to emulate this imperfect LSM simulation. 

Synthetic satellite observations are generated from the synthetic ground truth by introducing controlled observational uncertainties derived from prior studies. These experiments systematically evaluate the sensitivity of LDA performance to satellite observation errors under a wide range of realistic observational scenarios. Therefore, the proposed framework is expected to serve as a computationally efficient and scientifically rigorous testbed for exploring LDA strategies, with potential applications in future satellite mission design and water resource management.


How to cite: Kim, S. and Kim, H.: Fraternal Twin Experiments for Satellite-Constrained Land Data Assimilation Using Deep Learning Surrogate Models, EGU General Assembly 2026, Vienna, Austria, 3–8 May 2026, EGU26-17278, https://doi.org/10.5194/egusphere-egu26-17278, 2026.

EGU26-17329 | ECS | Posters on site | HS4.10

Bridging Observational Gaps in Microwave Satellite Signals Using a Meteorological Foundation Models 

Donggeon Lee, Seulgi Kim, Subin Kim, and Hyunglok Kim

Brightness temperature (TB) data acquired from microwave satellite systems constitute a fundamental component of global environmental monitoring and earth system analysis. This data serves as critical variables for understanding our Earth systems and predicting carbon, water and energy fluxes. While these satellite systems offer global-scale observational data comparable to physics-based land surface models, they remain subject to fundamental limitations inherent to Low Earth Orbit satellite missions. In particular, their spatial and temporal sampling is constrained by orbital geometry and revisit cycles, resulting in observational gaps and reduced capability to resolve rapidly evolving hydrometeorological processes. Moreover, the continuity and availability of satellite-derived products are strongly dependent on mission lifetimes and launch schedules, leading to potential discontinuities across different satellite generations. 

This study proposes a new deep learning-based framework to emulate TB data from microwave satellite systems. Recently, foundation models based on the Transformer architecture have been successful in specific downstream tasks. Foundation models provide superior zero-shot or out-of-distribution performance due to their broad pre-training. This has led to an increasing number of studies applying foundation models to various hydrological challenges.

Using available TB data from various microwave satellite systems as the target, the proposed model is trained to learn nonlinear relationships between latent vectors and global-scale TB dynamics. Based on these learned relationships, the model subsequently infers a suite of hydrological variables, including soil moisture and vegetation water content, thereby enabling consistent reconstruction of land surface states across space and time.

How to cite: Lee, D., Kim, S., Kim, S., and Kim, H.: Bridging Observational Gaps in Microwave Satellite Signals Using a Meteorological Foundation Models, EGU General Assembly 2026, Vienna, Austria, 3–8 May 2026, EGU26-17329, https://doi.org/10.5194/egusphere-egu26-17329, 2026.

EGU26-19528 | ECS | Orals | HS4.10

Semi-Distributed Deep Learning Models at Global Scale 

Frederik Kratzert, Martin Gauch, Asher Metzger, Daniel Klotz, Shmulik Fronman, and Deborah Cohen

Hydrological modeling has reached a point where deep learning models, especially those based on the LSTM architecture, are being used operationally by national agencies, the private sector, as well as across thousands of academic publications. However, by far the most common strategy is to use these models in a lumped setup, no matter the scale of the application. For example, Nearing et al. (2024) apply LSTM based models in a lumped setup at a global scale. Unfortunately, this withholds information that is relevant to precisely predict floods, such as the location of a precipitation event relative to the prediction point. Similarly, the spatial averaging over the entire upstream area dampens the precipitation signal that is provided to the model.

Classical hydrologic models use distributed or semi-distributed setups to solve this problem: they divide the basin into pixels or subpolygons and route streamflow along the river graph. There are first attempts to translate this semi-distributed modeling paradigm to end-to-end deep learning models, but so far they are typically trained only on individual river networks or select geographical regions (e.g., Kratzert et al., 2021, Kraft et al., 2025), lag behind the performance of lumped models (e.g., Kirschstein et al., 2021), cannot generalize to unseen river networks (e.g., Vischer et al., 2025), or are global and applicable ungauged basins but not trained end-to-end (e.g., Yang et al., 2025).

With the learnings and experience from operating lumped LSTM models at a global scale for multiple years, we revisit semi-distributed modeling with deep learning at a global scale with a focus on end-to-end training. In this submission, we present our version of a global end-to-end semi-distributed hydrologic model. We detail the model setup, its training procedure, and compare this model to the lumped setup. Our evaluation shows that the semi-distributed model has superior performance compared to the lumped model, especially for large, ungauged rivers. Finally, we highlight how this modeling approach is a step towards a broader multi-output, multi-modal system that propagates more information than just streamflow or physical quantities in general.

References:

  • Kirschstein, N., et al. "The Merit of River Network Topology for Neural Flood Forecasting." Forty-first International Conference on Machine Learning. 2024.
  • Kraft, B., et al. DROP: A scalable deep learning approach for runoff simulation and river routing. Authorea. November 25, 2025.
  • Kratzert, F., et al. "Large-scale river network modeling using graph neural networks." EGU General Assembly Conference Abstracts. 2021.
  • Nearing, G., et al. "Global prediction of extreme floods in ungauged watersheds." Nature 627.8004 (2024): 559-563.
  • Vischer, M., et al. "Spatially Resolved Rainfall Streamflow Modeling in Central Europe." EGUsphere 2025 (2025): 1-26.
  • Yang, Y., et al. (2025). Global daily discharge estimation based on grid long short-term memory (LSTM) model and river routing. Water Resources Research, 61.

How to cite: Kratzert, F., Gauch, M., Metzger, A., Klotz, D., Fronman, S., and Cohen, D.: Semi-Distributed Deep Learning Models at Global Scale, EGU General Assembly 2026, Vienna, Austria, 3–8 May 2026, EGU26-19528, https://doi.org/10.5194/egusphere-egu26-19528, 2026.

EGU26-20412 | ECS | Posters on site | HS4.10

PIGMLD: A Physics-Aware Geospatial Machine Learning for High-Resolution Extreme Precipitation Reconstruction  

Kunlong He, Dongmei Zhao, Wei Zhao, Luca Brocca, and Xiaohong Chen

Reliable high-resolution precipitation is crucial for monitoring hydrologic extremes and guiding climate-risk decisions, especially for compound events such as dry-to-wet “whiplash” . However, satellite precipitation products are often too coarse (5–25 km) and show strong region- and intensity-dependent biases, limiting their value for local hazard assessment. We develop a physics-aware geospatial machine-learning downscaling and fusion framework (PIGMLD) to generate 1-km daily precipitation over China for 2000–2020 by combining 10-km GPM IMERG with sparse gauges, ERA5-Land precipitation, and physically interpretable covariates linked to moisture, clouds, and land–atmosphere coupling. Validation against independent gauges across China and nine major basins shows broad skill gains (84.1% of stations with KGE > 0.60), improved event detection, and reduced bias; improvements are smaller in terrain-complex, gauge-scarce regions but remain useful. Performance gains are strongest for extremes, with large RMSE reductions for heavy and torrential rainfall and substantial bias corrections for both dry and wet percentile-defined extremes. Overall, PIGMLD provides more reliable 1-km precipitation to better characterize hydroclimate extremes and support water hazard related risk assessment.

How to cite: He, K., Zhao, D., Zhao, W., Brocca, L., and Chen, X.: PIGMLD: A Physics-Aware Geospatial Machine Learning for High-Resolution Extreme Precipitation Reconstruction , EGU General Assembly 2026, Vienna, Austria, 3–8 May 2026, EGU26-20412, https://doi.org/10.5194/egusphere-egu26-20412, 2026.

EGU26-21593 | ECS | Posters on site | HS4.10

Streamlining Integrated Hydrologic Modeling at Continental Scale: A Workflow for Quasi–Real-Time ParFlow-CLM Simulations over CONUS 

Leonardo Sandoval, Amy Defnet, Georgios Artavanis, Reed Maxwell, and Laura Condon

Recent advances in integrated hydrologic modeling have advanced our ability to simulate coupled surface–subsurface processes, offering critical insights into water dynamics at large scales. Specifically, simulations of the Contiguous United States (CONUS) have been recently conducted with ParFlow-CLM, a highly parallelizable integrated hydrologic modeling platform. These large-scale simulations have supported investigations of stream–aquifer connectivity and hydrologic sensitivity to climate forcing, yet their implementation remains technically demanding.

Assembling such simulations involves numerous challenges, including the configuration of complex HPC environments, management of evolving and voluminous climate forcings, large-scale input and output data handling, and heavy postprocessing workflows. These barriers limit the broader adoption and operational use of integrated models.

Here we present a semi-automated workflow for running ParFlow-CLM simulations over the CONUS domain in quasi–real-time. The workflow, designed to operate in weekly cycles, integrates Python and Shell scripting with the hf_hydrodata Python package to automate data preparation, model execution, and output management. We demonstrate its application on three widely used HPC platforms, highlighting its scalability and adaptability.

This contribution directly supports the community’s effort to make integrated modeling more accessible, reproducible, and operationally feasible at continental scales. By reducing technical overhead, the workflow promotes broader participation in high-resolution hydrologic modeling and facilitates timely water resources decision-making.

How to cite: Sandoval, L., Defnet, A., Artavanis, G., Maxwell, R., and Condon, L.: Streamlining Integrated Hydrologic Modeling at Continental Scale: A Workflow for Quasi–Real-Time ParFlow-CLM Simulations over CONUS, EGU General Assembly 2026, Vienna, Austria, 3–8 May 2026, EGU26-21593, https://doi.org/10.5194/egusphere-egu26-21593, 2026.

Accurate groundwater level (GWL) forecasting is crucial for effective water resource management, particularly under changing climatic conditions. In this study, we investigate the potential of the Kolmogorov–Arnold Network (KAN), an emerging neural architecture, for time series forecasting of GWL across the Normandy region in France. The performance of the KAN model was compared to classical recurrent neural network (RNN) architectures, including the Long Short-Term Memory (LSTM) and Gated Recurrent Unit (GRU). 

Using ERA5 precipitation and temperature as predictors, all models were trained to simulate groundwater level variations at multiple monitoring stations. Results indicate that, although the standalone one-layer KAN model underperformed relative to LSTM and GRU in terms of predictive accuracy, it provided valuable interpretability by effectively capturing input importance and nonlinear dependencies between meteorological drivers and groundwater dynamics. Moreover, integrating a KAN layer within LSTM and GRU architectures improved performance at several stations, suggesting that hybrid KAN–RNN frameworks can combine the interpretability of KAN with the sequential learning capability of recurrent models. Based on our findings, we recommend a two-step approach: employing KAN alone for input relevance analysis, followed by applying hybrid KAN–LSTM architectures to enhance predictive accuracy. 

As the KAN-based model architectures continue to evolve with frequent updates and new variants, future research should further explore and benchmark these improved versions for hydrological and, particularly, GWL forecasting tasks. These results highlight the potential of KAN-based hybrid models for interpretable and adaptive groundwater forecasting, opening promising perspectives for data-driven understanding of subsurface processes in data-scarce regions. 

How to cite: Janbain, I., Massei, N., Jardani, A., and Fournier, M.: Evaluating Kolmogorov–Arnold Networks (KAN) for Time Series Forecasting: Influence on Interpretability and Accuracy in Groundwater Level Prediction in Normandy, France , EGU General Assembly 2026, Vienna, Austria, 3–8 May 2026, EGU26-21634, https://doi.org/10.5194/egusphere-egu26-21634, 2026.

EGU26-22393 | Orals | HS4.10

Improving short to sub-seasonal streamflow forecast using machine learning 

Anukesh Krishnan Kutty Ambika, Kshitij Tayal, Dongyu Feng, Vimal Mishra, Dan Lu, and Forrest M. Hoffman

Recent advances in machine learning (ML) for hydrology demonstrate strong potential for improving short to sub-seasonal streamflow forecasting under increasing frequent extreme events. These models leverage large collections of meteorological and hydrological time series dataset that often combined with spatial and network-based information to learn transferable forecasting relationships across diverse hydroclimatic regimes. Here we discuss our recent progress and remaining challenges in developing robust ML-based streamflow forecasting systems that operate beyond traditional short lead times. We developed Future Time Series Transformer (FutureTST), a deep learning architecture designed to explicitly integrate past hydrometeorological conditions with future weather information for streamflow forecast. Unlike conventional autoregressive or process-based approaches, FutureTST independently encodes historical streamflow and meteorological forcings while conditioning forecasts on future atmospheric drivers which helps to capture complex temporal dependencies that govern streamflow at extended lead times. Evaluating across multiple basins, we demonstrate three key advances: (1) Forecast skill improvement across lead times: FutureTST achieves strong performance from short to sub-seasonal period with a mean Nash-Sutcliffe Efficiency (NSE) value of 0.82 at 1-day lead time to 0.67 at 30-day lead time which substantially outperform calibrated process-based hydrological models beyond 4 days, (2) Data filling and network-informed forecasting: Reconstructing lost streamflow information highlights the importance of data filling and spatial connection in a river network for improving forecast for partially gauged or data-sparse basins, and (3) Implications for compound flood prediction: By jointly conditioning on antecedent hydrologic states and meteorological extremes, the ML framework provides an interpretable variable importance for identifying compound flood drivers. Finally, we outline key challenges and future directions from ensemble weather forecasts, uncertainty quantification, and compound event aware training strategies to further improve streamflow forecasting.

How to cite: Krishnan Kutty Ambika, A., Tayal, K., Feng, D., Mishra, V., Lu, D., and Hoffman, F. M.: Improving short to sub-seasonal streamflow forecast using machine learning, EGU General Assembly 2026, Vienna, Austria, 3–8 May 2026, EGU26-22393, https://doi.org/10.5194/egusphere-egu26-22393, 2026.

Anthropogenic activities such as rapid urbanization, highly regulated dams and reservoirs, and widespread land-use changes significantly modify natural streamflow dynamics, making streamflow prediction increasingly challenging for traditional hydrological models. Deep learning approaches, particularly the long short-term memory (LSTM) network, have gained popularity due to their ability to capture long-term dependencies in hydrological time series. However, the purely data-driven nature of LSTM limits its reliability in human-influenced watersheds. The Mass-Conserving LSTM (MC-LSTM) addresses this limitation by incorporating mass-balance constraints directly into its architecture, enabling physically consistent predictions. Despite this advancement, a systematic comparison between LSTM and MC-LSTM in human-influenced hydrological systems remains limited. In this study, we evaluate the predictive advantage and hydrologic suitability of MC-LSTM across 51 human-influenced watersheds in India. The watersheds are categorized into low- and high-human-influenced categories using a composite disturbance index (CDI), derived from the number of dams, reservoir storage, cropland fraction, built-up fraction, and population density.  This setup allows us to address a key question: Does incorporating mass balance constraints into LSTM improve streamflow reliability in highly regulated watersheds? The results show that MC-LSTM substantially outperforms traditional LSTM in highly human-influenced watersheds, yielding a significantly higher median NSE (MC-LSTM: 0.69; LSTM: 0.62). MC-LSTM also demonstrates several additional benefits, including improved high-flow prediction, reduced sensitivity to training data size, and slightly enhanced performance in semi-arid watersheds. In contrast, traditional LSTM tends to underestimate high-flow, depends on larger training datasets, and performs poorly in semi-arid and highly regulated basins. These findings underscore the importance of incorporating mass balance into DL-based hydrological models to enhance reliability in real-world applications.

How to cite: Sahu, G. and Sharma, A.: Assessing the Hydrologic Suitability of MC-LSTM for Reliable Streamflow Prediction in Human-Influenced Watersheds, EGU General Assembly 2026, Vienna, Austria, 3–8 May 2026, EGU26-617, https://doi.org/10.5194/egusphere-egu26-617, 2026.

Groundwater influences flood dynamics by modulating subsurface saturation states and engaging in complex interactions with surface water in multiple pathways. Accurately representing these processes is essential for physically consistent flood prediction, risk assessment, and mitigation strategies. However, groundwater-related processes remain poorly resolved in most existing flood modeling frameworks, which typically employ oversimplified representations of subsurface flow. In this study, we present HiPIMS-GWF, a three-dimensional, variably saturated groundwater flow module integrated into the High-Performance Integrated Hydrodynamic Modelling System (HiPIMS). HiPIMS is a GPU-accelerated, high-performance flood model capable of simulating catchment-scale fluvial flooding driven by extreme rainfall events. The HiPIMS-GWF module provides functionality to solve the three-dimensional Richards equation using both iterative and non-iterative numerical schemes, enabling explicit representation of surface-subsurface water exchanges within a unified modeling framework. Model accuracy is evaluated against a suite of standard numerical benchmark problems, and computational scalability and efficiency are assessed on a multi-GPU computing platform. 

Beyond the acute phase of flooding, we are also interested in investigating the long-term impacts of flood events on groundwater and surface water systems after its recession. Because catchment-scale groundwater dynamics evolve over temporal scales that can be orders of magnitude longer than those of surface flooding, capturing the full hydrological response necessitates extended simulation capabilities beyond the time horizon of flood events. To this end, HiPIMS-GWF introduces a novel modeling flexibility: once floodwater recedes, the high-resolution, physics-based surface hydrodynamic component can be swtiched to a computationally efficient, hydrologic model tailored for long-term watershed simulation. Critically, the spatially distributed fields of water saturation and surface water depth generated by the fully physics-based simulation serve as initial conditions for the long-term mode, ensuring continuity in the representation of system states across timescales. The overall accuracy and robustness of this integrated modeling framework are validated against a real-world flood event.

How to cite: Zong, Y., Tong, X., and Liang, Q.: HiPIMS-GWF: A GPU-Accelerated 3D Variably-Saturated Subsurface Solver for Integrated Flood Modeling with Groundwater Components, EGU General Assembly 2026, Vienna, Austria, 3–8 May 2026, EGU26-783, https://doi.org/10.5194/egusphere-egu26-783, 2026.

With the increasing complexity of urban systems, traditional flood risk assessments often fail to capture the systemic vulnerability arising from infrastructure interdependencies. This study integrates high-fidelity hydrodynamic modeling (HiPIMS), physics-guided deep learning, and complex network theory to develop a novel dynamic flood chain risk assessment framework. To enhance hazard prediction, a Physically-Guided Spatiotemporal Mixture-of-Experts (PG-ST-MoE) network is constructed. By leveraging hydrodynamic outputs as guidance, this network dynamically predicts high-precision spatiotemporal flood probabilities, effectively bridging the gap between idealized physical simulations and real-world flood occurrences. Crucially, the framework transcends static hazard mapping to analyze disaster chain effects. By simulating cascading failures within infrastructure-community networks, it quantifies how localized physical damage propagates into widespread functional paralysis and identifies functional islands where critical services are severed despite the absence of direct flooding. The framework has been deployed in the San Isabel Basin, South America, demonstrating the capability to reveal hidden systemic risks in data-scarce regions. This study offers a paradigm shift from static exposure assessment to dynamic chain-reaction analysis, providing actionable insights for preventing systemic collapse and enhancing adaptive emergency management.

How to cite: Qu, Z., Kou, M., and Zhang, K.: From Inundation to Systemic Collapse: A Dynamic Flood Risk Assessment Framework Coupling Hydro-Deep Learning with Cascading Failure Analysis, EGU General Assembly 2026, Vienna, Austria, 3–8 May 2026, EGU26-908, https://doi.org/10.5194/egusphere-egu26-908, 2026.

EGU26-5294 | Posters on site | HS4.11

Towards national-scale hydrodynamic flood modelling: feasibility, resolution sensitivity, and computational trade-offs 

Qiuhua Liang, Xue Tong, Huili Chen, and Jinghua Jiang

Surface water flooding (SWF), when intense rainfall overwhelms drainage systems and inundates streets, homes, and infrastructure, is the most widespread form of flooding in the UK and a rapidly escalating global hazard under climate change and growing urban exposure. In England alone, around 3.2 million properties are at risk. In the extreme cases, SWF can develop rapidly with little or no warning and exhibit highly dynamic, fast-moving flow conditions, behaving like an “inland tsunami”, with debris-laden flood waves overwhelming streets, vehicles, and buildings within minutes. It can paraly transport, disrupting essential services, and, in some cases, cause catastrophic loss of life. Recent events have highlighted the deadly consequences of such flooding, including the July 2021 Zhengzhou (China) flood with nearly 400 fatalities, the 2021 floods in Germany and Belgium with over 200 deaths, the October 2024 flash floods in Valencia, Spain causing 237 fatalities, and widespread cyclone- and monsoon-driven flooding across South and Southeast Asia in 2025 causing more than 1,000 deaths and displacing millions.

At large spatial scales, SWF does not occur as isolated local events. Intense rainfall may occur simultaneously or sequentially over wide areas, and interconnected river networks, drainage systems, and infrastructure can couple multiple local flood processes into a single, spatially extensive flood system. Understanding and predicting such large-scale, interacting flood dynamics is therefore essential for both national-scale risk assessment and real-time forecasting.

Numerical modelling provides an indispensable tool for representing SWF processes. However, due to their highly transient, shock-like behaviour, hydrological or simplified hydraulic approaches are often insufficient. Fully hydrodynamic models solving the two-dimensional shallow water equations with shock-capturing capability are required, but their computational cost has historically limited their application to city or local-catchment scales. Scaling such models to regional or national extents is not a simple domain enlargement problem, but introduces coupled challenges related to computational demand, terrain resolution, and modelling strategy. As a result, fundamental questions remain regarding the feasibility of national-scale hydrodynamic modelling, the computational resources required, the sensitivity of flood hazard metrics to DEM resolution, and the trade-offs between alternative large-scale simulation strategies.

To address these questions, we conduct a national-scale hydrodynamic flood modelling experiment over England using the High-Performance Integrated hydrodynamic Modelling System (HiPIMS) accelerated by multi-GPU computing. Event-based simulations are performed over the England at DEM resolutions of 10 m, 20 m, and 40 m to systematically quantify resolution effects on flood hazard representation and associated computational costs. The experimental design also enables comparison between alternative national-scale modelling strategies, including domain-wide versus partitioned simulations.

The results delineate the practical feasibility limits, resolution sensitivity, and performance trade-offs of national-scale hydrodynamic flood modelling, and provide quantitative guidance on the computational and data requirements for moving towards national-to-street-scale, physics-based surface water flood forecasting and risk assessment.

How to cite: Liang, Q., Tong, X., Chen, H., and Jiang, J.: Towards national-scale hydrodynamic flood modelling: feasibility, resolution sensitivity, and computational trade-offs, EGU General Assembly 2026, Vienna, Austria, 3–8 May 2026, EGU26-5294, https://doi.org/10.5194/egusphere-egu26-5294, 2026.

Escalating flood frequency and intensity, driven by anthropogenic land use modifications and climate variability, pose critical challenges to watershed management worldwide. This study examines the hydrological impacts of the Billion Tree Tsunami (BTT) reforestation initiative, implemented in 2014 across Pakistan's Khyber Pakhtunkhwa province, with specific focus on flood attenuation dynamics in the Swat River catchment. We integrate land use and land cover (LULC) change analysis spanning three decades (1990–2024) with Long Short-Term Memory (LSTM) neural networks to assess historical discharge patterns and project future hydrological conditions through 2050. LULC analysis reveals substantial landscape transformation, including significant forest expansion, marked reduction in barren land, and agricultural land modifications. Statistical evaluation demonstrates notable flood mitigation effects post-intervention, with 15% reduction in peak flows and decreased discharge intensification rates. The LSTM models exhibit strong predictive performance (R² = 0.87), forecasting a 20–25% reduction in peak discharge events by 2050 under continued reforestation scenarios. These findings underscore the efficacy of large-scale reforestation as a nature-based solution for flood risk reduction and demonstrate the value of integrating machine learning approaches with conventional hydrological modeling for enhanced watershed management strategies.

How to cite: Shah, L.: Quantifying Nature-Based Flood Risk Reduction Through LSTM Modeling: Evidence from Pakistan's Swat River Basin, EGU General Assembly 2026, Vienna, Austria, 3–8 May 2026, EGU26-5559, https://doi.org/10.5194/egusphere-egu26-5559, 2026.

EGU26-5968 | Orals | HS4.11 | Highlight

Advancing Climate Services Through Hybrid Precipitation Forecasts That Integrate Indigenous Knowledge 

Samuel Jonson Sutanto, Joep Bosdijk, Imme Benedict, Arnold Moene, Dragan Milosevic, Fulco Ludwig, and Spyridon Paparrizos

Smallholder farmers in the global south predominantly rely on rainfed agriculture, making accurate precipitation forecasts crucial for agricultural decision-making. However, the low reliability, limited skills, and accessibility of scientific forecasts (SF) derived from Numerical Weather Prediction models in rural communities hinder the use of SF. Instead, smallholders often rely on indigenous knowledge to predict the rainfall based on observed local indicators, e.g., meteorology, animals’ behavior, and astronomy, hereafter we call it local forecasts (LF). However, the use of LF also faces challenges, including the loss of LF knowledge since it is communicated orally, not documented, not always observable, or not deemed useful. In addition, the use of local forecast also faces challenges by increasing climate variability, which undermines farmers’ confidence in their forecast. Studies conducted in Africa evaluating SF and LF skills have demonstrated that LF’s performance is comparable to or even outperforms the SF. Furthermore, these studies highlight that integrating SF and LF, known as hybrid forecast (HF), results in higher forecast performance than either SF or LF alone. In this study, we aim to develop an HF system that combines SF and LF using machine learning approaches to improve precipitation predictions in northern Ghana. Four rain gauges were installed at the field and used to evaluate the performance of SF, LF, and HF to predict precipitation events based on the Hanssen-Kuipers discriminant (HK) and accuracy skill assessment metrics. Results show that the HF achieved a HK value of 0.79, outperforming the scientific forecast (HK = 0.50), and local forecasts (HK = 0.37). In terms of accuracy, the HF also led with a score of 0.92, followed by the SF at 0.69. Similar to its HK, LF has the lowest accuracy of 0.65. Our study proved that ML approaches can be highly effective in developing a seamless forecasting system, specifically the HF, which outperforms the accuracy of individual forecasts alone. Such enhanced precipitation forecasts could enable smallholder farmers in the Global South to make better-informed agricultural decisions, ultimately enhancing their livelihoods.

How to cite: Sutanto, S. J., Bosdijk, J., Benedict, I., Moene, A., Milosevic, D., Ludwig, F., and Paparrizos, S.: Advancing Climate Services Through Hybrid Precipitation Forecasts That Integrate Indigenous Knowledge, EGU General Assembly 2026, Vienna, Austria, 3–8 May 2026, EGU26-5968, https://doi.org/10.5194/egusphere-egu26-5968, 2026.

EGU26-6078 | Orals | HS4.11

Proactive Hydrological Forecasting and Intelligent Decision Support in Human-Regulated Urban Catchments 

Fi-John Chang, Li-Chiu Chang, Ming-Ting Yang, and Jia-Yi Liou

Urban catchments are highly human-influenced hydrological systems in which drainage networks, pumping stations, and engineered conveyance structures fundamentally modify runoff generation and flow dynamics. These anthropogenic controls introduce strong nonlinearity and non-stationarity, challenging short-term hydrological forecasting and reducing the effectiveness of reactive flood control, particularly under intensifying extreme rainfall. This study develops an Intelligent Flood Control Decision Support System (IFCDSS) that integrates data-driven hydrological forecasting with adaptive operational control to support proactive urban flood management. At the catchment scale, short-term flood inundation nowcasting is achieved by combining Principal Component Analysis (PCA) and Self-Organizing Maps (SOM) with Nonlinear Autoregressive models with exogenous inputs (NARX). This approach enables efficient extraction of dominant inundation patterns from high-resolution two-dimensional flood maps and provides reliable multi-step-ahead forecasts at 10-minute resolution up to one hour. At the infrastructure scale, hybrid deep learning models (CNN–BP) are used to generate multi-input, multi-output forecasts of sewer, forebay, and river water levels, achieving high predictive skill under rapidly evolving rainfall and operational conditions. Forecast outputs are translated into operational decisions through a decision layer integrating NSGA-III for multi-objective optimization, TOPSIS for solution ranking, and an Adaptive Neuro-Fuzzy Inference System (ANFIS) for real-time pump control. Application to a major pumping-station catchment in Taipei, Taiwan, demonstrates that the system delivers actionable forecasts and control strategies within seconds. Compared with manual operation, the IFCDSS achieves more robust trade-offs among flood mitigation, energy efficiency, and operational reliability. The results highlight the importance of explicitly representing human interventions in urban hydrological forecasting and demonstrate how intelligent decision support can enhance flood preparedness in complex, human-regulated catchments under climate change.

How to cite: Chang, F.-J., Chang, L.-C., Yang, M.-T., and Liou, J.-Y.: Proactive Hydrological Forecasting and Intelligent Decision Support in Human-Regulated Urban Catchments, EGU General Assembly 2026, Vienna, Austria, 3–8 May 2026, EGU26-6078, https://doi.org/10.5194/egusphere-egu26-6078, 2026.

EGU26-10058 | ECS | Orals | HS4.11

A Coupled Human And Natural System (CHANS) Framework for Human Mobility during Flood Events 

Xue Tong, Qiuhua Liang, Huili Chen, and Yifei Zong

Climate change and rapid urbanisation have intensified the frequency and consequences of extreme flood events. During floods, transportation systems may fail, leading to traffic breakdowns, prolonged exposure, and cascading impacts on emergency response and wider urban functioning. Flood risk is therefore shaped not only by the physical dynamics of inundation, but also by how people perceive, respond to, and adapt their mobility under evolving hazard conditions, exemplifying a Coupled Human And Natural System (CHANS). This tight coupling between hazard evolution and human response makes it essential to represent hazard-human interactions at the event timescale, particularly for reliable flood forecasting, early warning, and emergency preparedness. However, capturing adaptive human mobility under dynamically changing flood conditions remains a major challenge, especially within a CHANS modelling framework.

Agent-based modelling (ABM) has been increasingly applied to represent human behaviour during floods, often coupled with hydrodynamic inundation models. However, most existing implementations rely on offline or weakly coupled co-simulation, in which flood dynamics and human behaviour are computed in separate platforms and synchronised through frequent data exchange. Such data-exchange-driven approaches become increasingly expensive when high-frequency updates are required, limiting their capability to represent real-time feedback between flood evolution and human mobility.

In this study, we present a CHANS modelling framework built upon the GPU-accelerated High Performance Integrated hydrodynamic Modelling System (HiPIMS) for predicting flood hydrodynamics, fully coupled with an agent-based module within the same computational framework to represent human mobility. This enables seamless simulation of interacting flood conditions and human responses. Human mobility is represented by autonomous agents within a unified architecture that supports pedestrians, cyclists, and vehicles. Mobility agents exhibit heterogeneous behavioural attributes, including risk aversion, awareness, compliance, and patience, and interact within a shared, dynamically evolving flood environment.

The framework is demonstrated through an urban case study in Newcastle upon Tyne, with data from the Urban Observatory for model validation. Further simulations are conducted for light, medium, and heavy rainfall scenarios to analyse adaptive transport responses under different flood conditions.

By supporting large numbers of agents and real-time hazard-human interactions within a single computational environment, the proposed framework enables systematic analysis of human adaptive behaviour and system-level disruption during flood events. This work provides a new methodological basis for characterising flood risk in a coupled human and natural systems context, with clear implications for early warning, emergency response planning, and integrated flood forecasting.

How to cite: Tong, X., Liang, Q., Chen, H., and Zong, Y.: A Coupled Human And Natural System (CHANS) Framework for Human Mobility during Flood Events, EGU General Assembly 2026, Vienna, Austria, 3–8 May 2026, EGU26-10058, https://doi.org/10.5194/egusphere-egu26-10058, 2026.

EGU26-13732 | ECS | Orals | HS4.11

From Natural Flow to Anthropogenic Pressure: Quantifying Water Withdrawals in the Tiber River Basin Over 70 Years 

Irene Pomarico, Aldo Fiori, Elena Volpi, and Antonio Zarlenga

Quantifying long-term water withdrawals at the river basin scale remains a major challenge due to scarce direct observations and the interaction between natural hydrological processes and human activities. This study introduces a semi-distributed modelling framework to reconstruct natural discharge and infer net water withdrawals from observed streamflow records. Net water withdrawals are estimated as the difference between simulated natural and observed discharges. Natural discharge is simulated by partitioning precipitation (BIGBANG v.8 database, ISPRA) into surface runoff and groundwater recharge through an infiltration-based scheme. Groundwater contributions are represented using a linear reservoir to capture delayed baseflow response. The model is governed by three parameters, which are (i) the infiltration coefficient, (ii) the ratio between the hydrogeological and catchment area and (iii) storage coefficient of the linear reservoir model.  Calibration is performed over 1954–1965, assumed minimally impacted by withdrawals, by maximizing Nash–Sutcliffe Efficiency and minimizing volume bias, with Kling–Gupta Efficiency as an additional metric. The approach is applied to the Tiber River basin closed at Ripetta station (central Italy) using data spanning 1954–2023. The calibrated model reproduces observed discharge dynamics satisfactorily. The reconstructed natural discharge series is then extended to 2023 to proceed with the calculation of net withdrawals. The resulting time series shows a clear long-term linear increasing trend, with significant interannual variability. Statistical tests (Chi-square and t-tests) on residuals confirm normality and a mean not significantly different from zero, supporting the robustness of the inferred trend. This approach enables spatially coherent reconstruction of water withdrawals using commonly available hydrological data, providing a valuable tool for assessing anthropogenic pressures where direct measurements are lacking. Results for the Tiber River basin reveal progressive intensification of human influence on water resources over seven decades, offering insights for water management, policy development, and hydrological forecasting in human-modified catchments.

How to cite: Pomarico, I., Fiori, A., Volpi, E., and Zarlenga, A.: From Natural Flow to Anthropogenic Pressure: Quantifying Water Withdrawals in the Tiber River Basin Over 70 Years, EGU General Assembly 2026, Vienna, Austria, 3–8 May 2026, EGU26-13732, https://doi.org/10.5194/egusphere-egu26-13732, 2026.

EGU26-15780 | ECS | Orals | HS4.11

A Structure-Preserving Neural Flux Surrogate for Efficient Shallow-Water Modelling 

Jingxiao Wu, Qiuhua Liang, and Huili Chen

High-resolution shallow-water (SW) models are critical for flood and inundation forecasting, yet their operational efficiency is often bottlenecked by the computational cost of repeatedly solving intercell Riemann problems. While emerging machine-learning surrogates (e.g., PINNs and neural operators) can accelerate PDE prediction, they often struggle to meet the rigorous requirements of hydrodynamic modelling. Specifically, these end-to-end models generally enforce physics only via soft constraints, leading to non-physical mass leakage and error accumulation over long durations. They also suffer from spectral bias, which hinders the sharp capture of discontinuities and wet–dry fronts. Furthermore, they typically lack cross-geometry generalizability, requiring costly retraining when boundary conditions or mesh resolutions change. This study proposes a structure-preserving hybrid strategy that integrates deep learning into a classical Godunov-type finite-volume (FV) solver. Rather than approximating the global solution map, we employ a neural network as a local, plug-in surrogate specifically for intercell flux evaluation. This network learns a discretization-aware operator, mapping local reconstructed interface states to normal-aligned numerical fluxes. Crucially, by embedding this learned surrogate within the standard FV backbone—retaining CFL-controlled time marching and wetting–drying treatments—the hybrid solver strictly enforces mass conservation through rigorous flux-difference assembly. Because the model learns local interface physics rather than global flow patterns, it exhibits strong cross-resolution generalization: a model trained on a specific grid can be deployed directly on different mesh densities and unseen initial conditions without retraining. This work establishes a scalable pathway for integrating deep learning into hydrodynamic solvers, combining the computational speed of machine learning with the reliability and conservation properties of numerical mechanics.

How to cite: Wu, J., Liang, Q., and Chen, H.: A Structure-Preserving Neural Flux Surrogate for Efficient Shallow-Water Modelling, EGU General Assembly 2026, Vienna, Austria, 3–8 May 2026, EGU26-15780, https://doi.org/10.5194/egusphere-egu26-15780, 2026.

EGU26-16279 | Posters on site | HS4.11

Hidden River Contamination from Critical-Metal Mining Demands Proactive Monitoring and Forecasting  

Juan Liu, Hangfei Guo, Ziqi Zhu, and Yan Zhong

Thallium (Tl) is a toxic metal. Its contamination in aquatic ecosystems is likely to intensify in the upcoming decades. Exploding demand for Li, rare earths, Co, Ni and Cu is pushing mining into various Tl-enriched ores/deposits. Every new battery, wind-turbine and power line therefore may carry a hidden Tl footprint that conventional lime-dosing treatment fails to retain. Thus, the low-carbon transition may turn Tl into an unexpected river contaminant. Field-to-lab experiments reveal that Tl⁺ mimics K⁺ in fish gills and algal cells, inducing oxidative stress, and Na⁺/K⁺-ATPase collapse at very low concentrations. These impacts may induce a series of alterations at the physiological, biochemical, and genomic expression levels. These disruptions can, in turn, undermine the survival and demographic structure of these organisms, ultimately posing risks to human beings via complex trophic networks. Given the urgency of this situation, it is therefore suggested that Tl should be incorporated into routine river-health monitoring in mining-impacted basins and propose a cost-effective proxy-screening and forecasting protocol.

How to cite: Liu, J., Guo, H., Zhu, Z., and Zhong, Y.: Hidden River Contamination from Critical-Metal Mining Demands Proactive Monitoring and Forecasting , EGU General Assembly 2026, Vienna, Austria, 3–8 May 2026, EGU26-16279, https://doi.org/10.5194/egusphere-egu26-16279, 2026.

EGU26-17989 | ECS | Posters on site | HS4.11

A Fully Integrated Hydrodynamic-NBS Model for City-Scale Flood Risk Assessment under Extreme Rainfall 

Jinghua Jiang, Huili Chen, Xue Tong, Darren Varley, and Qiuhua Liang

Urban Nature-based Solutions (NbS) are critical for flood mitigation, yet existing modelling approaches have limitations in explicitly capturing their performance during extreme events. Conventional approaches typically couple NbS modules with two-dimensional (2D) surface flow models as separate executables. This "loose coupling" fails to capture the two-way dynamic interactions between surface runoff and NbS features, especially when systems approach full saturation or exceed their design capacity.

This study introduces HiPIMS-NbS, a high-performance, GPU-accelerated modelling framework that embeds physical behaviours of multi-layer NbS directly into high-resolution 2D shallow water computations. Unlike traditional models with predetermined drainage areas, HiPIMS-NbS calculates flow directions and surface-NbS exchange rates dynamically across the 2D domain. Surface ponding depths influence NbS infiltration rates while NbS storage regulates surface water availability within the unified GPU-accelerated computational framework, achieving dynamic two-way coupling.

The model was validated against SWMM benchmarks and field-scale bioretention experiments. To demonstrate city-scale applications, HiPIMS-NbS was applied to the 2012 "Toon Monsoon" flood event in Newcastle upon Tyne, UK, to evaluate various NbS implementation scenarios. Results demonstrate that the model achieves the computational efficiency required for city-scale simulations while capturing key NbS behaviours under realistic overflow conditions. This integrated approach provides a robust modelling basis for urban planners to optimise NbS placement and design for the extreme rainfall events projected under changing climate.

How to cite: Jiang, J., Chen, H., Tong, X., Varley, D., and Liang, Q.: A Fully Integrated Hydrodynamic-NBS Model for City-Scale Flood Risk Assessment under Extreme Rainfall, EGU General Assembly 2026, Vienna, Austria, 3–8 May 2026, EGU26-17989, https://doi.org/10.5194/egusphere-egu26-17989, 2026.

EGU26-18615 | Orals | HS4.11

Human–water interactions and drought adaptation: insights from global cases and socio-hydrological modelling 

Anne Van Loon, Maurizio Mazzoleni, Charles Wamucii, Ileen Streefkerk, Lars De Graaff, Jose David Henao Casas, Sally Rangecroft, and Alessia Matanó

Drought risk emerges from multi-directional feedbacks between water availability, risk perception, and adaptation decisions. Human activities both aggravate and alleviate hydrological drought. Adaptation measures to cope with drought can generate negative unintended consequences for other water users, but also unintended benefits.

A global synthesis of 28 cases reveals that water abstraction consistently intensifies drought severity, while reservoir releases can reduce deficits during dry periods but often alter seasonality, leading to wet-season shortages. Drought adaptation measures rarely offset the impacts of water abstraction, but instead shift drought effects in space or time. For example, water transfers reduce deficits in the receiving basin, but increase them in the providing basin, and groundwater-derived streamflow augmentation alleviates extreme low flows, but at the expense of reduced flows during other flow periods.

To further explore the effects of drought adaptation, we developed integrated socio-hydrological tools using system dynamics (SD) and agent-based models (ABM). SD analyses revealed that societies with homogeneous risk-attitudes implement fewer collective measures, opting for more individual measures to address drought risk. However, individual measures by specific social groups may lead to unsustainable water use and therefore larger drought damages. SD analysis in Crete shows that single-sector climate service prioritization amplifies sectoral benefits but increases systemic vulnerabilities, whereas equitable cross-sectoral prioritization fosters balanced, sustainable outcomes.

ABM applications highlight spatial trade-offs, with individual measures also affecting downstream or neighbouring water users. For example, in the Netherlands, irrigation pumping reduces neighbours’ water availability, while measures to raise groundwater levels benefit surrounding farms. In Kenya, upstream commercial abstractions amplify downstream drought risk, and water harvesting improves short-term access but reduces discharge downstream.

These findings underscore the complexity of drought management and the need to represent social diversity, institutions, and cross-scale hydrological feedbacks to design equitable and sustainable adaptation pathways.

How to cite: Van Loon, A., Mazzoleni, M., Wamucii, C., Streefkerk, I., De Graaff, L., Henao Casas, J. D., Rangecroft, S., and Matanó, A.: Human–water interactions and drought adaptation: insights from global cases and socio-hydrological modelling, EGU General Assembly 2026, Vienna, Austria, 3–8 May 2026, EGU26-18615, https://doi.org/10.5194/egusphere-egu26-18615, 2026.

EGU26-19143 | ECS | Posters on site | HS4.11

A Campus-scale Digital Twin Framework for Urban Flood Monitoring, Simulation and Management 

Mengdan Guo, Yifei Zong, Xue Tong, and Qiuhua Liang

Urban flooding poses an increasing threat to lives and property in urbanized environments under climate change and growing human exposure. Digital Twin (DT) concept provides a potential framework for integrating real-time monitoring, numerical simulation, and decision support. However, DT implementations that exploit dense senor networks and high-resolution, physics-based hydrodynamic flood models to enable real-time, bi-directional information exchange between physical and virtual systems remain limited. In this study, we develop a campus-scale DT framework that couples real-time monitoring, high-resolution hydrodynamic modeling, 3D virtual representation within a unified data and computational environment supported by embedded data-analytics capabilities.


A high-resolution 3D digital campus model is reconstructed from ultra-high-resolution LiDAR point clouds to provide the geometric basis for spatial representation and data management. A dense IoT monitoring network, comprising rainfall gauges, water-level sensors, CCTV, and pipe flow meters, is deployed to acquire and transmit high-frequency hydrometeorological and hazard-related observations in real time. At the core of the framework is the dynamic coupling between real-time rainfall observations and the GPU-accelerated High-Performance Integrated hydrodynamic Modelling System (HiPIMS), which resolves surface water inundation processes at high spatial and temporal resolution. Static spatial data, real-time monitoring observations, and model outputs are ingested, harmonized, and managed within the unified data and computational environment, enabling automated model execution and coordinated system operation. Monitoring data and simulation outputs are mapped directly onto the 3D virtual environment to provide real-time visualization of spatiotemporal evolution of flooding and to support flood warning and emergency management.


The reliability of flood simulations is evaluated against historical flood records and further assessed through continuous comparison with in-situ water-level observations. The framework supports near-real-time flood forecasting and systematic identification of high-risk locations, providing information for early warning and emergency decision-making. Emergency interventions, such as deployment of temporal flood defenses and mobile pumping stations, can in turn influence flood dynamics and risk; these changes are subsequently captured by the monitoring-modelling system and reflected in updated DT outputs. This establishes a closed-loop, real-time monitoring-simulation-decision-feedback cycle, forming an operational DT framework for urban flood management.

How to cite: Guo, M., Zong, Y., Tong, X., and Liang, Q.: A Campus-scale Digital Twin Framework for Urban Flood Monitoring, Simulation and Management, EGU General Assembly 2026, Vienna, Austria, 3–8 May 2026, EGU26-19143, https://doi.org/10.5194/egusphere-egu26-19143, 2026.

EGU26-19225 | ECS | Posters on site | HS4.11

Multi-Sensor Terrain Reconstruction for High-Resolution Urban Flood Modelling 

Yaxin Zhang, Huili Cheng, Qiuhua Liang, Yifei Zong, and Baoshan Shi

High-resolution (approximately 1 m) flood modelling is increasingly recognised as essential for resolving flow pathways and hydraulic connectivity in complex urban environments. At this scale, flood dynamics are strongly controlled by micro-topographic features, including hydraulically permeable elements beneath vegetation and bridge structures, as well as small-scale obstructions such as kerbs and surface discontinuities. However, conventional Digital Terrain Model (DTM) generation approaches struggle to reliably represent such features due to vegetation occlusion and sensor-specific terrain acquisition limitations, often necessitating extensive manual intervention.

This study presents a semi-automated terrain reconstruction framework that integrates Unmanned Aerial Vehicle-borne LiDAR, Unmanned Aerial Vehicle (UAV)oblique photogrammetry, handheld LiDAR Simultaneous Localization and Mapping (SLAM), and Real-Time Kinematic Global Navigation Satellite Systems (RTK-GNSS) measurements to generate flood-ready DTMs for high-resolution hydrodynamic modelling. Rather than treating multi-source datasets as interchangeable inputs, the framework explicitly exploits their differing information characteristics and spatial sensitivities to occlusion and ground accessibility. UAV LiDAR provides spatially continuous but occlusion-prone surface measurements, handheld LiDAR SLAM offers dense ground-level observations in vegetated and structurally complex areas, and RTK-GNSS provides sparse but high-accuracy elevation control.

An initial DTM is established through adaptive fusion of morphologically filtered UAV-derived DTMs and SLAM-derived ground observations, supported by vegetation indices extracted from digital orthophoto maps and SLAM point-density metrics. To address residual elevation errors arising from partial occlusion and sensor limitations, a residual learning strategy based on a U-Net architecture is employed to predict local elevation corrections relative to RTK-GNSS ground truth. The learning component is explicitly constrained to operate as a local correction mechanism rather than an end-to-end terrain predictor, thereby preserving physical plausibility and spatial consistency of the reconstructed terrain.

The framework is demonstrated over the Zhengzhou University campus (approximately 1 km²), encompassing diverse building typologies, vegetation densities, and pedestrian and vehicular infrastructure. The hydrodynamic relevance of the reconstructed DTM is evaluated using the High-Performance Integrated Hydrodynamic Modelling System(HiPIMS) through comparative two-dimensional simulations of historical extreme flood events. Results demonstrate that improved representation of micro-topographic controls significantly enhances simulated flow connectivity, inundation extent, and inundation timing relative to conventional terrain products, and provides a transferable workflow for campus- and neighbourhood-scale flood modelling and risk assessment and urban digital twin applications.

How to cite: Zhang, Y., Cheng, H., Liang, Q., Zong, Y., and Shi, B.: Multi-Sensor Terrain Reconstruction for High-Resolution Urban Flood Modelling, EGU General Assembly 2026, Vienna, Austria, 3–8 May 2026, EGU26-19225, https://doi.org/10.5194/egusphere-egu26-19225, 2026.

EGU26-21169 | ECS | Orals | HS4.11

Hydrological impacts of enhanced irrigation under drought conditions in Europe 

Sina Jasmin Schreiber, Amelie Schmitt, Augustin Clédat, and Peter Greve

Anthropogenic climate change is expected to pose significant challenges for European agriculture. Rising temperatures, altered precipitation patterns, and increasing frequency and intensity of extreme weather events, including prolonged and intensified droughts, are projected to substantially increase irrigation water demands. To date, a large fraction of European croplands relies solely on rainfed cultivation. Consequently, the projected increase in drought conditions will likely require an expansion of irrigated areas to mitigate climate-induced yield losses.

This study examines the hydrological impacts of enhanced irrigation across Europe with a particular focus on river discharge, using the Community Water Model (CWatM) at 5′ resolution. CWatM is a large-scale water resources model that simulates precipitation–runoff processes with river routing, capturing both natural hydrological processes and anthropogenic water demands. Its integrated approach provides a unique opportunity to investigate not only impacts of climate change but also impacts arising from the expected increase in irrigation water demand.

The model was calibrated and validated against GRDC discharge data using a regionalized calibration approach. Six irrigation scenarios, representing a stepwise transition from rainfed to irrigated cropland, were implemented in CWatM and simulated for the exceptionally hot and dry summers of 2003 and 2018, which may be considered representative of future summer conditions under climate change.

Simulation results indicate that even a moderate expansion of irrigated areas (converting 10 % of currently rainfed cropland to irrigated cropland) could lead to a substantial increase in unmet water demands and a significant reduction in summer river flows. Rivers in Central and Eastern Europe (e.g., Loire, Rhine, Elbe, Oder, Danube) with agriculturally dominated river basins are particularly affected. For the years 2003 and 2018, summer discharges of these rivers are already below the interquartile range of the 30-year average (1990-2019) under the default scenario (i.e., without additional irrigation); and decline even markedly further under irrigation expansion scenarios. These severely reduced summer low flows pose significant risks to river ecosystems and long-term river resilience. Simulations further revealed that reductions in river discharge are largely independent of the source of water abstraction (groundwater or surface waters), which is likely related to the fact that baseflow from groundwater reservoirs is one of the most important sources of river water during dry periods.

The results highlight the importance of effective water management adaptation strategies in intensively farmed regions of Central and Eastern Europe to prevent future water scarcity and to reduce the ecological risks associated with increasingly severe and prolonged low-flow periods.

How to cite: Schreiber, S. J., Schmitt, A., Clédat, A., and Greve, P.: Hydrological impacts of enhanced irrigation under drought conditions in Europe, EGU General Assembly 2026, Vienna, Austria, 3–8 May 2026, EGU26-21169, https://doi.org/10.5194/egusphere-egu26-21169, 2026.

HS5.1 – Water Resources Policy and Management under Uncertainty

Water plays a critical role in mitigating climate impacts and building resilience, yet its role has been persistently marginalised in global climate governance. This study traces the historical exclusion of water from core discussions at the United Nations Framework Convention on Climate Change (UNFCCC) Conferences of the Parties (COP), examining negotiations from COP20 (2014) to COP29 (2024). Using qualitative document analysis, the research identifies how water-related issues transitioned from peripheral attention to gaining formal recognition through the Baku Water Dialogue at COP29. The Dialogue marks a pivotal shift, positioning water as a foundation for climate adaptation, resilience, and sustainable development. Findings highlight that fragmented governance structures, limited cross-sectoral coordination, and financial disparities have historically constrained the integration of water into climate strategies. The study argues that embedding water management into Nationally Determined Contributions (NDCs), National Adaptation Plans (NAPs), and climate finance frameworks is essential for systemic resilience. It concludes that adaptive governance, transboundary cooperation, and nature-based solutions offer practical, cross-sectoral pathways to managing water under uncertainty. The integration of water into global climate frameworks is not only a scientific necessity but also a strategic imperative for sustainable futures.

Keywords: Water governance, Climate policy, Adaptive management, COP negotiations

How to cite: Hammond Antwi, S.: Repositioning Water in Global Climate Governance: Lessons from COP20 to COP29 for Adaptive and Integrated Water Management under Uncertainty, EGU General Assembly 2026, Vienna, Austria, 3–8 May 2026, EGU26-64, https://doi.org/10.5194/egusphere-egu26-64, 2026.

EGU26-627 | ECS | Orals | HS5.1.1

A Field-Validated KPI-5 Framework for Sustainable and Equitable Performance Assessment of Rural Water-Supply Systems 

Manoj Kumar Jindal, Vairagaya Joshi, Devendra Singh, Pradip Kumar Tewari, and Vikky Anand

Ensuring safe, reliable, and climate-resilient drinking-water supplies remains a global challenge, particularly in rural regions where waterworks face raw-water constraints, aging infrastructure, operational inconsistency, and limited institutional capacity. This study presents a field-validated, sustainability-oriented key performance index (KPI-5) developed via multiyear operational records, monitoring datasets, and field inspections across 31 rural waterworks in a state in India. The framework provides one of the first structured, evidence-based, and scalable performance assessment models for rural water supply governance. The KPI-5 integrates five sustainability domains essential for long-term drinking-water security: (1) Water-quality indicators assessing sample-testing frequency, chlorine and turbidity checks at waterworks and households, cleanliness and structural conditions of tanks (Sedimentation & Storage), aerator performance in high-level tanks, filter-bed cleaning cycles, V-notch chamber maintenance, and the integrity of raw- and clear-water storage structures; (2) operational-efficiency indicators evaluating filtration-capacity utilisation, pump performance, leakage monitoring, installation of pressure and flow metres at works and tail ends, logbook accuracy, data-logging reliability, pump-maintenance intervals, and treatment-plant campus hygiene; (3) human-resource indicators assessing staff adequacy, induction training, technical proficiency in water treatment operations, electrical systems, and pipeline networks, as well as documentation quality; (4) demand–supply vs. treatment-capacity indicators examining alignment between supply volume and filtration design, compliance with standard norms, seasonal-demand management, future-demand forecasting, climate-impact preparedness, and the presence of active leak-control programmes; and (5) social-impact indicators capturing user satisfaction regarding water quality and quantity, health-impact perception, adequacy of end-pressure at distribution points, water-borne disease signals, water-wastage reduction practices, and effectiveness of local community-level grievance resolution. Each sub-indicator is evaluated on a 0–5 scale and normalised to a 0–1 domain value. This process produces a cumulative 0–5 sustainability score categorised as Excellent, Good, Moderate, Poor, or Worst. Field findings revealed severe inequities in per capita supply, varying from 21.9 to 892.2 LPCD (liters per capita per day) across neighboring villages, highlighting the need for structured monitoring and transparent governance. The implementation of the KPI-5 enabled the systematic identification of operational bottlenecks, staff-capacity gaps, filtration inefficiencies, and governance weaknesses. A built-in performance recognition mechanism further promotes accountability and long-term operational excellence. The KPI-5 framework unifies engineering performance, institutional capacity, equity in service delivery, public health protection, and climate-aware management into a single sustainability model. Its field validation in an Indian state demonstrates strong global applicability and direct relevance to multiple Sustainable Development Goals, including SDG-6 (Clean Water and Sanitation), SDG-3 (Good Health and Well-Being), SDG-9 (Industry, Innovation, and Infrastructure), SDG-10 (Reduced Inequalities), SDG-11 (Sustainable Communities), and SDG-16 (Accountable Institutions). This framework has the potential to benefit millions of people and provides a sustainable tool for advancing integrated, evidence-driven water-governance systems.


How to cite: Jindal, M. K., Joshi, V., Singh, D., Tewari, P. K., and Anand, V.: A Field-Validated KPI-5 Framework for Sustainable and Equitable Performance Assessment of Rural Water-Supply Systems, EGU General Assembly 2026, Vienna, Austria, 3–8 May 2026, EGU26-627, https://doi.org/10.5194/egusphere-egu26-627, 2026.

EGU26-2400 | ECS | Orals | HS5.1.1

Multi-Objective Joint Robust Optimization for Flood Control Operation of Reservoir Groups under Uncertainty 

Yuxue Guo, Xinting Yu, Yue-Ping Xu, and Haiting Gu

To address multi-objective conflicts and hydrological uncertainty in joint flood control operation of reservoir groups, this study develops an uncertainty-aware optimization framework. An improved Vine Copula method with variable selection and structural simplification (RDV-Copula) is first introduced to describe the spatiotemporal dependence of multi-site flood processes. By simplifying the dependence structure, the method alleviates the complexity of high-dimensional modeling and generates stochastic inflow scenarios for reservoir operation. On this basis, a two-layer hedging–robust optimization model (TL-HRO) is formulated, in which hedging strategies are combined with robust optimization to coordinate flood control and hydropower generation objectives across current and future operation stages. The framework is applied to the Shifengxi Basin in Zhejiang Province, China. The analysis shows pronounced spatial dependence among flood processes, with a four-site flood synchronization probability of 41.92% and an average pairwise synchronization frequency of 65.87%. Compared with conventional approaches, the RDV-Copula achieves improvements in simulation accuracy of approximately 15.0%–61.2% while reducing model complexity, providing reliable stochastic inflow inputs for reservoir operation. Using these stochastic scenarios, the TL-HRO model is evaluated against a conventional multi-objective robust optimization (MORO) model. The results indicate that TL-HRO performs better in terms of both flood risk control and hydropower generation, with an average reduction of 58.26% in the optimization reference value relative to MORO. These findings suggest that the proposed approach can improve the overall performance of reservoir group operation under flood-related uncertainty and support flood control decision-making.

How to cite: Guo, Y., Yu, X., Xu, Y.-P., and Gu, H.: Multi-Objective Joint Robust Optimization for Flood Control Operation of Reservoir Groups under Uncertainty, EGU General Assembly 2026, Vienna, Austria, 3–8 May 2026, EGU26-2400, https://doi.org/10.5194/egusphere-egu26-2400, 2026.

Vegetation restoration in drylands can enhance carbon sequestration but also intensify the regional carbon-water trade-off (CWT) by increasing water consumption. Optimizing restoration strategies to mitigate this trade-off is important for the long-term sustainability of dryland ecosystems. Therefore, this study presents a coupled assessment framework integrating Gross Primary Productivity (GPP) and Water Availability (WA) to quantify CWT, using the Loess Plateau (LP) as a representative case of large-scale dryland restoration. By integrating remote sensing and multi-source datasets with trend analyses and time-series diagnostics, this study quantified the spatiotemporal dynamics of CWT and used Random Forest models to identify key drivers and their thresholds, ultimately proposing targeted adaptive management strategies. The results showed that areas with a significant increase in GPP accounted for 90.42% of the LP, whereas areas with a significant decrease in WA accounted for 42.56%. 8.65% of the region was classified as intensified CWT zones, indicating potential hotspots of ecological degradation. Furthermore, interpretable machine learning revealed that the dominant drivers of CWT shifted from water limitation in high trade-off areas to energy limitation in low trade-off areas. These results suggest that current rapid, high-density restoration may constrain the long-term sustainability of vegetation growth, highlighting that adjusting spatial configuration is crucial for optimizing regional carbon-water relationships. Our findings characterize the spatial patterns of CWT and identify targeted mitigation strategies, providing critical insights into reconciling carbon sequestration with water consumption, which underpins sustainable vegetation restoration in the LP and other dryland ecosystems.

How to cite: Tang, B. and Lü, Y.: Spatial configuration is critical to mitigating carbon-water trade-offs for sustainable vegetation restoration in drylands, EGU General Assembly 2026, Vienna, Austria, 3–8 May 2026, EGU26-3283, https://doi.org/10.5194/egusphere-egu26-3283, 2026.

Water resources management is fundamentally concerned with ensuring reliable water supply while simultaneously protecting society from water-related hazards. In recent decades, water resources systems have faced increasing challenges due to growing human water demand and escalating hydrologic uncertainty driven by climate change and socio-economic development. Under these conditions, optimizing the operation of existing water resources system has become essential for achieving efficient and adaptive water allocation strategies capable of meeting both present and future demands. Traditional optimization approaches, including classical mathematical programming and evolutionary algorithms, have been widely applied in water resources system analysis. However, their convergence efficiency often be argued when confronted with high-dimensional, nonlinear, and strongly constrained real-world problems. Recent advances in artificial intelligence and machine learning have introduced the Learn-to-Optimize (L2O) paradigm, in which a meta-optimizer trains neural networks to learn optimization update rules rather than directly optimizing decision variables. This framework offers the potential to enhance optimization performance, particularly for complex systems. Accordingly, this study evaluates the effectiveness of three optimization frameworks: (1) a classical quasi-Newton solver, (2) a long short-term memory (LSTM)-based L2O optimizer, and (3) an L2O framework integrated with a reinforcement learning agent. Their performance is systematically compared in terms of convergence behavior, solution quality, and computational efficiency. To assess robustness across different levels of problem complexity, the three methods are tested on a simple Trid benchmark, the nonlinear Rosenbrock function, as well as a large-scale water-supply allocation problem representing the Hsinchu regional water resources system in northern Taiwan. Preliminary results indicate that classical algorithms remain highly efficient for smooth, low-dimensional benchmark functions, whereas meta-learning-based optimizers demonstrate promising advantages when addressing nonlinear and highly constrained water resources optimization problems. Ongoing experiments aim to further quantify these performance differences across problem classes in a more rigorous and systematic manner.


Keywords: Optimization; Artificial Intelligence; Machine Learning; Learn-to-Optimize; Long-Short-Term Memory; Reinforcement Learning

How to cite: Wu, C.-E. and You, J.-Y.: Evaluating Learn-to-Optimize Frameworks for Complex Water Resources Allocation: A Comparison Between Meta-Learning, Reinforcement Learning, and Classical Solvers, EGU General Assembly 2026, Vienna, Austria, 3–8 May 2026, EGU26-4408, https://doi.org/10.5194/egusphere-egu26-4408, 2026.

EGU26-5943 | Orals | HS5.1.1

Compound risks of droughts and heatwaves on water and energy systems 

Michelle van Vliet, Elham Bakhshianlamouki, Gabriel Cardenas Belleza, Edward Jones, Michele Magni, and Jignesh Shah

Ensuring reliable supplies of clean water and energy to a growing global population and under changing climate and extremes is an increasing challenge. The demands for both resources and their systemic interdependencies are particularly strong during droughts and heatwaves. Although research on the water–energy nexus has expanded in recent years, we still lack a fundamental understanding of how water–energy system processes propagate across time and space and may results in cascading impacts during extreme weather events. In addition, limited understanding exists on the trade-offs between management strategies and solutions designed to improve the supply of clean water and energy resources.

Here we will show compounds risks and impacts of climate change and extremes (i.e. droughts, heatwaves and compound events) on clean water and energy systems globally and discuss implications of management strategies to alleviate these risks on water–energy trade-offs. To quantify water and energy system processes in time and space, we developed new open access datasets and built new model frameworks integrating high spatiotemporal resolution models of hydrology, water quality, water use and energy systems.

Our results show that water use in the energy sector is substantially impacted by these hydroclimatic extreme events, with the strongest responses observed during heatwaves and compound drought–heatwave events1. Future climate change is projected to reduce thermoelectric power plant usable capacity globally through rising surface water temperatures and increasing water scarcity2. We found that declines in river flow during droughts over the last decades have to led to a 11% reduction in hydropower generation globally, using a hybrid physically-based and machine-learning model applied to our GloHydroRes global hydropower plant and reservoir dataset3.

Clean water scarcity intensifies across all sectors during these hydroclimatic extremes, due to reduced water availability, rising sectoral water demands, and deteriorating water quality4. While desalination and wastewater treatment and reuse are often promoted as key management strategies towards water scarcity alleviation, they come with substantial energy consumption, brine disposal challenges, and high costs. For instance, we quantified that desalination, wastewater treatment, and conventional drinking water treatment together account for up to ~5% of global electricity consumption, with strong regional variation5. In the Middle East, for example, desalination plants alone contribute to nearly one-fifth of total electricity use, largely powered by fossil fuels, resulting in tradeoffs with climate mitigation goals. This work is part of the B-WEX ERC project and will focus in a next step on developing joint clean water and energy transition pathways that remain robust under changing climate with increasing droughts, heatwaves, and compound events.

References

1 Cárdenas Belleza, G.A., M.F.P. Bierkens, M.T.H. van Vliet (2023) Environ. Res. Lett. 18 104008, https://doi.org/10.1088/1748-9326/acf82e

2 Jones, E.R. et al. (2025) Environmental Research: Water, 1, 2, 025002, https://10.1088/3033-4942/addffa

3 Shah, J. J. Hu, O.Y. Edelenbosch, M.T.H. van Vliet (2025) Scientific Data 12, 646, https://doi.org/10.1038/s41597-025-04975-0

4 van Vliet, M.T.H. (2023) Nature Water 1, 902–904, https://doi.org/10.1038/s44221-023-00158-6

5 Magni, M., E.R. Jones, M.F.P. Bierkens, M.T.H. van Vliet (2025) Water Research 277, 123245, https://doi.org/10.1016/j.watres.2025.123245

How to cite: van Vliet, M., Bakhshianlamouki, E., Cardenas Belleza, G., Jones, E., Magni, M., and Shah, J.: Compound risks of droughts and heatwaves on water and energy systems, EGU General Assembly 2026, Vienna, Austria, 3–8 May 2026, EGU26-5943, https://doi.org/10.5194/egusphere-egu26-5943, 2026.

Boil water advisories (BWAs) are essential public health alerts issued when drinking water safety is compromised, yet the United States lacks a centralized database to track these events. Such a dataset would enable epidemiological studies, infrastructure resilience assessments, and policy analysis to better understand advisory causes, impacts, and regional disparities. This research introduces a scalable framework for building this database and a generalizable methodology for converting unstructured online information into machine-readable datasets. Our approach integrates automated web scraping with large language models (LLMs) to extract and standardize advisory attributes such as location, duration, and cause. Preliminary validation compares U.S. data against ground-truth datasets from Canada and Kentucky to assess coverage and accuracy, with early findings indicating substantial capture of advisories despite variability in reporting formats. Future work will refine search strategies to improve precision and extend this methodology to other domains lacking centralized data, such as water quality violations and emergency notifications. This study demonstrates the potential of combining web scraping and LLM-based text processing to address critical data gaps in environmental and public health monitoring.

How to cite: Cook, E., Marston, L., and Cohen, A.: Toward a National Database of Boil Water Advisories in the United States Using Web Scraping and Large Language Models, EGU General Assembly 2026, Vienna, Austria, 3–8 May 2026, EGU26-7185, https://doi.org/10.5194/egusphere-egu26-7185, 2026.

EGU26-8222 | Posters on site | HS5.1.1

 Spatial Analysis of Desalination Energy Demand in Greece: Feasibility Zones from the Coastline for Water-Energy Planning   

Marios Athanasios Angelidis, Ilias Arvanitidis, Romanos Ioannidis, and G.-Fivos Sargentis

Greece, as a predominantly coastal country, faces increasing pressure on freshwater resources due to climate variability, population distribution, tourism, and agricultural demands. Desalination represents a viable adaptation strategy, yet its energy intensity—particularly for reverse osmosis and water conveyance—varies significantly with distance from the coastline. This study employs a GIS-based feasibility zone analysis around the Greek coastline at incremental distances (10 m, 50 m, 100 m, 1 km, 10 km, 50 km, and 100 km) to spatially quantify the daily energy requirements for desalination and conveyance, aggregated by population and land use zones. Calculations are based on representative specific energy consumption values for desalination (typically 3–5 kWh/m³) and conveyance (increasing with elevation and distance), combined with population distribution data. Results reveal a strong concentration of energy demand near the coast: within 10 km, approximately 60.21% of total national desalination energy demand is covered, corresponding to 66.25% of the population (≈7.24 million people). By 50 km, this rises to 89.50% of energy demand and 93.00% of the population. Beyond 100 km, only 1.27% of the total energy requirement remains, yet with disproportionately higher per-cubic-meter costs due to conveyance challenges. To contextualize feasibility, daily household and services electricity consumption  is allocated proportionally to population per zone. Desalination energy as a percentage of zonal electricity demand remains moderate near the coast but increases inland, highlighting the trade-offs for full national coverage. These findings support that desalination is energetically and technically most viable within 50 km of the coastline, covering the vast majority of the population with relatively low conveyance losses. Inland regions would benefit more from alternative strategies (e.g., rainwater harvesting, wastewater reuse, or inter-basin transfers). The approach provides a first-order metric for prioritizing desalination infrastructure and informs integrated water-energy nexus planning in Mediterranean coastal countries. 

How to cite: Angelidis, M. A., Arvanitidis, I., Ioannidis, R., and Sargentis, G.-F.:  Spatial Analysis of Desalination Energy Demand in Greece: Feasibility Zones from the Coastline for Water-Energy Planning  , EGU General Assembly 2026, Vienna, Austria, 3–8 May 2026, EGU26-8222, https://doi.org/10.5194/egusphere-egu26-8222, 2026.

EGU26-12690 | ECS | Orals | HS5.1.1

Impacts of Foresight Among Competitive Groundwater Users: An investigation through Receding Horizon Games 

Léonard Chanfreau, Sophie Hall, Kevin Wallington, Marc Müller, and John Lygeros

Groundwater is a shared (common-pool) resource and, as such, is vulnerable to individual users making decisions that benefit themselves but degrade the aggregate welfare of all users. However, past theoretical and empirical studies have shown mixed results regarding whether competition among individuals actually does degrade aggregate welfare in the groundwater context. Here, we help to clarify this discord by illustrating the relationship between (1) the length of a competitive groundwater user’s foresight for the impact of their present decision on their own future costs and (2) the externalities of a competitive groundwater user’s decision on the costs of other users in other locations. Toward this end, and whereas prior work in this area often treats competitive behavior as exclusively myopic or analyzes steady state outcomes, we deploy a novel framework where user foresight is a tunable parameter and where user decisions and their environment are dynamic. In our framework, groundwater users are participants in a Receding Horizon Game where at each time step of simulation (1) a generalized game is solved to obtain the optimal (open loop) pumping sequence of all users during a given foresight horizon, (2) each user plays only their first pumping decision, and (3) the procedure is repeated from the next time step with updated state information. We compare outcomes from different foresight lengths to the maximum social welfare solution and illustrate how longer foresight for individual groundwater users decreases the negative externalities of their decisions. We also illustrate how foresight (a temporal dimension) and distance between wells (a spatial dimension) interact to shape externalities. Further, this study demonstrates the suitability of the Receding Horizon Game approach, an emerging tool in the optimization and control community, to model and optimize dynamic behavior of competitive agents in other water resources systems.

How to cite: Chanfreau, L., Hall, S., Wallington, K., Müller, M., and Lygeros, J.: Impacts of Foresight Among Competitive Groundwater Users: An investigation through Receding Horizon Games, EGU General Assembly 2026, Vienna, Austria, 3–8 May 2026, EGU26-12690, https://doi.org/10.5194/egusphere-egu26-12690, 2026.

EGU26-14370 | ECS | Posters on site | HS5.1.1

From vulnerability exploration to adaptive policy design in semi-arid coastal basins: surrogate-assisted robust pathways building in the Quilimarí case, Chile. 

David Poblete, Sebastián Vicuña, Óscar Melo, Sarah Leray, Sarah Fletcher, and Mofan Zhang

Recent applications of Robust Decision Making (RDM) have demonstrated their value for exploring socio-hydrological vulnerabilities under deep uncertainty in water-scarce regions. A recent study in the semi-arid coastal Quilimarí basin (central Chile), used an RDM framework combining stakeholder engagement and an integrated WEAP-MODFLOW model to reveal critical trade-offs between agricultural production, drinking water security, groundwater depletion and saline intrusion under climate and development uncertainties. While this work provided valuable insights into system vulnerabilities and stressors, it remained focused on exploratory analysis rather than on the explicit design of adaptive strategies.


This study builds directly on the Quilimarí RDM case study and advances the framework toward adaptive policy design, introducing two methodological innovations. First, we extend the RDM approach by integrating the Direct Policy Search (DPS) framework  to identify robust and flexible water management strategies. Instead of evaluating a small set of predefined interventions, policies are formulated as adaptive decision rules that dynamically link observable system states such as groundwater levels, salinity thresholds or unmet drinking water demand, to management actions including abstraction restrictions, activation of alternative supplies or demand reallocation. This allows the systematic identification of pathways that evolve over time and remain robust across a wide ensemble of plausible hydroclimatic and socio-economic futures.


Second, to enable the computational requirement of DPS in data and process intensive basins, we develop a surrogate model that emulates the behavior of the full integrated surface-groundwater system. The original WEAP-MODFLOW model for Quilimarí, which explicitly represents groundwater dynamics, agricultural water use, and seawater intrusion, is approximated using an LSTM (Long Short-Term Memory), a type of Recurrent Neural Networks (RNN), trained on large ensembles of simulation outputs. The surrogate model preserves key nonlinearities and memory effects inherent to groundwater systems while reducing computational costs by several orders of magnitude, making large-scale adaptive policy search feasible.


The combined framework is applied to the Quilimarí basin to identify adaptive pathways that balance drinking water reliability, agricultural viability, and long-term groundwater sustainability under deep uncertainties as climate and land use change and growing population. Results show that the DPS using the surrogate model outperform static strategies identified in the original RDM analysis, particularly under severe drought and demand-growth scenarios, by avoiding maladaptation and reducing regret across objectives.


By explicitly linking the vulnerability exploration with the design of adaptive strategies, this study shows how RDM can be operationalized into implementable and flexible water management policies. The approach is transferable to other semi-arid coastal basins that face strong groundwater dependence, institutional constraints, and profound climate and other uncertainties.

How to cite: Poblete, D., Vicuña, S., Melo, Ó., Leray, S., Fletcher, S., and Zhang, M.: From vulnerability exploration to adaptive policy design in semi-arid coastal basins: surrogate-assisted robust pathways building in the Quilimarí case, Chile., EGU General Assembly 2026, Vienna, Austria, 3–8 May 2026, EGU26-14370, https://doi.org/10.5194/egusphere-egu26-14370, 2026.

Multi-purpose reservoirs are critical infrastructure for the management of water resources, and reservoir operators must often balance multiple competing water demands. Climate change is an important threat to the resiliency of water resources in these reservoirs, as it can limit the efficacy of historical operations strategies as well as water demands and availability. The Conowingo Reservoir, a large multi-purpose reservoir located in Pennsylvania and Maryland along the Susquehanna River, has been managed actively for decades, yet current operating policies fail to adequately account for internal system variability and emerging threats to regional water resource reliability. Havre de Grace, Maryland, a small community at the mouth of the Susquehanna River, sources drinking water from the river, and during periods of low riverine freshwater flow, saline waters from Chesapeake Bay can intrude upstream, degrading public water supply and corroding infrastructure. To address this emerging problem, we first develop a statistical model for saltwater intrusion at the Havre de Grace drinking water intake using historical discharge, tide, and wind data from 2007 – 2024. Salinity responses to wind and tidal forcing under low flow conditions are rare and nonlinear, highlighting the need for targeted reservoir releases prior to and during salinity events. Second, we incorporate this model into a simulation-optimization framework for the Conowingo, training adaptive, state-aware, and dynamic release policies that release water from the reservoir downstream to flush out intruding saltwater while continuing to satisfy pre-existing regional water demands. Updating the current operations strategies will expand the scope of water resource management to an emerging compound stressor of water reliability, providing finer control over rare intrusion events that currently, and will continue to, threaten public health and infrastructure.  

How to cite: Heidtman, E. and Hadjimichael, A.:  Combating compounding drought and riverine saltwater intrusion hazards using reservoir operations: a case study in the tidal Susquehanna River , EGU General Assembly 2026, Vienna, Austria, 3–8 May 2026, EGU26-14972, https://doi.org/10.5194/egusphere-egu26-14972, 2026.

EGU26-17629 | Orals | HS5.1.1

Future water resource assessments to support Net Zero: hydrological projections for England incorporating both climate change and socioeconomic demands 

Jamie Hannaford, Vicky Bell, Lucy Barker, Helen Baron, Helen Davies, Matt Fry, Virginie Keller, Eugene Magee, Gemma Nash, Ponnambalam Rameshwaran, Richard Smith, Maliko Tanguy, Chris Thorpe, Emma Greswell, Stuart Allen, and Andy Beverton

To achieve Net Zero ambitions in England, as with other countries, there is a need to ensure security of water supply for the decarbonisation technologies that are pivotal to such aims. This requires future scenarios of water resources, particularly river flow, but to date, a majority of projections in England have focused solely on the impacts of anthropogenic warming. Future assessments of socioeconomic demand have typically been constructed separately for different sectors and have largely been estimated regionally rather than the fine scales needed for planning purposes. Hence, England has lacked readily accessible projections that integrate all of these factors to provide spatially-resolved assessments of future water resources. Indeed, internationally, there are few examples of hydrological projections that are fit-for-purpose for the challenge of quantifying future water resources for energy infrastructure alongside public supply and other demands.  

Here we describe how the CS-N0W programme (Climate Services for a Net Zero World) has delivered spatially distributed projections of future resources for England, to the 2080s, accounting for both climate change and future changes in human influences on river regimes (namely abstractions and discharges). The projections are based on the latest 12km, 12-ensemble member UKCP18 climate projections, run through the 1km Grid-to-Grid distributed hydrological model. Crucially, this version of Grid-to-Grid incorporates layers of contemporary abstractions and discharges that are perturbed into the future according to three newly co-designed demand scenarios. These demand scenarios were developed by integrating existing scenarios of future water use for the public water supply and energy sectors alongside other abstractors (e.g. industry, agriculture). We showcase the potential of the projections for analysis of future water resources, quantifying changes in drought and low flow indicators for >600 catchments as well as larger-scale water resources planning regions. Finally, we describe how the projections have been turned into accessible, actionable information for policy- and decision-makers through a mapping and visualisation portal, co-designed with a stakeholder group representing a wide range of actors involved in water management.

How to cite: Hannaford, J., Bell, V., Barker, L., Baron, H., Davies, H., Fry, M., Keller, V., Magee, E., Nash, G., Rameshwaran, P., Smith, R., Tanguy, M., Thorpe, C., Greswell, E., Allen, S., and Beverton, A.: Future water resource assessments to support Net Zero: hydrological projections for England incorporating both climate change and socioeconomic demands, EGU General Assembly 2026, Vienna, Austria, 3–8 May 2026, EGU26-17629, https://doi.org/10.5194/egusphere-egu26-17629, 2026.

EGU26-18870 | Posters on site | HS5.1.1

Operationalizing Equity in Quantitative Water Resources Systems Modeling 

Aseel Mohamed, Marc F. P. Bierkens, Yasmin Lira, Conceição M. A. Alves, and David F. Gold

Equity is increasingly central to water resources management as cities expand and socioeconomic inequalities persist. As climate change intensifies, urban water managers are tasked with ensuring reliable water supplies while navigating the complex distribution of benefits and burdens across diverse communities. While equitable access to clean water is a core component of Sustainable Development Goal 6: Ensure availability and sustainable management of water and sanitation for all, quantitative water resources models often lack an explicit representation of equity, instead prioritizing aggregate metrics such as cost-efficiency or system-wide reliability. Without explicit equity representations, models are limited in their ability to evaluate distributional outcomes and may unintentionally reinforce existing inequalities. In this study, we operationalize distributive equity within a quantitative water resources modeling framework to assess how equity principles influence infrastructure and operational decisions. We explore these principles in the Federal District of Brazil, a region with a high drought risk, rapid urbanization, and large income inequality. Using the WaterPaths water supply model coupled with the Borg multi-objective evolutionary algorithm, we explore how alternative distributive principles influence drought risk and equity outcomes within optimized water supply portfolios. In WaterPaths, we compare three distinct principles of distributive equity, Rawlsian, Utilitarian, and Sufficietarian, by developing three rival multi-objective problem formulations. We optimize each formulation and explore how trade-offs between conflicting objectives and equity outcomes change across the formulations. Results indicate that the choice of a specific equity principle can fundamentally shift trade-offs and alter the perceived performance of candidate management strategies. Our findings contribute to more transparent and robust system planning approaches, offering a pathway to integrate social justice directly into water resources decision-making under deep uncertainty.

How to cite: Mohamed, A., F. P. Bierkens, M., Lira, Y., M. A. Alves, C., and F. Gold, D.: Operationalizing Equity in Quantitative Water Resources Systems Modeling, EGU General Assembly 2026, Vienna, Austria, 3–8 May 2026, EGU26-18870, https://doi.org/10.5194/egusphere-egu26-18870, 2026.

EGU26-20708 | Orals | HS5.1.1

Towards adaptive and climate-resilient water management under deep uncertainty: lessons from Chile 

Eduardo Bustos and Sebastián Vicuña and the Academic-Public Team for Adaptive Water Management in Chile

Climate change is increasingly challenging water governance systems worldwide, particularly in countries with strong hydroclimatic gradients and complex institutional arrangements. In Chile, observed and projected changes in precipitation, temperature, snow accumulation, glacier mass balance and extreme events are already affecting water availability, ecosystem integrity, and the effectiveness of existing water management instruments. These changes occur in a context of deep uncertainty, where future hydroclimatic conditions cannot be reliably characterized using single deterministic projections, posing fundamental challenges for long-term planning and day-to-day water governance.

This study presents an integrated framework for adaptive and climate-resilient water management, developed in close collaboration with the Chilean Water Authority (Dirección General de Aguas, DGA). The framework combines advances in climate and hydrological science with institutional analysis and participatory processes, aiming to support decision-making across multiple spatial and temporal scales. First, we synthesize observed and projected climate change impacts on Chilean water resources at national and macro-regional scales, drawing on updated hydroclimatic datasets and distributed hydrological modelling based on the Variable Infiltration Capacity (VIC) model. This includes explicit consideration of surface water, groundwater, snow, and glacier contributions, as well as changes in drought and flood regimes.

Second, we conduct a comprehensive institutional diagnosis of water management functions and practices, identifying the key Functions and Tasks of Water Management (FLGH for its acronym in Spanish) performed by public agencies and other actors. Through interviews, workshops and macro-regional participatory processes, we assess how these functions depend on hydrological variables and how they are being affected by climate change. We then propose a classification of FLGH according to their climate sensitivity, decision horizon and flexibility, distinguishing between functions requiring methodological adaptation and those primarily affected through changes in frequency or operational intensity.

Third, building on this classification, we develop adaptive decision criteria and methodological proposals to explicitly incorporate future climate uncertainty into water management functions. The approach is inspired in adaptive planning approaches such as Adaptation Pathways to support climate scenario based decisions for long-term, high-commitment decisions, while strengthening monitoring, enforcement, and short-term operational capacities for highly climate-sensitive functions. The framework emphasizes the need to align institutional mandates associated with water security criteria, and territorial heterogeneity, recognizing that adaptive strategies must differ across Chile’s broad climatic zones.

The results provide a transferable approach for embedding climate change and uncertainty into water governance systems, highlighting the importance of linking hydroclimatic science, institutional analysis, and participatory processes. While developed for Chile, the proposed framework is relevant for other regions facing increasing water scarcity, institutional fragmentation, and deep climatic uncertainty.

How to cite: Bustos, E. and Vicuña, S. and the Academic-Public Team for Adaptive Water Management in Chile: Towards adaptive and climate-resilient water management under deep uncertainty: lessons from Chile, EGU General Assembly 2026, Vienna, Austria, 3–8 May 2026, EGU26-20708, https://doi.org/10.5194/egusphere-egu26-20708, 2026.

EGU26-23070 | Orals | HS5.1.1

Water-energy system design under uncertainty – lessons and recent advances 

Julien Harou and Adil Ashraf

Interdependencies between water, energy, and food systems motivate linking system simulations with design tools for planning and management. We use the open-source Python water resources simulator Pywr and a Pywr-based power system simulator Pyenr. These simulators are linked using Pynsim, a generalised model integration framework. The integrated simulator is coupled with multi-objective evolutionary optimisation and machine learning algorithms. This enables exploration of infrastructure and operational intervention strategies and evaluation of trade-offs between multiple performance objectives. We apply the method to infrastructure planning in Ghana and the Eastern Nile region. For Ghana, national-scale future water and energy systems are planned to enhance equity in providing electricity and water, reduce carbon emissions, and improve system performance. For the Eastern Nile region (Ethiopia, Sudan, Egypt), the method explores and optimises joint irrigation and electricity expansion and operation strategies to improve nutritional and caloric outcomes from irrigation, manage emissions, and deliver cross-sector benefits under climate and socioeconomic uncertainties. We discuss limitations and directions for future research.

How to cite: Harou, J. and Ashraf, A.: Water-energy system design under uncertainty – lessons and recent advances, EGU General Assembly 2026, Vienna, Austria, 3–8 May 2026, EGU26-23070, https://doi.org/10.5194/egusphere-egu26-23070, 2026.

Climate change and increasing extreme events challenge food production due to the growing volatility of agricultural revenues. In water-scarce regions, farmers are exposed to hydrological droughts due to their dependence on regulated water systems. We assess how drought-indexed insurance could reduce income shocks for irrigation communities affected by climate change, in particular in the largest citrus-growing area in the EU (Valencia province).

Our analysis revealed insurance configurations that could be attractive to both farmers and insurers across surface and mixed water demands. However, their suitability depends on the climate change scenario. Tailoring the insurance design to the official State Drought Index of the area (Jucar River Basin) aligns the probability of receiving an indemnity with drought severity and the premiums paid. We also demonstrate that public sector participation would be crucial to achieving robust, efficient insurance schemes, given issues of insurance affordability among farmers and uncertainties in insurers' revenues.

How to cite: Pulido-Velazquez, M. and Macian-Sorribes, H.: Assessing drought-indexed insurance for irrigation communities under climate uncertainty: A case study from Mediterranean agriculture, EGU General Assembly 2026, Vienna, Austria, 3–8 May 2026, EGU26-23202, https://doi.org/10.5194/egusphere-egu26-23202, 2026.

EGU26-1352 | Orals | HS5.1.2

Enhanced reservoir system management using adaptive environmental flows 

Eva Contreras, Rafael Pimentel, Raquel Gómez-Beas, Antonio Puerto, Carmelo Escot, and María José Polo

The intense hydrological variability and the increased frequency of drought events in Mediterranean basins entail major challenges for achieving an effective balance between water-supply reliability and ecological conservation in regulated river systems. Within this context, this study examines the performance of an adaptive minimum environmental flow (MEF) regime aimed at enhancing drought resilience in a three reservoirs system of the Rivera de Huelva catchment (southern Spain), which constitute a critical component of the water-supply infrastructure for the metropolitan area of Seville.

An adaptive MEF regime, that reflects the natural hydrological variability, is defined based on a statistical approach and using historical streamflow data. This adaptive MEF regime was also variable between meteorological drought and no-drought situations using the Standardized Precipitation Index (SPI). To evaluate the impact of this new MEF regime, reservoir operation was simulated for the 2001/02–2024/05 period under two management scenarios: (1) the MEF regime currently implemented, and (2) the new proposed adaptive MEF regime. Based on observed daily inflows and operational releases, the analysis quantifies the individual impact of each flow regime on reservoir storage dynamics. Reservoir-specific water scarcity situations   - pre-alert, alert, emergency - were established fixing different threshold to the normalization of observed storage volume. This procedure is consistent with the framework of the River Basin Drought Management Plan, and therefore it enables standardized characterization of water scarcity at the reservoir scale. Finally, a comparative analysis, based on the fraction of months allocated to each state was carried out.

The adaptive regime resulted in consistently higher storage levels across the three reservoirs, with mean increases which may vary from 5 to 10 hm³, depending on the specific reservoir. The effects are particularly notable in the smallest reservoir, where the incidence of alert and emergency states is reduced to approximately one third of that observed under the current regime, which indicates a substantial reduction in the frequency of emergency conditions under the adaptive regime.

Overall, the results demonstrate that the implementation of adaptive environmental flows can simultaneously reinforce supply-security outcomes and strengthen ecological resilience, thereby offering a robust and scalable strategy for reservoir management under increasing drought pressure.

Acknowledgments: This work has been funded by the project CONV 39-27 UCO-EMASESA, in the framework of the TED/934/2022-PCAU00006, funded by MITECO and by European Union NextGenerationEU/PTR.

How to cite: Contreras, E., Pimentel, R., Gómez-Beas, R., Puerto, A., Escot, C., and Polo, M. J.: Enhanced reservoir system management using adaptive environmental flows, EGU General Assembly 2026, Vienna, Austria, 3–8 May 2026, EGU26-1352, https://doi.org/10.5194/egusphere-egu26-1352, 2026.

EGU26-4527 | Posters on site | HS5.1.2

An Experimental Protocol Combined with machine mearning for Smart Evaporation Management under Climate Change 

insaf ouchkir, Abdelkrim Arioua, Bouzekri Arioua, Ismail Karaoui, Oussama Nait-taleb, Fatima Ezzahra El Kamouni, and Mostafa Bimouhen

Water evaporation represents a major source of water loss in agricultural systems, particularly in arid and semi-arid regions. Developing innovative, data-driven approaches to quantify and manage evaporation is therefore essential for sustainable water resource management. This study proposes an original experimental protocol combined with machine learning techniques to support smart evaporation management at the plot scale.

The experimental setup consists of two identical artificial basins exposed to the same climatic conditions: one partially covered by a photovoltaic panel, while the other remains uncovered. Continuous high-resolution measurements of water level variations, along with other climatic parameters (humidity, air temperature, water temperature, TDS, etc.), are collected using sensors, enabling a precise characterization of evaporation dynamics under contrasting surface conditions.

The acquired experimental data constitute a dedicated database for training machine learning models, including Support Vector Machines (SVM), Gradient Boosting, and Random Forest, aimed at predicting evaporation rates and identifying the main controlling factors. According to the results, the Gradient Boosting model performed best, achieving an R² of 0.993 and RMSE of 0.245 for the open basin, and an R² of 0.996 and RMSE of 0.158 for the covered basin, indicating highly accurate predictions. Random Forest and SVM were also tested, showing good and poor predictive performance, respectively.These findings demonstrate the reliability of ensemble models, particularly Gradient Boosting, for modeling evaporation from measured climatic parameters. The models support adaptive irrigation strategies and contribute to the development of an intelligent agricultural plot, where water losses can be anticipated and minimized.

This work highlights the potential of coupling experimental hydrological observations with machine learning to reduce evaporation losses while promoting the integration of renewable energy solutions in agricultural water management.
key words: Water evaporation,Climate Change,Machine Learning,Experimental protocol,Photovoltaic covering, Smart agricultural plot

How to cite: ouchkir, I., Arioua, A., Arioua, B., Karaoui, I., Nait-taleb, O., El Kamouni, F. E., and Bimouhen, M.: An Experimental Protocol Combined with machine mearning for Smart Evaporation Management under Climate Change, EGU General Assembly 2026, Vienna, Austria, 3–8 May 2026, EGU26-4527, https://doi.org/10.5194/egusphere-egu26-4527, 2026.

Water reservoirs play a crucial role in water resources management, providing a range of benefits that contribute to societal, economic, and environmental well-being. One of the primary functions of reservoirs is to provide water for agriculture, which is essential for irrigating crops and sustaining agricultural productivity. About 70% of global freshwater withdrawals are used for irrigation, creating substantial demand and alterations for regional hydrology. A study conducted by the World Commission on Dams revealed that irrigation dams frequently fail to deliver the projected water supply for their command areas (i.e., the irrigated area extent and location associated with each individual irrigation reservoir), underscoring inefficiencies in reservoir management.

Several additional challenges are expected to affect reservoir management in the future. For example, climate change can alter the volume of stored water in the reservoirs, whereas land cover change can increase sediment delivery, reducing reservoir storage capacity. Pollution may trigger harmful algal blooms, and conflicting objectives such as balancing domestic water supply, hydropower generation, and irrigation demands can make reservoir operation even more complex. Therefore, reservoir management is inherently a multi-objective task that must account for future storage conditions while balancing various water demands to ensure their sustainable supply.

Many researchers have tried to map irrigated areas and the crops produced therein, but no current global dataset provides command areas and crop production information at the resolution of individual irrigation reservoirs at a global scale. As a result, there is a clear global need for continuous, high-resolution information on command areas and crop production linked to individual water reservoirs.

This study proposes a new framework to cope with the complexity of irrigation reservoir management through two different steps, including (i) the identification of command areas and (ii) the determination of crop production and water demand for each command area for all large irrigation reservoirs worldwide, totaling more than 21,000.  Command areas are estimated based on different criteria such as proximity to the reservoir, gravity-based water transfer (i.e., only downhill movement is allowed), irrigation and crop maps, exclusion of water bodies and urban areas, and slope considerations. Then, using crop production maps alongside the estimated command areas, geospatial analyses are applied to extract the total crop production within each command area. For each command area, the first step is to identify the different crop types harvested during the target year. Once the crop types are identified, the water requirements for all crops within the command area can be calculated. The annual water requirement for each command area then represents the sum of the water needed for all crop types grown within the command area during the target year.

Integrating crop production data with command area mapping allows for improved optimization of reservoir operations to balance irrigation needs with other competing uses such as hydropower generation, flood control, and environmental flows, as well as a better management of downstream irrigation production.


How to cite: Soleimanian, E. and Lehner, B.: Calculating crop production within the command areas of irrigation reservoirs at a global scale to support sustainable water management under climate change, EGU General Assembly 2026, Vienna, Austria, 3–8 May 2026, EGU26-5561, https://doi.org/10.5194/egusphere-egu26-5561, 2026.

EGU26-6863 | ECS | Posters on site | HS5.1.2

A global assessment of saline lake dynamics from 1985 to 2021 

Inchara Kumaraswamy, Milad Aminzadeh, and Nima Shokri

Saline lakes play a critical role in ecosystem functioning and are highly sensitive to both 
climatic variability and human-induced pressures. Rising global water demand and intensified 
water extraction coupled with shifts in precipitation regimes and increasing temperatures 
have altered the hydrological stability of many saline lakes across the world. This study 
integrates satellite remote sensing and multi-decadal historical observations to assess the 
spatial extent and long-term dynamics of more than 24,000 saline lakes (> 10 ha) worldwide 
from 1985 to 2021. Our preliminary results reveal that approximately 15% of these lakes have 
undergone notable shrinkage, about 31% have experienced expansion, and the rest have 
remained largely unchanged during the study period. Linking spatial trends to climatic regimes 
indicates that lake shrinkage is primarily concentrated in arid and semi-arid regions which 
often experience acute water stress problems. In contrast, accelerated snow and glacier melt 
with global warming has been a primary driver of lake expansion. These findings underscore 
the need for region-specific water management strategies, especially in water-stressed 
regions where lake desiccation enhances ecosystem degradation and dust emissions with 
significant human health implications (Hassani et al., 2020).

Hassani, A., Azapagic, A., D'Odorico, P., Keshmiri, A., Shokri, N. (2020). Desiccation crisis of 
saline lakes: A new decision-support framework for building resilience to climate change. 
Science of the Total Environment, 703, 134718,
https://doi.org/10.1016/j.scitotenv.2019.134718

How to cite: Kumaraswamy, I., Aminzadeh, M., and Shokri, N.: A global assessment of saline lake dynamics from 1985 to 2021, EGU General Assembly 2026, Vienna, Austria, 3–8 May 2026, EGU26-6863, https://doi.org/10.5194/egusphere-egu26-6863, 2026.

EGU26-7812 | ECS | Orals | HS5.1.2

Forecast-based operation of re-purposed small reservoirs for floods, farms, and (low) flows 

Sarah Ho, Uwe Ehret, and Robert Lang

The increased frequency and intensity of hydrological extremes, including drought, due to anthropogenic climate change will drive the need for enhanced water supply resilience, even in water-rich countries. Previous studies have shown that small reservoirs have considerable potential for expanding water supply for various purposes, including when repurposed from flood-only reservoirs for both flood and drought protection. However, whether these repurposed reservoirs retain the same flood protection ability when operating under forecasts is still unclear, as reservoir operation under forecasts has primarily been researched in the context of large reservoirs. In this study, we investigated potential operating rules under forecasts for 30 small-to-midsize flood reservoirs to a) determine if the uncertainty introduced by forecasts degrades the performance of repurposed reservoirs so significantly as to render the concept unusable, b) identify patterns in the relationship between forecast accuracy and optimal reservoir performance, and c) identify patterns in optimal reservoir operation rules, under the constraint that flood protection should not be compromised. Performance is determined by the modelled ability to either supplement streamflow to avoid low flows or to provide water for irrigation purposes in the area of the reservoir. 1000 combinations of three operation parameters—the warning threshold at which flood pre-release begins, the rate at which water is released from the reservoir for flood pre-release, and the inflow at which the reservoir begins storing water—were tested for maintenance of flood protection (viability) and benefit for the reservoir’s additional uses. While some reservoirs indeed were no longer beneficial when optimized to operate under forecasts, many still maintained benefits above 40%, with a couple even surpassing their performance under perfect knowledge. Comparing changes in benefit from the perfect-knowledge operation to forecast accuracy indicated that high rates of hits, false alarms and misses, and misses (HFM) could explain the largest decreases in performance, while other forecast accuracy metrics were less impactful. However, even if HFM were low but nonzero, a poorly-timed false alarm could drain a reservoir’s storage before a spike in demand, causing a noticeable loss in performance. Investigation of reservoirs’ potential benefits under forecasts should therefore be done via simulation rather than approximated via characterizing indices. Optimal operation rules tended to be those that most closely mimicked the perfect knowledge operation, i.e. aggressive storage thresholds and a tendency to hold onto the water storage for as long as is safe, but more conservative operating rules were also able to provide benefits as well. The models for forecast operation and optimization produced for this study can be used by water managers to assess if existing small flood reservoirs can feasibly be used to increase water supply resilience in a changing world.

How to cite: Ho, S., Ehret, U., and Lang, R.: Forecast-based operation of re-purposed small reservoirs for floods, farms, and (low) flows, EGU General Assembly 2026, Vienna, Austria, 3–8 May 2026, EGU26-7812, https://doi.org/10.5194/egusphere-egu26-7812, 2026.

EGU26-7826 | ECS | Posters on site | HS5.1.2

IQ Water: AI-supported modeling and forecasting of biodiversity and water quality in drinking water reservoirs 

Andreas Wunsch, Christian Kühnert, Chiara Holzer, Johannes Ho, and Michael Hügler

Lakes and reservoirs support rich biodiversity and are essential for the natural production of over 12% of Germany's drinking water. Their biodiversity is crucial for maintaining water quality but is increasingly threatened by climate change, pollution and the spread of invasive species. In the context of the IQ Water project, a multifaceted approach is employed to assess water quality, encompassing conventional parameters such as physical, chemical, and hygienic metrics, as well as assessments of the planktonic community, in conjunction with innovative molecular methodologies (e.g., eDNA analyses). This integrated strategy enables the exploration of reservoir behavior across multiple dimensions, including physicochemical aspects, in addition to the often-overlooked domain of microbial biodiversity, encompassing bacteria, viruses, protozoa, and fungi. The focus of this research is on water quality parameters, including, but not limited to blooms of potentially toxic cyanobacteria or hygienic relevant bacteria, antibiotic resistance genes (ARG), viruses, and invasive species. The overarching objective of the project is to develop biodiversity models for drinking water reservoirs by integrating complex biological, chemical, and physical data with machine learning (ML) technologies. These ML models aim to enable the prediction of important hygienic challenges like cyanobacterial blooms and the distribution of pathogens and ARGs, thereby contributing to the advancement of understanding of aquatic freshwater ecosystem dynamics.

In this contribution, we present preliminary findings regarding the efficacy of molecular methodologies in analyzing reservoir biodiversity. We also offer insights from a data-centric perspective, including the necessity of a unified data schema for the collection of highly heterogeneous data and the support of machine learning (ML)-based modeling. We showcase ML-based cross-reservoir assessments for ecosystem monitoring based on the proposed framework by modeling biochemical and physicochemical fingerprints. Furthermore, we propose a neural network–based multi‑resolution modelling approach that explicitly accounts for strongly variable sampling intervals (hours to months) within a single model. The architecture treats meteorological and physicochemical time series as primary sequential inputs and uses sparsely sampled molecular profiles as contextual information via learned embeddings and cross‑attention.

How to cite: Wunsch, A., Kühnert, C., Holzer, C., Ho, J., and Hügler, M.: IQ Water: AI-supported modeling and forecasting of biodiversity and water quality in drinking water reservoirs, EGU General Assembly 2026, Vienna, Austria, 3–8 May 2026, EGU26-7826, https://doi.org/10.5194/egusphere-egu26-7826, 2026.

This paper proposes the Neural Evolution-Enhanced Differential Evolution (NEDE), a novel meta-heuristic algorithm designed to optimize the operations of complex, high-dimensional reservoir clusters—a critical task for efficient hydropower utilization and global carbon reduction. Integrating Differential Evolution (DE) with Deep Reinforcement Learning (DRL) and the concept of "evolutionary paths," NEDE features a novel neural network-based architecture comprising a population encoder, policy selector, and parameter controller. By leveraging the adaptive capabilities of DRL to dynamically adjust DE parameters and mutation strategies, the algorithm effectively addresses the challenges of hydraulic coupling and hydrological uncertainty inherent in high-dimensional systems. The neural network is trained within a reinforcement learning framework utilizing fitness rewards and entropy regularization. Comparative analyses on the IEEE CEC 2020 benchmark functions and the real-world downstream Jinsha River - Three Gorges cascade system demonstrate that NEDE delivers superior solution accuracy and faster convergence than conventional algorithms. Specifically, compared to LSHADE, NEDE increases average and maximum power generation by 0.4% and 0.9% in wet years, 1.0% and 0.9% in normal years, and 1.0% and 1.2% in dry years, respectively, validating its robustness and effectiveness in dynamic reservoir scheduling.

How to cite: Yang, L., Qin, H., Li, C., and Xu, X.: Deep Reinforcement Learning Aided Differential Evolution for High-Dimensional Reservoir Optimization: The Case of Jinsha River - Three Gorges Cascade , EGU General Assembly 2026, Vienna, Austria, 3–8 May 2026, EGU26-8537, https://doi.org/10.5194/egusphere-egu26-8537, 2026.

EGU26-9551 | ECS | Posters on site | HS5.1.2

Remote sensing of water presence and physicochemical parameters in water pans in semi-arid Kenya using Sentinel-2 imagery 

Pauline Ogola, Janne Heiskanen, Angela Too, Collins Mundia, Gretchen Gettel, and Petri Pellikka

Climate change, population growth, and water source pollution present significant challenges for water resource managers, who often face limited resources and scarce in-situ data in the arid and semi-arid regions of Sub-Saharan Africa. In Kenya, about 80% of the country’s land area falls within these arid and semi-arid regions. These areas support 36% of the human population and 70% of the livestock population, contributing roughly 50% of agricultural GDP and 15% of national GDP. Water pans, which are small, shallow reservoirs that fill with surface runoff, sustain local livelihoods by supplying water for livestock, wildlife, and small-scale agropastoral irrigation. However, water pans are becoming increasingly susceptible to climate change, highlighting the need for continuous monitoring to ensure water availability for communities. Remote sensing provides a valuable complement to traditional water monitoring techniques by offering spatially extensive and repeatable observations that enhance our understanding of water dynamics. In this context, our primary aims were to evaluate the potential of Sentinel-2 imagery for detecting water presence and assessing physicochemical parameters, specifically turbidity and specific conductivity, in water pans in Taita Taveta County, Kenya. We employed mid-point and receiver operating characteristic (ROC) curve-based threshold methods for water presence detection, alongside generalized additive models for estimating turbidity and specific conductivity. We achieved an F1 score greater than 95% for water presence detection using the Normalized Difference Moisture Index and the two thresholds. The B8A/B4 predictor for specific conductivity yielded a coefficient of determination (R²) of less than 0.5 with both standard and group leave-one-out cross-validation (LOOCV). In contrast, the B8/B4 and B8/B5 predictors for turbidity recorded R² values greater than 0.8 with standard LOOCV and greater than 0.6 with group LOOCV. Overall, this study demonstrates the potential of remote sensing-based approaches for water monitoring, even under conditions of limited data availability.

How to cite: Ogola, P., Heiskanen, J., Too, A., Mundia, C., Gettel, G., and Pellikka, P.: Remote sensing of water presence and physicochemical parameters in water pans in semi-arid Kenya using Sentinel-2 imagery, EGU General Assembly 2026, Vienna, Austria, 3–8 May 2026, EGU26-9551, https://doi.org/10.5194/egusphere-egu26-9551, 2026.

EGU26-10912 | ECS | Orals | HS5.1.2

Including water quality in drought definition for a better assessment of water scarcity situation in Mediterranean highly human modified catchments. 

Laura Santos, Francisco Herrera, Eva Contreras, Ana Andreu, Raquel Gómez-Beas, Cristina Aguilar, María José Polo, and Rafael Pimentel

Mediterranean river basins are characterized by high hydroclimatic variability and the recurrence of drought episodes that strongly condition water resources availability and management. In these systems, water scarcity situations are not only triggered by a reduction in water quantity but, may also be conditioned by a bad water quality that compromises multiple uses. This was the case of the water crisis experienced in the northern part of the Córdoba province during 2023, when, more than 80,000 people did not have running water at home for more than a year. The main reservoir supplying water to the population, Sierra Boyera Dam, was dried out and the safeguard water coming from La Colada reservoir did not fulfill the requirements for their consumption due to high rates of arsenic, TOC, and nitrogen. Therefore, early detection of these situations is particularly relevant in regulated basins, where drought develops progressively and with non-simultaneous responses across the system components due to storage effects and management practices.

This work uses this water crisis as case study to propose to include water quality in the definition of droughts. For that a Combined Water Scarcity Index (CWSI) that combines meteorological, agricultural and hydrological drought with a fourth component explicitly linked to water quality is proposed. Conventional drought indexes (i.e., Standardized Precipitation Index – SPI -, Standardize Soil Moisture Index – SSMI – and Standardized Streamflow Index – SSI) are used to account for the different types of droughts. In the case of water quality, the potential non-point pollution index modified monthly by precipitation patterns is adapted to be used as a fourth component of the combined drought index. The period 1960-2024 has been used for defining this new combined index. A comparative analysis has been carried out to assess the impact of including the potential affection of water quality in water scarcity definition and some specific cases know in the area were used as validation datasets for the methodology proposed.

The results show that the inclusion of water quality in drought assessment increases the number of water scarcity situations identified. Therefore, CWSI enables the early identification of alert states and tipping points relevant for decision-making to deal with water scarcity situations, highlighting its potential as a tool for foreseeing water scarcity episodes. In addition, our results showed that those areas with high water pollution potential risk, predominantly associated with zones of intensive agriculture, livestock farming, and urban development, had to face more frequent water scarcity situations and water shortages due to poor water quality in reservoirs.

Acknowledgements: This study has been funded by the call “Grants to develop innovative solutions to address drought, within the framework of the PLAnd Drought Andalusia. 2023 Call” through the project PLSQ-00172-F – “Service for the early detection of alert states in water management under scarcity conditions” (SEGA)

How to cite: Santos, L., Herrera, F., Contreras, E., Andreu, A., Gómez-Beas, R., Aguilar, C., Polo, M. J., and Pimentel, R.: Including water quality in drought definition for a better assessment of water scarcity situation in Mediterranean highly human modified catchments., EGU General Assembly 2026, Vienna, Austria, 3–8 May 2026, EGU26-10912, https://doi.org/10.5194/egusphere-egu26-10912, 2026.

EGU26-11155 | ECS | Orals | HS5.1.2

Exploring the potential of minimum flows to mitigate the impacts of small farm reservoirs on low-flows 

Henri Lechevallier, Cécile Dagès, Delphine Burger-Leenhardt, and Jérôme Molénat

Small farm reservoirs are human-made storage systems (from few hundreds m3 to 1Mm³) used all around the world to store water for agricultural uses (crop irrigation, livestock watering) . They are usually built directly across the stream (small dams) or in local depressions to store surface runoff water (hill reservoirs). In the absence of regulation from authorities, small dams can intercept and store upstream water throughout the year without any restrictions. This may have downstream impacts on streamflow and aquatic ecosystem, particularly during the dry season. Many countries, such as Spain and South-Africa, have incorporated the concept of environmental flow in their regulations to protect downstream water uses.

In France, since 2014, all dams irrespective of their size or construction date are required to maintain a downstream flow whenever upstream flow occurs. Reservoirs can only be filled if the upstream flow exceeds a minimum flow, which must be transmitted downstream. This minimum flow is set at 10 % of the inter-annual mean discharge at the location of the reservoir.

This study aims to evaluate the effect of the minimum flow on streamflow, especially low-flow, and water availability in small reservoirs. From a water management perspective, it addresses the question of the mitigation of the hydrological impacts of small reservoirs. We used the spatially-distributed agro-hydrological model MHYDAS-small-reservoirs (Lebon et al., 2022¹) to test four minimum flow values: 0%, 5%, 10%, and 20% of inter-annual mean discharge. The study site was the Gélon catchment (20 km²) located in South-Western France, characterized by hilly terrain, clay loam soils, and a groundwater dominated hydrology. The four values of minimum flow were tested with three different hypothetical 14-reservoirs networks to consider the effect of reservoir distribution (Lechevallier et al., 2025²), and with two values for total reservoir capacity. This results in a total of 24 simulations, in addition to the reference simulation without reservoirs or irrigation. The agronomic context involved intensive reservoir use to irrigate maize and soybeans crops. Simulations were run on 20 years at a hourly time step.

The impact on low-flows was assessed spatially as the change in the number in low-flow days compared to the reference situation without reservoirs. Our on-going research reveals that the greatest impact occurs at 0% of minimum flow, and the effect diminishes with increasing minimum flow, reaching a no-impact situation at 20% of minimum flow. Additionally, withdrawals and water availability are little impacted by the implementation of minimum flows, except for upstream reservoirs. These findings demonstrate that minimum flows effectively mitigate the impacts of small farm reservoirs on low-flows. Future analysis will explore the effects of minimum flows on crop yields and simulate alternative management strategies with restrictions on reservoir refill during the dry season.


¹ https://doi.org/10.1016/j.envsoft.2022.105409

² https://doi.org/10.5194/egusphere-egu25-6876

How to cite: Lechevallier, H., Dagès, C., Burger-Leenhardt, D., and Molénat, J.: Exploring the potential of minimum flows to mitigate the impacts of small farm reservoirs on low-flows, EGU General Assembly 2026, Vienna, Austria, 3–8 May 2026, EGU26-11155, https://doi.org/10.5194/egusphere-egu26-11155, 2026.

Amid global warming and expanding high-altitude hydropower development, characterizing the carbon source-sink dynamics of cryospheric waters is pivotal for sustainable water resource management. However, water-carbon coupling across natural and artificial water bodies in the Third Pole remains poorly understood. This study deeply explored the coupling influence mechanism of hydrological, climate, biogeochemical, land cover, and human factors on water-air carbon dioxide (CO2) flux across lakes, reservoirs, and rivers in the Yarlung Tsangpo basin (YL). Results indicate that compared with inland waters, lakes and reservoirs in the YL were obvious carbon sinks (4.91 ± 86.92 and 21.23 ± 95.67 mmol m-2 d-1, respectively), especially during normal and flood periods, whereas rivers predominantly acted as CO2 sources (103.04 ± 194.88 mmol m-2 d-1). The key drivers of CO2 flux were pH, air temperature, and runoff etc. Runoff showed obvious spatial heterogeneity that correlated negatively with CO2 flux in upstream lakes/reservoirs but positively in downstream rivers. Structural equation modeling identified pCO2water (pH-controlled), climate (rainfall, temperature), and runoff as direct drivers for CO2 flux. Increased rainfall and temperature facilitate CO2 uptake of YL waters, further retained by lentic systems but re-released by rivers via runoff. Runoff effects on carbon sequestration in reservoirs were weaker than in lakes, indicating that while damming converts rivers from sources to sinks, operations may weaken the sink capacity. Operation ratios range from -0.24 ~ 0.56, and less than -0.36 might be an ideal regulation range. Our findings highlight the critical role of lentic systems in CO2 uptake within the YL. While impoundment can reduce carbon emissions from rivers, careful operational regulation is essential.

How to cite: Chen, Y., Sun, J., and Liu, P.: Water-Carbon Coupling Processes on the Third Pole: Differential Carbon Source-Sink Effects and Mechanisms in Lakes, Reservoirs, and Rivers of The Yarlung Tsangpo River Basin, EGU General Assembly 2026, Vienna, Austria, 3–8 May 2026, EGU26-11900, https://doi.org/10.5194/egusphere-egu26-11900, 2026.

EGU26-14976 | ECS | Posters on site | HS5.1.2

Global Assessment of Reservoir Drought Patterns 

Surabhi Upadhyay and Adrienne Marshall

Reservoirs are a cornerstone of global water management, providing critical buffering capacity for irrigation, municipal supply, energy production, and environmental flows. However, intensifying drought under warming climate is increasingly challenging the reliability of reservoir storage worldwide. Unlike meteorological or hydrological droughts, reservoir droughts emerge from nonlinear and lagged interactions between climate forcings, catchment processes, and storage dynamics, and therefore remain poorly characterized in global drought assessments. In particular, consistent metrics that capture the intensity, spatial extent, and frequency of reservoir storage deficits across regions are lacking.

Here, we present a global assessment of reservoir drought patterns using a storage-centric framework based on standardized reservoir storage anomalies (SRSA). We analyze monthly storage variations for approximately 7,000 large reservoirs worldwide over the period 1999–2018, spanning 44 IPCC reference regions. SRSA is computed using long-term, month-specific climatologies for each reservoir. Trends in SRSA are evaluated using Mann–Kendall tests at the reservoir scale and aggregated to assess field-significant regional patterns. To characterize the spatiotemporal structure of reservoir droughts, we extend the Intensity–Extent–Frequency (IEF) framework to reservoir storage. Drought intensity is defined as the normalized storage deficit within affected reservoirs, extent as the fraction of regional storage capacity impacted, and frequency as the return interval of such events. Capacity-weighted metrics are used to quantify regional drought behavior and distinguish localized from system-wide storage failures.

Results reveal a pronounced latitudinal divide in global reservoir drought behavior. Northern regions generally exhibit stable or increasing storage trends and experience frequent but low-severity fluctuations that are spatially coherent across reservoirs. In contrast, tropical and subtropical regions show declining storage trends and are dominated by episodic, high-intensity droughts that affect a limited fraction of regional capacity. IEF curves further demonstrate that extreme reservoir drought risk is primarily driven by localized storage failures in lower-latitude regions, whereas droughts in northern regions tend to expand more uniformly across systems. These findings highlight substantial regional heterogeneity in reservoir drought dynamics and emphasize the importance of storage-based diagnostics for understanding drought risk in managed water systems. This study provides a global, capacity-weighted assessment of reservoir drought intensity, extent, and frequency and establishes a transferable framework for evaluating reservoir vulnerability under ongoing and future climate change.

How to cite: Upadhyay, S. and Marshall, A.: Global Assessment of Reservoir Drought Patterns, EGU General Assembly 2026, Vienna, Austria, 3–8 May 2026, EGU26-14976, https://doi.org/10.5194/egusphere-egu26-14976, 2026.

EGU26-15870 | ECS | Posters on site | HS5.1.2

Comparative Assessment of Management Strategies for Invasive Aquatic Macrophytes in Freshwater Lakes 

Maria Reboldi, Edoardo Bertone, Giulia Valerio, Kelvin O'Halloran, and Matthew Purcell

Human-driven nutrient enrichment is accelerating the spread of invasive aquatic macrophytes, generating substantial ecological and socio-economic impacts in freshwater ecosystems, including biodiversity loss, deterioration of drinking water quality, reduced fisheries productivity, constraints on recreational use as well as impaired waterborne transport. Consequently, the management of invasive aquatic weeds is now widely regarded as a priority for the conservation and sustainable use of freshwater lakes.

This study critically reviews the main control strategies currently adopted to limit the expansion of highly invasive species such as Salvinia molesta, Eichhornia crassipes, Egeria densa, Pistia stratiotes, and Elodea nuttallii. Starting from 30,659 academic and grey literature articles matching our search criteria across multiple browsers (i.e. Google Scholar, ProQuest, Web of Science, and Scopus), we critically analysed 155 fully relevant articles, focusing on lake morphology, infestation details (year of detection and species involved), strategy characteristics and their effectiveness (reduction in surface coverage and containment in the event of reappearance), as well as the qualitative and quantitative advantages and disadvantages of each method.

Our work also examines the global distribution of such management practices and integrates satellite-based remote sensing data to quantify macrophyte surface coverage in lake environments pre‑ and post‑control. Our results to date have identified three dominant approaches: mechanical removal (in 15.6% of the cases), chemical herbicide application (19.5%), and biological control (28.6%), alongside integrated management combining the former approaches (28.6%) and other treatments (7.8%).

Mechanical harvesting and chemical treatments can rapidly reduce biomass, yet their long-term application is often constrained by high operational costs and, in the case of herbicides, potential environmental risks. Biological control, typically involving specialist insects or herbivorous fish, appears to offer a more sustainable and self-maintaining option (with a recurrence rate of 11.4% of the cases, compared with 33.3% for chemical approaches and 41.7% for mechanical treatments), although its effectiveness depends on predator–prey specificity and the suitability of local climatic conditions.

In terms of geographical distribution, the case studies were unevenly distributed, with 40.8% located in North America (which shows a predominance of chemical treatment accounting for 36.7% of the total, particularly in the United States), 25.0% in Africa (where 70.0% of the cases involved biocontrol), and a smaller share in Oceania and Asia (representing 20.0% and 10.8% of the total, respectively), with an even smaller proportion in Europe and South America.

By comparing the strengths, limitations, and context-dependent requirements of each method, this study supports the selection of appropriate management strategies for future case studies, taking into account ecological characteristics, invasion dynamics, geographic setting, and available economic resources.

How to cite: Reboldi, M., Bertone, E., Valerio, G., O'Halloran, K., and Purcell, M.: Comparative Assessment of Management Strategies for Invasive Aquatic Macrophytes in Freshwater Lakes, EGU General Assembly 2026, Vienna, Austria, 3–8 May 2026, EGU26-15870, https://doi.org/10.5194/egusphere-egu26-15870, 2026.

EGU26-16555 | ECS | Posters on site | HS5.1.2

Field-Based Investigation of Flow-Regime-Dependent Hydrodynamic Characteristics in a Complex Artificial Lake 

Yongmuk Kang, Suin Choi, Seogyeong Lee, and Boseong jeong

Artificial reservoirs with meandering planforms and tributary junctions often exhibit complex three-dimensional flow structures that vary depending on hydrologic conditions. In such systems, interactions between inflow regimes and water-intake facilities can influence both hydraulic behavior and water-supply stability. This study examines the flow-regime-dependent hydrodynamic characteristics of Lake Paldang, a large regulated reservoir that serves as a primary drinking-water source for approximately 25 million people in the Seoul metropolitan area, Korea.

Field measurements were conducted under contrasting hydrologic conditions, including flood and normal-flow periods, focusing on major bend sections downstream of tributary confluences. Three-dimensional velocity fields were obtained using an Acoustic Doppler Current Profiler (ADCP), while vertical profiles of water-quality parameters were measured using multi-parameter sondes (YSI-EXO2). Spatial patterns of flow and mixing were analyzed by integrating cross-sectional velocity distributions, electrical conductivity fields, and the positions of maximum-velocity lines (MVL). These datasets were used to examine secondary-flow structures, lateral mixing behavior, and transport pathways of distinct water masses.

The results indicate that during flood conditions, increased discharge from main tributaries enhances curvature-induced momentum, leading to a pronounced lateral separation of the MVL and the development of a dominant single secondary-circulation cell. Under these conditions, the flow field exhibits river-like characteristics, suggesting an increased potential for asymmetric sediment transport and bank-related hydraulic stresses. In contrast, during normal-flow periods, overall flow velocities decrease and multiple smaller secondary cells emerge across the channel section, reflecting more lacustrine hydraulic behavior with reduced lateral momentum and weaker organized circulation.

In addition, under specific hydrologic regimes, tributary inflows characterized by relatively high electrical conductivity were observed to migrate along near-surface pathways toward water-intake zones. This behavior suggests that seasonal flow conditions may influence not only mixing efficiency but also the potential exposure of intake facilities to pollutant-rich inflows.

Overall, the findings suggest that regulated artificial lakes can alternate between riverine and lacustrine hydrodynamic states depending on flow regimes, with direct implications for mixing processes, sediment dynamics, and intake management. The study highlights the value of high-resolution field measurements for understanding regime-dependent hydraulic behavior and supports the need for adaptive monitoring and operational strategies to enhance the resilience of reservoir-based water-supply systems.

How to cite: Kang, Y., Choi, S., Lee, S., and jeong, B.: Field-Based Investigation of Flow-Regime-Dependent Hydrodynamic Characteristics in a Complex Artificial Lake, EGU General Assembly 2026, Vienna, Austria, 3–8 May 2026, EGU26-16555, https://doi.org/10.5194/egusphere-egu26-16555, 2026.

EGU26-18378 | Orals | HS5.1.2

Deficit Buffering Indices for Climate-Resilient Potato Water Management in Finland under CMIP6 SSPs 

Mojtaba Naghdyzadegan Jahromi, Alireza Gohari, Christine Kaggwa Nakigudde, and Ali Torabi Haghighi

This study develops and applies a deficit‑based approach to estimate the minimum buffering of water deficits (summer drought) required so that potatoes in Finland avoid specified levels of water shortage under two future CMIP6 scenarios of SSP2‑4.5 and SSP5‑8.5. Using an ensemble‑based daily water‑balance model, future changes in precipitation and crop evapotranspiration are translated into spatially explicit indices of deficit severity, duration of consecutive deficit days, and the associated deficit buffering needed to keep water stress within chosen tolerance levels. The results indicate an increasing mismatch between water supply and crop water demand under high‑emission conditions, leading to more frequent and persistent dry spells and a strong rise in required deficit buffering, particularly in southern agricultural regions. In contrast, the intermediate‑emission pathway produces more moderate increases and a more limited spatial expansion of high-risk areas. Increasing the tolerated length of consecutive deficit days reduces the average deficit buffering needed but increases relative spatial variability, highlighting a trade‑off between acceptable crop stress and the scale of buffering measures. Overall, the deficit‑based indices provide a practical framework to support adaptive decision-making across Finland for climate‑resilient planning of irrigation, soil‑water management, and on‑farm buffering strategies for potatoes and other water‑sensitive crops in northern European agriculture.

How to cite: Naghdyzadegan Jahromi, M., Gohari, A., Nakigudde, C. K., and Torabi Haghighi, A.: Deficit Buffering Indices for Climate-Resilient Potato Water Management in Finland under CMIP6 SSPs, EGU General Assembly 2026, Vienna, Austria, 3–8 May 2026, EGU26-18378, https://doi.org/10.5194/egusphere-egu26-18378, 2026.

EGU26-18717 | Posters on site | HS5.1.2

Why some terminal lakes remain stable while others shrink under hydroclimatic stresses? 

Hannes Nevermann, Milad Aminzadeh, Dani Or, and Nima Shokri

Endorheic lakes, terminal basins without surface outflows, are among the most sensitive indicators of hydroclimatic change. While recent global analyses have highlighted widespread shrinkage driven by a combination of anthropogenic and climatic factors, many endorheic lakes have remained stable or even expanded over the past two decades. We hypothesize that understanding the mechanisms behind their resilience can help adaptive water management and conservation strategies in closed basins. Building on our global assessment of 635 endorheic lakes (Nevermann et al., 2025), which identified 130 lakes exhibiting significant shrinkage, here we focus on the remaining non-shrinking systems to determine how they persist under increasing hydroclimatic stress. Using multi-decadal satellite records, land-use data, and climate reanalysis, we aim to quantify decadal hydrological stability trends (for 2000 to 2021). A comparison of stable versus shrinking lakes across climate zones, water-stress categories, and basin-level anthropogenic activity will help disentangle resilience mechanisms such as increased glacial melt contributions, climatic water surpluses, effective basin management, and limited irrigation pressures. Preliminary findings indicate that many stable lakes occur in high-elevation basins (e.g., Tibetan Plateau, Andes), where increased cryospheric water input offsets evaporative losses, while others in semi-arid regions exhibit stability linked to strong governance or reduced agricultural intensity. These contrasting hydrological trajectories provide valuable insights into how natural and managed systems maintain equilibrium under global change.

Nevermann, H., Aminzadeh, M., Madani, K., D’Odorico, P., AghaKouchak, A., & Shokri, N. (2025). A global perspective on endorheic lake shrinkage: Impacts of anthropogenic and atmospheric factors. EGU General Assembly 2025, Vienna, Austria, 27 Apr–2 May 2025, EGU25-8774. https://doi.org/10.5194/egusphere-egu25-8774

How to cite: Nevermann, H., Aminzadeh, M., Or, D., and Shokri, N.: Why some terminal lakes remain stable while others shrink under hydroclimatic stresses?, EGU General Assembly 2026, Vienna, Austria, 3–8 May 2026, EGU26-18717, https://doi.org/10.5194/egusphere-egu26-18717, 2026.

EGU26-20614 | Posters on site | HS5.1.2

Water Resources Management of the “Kefalari Agios Ioannis” Spring, Dimitsana, Greece 

Armela Korovesai, Christos Filis, Emmanouil Skourtsos, Emmanouel Andreadakis, Elina Kapourani, Nikolaos Karalemas, and Apostolos Alexopoulos

The “Kefalari Agios Ioannis” spring, situated at approximately 871 m elevation and about 1,650 m south-southeast of the picturesque village of Dimitsana (Peloponnesus, Greece), is used for both drinking water supply and irrigation.

The spring is a contact spring, discharging the karst aquifer developed in the Upper Cretaceous platy limestones of the Pindos Unit, at their contact with the underlying impermeable red cherts, siltstones, and “First Flysch” (Upper Jurassic – Lower Cretaceous) of the same unit.

The recession coefficient of the “Kefalari Agios Ioannis” spring, calculated from flow measurements conducted between 14 July 2024 (711.1 m³/h) and 27 October 2024 (69.4 m³/h), is 8.69 × 10-³ days-¹. This value indicates that groundwater flow occurs mainly through fractures and intra-stratigraphic voids within the Upper Cretaceous platy limestones of the Pindos Unit. The calculated recession coefficient is consistent with values reported in the literature for karst aquifers developed in the Pindos Unit and equivalent formations, which are on the order of 10-³ days-¹ (Soulios, 1985; Giannatos, 1999; Karalemas, 2010).

The hydrological year 2023-2024 was particularly dry (1,109.2 mm), and the calculated recession coefficient should therefore be interpreted with caution, as it reflects flow conditions under prolonged drought and water scarcity. Such conditions may alter groundwater circulation, which is not uniform across the hydrogeological basin and becomes more evident under extreme hydrological conditions—either surplus (wet years) or deficit (dry years)—when different sections and levels of the recharge area are activated or operate differently. Notably, the recession period lasted at least 105 days. The following hydrological year, 2024-2025, was also dry (1,135.6 mm), in contrast to the wetter years 2021-2022 and 2022-2023, which recorded precipitation totals of 1,436.4 mm and 1,426.6 mm, respectively. For the ongoing 2025-2026 hydrological year, a total of 602.4 mm of precipitation has been recorded as of 14 January, indicating that dry conditions persist.

Effective water resources management should prioritize the protection and zoning of the karst aquifer, include systematic monitoring of spring discharge and groundwater quality, regulated and sustainable planning of groundwater abstraction through controlled boreholes, and the enhancement of natural and artificial recharge where feasible. Such adaptation measures are essential to mitigate the impacts of extreme hydrological events and prolonged droughts, ensuring the long-term availability of water for both human consumption and downstream cultural heritage sites.

Under the currently observed low-discharge conditions (98.2 m³/h as of 7 August 2024), the operation of the Open-Air Water Power Museum of the Piraeus Cultural Foundation, which is located immediately downstream, is significantly affected, as the available spring flow becomes insufficient during the summer months. Consequently, the museum is periodically forced to suspend its operation, highlighting the direct dependence of cultural and touristic activities on the hydrological regime of the “Kefalari Agios Ioannis” spring.

In conclusion, the sustainable management of water resources in the Dimitsana area, and particularly of the karst aquifer discharged by the “Kefalari Agios Ioannis” spring, is imperative given the combined pressures of ongoing tourism development and climate variability.

How to cite: Korovesai, A., Filis, C., Skourtsos, E., Andreadakis, E., Kapourani, E., Karalemas, N., and Alexopoulos, A.: Water Resources Management of the “Kefalari Agios Ioannis” Spring, Dimitsana, Greece, EGU General Assembly 2026, Vienna, Austria, 3–8 May 2026, EGU26-20614, https://doi.org/10.5194/egusphere-egu26-20614, 2026.

EGU26-20903 | Posters on site | HS5.1.2

Water Resources Management in Kythira Island (Greece) under High Tourism Pressure and Climate Crisis 

Giannis Zoumbourlis, Christos Filis, Emmanouil Skourtsos, Evelina Megalokonomou, Vasilios Ketsetsioglou, and Nikoleta Trianti

Three main aquifer systems have developed on Kythira Island (Greece) (Pagounis, 1981; Pagounis & Gertsos, 1984; Danamos, 1991; Koumantakis et al., 2006; Filis et al., 2019):

  • The porous aquifer system within Neogene and Quaternary formations.
  • The karst aquifer system developed in the carbonate formations of the Pindos and Tripolitza Units.
  • The aquifer system, both shallow and deep, within fractured hard rocks, mainly associated with the Phyllites – Quartzites Unit.

The main discharge of the aquifer systems takes place in coastal and submarine brackish springs around the island, except for its northern part where the Phyllites – Quartzites Unit outcrops and its central part where springs of small capacity discharge the carbonate formations of the Pindos Unit.

Precipitation is the direct recharge of the three aforementioned aquifer systems while indirectly lateral discharge occurs in places between adjacent and tangential aquifer systems and from the streams runoff as well.

The municipal water supply of Kythira has been reinforced by a series of projects and interventions, focusing on the summer touristic period, mainly consisting of new deep boreholes and low-capacity desalination plants.

The climate crisis has led to increasingly frequent high-intensity hydro-meteorological events, particularly in summer, with heavy rainfall over short periods. Consequently:

  • Surface runoff dominates, limiting groundwater recharge.
  • Evapotranspiration increases due to high temperatures and longer daylight hours.

Taking the above into consideration, the following conclusions can be drawn regarding the water resources of Kythira:

  • The coverage of water supply needs during the summer months faces severe challenges, with frequent interruptions in water distribution.
  • Overexploitation of available water resources occurs during the summer months, due to the significant increase in population and the inability to meet water demand, as a result of the substantial tourism development in recent years.
  • During the period of maximum water demand (summer months), the available water supply is at its minimum.
  • The climate crisis has adversely affected the recharge of individual aquifers.
  • The drilling of new water-supply boreholes does not always yield the desired results, due to the area’s particular hydrogeological structure.
  • Water resources management in Kythira presents a pessimistic outlook, as the projected changes in mean seasonal and average climatic parameters are negative, indicating decreased precipitation accompanied by increased temperatures.

In conclusion, there is an urgent need to implement actions and interventions for the sustainable management of the water resources of Kythira, which, depending on local conditions, may include the following:

  • Proposals/measures for the rational management of groundwater resources at the Community level (environmental awareness, drilling of water-supply boreholes, desalination plant locations, protection zones for municipal water abstraction works, etc.).
  • Siting of small check dams along watercourses to regulate downstream flow and promote artificial recharge.
  • Siting of small reservoirs within and/or outside watercourses for the storage of winter runoff, as well as identification of locations for drilling boreholes for the implementation of artificial recharge, under specific conditions.

How to cite: Zoumbourlis, G., Filis, C., Skourtsos, E., Megalokonomou, E., Ketsetsioglou, V., and Trianti, N.: Water Resources Management in Kythira Island (Greece) under High Tourism Pressure and Climate Crisis, EGU General Assembly 2026, Vienna, Austria, 3–8 May 2026, EGU26-20903, https://doi.org/10.5194/egusphere-egu26-20903, 2026.

EGU26-22569 | Orals | HS5.1.2

Global distribution of small agricultural reservoirs and their seasonal dynamics 

Sankeerth Govindaiah Narayanaswamy, Milad Aminzadeh, Hamed Alemohammad, and Nima Shokri

Small agricultural reservoirs are a critical, yet poorly documented component of managed water storage systems, supporting irrigation and livestock water demands (Aminzadeh et al., 2025). Due to small size (often <0.1 km²) and strong temporal variability of agricultural reservoirs driven by evaporative losses and frequent withdrawals (Aminzadeh et al., 2024, 2018), they are commonly overlooked in the existing global inventories of inland water bodies. We present the first comprehensive global, seasonally resolved dataset of small agricultural reservoirs derived by integrating Sentinel-2 optical indices and Sentinel-1 radar backscatter. The product includes four seasonal layers for March 2024-February 2025 (MAM, JJA, SON, DJF). Water bodies are detected independently in optical and radar imagery using an edge-aware, locally adaptive dynamic thresholding approach. We identified more than 5 million reservoirs globally, with the highest density in China, the United States, and India. Validation against ~2,000 independently delineated reservoirs shows strong area agreement (R² = 0.92), enabling forward updates and retrospective back-casting toward a multiyear global record.

References

Aminzadeh, M., Friedrich, N., Narayanaswamy, S., Madani, K., Shokri, N., 2024. Evaporation Loss From Small Agricultural Reservoirs in a Warming Climate: An Overlooked Component of Water Accounting. Earth’s Future 12, e2023EF004050. https://doi.org/10.1029/2023EF004050

Aminzadeh, M., Lehmann, P., Or, D., 2018. Evaporation suppression and energy balance of water reservoirs covered with self-assembling floating elements. Hydrology and Earth System Sciences 22, 4015–4032. https://doi.org/10.5194/hess-22-4015-2018

Aminzadeh, M., Narayanaswamy, S., Nevermann, H., Zampieri, M., Hoteit, I., D’Odorico, P., AghaKouchak, A., Madani, K., Shokri, N., 2025. Water storage paradox of reservoir expansion and evaporative losses in the MENA region. Sci Rep 15, 34297. https://doi.org/10.1038/s41598-025-21859-w

How to cite: Govindaiah Narayanaswamy, S., Aminzadeh, M., Alemohammad, H., and Shokri, N.: Global distribution of small agricultural reservoirs and their seasonal dynamics, EGU General Assembly 2026, Vienna, Austria, 3–8 May 2026, EGU26-22569, https://doi.org/10.5194/egusphere-egu26-22569, 2026.

This study quantitatively assesses the potential impacts of the Qosh Tepa Canal (QTC) construction and water diversion from the Amu Darya River on water availability, irrigated land, and farmer employment in Kashkadarya Province, Uzbekistan. Using a proportional impact assessment framework and scenario analysis, the research projects a progressive reduction in annual water availability by over 1.2 billion cubic meters (BCM) by 2030 under a 20% diversion scenario. This water scarcity is estimated to reduce irrigated land per farmer by approximately 19% and decrease farmer employment by up to 24% by 2030. The findings highlight critical challenges for the province’s irrigation-dependent agriculture, particularly for high-water-demand crops such as cotton and wheat, and underscore the broader socio-economic risks including rural livelihood destabilization and potential forced migration. The study emphasizes the urgent need for adaptive water management policies, crop diversification, and rural livelihood support to mitigate adverse effects on the water-food-livelihood nexus in the region.

How to cite: Bamgboye, T. T., Baubekova, A., and Torabi Haghighi, A.: Impacts of the Qosh Tepa Canal on Water Availability, Irrigated Land, and Farmer Employment in Kashkadarya Province, Uzbekistan: Implications for the Water–Food–Livelihood Nexus, EGU General Assembly 2026, Vienna, Austria, 3–8 May 2026, EGU26-618, https://doi.org/10.5194/egusphere-egu26-618, 2026.

The Caspian Sea is the largest enclosed water body on Earth, and it is undergoing rapid fluctuations in water level that pose significant risks to ecosystems, infrastructure, and socio‑economic activities across its littoral states. This study integrates hydrological and atmospheric perspectives to identify the primary drivers of recent and projected sea level changes.

Long‑term hydrological records (1938–2020) from the Volga River, the dominant freshwater contributor, reveal a strong historical correlation between high runoff and increased atmospheric precipitation in its basin. However, since 2005, a marked decline in the runoff coefficient at the Verkhneye Lebyazhie hydrological station has been observed, attributable to regional warming that exceeds global temperature anomalies. This decline contributed to a 133 cm reduction in Caspian Sea level between 1977 and 2020. Importantly, while sea level changes historically mirrored Volga runoff fluctuations, since 2006 the relationship has decoupled, suggesting additional climatic drivers beyond river inflow.

To investigate these drivers, wind regime variability was analysed using Modern‑Era Retrospective analysis for Research and Applications, Version 2 (MERRA‑2) reanalysis data spanning 1980–2023. Statistical tests revealed no significant differences in average wind speed between the phase of sea level rise (1984–2004) and decline (2005–2022). However, the resultant wind speed increased by 10.3%, accompanied by a 9.5° shift in the predominant direction, indicating a reorganisation of atmospheric circulation over the basin. Comparison with the Southern Oscillation Index (SOI) and North Atlantic Oscillation (NAO) demonstrated moderate correlations, underscoring the role of global teleconnections in shaping evaporation and water balance dynamics.

As a broader context, near‑surface air temperature across the Caspian region increased by ~1.3 ± 0.5 °C since the mid‑20th century, with ERA5 showing stronger warming in the north (~1.6 °C) and peaks up to 3.0 °C in Iran’s mountainous areas. This regional warming amplifies evaporation and interacts with wind regime changes, further accelerating sea level decline.

These findings highlight that Caspian Sea level dynamics cannot be explained by river runoff alone, but are mediated through atmospheric circulation shifts and regional climate variability. By integrating hydrological records, wind regime analysis, and climate context, this study advances the scientific basis for forecasting and adaptation strategies. The results emphasise the need for coordinated climate‑hydrology assessments to anticipate future risks in the Caspian basin, where natural variability interacts with anthropogenic pressures.

How to cite: Safarov, E. and Safarov, S.: Drivers of Caspian Sea Level Decline: Volga Runoff, Wind Regime, and Climate Variability, EGU General Assembly 2026, Vienna, Austria, 3–8 May 2026, EGU26-840, https://doi.org/10.5194/egusphere-egu26-840, 2026.

EGU26-842 | ECS | Posters on site | HS5.1.3

A Water–Energy Simulation Framework for Designing PV-Based Irrigation Supply Systems Under Transboundary Basin Constrains: The case of Samarkand 

Elyor Shukurov, Farid Hamzehaghdam, Taiwo Bamgboye, and Ali Torabi Haghighi

Water-Energy-Food (WEF) nexus challenges in Central Asia are intensifying because of climate change, increasing irrigation demand, and escalating pressures in transboundary river basins. Agriculture production in the economy of Uzbekistan plays an important role in sustainable development of the nation, accounting for 25 % of the country's GDP. Although the Zarafshan river is primarily shared between Tajikistan and Uzbekistan, upstream hydropower development, seasonal flow variability, and rising temperatures are increasingly constraining water availability for agriculture in downstream regions such as Samarkand in Uzbekistan. The Samarkand region, which relies heavily on pumped irrigation for cotton and wheat production, faces acute summer water shortages and growing dependence on grid-powered and diesel base pumping systems. These challenges underscore the necessity for resilient, low-carbon irrigation energy solutions. This study introduces water-energy simulation framework to investigate the optimization of pumping capacity and reservoir storage for efficient solar PV-powered irrigation systems. Crop water requirements are estimated using the FAO Penman-Monteith method. Monthly water-energy balances are simulated for various pumping durations (6, 8, 12, 18, 24 hrs/day), reservoir capacities and pumping heads. A comparative analysis of PV and grid scenarios assesses the role of reservoir storage in mitigating solar variability, reducing required PV capacity, and determining pump sizing. In addition to the technical assessment, the study incorporates a comprehensive economic analysis including life-cycle cost (LCC), cost-benefit analysis, and environmental impact assessment based on CO2 emissions from the grid and diesel-based pumping.

The expected outcomes will identify optimal combinations of PV size, reservoir volume, and pumping discharge that minimize costs, improve energy performance, and reduce emissions. By linking system design to WEF nexus challenges in a transboundary basin, this research aims to support sustainable, energy-efficient irrigation strategies for the Samarkand region.


Keywords: Zarafshan River Basin, Transboundary water management, Water–Energy–Food Nexus, Solar-powered irrigation, Pumping–reservoir optimization, Water–energy balance, Life-cycle cost analysis, Cost–benefit ratio, CO₂ emissions, Sustainable agriculture


How to cite: Shukurov, E., Hamzehaghdam, F., Bamgboye, T., and Torabi Haghighi, A.: A Water–Energy Simulation Framework for Designing PV-Based Irrigation Supply Systems Under Transboundary Basin Constrains: The case of Samarkand, EGU General Assembly 2026, Vienna, Austria, 3–8 May 2026, EGU26-842, https://doi.org/10.5194/egusphere-egu26-842, 2026.

EGU26-917 | ECS | Posters on site | HS5.1.3

Hydrological modelling and river flow dynamics of small rivers under climate change in Kazakhstan 

Tursyn Tillakarim and Aziza Baubekova

Climate warming is rapidly reshaping high-mountain environments worldwide. Negative mass balance of glaciers across most mountain regions leads to profound shifts in regional hydrology. This fact poses particular risks for Central Asia, where up to 90% of water resources originate in the mountains and support domestic, industrial, and agricultural needs across the arid lowlands. While major transboundary rivers such as the Amu Darya, Syr Darya and Irtysh have received considerable scientific attention, much less is known about the smaller rivers, such as Ulken Almaty, Kishi Almaty, and Kaskelen, that supply water to the largest city in Kazakhstan, Almaty. The rapid rise in air temperature in the Ile Alatau Mountains is accelerating glacier melt, diminishing a critical source of runoff for the studied rivers.

Therefore, understanding how climate change affects the runoff dynamics of these small but vital freshwater sources is essential for sustainable water management in southeastern Kazakhstan. Thus, this study aims to model long-term river flow dynamics considering climatic and anthropogenic factors.

The study is based on more than a century of observational records obtained from the state hydrometeorological monitoring network. Time series analysis was performed using linear regression, the parameters of which were estimated using the least squares method, and the degree of trend severity was determined by the coefficient of determination (D). Modelling was performed using the HBV conceptual semi-distributed hydrological model. The model was calibrated using the automated GAP optimization algorithm in combination with manual parameter adjustment. The quality of the modelling was assessed using the Nash–Sutcliffe efficiency (NSE), standard deviation and PBIAS criteria, and reliability was assessed by validation over an independent period.

An analysis of long-term flow dynamics since the 1920s-30s has revealed mixed trends. The Kishi Almaty experienced a steady decline in discharge, the Ulken Almaty showed an increase in flow, while the Kaskelen had a relatively stable regime without pronounced long-term trends. It is noteworthy that during the last two decades, there has been an overall increase in runoff compared to previous periods. In this regard, the period 2000-2015 was chosen for flow modelling, which allowed climate change to be taken into account and its impact to be adequately reflected in the model parameters.

HBV modelling showed high accuracy in reproducing runoff: NSE ranged from 0.80 to 0.93, PBIAS from –0.9 to –4.7%. The model correctly reproduced the key characteristics of spring-summer floods, including the start, peak, end and duration. A comparison of modelled and observed runoff volumes showed high consistency: for Ulken Almaty, 84.6 versus 82.3 million m³, for Kishi Almaty, 53.7 versus 51.9 million m³, for Kaskelen, 132 versus 127 million m³, with a ratio of 91–95%. The validation confirmed the high efficiency of the model for the Ulken Almaty and Kaskelen rivers and satisfactory efficiency for the Kishi Almaty.

The study confirms the possibility of accurately reproducing key characteristics of flow and flood levels for taking climate change into account when planning water use and managing water resources in the region.

Key words: hydrological modeling, Climate change, Water availability, Kazakhstan

How to cite: Tillakarim, T. and Baubekova, A.: Hydrological modelling and river flow dynamics of small rivers under climate change in Kazakhstan, EGU General Assembly 2026, Vienna, Austria, 3–8 May 2026, EGU26-917, https://doi.org/10.5194/egusphere-egu26-917, 2026.

EGU26-2160 | Orals | HS5.1.3

Elevation-dependent trends in peak snowpack amount and timing illustrate emerging snow water resource changes: a case study from the Kashkadarya River, Uzbekistan 

Theodore Barnhart, Gulomjon Umirzakov, Akmal Gafurov, Darkhon Yarashev, Elena Crowley-Ornelas, Peter Steeves, and William Asquith

Mountainous regions contribute disproportionately to streamflow, particularly in arid regions such as Central Asia, and may be more susceptible to climate change with implications for downstream water resource development. The Kashkadarya is a regionally important river located in the Republic of Uzbekistan and within the Amu Darya watershed. The hydrology of the Kashkadarya is dominated by snowmelt generated from the headwaters in the western Pamir-Alai Mountains. The watershed has an elevation range of 404 m to 4,332 m and is data-scarce, particularly at high elevations, with only three of eight weather stations in the watershed above 2,000 m and no weather stations above 2,700 m.  This investigation presents a case study to understand trends and predictability in snow-water resources in the Kashkadarya watershed above Qarshi, Uzbekistan (11,344 km2). We developed a high-resolution (100 m), long-term (1950–2023, 73 water years) snow water equivalent (SWE) dataset using a physics-based snow model (SnowModel) forced with the ERA5-Land meteorology reanalysis. To improve the SnowModel simulation, local station-derived air temperature and precipitation lapse rates were used with a spatial precipitation correction grid. The spatial precipitation correction grid was generated by comparing snow persistence, the long-term average of percent snow covered days from January 1 – July 1, from an initial SnowModel simulation to observed MODIS cloud-gap-filled snow persistence. These modifications in the model improved mean Kling–Gupta Efficiency (KGE) of simulated and observed SWE time series at the three high-elevation weather stations from 0.44 (default model configuration) to 0.64 (model configuration with local lapse rates and precipitation grid correction). Watershed wide nonparametric Mann–Kendall trends in annual peak SWE amount and timing were not present; however, some decreasing mean peak SWE trends were present in 200 m elevation bands between 1,100–1,500 m (mean Sen’s slope = -0.35 cm/decade, mean p-value < 0.05). Peak SWE timing trends illustrates broader changes in the watershed with earlier mean day of water year of peak SWE from 1,300–2,900 m and 3,100–3,500 m (mean Sen’s slope = -1.62 days/decade, mean p-value < 0.05). To understand the predictability of the mountain snowpack in the watershed, first of the month mean SWE values for each elevation band will be compared to teleconnection indices (e.g., the Pacific Decadal Oscillation) and other variables (e.g., preceding precipitation and air temperature) as well as streamflow measurements in the watershed. These results suggest that while the volume of snow water resources remain stable in the high elevations of the watershed, the timing of snowmelt is shifting in the mid- to high-elevation portions of the watershed, portending changes to the melt dynamics in the most hydrologically productive areas of the watershed.

How to cite: Barnhart, T., Umirzakov, G., Gafurov, A., Yarashev, D., Crowley-Ornelas, E., Steeves, P., and Asquith, W.: Elevation-dependent trends in peak snowpack amount and timing illustrate emerging snow water resource changes: a case study from the Kashkadarya River, Uzbekistan, EGU General Assembly 2026, Vienna, Austria, 3–8 May 2026, EGU26-2160, https://doi.org/10.5194/egusphere-egu26-2160, 2026.

In many transboundary river basins, shared water resources are formally regulated through water-related agreements, laws, and regulations. These institutional documents contain diverse types of water governance rules that shape strategies and opportunities for cooperation among stakeholders. Such rules may, for example, constrain water withdrawal limits, facilitate information sharing, or coordinate collective decision-making over the development and management of shared water resources. Understanding the content of these rules and their diverse functions is therefore essential for informed policy and institutional designs in transboundary water governance.

In this study, we propose a set of rule-based indicators for assessing water governance regimes, grounded in the rule concepts of the Institutional Analysis and Development (IAD) framework. By combining these indicators with the content analysis tool of the Institutional Grammar, which enables the systematic dissection of water agreements and legislation across different formats, the proposed approach is able to use institutional rules as core analytical elements for water governance analysis. This allows for the evaluation of both the level of cooperation and the distribution of water management authority within water governance systems, and ultimately, identify the water governance modes (i.e., polycentric, centralized, or decentralized) of the basins.

We demonstrate the application of this integrated approach through a comparative analysis of four interstate river basins: the Colorado River Basin and the Delaware River Basin in the United States, the Murray–Darling Basin in Australia, and the Yellow River Basin in China. The main rivers of these subnational transboundary river basins span multiple states or provinces and are governed by extensive rule systems embedded in water agreements and legislation. The results indicate that the governance regimes of the Delaware River Basin and the Murray–Darling Basin are predominantly polycentric, the Upper Colorado River Basin exhibits a hybrid regime combining centralized and polycentric characteristics, while the Yellow River Basin is characterized by a strongly centralized governance regime.

How to cite: Lai, C. H. and Zhao, J.: Rule-Based Indicators for Assessing Water Governance Modes in Transboundary River Basins, EGU General Assembly 2026, Vienna, Austria, 3–8 May 2026, EGU26-2489, https://doi.org/10.5194/egusphere-egu26-2489, 2026.

EGU26-4761 | Orals | HS5.1.3

Multivariate Drought Risk Evolution in the Danube River Basin: A Copula-Based Analysis of Duration and Severity Across Sub-Basins 

Emilio Politti, Peter Burek, Carla Catania, Silvia Artuso, and Taher Kahil

Projected climate change in the Danube River Basin (DRB) indicates significant shifts in temperature, precipitation patterns, and hydrological cycles, with pronounced spatial and seasonal variability. Among these impacts, drought risk is projected to escalate dramatically, particularly in the southern and eastern DRB (e.g., Romania, Bulgaria, Serbia), due to synergistic effects of reduced summer precipitation, higher temperatures, and increased evapotranspiration. Existing studies, however, focus on single sub-regions of the DRB or rely on a limited number of Global Circulation Models (GCMs) and Representative Concentration Pathways (RCPs).

This study encompasses the entire DRB, divided into its Upper, Middle, and Lower sub-basins, and examines the projected evolution of meteorological drought characteristics under three RCPs, targeting the joint probability of drought duration and severity using a multivariate Copula-based framework and the Standardized Precipitation Evapotranspiration Index (SPEI) months to model the dependence structure between drought variables.

The workflow consisted of two stages: validation and projection. Initially, historical simulations from five GCMs under three RCPs were validated against the Climate Research Unit (CRU) observational dataset. The Kolmogorov-Smirnov (KS) test confirmed that all selected GCM-RCP datasets reliably reproduced the empirical cumulative distribution functions of historical drought duration and severity.

In the second stage, we contrasted a Pooled Ensemble Analysis—where all GCM events were aggregated to fit a single Copula—with a Per-GCM Analysis. The latter fitted separate Copulas for each model and used model-specific thresholds to define historical extremes. By anchoring the definition of a "100-year event" to each GCM’s historical climatology rather than a universal baseline, this method normalised inherent model biases (e.g., "wetter" vs. "drier" base states), allowing for a more accurate assessment of relative change and internal climatological shifts.

Results from the Ensemble analysis indicate a clearer signal of intensification, particularly for extreme events under high-emission scenarios (RCP 8.5). For example, historical 100-year events are projected to occur every 37 years in the Middle sub-basin and every 13 years in the Upper sub-basin. Furthermore, an analysis of "Risk Multipliers" reveals that extreme events are disproportionately affected compared to moderate events; the rarest droughts of the past are those projected to see the most dramatic increase in frequency.

However, the Per-GCM analysis exposes significant inter-model variability that the ensemble average obscures. When analysed against their own baselines, individual GCM trajectories diverge: while some models (e.g., GFDL-ESM4) depict a doubling of drought frequency, others (e.g., MRI-ESM2-0) project stability or even a decrease in frequency (wetting). This "fanning out" of projections highlights that, while the aggregate consensus points towards drying, the specific magnitude of local change remains subject to structural model uncertainty. Consequently, adaptation strategies must look beyond ensemble means and account for this wide range of plausible hydrometeorological futures.

How to cite: Politti, E., Burek, P., Catania, C., Artuso, S., and Kahil, T.: Multivariate Drought Risk Evolution in the Danube River Basin: A Copula-Based Analysis of Duration and Severity Across Sub-Basins, EGU General Assembly 2026, Vienna, Austria, 3–8 May 2026, EGU26-4761, https://doi.org/10.5194/egusphere-egu26-4761, 2026.

The Amu Darya Basin, with an estimated flow rate of 2,525 cubic meters per second, has long played a key role in supporting large-scale agriculture and economic development in Central Asia, particularly in downstream countries such as Turkmenistan and Uzbekistan. Due to the prolonged conflict, instability, institutional incompetency and exclusion from basin-wide water management provisions during the Soviet period, Afghanistan has been unable to utilize the basin’s water resources for decades, despite of being a major upstream riparian in the region. Consequently, extensive asymmetries have arisen in the distribution of development benefits resulting from the Amu Darya.

Turkmenistan annually diverts more than 13 km³ of water from the Amu Darya through the Karakum Canal, supporting wheat and cotton production. In contrast, upstream countries such as Afghanistan have not experienced similar infrastructure development due to prolonged conflict and institutional constraints, which has often led to imbalances in water use and development among the concerned states. By comparing the long-lasting role of the Karakum Canal in Turkmenistan with the more recent Qosh Tepa Canal initiative launched in 2022 in northern Afghanistan, this paper examines Afghanistan’s overdue engagement in water resources development within the Amu Darya basin. Though the canals are comparable from their scale and strategic prospects, however, their unlike development paths embody variances in terms of political support, financial capacity and historical opportunities in lieu of inequality in right or need for development. The Karakum Canal became a cornerstone of Turkmenistan’s agricultural economy under strong Soviet institutional backing, it transformed large arid land of the Karakum Desert into irrigated agricultural land, expanded cultivated land and increased agricultural output, the canal also supported settlement expansion and stabilized rural livelihoods, whereas Afghanistan’s internal instability and limited access to international support constrained similar investments for decades.  instead of framing Afghanistan’s current water use as a disruption to existing arrangements, this study emphasize on a cooperation-oriented perspective that situates the Qosh Tepa Canal as a long-overdue corrective to historical imbalance.

The paper highlights that an inclusive governance mechanism is required for the sustainable water management of the Amu Darya basin that identifies both the real development need of Afghanistan and to address the concerns of other downstream countries through negotiation, efficiency improvements and cooperation. It suggests equitable and cooperative methods and approaches that offer a logical and realistic way to ensure regional water security, economic resilience and long-term stability in Central Asia, particularly among the riparian countries.

How to cite: Hamdard, M. H. and Gohari, A.: Equity and Cooperation in the Amu Darya Basin: Afghanistan’s Delayed Path to Water Development from Karakum to Qosh Tepa: Historical Asymmetry and Cooperative Adjustment in the Amu Darya Basin., EGU General Assembly 2026, Vienna, Austria, 3–8 May 2026, EGU26-5464, https://doi.org/10.5194/egusphere-egu26-5464, 2026.

The importance of digitalization in agriculture has been steadily growing worldwide, particularly under the conditions of climate change and resource scarcity. Despite the widespread adoption of digital technologies and digital services in agricultural production, there is still limited real-time data-based evidence on the effectiveness of digital irrigation system in the global literature. To address this gap, this study aims to provide comprehensive insights into technical background, experimental methodology, and the key findings of a case study implemented in the Zarafshan River Basin, Uzbekistan. The study systematically assesses the performance of climate-responsive irrigation scheduling by examining multiple dimensions of agricultural productivity and resource-use efficiency under field conditions. More specifically, water savings, total crop productivity and crop water productivity indicators are evaluated across the four distinct treatments. The findings of the study highlight not only the efficiency gains achieved through digital irrigation advisory systems, but also the practical trade-offs between maximizing yield and minimizing water consumption under conditions of increasing water scarcity and climate change in the country. 

How to cite: Babakholov, S.: The importance of digital irrigation advisory system: evidence from Zarafshan River Basin, Uzbekistan, EGU General Assembly 2026, Vienna, Austria, 3–8 May 2026, EGU26-6901, https://doi.org/10.5194/egusphere-egu26-6901, 2026.

EGU26-7346 | Posters on site | HS5.1.3

Evidence from remote sensing: Do the transboundary basins exhibit signs of regulated water upstream and associated dangers and stress downstream? 

Sami Ghordoyee Milan, Nese Yilmaz, Mehmet Emin Sonmez, and Elsa Culler

Two major transboundary river systems in the Middle East and the Caucasus, the Tigris-Euphrates and the Kura-Aras basins, originate largely in Türkiye. Although Türkiye constitutes only a limited portion of both basins, it plays a decisive role in shaping water availability across the entire systems. These dynamics have had substantial implications for downstream countries, contributing to severe water stress in the past and potentially intensifying in the future. This issue has therefore been examined using remote sensing data, given the limited availability of ground-based information on water resources and their use in both upstream and downstream basins. Monthly precipitation, temperature vegetation dryness index (TVDI), aridity index, AET/PET, soil moisture, and groundwater storage from 2003 to 2025 were employed for this purpose. The research's findings indicate that while the downstream basins have a distinct approach to water supply and use, the upstream basins follow a similar strategy. In the Kura-Aras, in addition to precipitation and available surface water, a significant portion of the water demands has been supplied by groundwater resources, which show a sharp downward trend in all four areas studied. This has caused the AET/PET index readings to be higher than 0.5 for the majority of the year. Despite a dramatic decline in CRD and soil moisture, AET/PET values in Georgia and Turkiye have not altered much since 2017. However, the rate of groundwater storage has also increased. In contrast, the Tigris-Euphrates, although the trend of groundwater storage decline in the basin’s upper reaches occurs at a much lower slope (Sen’s slope = -2.8), the cumulative rainfall deviation in the majority of years shows a severe deficit, which supports the basin's upstream reaches' regular consumption of surface water resources. However, the AET/PET ratios are less than 0.5 in most months in Iraq, especially in the Southeast, indicating extreme water stress and scarcity. After 2010, although there have been significant swings in the groundwater level, it has consistently followed a straight linear pattern. This could be the result of political issues like a civil war, a lack of infrastructure for exploitation, or a reluctance to use groundwater to make up for the amount of water needed. The findings show that there is a difference in consumption and significant water stress in the Tigris-Euphrates watershed downstream. Although the nations downstream of the Kura–Araks have relied heavily on groundwater resources to meet their water and soil moisture requirements, this could lead to future issues and conflicts.

How to cite: Ghordoyee Milan, S., Yilmaz, N., Sonmez, M. E., and Culler, E.: Evidence from remote sensing: Do the transboundary basins exhibit signs of regulated water upstream and associated dangers and stress downstream?, EGU General Assembly 2026, Vienna, Austria, 3–8 May 2026, EGU26-7346, https://doi.org/10.5194/egusphere-egu26-7346, 2026.

EGU26-10124 | ECS | Posters on site | HS5.1.3

A Pareto-Based Simulation–Optimization Framework for Decision Support in Reservoir Cascades: A Transboundary River Basin Case Study 

Matin Rafipour-Langeroudi, Ali Moridi, and Amir Hatamkhani

Transboundary water negotiations are often constrained by limited quantitative understanding of how reservoir operating choices translate into sectoral gains and losses. This study presents a Pareto-based simulation–optimization framework to support negotiation-oriented decision-making by mapping operational and design-related trade-offs in multipurpose reservoir cascades. The framework integrates the WEAP water allocation model with a multi-objective particle swarm optimization (MOPSO) algorithm to explore combinations of reservoir storage targets, release policies, and hydropower capacities that jointly influence winter energy production and downstream irrigation supply reliability. Instead of identifying a single preferred strategy, the approach produces a Pareto front representing feasible compromise solutions between conflicting objectives. This methodology has been applied to the Vakhsh River, a primary tributary of the Amu Darya, where the ongoing development of the Rogun Dam has raised significant concerns about the future of agricultural water security in downstream countries. Application results show that operating strategies maximizing winter energy production reduce downstream irrigation reliability by approximately 40%, while prioritizing downstream supply leads to about a 50% reduction in winter hydropower generation. The shape of the Pareto front further reveals intermediary operating regions where moderate energy reductions yield disproportionately large improvements in downstream reliability, highlighting operational leverage points for negotiated agreements. By identifying compromise operating regions and quantifying system sensitivities, the proposed framework supports cooperative planning and evaluation of operational flexibility in regulated transboundary river systems.

How to cite: Rafipour-Langeroudi, M., Moridi, A., and Hatamkhani, A.: A Pareto-Based Simulation–Optimization Framework for Decision Support in Reservoir Cascades: A Transboundary River Basin Case Study, EGU General Assembly 2026, Vienna, Austria, 3–8 May 2026, EGU26-10124, https://doi.org/10.5194/egusphere-egu26-10124, 2026.

Glaciers in the Danube Basin are projected to disappear almost entirely by 2100. This study quantifies both the trajectory of glacier loss and its hydrological consequences across the basin.

The Open Global Glacier Model (OGGM) is employed, driven by downscaled and bias-corrected meteorological forcing from multiple CMIP6 General Circulation Models to simulate the evolution of 800 glaciers from the Randolph Glacier Inventory 6.0 across three SSP-RCP scenarios. Results indicate substantial glacier loss across all scenarios, with most of the glaciated area disappearing by 2060. Even under the optimistic SSP1-2.6 pathway, only a minor fraction of glacier area and volume persists through 2100.

To assess the hydrological consequences of glacier retreat, the hydrological model Community Water Model (CWatM) is used. CWatM is calibrated for the entire Danube basin at 645 discharge stations, with daily temporal and one arcminute spatial resolution, incorporating glacier runoff contributions derived from OGGM. Paired simulations are conducted with and without glacier runoff to quantify the contribution of glacier runoff to river streamflow using historical meteorological forcing (1990–2020).  Additionally, an attribution analysis is performed comparing the hydrological regime under glacier runoff with that under non-glaciated conditions in presently glaciated areas.

This study reveals the spatial and temporal patterns of glacier decline and demonstrates how glacier runoff contribution and attribution evolve along the Inn, Drau, and Danube rivers from headwaters to the river mouth, providing insights into the changing water balance of the Danube.

How to cite: Burek, P.: Attribution of glacier runoff to river streamflow in the Danube Basin, EGU General Assembly 2026, Vienna, Austria, 3–8 May 2026, EGU26-11119, https://doi.org/10.5194/egusphere-egu26-11119, 2026.

EGU26-11710 | Orals | HS5.1.3

Monitoring transboundary water systems from space: SWOT opportunities for data-scarce and politically sensitive basins 

Mohammad J. Tourian, Soheil Ettehadieh, Shuhua Yu, Peyman Saemian, Siqi Ke, Shahin Khalili, Benjmain Kitambo, Omid Elmi, and Amir AghaKouchak

Transboundary water systems under increasing water scarcity are often characterized by limited monitoring capacity and restricted data sharing, particularly in regions affected by political tensions or conflict. These limitations severely constrain the assessment of basin-wide hydrological conditions and informed water management. The Surface Water and Ocean Topography (SWOT) mission offers a step change in this context by enabling consistent, independent observations of inland surface waters across national boundaries.

SWOT provides near-global measurements of water surface elevation, river width, river slope, lake and reservoir area, and their temporal dynamics at sub-monthly sampling. Through these observations, SWOT enables the estimation of variables that have historically been poorly monitored from space, including river discharge, lake and reservoir inflow and outflow, and changes in surface water storage. This multi-variable capability is particularly valuable in transboundary basins where in-situ data are sparse, inaccessible, or politically sensitive, and where monitoring needs extend beyond rivers to lakes and reservoirs that regulate downstream flows.

As a demonstration, we highlight applications in the Amu Darya basin, one of the most critical yet least transparent river systems in Central Asia. The basin exemplifies a setting where upstream regulation, poorly monitored tributary inflows, and downstream irrigation withdrawals strongly shape the water balance, while reliable hydrological data remain limited. By combining SWOT-derived river width, water surface elevation, and surface water extent, we show how basin-scale water balance components can be inferred without reliance on shared in-situ observations. This includes diagnosing upstream regulation signals, quantifying inflows from ungauged tributaries, assessing downstream irrigation diversions, and resolving the dynamics of lake and reservoir inflow and outflow. In this way, SWOT effectively functions as an independent hydrological observing system, enabling physically consistent assessments of water availability and use across political boundaries and providing a robust evidence base for scientific analysis and dialogue in transboundary basins under increasing water scarcity.

How to cite: Tourian, M. J., Ettehadieh, S., Yu, S., Saemian, P., Ke, S., Khalili, S., Kitambo, B., Elmi, O., and AghaKouchak, A.: Monitoring transboundary water systems from space: SWOT opportunities for data-scarce and politically sensitive basins, EGU General Assembly 2026, Vienna, Austria, 3–8 May 2026, EGU26-11710, https://doi.org/10.5194/egusphere-egu26-11710, 2026.

The Middle East is situated in the desert belt of the Northern Hemisphere, where the average annual rainfall is just one-third of the global average, and evapotranspiration rates are three times higher than the global average. The average renewable water resources in the region are approximately 1,200 cubic meters per person per year, compared to the global average of around 7,000 cubic meters per person per year.

The region is experiencing one of the highest population growth rates, which has increased the demand for water resources. The area faces both physical and economic water scarcity, aggravated by mismanagement and climate change, which further strain water resources. Most climate change studies predict a drier climate for the Middle East over the next century, with reductions in precipitation of 20-30% and increases in temperature of up to 4° C, leading to less water availability for an ever-growing population.

Using regional case studies and cross-sectoral analysis, this study demonstrates how the interaction between climate variability and anthropogenic mismanagement has already resulted in environmental degradation, including accelerated groundwater depletion, widespread land subsidence, progressive soil and land degradation, shrinking surface water bodies, and a marked increase in dust storm frequency and intensity. Importantly, these impacts propagate beyond national borders, creating transboundary environmental hazards that affect regional stability, food security, and public health. The results highlight shared vulnerability hotspots and reveal common drivers across river basins and aquifer systems. Based on these findings, the study evaluates targeted adaptation scenarios, emphasizing improved groundwater governance, land and dust storm detection and mitigation, and coordinated transboundary water management as priority pathways to enhance regional resilience under a changing climate.

How to cite: Hashemi, H.: The Middle East’s Triple Treat: Drought, Dust, and Sinking Lands, EGU General Assembly 2026, Vienna, Austria, 3–8 May 2026, EGU26-12100, https://doi.org/10.5194/egusphere-egu26-12100, 2026.

EGU26-13157 | ECS | Orals | HS5.1.3

Crop Water Use and Future Irrigation Scenarios within a Safe Operating Space Framework in the Danube Basin 

Silvia Artuso, Emilio Politti, Peter Burek, Sylvia Tramberend, Mikhail Smilovic, and Taher Kahil

The Danube River Basin, spanning 19 countries and covering approximately 801,000 km², is an important agricultural region in Europe and exhibits strong spatial contrasts in water availability and use. Crop production in the basin depends on both rainfed and irrigated agriculture, with pronounced spatial diversity in crop composition, climate conditions, and water availability. Irrigation plays a critical role particularly in downstream areas, with many countries having plans or incentives to expand irrigated agriculture due to increasing drought risk under climate change. At the same time, increasing irrigation water demands may exacerbate water scarcity, alter river flow regimes, and intensify pressures on aquatic ecosystems, highlighting the need for a coordinated, basin-wide and adaptive future agricultural water management.

Building on the concept of Safe Operating Space (SOS), which aims to define sustainable limits for human pressures on Earth system processes, the Horizon Europe SOS-Water project seeks to operationalize the SOS for water resources under changing climatic and societal conditions. Within SOS-Water, agricultural water use is a key component of the coupled human–water system and is analysed using integrated modeling and stakeholders-informed future scenarios.

This proposed talk will present the application of the SOS framework in the Danube Basin, with a focus on spatially explicit crop modelling and future irrigation scenarios. Using the Community Water Model (CWatM), we simulate crop-specific water demands, seasonal dynamics, and irrigation scenarios consistent with Shared Socio-economic Pathways (SSP1-2.6, SSP3-7.0, SSP5-8.5), allowing the evaluation of irrigation expansion and efficiency improvements across the upper, middle, and lower Danube sub-basins.

The analysis will explore how crop dynamics and alternative irrigation pathways influence water demand and water availability in the Danube basin, and illustrate how the SOS approach can be used to support the assessment of sustainable water management options in transboundary regions.

How to cite: Artuso, S., Politti, E., Burek, P., Tramberend, S., Smilovic, M., and Kahil, T.: Crop Water Use and Future Irrigation Scenarios within a Safe Operating Space Framework in the Danube Basin, EGU General Assembly 2026, Vienna, Austria, 3–8 May 2026, EGU26-13157, https://doi.org/10.5194/egusphere-egu26-13157, 2026.

EGU26-13786 | Orals | HS5.1.3

An online platform for exploring the climate change impact on ecosystems and wetland restoration potential in the Danube River Basin 

Vlad Amihăesei, Sorin Cheval, Vasile Crăciunescu, Dana Micu, Mihai Adamescu, and Alexandru Dumitrescu

Climate change impact studies often use large and complex climate scenario datasets. However, these datasets are not always easily accessible or usable, especially for non-specialist users. To address address this challenge,  the Restore4Life wetland Restoration Decision Support System was developed as an online interactive platform enabling users to easily explore and visualize climate change scenarios based on CMIP6 simulations over the Danube River Basin. The platform integrates bias-corrected climate projections based on simulations from eight global climate models and an ensemble approach is applied, using the median as the central estimate and the 10th and 90th percentiles to represent model uncertainty. Users can interactively explore spatial patterns, temporal horizons, variables, and scenarios through a web-based interface, supporting both scientific analysis and climate services applications. The platform provides climate change signals for air temperature and precipitation, and several related extreme indices. Four Shared Socioeconomic Pathways are included: SSP1, SSP2, SSP3, and SSP5, covering a wide range of possible future developments.

To ensure transparency, reproducibility, and long-term accessibility, all processed datasets used on the platform are published in a standardized format and openly available through the Zenodo repository, with persistent identifiers. A key feature of the application is the interactive spatial analysis capability. The application allows analysis for several predefined areas of interest, including vulnerable ecosystems. In addition, users can draw their own areas of interest directly on the map. This enables location-specific analyses adapted to different user needs. The platform was developed using the Shiny framework and is deployed on a state-of-the-art IT infrastructure. Beyond the interactive web interface, this infrastructure provides programmatic access to all underlying datasets through standardized, cloud-optimized protocols and formats, including OGC WMS/WCS, OGC API services, STAC, Zarr, Cloud Optimized GeoTIFF (COG) and GeoParquet.

Acknowledgment 

This research was funded by the "RestoreForLife (Restoration of wetland complexes as life supporting systems in the Danube Basin)" project, under the European Union’s Horizon Europe Programme (Grant agreement No. 101112736).

How to cite: Amihăesei, V., Cheval, S., Crăciunescu, V., Micu, D., Adamescu, M., and Dumitrescu, A.: An online platform for exploring the climate change impact on ecosystems and wetland restoration potential in the Danube River Basin, EGU General Assembly 2026, Vienna, Austria, 3–8 May 2026, EGU26-13786, https://doi.org/10.5194/egusphere-egu26-13786, 2026.

EGU26-14271 | Posters on site | HS5.1.3

An Integrated Modeling Approach for Managing Transboundary Lakes 

Elmira Hassanzadeh and Daphné Lisak

Lakes are essential for ecological integrity, water supply, hydropower production, and recreation, yet they are increasingly threatened by the combined impacts of human activities and climate change. Urbanization and agriculture intensify nutrient loading, while rising temperatures accelerate biogeochemical processes that promote harmful algal blooms. At the same time, the increasing frequency and intensity of extreme precipitation events elevate the risk of flooding, posing serious threats to lakeshore communities and infrastructure. Transboundary lakes are particularly vulnerable to these compounded pressures, as their management is often fragmented across political boundaries with differing priorities, regulations, and data availability. Addressing these challenges requires integrated, forward-looking tools capable of representing both natural processes and human interventions. This study develops an integrated modeling framework that couples water quantity, water quality, and management practices to support sustainable lake management under current and future climate conditions. We focus on Lake Memphremagog (102 km²), a transboundary lake shared between Canada and the United States, which exemplifies these challenges. Using a multi-model approach, we simulate lake volume to characterize current hydrological conditions and associated uncertainties. Preliminary analyses reveal strong variability and emerging trends in hydroclimatic, hydrological, and thermal datasets. This study provides a solid foundation for impact assessments and provide a critical step toward management of transboundary lakes under changing conditions.

How to cite: Hassanzadeh, E. and Lisak, D.: An Integrated Modeling Approach for Managing Transboundary Lakes, EGU General Assembly 2026, Vienna, Austria, 3–8 May 2026, EGU26-14271, https://doi.org/10.5194/egusphere-egu26-14271, 2026.

EGU26-14487 | Posters on site | HS5.1.3

Projections of Upper Danube River discharge applying the CMIP6 climate model ensemble and a physical storyline classification 

Philipp Stanzel, Harald Kling, Fabio Lerche, Valentin Weis, and Albert Ossó

Runoff generation in the Upper Danube Basin upstream of Vienna, which can be regarded as the water tower of the Danube region, is characterized by complex interactions of glacier, snow and rainfall-driven processes. Previous studies have shown the high sensitivity of the basin’s runoff regime to climatic changes. The presented contribution is the first climate change impact study for the Upper Danube applying latest-generation CMIP6 climate model projections.

Precipitation-runoff simulations were performed with a daily hydrological model calibrated with exceptionally long observation data series (1870-2023) that allowed comprehensive evaluation of the ability to adequately simulate the basin’s hydrology under different weather and climate conditions. Climate model data for the emission scenarios SSP2-4.5 and SSP5-8.5 were bias corrected with the Scaled Distribution Mapping method. Climate change projections were analysed to inform a physical climate storylines classification based on the projected development of large-scale climatic features (jet latitude and jet speed) in the different models of the CMIP6 ensemble.

Application of the climate projections in the hydrological model yielded long-term hydrological projections for the entire 21st century. Simulated changes in the hydrological regime are presented, with a focus on low flow discharge due to its importance for river navigation. Differences to climate impact simulations with previous climate model generations are analysed, and the potential of jet-based storylines to explain the uncertainty in hydrological projections is explored.           

How to cite: Stanzel, P., Kling, H., Lerche, F., Weis, V., and Ossó, A.: Projections of Upper Danube River discharge applying the CMIP6 climate model ensemble and a physical storyline classification, EGU General Assembly 2026, Vienna, Austria, 3–8 May 2026, EGU26-14487, https://doi.org/10.5194/egusphere-egu26-14487, 2026.

EGU26-14781 | Orals | HS5.1.3

The Hydropolitical Power in the Middle East: Understanding Sovereignty Challenges Under a Changing Climate 

Yusuf Aydin, Reza Talebi, Peyman Arjomandi, Umud Shokri, Maryam Gholizadeh, Afshin Shahbazi, and Kabir Rasouli

Water in the Middle East transcends its role as a natural resource, underpinning state sovereignty, regional power, and national security. Climate change is intensifying droughts, altering precipitation, and amplifying extremes, pushing limited water resources toward crisis. This study examines how geopolitical influence increasingly aligns with the flow of rivers rather than political borders. Integrating climate variables such as temperature, precipitation, snow mass and runoff derived from CMIP6 projections (1980–2100; SSP2–4.5 and SSP5–8.5 scenarios) and ERA5 reanalysis, alongside governance indicators, water management frameworks, transboundary agreements, and scenario-based policy analysis, the study explores how climatic and institutional factors jointly shape regional resilience. In this study, we compare future climate conditions to a baseline period (1980–2014). The future periods considered are 2021–2050, 2051–2080, and 2081–2100. The results indicate a persistent snow drought beginning in the early 2000s, marked by reduced snowpack despite normal or above-average precipitation. Rising temperatures have increasingly shifted snowfall to rainfall during the baseline period, and this trend is projected to intensify across future warming periods. This shift diminishes seasonal snow storage, the region’s key natural water reservoir, weakening spring and summer river discharge. The resulting decline in snow mass threatens irrigation, hydropower, and urban water supplies while heightening transboundary tensions. By linking physical climate modeling with governance perspectives, the study demonstrates that water management and adaptive policy responses will determine future stability and cooperation in the region. Ultimately, the findings underscore that in a warming Middle East, control over water resources and mitigation strategies not territory will define geopolitical power and resilience.

Focusing on Iran’s transboundary basins, the Helmand and Harirrud in the east, the Tigris–Euphrates in the west, and the Aras in the northwest, this study shows how climate variability, snow drought, and upstream interventions have reshaped ecological and political relations. In the Helmand Basin, upstream dam construction in Afghanistan and prolonged droughts have reduced Iran’s downstream flows to a fraction of treaty levels, desiccating the Hamun wetlands and fueling border tensions over the past two decades. In western Iran, climate change and large-scale water projects have degraded both water quality and quantity, transforming scarcity into a source of protest and instability in recent years. Similarly, industrial pollution in the Aras River has turned a formerly cooperative basin into an arena of environmental and diplomatic friction. Looking ahead, future droughts are projected to intensify hydropolitical tensions, aggravating ecological degradation, inequality, and unrest especially in border regions of the Middle East countries such as Khuzestan, Kurdistan, Sistan and Baluchestan provinces of Iran. As water insecurity deepens, two conflict pathways emerge: scarcity-driven social instability and the strategic use of water as a tool of power. The findings highlight a growing hydropolitical security complex, where hydrological interdependence, rather than territory, defines sovereignty, stability, and regional influence in a warming Middle East.

How to cite: Aydin, Y., Talebi, R., Arjomandi, P., Shokri, U., Gholizadeh, M., Shahbazi, A., and Rasouli, K.: The Hydropolitical Power in the Middle East: Understanding Sovereignty Challenges Under a Changing Climate, EGU General Assembly 2026, Vienna, Austria, 3–8 May 2026, EGU26-14781, https://doi.org/10.5194/egusphere-egu26-14781, 2026.

Glacial lakes formed during glacier retreat temporarily preserve meltwater and mitigate water resource pressure, dependent on ice reserves. However, this effect is transient, and regions relying on glacial meltwater may face future water scarcity. Due to the unique characteristics of maritime glaciers, glaciers in southeastern Tibet are experiencing the most significant mass loss on Earth—approximately three times the average rate across the Tibetan Plateau—exerting profound impacts on regional water resources. Understanding glacial lake evolution and mass balance in this region is therefore critical for developing early warning systems, mitigating glacial lake outburst flood risks, and safeguarding water resources.

Existing glacial lake studies primarily focus on monitoring area changes, while direct depth and volume observations remain extremely scarce due to challenging field conditions. Traditional empirical area-volume formulas inadequately capture morphological, topographic, and hydrological variations across lake types, resulting in significant estimation errors. Although ICESat-2 possesses shallow-water bathymetry capabilities, its application faces challenges, including limited single-beam coverage, significant basin information gaps, and constraints imposed by beam spacing, cloud cover, and variable turbidity.

This study systematically integrates ICESat-2 single-beam photon data with multi-source remote sensing and topographic-meteorological data, proposing a comprehensive framework progressing from "single laser profiles" to "three-dimensional basin reconstruction" and ultimately to "regional-scale glacial lake volume estimation." Based on ICESat-2 ATL03 geolocated photon data, we established a rigorous filtering workflow that combines quality flags, confidence constraints, and interactive manual selection to eliminate noise while retaining reliable bathymetric information. We developed a novel three-dimensional basin reconstruction model that optimizes bathymetry point distribution via mirror symmetry and contour-shrinkage mechanisms, with quadratic spline interpolation constraining the deepest point and radial basis functions enabling continuous terrain reconstruction.

Model validation using unmanned boat sonar measurements across multiple glacial lakes demonstrates that the proposed method stably reproduces bowl-shaped topographic features, with volume reconstruction errors generally below 10% and only 2% variation across different lake-bottom center assumptions, confirming robustness under complex observational conditions.

By integrating in-situ observations with ICESat-2 reconstructions, we constructed a high-quality dataset of 611 samples that incorporates lake morphology, topography, hydrology, and meteorology. Using Isolation Forest filtering and the XGBoost algorithm with optimized hyperparameters and recursive feature elimination, the model significantly outperforms traditional empirical formulas, achieving an R² of 0.911 for small and medium-small glacial lakes. SHAP analysis revealed lake area as the most critical variable, with lakeshore slope, shape regularity, and regional precipitation exerting significant regulatory effects. Monte Carlo uncertainty analysis demonstrates over 88% coverage of actual volumes within 95% confidence intervals with significantly lower bias than existing methods.

This study achieves a methodological breakthrough from ICESat-2 single-beam bathymetry to three-dimensional basin reconstruction, establishing a high-precision regional-scale estimation model. It provides a scalable technical framework for glacial lake hazard assessment, water resource monitoring, and the development of early warning systems in high-mountain regions.

How to cite: wu, R.: Integrating ICESat-2 Lidar and Machine Learning for High-Precision Glacial Lake Volume Estimation in Southeastern Tibet Plateau , EGU General Assembly 2026, Vienna, Austria, 3–8 May 2026, EGU26-15226, https://doi.org/10.5194/egusphere-egu26-15226, 2026.

EGU26-16080 | ECS | Orals | HS5.1.3

Resilience and Adaptation of the Communities in the Aral Sea Basin 

Aliya Assubayeva, Symbat Ibadulla, Zulfiya Kannazarova, and Stefanos Xenarios

The desiccation of the Aral Sea—driven by the large-scale diversion of the Amu Darya and Syr Darya rivers for irrigated cotton production, which began during the Soviet era—remains one of the world’s most significant human-caused environmental disasters. While the hydrological, ecological, and geopolitical dimensions of the crisis are well documented, comparatively little is known about how communities that continue to live in the most degraded parts of the basin adapt, persist, and envision their futures, particularly in rural settlements. Through a mixed-methods, exploratory comparative design, we examine community-level resilience and adaptation on both sides of the former shoreline. Fieldwork was conducted in settlements surrounding the remaining bodies of water in Kazakhstan (North Aral region) and Karakalpakstan in Uzbekistan (South Aral region). This research combined structured household surveys, semi-structured interviews, and field observations. Guided by a social-ecological systems framework, we analyze how environmental change intersects with socioeconomic conditions, governance arrangements, and historical legacies to shape adaptation options.

Our results identify multiple interacting stressors and distinguish chronic pressures from episodic shocks. Across sites, decisions to remain are influenced by place attachment, limited mobility, and family and community obligations. Social capital, especially kinship networks and informal mutual aid, emerges as a key foundation of persistence; however, it is insufficient without institutional and economic support. We observe differentiated adaptation pathways across the basin. Communities in Kazakhstan report incremental improvements associated with the ecological recovery following the construction of the Kok-Aral Dike. In contrast, communities in Karakalpakstan face structural constraints that limit incremental adaptation and increase the need for transformative interventions, including livelihood diversification and inclusive governance. By documenting how resilience emerges under persistent socio-ecological stress, this study provides empirical insights for climate adaptation and water governance in arid and semi-arid regions.

How to cite: Assubayeva, A., Ibadulla, S., Kannazarova, Z., and Xenarios, S.: Resilience and Adaptation of the Communities in the Aral Sea Basin, EGU General Assembly 2026, Vienna, Austria, 3–8 May 2026, EGU26-16080, https://doi.org/10.5194/egusphere-egu26-16080, 2026.

EGU26-16786 | ECS | Orals | HS5.1.3

New Level-3 datasets demonstrate that robust field-level groundwater use accounting is possible at continental scales: what is next for transboundary aquifer governance? 

Elizabeth Carter, Clay Caldwell, Yun Yang, Joseph Kennedy, Cella Schnabel, Vivek Srikrishnan, Christopher Hain, and Martha Anderson

According to the UN Valuing Water Initiative, accurate measurement of water resources is critical to valuation, decision making, and governance. Rotary drilling and submersible pump technologies, which proliferated in the 1950s-1970s, facilitated rapid and widespread development of global groundwater reserves. Currently, 25% of global water use is from groundwater, trending towards 100% in arid regions, and 75% of this groundwater is used for agriculture. Because it is difficult to measure, regulation of groundwater use is sparse and underenforced, and international treaties governing use of groundwater are virtually non-existent. Given the promise of spatial ubiquity in satellite observations, the hydrologic remote sensing research community has made tremendous progress in the measurement of hydrologic fluxes that are aliased by sparse in-situ networks. Two promising data derivatives—mainly energy-balance actual evapotranspiration derived from radiometric surface temperature and surface displacement associated with groundwater extraction from interferometric synthetic aperture radar—have fundamentally changed our understanding of how anthropogenic groundwater use in particular is modifying the hydrosphere, and enable estimates of relative groundwater extraction rates at the well/farm scale. Due to the high computational costs and technical complexity associated with processing these datasets, particularly at the spatial scales required for national to transboundary water accounting, their use in operational water management has been limited.

Two operational datasets published in the United States this year allow for both large and small-scale accounting of agricultural groundwater use: the OpenET project DisALEXI dataset, and the OPERA project’s Sentinel 1 interferometric LOS displacement dataset. We demonstrate how independent error sources in these two datasets assist with uncertainty characterization, and benchmark their performance against GRACE observations of total water storage flux. We demonstrate how they allow us to estimate both regional (aquifer to nation-level) and local (field and well-level) groundwater use. We focus our analysis on 34 aquifers that span the United States/Mexico border, where a deepening water crisis is playing out in the absence of international agreements on transboundary aquifer use. We use this case study to demonstrate how investment in production of Level-3 datasets from entire satellite archives can enable international collaboration on natural resource development.

How to cite: Carter, E., Caldwell, C., Yang, Y., Kennedy, J., Schnabel, C., Srikrishnan, V., Hain, C., and Anderson, M.: New Level-3 datasets demonstrate that robust field-level groundwater use accounting is possible at continental scales: what is next for transboundary aquifer governance?, EGU General Assembly 2026, Vienna, Austria, 3–8 May 2026, EGU26-16786, https://doi.org/10.5194/egusphere-egu26-16786, 2026.

EGU26-18173 | ECS | Orals | HS5.1.3

Evolving Hydroclimate of Indus River Basin Exposes Asymmetric Transboundary Risks 

Urmin Vegad and Vimal Mishra

The Indus River Basin (IRB) is a vital transboundary system in South Asia that sustains one of the world’s largest irrigation networks. IRB supports extensive agricultural and socio-economic activities for over 300 million people across India and Pakistan. The Indus Waters Treaty, signed in 1960 with mediation by the World Bank, established a legal framework for allocating the Indus River water between India and Pakistan. The treaty allocated the three western rivers to Pakistan and the three eastern rivers to India. It is widely regarded as a successful model for transboundary water sharing. However, the treaty was designed under mid-20th-century hydro-climatic and geopolitical conditions that differ significantly from present-day conditions. Despite substantial changes in the Indus River Basin since the treaty’s formation, there remains a limited understanding of how climate-driven shifts have altered hydrological conditions across the two countries. In this study, we examine changes in precipitation, groundwater availability, reservoir inflows, and contributions from snow and glacier melt to the total inflow. Our results reveal a persistent drying trend in the Chenab, Ravi and Sutlej basins, with more than 16% decline in precipitation, while the western basins remain largely stable. Sharp groundwater declines exceeding 10 meters in the Sutlej and Ravi basins highlight the unsustainable dependence on groundwater. We also observe a significant reduction in annual inflow to several major Indian reservoirs, indicating a shift toward greater hydroclimatic variability. Overall, declining storage trends in major Indian dams, altered inflow regimes, intensifying climatic stressors, and evolving meltwater dynamics underscore the need to re-evaluate the existing water-sharing framework to ensure long-term sustainability.

How to cite: Vegad, U. and Mishra, V.: Evolving Hydroclimate of Indus River Basin Exposes Asymmetric Transboundary Risks, EGU General Assembly 2026, Vienna, Austria, 3–8 May 2026, EGU26-18173, https://doi.org/10.5194/egusphere-egu26-18173, 2026.

EGU26-18265 | Posters on site | HS5.1.3

Morava–Dyje floodplain forests: A comprehensive analysis of climate-driven changes in current and future water balance 

Petr Pavlik, Adam Vizina, Adam Beran, and Barbora Krijt

The confluence of the Dyje (Thaya) and Morava rivers hosts one of the largest floodplain forest complexes in the Danube basin (~15,000 ha). This area has been intensively studied over past decades, and its ecological importance was further recognised by the designation of a UNESCO Biosphere Reserve and the establishment of a protected landscape area in 2025. The vitality and resilience of the forests as a system are closely linked to water availability in the Dyje headwater catchments, as well as to water management at the Nové Mlýny reservoir system. These shallow reservoirs, located upstream, play a key role in controlled flooding and groundwater replenishment within the floodplain.

This contribution builds upon our previous research conducted across the broader Dyje RB, which identified a statistically significant decreasing trend in annual runoff and a concurrent increasing trend in actual evapotranspiration over the period 1980–2020. No significant long-term change in total annual precipitation was detected. Instead, changes in runoff were primarily attributed to rising air temperatures, altered snow accumulation and melt dynamics, and a shift in seasonal water availability. In particular, reduced snow storage and earlier snowmelt during winter, combined with increased temperatures in spring (MAM) and autumn (SON), resulted in a prolongation of the vegetation period. This extended growing season was identified as a major driver of increased evapotranspiration and, consequently, declining runoff.

To better constrain evapotranspiration as the dominant outgoing flux of the basin water balance, additional monitoring was conducted on neighbouring water bodies. A custom floating evaporimeter platform was equipped with Li-COR Li-710 infrared gas analysers, custom (Class A derived) evaporation pans, and meteorological stations. The model input meteorological variables were derived from a gridded high resolution national data set (~500 m) and accompanied with bore hole water level measurements at eight locations. Climate change scenarios were derived using the Advanced Delta Change (ADC) method, which modifies observed time series such that changes in the mean and variability correspond to those simulated by climate models. At the daily time step, ADC explicitly accounts for changes in variability, allowing extremes to evolve differently from average conditions. For precipitation, the method also corrects systematic model biases, whereas temperature is adjusted linearly, ensuring consistency in projected warming signals. A representative ensemble of global climate models (GCMs) was used to propagate climate uncertainty into hydrological projections.

A spatially distributed multimodel framework of varying complexity and process representation was developed to assess hydrological response under present and future climate conditions. Building on this framework, a numerical groundwater flow model has been developed in MODFLOW in order to get a detailed representation of hydraulic conditions and interactions between surface water and groundwater. The modeling framework is designed to allow subsequent coupling with heat transport and solute transport modules in the future, enabling comprehensive assessments of thermal dynamics and contaminant migration and their impacts on the hydrological system and associated ecosystems.

Acknowledgement: This study was supported by the DALIA project n. 101094070, under the call HORIZON-MISS-2021-OCEAN-02 funded by the European Union.


How to cite: Pavlik, P., Vizina, A., Beran, A., and Krijt, B.: Morava–Dyje floodplain forests: A comprehensive analysis of climate-driven changes in current and future water balance, EGU General Assembly 2026, Vienna, Austria, 3–8 May 2026, EGU26-18265, https://doi.org/10.5194/egusphere-egu26-18265, 2026.

EGU26-18747 | Orals | HS5.1.3

Climate Change–Driven Hydrological Extremes and Indirect Impacts on Socio-Economic Vulnerability and Resilience in the Danube Basin 

Mihai Adamescu, Sorin Cheval, Alexandru Dumitrescu, Vlad Amihaesei, Relu Giuca, Tudor Racoviceanu, Vasile Craciunescu, Paul Bowyer, Constantin Cazacu, Serban Danielescu, and Oliver Bothe

Climate change impacts on human systems increasingly emerge through hydrological extremes that generate complex socio-economic vulnerabilities across sectors. However, traditional risk assessments often emphasize physical hazards rather than how climate-driven hydrological changes cascade through ecosystem services to affect livelihoods, infrastructure, and adaptive capacity. To translate climatic scenarios into river discharge projections for the Lower Danube, we employed the Europe-HYPE (E-HYPE) hydrological model. This semi-distributed, process-based model simulates water balance components and river flow across hydrological response units. E-HYPE has been configured for pan-European applications and evaluated against observed flows across multiple basins. For the historical reference period (1971–2000), we used the HYPE reanalysis dataset at the Brăila gauge to characterise the baseline hydrological regime. Daily meteorological forcings in the reanalysis reflect observed and interpolated inputs that drive hydrological processes (e.g., rainfall, temperature). For future discharge projections (2001–2100), we constructed an E-HYPE ensemble of eight members by forcing the model with bias-adjusted meteorological inputs derived from multiple regional climate models under two Representative Concentration Pathways (RCP4.5 and RCP8.5). These forcings provide consistent daily temperature and precipitation inputs that reflect alternative greenhouse gas concentration trajectories through to 2100. The ensemble captures structural and forcing uncertainty in the projected hydrological response.

IWe used a hydrological impact dataset providing water-related Essential Climate Variables (ECVs) and Climate Impact Indicators (CIIs), derived from bias-adjusted regional climate simulations from the EURO-CORDEX. The dataset includes daily mean river discharge produced using a multi-model hydrological setup based on the E-HYPEcatch model at a pan-European scale, available at the catchment level and on a 5 km × 5 km grid. We have extracted the simulated daily discharge at the Brăila station, for two climate scenarios (RCP4.5 and RCP8.5) and then was analysed across near-term (2021–2050), mid-century (2051–2080), and late-century (2081–2100) horizons to evaluate changes in the frequency and magnitude of hydrological extremes (e.g., >10 000 m³/s and >15 000 m³/s for floods; <3 000 m³/s for low flows) and seasonality patterns relative to the historical baseline (1971-2006). Sectoral context for interpretation was drawn from ICPDR, UNECE, and national data for the Lower Danube / Brăila region. Results show that climate change amplifies hydrological variability rather than uniformly shifting mean discharge. By mid-century, the frequency of high-flow events (>10 000 m³/s) increases by ~50 – 75 %, and extreme floods (>15 000 m³/s), historically rare, become recurrent under both scenarios. Concurrently, exposure to navigation-critical low flows (<3 000 m³/s) rises substantially, with up to ~80 days per year below this threshold by the late century under RCP8.5. Seasonal reorganisations are pronounced: flood peaks shift toward winter, while critical low flows concentrate in summer and early autumn.

Interpreted through an ecosystem services and socio-economic vulnerability framework, these hydrological changes weaken regulating services (natural flood mitigation), strain supporting services (habitat integrity and resilience), and constrain provisioning services such as water for agriculture and inland navigation. The co-occurrence of altered extremes and seasonality underscores cascading risks that extend beyond physical hazard zones, affecting agricultural productivity, transport reliability, and community adaptive capacity.

How to cite: Adamescu, M., Cheval, S., Dumitrescu, A., Amihaesei, V., Giuca, R., Racoviceanu, T., Craciunescu, V., Bowyer, P., Cazacu, C., Danielescu, S., and Bothe, O.: Climate Change–Driven Hydrological Extremes and Indirect Impacts on Socio-Economic Vulnerability and Resilience in the Danube Basin, EGU General Assembly 2026, Vienna, Austria, 3–8 May 2026, EGU26-18747, https://doi.org/10.5194/egusphere-egu26-18747, 2026.

EGU26-18757 | ECS | Posters on site | HS5.1.3

Scenario Modelling of Future Water Balance in a Transboundary Basin: Potential and Limitations from the Tisa Pilot Basin within the Danube Water Balance Project 

Máté György, Bence Decsi, Tamás Ács, Zsolt Kozma, Máté Chappon, and Peter Burek

The Danube Water Balance project was launched with the objective to improve harmonized data management, to develop a joint water balance calculation methodology for the entire Danube River Basin and to foster the common acceptance of the elaborated modelling framework.

In this study, we demonstrate the advantages of the CWatM model by presenting its water balance calculation capabilities for the Tisa River Basin (TRB), the largest tributary catchment of the Danube. In addition to the standard model setup steps, a scenario evaluation will be presented for future climate change scenarios. The TRB offers several modelling challenges as it is a transboundary catchment with mountainous and lowland areas, strong groundwater influence and complex water management solutions in the alluvial plains.

Data availability posed a limitation for the study site. While global OA data on elevation, land use, soil, and meteorology was adequate, local information on water management was scattered thematically and regionally. Calibration-validation resulted in acceptable performance for river discharge (validation KGE ranging from 0.18 to 0.88 with a median of 0.64). Gridded precipitation data from seven databases were used to check model sensitivity on the biases of meteorological forcing.

Scenario analyses were performed with a two-fold focus: (i) a comprehensive climate impact assessment involving 11 climate models (ensemble) and three SSP pathways and (ii) demonstration-oriented scenarios were simulated to verify the CWatM model's capabilities to represent surface-subsurface water balance components under future climate and changing water demands. Simulations were evaluated with respect to changes in discharge characteristics as well as storage changes.

We also present the future steps planned for the project to develop the modelling framework as a suitable tool to answer water balance-related questions across the Danube Region.

This work was supported as part of DANUBE WATER BALANCE, an Interreg Danube Region Programme project co-funded by the European Union.

How to cite: György, M., Decsi, B., Ács, T., Kozma, Z., Chappon, M., and Burek, P.: Scenario Modelling of Future Water Balance in a Transboundary Basin: Potential and Limitations from the Tisa Pilot Basin within the Danube Water Balance Project, EGU General Assembly 2026, Vienna, Austria, 3–8 May 2026, EGU26-18757, https://doi.org/10.5194/egusphere-egu26-18757, 2026.

Water has long been a strategic resource in the semi-arid landscapes of Mesopotamia, a region spanning Turkey, Syria, and Iraq, where the Tigris and Euphrates rivers form the lifeline of societies. As water scarcity intensifies due to a combination of climatic stressors and anthropogenic pressures, the governance of transboundary rivers has become critical for ensuring health, food security, and regional stability. The stakes are particularly high in this basin, where upstream–downstream asymmetries shape political relations and exacerbate vulnerabilities.

The long-standing dispute between Turkey, the upstream hegemon, and Syria, a downstream user, has deepened in the past decade with the emergence of a de facto Kurdish administration in northern and eastern Syria along Turkey’s southern border. This political reality adds complexity to water governance, intersecting with security concerns and competing narratives of resource control. Despite the centrality of water in these dynamics, empirical verification of water availability and flow remains limited. Data scarcity, driven by sparse in-situ measurements and restricted access to hydrological information, hampers assessment of scarcity and its implications for conflict and cooperation.

Against this backdrop, this study examines whether upstream reservoir dynamics at the Atatürk Dam in Turkey are reflected in storage variations at the downstream Tishrin reservoir in Syria, and whether these hydrologic changes are accompanied by detectable signals in agricultural activity. We compiled multi-year satellite-derived time series for both reservoirs and nearby agricultural zones, including reservoir surface water level, precipitation, temperature, evapotranspiration, soil moisture, and NDVI-based vegetation activity. Variables were harmonized to a common monthly scale and prepared for anomaly-based analysis to reduce seasonal confounding.

A qualitative review of the time series indicates baseline hydroclimatic contrasts between the two study regions. Precipitation, soil moisture, and baseline NDVI appear lower in the Tishrin-side agricultural area than in the Atatürk-side agricultural area, suggesting a more water-limited system and greater sensitivity to variability in water availability. These background differences provide context for downstream vulnerability but do not explain the temporal structure of reservoir storage fluctuations and associated vegetation anomalies. The reservoir and vegetation time series suggest downstream dynamics are constrained within a lower-productivity envelope, consistent with stronger exposure to moisture stress and limits in irrigation reliability.

To move from qualitative evidence to attribution, we test whether upstream and downstream reservoir dynamics are coupled once hydroclimatic controls are considered. We use time-series comparison and statistical controls to separate signals linked to reservoir operations from those attributable to regional climate variability, drawing on precipitation, temperature, evapotranspiration, and soil moisture as contextual drivers. We then investigate whether vegetation activity across surrounding agricultural areas covaries with local reservoir conditions and hydroclimatic stress, using NDVI anomalies as an integrated measure of crop response. Finally, land use/land cover trajectories will be evaluated to place short-term variability in a longer-term landscape context, with mapping consistency to ensure apparent shifts in cultivation are not conflated with classification artifacts. This integrated satellite-based framework offers a robust, adaptable basis for evaluating transboundary water-management influences on downstream storage and agricultural conditions in a politically complex setting.

How to cite: Khodaei, B., Dinc, P., and Hamza, M.: Satellite-based assessment of upstream regulation impacts on downstream reservoir dynamics and agricultural activity between the Turkey and Syria , EGU General Assembly 2026, Vienna, Austria, 3–8 May 2026, EGU26-20274, https://doi.org/10.5194/egusphere-egu26-20274, 2026.

EGU26-20479 | ECS | Orals | HS5.1.3

Projected Hydrological Changes and Trends in the Romanian district of the Lower Danube River Basin under Climate Change 

Andrei Radu, Peter Burek, Marius Mătreață, and Viorel Chendeș

The Danube River Basin is one of the most complex hydrological systems in the world, collecting waters from 19 countries and covering an area of over 800,000 km². In the context of ongoing climate change, the Danube River faces increasing challenges in achieving effective water resource management.

Projected hydrological changes and trends in the Lower Danube River Basin were assessed using simulated river discharge for 1985–2100, forced by downscaled and bias-corrected meteorological inputs derived from 11 General Circulation Models (GCMs) within the ISIMIP3b (5 models) and RESTORE4LIFE (6 models) datasets. The reference period was selected as 1985–2014, consistent with the CMIP6 historical simulations. The projected periods are 2031–2060 (mid-century) and 2071–2100 (late-century), simulated using the CMIP6 climate change scenarios SSP2–4.5 (Middle of the Road) and SSP5-8.5 (Fossil-fuelled development). Within the framework of the Danube Water Balance project, a hydrological water balance model is being developed for the entire Danube River Basin, using the Community Water Model (CWatM), which was specifically configured, calibrated, and validated for this basin.

This study focuses on the major tributaries draining Romanian territory that contribute to the flow regime of the Lower Danube River. The results indicate significant changes and decreasing trends in discharges of the analysed rivers, particularly under SSP5–8.5. Under SSP2–4.5, generally a stationary trendline has been highlighted. However, inter-model spread across the 11 GCMs combined with the SSP–RCP scenarios contributes to notable uncertainty in the projections. Additionally, significant differences are observed among the analysed river basins regarding how future discharge will evolve.

Understanding how river discharge may evolve in the future could support the timely implementation of measures and policies for the sustainable management of the analysed Danube tributaries and the Lower Danube River as a whole.

Acknowledgment 
This work/paper was supported as part of DANUBE WATER BALANCE – DRP0200156, an Interreg Danube Region Programme project co-funded by the European Union.

How to cite: Radu, A., Burek, P., Mătreață, M., and Chendeș, V.: Projected Hydrological Changes and Trends in the Romanian district of the Lower Danube River Basin under Climate Change, EGU General Assembly 2026, Vienna, Austria, 3–8 May 2026, EGU26-20479, https://doi.org/10.5194/egusphere-egu26-20479, 2026.

EGU26-21881 | Orals | HS5.1.3

Federal Governance Frameworks and Cooperative Mechanisms for Inter-State Water Sharing in India 

Sunil Kumar, Bhagu Ram Chahar, and Chandrika Thulaseedharan Dhanya

Inter-State water sharing in India presents a complex governance challenge, as all river basins are shared by two or more states and are increasingly stressed by population growth, economic development, and climate-induced hydrological variability. In India’s federal system, water is constitutionally assigned primarily to the states. Effective management of shared rivers therefore requires governance arrangements that balance regional autonomy with national coordination and promote cooperation among riparian states.

India’s inter-State water governance is rooted in a layered constitutional, legal, and institutional framework. The normative foundations lie in the values of justice, equality, fraternity, and unity embedded in the Constitution, which collectively shape the ethos of cooperative federalism in shared water management. These values provide an ethical basis for equitable participation, mutual trust, and national cohesion in decision-making related to inter-State rivers.

Legislative competence over water is distributed under Article 246 and the Seventh Schedule of the Constitution. States exercise authority over intra-State water resources, while the Union government is empowered under Entry 56 of the Union List to regulate and develop inter-State rivers in the public interest. This dual allocation of powers creates a structured interdependence, often described as water federalism, enabling coordination across jurisdictions but also generating institutional tensions and competing claims among basin states.

To address these tensions, specialized constitutional and statutory mechanisms have been established. Article 262 and the Inter-State River Water Disputes Act, 1956 provide a tribunal-based framework for adjudicating disputes related to the use, distribution, and control of shared river waters. Judicial support provisions under Articles 131, 136, and 143 allow limited constitutional oversight, reinforcing legal coherence and legitimacy while preserving the distinct nature of inter-State water adjudication. In parallel, the River Boards Act, 1956 envisages basin-level institutions for coordinated planning and development, reflecting early recognition of the need for integrated river basin management, even though such institutions have seen limited practical implementation.

Despite the existence of this comprehensive framework, inter-State water governance in India has largely remained adjudication-driven, with cooperative mechanisms playing a secondary role. Limited operationalization of basin-level institutions, fragmented data and information sharing, and the episodic nature of inter-State engagement have constrained the effectiveness of cooperative federalism. These limitations are further amplified under conditions of hydrological uncertainty and increasing climatic variability, which demand adaptive and forward-looking governance arrangements.

Strengthening inter-State water sharing requires a shift from predominantly adversarial dispute resolution towards continuous, basin-scale cooperation. Greater emphasis on institutionalized coordination, transparent data sharing, and adaptive planning mechanisms can enhance trust among riparian states and improve the resilience of governance systems. India’s experience offers broader insights for multi-level governance systems globally, illustrating how the alignment of constitutional values, federal competencies, and cooperative institutions is central to transforming shared rivers from sources of inter-jurisdictional conflict into foundations for sustainable and equitable water management.

How to cite: Kumar, S., Chahar, B. R., and Dhanya, C. T.: Federal Governance Frameworks and Cooperative Mechanisms for Inter-State Water Sharing in India, EGU General Assembly 2026, Vienna, Austria, 3–8 May 2026, EGU26-21881, https://doi.org/10.5194/egusphere-egu26-21881, 2026.

EGU26-22296 | Orals | HS5.1.3 | Highlight

Digitalisation and Earth Observation for Sustainable Water Security and Transboundary Diplomacy in Central Asia 

Ben Jarihani, Abdulkhakim Salokhiddinov, Michael Brody, Gulomjon Umirzakov, Doniyor Turgunov, and Komiljon Rakhmonov

Water security across Central Asia is increasingly threatened by climate variability, ageing irrigation infrastructure, rapid demographic change, and complex transboundary water-sharing arrangements. Digitalisation combined with advanced Earth Observation (EO) technologies provides a critical pathway for improving transparency, strengthening regional cooperation, and supporting sustainable basin-scale water management. In this study, we demonstrate an integrated digital–EO framework for monitoring water availability and evaluating hydrological dynamics across the Syr Darya and Amu Darya basins. Using multi-source datasets—including CHIRPS and GPM precipitation, MODIS and SSEBop evapotranspiration, and GRACE/GRACE-FO total water storage anomalies—processed within the Google Earth Engine environment, we quantify seasonal and interannual variability in catchment-scale water balance components. The analysis highlights significant hydrological fluctuations driven by climate and upstream water-use pressures, underscoring the need for adaptive and data-driven management approaches.

We further discuss how the combination of remote sensing, machine learning analytics, and emerging IoT-based monitoring systems can enhance the digital transformation of water governance in Central Asia. These tools support more equitable data sharing, reduce uncertainty in transboundary negotiations, and provide a technical foundation for strengthening water diplomacy between riparian states. The study concludes with recommendations on operationalising EO‑based digital platforms to improve transparency, build trust, and advance long-term water security and cooperative river-basin governance in the region.

How to cite: Jarihani, B., Salokhiddinov, A., Brody, M., Umirzakov, G., Turgunov, D., and Rakhmonov, K.: Digitalisation and Earth Observation for Sustainable Water Security and Transboundary Diplomacy in Central Asia, EGU General Assembly 2026, Vienna, Austria, 3–8 May 2026, EGU26-22296, https://doi.org/10.5194/egusphere-egu26-22296, 2026.

EGU26-22543 | Orals | HS5.1.3

Assessment of Springs as Rural Water Resources in Southwest Kyrgyzstan 

Alan Fryar, Sagynbek Orunbaev, Gulnaz Jalilova, Baktyiar Asanov, and Karen Rignall

Southwest Kyrgyzstan is one of the most socioeconomically disadvantaged and environmentally sensitive regions of the country, characterized by water scarcity, aging irrigation infrastructure, land degradation, and increasing climate change impacts. These problems have been compounded by transboundary water disputes with Uzbekistan and Tajikistan in the Fergana valley. Springs occur across southwest Kyrgyzstan, particularly in karstified limestone, but information on their hydrology and utilization as water resources is lacking. During 2025, we measured field water-quality parameters (pH, electrical conductivity, temperature, dissolved O2, turbidity) at 54 springs, primarily in Batken province. We sampled 23 springs for analyses of metals, anions, nutrients, and stable isotopes of water (δ2H and δ¹⁸O), and we deployed pressure and temperature loggers at 3 springs. We assessed local water use through a random sampling household survey with 154 respondents and semi-structured key informant interviews. Chemical quality of the studied springs is generally good. Solute concentrations were less than WHO guidelines in all but 2 instances (NO3 at one spring and Ba at another, neither of which was used for drinking water). The 5 springs with total dissolved solids (TDS; calculated from solute analyses) > 750 mg/L had SO4 as the dominant anion. Of the other 18 springs sampled, 15 had Ca-HCO3 or Ca-Mg-HCO3 facies. Major-ion chemistry appears to reflect dissolution of carbonate and evaporite minerals, cation exchange, and partial evaporation. Most spring waters fall close to the Global Meteoric Water Line on an δ2H–δ¹⁸O plot, indicating a meteoric origin. Springs with TDS < 450 mg/L show a slope of 5.7, suggesting partial evaporation prior to recharge, while waters with higher TDS exhibit a weak δ²H–δ¹⁸O relationship, implying mixing processes and prolonged water–rock interaction. The δ¹⁸O values show a weak but discernible altitude effect, whereas spring water temperature exhibits a stronger negative correlation with elevation. Springs are used for drinking/domestic supply, irrigation, livestock watering, aquaculture, and recreation. Of survey respondents, 42% rely on piped systems, 37% on irrigation channels, and 29% on springs. Respondents reported variable water quality, including salinity, turbidity, color changes, and occasional odors. Most respondents (95%) reported no occurrence of infectious diseases among household members. Respondents demonstrated high awareness of climate-related risks, including drought (54%) and increasing temperatures (61%). Overall, 40% of respondents reported declining water availability, and 18% indicated that irrigation water no longer reaches their fields. Survey findings highlight the need for integrated interventions, including protection and monitoring of springs, household-level water treatment and safe storage, rehabilitation of irrigation infrastructure, and promotion of water-saving technologies. Implementing these measures can improve water security, agricultural productivity, and rural livelihoods while strengthening climate resilience in Batken province. Pending work includes compiling logged water-level and temperature data during the next year in conjunction with meteorological data. Study results and recommendations for spring utilization will be shared with local stakeholders (e.g., community members and representatives of water-users associations) and Kyrgyz government agencies.

How to cite: Fryar, A., Orunbaev, S., Jalilova, G., Asanov, B., and Rignall, K.: Assessment of Springs as Rural Water Resources in Southwest Kyrgyzstan, EGU General Assembly 2026, Vienna, Austria, 3–8 May 2026, EGU26-22543, https://doi.org/10.5194/egusphere-egu26-22543, 2026.

EGU26-1577 | ECS | PICO | HS5.1.4

How Uncertainty Shapes Climate (In)action: Behavioral Dynamics of Farmers’ Adaptation Decisions 

Christine Heinzel and Britta Höllermann

Agricultural systems are increasingly exposed to deep uncertainty as climate change amplifies the frequency, intensity, and unpredictability of hydroclimatic extremes. This uncertainty affects the behavior of farmers, whose individual responses have a significant impact on the resilience of regional land-use and water systems. However, the ways in which different types of uncertainty affect farmers’ adaptation decisions remain insufficiently understood, as scientific discourse has emphasized model-based uncertainty while giving less attention to behavioral dimensions.

This contribution presents a conceptual framework that integrates uncertainty research into the Model of Private Proactive Adaptation to Climate Change (MPPACC), which allows the analysis of the internal reasoning behind action or inaction in farmers’ drought and flood adaptation decisions. Drawing on survey data from 102 farmers in Lower Saxony, Germany, and using multiple linear regressions to examine the relationships specified in the conceptual framework, we analyze how various dimensions of uncertainty are perceived and how these perceptions influence responses to hydro-climatic extremes. The results show that uncertainty perceptions function as dynamic factors shaping behavior and highlight underlying mechanisms explaining why some farmers delay or avoid adaptation despite rising environmental risks, while others adopt proactive measures in response to uncertainty. Specifically, personal attitudes and uncertainty-related competences influence how uncertainty is interpreted, while reliance on forecast and past experiences can amplify perceived uncertainties, contrary to prevailing assumptions.

Thus, this work offers insights for designing strategies for policymakers that more accurately reflect the decision contexts of individuals under deep uncertainty, including strengthening farmers’ decision competence through capacity-building and improving science communication and uncertainty narratives.

How to cite: Heinzel, C. and Höllermann, B.: How Uncertainty Shapes Climate (In)action: Behavioral Dynamics of Farmers’ Adaptation Decisions, EGU General Assembly 2026, Vienna, Austria, 3–8 May 2026, EGU26-1577, https://doi.org/10.5194/egusphere-egu26-1577, 2026.

EGU26-2039 | ECS | PICO | HS5.1.4

Decision-Making under Normative Uncertainty: Methods and an Application to Climate Mitigation  

Jazmin Zatarain Salazar, Palok Biswas, and Jan Kwakkel
 

In real-world policymaking, decision-makers must act amid both deep and normative uncertainty. Deep uncertainty arises when system models, probabilities, and even the boundaries of the problem are contested or unknown, while normative uncertainty arises when stakeholders disagree about values, priorities, and how to evaluate trade-offs. Together, these uncertainties can make outcomes, likelihoods, and even the definition of “success” fundamentally ambiguous. Yet most model-based policy assessments have limited capacity to guide decisions under these conditions: a recommendation may be robust to uncertain futures yet ethically unjust, or ethically appealing but not robust under uncertainty. In practice, model-based assessments often embed a single ethical standpoint or conflate deep and normative uncertainty, rather than explicitly engaging with competing preferences and conceptions of justice. 

In this study, we examine how deep and normative uncertainties in integrated assessment models (IAMs) affect climate mitigation policy recommendations. Although IAMs are widely used to derive “optimal” mitigation pathways, they are subject to both kinds of uncertainty. We therefore draw a clear conceptual distinction between deep and normative uncertainty and model them separately. We combine  Decision Making under Deep Uncertainty (DMDU) methods with social choice theory and multi-agent, multi-objective optimization in a single modelling framework, JUSTICE. This separation matters in practice because it helps decision-makers diagnose the source of disagreement and identify who can help resolve it—for example, whether a deadlock calls for additional scientific evidence or for ethical deliberation about what ought to be prioritized. It also avoids collapsing multiple social objectives into a single welfare metric—or adopting a single conception of justice—which typically requires contentious weighting choices and implicit assumptions about which distributive justice lens should guide the analysis, all of which are inherently normative. 

Our results show that ethical framing and robustness preferences under deep and normative uncertainty significantly influence both the pace and distribution of global mitigation efforts. In highly aggregated IAM-based policy optimization, normative uncertainty can outweigh deep uncertainty in socioeconomic projections. Explicitly disaggregating competing objectives and ethical perspectives is therefore essential for revealing distributional consequences and engaging questions of distributive justice. By keeping metrics disaggregated, using multi-objective analysis to expose trade-offs, and testing robustness across rival weightings and justice framings, our approach makes normative assumptions explicit rather than implicit. More broadly, the framework expands the decision space, reveals trade-offs, and represents diverse stakeholder values, thereby addressing tenets of procedural justice in model-based policymaking. When integrated into IAMs, it can support the design of fairer climate policies, strengthen legitimacy and stakeholder engagement, and facilitate climate negotiations and collective action. 

How to cite: Zatarain Salazar, J., Biswas, P., and Kwakkel, J.: Decision-Making under Normative Uncertainty: Methods and an Application to Climate Mitigation , EGU General Assembly 2026, Vienna, Austria, 3–8 May 2026, EGU26-2039, https://doi.org/10.5194/egusphere-egu26-2039, 2026.

Sustainable water management entails meeting current water demand without compromising future availability, which requires balancing technical, environmental, economic, and safety factors. Achieving this balance requires management schemes capable of recognizing and adapting to changing conditions, particularly under uncertainty scenarios arising from climate variability, aquifer behavior, and temporal fluctuations in demand.

Water resource systems are inherently complex due to the coexistence of uncertainties in both subsurface conditions, such as spatial heterogeneity in hydraulic conductivity fields and transient flow dynamics, and demand conditions, characterized by nonlinear, time-dependent variations. These uncertainties directly influence the reliability of the supply, the efficiency of pumping strategies, and the long-term stability of groundwater systems.

Historically, the concept of safe yield has guided groundwater management by defining the sustainable extraction limit without deteriorating the aquifer system. However, under increasing uncertainty, it becomes necessary to evolve toward the concept of safe supply, which simultaneously considers the physical stability of the aquifer and its adaptive capacity to respond to future variations in demand and hydrogeological conditions.

Within this framework, machine learning techniques provide powerful tools to address different sources of uncertainty. On the one hand, Gaussian Processes (GPs) enable the modeling of uncertainty in water demand time series, offering probabilistic predictions that explicitly capture expected temporal variability in consumption. On the other hand, unsupervised learning methods, applied to ensembles of geological realizations, allow identifying representative subsets of hydraulic conductivity fields that approximate subsurface uncertainty at a significantly reduced computational cost. This approach captures relevant spatial variability without relying on exhaustive Monte Carlo simulations, facilitating multi-objective analysis and optimization under uncertainty.

Thus, integrating hydrogeological simulation with machine learning algorithms enables the development of adaptive groundwater management, where uncertainty, both temporal and geological, is treated as an explicit component of the decision-making process, strengthening water security and ensuring the long-term sustainability of the resource.

How to cite: Rodriguez Pretelin, A. and Morales Casique, E.: COCO, a cost-optimal combined operationframework for the management of WellheadProtection Areas under transient flow, geologicaluncertainty, and unknown groundwater demand, EGU General Assembly 2026, Vienna, Austria, 3–8 May 2026, EGU26-2617, https://doi.org/10.5194/egusphere-egu26-2617, 2026.

Significant climate change and human activities have decreased the stability of water resource systems, leading to multiple uncertainties in streamflow prediction, reservoir operation optimization, decision-making, and adaptive adjustments for water resource scheduling. Understanding the impact of uncertainties on reginal streamflow is necessary and crucial to identifying reservoir operation strategies and decision-making responses. We proposed an integrated systematic “inflow predition”– “reservoir operation”– “optimization”– “decision-making risk analysis” chain considering the transmission of multiple uncertainties.The uncertainty of streamflow prediction is disclosed based on error analysis and reservoir inflow process is simulated by stochastic scenario model. Then, the modified stochastic multi-criteria decision-making model were applied to identify the effects of inflow prediction on reservoir multi-objective operation and decision-making. Moreover, risk quantification indices were used to determine the uncertainty propagation and potential risks accumulated in the chain. We applied this framework to reservoir system in typical basins. The results indicate that the uncertainty of inflow predictions leads to stochastic process of reservoir operation and decision-making. The reservoir decision-making error risk is quantified and enhanced with deep uncertainty. We identified the preferred solutions for reservoir operation under different uncertainty levels with risk information to enhance the robustness of reservoir operation and decision-making.

How to cite: Yang, Z., Wang, Y., and Song, S.: Integrated Process Chain for Reservoir Inflow Prediction-Multi-objective Joint Optimal Scheduling-Risk-Informed Decision-making Considering Multiple Uncertainties Transmission, EGU General Assembly 2026, Vienna, Austria, 3–8 May 2026, EGU26-5536, https://doi.org/10.5194/egusphere-egu26-5536, 2026.

EGU26-6391 | ECS | PICO | HS5.1.4

Exploring compounding rainfall events and potential adaptation measures in complex delta systems  

Dagmar Mennes, Frances Dunn, Hans Middelkoop, David Gold, and Marjolijn Haasnoot

Climate change is projected to increase the frequency and intensity of extreme climate events such as precipitation events and floods. Furthermore, compound events - multiple (extreme) events or hazards that occur simultaneously - are likely to become more prevalent on a warmer planet. Adaptation plans developed for single hazards may (unknowingly) ignore compound events, leading to an adaptation gap and potentially negative effects for other hazardous situations. However, uncertainties in changes of climate extremes, their concurrence, and the complexity of their interactions, render adaptation planning fundamentally more difficult for compound events than for individual events. This research explores adaptation strategies for uncertain compound events in the Netherlands, a low-lying urbanized deltaic system that faces the threat of compound events driven by extreme rainfall, storm surges, or high river discharges. We focus on compound events where extreme rainfall is the primary hazard driver (e.g., two rainfall events or a rainstorm and a storm surge) and aim to create a better understanding of the effects of past and future compound events in the Dutch water system. Our study provides a first insight into the effect of adaptation measures at a regional scale using archetype areas that schematically represent the Dutch delta system.  

We create a compound event database to develop storylines narrating past events and illustrating how adaptation measures were used to protect the Netherlands against high water levels and inundation. The database identifies areas that are especially vulnerable to compound events. We then stylize these areas into archetypes in a hydrologic model, and use the model to explore different adaptation measures, such as drainage, pumps, and storage capacity, under various compound event scenarios. We utilize an exploratory modeling method for decision-scaling based stress testing using the hydrologic model specified for the different archetypal areas in the Netherlands to determine the nature of (future) compound events that may generate water system vulnerability.  

Past events recorded in the database show that the east and west of the Netherlands may respond differently to similar compound events due to differences in hydrological setting, water management (free draining in the east and mainly man-made controlled systems in the west), and the dependency of drainage on downstream conditions, which in turn are affected by storm surges and sea level. Our first model results for the western archetype region show the importance of feedback between the different delta components in the development of flood risks, as e.g., high water levels downstream may affect adaptation requirements and limits upstream. They also confirm that the compounding effect of rainfall events may disproportionally amplify the problem, for example, while the system can deal with an individual rainfall event, a subsequent event can substantially increase inundation.

How to cite: Mennes, D., Dunn, F., Middelkoop, H., Gold, D., and Haasnoot, M.: Exploring compounding rainfall events and potential adaptation measures in complex delta systems , EGU General Assembly 2026, Vienna, Austria, 3–8 May 2026, EGU26-6391, https://doi.org/10.5194/egusphere-egu26-6391, 2026.

Traditional scenario-based approaches to water resources planning often miss consequential dynamics and diverse stakeholder vulnerabilities that emerge from complex interactions between climate, institutions, infrastructure, and human action. This presentation will demonstrate the use of bottom-up exploratory modeling frameworks in advancing our understanding of water scarcity in institutionally complex river basins by systematically exploring large ensembles of plausible futures. Working in the Upper Colorado River Basin—a system governed by prior appropriation water rights—we couple the State's water allocation model with exploratory modeling to simulate hundreds of thousands of plausible scenarios spanning diverse hydroclimatic conditions, demand changes, and other stressors. Paired with global sensitivity analysis and other diagnostics, we show how human institutions and system complexity fundamentally shape vulnerability: under identical scenarios, stakeholders experience vastly different impacts depending on their position within water rights and infrastructure networks. The analysis demonstrates several critical insights. First, dominant stressors controlling water shortages vary across users and across severity thresholds for individual users. Second, robustness assessments must account for multiple actors with distinct objectives, as no single metric captures all system responses to stress. Third, scenario storylines can be identified and used to describe consequential multi-actor dynamics and inform planning, despite these limitations. This framework is currently extended with new stochastic weather generation tools using multivariate copulas to explore deeply uncertain precipitation-temperature relationships and their compounding effects on water scarcity. This work demonstrates how exploratory modeling can transform traditional water resources planning from evaluating predetermined scenarios to systematically discovering consequential uncertainties and generating actionable storylines for decision-making under deep uncertainty.

How to cite: Hadjimichael, A.: Exploratory Modeling for Understanding Water Scarcity in Coupled Human-Natural Systems: From Vulnerability Assessment to Scenario Storyline Discovery, EGU General Assembly 2026, Vienna, Austria, 3–8 May 2026, EGU26-7830, https://doi.org/10.5194/egusphere-egu26-7830, 2026.

EGU26-8065 | ECS | PICO | HS5.1.4

Climate Sensitivity of Agricultural Water Demand Depends on Control Over Growing Season 

Alexander Thames, Antonia Hadjimichael, and Julianne Quinn

Changes to the relationship between precipitation and temperature due to climate change can exacerbate water scarcity by increasing evapotranspiration and reducing runoff and soil moisture. These changes are especially significant for the agricultural sector, where complex interactions between precipitation, temperature, and growing season dynamics produce deep uncertainties in agricultural water demands. While watershed managers have traditionally relied on “top-down” planning scenarios, these typically do not provide insights into the system’s internal variability, nor do they capture the range of plausible, yet deeply uncertain, changes in the regional hydroclimate. To address this shortcoming, we develop a multivariate, multisite, copula-based stochastic weather generator for bottom-up exploratory modeling analysis of agricultural water resources systems. Paired with a regional consumptive use model, this generator allows us to investigate differential impacts of climate change on diverse agricultural producers and crops. We demonstrate this framework in the Upper Colorado River Basin within the state of Colorado. The explored hydroclimatology shows precipitation and temperature as highly variable and elevation-dependent relative to their historical annual averages, spanning -95% and +600% and –10°C and +19°C at the extrema, respectively. As a result, we observe substantial changes in irrigation water requirements for agricultural parcels across the basin between –100% and +250% relative to historical averages; all producers see irrigation requirements increase higher than their historical averages in more than 50% of our sampled realizations, with producers at lower elevations seeing this increase in more than 75% of them. Global sensitivity analysis reveals that adequate access to water impacts producers' effective growing season lengths and thereby which climate variables most control crop water requirement: producers with adequate water are most sensitive to changes in temperature mean and variance while producers without adequate water are most sensitive to changes in precipitation variance—and not mean—with temperature contributions halving. These findings demonstrate how differential vulnerability drivers underscore the need for stakeholder-specific assessments that account for spatial heterogeneity and decision-relevant uncertainties in agricultural water demand.

How to cite: Thames, A., Hadjimichael, A., and Quinn, J.: Climate Sensitivity of Agricultural Water Demand Depends on Control Over Growing Season, EGU General Assembly 2026, Vienna, Austria, 3–8 May 2026, EGU26-8065, https://doi.org/10.5194/egusphere-egu26-8065, 2026.

Urban water utilities face the combined pressures stemming from evolving drought extremes, increasing demands, and financial constraints, prompting a growing interest in regional cooperative dynamic and adaptive infrastructure investment pathway strategies. Theoretically, these strategies promise improved resource efficiency by realizing economies of scale, adding flexibility for achieving improved supply reliability, and, ideally, limiting individual and collective financial risks. However, prior work has shown that implementation uncertainty in regional partners’ cooperative actions, characterized by modest deviations from a prescribed set of Pareto-approximate actions, can drive counterparty risks and potentially exacerbate collaborating actors’ vulnerabilities to deeply uncertain supply and financial challenges. To address this challenge, we contribute the Deeply Uncertain Pathways for Implementation Uncertainty (DU Pathways IU) framework, an evolutionary multi-objective reinforcement learning (eMORL) approach that accounts for human-driven implementation uncertainty when optimizing for regional cooperative water supply management and planning pathway strategies that remain robust to external socio-economic uncertainties and drought extremes.

In this work, we demonstrate that the DU Pathways IU approach yields a broader range of regional water supply pathway strategies that more fully utilize the full suite of cooperative management and planning actions available to regional actors. This broader set of highly cooperative pathway strategies exhibit more controlled supply and financial performance degradation when stress-tested under implementation uncertainties (i.e., perturbations to pathway strategies’ decision variables). In addition to remaining stable in the face of unexpected deviations from the recommended set of regional cooperative actions, these strategies achieve higher robustness across all regional actors. Further sensitivity analysis reveals that highly cooperative pathway strategies experience reduced sensitivity to perturbations to other actors’ actions. Consequently, cooperating utilities have more control over their individual performance and reduced uncertainty when assessing the needed timing and prioritization of future infrastructure investments. Overall, this work facilitates the discovery of highly cooperative regional water supply planning and management pathway strategies that remain stable under implementation uncertainty. It is broadly applicable to water utility managers who seek improved transparency into how modest perturbations in cooperative actions drive potential performance conflicts across multiple actors implementing both individual and cooperative actions in a regional system.

How to cite: Lau, L., Reed, P., and Gold, D.: Accounting for human implementation uncertainties in the discovery of robust water supply infrastructure pathways using evolutionary multi-objective reinforcement learning., EGU General Assembly 2026, Vienna, Austria, 3–8 May 2026, EGU26-9084, https://doi.org/10.5194/egusphere-egu26-9084, 2026.

Models are essential for representing the complex interactions that shape human–water systems, yet existing approaches often struggle to capture basin-specific feedbacks and to support systematic sustainability assessments at the river-basin scale. Here, we develop a generic and extensible Integrated Social–Ecohydrological System Dynamics (ISEHSD) model that explicitly couples social, ecological, and hydrological processes within a unified feedback structure. The framework represents dynamic interactions across eleven interconnected sectors and enables basin-scale sustainability assessment based on biophysical boundaries, capturing outcomes arising from both natural dynamics and human interventions. ISEHSD explicitly resolves the co-evolution of agri-food systems, water, and ecological impacts. The framework is demonstrated through a use-case implementation for the Yellow River Basin, an arid river basin subject to intensive anthropogenic pressures. Global sensitivity analysis and uncertainty quantification are employed to identify key nonlinear interactions and to evaluate alternative development and management strategies. Results indicate that severe water stress is not expected to be relieved before 2045 under the scenario analysis. Even under the most sustainability-oriented scenario, human water demand could exceed the severe water stress threshold by 22% (ranging from 6% to 40%) in 2100. Cross-system transformations, including enhanced water efficiency and sustainable agricultural practices, remain essential to reducing water stress in the basin. Beyond this application, ISEHSD provides a scalable and interpretable modelling framework that supports multi-scenario policy analysis, integrated visual analytics, and stakeholder-oriented dialogue for river-basin sustainability planning.

How to cite: Yu, L. and Wang, S.: ISEHSD: a feedback-based, integrated social-ecohydrological system model for studying basin-level transformation, EGU General Assembly 2026, Vienna, Austria, 3–8 May 2026, EGU26-11510, https://doi.org/10.5194/egusphere-egu26-11510, 2026.

EGU26-11957 | ECS | PICO | HS5.1.4

A review of tools and resources to support Decision-Making Under Deep Uncertainty 

David Gold, Julius Schlumberger, Valeria Di Fant, Umit Taner, Gundula Winter, and Jan Kwakkel

Decision-making under Deep Uncertainty (DMDU) offers approaches to support robust, adaptive strategies for complex water resources decision-making. However, practical uptake of DMDU remains limited, partly due to fragmented access to resources and a lack of an inventory of available tools. This study introduces a comprehensive catalogue of tools and resources. Through a structured survey and expert elicitation, we identify 28 resources and 16 tools that support DMDU research and practice and classify them using an established DMDU taxonomy. Our analysis reveals a focus on introductory guidance on the theory and methods of DMDU application. Technical, method-specific resources for implementing existing frameworks remain limited. Our results identify tools that support all core DMDU components, but they also highlight persistent scalability challenges. The resulting online catalogue provides a foundation for expanding the use of DMDU in practice and is intended as a living, community-driven platform.

How to cite: Gold, D., Schlumberger, J., Di Fant, V., Taner, U., Winter, G., and Kwakkel, J.: A review of tools and resources to support Decision-Making Under Deep Uncertainty, EGU General Assembly 2026, Vienna, Austria, 3–8 May 2026, EGU26-11957, https://doi.org/10.5194/egusphere-egu26-11957, 2026.

EGU26-15048 | ECS | PICO | HS5.1.4

Robust Stackelberg equilibrium water allocation patterns in shallow groundwater areas 

Xiaoxing Zhang, Andrea Castelletti, Xuechao Wang, and Ping Guo

It is challenging for decision-makers (DM) to deal with uncertainties in multi-level agricultural water resource systems, where DMs independently make decisions but have different levels of power. In this paper, we model the multi-level agricultural water resources system under deep uncertainties as a Stackelberg game, use multi-level programming to solve equilibrium water allocation problems, and introduce robustness metrics into multi-level programming to balance solution feasibility and model optimality within uncertain environments. The approach is applied to a shallow groundwater system with three decision levels, pursuing, from the top level to the bottom one, high food production, fair water allocation, and increased economic benefit. The model generated a series of optimal equilibrium solutions with different robustness degrees. DMs can choose “rational” solutions according to their acceptable costs, oriented robustness degree, expected objective values, and advance risk assessment of uncertainties. Among these solutions, we capture a critical point with high objective values and strong robustness, where DMs can accomplish both objective optimality and solution robustness with a low cost. The proposed approach in this study provides a posterior decision support to consider solution robustness while designing policies in multi-level agricultural water resource systems under deep uncertainties.

How to cite: Zhang, X., Castelletti, A., Wang, X., and Guo, P.: Robust Stackelberg equilibrium water allocation patterns in shallow groundwater areas, EGU General Assembly 2026, Vienna, Austria, 3–8 May 2026, EGU26-15048, https://doi.org/10.5194/egusphere-egu26-15048, 2026.

EGU26-15349 | ECS | PICO | HS5.1.4

Modernizing Hydropower through Turbine Upgrades Improves Efficiency and Resilience 

Marta Zaniolo, Veysel Yildiz, and Nathalie Voisin

Hydropower is the largest source of renewable electricity and a central component of the water–energy nexus and the net-zero transition. Aging infrastructure, combined with climate variability and evolving grid demands, is reducing the efficiency and operational flexibility of Hydropower Plants (HP) designed for past climate and grid conditions. Meeting future energy needs requires modernizing the existing fleet,  for example through turbine replacement which occurs every few decades.

In practice, turbines are often replaced with identical units that replicate legacy configurations optimized for past conditions, but replacements constitute an opportunity to redesign turbine head and discharge capacity to match evolving hydrology, reservoir operations, and grid needs. In drought-prone systems, for example, installing units optimized for lower head can sustain generation at reduced reservoir levels, as demonstrated by recent upgrades at Hoover Dam on the Colorado River. What is missing is a rigorous method to determine when and how turbines should be upgraded to ensure efficient, reliable, and sustainable outcomes.

This study addresses this need for large-scale hydropower upgrades by using a newly developed framework, HyTUNE (Hydropower Turbine Upgrade and Next-generation Planning). HyTUNE is a dynamic decision-support tool that integrates basin hydrology, HP hydraulics, and adaptive optimization to inform turbine replacement timing and configuration. HyTUNE learns from evolving system states and identifies threshold conditions where adjustments to design head or discharge capacity improve hydropower performance.

Application to the Hoover Hydropower Plant in the Colorado River Basin shows that HyTUNE’s adaptive policies consistently outperform benchmark replacement strategies across diverse hydrologic futures. The approach increases economic returns, measured as net present value, and enhances plant capability through higher firm power, peak-period generation, and operational efficiency, with fewer turbine replacements. Climate variability still shapes outcomes, with the largest benefits of HyTUNE compared to benchmark expected under wetter conditions, and the strongest improvements in firm power and operational efficiency under drier conditions. HyTUNE offers a practical framework for hydropower systems facing the combined challenges of modernization, climate uncertainty, and growing demand.

How to cite: Zaniolo, M., Yildiz, V., and Voisin, N.: Modernizing Hydropower through Turbine Upgrades Improves Efficiency and Resilience, EGU General Assembly 2026, Vienna, Austria, 3–8 May 2026, EGU26-15349, https://doi.org/10.5194/egusphere-egu26-15349, 2026.

EGU26-15917 | PICO | HS5.1.4

Cascading failures of index insurance, cooperation, and levees in coastal Bangladesh: agent-based modeling and global sensitivity analysis for stochastic models 

Woi Sok Oh, Kyungmin Sung, Fernando Santos, Kelsea Best, Simon Levin, and Daniel Rubenstein

Physical infrastructure and institution safeguard farmers from flooding in coastal Bangladesh in a interconnected way. In this region, crops are protected from flooding by levees, a form of physical infrastructure. These levees are maintained by self-organized cooperations, an informal institution. We also test counterfactual dynamics of index insurance, a formal institution. With interconnections of multiple components, it is difficult to understand the complex landscape of sustainability for successful policymaking. To address the gap, we develop a spatially-explicit agent-based model with interconnected components in the coastal Bangladesh to capture how farmer's strategic decisions on insurance participation and cooperation evolve. In the model, we define "sustainable" cases when (i) most farmers participate in index insurance and cooperate for levee maintenance, (ii) levee is kept nearly at the targeted level, and (iii) insurance agencies do not fall into debts. Our model shows that the coupled system is sustainable in a restricted combination of target levee and insurance index levels. More interestingly, we find a diverse versions of cascading failures between index insurance, cooperation, and levees. We then use global sensitivity analysis modified for stochastic models to capture both deterministic and stochastic contributions of inputs on uncertainties of system being sustainable. Ultimately, this study establishes a novel framework of capturing and analyzing cascading failures to fully understand complex human-water interplays, supporting a better design of climate adaptation policies against climate change.

How to cite: Oh, W. S., Sung, K., Santos, F., Best, K., Levin, S., and Rubenstein, D.: Cascading failures of index insurance, cooperation, and levees in coastal Bangladesh: agent-based modeling and global sensitivity analysis for stochastic models, EGU General Assembly 2026, Vienna, Austria, 3–8 May 2026, EGU26-15917, https://doi.org/10.5194/egusphere-egu26-15917, 2026.

EGU26-18255 | PICO | HS5.1.4

From recharge deep uncertainty to desalination lock-in: propagation of groundwater recharge uncertainty into water-resources management and adaptation pathways in Macaronesian oceanic islands 

Alejandro García-Gil, Rodrigo Sariago, Jorge Martínez-León, Jon Jimenez, Gerardo Meixueiro Ríos, and Carlos Baquedano

Oceanic islands often rely on groundwater for up to 95% of freshwater supply, yet groundwater recharge remains one of the most uncertain components of island water budgets due to steep climatic gradients, volcanic aquifer heterogeneity, sparse monitoring and strong interannual variability. This uncertainty is frequently underrepresented in planning and can propagate into groundwater allocation rules and infrastructure decisions, potentially fostering maladaptive trajectories.

We analyse how deep uncertainty in recharge estimation propagates through the groundwater-management chain, from recharge assessment and water-balance calculations to abstraction limits, coastal salinization risk and long-term infrastructure planning. We quantify an “uncertainty cascade” using multi-island examples from the Canary Islands (Macaronesia). In El Hierro, recharge estimates reported in the literature span ~30–114 mm yr⁻¹ (CV ≈ 44%), while recent physically-based modelling constrained by evapotranspiration yields ~58 mm yr⁻¹ (≈15.6 hm³ yr⁻¹), implying a ~50% downward revision compared to commonly adopted values. For Gran Canaria, estimated renewable groundwater resources range from ~140 hm³ yr⁻¹ (1970s) to ~80 hm³ yr⁻¹ in current plans, while our assessment suggests substantially lower values (~40–63 hm³ yr⁻¹ depending on assumptions). In La Palma, our calibrated estimate indicates ~50.8 hm³ yr⁻¹ (2000–2020), yet desalination planning is already being advanced for agricultural supply reliability in highly stressed areas.

Within the GENESIS project framework, we further evaluate climate change as an additional pressure capable of inducing a dramatic reduction in recharge across island aquifers, aggravating overexploitation, accelerating seawater intrusion thresholds and reinforcing desalination dependence (lock-in). We discuss adaptation pathways aligned with the European Climate Adaptation Strategy, with a focus on ultra-peripheral (outermost) regions, where water systems are among Europe’s most climate-sensitive and likely to experience early impacts. We highlight how Nature-based Solutions (NbS) and reclaimed water management can reduce demand on groundwater, increase system robustness, and protect critical island water infrastructures. Ultimately, uncertainty-aware governance is essential for equitable adaptation and to ensure that no communities are left behind.

How to cite: García-Gil, A., Sariago, R., Martínez-León, J., Jimenez, J., Meixueiro Ríos, G., and Baquedano, C.: From recharge deep uncertainty to desalination lock-in: propagation of groundwater recharge uncertainty into water-resources management and adaptation pathways in Macaronesian oceanic islands, EGU General Assembly 2026, Vienna, Austria, 3–8 May 2026, EGU26-18255, https://doi.org/10.5194/egusphere-egu26-18255, 2026.

The scientific investigation of global climate change characterizes a complex geophysical system in transition.  Broadly characterized, that system transformation includes a wider range of potential futures with emergent system qualities and tipping points that undermine the foundational planning assumptions for historical water supply planning.  While the geophysical system encompasses the whole of the planet, the intersection with human-built systems and institutions for water supply management occupies a diverse range of delimited local situations.  From the perspective of human-managed water systems, the geophysical system transformation is reflected in a social system also in transition.  Like the geophysical system, social adaptation exhibits emergent social system qualities and tipping points.  As this plays out in multiple centers of water governance across multiple adaptive institutional management scales, each locally adaptive strategy becomes yet another agent of change in the larger network of water supply management.  At these multiple scales of management, decision makers are faced with long-term and long lead time adaptive investment decisions to secure water supply reliability without the usual certainty that any particular project will address evolving conditions.   Urgent action is needed involving significant decisions without what was traditionally viewed as sufficient information.

Typically, the suite of Decision Making Under Deep Uncertainty (DMDU) approaches support decision-makers through participatory deliberation with analysis.  With structured decision making, scenario development, scenario discovery, explicit inclusion of multiple worldviews, and frame reflection; there is a reasonable chance for mutual accommodation even if a common worldview proves elusive. But what if the most effective scale of management no longer matches the historical institution’s scale and governance?   To be effective, these tools require a radical reframing of the scale of management.  If existing scale of resource management reflects the historical dynamics of a hydrologic system; the built infrastructure, management scale, and institutional governance are unlikely to fit an evolving system. 

The Metropolitan Water District of Southern California is the largest treated water supplier in the United States.  Metropolitan supplies 19 million people with supplies imported hundreds of miles from the Colorado River and the California State Water Project through its 26 member agencies.  Those imported water supplies are increasingly affected by global climate change.

Metropolitan has employed DMDU analytical approaches since 2010 while experiencing a series of unprecedented trends in water supply and demand.  At its 2023 Board retreat, climate change adaptation became the central focus for Metropolitan.  It is currently engaged in developing a climate adaptation master plan for water.  It’s a messy process complicated by issues of scale and uncertainty, compounded by eroding supply reliability and fiscal challenges.

Based on over fifteen years of participating in Metropolitan’s water resource planning, this presentation provides a participant’s report on how institutional system transformation is proceeding in southern California.  What has worked, and what hasn’t, reflects an institution grappling with a radical reframing of its value proposition to fit the changing scale of water supply management.  For the scientific community, this offers an inside look at how decision makers struggle to adapt to change.

How to cite: Graumlich, H.: Finding the Fit: Reframing the Institutional Context for Adaptive Change in DMDU, EGU General Assembly 2026, Vienna, Austria, 3–8 May 2026, EGU26-22147, https://doi.org/10.5194/egusphere-egu26-22147, 2026.

EGU26-865 | ECS | Posters on site | HS5.1.5

An Evaluation of the Institutional and Policy Framework in Ghana's Urban Water Sector 

Jacob Doku Tetteh, Samuel Agyei-Mensah, George Owusu, Sandow Mark Yidana, Michael R. Templeton, Faustina Twumwaa Gyimah, and Ben C. Howard

This study examined the institutional and policy framework governing water service delivery in urban Ghana. Through qualitative data analysis, 23 key informants’ interviews from both governmental and non-governmental stakeholders were analysed. Four central themes emerged: mandates and operations, institutional progress, challenges faced, and coping strategies employed by key stakeholders. While some degree of institutional progress was identified, so were overlapping mandates among key utilities, highlighting uncertainty and inefficiency in responsibilities. Several critical challenges in the water sector were highlighted, including inadequate collaboration among stakeholders, environmental threats (e.g., water pollution), political interference, and financial constraints. These factors hinder progress towards achieving sustainable water services. Additionally, the non-payment of water tariffs by some complicates operational activities, underscoring the need for community sensitization initiatives. However, there are opportunities for improved water management through collaborative partnerships among government bodies, non-governmental organizations, and local communities. For example, the Water Research Institute plays a vital role by providing essential data and research insights that inform policies aimed at sustainable water resource management. We advocate for innovative approaches, such as decentralizing water supply systems and investing in efficient resource management strategies, to better serve communities. We also emphasize the importance of enhancing civic education to foster public accountability and engagement. By addressing institutional and socio-cultural factors, we underscore the necessity for comprehensive reforms that position water as a shared common good, highlighting collaborative governance as a pathway to improve access and ensure sustainability in alignment with Sustainable Development Goal 6.

How to cite: Tetteh, J. D., Agyei-Mensah, S., Owusu, G., Yidana, S. M., Templeton, M. R., Gyimah, F. T., and Howard, B. C.: An Evaluation of the Institutional and Policy Framework in Ghana's Urban Water Sector, EGU General Assembly 2026, Vienna, Austria, 3–8 May 2026, EGU26-865, https://doi.org/10.5194/egusphere-egu26-865, 2026.

Water security in semi-arid, transboundary regions like the Cuvelai-Etosha Basin in northern Namibia is increasingly threatened by climate variability, population growth, and rising multi-sectoral water demands. Despite the basin’s critical hydrological and socio-economic importance, it lacks integrated modelling frameworks to support evidence-based planning and equitable water allocation. This study addresses this gap by developing a Water Evaluation and Planning (WEAP)-based model to assess current and future water availability at sub-seasonal and seasonal timeframes, incorporating gender-responsive and stakeholder-informed scenarios. Adopting a mixed-methods approach, the research combines quantitative hydrological modelling with participatory engagement to ensure contextual relevance and legitimacy. Quantitative inputs include climate data, canal infrastructure, and sector-specific water use, while qualitative methods capture gender-differentiated water needs and planning priorities.

The findings aim to inform adaptive water allocation, infrastructure development, and drought/flood mitigation strategies for Namibia’s national water planning priorities. Specifically, the WEAP-based model is designed to support basin-scale decision-making by enabling sustainable allocation, strengthening climate-resilient planning, and fostering gender-inclusive water management. At a broader scale, the study contributes to the “Co-Design of Hydrometeorological Information System for Sustainable Water Resources Management in Southern Africa” (Co-HYDIM-SA), a research initiative under the Water Security in Southern Africa (WASA) programme. By generating actionable hydrometeorological intelligence, the model provides a foundational planning tool that feeds into the regional decision-support system aimed at enhancing resilience to climate extremes across Southern Africa.

Keywords: Cuvelai-Etosha Basin, WEAP modelling, Water security, IWRM, Climate resilience

How to cite: Kandjinga, T. and Bharati, L.: Assessment of Current Water Use and Future Water Availability for Planning and Allocation in the Cuvelai-Etosha Basin, Namibia, EGU General Assembly 2026, Vienna, Austria, 3–8 May 2026, EGU26-1328, https://doi.org/10.5194/egusphere-egu26-1328, 2026.

Southern Africa faces escalating challenges to water management and food security as climate change intensifies pressures on water availability, quality, and equitable access. In the Cuvelai-Etosha, Cunene River and Upper Limpopo River Basins, highly variable rainfall, recurrent floods and droughts, ephemeral river systems, and high evaporation rates compound vulnerabilities. Rapid urbanization, agricultural demands, ecosystem degradation, and socio-economic instability further increase communities’ vulnerability, directly affecting livelihoods, irrigation, and reliable food access. Effective responses require integrated, climate-sensitive approaches that address environmental, social, and institutional dimensions of risk, strengthen adaptive capacities, and prioritize locally appropriate water management strategies.

Under the Co-Design of a Hydrometeorological Information System for Sustainable Water Resources Management in Southern Africa (Co-HYDIM-SA) project, part of the Water Security in Africa (WASA) Programme, we implement a participatory, multi-criteria decision-making framework to assess flood and drought risks. The methodology integrates hazard, exposure, and vulnerability indicators derived from remote sensing, climate records, hydrological and water storage data, socio-economic statistics, and local knowledge. Indicators lists for risk factors are compiled from literature and discussed with stakeholders during workshops, where they are prioritized and weighted to reflect both empirical evidence and local perspectives, ensuring that assessments capture local priorities, perceptions, and decision-making needs.

The approach generates spatially explicit flood and drought risk maps, supporting the co-design of the CUVEWIS hydro-meteorological information system to guide climate-resilient water governance. By capturing the spatio-temporal dynamics of floods and droughts, including ephemeral iishana flows in the Cuvelai-Etosha Basin, and incorporating socio-political and economic drivers of vulnerability, the project strengthens adaptive capacities at multiple scales. Flood and drought hazards and exposure are analysed through diverse indicators such as rainfall variability, soil moisture, groundwater stress, and surface water extent, while vulnerability incorporates water and food access, livelihoods, infrastructure, and coping capacity.

By combining research, stakeholder engagement, and practical tools, this work demonstrates how localized, evidence-based strategies can guide adaptive water management. Addressing the entanglement of hydrological risks with social inequalities highlights the value of interdisciplinary, participatory approaches for operationalizing early warning systems, improving risk communication, and supporting sustainable, inclusive water management. Beyond the studied transboundary basins, this framework offers transferable insights for climate-resilient water management across Southern Africa and contributes to broader regional and global dialogues on integrated water resource governance under climate change.

Key words: Flood and drought risk, participatory risk assessment, water security, vulnerability, multi-criteria decision approach.

Acknowledgement: The WASA programme in Germany was launched under the leadership of the Federal Ministry of Education and Research (BMBF), with the collaboration of six additional federal ministries and their respective institutions.

How to cite: Pamukçu Albers, P., Evers, M., and Sin, H. P.: Integrating Stakeholder Knowledge and Multi-Criteria Risk Assessment for Climate-Resilient Water Management in Southern Africa, EGU General Assembly 2026, Vienna, Austria, 3–8 May 2026, EGU26-1498, https://doi.org/10.5194/egusphere-egu26-1498, 2026.

EGU26-7815 | Orals | HS5.1.5

Co-creating earth observation use cases for informed water management decisions in African River Basins  

Seifu Admassu Tilahun, Alemseged Tamiru Haile, Mirriam Makungwe, James Ashaley, Ashenafi Likassa, Chisanga Kapacha, Ali Barro, Afua Owusu, Moctar dembele, Komlavi Akpoti, Mansoor Leh, Mulugeta Tadesse, Kirubel Gebreyesus, Naga Velpuri, and Abdulkerim Seid

Across five African countries, practical use cases supported by the Digital Innovations for Water-Secure Africa (DIWASA) initiative demonstrate how Earth observation (EO) based digital tools can address diverse water management challenges in data-scarce contexts. The International Water Management Institute (IWMI), through DIWASA, facilitated structured multi-stakeholder dialogues with use case owners, including the Ministry of Irrigation and Water Development (MIWD) in Ethiopia, the Ghana Irrigation Development Authority (GIDA) in Ghana, the Directorate General of Water Resources (DGRE) in Burkina Faso, the Water Resources Management Authority (WARMA) in Zambia, and the Ministry of Water and Environment (MWE) in Uganda.

A co-design process was implemented involving the use case owner and other beneficial organizations that engaged user case owners in collaboration with various public agencies, academia, and private-sector actors to jointly define problems, co-develop EO-enabled solutions, and agree on delivery mechanisms. Each process produced a clear roadmap detailing activities, stakeholder responsibilities, and timelines. Use case owners and primary beneficiaries led problem definition and data sharing; IWMI researchers developed analytical workflows and models; interns and fellows contributed to analysis; focal persons bridged the gap between researchers and practitioners; and a broad set of stakeholders validated inputs, methods, and outputs.

This process resulted in five operational use cases. In Burkina Faso, a water accounting dashboard for the Nakanbé Moyen sub-basin integrates multi-source data to quantify water availability and consumption, supporting allocation decisions and conflict reduction. In Zambia, a basin-scale water accounting framework for the Lunsemfwa Basin supports water-use permitting by estimating abstractions, tracking interannual changes, and identifying non-compliant irrigation sites. In Uganda, remote sensing-based flood monitoring informs infrastructure development decisions for Kampala. In Ghana and Ethiopia, irrigation scheme-level water accounting tools were developed, tailored to user needs, and supported water user associations in Ghana and generated investment-ready evidence for scheme revitalization in Ethiopia. For all these use cases, a co-created dashboard ensures that all stakeholders contribute to its design and development, resulting in visualizations that are not only interactive and easy to understand but also directly relevant to users’ needs.

These practical use cases highlight how co-creation enhances relevance, ownership, and uptake of EO-based digital tools, offering transferable lessons for scaling digital water innovations across Africa and beyond.

How to cite: Tilahun, S. A., Haile, A. T., Makungwe, M., Ashaley, J., Likassa, A., Kapacha, C., Barro, A., Owusu, A., dembele, M., Akpoti, K., Leh, M., Tadesse, M., Gebreyesus, K., Velpuri, N., and Seid, A.: Co-creating earth observation use cases for informed water management decisions in African River Basins , EGU General Assembly 2026, Vienna, Austria, 3–8 May 2026, EGU26-7815, https://doi.org/10.5194/egusphere-egu26-7815, 2026.

EGU26-8934 | ECS | Orals | HS5.1.5

Remote sensing–based assessment of water quality in small inland waters as a scalable tool for equitable and multisectoral water management 

SeyedMorteza GhorashiNejad, Regina Nogueira, and Mahmud Haghshenas Haghighi

Sustainable water management under a changing hydrological cycle increasingly requires approaches that integrate hydrological processes, water quality dynamics, and decision-making across multiple sectors. Anthropogenic pressures such as urban and industrial wastewater discharge, as well as excessive nutrient inputs from agriculture, exacerbate water quality degradation and ecological stress. This is particularly pronounced in small inland waters, which are often under-monitored yet critical for local water supply, agriculture, and ecosystem services. These challenges are amplified by data scarcity and limited monitoring capacity, constraining equitable water allocation and evidence-based governance.

This contribution presents a remote sensing–based framework for assessing spatio-temporal water quality dynamics in small inland waters, with a focus on supporting multisectoral water management under data-limited conditions. The approach is demonstrated through a case study on the River Aller in Celle, Germany, where the potential impact of a wastewater treatment plant was assessed on the river water quality. Satellite observations are combined with targeted in-situ measurements to evaluate chlorophyll-a (Chl-a) variability as an indicator of eutrophication and ecological pressure.

Two river sections, located upstream and downstream of the wastewater treatment plant, were analysed to assess spatial and temporal differences in Chl-a concentrations. Optical remote sensing data from Sentinel-2 and PlanetScope satellites were integrated with field measurements collected during the summer of 2024. The analysis revealed variable Chl-a concentrations over time, with elevated values downstream of the treatment plant during several sampling periods, indicating a potential influence of treated effluent on eutrophication dynamics.

Statistical analysis showed positive correlations between satellite-derived reflectance and in-situ Chl-a concentrations. For Sentinel-2, the strongest relationships were observed in the red (Band 4) and red-edge (Band 5) bands using Level-2A (bottom-of-atmosphere) data, with the highest Pearson correlation coefficient (r = 0.6) obtained for the red band. These bands (Bands 4 and 5) and data products (Level-2A) were therefore selected for further analysis. Likewise, moderate correlations were also identified using PlanetScope data, particularly in the red and red-edge bands. Although weaker than those obtained from Sentinel-2, these results highlight the potential of high-resolution satellite data, with a spatial resolution of approximately 3 m and near-daily revisit frequency, for monitoring small inland waters. Data at this resolution with improved temporal coverage are particularly valuable where spatial detail is critical and where limited clear-sky conditions constrain data availability.

Empirical models were developed to estimate Chl-a concentrations based on satellite reflectance, demonstrating the value of Earth observation as a complementary tool to conventional monitoring, particularly as an early-warning service in contexts where dense in situ networks are not feasible. By enabling more consistent and spatially extensive monitoring, remote sensing approaches such as those presented here offer a more affordable and scalable alternative to conventional, labor-intensive in-situ sampling. This is particularly important for small inland waters, where consistent long-term monitoring is required to capture spatial heterogeneity and short-term variability relevant for management decisions. In addition, the spatially continuous nature of satellite observations supports reproducible and comparable assessments of water quality dynamics across time and locations, reducing reliance on sparse point-based measurements.

How to cite: GhorashiNejad, S., Nogueira, R., and Haghshenas Haghighi, M.: Remote sensing–based assessment of water quality in small inland waters as a scalable tool for equitable and multisectoral water management, EGU General Assembly 2026, Vienna, Austria, 3–8 May 2026, EGU26-8934, https://doi.org/10.5194/egusphere-egu26-8934, 2026.

EGU26-10154 | ECS | Posters on site | HS5.1.5

Designing and assessing water management intervention in informal settlements: an international cooperation project in Beira, Mozambique 

Susanna Ottaviani, Davide Framba, Wilson Alberto Munguita Paulino, Alessandra Marzadri, Davide Geneletti, and Guido Zolezzi

More than half of the world's population lives in cities, and 1.12 billion inhabit informal settlements. In Sub-Saharan Africa, one of the regions most exposed to climate change, rapid urbanisation has resulted in 53% of the urban population living in informal settlements, according to UN-Habitat. In these contexts, insecure land tenure, non-compliance with building and spatial planning regulations, and limited access to improved water and sanitation services exacerbate climate-related risks. 

This is the case of the Macuti neighbourhood, hosting approximately 17’000 residents  (2017) over 220 hectares in the coastal city of Beira, central Mozambique. Between 2022 and 2025, Macuti benefited from the MUDAR project, an EU co-funded initiative for local authorities on capacity building and urban upgrading. 

The University of Trento, as part of a broader project partnership comprising public authorities, NGO, and educational institutions, carried out a context assessment aimed at identifying priority urban resilience interventions and studying their impacts once implemented. 

A multidisciplinary methodology combining more than 800 questionnaires and 200 interviews with residents and stakeholders, in-situ measurements, the collection of existing cartographic information, and satellite imagery helped overcome data availability constraints. The outcomes of this analysis, together with a structured participatory process involving municipal authorities, technicians, and local communities, informed the design of tailored, modular and replicable small-scale interventions, namely a street, a recreational area and two retention ponds for flood mitigation, embedded within a broader neighbourhood-scale urban planning framework.

Preliminary results assessing the impacts of the interventions show tangible changes both on the physical fabric of Macuti and the everyday conditions experienced by residents, consistent with an urban upgrading approach. Social surveys, carried out before and after the MUDAR’s intervention and subsequently compared, show a marked improvement in perceived road conditions, with negative ratings (bad or very bad) decreasing from 78% in 2024 to 1.6% in 2025, while 83% of respondents now rate the road as good or very good. The street also enabled the implementation of a waste collection system serving 81% of Macuti’s inhabitants weekly. Moreover, two-dimensional hydrological-hydraulic modelling performed with HEC-RAS indicates good performance of the two ponds in collecting runoff from the densely inhabited lower-lying surroundings and in conveying it to the existing free-flowing channels, even under tidal constraints. However, it clearly appears that to fully understand the impacts of such a project further and transversal investigation is needed. In this sense, a comprehensive approach able to detect intervention’s multifunctionality, valuation, spatial and temporal relevance and the equity implications is crucial.

The present study contributes to the session discussion by presenting an applied case study of urban water management that integrates participatory processes and multi-stakeholder collaboration. It concludes by highlighting the importance of a comprehensive approach to support the development of context-based impact assessment frameworks, informing more adaptive and sustainable water management and urban policies worldwide.

How to cite: Ottaviani, S., Framba, D., Alberto Munguita Paulino, W., Marzadri, A., Geneletti, D., and Zolezzi, G.: Designing and assessing water management intervention in informal settlements: an international cooperation project in Beira, Mozambique, EGU General Assembly 2026, Vienna, Austria, 3–8 May 2026, EGU26-10154, https://doi.org/10.5194/egusphere-egu26-10154, 2026.

EGU26-11219 | ECS | Orals | HS5.1.5

Next-Generation Decision Support System for Equitable River Basin Water Management 

Amir Rouhani, Michael Rode, and Seifeddine Jomaa

In recent years, the Bode River Basin has experienced prolonged droughts accompanied by widespread forest dieback, intensifying trade-offs between ecosystem protection, agricultural production, and drinking water supply. The Bode basin represents one of the best-monitored meso-scale catchments in Europe, offering a unique opportunity to develop more comprehensive and evidence-based decision-making capabilities. This study leverages this data-rich environment, advanced modelling approaches, and accumulated knowledge on ecological boundaries to develop and demonstrate an integrated digital twin platform as a next-generation decision support framework. The framework is explicitly co-designed to support equitable and multisectoral water allocation among multiple stakeholders under changing hydrological conditions.

The Bode Digital Twin Platform integrates advanced process-based modelling, and data-driven methods within a unified digital architecture. The platform assimilates more than 15 years of high-frequency water quality observations (part of TERENO Observatory), together with meteorological forcing from the German Weather Service (DWD) and hydrological data from the regional flood protection agency (LHW). Furthermore, the platform integrates state-of-the-art modelling capabilities, by coupling fully distributed hydrological and water quality modelling (mHM-Nitrate) with groundwater level simulations (MODFLOW) and machine-learning-based ecological modules. To this end, water temperature and dissolved oxygen concentrations were predicted with high accuracy using a random forest algorithm (R2= 0.93 and 0.75, respectively). This hybrid framework allows, for the first time in the Bode Basin, a consistent cross-scale representation of surface water, groundwater, and key ecosystem indicators. These components are complemented by short-term forecasting modules that support proactive management by anticipating hydrological extremes and water quality risks. A fully automated data ingestion pipeline, based on advanced application programming interfaces (APIs), enables continuous updates and near real-time system operation. This design ensures transparency, transferability, and adaptability to diverse governance contexts and stakeholder needs. We argue that this approach offers a replicable pathway towards more equitable, climate-resilient water governance and long-term water security.

Acknowledgment: This work was supported by the OurMED PRIMA Program project funded by the European Union’s Horizon 2020 research and innovation under grant agreement No. 2222.

How to cite: Rouhani, A., Rode, M., and Jomaa, S.: Next-Generation Decision Support System for Equitable River Basin Water Management, EGU General Assembly 2026, Vienna, Austria, 3–8 May 2026, EGU26-11219, https://doi.org/10.5194/egusphere-egu26-11219, 2026.

EGU26-11537 | Posters on site | HS5.1.5

Integrating High-Frequency Monitoring and Earth Observation for Characterizing Groundwater Dynamics in Northwestern Tunisia 

Aishik Debnath, Manfred Fink, Slaheddine khlifi, Patrícia Lourenço, J. Jaime Gómez-Hernández, Nadim K. Copty, and Seifeddine Jomaa

Groundwater in semi-arid agricultural regions is increasingly threatened by the combined effects of climate variability and intensified anthropogenic water use. This study investigates groundwater abstraction dynamics and aquifer response in the Kalaa Khasba Plain (Northwestern Tunisia) using high-frequency groundwater level observations, complemented by climate indicators and Earth observation (EO) datasets. The study period (2019–2024) captured an ongoing prolonged drought and persistent groundwater depletion in the basin. A novel event-based segmentation of high-frequency groundwater-level data was applied to identify pumping and recovery cycles from pumping induced observation. The pumping segments were used to analyze abstraction behavior across diurnal, seasonal and inter-annual scales.

The results reveal that pumping is strongly seasonal, with peak activity in July-August, and exhibits a pronounced diurnal cycle characterized by shutdowns during evening electricity peak tariff hours. Groundwater levels show a clear long-term decline, and a strong negative relationship with pumping hours, confirming that abstraction is the dominant driver of groundwater depletion in this semi-arid setting. Aquifer transmissivity and storativity were estimated by fitting multi-cycle Theis solutions to the observed drawdown-recovery sequences. This demonstrates that high-frequency groundwater monitoring can capture operational pumping significantly well and can function as a “passive” pumping test while still yielding realistic aquifer parameters, even though some non-uniqueness remains. Integration with EO data further clarifies the links between hydrological conditions and pumping behavior. ERA5-Land soil moisture exhibits robust seasonal cycles and a moderate negative correlation with monthly abstraction, while Sentinel-2 NDVI/NDWI reveal shifts in cropping and irrigation practices and lagged vegetation responses to pumping.

Overall, the study shows that high-frequency groundwater monitoring, when combined with EO, climate indicators and model results, provides a powerful and cost-effective diagnostic framework for understanding groundwater-agriculture interactions in data-scarce, semi-arid regions. The findings highlight the need for improved monitoring, better integration of ground- and satellite-based data with modeling outputs, and targeted management strategies to mitigate long-term groundwater depletion under increasing climatic and anthropogenic pressures.

Acknowledgment: This work was supported by the OurMED PRIMA Program project funded by the European Union’s Horizon 2020 research and innovation under grant agreement No. 2222, and by the project SMART Medjerda: Capacity building in monitoring for intelligent management of the Medjerda water resources, funded through the program of Wallonia Brussels International and Tunisia under grant No. 1.1.2.

How to cite: Debnath, A., Fink, M., khlifi, S., Lourenço, P., Gómez-Hernández, J. J., Copty, N. K., and Jomaa, S.: Integrating High-Frequency Monitoring and Earth Observation for Characterizing Groundwater Dynamics in Northwestern Tunisia, EGU General Assembly 2026, Vienna, Austria, 3–8 May 2026, EGU26-11537, https://doi.org/10.5194/egusphere-egu26-11537, 2026.

EGU26-13513 | Orals | HS5.1.5

Significance of Students’ Mobility Towards Capacity Development  

Layla Hashweh and Luna Bharati

Capacity development is widely recognised as a critical foundation for strengthening climate resilience and advancing effective water resources management across Africa. As climate change intensifies hydrological variability, the capacity of higher education and research institutions to train skilled specialists, generate scientific knowledge, and support evidence-based adaptation becomes increasingly important. In response to these challenges, the German Federal Ministry of Education and Research (BMBF) has supported long-term structure-building collaborations between African and German institutions, notably through the West African Science Service Centre on Climate Change and Adapted Land Use (WASCAL) and the Southern African Science Service Centre on Climate Change and Adaptive Land Management (SASSCAL).

A central element of both initiatives is the implementation of structured doctoral programmes coordinated and academically anchored at the International Centre for Water Resources and Global Change (ICWRGC) in Koblenz. These programmes integrate rigorous coursework, interdisciplinary research, and joint African–German supervision to ensure comparable academic standards and coherence across regions. Within this framework, student mobility to Germany constitutes a key component aimed at enhancing research quality, fostering scientific independence, and strengthening international collaboration.

The presentation investigates the significance of student mobility for capacity development, drawing on qualitative evidence from interviews with doctoral students participating in the SASSCAL Graduate School in Integrated Water Resource Management (SGSP-IWRM). In addition, evaluation interviews were conducted with German supervisors to assess academic performance, professional conduct, institutional and social integration, research progress, and the overall mobility experience. The results of these supervisory evaluations are presented alongside student perspectives.

The analysis explores students’ objectives, supervision experiences, participation in academic activities, perceived benefits and challenges, and overall academic progress. These findings are complemented by supervisors’ assessments, providing a comprehensive view of the mobility experience. The results demonstrate that student mobility makes a substantial contribution to capacity development at both individual and institutional levels. Key outcomes include the advancement of technical and analytical research skills, increased academic independence and leadership capacity, expanded professional networks, enhanced cross-cultural competencies, and strengthened institutional linkages and research visibility.

Despite these positive impacts, several challenges were identified, including constraints related to the duration of mobility periods, limited supervisor availability, and financial and administrative procedures. Based on these insights, the presentation recommends extending mobility periods to a minimum of six months, improving the alignment between supervisor availability and student timelines, streamlining financial and administrative processes, and strengthening pre-departure orientation and support mechanisms. Overall, the study provides evidence-based guidance for optimizing student mobility as a strategic instrument for sustainable capacity development in climate- and water-related research programmes across Africa.

How to cite: Hashweh, L. and Bharati, L.: Significance of Students’ Mobility Towards Capacity Development , EGU General Assembly 2026, Vienna, Austria, 3–8 May 2026, EGU26-13513, https://doi.org/10.5194/egusphere-egu26-13513, 2026.

EGU26-13696 | Orals | HS5.1.5

Science-based information for adaptation to climate change in rainfed agriculture 

Peter Molnar and Mosisa Wakjira

Globally about 60% of our food is produced under rainfed agriculture (RFA), i.e. without significant irrigation infrastructure. In some regions of the world, such as sub-Saharan Africa, Southeast Asia, etc., RFA can cover more than 90% of food production. At the same time, RFA is extremely vulnerable to climate variability and change, through changes in rainfall (timing and intensity) and air temperature (warming and higher evaporative demand). This significantly challenges the future of food security and the livelihoods of farmers in RFA regions, particularly in small-holder subsistence systems. It is therefore a high priority to be able to provide stakeholders in such RFA systems with state-of-the-art information about their vulnerabilities today and in the future, so they can prepare and adapt.

Here we provide an example of such science-based information on the key aspects (climatic, hydrological, agroecological) of the functioning of RFA systems in Ethiopia, combining publicly available gridded climate, soil, land use, and crop data with agrohydrological models and data analytics. We present three main results of such analyses: (a) We show how the temporal characteristics of rainfall can be quantified, particularly the onset of the rainy season and the seasonal distribution of rainfall, which fundamentally determine the growing season water availability, and we show how delays in the rainy season led to measurable crop yield losses. (b) We show how water-limited crop yields (crop yield gaps) within the growing season can be estimated by an agrohydrological modelling framework under present and future climates, and we illustrate where rainfall or temperature changes dominate the response. (c) We show how the potential changes in cropland suitability given by a combination of climatic and soil properties for staple crops can be quantified, allowing good spatial predictions of where/which crops can grow today and in the future.

Ultimately, this work shows that climate change is likely to negatively affect future water availability and crop yields, especially in dry areas across the RFA region of Ethiopia. The anticipated impacts on cropland suitability are potentially severe, leading to elevation-related shifts and an overall reduction in suitable cropland areas for major cereal crops such as maize, teff, sorghum, and wheat. Our methods can be replicated in other RFA regions globally and we argue that such analyses can be a critical source of science-based information needed for risk management and for developing long-term climate adaptation plans for climate resilient crop production.

How to cite: Molnar, P. and Wakjira, M.: Science-based information for adaptation to climate change in rainfed agriculture, EGU General Assembly 2026, Vienna, Austria, 3–8 May 2026, EGU26-13696, https://doi.org/10.5194/egusphere-egu26-13696, 2026.

EGU26-17052 | ECS | Posters on site | HS5.1.5

Downscaled CMIP6 climate projections for Mediterranean water management 

Daniele Secci, Valeria Todaro, Marco D'Oria, and Maria Giovanna Tanda

The Mediterranean region is highly vulnerable to climate change, with increasing pressures on already limited water resources. Reliable and high-resolution climate projections are therefore essential to inform adaptation and mitigation strategies and to support integrated water resources management. Within the framework of the OurMED project (https://www.ourmed.eu), this study contributes to these objectives by providing long-term climate projections at both Mediterranean-wide and local scales.

The study presents projections of precipitation and temperature extending to the end of the 21st century, based on simulations from five CMIP6 General Circulation Models under two contrasting Shared Socioeconomic Pathways: SSP1-2.6 and SSP3-7.0. Due to the current lack of CMIP6-driven regional climate simulations covering the Mediterranean basin, a dedicated dataset obtained through statistically downscaling is employed. This dataset is developed using a hybrid framework that combines convolutional neural networks with quantile delta mapping and spans an extended Mediterranean region. The resulting Mediterranean-scale projections are subsequently downscaled using quantile delta mapping to the eight OurMED demo-sites, which represent diverse climatic and socio-environmental conditions across Europe, North Africa, and the Middle East.

At the Mediterranean scale, the projections indicate a clear and spatially coherent warming signal throughout the century, with magnitude strongly dependent on the emissions pathway. Under SSP3-7.0, mean annual temperatures increase steadily across the basin, with end-of-century anomalies frequently exceeding 4°C in southern and eastern Mediterranean regions. In contrast, under SSP1-2.6, warming is substantially reduced and tends to stabilize after mid-century. These large-scale patterns are consistently reflected at the demo-site level. Under SSP3-7.0, all sites experience pronounced warming, with the strongest increases—on the order of 4–6°C by the end of the century—projected for southern and eastern Mediterranean sites such as Mujib (Jordan), Medjerda (Tunisia), and Sebou (Morocco). Central Mediterranean sites, including Albufera (Spain), Arborea (Italy), and Konya (Turkey), also show substantial warming, while northern sites such as Bode (Germany) and Agia (Greece) exhibit comparatively smaller temperature increases. Under SSP1-2.6, warming is consistently lower across all sites and generally levels off after mid-century.

Precipitation projections exhibit greater spatial heterogeneity and inter-model variability than temperature. At the Mediterranean scale, northern regions show relatively stable annual precipitation, whereas large parts of the central, southern, and eastern Mediterranean display a tendency toward drying, particularly under SSP3-7.0. This signal is reflected at the demo-sites, where northern and more humid locations, especially Bode (Germany), show limited changes, while most southern and eastern Mediterranean sites—including Albufera (Spain), Arborea (Italy), Medjerda (Tunisia), Sebou (Morocco), and Mujib (Jordan)—experience decreasing annual precipitation, exacerbating water scarcity risks.

In addition to changes in mean climate conditions, a set of ETCCDI climate extreme indices is computed at the demo-site level to assess projected changes in temperature and precipitation extremes. Combined with seasonal analysis, these indicators provide a more comprehensive assessment of future hydroclimatic risks and support informed water resources management across the diverse environments represented by the OurMED demo-sites.

This work was supported by OurMED PRIMA Program project funded by the European Union’s Horizon 2020 research and innovation under grant agreement No. 2222.

How to cite: Secci, D., Todaro, V., D'Oria, M., and Tanda, M. G.: Downscaled CMIP6 climate projections for Mediterranean water management, EGU General Assembly 2026, Vienna, Austria, 3–8 May 2026, EGU26-17052, https://doi.org/10.5194/egusphere-egu26-17052, 2026.

EGU26-17864 | Orals | HS5.1.5

Co-Designing Groundwater Governance in Mediterranean Tourism–Agriculture Systems: Evidence from Living Labs in Crete 

Ioanna Anyfanti, Irini Vozinaki, Yulya Korobchenko, Emmanouil Varouchakis, and George Karatzas

This study evaluates how Living Labs, as participatory co-design platforms, can improve groundwater governance in Mediterranean regions where tourism and agriculture compete for water resources. By engaging multi-sector stakeholders in structured, participatory processes, it examines how social learning, trust building, and knowledge co-production can support adaptive, equitable, and context-specific water management solutions.

Across two case study areas in Crete, the Living Lab (LL) process combined participatory workshops and in-depth stakeholder interviews to support inclusive, knowledge-based groundwater governance. The Malia workshop (July 2021) brought together 55 stakeholders from local and regional authorities, water agencies, NGOs, civil society, technical experts, and researchers to introduce the project, present the hydrological and geographical context, and identify local water management needs and roles. Ice-breaking activities, roundtable discussions, Mentimeter surveys, and interactive mapping enabled participants to collaboratively explore challenges and perspectives.

In Agia, the Living Lab process developed through three workshop stages. The first workshop (in March 2024), attended by 47 stakeholders, used a flexible, discussion-driven format with participatory mapping and cooperation exercises to capture sectoral perspectives on water storage and distribution and to embedding corporate stakeholder knowledge into water- management simulation models. A focused technical Living Lab (in March 2025) brought together water- utility experts and researchers to examine groundwater and water- allocation models (PTC and WEAP), address data gaps and irrigation pressures, and initiate data- sharing and model refinement. The third multi-stakeholder workshop (December 2025), involving 16 representatives from agriculture, authorities, and utilities, and science, expanded the process to include governance and equity issues through SWOT analysis, spatial and collaboration mapping, and hands-on decision-making activities. These activities led to stably prioritized, co-designed solutions such as wastewater reuse, rainwater harvesting, improved monitoring, and farmer training. The Living Lab process was further supported by 28 semi-structured interviews (14 per site), which captured detailed insights on groundwater use, governance, infrastructure, climate change, and future needs. The integration of one-to-one interviews helped reveal conflicts within sectors or among stakeholder categories, fostering inclusion and setting the stage for open dialogue sessions during group workshops.

Together, workshops and interviews created a layered participatory framework that links local knowledge, institutional capacity, and scientific modeling. Overall, the findings show that Living Labs create dynamic social learning environments that strengthen stakeholder engagement and collaboration, integrate diverse knowledge sources, and support more transparent and adaptive decision-making for integrated multi-sectoral water management. This approach offers a novel, transferable framework for sustainable water governance in Mediterranean regions facing competing water demands and climate pressures.

This work was supported by OurMED PRIMA Program project funded by the European Union’s

Horizon 2020 research and innovation under grant agreement No. 2222.

How to cite: Anyfanti, I., Vozinaki, I., Korobchenko, Y., Varouchakis, E., and Karatzas, G.: Co-Designing Groundwater Governance in Mediterranean Tourism–Agriculture Systems: Evidence from Living Labs in Crete, EGU General Assembly 2026, Vienna, Austria, 3–8 May 2026, EGU26-17864, https://doi.org/10.5194/egusphere-egu26-17864, 2026.

EGU26-19951 | Orals | HS5.1.5

Building integrated surface and groundwater quality monitoring capacity for climate-resilient IWRM in Ethiopia: a cooperation experience in the Awash–Danakil–Webi Shebele basins 

Stefano Fazi, Yirgalem Esuneh, Sara Pennellini, Nibret Adela, Elisabetta Preziosi, Marco Melita, Stefano Amalfitano, Massimo Spadoni, Segni Lemessa Tsgera, and Barbara Casentini

Climate change is intensifying hydrological extremes and degrading water quality in East Africa, increasing the vulnerability of communities and ecosystems in arid and semi-arid regions. To support evidence-based, climate-resilient water resources management in Ethiopia, the EU–AICS Integrated Water Resources Management programme (EU-IWRM) implemented a multi-level capacity development pathway across the Awash, Danakil and Webi Shebele basins. 
The programme strengthened institutional and technical competencies for integrated surface and groundwater quality monitoring through distance-learning, field-based training, and an advanced laboratory programme at CNR-IRSA in Italy, which also provided hands-on training in key analytical techniques for chemical and microbiological water characterization. 
Ethiopian staff from the Ministry of Water and Energy, Basin Administration Offices, and Regional Water Bureaus were trained in monitoring network design, sampling strategies, data standardization, and statistical reporting. Field campaigns across the Awash basin characterized water quality using physicochemical, inorganic, nutrient, trace-metal and microbiological indicators, following protocols aligned with the EU Water Framework Directive. Complementary laboratory training, both in Ethiopia and Italy, enhanced analytical capabilities and supported the co-development of standardized field forms, harmonized databases, and GIS-based reporting tools. 
Preliminary findings from the three sampling campaigns highlight turbidity, salinity and fluoride concentrations exceeding WHO standards as key challenges that jeopardize water use for both human consumption and irrigation purposes. The experience demonstrates how targeted international cooperation can translate research methodologies into operational monitoring frameworks, reinforcing institutional ownership and supporting long-term water quality governance under increasing climate pressures.

How to cite: Fazi, S., Esuneh, Y., Pennellini, S., Adela, N., Preziosi, E., Melita, M., Amalfitano, S., Spadoni, M., Lemessa Tsgera, S., and Casentini, B.: Building integrated surface and groundwater quality monitoring capacity for climate-resilient IWRM in Ethiopia: a cooperation experience in the Awash–Danakil–Webi Shebele basins, EGU General Assembly 2026, Vienna, Austria, 3–8 May 2026, EGU26-19951, https://doi.org/10.5194/egusphere-egu26-19951, 2026.

EGU26-20064 | Posters on site | HS5.1.5

Groundwater depletion and saltwater intrusion under climate change 

Maria Giovanna Tanda, Daniele Secci, Valeria Todaro, Marco D'Oria, and Irene Pettenati

Coastal aquifers, such as the Grombalia aquifer in northeastern Tunisia, represent strategic freshwater resources that are increasingly stressed by intensive groundwater abstraction and climate change. These combined pressures exacerbate groundwater level decline and can accelerate saltwater intrusion, posing a serious threat to long-term sustainability of the aquifer. A comprehensive assessment of both piezometric evolution and salinity dynamics is therefore essential to support effective groundwater management. This study investigates the current state and future evolution of groundwater levels and salinity in the Grombalia coastal aquifer using a three-dimensional, variable-density numerical modeling framework. A SEAWAT model, coupling MODFLOW for groundwater flow with MT3DMS for solute transport, was developed to simulate freshwater–saltwater interactions. The model was calibrated against observed piezometric heads to ensure an accurate representation of groundwater flow dynamics, after which salinity distributions and freshwater–saltwater intrusion processes were analyzed. A 20-year transient simulation was first performed to reproduce historical groundwater level fluctuations and saltwater intrusion patterns, providing a robust baseline for future assessments. Then, scenario-based simulations extending to 2095 were carried out by forcing the groundwater model with climate change–driven recharge projections obtained from an ensemble of regional climate models (RCMs). Prior to their use, these projections were bias-corrected using local observational data to enhance their reliability at the aquifer scale. The simulation results reveal that climate change exerts a stronger influence on groundwater level decline than on the direct advancement of saltwater intrusion. Projected reductions in recharge under future climate scenarios lead to a substantial lowering of piezometric heads, which in turn indirectly promotes the inland migration of the saltwater wedge and increases chloride concentrations in key pumping wells. These findings highlight the critical role of recharge variability in controlling both groundwater availability and salinization processes in coastal aquifers. 

This work was supported by the PRIMA programme under grant agreement No. 1923, project Innovative and Sustainable Groundwater Management in the Mediterranean (InTheMED). The PRIMA programme is supported by the European Union.

How to cite: Tanda, M. G., Secci, D., Todaro, V., D'Oria, M., and Pettenati, I.: Groundwater depletion and saltwater intrusion under climate change, EGU General Assembly 2026, Vienna, Austria, 3–8 May 2026, EGU26-20064, https://doi.org/10.5194/egusphere-egu26-20064, 2026.

EGU26-20459 | ECS | Posters on site | HS5.1.5

 Stakeholder-Driven Dynamic Systems Modeling for Managing the Water-Food-Ecosystems Nexus in the Konya Closed Basin, Türkiye 

Elif Bal, Ali Kerem Saysel, and İrem Daloğlu Çetinkaya

The Konya Closed Basin in central Türkiye is a semi-arid region of major agricultural significance and a prominent example of escalating challenges related to water scarcity and governance. Despite substantial groundwater potential and the presence of Türkiye’s largest freshwater lake, Lake Beyşehir, the basin has experienced overexploitation of its water resources. This crisis is primarily driven by the cultivation of water-intensive crops and the resulting increase in water demand. Since the 1990s, groundwater levels have declined by approximately 35 meters with recent acceleration leading to sinkhole formation, groundwater salinization, and higher irrigation costs. Besides, increasing water demand, together with limited surface water availability, has intensified pressures on Lake Beyşehir. Although lake water levels exhibit seasonal variation, a clear long-term declining trend is evident. To address these challenges, this study aims to improve understanding of the basin’s complex water management dynamics and to explore integrated policy options that can address water resources management, agricultural production, and ecosystem conservation. To this end, this research employs a dynamic simulation modeling approach that is developed in parallel with the participatory workshops. Three stakeholder workshops were organized to support successive stages of model development.

The first workshop focused on establishing a shared understanding of the challenges facing the basin and identifying the complex relationships among agricultural practices, water governance, and climate trends. The issues identified during this workshop formed the conceptual foundation of the model and informed the selection of key model indicators. The second workshop was designed as a structured visioning exercise intended to inform the development of model scenarios. Participants explored how alternative visions could be realized through concrete actions and interventions. These interventions addressed multiple leverage points, including education, policy, technology, infrastructure, governance, and behavioral change. The identified levers were subsequently used to define scenario parameters and to support the development of an interactive model interface. The third and final workshop focused on stakeholder exploration of the model through the interactive interface, enabling participants to engage with the model and assess the implications of different scenarios.

This study demonstrates that the water management challenges of the Konya Closed Basin cannot be addressed through individual, isolated solutions. Rather, these challenges are multi-layered, arising from interactions of agricultural practices, climatic and hydrological constraints, governance structures, and socio-economic dynamics, and therefore require integrated and coordinated approaches. In the Konya Closed Basin, this participatory approach facilitated the generation of useful insights while strengthening the foundations for integrated and adaptive water management.

Acknowledgement: This work was supported by OurMED PRIMA Program project funded by the European Union’s Horizon 2020 research and innovation under grant agreement No. 2222.

How to cite: Bal, E., Saysel, A. K., and Daloğlu Çetinkaya, İ.:  Stakeholder-Driven Dynamic Systems Modeling for Managing the Water-Food-Ecosystems Nexus in the Konya Closed Basin, Türkiye, EGU General Assembly 2026, Vienna, Austria, 3–8 May 2026, EGU26-20459, https://doi.org/10.5194/egusphere-egu26-20459, 2026.

EGU26-750 | ECS | PICO | HS5.1.7

Fog water as a non-conventional resource for strengthening water security in coastal settlements of the Atacama Desert 

Catalina Contreras, Virginia Carter, Vicente Espinoza, and Camilo del Río

Rural coastal settlements located in hyperarid areas face increasing levels of water insecurity due to limited freshwater availability, the increasing demand by mining industry, and persistent gaps in water governance. In northern coastal Chile, there is a semi-permanent presence of fog, an unconventional water source with the potential to complement existing resources. However, it has not yet been incorporated into territorial planning and water management. Water is harvested using fog collectors and studies in the area mention average yield varies from 1.5 to 7 L/m2/day.

This research examines the current conditions of water supply institutional challenges, local perception, and the potential for fog water harvesting as a complementary resource in the town of Chanavaya, which has approximately 80 inhabitants. This coastal settlement is currently supplied exclusively by tanker trucks that deliver water to a Rural Sanitation System and to self-managed households. This mode of supply entails high operating and environmental costs and limits the volume of water available in the town (between 250 and 300 m3 a month), resulting in water insecurity for residents.

This study proposes a mixed methodological approach. From a social perspective, this research analyses the community's perception of current access to water, its main uses, the problems associated with the existing management model and its costs, knowledge about fog water, acceptance of this unconventional resource, and willingness to pay for it. The research also integrates a normative and institutional document review, interviews with water managers, and household surveys. An estimate of the collectable fog-water potential was also obtained using the numerical model AMARU.

The AMARU model enables the estimation of fog-water potential using meteorological data located at different altitudes, GOES satellite images and a Digital Elevation Model to identify where and how much fog water can be collected. For this research, three climate scenarios were used corresponding to superabundance (1998), mean (2016), and deficit (2019) in fog availability, according to ERA 5 climate reanalysis data. The estimated potential volumes are compared with current water supply, local demand and international standards for access to the resource. These results make it possible to quantify the contribution of this alternative source to reducing gaps in water access and availability.

Preliminary results indicate that fog harvesting could make a significant contribution to reducing dependence on water tankers, increasing water security and promoting domestic and productive activities. This research contributes to the assessment of fog use in human settlements. It represents a step towards water strategies that are resilient to climate change and created in collaboration with the community.

How to cite: Contreras, C., Carter, V., Espinoza, V., and del Río, C.: Fog water as a non-conventional resource for strengthening water security in coastal settlements of the Atacama Desert, EGU General Assembly 2026, Vienna, Austria, 3–8 May 2026, EGU26-750, https://doi.org/10.5194/egusphere-egu26-750, 2026.

EGU26-872 | PICO | HS5.1.7

Public Perception and Acceptance of Desalinated Water in Agadir, Morocco: Challenges and Opportunities for Sustainable Water Management 

Chaima Aglagal, Mohammed Hssaisoune, Yassine Ait Brahim, Nisrine Nouj, Mohammed El Hafyani, Houria Abahous, Soumia Gouahi, Abdelwahed Chaaou, Moussa Ait El Kadi, Hamza Ait-Ichou, Soufiane Taia, and Lhoussaine Bouchaou

The increasing reliance on desalinated water in water-scarce regions has raised concerns about its acceptance and perceived quality. This study aims to assess public perception and acceptance of desalinated water as drinking water in Agadir, Morocco, where it has been supplied since January 2022. The objective is to understand the challenges and opportunities of integrating desalinated water into the urban supply. A survey was conducted with 408 respondents using a questionnaire available in Arabic and French. It covered demographic information, evaluations of past and present drinking water quality, behavioral adaptations (such as using water filters or bottled water), perceived benefits and drawbacks of desalinated water, and the influence of social factors on its acceptance. Beyond the survey, this study includes water quality assessments across different districts of Agadir. These assessments aim to compare the quality of drinking water in various neighborhoods with that of desalinated water directly from the desalination plant. This approach seeks to provide objective data to support discussions about the acceptance and effectiveness of desalinated water as a sustainable solution. Preliminary results indicate that 69.2% of respondents perceive a decline in drinking water quality since the introduction of desalinated water, mainly due to changes in taste, odor, and clarity. Before January 2022, only 18% of respondents rated the water quality as good or very good, a perception that has significantly worsened. Additionally, 70% reported a deterioration in water quality. Regarding acceptance, 36% of respondents expressed reluctance or refusal to drink desalinated water. While some recognize its potential to reduce pressure on groundwater resources, concerns about cost, environmental impact, and organoleptic properties (taste, smell, and appearance) remain substantial barriers. Social and community influences also play a significant role in shaping opinions. The findings highlight the need for targeted awareness campaigns, strict quality control measures, and informed policy adjustments to build public trust in desalinated water. By presenting objective data on water quality and exploring public attitudes, this study provides valuable insights into the social dimensions of desalination projects. It emphasizes the importance of a strategic approach to integrating desalinated water into urban systems, addressing both public concerns and sustainable water resource management. This research contributes to broader discussions on sustainable water solutions.

How to cite: Aglagal, C., Hssaisoune, M., Ait Brahim, Y., Nouj, N., El Hafyani, M., Abahous, H., Gouahi, S., Chaaou, A., Ait El Kadi, M., Ait-Ichou, H., Taia, S., and Bouchaou, L.: Public Perception and Acceptance of Desalinated Water in Agadir, Morocco: Challenges and Opportunities for Sustainable Water Management, EGU General Assembly 2026, Vienna, Austria, 3–8 May 2026, EGU26-872, https://doi.org/10.5194/egusphere-egu26-872, 2026.

EGU26-1272 | ECS | PICO | HS5.1.7

Quantifying Crop Responses to Brackish Water Use Across the Mediterranean with Minimal Input Modelling 

Harsh Nanesha, Maria Cristina Rulli, and Davide Danilo Chiarelli

Water scarcity is tightening its grip on global agriculture as climate change advances, with the Mediterranean facing particular strain. About thirty percent of its 11.32 million hectares of irrigated land overlies saline aquifers, forcing farmers to depend on water of declining quality. Brackish water represents a viable substitute for freshwater, yet its adoption remains limited because current tools for assessing crop specific impacts often require detailed field measurements that are rarely available at regional scale. This study presents a simplified agro hydrological modelling framework designed for first level analysis of salinity effects on crops, soil, and irrigation demand. It operates with a small collection of standard inputs, including climate, soil properties, and irrigation water salinity, allowing consistent application across large areas. The framework is applied to twenty four crops across the Mediterranean under four irrigation strategies: freshwater baseline, brackish water only, brackish water with leaching, and mixed irrigation adjusted to maintain soil salinity at half of each crop’s tolerance level. Across regions influenced by saline aquifers, the leaching based strategy cuts freshwater use by seventy six percent compared with the freshwater baseline, while still maintaining soil salinity within acceptable crop thresholds. At the basin scale, mixed irrigation shows a total water demand of 33.68 cubic kilometres per year with limited salinity stress, providing an effective balance between freshwater conservation and soil protection. Field-level simulations for the Zelba area in Tunisia, using brackish water of 7.2 dS per metre for wheat, barley, and sorghum, confirm the strong performance of management strategies that pair brackish water with targeted leaching. This scalable approach provides rapid and reliable insight into the feasibility of brackish water use, helping farmers and policymakers evaluate irrigation options, protect soil quality, and plan freshwater savings in water-scarce environments.

How to cite: Nanesha, H., Rulli, M. C., and Chiarelli, D. D.: Quantifying Crop Responses to Brackish Water Use Across the Mediterranean with Minimal Input Modelling, EGU General Assembly 2026, Vienna, Austria, 3–8 May 2026, EGU26-1272, https://doi.org/10.5194/egusphere-egu26-1272, 2026.

EGU26-1581 | PICO | HS5.1.7

Inclusive assessment of a pilot rural sanitation project from a human rights and gender perspective 

Sokaina Tadoumant, Moussa Ait El kadi, Chaima Aglagal, Soumia Gouahi, Aya Rais, Khaoula Bakas, Mohammed Hssaisoune, Abdelwahed Chaaou, Iolanda Borzì, and Lhoussaine Bouchaou

This study presents an evaluation of an ecological sanitation initiative in the villages of Assaka and Akal Melloulne, in the Commune of Ouijjane, Province of Tiznit, Morocco. The project sought to enhance rural living conditions by implementing sustainable wastewater management systems based on constructed wetlands. Employing a participatory and gender-sensitive methodology, including field surveys, focus groups, and stakeholder interviews, the evaluation demonstrates significant improvements in environmental health and reductions in household sanitation burdens, particularly for women. The project also fostered strong social ownership. The reed bed treatment systems achieved high purification efficiency, and satisfaction rates were high, with 87% of Assaka and 90% of Akal Melloulne residents expressing positive views. Reported outcomes included improved hygiene, reduced odors, and enhanced quality of life. Strong community engagement and willingness to support future initiatives indicate robust local ownership. Additionally, the reuse of treated water for agriculture supports local economic activities. Despite these successes, further efforts are needed to increase women's participation in income-generating activities. Overall, the project offers a scalable model for rural ecological sanitation in arid regions, contributing to SDGs 5 and 6 (Gender Equality and Clean Water and Sanitation) and aligning with Morocco’s National Sustainable Development Strategy.

How to cite: Tadoumant, S., Ait El kadi, M., Aglagal, C., Gouahi, S., Rais, A., Bakas, K., Hssaisoune, M., Chaaou, A., Borzì, I., and Bouchaou, L.: Inclusive assessment of a pilot rural sanitation project from a human rights and gender perspective, EGU General Assembly 2026, Vienna, Austria, 3–8 May 2026, EGU26-1581, https://doi.org/10.5194/egusphere-egu26-1581, 2026.

EGU26-1735 | PICO | HS5.1.7 | Highlight

Regional impacts of non-conventional water use: the role of water-systems thinking and modelling 

Ruud P. Bartholomeus, Sija F. Stofberg, Marjolein H.J. van Huijgevoort, Mina Yazdani, Janine A. de Wit, and Klaasjan Raat

Although the natural water system and urban water cycle are traditionally considered as separate domains, they are physically strongly connected. The hydrological system supplies water for anthropogenic use, and after use and treatment, wastewater is released from the urban water cycle back to the natural water system. Yet within the broad range of adaptation measures aimed at improving regional water availability, solutions that intentionally leverage these linkages remain underexplored. Exploitation of non-conventional water resources – such as industrial of domestic wastewater – is only recently being explored in temperate climates like in the Netherlands, as a complement to traditional groundwater and surface water supplies. Embracing such circular approaches, instead of the prevailing linear practice in which water is quickly discharged from an area, offers new opportunities for more balanced water allocation to protect the environment that depends so heavily on water resources.

We present examples in which the benefits and risks of cross-sectoral measures have been assessed. These include a brewery initiative in the southern Netherlands applying treated industrial wastewater for subsurface irrigation to reduce agricultural drought stress, the reuse of domestic wastewater for industrial applications, and water reuse for drinking water production. Such approaches have the potential to alleviate pressure on water resources which could benefit other water-dependent functions. Our findings show that a system perspective and clear evaluation criteria are essential to quantify the real potential of such (cross-sectoral) approaches and to identify the propagation of the effects of using non-conventional sources through the regional water system, including associated trade-offs. For instance, determining what proportion of residual water can be used or reused for agricultural drought mitigation requires assessing net effects on other functions, such as nature. Across the examples, we find that the propagation of quantitative effects – both positive and negative – remains insufficiently explored.

We further show that while dedicated models can effectively assess subsystem responses, they may be inadequate when a broader, integrated perspective is needed. Water systems thinking and modelling are increasingly used to analyse complex dynamic water systems, including groundwater systems, and are helpful in studying multiple water uses and planning strategies. Tools as Sankey diagram visualizations, related causal loop diagrams, and resulting system dynamics modelling frameworks help explore the regional feasibility of water (re)use, its potential to reduce groundwater and surface water demand, and the possible synergies and trade-offs between sectors. Additionally, these tools can serve as communication frameworks to engage stakeholders and support users/policy makers in understanding all the interlinkages, benefits and trade-offs of measures. We illustrate these insights with case-study implementations.

How to cite: Bartholomeus, R. P., Stofberg, S. F., van Huijgevoort, M. H. J., Yazdani, M., de Wit, J. A., and Raat, K.: Regional impacts of non-conventional water use: the role of water-systems thinking and modelling, EGU General Assembly 2026, Vienna, Austria, 3–8 May 2026, EGU26-1735, https://doi.org/10.5194/egusphere-egu26-1735, 2026.

EGU26-2078 | ECS | PICO | HS5.1.7

Quantifying the impact of climate change on household water use in mega cities: a case study of Beijing, China 

Yubo Zhang, Yongnan Zhu, Haihong Li, and Lichuan Wang

Amid rapid urbanization and climate change, global urban water consumption, particularly household water use, has continuously increased in recent years. However, the impact of climate change on individual and household water use behavior remains insufficiently understood. In this study, we conducted tracking surveys in Beijing, China, to determine the correlation between climatic factors (e.g., temperature, precipitation, and wind) and household water use behaviors and consumption patterns. Furthermore, we proposed a genetic programming–based algorithm to identify and quantify key meteorological factors influencing household and personal water use. The results demonstrated that water use is mainly affected by temperature, particularly daily maximum (TASMAX) and minimum (TASMIN) near-surface air temperature. In addition, showering and personal cleaning account for the largest proportion of water use and are most affected by meteorological factors. For every 10℃ increase in TASMAX, showering water use nonlinearly increases by 3.46 L/d/person and total water use nonmonotonically increases by 1.14 L/d/person. When TASMIN varies between −10℃ and 0℃, a significant change in personal cleaning water use is observed. We further employed shared socioeconomic pathway scenarios of the Coupled Model Intercomparison Project 6 to forecast household water use. The results showed that residential water use in Beijing will increase by 21%–33% by 2035 compared with 2020. This study offers a groundbreaking perspective and transferable methodology for understanding the effects of climate change on household water use behavior, providing empirical foundations for developing sustainable water resource management strategies.

How to cite: Zhang, Y., Zhu, Y., Li, H., and Wang, L.: Quantifying the impact of climate change on household water use in mega cities: a case study of Beijing, China, EGU General Assembly 2026, Vienna, Austria, 3–8 May 2026, EGU26-2078, https://doi.org/10.5194/egusphere-egu26-2078, 2026.

EGU26-6564 | ECS | PICO | HS5.1.7

Implementation of Non-Conventional Water Resources for Resilient Urban Water Management: insights from the RESWATER project  

Elena Cristiano, Francesco Viola, Roberto Deidda, Aaron Cutajar, Nikos Skondras, Alexandros Kandarakis, Myriam Ben Said, Thouraya Mellah, Yiğit Beydağ, and Manuel Sapiano

The combined effects of climate change and demographic dynamics in the Mediterranean region are expected to exacerbate pressures on freshwater resources and to compromise the capacity of countries to ensure water supply security, defined as the sustained availability of sufficient quantities of safe and reliable water. These challenges will be particularly pronounced in urban catchments, characterized by low elevation, high population density, and hydrological systems that drain towards the sea. Mediterranean urban coastal catchments are especially vulnerable to water scarcity due to high water demand, limited inland freshwater availability, and increasing exposure to anthropogenic contamination from industrial, agricultural, and municipal sources, as well as to seawater intrusion, whereby saline water encroaches into freshwater aquifers, reducing their suitability for use. In this context, the Interreg NEXTMED RESWATER (Non-Conventional Water Resources for Resilient Urban Water Management) project targets critical urban water-demand hotspots and aims to identify trends in water resource availability and demand development to evaluate future risks in ensuring water supply security. RESWATER capitalizes on the results and methodologies developed in previous EU funded projects such as ARSINOE and NAWAMED, as well as on the ongoing NUSTALGIC project, ensuring continuity, knowledge transfer and upscaling of best practices in resilient urban water management. Within the RESWATER project, an online catalogue of decentralized Non-Conventional Water Resources solutions will be delivered, based on the experience gained in seven urban demonstration units, located one in each project partner country (i.e., Malta, Greece, Spain, Tunisia, Turkey, Egypt and Italy). This will form the basis for the development of a policy framework to support resilient Urban Water Management Plans, fostering continuous stakeholder engagement through local Living Labs and a regional Community of Practice. Together, these actions will constitute an integrated capacity building platform, to support policymakers, researchers, municipalities, water authorities, and citizens in the development of resilient cities.

How to cite: Cristiano, E., Viola, F., Deidda, R., Cutajar, A., Skondras, N., Kandarakis, A., Ben Said, M., Mellah, T., Beydağ, Y., and Sapiano, M.: Implementation of Non-Conventional Water Resources for Resilient Urban Water Management: insights from the RESWATER project , EGU General Assembly 2026, Vienna, Austria, 3–8 May 2026, EGU26-6564, https://doi.org/10.5194/egusphere-egu26-6564, 2026.

EGU26-7249 | PICO | HS5.1.7

Looking into the value of non-strategic reservoirs in drylands for social, economic, environmental and cultural sustainability under climate change 

Ana Iglesias, Camila Cristina Souza Lira, Pedro Medeiros, Paulilo Palacio, Francisco Dirceu Duarte Arraes, Luis Garrote, and Muguresu Sivapalan

Across dryland regions worldwide, small non-strategic on-farm reservoirs serve as critical non-conventional water resources that enhance access to water for agriculture and households. This study examines the role of non-strategic reservoirs in drylands in advancing social, economic, environmental, and cultural sustainability in the context of climate change, by providing examples in four case studies in the Mediterranean region, Asia, Africa and Brazil. The results suggest that strategies aimed solely at maximizing farm income frequently expose farmers to extended periods of financial deficit, caused by variable rainfall and amplified by interest rates on borrowed capital. Such financial volatility is particularly problematic for subsistence-oriented, smallholder family farms that dominate these regions. Using a case study from Brazil, we demonstrate that improving financial resilience is possible by maintaining the same principles of water allocation while modestly lowering income targets. The study concludes that by incorporating hydrological uncertainty explicitly and its effects on the finances of local communities, non-strategic reservoirs can be managed more effectively to support livelihoods in dry environments.  


How to cite: Iglesias, A., Souza Lira, C. C., Medeiros, P., Palacio, P., Duarte Arraes, F. D., Garrote, L., and Sivapalan, M.: Looking into the value of non-strategic reservoirs in drylands for social, economic, environmental and cultural sustainability under climate change, EGU General Assembly 2026, Vienna, Austria, 3–8 May 2026, EGU26-7249, https://doi.org/10.5194/egusphere-egu26-7249, 2026.

EGU26-12108 | PICO | HS5.1.7

An integrated master plan to enhance agricultural water reuse at irrigation basin scale 

Stevo Lavrnić, Giuseppe Maistrello, Pietro Drei, Giuseppe Mancuso, Francesca Valenti, and Attilio Toscano

In Mediterranean regions, irrigation demand is rising while conventional water resources are becoming less reliable due to recurrent droughts, competing uses, and environmental constraints. Treated urban wastewater (TWW) is therefore gaining increasing attention as an unconventional resource capable of supplementing conventional irrigation supplies and supporting climate-change adaptation strategies. However, moving from isolated pilot schemes to implementation across large irrigation basins is complex. Reuse at this scale isn't a single pipeline linking one wastewater treatment plant (WWTP) to one field. Instead, it's part of a large, distributed, dynamic irrigation system serving many agricultural fields with varied crops and methods. Numerous, dispersed WWTPs produce TWW of varying quality, and the irrigation network conveys and mixes flows under different conditions.

The key planning challenge is therefore to integrate TWW with conventional sources within a single allocation and operations framework that considers both water quantity and quality. Quantitatively, planners must synchronise TWW and conventional supplies by matching seasonal availability to spatially variable irrigation demand across multiple districts, often under pronounced temporal mismatches that make storage and operational regulation essential. Qualitatively, TWW may contain pathogens and chemical contaminants, requiring preventive risk management throughout conveyance, distribution, and on-farm application. In the European Union, Regulation (EU) 2020/741 formalises these requirements by mandating a site-specific Risk Management Plan (RMP) and defining four reclaimed-water quality classes (A–D) linked to minimum quality standards and intended agricultural uses. Basin-scale planning must integrate volumetric allocation, infrastructure, and compliance considerations across diverse crop–irrigation setups with varying quality-class requirements. Current assessments often treat TWW as isolated; a unified framework combining these aspects is missing.

This study presents a novel, EU-aligned comprehensive methodology to assess and optimise the potential for agricultural reuse of treated wastewater in large, multi-district irrigation basins. The approach is designed to be generally applicable and adaptable to specific case studies, using routinely available stakeholder datasets integrated within a GIS-enabled framework. The methodology comprises six interconnected phases: (i) identification and spatial characterisation of areas suitable for reuse; (ii) area-specific resource–demand water balances (available resources versus irrigation requirements); (iii) assessment of current WWTP effluent quality according to Regulation (EU) 2020/741; (iv) determination of the reclaimed-water quality class required by currently irrigated surfaces based on crop type, irrigation method, and consumption mode; (v) definition of intervention scenarios to maximise reuse potential considering territorial and infrastructural constraints and irrigation needs; and (vi) identification of structural and operational measures prioritised over time to achieve sustainable, efficient, and EU-compliant outcomes.

The methodology was applied in Northern Italy within the Consorzio della Bonifica Renana (CBR) multi-district irrigation system, in collaboration with the local water utility (HERA). The application demonstrates how the framework transforms accessible information into decision-ready priorities, identifying candidate districts, WWTP clusters, and phased intervention portfolios and clarifies key barriers (infrastructure, storage, management, monitoring capacity, and quality-class constraints) while outlining actionable pathways to enable safe, Regulation (EU) 2020/741 compliant reuse at basin scale.

How to cite: Lavrnić, S., Maistrello, G., Drei, P., Mancuso, G., Valenti, F., and Toscano, A.: An integrated master plan to enhance agricultural water reuse at irrigation basin scale, EGU General Assembly 2026, Vienna, Austria, 3–8 May 2026, EGU26-12108, https://doi.org/10.5194/egusphere-egu26-12108, 2026.

EGU26-14695 | ECS | PICO | HS5.1.7

Reservoir classification based on hydrological efficiency to improve water governance in the drylands 

Camila Cristina Souza Lira, Pedro Henrique Augusto Medeiros, and Eva Nora Paton

Water management in dry regions is challenging due to high climatic variability, frequent droughts, and projected climate change, which cause water scarcity. In Ceará, Brazil, water security has historically relied on a dense network of reservoirs of varying sizes and playing distinct roles in the system, but management has focused on a few large reservoirs supplying strategic demands, while thousands of smaller reservoirs remain unmonitored and underused. These small reservoirs are particularly vulnerable to rapid water loss through evaporation, limiting their operation under conventional, risk-avoiding management strategies. Recent work has demonstrated that larger and hydrologically more efficient reservoirs are most appropriate to supply strategic human consumption that requires high reliability of water supply, whereas small reservoirs can be managed under more intense water withdrawal strategies for agricultural use. To support this water management approach, we propose a classification method based on hydrological efficiency, defined as a reservoir’s capacity to convert inflow into reliable withdrawal. The method uses the Triangular Regulation Diagram (TRD) to partition inflows into withdrawals, evaporation, and spillage, integrating reservoir characteristics (capacity, geometry, potential evaporation) and streamflow variability (coefficient of variation). Preliminary results indicate that, adopting a withdrawal threshold of 5% of the inflow, about 14,000 reservoirs (approximately 60% of the total network, which collectively represent only 3% of the total storage capacity of the system), can be allocated for agriculture without compromising human water supply. This study shows that non-conventional, efficiency-based management of small reservoirs can enhance resilience to water scarcity through a clear scientific grounded definition of reservoir classification and their respective roles, improving the use of the existing water infrastructure.

How to cite: Souza Lira, C. C., Augusto Medeiros, P. H., and Paton, E. N.: Reservoir classification based on hydrological efficiency to improve water governance in the drylands, EGU General Assembly 2026, Vienna, Austria, 3–8 May 2026, EGU26-14695, https://doi.org/10.5194/egusphere-egu26-14695, 2026.

Since 2010, Chile’s central basins have faced an extended drought, stressing water systems. Particularly at Elqui River Basin, while direct reuse of treated wastewater is considered a management strategy to address water scarcity, regulatory and socio-economic barriers hinder its implementation. Still, a knowledge gap remains regarding the optimal allocation of such Non-Conventional Waters (NCW) and the systemic impact of reallocating the specifically 'freed-up' freshwater rights at the basin scale.

This study introduces a methodological framework coupling a hybrid Multicriteria Decision Making (MCDM) model with hydrological simulation. To address the complex interdependencies between conflicting decision factors, we apply a DANP (DEMATEL-based ANP) approach. Through a panel of experts, we build an Influential Network Relation Map (INRM) to derive global weights for technical, economic, and environmental criteria. This model prioritizes NCW allocation scenarios initially among competing sectors (e.g. mining, agriculture, urban, and ecosystems) and subsequently at the sectorial scale (e.g. irrigation canal sections).

The resulting prioritization schemes are input into a WEAP model of the basin. We simulate the hydrological trade-offs, evaluating how replacing freshwater with NCW impacts reservoir reliability and water demand satisfaction metrics. The study concludes by discussing the implications of these hybrid allocation schemes for integrated water resource management at the basin scale.

How to cite: Wiener, M. J. and Schulze-González, E.: Application of multicriteria hybrid model to address wastewater reuse strategies: the case of Elqui River basin in Chile, EGU General Assembly 2026, Vienna, Austria, 3–8 May 2026, EGU26-15735, https://doi.org/10.5194/egusphere-egu26-15735, 2026.

EGU26-19477 | PICO | HS5.1.7

Co-production of a remote-sensing based approach for small agricultural reservoirs management in a Mediterranean watershed 

Giulio Castelli, Enrico Lucca, Lorenzo Villani, Yamuna Giambastiani, Riccardo Giusti, Noemi Mannucci, Mehdi Sheikh Goodarzi, Marco Lompi, Enrica Caporali, Davide Danilo Chiarelli, Luigi Piemontese, and Elena Bresci

Small Agricultural Reservoirs (SmARs) are important agricultural drought adaptation measures. However, the monitoring and the management of SmARs is a challenging task in several areas of the Mediterranean, given the limited amount of information and support systems available for such relatively small structures. Recent national-scale mapping in Italy, developed within the CASTLE PRIN project – Creating Agricultural reSilience Through smaLl rEservoirs (https://sites.google.com/view/castleita/home-page), demonstrated the potential of satellite data to identify SmARs systematically. Following these efforts, within the Val D’Orcia Living Lab (https://agwamed.eu/italy-val-dorcia) of the University of Florence, we develop a co-production approach with local stakeholders to create a remote-sensing-based Decision Support System (DSS) for managing water resources in SmARs.

The Orcia watershed - a UNESCO World Heritage Site - is situated in Tuscany, Central Italy. It is morphologically characterized by a succession of hills composed of Pliocene clay, characterized by deep incisions of the courses of gullies and erosive formations typically associated with clay substrates. The soil is intensely cultivated in wide agricultural parcels characterized by simple arable land with sporadic tree crops (olive groves and vineyards) on the highest areas and near the major settlements, with a typical Mediterranean setting. The area is mainly characterized by rainfed agriculture but, in the last decades, farmers increasingly resorted to supplementary irrigation during summer. 

The proposed approach takes advantage of a variety of remote sensing products to analyze the dynamics of emptying and filling SmAR in the area through the analysis of the reservoir area, using  Stage-area-volume (SAV) curves derived from water-borne drone surveys in  the case study and on-site monitoring of water levels. The scale of approach (farm- or watershed-scale) and the findings are validated in participatory meetings at the Living Lab to ensure the developed system meets local needs for water resources monitoring and drought management. The impacts and the possibility of detecting loss of storage volume due to sedimentation are also discussed. The resulting framework can enable the development of cost-effective and scalable tools, ensuring economic sustainability and practical applicability for farm-level and watershed-scale water management. The proposed approach can be out-scaled in other areas of the Mediterranean and further developed for similar water harvesting structures.


This research was partly carried out within the projects: 

  • AG-WaMED Project (CUP B53C22004860003), funded by the Partnership for Research and Innovation in the Mediterranean Area Programme (PRIMA), an Art.185 initiative supported and funded under Horizon 2020, the European Union's Framework Programme for Research and Innovation, Grant Agreement Number [Italy: 391 del 20/10/2022, Egypt: 45878, Tunisia: 0005874-004-18-2022-3, Greece: ΓΓP21-0474657, Spain: PCI2022-132929, Algeria: N° 04/PRIMA_section 2/2021]
  • “Space It Up!” (call ASI n. 687/2022 of 26 July 2022, contract ASI N. 2024-5-E.0, master code: I53D24000060005, WP 7.6), funded by the Italian Space Agency (ASI) and the Italian Ministry of University and Research (MUR)
  • CASTLE project, European Union Next-GenerationEU (National Recovery and Resilience Plan – NRRP, Mission 4, Component 2, Investment 1.1 – D.D. n. 104 02/02/2022 PRIN 2022 project code MUR 2022XSERL4 - CUP D53D23004920006

How to cite: Castelli, G., Lucca, E., Villani, L., Giambastiani, Y., Giusti, R., Mannucci, N., Sheikh Goodarzi, M., Lompi, M., Caporali, E., Chiarelli, D. D., Piemontese, L., and Bresci, E.: Co-production of a remote-sensing based approach for small agricultural reservoirs management in a Mediterranean watershed, EGU General Assembly 2026, Vienna, Austria, 3–8 May 2026, EGU26-19477, https://doi.org/10.5194/egusphere-egu26-19477, 2026.

EGU26-19600 | PICO | HS5.1.7

Projections of future desalination capacity and related risks of maladaptation 

Marina Andrijevic, Adriano Vinca, Edward Jones, Michele Magni, Michelle van Vliet, and Edward Byers

The intensifying global water crisis calls for novel strategies to ensure reliable, equitable, and sustainable water supply. As climate change, population growth, and overuse of conventional freshwater sources push water systems beyond safe planetary boundaries, novel technologies are becoming increasingly central to adaptation strategies. Desalination stands out as a critical yet contested option to enhance water security, particularly in regions exposed to persistent aridity and rising water stress. While technologically mature and rapidly expanding, future developemtn of large-scale desalination capacities remains underexamined as a potential source of maladaptation due to its high energy demand and potential carbon footprint.

Using the data on individual plants from Global Water Intelligence, in this study we provide a global assessment of the evolution and future prospects of desalination. Historical timeseries on capacities of key desalination technologies were combined with climate and socioeconomic indicators into a panel dataset to analyze historical growth patterns and project future trajectories under different Shared Socioeconomic Pathway (SSP) scenarios. Applying random forest regression models, we identified key predictors of national desalination capacity—namely water stress, aridity ,income, population, and urbanization—as drivers of observed and projected trends.

Historically, global desalination capacity expanded from about 250,000 m³/day in 1980 to 122 million m³/day by 2020. While dominated by high-income and arid countries in the past, desalination is projected to accelerate in developing regions—particularly Africa and South Asia—driven by population growth and rising economic activity. Cumulative capacity is projected to at least double (SSP3) or nearly triple (SSP1) by 2060. Scenario comparisons show that socioeconomic development, more than climate dynamics, shapes the scale of desalination dynamics.

To evaluate the emissions footprint of future desalination, we linked energy demand estimates (Magni et al., 2025) with scenario-based assumptions on growth in desalination capacity, including various technological compositions. We find that, owing to population- and economic activity-driven demand for desalinated water, in the scenario of high economic development but continued and increased fossil fuel emissions peak around the year 2070 at around 550 MtCO2/year, but they decrease only to around 400 MtCO2/year later in the century, which is still twice the current levels. In a fragmented development-high emissions scenario, emissions steadily rise to around 300 MtCO2/year in 2100. For a high development-fast decarbonization scenario, emissions from desalination become neutral past 2070.

Our findings highlight desalination’s dual role as both an enabler and potential risk in climate adaptation pathways. Scaling desalination as a sustainable non-conventioonal water (NCW) solution will require integrating renewable energy supply, technological innovation, and proactive governance to minimize maladaptive outcomes. This research informs global debates on water security by quantifying the balance between desalination’s adaptation benefits and its climate-related costs, emphasizing its role within equitable and low-carbon NCW portfolios.

How to cite: Andrijevic, M., Vinca, A., Jones, E., Magni, M., van Vliet, M., and Byers, E.: Projections of future desalination capacity and related risks of maladaptation, EGU General Assembly 2026, Vienna, Austria, 3–8 May 2026, EGU26-19600, https://doi.org/10.5194/egusphere-egu26-19600, 2026.

EGU26-23136 | ECS | PICO | HS5.1.7

Rainwater Harvesting Ponds Suitability maps coupling Hydrological and Socio-Economic criteria, a case study in the Shouf area, Lebanon 

Nicola D'Alberton, Hanan Hassan, Eleonora Forzini, Enrico Lucca, Giulio Castelli, Luigi Piemontese, Elena Bresci, and Guido Zolezzi

RainWater Harvesting Ponds (RWHPs) represent a critical adaptation measure for enhancing water availability for irrigation, reducing downstream surface runoff, and controlling soil erosion in Mediterranean mountain regions experiencing increasing hydro-climatic stress. The Shouf Biosphere Reserve (SBR) area in Lebanon presents an important case study for RWHP implementation, given the presence of hundreds of such infrastructures, built as both private and public initiative from the ‘60s and the climate vulnerability despite the high density of RWHPs in the SBR region, their historical placement was largely experience-based, or politically driven, lacking integrated hydrological, erosion, socio-economic assessment, resulting in widespread siltation and structural failure. Addressing this gap an integrated an evidence-based methodology is proposed that integrates hydrological and socio-economical factors to identify suitable RWHP sites in the area surrounding the SBR and offering a transferable methodology for comparable Mediterranean mountain contexts The study employed a multi-criteria approach integrating Geographic Information Systems (GIS), Multi-Criteria Decision-Making (MCDM), soil erosion modeling through the Revised Universal Soil Loss Equation (RUSLE), and participatory research. The results were obtained and the model calibrated through sensitivity analysis using 400 existing RWHPs mapped in the study area, which were categorized by public and private ownership. Biophysical and socio-economic criteria were integrated, including land use classification, soil data, rainfall patterns, digital elevation models, administrative boundaries, road networks, and water sources. Decision-makers and farmers' consultations provided crucial socio-economic insights and spatial context. The two final suitability maps, one for private and one for public ponds had a spatial distribution with the following statistical quartiles: Q1 = 6.15, Q2 (median) = 6.60, Q3 = 6.96 for private ponds and Q1 = 6.00, Q2 (median) = 6.50, Q3 = 7.00 for public ponds. Field-based site assessments conducted in five high-suitability areas ( >7.5) validated the model outputs, as several sites for RWHP were identified on field, demonstrating good performance of the methodology. The consultations revealed spatial variability in water sources and irrigation practices, confirming the relevance of pond infrastructure under increasing climate variability. However, the study identified the critical need for a cadastral map, currently unavailable in Lebanon, to enable a more realistic implementation process. This study represents the first applied research on RWHP suitability in the SBR area and the first to couple hydrological and socio-economical factors in the Lebanese context. The demonstrated methodology provides a valuable data-based decision support tool that can be scaled up at the national level for RWHP implementation, contributing to climate adaptation strategies in water-stressed Mediterranean regions.

How to cite: D'Alberton, N., Hassan, H., Forzini, E., Lucca, E., Castelli, G., Piemontese, L., Bresci, E., and Zolezzi, G.: Rainwater Harvesting Ponds Suitability maps coupling Hydrological and Socio-Economic criteria, a case study in the Shouf area, Lebanon, EGU General Assembly 2026, Vienna, Austria, 3–8 May 2026, EGU26-23136, https://doi.org/10.5194/egusphere-egu26-23136, 2026.

HS5.2 – Human-Water Systems

Framed through an ecocritical–political ecology lens, this article examines the 2025 Pakistan floods as a socio-natural event in which rivers and floodplain ecologies act back against extractive designs. We integrate critical discourse analysis of state, media, civil-society, and community texts with GIS/remote sensing of flood dynamics, a review of policies and institutions, and semi-structured interviews (n≈20–30). Operationalizing “nature’s resistance” (hydrological, geomorphic, biological, social) against “axes of exploitation” (intensification, enclosure, hardening, neglect), we map lateral spill and avulsion near embanked reaches, backwater accumulations above major barrages, breach clustering around curvature and extractive hotspots, and wetland rebound that stores and slows flows.

Discursively, state sources privilege “act of nature” and encroachment frames, while civil society and community media emphasize infrastructural failure, governance responsibility, and climate justice. Triangulation shows how control-first paradigms concentrate risk, whereas wetland buffers and room-for-river orientations diffuse it and command local support. The study contributes a conceptual synthesis that treats the Indus as an agentive system, a mixed-methods template for socio-natural disaster research, and practical guidance for flood governance: expand floodplain room, manage sediment as infrastructure, invest in nature-based buffers, and align finance with just transitions. These insights inform equitable recovery and adaptive planning across Pakistan’s riverine provinces today.

Keywords: ecocriticism, political ecology, Indus Basin, flood governance, nature-based solutions, disaster discourse, Pakistan 2025 floods

How to cite: Riaz, M.: Ecocritical Perspectives on the 2025 Pakistan Floods: Nature’s Resistance to Human Exploitation , EGU General Assembly 2026, Vienna, Austria, 3–8 May 2026, EGU26-1444, https://doi.org/10.5194/egusphere-egu26-1444, 2026.

EGU26-1860 | ECS | Posters on site | HS5.2.1

How do drought news, emotions, and restrictions influence patterns of water consumption? The case of Cape Town and the Day Zero crisis 

Seunghui Choi, Giuliano Di Baldassarre, and Jonghun Kam

The propagation of anthropogenic drought is shaped by patterns of human consumption, in turn influenced by water restrictions and public awareness. In this study, we develop a sociohydrological model to investigate how social dynamics interact with anthropogenic drought in Cape Town, South Africa, with a focus on the Day Zero water crisis. In particular, we examine how different drivers influence urban water consumption, focusing on: (1) water-use restrictions, (2) emotional narratives expressed in drought-related news media, and (3) the combined effects of water restrictions and media-driven emotional responses. By integrating hydrological dynamics with behavioral responses to policy interventions and media sentiment, the model captures feedbacks between water shortage, public awareness, and water consumption behavior. The interactions between water restrictions and media-driven emotions produce nonlinear and time-varying awareness, which in turn influence the dynamics of urban water consumption. This study underscores the role of news media narratives in influencing public behavior during drought and demonstrates the value of sociohydrological approaches for understanding urban drought risk.

How to cite: Choi, S., Di Baldassarre, G., and Kam, J.: How do drought news, emotions, and restrictions influence patterns of water consumption? The case of Cape Town and the Day Zero crisis, EGU General Assembly 2026, Vienna, Austria, 3–8 May 2026, EGU26-1860, https://doi.org/10.5194/egusphere-egu26-1860, 2026.

EGU26-2902 | ECS | Posters on site | HS5.2.1

Deciphering Heterogeneous Scaling Properties in Urban Drainage Networks 

Hyeonju Kim and Soohyun Yang

Urban drainage networks (UDNs) constitute essential infrastructure for mitigating urban flooding hazards and public health risks by collecting and conveying stormwater and wastewater. Accordingly, much of the existing literature has focused on improving UDN functional performance, typically through detailed process-based modeling approaches. While these methods have substantially advanced UDN design and operational analysis, their intensive data requirements and high computational costs have highlighted the need for complementary perspectives that can infer UDNs’ functional characteristics directly from network topology. Flows within UDNs are predominantly gravity-driven and organized along converging drainage paths, analogous to those observed in natural river networks. This physical resemblance implies fundamental commonalities in the structural organization of UDNs and rivers, motivating the characterization of UDN topology using scaling laws originally found from river networks in a concise and physically grounded manner. Building on this perspective, recent studies have shown that UDNs exhibit self-similarity analogous to that of natural river networks. These findings naturally prompt further inquiry into: (1) To what extent do scaling properties represent a homogeneous feature of UDN topologies? (2) If not, how should heterogeneity in scaling properties be interpreted through functional or physical perspectives? To address these questions, we analyzed ~220 UDNs (~4,000 km) constructed in Seoul (~605 km², ~9.7M people), South Korea, a representative megacity in Asia. Three classical scaling features identified in river networks were applied to UDNs: (i) power function in the area-length relationship (scaling exponent h), (ii) power function in the area exceedance probability distribution (scaling exponent ε), and (iii) a set of Hortonian scaling ratios (i.e., bifurcation, length, and area ratios). For the interpretation of scaling properties in UDNs, we considered ~20 descriptive indicators covering topographic, geometric, structural, and socio-economic domains. We found heterogeneity in the studied UDNs’ scaling properties. First, the power-law scaling exponents, h and ε, exhibited broader distributions and smaller values (0.2 < h < 0.9; 0.05 < ε < 0.41), respectively, compared to those typically reported for natural river networks (0.5 < h < 0.7; 0.40 < ε < 0.46). This reflects the influence of urban constraints, including road layouts and building distributions. Moreover, only about half of the analyzed UDNs simultaneously satisfied the three Hortonian scaling ratios, indicating that hierarchical scaling is not a universal property for UDNs. This heterogeneity in hierarchical scaling is closely linked to network size, drainage efficiency, structural maturity, and specific socio-economic characteristics. Our findings are expected to not only provide a fundamental basis for coupling the structural and functional characteristics of UDNs but also offer a conceptual foundation for bridging the gap between network topology and functional resilience in UDNs.

Acknowledgements

This work was supported by the Creative-Pioneering Researchers Program through Seoul National University and by the National Research Foundation of Korea (NRF) grant funded by the Korean government (MSIT) (No. RS-2025-00523350).

How to cite: Kim, H. and Yang, S.: Deciphering Heterogeneous Scaling Properties in Urban Drainage Networks, EGU General Assembly 2026, Vienna, Austria, 3–8 May 2026, EGU26-2902, https://doi.org/10.5194/egusphere-egu26-2902, 2026.

EGU26-3166 | ECS | Orals | HS5.2.1

Socioeconomic inequality and access to urban water and sanitation services in Brazil’s Southeast Region: a spatial analysis from a human–water systems perspective 

Matheus Zangerolame Taroco, Carlos Henrique Ribeiro Lima, and Vinicius Novaes Almeida

Access to water supply and sanitation services is widely recognized as a fundamental human right and a central component of human–water systems. In countries marked by persistent socioeconomic inequality, however, the provision of these services remains unevenly distributed across space, reflecting long-standing territorial and institutional disparities. Brazil represents a critical case in this regard, combining ambitious universalization targets with significant differences in access to water and sanitation infrastructure across municipalities.

This study investigates the spatial relationship between average household income and access to urban water supply and sanitation services in Brazil’s Southeast Region. The regional focus is justified by the higher completeness and consistency of sanitation data available for the year 2020, which allows for a more robust spatial analysis. Municipal-level income data from the Fundação Getulio Vargas (FGV) were combined with urban service coverage indicators from the National Sanitation Information System (SINISA), specifically the urban water supply coverage index (IN023) and the urban sewerage coverage index (IN047). The analysis was conducted in a GIS environment (ArcGIS Pro). Spatial dependence was first assessed using Global Moran’s I statistics, followed by Local Indicators of Spatial Association (LISA) to identify clusters and spatial outliers. To further explore the interaction between socioeconomic conditions and service provision, income and sanitation LISA results were overlaid, enabling the identification of municipalities where low income and limited access to services coexist spatially.

The results indicate statistically significant positive spatial autocorrelation for income, water supply coverage, and sewerage coverage, suggesting that municipalities with similar socioeconomic and infrastructure characteristics tend to cluster geographically. The combined cluster analysis highlights territorially structured inequalities, including areas characterized by the simultaneous presence of low income and deficient access to water and sanitation services, as well as spatial mismatches where service coverage and income levels diverge. These patterns indicate that disparities in access are not randomly distributed, but instead reflect broader socio-spatial dynamics shaping human–water interactions in the region.

By adopting a human–water systems perspective, this study emphasizes that access to water and sanitation services is closely linked to territorial and socioeconomic conditions. The findings reinforce the importance of incorporating spatial and socioeconomic criteria into water and sanitation planning and demonstrate how spatial statistical approaches can support more equitable and evidence-based public policy design.

How to cite: Taroco, M. Z., Lima, C. H. R., and Almeida, V. N.: Socioeconomic inequality and access to urban water and sanitation services in Brazil’s Southeast Region: a spatial analysis from a human–water systems perspective, EGU General Assembly 2026, Vienna, Austria, 3–8 May 2026, EGU26-3166, https://doi.org/10.5194/egusphere-egu26-3166, 2026.

EGU26-3191 | Posters on site | HS5.2.1

Integration of Systems thinking to Couple Science, Technology, Society, Politics, Policy and Management for Sustainable Water Resources Management 

Chansheng He, Joseph Holden, Martin R Tillotson, Gordon Mitchell, Jouni Paavola, Julia JOrtega-Martin, Glen MacDonald, Lee Brown, and Anna Mdee

Despite tremendous progress in water resources research, technologies, and management, the world is still facing a worsening water crisis. Over 4 billion people lack access to safe drinking water and to safely managed sanitation. Water quality problems due to emerging pollutants, diffuse source pollution, and the spread of invasive species persist globally, and floods and droughts continue to cause huge economic losses and loss of life. Scholars have suggested that the global water crisis is largely a crisis of governance, and that the missing links are effective interactions between researchers and decision makers and systems thinking at multiple scales that are actionable across multiple governances. Here, we promote the integration of systems thinking to couple science, technology, society, politics, policy and management to tackle global water challenges. We identify four key governance priorities to enable the systems approach:1) leadership across multiple institutions; 2) organizations with nested structures and functions to foster long-term institutional capability to implement, monitor and assess solutions, compatible cross agency, sector, and boundary planning and management; 3) platforms for regular, effective, and dynamic discussion, exchange, and interaction among stakeholders for shaping water issues, goals, solutions, methods, and schedules; and 4) multi-level education to promote sustainable value, recognize inequality, and facilitate water saving and protection. Integration and institutionalization of these four key elements across scales, systems, sectors, and boundaries holds the promise to address the global water crisis and ensure a safe, just, and sustainable human-water system for all.

How to cite: He, C., Holden, J., Tillotson, M. R., Mitchell, G., Paavola, J., JOrtega-Martin, J., MacDonald, G., Brown, L., and Mdee, A.: Integration of Systems thinking to Couple Science, Technology, Society, Politics, Policy and Management for Sustainable Water Resources Management, EGU General Assembly 2026, Vienna, Austria, 3–8 May 2026, EGU26-3191, https://doi.org/10.5194/egusphere-egu26-3191, 2026.

EGU26-3985 | Orals | HS5.2.1

Testing Tradition: A Controlled Study on Dowsing Accuracy 

Geneviève Bordeleau, Manon Lévesque, Erwan Gloaguen, and Bernard Giroux

Dowsing is an ancient practice that employs rods or pendulums to locate groundwater and other subsurface features. Although it dates back several millennia and remains widely used today—by private individuals and, in some cases, by municipalities to locate the most easily accessible groundwater sources—dowsing relies largely on intuition and experiential knowledge rather than controlled scientific experimentation. This contrasts with hydrogeology, which emerged as a scientific discipline in the 19th century and is based on empirical observation, modeling, often complemented by other scientific disciplines, which involves significant costs. Field demonstrations of dowsing can appear convincing and are often viewed as cost-effective methods of selecting a location for drilling a new well; however, in regions characterized by sufficient rainfall and favorable geological conditions, groundwater is often ubiquitous. This raises questions about what constitutes a genuine “detection” and complicates meaningful comparisons between traditional and scientific approaches.

In addition to general groundwater, dowsers frequently claim the ability to detect underground drains or pipes. These discrete, well-defined targets provide a more suitable basis for controlled experiments and statistical evaluation. In this context, we present the final results of a controlled dowsing experiment co-designed by a multidisciplinary team of scientists in collaboration with an experienced dowsing practitioner, with the aim of ensuring both methodological rigor and acceptance by the dowsing community.

The experimental setup consisted of a grid divided into 25 cells, within which various objects were buried in selected locations. These objects included iron and plastic pipes, either empty or filled with water. When present, the water varied in composition and conditions, including saline or fresh water, as well as stagnant or flowing water. Participants were asked to scan the grid using either wooden or metal rods and to indicate the cells in which they believed an object was buried.

A total of 54 participants took part in the experiment: 27 with intermediate to extensive prior experience in dowsing, and 27 novices who received basic training before participation. Several participants completed multiple trials to assess reproducibility. The results are analyzed and discussed as a function of object type, dowsing instrument, and prior experience level, providing a quantitative assessment of dowsing performance under controlled conditions.

How to cite: Bordeleau, G., Lévesque, M., Gloaguen, E., and Giroux, B.: Testing Tradition: A Controlled Study on Dowsing Accuracy, EGU General Assembly 2026, Vienna, Austria, 3–8 May 2026, EGU26-3985, https://doi.org/10.5194/egusphere-egu26-3985, 2026.

Large-scale ecological restoration represents a profound human-driven land-use and water management change in semi-arid environments, reshaping coupled human–water systems through complex feedbacks among land use, hydrology, and ecosystem productivity. However, the integrated socio-hydrological consequences of such changes remain insufficiently quantified at regional scales. Here, we synthesize recent empirical evidence from the Loess Plateau and the Mu Us Sandyland in northern China to assess how ecological restoration and related human activities alter soil erosion, water resources, carbon redistribution, and land productivity. Using multi-source remote sensing, socio-economic statistics, GRACE satellite observations, and process-based modelling frameworks, we quantify long-term changes in soil erosion, evapotranspiration (ET), terrestrial and groundwater storage, soil organic carbon (SOC) redistribution, and gross primary productivity (GPP) over the past four decades. Results show that vegetation restoration and ecological infrastructure have substantially reduced soil erosion and enhanced land productivity across the Loess Plateau, particularly since 2000. Concurrently, erosion-induced lateral SOC transport decreased by approximately 21%, indicating a strong coupling between erosion control and regional carbon dynamics. However, these ecological gains are accompanied by increasing water demand. Vegetation greening emerged as the dominant driver of rising ET and GPP, while ecological restoration, irrigation expansion, and mining activities jointly accounted for nearly 80% of observed terrestrial and groundwater storage decline in water-limited regions. These findings reveal reinforcing and counteracting feedbacks in human–water systems, where ecological restoration simultaneously improves ecosystem services and intensifies water stress. Our study highlights the necessity of integrating hydrological constraints into ecological restoration planning and provides socio-hydrological insights for balancing environmental recovery, water sustainability, and human development in semi-arid regions.

How to cite: Gou, F.: Integrated human–water–carbon feedbacks driven by large-scale ecological restoration in semi-arid northern China, EGU General Assembly 2026, Vienna, Austria, 3–8 May 2026, EGU26-4867, https://doi.org/10.5194/egusphere-egu26-4867, 2026.

EGU26-6422 | ECS | Posters on site | HS5.2.1

Emergent heterogeneous scaling regimes in the functional topology of urban drainage networks 

Jihwan Lim and Soohyun Yang

Urban drainage networks (UDNs) are essential public infrastructure systems responsible for the conveyance of stormwater and wastewater. With intensifying urbanization, UDNs have evolved into structurally complex systems whose functional organization is not adequately resolved by conventional graph-based representations. This limitation necessitates a conceptual shift from structure-centric analyses toward functionality-informed topological approaches. One such approach represents UDN layouts within a dual-mapping domain, in which pipe segments conventionally treated as edges are redefined as nodes, while their intersections are encoded as edges. Transformations into the dual-mapping domain enable network-scale comparisons, and facilitate to uncover emergent features of diverse individual complex networks, even further co-evolutionary self-similar characteristics among various networks. These features are captured in the power-law relationship between the dual-node degree k and its probability P(k) with an exponent γ, i.e., P(k) ~ k . Nonetheless, little is known about the physical and mechanistic interpretation of the scaling exponent γ, although its values have been extensively reported across different infra-networks. In addition, dual-mapped representation commonly relies on the Hierarchical Intersection Continuity Negotiation (HICN) method; however, as this method was originally designed for road networks, it fails to capture the convergent and flow-directed nature of UDNs. Consequently, unmodified application of the HICN method can result in unintended merges, disconnections and non-reproducible dual representations. To address these conceptual and methodological limitations, this study adopts the Horton-Strahler order as a constant hierarchical criterion and integrates flow-aligned continuity criterion for merging pipe segments. We further elaborate the understanding of the UDNs’ dual-degree distribution by (1) analytically deriving γ as a function of Horton’s bifurcation and segment ratios in ideal Hortonian networks and (2) interpreting this relationship through fractal dimension to enable quantitative links between scaling and topology. Our analytical results are validated using ~ 200 UDNs in Seoul, Republic of Korea, alongside synthetic drainage networks simulated by Gibbs-model. We find two distinct topological architectures of the dual-mapped UDNs that exhibit either a single or double power-law scaling. While ~50% of the Seoul UDNs and the synthetic networks exhibited self-similarity consistent with ideal Hortonian networks, the dual-node degree distributions of the remaining networks were better described with double power-law characteristics. This double power-law behavior serves as a critical indicator of network heterogeneity, quantitatively reflecting engineering factors such as variations in pipe-type composition, sub-catchment density, and redundancy in critical conduits. Overall, the proposed method significantly improves reproducibility and strengthens the physical interpretability of complex-network indicators, offering a robust tool for monitoring UDN evolution under the pressures of urban expansion.

Acknowledgements

This work was supported by the Creative-Pioneering Researchers Program through Seoul National University and by the National Research Foundation of Korea (NRF) grant funded by the Korean government (MSIT) (No. RS-2025-00523350).

How to cite: Lim, J. and Yang, S.: Emergent heterogeneous scaling regimes in the functional topology of urban drainage networks, EGU General Assembly 2026, Vienna, Austria, 3–8 May 2026, EGU26-6422, https://doi.org/10.5194/egusphere-egu26-6422, 2026.

EGU26-6465 | Posters on site | HS5.2.1 | Highlight

The BERLIN project: Delving into behavioral modelling for evidence-based adaptation policies under complex human-water interactions 

Serena Tagliacozzo, Lujayn Al-Khasawneh, Suwen Jin, Sandra Ricart, and Matteo Giuliani

Water storage systems are crucial for achieving several Sustainable Development Goals amidst evolving climatic and societal conditions. Today, over 58,000 large dams regulate about 46% of the world’s main rivers, which are shaped by both their inherent hydrologic patterns and the choices made by human sectors, who determine how much water to hold in reservoirs and how much to release for different stakeholders’ needs. While mathematical models for water resources processes benefited from centuries of study and development across spatial and temporal scales, the research on human behavioural models and their integration in socio-hydrology frameworks are less advanced. Thus, there is a pressing need to highlight the critical role of human behaviours concerning water systems with coexisting and conflicting water purposes, asking for more accurate and valid water balance simulations when exploring alternative, robust water management strategies able to satisfy competing and multisector societal needs.  

In this context, the BERLIN project aims to construct innovative behavioural models of the human intentions and preferences by leveraging the recent advances in Machine Learning, which allow exploiting the full potential of the unprecedented availability of big observational data, with insights from Social Learning, incorporating stakeholders’ experiences and preferences from a triple-loop approach (risk awareness, risk perception, and risk adaptation) to reinforce the model-based exploration of adaptation policies. Their combination in different climate change hotspots representing semiarid regions, river deltas, and snow-dependent river basins will support the development of behaviourally explicit hydrologic models, providing rigorous retrospective assessments of observed decision-making processes and the generation of reliable and credible projections of the future co-evolution of complex water systems. At the same time, BERLIN will promote knowledge exchange by involving key stakeholders through co-creation processes, collaborative frameworks, and participatory indicators, ensuring that place-based knowledge and end-users’ priorities are embedded in global modelling efforts.

Particular emphasis will be dedicated to elucidating how water systems and societies co-evolve through feedbacks between hydrological dynamics, infrastructural operations and institutional/behavioral drivers. For this purpose, socio-hydrological modelling and hydro-social analysis become increasingly more important to unpack how policies, risk perceptions, inequality, and power-interest (im)balance shape water availability, hazards, and resilience over time. From a sociohydrology perspective, these approaches improve water resource allocation, sustainability, and conflict resolution by integrating human decision-making with physical processes. From a hydrosocial research angle, they support context-specific, equitable, and robust strategies that anticipate behavioral responses, unintended consequences, and long-term dynamics under uncertainty and change across scales and decision-making settings, thus supporting better water resource governance.

Against this background and aligned with the HELPING vision of the Science for Water Solutions Decade, BERLIN promotes anchoring hydrological science in real-world decision-making processes and integrating global datasets with national and local information sources, including in-situ observations. The integration of sociohydrology and hydrosocial research concepts and methods contributes to the understanding of the key interactions and potential loops between global drivers and locally specific water management and governance challenges, explicitly accounting for human responses, non-linear dynamics, feedbacks, and evolving system trajectories. 

How to cite: Tagliacozzo, S., Al-Khasawneh, L., Jin, S., Ricart, S., and Giuliani, M.: The BERLIN project: Delving into behavioral modelling for evidence-based adaptation policies under complex human-water interactions, EGU General Assembly 2026, Vienna, Austria, 3–8 May 2026, EGU26-6465, https://doi.org/10.5194/egusphere-egu26-6465, 2026.

EGU26-7007 | ECS | Orals | HS5.2.1

Flood adaptation: feedback effects of  (non-)protective behaviour on risk perception and other cognitive factors 

Tang Luu, Annegret H. Thieken, Toon Haer, and Philip Bubeck

Individual protective responses, such as preparing emergency devices and retrofitting homes, can help reduce flood damage. Risk perception is often assumed to lead to individual protective behaviour in popular theories, e.g., the Protection Motivation Theory. Yet, empirical studies show weak positive, no, and even negative correlations between risk perception and protective behaviour. This inconsistent relationship is often attributed to a reverse feedback effect, assuming that the implementation of protective measures leads to a reduction of risk perception. The feedback effect has been used in various studies to explain the weak relation between flood risk perception and protective behaviour. However, the existence of the feedback has not been statistically proven in the flood risk domain, yet. Investigating this gap is challenging due to a lack of longitudinal studies, which observe individuals over time, thus being able to establish a temporal relationship between adopted behaviour and risk perception. This study thus explores the reverse feedback effects of protective responses on risk perception, using data from a three-wave longitudinal survey over 1.5 years in Vietnam. With the same reasoning, we further investigate the feedback effects of protective and non-protective responses, e.g., wishful thinking, on other cognitive factors, such as perceived social norms and coping appraisals.

Using structural equation modelling, we do not detect significant reverse feedback effects of protective responses on risk perceptions in our dataset. Neither do we find a feedback effect on social norms and coping appraisals, except for retrofitting homes: this measure increases perceived financial capacity and perceived expectation of the general society on doing so. Given the sample size and the very high retention rate of our dataset (401 initial respondents with a retention rate of 94%), it is highly unlikely that we would not detect a feedback effect with a high or medium effect size. We thus conclude that there is no medium or strong feedback effect on risk perception in our sample. Hence, other explanations should be tested, including the most basic of all: perhaps risk perception is not (always) an important driver of protective behaviour.

By contrast, the adoption of non-protective responses has a highly significant influence on many cognitive factors. Specifically, delaying and denial reduce perceptions of risk, social norms, and coping appraisals, in line with our hypotheses. Wishful thinking, by contrast, increases perceived flood consequences, social norms, and coping appraisals, but reduces perceived flood probability. Fatalism increases the perceived flood consequences and probability, but reduces perceived coping appraisals. We thus recommend that risk communication focuses also on other cognitive factors, such as coping appraisals and social norms, and not only on risk perceptions. More research on the role of non-protective responses in flood risk adaptation and communication is needed to eventually inform policy interventions. The predictive power of behavioural theories may be improved if the relationships between non-protective responses and cognitive factors are better understood. Future studies on other flooding contexts are highly recommended to contextualise our findings.

How to cite: Luu, T., Thieken, A. H., Haer, T., and Bubeck, P.: Flood adaptation: feedback effects of  (non-)protective behaviour on risk perception and other cognitive factors, EGU General Assembly 2026, Vienna, Austria, 3–8 May 2026, EGU26-7007, https://doi.org/10.5194/egusphere-egu26-7007, 2026.

EGU26-9742 | ECS | Orals | HS5.2.1

Source matters: spatial modelling of drinking water sources and vulnerabilities in LMICs 

Rebekah Hinton, Dor Fridman, Barbara Willaarts, and Taher Kahil

Safe and reliable drinking water underpins health, livelihoods, and water security. The way in which water is accessed is an integral component of human-water systems, influencing multiple aspects of water security such as reliability, contamination risk, accessibility, and cost, and influencing hydrological dynamics through patterns of abstraction. Understanding the diversity of water sources is particularly important in low and middle income countries (LMICs), where many households obtain water through direct abstraction that is often unregulated and forms an “unseen” demand within hydrological systems.

To enable global progress tracking, international monitoring has largely classified drinking water sources into two broad groups: “improved” and “unimproved.” While useful for benchmarking access and supporting cross-country comparison, this binary categorisation conceals major functional differences in how and where water is accessed, and obscures distinct vulnerabilities that influence both human wellbeing and hydrological systems. For example, piped networks, boreholes, tanker delivery, and rainwater collection exhibit fundamentally different abstraction patterns and vulnerabilities yet are grouped as “improved,” limiting functional understanding of complex human-water interactions. Despite the importance of drinking water access as the most foundational interface between people and hydrological systems, spatially explicit information on water source types remains limited.

Using geolocated household survey data from Demographic and Health Surveys (DHS) for 53 countries (2010–2024), we produce high resolution (5km) maps of nine functionally meaningful water source groups for LMICs. A multivariate random forest model with spatial cross-validation and global biophysical and socioeconomic covariates is then used to generate 5 km gridded probability estimates of water source use. Model performance is evaluated using hold-out validation and national-level comparisons to Joint Monitoring Programme (JMP) estimates to support validation in countries lacking geolocated data.

Our results reveal large subnational variability in drinking water source types that is masked by improved/unimproved metrics. Notably, while the improved/unimproved dichotomy broadly reflects microbial contamination risk, it fails to capture vulnerabilities related to other dimensions of water security such as reliability, accessibility, and affordability. Maps also highlight hotspots of direct groundwater and surface water abstraction, illustrating where household-level abstraction is particularly important for understanding hydrological systems. By moving beyond the improved/unimproved dichotomy, this work provides new evidence to support hydrological modelling, exposure and vulnerability assessment, and strengthens the basis for integrating human water use into water security assessments.

How to cite: Hinton, R., Fridman, D., Willaarts, B., and Kahil, T.: Source matters: spatial modelling of drinking water sources and vulnerabilities in LMICs, EGU General Assembly 2026, Vienna, Austria, 3–8 May 2026, EGU26-9742, https://doi.org/10.5194/egusphere-egu26-9742, 2026.

EGU26-10977 | ECS | Orals | HS5.2.1

Beyond Profit: Modelling the Socio-Hydrological Impacts of Agricultural Insurance and Drought Adaptation 

Maurice Kalthof, Giuliano Di Baldassarre, Jeroen Aerts, Hans De Moel, and Jens De Bruijn

Agricultural insurance is promoted as a drought-risk management tool, yet evidence on its long-term socio-hydrological impacts and its interactions with other adaptations is mixed, with studies reporting both increased and decreased adaptation uptake due to insurance. We extend the Geographical, Environmental and Behavioural model (GEB)—a fully distributed hydrological model coupled with an agent-based model (ABM), a process-based crop model, and a dynamic farmer adaptation module—by adding two adaptation options (well adoption, crop switching) and two insurance products (traditional indemnity, index insurance). We calibrate the model to an Indian river basin and compare outcomes across hydrological, economic, and risk-oriented metrics. Traditional insurance increases well adoption and profits, but induces lock-in to wells and higher-water-use crops, resulting in 20–50% higher annual water use and 30–60% lower groundwater levels. Index insurance avoids this lock-in, shifts production toward lower-water options, and delivers higher profits with lower basin-wide water use. However, traditional insurance sustains greater crop diversity and a more diffuse irrigation portfolio via groundwater, reducing drought risk: profit variability and losses during consecutive droughts are smaller than under index insurance (~0.039 vs ~0.085 USD m⁻²; ~20% vs ~28%). Spatial patterns indicate that insurance interacts with reservoir effects: uptake is lower in surface-water command areas, whereas index insurance shows relatively higher uptake in these zones, suggesting potential to offset reservoir effects. Finally, we find that the level of available irrigation, rather than simple access, determines whether reservoir effects emerge. Overall, the results show a design trade-off: hydrological and economic outcomes favor index insurance, while risk outcomes can favor traditional insurance, illustrating how ABMs can make these trade-offs explicit. 

How to cite: Kalthof, M., Di Baldassarre, G., Aerts, J., De Moel, H., and De Bruijn, J.: Beyond Profit: Modelling the Socio-Hydrological Impacts of Agricultural Insurance and Drought Adaptation, EGU General Assembly 2026, Vienna, Austria, 3–8 May 2026, EGU26-10977, https://doi.org/10.5194/egusphere-egu26-10977, 2026.

EGU26-11114 | ECS | Orals | HS5.2.1

Adaptive Capacity Disparities: Capturing Resiliency Inequalities in Socio-Hydrological Systems 

Matthew Preisser and Paola Passalacqua

Traditional socio-hydrology models often simplify the human domain, treating populations as homogenous and overlooking disparities that shape real-world flood vulnerability and recovery. This work introduces a socio-hydrology modeling framework that explicitly incorporates community-level differences in adaptive capacity, defined as the degree to which communities can cope with flood events. In this framework, a city is treated heterogeneously, with individual communities having their own characteristics. Using empirical socioeconomic data from diverse metropolitan areas, we parameterize a new Resilience domain to represent inter-community variation in flood recovery, economic growth, and disaster response. Results reveal that disparities in economic conditions between communities can shape resilience outcomes—consistent with Kuznets curve dynamics, where early economic growth may widen recovery gaps before eventual convergence. Additionally, we differentiate between inter- and intra- community inequalities that exacerbate recovery trajectories from temporally compounding flood events. Our results emphasize how empirically based metropolitan socio-economic characteristics shape causal relationships in social-hydrological systems. We show that by incorporating community specific characteristics, city-wide adaptive capacity performance follows the Kuznets curve hypothesis, where increasing economic productivity may unintentionally widen flood resiliency disparities. We further identify how flood resiliency inequalities stem from inter-city, intra-city, and exposure disparities, highlighting how community specific information influences human-flood interactions. Additionally, our model includes an adaptive disaster relief mechanism to simulate the impacts of different resource allocation and response strategies, highlighting how equitable disaster relief policies can reduce resource gaps without compromising overall city growth. By embedding adaptive human behavior, inequality, and policy levers into a systems modeling framework, this study advances socio-hydrology as a tool for assessing coupled human-natural systems in multi-sector dynamics contexts. Our findings underscore the importance of moving beyond average or fixed representations of human systems to inform more equitable and effective urban flood resilience strategies.

How to cite: Preisser, M. and Passalacqua, P.: Adaptive Capacity Disparities: Capturing Resiliency Inequalities in Socio-Hydrological Systems, EGU General Assembly 2026, Vienna, Austria, 3–8 May 2026, EGU26-11114, https://doi.org/10.5194/egusphere-egu26-11114, 2026.

Socio-hydrology has emerged as a critical framework for Integrated Water Systems (IWS) management, emphasising the need to bring governance, policy, and institutional dynamics alongside physical and technical processes. Achieving meaningful integration between social and technical domains presents both epistemological and methodological challenges, requiring the coexistence of quantitative and qualitative forms of knowledge and the development of hybrid, co-creative modelling approaches. Recent advances in Large Language Models (LLMs) offer new opportunities to address this socio-technical divide. These systems can process heterogeneous data sources such as text, images, and video, and translate qualitative information into representations that can be systematically analysed alongside numerical model outputs. LLMs can be embedded within agentic frameworks and be applied to emulate aspects of human reasoning, interaction, and decision-making. This enables the exploration of social behaviours and institutional responses within complex IWS contexts. Our study reviews existing applications of LLMs in IWS research and categorises them according to their use of LLM affordances, particularly in terms of agentic autonomy and the nature of simulated social interactions. Building on this review, we propose a novel approach that employs LLM-based agents as interpretative intermediaries between IWS simulation outputs, policy documents, and stakeholder relationships in decision-making scenarios. Applying such systems to real-world water management problems and conducting statistical and comparative analyses can reveal previously inaccessible relationships and dependencies between social and technical components of IWS, supporting more integrated and adaptive water governance.

How to cite: Rico Carranza, E. and Mijic, A.: The application of LLM agentic frameworks as a bridge between social and technical domains in Integrated Water Systems management., EGU General Assembly 2026, Vienna, Austria, 3–8 May 2026, EGU26-11295, https://doi.org/10.5194/egusphere-egu26-11295, 2026.

Numerical models play a critical role in socio-hydrology, influencing decisions that impact coupled human-water systems. For instance, policy decisions on the allocation of water increasingly rely on hydrological and hydro-economic models that structure the framing of scarcity, priority uses, and the acceptable trade-offs. This, in turn, has wider-reaching effects on both economic uses and hydrological systems as well as biophysical processes in the affected areas. In all of this, models are often seen as neutral entities providing objective information. However, subjectivity arises from assumptions of what is important to model, theories of human behaviour, technical model choices, and uncertainties. Understanding the socio-natural feedback between biophysical states, the assumptions that influence models, and the models’ roles in shaping water governance is crucial to improving transparency and, ultimately, in highlighting potentially more just and sustainable allocations of water that better meet the needs of people and the environment. This research examines the socio-hydrological role of models in the allocation of water resources by understanding models as socially constructed and therefore non-neutral tools that engender or favour certain types of outcomes over others. It takes as a case study the semi-arid Piancó-Piranhas Açu (PPA) Basin in Northeast Brazil, in which allocation of water is an ongoing, negotiated process. This process has been made more complex by a large-scale inter-basin transfer project bringing water to the PPA, resulting in overlapping authority (federal, state, basin committee) interacting to allocate and manage water. It also fundamentally alters hydrological processes in both basins. This study explores the development, characteristics, and uses of models in the PPA basin during the formation of allocation rules, and how these rules have impacted coupled human-water systems.  Through a social construction of technology (SCOT) framework, a grey literature analysis, and semi-structured interviews with modellers, water managers in key institutions at multiple geographic scales, and stakeholders, we reconstruct the development, configuration, and uses of key models. Challenging the notion of models as neutral decision-support tools by examining their implicit role in the framing of scarcity and the legitimisation of particular governance decisions on water allocation, the study aims to support more reflexive, transparent, and socially robust approaches to water allocation.

How to cite: Frolich, E., Whaley, L., and Orieschnig, C.: A socio-hydrological understanding of the use of models in water allocation: the case of the Piancó-Piranhas Açu (PPA) Basin in Northeast Brazil, EGU General Assembly 2026, Vienna, Austria, 3–8 May 2026, EGU26-12827, https://doi.org/10.5194/egusphere-egu26-12827, 2026.

Global groundwater sustainability is a grand challenge that requires diverse approaches to account for local contexts. Yet, global groundwater assessments often focus solely on aggregate physical trends in storage, levels, and fluxes, overlooking the diversity of social and ecological functions provided by groundwater and their associated sustainability challenges. 

Here, we introduce groundwater sustainability puzzles as a concept and approach to identify distinct configurations of human-groundwater system sustainability challenges within heterogeneous landscapes. We apply this new concept and synthesize 17 global datasets on groundwater functions in social-ecological systems (e.g., groundwater-dependent ecosystems, irrigation, climate coupling, etc.) and groundwater system management problems (e.g., depletion, land subsidence, land use change, gender inequality, etc.) through a leading high-dimensional spatial data classification methodology that implements self-organising maps. This data-driven synthesis represents the most comprehensive integration of current data relevant to the global challenge of groundwater sustainability, and generates a refined portrait of the multi-dimensional composition, spatial organization, heterogeneity, and variance of groundwater sustainability challenges worldwide.

In total, we identify and map over 200 groundwater sustainability puzzles worldwide. Each puzzle represents a unique configuration of system functions and management problems, corresponding to a specific setting in which sustainability transformations must take root. Notably, half of global land area, population, and crop production situate within fewer than 20 puzzles respectively, indicating a more tractable problem space than the mapping might initially suggest. 

Groundwater sustainability puzzles help to articulate a coherent system-of-systems problem statement for global groundwater sustainability, bridge the narratives and patterns of global groundwater analyses with local groundwater realities, and strengthen solution networks among researchers and practitioners working in similar contexts. More broadly, the approach offers a new tool for socio-hydrological and hydro-social research to compare systems across regions, facilitate cross-regional learning and network formation, and support context-appropriate pathways to sustainability across freshwater systems.

How to cite: Huggins, X., Gleeson, T., Famiglietti, J. S., Moore, M.-L., and Villholth, K. G.: Global groundwater sustainability puzzles: a coupled human–groundwater systems approach to identify distinct management challenges, strengthen solution networks, bridge global and local scales, and enable pathways to sustainability, EGU General Assembly 2026, Vienna, Austria, 3–8 May 2026, EGU26-13202, https://doi.org/10.5194/egusphere-egu26-13202, 2026.

EGU26-15377 | ECS | Posters on site | HS5.2.1

Public water supply intermittency and unequal urban water access: Insights from hydro-economic multi-agent modeling case studies in the Global South 

Christian Klassert, Jim Yoon, Ankun Wang, Yuanzao Zhu, Jesús Reyes Vásquez, Samer Talozi, Juan Sebastián Hernández Suarez, Hassaan Furqan Khan, and Steven M. Gorelick

Unequal water access will be a major driver of increasing water insecurity in the 21st century, exacerbating the impacts of climate change. An estimated one billion people in cities in low- and middle-income countries currently face varying degrees of public water supply interruptions, subjecting them to unequal water access. This number is expected to grow, as water scarcity intensifies and supply infrastructure deteriorates. Yet, insights into the quantitative effect of water supply intermittency on urban water access inequality are so far limited. Here, we assess insights from hydro-economic multi-agent modeling case studies in South Asia and in the Middle East to analyze the effects of intermittent public water supply on the water security of heterogeneous urban household populations. We find that public water supply interruptions lead to severe disparities in household water consumption across cases. This also leads to household reliance on costly alternative water sources, jeopardizing water affordability. By 2050, climate change and population growth exacerbate the effects of water supply intermittency, causing severe deterioration in water security and increasing water access inequality. The results indicate that improved monitoring of water access inequality and reducing supply intermittency are key to mitigating urban water insecurity in the coming decades.

How to cite: Klassert, C., Yoon, J., Wang, A., Zhu, Y., Reyes Vásquez, J., Talozi, S., Hernández Suarez, J. S., Khan, H. F., and Gorelick, S. M.: Public water supply intermittency and unequal urban water access: Insights from hydro-economic multi-agent modeling case studies in the Global South, EGU General Assembly 2026, Vienna, Austria, 3–8 May 2026, EGU26-15377, https://doi.org/10.5194/egusphere-egu26-15377, 2026.

EGU26-15519 | Posters on site | HS5.2.1

Advancing conceptual modelling to explore resilience-relevant dynamics in coupled human–flood systems 

Glenda Garcia-Santos, Romitha Wickramasinghe, Annekha Chetia, and Shinichiro Nakamura

Socio-hydrological and hydro-social research seeks to understand how water-related risks emerge from dynamic interactions between hydrological processes and social systems. In coupled human–flood systems, resilience-relevant dynamics include processes of long-term social learning and forgetting, the persistence and decay of adaptive capacity, and shifts in societal sensitivity that shape social vulnerability. While human–flood feedback models have improved the representation of non-stationary flood risk, adaptation dynamics are often treated implicitly or as static attributes, limiting insight into these long-term social processes. 

We advance a conceptual socio-hydrological modelling framework in which adaptation as part of social vulnerability is explicitly represented as a dynamic system property, consistent with the IPCC AR6 risk framework. By foregrounding vulnerability, the framework enables exploration of resilience-relevant dynamics in coupled human–water systems. The approach highlights the added value of socio-hydrological modelling for interpreting long-term flood-risk dynamics and adaptation pathways, in line with the IAHS HELPING Science for Solutions agenda.


How to cite: Garcia-Santos, G., Wickramasinghe, R., Chetia, A., and Nakamura, S.: Advancing conceptual modelling to explore resilience-relevant dynamics in coupled human–flood systems, EGU General Assembly 2026, Vienna, Austria, 3–8 May 2026, EGU26-15519, https://doi.org/10.5194/egusphere-egu26-15519, 2026.

EGU26-18350 | ECS | Orals | HS5.2.1

Between groundwater sustainability and irrigation expansion: Evidence from eastern India 

Isabella Gupta, Sudatta Ray, and Mario Soriano Jr.

India is the world’s largest consumer of groundwater for irrigation. Census data reveal an increasing trend in the number of deep tubewells being constructed, raising concerns for the sustainability of groundwater resources. Where regulatory limits on the number of wells or extraction volumes are absent, energy policies governing the availability of electricity for pumping may present an alternative tool for groundwater management, but their effectiveness remains unclear. Eastern India, a region that historically lacked groundwater development despite being touted as possessing great potential for irrigation expansion, has witnessed a recent increase in deep-well drilling even in the absence of electricity subsidies that promoted irrigation expansion in other parts of the country. Here, we study this paradox and its potential implications for sustainability using a novel longitudinal dataset combining hydrogeological and socioeconomic data. We study the growth in irrigation infrastructure between 2000 and 2018, its impact on current and future groundwater stocks and accessibility, and the influence of energy pricing mechanisms for groundwater management. We also examine the geographic distribution of well expansion and its impact on the spatial extent and intensity of cropping activities. Drawing insights from physically based groundwater modeling and econometric analysis, our results underscore the tension between irrigation development to support food security, livelihoods, and the threat of runaway groundwater depletion. Our results also highlight the limitations of using energy pricing as the primary lever for groundwater governance. Lastly, we find that the expansion of wells is uneven across lines of existing socioeconomic inequities in caste and land ownership, emphasizing the need for groundwater governance policies to be anchored not just on hydrogeological factors but on socioeconomic drivers as well.

How to cite: Gupta, I., Ray, S., and Soriano Jr., M.: Between groundwater sustainability and irrigation expansion: Evidence from eastern India, EGU General Assembly 2026, Vienna, Austria, 3–8 May 2026, EGU26-18350, https://doi.org/10.5194/egusphere-egu26-18350, 2026.

EGU26-19699 | ECS | Posters on site | HS5.2.1

Capturing Water Scarcity and Abundance under Change: A Multi-Sector Hydro-Economic Scenario Ensemble Approach for Thuringia 

Simon Werner, Christian Klassert, Dulanjana Wijenaykae, Jasmin Heileman, Edward Digman, Bernd Klauer, and Erik Gawel

Anticipating future water security is essential for sustainable development, food security, and economic stability across regions and sectors. Water scarcity and abundance are increasingly shaped by the combined effects of socio-economic development and climate change, yet their spatial patterns under deep uncertainty have not yet been systematically explored, particularly for regions such as Thuringia in Germany, which has historically been considered water abundant. Previous studies have typically assessed water scarcity using single-sector models or limited scenario frameworks, neglecting sectoral and regionally specific patterns of change. This limits our ability to identify regions that may remain water abundant despite profound change.

This study examines where and to what extent water scarcity and abundance emerge under combined socio-economic and climatic change, and how robust these outcomes are under deep uncertainty. We show that explicitly representing interacting water users within a multi-agent hydro-economic framework fundamentally alters the projected spatial distribution of future water stress and surplus.

Using a high-resolution multi-agent system (MAS) that integrates industrial, household, and agricultural water demands within a large-scale model of Thuringia, we construct an ensemble of water-use trajectories coupled with soil moisture projections from mHM as well as groundwater and surface water projections. These trajectories combine policy adjustments with regionalized SSP–RCP scenarios of population development, GDP, agricultural prices, and climate impacts. We employ econometric water demand functions for industrial water use across 19 districts and household demand across 800 water supply areas. Agricultural water use is represented through the coupled hydro-economic model DroughtMAS, comprising more than 1000 representative agricultural agents calibrated via Econometric Mathematical Programming (EMP) and driven by projected yield anomalies under droughts and hydro-climatic extremes, which are derived from a LASSO-regression–parametrized yield model.

Our results reveal that despite overall declining water use, localized changes—such as urban growth, increasing irrigation demand, and regional declines in water availability —can intensify potential water scarcity. In a broader context, these findings demonstrate that future water risk is not solely climate-driven but driven by a combination of socio-economic development pathways and policy choices. Accounting for these dynamics is therefore critical for identifying resilient regions and developing robust water governance under uncertainty, and provides a framework to explicitly quantify water abundance alongside scarcity within a coupled socio-economic and hydro-climatic system.

How to cite: Werner, S., Klassert, C., Wijenaykae, D., Heileman, J., Digman, E., Klauer, B., and Gawel, E.: Capturing Water Scarcity and Abundance under Change: A Multi-Sector Hydro-Economic Scenario Ensemble Approach for Thuringia, EGU General Assembly 2026, Vienna, Austria, 3–8 May 2026, EGU26-19699, https://doi.org/10.5194/egusphere-egu26-19699, 2026.

Hydrological models, with or without social components, do not just represent social-hydrological systems but they afford particular ways of thinking about, deliberating on and intervening in the world. It is thus important to reflect critically on modelling practices, models and their use in water resources management.

Hydrology has a long tradition of engaging critically with models from an uncertainty perspective. I here complement this perspective with several entry points originating from the social sciences, particularly practice-theoretic and political ecology approaches.

Building on a recent special issue (Alba et al. 2025), I discuss what is special about models, how models establish authority and how models make worlds. I pay particular attention to the role of critical engagements with models in times of post-truth politics. Throughout, I connect the discussion to the ambitions of IAHS’ HELPING decade and draw out lessons for inter- and transdisciplinary water research.

References

Alba, R., T. Krueger, L. Melsen and J. P. Venot (2025). "Modelling water worlds." Water Alternatives 18(2): 214-239.

How to cite: Krueger, T.: How models intervene in the world: different entry points for engaging critically with hydrological modelling, EGU General Assembly 2026, Vienna, Austria, 3–8 May 2026, EGU26-20052, https://doi.org/10.5194/egusphere-egu26-20052, 2026.

EGU26-509 | ECS | PICO | HS5.2.2

When risk reduction backfires: a systematic review of the safe development paradox 

Emanuel Fusinato, Masato Kobiyama, and Mariana Madruga de Brito

Hydrological hazards cause significant impacts worldwide. Yet, risk reduction measures (e.g., levees, insurance, and other structural and non-structural interventions) can unintentionally exacerbate the impacts they aim to mitigate. Indeed, when such interventions disregard the complexities of human–water interactions, they can produce adverse outcomes, including the safe development paradox (SDP) and the levee effect (LE), wherein risk-reduction measures paradoxically increase risk by fostering a false safety feeling. Despite growing attention to these socio-hydrological phenomena, empirical evidence remains fragmented.

To consolidate existing knowledge, we reviewed 56 studies published between 2001 and November 2025 that investigated the SDP and LE in specific case studies. Specifically, we analyzed the methodological approaches used, the variables considered, and the extent to which they provided evidence for or against the occurrence of SDP and LE.

Most studies (69.6%) presented conclusive evidence of the SDP or LE through three primary mechanisms: (a) intensified development in protected areas; (b) reduced preparedness and a false safety feeling; and (c) increased damage resulting from rare and extreme events. Only 5.4% of studies reported mitigation or absence of the SDP or LE, highlighting the role of individual preparedness, existing policy frameworks, and risk awareness as potential mitigating factors. Surprisingly, 42.9% of studies focused exclusively on exposure, ignoring vulnerability or behavioral dimensions associated with false safety feeling. This tendency was especially pronounced in the 2024–2025 papers, 68.8% of which considered exposure alone. However, we argue that exposure alone is insufficient to confirm or refute the SDP or LE as it neglects coping capacity, risk perception, and individual adaptation. Consequently, increases in urbanization or population within protected areas cannot, by themselves, confirm the SDP or the LE.

Most studies (44.6%) examined only the effects of structural measures, disregarding the influence of non-structural measures and individual adaptation. Moreover, flood studies dominated, with few articles addressing landslides, mass movement, and other sediment-related hazards.

Therefore, advancing the understanding of these socio-hydrological dynamics requires integrating preparedness, vulnerability, and risk perception into multi-hazard assessments. Furthermore, the role of non-structural measures in generating unintended consequences should be further studies. This comprehensive approach would enable a better understanding of the diversity of scenarios where the SDP and LE can manifest.

How to cite: Fusinato, E., Kobiyama, M., and de Brito, M. M.: When risk reduction backfires: a systematic review of the safe development paradox, EGU General Assembly 2026, Vienna, Austria, 3–8 May 2026, EGU26-509, https://doi.org/10.5194/egusphere-egu26-509, 2026.

EGU26-768 | ECS | PICO | HS5.2.2

Understanding Human-Water-Nitrogen Relationships: Using System Dynamics to Study Missisquoi Bay, Québec, Canada 

Sarah Van Heyst, Jan Adamowski, and Andreas Nicolaidis Lindqvist

Human alteration of the nitrogen cycle, through the use of fertilizers and fossil fuels, has intensified the flows of reactive nitrogen to the hydrosphere and degraded the quality of water resources. Imbalanced levels of nitrogen in surface water impact both ecological and human wellbeing, promoting the eutrophication of rivers and lakes and subsequently contributing to losses of wildlife, contaminated drinking water sources, increased health risks and water treatment costs, as well as decreased recreational activities and tourism revenue for local economies.

In order to protect water resources and the communities that rely upon them, approaches capable of understanding the complex interactions between humans and water are needed. System dynamics (SD) is a modelling method that maps, quantifies, and simulates the feedbacks that exist between the causes and consequences of an issue, such as surface water pollution. By capturing the long-term behaviour of non-linear systems and identifying potential leverage points, SD provides a holistic perspective that traditional modelling approaches frequently lack.

In this research, SD is employed to study Missisquoi Bay, a culturally significant waterbody located on the border of Québec, Canada and Vermont, USA, that is experiencing counterintuitive nitrogen trends. Over the last 30 years, levels of nitrogen in Missisquoi Bay have remained stable while loads from the Bay’s tributaries, namely the agriculturally intensive Pike River watershed, have increased, highlighting an existing knowledge gap in the region. Understanding and preventing nitrogen pollution is critical as nitrogen can exacerbate the toxicity of harmful algae blooms, which are already a consistent issue in Missisquoi Bay. Nitrogen loadings are also anticipated to increase in the area with future changes to land use and climate.

A quantitative SD model is being developed for the Pike River-Missisquoi Bay system at a monthly timestep to capture the seasonal variabilities of nitrogen dynamics. The resultant model will be used to evaluate: 1) What biogeochemical or socioeconomic processes are the most influential in governing the levels of nitrogen in the Pike River and Missisquoi Bay; 2) How will these processes change over the period of 2025 – 2050 given different climate, land use, and management scenarios; and 3) What pollution prevention strategies would be most effective in protecting the Bay and its surrounding communities?

Stakeholders and decision makers in the region will be able to use the final SD simulation model as a reliable decision support tool to examine the long-term outcomes of their proposed solutions, select strategies capable of reducing stresses on water quality, and answer “what-if” questions. By disseminating this model, other watersheds in Canada seeking to better understand their nitrogen dynamics will be able to use a consistent framework to improve their policy development and management strategies.

How to cite: Van Heyst, S., Adamowski, J., and Nicolaidis Lindqvist, A.: Understanding Human-Water-Nitrogen Relationships: Using System Dynamics to Study Missisquoi Bay, Québec, Canada, EGU General Assembly 2026, Vienna, Austria, 3–8 May 2026, EGU26-768, https://doi.org/10.5194/egusphere-egu26-768, 2026.

EGU26-883 | ECS | PICO | HS5.2.2

Quantifying behavioral responses to dam-breach flooding evacuation drills as a function of demographic factors, socio-cognitive variables, and experiential background. 

Bjorn Krause Camilo, André Felipe Rocha Silva, Julian Cardoso Eleutério, Maria Thereza G. Gabrich Fonseca, and André Ferreira Rodrigues

Extreme hydrological events, particularly dam-breach flooding, pose a growing challenge to risk governance worldwide. These events are characterized by short warning times, rapid flood-wave propagation, and potentially catastrophic downstream impacts. Their likelihood is rising due to interacting drivers, such as intensifying rainfall under climate change and altered runoff from land-use transitions. Especially in the Global South, these pressures converge with increased social vulnerability, making the human dimension an essential component of risk assessment. This study leverages valuable data from Brazil (2024-2025), where evacuation drills are mandated by national legislation. These exercises constitute one of the few systematic, large-scale efforts to observe human behavior during simulated dam-failure scenarios. As such, they provide rare empirical insights into how different groups interpret warnings, mobilize, and evacuate under realistic training conditions. We analyze behavioral responses from drill participants settled in the Self-Rescue Area (SRA) downstream of the Ibirité water reservoir (MG-Brazil), focusing on their mobilization performance after receiving an alert. Using ordinal logistic regression, we examine how alert responsiveness is influenced by demographic factors (e.g., gender and age), socio-cognitive variables (e.g., risk perception, emergency preparation), and experiential background (e.g., prior exposure to flood events). This approach allowed the identification of those characteristics that most strongly predict rapid or delayed evacuation initialization. The evacuation drills are characterized by low participation rates (2.4 ± 0.3%), which is a typical pattern in the Brazilian context. In consequence, statistical tests were realized using single year data from 2024 (n = 80) and 2025 (n = 65), and a combined dataset for 2024-2025 (n = 145). Demographic factors had no significant influence on mobilization. In contrast, socio-cognitive variables and experimental background shaped significantly protective actions: persons with prior drill experience took consistently longer to begin evacuating (2024: OR = 3.18 (p = 0.062) / 2025: OR = 3.01 (p = 0.057) / 2024-2025: OR = 2.61 (p = 0.015)); participation at drill-preparatory seminars were associated with shorter mobilization times (2025: OR = 0.27 (p = 0.032) / 2024-2025: OR = 0.35 (p = 0.015)); and experiential background influenced evacuation initiation positively (2025: OR = 4.11 (p = 0.039)). These outcomes suggest that evacuation drills alone may lead to a false sense of security and slower alarm responses. Educational measures and experience with real risk cues, on the other hand, can reduce reaction time during warnings. Interpreted through a human-water feedback framework, the results illustrate how behavioral responses can alter the effective consequences of extreme hydrological events. Rapid mobilization reduces the number of flood-harmed individuals, while delayed responses can exacerbate vulnerability even when warning systems operate as designed. This study demonstrates the critical value of evacuation drills as an important empirical resource for understanding human behavior during extreme hydrological events. The Brazilian context offers an important contribution from the Global South, where empirical data on human–flood interactions remain underrepresented in hydrological risk research. It is recommended to continue data collection and combine datasets of different local evacuation drills to improve the model’s performance and stability over time.

How to cite: Krause Camilo, B., Felipe Rocha Silva, A., Cardoso Eleutério, J., G. Gabrich Fonseca, M. T., and Ferreira Rodrigues, A.: Quantifying behavioral responses to dam-breach flooding evacuation drills as a function of demographic factors, socio-cognitive variables, and experiential background., EGU General Assembly 2026, Vienna, Austria, 3–8 May 2026, EGU26-883, https://doi.org/10.5194/egusphere-egu26-883, 2026.

As the largest freshwater lake in China, Poyang Lake (PYL) has undergone significant hydrological alterations in recent decades, particularly a continuous decline in autumn water levels, yet the relative contributions of different drivers remain controversial. This study integrates similarity analysis with a Dragonfly Algorithm (DA) optimized Gated Recurrent Unit (GRU) model, forming a control variable framework that explicitly separates timing and magnitude effects of different drivers, enabling quantitative attribution of the effects of the Three Gorges Reservoir (TGR) regulation and channel morphological changes on PYL water level decline.The similarity analysis indicates a structural shift in the hydrological linkage between the Yangtze River and PYL after 2003, marked by a decoupling of mainstream discharge and lake water levels. Scenario simulations indicate that TGR regulation primarily alters the seasonal discharge regime, advancing post-flood water level recession by weakening the backwater effect. In contrast, channel morphological changes, including riverbed incision and cross-sectional enlargement, emerge as the dominant and more persistent control on water level decline. Quantitative attribution shows that about 77% of PYL’s water level decline since 2003 is attributed to channel morphological changes, while about 23% is associated with TGR regulation. Overall, among two primary driving factors, TGR regulation mainly governs the timing of water level decline, while channel morphological changes control its magnitude.

How to cite: Wang, X.: Quantitative attribution of the drivers of Poyang Lake water level changes based on similarity analysis and the DA–GRU model, EGU General Assembly 2026, Vienna, Austria, 3–8 May 2026, EGU26-2047, https://doi.org/10.5194/egusphere-egu26-2047, 2026.

Flood risk is shaped by societal processes, such as “levee effect” and “adaptation effect”. Even though such feedbacks can now be captured by quantitative socio-hydrological models, they have been limited to small case studies due to lack of data. The aim of the European Socio-Hydrological Model (EuroSoHo) is to quantify past and future flood risk dynamics across the continent considering the spatially and temporarily varying human-water feedbacks.

This contribution presents the conceptual framework, outlines methodologies underlying the model, indicates how the necessary data will be obtained and what challenges will need to be addressed in further research. EuroSoHo will be a probabilistic, system dynamics model calibrated using a vast array of historical data covering years 1950-2025. Information from the HANZE (Historical Analysis of Natural HaZards in Europe) database will provide dates, locations and impacts (fatalities, population affected, economic loss) of floods, as well as their hydrological intensity in more than 1400 regions in 42 countries. Dedicated data collection of floodplain exposure changes and flood protection levels will further support establishing values of socio-hydrological parameters (e.g. preparedness, awareness, reactiveness or risk aversion) individually for each region within a uniform framework.

Based on the historical developments of human-water feedbacks, EuroSoHo will be applied to projections of future climate and socioeconomic pathways to estimate the actual changes in future flood risk until 2100. Further, EuroSoHo will quantify the costs and benefits of improving dikes, extending individual preparedness, restrictions on exposure growth, and relocation considering their system-wide positive and negative effects. The results will indicate which combination of adaptation strategies would be most effective under the uncertainty of future climate and socioeconomic developments as well as the unknowable timing of hydrological extremes.

How to cite: Paprotny, D.: The European Socio-Hydrological Model: concept, methods and challenges, EGU General Assembly 2026, Vienna, Austria, 3–8 May 2026, EGU26-3319, https://doi.org/10.5194/egusphere-egu26-3319, 2026.

EGU26-4016 | ECS | PICO | HS5.2.2

Groundwater-Surface Water Interaction in the Upper Ganga-Yamuna Interfluve in Northern India: Impact of Two Centuries of Irrigation and Groundwater Use 

Frank van Broekhoven, Stefan Dekker, Jasper Griffioen, Anjali Bhagwat, and Paul Schot

The Indo-Gangetic Basin (IGB) is currently a global hotspot for groundwater overexploitation. Over the past two centuries, groundwater levels initially rose due to increased recharge from irrigation canals but later declined as extractions for agricultural, municipal, and industrial use intensified. However, the relative impacts of recharge and abstraction sources, such as precipitation, canal leakage, irrigation return flow, and municipal and industrial use, remain unclear, as do the effects on groundwater-surface water interactions and environmental flows. This study quantifies spatio-temporal changes in groundwater recharge and abstraction over the past two centuries and simulates with a groundwater model the effects on groundwater levels and groundwater-surface water interactions in the Upper Ganga-Yamuna interfluve in Northern India. The findings align with previous studies: canal water infiltration after canal construction (>1830) boosted recharge, but increased abstractions have lowered groundwater levels and reduced river discharge since the 1970s. Today, irrigation accounts for the majority of abstractions, with municipal and industrial uses far smaller. From around 2000, abstraction decreased groundwater levels to such extent that local rivers likely shifted from discharging to infiltrating. Groundwater-surface water interactions have weakened, particularly reducing discharge to local rivers. While the Yamuna and Ganges show reduced groundwater exfiltration, they are not (yet) losing. This shift threatens environmental river flows, degrades surface water quality by limiting wastewater dilution, and harms groundwater quality as polluted river water infiltrates, posing risks to both ecosystems and human health.

How to cite: van Broekhoven, F., Dekker, S., Griffioen, J., Bhagwat, A., and Schot, P.: Groundwater-Surface Water Interaction in the Upper Ganga-Yamuna Interfluve in Northern India: Impact of Two Centuries of Irrigation and Groundwater Use, EGU General Assembly 2026, Vienna, Austria, 3–8 May 2026, EGU26-4016, https://doi.org/10.5194/egusphere-egu26-4016, 2026.

The Panta Rhei Scientific Decade (2013–2022) has generated major advances in understanding how hydrological processes and human systems coevolve. This contribution presents the key results synthesized in the book Coevolution and Prediction of Coupled Human–Water Systems, which consolidates insights from over 160 authors and global case studies spanning floods, droughts, agriculture, and transboundary rivers.

The synthesis identifies recurring coevolutionary patterns across diverse contexts, showing how human interventions—such as flood protection, irrigation expansion, and institutional reforms—reshape hydrological dynamics and, through feedbacks in behavior, governance, and economics, produce unintended consequences over time. A central result is the development of a six-component anatomy of coupled human–water systems, integrating hydrology, infrastructure, institutions, society, the economy, and the environment into a unified analytical framework. The book further introduces the concept of critical pathways to identify dominant sequences of interactions that drive risk amplification, maladaptation, or resilience.

Together, these results advance sociohydrology from isolated case studies toward a generalizable science of human–water coevolution, offering practical insights for anticipating long-term system trajectories and informing adaptive water management.

How to cite: Tian, F. and Kreibich, H.: Key Results from the Panta Rhei Synthesis: Coevolution and Prediction of Coupled Human–Water Systems, EGU General Assembly 2026, Vienna, Austria, 3–8 May 2026, EGU26-4716, https://doi.org/10.5194/egusphere-egu26-4716, 2026.

EGU26-5354 | ECS | PICO | HS5.2.2

Evaluating the Impact of Water Policies on Groundwater Resources in Major Water Scarcity Hotspots 

Myrthe Leijnse, Marc Bierkens, and Niko Wanders

Effective water governance is critical for steering water scarcity hotspots toward sustainable water use, yet a systematic meta-analysis of water policy effectiveness across such regions is lacking. Here, we assess the effectiveness of water management policies in six major water scarcity hotspots: California, Central Chile, the Ganges–Brahmaputra Basin, the Murray–Darling Basin, Spain, and the U.S. High Plains.

We combine qualitative and quantitative evidence to evaluate policy effectiveness on groundwater levels. First, we reviewed 102 peer-reviewed case studies to compile a database of implemented water management policies and their reported effectiveness. Second, we analysed long-term groundwater level observations using ARX modelling (autoregressive models with exogenous inputs) to remove climate variability. We then applied multiple breakpoint detection methods on the ARX model residuals to identify systematic changes potentially associated with policy interventions.

Across hotspots, the qualitative literature is generally more critical of policy effectiveness than suggested by observed groundwater responses. According to the literature, regulations on groundwater abstraction and the expansion of unconventional water resources are policy categories that are most frequently associated with positive outcomes, while integrated water management approaches are reported as least effective. Consistently, our quantitative analysis most strongly associates groundwater regulation, unconventional water resources, and measures to improve water use efficiency with groundwater stabilization or recovery. The effectiveness of policy categories, however, varies considerably across regions, emphasizing the need for localized and context-specific solutions.

How to cite: Leijnse, M., Bierkens, M., and Wanders, N.: Evaluating the Impact of Water Policies on Groundwater Resources in Major Water Scarcity Hotspots, EGU General Assembly 2026, Vienna, Austria, 3–8 May 2026, EGU26-5354, https://doi.org/10.5194/egusphere-egu26-5354, 2026.

EGU26-5905 | ECS | PICO | HS5.2.2

Human-water-environment feedbacks: A framework for mosquito-borne arboviral diseases in Prosopis juliflora landscapes of Kenya’s Rift Valley 

Tasneem Osman, Eric Fevre, Sandra Junglen, and Christian Borgemeister


Mosquito-borne disease Infections are becoming increasingly hazardous in fragile ecological areas. Such areas are characterized by inextricably linked hydrological fluctuations and human activities. Understanding how these processes interact is crucial to understanding the geographical and temporal persistence of arboviral disease risk. We develop a conceptual framework for arboviral transmission within an integrated human-water-environment system, with mosquito ecology acting as the primary biological mediator. The framework is designed based on extensive field visits in Kenya's Rift Valley underpinned by a literature review. Prosopis juliflora is given special attention, as this invasive alien woody plant has significantly altered riparian and floodplain ecosystems in the valley. The framework demonstrates how changes in terrestrial ecosystems and water regimes influence mosquito habitats, vector survival and host interaction, and, ultimately, human health. Prosopis-dominated landscapes could facilitate adult mosquito survival and persistence as well as arboviral transmission under flood and drought conditions. These processes are attributed to enhanced vegetation density, shade, and microclimatic humidity surrounding water bodies. Arboviral transmission persists in landscapes that are rapidly changing due to climate extremes, land degradation, and the spread of invasive alien plant species. The concept also emphasizes bidirectional feedback.  It demonstrates how disease burden can exacerbate socioeconomic vulnerability, resource dependency, and ill-oriented practices that promote the spread of invasive species. This framework underscores the importance of an integrated approach for tackling mosquito-borne disease threats in climate-sensitive landscapes that are undergoing fast ecological change.


How to cite: Osman, T., Fevre, E., Junglen, S., and Borgemeister, C.: Human-water-environment feedbacks: A framework for mosquito-borne arboviral diseases in Prosopis juliflora landscapes of Kenya’s Rift Valley, EGU General Assembly 2026, Vienna, Austria, 3–8 May 2026, EGU26-5905, https://doi.org/10.5194/egusphere-egu26-5905, 2026.

China faces chronic water scarcity and strong spatial-temporal mismatches between water availability and demand, with particularly severe stress in North and Northwest China. Rapid urbanisation, industrial restructuring, and expanding irrigated agriculture have intensified competition among domestic, irrigation, manufacturing, and thermal-cooling water uses. These dynamics reflect coupled human-water feedbacks: socio-economic development reshapes withdrawals, while evolving water constraints and hydroclimatic extremes influence exposure, management responses, and future demand trajectories. A key gap is to causally attribute multi-sector water-use changes to socio-economic and hydroclimatic drivers and to anticipate how their co-evolution may reshape water-use hotspots.

We analyse a new 0.1° gridded dataset of monthly sectoral water withdrawals for China (1965-2022), focusing on emerging domestic-use hotspots and their interaction with other sectors as a first step towards diagnosing cross-sector trade-offs and human-water feedback pathways. National annual domestic withdrawals increased from 1.9×10¹⁰ to 9.3×10¹⁰ m3 (1965-2022). A piecewise linear fit indicates three growth phases and a recent slowdown: moderate growth before 1975, faster growth during 1976-1992, rapid acceleration in 1993-2010 (slope = 2.3×10⁹ m3yr-1), and a weaker, statistically noisy trend in 2011-2022. Despite the volume increase, domestic seasonality remains stable (amplitude ratio = 0.19; JJA share = 27%).

At the grid-cell level, we compute (i) the long-term trend in annual domestic withdrawals (1965-2022), (ii) relative seasonal amplitude, and (iii) mean annual domestic use in 2000-2022. Hotspots are cells exceeding the 75th percentile in all three metrics. They occupy 17.5% of valid land cells yet account for 24.3% of recent domestic withdrawals and 10.9% of the national domestic-use increase over 2000-2022. The correlation between local trends and recent mean use is extremely high (r = 0.99), indicating growth is concentrated where domestic withdrawals are already substantial, typically along rapidly urbanising corridors.

A complementary multi-sector analysis shows total withdrawals rise from 3.7×10¹¹ to 5.4×10¹¹ m3yr-1 across 1965-1989, 1990-2009, and 2010-2022. Irrigation remains dominant (80%, 68%, 64% of mean withdrawals), but its contribution to growth turns negative in 1990-2009, when domestic and thermal-cooling withdrawals explain 85% and 68% of the net increase. Together, these patterns indicate a transition from an irrigation-dominated regime to a more complex urban- and energy-driven water-use system, with domestic hotspots emerging as critical pressure points for water security.

Ongoing work links these patterns with socio-economic indicators and hydroclimatic variables using Neural Granger Causal and PCMCI+ frameworks, and couples them with deep learning prediction under plausible population, urbanisation, and climate trajectories to assess future hotspot shifts and inform adaptive, resilient water management.

How to cite: Hao, W., Yan, D., Cominola, A., and Castelletti, A.: High-resolution Reconstruction and Causal Framing of Multi-sector Water Withdrawals in China: Emerging Domestic Hotspots and Shifts in Coupled Human-water Regimes, EGU General Assembly 2026, Vienna, Austria, 3–8 May 2026, EGU26-6924, https://doi.org/10.5194/egusphere-egu26-6924, 2026.

EGU26-7523 | ECS | PICO | HS5.2.2

Longitudinal assessment of changes in household flood resilience in Ho Chi Minh City, Vietnam 

Yamile Villafani, Jung Hee Hyun, Andrea Cominola, and Nivedita Sairam

Flood resilience reflects the capacity to anticipate, withstand, and recover from flood impacts through a combination of available resources and adaptive responses. Despite its prominence in flood risk research, flood resilience is rarely measured empirically in urban environments, where exposure and vulnerabilities evolve dynamically over time. This study examines changes in household-level flood resilience in Ho Chi Minh City (HCMC) between 2020 and 2023 using two longitudinal survey waves (1,000 and 750 households, respectively, including a panel of 560 households that participated in both surveys). Our goal is to identify trends and dynamics of different resilience dimensions over time, along with the drivers of persistent vulnerability. We develop a multi-stage data-driven approach that combines indicator screening, dimension construction, and statistical modelling. A comprehensive set of survey-based indicators capturing flood characteristics, socioeconomic conditions, behavioural responses, and flood damage are first formulated to represent human, social, physical, financial, and natural capitals (5C). Tree-based models are then applied to identify the feature importance associated to the factors most strongly related with changes in flood outcomes. Based on this screening, selected indicators are then aggregated into latent resilience dimensions corresponding to the 5R framework (robustness, redundancy, resourcefulness, rapidity, and recovery). These are combined, producing individual 5R scores and an overall resilience score. The longitudinal design enables comparison of resilience profiles over time and supports the analysis of variation in resilience within Ho Chi Minh. By linking observed household-level capacities to resilience processes, this study supports the empirical measurement of systemic resilience and provides actionable insights for flood risk reduction and adaptation planning in rapidly urbanising flood-prone contexts.

How to cite: Villafani, Y., Hyun, J. H., Cominola, A., and Sairam, N.: Longitudinal assessment of changes in household flood resilience in Ho Chi Minh City, Vietnam, EGU General Assembly 2026, Vienna, Austria, 3–8 May 2026, EGU26-7523, https://doi.org/10.5194/egusphere-egu26-7523, 2026.

EGU26-7663 | PICO | HS5.2.2

Spatial and temporal patterns in water limitations caused by human water use in the conterminous U.S. 

Edward (Ted) Stets, Althea Archer, Matt Cashman, Anthony Martinez, Olivia Miller, and Kathryn Powlen

Water availability is fundamentally important to human well-being, economic vitality, and ecosystem health. The United States Geological Survey (USGS) recently completed a comprehensive assessment of water availability in the United States which included water supply, human water consumption, water quality, and ecological flows.  The assessment relied upon national-scale models of natural and human processes including hydrologic conditions and human water consumption.  Surface water total nitrogen and phosphorus concentrations were assessed along with groundwater nitrate and arsenic concentrations and ecologically relevant streamflow alteration.  From 2010–2020, around 27 million people lived in areas where water consumption was > 80 % of water supply and therefore likely to experience regular water limitations. Water limitation was most severe in areas with high withdrawals for crop irrigation.  The areal extent of potential water limitation was greatest in 2012–2013 during an unusually hot and dry period and coincided with elevated withdrawals for crop irrigation.  Total nitrogen and phosphorus concentrations were elevated in surface water in many parts of the conterminous U.S. (CONUS), particularly agricultural areas.  Regional comparisons showed that areas with the most severe water use imbalances also tended to have the highest concentrations of nutrients in surface waters and groundwater contaminants.  The analysis highlights the multifaceted ways that excessive human water consumption can create water availability limitations.

How to cite: Stets, E. (., Archer, A., Cashman, M., Martinez, A., Miller, O., and Powlen, K.: Spatial and temporal patterns in water limitations caused by human water use in the conterminous U.S., EGU General Assembly 2026, Vienna, Austria, 3–8 May 2026, EGU26-7663, https://doi.org/10.5194/egusphere-egu26-7663, 2026.

Local development in reservoir catchments is often sensitive and contested, as drinking-water protection frequently imposes strict constraints on land use and local livelihoods. This study examines the tea industry in Pinglin, a rural area in northern Taiwan located within the Feitsui Reservoir catchment, to analyze how local economic development has interacted with environmental policy—particularly water resource conservation—and how these interactions have shaped tea landscapes over time. Using a socio-ecological systems (SES) framework, the study employs qualitative methods including literature review, participant observation, in-depth interviews, and public participation geographic information systems (PPGIS). These approaches document landscape and industry change and frame the tea industry as an outcome of interactions between land governance and water governance.

Tea cultivation in Pinglin was introduced during the Qing dynasty, consolidated under Japanese colonial rule, and expanded after World War II, eventually becoming one of Taiwan’s best-known tea-producing regions. Transportation infrastructure emerged as a key driver of this process. Successive mobility corridors—from the Danlan Ancient Trail, to the Beiyi Road, and later an extensive network of industrial roads built between the 1970s and 2000s—connected producers to markets, supported settlement formation, and aligned Pinglin’s tea economy with Taiwan’s broader economic growth. During the 1980s and 1990s, these dynamics transformed a diverse agricultural mosaic of rice paddies, orchards, and tea gardens into landscapes dominated by tea plantations.

This development trajectory shifted with the completion of the Feitsui Reservoir in the 1980s, which supplies drinking water to the Greater Taipei metropolitan area. The designation of a water source protection zone introduced increasingly strict land-use regulation, constraining the expansion and transformation of tea production and raising concerns related to residential land rights and housing justice. A second turning point followed the opening of National Freeway No. 5 in 2000, which reduced Pinglin’s role as a transportation node. Declining visitor numbers, population out-migration, and long-standing demographic aging combined to intensify economic challenges and weaken the social foundations of the tea industry.

Local actors responded through multiple adaptation strategies, including mechanization, organic farming, cooperative production arrangements, and tourism-oriented initiatives. However, many of these efforts were limited by stringent land-use controls that restricted diversification and spatial reconfiguration. At the governance level, limited channels for local political participation further constrained adaptive capacity. Following administrative restructuring in 2010, local representation in this small-population area remained weak, contributing to a governance configuration increasingly oriented toward external and centralized water-resource priorities, with bottleneck effects on local development.

Overall, the Pinglin tea industry emerges not simply as an outcome of environmental conditions, but as a dynamic product of transportation infrastructure, central policy intervention, land-use regulation, and local power relations—most critically, strict land-use control under reservoir water governance. Future work should both examine land-use–water quality relationships and explore environmentally friendly practices and locally applicable water-governance approaches. Strengthening meaningful local participation, through participatory platforms and more representative governance arrangements, may help advance reservoir catchment management that better balances conservation goals with equity and local development needs.

How to cite: Lu, D.-J. and Chen, J.-J.: Water Governance, Land-Use Control, and Local Development in a Reservoir Catchment: The Pinglin Tea Industry, Taiwan, EGU General Assembly 2026, Vienna, Austria, 3–8 May 2026, EGU26-8015, https://doi.org/10.5194/egusphere-egu26-8015, 2026.

EGU26-8507 | ECS | PICO | HS5.2.2

Meta-analysis on theoretical framework, method and data for coupled human-water systems: decadal progress and future directions 

Haoyang Lyu, Fuqiang Tian, Leyang Liu, Ana Mijic, and Jing Wei

Coevolution of coupled human-water systems (CHWS) is critical for long-term sustainable water management, linking to Panta Rhei. However, study of CHWS suffers from complexity brought by diverse natural and social science disciplines. In this study, we investigated the general landscape of the theoretical frameworks, methods and data in CHWS case studies. Our meta-analysis, encompassing 205 cases, draws on eight proposed theoretical frameworks in four typologies, quantifying the prevalence and geographical distribution of methods and data. Results demonstrated the analytical strength of sociohydrology for CHWS, underscoring the need to integrate multidisciplinary theoretical frameworks. Combination of qualitative and quantitative methods and data would help overcoming the limitations of each method when used in isolation, broadening the research scope of disciplines. This requires sociohydrology to enhance its ability of integrating diverse research approaches. The uneven global distribution of CHWS research teams calls for the necessity of increasing collaboration and resource sharing across borders.

How to cite: Lyu, H., Tian, F., Liu, L., Mijic, A., and Wei, J.: Meta-analysis on theoretical framework, method and data for coupled human-water systems: decadal progress and future directions, EGU General Assembly 2026, Vienna, Austria, 3–8 May 2026, EGU26-8507, https://doi.org/10.5194/egusphere-egu26-8507, 2026.

EGU26-9111 | ECS | PICO | HS5.2.2

Escalating lifetime water deficit for younger generations 

Inne Vanderkelen, Édouard L. Davin, Jessica Keune, Diego G. Miralles, Yoshihide Wada, Hannes Müller Schmied, Simon Gosling, Yadu Pokhrel, Yusuke Satoh, Naota Hanasaki, Peter Burek, Sebastian Ostberg, Luke Grant, Sabin Taranu, Matthias Mengel, Jan Volkholz, Carl-Friedrich Schleussner, and Wim Thiery

Water scarcity is a growing concern in many regions worldwide, as demand for clean water increases and supply becomes increasingly uncertain under climate change. Developing socio-economic conditions and growing population increase water demands, while climate change leads to changes in freshwater availability. Water scarcity assessments typically rely on static biophysical measures within discrete time windows, using fixed population and climate change projections, while overlooking demographic dynamics, lifetime evolution, and cumulative deficits across generations.

Here, we calculate monthly water deficits based on sectoral, population-driven demand and water availability worldwide by combining demographic data with an ensemble of global climate and hydrological models from the InterSectoral Impact Model Intercomparison Project (ISIMIP2b). By linking these deficits with gridded population projections and life expectancy, we estimate the proportion of lifetime water demand that remains unmet per individual. Thereby we capture how shifting hydro-climatic and demographic conditions shape water scarcity across generations.

Our analysis shows that younger generations will bear a significantly greater share of lifetime water scarcity. Across all regions, younger generations will face higher lifetime water deficits compared to older generations. Without adaptation, a child born in 2020 is projected to experience 45% of their lifetime water demand unmet. Approximately 706 million children are expected to encounter deficits exceeding half of their lifetime needs—1.5 times more than individuals aged 50–59. This intergenerational disparity is primarily driven by population growth and rising life expectancy in areas with limited adaptive capacity. These findings underscore the urgent need for accelerated adaptation strategies to safeguard water security for future generations.

How to cite: Vanderkelen, I., Davin, É. L., Keune, J., Miralles, D. G., Wada, Y., Müller Schmied, H., Gosling, S., Pokhrel, Y., Satoh, Y., Hanasaki, N., Burek, P., Ostberg, S., Grant, L., Taranu, S., Mengel, M., Volkholz, J., Schleussner, C.-F., and Thiery, W.: Escalating lifetime water deficit for younger generations, EGU General Assembly 2026, Vienna, Austria, 3–8 May 2026, EGU26-9111, https://doi.org/10.5194/egusphere-egu26-9111, 2026.

EGU26-10483 | ECS | PICO | HS5.2.2

Investigating Socio-Hydrological Feedbacks in Drought and Flood Risk Adaptation: A Comparative Analysis Using the Paired Events Dataset 

Marlies H Barendrecht, Maurizio Mazzoleni, Anne F Van Loon, and Heidi Kreibich

The paired events dataset that was published by Kreibich et al. (2023), provides a unique dataset on drought and flood risk adaptation between two extreme events across a variety of case studies. This study identifies changes in impacts and attributes them to changes in the different components of risk. It concludes that it remains a challenge to manage unprecedented events (Kreibich et al. 2022). This study and dataset have provided valuable insights in the change in impacts and risk, however, from the dataset it is unclear which underlying socio-hydrological dynamics have led to the variety of changes in risk and impacts across case studies. In this study, we develop a generic model to investigate the socio-hydrological feedbacks between hazard, management, vulnerability and exposure leading to the observed changes in impacts.

We use the model to compare the socio-hydrological processes across the different drought and flood case studies to identify differences in management and adaptation strategies. We show that a generic model, such as the model presented here, in combination with a consistent dataset, such as the paired events dataset, can be useful in comparing socio-hydrological processes across case studies. It can help explore the possibility space in an informed manner, though the identification of current pathways and, following from those current pathways, the identification of suitable adaptation strategies that have been successful in other cases.

How to cite: Barendrecht, M. H., Mazzoleni, M., Van Loon, A. F., and Kreibich, H.: Investigating Socio-Hydrological Feedbacks in Drought and Flood Risk Adaptation: A Comparative Analysis Using the Paired Events Dataset, EGU General Assembly 2026, Vienna, Austria, 3–8 May 2026, EGU26-10483, https://doi.org/10.5194/egusphere-egu26-10483, 2026.

Joint operation of reservoirs can effectively reduce flood loss. However, the traditional reservoir operation model considers downstream flood peak rather than flooding loss, due to the heavy computational burden of hydrodynamic simulation. To addressed this issue, the machine learning-based surrogate model, which can accelerate the hydrodynamic simulation, is used to reduce flooding loss by coupling with the reservoir operation model. The machine learning surrogate model can quickly simulate flooding loss, but leads to the reservoir operation model no longer meeting the Markov property. As a result, dynamic programming (DP) and its improved algorithms are unable to deal with this optimization problem. Thus, DP only generates an initial solution, which can be further refined by the pattern search algorithm to minimize flooding loss. The Centianhe and Shuangpai Reservoirs on Xiaoshui River Basin, Hunan Province, China were selected as the study area. Results showed that: (1) the surrogate model can shorten the flooding loss calculation time from the minute level of the hydrodynamic model to the millisecond level, while ensuring accuracy of average RMSE 0.629 m and the R2 0.83, and (2) the proposed reservoir operation model significantly reduces flooding loss. Compared with traditional models, the proposed model reduces flooding loss by 16.28 % and 13.74 % under the design floods of 3-year and 5-year return period, respectively. Even the proposed method can be improved in terms of model generalizability and accuracy, it provides a valuable model for high flood risk basins by shifting the reservoir operation objective from flood peak shaving to flooding loss reduction.

How to cite: Bao, Y. and Liu, P.: Surrogate model of flooding loss to alleviate computational burden in reservoirs operation, EGU General Assembly 2026, Vienna, Austria, 3–8 May 2026, EGU26-10664, https://doi.org/10.5194/egusphere-egu26-10664, 2026.

Small islands are particularly sensitive to climate change due to limited storage capacity, strong dependence on external energy supplies, and close coupling between human activities and environmental processes. On tourism-dependent islands, fluctuations in population, climate variability, and infrastructure constraints can generate complex feedbacks between human water use, hydrological processes, and ecosystem stress. Green Island, a volcanic island off the southeastern coast of Taiwan, provides a representative case where water-related challenges arise not from a lack of total precipitation, but from the highly episodic nature of rainfall associated with typhoons, during which large volumes of rainwater are rapidly lost through runoff and coastal discharge. This research investigates human–water feedbacks on Green Island by integrating analyses of water balance, energy balance, and climate change impacts within a system-oriented framework, with particular attention to how tourism-driven water and energy demand interacts with hydrological processes under changing climatic conditions and how these interactions may reinforce system vulnerability over time. The water system is conceptualized as a coupled human–natural system, incorporating precipitation inputs, surface and groundwater storage, water treatment and distribution, sectoral water use, and environmental losses such as evapotranspiration and rapid runoff, while human responses to hydrological variability—including infrastructure design and water management practices that limit rainwater retention and reuse—are treated as key drivers shaping feedback dynamics. In parallel, the energy system assessment examines baseline residential demand, seasonal tourism-related electricity use, reliance on diesel-based power generation, and the potential integration of renewable energy sources. Climate change is treated as a cross-cutting driver influencing both hydrological processes and human behavior, as projected increases in rainfall intensity, extreme events, heatwaves, and typhoons are expected to further amplify mismatches between water availability and effective water use. Methodologically, the study integrates hydrological data, energy statistics, climate information, and ecological observations within a conceptual system framework, and employs system dynamics modeling using Vensim at a supporting level to structure causal relationships and explore feedback mechanisms rather than to produce deterministic predictions. By reframing water sustainability as a challenge of retention, reuse, and adaptive management rather than absolute scarcity, this research aims to support more resilient and resource-efficient water governance pathways for small island systems under climate change.

How to cite: Hu, Y.-J. and Tung, C.-P.: Human–Water Feedbacks under Climate Change on a Tourism-Dependent Island: An Integrated Assessment of Water and Energy Balances on Green Island, Taiwan, EGU General Assembly 2026, Vienna, Austria, 3–8 May 2026, EGU26-12444, https://doi.org/10.5194/egusphere-egu26-12444, 2026.

The downstream Heihe River Basin (HRB) is a quintessential coupled human-water system, where ecosystem sustainability is governed by engineered water management. Although the Ecological Water Conveyance Project (EWCP) has visibly promoted greening, the quantitative impacts of this hydrological forcing on ecosystem organization and stability remain unclear. Here, we apply an Eigen Microstate and Entropy Theory (EMET) framework to long-term NDVI data (2001–2024) to characterize ecosystem evolution under this non-stationary regulation. Our analysis reveals a stepwise increase in ecosystem entropy across the three conveyance periods, with vegetation dynamics responding synchronously to water inputs in the first two periods but exhibiting a one-year lag in the third following sustained high flows. Concurrently, the linkage between vegetation entropy and upstream precipitation entropy weakened markedly after 2007, signaling a transition from a hydroclimate-constrained regime to one dominated by human regulation. Mode decomposition shows that the shift from an ordered, low-entropy state to a complex, higher-entropy state is primarily driven by oasis expansion along the West River corridor and intensified agricultural activity after 2008. The latter is associated with a sharpening phenological contrast between cropland and natural vegetation, amplifying heterogeneity within the oasis. Our findings demonstrate that managed water inputs have fundamentally reconfigured the oasis’s structural complexity, shifting its dynamics from climate-buffered to human-shaped, with direct implications for future water allocation and ecosystem management strategies.

How to cite: Wang, X. and Chen, X.: From Climate-Constrained to Regulation-Dominated: A Shift in Arid Oasis Ecosystem Dynamical State, EGU General Assembly 2026, Vienna, Austria, 3–8 May 2026, EGU26-12674, https://doi.org/10.5194/egusphere-egu26-12674, 2026.

EGU26-12778 | ECS | PICO | HS5.2.2

Long-term household flood adaptation under government policies: a coupled hydrological, hydrodynamic, and agent-based model 

Veerle Bril, Jens de Bruijn, Tim Busker, Wouter Botzen, Jeroen Aerts, and Hans de Moel

Flooding is one of the costliest natural hazards globally and is expected to increase in severity because of climate change and socio-economic developments. Therefore, it is important to implement adaptation measures that limit flood risk. Adaptation measures can be implemented by governments, but also households can flood-proof houses. This is viewed as a promising adaptation strategy, but it is unclear yet how many households will adopt these measures in response to government policies. Therefore, this study aims to understand to what extent various government policies, such as subsidies and information campaigns, can lead to increased implementation of household-level adaptation to reduce risk, such as wet-proofing or dry-proofing. To do so, we further develop a coupled hydrological, hydrodynamic, and agent-based model (GEB). We demonstrate this model for the Geul river in The Netherlands, where a severe flood event took place in July 2021.

The GEB model simulates river discharge over the last 30 years, including the July 2021 flood. When discharge exceeds bankfull conditions, we automatically simulate the flood using the hydrodynamic model SFINCS. Households in flood-prone areas make adaptation decisions on an annual basis, and additionally reconsider their choices following a flood event. This decision-making process is based on the Subjective Expected Utility Theory. Following this theory, flooding elevates the flood risk perception of households and this increased perception triggers adaptation decisions.

Our socio-hydrological simulations show that household adaptation is an effective way to reduce flood damages. Results can be used by policymakers to understand how much flood risk reduction can be achieved through household adaptation and to design strategies to increase adaptation uptake.

How to cite: Bril, V., de Bruijn, J., Busker, T., Botzen, W., Aerts, J., and de Moel, H.: Long-term household flood adaptation under government policies: a coupled hydrological, hydrodynamic, and agent-based model, EGU General Assembly 2026, Vienna, Austria, 3–8 May 2026, EGU26-12778, https://doi.org/10.5194/egusphere-egu26-12778, 2026.

EGU26-13672 | ECS | PICO | HS5.2.2

Socio-hydrology and water-energy-food-ecosystems (WEFE) Nexus approaches to explore water scarcity in an alpine catchment in Northern Italy 

Enrico Lucca, Janez Sušnik, Giulio Castelli, Luigi Piemontese, Sara Masia, Emanuele Fantini, and Elena Bresci

The Alps play a vital role in regulating water supply for densely populated and agriculturally intensive downstream regions. Yet climate change is raising concerns over the development of water scarcity in mountain areas historically perceived as water abundant. Addressing these challenges requires understanding interdependencies across water uses, i.e., the Water–Energy–Food–Ecosystems (WEFE) Nexus, and untangling the coupled social and hydrological processes that contribute to creating water scarcity. We present a novel methodological framework that integrates Causal Loop Diagrams and the Network of Action Situations to jointly map socio-hydrological dynamics and the multi-level decision-making processes through which rules, institutions and practices influence water use, allocation and management. We apply this framework to the Orco catchment (Northern Italy), which has experienced recurrent summer droughts and water scarcity over the past two decades. Results show that trade-offs across the Nexus arise not only from hydroclimatic variability, but also from socio-economic factors creating levers and barriers to change, and an underlying condition of overallocation of water resources. At the same time, evidence of cross-sectoral synergies is found in both formal instruments (e.g., hydropower concessions and sectoral policies) and through informal, drought-triggered coordination among water users. Two venues of decision-making are central to addressing water scarcity: (i) the governance of hydropower reservoir, which is shifting towards a multipurpose use, and (ii) the implementation of environmental flow requirements, where weak knowledge links between socio-hydrological processes and decision-making create divergences among local actors but also  opportunities for collaboration across sectors. By integrating CLD and NAS, our approach maps the cause–effect chains that generate trade-offs among sectoral goals, deepening the understanding of the root causes of water scarcity and providing a basis for more coordinated and resilient governance of water resources in mountain regions.

How to cite: Lucca, E., Sušnik, J., Castelli, G., Piemontese, L., Masia, S., Fantini, E., and Bresci, E.: Socio-hydrology and water-energy-food-ecosystems (WEFE) Nexus approaches to explore water scarcity in an alpine catchment in Northern Italy, EGU General Assembly 2026, Vienna, Austria, 3–8 May 2026, EGU26-13672, https://doi.org/10.5194/egusphere-egu26-13672, 2026.

EGU26-13906 | ECS | PICO | HS5.2.2

Socio-hydrological dynamics under drought-flood extremes in a Peruvian Amazonian community 

Alessia Matano, Maurizio Mazzoleni, Marlies H. Barendrecht, Heidi D. Mendoza, Anne van Loon, Jonathan Valenzuela, and Pedro Rau

While amazonian riverine communities have long adapted to seasonally fluctuating water levels, the increasing frequency and severity of the recent hydrological extremes threaten their fragile livelihoods and disrupts the ecosystems on which they depend.

In this study, we investigate socio-hydrological dynamics in the Peruvian Amazonian riverine community of Tamshiyacu by examining how interactions between hydrological extremes, community livelihoods, and public policies shape vulnerability and exposure to drought-flood cycles. Using a system dynamics model, we simulate shifts in livelihoods under varying drought-flood scenarios. Results show that seasonal hydrological anomalies can have both positive and negative effects on this Amazonian riverine community, depending on livelihood type, proximity to major rivers, and local topography. In particular, adaptation strategies that diversify livelihoods strengthen community resilience to hydrological shocks.

These insights underscore the importance of multi-sectoral analyses to better understand how different livelihoods are affected by hydrological anomalies. The results also highlight the need for public policies that promote economic diversification and sustainable resource management to enhance community resilience in the face of increasing climate extremes.

How to cite: Matano, A., Mazzoleni, M., Barendrecht, M. H., Mendoza, H. D., van Loon, A., Valenzuela, J., and Rau, P.: Socio-hydrological dynamics under drought-flood extremes in a Peruvian Amazonian community, EGU General Assembly 2026, Vienna, Austria, 3–8 May 2026, EGU26-13906, https://doi.org/10.5194/egusphere-egu26-13906, 2026.

Climate change is increasingly driving severe and prolonged hydrological droughts—even in humid regions—causing many rivers to shift from perennial to intermittent flow regimes. This trend is especially critical for agricultural watersheds like the Bécancour River basin (Québec, Canada), where expanding cranberry production intensifies water demand during vulnerable low-flow conditions. Addressing these coupled pressures requires capturing the feedback between streamflow and agricultural withdrawals, particularly given the complex reservoir management inherent to cranberry farming. This study presents an integrated socio-hydrological modelling framework to assess the co-evolution of cranberry farm expansion, water availability, and social constraints in the Bécancour River basin. We translate socio-economic survey data from cranberry producers into a System Dynamics (SD) model, capturing key feedback mechanisms related to economic pressure, social license to operate, conflict perception, and future expansion decisions. The SD model is loosely coupled with the distributed hydrological model HYDROTEL through a Python-based wrapper, allowing dynamic exchange between hydrological stress signals and socio-economic decision variables. The coupled framework is applied to explore scenarios, including climate stress, regulatory tightening, conservation-oriented policies, and technological adoption for water-use efficiency. Results highlight how social constraints and adaptive behaviors can significantly modulate hydrological impacts, emphasizing the importance of integrating human decision-making into watershed-scale water management models.

How to cite: Khoramshokooh, N., Rousseau, A. N., and Alizadeh, M. R.: Socio-Hydrological Governance for Watershed-Scale Water Management Accounting for Various Agricultural, Municipal and Industrial Water Uses, EGU General Assembly 2026, Vienna, Austria, 3–8 May 2026, EGU26-15152, https://doi.org/10.5194/egusphere-egu26-15152, 2026.

EGU26-15942 | ECS | PICO | HS5.2.2

Fast-responding near-natural hydrological systems as early markers of socio-economic drought impacts 

Mayra Daniela Peña-Guerrero, Zhenyu Wang, Pia Ebeling, Christian Siebert, Jan Sodoge, Mariana Madruga de Brito, Kerstin Stahl, and Larisa Tarasova

Improving drought early warning requires indicators that capture not only precipitation deficits but also how quickly hydrological systems respond and when societal consequences emerge. Here, we assess whether drought propagation pathways and antecedent groundwater conditions in near-natural hydrological systems can serve as early-warning signals for the timing and emergence of drought impacts. We analyze drought propagation in 132 near-natural catchments (areas < 500 km², with no noticeable direct human influence from reservoir storage or abstractions) located within 72 administrative regions in Germany. Using daily precipitation, streamflow, and biweekly groundwater observations spanning almost 70 years, we identify droughts in each hydrological compartment using the variable threshold level method. This allows the reconstruction of event-specific propagation sequences and lag times, which are then linked to Drought Impact Statements (DIS) extracted from news media between 2000 and 2024, documenting the timing and type of reported socio-economic drought impacts. Our results show that drought propagation varies in space and time, with catchments exhibiting different propagation pathways (defined by the order and timing with which drought conditions propagate from precipitation to streamflow and groundwater) and with pathways changing across events. Fully propagated droughts (reaching both streamflow and groundwater) are preceded by prolonged periods of below-average groundwater levels, indicating strong hydrological preconditioning. Linking propagation pathways to reported impacts shows that the timing and composition of socio-economic drought impacts differ across pathways, suggesting that drought propagation through hydrological compartments influence the timing of impact emergence and the sectors affected. Overall, our results highlight how monitoring groundwater levels as indicators of system preconditioning, together with propagation dynamics characterized by short propagation lags, provides impact-relevant information for drought early warning, helping to anticipate impacts.

How to cite: Peña-Guerrero, M. D., Wang, Z., Ebeling, P., Siebert, C., Sodoge, J., de Brito, M. M., Stahl, K., and Tarasova, L.: Fast-responding near-natural hydrological systems as early markers of socio-economic drought impacts, EGU General Assembly 2026, Vienna, Austria, 3–8 May 2026, EGU26-15942, https://doi.org/10.5194/egusphere-egu26-15942, 2026.

There is mounting evidence of a net transfer of water from land to the sea, causing unprecedented continental drying, now estimated to contribute to global sea level rise besides glacier and ice cap melting. The depletion of aquifers due to overabstraction is a key driver of this trend. Halting continental water depletion and enhancing the recharge of continental storage is imperative and urgent.  Reducing water demand through efficiency is key but not enough: we must revert the transfer of water from land to sea. A way to pump back water from sea to land is desalination. Can we regard it as a strategic priority? If so, under which conditions may it be regarded as sustainable from an environmental as well as an economic point of view?

This presentation examines the potential and challenges of seawater desalination as a systemic solution to continental drying. It discusses how desalination and water reuse may support the restoration of the water cycle, enhanced carbon storage in soils and vegetation, and mitigate the impacts of climate change. At the same time it highlights the energy and brine disposal challenges, and the socioeconomic implications standing on the way for desalination to be a full-scale sustainable adaptation and mitigation option.        

How to cite: Pistocchi, A.: Can we harness seawater desalination to revert continental drying?  , EGU General Assembly 2026, Vienna, Austria, 3–8 May 2026, EGU26-17791, https://doi.org/10.5194/egusphere-egu26-17791, 2026.

EGU26-17835 | ECS | PICO | HS5.2.2

Catchment-scale patterns of climate vulnerability in human-impacted landscapes 

Abbey L. Marcotte, Ellen Weerman, Daniël van Wijk, Sven Teurlincx, and Dedmer B. Van de Waal

Climate change is increasing the frequency and intensity of hydrological extremes, amplifying both flooding and drought risks. The vulnerability of landscapes to these hydrological disturbances depends on the climate robustness of these systems, which is defined by their resilience, resistance, and recovery potential to disturbances. Climate robustness is driven not only by climate forcing alone, but also through the interactions between hydrological regimes, landscape characteristics, and demographic pressures expressed through land and water use.

In the Netherlands, landscapes are highly engineered, with water levels, land use, and soil conditions controlled to support agriculture and human water consumption. Under current climatic changes, these landscapes are becoming increasingly strained, particularly in sandy areas in the south of the country where population pressures, warming, and drought frequency are intensifying. While national climate and demography scenarios for the future exist, the projected impacts and changes are challenging to translate at local and regional scales that are often more relevant for management.

Here, we present a catchment-scale, indicator-based approach to diagnose climate robustness of the study catchment under current conditions, and explore how directional changes in hydrological drivers and demographic changes may amplify or reduce landscape robustness in the future. We first combined ground water, soil, and land-use spatial indicators in a multi-criteria decision (MCDA) mapping analysis, which identified potentially vulnerable and climate-robust regions within the catchment. Preliminary results show that areas classified as vulnerable are predominantly associated with sandy soils, and agricultural and forested land. These areas also tend to be in close proximity to urban areas, highlighting a potential overlap between hydrologically sensitive landscapes and areas subject to more intensive land use.

In a next phase, we will use a gradient-based modelling approach to stress-test the indicators under plausible directional changes, based on key climatic and demographic pressures projected for the future. Overall, this approach identifies where human–water feedbacks are concentrated spatially, identifies dominant drivers for climate vulnerability, and highlights areas where targeted interventions may be most effective at catchment scales relevant for land and water management.

How to cite: Marcotte, A. L., Weerman, E., van Wijk, D., Teurlincx, S., and Van de Waal, D. B.: Catchment-scale patterns of climate vulnerability in human-impacted landscapes, EGU General Assembly 2026, Vienna, Austria, 3–8 May 2026, EGU26-17835, https://doi.org/10.5194/egusphere-egu26-17835, 2026.

EGU26-17994 | ECS | PICO | HS5.2.2

Comparative socio-hydrology to identify dominant controls on baseflow reductions from human irrigation demands 

Vishwajit Jaiswal, Riddhi Singh, and Sai Veena Sunkara

Baseflow plays a crucial role in sustaining river aquatic ecosystems, reduced drought impacts necessitating the need to understand how human activities might influence it. Here, we implement a comparative socio-hydrology based approach to identify dominant controls on baseflow reductions across three regions in India irrigated by large reservoirs. We evaluate the effect of conjunctive use of surface water and groundwater on downstream baseflow in areas irrigated by the Nagarjuna Sagar (NSR) in Krishna basin, Hirakud (HRD) in Mahanadi basin and Indira Sagar (ISR) in Narmada basin, three large reservoirs in India. We apply a socio-hydrologic model to simulate surface water and groundwater withdrawals as a function of reservoir inflows, reservoir characteristics, water demands, and aquifer characteristics of the regions. The model constitutes a reservoir module that simulates water releases from the reservoir, a water use module that simulates how farmers use surface water and groundwater to meet irrigation demands, and a conceptual groundwater module to simulate groundwater levels. Farmers extract groundwater when water supplied from reservoirs does not meet irrigation demands. A classification and regression tree (CART) based algorithm was used to quantify the relative influence of different socio-hydrological factors on baseflow reductions due to upstream irrigation. We found an average annual reduction of 323 MCM (1968-2022), 24 MCM (1958-2021) and 13.72 MCM (2005-2022) in baseflow due to the groundwater pumping for NSR, HRD, and ISR, respectively. These translate to 11 %, 5%, and 3% reduction in baseflow compared to a baseline no pumping scenario. Though the relative reduction in baseflow was primarily governed by the volume of groundwater pumped in all cases, accurate characterization of the reduction required information on climate and reservoir characteristics at annual time scales. 

How to cite: Jaiswal, V., Singh, R., and Sunkara, S. V.: Comparative socio-hydrology to identify dominant controls on baseflow reductions from human irrigation demands, EGU General Assembly 2026, Vienna, Austria, 3–8 May 2026, EGU26-17994, https://doi.org/10.5194/egusphere-egu26-17994, 2026.

Flood regulation measures (primarily through dams), combined with a range of non-regulative measures, sit at the heart of modern flood management aiming to mitigate flood impacts. However, the undertaken flood protection measure for a particular region is often selected based on how flood risk evolves under historical and future climate scenarios, whereas relatively less attention has been paid to assess the effectiveness and burden of different measures in face of varying flood magnitudes (constrained by hydroclimatic conditions) and protection targets (constrained by human settlements in floodplains). As a result, it remains unclear whether existing dams can realistically meet evolving protection demands, or whether they are already operating under disproportionately increasing pressure.

To address this, we introduce a quantitative framework (FRAMES, Zheng & Lin, 2025) to evaluate the applicability and adaptivity of regulative measures. We focus on how systems bear the Operational Load (OL)—defined as the storage demand placed on infrastructure across varying flood magnitudes (Return Periods) and protection targets (Exposure Levels). By analyzing 4,732 global settlements paired with 5,963 dams, we quantify the response patterns of OL across diverse geographic and developmental settings globally. These settlements are further categorized into distinct archetypes based on the marginal effectiveness of their regulative systems. Preliminary findings indicate that 57.5% of global settlement show diminishing returns of applying dams for flood protection. Such results indicate in these regions, management should prioritize land-use controls, zoning, and local resilience measures to alleviate disproportionate infrastructure pressure. Conversely, in regions where regulative potential remains high, emphasis should be placed on maintaining system redundancy and avoiding infrastructure lock-in. This study provides the first global quantitative baseline of flood protection potentials and adaptivity, offering a new foundation for evidence-based decision-making in flood management.

How to cite: Zheng, K., Lin, P., and Yamazaki, D.: Identifying Global Flood Protection Potential and Archetypes of Dam Regulation by Quantitative Modeling, EGU General Assembly 2026, Vienna, Austria, 3–8 May 2026, EGU26-18018, https://doi.org/10.5194/egusphere-egu26-18018, 2026.

EGU26-18036 | PICO | HS5.2.2

The Climate Collaboratorium: A Transdisciplinary Approach to Groundwater Modelling for Climate Adaptation in the Sorbian Community of Rietschen (Görlitz District, Germany) 

Andreas Hartmann, Tania Stefania Agudelo Mendieta, Zhao Chen, Kwok Pan Chun, Diana Ayeh, and Sina Leipold

This presentation will introduce the Climate Collaboratorium, a transdisciplinary and participatory research project uniting groundwater science, social research, and local stakeholders in the Sorbian community of Rietschen, Germany. We will present the project’s innovative framework, focusing on the co-development of a conceptual site model through stakeholder workshops involving representatives from fisheries, mining,  public authorities (engaged in groundwater management), and civil society. Drawing on regional climate projections, multiple groundwater recharge estimation methods, and locally developed socio-economic scenarios, we integrate hydrogeological and social-ecological data into a dynamic numerical platform to simulate future groundwater responses under diverse adaptation pathways. Preliminary results highlight the identification of key vulnerabilities, potential synergies, and trade-offs between ecological and social dimensions. Our approach further incorporates creative, participatory scenario processes to support local engagement, broaden understanding of groundwater processes, and support sustainable water governance. Comparable studies are conducted in Canada, the UK, and the USA, allowing for a broader perspective to identify common challenges and unique solutions for better climate adaption. This presentation will detail the collaborative modelling approach, early project insights, and implications for sustainable, community-based groundwater management under climate change.

How to cite: Hartmann, A., Agudelo Mendieta, T. S., Chen, Z., Chun, K. P., Ayeh, D., and Leipold, S.: The Climate Collaboratorium: A Transdisciplinary Approach to Groundwater Modelling for Climate Adaptation in the Sorbian Community of Rietschen (Görlitz District, Germany), EGU General Assembly 2026, Vienna, Austria, 3–8 May 2026, EGU26-18036, https://doi.org/10.5194/egusphere-egu26-18036, 2026.

EGU26-18207 | ECS | PICO | HS5.2.2

Hydropeaking in the Indian Himalayas: Interactions between Hydropower Operations, River Dynamics, and Societal Governance 

Anushruti Kukreja, Gabriele Chiogna, Ankit Agarwal, and Mónica Basilio Hazas

Hydropower supports India’s renewable energy transition by enhancing grid stability amid growing solar and wind penetration. In the Indian Himalayas, hydropower development and operation occur within ecologically sensitive and geographically complex river systems shaped by political, social, and cultural constraints that influence water management and access to hydrological observations, which often rely on manual or low-frequency gauging. Many river basins are transboundary, and hydrological data sharing is constrained by neighboring riparian states as well as broader geopolitical and security considerations, with high-resolution datasets frequently treated as sensitive. These limitations are further compounded by rivers functioning as socially and spiritually significant landscapes. Within this setting, hydropeaking, characterized by rapid sub-daily adjustments of river discharge to meet electricity generation needs, introduces pronounced flow variations in already stressed river systems. Despite its potential consequences and impacts, empirical evidence on hydropeaking impacts in India remains limited and under-represented. This study presents new field-based evidence from a real-time in-situ monitoring station deployed downstream of a hydropower project in the upper Yamuna basin. The observations reveal highly regular sub-daily water-level fluctuations dominated by rapid up- and down-ramping associated with peaking operations, indicating strong operational control over downstream flow regimes. Sub-daily variations in river water temperature are also observed, pointing to additional complexity in regulated river responses and impacts on the riverine ecosystem. Given the cultural and religious use of rivers such as the Yamuna, these hydrological alterations may further influence human–river interactions. Overall, we highlight the need for fine-scale eco-hydrological monitoring and governance approaches that account for political constraints and socially embedded river use when assessing hydropeaking in Himalayan river systems.

How to cite: Kukreja, A., Chiogna, G., Agarwal, A., and Basilio Hazas, M.: Hydropeaking in the Indian Himalayas: Interactions between Hydropower Operations, River Dynamics, and Societal Governance, EGU General Assembly 2026, Vienna, Austria, 3–8 May 2026, EGU26-18207, https://doi.org/10.5194/egusphere-egu26-18207, 2026.

EGU26-20557 | ECS | PICO | HS5.2.2

Integrating In-Situ and Earth Observation Data to Support Understanding of Functional Water Constraints in Small Reservoirs in Ghana 

Stefanie Steinbach, Rashidatu Abdulai, Mohammed Taufiq Abdulai, Komlavi Akpoti, Valerie Graw, and Sander Zwart

Small reservoirs are a rapidly expanding form of water infrastructure across sub-Saharan Africa, supporting irrigation, livestock watering, fishing, aquaculture, and domestic water supply. These systems are locally governed and highly multifunctional. However, they are rarely subject to regular hydrological or water quality monitoring due to their small size and large numbers. Earth observation (EO) provides a unique opportunity to complement ground data for systematic reservoir assessment across space and time. A previous EO-based study using a Sentinel-2 time series (2018–2024) identified 3,079 small reservoirs in northern Ghana with widespread vulnerability to seasonal drying1. Understanding when and why reservoirs become functionally constrained requires an integrated perspective with information on water availability, but also on water quality and patterns of use, which motivates this research.

In a first step, measurements of turbidity, reflecting light availability as a relevant indicator of water quality, were collected across 103 small reservoirs in northern Ghana in December 2025. These data were analyzed together with information from a detailed reservoir user survey conducted by the International Water Management Institute (IWMI), and vulnerability to drying1. Hierarchical cluster analysis showed three distinct types: 1. Small, moderate vulnerability to drying, high turbidity, mixed irrigation; 2. Large, low vulnerability to drying, low turbidity, fully irrigated; 3. Medium, low vulnerability to drying, moderate turbidity, non-irrigated. Across all reservoirs, turbidity was negatively correlated with reservoir size and positively associated with vulnerability to drying.

In a second step, Sentinel-2-derived turbidity estimates using the C2RCC processor2 were validated using satellite-in-situ match-ups within a ±5-day window. The analysis focused on the dry season to capture early dry-season sediment accumulation following rainfall and late dry-season conditions shaped by aeolian inputs, while minimizing cloud contamination. The resulting turbidity time series (2017–2025) enabled scaling the analysis across space and time, supporting regional comparisons of quantity-quality-use interactions.

This study demonstrates how integrating in-situ observations and EO-derived indicators can support the understanding of functional water constraints in small reservoirs. By jointly considering feedbacks between water quantity, quality, and use, the approach reveals patterns that are not visible from single-variable assessments. While limitations remain, particularly regarding attribution of observed values to specific drivers or management decisions, the framework provides a scalable basis for interpreting vulnerability and emerging risk in small, human-managed water systems. It thus contributes to improved monitoring strategies for data-scarce environments and offers a foundation for informed, locally relevant water management under climatic and socio-economic pressures.

1Siabi, Ebenezer K.; Akpoti, Komlavi; Zwart, Sander J. 2023. Small reservoirs in the northern regions of Ghana and their vulnerability to drying. Colombo, Sri Lanka: International Water Management Institute (IWMI). CGIAR Initiative on Aquatic Foods. 37p.

2Brockman, C., Doerffer, R., Peters, M., Stelzer, K., Embacher, S., & Ruescas, A. (2016). Evolution of the C2RCC Neural Network For Sentinel 2 and 3 for the Retrieval of Ocean Colour Products in Normal and Extreme Optically Complex Waters. Living Planet Symposium, Prague, Czech Republic.

How to cite: Steinbach, S., Abdulai, R., Abdulai, M. T., Akpoti, K., Graw, V., and Zwart, S.: Integrating In-Situ and Earth Observation Data to Support Understanding of Functional Water Constraints in Small Reservoirs in Ghana, EGU General Assembly 2026, Vienna, Austria, 3–8 May 2026, EGU26-20557, https://doi.org/10.5194/egusphere-egu26-20557, 2026.

One quarter of the world population lacks safe drinking water. As existing water service providers struggle to make sufficient progress towards the water SDG by 2030, decentralised rural service providers are emerging as possible solutions with pluralist governance arrangements addressing varying water scarcity and quality risks under increasing hydroclimatic extremes, but also financial, operational and social risks. Pooling risks through pluralist arrangements between public, private and community actors with diverse, sometimes competing logics represents both a dilemma and an opportunity for institutional innovation. How pluralist institutions pool risks across different configurations of public, private and community management remains a knowledge gap – theoretically as the relationship between risk and institutional innovation is not fully understood and empirically as the outcomes of such innovations have not been examined systematically. I advance institutional theory of risk, drawing on Douglas’ cultural theory of risk and Ostrom’s approach to institutional diversity. Bridging these theoretical perspectives leads to better understanding how risk-pooling impacts the sustainability of water services, especially under drought conditions. I critically review literature on risk governance in pluralist arrangements and present results from case study research with service providers in Africa, Asia and Europe to identify key institutional design principles of pluralist arrangements. Workshops with service providers and regulators afford insight into the challenges of creating an enabling environment for pluralist organisations and developing comparable standards for monitoring and benchmarking to improve governance. Assessing differences and similarities in risk-pooling strategies and their effect on institutional design thus contributes to informing policy and practice towards safe water for all.

How to cite: Koehler, J.: Risk-pooling and institutional innovation in water service transitions, EGU General Assembly 2026, Vienna, Austria, 3–8 May 2026, EGU26-21493, https://doi.org/10.5194/egusphere-egu26-21493, 2026.

EGU26-1038 | ECS | Posters on site | HS5.2.3

SWAT-Based Estimation of Curve Numbers for Runoff-Potential Zoning 

Prashant Prashant, Surendra Kumar Mishra, and Anil Kumar Lohani

Accurate estimation of runoff potential is essential for watershed planning, flood assessment, and sustainable land and water management. Although the Curve Number (CN) method is widely used for surface runoff estimation, most existing studies still depend on static LULC–soil matrices or empirical CN values that overlook spatial heterogeneity and hydrological variability at the watershed scale. This introduces a methodological gap in deriving dynamically representative CN estimates that capture actual catchment responses. In this study, the Soil and Water Assessment Tool (SWAT) was employed to generate spatially explicit CN values across a diverse set of Hydrologic Response Units (HRUs) by integrating land use/land cover, soil hydrological groups, and slope classes. The analysis was conducted for the Ong watershed, an important tributary of the Mahanadi River basin in eastern central India, covering an area of 4,650 km². The model-simulated CN values were subsequently utilized to delineate runoff-potential zones within the watershed. Calibration and validation of SWAT-simulated runoff against observed streamflow strengthened the reliability of surface runoff parameterization. The spatial assessment revealed distinct patterns of low, moderate, and high runoff potential, predominantly governed by variations in LULC and soil texture. Built-up and agricultural areas exhibited higher CN values, while forested and permeable zones consistently showed lower runoff potential. Overall, the results demonstrate that SWAT-based CN derivation overcomes the limitations of conventional CN assignment by producing hydrologically consistent and spatially distributed runoff-potential maps. This systematic and scalable framework can support improved conservation planning, watershed prioritization, and climate-stress resilience assessments.

Keywords: Hydrological modeling; Curve Number; Hydrological Responses Unit; Runoff potential; Watershed management

How to cite: Prashant, P., Mishra, S. K., and Lohani, A. K.: SWAT-Based Estimation of Curve Numbers for Runoff-Potential Zoning, EGU General Assembly 2026, Vienna, Austria, 3–8 May 2026, EGU26-1038, https://doi.org/10.5194/egusphere-egu26-1038, 2026.

EGU26-4563 | ECS | Posters on site | HS5.2.3

Assessing Satellite Remote Sensing for Indigenous Waterway Monitoring, A Co-Created Case Study from the Ruapehu Region, New Zealand 

Iris Ronald, Jonathan Procter, Melody Whitehead, Hemi Whaanga, and Hollei Gabrielsen

For Māori, the indigenous people of New Zealand, waterways are not merely physical resources, they are living systems with their own mauri (life force). These waterways sustain livelihoods, support cultural practices, linking people to their ancestors and to place. Because of the importance of waterways, Māori have been monitoring them for centuries, using traditional practices while also incorporating new monitoring technologies over time. This project investigates the potential of satellite-based remote sensing to complement and strengthen indigenous led waterway monitoring in the Ruapehu region, New Zealand.

The Ruapehu district is within the tribal lands of the Iwi (tribe) Ngāti Rangi. The lakes, rivers and springs of this area connect the people to their ancestral mountain, Mount Ruapehu. Ngāti Rangi practices cultural stewardship by monitoring changes in these waterways. Their current monitoring relies primarily on in situ observations. Combining satellite based remote sensing data with Ngāti Rangi’s existing in situ monitoring systems offers an opportunity to enhance understanding of waterway condition and change at more frequent time intervals at multiple sites across the region.

This research adopts a co-creation approach where discussion with Ngāti Rangi has guided the selection of significant waterbodies and monitoring parameters. Multi-spectral imagery from Landsat 8-9 and the Sentinel-2 satellites is used to derive data that tracks changes in water colour and related indicators of waterway condition. These satellite-derived datasets are processed and anaylsed against Ngāti Rangi’s existing in situ observations to evaluate how satellite-derived datasets may support existing environmental monitoring strategies.

This case study contributes to emerging socio-hydrological practice by demonstrating how remote sensing technologies can support Indigenous-led waterway monitoring. It highlights both the opportunities and challenges of integrating remote sensing technologies within existing Māori environmental management systems and offers transferable insights for co-created monitoring in other Māori environmental contexts.

How to cite: Ronald, I., Procter, J., Whitehead, M., Whaanga, H., and Gabrielsen, H.: Assessing Satellite Remote Sensing for Indigenous Waterway Monitoring, A Co-Created Case Study from the Ruapehu Region, New Zealand, EGU General Assembly 2026, Vienna, Austria, 3–8 May 2026, EGU26-4563, https://doi.org/10.5194/egusphere-egu26-4563, 2026.

EGU26-7279 | ECS | Orals | HS5.2.3

Co-creating Digital Water Solutions: Transitioning from training to Community-Driven Earth Observation Use Cases in Data-Scarce Africa 

Mirriam Makungwe, Seifu A Tilahun, Alemseged T Haile, Edward Boamah, Mubea Mubea, and Abdulkerim Seid

Across Africa, water systems are undergoing rapid transformation in response to climate variability, land-use changes, and increasing demand. Yet, water management decisions remain constrained by limited in-situ data. While advances in digital innovation offer substantial potential to address water data scarcity, weak institutional capacity limits the use of such innovations by African water institutions. This work presents insights from the International Water Management Institute (IWMI)’s Digital Innovations for Water-Secure Africa (DIWASA) initiative, which adopts a community use-case-based co-creation approach to translate Earth Observation (EO) data into actionable digital water solutions that are locally relevant and institutionally embedded.
Guided by principles of co-creating water knowledge, teams of practitioner communities in Ethiopia, Ghana, and Zambia identified priority water challenges and co-developed context-specific use cases grounded in local decision contexts. Through inclusive, iterative engagement with 50 African organisations, diverse knowledge systems were integrated with Earth observation data from Digital Earth Africa (DEA) to generate legitimate and actionable water solutions. To sustain the application, targeted capacity-building training was provided for the participants, who have now been utilising these skills for over a year.  In Ghana, Burkina Faso, Zambia, and Ethiopia. We document the co-creation of ten priority community use cases, including (i) satellite-based (i) soil moisture estimation to support irrigation scheduling at the Bontanga Irrigation Scheme in Ghana; (ii) coastal erosion monitoring to evaluate the effectiveness of sea-defence interventions along Ghana’s eastern coastline; (iii) flood damage assessment to enable rapid humanitarian response in flood-prone rural areas of Burkina Faso; (iv) assessment of agricultural drought in Chongwe District of Zambia; (v) crop yield monitoring in Chibombo District of Zambia; and (vi) soil salinity monitoring in a large-scale irrigation scheme in Ethiopia. 
IWMI’s role through DIWASA was primarily facilitative, providing technical backstopping, convening spaces, and capacity development, while ownership remained with national institutions and early-career professionals. Validation was undertaken through field engagement and multi-stakeholder workshops involving public water authorities, meteorological agencies, research institutions, the private sector, and local users. Results demonstrate that co-created Earth observation (EO) workflows can effectively address critical information gaps across multiple domains, including soil moisture dynamics, shoreline change, flood extent and impacts, rainfall-driven agricultural drought dynamics, field-scale maize yield performance, and soil salinity monitoring. Importantly, these workflows also contribute to strengthening institutional capacity, enhancing data literacy, and improving cross-agency coordination for evidence-based decision-making.  
We argue that the value of EO for water security lies not only in technical performance but in how knowledge is transferred and transitioned from learning to action,  and co-created, governed, and integrated into decision-making systems. The DIWASA experience demonstrates scalable pathways for advancing EO-based water services through community-driven innovation and sustained capacity building in Africa.

How to cite: Makungwe, M., Tilahun, S. A., Haile, A. T., Boamah, E., Mubea, M., and Seid, A.: Co-creating Digital Water Solutions: Transitioning from training to Community-Driven Earth Observation Use Cases in Data-Scarce Africa, EGU General Assembly 2026, Vienna, Austria, 3–8 May 2026, EGU26-7279, https://doi.org/10.5194/egusphere-egu26-7279, 2026.

EGU26-8060 | ECS | Posters on site | HS5.2.3

Citizen science and co-creation of knowledge to improve resilience to floods  

Montserrat Llasat-Botija, Olga Varela, Raül Marcos, and Maria-Carmen Llasat

In 2020, the FLOODUP Francolí project was carried out to gather information about the flash flood event that affected the Francolí River (Catalonia, NE Spain) in October 2019. The ultimate goal was to involve the local population in improving resilience to sudden and catastrophic floods, which are relatively frequent in the area. To achieve this, a citizen science experiment was developed in collaboration with various local stakeholders, along with co-creation workshops. One of the campaign’s results was the reconstruction of the social response during the emergency. Its analysis highlighted the need to improve flood preparedness and response, leading to the continuation of the study through a new participatory process developed through the Flood2Now project.

This project also incorporated citizen science, with two main objectives: a real-time river level monitoring through citizen participation and raising awareness of risk perception through the reconstruction of collective memory. The project was carried out in two areas: the Francolí river basin and the Arga river basin in Villaba, Pamplona (N Spain). As part of the participatory activities, participants were invited to share their knowledge of flooding by taking part in co-creation and historical reconstruction workshops adapted to the specific characteristics of each community. Workshops were also held to select river level monitoring points jointly. Once these locations had been defined and validated by the project team’s hydrologists, observation posts were installed to facilitate monitoring. This communication will describe how co-creation process and activities were adapted to the specific characteristics of each territory and community and present the main results obtained. It will also show the differences in the river-community-territory relationships of each pilot and identify the barriers and opportunities for achieving the planned objectives.

How to cite: Llasat-Botija, M., Varela, O., Marcos, R., and Llasat, M.-C.: Citizen science and co-creation of knowledge to improve resilience to floods , EGU General Assembly 2026, Vienna, Austria, 3–8 May 2026, EGU26-8060, https://doi.org/10.5194/egusphere-egu26-8060, 2026.

Implementing Nature-based Solutions (NbS) in Taiwan’s steep, rapid-flow river environments faces a unique governance paradox where high-level policies encourage ecological restoration yet frontline engineering practices remain constrained by strict flood safety liabilities. This governance challenge is particularly pronounced in the Gangkou River watershed, a biologically rich region adjacent to the Kenting National Park at the southern tip of Taiwan. Notably, the demonstration site for this study was not unilaterally selected by the research team but was identified by local stakeholders advocating for restoration. The conflict between local demands for water recreation and flood safety versus rigid concrete check dam designs necessitates scientific mediation.

To echo the social inclusivity emphasized by NbS and promote its practical implementation in Taiwan, the key challenge lies not in the lack of hydraulic modeling tools but in the absence of a mechanism to translate qualitative Stakeholder Narratives into adaptive engineering language to assist in assessing the multiple benefits of NbS in disaster prevention and ecology. Therefore, this study proposes a Socio-Hydrological Framework integrating Participatory Modeling (PM).

Drawing on the bi-directional translation and iterative spirit of the Story-And-Simulation (SAS) approach, we attempt to establish an intuitive process for mapping qualitative needs to adaptive schemes and utilize two-dimensional hydraulic simulation as the quantitative calculation method. First, through Upward Translation, key needs proactively raised by locals (including biological, security, and cultural demands) are directly mapped and translated into model parameter settings for NbS adaptive planning scenarios. Next, through simulation calculations, Downward Translation converts physical data into visualized trade-off indicators (such as Habitat Suitability and Flood Risk maps) which are fed back to stakeholders for Social Iteration.

Through this systematic translation process, the study aims to establish a bottom-up, iterative decision-making pathway that supports community consensus-building and provides a scientific reference for advancing Nature-based Solutions in ecologically sensitive and high-conflict river environments in Taiwan.

This framework was applied to the Ba-Yao Bridge reach to evaluate three scenarios: Baseline, Ecological-oriented (Full Removal), and Integrated NbS (70% Height Reduction with Regraded Banks). Preliminary simulation results indicate that the Integrated NbS Scenario demonstrates typical advantages of nature-based solutions, generating significant hydraulic synergy: lowering the existing check dam height by approximately 70% increased flow velocity while effectively reducing local water levels. This hydraulic margin, facilitated by feasibility discussions with right-bank landowners regarding regraded banks, allowed for the design of vegetated slopes that enhance longitudinal connectivity without causing flood risks for adjacent farmlands to exceed safety thresholds. Furthermore, the design reduced flow disconnection time by nearly 80% during low-flow periods, effectively addressing stakeholder concerns regarding eutrophication, shallow water depths, and the desire to restore childhood memories of water accessibility.

Ultimately, this study preliminarily validates that the conflict between flood safety and ecological restoration often stems from rigid engineering constraints. By systematically translating social values into NbS design parameters and aligning with local policies like 'Sediment-Water Inundation Zones' and regraded embankments, we establish a bottom-up iterative decision-making process to provide a solid scientific foundation for promoting Nature-based Solutions in high-conflict, ecologically sensitive areas.

How to cite: Hsu, J.-C. and Liao, K.-W.: A Socio-Hydrological Framework for Nature-Based Stream Restoration: Integrating Engineering Safety and Social Narratives in Taiwan, EGU General Assembly 2026, Vienna, Austria, 3–8 May 2026, EGU26-9197, https://doi.org/10.5194/egusphere-egu26-9197, 2026.

EGU26-10480 | Orals | HS5.2.3

Climate adaptation pathways for Ramsar wetlands: a co-creation approach integrating hydroclimate projections, ecological thresholds and local knowledge 

Rebecca Doble, Ashmita Sengupta, Michael Dunlop, Jess Melbourne-Thomas, Vanessa Round, Mandy Hopkins, Jodie Pritchard, Shane Brooks, Matt Gibbs, and Tanya Doody

Wetlands are internationally recognised for their ecological, cultural, and economic significance, providing critical ecosystem services such as biodiversity conservation, water quality improvement, and flood regulation. However, wetlands often face compounding challenges from climate change and historical river regulation, creating complex and uncertain futures that demand innovative adaptation strategies. Anticipating and responding to these challenges is particularly difficult given the interplay between hydrological alterations, ecological thresholds, and cultural values.

While models inform adaptation decisions, it is people who make them. Effective climate adaptation for wetlands hinges on matching assessment methods to problem complexity and co-producing solutions that integrate diverse knowledge systems. Despite substantial advances in modelling capabilities, critical gaps persist in translating outputs into actionable metrics for local management. Hydrological models often fail to capture complex, non-linear impacts, cumulative stressors, and higher-order system values such as connectivity and cultural-spiritual dimensions. Wetlands function as integrated socio-ecological systems, challenging the reductionist modelling approaches that decompose them into discrete components. Conversely, co-production of adaptation pathways required both local knowledge and evidence-based climate projections to provide a robust foundation for discussion and decision-making. Effective adaptation requires blending the best available science with local and Indigenous experiential knowledge, particularly for complex or chaotic impact pathways where historical analogues are absent.

This research addressed some of these challenges through co-creation and integrating human and hydroecological systems for climate adaptation planning. The study developed climate vulnerability assessments and adaptation roadmaps for three Ramsar-listed wetlands in the Murray–Darling Basin, Australia: Riverland, Barmah Forest, and the Macquarie Marshes, through a multidisciplinary, participatory process involving over 160 local and regional land and water managers. The approach integrated hydroclimate projections with local knowledge and Indigenous cultural values, adapted from established climate risk frameworks for Australian Ramsar sites and World Heritage areas. Hydroclimate information was developed from the best available climate and hydrological model outputs, and included past and future temperatures, rainfall volumes and characteristics, river flows, and inundation dynamics, providing scientific evidence to underpin the co-development process. A list of core site values and features were co-produced with participants, and their vulnerability assessed using combined qualitative and quantitative analyses to explore ecological thresholds and climate responses. Using spatial and temporal climate analogues and hydrological projections, visions of a changed future site were articulated, and adaptation pathways were co-developed to guide management towards climate-ready objectives while acknowledging significant ecological transformation.

By complementing quantitative modelling with participatory processes, this methodology fills a critical gap in adaptation research for complex ecosystems in highly regulated catchments. It offers a replicable framework for developing climate-ready management strategies that respect ecological integrity and cultural values while navigating some of the sources of uncertainty.

How to cite: Doble, R., Sengupta, A., Dunlop, M., Melbourne-Thomas, J., Round, V., Hopkins, M., Pritchard, J., Brooks, S., Gibbs, M., and Doody, T.: Climate adaptation pathways for Ramsar wetlands: a co-creation approach integrating hydroclimate projections, ecological thresholds and local knowledge, EGU General Assembly 2026, Vienna, Austria, 3–8 May 2026, EGU26-10480, https://doi.org/10.5194/egusphere-egu26-10480, 2026.

Digital Twins (DTs) offer dynamic, near-real-time representations of systems, enabling visualization of current and projected states and the testing of interventions. These emerging technologies have significant potential to transform environmental risk management practices. However, developing DTs for environmental management and disaster risk reduction presents substantial challenges. In Flood Risk Management (FRM), this complexity is amplified by the involvement of multiple professional stakeholders with diverse statutory responsibilities, priorities, and information needs. Currently, there is no formalized approach for DT design nor established methods for integrating end-user requirements. Development processes often remain top-down and technology-driven rather than participatory and user-focused.

This presentation reports one of the first attempts to embed user co-design in the development of an environmental DT. It draws on FLOODTWIN an interdisciplinary demonstrator project for FRM in Hull and the East Riding of Yorkshire (UK), a region characterized by compound and complex flood risk. Using qualitative data from participatory workshops and interviews, we examine the project’s co-creation process with professional FRM stakeholders. Our analysis maps emerging opportunities and challenges in DT development and interface design, viewed through an ethnographic lens. We explore stakeholder perspectives on technology adoption, the politics of data sharing, and the role of academic research in shaping future DT applications in FRM practice.

This research contributes a new evidence base to inform research on co-creating digital tools for multi-agency decision-making in FRM and broader environmental management. We propose a research planning framework to guide co-design processes in future DT projects. In doing so, we highlight how sub-optimal water risk management is socially constructed, revealing that it is not solely a technical problem but one embedded in institutional, cultural, and political contexts.

How to cite: Coulthard, T., Underhill, H., and McEwan, L.: “That’s the dream, right?”: reflections on the co-design of an environmental digital twin by flood risk management professionals, EGU General Assembly 2026, Vienna, Austria, 3–8 May 2026, EGU26-11570, https://doi.org/10.5194/egusphere-egu26-11570, 2026.

EGU26-12326 | Posters on site | HS5.2.3

What does co-creation of knowledge look like in water sciences?   

Mohammad Merheb, Caitlyn Hall, Amobichukwu Amanambu, Hasnat Aslam, Sazzad Hossain, Kwok Chun, Fajr Fradi, Hajar Choukrani, Natalie Ceperley, Christophe Cudennec, Giulio Castelli, Surendran Udayar PIllai, Anandharuban Panchanathan, Gerbrand Koren, Maria Carmen Llsat, Ben Howard, and Mohamed Ouarani and the CCWK WG Review paper team

Co-creation is increasingly promoted within hydrological research as a way to address complex and contested water challenges, yet its meaning, scope, and implementation are necessarily  highly variable in practice due to the specifics of local contexts and goals. Within the framework of the IAHS HELPING (Hydrology Engaging Local People IN one Global world) decade and as part of the Co-Creation of Water Knowledge working group (CCWK), we conducted a systematic review of co-creation in water-related research to examine how collaborative knowledge production is conceptualized, operationalized, and evaluated across the hydrological research lifecycle. We focus explicitly on co-creation processes that involve empowering or co-leading of societal engagement, excluding one-way consultation or extractive participation.

Following a structured multi-stage screening of 3,971 publications retrieved from Web of Science and Scopus, we identified and analysed 144 case studies that met stringent co-creation criteria. The review was guided by a qualitative screening framework developed within the CCWK working group and structured around four core elements of co-creation—relationship building, leadership, tools and techniques, and knowledge inclusion—together with four overarching principles: inclusivity, openness, legitimacy, and actionability (Castelli et al., 2025).

We observed a rapid increase in co-creation approaches in hydrology after 2013, concentrated in Europe and North America. Rivers, urban water systems, and watershed management were the most frequent focus of co-creation. Most  processes were initiated by researchers, in contrast to community- or government-led initiatives. While collaborative and facilitative leadership was frequently reported, genuine redistribution of decision-making power was rare and/or poorly documented.

Recurring bundles of tools rather than single techniques were used for co-creation, most commonly workshops, interviews, participatory mapping, modelling, and scenario-based approaches. Scientific and governance knowledge overwhelmingly dominated, in contrast to Indigenous and traditional knowledge systems. Although most studies claim actionable outcomes, concrete evidence of implementation, long-term impact, or environmental change was uneven, and evaluation frameworks were scant.

Overall, our review shows that co-creation in water science is widely invoked but inconsistently defined, implemented, and assessed. We identify recurring structural barriers related to funding architectures, institutional constraints, power asymmetries, and short project timeframes. By synthesising empirical patterns across cases, this study clarifies where and how co-creation contributes meaningfully to addressing wicked water problems, and where its application risks becoming rhetorical rather than transformative. This review lays the work for our future work developing a vision for what co-creation of water knowledge should become in the next decade and how we can get there.

This work was performed as part of the IAHS HELPING Working Group on “Co-Creating Water Knowledge”: https://iahs.info/Initiatives/Scientific-Decades/helping-working-groups/co-creating-water-knowledge/ 

References: 

Castelli, G., Howard, B. C., Adyel, T. M., AghaKouchak, A., Agramont, A., Aksoy, H., … Ceperley, N. (2025). Co-creating water knowledge: a community perspective. Hydrological Sciences Journal, 70(16), 2899–2919. https://doi.org/10.1080/02626667.2025.2571065

How to cite: Merheb, M., Hall, C., Amanambu, A., Aslam, H., Hossain, S., Chun, K., Fradi, F., Choukrani, H., Ceperley, N., Cudennec, C., Castelli, G., Udayar PIllai, S., Panchanathan, A., Koren, G., Llsat, M. C., Howard, B., and Ouarani, M. and the CCWK WG Review paper team: What does co-creation of knowledge look like in water sciences?  , EGU General Assembly 2026, Vienna, Austria, 3–8 May 2026, EGU26-12326, https://doi.org/10.5194/egusphere-egu26-12326, 2026.

EGU26-17078 | Posters on site | HS5.2.3

Combining hydrological and water-use models for watershed management: informing stakeholders on resource projections and strategic allocation 

Raphaël Lamouroux, Aurélien Beaufort, Camille Debein, Hélène Dolidon, Catherine Neel, and Francesco Piccioni

Sustainable water resource management increasingly relies on integrated modelling approaches that jointly address the evolution of hydrological processes, and the quantification of anthropogenic water uses. This contribution aims to illustrate the maturity of such an approach by combining hydrological modelling results with spatially explicit estimates of water withdrawals and consumption. The objective is to support territorial stakeholders by providing a coherent view of future water resource trajectories and associated allocation challenges.

The study is conducted over the Vienne River basin (~22,000 km²) through a partnership between three French actors with complementary expertise and an interest in the future of water resources:

  • CEREMA, the French public agency leading expertises for adapting territories, has developed STRATEAU [1], which reconstructs monthly water-use volumes by sector (agriculture, industry, energy production and tertiary activities), and aims at contributing to the quantification of water withdrawals and consumption.
  • EDF (leading electricity producer in Europe) contributes with the hydrological modelling at the basin scale, using its experience gained through its involvement in the French EXPLORE2 project [1] which addresses the impacts of climate change on hydrological regimes.
  • Vienne EPTB (Vienne River Basin Public Authority) provides in-depth knowledge of the territory, supported by previous hydroclimatic studies conducted to inform regulatory approaches related to allocable water volumes.

The set-up of STRATEAU (definition and calibration of the underlying assumptions) relies on shared expert judgement among the partners, with a central role played by the EPTB in ensuring the consistency of scenarios with local hydrological and territorial realities. STRATEAU is then used to translate climate and societal evolution scenarios — consistent with national reference studies [2] — into projections of water withdrawals and consumption. These results are combined with hydrological projections derived from the EXPLORE2 framework, enabling an integrated analysis of the joint evolution of water availability and water uses.

The results highlight the benefits of the dialogue between scientific, industrial, and institutional stakeholders and the added value of combining heterogeneous modelling tools. Preliminary spatial analyses illustrated below (for the year 2020), show the distribution of available water volumes across the basin and the estimated total withdrawals for all sectors, while temporal analyses allow the exploration of the seasonal dynamics of ratio between resource availability and water use.

This work identifies several perspectives: the need for a more explicit representation of the sensitivity of hydrological simulations to water abstractions, depending on their origin (surface versus groundwater), and the desirable integration of water management measures, that influence availability of water at annual and basin scales.

Total estimated withdrawals (left) and average discharge (right) for 2020 summer period (jja) over the Vienne River watershed.

[1] Lecomte J., et al. STRATEAU – une approche novatrice et un outil innovant de gestion prospective des tensions sur l’eau, 2023, DOI : 10.54563/asgn.2359

[2] Tristan Jaouen et al. Will rivers become more intermittent in France? Learning from an extended set of hydrological projections. Hydrology and Earth System Sciences, 2025

How to cite: Lamouroux, R., Beaufort, A., Debein, C., Dolidon, H., Neel, C., and Piccioni, F.: Combining hydrological and water-use models for watershed management: informing stakeholders on resource projections and strategic allocation, EGU General Assembly 2026, Vienna, Austria, 3–8 May 2026, EGU26-17078, https://doi.org/10.5194/egusphere-egu26-17078, 2026.

EGU26-17327 | Posters on site | HS5.2.3

The IAHS Working Group on the History of Hydrology and the future of education 

Okke Batelaan and Keith Beven

The International Association of Hydrological Sciences (IAHS) Working Group on the ‘History of Hydrology’ (https://iahs.info/Initiatives/Working-Groups/History-of-Hydrology/) was established under the leadership of Keith Beven in December 2022. In 2025, Okke Batelaan succeeded Keith Beven as chair. Before the establishment, several scientific activities demonstrated broad interest in the history of hydrology, thereby underscoring the opportunity and need for this Working Group (Beven et al. 2025). In 2018-2019, well-attended EGU sessions on the ‘History of Hydrology’ were organised. In 2019, a special issue on the ‘History of Hydrology’ in the ‘Hydrology and Earth System Sciences’ resulted in 13 published papers.

The aims of the Working Group are:

1: To provide a central repository for information on the History of Hydrology with liaison, links and metadata on the existing initiatives and copies or links to important historical papers from multiple countries.

2: To encourage more international contributions from countries that are not currently well represented in the existing resources, including the identification of important historical papers from those countries.

3: To encourage the recording of the contributions of female hydrologists.

4: To encourage the recording of the histories of experimental catchments where important advances in understanding of hydrological processes have been made.

5: To encourage the recording of the histories of hydrological models and the people who worked with them.

6: To provide a mechanism for the recording of the history of projects representing good practice in sustainable hydrology for societies under change, building on the Case Studies in Panta Rhei.

Since its establishment, the Working Group has been active in further sessions on the History of Hydrology at the IAHS-IUGG General Assembly, Berlin, in 2023, at EGU in 2025-2026, while a special workshop ‘From the History of Hydrology to the Future of Education’ was organised at Eawag, Switzerland, in 2025. A new Special Collection on ‘History of Hydrology’ in the Hydrological Sciences Journal has been very successful with so far 22 papers. Since 2018, more than 20 ‘History of Hydrology Interviews’ have been recorded with hydrologists (https://www.youtube.com/@historyofhydrologyintervie846). In these interviews, hydrologists share their personal stories about their careers, inspirations, successes, failures, collaborations, friendships, influences, and thoughts about the future. These recordings are inspirational for all, especially students, early-career researchers, and senior researchers. The often personal and historical accounts of scientific directions and developments, which are rarely found in journal papers, are a valuable source of information for hydrological education. The ‘History of Hydrology Wiki’ (http://www.history-of-hydrology.net/mediawiki/index.php?title=Main_Page) is another high-value educational resource, as it provides biographies of hydrologists, histories of experimental and research catchments, histories of institutions, hydrological textbooks, and an annotated bibliography.

Alltogether, the Working Group on the ‘History of Hydrology’ provides a gold mine of information that can be infused into hydrological teaching and education and inspire the next generation of hydrologists.


Beven et al., 2025, On the value of a history of hydrology and the establishment of a History of Hydrology Working Group. Hydrological Sciences Journal 70(5):717-729. https://doi.org/10.1080/02626667.2025.2452357.

How to cite: Batelaan, O. and Beven, K.: The IAHS Working Group on the History of Hydrology and the future of education, EGU General Assembly 2026, Vienna, Austria, 3–8 May 2026, EGU26-17327, https://doi.org/10.5194/egusphere-egu26-17327, 2026.

EGU26-17716 | Orals | HS5.2.3 | Highlight

Citizen science as a catalyst for inclusive water and climate adaptation in data-scarce African landscapes 

Seifu Tilahun, Tammo Steenhuis, Junias Adusei-Gyamfi, and Wouter Buytaert

Climate change, land degradation, and increasing water demand are intensifying pressure on water resources in data-scarce regions of Sub-Saharan Africa, where conventional monitoring systems are limited by cost, technical capacity, and sparse observational networks. This presentation provides evidence from multiple citizen science initiatives since 2010 demonstrating how participatory data collection and co-creation of local knowledge can enhance inclusive water resources management and climate adaptation.

Drawing on case studies from Ethiopia and Ghana, we show how high school students, farmers, and local communities were trained to collect groundwater levels, soil moisture, rainfall, streamflow, and water quality data using low-cost instruments such as plastic gauges, manual staff meters and weirs, and manual sampling kits. These datasets complement validation of earth observation products (e.g., soil moisture products), groundwater recharge estimates in sloping aquifers, and hydrological models, enabling improved understanding of seasonal water availability, groundwater surface water interactions, and watershed management. In Ghana’s Ahafo Ano watershed, citizen-generated observations supported inclusive landscape management planning and prioritizing post-mined land for reclamation, while in Ethiopia, citizen monitoring informed understanding of runoff mechanisms, erosion control, watershed restoration, and adaptive land management practices.

The results highlight that citizen science not only fills critical data gaps but also strengthens local capacity, trust in science, co-creation of local knowledge, and ownership of adaptation decisions. However, challenges remain related to data reliability, sustained engagement, and integration into formal decision-making processes. We argue that combining citizen science (CS) with existing community challenges, adapting new technologies for CS, implementing simple quality-control protocols, and integrating CS into government structures and budgets can unlock knowledge and enhance sustainability, scientific credibility, and policy relevance.

How to cite: Tilahun, S., Steenhuis, T., Adusei-Gyamfi, J., and Buytaert, W.: Citizen science as a catalyst for inclusive water and climate adaptation in data-scarce African landscapes, EGU General Assembly 2026, Vienna, Austria, 3–8 May 2026, EGU26-17716, https://doi.org/10.5194/egusphere-egu26-17716, 2026.

The incorporation of “soft data” from local community experts has long been recognised as a valuable source of information in scientific studies. However, in practice many quantitative scientists find it challenging to incorporate the resulting qualitative data into their studies. However, we present an example from South Australia, where the combination of Indigenous knowledge and historical maps was a key component. The study has aimed to locate freshwater resources along a long (180 km), thin (less than 2 km wide) barrier peninsula, determine their hydrological characteristics, and understand their resilience to climate change impacts. The peninsula contains a wealth of culturally important sites, including “soaks”, which are small, persistent wetlands that constitute the only source of fresh water in an environment with seawater on one side and a hypersaline, RAMSAR-listed estuarine lagoon on the other. These soaks also support the native wildlife that inhabits the regions. Thus, the project included considerable consultation and collaborative fieldwork with the Ngarrindjeri community to locate and sample soak hydrology. Dozens of soaks were identified through a combined approach of remote sensing and community knowledge, and have subsequently been sampled for salinity and stable isotopes to determine water sources. The results of the project are expected to underpin resource management of the region by both state government and Indigenous rangers.

How to cite: Shanafield, M. and Banks, E. (.: Walking together on Country: combining Indigenous knowledge and western science to understand freshwater resources in a hypersaline environment, EGU General Assembly 2026, Vienna, Austria, 3–8 May 2026, EGU26-19263, https://doi.org/10.5194/egusphere-egu26-19263, 2026.

Hydrological interventions in hard rock, agriculture dominated landscapes often produce highly variable outcomes that are difficult to explain using conventional project bound thumb rule based monitoring and evaluation approaches. This study presents a co created, community led continuous monitoring framework implemented in a semi arid watershed in Telangana, India, aimed at generating process level hydrological evidence while strengthening local learning and adaptive water resources management. The monitoring system was jointly designed by researchers, implementing agencies, and trained Community Resource Persons, repositioning monitoring from a retrospective accountability exercise to an ongoing, field embedded learning process.

The framework integrates simple instruments such as rain gauges and staff gauges with selective use of sensors including pressure transducers, hand held soil moisture sensors, and flow meters to track rainfall, surface storage, groundwater recharge, soil moisture dynamics, and irrigation water use across supply side, soil moisture, and demand side interventions. Continuous time series data reveal how hydrological responses vary with landscape position, rainfall intensity, and moisture conditions, patterns that are typically obscured in one time surveys or endline evaluations. For example, monitoring of farm ponds and borewell recharge structures highlights contrasting recharge behaviours across ridge, mid slope, and valley settings, while plot scale soil moisture measurements demonstrate how agronomic practices like mulching influence infiltration and moisture persistence over time.

Beyond data generation, the co creation process actively involves Community Resource Persons and farmers in data interpretation through regular reflection and sense making sessions. This participatory analysis strengthens local understanding of hydrological processes, helps distinguish between storage, recharge, and demand management functions of interventions, and supports mid course corrections in design, siting, and complementary practices.

The study demonstrates that community led continuous monitoring can function simultaneously as a scientific method and a governance practice. When embedded within a co creation framework, it produces context specific hydrological evidence while fostering shared ownership of knowledge, offering a scalable pathway for adaptive water resources management in data scarce regions.

How to cite: N r, L. and Srinivasan, V.: Co creating hydrological knowledge through community led continuous monitoring in data scarce watersheds, EGU General Assembly 2026, Vienna, Austria, 3–8 May 2026, EGU26-19804, https://doi.org/10.5194/egusphere-egu26-19804, 2026.

The Moorabool River is one of Victoria’s most important regional rivers. As well as providing drinking water for the expanding cities of Geelong and Ballarat, the river serves as a critical biodiversity corridor for endangered plant and animal species. It is also a popular waterway for recreational purposes and holds significance to its Wadawurrung Traditional Owners. The river’s importance was highlighted by the Victorian Government’s designation of the river as one of 19 “Flagship Waterways” prioritised for funded catchment management programs. 

The high prioritisation accorded to the Moorabool River is further justified through its identification as one of Victoria’s most flow stressed rivers. Since settlement, the catchment and river have been significantly impacted by the construction of farm dams, weirs, diversions, land-use change, and water extraction for both urban and rural use. Corangamite Catchment Management Authority (CCMA) is a statutory authority that oversees catchment management of the region, including integration of collaborative groundwork and research.  The CCMA’s Regional Waterway Strategy (2014-2022) summarises the key Moorabool River threats as flow deprivation, river sedimentation, land-use change, population growth, and (projected) climate change.

In response to these challenges, in 2017 the Victorian Government initiated the “Living Moorabool Flagship” project managed by CCMA through a partnership approach with water authorities, Aboriginal Traditional Owners and the community.  The overarching aims of the Living Moorabool Flagship are threefold: 1) to improve environmental flow releases for the river downstream of Lal-Lal Reservoir; 2) to improve riparian vegetation through incentives programs for landowners to fence off waterways, reduce weeds and re-establish native vegetation; 3) to empower the community through Citizen-Science monitoring programs.

The Moorabool Catchment is a case study of applied research employing a partnership approach to the delivery of on-ground works. This paper presents preliminary PhD results based on a project applied to the Living Moorabool Flagship program focusing on quantifying the impact of environmental flow releases on water quality and a hydrological model of the impact of farm dams on streamflow. Results indicate that integrating long-term water quality data from multiple agencies improves the analysis of water quality responses to environmental flow releases, supporting their evaluation as an intervention strategy. Hydrological modelling showed that farm dams significantly reduce streamflow, increasing low-flow periods in the system. Together, these findings highlight the value of co-creating evidence-based knowledge that contributes to the decision framework for integrated catchment management.

How to cite: Gutierrez Ramos, P. and Harrison, A.: Co-creating Knowledge for Catchment Sustainability:  Applying research in the Moorabool Catchment for more effective on-ground change, EGU General Assembly 2026, Vienna, Austria, 3–8 May 2026, EGU26-20570, https://doi.org/10.5194/egusphere-egu26-20570, 2026.

Transdisciplinary water research is widely promoted as essential for addressing climate adaptation challenges, yet many projects fall short of intended goals or impact,  despite strong commitment to collaboration. This presentation examines how the structure and design of research projects shape whether co-creation succeeds or fails, drawing on applied projects across Arizona, the Sonoran Desert, and Baja California spanning the United States and Mexico focused on arid, coastal, and marine systems, including surface water and groundwater, and their implications for rural water availability and climate adaptation. Beyond commonly cited co-creation challenges such as timelines and funding constraints, these efforts reveal less-discussed barriers related to rural–urban differences, cross-border and international coordination, mismatched governance scales, and uneven capacity to engage with scientific and technical processes. Rather than proposing a universal framework, we use these experiences to surface broader patterns that recur across transdisciplinary water research, emphasizing where communication structures, design, and governance choices most strongly influence the translation of knowledge into practice. We share strategies that researchers can adopt to strengthen co-creation and improve the translation of climate-relevant water research with diverse partners (e.g., elected officials, local community members, resource managers) for adaptive decision-making. 

How to cite: Hall, C. and Gupta, N.: From Promise to Practice: Supporting Transboundary Co-Creation in Water Action Science Across Borders, EGU General Assembly 2026, Vienna, Austria, 3–8 May 2026, EGU26-21103, https://doi.org/10.5194/egusphere-egu26-21103, 2026.

EGU26-22369 | Posters on site | HS5.2.3

Participatory modelling as a co-creation pathway for human-natural systems management 

Alessandro Pagano, Virginia Rosa Coletta, Laura Selicato, and Raffaele Giordano

Water-related and environmental challenges increasingly emerge from complex human–natural systems, where hydrological processes, ecosystem functioning and human decision-making are deeply interconnected through non-linear feedbacks and cross-scale dynamics. In such systems, scientific knowledge alone is often insufficient to fully capture system behaviour, as local practices, institutional arrangements and decision processes actively shape both pressures and responses. Strengthening hydrological and environmental research through the integration of stakeholder and decision-makers’ knowledge is therefore essential to enhance system understanding, decision relevance and the effectiveness of management strategies.

This contribution discusses the role of participatory modelling as a co-creation pathway for water and environmental resources management, drawing on multiple research experiences and applications developed across diverse eco-socio-hydrological contexts. Rather than focusing on isolated sectors (siloed approach), the proposed perspective embraces an integrated view of environmental systems, where water dynamics are analysed together with ecosystems, governance structures and human behaviour, allowing insights to be transferable across contexts.

System Dynamics (SD) modelling is proposed as a particularly suitable approach for representing and managing human–natural complexity. SD modelling enables the explicit representation of feedback mechanisms, delays and non-linear responses, and supports the exploration of alternative system trajectories through the simulation of management and policy intervention scenarios. Within participatory settings, SD modelling provides a shared analytical space in which scientific evidence and experiential stakeholder knowledge can be jointly organised and discussed.

The modelling process is articulated through a qualitative phase, in which participatory Causal Loop Diagrams support the collective construction of system understanding and its possible evolution, and a quantitative phase, where these representations are formalised into simulation models to explore system behaviour, trade-offs and unintended consequences over time. Stakeholder knowledge is integrated throughout both phases, contributing to problem framing, identification of relevant variables and feedbacks, equation development and interpretation of model outputs.

Beyond knowledge integration, co-creation is understood as a process that actively shapes system dynamics through actors’ behaviours, strategies and interactions. In complex human-natural systems, decisions made by farmers, utilities, policy-makers and other stakeholders are not external drivers, but endogenous components that influence feedback structures, system trajectories and long-term outcomes. By explicitly embedding decision-making processes, behavioural heterogeneity and adaptive responses within participatory models, co-creation allows these dynamics to be explored, discussed and negotiated. In this sense, participatory modelling becomes both an analytical and a transformative process: it supports collective learning about system behaviour, reveals potential policy resistance and unintended consequences, and creates the conditions for adaptive management strategies that are not only technically robust but also socially legitimate and implementable.

How to cite: Pagano, A., Coletta, V. R., Selicato, L., and Giordano, R.: Participatory modelling as a co-creation pathway for human-natural systems management, EGU General Assembly 2026, Vienna, Austria, 3–8 May 2026, EGU26-22369, https://doi.org/10.5194/egusphere-egu26-22369, 2026.

EGU26-23129 | ECS | Orals | HS5.2.3

Student Coursework as Collaborative Science: Development of a Flood Modeling Course to Educate Future Engineers and Support Local Stakeholders 

Diana Veronez, Pj Ruess, Andre de Souza de Lima, Daniel Cardona, Zeeshan Khalid, Amanda Mullen, Celso Ferreira, Leah Nichols, Alice Fox, and James Kinter

Participatory research and community engagement increasingly play a vital role in strengthening relationships between academia and local communities, helping to ensure research questions are highly relevant and meaningful. To this end, we have progressively developed a Flood Hazards Engineering and Adaptation course at George Mason University in which student groups are paired with Virginia stakeholders to identify and address local flooding concerns. This course is part of both the larger Virginia Climate Center and a Seed Translational Research Project involving professionals from varied disciplines including scientists, engineers, and communicators.


Over 100 students have participated in this course since its inception in 2023. Through the course, students learn to develop flood models for their local stakeholders and assess mitigation strategies to minimize flooding in their project areas. These projects are defined by preliminary stakeholder discovery interviews (including iterative follow-up interviews, to which students are invited) to ensure our models fit stakeholder needs. Our stakeholders are very diverse and have included municipalities, counties, planning district commissions, and indigenous tribes across Virginia with varied socioeconomic statuses. Each project is unique and demands different modeling solutions, providing unique experiences for each student group as well as high-value outputs to meet each stakeholder’s needs.


In this presentation we explain in detail the development of the course as an example for future implementations of similar work, while additionally exploring the following questions: 1. How did we initiate engagement with stakeholders?, 2. How did we identify a minimum viable product for the course?, 3. What lessons have we learned through this process?, and 4. What do we wish we had done differently? We aim for this to serve as a valuable prototype and inspiration for similar stakeholder-driven coursework.

How to cite: Veronez, D., Ruess, P., de Lima, A. D. S., Cardona, D., Khalid, Z., Mullen, A., Ferreira, C., Nichols, L., Fox, A., and Kinter, J.: Student Coursework as Collaborative Science: Development of a Flood Modeling Course to Educate Future Engineers and Support Local Stakeholders, EGU General Assembly 2026, Vienna, Austria, 3–8 May 2026, EGU26-23129, https://doi.org/10.5194/egusphere-egu26-23129, 2026.

HS5.3 – Water-Energy-Food-Ecosystem Nexus

EGU26-86 | Orals | HS5.3.1

A Web-Based Modelling Framework for the Water-Energy-Food Nexus with Integrated Policy Analysis 

Rajendra Singh, Krishna Mondal, and Chandranath Chatterjee

Achieving sustainable and resilient water management requires a systems perspective that recognises the strong interconnections between water, energy, food, and the environment. The Water–Energy–Food (WEF) nexus framework helps assess trade-offs among these sectors and ways to improve resource use, efficiency, and equity. However, the existing WEF nexus models typically analyse individual components and estimate the required demand of the main element without considering the interconnected aspects among the resources. Besides, there is a lack of open-source analytical tools for multi-scale WEF nexus studies. In this study, we have developed a Web-based WEF Nexus Model (WbWEFNM) integrating the Modified Pardee-RAND WEF Security Index with a dedicated policy analysis module. The model is coded in Java and features an integrated Graphical User Interface (GUI) and database structure, enabling users to construct new regional datasets, compute water, energy, and food subindices, and evaluate an overall WEF nexus index. Outputs are presented in both tabular and spatial formats, facilitating comparative analyses and visual interpretation of resource security patterns. The developed model will help understand the nexus among water, energy, and food by calculating their respective subindices and the WEF nexus index. The model also includes a policy analysis module to help develop or test policies for better resource security. We applied the developed model to the Kangsabati River basin in eastern India, using 2011 data (the most recent official census in India). The computed subindices for water (0.87), energy (0.74), and food (0.78) produced a WEF nexus index of 0.80, indicating moderate resource security. Therefore, various WEF-related policies must be implemented in the basin to achieve comprehensive resource security. The policy analysis module suggested that policies such as the adoption of rooftop water harvesting structures and solar systems, interventions to enhance crop production, and expansion of poultry farms could significantly enhance the WEF security in the basin. The WbWEFNM provides a transparent framework to evaluate resource interactions, trade-offs, and policy impacts.   By linking quantitative assessment with scenario-based policy testing, the tool aids evidence-driven planning for sustainable development. The framework directly supports Sustainable Development Goals 2 (Zero Hunger), 6 (Clean Water and Sanitation), and 7 (Affordable and Clean Energy), and contributes to balancing the WEF-environment nexus for resilient water systems under global change.

How to cite: Singh, R., Mondal, K., and Chatterjee, C.: A Web-Based Modelling Framework for the Water-Energy-Food Nexus with Integrated Policy Analysis, EGU General Assembly 2026, Vienna, Austria, 3–8 May 2026, EGU26-86, https://doi.org/10.5194/egusphere-egu26-86, 2026.

EGU26-1125 | ECS | Posters on site | HS5.3.1

Integrated assessment of climate change impacts on the water-energy-food-ecosystem nexus in multipurpose reservoirs in Brazil 

Pedro Gustavo Câmara da Silva, Marcos Benso, Gabriel Marinho, Maarten Krol, and Eduardo Mendiondo

Water security is an increasing challenge globally, especially in regions with resource scarcity and complex management needs. Reservoirs play a critical role in mitigating water crises, but their operation is influenced by climate change and human pressure. Understanding changes in water security indicators (WSI) in basins with reservoirs is crucial for sustainable water management, particularly in semiarid regions. Climate projections from CMIP6 using SSP-RCP scenarios are integrated with Long Short-Term Memory (LSTM) and random forest machine learning techniques to simulate future conditions (2011-2100). This combined approach enables capturing both spatial and temporal variations in water security, identifying critical hotspots and vulnerabilities with enhanced predictive accuracy and robust handling of complex, nonlinear hydrological patterns. These insights inform sustainable water strategies tailored to regional challenges. Building on these outcomes, this study develops an integrated modeling framework to assess climate change impacts on the water-energy-food-ecosystem (WEFE) nexus in multipurpose reservoirs by applying hydrological risk transfer models (HRTM). The framework synthesizes reservoir operation simulations with WSIs and the Brazilian water agency (ANA) framework to analyze multi-sector interactions and risks. It aims to optimize reservoir water releases to meet competing demands while minimizing the risk of water shortages and associated economic impacts, simultaneously maximizing multi-sector water sustainability. A novel aspect is the incorporation of AI techniques into HRTM to dynamically adjust hydrological risk transfer mechanisms, such as reservoir index insurance. These insurance contracts, indexed to measurable reservoir inflows, provide financial protection against droughts and floods, redistributing risks spatially and temporally among water users. The framework accounts for seasonality, compound risks, and regional reservoir interactions, enabling comprehensive risk and resilience assessment. Preliminary analyses identify vulnerability hotspots and economic impacts of climate-driven hydrological changes, supporting adaptive reservoir management and insurance design to enhance sustainability and equity in the WEFE nexus. The integrated socio-hydrological, economic, and climate scenario approach advances reservoir management under climate uncertainty, balancing ecological protection with socio-economic objectives for sustainable water security in Brazil’s semiarid regions.

Keywords: water security, climate change impact, reservoir management, water-energy-food-ecosystem nexus, hydrological risk transfer.

How to cite: da Silva, P. G. C., Benso, M., Marinho, G., Krol, M., and Mendiondo, E.: Integrated assessment of climate change impacts on the water-energy-food-ecosystem nexus in multipurpose reservoirs in Brazil, EGU General Assembly 2026, Vienna, Austria, 3–8 May 2026, EGU26-1125, https://doi.org/10.5194/egusphere-egu26-1125, 2026.

EGU26-2776 | ECS | Posters on site | HS5.3.1

Dam Regulation Moderates Climate-Induced Rice Yield Loss in the Mekong-Tonle Sap Lake System 

Keer Zhang, Khosro Morovati, Anton Urfels, and Fuqiang Tian

Rice, a principal global staple crop, is increasingly threatened by intensified flooding under climate change, placing rice-dependent economies at risk. Yet the potential for human activities to mitigate inundation impacts on rice remains essential and largely overlooked. Here we develop an interdisciplinary agro-hydrological framework that links climate forcing, hydrological regulation, and farmer decision-making from a systems perspective. We apply the framework to the rapidly changing Lancang-Mekong River Basin, focusing on Tonle Sap Lake – a biodiversity hotspot and major floodplain rice-production region-where shifting flood dynamics interact with rainfall-driven planting practices. We project that farmers' rainfall-driven planting decisions will progeressively delay planting, particularly as climate change intensifies, while the hydrological regime will produce more consistently high but less damaging water levels. Relative to a baseline period (1980-2014) with mean annual rice losses of US$78 million, losses are projected to inthe near future (2021-2060), and then increase in the far future (2061-2100). A Joint adaptation strategy combining reservoir operation (dam regulation) with farmer-led shifts towards earlier planting substantially reduces inundation damages and improves climate resilience. We further find that the dominant phenological window of inundation-induced loss shifts from the reproductive and maturity stages (baseline) to the vegetative and reproductive stages in both the near and far future. Reservoir operation primarily constrains losses during the reproductive and maturity stages, thereby limiting late-season damage. This framework enables investigation of coupled water-agriculture dynamics and their growing interdependencies under climate change, supporting robust assessment of climate-resilient adaptation pathways.

How to cite: Zhang, K., Morovati, K., Urfels, A., and Tian, F.: Dam Regulation Moderates Climate-Induced Rice Yield Loss in the Mekong-Tonle Sap Lake System, EGU General Assembly 2026, Vienna, Austria, 3–8 May 2026, EGU26-2776, https://doi.org/10.5194/egusphere-egu26-2776, 2026.

Effective management of transboundary river basins demands a comprehensive understanding of Water–Energy–Food (WEF) system trade-offs, particularly under growing climate and socio-economic development. In the Lancang-Mekong River Basin, rapid expansion of hydropower infrastructure and irrigated agriculture intensifies competition for limited water resources, with climate variability further complicating system dynamics. However, existing WEF models often overlook the spatial heterogeneity of irrigation demand, limiting their ability to capture water reallocations across interconnected systems. Here, we develop a distributed hydrological model that integrates reservoir operations, irrigation withdrawals, and future climate projections to quantify dynamic WEF feedbacks. A key innovation is the inclusion of a hydraulic infrastructure topology module that uses intelligent remote sensing canal detection technique to detect irrigation canals and establish river–reservoir–field connectivity. Historical simulations reveal that prioritizing hydropower generation can reduce downstream irrigation water availability by up to 14%, with dry-season impacts up to five times greater than those in the wet season. Under future scenarios (2021~2040), irrigation demand is projected to increase by 63~68%, largely driven by expansion of irrigated areas. However, projected increases in dry-season precipitation under future climate change could mitigate these trade-offs, reducing average irrigation shortfalls to 7%. Our findings highlight how WEF system interdependencies are dynamically reshaped by climate and infrastructure development, offering a new framework for evaluating adaptive resource management in transboundary river systems.

How to cite: Zhao, H.: Climate Change, Dams, and Irrigation Expansion Reshape the Water–Energy–Food Nexus in the Lancang–Mekong River Basin, EGU General Assembly 2026, Vienna, Austria, 3–8 May 2026, EGU26-2873, https://doi.org/10.5194/egusphere-egu26-2873, 2026.

Thailand’s water and climate adaptation are complex and under challenges from a low-lying delta capital city, combination of intensifying floods and droughts, increasing land subsidence, river and coastal erosion, biodiversity loss and sea-level rise.  Thailand’s approach to water development and management has always been relying on multiple sector basis without substantial consideration of any interactions between them and institutions and policies are typically flawed, in the long-term leading to inefficient water use and undesirable consequences from development, all are creating an urgent need for sustainable solutions, actions, and practices.  As climate change intensifies, growing water scarcity, unpredictability, and vulnerability drive the need for sound baseline economic analyses related to current water use efficiency and water productivity, providing the basis for innovative approaches to allocate water to various sectors and increase the efficient use of existing water supplies with minimal adverse effects, and setting the stage for more sustainable water management.    In this study, we assess the water use efficiency (WUE) and economic water productivity across Thailand agricultural sector to focus on the efficient use of water resources under water scarcity threat at the basin-level based on standardized terminologies and formulas from modified version of the FAO’s monitoring framework.  Meteorological, physical geospatial, Gross Provincial Products, and historical allocated surface water and groundwater to agricultural sectors in irrigated area data (based on the System of Environmental Economic Accounting for Water approach) are collected and the economic efficiency in agricultural sector expressed as a quantitative ratio between the amount of monetary production (i.e., value added in agricultural sector) per area as resources or efforts made for its realization are investigated.  With increasing in water allocated to dry-season irrigated area, slow rising in the economic efficiency of agricultural sector is observed.  Change in the economic water productivity defined as a ratio between the amount of monetary production per unit irrigated water resource made to obtain them (THB/m3), is further evaluated.  Declining in the economic water productivity is observed with increasing of dry-season allocated water, suggesting that the economic water activity is complex, requiring specific level of resource consumption to achieve the efficiency, not entirely corresponding to the allocated expenditure.  Dry-season water allocation escalates consistently with increase in annual rainfall and growing irrigated crop area, but fails to enhance both water economic productivity and sustainability.   Greater attention needs to be focused on managing surface water and groundwater for conjunctive use. We need a better understanding of biophysical and socio-economic changes in basins over time and improved measures of basin-level efficiencies before we can determine in a given situation the potential for increasing water productivity through responsive interventions and policies.  Decisions on basin-level allocations among sectors cannot be based strictly on economic efficiency but they must involve value judgements as to how best to benefit society inclusively as a whole. This will include setting priorities in the management of water resources to meet objectives such as ensuring sustainability, meeting food-security needs and providing the more vulnerable segments of society with access to water.

How to cite: Putthividhya, A., Jirasirirak, S., and Prajamwong, S.: Assessment of Groundwater and Surface Water Use Efficiency (WUE) and Economic Water Productivity across Thailand Agricultural Sector through the Lens of Sustainability, EGU General Assembly 2026, Vienna, Austria, 3–8 May 2026, EGU26-3043, https://doi.org/10.5194/egusphere-egu26-3043, 2026.

Food, energy, and water (FEW) form the foundation of human livelihoods and support a wide range of socio-economic activities. These resources are interconnected across regions and sectors through complex supply chains linking upstream production and downstream consumption. In the context of increasing population pressure, resource constraints, and environmental challenges, examining FEW interactions from a supply-chain perspective is essential for understanding regional sustainability and livelihood well-being. This study constructs a multi-regional and multi-sector FEW flow network for China using provincial input–output data to capture cross-regional FEW linkages embedded in economic activities. Critical supply chains and key nodes within the FEW system are identified, and their performance is evaluated by jointly considering economic benefits, resource consumption, and associated environmental impacts. This integrated assessment helps reveal inefficiencies related to resource waste and excessive environmental pressures. In addition, regional livelihood well-being associated with the FEW nexus is evaluated from three dimensions: availability, accessibility, and stability. Based on these analyses, the study further investigates how individual FEW subsystems and their interactions influence regional livelihood well-being through supply-chain connections. The results show that agriculture, the food processing industry, and the construction sector play central roles in China’s FEW system. However, several important supply chains and regions exhibit relatively low performance due to inefficient resource use or high environmental burdens. Moreover, in many regions, FEW-related livelihood well-being does not correspond to their level of economic development or their position within supply chains, indicating notable spatial disparities. These findings suggest that improving livelihood well-being and regional sustainability requires coordinated management of FEW systems across regions. Strengthening interregional economic and trade cooperation, together with providing appropriate ecological compensation to regions that supply large amounts of FEW resources, can help reduce environmental pressures and promote more balanced development outcomes.

How to cite: Mai, Q.: Coupling characteristics of China's food-energy-water nexus and its implications for regional livelihood well-being, EGU General Assembly 2026, Vienna, Austria, 3–8 May 2026, EGU26-3658, https://doi.org/10.5194/egusphere-egu26-3658, 2026.

EGU26-3950 | Orals | HS5.3.1

Global assessment of management strategies for clean water and energy provision under droughts, heatwaves, and compound events 

Elham Bakhshianlamouki, David F Gold, Michele Magni, Edward R Jones, Jignesh Shah, Marjolijn Haasnoot, and Michelle T. H. van Vliet1

Increases in the frequency and intensity of droughts, heatwaves, and their compound occurrence are placing growing pressure on both clean water provision and water-dependent energy systems, and their interactions worldwide. While many studies quantify the impact of climate extremes on clean water supply and energy systems, far less attention has been given to how countries are managing risks across these sectors.

This study provides a global assessment of management strategies for clean water and energy provision under droughts, heatwaves, and compound events, and assesses their implications for water–energy trade-offs. We especially focus on management strategies related to energy-intensive water supply options, including desalination, wastewater treatment, and inter-basin transfers, and water-intensive energy technologies such as hydropower and thermoelectric power.

We combined a structured literature review (focusing on the period 2000–2025) with an indicator-based global data analysis. Using semi-automated screening and manual review, we evaluate water–energy sector interactions and management strategies during droughts, heatwaves, and compound events. In addition, we complement this review with new national-scale indicators capturing water scarcity (water gap per capita), dependence on water-intensive electricity generation, thermoelectric cooling technologies, and reliance on energy-intensive water sources. This allows us to assess both “water-for-energy” and “energy-for-water” risks and to consistently compare reported strategies with underlying system vulnerabilities across countries globally.

The results show that energy-intensive water supply options such as desalination and wastewater treatment are widely promoted to reduce water scarcity, with growing emphasis in future adaptation pathways. However, even in several countries with large treatment capacity, these technologies address only a small share of total water gaps. On the energy side, adaptation strategies focus mainly on switches in cooling-system types, optimization in reservoir operation, and energy-mix diversification (e.g., shifting to technologies which do not require water such as wind and solar energy) to adapt to climate change and extremes (i.e., droughts, heatwaves).

Our study highlights several opportunities for more coherent clean water–energy management. In the water sector, treated wastewater can support energy provision by supplying cooling water for thermoelectric power plants and by enabling energy recovery through processes such as biogas or heat extraction. In the energy sector, locating water-intensive power generation in water-abundant regions for climate-smart energy planning in the future, and expanding water-independent renewable energy, emerge as key options to reduce pressure on scarce resources. The presented results provide a basis for future scenario design and modelling and offer a foundation for stakeholder engagement to assess joint clean water–energy transition pathways that align with regional socio-environmental conditions.

How to cite: Bakhshianlamouki, E., Gold, D. F., Magni, M., Jones, E. R., Shah, J., Haasnoot, M., and van Vliet1, M. T. H.: Global assessment of management strategies for clean water and energy provision under droughts, heatwaves, and compound events, EGU General Assembly 2026, Vienna, Austria, 3–8 May 2026, EGU26-3950, https://doi.org/10.5194/egusphere-egu26-3950, 2026.

The Hetao Irrigation District, located in northwestern China, is characterized by severe water scarcity, with water supply for production and daily use highly dependent on diversions from the Yellow River. The annual average water withdrawal of the irrigation district accounts for approximately one seventh of the total Yellow River water use in Inner Mongolia. Under the unified management of water resources across the Yellow River Basin, future water diversions to the Hetao Irrigation District are expected to further decrease, exacerbating water scarcity and associated conflicts. Therefore, clarifying the ecological water demand required to maintain ecological balance, as well as the proportion of different ecological water consumption components under current conditions, is of great significance for ensuring ecological stability and sustainable socioeconomic development in the irrigation district.

Based on the concept of ecological water consumption, this study systematically analyzes the composition of ecological water use and its major influencing factors in the Hetao Irrigation District. Using the WACM model, 11,819 calculation units were delineated to construct an ecological water consumption assessment framework. Model parameters were calibrated using data from 1990–2018 and validated with observations from 2019–2023. On this basis, total water consumption, Yellow River water consumption, ecological water consumption, and ecological Yellow River water consumption were quantified, and the recommended water demand for maintaining ecological balance under the current development pattern was determined.

The results indicate that water consumption in the irrigation district is mainly influenced by meteorological conditions, underlying surface characteristics, and human activities, among which meteorological factors play a dominant role. Model performance was evaluated in terms of water surface evaporation, drainage processes, and the spatial distribution of groundwater depth. The relative error of simulated water surface evaporation was less than 10% with a Nash–Sutcliffe efficiency (NSE) exceeding 0.8, while the relative error of drainage simulation was less than 20% with an NSE greater than 0.7. The simulated spatial pattern of groundwater depth was consistent with observations, demonstrating good model applicability.

From 2009 to 2023, the annual average total water consumption of the Hetao Irrigation District was 6.18 billion m³, including 4.53 billion m³ of agricultural water consumption and 1.65 billion m³ of ecological water consumption. The annual average Yellow River water consumption was 4.39 billion m³, of which ecological water use accounted for 0.91 billion m³. Agricultural water use constituted the largest proportion of both total water consumption (73.3%) and Yellow River water consumption (72.5%), but exhibited a declining trend over time, whereas ecological water consumption showed a continuous increase. Within ecological water use, Wuliangsuhai Lake accounted for the largest share (approximately 32%) and remained relatively stable at about 0.29 billion m³, providing an important reference for determining its ecological water supply. The study concludes that, under the current water use pattern, maintaining ecological balance in the Hetao Irrigation District requires an annual water demand of approximately 6.70 billion m³, including 4.53 billion m³ diverted from the Yellow River.

How to cite: Liu, B. and Zhang, W.: Assessment of Ecological Water Requirements for Maintaining Ecological Balance under the Current Development Pattern of the Hetao Irrigation District, EGU General Assembly 2026, Vienna, Austria, 3–8 May 2026, EGU26-4806, https://doi.org/10.5194/egusphere-egu26-4806, 2026.

Transboundary aquifers underlie a large share of global irrigation and urban water supply, yet their shared nature and associated governance challenges raise concerns about accelerated depletion. Here I provide the first global assessment of groundwater depletion in transboundary aquifers. Using long-term groundwater-level trends from more than 100,000 observation wells, I show that transboundary aquifers deplete significantly faster on average than matched domestic aquifers, and that depletion is systematically concentrated near international borders. Extending this analysis to the global population of transboundary aquifers using high-resolution data on irrigated cropland, I find that irrigation is likewise disproportionately concentrated near borders. However, these spatial patterns are largely explained by hydrogeography (the co-location of rivers, alluvial plains, and irrigation infrastructure) rather than by border-related competitive overuse. This suggests that transboundary groundwater stress is often driven by physical setting rather than strategic behavior, on average, a finding that is both informative and encouraging for the prospects of cooperative governance.

How to cite: Muller, M. F.: Enhanced groundwater depletion near borders in transboundary aquifers, EGU General Assembly 2026, Vienna, Austria, 3–8 May 2026, EGU26-4985, https://doi.org/10.5194/egusphere-egu26-4985, 2026.

EGU26-5169 | Orals | HS5.3.1

Water pricing responses to climate-driven scarcity in an integrated hydro-economic nexus framework 

Safa Baccour, Héctor Macian-Sorribes, Adria Rubio-Martin, and Manuel Pulido-Velazquez

Global water systems are increasingly exposed to intensified water scarcity, climate variability, and competing sectoral pressures. These challenges affect not only the availability and quality of freshwater resources but also the sustainability of ecosystems and the resilience of socio-economic systems. Ensuring sustainability requires innovative and integrated governance approaches that foster climate adaptation and move beyond traditional sectoral thinking. This study addresses the gap by developing an integrated hydro-economic model (HEM) that promotes equitable and inclusive cross-sectoral performance. The model links biophysical, hydrologic, economic, and ecological components within a WEFE Nexus framework. It incorporates CMIP6 climate projections, hydrological outputs from TETIS, crop water requirements from AQUACROP, agricultural and energy price projections from CAPRI and PRIMES, and habitat suitability modelling for key fish species. The HEM assesses how uniform and dynamic water pricing strategies influence water allocation, cross-sectoral outcomes, and species resilience in the Júcar River Basin under future climate and socio-economic conditions. A marginal resource opportunity cost approach (MROC) is applied to construct a stepwise pricing curve for the dynamic water pricing strategy. The results indicate that both water pricing strategies reduce unsustainable water use while preserving economic benefits, improving system efficiency, and alleviating water scarcity. Uniform water pricing considerably reduces water withdrawals by 30%, reaching 759 Mm³ under SSP5-8.5 for the simulation period 2015-2050, compared to the baseline (1078 Mm³), by creating a strong incentive for conservation. However, this approach often does so at the expense of economic efficiency. Its rigid structure disproportionately affects activities with lower economic returns and penalizes crops with lower water productivity, such as cereals, potatoes, or sunflowers. In contrast, dynamic water pricing results in a more moderate reduction in withdrawals, while preserving economic performance by adjusting prices to reflect scarcity conditions. Herbaceous production declines from 562 MT in the baseline to 406 MT under SSP5-8.5, while fruit tree and citrus yields remain mostly stable. Dynamic pricing, therefore, supports better cross-sectoral balance, achieving environmental and energy gains with less economic disruption. Findings also indicate that both pricing strategies enhance ecological resilience by reducing the frequency, duration, and severity of habitat stress below ecological thresholds. The analysis demonstrates that water tariffs could optimize cross-sectoral trade-offs, providing operational evidence to support sustainable, inclusive, and nexus-aligned water governance.

Acknowledgements: This study has received funding from the European Union’s Horizon 2020 research and innovation program under the RETOUCH NEXUS project (grant agreement No 101086522).

How to cite: Baccour, S., Macian-Sorribes, H., Rubio-Martin, A., and Pulido-Velazquez, M.: Water pricing responses to climate-driven scarcity in an integrated hydro-economic nexus framework, EGU General Assembly 2026, Vienna, Austria, 3–8 May 2026, EGU26-5169, https://doi.org/10.5194/egusphere-egu26-5169, 2026.

EGU26-5311 | ECS | Posters on site | HS5.3.1

Localised impact of different meteorological forcing data and scales in high-resolution hydrological modelling  

Ioanna Samakovlis, Dr David Haro Monteagudo, and Dr Josie Geris

Hydrological modelling is increasingly adopting hyper-resolution approaches in an attempt to provide more accurate and high-resolution representations of local hydrological dynamics. For arid regions and areas expected to be disproportionately affected by a changing climate this may prove particularly useful to make highly localised water allocation decisions. However, the benefits of increasing spatial resolution remain uncertain, as hydrological models are highly sensitive to meteorological forcing data, which constitute one of the main sources of model uncertainty.  

A fundamental question is whether finer resolution forcing data meaningfully improve model performance and reliability, or instead amplify uncertainty at a greater computational cost. Addressing this question is critical, as hydrological simulations and future scenario development increasingly form the basis for infrastructure planning and water-related decision-making that will impact land use policies and communities' livelihoods.  

Here, we explored the effect of four different resolution meteorological forcing data on the performance of the 1km grid cell CWatM hydrological model for the Ebro basin (approx. 80,000 km2) in Spain. The meteorological datasets have a resolution ranging from 1 arcmin x 1 arcmin (EMO-1, approx. 1.4 km x 1.4 km at 41º latitude), over 5 km x 5 km (EMO-5, approx. 3.6 arcmin x 3.6 arcmin at 41º latitude), to 0.1º (MSWX, E-OBS, approx. 8.4 km x 8.4 km).   While traditional model performance evaluations often only assess streamflow performance, we also assessed simulated reservoir volume and inflow results and modelled irrigation amounts throughout the basin. For this, we used traditional validation data obtained through the gauging network of the  Sistema Automático de Información Hidrológica (SAIH), as well as irrigation amounts estimated through satellite imagery, hereby testing a novel method for validation that could also be utilised in less well-gauged basins.  

The results provide twofold insights and contributions to the current debate on hyper-resolution hydrological modelling. On the one hand, this research addresses the perceived necessity of high-resolution data to produce reliable results for future scenario development, especially since up-to-date high-resolution climate projection data at this level of detail are not widely available. On the other hand, while higher resolution meteorological forcing data can provide highly localised information on water allocation impacts, utilisation of hyper-resolution data must also be seen considering practicality and computational effort. Hydrological modelling results in highly gauged basins can reliably be validated with a wealth of data, whereas remote sensing products provide a feasible alternative for high-resolution hydrological modelling as validation tools in less well-gauged basins. These insights can enable water-allocation decision makers locate areas of highest impact per allocated water unit finding trade-offs for maintaining the local water cycle.   

How to cite: Samakovlis, I., Haro Monteagudo, D. D., and Geris, D. J.: Localised impact of different meteorological forcing data and scales in high-resolution hydrological modelling , EGU General Assembly 2026, Vienna, Austria, 3–8 May 2026, EGU26-5311, https://doi.org/10.5194/egusphere-egu26-5311, 2026.

EGU26-6231 | ECS | Orals | HS5.3.1

Widening of Africa’s SDG gap induced by global trade 

Jiayao Shu and Jian Peng

Africa’s progress towards the 2030 Sustainable Development Goals (SDGs) is at risk. Although global trade serves as a critical link between Africa and the global market, its impact on Africa’s progress towards the SDGs is still a matter of discussion. Thus, elucidating the mechanisms through which trade influences SDGs is essential for advancing global sustainable development. In this study, we utilized a Multi-Regional Input-Output (MRIO) model to develop the counterfactual scenario of “no-trade” aimed at measuring the net effects of global trade on Africa’s SDG 2.4, SDG 6.4, and SDG 13.2, which are interconnected within the water-food-climate system. Our results revealed that global trade reduced Africa’s average SDG score by 1.83, thereby exacerbating the disparities of sustainable development between Africa and the rest of the world. Although imports of water infrastructure and technology boosted performance on SDG 6.4 (+2.97), this progress was outweighed by declines in SDG 2.4 (-3.43) and SDG 13.2 (-5.04). We further observed significant variability across Africa that the adverse impact was most severe in low-income countries (-2.48), compared with lower-middle-income (-1.07) and upper-middle-income (1.77) countries. The environmental burden imposed by trade partners also differed markedly. High-income countries exerted the strongest negative effect, primarily by externalizing environmental costs through agricultural imports and embodied carbon transfers, whereas Asian economies present a trade-off between technological assistance for water conservation and the extraction of resources. Our research showed that Africa is increasingly compromising its ecological integrity in exchange for immediate revenue from resource exports. Consequently, it is urgently to implement green premium mechanisms and strategic conservation policies to decouple economic globalization from local environmental degradation. This study highlighted the environmental obligations that Africa holds within the global trade framework and clarified its driving mechanisms.

How to cite: Shu, J. and Peng, J.: Widening of Africa’s SDG gap induced by global trade, EGU General Assembly 2026, Vienna, Austria, 3–8 May 2026, EGU26-6231, https://doi.org/10.5194/egusphere-egu26-6231, 2026.

EGU26-6505 | Orals | HS5.3.1

Economics of groundwater sustainability: Modeling Incentives for Groundwater-Fed Irrigation in West Africa 

Julian Joseph, Giulia Zane, William Quarmine, Moctar Dembélé, and Taher Kahil

Many areas in Sub-Saharan Africa face substantial food security concerns amidst uncertain future crop yield variability. Unexploited rechargeable groundwater resources could be used to stabilize and increase agricultural production through irrigation. To assess economic and environmental viability and impacts, we build a hydro-economic modeling framework to explore sustainable irrigation expansion fed by groundwater. The modeling framework simulates farmer profits under various upscaling and climate scenarios. We apply a nexus approach by incorporating groundwater dynamics and recharge, energy requirements for pumping, endogenous technology choice, and food production. This framework captures trade-offs and feedbacks among water extraction, energy consumption, and agricultural output under future climate conditions. The combination of biophysical models for yields and groundwater, as well as economic modeling for farmer revenues and costs, provides detailed insights into the impacts of multiple irrigation upscaling options. Because irrigation technologies are capital-intensive, they often need economic incentives. We therefore assess the impacts and returns of multiple subsidies and other policies that reduce farmers’ private costs for pumps and irrigation infrastructure. The modeling results show how farmers’ economic profit maximization under future conditions affects crop choices, caloric content of food production, irrigation water use, groundwater dynamics, and agricultural labor. Preliminary results from an application of the framework to three potential upscaling areas in West African Niger indicate substantial potential for sustainable expansion of groundwater irrigation. Multiple policy options support the uptake of groundwater pumping by bridging the high initial investment costs for farmers while delivering an overall positive return on investment, increased revenues from crop production that exceed government expenditure, and enhanced food system resilience.

How to cite: Joseph, J., Zane, G., Quarmine, W., Dembélé, M., and Kahil, T.: Economics of groundwater sustainability: Modeling Incentives for Groundwater-Fed Irrigation in West Africa, EGU General Assembly 2026, Vienna, Austria, 3–8 May 2026, EGU26-6505, https://doi.org/10.5194/egusphere-egu26-6505, 2026.

EGU26-6997 | ECS | Orals | HS5.3.1

Global Potential of Agrivoltaics for Sustainable Food and Energy Transitions 

Saeed Karimzadeh, Elie Bou-Zeid, Matteo Camporese, Andre Daccache, Rebecca R. Hernandez, Gabriel Katul, Md Shamim Ahamed, Matti Kummu, and Majdi Abou Najm

The dual challenge of meeting rising global food demand while accelerating the clean energy transition requires innovative land-use strategies. Agrivoltaics—the co-location of solar photovoltaics and agriculture—offers a transformative solution, yet global adoption has been hindered by a lack of standardized sunlight requirements for crops. Here, we introduce a framework to quantify crop-specific light requirements using the Daily Light Integral (DLI). We define two distinct thresholds: a “theoretical” DLI and a “real-world” DLI. Applying these thresholds to the world’s four staple crops (wheat, maize, rice, and soybean), we assess the global potential for co-generation without compromising food security. Our analysis reveals that even under conservative design scenarios SC40 that prioritize food security, agrivoltaic systems could generate over 100,000 TWh of electricity annually. Soybean and wheat demonstrate the highest compatibility, particularly in the Middle East, South Asia, and the Americas. These findings outline a quantitative pathway for sustainable land-use transitions, showing that multifunctional landscapes can simultaneously mitigate climate change, reduce water use, and strengthen rural resilience. Agrivoltaics exemplifies the water–energy–food–environment nexus at scale by improving land-use efficiency, creating favorable microclimates, and reducing evaporative demand.

How to cite: Karimzadeh, S., Bou-Zeid, E., Camporese, M., Daccache, A., Hernandez, R. R., Katul, G., Ahamed, M. S., Kummu, M., and Abou Najm, M.: Global Potential of Agrivoltaics for Sustainable Food and Energy Transitions, EGU General Assembly 2026, Vienna, Austria, 3–8 May 2026, EGU26-6997, https://doi.org/10.5194/egusphere-egu26-6997, 2026.

EGU26-7281 | ECS | Orals | HS5.3.1

Mapping Europe’s Net-Zero Trade-offs: An Open Integrated Model of Energy, Land, and Water Systems 

Vignesh Sridharan, Constantinos Taliotis, Leigh Martindale, Anastasios Karamaneas, Thomas Nikolakakis, Sophia Kokoni, Konstantinos Koasidis, Alexandros Nikas, Marios Karmellos, Irene Gkiouleka, Elias Kousoulos, Ioanna Konstantinou, Theodoros Zachariadis, and Nathan Johnson

CLEWs-EU, an open-source Integrated Assessment Model developed to analyse the coupled climate–land–energy–water (CLEWs) system of the European Union within a single, internally consistent optimisation framework, is presented here. Implemented in OSeMOSYS, the model identifies least-cost system configurations that satisfy exogenously defined energy service demands across electricity and heat supply, buildings, industry, and transport, while simultaneously accounting for land availability, crop production, livestock, forest dynamics, water withdrawals, and climate-sensitive resource constraints. The energy system representation includes primary energy supply, renewable and thermal generation, electricity storage, hydrogen production, and cross-border electricity exchange, with intra-annual time slices capturing seasonal and daily variability in demand and renewable output. The land and water components represent crop types by irrigation class, biomass production, water supply and withdrawals by sector, and land allocation among cropland, pasture, forest, and other uses. Explicit linkages connect irrigation demand, hydropower availability, thermal cooling requirements, and biomass flows into the energy system, enabling assessment of system-wide trade-offs and feedbacks. Baseline projections to mid-century indicate a strong shift toward electrification across end-use sectors, driven primarily by the expansion of renewable electricity generation and the increasing deployment of heat pumps in buildings. Electricity generation is increasingly dominated by wind and solar, supported by storage and intercountry balancing through expanded interconnections. Final energy demand in buildings declines due to efficiency improvements and renovation measures, while transport activity shifts toward electric and, in specific modes, hydrogen-based technologies. Hydrogen supply grows over time, with both domestic production and imports contributing to end-use consumption, particularly in transport and industry.

Land-use dynamics reflect increasing competition between food production, biomass supply for energy, and forest-based carbon sequestration. Crop production evolves through shifts in land allocation and irrigation practices, while water withdrawal patterns change substantially across sectors and countries, with agriculture remaining the dominant user in water-stressed regions. Water constraints influence both agricultural output and energy pathways, including hydropower generation and thermal plant cooling. Emissions trajectories vary markedly by sector, with faster declines in power generation and slower reductions in agriculture and certain industrial processes, highlighting persistent mitigation challenges beyond the electricity system.

How to cite: Sridharan, V., Taliotis, C., Martindale, L., Karamaneas, A., Nikolakakis, T., Kokoni, S., Koasidis, K., Nikas, A., Karmellos, M., Gkiouleka, I., Kousoulos, E., Konstantinou, I., Zachariadis, T., and Johnson, N.: Mapping Europe’s Net-Zero Trade-offs: An Open Integrated Model of Energy, Land, and Water Systems, EGU General Assembly 2026, Vienna, Austria, 3–8 May 2026, EGU26-7281, https://doi.org/10.5194/egusphere-egu26-7281, 2026.

EGU26-9444 | ECS | Orals | HS5.3.1

Hydropower dams as modifiers of Opisthorchiasis spread in river networks 

Bruno Invernizzi, Andrea Rinaldo, and Andrea Castelletti

Waterborne and water-related diseases are strongly shaped by ecohydrological and human factors that control the spatial connectivity of freshwater systems. Hydropower dams profoundly modify this connectivity, altering flow regimes, fragmenting aquatic habitats, and reshaping interactions among hosts and pathogens. Yet, the implications of dam-induced connectivity changes for disease transmission remain largely overlooked in assessments of hydropower sustainability.

Here, we investigate how hydropower infrastructure affects the transmission dynamics of Opisthorchis viverrini, a parasitic liver fluke endemic to Southeast Asia. The parasite’s complex life cycle involves freshwater snails and cyprinid migratory fish as intermediate hosts, and piscivorous mammals, including humans, as definitive hosts. Because all hosts depend on aquatic habitats and disperse through river networks, alterations of hydrological connectivity can fundamentally reshape transmission pathways.

We extended a spatially explicit metacommunity model of O. viverrini transmission to include the effects of dams on fish movement and snail habitat availability within a realistic river network. Dams reduce fish migration and fragment river corridors, limiting parasite dispersal, while reservoirs create favorable conditions for snail proliferation that may enhance local transmission. Using Monte Carlo simulations, we vary both the location of the initial infection and the fish passability of existing dams to explore the trade-offs between restoring river connectivity for ecosystem conservation and limiting disease spread.

Our results show that the spatial configuration of dams strongly governs these dynamics. Reservoirs shape transmission pathways, creating zones where infections may either amplify or remain contained. Explicit representation of reservoirs allows identification of critical network nodes, where localized infection could trigger widespread propagation, providing a quantitative basis to prioritizing targeted monitoring, prevention, or intervention campaigns. Importantly, our analysis highlights a key trade-off: increasing dam passability  to enhance river connectivity—for example, through fish ladders—supports natural capital and biodiversity but can also weaken hydrological barriers that otherwise limit pathogen spread.

These findings illustrate how hydropower management decisions can simultaneously affect ecological integrity and human health. Incorporating disease ecology into river management and infrastructure planning is therefore essential to fully assess the trade-offs between energy production, ecosystem integrity, and human health in regulated water systems.

How to cite: Invernizzi, B., Rinaldo, A., and Castelletti, A.: Hydropower dams as modifiers of Opisthorchiasis spread in river networks, EGU General Assembly 2026, Vienna, Austria, 3–8 May 2026, EGU26-9444, https://doi.org/10.5194/egusphere-egu26-9444, 2026.

EGU26-9502 | Orals | HS5.3.1 | Highlight

Understanding multisector and transboundary trade-offs of hydropower expansion in the Mekong River basin 

Andrea Castelletti, Bruno Invernizzi, Matteo Giuliani, and Carola Calisi

River systems sustain societies, economies, and ecosystems, yet their management is increasingly constrained by competing demands for energy production, food security, and environmental protection. The Mekong River basin exemplifies these tensions. Rapid hydropower expansion - over 160 dams have been built in recent decades, and hundreds more are planned - has profoundly altered one of the world’s most biodiverse and productive river systems, raising concerns over their cumulative impacts on sediment transport, aquatic ecosystems, greenhouse gas emissions, and regional livelihoods. Despite exstensive research on hydropower sustainability, basin-scale assessments that explicitly capture multi-sector interactions and transboundary trade-offs remain limited.

Here, we introduce an integrated modeling framework to evaluate the multisectoral consequences of alternative hydropower development portfolios across the entire Mekong Basin. The framework couples the large-scale hydrological model VIC-Res with a suite of sectoral impact models, enabling the joint assessment of five key dimensions: hydropower generation, reservoir greenhouse gas emissions, sediment connectivity, ecosystem alteration, and freshwater fishery productivity. This integrated setup allows the quantification of trade-offs and synergies both across sectors and national boundaries, providing a comprehensive basis for evaluating the sustainability and equity of hydropower development.

We apply the framework to a set of dam portfolios representing contrasting development pathways, spatial configurations, and management objectives. For each portfolio, we analyze how benefits and costs of hydropower development are distributed among Mekong countries and sectors, considering both basin-wide outcomes (e.g., the total energy production, sediment fluxes, and ecosystem health) and national-level indicators. By explicitly linking hydrological, ecological, and socio-economic processes, the framework captures feedbacks and dependencies that are typically overlooked in single-sector assessments.

Our results provide a powerful lens for exploring the boundaries of sustainable hydropower development. By jointly representing water, energy, ecosystem, and socio-economic interactions, the framework enables identification of development pathways that maintain the integrity of critical ecological functions and productive processes while meeting energy objectives. The analysis reveals how development choices can move the basin toward - or away from - sustainable and equitable operating trajectories. Ultimately, this work offers a transferable methodological foundation to support integrated, cooperative planning in the Mekong and other transboundary river basins worldwide.

How to cite: Castelletti, A., Invernizzi, B., Giuliani, M., and Calisi, C.: Understanding multisector and transboundary trade-offs of hydropower expansion in the Mekong River basin, EGU General Assembly 2026, Vienna, Austria, 3–8 May 2026, EGU26-9502, https://doi.org/10.5194/egusphere-egu26-9502, 2026.

EGU26-11728 | Posters on site | HS5.3.1

An integrated hydro-agro-economic approach  for sustainable water resources management in a Mediterranean area 

Maria Francesca Palmiero, Antonia Longobardi, Carlos Gutiérrez-Martín, Nazaret M. Montilla-López, and Alfonso Expósito

The increasing scarcity of water resources, driven by rising global demand associated with demographic and economic growth and further exacerbated by climate change, represents a major challenge for many regions worldwide, particularly in Mediterranean and semi-arid areas. In such contexts, the persistence of water deficits, in combination with the increasing frequency and intensity of drought events, intensifies the structural imbalance between demand and availability. This makes the adoption of efficient water management and allocation strategies imperative. The resulting implications are potentially highly significant for the agricultural sector, which is one of the largest consumers of water in the Mediterranean region.

In Campania, southern Italy, these challenges are further amplified by the scarcity of streamflow data, a consequence of the interruption of hydrological monitoring since the early 2000s. This lack of data has hindered assessments of surface water availability and the definition of physically consistent water constraints for irrigation planning over the past two decades.

In this context, the present study proposes a workflow based on an integrated hydrological and agro-economic modelling approach, applied to an irrigation consortium located in a major agricultural area of the region. The reconstruction of streamflow series is achieved through the implementation of hydrological models, which estimate natural flows and the volume of water potentially available at the consortium scale. This approach provides physically consistent constraints on water availability. These outputs feed an agricultural value optimization model, representing the consortium’s crop portfolio in terms of cultivated areas, irrigation requirements, yields, prices, and production costs, generating both water consumption and key economic indicators.

The proposed approach's key strength lies in the consistent integration of the hydrological and agro-economic components, which enable a systematic and forward-looking analysis of the effects that climate change variability has on water resource management. The framework enables the assessment of alternative climate scenarios through the modification of key input variables. These include alterations in the volumes of water available for irrigation and allocable to users, signifying reductions in water availability; variations in crop irrigation requirements associated with rising temperatures and evapotranspiration and the implementation of different water prices, incorporated into crop costs, as a measure for regulating demand. The assessment of the robustness of allocation and production strategies in relation to critical hydrological conditions is supported by future scenarios. Furthermore, they enable the analysis of the potential reorganisation of the crop portfolio, affecting water consumption, return flows and economic indicators in contexts of increasing resource scarcity. The framework thus provides a decision-making tool for proactive drought management, enabling the development of more efficient and resilient water management policies.

How to cite: Palmiero, M. F., Longobardi, A., Gutiérrez-Martín, C., Montilla-López, N. M., and Expósito, A.: An integrated hydro-agro-economic approach  for sustainable water resources management in a Mediterranean area, EGU General Assembly 2026, Vienna, Austria, 3–8 May 2026, EGU26-11728, https://doi.org/10.5194/egusphere-egu26-11728, 2026.

EGU26-12769 | ECS | Posters on site | HS5.3.1

Optimization of precision fertilizer management to reduce nitrogen pollution while maintaining agricultural productivity 

Rye Gleason, Niklas Schmid, Kevin Wallington, and John Lygeros

Cheap and abundant nitrogen (N) fertilizer has driven revolutionary increases in global crop yields. However, N is susceptible to being lost from agricultural fields and transported into water bodies where, in excess, it contributes to drinking water contamination, harmful algal blooms, and hypoxia. This work investigates the potential to improve the Pareto front of crop yield and N loss outcomes through high-frequency, in-season soil sampling and fertilizer application. The current paradigm in agriculture is (1) to apply N either entirely before plant emergence or split between pre-plant and a single “side-dressing” after plant emergence and (2) to measure soil N concentrations yearly or less often. However, advances in agricultural field robotics and remote sensing are making it possible to attain and act on soil data more quickly and precisely and thus to maintain crop yield while decreasing N losses. To date though, few studies have attempted to describe optimal fertilizer strategies that make use of such high-frequency monitoring and actuation tools or how much N loss abatement these strategies could achieve. Indeed, such analysis is challenging due to the complex and high-dimensional nature of the N management problem.

This study provides a model abstraction and discretization scheme that make dynamic programming (DP) for N management computationally feasible while maintaining decision-relevant features of the problem. The DP algorithm computes a strategy on incremental fertilizer application rates and timing based on the N and water content in the soil as well as weather predictions. The strategy is optimized for a maximum expected land profitability minus a fine that is incurred when N losses exceed a statutory threshold. By varying the level of the fine for N loss violations, we map the DP outcomes to a Pareto front that characterizes the maximum land profitability that can be achieved at different likelihoods of violating the N loss threshold. Finally, we compute multiple strategies via DP, each using different frequencies for soil monitoring and fertilizer application, and we show that increasing the frequency shifts the Pareto front toward improved (lower) likelihoods of N loss violation without sacrificing land profitability.

How to cite: Gleason, R., Schmid, N., Wallington, K., and Lygeros, J.: Optimization of precision fertilizer management to reduce nitrogen pollution while maintaining agricultural productivity, EGU General Assembly 2026, Vienna, Austria, 3–8 May 2026, EGU26-12769, https://doi.org/10.5194/egusphere-egu26-12769, 2026.

EGU26-12988 | ECS | Posters on site | HS5.3.1

Guiding national water resource policies: An example of estimating potential water stress in France in 2050. 

Arthur Gaillot, Hélène Arambourou, and Simon Ferrière

The risk of water scarcity is increasing with climate change, even in countries with significant water resources such as France. Over the past 10 years, French governments and public agencies have implemented public policies to adapt to climate change. Identifying and quantifying stress on water resources is essential for developing effective public policies. Our objectives were therefore to estimate the potential stress on surface water resources in 2050 under three demand scenarios. At the watershed level, the environmental flow requirement, water needs for all human activities (agriculture, industry, energy production, etc.), and future water resources were compared on a monthly basis for a year with high rainfall and a year with low rainfall in the spring and summer. Two climate change projections were considered (with the RCP8.5 and the biais correction ADAMONT) : HadGEM2-ES/CCLM4-8-17 and CNRM-CM5/ALADIN63. The environmental flow requirement was estimated from the variable monthly flow method. The water demand of human activities were estimated using the latest climate projections and an integrated water resource management tool. Future water resources were estimated based on the results of the EXPLORE2 project, which provides daily projections of the flow of France's main rivers, using two hydrological model : ORCHIDEE and SMASH. Three demand scenarios were considered: the “trend” scenario continues past trends, the “public policies” scenario takes into account changes in water demand for certain activities, and the “disruptive” scenario envisages a water-efficient society. This study is the first national-scale study to estimate potential water stress in 2050, taking into account all human activities. Main results are : (i) Under both climate projections considered, for 93% of the watersheds, envrionmental flow requirement would not be satisfied for at least one month of the year in dry years (low rainfall during spring and summer), (ii) under the HadGEM2-ES/CCLM4-8-17 climate projection, water consumption will increase in 2050 in all scenarios, (iii) a dry year could lead to severe water stress across 88% of the country, and water restrictions would need to be enforced and (iv) only a public policy similar to the « disruptive » scenario could mitigate the increase in water stress.

How to cite: Gaillot, A., Arambourou, H., and Ferrière, S.: Guiding national water resource policies: An example of estimating potential water stress in France in 2050., EGU General Assembly 2026, Vienna, Austria, 3–8 May 2026, EGU26-12988, https://doi.org/10.5194/egusphere-egu26-12988, 2026.

EGU26-13802 | ECS | Orals | HS5.3.1

Capturing Dynamic Hydropower Performance in Long-Term Energy Planning 

Veysel Yildiz, Ece Akdemir, Shreyas Karadi, Jordan Kern, Nathalie Voisin, and Marta Zaniolo

Hydropower is a reliable renewable energy source that plays a central role in the water–energy nexus and in integrating emerging energy loads and generation technologies. Hydropower plants (HPs) are designed to operate efficiently within defined ranges of reservoir releases and water levels. Deviations from these conditions, driven by changes in water availability, regulatory constraints, and evolving energy grid demands, reduce operational efficiency. As a result, less energy may be produced per unit of water in a future where hydrology and water operations are meaningfully different from what the HPs were designed for.

However, current state of the art large-scale, long-term energy planning models assume constant, near-optimal turbine efficiency or even constant hydraulic head, ignoring variability in HP efficiency and losses. These simplifications lead to systematic overestimation in our future projections of hydropower generation and capacity. They can also lead to underestimation of future resource adequacy needs, and consequent underinvestment in complementary energy infrastructure, increasing risks to future grid reliability. Models and approaches that provide more accurate, temporally and regionally resolved assessments of hydropower potential are therefore needed to support informed planning decisions.

Here we introduce HEADFIT (Hydraulic-Energy Analysis and Dynamic Fitting), a physics-informed framework for analyzing and calibrating hydropower system performance in long-term water–energy planning models. HEADFIT integrates plant hydraulics, including frictional and minor head losses, tailwater dynamics, and operational limits, with turbine efficiency curves for a high-fidelity estimation of how hydropower generation is expected to change in a changing climate. These relationships are approximated at the plant level using physics-informed relationships calibrated with observed hydrological and operational data. The calibrated plant-level models are then used to project hydropower generation under future hydrological scenarios. Lastly, we employ a Western United States power system model to propagate refined hydropower projections into more accurate grid performance assessments across time scales.

Preliminary analysis for 15 major hydropower plants across the Colorado and Columbia River basins shows that constant-efficiency assumptions overestimate annual hydropower production by an average of five percent, with larger biases during periods of high releases combined with low reservoir levels. These discrepancies reduce the accuracy of capacity and flexibility estimates that support essential grid services. They can also misguide investment and design decisions, increasing risks to grid reliability as climate and demand variability intensify.

How to cite: Yildiz, V., Akdemir, E., Karadi, S., Kern, J., Voisin, N., and Zaniolo, M.: Capturing Dynamic Hydropower Performance in Long-Term Energy Planning, EGU General Assembly 2026, Vienna, Austria, 3–8 May 2026, EGU26-13802, https://doi.org/10.5194/egusphere-egu26-13802, 2026.

The Water–Energy–Food (WEF) Nexus constitutes the foundational framework for human well-being, as access to these interconnected resources underpins societal prosperity and resilience. In an era of increasing resource pressures driven by population dynamics and geopolitical tensions, assessing the degree of local self-sufficiency within the WEF Nexus becomes essential for sustainable planning and vulnerability reduction. This study introduces a novel methodology for the quantitative and spatial evaluation of WEF self-sufficiency. We develop composite indicators that integrate key elements of the nexus—local availability and management of water resources, renewable energy potential, agricultural productivity, and land use patterns. Beginning from one capita, these indicators are normalized on a scale from 0 (complete dependence on external, distant resources) to 1 (full local self-sufficiency), providing a clear, comparable metric for dynamic assessment at different scales. As a proof-of-concept case study, the methodology is applied to a small rural village in North Euboea, Greece, a region characterized by post-wildfire recovery challenges, traditional agriculture (e.g., olive groves), limited infrastructure, and strong reliance on local hydrological and biomass resources. Spatial analysis, incorporating GIS-derived data on precipitation, soil fertility, solar/wind potential, crop yields, and energy consumption patterns, reveals the village's current self-sufficiency levels across the nexus components. Results highlight strengths in local food production and renewable energy opportunities, while identifying vulnerabilities in water storage and seasonal energy needs. The proposed indicators offer a practical tool for policymakers, enabling targeted interventions to enhance resilience and promote circular practices in order to safeguard prosperity in unrest periods. Future extensions aim to scale the indicators to urban systems and larger regions, exposing structural weaknesses in modern, highly interconnected settlements.

How to cite: Arvanitidis, I. and Sargentis, G.-F.: Spatial Indicators of Dynamic Self-Sufficiency and Resilience in the Water–Energy–Food Nexus. Case study: Small Rural Village in North Euboea, Greece, EGU General Assembly 2026, Vienna, Austria, 3–8 May 2026, EGU26-14761, https://doi.org/10.5194/egusphere-egu26-14761, 2026.

EGU26-14973 | Orals | HS5.3.1

Dam Heightening as a Climate Adaptation Strategy in the Italian Alps 

Matteo Giuliani, Martina Merlo, Robert M. Boes, Filippo Di Marco, Diego Avesani, Bruno Majone, and Andrea Castelletti

The increasing frequency and severity of droughts in southern Europe are placing growing pressures on interconnected water-energy-food-environment systems. In Alpine regions, climate change is intensifying hydrological variability through declining snowpack and glacier storage and by altering runoff seasonality, thereby widening the temporal mismatch between water availability and multisectoral demands. In this context, the expansion of existing water storage capacity is emerging as a potential adaptation strategy to buffer hydrological variability and mitigate drought impacts.

This study assesses the synergies and trade-offs of expanding water storage in the Italian Alps through dam heightening. We first apply a multi-criteria evaluation framework to screen and prioritize alternative dam heightening projects. The multisector impacts of the selected alternatives are subsequently evaluated using a distributed hydrological model that explicitly integrates reservoir operations and water transfers related to hydropower operations. Our results demonstrate that dam heightening can substantially improve drought resilience in the region by reducing the gap between water availability and demand under current and projected climate conditions. Overall, this work provides a transferable and policy-relevant framework to support climate-resilient water infrastructure planning in Alpine systems under increasing drought risk.

How to cite: Giuliani, M., Merlo, M., Boes, R. M., Di Marco, F., Avesani, D., Majone, B., and Castelletti, A.: Dam Heightening as a Climate Adaptation Strategy in the Italian Alps, EGU General Assembly 2026, Vienna, Austria, 3–8 May 2026, EGU26-14973, https://doi.org/10.5194/egusphere-egu26-14973, 2026.

Contemporary agricultural resilience measurement relies predominantly on backward-looking outcome metrics that obscure how present infrastructure choices configure future adaptation options. This temporal blindspot proves particularly problematic for climate adaptation finance, where quantifying long-term benefits remains challenging compared to straightforward mitigation metrics. We address this methodological gap through the first implementation of pathway diversity theory in agricultural agent-based modeling, demonstrating its application to water infrastructure inequality analysis in Egypt's Fayoum irrigation system. Pathway diversity theory enables explicit analysis of intervention effects across three critical layers: (1) what development programs nominally provide (infrastructure access, subsidies, technical assistance), (2) what farmers actually perceive as available to them given binding constraints, and (3) what farmers ultimately choose from their constrained option sets. Traditional resilience metrics capture only layer three (revealed choices), missing systematic inequalities in layers one and two that determine who has access to adaptive pathways before shocks reveal their necessity. Our ABM simulates heterogeneous farmer agents, operationalizing pathway diversity through archetype-based enumeration of viable livelihood strategies. Each farmer's pathway set emerges from combinations across water sources, crop portfolios, and infrastructure investments, constrained by wealth, farm size, and canal position. Farmers employ satisficing decision-making with bounded rationality, while pathway diversity operates as an analytical lens measuring resilience external to farmer cognition, capturing what farmers could access, not just what they choose. Model results reveal that farm size creates stratification in pathway diversity, far exceeding spatial effects from canal position. The pathway diversity framework’s novelty manifests by: (i) advancing understanding of infrastructure-mediated feedbacks linking water access to adaptive capacity distributions, (ii) introducing novel computational methods for evaluating ex-ante (before-shock) resilience inequalities rather than ex-post (after-shock) outcome disparities, (iii) providing policy evaluation tools that make equity-efficiency tensions explicit rather than implicit, and (iv) enabling identification of intervention targeting criteria that prioritize farmers facing most constrained option sets rather than merely lowest current outcomes. This work demonstrates that rigorous equity-focused development policy requires forward-looking measurement of option inequality, not merely backward-looking assessment of outcome inequality, water infrastructure functions as resilience infrastructure by shaping who can adapt.

How to cite: Badawy, A.: Resilience for Whom? Agent-Based Modeling of Water Infrastructure Access and Agricultural Adaptation Inequalities in Egypt's Fayoum Irrigation System, EGU General Assembly 2026, Vienna, Austria, 3–8 May 2026, EGU26-15647, https://doi.org/10.5194/egusphere-egu26-15647, 2026.

EGU26-15751 | ECS | Posters on site | HS5.3.1

Decadal Analysis of Baseline Methane Emissions from Rice Cultivation: Identifying Spatiotemporal Hotspots for Mitigation Targeting 

Hari Nayak Sankar, Laura Arenas Calle, Anton Urfels, Virender Kumar, Alison Eagle, and Andrew James McDonald

Rice paddies account for approximately 22% of global agricultural methane emissions, while South, East, and Southeast Asia together contribute nearly 90% of the global rice-cultivated area. Consequently, mitigation planning for agricultural methane frequently targets rice systems with little nuance across these vast geographies. Such assessments often assume stylized representative hydrologic environments, such as continuous flooding in irrigated regions, to estimate baseline emissions. However, recent studies have revealed much greater heterogeneity in hydrologic conditions within rice-growing regions including irrigated systems, leading to substantial spatial and temporal variability in methane emissions from rice paddies.

In this study, we used satellite-derived planting dates and soil moisture data in conjunction with the process-based ORYZA model to estimate methane emissions for the Indian states of Bihar, West Bengal, and Punjab. Our results indicate a relatively consistent pattern of methane emissions in Punjab, whereas emissions in Bihar exhibited pronounced spatial and temporal variability. For instance, southwestern and eastern Bihar showed higher average methane emissions, with relatively low temporal variability, averaging around 141 kg ha⁻¹ and coefficients of variation ranging from 29% to 59%. In contrast, the northwestern region of Bihar exhibited lower average emissions (approximately 95.5 kg ha⁻¹) but much higher temporal variability, with a coefficient of variation of 77%.

We further identified key drivers of methane emission variability, including total seasonal rainfall, evapotranspiration, and irrigation intensity. Seasonal rainfall exceeding 1000 mm was associated with higher methane emissions, whereas a greater number of irrigation events did not correspond to increased CH₄ emissions. These findings suggest that, for a state such as Bihar, there is limited potential for methane mitigation through improvements in irrigation management alone, and that alternative soil and crop management strategies may be required to reduce emissions from current baseline levels.

How to cite: Sankar, H. N., Calle, L. A., Urfels, A., Kumar, V., Eagle, A., and McDonald, A. J.: Decadal Analysis of Baseline Methane Emissions from Rice Cultivation: Identifying Spatiotemporal Hotspots for Mitigation Targeting, EGU General Assembly 2026, Vienna, Austria, 3–8 May 2026, EGU26-15751, https://doi.org/10.5194/egusphere-egu26-15751, 2026.

EGU26-15775 | Posters on site | HS5.3.1

Improving crop water footprint modelling and mapping towards comprehensive sustainability assessment for agricultural systems 

La Zhuo, Wei Wang, Zenghui Xu, Zhibin Li, Zhiwei Yue, and Fubin Sun

Crop production is the biggest water user and key contributor to anthropogenic greenhouse gas emissions, and environmental degradations globally. Detailed, timely and multi-sourced modelling and mapping of water footprint, i.e., water consumption, for crop production are important precondition for wise and sustainable agricultural water allocations towards the aiming just and safe globe. However, the system boundary, calculation principle, accuracy criteria, and practical implementations of crop water footprint assessment are still in debate.

We developed three types of improved crop water footprint modelling approaches for faster updates of gridded datasets for different purposes across river basin, national and global scales. (i) Distinguishing impacts of irrigation techniques on green (soil water) and blue (irrigation) water consumption in large scale (Wang et al., 2023; Yue et al., 2025). (ii) Machine learning modelling of green and blue water footprints for fast scenario analysis considering effects from intensive human activities (Li et al., 2025). (iii) Robust long-term global crop water footprint dataset generation with fewer inputs and shorter time (Liu et al., 2025). In addition, we investigated the feasibility of extending system boundary for crop water footprint estimation in line with the other environmental footprints, capable for monitoring the status of crop production systems in terms of synergies and trade-offs among resources appropriation and environmental impacts (Feng et al., 2022; Sun et al., unpublished).

References

Feng, B., Zhuo, L., Mekonnen, M.M., Marston, L., Yang, X., Xu, Z., Liu, Y., Wang, W., Li, Z., Ji, X., Wu, P. (2022) Inputs for staple crop production in China drive burden shifting of water and carbon footprints transgressing part of provincial planetary boundaries, Water Research, 2022, 221: 118803.

Li, Z., Sahotra, H., Ahmad, S., Wang, W., Yang, Z., Wu, P., Khan, E., Zhuo, L. (2025). A distributed machine learning model for blue and green water resources with transferable applications in similar climatic zones. Water Resources Research, 61: e2024WR039169.

Liu, Y., Zhuo, L., Ji, X., Tian, P., Gao, R., Wu, P. (2025). Accounting and evolution of global spatial explicit blue and green water footprint of maize production with fewer inputs. Water Resources Research, 61: e2024WR037184.

Wang, W., Zhuo, L., Ji, X., Yue, Z., Li, Z., Li,M., Zhang, H., Gao, R., Yan, C., Zhang, P., Wu, P. (2023) A gridded dataset of consumptive water footprints, evaporation, transpiration, and associated benchmarks related to crop production in China during 2000–2018. Earth Syst. Sci. Data, 15, 4803–4827.

Yue, Z., Zhuo, L., Ji, X., Tian, P., Gao, J., Wang, W., Sun, F., Duan, Y., Wu, P. (2025) Water-saving irrigated area expansion hardly enhances crop yield while saving water under climate scenarios in China. Communications Earth & Environment, 6:295.

How to cite: Zhuo, L., Wang, W., Xu, Z., Li, Z., Yue, Z., and Sun, F.: Improving crop water footprint modelling and mapping towards comprehensive sustainability assessment for agricultural systems, EGU General Assembly 2026, Vienna, Austria, 3–8 May 2026, EGU26-15775, https://doi.org/10.5194/egusphere-egu26-15775, 2026.

EGU26-16112 | ECS | Orals | HS5.3.1

Mapping Groundwater Irrigation Potential and Energy Requirements for Food Security Across Sub-Saharan Africa 

Nageen Ayesha Rameez, Sudatta Ray, and Giacomo Falchetta

Enhancing groundwater access in service of agricultural productivity and food security is a critical aspect of integrating sustainable energy solutions into agricultural practices. This is particularly important in Sub-Saharan Africa (SSA), where agricultural productivity has stagnated among smallholder farmers. Current literature is dominated by techno-economic analyses based on large-scale modeling which incorporate accurate biophysical data but lack socioeconomic realities that shape economics of groundwater access. Relatively fewer studies estimate impacts of irrigation expansion based on household surveys and agricultural interventions. The latter while providing a clearer picture of on-ground realities, often lack the scale required to incorporate biophysical data. We build upon both areas by merging biophysical and socioeconomic data to examine the drivers of irrigation technology adoption and simulate energy requirements through an agent-based model. Merging household level survey data from the Living Standards Measurement Study (LSMS) with spatial groundwater characteristics across five SSA countries reveals farm size constraints as a potential economic challenge for future farmer-led irrigation adoption. We find that while plentiful groundwater is available, the distribution of hydrogeologies imply high-energy demand across large parts of Ethiopia, Nigeria, Tanzania and Uganda. With adequate energy infrastructure, currently cultivated area can largely be irrigated even during the dry season for several crops across key food groups including fruits and vegetables, pulses, roots, and grains. To our knowledge, this is the first cross-country integration of LSMS adoption patterns with spatial groundwater constraints to map feasibility for and consequences of irrigation expansion in the region. By linking adoption patterns to groundwater constraints, we identify regions where irrigation expansion is likely, where energy requirements are a likely constraint, and which crop categories are favourable for dry season cultivation. Our findings enable policy planning that prioritises crops which maximize nutritional returns from groundwater based irrigation expansion and identify least-cost pathways for providing the energy access required. Finally, they also provide a basis for managing uncertainty and risk in current and future groundwater stocks across SSA.

How to cite: Rameez, N. A., Ray, S., and Falchetta, G.: Mapping Groundwater Irrigation Potential and Energy Requirements for Food Security Across Sub-Saharan Africa, EGU General Assembly 2026, Vienna, Austria, 3–8 May 2026, EGU26-16112, https://doi.org/10.5194/egusphere-egu26-16112, 2026.

Water security is increasingly recognized as a central challenge for sustainable development under global change, requiring policy frameworks that balance domestic needs, livelihoods, environmental sustainability, and climate risk. However, existing approaches to measuring water security face a fundamental trade-off. Resource-based metrics have progressed with the access to satellite data to capture hydrological availability and variability at sub-basin or watershed, but still require extensive data and modeling. In parallel, experiential household-level metrics,  such as the Household Water Insecurity Experiences Scale (HWISE) conveys local perceived realities which are shaping welfare and behaviors, yet remain largely confined to water, sanitation, and hygiene (WASH), and other domestic uses, overlooking productive uses, governance, and climate-related risks. This limits their relevance for integrated water resources management and supporting the water–food–energy–ecosystem nexus policies.

This paper presents a new, parsimonious household-level water security module designed to address this gap. Grounded in a widely used conceptual definition of water security encompassing health, livelihoods, ecosystems, and risk, the module captures households’ lived experiences of water insecurity across four domains: (i) domestic water uses, (ii) productive uses supporting agriculture and non-farm activities, (iii) governance and social relations related to water access, and (iv) perceived exposure to climate-related water risks. The short version of the module consists of 13 binary questions and is explicitly designed for integration into large-scale Living Standards Measurement Surveys (LSMS), analogous to experiential food security measurement.

The module was implemented in multiple household surveys in Ghana (2023–2025), with over 2,700 observations from varied livelihood systems: small-reservoir communities, cocoa-growing areas, and mixed rural economies. In addition, a dedicated 2025 survey, about 1,000 households completed both this module and HWISE, enabling direct empirical comparison.

Preliminary findings indicate around half of surveyed households experience water insecurity in at least one domain. An aggregate water security index based on the module demonstrates strong correlations with food security, health outcomes, asset ownership, and household income, emphasizing water access’s centrality to welfare amid climate variability. Disaggregated analysis shows that domestic and productive water insecurity are linked to different socioeconomic outcomes, highlighting the limitations of solely domestic-focused metrics.

The proposed water security index correlates strongly with HWISE, with the strongest alignment in domestic water insecurity (r=0.65) and weaker but still significant correlations for productive (r=0.55) and combined dimensions (r=0.53), indicating substantial convergent validity while capturing additional, non-domestic aspects of water. Moreover, intra-household comparisons suggest broadly similar reported water security experiences among men and women, while pointing to potentially distinct livelihood and wellbeing pathways.

Overall, the proposed module offers a scalable and policy-relevant approach to measuring household water security, bridging experiential metrics and nexus-oriented analysis. By expanding measurement beyond domestic uses to include livelihoods, governance, and climate risk, it offers a more comprehensive understanding of household-level water insecurity and its management. Its strong empirical association with welfare outcomes, combined with its ease of integration into existing surveys, makes it a promising tool for informing integrated water, food, energy, and climate policy under conditions of increasing variability and scarcity.

How to cite: Zane, G., Buisson, M.-C., and Salmawobil, J.: Measuring Household Water Security for Health and Livelihoods: A Scalable Experiential Metric for Nexus-Oriented Water Policy, EGU General Assembly 2026, Vienna, Austria, 3–8 May 2026, EGU26-17697, https://doi.org/10.5194/egusphere-egu26-17697, 2026.

EGU26-20121 | ECS | Posters on site | HS5.3.1

A fully-integrated hydrological-optimization framework for Water–Energy–Food nexus management in alpine basins 

Filippo Di Marco, Diego Avesani, Matteo Giuliani, and Bruno Majone

Water–Energy–Food (WEF) nexus management in regulated alpine basins requires integrated approaches that couple hydrological modeling with multi-objective optimization. Reservoir operations must balance multiple competing objectives (e.g., hydropower production, downstream water demand) under highly variable hydrological conditions. Climate change is further intensifying these trade-offs by altering runoff seasonality and increasing hydrological uncertainty. Fully-coupled modeling frameworks are needed to directly represent the feedback between hydrological processes, reservoir operations, and management objectives, enabling efficient exploration of optimal operating strategies.

This study presents a fully-integrated framework that couples the distributed hydrological model HYPERstreamHS with the Borg Multi-Objective Evolutionary Algorithm (Borg-MOEA). The full integration allows the optimization algorithm to directly evaluate joint hydrological responses and management outcomes for different reservoir operating strategies within each iteration, capturing process feedbacks while reducing computational overhead compared to external coupling schemes.

We apply this framework to the Adda River basin in the Italian Alps, a highly regulated hydropower system. Results demonstrate how the coupled approach efficiently identifies Pareto-optimal trade-offs between energy production and competing water management objectives under climate uncertainty, providing quantitative support for adaptive reservoir operations.

Overall, this work provides a transferable modeling framework for multi-objective WEF nexus management in regulated alpine basins.

How to cite: Di Marco, F., Avesani, D., Giuliani, M., and Majone, B.: A fully-integrated hydrological-optimization framework for Water–Energy–Food nexus management in alpine basins, EGU General Assembly 2026, Vienna, Austria, 3–8 May 2026, EGU26-20121, https://doi.org/10.5194/egusphere-egu26-20121, 2026.

EGU26-20870 | Orals | HS5.3.1

Climate-Driven Water Stress and the Role of the Energy Transition in Enhancing Water–Energy Nexus Resilience 

Jingshui Huang, Sreya Prakash, Sawparnika Ayyappan Preetha Kumari, and Mattia Digiusto

Water and energy are two essential and interdependent resources that form the foundation of modern civilization. In Germany, the energy sector accounts for the largest share of total water demand (39% in 2022). Bavaria has traditionally been considered a water-rich federal state, with total water withdrawals historically remaining below 10% of available water resources. However, these conditions may change in the future, as climate change alters hydrological regimes and increases the frequency and severity of drought events. In this context, it is necessary to assess the resilience of regional water and energy systems under future climatic, demographic, and structural changes in the energy sector.

This study investigates the water–energy nexus and water security in the Upper Main River basin (Bavaria, Germany). The analysis is conducted within the framework of the RETOUCH Nexus project using an integrated modeling approach that combines the Soil and Water Assessment Tool (SWAT+), the Water Evaluation and Planning System (WEAP), and the Low Emission Analysis Platform (LEAP). SWAT+ is applied to simulate future hydrological changes under different climate scenarios derived from the ISIMIP3b dataset, while WEAP is used to represent sectoral water demands. Energy system transitions aligned with Bavaria’s 2040 climate neutrality targets are represented through LEAP, capturing feedbacks between electricity generation, renewable energy expansion, and water use in the energy sector.

The results indicate that the Upper Main River basin experiences seasonal unmet water demand, especially during summer months, with water availability declining under climate change. The SSP5–8.5 scenario represents the worst-case combination of reduced water availability and increased demand. Future unmet water demand emerges primarily in the industrial and energy sectors. However, the transition toward renewable energy—particularly wind and solar power—offers substantial potential to reduce water consumption in electricity generation, thereby increasing the resilience of the energy sector to climate change. Overall, this study provides a robust basis for forward-looking, climate-resilient water management and policymaking within Bavaria’s evolving environmental and energy system.

How to cite: Huang, J., Prakash, S., Ayyappan Preetha Kumari, S., and Digiusto, M.: Climate-Driven Water Stress and the Role of the Energy Transition in Enhancing Water–Energy Nexus Resilience, EGU General Assembly 2026, Vienna, Austria, 3–8 May 2026, EGU26-20870, https://doi.org/10.5194/egusphere-egu26-20870, 2026.


Water yield is a key ecosystem service that reflects the capacity of watersheds to regulate water availability under varying climatic and land use conditions. In this study, the InVEST Annual Water Yield model was applied to an upstream sub-basin of the Sefidrood watershed located in Kurdistan Province, western Iran, to assess the spatial variability of water yield and its relationship with land use patterns. Watershed boundaries were delineated using a digital elevation model and stream network data in ArcGIS. Potential evapotranspiration was estimated using the Blaney–Criddle method based on available climatological data, while precipitation surfaces were generated from regional rain gauge stations. Land use/land cover for 2023 was derived from Sentinel-2 imagery (10 m resolution) and Esri datasets. Plant available water content was calculated using global soil texture information. Model parameterization included the development of a biophysical table and the calibration of the Z parameter to reflect regional climatic conditions. Results indicate that annual water yield across the watershed ranges from 0 to 239.97 mm, with rangelands contributing the highest total water yield (90,656.7 m³) and orchards exhibiting the lowest contribution (47.2 m³). These findings highlight the strong influence of land use on water yield dynamics and provide a scientific basis for sustainable watershed management and ecosystem service optimization in semi-arid regions of western Iran.

How to cite: khodamoradi, H. and maerker, M.: Assessment of Water Yield as an Ecosystem Service Using the InVEST Model: A Case Study of a Watershed in Western Iran, EGU General Assembly 2026, Vienna, Austria, 3–8 May 2026, EGU26-21500, https://doi.org/10.5194/egusphere-egu26-21500, 2026.

EGU26-22039 | Orals | HS5.3.1

Beyond the Tap: The Value of Alternative Water Sources for Climate Adaptation 

Ruslana Palatnik, Dor Friedman, Julia Sirota, Orna Raviv, Ramiro Parrado, Mordechai Shechter, Taher Kahil, and Francesco Bosello

This study utilizes a Computable General Equilibrium (CGE) model, specifically GTAP-AW, to analyze the economic implications of alternative water sectors in addressing natural water scarcity, with a focus on the Mediterranean region. Recognizing the growing water scarcity worsened by climate change, the research incorporates alternative water sources—desalination and treated wastewater—into the economic framework, establishing a direct link with natural water as a primary factor of production. The study offers a thorough evaluation of how shifts in the availability and management of water resources, both natural and alternative, as well as climate-driven changes in land and water productivity, can influence vital sectors and the overall economy, especially under climate-driven water shortages.

The research hypothesizes that, despite higher financial and energy costs, the adoption of alternative water sources in water-scarce areas provides significant social benefits by reducing the impacts of natural water shortages, supporting food security, and sustaining economic growth. Results indicate that under the SSP2–RCP4.5 scenario, decreases in natural water availability and declining irrigation water productivity place strong pressure on agriculture, energy production, and GDP. Nevertheless, when desalination and treated wastewater can substitute for scarce natural water—as in the GTAP-AWH specification—these negative effects are substantially mitigated. The findings emphasize the economic value of alternative water sources and advocate for including detailed technical substitution and innovation capabilities into CGE models to better evaluate the economy-wide potential to substitute capital and other inputs with water.

The abstract is sub,itted for the session HS5.3.1: Water resources policy and management - balancing the water, food, energy and environment nexus for sustainable and resilient water systems under global change

How to cite: Palatnik, R., Friedman, D., Sirota, J., Raviv, O., Parrado, R., Shechter, M., Kahil, T., and Bosello, F.: Beyond the Tap: The Value of Alternative Water Sources for Climate Adaptation, EGU General Assembly 2026, Vienna, Austria, 3–8 May 2026, EGU26-22039, https://doi.org/10.5194/egusphere-egu26-22039, 2026.

EGU26-345 | ECS | PICO | HS5.3.2

Vulnerabilities and opportunities of solar-hydro hybridization under climate change: a case study in the Swiss Alps 

Domenico Micocci, Cristiana Bragalli, Elena Toth, Tobias Wechsler, and Massimiliano Zappa

Many countries are increasing the share of variable renewable energy sources (VRES) in their energy mix, as part of their climate change (CC) mitigation strategy. Coupling solar photovoltaics (PV) with reservoir-based hydropower (HP) is a promising solution to facilitate the introduction of higher amounts of intermittent PV power in the electrical grid, thanks to storage capacity provided by HP. However, these resources are themselves vulnerable to CC: climate-induced modifications of the hydrological cycle may affect HP operations, whereas the projected air temperature increase badly impacts the efficiency of PV converters. Few research works focused on CC impacts on combined HP-PV operation, hence possible consequences for solar-hydro hybrids are still unclear for many regions, such as the Alps.
We evaluate the impacts of CC on a hybrid HP-PV plant in the Swiss pre-Alpine region, consisting of an existing pumped-storage HP plant, complemented by a fictional FPV plant. Simulations are run at hourly temporal resolution according to a top-down approach, involving an impact modelling chain forced by climate variables from a multi-model ensemble of 39 EURO-CORDEX-based GCM-RCM runs covering three emission scenarios; coherent projections for the reservoir inflows are obtained through a hydrological model, developed using the semi-distributed PREVAH modelling system.
We compare a reference setup (with no PV to support HP) to two hybrid setups: in the first one solar energy, if available, contributes to fulfil the demand and excess PV power is possibly stored through pumping; the second setup is similar, but it also includes the possibility to increase the legally prescribed environmental flow using part of the water which is not used for HP generation thanks to PV power contribution.
Simulations indicate an increase of HP production during winter and a decrease in spring and summer, resulting from a climate-induced shift in runoff seasonality. Annual PV energy yield might slightly decrease, mainly as a consequence of air temperature increase; the seasonal pattern of PV power available, instead, is projected not to undergo remarkable changes, the highest potential being concentrated in spring and summer. There exists a complementarity between changes in runoff seasonality in the study area and the seasonal pattern for PV power available, hence a properly designed PV plant might be able to compensate for most of the projected reduction in spring and summer HP generation. We also found that the introduction of PV might have a positive impact on reservoir management and might allow to increase downstream environmental flow without significantly affecting the performance of the power plant.

How to cite: Micocci, D., Bragalli, C., Toth, E., Wechsler, T., and Zappa, M.: Vulnerabilities and opportunities of solar-hydro hybridization under climate change: a case study in the Swiss Alps, EGU General Assembly 2026, Vienna, Austria, 3–8 May 2026, EGU26-345, https://doi.org/10.5194/egusphere-egu26-345, 2026.

EGU26-3141 | ECS | PICO | HS5.3.2

Hydropower in Cold Climates Under Climate Change: A Systematic Review 

Raffa Ahmed, Julia Kiehle, Taiwo Bamgboye, Alireza Sharifi Garmdareh, Zeeshan Virk, Noora Veijalainen, Hannu Marttila, and Ali Torabi Haghighi

In cold climate regions, hydropower operations depend on predictable snowmelt and stable ice conditions. However, climate change is disrupting these patterns through earlier snowmelt, shorter ice-influenced period, and rising winter inflows. These shifts challenge existing reservoir rules and complicate efforts to align hydropower production with evolving seasonal energy demand. Despite extensive research, there remains a lack of synthesized data specifically addressing these challenges in cold climate regions. To address this, we conducted a systematic review of 103 peer-reviewed studies and technical reports, complemented by insights from operators, experts, and regulators from regions with snow/glacial-influenced basins. The inclusion criteria focused on studies examining hydropower operations, climate change hydropower adaptation, and cold-climate or Nordic conditions, while the exclusion criteria included studies written in non-English languages, those centered on tropical, arid, or semi-arid hydropower systems, and studies lacking relevance to operational or environmental aspects. The review focused on (i) consequences of climate-driven hydrological and cryosphere changes for hydropower operations, (ii) vulnerability of hydropower intakes, spillways, and dams to changing hydrological and ice conditions, and (iii) adaptation strategies, including flexible rule curves, multi-objective optimization, and ice control methods. The review indicates that climate change is already undermining hydropower resilience in cold-climate regions, altering runoff seasonality, shifting ice regimes, and increasing hydrological variability. Earlier snowmelt, higher winter inflows, and reduced summer runoff commonly lead to seasonal mismatches between water availability, electricity demand, and market conditions.  At the same time, ice-related processes such as frazil ice formation, intake clogging, and ice jams remain major operational risks.  Although some studies suggest potential increases in annual hydropower production, these gains are often offset by increased spill losses, constrained summer generation, and growing conflicts between energy production, flood control, and environmental flow requirements. This work provides a structured basis for enhancing operational resilience by integrating scientific evidence with stakeholder perspectives.

How to cite: Ahmed, R., Kiehle, J., Bamgboye, T., Garmdareh, A. S., Virk, Z., Veijalainen, N., Marttila, H., and Haghighi, A. T.: Hydropower in Cold Climates Under Climate Change: A Systematic Review, EGU General Assembly 2026, Vienna, Austria, 3–8 May 2026, EGU26-3141, https://doi.org/10.5194/egusphere-egu26-3141, 2026.

EGU26-4305 | ECS | PICO | HS5.3.2

Multi-Objective Reservoir Management under Environmental Constraints: Hydropeaking and Thermal Impacts in Alpine Rivers 

Maria Elena Alfano, Marta Zaniolo, Laura Savoldi, and Davide Poggi

Multi-objective reservoir optimization plays a pivotal role in managing water scarcity and growing uncertainty in hydrology under climate change, especially in sensitive mountain environments. While these frameworks are effective in weighing competing uses such as hydropower production and water supply, they often provide a aggregated representation of environmental impacts. In particular, operationally driven alterations of flow regimes (hydropeaking) and downstream water quality, especially water temperature, are seldom incorporated as explicit objectives, despite representing some of the most critical stressors on riverine ecosystems.

Hydropeaking, arising from rapid sub-daily variations in turbine releases, is one of the most severe anthropogenic stressors in regulated Alpine rivers, impacting habitat availability, fish behavior and survival, and benthic communities. In parallel, reservoir operations substantially modify downstream water temperature through flow regulation and withdrawal, directly influencing dissolved oxygen, metabolic processes, and habitat suitability. Although these pressures operate through different mechanisms and timescales, both are directly controlled by reservoir management decisions.

To explicitly incorporate these ecosystem challenges, we develop a sub-daily simulation and optimization framework that integrates both hydropeaking and thermal dynamics directly into operational planning. Thermal dynamics are simulated using a one-dimensional, density-stratified Lagrangian model, which resolves the vertical thermal structure of the reservoir and its impact on release temperature with limited computational burden. Environmental objectives include minimizing (i) hydropeaking metrics that quantify the magnitude and frequency of sub-daily flow fluctuations, and (ii) downstream water temperature exceedance from natural conditions. These are optimized jointly with objectives related to hydropower revenue and irrigation reliability.

The framework is applied to the Ceresole reservoir (North-West Italy) using a closed-loop optimization approach. Policies are optimized using an Evolutionary Multi-Objective Direct Policy Search (EMODPS), permitting adaptive decision-making that responds dynamically to system states rather than prescribing pre-settled release trajectories.

Results show that extensive accounting for both hydropeaking and thermal objectives leads to tangibly different optimal operating strategies compared to traditional formulations, revealing clear trade-offs as well as non-obvious synergies between economic and ecological goals. The proposed framework provides a transparent and transferable approach for integrating operationally relevant environmental constraints into reservoir optimization, supporting more ecosystem-oriented hydropower management in Alpine river systems.

How to cite: Alfano, M. E., Zaniolo, M., Savoldi, L., and Poggi, D.: Multi-Objective Reservoir Management under Environmental Constraints: Hydropeaking and Thermal Impacts in Alpine Rivers, EGU General Assembly 2026, Vienna, Austria, 3–8 May 2026, EGU26-4305, https://doi.org/10.5194/egusphere-egu26-4305, 2026.

EGU26-13039 | ECS | PICO | HS5.3.2

Hydropower generation under anthropogenic disturbances: A global review and case studies in France and Colombia. 

Paul Hazet, Olivier Evrard, Benjamin Quesada, Anthony Foucher, and Alvaro Avila

Hydropower, the global leading renewable energy source (one-sixth of worldwide electricity), is increasingly vulnerable to environmental and anthropogenic pressures. This study assesses their impacts through a systematic review and local scale studies. A systematic review carried out with a PRISMA-based screening of 1,516 Web of Science articles revealed a publication bias towards China and Brazil (24% of studies, 41% of global capacity), with a climate-focused research dominating over land use, sediment dynamics, or policy analysis. Strong correlations between precipitation or inflow variation was found, reflecting this bias. A mapping of climate, hydrology and energy model chains across structural complexity was realized. No cross-study robustness could be established. Almost no studies encompass all environmental factors. Then, to address the identified bias towards climate-focused approaches, we adopted a multi-scale, multi-factor methodology focusing on two case studies: Colombia and France, where hydropower represents approximately 68% and 20% of their total national installed capacity, respectively. In Colombia, we assessed the national-scale impact of ENSO-driven interannual climate variability on hydropower generation. Complementarily, we conducted high-resolution sediment core analyses from lakes supplying the Guatapé/El Peñol (Colombia) and Monts d’Orb (France) dams. Using a combination of fallout radionuclide dating, and multi-proxy analyses (relative density, granulometry, XRF), we reconstructed sediment dynamics to disentagle the combined effects of climate variability, land use change, and policy constrains on hydropower generation. Overall, this work reveals persistent bias and blindspots in hydropower vulnerability assessments, showing the importance of multi-scale, multi-factor approaches that integrate climate, land use, sediment dynamics, and policy constraints.

How to cite: Hazet, P., Evrard, O., Quesada, B., Foucher, A., and Avila, A.: Hydropower generation under anthropogenic disturbances: A global review and case studies in France and Colombia., EGU General Assembly 2026, Vienna, Austria, 3–8 May 2026, EGU26-13039, https://doi.org/10.5194/egusphere-egu26-13039, 2026.

Hydropower is a mature and cost-competitive renewable energy source and plays a central role in the European electricity system by providing flexibility, reserves, and grid stability. However, expanding hydropower generation capacity and operational capabilities is increasingly constrained by environmental regulations, competing water uses, and limited opportunities for new infrastructure development. This study explores the feasibility of deploying hydrokinetic turbines within tailrace channels downstream of hydropower dams as an infrastructure-efficient opportunity to incrementally expand energy production at existing facilities or enable generation at Non-Powered Dams (NPDs), while leveraging regulated flow releases and existing assets. Hydrokinetic turbines harness the kinetic energy of water currents, using the same physical mechanism as wind turbines, and can complement conventional hydropower without requiring additional storage or major civil works.

Tailrace channels offer favourable conditions for hydrokinetic applications due to their fast-moving currents, predictable operating regimes, proximity to grid interconnections, and limited incremental environmental footprint. However, energy extraction introduces additional flow resistance that may induce a backwater effect in subcritical flows, potentially reducing the available hydraulic head at the upstream powerhouse and offsetting net energy gains. To quantify this tradeoff, we propose a simple one-dimensional momentum balance approach to estimate the induced water-level increase as a function of tailrace hydraulics, turbine operating conditions, and channel blockage. The model is non-dimensional and geometry-agnostic, enabling rapid screening across a wide range of sites, and is validated against laboratory and field-scale measurements.

By coupling this formulation with traditional backwater calculations, we show how turbine siting distance can be optimized to maximize net power production while remaining within tailrace boundaries. This approach enables a system-level evaluation of hydrokinetic integration that explicitly balances marginal hydropower losses against hydrokinetic gains. Results suggest that tailrace hydrokinetic deployment can provide incremental generation and operational flexibility using existing assets, supporting grid resilience and renewable integration without requiring major modifications to hydropower plant operation or additional storage infrastructure.

How to cite: Musa, M. and Tseng, C.-Y.: Expanding Hydropower Capabilities Using Hydrokinetic Turbines in Tailrace Channels: Feasibility, Site Optimization, and System Implications , EGU General Assembly 2026, Vienna, Austria, 3–8 May 2026, EGU26-13125, https://doi.org/10.5194/egusphere-egu26-13125, 2026.

EGU26-13849 | ECS | PICO | HS5.3.2

Open River Network and Hydropower Cascade Modelling: A Python Framework for Integrated Hydrological Modelling and Simulation of Regulation Dynamics 

Christine Kaggwa Nakigudde, Epari Ritesh Patro, and Ali Torabi Haghighi

We present Open River Network and Hydropower Cascade Modelling, a Python-based framework implemented in Jupyter Notebooks for integrated analysis and simulation of hydrological dynamics within river networks and hydropower dam cascades. The river network model supports data input from gridded datasets and time series observations for lumped and distributed hydrological modelling to simulate river discharges across subbasins in the river basin. A lake routing routine based on a modified Puls method has been incorporated, allowing integration of lake bathymetry and stage-discharge relationships. River routing employs kinematic wave routing based on 1D Saint-Venant equations to route discharges between river reaches. Calibration routines are embedded within the framework, supporting simple global shuffled optimisation algorithms and evolutionary algorithms. Building on the river network model, the hydropower cascade model includes two submodules: (i) a river network analysis module that computes the dynamic degree of regulation by hydropower dams, resulting downstream inflow alteration, and local degree of regulation introduced by each dam in the cascade; and (ii) an operational cascade module that implements user-defined reservoir regulation rules for long-term scheduling and short-term operational flexibility of both storage and run-of-river hydropower cascades, with a lag function to preserve the hydraulic connection between dams. This modelling framework provides a comprehensive hydrological analysis of heavily regulated river basins with multiple dams. Furthermore, it supports the simulation of operational and regulation dynamics across regulated hydropower cascades within river networks. This work has been conducted as part of the Interreg Aurora’s RE-HYDRO project.

How to cite: Nakigudde, C. K., Patro, E. R., and Haghighi, A. T.: Open River Network and Hydropower Cascade Modelling: A Python Framework for Integrated Hydrological Modelling and Simulation of Regulation Dynamics, EGU General Assembly 2026, Vienna, Austria, 3–8 May 2026, EGU26-13849, https://doi.org/10.5194/egusphere-egu26-13849, 2026.

Under a changing environment, the lack of precise alignment between the multi-driving mechanisms of spatiotemporal runoff evolution and the regulation of reservoir group, coupled with the frequent neglect of uncertainties in attribution analysis, results in a logical disconnect between "driver identification and regulatory response". To address this gap, this study integrates the theories of streamflow change attribution and reservoir group adaptive scheduling, proposing an integrated methodological framework of "uncertainty quantification - precise driver identification - targeted regulation design". The core of this framework comprises two interconnected modules: First, a distributed hydrological model (SWAT) is coupled with the Differential Evolution Adaptive Metropolis (DREAM) algorithm. Through Bayesian inference, the posterior distribution of model parameters is obtained, and combined with multi-route attribution analysis, the nonlinear contributions and uncertainties of climatic factors (precipitation, temperature, humidity, wind speed) and human activities (land use/cover change, LUCC) to streamflow are quantified, clarifying the positive/negative effects and spatial heterogeneity of each driving factor. Second, guided by the attribution results to target key drivers and their uncertainties, a three-dimensional adaptive scheduling system of "supply-demand-linkage" is constructed. Using a multi-objective optimization model solved by the Adaptive Hybrid Particle Swarm Optimization (AHPSO) algorithm, supply-side (cascade joint optimization, rainwater and flood resource utilization), demand-side (water-saving behavior adjustment), and supply-demand linkage regulatory measures are designed to achieve synergistic response to multi-dimensional driving forces. This framework has been applied to the Upper Yangtze River Basin, verifying its effectiveness in bridging attribution analysis and adaptive scheduling. It breaks the traditional disconnect between the two fields, providing scientific and operable methodological support for the dynamic management of water resources systems under changing environments, and can be widely extended to the collaborative optimization of reservoir group systems in complex river basins.

How to cite: Zhang, Y.: From Runoff Change Drivers Identification to Targeted Regulation: An Integrated Framework for Reservoir Group Adaptive Scheduling, EGU General Assembly 2026, Vienna, Austria, 3–8 May 2026, EGU26-15897, https://doi.org/10.5194/egusphere-egu26-15897, 2026.

Hydropower remains one of the most reliable and flexible renewable energy sources and continues to play a vital role in stabilising electricity systems with growing shares of wind and solar power. Yet, in practice, hydropower operation is increasingly shaped by non-power objectives such as environmental flow requirements, water supply security, flood management, and ecosystem protection. These competing demands, combined with climate-driven hydrological variability and evolving electricity market structures, limit the extent to which hydropower can respond to price signals and support renewable integration. Addressing these challenges calls for holistic, policy-relevant approaches that explicitly recognise the interdependencies between water, energy, and ecosystems.

This study explores how hybridising conventional reservoir-based hydropower with downstream hydrokinetic energy recovery can enhance operational flexibility without compromising water-resource or environmental constraints. A nonlinear optimisation framework is developed to co-ordinate hydropower generation, tailrace hydrokinetic extraction, and grid interaction under time-of-use electricity tariffs. The model explicitly represents reservoir dynamics, climatic drivers (inflow, precipitation, evaporation), and mandatory environmental flow releases, while capturing the site-specific relationship between hydropower discharge and tailrace flow velocity. A rolling-horizon formulation is adopted to reflect short-term operational planning and evolving hydrological conditions.

The approach is demonstrated using an existing hydropower plant in southern Poland, where limited hydrokinetic recovery (approximately 3% of main discharge) can be achieved without affecting upstream hydraulic performance or ecological flow regimes. Results show that coordinated operation improves reservoir stability, reduces reliance on peak-period grid imports, and lowers annual operational energy costs by 1.81% compared to conventional operation. Over the plant lifetime, the hybrid configuration yields a 3.95% reduction in total costs with a break-even period of approximately 3.7 years. Sensitivity analyses highlight electricity pricing and financial parameters as stronger drivers of system performance than hydrokinetic capital costs.

Overall, the study demonstrates that hybrid hydropower-hydrokinetic systems offer a practical and policy-compatible pathway to strengthen the water-energy-ecosystem nexus, enhance climate resilience, and unlock additional flexibility from existing hydropower infrastructure in low-carbon electricity transitions.

How to cite: Kusakana, K.: Enhancing hydropower flexibility through tailrace hydrokinetic energy recovery: A Water-Energ-Ecosystem Nexus Perspective, EGU General Assembly 2026, Vienna, Austria, 3–8 May 2026, EGU26-19394, https://doi.org/10.5194/egusphere-egu26-19394, 2026.

EGU26-20631 | PICO | HS5.3.2

Climate change impacts on water availability and hydropower production – a case study from Drammen river basin in Norway  

Kolbjorn Engeland, Emiliano Gelati, Trine Jahr Hegdahl, Shaochun Huang, and Carl Andreas Veie

Close to 90% of the electricity production in Norway originate from hydropower. To match the energy supply with the demand water is stored in reservoirs in summer when reservoir inflow is high and production is high, and released in  winter when the demand is the highest and inflow is small. As the management of hydropower reservoirs aims to maximize income,  the day-to-day decision of power production, and reservoir release, is based on electricity prices and  constrained by minimum and maximum reservoir water levels as well as minimum flow requirements downstream.

As a part of the HorizonEurope project STARS4Water, we aim to assess how climate changes might impact  reservoir inflows, hydropower production, reservoir operations in the Drammen River basin in southern Norway. In particular we have analyzed the climate change impacts on the seasonality and year-to-year variability of energy inflow to the reservoirs, reservoirs water levels and  how much of changes in energy inflow impacts the power production. To assess climate change impacts, downscaled scenarios from several combinations of GCMs, RCMs, and bias correction algorithms from both Coupled Model Intercomparison Project Phase 5 (CMIP5) and CMIP6 are used. We have used two gridded hydrologic models (HBV and LISFLOOD) to simulate runoff for a reference period and two future periods driven by the downscaled climate projections. Thereafter, the energy marked model EOPS (One-area Power-market Simulator) has been used to simulate reservoir operations. EOPS is used for sub-areas or river basins, has a detailed representation of the hydropower system, including environmental restrictions, and requires inflows and energy prices as inputs. Based on the outputs from the hydrological models and EOPS, the changes in water balance, reservoir inflow, water levels, and – outflows, and energy production are analysed and compared.    

How to cite: Engeland, K., Gelati, E., Hegdahl, T. J., Huang, S., and Veie, C. A.: Climate change impacts on water availability and hydropower production – a case study from Drammen river basin in Norway , EGU General Assembly 2026, Vienna, Austria, 3–8 May 2026, EGU26-20631, https://doi.org/10.5194/egusphere-egu26-20631, 2026.

While Hydropower is cost-efficient, reliable, and almost carbon-free, its development in remote Arctic and Alpine regions implies a complex interplay of social, economic, and environmental impacts that extend far beyond technical energy generation. This study employs a comparative case analysis of two major facilities, i) the Kárahnjúkar Plant (690 MW capacity) in Iceland and ii) the Reisseck-Malta hydropower complex (1.1 GW capacity) in Austria, to critically assess the social, economic, and environmental implications of remote mountain hydropower. Both plants generate significant energy, which is supplied to the national grid, but are situated in sparsely populated, ecologically sensitive mountain regions.

Socially, both regions struggle with long-term trends of declining and aging local populations, a dynamic that large-scale infrastructure projects rarely reverse. Economically, the plants operate with high technical and financial efficiency at the national level; however, questions remain regarding the equitable distribution of benefits, as local communities may experience limited direct economic prosperity from the projects. Power plant operators have implemented large-scale projects to minimize, mitigate, and compensate for environmental concerns, including habitat fragmentation, altered river regimes, and landscape modification, with the objective of achieving a net-positive ecological outcome.

Based on this comparative case analysis, a holistic "sustainable energyscape" framework is proposed. The proposed framework conceptualizes the landscape surrounding the power plants as an integrated space where societal needs, energy production, and ecological health are co-managed to achieve synergistic outcomes. By intentionally aligning remote hydropower development with robust local value creation and rigorous environmental stewardship, such a framework can guide the path toward truly sustainable and prosperous societies in energy-intensive futures.

How to cite: Finger, D. C.: The Remote Energy Dilemma: Balancing Hydropower, People, and Nature in the Alps and Arctic, EGU General Assembly 2026, Vienna, Austria, 3–8 May 2026, EGU26-21003, https://doi.org/10.5194/egusphere-egu26-21003, 2026.

EGU26-21011 | ECS | PICO | HS5.3.2

Influence of heatwaves on chlorophyll-a dynamics in a Portuguese large reservoir using Sentinel-2 imagery 

Carla Silva, Ritesh Patro, and Maria Manuela Portela

Global temperatures have increased markedly since the Industrial Revolution, with a clear breakpoint identified during this period. The most recent decade (2011–2020) has recorded progressively higher temperatures compared with the pre-industrial reference period (1850–1900). These increases, driven by anthropogenic climate change, are also reflected in the growing occurrence of extreme events, particularly heatwaves (HWs).

Within this context, Portugal, characterised by a Mediterranean climate, is among the European regions most vulnerable to climate change. These alterations can impact multiple sectors, including water resources dependent on reservoirs, such as hydropower generation. A significant consequence is the intensification of chlorophyll a blooms during heatwave events, which can compromise water quality in reservoirs of national importance.

This study aims to analyse heatwaves over mainland Portugal in 2025, with a focus on the country’s largest reservoir, Alqueva, and assesses the potential implications for chlorophyll-a dynamics. The year 2025 was the third warmest on record, following 2023 and 2024.

The Alqueva Reservoir is located in southern Portugal, has a gross capacity of 4,150 hm³ and a flooded area of 250 km² at full supply level (FSL). Operational since 2002 and situated within the Guadiana River basin, a transboundary catchment of approximately 55,289 km² across Spain and Portugal with mean annual precipitation of 593 mm, the reservoir is a major source of irrigation, drinking water, and hydropower production, with an installed capacity of 520 MW.

Heatwave analyses for 2025 were conducted using the ERA5-Land reanalysis dataset (0.1° × 0.1° resolution). Hourly 2 m air temperature data were used to derive daily maximum (Tmax) and minimum (Tmin) temperatures. Heatwaves were identified using ERA5-Land reanalysis data, with events defined as ≥3 consecutive days with Tmax ≥ 30 °C and Tmin ≥ 22 °C (definition of heatwave frequency). Three heatwaves occurred between June and August 2025 (Figure 1).

Chlorophyll-a concentrations in the Alqueva Reservoir were estimated from Sentinel-2 Level-2A imagery, which provides atmospherically corrected surface reflectance at 10 m resolution. Images were selected from the Copernicus Data Space Browser with less than 10% cloud cover. To evaluate the effects of heatwaves on chlorophyll-a, with events selected based on data availability, concentrations were quantified before and during each event using the Three-Band Method (TBM), calculated from Sentinel-2 bands B4, B5, and B6.

Figure 1. HWs identified in 2025 over the Alqueva Reservoir.

The preliminary results showed a bloom of chlorophyll-a during the heatwaves (Figure 2), highlighting the impact of elevated temperatures on water quality. The methodology could be extended to identify other heatwave events based on pre-established definitions in order to assess whether blooms occur in a similar manner to those detected using the heatwave frequency metric.

Figure 2. Chlorophyll-a in the Alqueva Reservoir before and during the three heatwaves of 2025 (HW1–HW3). Left panels: before each heatwave; right panels: during each heatwave.


Acknowledgments: This research was fully funded by the Fundação para a Ciência e a Tecnologia (FCT) under Grant 2023.04248.BD and the CERIS research unit project UID/6438/2025. Additional support was provided by COST Action CA21104.

How to cite: Silva, C., Patro, R., and Portela, M. M.: Influence of heatwaves on chlorophyll-a dynamics in a Portuguese large reservoir using Sentinel-2 imagery, EGU General Assembly 2026, Vienna, Austria, 3–8 May 2026, EGU26-21011, https://doi.org/10.5194/egusphere-egu26-21011, 2026.

EGU26-1478 | PICO | HS5.3.3

Nonlinear and Divergent Responses of Crop Yield and Soil Nitrous Oxide Emissions to Precipitation Change 

Dafeng Hui, Jaekedah Christian, Avana Chauvin, Faisal Hayat, Avedananda Ray, Resham Thapa, Yujuan Chen, Nicholas Girkin, Daniel Ricciuto, Melanie Mayes, and Hanqin Tian

Global food demand is projected to increase by 50-60% between 2019 and 2050, making it critical to understand how crop yield and soil health respond to increasing climate variability, particularly drought. In this study, we coupled a 40-year climate dataset (1981-2020) with the biogeochemical model DNDC (DeNitrification-DeComposition) to simulate corn yield and soil nitrous oxide (N2O) emissions under 20 precipitation treatments ranging from severe drought (-90% precipitation reduction) to extreme wet conditions (+100% precipitatino increase). We quantified interannual variability (IAV) and precipitation sensitivity of both responses. Corn yield and soil N2O emissions each exhibited substantial IAV but with contrasting patterns: yield variability peaked under moderate drought (-30% to -50%), whereas N2O variability intensified with increasing precipitation. Yield increased linearly from severe drought to ambient precipitation but plateaued when precipitation exceeded ambient levels, while N2O emissions rose steadily across nearly all precipitation treatments. Under most precipitation scenarios, corn yield responded linearly to precipitation, whereas N2O emissions were significantly sensitive to precipitation only under drought conditions (-30% to -70%). We also identified a precipitation threshold for maximum yield and an optimal precipitation range in which yield gains exceeded increases in N2O emissions. Overall, our results demonstrate nonlinear and asymmetric responses of crop productivity and soil N2O emissions to precipitation changes, highlighting the importance of adaptive agricultural management strategies under growing climate variability.

How to cite: Hui, D., Christian, J., Chauvin, A., Hayat, F., Ray, A., Thapa, R., Chen, Y., Girkin, N., Ricciuto, D., Mayes, M., and Tian, H.: Nonlinear and Divergent Responses of Crop Yield and Soil Nitrous Oxide Emissions to Precipitation Change, EGU General Assembly 2026, Vienna, Austria, 3–8 May 2026, EGU26-1478, https://doi.org/10.5194/egusphere-egu26-1478, 2026.

EGU26-1561 | ECS | PICO | HS5.3.3

Assessing water scarcity and potential for irrigation development in Europe and Central Asia 

Oleksandr Mialyk, Han Su, Silvan Ragettli, Poolad Karimi, and Ranu Sinha

Agriculture plays an important role in the socioeconomic development of the Europe–Central Asia region (ECA). This area is highly diverse in terms of climate and geography, allowing countries to grow a wide range of crops for domestic consumption and exports, such as cereals, oil crops, and fruits. About 87 % of ECA’s cropland is rainfed, making crop production increasingly vulnerable to droughts and water scarcity.

Here, we present a new World Bank study, which applies a gridded process-based crop model ACEA to assess the present (1992–2019) and future (under three SSP–RCP scenarios till 2100) exposures to i) green water scarcity (GWS), ii) blue water scarcity (BWS), and iii) the potential for irrigation development across all major crops in 21 ECA countries. Presently, this region has around 21 million ha of rainfed cropland experiencing GWS—restricted crop growth due to insufficient rainfall—mainly affecting Kazakhstan, Türkiye, and Ukraine. This exposure to GWS is projected to increase in the future, worsened by further increases in the frequency and extent of extreme droughts. On the other hand, most of these areas experience no BWS—unsustainable levels of blue water consumption considering environmental flow requirements—and thus, developing irrigation can serve as a vital adaptation strategy. We estimate that currently around 14.6 million ha under GWS can potentially transition to irrigation (increasing by 11.5–30.6 % by 2100), which would not only reduce GWS-related risks but also support the socioeconomic development in ECA. This transition, however, should be considered only as one of the several options on the “menu of solutions”. Other agricultural practices, such as changing cropping patterns and improved soil management, should be explored before investing in new irrigation systems.

This study demonstrates a novel application of gridded crop modelling and offers vital insights into the present and future water scarcity levels in the ECA region, while also demonstrating the potential of irrigation in addressing the associated risks.

How to cite: Mialyk, O., Su, H., Ragettli, S., Karimi, P., and Sinha, R.: Assessing water scarcity and potential for irrigation development in Europe and Central Asia, EGU General Assembly 2026, Vienna, Austria, 3–8 May 2026, EGU26-1561, https://doi.org/10.5194/egusphere-egu26-1561, 2026.

EGU26-2238 | PICO | HS5.3.3

Understanding rainfall patterns and farmers' concerns in Eastern Sahel amid alternate hydroclimatic extremes 

Nadir Ahmed Elagib, Mohammed Basheer, Abbas E. Rahma, and Andreas H. Fink

Variability is an inherent characteristic of the African Sahel climate, posing risks to the region's agriculture-based economy. Nevertheless, agricultural research on the region rarely integrates hydroclimatic extremes (i.e., droughts and floods). To address this gap at least in part, we raise the following research questions: Are there considerable differences between rainfall patterns and farmers' concerns under alternating hydroclimatic extremes? Which rainfall attribute(s) do farmers consider most concerning? What support do they need to navigate climate variability? To this end, we first identified 26 notorious drought and flood events from the literature for the analysis, spanning 1970-2020. In total, 16 of these events were droughts and the rest were floods. Second, we used stations' daily rainfall for the Sudanese Sahel (1.03 million square kilometres of arid and semi-arid environment) to calculate the number of rainy days (NURD) and dekadal indices of rainfall seasonality, concentration and intra-annual variability for the 26 events. The region was divided into two zones: Eastern Sudanese Sahel (EASS) and Western Sudanese Sahel (WESS). Third, we tested for significant differences in the means of these indices across the two zones, the two hazards, and the periods of the Sahel drought and recovery. Finally, we examined the responses of 307 and 499 farmers surveyed in the rainfed sector across EASS and WESS, respectively. The responses focused on their perception of rainfall change, adaptation measures against climate change, and barriers to implementing these adaptation strategies. Results showed significant differences in the means of indices between the two zones, between the drought and flood extremes for EASS, and only between the two extremes in the NURD for WESS. No significant change in the means of any of the indices occurred between the Sahel drought and recovery periods. The NURD plays a key role in shaping rainfall patterns, particularly in EASS. Conversely, this factor is unimportant both during the recovery period and during flood events in WESS. In general, higher NURD indicated less dekadal rainfall seasonality and variability across the year. In both zones, changes in the amount of rainfall overshadows the other perceived changes in detailed rainfall conditions. The majority of farmers are of the opinion that rainfall is decreasing. Surprisingly, the farmers in both zones seem to have little awareness of/concern about the recent frequent occurrence of both droughts and floods. Only 7.0% of WESS farmers mentioned lack of meteorological information as a barrier to adapting to climate change. Moreover, it is entirely missing from the suggested actions needed to cope. Although 44.0% of EASS respondents reported lacking meteorological information, only 15.7% of farmers reported that such information is crucial to coping with climate change. This study underscores the need for analyzing both hydroclimatic extremes integratively. However, without overlooking the farmers' socioeconomic characteristics, strengthening the weather forecast infrastructure emerges as one of the intrinsic pathways toward agricultural adaptability and transformation in Sahelian Sudan.

How to cite: Elagib, N. A., Basheer, M., Rahma, A. E., and Fink, A. H.: Understanding rainfall patterns and farmers' concerns in Eastern Sahel amid alternate hydroclimatic extremes, EGU General Assembly 2026, Vienna, Austria, 3–8 May 2026, EGU26-2238, https://doi.org/10.5194/egusphere-egu26-2238, 2026.

Farmers are increasingly exposed to climate change-induced stressors, including rising temperatures, altered rainfall patterns, and the growing frequency and intensity of extreme weather events. Understanding farmers’ actions and the factors that drive their responses to climate extremes is therefore essential for developing forward-looking, potentially transformative strategies that enhance climate resilience. The literature highlights three critical stages in addressing climate change: (i) recognizing observed environmental changes; (ii) evaluating whether these changes necessitate transformative behavioural responses to ensure resilience; and (iii) implementing effective adaptation measures to reduce vulnerability. In the pursuit of understanding ‘realistic’ farmers behaviour, researchers have increasingly acknowledged the range of factors and interactions that motivate climate behaviours, emphasizing the importance of cognitive processes beyond purely rational decision-making.

Adopting a bottom-up approach, this contribution examines farmers’ climate change behaviour through a triple-loop analytical framework encompassing awareness, perception, and adaptation. We conducted a survey of a random sample of 922 farmers in California to address three primary research questions: 1) to what extent do farmers perceive and respond to climate change, and what barriers constrain their capacity to reduce climate vulnerability? 2) whether risk adaptation pathways differ across farmers and, if so, which drivers shape their preferences and decision-making; and 3) how narratives and ‘wicked problems’ –such as climate scepticism, maladaptation, techno-optimism, and eco-anxiety– influence climate change initiatives and farmers’ tactical (short-term) and strategic (long-term) responses to evolving climate risks. To address these questions, we employ descriptive statistics, econometric analysis, clustering techniques, and structural equation modelling to capture farmer heterogeneity, identify cognitive and behavioural drivers of transformative responses, and disentangle the relative importance of factors shaping adaptive capacity.

The results indicate that farmers are generally aware of climate change and perceive increasing climate variability and impacts, particularly reporting rising temperatures, more frequent heatwaves and droughts, and declining rainfall and snowpack. Farmers employ a combination of coping strategies (e.g., weather and climate information services, insurance) and preventive measures (e.g., reduced fertilization, more efficient irrigation systems, and soil conservation practices). Nevertheless, several significant barriers to adaptation emerge, including high investment costs, increasingly stringent environmental regulations, and insufficient financial support for climate adaptation initiatives (e.g., water trading programs). The findings also reveal substantial heterogeneity in farmers’ attitudes and preferences regarding adaptation strategies. Accordingly, farmers can be classified into three behavioural profiles: Negationists (low-concern, unconvinced adapters), Optimisers (cautious, pragmatic adapters), and Proactives (well-informed, motivated adapters), highlighting pronounced behavioural diversity. The structural equation model confirmed that climate change awareness significantly predicts variability in farmers’ behavioural responses through perceived impacts; however, the causal linkage between risk perception and risk adaptation appears weaker and less robust. Overall, these insights support the integration of bottom-up behavioural evidence into climate behaviour modelling and inform the design of more targeted, flexible, and effective adaptation policies and instruments.

How to cite: Ricart, S., Escriva-Bou, A., and Castelletti, A.: Unlocking Transformative Climate Adaptation: A Behavioural Lens on Californian Farmers’ Preferences, Drivers, and Narratives, EGU General Assembly 2026, Vienna, Austria, 3–8 May 2026, EGU26-2536, https://doi.org/10.5194/egusphere-egu26-2536, 2026.

EGU26-2825 | PICO | HS5.3.3

Crop yield variability driven more by cultivated area changes than climate extremes in Iran 

Atefeh Torkaman Pary, Pejvak Rastgoo, Dirk Zeuss, and Temesgen Alemayehu Abera

Climate change has intensified the frequency and severity of droughts in arid and semi-arid regions, posing increasing challenges to agricultural sustainability. Iran, located within the global arid belt, is particularly vulnerable due to its strong dependence on both rainfed and irrigated cereal production. This study examines the relative impacts of drought severity and changes in total cultivated area on long-term wheat and barley yield dynamics in Iran from 1995 to 2022. We used crop yield data (from Iran’s Agricultural Ministry), the Standardized Precipitation Evapotranspiration Index (SPEI), non-parametric trend tests, and boosted regression tree (BRT) modeling. Our results indicate that wheat and barley yields increased during the study period, with average rates of 0.26 t ha⁻¹ year⁻¹ and 0.075 t ha⁻¹ year⁻¹, respectively, despite recurrent drought conditions. These increases were primarily driven by the expansion of cultivated area rather than by climatic improvement. Changes in cultivated area emerged as the dominant driver of yield variability, explaining approximately 71–87% of observed yield changes across crop types and production systems, whereas drought severity accounted for 12–29%. Rainfed agriculture exhibited greater sensitivity to drought severity than irrigated agriculture, particularly for wheat, highlighting the limited buffering capacity of rainfed systems against climatic stress.

How to cite: Torkaman Pary, A., Rastgoo, P., Zeuss, D., and Abera, T. A.: Crop yield variability driven more by cultivated area changes than climate extremes in Iran, EGU General Assembly 2026, Vienna, Austria, 3–8 May 2026, EGU26-2825, https://doi.org/10.5194/egusphere-egu26-2825, 2026.

This study aims to quantify and explain the coupling coordination dynamics of the agricultural water–energy–food (WEF) nexus in 40 Yellow River–diverted irrigation districts located in the lower reaches of the Yellow River during 2000–2020. Based on the identification of key system elements, the coupling coordination degree of the WEF nexus was measured to characterize its integrated development level. Drawing on synergetics theory, a hybrid analytical framework combining geographically and temporally weighted regression (GTWR) and the XGBoost-SHAP model was employed to reveal the internal synergistic evolution processes and external driving mechanisms while accounting for spatiotemporal heterogeneity and nonlinear effects.

The results show that the coupling coordination of the WEF nexus exhibited an overall steady upward trend, characterized by a spatiotemporal evolution pattern of continuous improvement, stage-specific fluctuations, and overall convergence. Temporally, the coordination degree transitioned from slow growth to rapid improvement, while spatial disparities among irrigation districts gradually narrowed, accompanied by increasingly pronounced spatial clustering effects. The nighttime light index and the proportion of cultivated land exerted long-term and stable positive impacts on coupling coordination, whereas average temperature and population density acted as primary constraints; precipitation, NDVI, grassland proportion, and water area proportion played secondary roles. Significant threshold effects were identified for all driving factors, indicating that moderate economic development, suitable climatic conditions, and a rational land-use structure are critical for maintaining high-level coordination, beyond which coordination declines rapidly.

Furthermore, scenario-based simulations incorporating climate change and technological progress were conducted using random forest models to explore future evolution trajectories. The coupling coordination degree under the SSP245 baseline scenario consistently outperformed that under SSP585, suggesting that climate stress associated with high-emission pathways negatively affects system coordination. Among individual technological measures, water-saving practices were identified as the most effective single intervention.These findings provide a quantitative basis for scenario regulation, zonal management, and the optimization of sustainable development pathways in Yellow River–diverted irrigation districts.

How to cite: Liu, C., li, L., and Jiang, E.: Coupling Coordination and Driving Mechanisms of the Agricultural Water–Energy–Food System in the Lower Yellow River Basin, EGU General Assembly 2026, Vienna, Austria, 3–8 May 2026, EGU26-4599, https://doi.org/10.5194/egusphere-egu26-4599, 2026.

EGU26-10784 | ECS | PICO | HS5.3.3 | Highlight

Avoiding the irrigation trap: Policy-driven adaptation pathways and cross-sectoral trade-offs in Germany’s irrigated agriculture 

Jasmin Heilemann, Christian Klassert, Mansi Nagpal, Simon Werner, Bernd Klauer, and Erik Gawel

Hydroclimatic extremes, particularly increasingly frequent and severe droughts and heat waves, are intensifying pressures on agricultural systems even in historically overall water-abundant regions such as Germany. Irrigation is often promoted as an effective adaptation strategy to climate variability and extremes. However, irrigation expansion can create path-dependent lock-ins into high and potentially unsustainable water use, amplifying systemic risks across the food–water–energy (FWE) nexus.

This study examines how food, water and energy sector policies shape farmers’ adaptive land use and irrigation decisions under future hydroclimatic and socioeconomic change, and how these decisions propagate trade-offs across sectors. Using an innovative hybrid modeling framework that links hydrological and machine-learning models with a hydro-economic multi-agent system capturing adaptive farmer behavior, we assess the ex-ante impacts of six sectoral policies on land use, irrigation demand, and FWE nexus indicators for eight major field crops in Germany.

Our results reveal strongly divergent adaptation pathways. Water sector policies such as abstraction limits and pricing can substantially curb irrigation expansion under intensifying climatic extremes and socioeconomic change, while maintaining farm profitability if implemented early. In contrast, bioenergy subsidies further increase irrigation demand and energy use, while irrigation efficiency subsidies fail to deliver net water savings due to rebound effects, and drought compensation payments reinforce maladaptive land use choices.

Overall, uncoordinated policy responses risk triggering an “irrigation trap” that deepens cross-sector trade-offs and constrains future transformation pathways. We show that timely, coordinated governance across the FWE nexus is critical to avoid maladaptation and to steer agricultural systems toward more resilient and sustainable trajectories. By considering heterogeneous and adaptive farmer behavior, the study provides a starting point to assess how far agricultural land use adaptation can mitigate on-farm losses and systemic risks under intensifying hydroclimatic extremes.

How to cite: Heilemann, J., Klassert, C., Nagpal, M., Werner, S., Klauer, B., and Gawel, E.: Avoiding the irrigation trap: Policy-driven adaptation pathways and cross-sectoral trade-offs in Germany’s irrigated agriculture, EGU General Assembly 2026, Vienna, Austria, 3–8 May 2026, EGU26-10784, https://doi.org/10.5194/egusphere-egu26-10784, 2026.

The Yellow River Basin, often referred to as China’s “Mother River”, is simultaneously a major grain-producing region and an important energy supply base. Under China’s dual-carbon targets of carbon peaking and carbon neutrality, understanding how alternative carbon-constraint scenarios influence land-use change and crop production is crucial for advancing agricultural low-carbon transition, improving land-use efficiency, and safeguarding food security in this strategically important basin. Such assessments are also essential for supporting the long-term objectives of ecological protection and high-quality development in the Yellow River Basin. This study integrates the Global Biosphere Management Model (GLOBIOM) with a coupling coordination degree model to examine the heterogeneous impacts of different carbon-constraint scenarios on land-use patterns and crop yields across the upper, middle, and lower reaches of the Yellow River Basin. Carbon constraints are represented through differentiated carbon tax scenarios, allowing for a systematic comparison of their effects on cropland allocation and the production of major crops, including maize, wheat, and rice, over the period 2007-2050. The results indicate several key findings. First, from the perspective of cropland dynamics, stricter carbon-constraint scenarios are generally more conducive to cropland expansion across the basin. By 2050, cropland area increases by approximately 2% in Gansu (upper basin), 2% in Inner Mongolia (middle basin), and 3% in Henan (lower basin) under the most stringent carbon constraint scenario, reflecting adjustments in land-use structure induced by carbon pricing. Second, total crop production exhibits an overall increasing trend under carbon constraints, but with pronounced crop- and region-specific heterogeneity. Stricter carbon constraints tend to favor maize production in the upper basin, while exerting relatively adverse effects on wheat production. Rice production shows notable spatial variation, with Gansu exhibiting the lowest rice output, and Sichuan’s rice production being the most sensitive to carbon constraints. Third, the temporal effects of carbon constraints differ across crops. Before 2030, carbon constraints generally promote maize production across the basin, whereas after 2030, higher carbon tax levels become increasingly favorable for rice and wheat yield growth in Shandong Province. Finally, analysis of the coupling coordination degree between cropland area and crop yields suggests that most regions in the Yellow River Basin exhibit an acceptable level of coordination and a generally balanced development state, although Inner Mongolia and Henan remain in a transitional coordination phase. Overall, this study highlights the differentiated and evolving impacts of carbon constraints on land-use and agricultural production systems, providing insights for designing region-specific and crop-specific low-carbon agricultural policies in the Yellow River Basin.

How to cite: Cui, Y., Lauri, P., and Havlik, P.: Impacts of carbon-constraint on land use change and crop production in the Yellow River Basin, China, EGU General Assembly 2026, Vienna, Austria, 3–8 May 2026, EGU26-11596, https://doi.org/10.5194/egusphere-egu26-11596, 2026.

EGU26-15709 | PICO | HS5.3.3

Dynamic Adaptation and Crop Abandonment under Prolonged Drought in Semi-Arid Regions 

Oscar Melo, Valentina Strappa, Sebastián Vicuña, Pilar Gil, and Eduardo Bustos

Water scarcity is a growing global challenge that threatens agricultural sustainability, food security, and the livelihoods of rural communities. Agriculture accounts for approximately 70–80% of global freshwater withdrawals, making it particularly vulnerable to declining water availability driven by climate change, population growth, and competing demand.

Perennial crops face specific challenges under water scarcity due to their long investment horizons, high establishment costs, and limited flexibility in land reallocation. Unlike annual crops, perennial orchards are dynamic systems that are influenced by both short-term and cumulative conditions, which impact both production yields and overall tree performance. As a result, farmers’ behavioral responses to water scarcity differ markedly between perennial and annual systems, where most of the literature has focused.

This study examines farmers’ dynamic decisions in perennial crop systems and the factors influencing changes in cultivated areas and crop abandonment in drought-prone contexts. Our case study is situated in a semi-arid region of Central Chile, where a three-decade decline in precipitation and a persistent megadrought since 2010 have resulted in reduced river flows, declining groundwater levels, intensified water competition, and significant land-use changes. In parallel, early in the decade, the region saw a shift toward permanent, high-value, and export-oriented crops—such as avocados, walnuts, and citrus—displacing annual production and livestock, reshaping the agricultural landscape, and the demand for water.

To analyze farmers' decisions, we use data from a novel survey of 200 farmers from the Ligua-Petorca basins, which incorporates retrospective recall of past production outcomes to address dynamic decision-making processes. This approach allows the reconstruction of farmers’ past responses to water scarcity. Following various econometric approaches, which combine panel data models and limited dependent variable regressions, we find substantial heterogeneity in adaptation responses across farmers. Changes in cultivated areas are systematically associated with farm size, access to surface water, crop type, and the characteristics of farmers. Also, expected climatic conditions, proxied by recent trends, are found to influence crop area changes and abandonment.

This research sheds light on the understanding of how farmers adapt to prolonged droughts in perennial production systems, an understudied topic in the literature but evermore relevant in the context of a changing climate. The proposed methodology enables addressing this issue in contexts where recurrent surveys are uncommon, such as in many semi-arid regions of lower-income countries. While recall-based data cannot replace true longitudinal panels, their use provides a feasible alternative for examining adaptation and abandonment processes in such environments, thereby expanding the empirical tools available for studying long-term agricultural responses to drought. Ignoring the differences between permanent crops and annuals implies overlooking the dynamic nature of perennial systems, misdiagnosing farmers’ constraints, and overestimating their flexibility. Observed reductions in cultivated area under prolonged water deficits are consistent with crop abandonment becoming a relevant outcome when adaptation pathways are limited in perennial systems. Recognizing these differences is essential for advancing research on agricultural adaptation and for informing the design of effective water and agricultural policies tailored to perennial systems under drought conditions.

How to cite: Melo, O., Strappa, V., Vicuña, S., Gil, P., and Bustos, E.: Dynamic Adaptation and Crop Abandonment under Prolonged Drought in Semi-Arid Regions, EGU General Assembly 2026, Vienna, Austria, 3–8 May 2026, EGU26-15709, https://doi.org/10.5194/egusphere-egu26-15709, 2026.

EGU26-15921 | ECS | PICO | HS5.3.3

Snow Loss, Economic Cost, and Potential (Mal)Adaptation in Irrigated Agriculture: Case Studies from the Western US 

Beatrice Gordon, Joey Blumberg, Rosemary Carroll, Dale Manning, Bryan Leonard, Gabrielle Boisrame, Austen Lorenz, Adrian Harpold, Julia Berkey, Chelsea Cough, and Christine Albano

Climate change is altering snow accumulation and ablation dynamics in snow-dependent regions worldwide, reshaping runoff timing and water availability for people, ecosystems, and agriculture. As the world’s largest consumer of freshwater, irrigated agriculture is particularly exposed, and these hydrologic changes impose substantial economic costs. Here, we demonstrate how hydrology and economics can be combined to assign costs to snow-driven hydrologic change, using irrigated agriculture in the western United States as a large, snow-dependent test case. By integrating reduced-form economic models with climate model projections spanning approximately 2–5 °C of warming, we estimate that irrigated cropland could decline by 27–46% by the end of the century, while agricultural profitability—proxied using land rental rates—declines by 11–26%, corresponding to annual losses of approximately $8.2–$14.7 billion. Against this economic backdrop, scientists have an opportunity to leverage expanding data and modeling capabilities to provide actionable information about adaptation strategies that can reduce damages.

However, there remains a persistent gap between the scales at which snow loss research is conducted and the scales at which land and water management decisions are made. To address this challenge, we propose that archetypes—drawn from social-ecological systems research—could help accelerate matching adaptation strategies to specific decision-making contexts by explicitly accounting for governance capacity and behavioral dynamics. This approach has not been widely explored in agricultural adaptation to snow hydrology but could enable rapid, locally-relevant guidance.

Yet rapid adaptation without integration across hazards risks unintended consequences. Through analysis of four decades of fire perimeter data (1984-present) and aerial imagery, we show that cropland is 2x less likely to be on the inside of a fire perimeter than any other land-cover type, suggesting an important landscape-scale buffering effect. Using drought and wildfire as an example, this finding demonstrates how cropland abandonment—a strategy that may enhance drought resilience—could amplify fire risk if poorly coordinated, illustrating how rational responses to one hazard can inadvertently increase exposure to others.  Results underscore the complexity of adaptation under compounding climate risks and the importance of working in partnership with decision-makers to leverage ever expanding data and modeling capabilities for locally-relevant solutions.

How to cite: Gordon, B., Blumberg, J., Carroll, R., Manning, D., Leonard, B., Boisrame, G., Lorenz, A., Harpold, A., Berkey, J., Cough, C., and Albano, C.: Snow Loss, Economic Cost, and Potential (Mal)Adaptation in Irrigated Agriculture: Case Studies from the Western US, EGU General Assembly 2026, Vienna, Austria, 3–8 May 2026, EGU26-15921, https://doi.org/10.5194/egusphere-egu26-15921, 2026.

In recent decades, climate change has intensified hydrometeorological extremes and altered seasonal water availability, posing growing challenges to irrigated agriculture in subtropical river basins. Taiwan has experienced a sustained warming trend over the past century, and projected changes in precipitation seasonality under IPCC AR6 scenarios may further amplify uncertainty in irrigation supply and rice production.

This study develops and validates a basin-specific Water–Crop modeling framework for the first rice cropping season in the Zhuoshui River Basin, Taiwan. Historical meteorological data (precipitation and temperature) and hydrological observations (river discharge as a proxy for water availability) are integrated to quantify the coupled dynamics of water availability, irrigation demand, and paddy rice yield. The crop-yield component is implemented using a long short-term memory (LSTM) model to capture nonlinear responses, lag effects, and interactions among hydroclimatic drivers, while the water module represents basin-scale constraints that regulate irrigation supply.

Based on the validated model outputs, we further derive a basin-specific drought–yield indicator that uses yield anomalies as an integrated measure of agricultural drought impacts, complementing conventional indices based solely on precipitation or streamflow. Finally, AR6 climate projections (SSP2-4.5 and SSP5-8.5) are used to force the modeling framework to assess future changes in water availability, irrigation demand, drought–yield risk, and yield outcomes under contrasting socio-economic pathways.

The proposed framework provides a physically and data-informed tool for diagnosing how climate-driven shifts in basin hydrology translate into irrigation constraints and rice yield risks. The results support decision-making for irrigation allocation, drought preparedness, fallow planning, and adaptation strategies in the Zhuoshui River Basin.

How to cite: Chu, P.-H., Chung, Y.-C., Wu, D.-H., and Chang, L.-C.: From Present-Day Validation to Future Projections: AR6 SSP Scenario Assessment of Water Availability, Irrigation Demand, and Paddy Rice Yield in the Zhuoshui River Basin Using a Water–Crop Model, EGU General Assembly 2026, Vienna, Austria, 3–8 May 2026, EGU26-16588, https://doi.org/10.5194/egusphere-egu26-16588, 2026.

EGU26-16622 | ECS | PICO | HS5.3.3

Spatiotemporal patterns of cardinal thermal threshold exceedance in European agriculture  

Sahand Ghadimi, Alireza Gohari, and Ali Torabi Haghighi

Agricultural production across Europe is highly sensitive to temperature, yet most continental-scale assessments still provide limited insight into when cardinal temperature thresholds are exceeded during the growing season and where the resulting thermal stress is most pronounced. Here, we present a growing-stage-resolved assessment of thermal exposure across the European agricultural growing season using potato cardinal temperatures. over 1990–2020. Using daily ERA5 land 2-m air temperature, we defined three region-specific growing windows (Southern: February–June; Central: April–September; Northern: May–August) and divided each season into four phenological stages based on FAO recommendations. Within these windows, seven Thermal Threshold Classes (TTCs) were defined representing conditions ranging from drastic cold to drastic heat, including the optimal range for potato growth 18-20 °C. Long-term mean patterns reveal a clear spatial variation: cold categories dominate in Nordic and high-elevation regions, whereas heat-related categories are concentrated in Mediterranean areas and coastal lowlands. Trend analysis using the Mann–Kendall test indicates widespread declines in cold exposure across Northern and Central Europe, alongside increasing mild and severe heat exposure in Central and Eastern Europe. Stage-dominance maps further highlight that early-season cold exposure remains widespread in northern regions, while late-season heat expands across Mediterranean and eastern areas, raising the likelihood of heat stress during tuber initiation and bulking. Overall, the results show that European agriculture is undergoing a measurable redistribution of thermal risk, with reduced early-season cold constraints but increasing late-season heat pressure in key production regions. These stage-specific thermal metrics provide a practical basis for identifying emerging hotspots and supporting targeted adaptation strategies in European potato systems.

How to cite: Ghadimi, S., Gohari, A., and Torabi Haghighi, A.: Spatiotemporal patterns of cardinal thermal threshold exceedance in European agriculture , EGU General Assembly 2026, Vienna, Austria, 3–8 May 2026, EGU26-16622, https://doi.org/10.5194/egusphere-egu26-16622, 2026.

EGU26-17505 | PICO | HS5.3.3

Underestimated flash drought risks in agrciulutral lands without consideration of crop phenology 

Yi Liu, Ruiguang Shi, Yu Liu, Linqi Zhang, Yang Ni, and Ye Zhu

Agricultral lands are facing with severe challenges from droughts in the context of global warming. Flash drought, in particular, may cause more severe impacts on crop yields given its rapid intensification process which leaves less time for drought preparation and mitigation. Moveover, the associated impacts can also be different depending on the hit timing of flash drought in different stages of crop phenology. Based on the fifth-generation of reanalysis (ERA5) soil moisutre data, global crop yields and crop phenology data, the impacts of flash droughts by considering crop phenology were evaluated. The results show that flash droughts became more frequent in global agricultural lands during 1940-2022. Moreover, the development of flash droughts became more rapid given the shoterned days of drought onset. More than half of flash droughts occurred during the critical growth preiod of crops when the water requirements are high to gurantee crop growth and yields. The results highlight the necessity of taking crop phenology into consideration for accurately estimating flash drought risks in agricultural lands.

How to cite: Liu, Y., Shi, R., Liu, Y., Zhang, L., Ni, Y., and Zhu, Y.: Underestimated flash drought risks in agrciulutral lands without consideration of crop phenology, EGU General Assembly 2026, Vienna, Austria, 3–8 May 2026, EGU26-17505, https://doi.org/10.5194/egusphere-egu26-17505, 2026.

Over the preceding decades the Western French basins of the Sèvre-Niortaise, and the lower Vienne rivers have seen a decrease of summer precipitation and an increase in drought frequency and severity. The region's land use regime is dominated by intensive agricultural production, with a significant number of farmers relying on irrigation to compensate for prolonged periods of summer drought and to reduce economic uncertainty. Due to the complex repercussions of intensifying droughts for all sectors in the region, the uncertainty of the future scale of the problem, and on-going debates revealing ambiguities about the exact nature of the problem, the concept of systemic risk can be applied to understand the issue facing the region.

In such a context, it has yet to be investigated if and how systems thinking is integrated in expert knowledge and how these lessons can help to guide risk governance for emerging hydroclimatic extremes, both in agricultural contexts and beyond. This contribution seeks to fill this gap in understanding by exploring experts’ perceptions and elucidating the different narratives and conceptualizations that exist between sectors and individuals working in expert roles. To gain these insights in the region of interest, participatory modelling and 26 qualitative interviews were leveraged across stakeholder domains. Contributing experts constitute a comprehensive sample from relevant regional actors and institutions, representing agricultural institutions, river management syndicates, environmental protection, as well as water governance actors.

Results indicate that while experts overall identify growing water scarcity as a problem, differences between domains emerge when it comes to possible solutions. The solution of newly-constructed water reservoirs, favored by the dominant agricultural interests, is seen by members from three out of four expert domains as only one strategy among others. Most advocate for a combination of tools as well as strong conditions for future agricultural water use to ensure transformative momentum to achieve a more water-resilient land management across sectors and land uses, safeguard water quality, and to limit over-reliance on irrigation. Others promote irrigation as the single most effective tool to ensure future agricultural production in the region with water storage as the biggest limiting factor, reducing the larger problem to one of agricultural water management. Furthermore, experts expressed different levels of systems thinking regarding problem diagnosis as well as potential adaptation strategies, pointing to competing narratives about the regional hydrological and land systems, despite access to and use of similar sources of information. This can be explained by a selective, conscious or unconscious, use of information, reinforcing the legitimacy of suggested solutions and thus ultimately shaping the trajectory of policy.

The diverging perceptions and conceptualizations of drought risk found between individual experts and sectors in Western France thus demonstrate the central role of ambiguity and provides lessons how to incorporate expert knowledge to guide adaptation and transformation in contexts of emerging risks with complex, and uncertain characteristics.

How to cite: Frandsen, P. C. and Viallon, F.-X.: Ambiguous expert knowledge under increasing hydroclimatic extremes: Lessons from risk perception in an agricultural region in transition, EGU General Assembly 2026, Vienna, Austria, 3–8 May 2026, EGU26-17920, https://doi.org/10.5194/egusphere-egu26-17920, 2026.

HS5.4 – Urban Water Management

EGU26-403 | Posters on site | HS5.4.1

A study on inflow control methods for deep stormwater tunnel 

Dongyeop Lee and Jongpyo Park

Recent climate change has led to increasingly severe short-duration heavy rainfall events, resulting in stormwater volumes that exceed the capacity of existing drainage systems in Seoul. In response, the Seoul Metropolitan Government is planning to construct additional deep stormwater storage and drainage tunnels to mitigate flooding in densely populated urban areas. This study examines effective inflow-control strategies for a planned deep drainage tunnel in the Sadangcheon basin, aiming to reduce urban flooding during extreme rainfall.

The XP-SWMM hydrological and hydraulic modeling software was used to simulate flood scenarios and assess the impact of inflow control on inundation. A flood-analysis model was constructed to reflect current watershed conditions and to simulate one-dimensional sewer flow and two-dimensional surface inundation simultaneously. Using this model, the design inflow to the stormwater storage tunnel and the rainfall duration corresponding to maximum storage utilization were estimated. Optimal inflow-control conditions were derived by adjusting the operating water level of the vertical shaft gate to regulate the inflow initiation time.

Under the fixed water-level control scenario, applying inflow control delayed the time required to reach maximum storage by approximately 20 minutes compared with the uncontrolled inflow condition. The effectiveness of inflow regulation was evaluated through changes in surface inundation area and inundation volume. The results showed a reduction of approximately 34.2% in inundation area and 33.9% in inundation volume. These findings indicate that regulating inflow at the tunnel entrance allows more efficient use of limited storage capacity and helps adjust the time gap between peak flood discharge and the moment when the tunnel reaches full storage. This contributes to the stable operation of deep underground stormwater storage and drainage tunnels during extreme rainfall events.

In addition, variable water-level control conditions were applied to evaluate the tunnel’s operational flexibility under smaller-scale rainfall events. The analysis suggests that adopting adaptive inflow-control strategies can enhance the tunnel’s ability to manage a wider range of hydrologic conditions and improve overall flood-mitigation performance. Based on these results, an efficient operational approach for the planned stormwater storage and drainage tunnel is proposed.

These outcomes collectively demonstrate that inflow-control strategies can significantly improve the performance of deep stormwater storage tunnels by delaying maximum storage time, reducing inundation, and enhancing operational stability during consecutive or extreme rainfall events. The results provide practical guidance for the planning and operation of large-scale urban flood-control infrastructure under changing climate conditions.


Acknowledgements

This work was supported by Korea Environment Industry & Technology Institute(KEITI) through Technology development project to optimize planning, operation, and maintenance of urban flood control facilities, funded by Korea Ministry of Climate, Energy, Environment(MCEE)(RS-2024-00398012)

How to cite: Lee, D. and Park, J.: A study on inflow control methods for deep stormwater tunnel, EGU General Assembly 2026, Vienna, Austria, 3–8 May 2026, EGU26-403, https://doi.org/10.5194/egusphere-egu26-403, 2026.

EGU26-717 | ECS | Posters on site | HS5.4.1

Urban Trees and Flood Resilience: Monitor, Evaluate and Optimise. 

Madeleine Tate, Ross Stirling, Claire Walsh, Darren Varley, and Carl Hodgson

Climate change is leading to rainfall events increasing in intensity and frequency. However, traditional drainage infrastructure, such as drains and pipes, struggle to cope with this change resulting in urban areas experiencing increased surface water flooding intensity and occurrences. As a result of this, Newcastle City Council launched Blue Green Newcastle (BGN), a scheme designed to help prevent flooding while also providing wider benefits to support communities by using nature.

Trees are commonly introduced to urban areas as one form of blue-green infrastructure. To explore the interaction between trees and water, a rain garden containing a Alnus glutinosa Imperialis (Cut Leaf Alder) has been instrumented. Sensors include a sap-flow-meter, which allows water uptake to be established. The tree currently being monitored is located in a rain garden which has soil-water content sensors and water potential sensors (to understand plant water availability). These additional sensors help map the flow of water while also allowing the impact of the rain garden to be factored into the evaluation of the tree contribution to managing water through-flow. All sensors on site and the monitored weather conditions, including rainfall and temperature, help reveal the relationship between the tree, soil and atmosphere. Monitoring was setup on 19/08/25 and will run for 3 years to provide empirical evidence of how the tree-rain garden system responds to a range of seasonal (natural) and augmented rainfall conditions. Furthermore, the impact the tree has on surface water flooding during different conditions can be understood more through further modelling.

To best capture the characteristics of trees within an urban space and to support the further introduction of trees through projects like BGN, more sites will be monitored. These sites will explore trees of various ages, species and at different site types aiming to explore the impact these changes have on performance. The performance of the different monitored sites including within open spaces and tree pits can be compared against each other. Since projects that will most benefit from this evidence, including BGN, have many stakeholders, including water companies, local government and those who live, work and visit the area, exploring a wider range of site types is beneficial. Therefore, extrapolating this knowledge and evidence by using models and using the collected data to verify them is beneficial. Evidence-based guidance will ensure findings based on the data collected is accessible and supports stakeholders to deliver effective city-scale green infrastructure schemes, helping to reduce surface water flooding and the impact of rainfall events while improving the built environments for communities. Overall, this research provides a pathway for projects like BGN to lead in climate-resilient urban design where every tree planted becomes an active part of the city’s drainage network.

How to cite: Tate, M., Stirling, R., Walsh, C., Varley, D., and Hodgson, C.: Urban Trees and Flood Resilience: Monitor, Evaluate and Optimise., EGU General Assembly 2026, Vienna, Austria, 3–8 May 2026, EGU26-717, https://doi.org/10.5194/egusphere-egu26-717, 2026.

EGU26-2557 | ECS | Orals | HS5.4.1

From Rain to Drain: Field-scale monitoring of sustainable drainage systems (SuDS) 

Wm. Alexander Osborne, Stuart McLelland, and Robert Thomas

We present evidence from long-term field-scale test environments in the United Kingdom, drawing on work from SuDSlab at the University of Hull and the Defra-funded Doncaster, Immingham and Grimsby Surface Water Resilience Project (DIG). Together, these initiatives employ a ‘Rain to Drain’ approach that tracks water from rainfall, through soils and sustainable drainage systems (SuDS), into drainage networks at catchment scale. Rain gardens, swales, ponds, permeable surfacing, retrofit downpipe interventions, and combined sewers have been monitored for up to four years. More than 2,000 internet-connected discrete sensors record meteorological, hydrological, and hydraulic variables continuously at five-minute intervals with live, real-time data acquisition.

High-resolution monitoring reveals several behaviours that are not apparent from design calculations or short deployment studies. Soil moisture profiles measured to depths of 0.6 m show that infiltration and storage capacity vary substantially with depth and season, with near-surface horizons responding within minutes of rainfall, while deeper layers may respond only during prolonged or intense events. Some systems operate primarily as infiltration features during drier periods, but transition to storage and attenuation dominated behaviour during wetter months. Event-based monitoring of retrofit planters and rain gardens shows delays in peak outflow of 10 to 60 minutes, with reductions in peak discharge commonly between 30 and 60% at asset scale. Downstream sewer measurements indicate that, under certain conditions, these effects can translate into longer response times and reduced short duration peaks at network scale. Monitoring also highlights important mismatches between assumed and actual system behaviour, including differences of tens of percent in contributing areas and inflow volumes between nominally similar assets.

Our work shows that long-term, high-frequency monitoring fundamentally improves understanding of how SuDS function in practice. By capturing seasonal variability, event-scale responses, and links between assets and receiving networks, monitoring provides evidence that can be used to refine design assumptions, support model validation, and diagnose underperformance. Sustained monitoring is essential not only to demonstrate that SuDS work, but to understand when they work, why performance varies, and how future schemes can be designed and managed more effectively.

How to cite: Osborne, Wm. A., McLelland, S., and Thomas, R.: From Rain to Drain: Field-scale monitoring of sustainable drainage systems (SuDS), EGU General Assembly 2026, Vienna, Austria, 3–8 May 2026, EGU26-2557, https://doi.org/10.5194/egusphere-egu26-2557, 2026.

EGU26-2764 | ECS | Orals | HS5.4.1

Climate Resilience through Community-led GI Framework in neglected Mountainous Ecosystems of Swat, Pakistan. 

Muhammad Rayan, Dietwald Gruehn, and Umer Khayyam

Mountainous regions that were safe zones are becoming increasingly vulnerable to climate-induced stressors, like flooding, landslides, and ecosystem degradation. In this debate, Swat; the northern mountainous district in Pakistan is also not an exception, which is hit hard by the climatic shocks, leaving behind devastation. To cope with the problems, Nature-Based Green Infrastructure (NBGI) as a people-centred approach, has emerged as an ecosystem-based adaptation and mitigation strategy to enhance cities' resilience against ever-rising climatic hazards. NBGI planning proves to be a vital element, not only in strengthening social-ecological connections between urban rural and mountainous areas, but also promoting the establishment of a balanced equilibrium between human-centred and eco-centred activities, thereby fostering sustainable livelihoods. Although, NBGI solutions are widely applied generally in the city settings, however, its potential to address the climatic hazards in mountainous regions still remains underdeveloped. It is particularly true for the developing countries, including mountainous regions of Pakistan. This study addresses the dire need for context-specific, proactive, pragmatic and (most importantly) the participatory Urban Landscape and Urban Greening (UL-UG) policies and strategies (tailored to the local built environment) for resilient land-use planning, as well as frameworks, to protect the inhabitants and ecosystems in the Swat district — a high-altitude, climate-sensitive region in Khyber Pakhtunkhwa, Pakistan. This research aims to determine and assemble sustainable green infrastructure (GI) planning indicators and their spatial functional linkages with the multifunctional green spaces (GS), based on the perspectives of local mountainous communities. It is to develop a sustainable GI indicator framework model under a community-led participatory (CLP) approach, best meshed with the mountainous region's built environment — makes it a unique and novel study.

The in-depth community-led survey was executed in Swat district, particularly targeting the climate effected regions across the Swat River. This empirical investigation was conducted through a self-administered questionnaire, themed around GI, resilience, and climate change adaptation, with 325 participants. The data is analysed using the Relative Importance Index (RII) and Interquartile Range (IQR) techniques, demonstrating strong internal reliability (Cronbach's α > or ≥ 0.7). The finding established potential twenty-two (primary and secondary) sustainable UGI indicators, classified into five levels: extremely important, important, moderately important, slightly important, and Low. Subsequently, a set of vital taxonomies of GS elements that achieved (RII value ≥ 0.68) were identified that strengthen the functional linkage and resilience of the respective UGI indicators when confronting environmental hazards in a mountainous region. The study concludes by advocating for a context-sensitive, community-driven UGI framework as a pathway toward an eco-friendly, climate-resilient mountainous community. This study also simulates results demonstrate the need for an inclusive perspective when building the nature-based adaptation and mitigation strategy (and standards) that will be most suitable for ensuring climate-resilient mountainous regions.

Key word: Sustainable green infrastructure (GI) indicators; green space (GS); mountain eco-system; resilience: community-led participatory (CLP) approach; climate change; Swat Pakistan


How to cite: Rayan, M., Gruehn, D., and Khayyam, U.: Climate Resilience through Community-led GI Framework in neglected Mountainous Ecosystems of Swat, Pakistan., EGU General Assembly 2026, Vienna, Austria, 3–8 May 2026, EGU26-2764, https://doi.org/10.5194/egusphere-egu26-2764, 2026.

 As extreme cold surges become more frequent in mid-latitude cities due to climate variability, the role of nature-based solutions (NBS), primarily designed for summer heat mitigation, requires re-evaluation for winter conditions. This study investigates the impact of urban street trees on pedestrian thermal comfort during a cold wave event in a high-density district of Daegu, South Korea. Using a Computational Fluid Dynamics (CFD) model coupled with a solar radiation model, we quantified the opposing physical mechanisms of trees: the beneficial reduction of convective heat loss via aerodynamic drag versus the detrimental reduction of solar gain via shading. Our results reveal that wind speed, rather than air temperature or mean radiant temperature, is the dominant driver of wintertime outdoor thermal comfort (UTCI). Tall evergreen trees significantly mitigated cold stress in wind-exposed corridors by acting as effective windbreaks. However, in already sheltered areas where solar access is critical, the shading effect of evergreens blocked valuable winter sunlight, paradoxically exacerbating cold stress by lowering the mean radiant temperature. Deciduous trees showed negligible impacts due to their low leaf area index in winter. These findings highlight that "beneficial summer shade" can become a "winter penalty." Consequently, we propose a context-specific planting framework for climate-resilient urban design: prioritizing wind mitigation in exposed zones while preserving solar access in sheltered environments.

How to cite: Kang, G. and Kim, J.-J.: Urban Tree Planting Strategies for Winter Cold Surges: A CFD-based Assessment of Deciduous vs. Evergreen Effects, EGU General Assembly 2026, Vienna, Austria, 3–8 May 2026, EGU26-3389, https://doi.org/10.5194/egusphere-egu26-3389, 2026.

Urban flooding has increased in rapidly growing cities, indicating the necessity for sustainable stormwater management strategies. Low Impact Development (LID) strategies present potential solutions; however, assessing the collective effectiveness of various LID practices at the Indian watershed scale is complicated due to the complexity of spatial, hydraulic, and cost-related data. This study presents an integrated modeling and optimization strategy for implementing Green Roofs (GR), Rain Barrels (RB), and Permeable Pavements (PP) as Low Impact Development (LID) interventions to address urban flooding on the IIT Delhi Campus, a developing urban watershed in Delhi, India. A multi-objective optimization decision-support tool was developed by integrating the PCSWMM hydrological-hydrodynamic model with the NSGA-II evolutionary algorithm. This system aims to identify potential individual and combined LID allocation areas, taking into account both flood-reduction benefits and implementation costs. Simulations were conducted for return periods of 5, 10, 25, and 50 years to assess runoff volume, flood volume, and flood depth under ideal Low Impact Development scenarios. The findings indicate that the optimized LID strategies significantly decrease peak runoff and ponding depth. Among all LID solutions, GR demonstrated the lowest capacity for flood reduction, while RB and PP appeared to be more effective. Nevertheless, the combination of GR, RB, and PP outperformed each individual option. It was also observed that LID strategies demonstrate superior performance for lower return periods (5 and 10 years). However, performance decreases as rainfall intensity increases. The proposed framework offers significant insights into urban stormwater planning, illustrating how optimized LID allocation improves hydrological performance while reducing costs. This tool effectively aids hydrologists and urban planners in maximizing environmental and flood prevention benefits through the strategic selection and location of LIDs in rapidly urbanizing areas.

Keywords: LID, Optimization, Urban flooding

How to cite: Mallik, A. and Dhanya, C. T.: Evaluating Performance of Individual and Combined LID Strategies for Urban Flood Reduction: An Integrated Modelling and Multi-Objective Optimization Approach, EGU General Assembly 2026, Vienna, Austria, 3–8 May 2026, EGU26-4199, https://doi.org/10.5194/egusphere-egu26-4199, 2026.

EGU26-5315 | Posters on site | HS5.4.1

Hydrological modelling of vertical green-screen nature-based solutions using HYDRUS-2D 

Giasemi Morianou, Konstantinos X. Soulis, Stergia Palli-Gravani, Nikolaos Ntoulas, Emilia Danuta Lausen, Marina Bergen Jensen, Emmanuel Berthier, Anna Palla, and Ilaria Gnecco

Nature-based solutions (NbS) that combine vertical greening with stormwater management are increasingly deployed in dense urban environments; however, key hydrological processes, including storage, overflow pathways, and evapotranspiration, remain poorly quantified. Compared to conventional horizontal NbS, vertical systems are subject to distinct hydrological constraints related to boundary conditions, flow patterns, and geometry, yet appropriate process-based modelling approaches remain underdeveloped.

This study presents a physically based numerical framework for the conceptual representation and analysis of the hydrological behaviour of a freestanding green-screen nature-based solution using the HYDRUS-2D/3D software. The investigated NbS consists of a vertically oriented mineral wool wall that receives roof runoff at its top and is positioned above a stepped, open-bottom planter box with vegetation, hydraulically connected to the underlying native soil. The system is designed to temporarily store incoming roof runoff within the vertical wall and vegetated planter, with stored water gradually depleted through evapotranspiration and infiltration to the underlying soil.

A representative two-dimensional cross-section is used to simulate variably saturated flow, water storage, evapotranspiration, and infiltration processes within the system. Roof runoff is represented as a time-variable inflow applied at the upper boundary of the vertical wall. Atmospheric boundary conditions are imposed on exposed vertical and horizontal surfaces to represent evaporation from the wall and evapotranspiration from the vegetated planter. To address the challenge of vertical evaporation, atmospheric forcing is spatially varied along the wall to account for differences in solar exposure. Hydraulic continuity is assumed between the open-bottom planter and the underlying soil, allowing infiltration into the subsurface.

Event-based simulations are used to investigate system responses under different rainfall conditions, including wet and dry extremes, evaluate the restoration of retention capacity between successive storm events, and assess and optimise key design parameters such as wall height, planter geometry, and hydraulic properties of system materials with respect to stormwater retention and system recovery. Particular attention is given to the role of spatially variable vertical evaporation from the wall, and evapotranspiration from the planter, in controlling system recovery and overall stormwater retention performance.

The proposed HYDRUS-2D conceptualisation provides a quantitative tool for evaluating and optimising vertical green-screen NbS and supports their integration into quantitative urban stormwater management and climate adaptation strategies.

This work is carried out within the framework of the GreenStorm project, funded under the Driving Urban Transitions to a Sustainable Future (DUT) Call 2022.

How to cite: Morianou, G., Soulis, K. X., Palli-Gravani, S., Ntoulas, N., Danuta Lausen, E., Bergen Jensen, M., Berthier, E., Palla, A., and Gnecco, I.: Hydrological modelling of vertical green-screen nature-based solutions using HYDRUS-2D, EGU General Assembly 2026, Vienna, Austria, 3–8 May 2026, EGU26-5315, https://doi.org/10.5194/egusphere-egu26-5315, 2026.

EGU26-6841 | Orals | HS5.4.1 | Highlight

Bioengineering in slope stabilization: experimental evaluation of grass rugs as a Nature-based Solution for Sustainable Management 

Abelardo Montenegro, Antônio Figueiroa, Iug Lopes, and João de Lima

Slope stabilization is essential for hazard management and plays a crucial role in preventing landslide events while also contributing to environmental protection. Effective protection of slopes is vital, as it not only ensures the safety of structures but also helps maintain the ecological balance in the surrounding areas. To address the challenges posed by steep slopes, soil bioengineering techniques are employed to mitigate surface water erosion and control the movement of soil masses. These techniques are particularly important in areas where the risk of erosion and landslides is heightened.

The present study aimed to evaluate the effectiveness of emerald grass rugs (Zoysia japonica) as Green Infraestructure (GI) in providing protection and stabilization for slopes based on investigation in experimental plots. The research was conducted on a steep 60% slope located at the Federal Rural University of Pernambuco State in Recife, Brazil. The experimental plots were designed with an area of 10.35 m², featuring dimensions of 3.0 × 3.45 m, and were bordered by masonry walls to control the experimental conditions. At the lowest point of each experimental unit, a 100 mm drainage pipe was installed to collect runoff and sediments, ensuring proper storage in 500-liter PVC tanks. An automatic rainfall gauge was set up on-site, providing critical data for the study.

Several treatments were implemented during the experiment: the first involved the installation of grass rugs with four replicates; the second treatment consisted of grass rugs with an underlying application of coconut powder as a bioretention layer, which had two replicates; and the final treatment served as a control, consisting of bare soil. The parameters evaluated throughout the study included rainfall, runoff, sediment loss, and erosion rates. The results indicated that for all rainfall events, the control plot exhibited a Runoff Coefficient of approximately 60%. In contrast, the grass rugs demonstrated a significantly lower coefficient of around 28%, while the grass rugs with coconut powder showed an impressive reduction to about 16%.

When examining erosion specifically, the grass rugs proved to be highly effective, exhibiting approximately 500 times less soil loss compared to the bare soil control plot. Moreover, the addition of coconut powder beneath the grass rugs further enhanced their protective capabilities, resulting in nearly 1000 times less soil loss when compared to conditions of bare soil. These findings clearly highlight that vegetation cover associated to a bioretention layer plays a vital role in maintaining the integrity of soil structure. Among the treatments tested, the arrangement of grass rugs combined with the underlying application of coconut powder was identified as the most efficient Nature-based Solution NbS method for slope stabilization and erosion control, demonstrating the potential benefits of integrating bioengineering practices into construction and environmental management strategies.

How to cite: Montenegro, A., Figueiroa, A., Lopes, I., and de Lima, J.: Bioengineering in slope stabilization: experimental evaluation of grass rugs as a Nature-based Solution for Sustainable Management, EGU General Assembly 2026, Vienna, Austria, 3–8 May 2026, EGU26-6841, https://doi.org/10.5194/egusphere-egu26-6841, 2026.

EGU26-7069 | Posters on site | HS5.4.1

The role of condensation from below in soil moisture dynamics within multilayer blue–green roofs 

Francesco Viola, Sayedehtahereh Vakily, Elena Cristiano, Malin Grosse-Heilmann, Paolo Corongiu, Cesare Jakomin, and Roberto Deidda

In urban areas, green roofs are increasingly adopted due to their multiple environmental benefits and their ability to mitigate hydro-meteorological risks. Among them, Multilayer Blue–Green Roofs include an additional storage layer that enhances pluvial flood mitigation by retaining excess water that percolates from the soil layer. This storage layer can also be regulated through a valve that allows controlled release of stored water into the urban drainage system. Existing hydrological models for blue–green roofs typically represent processes such as evapotranspiration, leakage and discharge, but the contribution of condensation from the underlying blue layer to soil-moisture dynamics is largely overlooked, despite monitoring evidence showing measurable moisture gains in the substrate associated with concurrent water loss from the storage layer. This study investigates the influence of condensation generated by upward water-vapor fluxes from the storage layer to the soil, assessing the impacts on the soil-moisture dynamics. The conceptual eco-hydrological model proposed by Viola et al. 2017 to simulate the soil-moisture dynamics of traditional green roofs, has been adapted to represents a Multilayer Blue-Green Roof, accounting for the additional storage layers and condensation dynamics. The Multilayer Blue–Green Roof prototype installed in the Engineering Faculty of the University of Cagliari has been selected as case study to calibrate the proposed model. The prototype has been equipped with sensors to continuously measure temperature, soil moisture, water level and discharge. Three years of collected data are available at high resolution for this Multilayer Blue–Green Roof. Rainfall and relative humidity data have been provided by the weather station network of the Regional Environmental Agency (ARPAS – Agenzia Regionale per la Protezione dell’Ambiente Sardegna). Crop coefficient and mass transfer coefficient have been calibrated for each season with the aim to account for the different vegetation cover. Incorporating condensation processes significantly improved model performance, yielding soil-moisture and water-balance simulations closely aligned with observations. Results highlight condensation as a non-negligible process in Multilayer Blue–Green Roofs hydrology and support its inclusion in future roof modelling frameworks.

How to cite: Viola, F., Vakily, S., Cristiano, E., Grosse-Heilmann, M., Corongiu, P., Jakomin, C., and Deidda, R.: The role of condensation from below in soil moisture dynamics within multilayer blue–green roofs, EGU General Assembly 2026, Vienna, Austria, 3–8 May 2026, EGU26-7069, https://doi.org/10.5194/egusphere-egu26-7069, 2026.

EGU26-7406 | Orals | HS5.4.1

Identifying key environmental stressors shaping plant health in ultra-urban green infrastructure 

Mingzhao Xie, Haifeng Jia, and Ting Fong May Chui

Green infrastructure (GI) is increasingly deployed in ultra-urban environments to mitigate runoff and enhance ecological resilience, yet field evidence remains limited on how GI plants physiologically integrates short-term microclimatic stress exposure and subsequent recovery. In contrast to conventional urban greening plantings, GI plant operates within engineered soil–hydrologic systems (e.g., media properties, drainage/storage, and event-driven wetting–drying), which can decouple rainfall from plant-available water and reshape plant sensitivity to episodic heat–dryness stress. Here we investigate how temporally structured environmental exposures regulate plant performance in a functioning rain garden in Foshan, China, by pairing weekly physiological surveys with continuous high-frequency micrometeorological monitoring.

Eight plant indicators capturing chlorophyll fluorescence energy partitioning, pigment-related status, canopy structure, and leaf–air thermal coupling were measured over a multi-season observation period and analyzed against stress-relevant descriptors of the local atmospheric and radiative regime. Rather than relying on weekly averages alone, we characterize exposure in biologically meaningful time contexts that distinguish same-week forcing from preceding conditions, and we emphasize extreme- and duration-based signatures that better represent urban stress episodes. Across indicators, we observe a clear functional differentiation in time-scale sensitivity that fluorescence partitioning aligns most closely with short-term radiative forcing, whereas canopy and pigment traits exhibit stronger coupling to thermal conditions and atmospheric moisture demand and show a clear carry-over effect from earlier conditions. Extreme- and threshold-oriented descriptors consistently outperform central-tendency metrics in explanatory value, highlighting that short, intense stress periods contain information not captured by mean states.

Overall, the dominant constraints reflect a familiar radiation–heat–demand regime reported for urban vegetation, yet the engineered GI ecohydrological context elevates the importance of antecedent root-zone status and recovery potential relative to precipitation totals. These findings motivate climate-adaptive GI strategies that buffer radiative and heat–dryness extremes and enhance short-term recovery conditions through both general microclimate interventions (e.g., shading and exposure control) and GI-specific levers (e.g., media configuration, drainage/storage tuning, and recovery-aligned irrigation), while maintaining hydrological function.

How to cite: Xie, M., Jia, H., and Chui, T. F. M.: Identifying key environmental stressors shaping plant health in ultra-urban green infrastructure, EGU General Assembly 2026, Vienna, Austria, 3–8 May 2026, EGU26-7406, https://doi.org/10.5194/egusphere-egu26-7406, 2026.

EGU26-8866 | Posters on site | HS5.4.1

Performance of Filtralite as a filter medium for nickel removal in urban runoff: effects of granulometry 

Concepción Pla, Marlon Mederos, Javier Valdes-Abellán, and David Benavente

Urban runoff frequently carries elevated concentrations of heavy metals such as nickel (Ni), posing significant environmental and public-health risks. Sustainable Urban Drainage Systems (SUDS) offer a promising pathway to mitigate these impacts, particularly through the use of filter media that enhance water decontamination. This study evaluates Filtralite, a lightweight expanded clay aggregate, as a filtration medium for Ni removal, with special emphasis on the evolution of pH under prolonged operational conditions and on the influence of particle size on the material’s treatment capacity.

The research was based on an 80-day experiment designed to simulate an accelerated weathering process similar to what occurs under real operating conditions when SUDS interact with rainfall. Four granulometric fractions (2 mm, 1 mm, 0.5 mm, and 0.25 mm) were tested under controlled, repeated washing cycles carried out statically: the Filtralite was kept submerged in beakers, and its water was replaced on an approximately daily basis throughout the 80-day period. The pH values of the effluent were systematically recorded and interpreted as a proxy for the material’s alkalinity-generating capacity—an essential driver of Ni removal from the contaminated solution.

Results demonstrate a consistent granulometry-dependent pattern in pH evolution. Coarser fractions (2 and 1 mm) experienced a more rapid decline in alkalinity than finer ones: although initial effluent pH values exceeded 10, they dropped below the threshold required for efficient Ni precipitation (≈8.5–9) after only a few litres of cumulative washing. The 2 mm fraction dropped to pH 8–8.5 after approximately 8–10 L of equivalent runoff, suggesting a short effective lifespan in real SUDS applications. The 1 mm fraction exhibited a slower decline, maintaining pH > 9 for a longer period, but ultimately converging toward circumneutral values at extended washing volumes. In contrast, finer fractions (0.5 and 0.25 mm) preserved alkaline conditions throughout most of the experiment. The 0.5 mm material sustained pH values in the range 9–10 for the majority of the test, indicating a more stable and gradual release of alkaline species. The finest fraction (0.25 mm) provided the most robust performance: effluent pH consistently remained between 9.5 and 10 even under high cumulative washing volumes, reflecting the strong buffering capacity associated with its larger specific surface area.

Overall, the findings confirm that Filtralite is an effective and sustainable medium for Ni removal in SUDS, although its long-term performance is highly sensitive to granulometry. Fine fractions provide a prolonged alkaline environment that enhances precipitation-driven removal. These results suggest that finer Filtralite may offer favourable characteristics for potential field applications, supporting more stable and efficient metal removal over extended periods. However, the reduced particle size also implies lower hydraulic conductivity compared to coarser fractions, which could limit infiltration performance in practical implementations. Validation under real operating conditions is therefore still required.

How to cite: Pla, C., Mederos, M., Valdes-Abellán, J., and Benavente, D.: Performance of Filtralite as a filter medium for nickel removal in urban runoff: effects of granulometry, EGU General Assembly 2026, Vienna, Austria, 3–8 May 2026, EGU26-8866, https://doi.org/10.5194/egusphere-egu26-8866, 2026.

UK homes are increasingly exposed to summertime overheating and traffic-related air pollution, alongside growing risks from intense rainfall, biodiversity decline, and unequal access to health-supportive green space. However, evidence on the effectiveness of greening at the household boundary, where residents can implement rapid and affordable interventions in front gardens, back gardens and balconies, remains fragmented and difficult to translate into actionable guidance. This study addresses that gap by producing integrated, decision-ready evidence on the environmental and socio-ecological performance of household-scale green-blue-grey infrastructure across five outcome domains: air quality, overheating, flooding, biodiversity, and health and well-being. This study combines real-world monitoring, process-based microclimate modelling, and decision support development. A living lab network is established, comprising two front gardens, three back gardens, and one balcony, selected to represent common UK residential configurations and contrasting degrees of enclosure, surface cover, and greening potential. Multi-season monitoring captures exposure-relevant conditions, including air temperature and relative humidity, for overheating-related metrics, as well as particulate indicators such as PM2.5 and PM10, for near-boundary air quality. Complementary site surveys document features that mediate performance and enable transferability, including garden and balcony geometry, boundary permeability, surface materials and permeability, vegetation structure, and practical constraints on installation and upkeep. These datasets are used to parameterise and evaluate site-specific ENVI met models capable of reproducing observed microclimate and near-boundary air quality patterns. The validated models then support the systematic testing of alternative intervention configurations, placements, and intensities under current conditions and future climate stress test scenarios. Simulation ensembles quantify how intervention design and meteorological variability influence multi-benefit performance, while explicitly considering trade-offs, such as cooling gains from shading and evapotranspiration versus potential reductions in ventilation, or boundary sheltering effects that may alter pollutant dispersion patterns. The study provides a decision support tool that integrates environmental outcomes and DIY feasibility to guide household action. The tool links simple user inputs, including space type, exposure, and constraints, to ranked intervention options with indicative co-benefit ranges across the five environmental domains, alongside DIY factors such as cost, required expertise, space availability, maintenance burden, and an indicative cost-benefit perspective. A suite of DIY cards complements the tool by translating monitoring and modelling insights into step-by-step guidance on what to install, where to place it, and expected outcomes across air quality, overheating, flooding, biodiversity, and health and wellbeing, as well as typical installation and maintenance considerations. Together, these outputs support informed resident decision-making and provide local authorities and community partners with a scalable and consistent evidence base for promoting household-level climate adaptation.

How to cite: Sun, H., Biswal, A., and kumar, P.: Household-scale decision support for climate-resilient urban greening informed by monitoring and modelling, EGU General Assembly 2026, Vienna, Austria, 3–8 May 2026, EGU26-10185, https://doi.org/10.5194/egusphere-egu26-10185, 2026.

EGU26-10701 | ECS | Posters on site | HS5.4.1

From plot measurements to catchment modelling: Forest role in coping with floods and droughts in the Gradaščica River catchment 

Tamara Kuzmanić, Katarina Zabret, Klaudija Lebar, Mojca Šraj, Maja Koprivšek, Sašo Petan, and Andreja Kopač

The Gradaščica River catchment is a small torrential catchment (≈160 km²) in central Slovenia, with mainly forested and agricultural land, entering the urban area of Ljubljana in its lower reach. It is one of the case studies of the European SpongeScapes project, which aims to enhance the ‘sponge’ function of soils, groundwater, and surface waters. The project combines field measurements, upscaling, and hydrological modelling to improve catchment resilience to floods and droughts. Since 2014, a research plot has been established in the catchment to monitor precipitation interception, throughfall, and stemflow of deciduous and coniferous trees, as well as their effect on local water balance. These data were upscaled and used to model the influence of forest cover on the water balance of the catchment. A Wflow SBM model with 200 m resolution and an hourly time step, driven by precipitation, air temperature, and potential evapotranspiration, was developed to simulate hydrometeorological extremes (e.g., floods and droughts) of varying magnitude and to assess the impact of forest share, type, and location on catchment hydrology.

Acknowledgements: The authors would like to acknowledge the financial support provided by the European Union’s Horizon Europe Research and Innovation Programme, within the scope of the project “SpongeScapes” (Grant agreement No. 101112738). The study was also partially financed by the Slovenian Research and Innovation Agency (ARIS) within the research program P2–0180 and project J2-4489. The research is also supported by the UNESCO Chair on Water-related Disaster Risk Reduction and the Slovenian national committee of the IHP UNESCO research programme.

How to cite: Kuzmanić, T., Zabret, K., Lebar, K., Šraj, M., Koprivšek, M., Petan, S., and Kopač, A.: From plot measurements to catchment modelling: Forest role in coping with floods and droughts in the Gradaščica River catchment, EGU General Assembly 2026, Vienna, Austria, 3–8 May 2026, EGU26-10701, https://doi.org/10.5194/egusphere-egu26-10701, 2026.

EGU26-12878 | ECS | Posters on site | HS5.4.1

The Water-Energy-Food Nexus in Naxos Island: Enhancing Self-Sufficiency Through Traditional Techniques 

Manthos Maravelakis, Theano Iliopoulou, and G.-Fivos Sargentis

The Water-Energy-Food (WEF) Nexus represents a critical framework for sustainable resource management, particularly in water-scarce Mediterranean islands like Naxos, Greece. This research examines the interdependence of water, energy, and food systems on Naxos, a Cycladic island facing challenges from climate variability, tourism pressures, and agricultural demands. We assess the island's natural resources and evaluate current needs for residents and primary production sectors, highlighting inefficiencies in existing infrastructure such as desalination units and energy mixes reliant on fossil fuels. Using geospatial analysis via QGIS, the island was divided into 28 grid cells to quantify rainwater harvesting potential from rooftops, courtyards, and road networks. Annual precipitation data were integrated with land use patterns to estimate harvestable volumes, ranging from 5,800 m³/yr in coastal cells to over 200,000 m³/yr in mountainous areas. Prioritization of water needs focuses on domestic supply for permanent residents and irrigation for crops like potatoes, olives, and vineyards, while incorporating animal manure as a nutrient source to reduce fertilizer dependency and embedded energy costs. Traditional techniques, such as cisterns for rooftop collection and roadside swales/bioretention systems for runoff management, are proposed as low-energy, resilient solutions. Results indicate that optimized harvesting could cover a significant part of irrigation needs and alleviate desalination reliance, enhancing self-sufficiency.

How to cite: Maravelakis, M., Iliopoulou, T., and Sargentis, G.-F.: The Water-Energy-Food Nexus in Naxos Island: Enhancing Self-Sufficiency Through Traditional Techniques, EGU General Assembly 2026, Vienna, Austria, 3–8 May 2026, EGU26-12878, https://doi.org/10.5194/egusphere-egu26-12878, 2026.

EGU26-14084 | Orals | HS5.4.1

Nature-Based Solutions for Urban Resilience: Remote Sensing assessment of wetland degradation and microclimate regulation using a Living Lab Framework in peri-urban India 

Namrata Bhattacharya Mis, Bivash Dhali, Tuhin Bhadra, Nairwita Bandyopadhyay, Kaberi Samanta, Kazi Hifajat, Riya Kundu, Spandan Dutta, Soumyajit Bhattacharya, and Nidhi Nagabhatla

Rapid urban expansion in peri-urban regions presents critical challenges for sustainable water management, thermal regulation, and air quality. Urban wetlands, which are integral to Blue–Green Infrastructure (BGI), deliver essential ecosystem services such as stormwater retention, microclimate moderation, and pollution mitigation to the local area. However, these systems are increasingly threatened by unplanned land-use change and anthropogenic pressures.

This study examines wetland degradation and its implications for urban micro-climate regulation in the rapidly urbanizing peri-urban landscape of Barasat, West Bengal, India. A multi-temporal land-use/land-cover (LULC) analysis was conducted with data between the year 1995 and 2025; using Landsat 5 TM and Landsat 8 OLI imagery processed with FLAASH atmospheric correction. Changes in vegetation, surface water, and built-up areas were quantified, and their relationship with land surface temperature (LST) and air quality indicators was assessed.

Initial results suggest a significant transformation in: vegetation cover, which declined by 1,512 ha, surface water bodies reduced by 22 ha, while built-up areas expanded by 813 ha. These changes correspond to rising LST, with built-up zones exhibiting mean winter daytime temperatures of ~33 °C compared to 30 °C in agricultural areas, 25 °C in vegetated zones, and 24 °C over water bodies—highlighting the thermal regulation role of wetlands. Air quality monitoring indicates PM2.5 and PM10 concentrations driving AQI values up to 190 (moderate–poor) in dense urban areas, whereas wetland-dominated zones maintain AQI ~50 (good).

In the long term, wetland degradation compromises urban water storage and drainage, exacerbates heat stress, and increases exposure to pollution. This study advocates for Nature-Based Solutions (NbS) to restore and protect urban wetlands as functional BGI. A Living Lab framework is proposed which serves as a platform for the real-world experimental platform to codesign evidence-based restoration, ensuring NbS interventions are specific to the context, location, and socially acceptable. Within this context, the approach enables continuous multi-parameter monitoring, adaptive management, stakeholder engagement, and evidence-based restoration—supporting integrated urban water management and microclimate amelioration in rapidly urbanizing regions of the Global South. 

Keywords: Urban wetlands, Blue–Green Infrastructure, Nature-Based Solutions, Living Lab, Remote Sensing, urban microclimate, wetland degradation.

How to cite: Mis, N. B., Dhali, B., Bhadra, T., Bandyopadhyay, N., Samanta, K., Hifajat, K., Kundu, R., Dutta, S., Bhattacharya, S., and Nagabhatla, N.: Nature-Based Solutions for Urban Resilience: Remote Sensing assessment of wetland degradation and microclimate regulation using a Living Lab Framework in peri-urban India, EGU General Assembly 2026, Vienna, Austria, 3–8 May 2026, EGU26-14084, https://doi.org/10.5194/egusphere-egu26-14084, 2026.

EGU26-14105 | Posters on site | HS5.4.1

Quantifying the Hydrological Performance of Urban Rain Gardens under Simulated Extreme Storm Events  

Elise Cheng, Daniel Green, Vasily Demyanov, Leo Peskett, and Nicole Archer

Urbanisation reduces permeable surfaces and increases susceptibility to surface water (pluvial) flooding. Nature-based Solutions (NbS) and Green Infrastructure (GI) have emerged as key components of sustainable flood risk management, complementing conventional grey systems through hybrid designs that enhance resilience and deliver multifunctional benefits. Sustainable Urban Drainage Systems (SuDS) are a prominent example, integrating the four design pillars of water quality, water quantity, public amenity and biodiversity by capturing and attenuating stormwater before it reaches combined sewer outflows (CSOs).

This study evaluates the hydrological performance of urban bioretention rain gardens across multiple sites in Edinburgh and Glasgow, Scotland. A combination of desk-based site characterisation, in-situ hydrological and hydraulic testing and distributed environmental sensor networks are used to establish baseline behaviour and storm response. These networks include volumetric water content sensors to quantify soil water storage, attenuation and drainage capacity, alongside local meteorological measurements to characterise inflow and evapotranspiration dynamics.

To assess system performance under high-intensity rainfall, controlled storm events are simulated using a portable rainfall simulator developed for site-based SuDS stress-testing. Sixty-minute design storm profiles of varying magnitudes (10-, 30-, and 100-year return periods) are applied to standardised 1 m² test plots isolated by custom-built separator trays. This setup enables consistent cross-site comparisons and links hydrological mass balance responses to site-specific conditions such as soil texture, infiltration rate, vegetation structure and planting density.

Preliminary findings demonstrate that vertical soil moisture dynamics during simulated storm events, reflecting the combined influence of soil hydraulic conductivity, antecedent moisture and vegetation cover on infiltration and retention. Measurements from sensors installed at 0–40 cm depths show rapid wetting of surface layers followed by delayed responses at depth, consistent with progressive infiltration through the soil profile. Under moderate (10–30-year) storms, soil columns exhibited sustained storage increases and slow drainage recovery, indicating effective attenuation of runoff generation. Under more extreme (100-year) events, near-surface layers reached saturation thresholds rapidly, producing short-term ponding and reduced percolation efficiency. Despite this, the monitored profiles retained measurable storage potential compared with non-vegetated controls, demonstrating capacity to buffer surface flow during extreme rainfall.

These findings provide empirical evidence on the hydraulic resilience of current NbS implementations to extreme pluvial conditions. These insights will inform design optimisation and future-proofing of rain gardens and related SuDS elements, supporting the development of more resilient and multifunctional urban drainage networks that safeguard both communities and infrastructure.

How to cite: Cheng, E., Green, D., Demyanov, V., Peskett, L., and Archer, N.: Quantifying the Hydrological Performance of Urban Rain Gardens under Simulated Extreme Storm Events , EGU General Assembly 2026, Vienna, Austria, 3–8 May 2026, EGU26-14105, https://doi.org/10.5194/egusphere-egu26-14105, 2026.

EGU26-14597 | ECS | Posters on site | HS5.4.1

Integrated effects of biochar and treated wastewater applications on soil carbon, salinity and hydro-physical properties in a Semiarid hillslope 

Thayná Almeida, Abelardo Montenegro, Jorge Isidoro, and João Pedroso de Lima

Water scarcity and soil degradation are major constraints for sustainable land management in semiarid regions. This is of particular importance on hillslopes of alluvial environments that are highly susceptible to erosion and carbon losses, both in rural and urban areas. The reuse of treated domestic wastewater for irrigation has emerged as an alternative water source in these regions, and as a sanitation solution; however, its long-term sustainability is often limited by salt accumulation and changes in soil physical and hydraulic functioning under high evaporative demand. This study evaluates the integrated effects of biochar application combined with treated wastewater irrigation on soil carbon stocks, salinity dynamics and hydro-physical properties in a hot semiarid environment.

Field experiments were conducted on shallow, steep sandy loam soils developed on hillslopes of alluvial deposits, characterized by low water storage capacity and strong hydrological connectivity along slopes. Soil surface management strategies included bare soil, organic mulching, and the combined application of mulch and biochar produced from agricultural wood residues, representing contrasting conditions of surface protection and organic input. The system was irrigated using treated domestic effluent with moderate to high electrical conductivity through a localized drip irrigation scheme, reflecting realistic water reuse practices in water-scarce regions. The assessment focused on soil electrical conductivity, total organic carbon and key physical and hydraulic attributes controlling infiltration, water retention and solute transport, monitored over successive field campaigns and soil depths. This integrated approach allowed the evaluation of responses of soil–water–carbon interactions under combined water reuse and soil amendment practices. Results indicate that the integration of biochar with organic surface cover promotes higher soil carbon accumulation and greater temporal stability compared to bare soil conditions. Organic amendments also attenuated salinity buildup under wastewater irrigation, reducing variability in soil electrical conductivity and buffering salt accumulation in the surface layer. These effects are associated with improvements in soil structure and porosity, which enhance water retention and infiltration capacity, reduce surface runoff and limit salt concentration in the root zone, particularly following rainfall events. These processes are especially relevant in sloping alluvial semiarid landscapes, where soil physical degradation and hydrological processes strongly influence carbon redistribution and salinity risks.

Overall, the findings highlight the potential of integrating biochar with treated wastewater irrigation as an innovative and scalable Nature-based Solution strategy for improving soil–water–carbon interactions in semiarid environments. This approach explicitly supports the United Nations Sustainable Development Goals by contributing to SDG 2 (Zero Hunger) through improved soil productivity, SDG 6 (Clean Water and Sanitation) by promoting safe wastewater reuse, SDG 13 (Climate Action) via soil carbon sequestration, and SDG 15 (Life on Land) by mitigating land degradation, while offering practical insights for climate-resilient land use planning and the implementation of Nature-based Solutions in vulnerable dryland regions.

How to cite: Almeida, T., Montenegro, A., Isidoro, J., and Pedroso de Lima, J.: Integrated effects of biochar and treated wastewater applications on soil carbon, salinity and hydro-physical properties in a Semiarid hillslope, EGU General Assembly 2026, Vienna, Austria, 3–8 May 2026, EGU26-14597, https://doi.org/10.5194/egusphere-egu26-14597, 2026.

EGU26-15239 | Posters on site | HS5.4.1

Phytoremediation of wastewater using a field-scale floating wetland system 

Ozeas Costa Jr and Zhaozhe Chen

Phytoremediation is an environmentally friendly, cost-effective, and sustainable technology that uses plants to clean up contaminated soil, water, and air. Compared to traditional wastewater treatment methods – which are often energy-intensive and expensive – phytoremediation techniques use low-cost, readily available local materials, have minimal upfront capital investment, are simple to maintain and operate, have little to no energy input, and provide multiple co-benefits (e.g., habitat for wildlife, improvement of local aesthetics, and biomass harvest for composting and biofuel). This study evaluated the effectiveness of a field-scale floating wetland system in reducing concentrations of nutrients and algal toxins (microcystin), using native aquatic plants installed in the equalization basin of a wastewater treatment plant. The floating wetland system was deployed in late spring and, through summer and fall, we monitored nutrient levels, microcystin concentrations, physico-chemical parameters, and plant biomass. A 78% reduction in microcystin was achieved during peak plant growth, and the relative abundance of cyanobacteria decreased from 27.7% to 4.5% during this period. Nutrient assimilation (and plant biomass production) was higher in systems with mixed plants (polyculture), with nutrient reduction reaching peak values of 2968 mg/m2 for NH4+, 1767 mg/m2 for PO43−, and 12 mg/m2 for NOx during the study. Environmental factors such as pH and water temperature also affected nutrient assimilation, with varying effects on both polyculture and monoculture systems. Precipitation was also a key factor influencing microcystin reduction rates, while microcystin toxicity had no significant effect. In order to evaluate the role of microbes in the phytoremediation process, we also performed microbial analysis of wastewater samples and root biofilms, including 16S rRNA gene sequencing. This characterization of the bacterial community revealed significantly higher microbial diversity in the rhizosphere compared to the water. Proteobacteria dominated the rhizosphere (47%–52%) while cyanobacteria dominated the water (30%). The polyculture system had greater abundance of beneficial microbial taxa and metabolic pathways, which was associated with higher plant growth and enhanced nutrient assimilation.

How to cite: Costa Jr, O. and Chen, Z.: Phytoremediation of wastewater using a field-scale floating wetland system, EGU General Assembly 2026, Vienna, Austria, 3–8 May 2026, EGU26-15239, https://doi.org/10.5194/egusphere-egu26-15239, 2026.

EGU26-17260 | Posters on site | HS5.4.1

Nature-based Restoration of a Mountain Stream Habitat: A Case Study from Shangshi Village, Fujian, China 

Jinn-Chyi Chen, Jian-Qiang Fan, Xi-Zhu Lai, Wen-Sun Huang, Feng-Bin Li, and Gui-Liang Li

Traditional riverbank engineering typically involves vegetation removal and channelization measures (e.g., bank hardening and riverbed grading), which simplify the natural flow regime and significantly reduce biodiversity. This study focuses on a mountain stream in Shangshi Village, located in the upper reaches of the Baxi River within the Yong'an City water source protection zone, Fujian Province, China. The area is characterized by excellent water quality and rich aquatic biodiversity, notably the annual summer migration of native fish species. However, flood control interventions involving bank hardening and riverbed grading have homogenized the flow regime, leading to the loss of this migratory behavior. Successful fish migration depends on a combination of hydraulic and geomorphic conditions, including suitable water depth, flow velocity, substrate composition, diverse flow paths, and the presence of specific hydraulic cues. To restore the riverine habitat, this study employs UAV-based aerial photography, hydrological surveys (including discharge, velocity, and depth measurements), and field investigations of streambed composition and riparian vegetation. Integrated with hydrological and hydraulic analyses, a rehabilitation scheme combining riprap structures and vegetative engineering is proposed. The approach aims to reconstruct bank morphology and diversify flow patterns and habitat niches, thereby promoting systematic river ecosystem restoration through nature-based solutions.

How to cite: Chen, J.-C., Fan, J.-Q., Lai, X.-Z., Huang, W.-S., Li, F.-B., and Li, G.-L.: Nature-based Restoration of a Mountain Stream Habitat: A Case Study from Shangshi Village, Fujian, China, EGU General Assembly 2026, Vienna, Austria, 3–8 May 2026, EGU26-17260, https://doi.org/10.5194/egusphere-egu26-17260, 2026.

EGU26-17892 | ECS | Posters on site | HS5.4.1

Stormwater Management for Developing Urban Areas under Precipitation and Urbanization changes: a parsimonious approach 

Guru Chythanya Guptha, Alessandra Marzadri, Sabyasachi Swain, and Giuseppe Formetta

The complexity of the risks associated with urban stormwater management is increasing world-wide, with climate change and rapid urbanization being among the main drivers. Climate change is intensifying extreme precipitation events to magnitudes that severely challenge the capacity of existing urban drainage infrastructures. Concurrently, rapidly increasing urban density, particularly in developing areas, results in expanded impervious surfaces, thereby raising the surface runoff volumes and peaks. This leads to hazards such as urban flooding, which has become more frequent in recent decades across the globe. Literature shows that integrating Nature-Based Solutions (NBS) with traditional Urban Drainage System (UDS) can improve system performance by providing increased water storage capacity, flood and flow reduction, and other associated benefits. This study employs the Python-integrated Storm Water Management Model (PySWMM) to model and simulate an existing UDS in a rapidly urbanizing catchment in Gurugram City, India. The 42 km² catchment is divided into 21 sub-catchments. A non-stationary/stationary rainfall frequency analysis is applied to account for potential precipitation trends across the analyzed urban area. Similarly, a simplified methodology is adopted for evaluating changes in urbanization using openly available datasets. The functionality of the UDS is assessed for the effects of changes in precipitation and urbanization for the near future, both individually and in combination. The modelled urban water system is intervened with different NBS interventions and their combinations to quantify the effectiveness of NBS in minimizing the impacts of climate change and urbanization. The results demonstrate a significant reduction in flooding and peak surface runoff outflows.

How to cite: Guptha, G. C., Marzadri, A., Swain, S., and Formetta, G.: Stormwater Management for Developing Urban Areas under Precipitation and Urbanization changes: a parsimonious approach, EGU General Assembly 2026, Vienna, Austria, 3–8 May 2026, EGU26-17892, https://doi.org/10.5194/egusphere-egu26-17892, 2026.

Urban flooding continues to intensify globally due to the combined effects of climate change–driven extremes, unplanned settlement, and rapid urbanisation. Conventional approaches for the design of urban stormwater management structures rely on fixed design storms and fail to integrate flood consequences. In densely settled areas, there is little scope to augment existing designs to cope with climate change, demanding innovative decentralised solutions.

In this study, we extend a safe-fail, consequence-based design framework by explicitly integrating decentralised urban water management strategies within a sponge city paradigm. The proposed framework shifts the design objective from flood prevention to controlled failure with minimised flood severity, accounting for both centralised drainage networks and distributed blue infrastructure. An event-based simulation framework is developed to evaluate a wide range of extreme rainfall scenarios under present and future climate conditions, along with potential decentralised house-level water management strategies.

The method was applied to 100 cities in India that are part of the Government of India’s Smart Cities programme. Three decentralised water storage scenarios—(1) full-store, (2) constant release, and (3) smart (capacity-aware) release—were tested across all cities. The results indicate that, on average, a storage capacity sufficient to capture 10–15 mm of rainfall per unit area of the urban environment can reduce nearly 75% of the flood volume under the capacity-aware scenario. Corresponding values were 25–30 mm and 30–40 mm for the constant release and full-store scenarios, respectively.

The results highlight the potential of decentralised solutions for flood mitigation in urban areas and suggest the need for careful policy and governance interventions.

How to cite: Rohith, A.: A consequence-based safe-fail approach for decentralised urban stormwater management for flood mitigation, EGU General Assembly 2026, Vienna, Austria, 3–8 May 2026, EGU26-18745, https://doi.org/10.5194/egusphere-egu26-18745, 2026.

Flood-related damage has increased due to extreme rainfall events driven by climate change. Nature-based solutions are an effective strategy for mitigating flood damage while restoring riverine ecosystems. The objective of this study is to evaluate the effectiveness of nature-based solutions in the Seosi-cheon Stream, South Korea. The study area is a 10.5 km reach downstream from the Guman Reservoir in Gurye-gun. Scenarios for the creation of retention basins were developed, and their effectiveness of flood mitigation and habitat restoration was evaluated. The flood mitigation effectiveness was evaluated using a hydrodynamic model. The InVEST model was used to assess impacts on habitat quality. The site selection of nature-based solutions was discussed in terms of flood mitigation and habitat restoration.


How to cite: Kim, S. K. and Koo, H.: Assessing nature-based solutions for flood mitigation and habitat restoration in the Seosi-cheon Stream, South Korea, EGU General Assembly 2026, Vienna, Austria, 3–8 May 2026, EGU26-21239, https://doi.org/10.5194/egusphere-egu26-21239, 2026.

EGU26-21335 | ECS | Posters on site | HS5.4.1

How does root oriented preferential flow impact rain garden hydrology?  

Madeleine Geddes-Barton, Daniel Green, Elma Charalampidou, Mariya Ptashnyk, Caitlyn Johnstone, and Emma Bush

With increasing pressures from climate change and urban expansion, the development of resilient “sponge cities” is essential to mitigate flooding and reduce pollution. Rain gardens represent a key green infrastructure intervention and have the potential to be implemented far more widely in new developments or retrofitted into existing ones. Rain gardens are particularly appealing to urban planners because they can deliver multiple co-benefits by enhancing biodiversity and amenity while achieving water management objectives. However, gaps in the understanding of rain garden hydrology remain a barrier to widespread adoption. In contrast to grey infrastructure, which is supported by extensive empirical research, confidence in the hydraulic performance of vegetated systems remains limited. To embed rain gardens more effectively in urban design, their hydrological functioning must be quantified more accurately and design parameters refined. 

A major source of uncertainty lies in the behaviour of rooted soils. Recent studies highlight that root-oriented preferential flow can substantially increase soil hydraulic conductivity, reduce surface runoff and prevent sediment from clogging drainage structures. Plant roots may also improve soil water retention, enhance rainfall interception, attenuate peak flow and support pollutant removal. Yet despite this growing awareness, these mechanisms remain poorly quantified and are rarely represented in models of green infrastructure. As a result, current engineering design typically relies only on physical soil parameters, without accounting for dynamic plant–soil interactions. 

This study investigates the influence of root-oriented preferential flow on rain garden hydrology through a mixed-methods approach combining laboratory experimentation, field observation and mathematical modelling. The first phase involves single-plant mesocosms in a three-year longitudinal laboratory study of rooted soil hydrology, complemented by regular MRI imaging to capture root architecture development. This study presents initial findings from this longitudinal experiment, demonstrating how high-resolution MRI scanning can be integrated with continuous hydrological monitoring to reveal emerging flow pathways in rooted soils. These data will inform a mechanistic model that quantifies the effects of preferential flow across different root types and depths, providing new parameterisations for use in rain garden performance models.  

How to cite: Geddes-Barton, M., Green, D., Charalampidou, E., Ptashnyk, M., Johnstone, C., and Bush, E.: How does root oriented preferential flow impact rain garden hydrology? , EGU General Assembly 2026, Vienna, Austria, 3–8 May 2026, EGU26-21335, https://doi.org/10.5194/egusphere-egu26-21335, 2026.

EGU26-22107 | ECS | Orals | HS5.4.1

Vertical Green Walls for Urban Water Resilience: Lessons from vertECO® and GRETA™ Pilots in Austria and Spain 

Marco Hartl, Tamara Vobruba, Massimiliano Riva, Gaetano Bertino, Heinz Gattringer, Josep Pueyo, Gianluigi Buttiglieri, Joaquim Comas, and Maria Wirth

Urban areas increasingly face compound hazards linked to climate change, including intensified pluvial flooding, heat stress and water scarcity. As a result, cities are turning towards green infrastructure (GI) and nature-based solutions (NbS) that can simultaneously reduce risk, enhance urban livability and enable circular resource management. In this contribution, we present alchemia-nova’s experiences from implementing and monitoring two building-integrated vertical NbS for decentralized water treatment and reuse: the vertECO® vertical constructed wetland system at the eco-community Cambium (Fehring, southeastern Austria) and the GRETA™ modular green wall at the St. Quirze social housing pilot (Barcelona metropolitan area, Spain).

At Cambium, vertECO® was installed in a wintergarden and represents, to our knowledge, the first full-scale vertical green wall receiving all fractions of mechanically pre-treated domestic wastewater (including blackwater, and not only greywater), with the aim of water and nutrient reuse in local agriculture . The system consists of four parallel (each 2-m long) modules with four stepwise aligned, aerated subsurface horizontal-flow basins, followed by treated water storage and ozonation recirculation . Monitoring results demonstrate that vertECO® alone already achieved average effluent quality compliant with the EU water reuse regulation thresholds for reclaimed water quality Class C (drip irrigation), while vertECO® combined with ozonation achieved Class B (broader irrigation methods), also meeting local Austrian permit requirements . The wintergarden setting maintained operational temperatures above freezing conditions during the monitoring period, supporting year-round performance in a temperate climate with cold winters.

In parallel, the GRETA™ pilot at St. Quirze demonstrates a vertical green wall for residential water management, combining bathroom greywater (three showers and two sinks) with rainwater harvested from a 120 m² roof area. The system was integrated into a renovated social housing building with dedicated greywater separation, highlighting the value of implementing source separation during new construction or refurbishment. GRETA™ treats ~125 L/day (peaks up to 180 L/day) using four parallel treatment lines across four stages of horizontal subsurface flow through modular planted units. Treated water is collected, disinfected via ozonation, and reused for toilet flushing in four apartments, with emergency tap water feeding options to improve reliability.

Monitoring from May 2023 to October 2024 (15-day intervals) indicates consistent performance, including strong reductions of turbidity, suspended solids, organic load, and ammonium. Hygiene indicators were already low in the influent and reached non-detectable levels after treatment and ozonation, supporting compliance with Spanish reuse requirements for urban non-potable applications. The pilot also yielded operational lessons: elevated installation reduced vandalism risk, and a heat period combined with automation failure caused major plant die-off. However, the system recovered quickly and maintained stable treatment efficiency, highlighting vertical GI resilience under disturbances.

Across sites, we show how vertical GI can contribute to integrated urban hazard management by reducing freshwater demand, strengthening resilience to drought and shortages, supporting rainwater buffering strategies, and acting as visible, community-facing infrastructure. We conclude with key research needs on scaling, cost–benefit assessment including co-benefits (e.g., greening and cooling), long-term robustness, and governance models for operation and maintenance.

How to cite: Hartl, M., Vobruba, T., Riva, M., Bertino, G., Gattringer, H., Pueyo, J., Buttiglieri, G., Comas, J., and Wirth, M.: Vertical Green Walls for Urban Water Resilience: Lessons from vertECO® and GRETA™ Pilots in Austria and Spain, EGU General Assembly 2026, Vienna, Austria, 3–8 May 2026, EGU26-22107, https://doi.org/10.5194/egusphere-egu26-22107, 2026.

Bengaluru, the “Silicon Valley of India”, faces environmental pressures, with degradation of its urban lakes among the most visible. Historically, three interconnected catchments with cascades of manmade reservoirs supported irrigation, domestic use and groundwater recharge. Rapid urbanisation and a shift from agriculture to the service sector led the city to import water from the Cauvery River, about 100 km away, reducing reliance on local lakes. Wastewater infrastructure did not keep pace with expanding water supply, and many lakes became sinks for untreated or partially treated sewage, resulting in fish kills, algal blooms and odour problems.
In response, public agencies, corporate social responsibility initiatives and citizen groups undertook lake restoration projects, but most interventions focused on civil works such as stone pitching, desilting, deepening of basins and planting of exotic species, with limited ecological rationale. Restoration success has typically been assessed against national “Class B” bathing water standards. Because most lakes fail to meet these norms, restoration is often portrayed as unsuccessful.
This study presents a context specific framework to benchmark lake health and guide restoration in rapidly developing catchments. We evaluated 32 lakes during critical season (Feb to May 2025), randomly selected from about 180 across Bengaluru, representing diverse intervention types, such as sewage treatment plants, sedimentation ponds and constructed wetlands, and different levels of community stewardship. Lake condition was assessed along three dimensions: water quality and hydrology (Secchi depth, total phosphorus, dissolved oxygen), biodiversity (plant and bird diversity) and community engagement.
To develop an operational benchmark, we focused on three indicators with strong ecological relevance: water clarity (Secchi depth), nutrient status (total phosphorus) and plant species richness. These were weighted to reflect their relative importance (0.5, 0.3 and 0.2 respectively). Indicators were normalised across lakes; beneficial values were scored positively and detrimental values inversely. Composite scores were calculated for each lake, and a benchmark threshold of 0.6 was proposed.
Fewer than 20 percent of lakes exceeded this benchmark. Higher scoring lakes had Secchi depth greater than 0.4 m, total phosphorus less than 0.8 mg/L, well maintained shoreline vegetation and received treated wastewater through sedimentation zones or in lake constructed wetlands, together with strong community stewardship. Lower scoring lakes were characterised by total phosphorus greater than 1.2 mg/L, Secchi depth less than 0.25 m and degraded shorelines, reflecting inflows of untreated or partially treated sewage and weak local engagement.
The framework helps establish restoration targets that are achievable in rapidly urbanising catchments. Rather than focusing solely on bathing water standards, agencies can use the benchmark to design interventions (type and scale) that help lakes achieve threshold 0.6 and above.  Additionally also help identify catchment and in lake factors associated with higher water clarity and better ecological condition. Well performing lakes can serve as reference systems, and the benchmark can act as a performance indicator. These lakes can also be developed as living laboratories where schools and communities monitor simple indicators such as Secchi depth, total phosphorus and plant diversity, helping to sustain lake health and the effectiveness of interventions.

How to cite: Jamwal, P.: Innovative approach to restoring urban water bodies in rapidly developing catchments, EGU General Assembly 2026, Vienna, Austria, 3–8 May 2026, EGU26-183, https://doi.org/10.5194/egusphere-egu26-183, 2026.

EGU26-545 | ECS | Posters on site | HS5.4.2

Sustainability assessment of Almaty urban water management using DPSIR-MCDA approach  

Aziza Baubekova, Ivan Radelyuk, and Zhaniya Khaibullina

Water scarcity has emerged as one of the most pressing issues in Central Asia, driven by climate change, transboundary water issues, rapid population growth, and escalating demands on limited water resources. For the Republic of Kazakhstan, water security has become a critical aspect of national security, recognised as early as 2003 and becoming more urgent from year to year. Despite an estimated renewable water resource potential, Kazakhstan faces significant water scarcity, particularly in the southern regions, due to uneven distribution, excessive water withdrawal for irrigation, and climatic variability. This research aims to assess the challenges in water resources management in Almaty, the primate city of Kazakhstan, using the DPSIR-MCDA approach. The DPSIR assessment of Almaty’s urban water system indicates that climate change, rapid demographic expansion, urbanization, and infrastructure underinvestment are primary drivers, generating pressures such as altered glacial runoff, variable groundwater recharge, rising consumption, and severe infrastructure deterioration. These pressures have degraded the system’s state, resulting in unstable water availability, high distribution losses, and unequal access to centralized services in peri-urban areas. The analysis indicates that effective responses must include adaptive abstraction strategies, large-scale infrastructure rehabilitation, expansion of water reuse and circular systems, and targeted PPP-based development for underserved districts. To prioritise these measures from the perspective of sustainability factors (economic, environmental, social, and technological), two respective questionnaires were developed and distributed among twenty-six experts: experienced academicians in the urban water management and local representatives. The outcomes were assessed using the hybridised versions of DEMATEL-ANP as a tool for MCDA. The results showed that the measure focusing on the implementation of Circular Economy principles received the highest total weighted score, demonstrating strong performance, particularly in the technological dimension, and a relatively balanced influence across the others. The measure of tariffs' modification and strengthening control mechanisms for water users followed closely, primarily driven by its dominant performance in the economic dimension. Awareness-raising initiatives ranked third, demonstrating particular strength in the social dimension, whereas water use diversification ranked fourth with a more even distribution across dimensions. The engaging independent private enterprises received the lowest composite score, suggesting weaker alignment with environmental and social sustainability. The study concludes that delivering water supply and sanitation services in a more sustainable, inclusive, efficient, and resilient manner requires technologically advanced solutions and proper governance response. 

How to cite: Baubekova, A., Radelyuk, I., and Khaibullina, Z.: Sustainability assessment of Almaty urban water management using DPSIR-MCDA approach , EGU General Assembly 2026, Vienna, Austria, 3–8 May 2026, EGU26-545, https://doi.org/10.5194/egusphere-egu26-545, 2026.

The phenomenon of urban flooding has evolved into a critical challenge in contemporary urban environments. Urban floods can occur due to rapid unplanned urbanization, frequent climatic extremes, and poor urban drainage infrastructure (URDAN). Incidents of urban flooding have become frequent in recent history. Hence, it is imperative to strengthen the flood resilience of cities. The present study proposes a holistic, multi-faceted flood resilience framework that integrates the critical elements of past urban floods, simulates existing URDAN using present and future climate extremes, and evaluates the integration of Low Impact Development (LID) in enhancing resilience of cities. Historically, landuse change and climate variability are quantified along with a dedicated assessment of previous urban floods. For the present, urban flood risk zonation and hotspot identification (UFRZHI) ascertain areas at higher flood risk. Performance of URDAN in a high flood risk zone is then evaluated using Stormwater Management Model (SWMM). The URDAN is optimized for performance using LID elements, while General Circulation Models (GCMs) integrate future rainfall projections.

The study analyzed the 2019 urban flood and found that climate change was the immediate cause of the floods, as intense rainfall overwhelmed the existing URDAN, while the week-long inundation resulted from poor management. The builtup area increased from 29.9 to 48.5 sq. km., while vegetation declined from 64.5 to 48.7 sq. km. between 1990 and 2020. The long-term historical (1950–2020) climate variability assessed using Modified Mann-Kendall and Centroidal Day (CD) shifts shows a forward shift in monsoonal and annual rainfall in recent decades. The variability in total rainfall is more pronounced post-1985, while rainfall during monsoons has intensified. An increase of 64.53 mm (18.9%) in surface runoff is observed despite decreasing rainfall trends.

A normalized multivariate approach ranks the performance of downscaled and bias-corrected GCMs. The ensemble of the top three optimal GCMs is used for future predictions for Shared Socioeconomic Pathways (SSP) (SSP245, SSP370, and SSP585) scenarios. The historical annual maximum hourly rainfall series was fitted to Generalized Extreme Value distribution and alternating block method develops design storm hyetographs. The UFRZHI analysis identifies the most flood-prone areas, the existing URDAN of which is comprehensively evaluated using SWMM for 2- (baseline), 5-, 10-, and 25-year return periods. Simulation results show that the baseline URDAN fails and the time to peak ( Tp) is 59 minutes for 2-year return period. The peak outlet discharge (Qpeak ) increases and  remains constant with higher return periods and warmer climate forcings.

Permeable pavement, bioretention cells, and green roofs included URDAN shows a sharp decrease in Qpeak and a 22-minute delay in Tp. The inclusion of LID eliminates URDAN failure and reduces the runoff in subcatchments by 40-45%. The performance of LIDs saturates under higher return periods and warmer climatic scenarios. The framework in the present study can model risk prone URDAN and alleviate the failure stress through the inclusion of LID and climate uncertainty. The proposed framework can be used to develop an urban flood resilient city under climatic extremes.

How to cite: Rashiq, A. and Prakash, O.: Climate-Adaptive Urban Flood Hazard Framework: Risk Evaluation and Resilience Optimization, EGU General Assembly 2026, Vienna, Austria, 3–8 May 2026, EGU26-808, https://doi.org/10.5194/egusphere-egu26-808, 2026.

EGU26-1270 | ECS | Orals | HS5.4.2

Extreme Storms and Sewer Overflows 

Bridget Rusk, Peter Hunter, David Oliver, Richard Quilliam, and Andrew Tyler

There is growing concern about the impact of wastewater discharges from combined sewer overflows (CSOs) on the quality of surface waters and their vulnerability to a wetter and stormier climate. The UK is already experiencing increased wet weather, and will continue to have more intense and frequent storms with climate change. Stronger and more frequent storms will increase pressure on sewer networks, likely compromising treatment capabilities and increasing discharges via CSOs. Consequently, reduced wastewater treatment means more faecal pollution and further degradation of surface water quality through increased loads of solids, faecal microbes, phosphorus, organics, microplastics, and pharmaceuticals.

Using a 12-month dataset from >1500 overflow monitors across Scottish Water’s Wastewater Intelligence Network (WWIN), the authors will present a novel analysis of real-time monitoring of CSO discharges at the nationwide level. Preliminary analysis involving the WWIN monitoring data and daily regional rainfall intensities show how high intensity storm events were the main driver of significant CSO discharges across Scotland in 2025. This research reveals for the first time that monitoring data has been analysed at a national scale to evaluate the impacts of weather on network performance.  The results demonstrate that the intensity of rainfall, rather than total rainfall volume, is the main driver in causing significant CSO discharge events. This presentation will showcase how real-time CSO monitoring can improve climate-informed decisions in prioritising and evaluating asset performance at a catchment level to ensure maximum return on investment to relation protecting public and environmental health.

How to cite: Rusk, B., Hunter, P., Oliver, D., Quilliam, R., and Tyler, A.: Extreme Storms and Sewer Overflows, EGU General Assembly 2026, Vienna, Austria, 3–8 May 2026, EGU26-1270, https://doi.org/10.5194/egusphere-egu26-1270, 2026.

In contemporary urban planning, infrastructure plays a decisive role in shaping the resilience, sustainability, and economic performance of cities. However, the urban planning discipline has conventionally lacked optimization-based frameworks for analyzing and operating these infrastructures. Instead, many studies have relied predominantly on AI or statistical pattern-recognition approaches that capture observable phenomena but often fail to reveal the underlying causal mechanisms. With the increasing diversity of operational data and the rapid evolution of computational capabilities, research that relies solely on empirical patterns is no longer sufficient for addressing the complexities of modern urban systems.

Water resource infrastructure is a prime example representing one of the largest electricity consumers in the public sector, yet much of the existing literature continues to depend on management of the conventional resources. In modern era, the scope of operable resources is far broader than pumps and treatment facilities alone. Renewable energy sources, battery energy storage, and even emerging hydrogen-based power systems increasingly interact with water infrastructure operations.

Given these expanded resource portfolios and the growing importance of electricity markets, urban infrastructure systems must be planned and operated through integrated, optimization-driven frameworks that recognize cross-sectoral coupling. Moreover, the scheduling horizon and operational logic of water and energy systems should be aligned with the temporal structures of electricity markets, enabling cities to capitalize on price signals, reduce operational costs, and enhance flexibility. Such a paradigm shift from isolated empirical decision-making to comprehensive optimization based on physics, economics, and system interactions, is essential for building next-generation climate-resilient and energy-efficient urban environments.

The study focuses on cost-optimization of a reconstructed water resource network of the city of Seongnam, developed using publicly available municipal data. The system serves a population of 943,676 and is supplied through an integrated metropolitan–local water network comprising 17 distribution reservoirs, 31 pumping stations, 140 pumps, 2 small hydropower generators, 2 photovoltaic generators, 1 battery energy storage system postulated, multiple intake stations and treatment facilities equipped with Oz-GAC and rapid filtration. Distances among facilities, stations and reservoirs were measured as straight-line distances using Google Earth, based on publicly provided GIS coordinates. The operational framework incorporates a MILP-based optimization model that explicitly accounts for operational delays through piecewise-linear flow representations, enabling time-dependent scheduling in the system.

How to cite: Lee, J.: Integrated Optimization of Urban Water–Energy Infrastructure Operations in a Metropolitan-Scale Network, EGU General Assembly 2026, Vienna, Austria, 3–8 May 2026, EGU26-1405, https://doi.org/10.5194/egusphere-egu26-1405, 2026.

Climate change can significantly affect the effectiveness and resilience of Stormwater Control Measures (SCMs) in urban environments, as changes in rainfall intensity and depth can impact SCMs' capacity to mitigate flooding and reduce pollutant loads in water bodies. Thus, increasingly adaptive and robust SCM designs need to be informed by a continued understanding of changing precipitation patterns. ​In this study we evaluate SCMs precipitation thresholds based on two main methods: 90% rainfall capture depth and 90th percentile rank of daily precipitation over the period 1980-2023 in North Carolina, USA. We sought to address the questions of whether changes in daily precipitation are detected over time and, if so, whether these changes result in different thresholds depending on the method of choice.  Our results indicate over the entire timeseries (1980-2023) both methods result in thresholds consistent with the current North Carolina Department of Environmental Quality SCM standard of 25.4 mm/day in central and western North Carolina and 38.1 mm/day in the eastern coastal plains. However, when the data is sliced in four 11-year periods the evolution of precipitation thresholds show a positive trend in both methods. We also find that the capture depth method is considerably more sensitive to extreme precipitation events than the 90th percentile method.  Our results indicate that current water quality event standards in North Carolina may underestimate pollutant load treatment due to observed precipitation changes in recent years, suggesting a need for decadal adjustments. ​Defined SCM threshold need also to account for differences arising from the choice of calculation method, and practitioners using the capture depth methodology in particular, may want to revisit established thresholds.

How to cite: Fernandes, K., Sañudo, L., Hunt, W., and Bowden, J.: Evaluating the impacts of climate variability and change versus methodological approaches on stormwater control measures rainfall thresholds. A case study from North Carolina, USA, EGU General Assembly 2026, Vienna, Austria, 3–8 May 2026, EGU26-1576, https://doi.org/10.5194/egusphere-egu26-1576, 2026.

EGU26-2779 | ECS | Orals | HS5.4.2

Identification of Key Water Quality Drivers in the Grunewald Chain of Lakes, Berlin 

Christina Radtke, Nick Heinemann, Arne Höring, and Kai Schröter

High nutrient loads, coming from urban sewage water and agricultural land use affect ecosystem functioning of surface water bodies. Urban lakes are special cases due to the anthropogenic use as storm water reservoir and the pollution caused by nutrients such as phosphorus and nitrate. Especially, the pollution by high nutrient loads causes the aquatic ecosystem to change in the trophic state to eutrophic or even worse hypertrophic, which influences the availability of oxygen and by this the occurrence of fishes, insects, plants and other aquatic beings. Moreover, the release of hydrogen sulfide due to anoxic conditions at the bottom of a lake causes odor in the surroundings of the lake. Improving the water quality of urban lakes is both a benefit for the ecosystem, and for the socio-ecological value of the waterbody. While reducing nutrient loads from inflowing water is crucial to achieve a healthy aquatic ecosystem, an in-depth understanding of transport and reaction processes in connected urban lakes is needed to guide restauration measures and water quality management. An example for connected water bodies is the Grunewald chain of lakes in Berlin, Germany, where ten lakes are connected one after the other, directly, via pumps or canals. The lakes are located at the southwest of Berlin and are surrounded by urban areas. The lakes serve as storm water reservoirs collecting rain water from urban and traffic areas. Phosphorus and other pollutants are accumulated in the lakes. To better understand the exchange between the lakes and how they affect each other, a monitoring campaign was conducted over a period of 13 months, where monthly water samples were taken at 17 sampling stations at the inlets, outlets and at the connections of the lakes. During the monitoring campaign (07/2024 - 07/2025), a heavy rain event with more than 20 mm per day was captured providing insights into nutrient transport along the chain of lakes. A feature selection algorithm (Boruta) was applied to identify the key parameters that affect the limiting nutrient in the Grunewald chain of lakes. The limiting nutrient is described by the TN:TP ratio, also known as Redfield ratio, and categorized as phosphorus limited, nitrogen limited and co-limited. In this study, an investigation about the variation of the measured parameters as well as the TN:TP ratio along the chain of lakes and the dependency of the season is conducted in addition to the Boruta feature selection. This study reveals the relevance of temperature, volume ratio, depth and phosphorus concentrations affecting the TN:TP ratio of the lakes and how water quality of the lakes are affected by each other. The study gives insights to cascading effects on nutrient accumulation along a chain of lakes, providing guidance for further management practices.

How to cite: Radtke, C., Heinemann, N., Höring, A., and Schröter, K.: Identification of Key Water Quality Drivers in the Grunewald Chain of Lakes, Berlin, EGU General Assembly 2026, Vienna, Austria, 3–8 May 2026, EGU26-2779, https://doi.org/10.5194/egusphere-egu26-2779, 2026.

Urban underground spaces are highly vulnerable to flooding due to their complex, multi-level configurations and limited drainage capacity. Although numerous numerical models have been proposed to simulate inundation processes in underground environments, their reliable development and application remain constrained by the lack of reference data for validating model structure and reproducibility. In particular, few studies have systematically investigated inundation behavior within the same underground space under varying inflow locations, numbers of inlets, and discharge conditions. This study presents the development of a two-dimensional surface–underground integrated flood model based on the shallow water equations, with the aim of reproducing inundation processes in complex underground spaces. The model was formulated to represent inflow, internal propagation, and drainage processes within underground spaces in a unified computational framework. Unlike conventional approaches that treat underground spaces as lumped storage elements or simplified links, the proposed model resolves underground spaces as two-dimensional hydraulic domains, allowing lateral flow propagation and spatial water-depth distributions to be explicitly simulated. Physical hydraulic experiments were employed to support model verification and to provide controlled reference conditions for quantitative evaluation. Model validation was conducted using laboratory-scale hydraulic experiments performed with the Kyoto Oike underground space facility (1/30 scale) at the Disaster Prevention Research Institute, Kyoto University. Steady-state inflow conditions were considered at 16 surface–underground connection points, including both single-inlet and sequential multi-inlet configurations. A total of 93 experimental cases were designed by applying constant inflow rates of 100, 200, and 400 mL/s while progressively increasing the number of active inlets. Final water depths, inundation extents, and dominant outflow pathways were measured after steady conditions were reached and were directly compared with numerical results under identical geometrical and boundary conditions. The comparison results demonstrate that the developed model can reasonably reproduce inundation propagation and drainage behavior within complex underground spaces under varying inflow locations, inlet numbers, and discharge levels. Through this study, a numerical model for analyzing inundation processes in complex underground spaces was developed, and the proposed model is expected to support future underground flood risk assessment and evacuation planning in urban environments.

How to cite: Song, I. and Lee, S.: Development of Complex Underground Space Inundation Model based on Laboratory Scale Experimental Data, EGU General Assembly 2026, Vienna, Austria, 3–8 May 2026, EGU26-3245, https://doi.org/10.5194/egusphere-egu26-3245, 2026.

     Recent precipitation extremes have shattered historical records over the Beijing-Tianjin-Hebei (BTH) region, causing devastating losses of life and property. While climate change is expected to increase the probability of precipitation extremes, how the frequency and intensity of rarest events will change remains unclear. Here, we develop an integrated framework combining long-term observations, large-ensemble Earth system simulations, and convection-permitting regional modeling to project the likelihood and magnitude of such “rareness” precipitation events. Using the Community Earth System Model Large Ensemble (CESM2-LE), we find that the likelihood of regional events comparable to the July 2023 BTH extreme precipitation event (“23.7 BTH” event) increase by 159% under the SSP3-7.0 scenario, primarily driven by thermodynamic intensification linked to more frequent moisture-abundant conditions. We further find that the local intensity of the most extreme future storms may increase by approximately 30%, with hourly precipitation rate nearly doubling. Our framework provides a robust pathway to quantify the frequency and magnitude of unprecedented regional extremes, offering critical implications for flood management, hazard mitigation, and climate adaptation planning.

How to cite: Pei, L., Miao, S., Zhao, L., and Chen, D.: Intensified future regional record-shattering precipitation events from convection-permitting ensemble downscaling, EGU General Assembly 2026, Vienna, Austria, 3–8 May 2026, EGU26-3709, https://doi.org/10.5194/egusphere-egu26-3709, 2026.

EGU26-6353 | ECS | Orals | HS5.4.2

Increased groundwater recharge due to localized infiltration from impervious surfaces in an urban area 

Kateřina Šabatová and Jiří Bruthans

Groundwater recharge in urban areas is generally accepted to differ from that in natural landscapes. However, due to numerous artificial influences on groundwater recharge, it is often difficult to predict the groundwater recharge without proper monitoring. Meanwhile, data from urban areas is scarce because most built-up sites consist of private property where data collection is challenging. This is particularly problematic for settlements with individual water supply in hardrock regions, as they are highly dependent on local groundwater resources. Furthermore, the availability of groundwater in those areas is often threatened by the ongoing climate change.

We evaluated the impact of localized infiltration of rainwater from impervious surfaces on groundwater recharge in a small settlement in Czechia. As the settlement has no public water supply or wastewater collection, the only artificial influences on water balance are withdrawal from domestic wells, irrigation and rainwater discharge on individual estates. Therefore, localized infiltration can be observed with as little disturbance as possible. We monitored water table level in a well, and installed a piezometer next to an outlet from rainwater drainage of a house roof to observe the localized infiltration independently. Two lysimeters were installed at the site – one 35 cm deep with cut grass and one 94 cm deep with shrubs. They confirmed that evapotranspiration significantly reduces the amount of groundwater recharge in gardens. The profiles with grass and shrubs consumed 68% and 95% of precipitation, respectively. During a 2-year monitoring period, water percolated to the bottom of the deeper lysimeter very few times – only in winter or after extreme rainfall. Despite that, water table in the well rose even when there was no recharge through the soil profile with vegetation. As the water table rises corresponded to peaks in the piezometer, it is evident that they were caused by the localized infiltration from the rainwater drainage. We estimated groundwater recharge inside and outside the settlement using Water table fluctuation method and Soil moisture deficit model (Šabatová et al., 2025), and also compared it to an existing regional study of groundwater recharge. Our results suggest that groundwater recharge enhanced by the localized infiltration can be up to 4 times higher than natural recharge. Thus, localized infiltration from impervious surfaces can substantially improve the water balance in built-up areas. This is especially valuable in dry periods, because the localized infiltration appears to percolate rapidly, avoiding capture for evapotranspiration. Therefore, allowing the rainwater from impervious surfaces to infiltrate can contribute significantly to counter the increasing drought related to the climate change, especially in hardrock areas where groundwater is of local origin.

References

Šabatová, K., Bruthans, J., Weiss, T., 2025. New groundwater recharge model for water table fluctuation method calibration using easily available data. Journal of Hydrology 661, 133685. https://doi.org/10.1016/j.jhydrol.2025.133685

Acknowledgements

Contribution was supported by project SS02030040 "PERUN - Prediction, Evaluation and Research for Understanding National sensitivity and impacts of drought and climate change for Czechia", co-financed with state support of the Technology Agency of the Czech Republic as part of the Program Environment for Life.

How to cite: Šabatová, K. and Bruthans, J.: Increased groundwater recharge due to localized infiltration from impervious surfaces in an urban area, EGU General Assembly 2026, Vienna, Austria, 3–8 May 2026, EGU26-6353, https://doi.org/10.5194/egusphere-egu26-6353, 2026.

As climate change intensifies, urban areas are increasingly exposed to compound hydro-climatological extremes, including heat waves, pluvial flooding, droughts, and associated thermal and health stresses. These hazards are interconnected, and their impacts are modulated by socio-demographic factors (e.g. age structure, population density), urban form (e.g. imperviousness, ventilation corridors), and pre-existing environmental burdens such as air pollution and noise. Understanding these impact chains is essential for identifying where adaptation measures can most effectively reduce vulnerability.

Nature-based Solutions (NbS), including unsealing, green infrastructure, and decentralized stormwater retention, have demonstrated substantial potential to simultaneously mitigate heat and flood impacts. Despite their proven benefits, implementation in Berlin remains fragmented and spatially limited, with measures typically realized as isolated projects rather than strategically located where their effectiveness would be highest.

This study identifies priority locations for NbS implementation by integrating multi-criteria indicators: pluvial flood risk, environmental burdens (air pollution, noise, thermal stress), and socio-demographic development. Using population projections for Berlin until 2040 combined with the Environmental Justice Atlas, the Friedrichshain district was identified as exhibiting elevated vulnerability to hydro-climatological extremes.

The district is characterized by continued population growth (+2.1 % by 2040), the highest projected increase in average age across Berlin (from 38.9 to 41.6 years), high surface sealing (~70 %), limited green infrastructure, and pronounced thermal load. These characteristics make the district particularly susceptible to compound flood and heat hazards and a representative case for highly built-up environments.

Building-scale pluvial flood risk was assessed using the 2D shallow water model hms++, simulating a 100-year precipitation event (48.8 mm in 1 hour). Mesh resolutions of 2×2 m, 4×4 m, and 8×8 m were compared to analyze flood extent and volumes while balancing model precision and computational efficiency. Flooding hotspots were identified using the unsupervised clustering algorithm DBSCAN, enabling robust detection of clusters with varying shapes and densities. Results reveal major flooding clusters in the south-western study area, particularly at sealed crossroads with limited infiltration capacity and high cumulative environmental burdens. Initial scenario analyses demonstrate that selective unsealing of public spaces (schoolyards, parking areas) can substantially reduce total flood volume (-6 % at 8×8 m; -44 % at 2×2 m) and inundated area (-4 % at 8×8 m; -35 % at 2×2 m) in the largest clusters.

Future work will incorporate time-varying infiltration and evapotranspiration schemes to capture wetting-drying cycles, vegetation dynamics, cooling effects of blue-green infrastructure, and potential drought stress. The proposed framework supports integrated assessment of flood-heat-drought interactions and provides evidence-based guidance for climate adaptation strategies in vulnerable urban districts.

How to cite: Ölmez, C. and Hinkelmann, R.: Perspectives on Target-Oriented NbS/BGI Interventions through Integrated Hydrodynamic Modeling and Social Indicators, EGU General Assembly 2026, Vienna, Austria, 3–8 May 2026, EGU26-7198, https://doi.org/10.5194/egusphere-egu26-7198, 2026.

EGU26-8016 | ECS | Posters on site | HS5.4.2

A heavy tailed distribution for Combined Sewer Overflow spill durations driven by infilitration 

Alex Lipp and Barnaby Dobson

Combined sewer overflows (CSOs) are a major source of untreated wastewater discharge into urban water bodies during periods of excess flow, posing significant environmental and public health risks. Using approximately four million CSO spill events recorded by Event Duration Monitors across England (2020-2024), we analyze the statistical distribution of spill durations to better understand the stresses applied to urban watersheds from CSOs. Our results reveal a strongly heavy-tailed distribution: while spills exceeding two hours represent only ~10% of events, they account for ~85% of total spill time, indicating potentially disproportionate ecological impact from long-duration spills. Likelihood ratio tests confirm that this distribution is best described by a stretched exponential (Weibull) model with a shape parameter of 0.15, a finding consistent across multiple subsettings of our dataset. Periodic deviations from this trend correspond to diurnal water-use cycles, with elevated probabilities of a spill lasting near integer multiples of 24 hours. Hydraulic modeling reproduces the observed heavy tail only when groundwater infiltration is included, suggesting that prolonged spills are primarily driven by infiltration into sewer networks rather than extreme precipitation. Furthermore, we show that the observed scaling can be approximated statistically by first passage times of a sewer head modeled as fractional Brownian motion. Given the outsized environmental impact of long-duration spills, we recommend incorporating tail behavior explicitly into hydraulic model calibration and propose using stretched exponential parameters as robust metrics for CSO performance assessment.

How to cite: Lipp, A. and Dobson, B.: A heavy tailed distribution for Combined Sewer Overflow spill durations driven by infilitration, EGU General Assembly 2026, Vienna, Austria, 3–8 May 2026, EGU26-8016, https://doi.org/10.5194/egusphere-egu26-8016, 2026.

EGU26-8995 | ECS | Posters on site | HS5.4.2

Urban Water Cycle Responses to Extreme Precipitation: Contaminant Mass Balance, Redistribution, and Transfer to Groundwater 

Janja Svetina, Joerg Prestor, Martin Gaberšek, and Mateja Gosar

Urban areas are characterised by continuous emissions of particulate matter from multiple anthropogenic sources, which accumulate mainly on impervious surfaces such as roads, parking areas, and rooftops. During precipitation events, especially extreme rainfall, these accumulated contaminants can be mobilised and redistributed throughout the urban water cycle. This study examines contaminant mass balance and redistribution during extreme precipitation at the scale of the urban water cycle in the regional pilot-case aquifer. Understanding these processes is essential for evaluating the effectiveness and long-term risks of infiltration-based stormwater management.

A multi-compartment sampling strategy is being implemented within an urban catchment to capture the key reservoirs and fluxes governing contaminant transfer within the system. Precipitation is sampled to characterise atmospheric washout, while street dust serves as an integrated record of contaminant accumulation on impervious surfaces. Surface runoff from sealed areas is monitored at gully pots, followed by sampling of water percolating through infiltration and filtration layers of the stormwater retention system. Groundwater quality is statistically evaluated at selected monitoring wells to assess aquifer response. In parallel, recharge inputs from the aquifer hinterland, including river infiltration, are characterised to constrain background groundwater conditions.

Water samples are being analysed for physicochemical parameters and dissolved contaminants, while solid phases from precipitation, runoff, and dust are chemically, mineralogically, and morphologically characterised to identify dominant particulate contaminant carriers. These datasets provide the basis for developing a conceptual mass-balance model describing contaminant transfer across the air–surface–soil–groundwater continuum.

Preliminary results indicate that a substantial fraction of contaminants mobilised during rainfall events is initially retained within soils and filtration media, thus limiting direct transfer to groundwater. However, this retention capacity is finite and strongly depends on contaminant loads, soil properties, and hydrological conditions. In areas affected by spatially localised industrial hotspots, extreme precipitation and associated leaching processes may act as effective triggers for contaminant release and downward transport once storage capacities are exceeded. These findings highlight the need to determine when soils and infiltration systems serve as effective buffers and when they facilitate contaminant transfer. This distinction is critical for evaluating the long-term performance of infiltration-based urban water management strategies and assessing groundwater vulnerability under climate change–related extreme precipitation regimes.

How to cite: Svetina, J., Prestor, J., Gaberšek, M., and Gosar, M.: Urban Water Cycle Responses to Extreme Precipitation: Contaminant Mass Balance, Redistribution, and Transfer to Groundwater, EGU General Assembly 2026, Vienna, Austria, 3–8 May 2026, EGU26-8995, https://doi.org/10.5194/egusphere-egu26-8995, 2026.

EGU26-9068 | ECS | Posters on site | HS5.4.2

Cobalt and nickel removal from urban and industrial wastewaters using sustainable synthetic carbonates 

Ginevra Sbardella, Caterina De Vito, Paolo Ballirano, Matteo Paciucci, and Silvano Mignardi

Urban and industrial wastewater often contains high concentrations of heavy metals, which are among the most harmful pollutants due to their toxicity, persistence, and negative effects on both biological systems and human health. This study investigates the efficiency of Co and Ni removal from aqueous solutions using synthetic Mg-carbonates produced through a CO₂-mineralization process, in which anthropogenic CO₂ reacts with MgCl₂ solutions. The open-high reactive structure of amorphous magnesium carbonates (AMCs) promotes rapid Co/Ni uptake through adsorption and ion-exchange mechanisms, offering a low-energy and sustainable remediation strategy for contaminated urban and industrial effluents. Batch experiments were conducted using Co and Ni solutions from 50 to 1000 mg/L, reacted with 0.1 g of AMCs for interaction times ranging from 20 minutes to 4 weeks at ambient pressure and temperature. The residual solutions were analyzed by ICP-AES to quantify removal efficiency and Mg release, whereas solid products were examined using SEM-EDS and XRPD to assess morphological and mineralogical transformations. The Co removal experiments provided a coherent dataset across analytical techniques and revealed a critical threshold of ~250 mg/L, marking the transition between two distinct removal regimes. Below the concentration 50–150 mg/L, morphological transformation is rapid and highly efficient, with AMC dissolution and reprecipitation as Co-carbonates occurring within a few hours and removal efficiencies reaching up to ~99% after four weeks. At concentrations ≥250 mg/L, removal remained significant (up to ~75%) but was characterised by slower kinetics and incomplete equilibrium within the experimental time. The correlation between the moles of Co removed and Mg released showed that at short times (0–3 h) the process was dominated by adsorption on AMC surfaces, whereas at longer times (24 h–4 w) ion exchange progressively prevailed, leading to nearly 1:1 Co–Mg stoichiometry. The transition between these mechanisms occurred earlier at higher Co concentrations. XRPD data confirmed structural reorganisation and the precipitation of new Co-bearing carbonate phases throughout the process. Preliminary Ni experiments indicate comparable trends, confirming that AMCs exhibit similar reactivity and removal mechanisms toward both metals. Overall, these results show that CO₂-derived synthetic Mg-carbonates offer an effective, low-energy and scalable solution for Co and Ni removal from contaminated waters, with clear relevance for urban and industrial water management. Their reactivity and sustainability, combined with the strategic value of Co and Ni as critical raw materials, highlight the potential of this approach for future resource-recovery applications.

How to cite: Sbardella, G., De Vito, C., Ballirano, P., Paciucci, M., and Mignardi, S.: Cobalt and nickel removal from urban and industrial wastewaters using sustainable synthetic carbonates, EGU General Assembly 2026, Vienna, Austria, 3–8 May 2026, EGU26-9068, https://doi.org/10.5194/egusphere-egu26-9068, 2026.

Evaporation from rainfall intercepted by the urban canopy layer (Ei) is a key but highly uncertain component of urban water and energy balances, with important implications for runoff generation and stormwater management. Quantifying Ei remains challenging due to the strong spatial heterogeneity of urban vegetation and impervious surfaces, as well as the difficulty in separating interception evaporation from other evaporation components during wet periods. In this study, we develop and validate a Reference-based Urban Evaporation Partitioning (RUEP) framework to quantify urban canopy interception evaporation by integrating multi-source observations with data-driven modeling. The proposed framework combines a hybrid machine learning model (HM_Ets) and a deep learning model (ML_Ei). HM_Ets is trained using dry-period observations to estimate total non-interception evaporation, including transpiration and soil evaporation (Ets), and is subsequently applied to wet periods. Interception evaporation (Ei) is derived as the residual between observed wet-period evaporation and modeled Ets, and is further simulated using ML_Ei. The framework is evaluated using multi-source datasets from an urban flux site in Vancouver, Canada, including eddy covariance flux measurements, meteorological observations, remote sensing products, and GIS-derived urban morphology data. Results demonstrate that the RUEP framework effectively reproduces both Ets and Ei dynamics, with R² values of 0.80 and 0.90 and Nash–Sutcliffe efficiencies of 0.55 and 0.81 for dry and wet periods, respectively. Event-based interception ratios (Ei/P) exhibit pronounced seasonal variability, peaking in autumn (0.47) and reaching minimum values in spring (0.09), while Ei/E ratios peak in spring (0.14) and are lowest in autumn (0.08). At the street-block scale, Ei shows strong spatial heterogeneity and a non-monotonic “high–low–high” pattern along the combined normalized difference vegetation index (NDVI) and impervious surface fraction (ISF) gradient. Areas with either high vegetation cover or large impervious fractions exhibit elevated Ei, with vegetation height further modulating Ei under high-NDVI conditions. Random forest analysis identifies wind speed, vegetation structure (NDVI and vegetation height), and precipitation characteristics as the dominant controls on urban interception evaporation. Overall, the proposed RUEP framework provides a practical approach for quantifying interception evaporation in heterogeneous urban environments, offering new insights for improving urban hydrological modeling and supporting vegetation-informed stormwater management and urban design.

How to cite: Zhou, L. and Cheng, L.: A Reference-based Urban Evaporation Partitioning framework for urban interception estimation using multi-source observations, EGU General Assembly 2026, Vienna, Austria, 3–8 May 2026, EGU26-9159, https://doi.org/10.5194/egusphere-egu26-9159, 2026.

EGU26-10107 | ECS | Orals | HS5.4.2 | Highlight

Cities under pressure: a global review of urban water scarcity governance 

Merel Laauwen, Johanna Koehler, and Mary Greene

Urban water scarcity is increasingly recognized as one of the most pressing challenges facing urban watershed management, driven by the compounding effects of climate change and rapid urbanization. Day Zero events, in which municipal taps run dry, have exposed critical vulnerabilities not only in physical infrastructure but in urban governance and social equity. While hydrological research often focuses on physical scarcity, this research argues that understanding urban watershed dynamics requires a systematic integration of social and institutional dimensions. This study presents a systematic literature review of three decades (1995–2025) of peer-reviewed social science research on urban water shortages involving rationing and emergency measures. Analyzing 69 articles from 1,295 records, the study tracks the evolution in research focus. Findings show shifts in disciplinary and methodological approaches, proposed coping strategies (technocratic versus sociocratic), levels of analysis, and water crisis framing. The review highlights that research is heavily clustered around several highly publicized water crises, notably Cape Town’s “Day Zero” (2015-2018), Australia’s Millennium Drought (2000s), and the Brazilian Drought (2014-2017). By synthesizing insights, the review identifies key gaps in integrated approaches for studying urban watersheds. It concludes that advancing urban water management research requires connecting hydrological processes with social-political drivers, to inform policy approaches that address scarcity not only as a technical challenge but as a fundamentally social and political issue.

How to cite: Laauwen, M., Koehler, J., and Greene, M.: Cities under pressure: a global review of urban water scarcity governance, EGU General Assembly 2026, Vienna, Austria, 3–8 May 2026, EGU26-10107, https://doi.org/10.5194/egusphere-egu26-10107, 2026.

EGU26-10622 | ECS | Posters on site | HS5.4.2

Assessment of Urban Water Environment Resilience and Vulnerability: Hsintien River Watershed in Taiwan 

Li-Wen Chang, Chia-Ling Chang, and Shien-Tsung Chen

The Hsintien River is a major watershed for water supply in Northern Taiwan, where high population density and urbanization have led to a complex water environment. Therefore, this study aims to develop a water environment resilience assessment framework applicable to Taiwan by integrating "Water Quality–Quantity–Social Nexus" to examine long-term resilience changes. The results show that upstream resilience is mainly influenced by flow conditions, whereas downstream resilience is constrained by high population density and pollution base loads, leading to insufficient dilution effects. Using the extreme drought event of 2020–2021 as a case study, shows that while the upstream reach maintained a stable recovery of resilience, the downstream reach failed to exhibit resilience due to increased ammonia nitrogen (NH₃–N) concentrations resulting from diminished self-purification. In highly urbanized river reaches, observed resilience patterns are not fully explained by flow conditions alone but are also influenced by pollution pressures associated with urbanization.

How to cite: Chang, L.-W., Chang, C.-L., and Chen, S.-T.: Assessment of Urban Water Environment Resilience and Vulnerability: Hsintien River Watershed in Taiwan, EGU General Assembly 2026, Vienna, Austria, 3–8 May 2026, EGU26-10622, https://doi.org/10.5194/egusphere-egu26-10622, 2026.

EGU26-12147 | ECS | Orals | HS5.4.2

Towards Accurate Urban Pluvial Flood Predictions: IBER–SWMM Application in Sampierdarena, Italy 

Marzia Acquilino, Ilaria Gnecco, Anna Palla, Marcos Sanz-Ramos, Beniamino Russo, and Giorgio Boni

Urban pluvial flooding has emerged as a critical challenge for contemporary cities, driven by rapid urbanization, ageing drainage infrastructure, and increasingly intense rainfall events. Reliable modelling of such floods is essential for risk assessment, urban planning, and mitigation strategies’ design. However, model performance is highly sensitive to input data quality, particularly topographic information governing overland flow and the description of drainage system. Despite their recognized importance, those kinds of input data are frequently selected based on availability rather than systematic evaluation, resulting in potential inaccuracies in flood predictions.

This research examines the influence of input data quality and preprocessing on urban pluvial flood simulations, with a specific focus on 1D-2D coupled modelling. An integrated modelling framework combining IBER for surface flow (2D) and SWMM for drainage  dynamics (1D) is adopted to explicitly represent the interactions between overland runoff and underground drainage systems. Particular attention is given to how terrain representation affects surface–subsurface exchanges, including flow concentration, inlet efficiency, and drainage surcharge behaviour, while the drainage network system is analysed focusing solely on the primary stormwater drainage network, modelled as 137 conduit links, 3 outfall and 137 junction nodes.

The study is conducted in the densely urbanized portion of Sampierdarena district of Genoa, Italy (1.43km2), an area frequently affected by pluvial flooding. Initial simulations are performed using the 2D IBER model under controlled conditions, applying a synthetic Chicago hyetograph with a duration of 1 hour, a time-to-peak ratio of 0.5, and a return period of 10 years. This preliminary phase allows the isolation of terrain-related effects by comparing model results obtained from different digital terrain models (DTMs).

High-resolution LiDAR-derived DTMs were compared with coarser photogrammetric products and derivative datasets commonly employed in practice. Model outputs, including water depth, flow velocity, inundation extent, and overland flow pathways, are analysed both qualitatively and quantitatively. Results show that reduced terrain resolution and excessive smoothing of micro-topographic features significantly alter surface flow patterns, shift flood extents, and modify peak water depths. These effects are particularly critical in urban environments, where small-scale topographic features control flow routing toward drainage inlets and strongly influence surface–drainage interactions.

To overcome limitations inherent to purely 2D simulations, this study has advanced to a fully coupled 1D-2D IBER-SWMM approach enabling a dynamic and bidirectional exchange of water between the surface and the drainage network. This integrated framework explicitly accounts for inlet capacity, drainage surcharge, overflow locations, and the timing of interactions between streets and the underground system. As a result, the coupled model provides a more realistic representation of flood dynamics, improves identification of vulnerable infrastructure, and supports the assessment of adaptation measures such as green infrastructure, detention systems, and drainage network upgrades.

Overall, the research highlights the critical role of systematic terrain data selection and preprocessing within 1D-2D coupled urban flood models. The IBER-SWMM coupling constitutes the core methodological contribution, enhancing the physical consistency and predictive reliability of pluvial flood simulations and supporting more informed decision-making toward resilient urban flood management.

How to cite: Acquilino, M., Gnecco, I., Palla, A., Sanz-Ramos, M., Russo, B., and Boni, G.: Towards Accurate Urban Pluvial Flood Predictions: IBER–SWMM Application in Sampierdarena, Italy, EGU General Assembly 2026, Vienna, Austria, 3–8 May 2026, EGU26-12147, https://doi.org/10.5194/egusphere-egu26-12147, 2026.

EGU26-13132 | ECS | Posters on site | HS5.4.2

Performance Evaluation of Stormwater Drainage System Subjected to Multiple Flood Drivers 

Pravas Ranjan Pradhan and Soumendra Nath Kuiry

Urbanization is a vital catalyst for socio-economic development in developing countries, such as India. However, rapid and poorly planned urban expansion has resulted in increased vulnerability to flooding during heavy rainfall. Stormwater drainage (SWD) systems emerge as cost-effective solutions to mitigate these challenges. Many major Indian cities, including Chennai, are situated in coastal and riverbank areas. During intense rainfall in upstream catchments, rivers carry significant water to the coastal areas of the city, challenging SWD systems to efficiently discharge water at outlet points. Complicating matters, the occurrence of surges from cyclonic effects in the sea further impedes river water transport. Consequently, urban areas experience prolonged flooding due to the compound effects of multiple drivers. This study evaluates the performance of the SWD system subjected to multiple flood drivers in the coastal part of Chennai city using the freely downloadable HEC-RAS model. The assessment encompasses pluvial, fluvial, and storm surge-induced flooding scenarios. The hydrological component of the model computes runoff from the watershed, which is then input into a one-dimensional (1D) stormwater model. To address compound flooding, the 1D model is coupled with a two-dimensional (2D) hydraulic routing model, enabling the management of junction overflows onto urbanized floodplains and simulating overland flows from floodplains into junctions. The comprehensive investigation not only enhances our understanding of the effectiveness of SWD during flooding but also provides valuable insights for decision makers. The study informs decisions related to resizing or expanding the proposed SWD infrastructure, ultimately contributing to improved flood preparedness and resilience in the urban landscape.

How to cite: Pradhan, P. R. and Kuiry, S. N.: Performance Evaluation of Stormwater Drainage System Subjected to Multiple Flood Drivers, EGU General Assembly 2026, Vienna, Austria, 3–8 May 2026, EGU26-13132, https://doi.org/10.5194/egusphere-egu26-13132, 2026.

EGU26-14413 | ECS | Posters on site | HS5.4.2

Evaluating the Influence of Imperviousness on Urban Runoff and Drainage System Efficiency 

Ghulam Abbas, Alessandra Marzadri, and Giuseppe Formetta

Urbanization leads to the conversion of pervious surfaces into impervious surfaces, significantly altering the hydrological conditions of urban catchments. These changes adversely affect the conveying capacity of urban drainage systems, resulting in increased overflow and eventually increase urban flooding risk. This study aims to assess the impact of imperviousness on rain induced urban flooding and to evaluate the effectiveness of (NbS) in improving runoff management using advanced modeling techniques for a neighborhood of the Trento Municipality (Italy). To achieve these objectives, 1D/2D hydrodynamic modeling approaches was applied to simulate the runoff generation, its routing within the designed drainage system and the flooding propagation on the study area. Within the 19 sub-catchments experiencing flooding under existing conditions and extreme rainfall events, NbS, specifically green roof and bio-retention cell were applied to manage runoff.Results demonstrate the capability of the proposed NbS to reduce flooded areas, runoff volume by mimicking natural processes (i.e., delaying runoff time and promoting infiltration). Reducing the imperviousness of the study area by 6% provides a reduction of the flooded area and runoff volume by 40% and 50%, respectively.Overall, the findings confirm that increasing NbS coverage significantly enhances urban drainage efficiency and mitigates urban flooding, highlighting the importance of sustainable urban planning and green infrastructure strategies for effective flood management.

How to cite: Abbas, G., Marzadri, A., and Formetta, G.: Evaluating the Influence of Imperviousness on Urban Runoff and Drainage System Efficiency, EGU General Assembly 2026, Vienna, Austria, 3–8 May 2026, EGU26-14413, https://doi.org/10.5194/egusphere-egu26-14413, 2026.

Deep drainage tunnels face significant limitations in field-scale experimentation and high-resolution monitoring due to their structural characteristics, such as large diameters, long distances, and extreme depths. Consequently, the importance of numerical simulations for precisely evaluating sediment behavior within these tunnels is increasing. In this study, we numerically reproduced the processes of sediment transport and deposition under free-surface flow conditions using sedInterFoam, an OpenFOAM-based three-phase flow solver. Initially, the validity of the vertical-velocity and sediment-concentration profiles was established by comparison with prior hydraulic experimental data. Subsequently, the model was applied to a numerical domain based on a conceptual schematic that simplifies the overall structure of the deep drainage tunnel system. For the simulation, a representative cross-section was established with a top width (B) of 0.60 m and a depth-to-width ratio (H/B) of 4. A total of 27 scenarios were configured, using flow rate, inflow sediment concentration, and invert cross-sectional shapes (U-shaped, trapezoidal, and base-type) as design variables, to perform a sensitivity analysis of their impact on sediment management efficiency (η manage). The efficiency index (η manage) was defined as the ratio of the sum of the mass discharged at the tunnel outlet (M outlet) and the mass captured in the sump (M sump) to the total sediment mass entering the system (M inflow). The results indicated that, compared with the base section, both the U-shaped and trapezoidal sections facilitated the formation of a continuous low-velocity zone at the center of the invert, resulting in a thick central sediment bed and stable capture performance. Furthermore, the sensitivity analysis revealed that the cross-sectional shape is the most dominant factor influencing variations in sediment management efficiency. These findings provide a quantitative basis for selecting optimal cross-sectional geometries and dimensions during the design phase of deep drainage tunnels. They are expected to contribute to the establishment of proactive maintenance strategies during the operational phase.


Keywords: Deep stormwater drainage tunnel, Sediment management efficiency, SedInterFOAM, Multiphase flow


Acknowledgement: This work is financially supported by Korea Ministry of Climate, Energy, Environment(MCEE) as 「Technology development project to optimize planning, operation, and maintenance of urban flood control facilities)(RS-2024-00397821)」.

How to cite: Lee, Y., Jeong, C., Kim, K., and Lee, S.: Sensitivity Analysis of Sediment Deposition Characteristics and Management Efficiency in Deep Drainage Tunnels Based on Invert Geometries Using OpenFOAM , EGU General Assembly 2026, Vienna, Austria, 3–8 May 2026, EGU26-15097, https://doi.org/10.5194/egusphere-egu26-15097, 2026.

Due to recent climate change, urban flood damage is increasing. Current urban flood prediction has been mainly conducted by performing numerical simulations for various return period scenarios and producing inundation maps based on the results. However, this method has disadvantages in that it is difficult to predict arbitrary rainfall events or intermediate frequencies that can occur other than the fixed scenarios, and it is difficult to respond in real-time because the computation time of numerical simulations is significantly long. Therefore, to overcome these challenges, this study developed a 'scientific interpolation method' to estimate urban inundation maps for arbitrary frequencies by leveraging pre-constructed flood scenario data. We utilized simulation results from a self-developed Python-based urban flood model as a benchmark to derive the fundamental governing equations and related parameters. An Inverse Analysis technique was applied to mathematically reconstruct the non-linear relationship between rainfall frequency and inundation depth. Consequently, the inundation depths and extents for arbitrary frequencies interpolated through the derived equations showed a high spatial correlation with the physics-based model results with R2= 0.9. By integrating discrete scenario maps through this interpolation scheme, the proposed method enables rapid flood prediction without the need for repetitive numerical simulations. This approach is expected to significantly enhance the capability for immediate decision-making and response against sudden urban flood disasters.

How to cite: Kim, J., Song, S., Kim, K., and Lee, S.: Development of Scientific Interpolation Method for Urban Inundation Maps of Arbitrary Return Periods Based on Pre-Simulated Scenarios, EGU General Assembly 2026, Vienna, Austria, 3–8 May 2026, EGU26-15412, https://doi.org/10.5194/egusphere-egu26-15412, 2026.

Marsh Creek in Oakley, CA was once a naturally, intermittent creek that ran from the foothills of Mt. Diablo to Dutch Slough and into the San Francisco Estuary (Contra Costa Resource Conservation District, n.d.). It contained several native fish species, whose ranges were dispersed across varying aquatic habitats. Over time, the creek has been dammed and diverted for agricultural and recreational purposes. Today, only a few sections of intermittent and small, perennial streams remain in the foothills. The lower section of the creek has become channelized, receives perennial flow from a wastewater treatment plant, and the Marsh Creek Reservoir. These anthropogenic modifications have facilitated the creation of a novel ecosystem, where the remaining native aquatic community assembly blends with introduced, non-native species. 


Despite being modified, we detected regional species of concern such as Sacramento Hitch (Lavinia exilicauda) and Chinook Salmon (Oncorhynchus tshawytscha) using Marsh Creek as habitat. To determine how Marsh Creek serves as habitat for these native fish, we plan to utilize GoPro video surveys and clover/minnow traps to assess species abundance and habitat heterogeneity at sample sites. Macroinvertebrate and YSI samples will be collected to characterize water quality and identify invertebrate community assemblage. Visual observations are planned to be used to observe breeding behavior and abundances of chinook salmon and Sacramento hitch adults. This study seeks to provide insight into the persistence of native fish in novel ecosystems and the influence stream modification can have on aquatic communities in Central California. 


How to cite: Long, C. and Durand, J.: Trends of Native & Non-Native Fish Communities in an Urban Creek (Marsh Creek, California) , EGU General Assembly 2026, Vienna, Austria, 3–8 May 2026, EGU26-15672, https://doi.org/10.5194/egusphere-egu26-15672, 2026.

EGU26-15941 | ECS | Orals | HS5.4.2

Strategic database for the diagnosis and prognosis of hydrogeological conditions in a highly populated volcanic watershed in Central Mexico 

Zaida Martinez Casas, Oscar Escolero Fuentes, Eric Morales Casique, Selene Olea Olea, Juan Camilo Montaño Caro, Priscila Ortega Medina, and Sandra Blanco Gaona

Intensive groundwater extraction in Central Mexico, driven by the increasing demand from population growth, exerts significant pressure on the hydrogeological system. This has led to sustained declines in piezometric levels and a deterioration of the chemical quality of the water produced by wells all around the entire watershed. Adequate watershed management requires comprehensive information to understand its behavior.

In this regard, the objective of this work is to compile hydrogeological data for a volcanic watershed that hosts one of the world's largest cities: the Basin of Mexico. The methodology consisted of consulting, collecting, and processing various databases from the National Water Commission (CONAGUA), the National Autonomous University of Mexico (UNAM), and various technical studies.

The result is a groundwater compendium with data from 1960 to 2022, providing a technical analysis of changes in water levels and chemical composition associated with groundwater use. Additionally, it contains physiographic, edaphological, geological, and climatological information, along with lithological columns, isotopic, hydrogeological, and hydrogeochemical data. It also includes the locations of wastewater discharge sites, treatment and drinking water plants, deep wells, protected natural areas, the piezometric monitoring network, the delimitation of hydrological-administrative regions, administrative aquifer boundaries, and the delimitation of the regional flow system. Furthermore, all the data is available for visualization with a Geographic Information System (GIS).

Finally, establishing a database and a subsequent diagnosis of hydrogeological information is of vital importance. It allows for the identification of areas of opportunity to improve our knowledge of the watershed and enables the proposal and definition of necessary works, such as the construction of piezometers, water level monitoring, and chemical and isotopic analyses, among others. All these elements are highly valuable for decision-making regarding management, infrastructure construction, and monitoring.


How to cite: Martinez Casas, Z., Escolero Fuentes, O., Morales Casique, E., Olea Olea, S., Montaño Caro, J. C., Ortega Medina, P., and Blanco Gaona, S.: Strategic database for the diagnosis and prognosis of hydrogeological conditions in a highly populated volcanic watershed in Central Mexico, EGU General Assembly 2026, Vienna, Austria, 3–8 May 2026, EGU26-15941, https://doi.org/10.5194/egusphere-egu26-15941, 2026.

EGU26-18223 | Orals | HS5.4.2

Shallow Groundwater Dynamics in Urban Environments: The Crucial Role of Capillary Forces 

Søren Thorndahl, Ida Kemppinen Vester, Jesper Ellerbæk Nielsen, and Per Møldrup

In urban areas, a high groundwater table can cause problems such as groundwater flooding, unintended infiltration into sewer and drainage systems, and infrastructure damage. These challenges are further intensified by climate change, underscoring the need for improved water management in low-elevation urban areas. Developing solutions depends on a detailed understanding of groundwater‑level dynamics, which constitute the core of this research.

Recent research based on urban groundwater monitoring sites in Denmark has shown that shallow groundwater varies seasonally far more than deeper groundwater. Furthermore, it is shown that shallow groundwater levels may abruptly rise by 50–150 cm as an immediate response to rainfall. The explanation for the extreme dynamics is identified as the capillary fringe zone, which becomes fully saturated in response to infiltrating rain. In the capillary fringe zone just above the normal groundwater level, the capillary forces are stronger than the gravitational forces, leaving this transition zone nearly saturated. Under the impact of infiltrating rain, the saturation of the capillary fringe zone results in a change in pore water pressure from negative to positive and thus an observable change in the groundwater table.

In areas with shallow groundwater, the magnitude of these significant groundwater level increments can be critical for triggering groundwater flooding or unintended infiltration into sewer systems and drainage infrastructure. Moreover, observations have shown that in clayey soil types, the groundwater level can remain elevated for days to weeks after rainfall, whereas in sandy soils, the groundwater levels return to their original state much more quickly.

Understanding these dynamics requires greater knowledge of infiltration processes, the unsaturated zone, and, in particular, the capillary fringe zone, which in many cases is neglected in the estimation of groundwater level variability.

In this work, we present analyses of time series of groundwater head, soil moisture, and rainfall, and link observed rainfall-response to physical and hydraulic soil properties. Furthermore, we propose the development of a one-dimensional modelling concept of the vadose zone based on the Darcy flow equation integrated with respect to soil depth and combined with an explicit finite-difference solution of the continuity equation. The model is demonstrated to simulate the dynamics of groundwater head as a response to rainfall for different soil types. Accordingly, the study aims to model potential groundwater variability as a function of multiple soil‑properties, providing a basis for subsequent risk assessment related to shallow groundwater in urban areas.

How to cite: Thorndahl, S., Vester, I. K., Nielsen, J. E., and Møldrup, P.: Shallow Groundwater Dynamics in Urban Environments: The Crucial Role of Capillary Forces, EGU General Assembly 2026, Vienna, Austria, 3–8 May 2026, EGU26-18223, https://doi.org/10.5194/egusphere-egu26-18223, 2026.

EGU26-18477 | Posters on site | HS5.4.2

Urban hydrology challenges and solutions: insights from the Birmingham Urban River Observatory 

David Hannah, Liam Kelleher, Kieran Khamis, Iseult Lynch, James White, Tahmina Yasmin, Wouter Buytaert, Ben Howard, and Stefan Krause and the SMARTWATER

Urbanisation and climate change are driving an increase in impervious surfaces and extreme weather events, leading to water scarcity, flooding, pollution, and significant threats to river health in cities and downstream watersheds. Stormwater management and blue-green infrastructure further influence urban hydrology, while offering opportunities for mitigation and adaptation to enhance ecosystem and societal resilience in a rapidly changing world. Advancing hydrological research on the spatial and temporal dynamics of urban water quantity and quality is critical for identifying multi-scale patterns, understanding underlying processes, and providing the evidence base for targeted, scalable, and sustainable management interventions.

Against this backdrop, the NERC-NSFGEO SMARTWATER project seeks to diagnose and manage watershed-wide pollution “hotspots” (locations) and “hot moments” (times). This interdisciplinary initiative combines environmental sensing, data science, and numerical modelling to uncover the dynamic drivers of multi-contaminant pollution. Our focus here is on findings from the Birmingham Urban River Observatory, a UNESCO Intergovernmental Hydrology Programme Ecohydrology Demonstration Site within a global network applying ecohydrology principles for sustainable watershed management. The observatory employs high-frequency, in-situ water quality monitoring across low- to mid-order streams along an urban-to-peri-urban gradient.

This overview aims to reflect on five key objectives: (1) identifying and characterising pollution dynamics using scalable field diagnostic technologies, (2) developing smart water quality monitoring networks, (3) applying data science innovations (including AI) for pollution tracking, (4) leveraging high-frequency, distributed observations to improve pollution models and predictions, and (5) collaborating with stakeholders - such as citizen scientists through Birmingham River Champion - to implement practical solutions for water quality management and planetary health.

By sharing these experiences, we aim to transform how urban water challenges are diagnosed, understood, predicted, and managed.

How to cite: Hannah, D., Kelleher, L., Khamis, K., Lynch, I., White, J., Yasmin, T., Buytaert, W., Howard, B., and Krause, S. and the SMARTWATER: Urban hydrology challenges and solutions: insights from the Birmingham Urban River Observatory, EGU General Assembly 2026, Vienna, Austria, 3–8 May 2026, EGU26-18477, https://doi.org/10.5194/egusphere-egu26-18477, 2026.

EGU26-18594 | ECS | Orals | HS5.4.2

Improvement of the Stormwater Drainage System in the Maligaon Railway Colony, Guwahati, Assam: A Case Study 

Km Luxmi, Dhruba Jyoti Sarmah, and Rajib Kumar Bhattacharjya

Urban flooding and water-logging have become recurring problems in Guwahati, Assam, India, primarily due to rapid and unplanned urbanization, high monsoonal rainfall, and degradation of natural drainage systems. The Maligaon Railway Colony, one of the most flood-prone areas of the city, frequently experiences surface inundation caused by inadequate stormwater conveyance, encroachment on natural drains, and runoff from the surrounding Kamakhya and Gotanagar hills. This study evaluates the performance of the existing stormwater drainage system of the Maligaon Railway Colony and proposes improvement measures to mitigate flooding. A detailed assessment was carried out using topographic data and hydraulic modeling in SWMM to simulate rainfall–runoff processes and drainage network behaviour under peak rainfall conditions. Initial simulations identified critical deficiencies in the existing system, particularly poor connectivity among several drainage nodes on the northern side of the railway line, leading to localized flooding. These issues were addressed through network modification and re-simulation. Two improvement scenarios were analysed, a proposed drainage system without wetland interaction and a system incorporating wetland storage effects linked to Deepor Beel. Simulation results indicate that, in the absence of wetland influence, the proposed outfall system conveys peak discharges of approximately 34 m³/s during a 2-hour rainfall event with a 5-year return period. When wetland storage is considered, the peak outflow is reduced to about 20 m³/s, demonstrating a substantial attenuation of flood peaks. The findings highlight the importance of preserving and integrating wetlands into urban drainage planning. The study provides practical design recommendations for improving drainage efficiency, reducing flood risk, and promoting sustainable stormwater management in the Maligaon Railway Colony.

How to cite: Luxmi, K., Jyoti Sarmah, D., and Kumar Bhattacharjya, R.: Improvement of the Stormwater Drainage System in the Maligaon Railway Colony, Guwahati, Assam: A Case Study, EGU General Assembly 2026, Vienna, Austria, 3–8 May 2026, EGU26-18594, https://doi.org/10.5194/egusphere-egu26-18594, 2026.

EGU26-18804 | ECS | Orals | HS5.4.2

Water Smart Cities: a Modular Modelling Framework for Nature-Based Stormwater Management in Urban Areas  

Christophe Dessers, Stéphane Champailler, Anne-Catherine Renard, Dorentina Sadrijaj, Antoine Dellieu, Paulus Paulus de Chatelet, Fanny Gritten, Sébastien Erpicum, Michel Pirotton, Aurore Degré, Benjamin Dewals, and Pierre Archambeau

The design of urban neighbourhoods involves addressing a multitude of interrelated factors, which makes decision-making increasingly challenging. This complex task is further exacerbated by the steady expansion of urban areas, the increasing frequency and intensity of meteorological extremes, and the growing interest in sustainable urban drainage systems and the Nature-based Solutions (NBS). Within this context, and as part of the Water Smart Cities (WSC) European project funded by the European Regional Development Fund (ERDF), a modular software tool has been developed to rapidly assess the performance of NBS and conventional grey infrastructure for stormwater management in relatively small urban catchments. The tool is intended to support urban planners, decision-makers, and civil engineering consultancies by offering an intermediate level of modelling complexity that bridges the gap between simple spreadsheet-based approaches and highly detailed hydraulic-hydrological simulation platforms.

The software architecture is based on nodal modelling and organised into interconnected modules that address various aspects of urban water management. Hydraulic and hydrological components provide quantitative assessments, while ecosystem services and water quality aspects are represented by a combination of quantitative outputs and qualitative indicators. This modular structure enables the flexible testing and comparison of alternative urban drainage strategies, including both NBS and grey solutions, within a consistent modelling framework.

This contribution focuses on the hydraulic-hydrological solver and its applications. The solver is implemented in Python using the JAX library, and is based on an implicit numerical formulation. JAX enables just-in-time compilation, automatic differentiation for efficient Jacobian evaluation, and parallel computation on CPU and GPU architectures provided one adopts a pure functional programming paradigm using continuously differentiable model formulations. The implicit formulation improves numerical stability and ensures synchronous coupling between interacting system components, thereby avoiding artificial numerical delays.

Unlike spreadsheet-based tools, which are generally limited to volume-based evaluations, the proposed solver explicitly represents the dynamic interactions between structures and their spatial organisation. It allows the assessment of outlet regulations, pipe characteristics, spillway geometries, soil properties and . This provides design-relevant information to communicate modelling uncertainties and support planning and decision-making. Several applied case studies will be presented to showcase the implications of modelling choices and the range of design possibilities in the context of water-sensitive urban development.

Acknowledgments: The project Water Smart Cities is part of the projects portfolio SWaM@Sc, cofunded by the European Union and by the Walloon Region (ERDF)

How to cite: Dessers, C., Champailler, S., Renard, A.-C., Sadrijaj, D., Dellieu, A., Paulus de Chatelet, P., Gritten, F., Erpicum, S., Pirotton, M., Degré, A., Dewals, B., and Archambeau, P.: Water Smart Cities: a Modular Modelling Framework for Nature-Based Stormwater Management in Urban Areas , EGU General Assembly 2026, Vienna, Austria, 3–8 May 2026, EGU26-18804, https://doi.org/10.5194/egusphere-egu26-18804, 2026.

EGU26-19955 | Posters on site | HS5.4.2

Hybrid Physics-AI Approaches for Urban Flood Prediction: GPU Hydrodynamics, Data Assimilation, and AI Surrogates 

Seong Jin Noh, Bomi Kim, Hyeonjin Choi, Hyuna Woo, Yaewon Lee, and Jiwon Choi

Urban pluvial flood prediction demands rapid operational response while maintaining street-scale realism amid strong urban heterogeneity and uncertain forcings. We present a suite of hybrid physics–AI developments that address this trade-off through complementary components designed for flexible coupling and discussion. First, multi-GPU-accelerated hydrodynamic modeling reduces latency, enabling city-scale, high-resolution scenario exploration. Second, to exploit sparse and heterogeneous observations (e.g., gauges and camera-derived depths), we introduce real-time data assimilation methodologies, such as particle filtering, and multivariate geostatistical data fusion via co-kriging. The latter translates limited measurements and auxiliary covariates into spatially distributed, uncertainty-aware inundation updates. In parallel, we introduce AI surrogates to complement physical modeling: a rapid emulator trained on high-fidelity physics simulations and deep-learning super-resolution methods that bridge the scale gap between coarse forcings and street-level impacts. We conclude by discussing alternative deployment pathways for these components, evaluating key trade-offs among speed, physical consistency, observational influence, and robustness under extreme events.

How to cite: Noh, S. J., Kim, B., Choi, H., Woo, H., Lee, Y., and Choi, J.: Hybrid Physics-AI Approaches for Urban Flood Prediction: GPU Hydrodynamics, Data Assimilation, and AI Surrogates, EGU General Assembly 2026, Vienna, Austria, 3–8 May 2026, EGU26-19955, https://doi.org/10.5194/egusphere-egu26-19955, 2026.

EGU26-20194 | ECS | Orals | HS5.4.2

Evaluating integrated model structural uncertainty of aggregated urban sewershed models 

Robin Maes-Prior, Barnaby Dobson, and Ana Mijic

Aggregated sewershed models provide simulations of sewer system behaviour with relatively low computational cost and limited structural complexity. In contrast, fully distributed models, such as SWMM and Infoworks, provide detailed representations of flows within individual pipes and network infrastructure, but require extensive data for model construction and substantially greater computational resources. Sewersheds are also embedded within wider integrated water systems, interacting with hydrological processes through both inputs and outputs. Capturing these interactions introduces additional modelling complexity and motivates the use of integrated modelling approaches. Across all model types, uncertainty is inherent. In particular, structural uncertainty (arising from choices related to model formulation, process representation, and model component configuration) remains a significant challenge and is especially difficult to quantify. In this study, we examine three urban case studies in the Greater Manchester region, developing aggregated integrated models using the WSIMOD integrated modelling framework. WSIMOD enables the simultaneous representation of urban infrastructure, hydrological processes, and land use within a flexible model structure, making it well suited to integrated sewershed modelling and the exploration of alternative model configurations. We introduce and apply a novel framework to systematically explore the impacts of key modelling decisions on both model behaviour (simulated system dynamics) and performance (simulation-observation metrics). Alternative model structures were constructed to represent different modelling choices, and a series of sensitivity analyses was conducted to assess parameter sensitivities and to group model processes according to their influence on model behaviour and performance. The results provide insights into how structural modelling decisions affect aggregated sewershed model outcomes and highlight implications for integrated urban water system modelling.

How to cite: Maes-Prior, R., Dobson, B., and Mijic, A.: Evaluating integrated model structural uncertainty of aggregated urban sewershed models, EGU General Assembly 2026, Vienna, Austria, 3–8 May 2026, EGU26-20194, https://doi.org/10.5194/egusphere-egu26-20194, 2026.

EGU26-21752 | Orals | HS5.4.2

Using leaky sewers to map urban groundwater chloride contamination 

Claire Oswald, Gagan Atwal, Garrett Holmes, and Cody Ross

In many snow-affected regions, road salt application (primarily sodium chloride) has caused long-term chloride increases in streams, lakes and groundwater, negatively impacting freshwater biodiversity and drinking water quality. While regional-scale studies in Ontario, Canada have documented strong relationships between chloride concentrations and urban land use, local drivers of longitudinal stream chloride patterns within individual watersheds remain poorly understood. In Toronto’s highly urbanized Black Creek catchment, in-stream sensors reveal spatial variability in chloride, but insufficient groundwater monitoring wells prevent similar high-resolution mapping of subsurface concentrations.

Here, we leveraged leaking stormwater sewers as sampling points for shallow groundwater throughout the watershed. Water samples collected during inter-event periods in summer 2025 from storm sewer outfalls (n = 111) were analyzed for stable isotopes of oxygen and hydrogen in water and major ions. Using historical isotope signatures for groundwater, municipal water, and precipitation, we identified 70 % of the samples as likely groundwater. Among these, chloride concentrations ranged from 126 to 4,241 mg/L, all exceeding  Canada’s chronic guideline (120 mg/L). Spatial patterns indicate highest concentrations near multi-lane highways crossing the catchment, corroborating previous modelling studies. This demonstrates that leaky sewer sampling offers a novel, accessible approach for mapping shallow groundwater chloride, which is critical for understanding surface water patterns and identifying areas that are vulnerable to elevated salinity.

How to cite: Oswald, C., Atwal, G., Holmes, G., and Ross, C.: Using leaky sewers to map urban groundwater chloride contamination, EGU General Assembly 2026, Vienna, Austria, 3–8 May 2026, EGU26-21752, https://doi.org/10.5194/egusphere-egu26-21752, 2026.

EGU26-22168 | Orals | HS5.4.2

Urban trees influence stormwater quantity and quality from site to watershed scales 

Diana Karwan, Xue Feng, Lucy Rose, and Xiating Chen

Trees are found ubiquitously in urban environments and are appreciated for a range of ecosystem services. However, their ability to reduce stormwater runoff volumes – and any tradeoffs involved with nutrients and other pollutants typically carried by stormwater runoff – are largely overlooked in stormwater management practices due to lack of robust data. We undertook a three-year project to monitor tree-scale water quantity and quality fluxes and examine how these local measurements and patterns related to the watershed observations across the city of Saint Paul, Minnesota. In this conference paper, we report on our multi-year effort to quantify the effects of trees on the urban hydrologic cycle, which included measuring the stormwater interception capacity of urban trees and their contributions to coarse organic matter, nitrogen, and phosphorus fluxes, using a series of watersheds in the Saint Paul, Minnesota, USA. At the tree scale, we quantified patterns in canopy throughfall amount, transpiration, and nutrient fluxes in canopy throughfall, which relates directly to stormwater runoff generated under deciduous trees. Under most species at most sites, canopy throughfall was statistically lower than open precipitation. Transpiration rates, determined by the sapflux method, differed across individual trees, with tree health and canopy defoliation explaining some of the differences between individual trees. Canopy interception also altered throughfall nutrient concentrations and fluxes relative to open precipitation. In spring and summer seasons between 2023-2024 mean soluble reactive phosphorus (SRP) and total organic carbon (TOC) fluxes were significantly higher under ash and maple trees than in open precipitation despite lower overall water fluxes under the canopy. With this process, deciduous trees potentially contribute increased phosphorus fluxes to stormwater while leaves remain on the tree canopy. Beyond the individual tree scale, stormwater fluxes, as monitored at the watershed level, showed variation with landcover. The presence of deciduous street tree canopy in watersheds corresponded to patterns in nutrient concentrations in stormwater at the storm-event and seasonal time scales.

How to cite: Karwan, D., Feng, X., Rose, L., and Chen, X.: Urban trees influence stormwater quantity and quality from site to watershed scales, EGU General Assembly 2026, Vienna, Austria, 3–8 May 2026, EGU26-22168, https://doi.org/10.5194/egusphere-egu26-22168, 2026.

EGU26-1173 | ECS | PICO | HS5.4.3

Beyond Evolutionary Algorithms: A Scalable River-Network Approach to Water Distribution Network Design 

Surendra Kumar Sahu, Dnyanesh Borse, and Basudev Biswal

The optimal design of Water Distribution Networks (WDNs) is an NP-hard problem governed by nonlinear hydraulics and exponentially increasing discrete design choices. Conventional optimisation methods frequently struggle with computational burden, scalability limits, and premature convergence. Recent graph theory (GT) and complex network analysis (CNA) approaches offer rapid diameter assignment but rely on surrogate friction weights and lack topographic and hydraulic integration. To address these limitations, we introduce a scalable probabilistic growth algorithm inspired by the energy-minimising evolution of natural river networks. The method evaluates candidate connections using a composite metric of flow, distance, and elevation, while incorporating full hydraulic feedback by running EPANET at every iteration. The algorithm was tested on benchmark networks of increasing size, including the GoYung network, a large network with 3,558 nodes, and the 150,630-pipe VertRome network, which is beyond the computational reach of traditional evolutionary algorithms. The proposed approach achieved optimal solutions for GoYung and high-quality designs for the larger networks with significantly reduced computation times. Overall, this probabilistic framework provides an efficient, hydraulically informed, and highly scalable methodology for large-scale WDN optimisation.

How to cite: Sahu, S. K., Borse, D., and Biswal, B.: Beyond Evolutionary Algorithms: A Scalable River-Network Approach to Water Distribution Network Design, EGU General Assembly 2026, Vienna, Austria, 3–8 May 2026, EGU26-1173, https://doi.org/10.5194/egusphere-egu26-1173, 2026.

EGU26-1383 | PICO | HS5.4.3

SaaS-Based Integrated Analysis System for Deep Stormwater Tunnels to Reduce Urban Flooding 

Yeo Eun Lee, Munmo Kim, and Jong Pyo Park

Urban areas are increasingly facing the limitations of existing drainage systems due to the growing frequency and intensity of extreme rainfall caused by climate change. As underground space becomes more developed and urban infrastructure grows more complex, effective flood mitigation requires a planning tool capable of systematically evaluating large-scale drainage facilities such as deep stormwater tunnels. This study proposes a SaaS-based integrated analysis and design system that automates the entire process of rainfall–runoff simulation, tunnel operation optimization, and surface inundation assessment.

The system consists of three major components:
(1) a SWMM-based hydrologic and hydraulic simulation engine,
(2) an automated calculation module for determining the storage capacity, inlet configuration, pumping requirements, and diversion channel sizing of deep stormwater tunnels, and
(3) a cloud-based data environment for storing, managing, and visualizing large hydrologic and topographic datasets.

Input data—including terrain, catchment characteristics, sewer networks, and design storm information—are automatically processed in the cloud database. The computation server conducts repeated SWMM simulations for various rainfall scenarios, generating results related to pipe surcharge, water-level variation, and overall drainage performance. A 2D inundation model is integrated to assess surface flooding before and after the construction of a deep stormwater tunnel, enabling spatial comparison of flood reduction effects.

The system outputs include required tunnel storage volume, surcharge-prone locations, inundation depth maps, and comparative scenario analyses. Users can easily generate, modify, and store multiple design alternatives and share them within a project team. This integrated modeling environment significantly improves the efficiency of complex drainage analyses and enhances the reliability of decision-making for urban flood mitigation infrastructure.

Overall, the proposed system serves as a next-generation digital tool that supports intuitive and comprehensive evaluation of urban drainage conditions. It is expected to markedly improve the practical applicability and planning efficiency of deep stormwater tunnel projects in future urban flood management efforts.


Acknowledgements

This work was supported by Korea Environment Industry & Technology Institute(KEITI) through Technology development project to optimize planning, operation, and maintenance of urban flood control facilities, funded by Korea Ministry of Climate, Energy, Environment(MCEE)(RS-2024-00398012)

How to cite: Lee, Y. E., Kim, M., and Park, J. P.: SaaS-Based Integrated Analysis System for Deep Stormwater Tunnels to Reduce Urban Flooding, EGU General Assembly 2026, Vienna, Austria, 3–8 May 2026, EGU26-1383, https://doi.org/10.5194/egusphere-egu26-1383, 2026.

EGU26-2139 | ECS | PICO | HS5.4.3

Numerical investigation of air expulsion and transient pressurisation during rapid filling of water distribution pipelines 

M R Ajith Kumar, Prashanth Reddy Hanmaiahgari, and Martin Lambert

Controlling pressure in urban water distribution systems is a key operational challenge, as excessive pipeline pressure can lead to leaks, pipe bursts, and significant economic losses for utilities. This issue is relevant in networks with intermittent water supply, where frequent cycles of rapid filling and emptying generate transient pressures that, if not properly managed, can lead to structural damage and reduced operational reliability. This study investigates the air expulsion process and transient pressure response in a rapidly filling pipeline, with emphasis on the effect of a downstream orifice for controlled air release. A two-dimensional CFD model was developed in ANSYS Fluent using the Volume of Fluid (VOF) multiphase approach and validated against experimental measurements. The effects of orifice size and water column length on transient pressures and the associated air–water interactions were systematically examined. Results show that transient pressure behavior is strongly governed by orifice size. Without an orifice, the air-cushioning effect is maintained, leading to lower pressure peaks and smoother transients. Larger orifices promote rapid air release, weakening the cushioning effect and producing water-hammer–dominated transients with significantly higher-pressure amplitudes. In contrast, smaller orifices partially release air while compressing the trapped air until water slams against the pipe end, creating a temporary water block. In this case, the air is not fully expelled, and both cushioning and water-hammer effects occur simultaneously. These results enable the identification of orifice size ranges that control the transition between air-cushioned filling and water-hammer-dominated response for practical air-release design. The simulations also capture temperature variations in the entrapped air, providing additional insight into the thermodynamic interactions during pipeline filling and air expulsion. Overall, the numerical framework captures the full range of transient behaviours associated with rapid filling and air expulsion and offers practical guidance for designing safer filling strategies and controlling pressure in urban water pipelines.

How to cite: Kumar, M. R. A., Hanmaiahgari, P. R., and Lambert, M.: Numerical investigation of air expulsion and transient pressurisation during rapid filling of water distribution pipelines, EGU General Assembly 2026, Vienna, Austria, 3–8 May 2026, EGU26-2139, https://doi.org/10.5194/egusphere-egu26-2139, 2026.

EGU26-4808 | ECS | PICO | HS5.4.3

An Ensemble Learning Approach for Leakage Localization in Water Distribution Networks 

Ines Mastouri, Martin Oberascher, Ella Steins, Andrea Cominola, Lilia Rejeb, and Robert Sitzenfrei

Reliable and explainable leakage localization in water distribution networks (WDNs) is critical for minimizing non-revenue water, reducing inspection time, and improving the operational resilience of WDNs. Explainability is particularly important because leakage localization results directly inform high-cost and high-risk operational decisions, such as field inspections and pipe excavations, and must therefore be transparent and trustworthy to system operators. Machine Learning (ML) approaches have recently shown strong potential for leakage localization, which commonly formulated as a multi-class classification problem. In this setting, a WDN is first partitioned into different zones, and the ML model is then trained to predict the most likely zone containing the leakage. In previous work, four high-performing tree-based classifiers, including Random Forest, Gradient Boosting, XGBoost, and LightGBM, and three neural network models of increasing architectural depth (shallow NN, deep NN, and extra-deep NN) were trained and comparatively evaluated. While all implemented ML models performed well individually when the number of classes was small, their performance degraded to varying degrees as the number of classes increased. However, the differential performance across algorithms suggests potential for ensemble methods to highlight their complementary strengths. This work proposes an explainable ensemble ML framework for multi-class leak zone classification using pressure measurements that systematically combines the outputs from different ML models, thus strengthening the robustness beyond individual approaches. Building on prior evaluations of individual models, different classifiers are evaluated by integrating the outputs of multiple models using three complementary ensemble strategies: majority voting, which combines discrete leak localisation decisions; weighted averaging, which assigns reliability-based weights to individual model predictions; and stacking, where a meta-model is trained to learn how to optimally combine the outputs of several base classifiers.

Model performance is evaluated through multiple metrics including classification accuracy, precision, recall, and F1-scores, complemented by confusion matrix analysis and computational efficiency measurements. Additionally, a new metric, called Maximum Pipe Length Search (MPLS) is applied, which provides a physically interpretable measure of inspection effort on-side. MPLS quantifies the cumulative pipe length that would be inspected if operators followed the model-generated ranking of likely leakage zones until reaching the correct one. This metric bridges model predictions with actionable field strategies, offering a practical lens for utilities to compare model outputs in operational terms. This research investigates whether ensemble approaches can provide key advantages in the context of leakage localisation, including increased robustness to noisy sensor measurements, mitigation of the limitations of individual models, and improved generalisability across varying hydraulic and operational conditions.

Funding

This publication was produced as part of the "FOUND" project. This project is funded by the Federal Ministry of Agriculture and Forestry, Climate and Environmental Protection, Regions and Water Management (BMLUK) (Austria) (Project C300198).

How to cite: Mastouri, I., Oberascher, M., Steins, E., Cominola, A., Rejeb, L., and Sitzenfrei, R.: An Ensemble Learning Approach for Leakage Localization in Water Distribution Networks, EGU General Assembly 2026, Vienna, Austria, 3–8 May 2026, EGU26-4808, https://doi.org/10.5194/egusphere-egu26-4808, 2026.

EGU26-8361 | PICO | HS5.4.3

Decoding residential water use through high-resolution pressure sensing  

Stefano Alvisi, Valentina Marsili, and Filippo Mazzoni

Smart metering systems are one of the key components of  the digital transformation of the water sector and represent a significant advancement over traditional meters. However, it has been widely demonstrated that only data gathered at a sufficiently fine resolution (1 min or even better 1 sec) allows properly performing end-use disaggregation and classification while due to technical reasons, such as battery life, smart metered water consumption data are generally registered and collected by Water Utilities at daily or hourly time steps. As an alternative to approaches relying on data provided by smart meters, methods for end-use water consumption characterization based on pressure data have progressively gained attention, due to the technical and economic advantages associated with the installation of pressure sensors compared to flow meters.

This study presents an innovative method for estimating water consumption events based on pressure measurements at two distinct in-line sections of the domestic inlet pipe, from which the head-loss time series can be derived. As first phase, the method converts the head-loss time series into flowrate by exploiting the pressure-flowrate relationship, allowing the reconstruction of the water-consumption time series. As second phase, information about water consumption at the level of individual consumption events is obtained. The flowrate time series is firstly processed by an algorithm for signal stabilization and combined events segmentation. Consequently, all individual events are analysed based on their features (e.g. duration, volume, etc.) to provide further information on water uses.

To validate the methodology, a residential user consisting of a single-family house was considered and pressure monitoring at two sections of the inlet pipe was performed over a period of about one month and a half with 1-s resolution. In addition, daily volume supplied to the user over the same period was obtained through the mechanical flowmeter for method validation. The pressure signals were converted in head-loss time series by accounting for sensor-elevation difference estimated over a time window of nil flow in the inlet pipe. Head-loss time series was then converted in flowrate time series by exploiting the relation between head-loss and flowrate, for which the hydraulic resistance of the inlet-pipe segment was preliminarily assessed through field tests. The total water consumption estimated over the monitoring period deviated from the observed one (i.e. that obtained from water-meter readings) of about 2.3%, confirming the capability of the methodology of effectively providing flowrate time series starting from pressure data. Flowrate time series was then subject to filtering and segmentation, resulting in over 7,500 individual end-use events, 18% of which overlapped in time. The characteristics of the above events were then investigated in a duration-volume mesh. Overall, the methodology was proven to provide insights into end uses of water that can support water utilities in the characterization and modelling of residential water consumption by exclusively relying on pressure data.

How to cite: Alvisi, S., Marsili, V., and Mazzoni, F.: Decoding residential water use through high-resolution pressure sensing , EGU General Assembly 2026, Vienna, Austria, 3–8 May 2026, EGU26-8361, https://doi.org/10.5194/egusphere-egu26-8361, 2026.

EGU26-10149 | ECS | PICO | HS5.4.3

Control-Oriented System Identification of Urban Drainage Dynamics for Flood Mitigation 

Rajani Pandey and Rajarshi Das Bhowmik

Urban drainage networks play a critical role in mitigating flood risk in rapidly urbanizing environments, yet their dynamic behavior under rainfall forcing remains difficult to describe using simple mathematical models. Most existing studies rely on detailed hydrodynamic simulators, such as EPA-SWMM, which are well suited for design and scenario analysis but are less suitable to system-level analysis and control-oriented modeling due to their complexity.
This study proposes a control-oriented modeling framework for urban drainage systems based on system identification techniques applied to SWMM-generated input-output data. Rainfall-runoff and hydraulic responses are simulated for an urban drainage network under multiple storm events. Time series of inflow and water depth are extracted at selected junctions identified as critical using flooding and surcharge indicators.
A physics-based mass balance formulation is adopted, and local storage-outflow dynamics are linearized around representative operating conditions. Using the resulting input-output data, first-order dynamic models are identified for individual drainage nodes. The derived transfer functions capture the dominant inflow-depth dynamics, where the static gain represents the steady-state sensitivity of water depth to inflow variations and the time constant reflects the effective storage behavior of the drainage node.
Model performance is evaluated by testing the identified models under different rainfall events. The proposed approach provides compact and interpretable models that bridge detailed hydraulic simulation and control-oriented analysis, supporting digital water and digital twin applications for urban drainage systems.

How to cite: Pandey, R. and Das Bhowmik, R.: Control-Oriented System Identification of Urban Drainage Dynamics for Flood Mitigation, EGU General Assembly 2026, Vienna, Austria, 3–8 May 2026, EGU26-10149, https://doi.org/10.5194/egusphere-egu26-10149, 2026.

Two emerging paradigms are redefining AI for physical systems: foundational models and intelligent agents. In the context of urban drainage systems, both offer the opportunity to move beyond task-specific tools toward more general, scalable, and operationally meaningful AI systems. This contribution discusses the state of the art, presents recent advances from our research, and outlines a realistic pathway toward AI-based urban drainage intelligence.

The first paradigm focuses on foundational, physics-aware models that aim to replace computationally expensive numerical simulators while fully exploiting real-world measurements. Such models have the potential to significantly strengthen digital twins by enabling fast, differentiable, and transferable representations of system dynamics. We present recent developments in graph neural network (GNN)–based surrogate models for urban drainage simulation, including autoregressive architectures capable of emulating both the dynamics of 1D numerical models and 2D shallow-water equation solvers. These results demonstrate that accurate and scalable learning-based simulators are now feasible for complex hydraulic processes.

Looking ahead, a key research challenge lies in integrating drainage network models with surface flow representations, enabling unified 1D/2D modelling of the coupled behaviour of sewers, floodplains, and urban catchments during extreme events. Another critical opportunity lies in exploiting the differentiable nature of AI models, which opens the door to assimilating real-world observations directly into model parameters. This offers a principled alternative to traditional calibration workflows, while also enabling continuous adaptation as new data become available. At the same time, the scarcity of high-quality real-world flood observations implies that pretraining on large-scale simulations will likely remain essential to developing robust and transferable models.

The second paradigm concerns AI agents for complex engineering tasks, where systems are designed not only to make predictions but also to reason, plan, and take actions within operational workflows. In the context of urban drainage, such agents could ultimately support activities ranging from model building and calibration to decision support, monitoring, and infrastructure management. As a concrete example of this broader direction, we present our ongoing work on automatic sewer defect detection, where we evaluate the limitations of current general-purpose vision–language models for infrastructure inspection. Our results indicate that meaningful progress will require domain-specific multimodal models, tailored to sewer imagery and engineering semantics. These models can naturally evolve toward vision–language–action systems, enabling compact, efficient agents suitable for deployment on robotic platforms and edge devices, with appropriate safety constraints.

How to cite: Taormina, R.: Foundational Models and Intelligent Agents for Urban Drainage Systems: The Road Ahead, EGU General Assembly 2026, Vienna, Austria, 3–8 May 2026, EGU26-12269, https://doi.org/10.5194/egusphere-egu26-12269, 2026.

EGU26-13010 | ECS | PICO | HS5.4.3

Kinematic Hierarchical Filling-and-Spilling Algorithm for Advanced DEM-based Modelling of Pluvial Flooding in Urban Areas 

Kay Khaing Kyaw, Luis Mediero, Valerio Luzzi, Stefano Bagli, and Attilio Castellarin

Pluvial flooding on roadways poses a significant threat to drivers. In addition, frequency of such pluvial floods is increasing due to climate change, urbanization, impervious surfaces, and aging stormwater infrastructure. While physics-based hydrodynamic models provide detailed results, their computational demand and reliance on often-uncertain drainage layouts make them impractical for rapid, real-time urban risk assessment.
SaferPlaces (saferplaces.co) addresses this with a web-platform that integrates high-resolution geospatial and climate data from sources like GEE, OSM, and Copernicus to automate the construction of digital-twins for flood risk modelling in urban areas. As part of the SaferPlaces platform, Safer_RAIN, a fast-processing DEM based algorithm that combines a pixel-based Green-Ampt infiltration model with a Hierarchical Filling-and-Spilling Algorithm (HFSA) approach to enable building-level risk assessments. By leveraging cloud-based infrastructure, the platform delivers high-resolution, real-time results for urban planning. However, when compared to 2D hydrodynamic models, Safer_RAIN showed some limitations, including the underestimation of flooded extents due to the absence of hydraulic backwater effects and single flow-path constraints. Therefore, this study introduces an enhancement to Safer_RAIN, termed Kinematic Safer_RAIN, by incorporating a kinematic approach to simulate flooding beyond depressions and integrating a flow-path inundation extension feature. This enhancement utilizes the Height Above Nearest Drainage (HAND) approach, coupled with Manning’s equation, to represent flood inundation along flow paths (e.g. essential for assessing risks to urban road networks).
Kinematic Safer_RAIN, featuring flow-path flood extension, was benchmarked against HEC-RAS 2D Rain-on-Grid hydrodynamic simulations using 1m-resolution LiDAR DEMs in two case studies. In the Cottonwood Lake Study Area (USA), Kinematic Safer_RAIN produced maximum flooding extents and water depth distributions that closely match HEC-RAS results. The model was further validated in Pamplona (Spain), using the extreme storm event of July 2010. Kinematic Safer_RAIN successfully identified flood-prone depressions and flooding along flow paths (primarily main roads and lanes), yielding high True Positive Rates and aligning with flood evidence from local newspaper images. This research provides a robust, low-cost, and rapid alternative for authorities to accurately predict roadway flooding risks, bridging the gap between topographic simplicity and hydrodynamic complexity to enhance flood mitigation strategies.

Keywords: Flow path flood extension, Hierarchical Filling-and-Spilling Algorithm (HFSA), Height Above Nearest Drainage (HAND), Pluvial Flooding, Safer_RAIN, Kinematic_SaferRAIN, SaferPlaces

How to cite: Kyaw, K. K., Mediero, L., Luzzi, V., Bagli, S., and Castellarin, A.: Kinematic Hierarchical Filling-and-Spilling Algorithm for Advanced DEM-based Modelling of Pluvial Flooding in Urban Areas, EGU General Assembly 2026, Vienna, Austria, 3–8 May 2026, EGU26-13010, https://doi.org/10.5194/egusphere-egu26-13010, 2026.

EGU26-14461 | ECS | PICO | HS5.4.3

Integrated Design of Centralized and Decentralized Reclaimed Water Networks 

Mohsen Hajibabaei, Mohammad Rajabi, and Robert Sitzenfrei

Urban water scarcity, intensified by climate change and seasonal variability, is increasingly driving cities toward the use of reclaimed water as a supplementary supply. Reclaimed water, derived from treated wastewater or greywater, can significantly reduce pressure on potable water resources, yet its large-scale integration into existing urban water infrastructure remains poorly optimized. In particular, most existing reclaimed water distribution networks (RWDNs) are designed either manually or using computationally intensive methods and rarely account for their functional interactions with potable water distribution networks (PWDNs). This is critical because reductions in potable water demand due to reclaimed water use can lead to adverse water-quality effects in PWDNs, especially in low-density urban areas.

This work presents a citywide, integrated, and computationally efficient framework for the optimal design of RWDNs that explicitly considers their interdependence with PWDNs and urban spatial structure. The framework is capable of generating and evaluating a wide spectrum of RWDN configurations, ranging from fully centralized systems to highly decentralized, multi-source networks. It relies on openly available spatial data, including street networks, land-use information, and digital elevation models, making it transferable to different cities.

The framework automatically generates initial RWDN layouts based on the correlation between street networks and water networks and refines them using information on land plots, topography, spatial demand patterns in the PWDN, and reclaimed water origin–destination relationships. Based on this integrated spatial analysis, a wide range of centralized and decentralized network configurations is produced, and optimal pipe diameters are determined using efficient graph-based optimization methods. Each candidate network is automatically evaluated with respect to its impact on the existing PWDN. This enables the identification of feasible designs that satisfy water reuse requirements while minimizing adverse water-quality effects in the potable water system. At the same time, it explores how many small installations can be meaningfully interconnected and optimally coordinated with the central supply network so that water availability and demand match in space and time.

The final centralized and decentralized RWDNs are compared in terms of cost, water savings, and overall system performance. Application of the framework to a large European city demonstrates that well-designed decentralized and hybrid reclaimed water systems can substantially reduce potable water demand while maintaining acceptable water quality in PWDNs, highlighting the importance of integrated planning for urban water reuse.

Funding: This research was funded by the Austrian Science Fund (FWF) [10.55776/P36737].

How to cite: Hajibabaei, M., Rajabi, M., and Sitzenfrei, R.: Integrated Design of Centralized and Decentralized Reclaimed Water Networks, EGU General Assembly 2026, Vienna, Austria, 3–8 May 2026, EGU26-14461, https://doi.org/10.5194/egusphere-egu26-14461, 2026.

EGU26-14862 | ECS | PICO | HS5.4.3

Harnessing Computer Vision for Advanced Flood Forecasting in Urban Environments 

Manu Shergill and Elizabeth Carter

Urban pluvial flooding, caused when local precipitation intensity outpaces the capacity of natural and engineered drainage systems, is among the costliest, most dangerous, and most prevalent forms of natural disaster. While flood inundation extent maps form the basis for federal management of coastal and riverine flood risk management, there is no existing technology that allows for real-time spatially continuous monitoring of urban pluvial flooding, which critically limits equitable and effective planning, response, and mitigation. The proposed research enables a low-power distributed sensor network that synchronizes storm sewer stage monitoring with a camera-based flood mapping platform that will provide automatic monitoring and alerts of urban surface inundation and stormwater backups, and autonomously generate spatially complete maps of peak flooding extent for comprehensive and equitable pluvial risk characterization and mitigation. To realize this vision, applied research will be conducted to leverage edge-AI (Artificial Intelligence) to identify flooding in multispectral images representing diverse urban and peri-urban contexts. Efficient methods for georeferencing images using photogrammetric models of the neighborhoods where cameras are installed will be developed and evaluated. By synchronizing cameras with LoRaWAN-networked USGS storm sewer stage sensors, we will demonstrate how edge-AI enables spatially distributed inundation measurements from cameras with low energy and communication costs and without collecting raw imagery that could contribute to unnecessary surveillance in host communities. Furthermore, we will demonstrate how networked sensor platforms can get smarter over time.

How to cite: Shergill, M. and Carter, E.: Harnessing Computer Vision for Advanced Flood Forecasting in Urban Environments, EGU General Assembly 2026, Vienna, Austria, 3–8 May 2026, EGU26-14862, https://doi.org/10.5194/egusphere-egu26-14862, 2026.

EGU26-17061 | ECS | PICO | HS5.4.3

Mitigation of Hydrogeological Risk Caused by Leakage in Urban Water Distribution Networks: An Optimal Sensor Placement Approach 

Gabriele Medio, Luca Cozzolino, Giada Varra, Renata Della Morte, and Andrea Cominola

Urban water distribution networks (WDNs) are intended to reliably supply safe drinking water to users, while ensuring an economically and environmentally sustainable management of the supply infrastructure. However, WDNs are prone to water losses, mostly due to ageing components and insufficient maintenance. In the last decades, substantial research efforts have focused on developing methods for water loss reduction, targeting an optimal management of the WDNs infrastructure and quantifiable economic and water savings. Proposed approaches include programmed replacement of pipes, pressure management by means of optimally deployed pressure reduction valves, and prompt leak detection and subsequent localisation by means of sensor data and automated algorithms.

Beyond their direct impact on water supply efficiency, leakages in WDNs also contribute to an underestimated and, so far, understudied problem, namely the hydrogeological instability in urban environments, which can manifest as ground subsidence, surface deformation, or the formation of sinkholes. Such processes can cause substantial damage to infrastructure, disrupt traffic circulation, damage vehicles, compromise underground utilities, weaken the structural integrity of buildings, and, in the most severe cases, pose a threat to public safety. Incorporating planning and management strategies aimed at reducing hydrogeological risks associated with pipe leaks in WDNs is thus key to fostering the resilience of WDNs within the urban environment, besides water supply efficiency and reliability. This study presents an optimal sensor placement framework for mitigating the risk of Hydrogeological Disruption from Leakage (HDL).

The framework sequentially combines a spatial risk zonation approach with an optimal pressure sensor placement for accurate leak localisation, where sensor placement is driven by the objective of maximising leak localisation accuracy in the most vulnerable and exposed areas of the city. The optimisation process makes use of an evolutionary algorithm (GA from the package Pymoo) where candidate pressure sensor configurations are evaluated across different leak scenarios. The objective function combines the minimum hydraulic paths between actual and predicted leaks with weights representative of different risk levels, while the leak scenarios are produced with the hydraulic model included in the WNTR library under the assumption that a single active leak occurs along pipes. Localisation is based on a sensitivity matrix that maps the pressure response of the network nodes to specific leak scenarios, characterised by their location and magnitude. To avoid the introduction of binarisation thresholds, which would burden the optimisation process, a threshold-independent cosine similarity measure is adopted to evaluate the directional consistency between the pressure residual vector and the sensitivity vectors.

Our framework is tested on the L-Town benchmark WDN, a realistic WDN inspired by a real-world infrastructure, for which risk zonation is assessed considering exposure (qualitative exposed value of real estate assets, population density, and road network importance) and hazard (operational and pipe intrinsic factors). The numerical results demonstrate that the approach is effective in choosing the set of sensors that reduces the distance between the predicted leak localisation and the actual leak point, rewarding urban areas characterised by a higher potential HDL risk.

How to cite: Medio, G., Cozzolino, L., Varra, G., Della Morte, R., and Cominola, A.: Mitigation of Hydrogeological Risk Caused by Leakage in Urban Water Distribution Networks: An Optimal Sensor Placement Approach, EGU General Assembly 2026, Vienna, Austria, 3–8 May 2026, EGU26-17061, https://doi.org/10.5194/egusphere-egu26-17061, 2026.

EGU26-19050 | ECS | PICO | HS5.4.3

Optimal Sensor Placement for Pipe Blockage Detection in Urban Drainage Networks Using Graph Signal Processing 

Mohammad Rajabi, Mohsen Hajibabaei, and Robert Sitzenfrei

During the long-term operation of urban drainage networks (UDNs), the accumulation of sediments and debris can cause partial or complete blockages. Blockages within the pipe network may lead to flooding at manholes, and such overflows can disrupt traffic and increase pollution emissions in urban areas. Identifying the locations of partial blockages and implementing a regular pipe monitoring and cleaning plan support proactive maintenance and operation of UDNs. This approach helps increase network resilience, prevents complete pipe choking, and reduces flood inundation during high-intensity rainfall over long-term operation. With Internet of Things IoT-based smart urban water systems, sensor data can be used for the UDN anomalies detection, such as blockages, through water-level monitoring and time-series analysis. To improve the accuracy of blockage detection, determining the optimal sensor locations while considering implementation costs is a fundamental part of IoT-based UDN anomaly detection. Therefore, this work focuses on the optimal placement of sensors in UDNs for anomaly detection, supported by graph signal analysis. Water elevation variation data are modeled as signals on a graph representation of the UDN, providing a robust framework for effective anomaly detection.

In this research, at first, graph clustering is applied to divide the UDN into monitoring zones corresponding to the number of sensors. Subsequently, the optimal sensor locations within the monitoring zones are determined. For that, a genetic algorithm (GA) is used to determine the optimal location of each sensor within its corresponding cluster (monitoring zone). Therefore, the sensor network is modeled as a graph in which vertices correspond to sensor locations at manholes, and edges represent the minimum shortest paths connecting these locations. The objective function for optimal sensor placement is based on the graph Fourier analysis of that sensor network subgraph. Finally, water elevation variation data are assigned to the graph nodes as node signals. Using the graph Fourier transform (GFT), the graph Fourier coefficients of these signals are computed. The proportion of high-frequency components, defined as the energy contained in the largest 50% of Laplacian eigenvalues relative to the total signal energy, is used as a metric for anomaly detection efficiency. Nodes exhibiting high-energy components at these large eigenvalues are more suitable for blockage detection, as such high-frequency variations indicate localized disturbances. These variations have greater potential for accurately identifying pipe blockages and reducing misinterpretation in the sensor network under multiple blockage scenarios. The proposed method is implemented in a real-world UDN in an alpine region, and the performance of the sensor placement strategy is validated through sensitivity analysis under modelling multiple pipe blockage scenarios and varying numbers of sensors.

Funding: The project “RESTORE” is funded by the Austrian Science Fund (FWF) P 36737-N.

How to cite: Rajabi, M., Hajibabaei, M., and Sitzenfrei, R.: Optimal Sensor Placement for Pipe Blockage Detection in Urban Drainage Networks Using Graph Signal Processing, EGU General Assembly 2026, Vienna, Austria, 3–8 May 2026, EGU26-19050, https://doi.org/10.5194/egusphere-egu26-19050, 2026.

EGU26-19741 | ECS | PICO | HS5.4.3

A novel hybrid approach for leakage area detection in water distribution networks 

Mohammadreza Haghdoost, Andrea D’Aniello, Domenico Pianese, and Luigi Cimorelli

The demand for drinking water has noticeably increased due to ever-increasing population growth and climate change.  In addition, a significant amount of water is lost from water distribution networks (WDNs) through leakages because of pipe aging, corrosion, structural flaws, etc. Consequently, detecting leakage in WDNs can play an essential role in maintaining sustainable water-supply infrastructures.

Recently, hybrid approaches combining different methods, such as statistical, hydraulic, and machine learning (ML) methods, have attracted significant attention among the scientific community. In light of the above, this study presents a hybrid method for leakage detection that relies on two steps: i) a robust ML-based procedure to identify the leakage area, and ii) an optimization algorithm to further narrow down the suspect leakage area detected in the first step.

In the first step, the WDN is divided into leakage areas using the k-means clustering algorithm. Then, a Support Vector Machine (SVM) algorithm is used to identify the suspect leakage area. Pressure differences (i.e., pressure differences between 24h leakage scenarios and the daily average pressure of the leakage-free scenario as baseline condition) are considered as input, and leakage areas are assumed as targets for the SVM algorithm. Moreover, noise related to demand pattern uncertainty and pressure sensor inaccuracy is added to the model. In the second step, a two-step optimization algorithm is applied. It relies on: a minimization process based on a derivative-free optimizer that reduces the difference between simulated and measured data at the pressure/flow sensors placed in the WDN, and a filtering-clustering-ranking algorithm that eliminates nodes where the leaked volume is assumed to be negligible by giving a priority list of nodes for further inspection.  

The proposed method was tested on L-Town, a large-scale WDN used as benchmark for the Battle of the Leakage Detection and Isolation Methods (BattLeDIM). The preliminary results indicate that the proposed approach can effectively identify leakage areas, especially in large-scale WDNs, potentially offering a practical tool to water utilities managing complex distribution networks.

How to cite: Haghdoost, M., D’Aniello, A., Pianese, D., and Cimorelli, L.: A novel hybrid approach for leakage area detection in water distribution networks, EGU General Assembly 2026, Vienna, Austria, 3–8 May 2026, EGU26-19741, https://doi.org/10.5194/egusphere-egu26-19741, 2026.

HS6 – Remote sensing and data assimilation

EGU26-2219 | ECS | PICO | HS6.1

Temporal Variability and Trend Analysis of Monthly Snow Cover in a Himalayan river basin 

Harshita Tiwari, Aditya Kumar Thakur, and Rahul Dev Garg

Snow cover variability in high-altitude Himalayan river basins plays a critical role in regulating regional hydrology, water availability, and climate-cryosphere interactions. Understanding its temporal behaviour is particularly important for snow-fed basins such as the Budhi Gandaki Basin, Nepal, where seasonal meltwater significantly influences downstream flow regimes. Previous studies often overlooked detailed monthly-scale time series analysis and robust trend diagnostics of snow cover variability. In this study, we investigate the temporal dynamics of monthly snow cover area in the Budhi Gandaki Basin (area: 3857.85 km²) using continuous observations from 2020 to 2024 using the Moderate Resolution Imaging Spectroradiometer (MODIS) 8-day snow cover products (MOD10A2) with 500 m resolution. A comprehensive time-series framework was applied, incorporating descriptive statistics, linear trend analysis, seasonal climatology, anomaly assessment, and non-parametric trend detection. The MOD10A2 snow cover composites were spatially averaged over the basin and temporally aggregated to monthly resolution using a proportional day-overlap weighting scheme to estimate basin-averaged monthly snow covered area (SCA). Monthly snow cover data were then transformed into a continuous time series to evaluate overall variability and long-term behaviour. Seasonal characteristics were quantified through monthly climatology and interannual variability using mean and standard deviation metrics. Trend significance was examined using the Mann-Kendall test, while the magnitude of change was estimated using Sen’s slope. Results reveal a mean snow cover index of 0.56 with substantial variability showing a standard deviation of 0.16 snow cover fraction (SCF), indicating pronounced seasonal and interannual fluctuations. Monthly climatology shows maximum snow cover during winter months, peaking in February (mean: 0.762 SCF) and January (mean: 0.756 SCF), while minimum values occur during the summer monsoon period, particularly in July (mean: 0.424 SCF) and June (mean: 0.426 SCF). Linear trend analysis indicates a gradual declining tendency in snow cover at a rate of -0.0024 SCF per month. However, the Mann-Kendall test yields a Z statistic of -1.77 with a p-value of 0.076, suggesting that the observed decreasing trend is not statistically significant at the 95% confidence level. Anomaly analysis further highlights episodic deviations from the climatological mean, with maximum positive and negative anomalies of +0.204 SCF and -0.162 SCF, respectively, reflecting short-term climate-driven variability. Overall, the findings indicate a weak but persistent declining tendency in snow cover, modulated strongly by seasonal and interannual variability rather than a statistically significant long-term trend. This study provides an improved understanding of snow cover dynamics in the Budhi Gandaki Basin and offers valuable insights for hydrological modeling, climate impact assessments, and sustainable water resource management in snow-fed Himalayan river systems.

Keywords: Snow cover variability; Time series analysis; Himalayan river basin; Seasonal climatology; Trend detection


How to cite: Tiwari, H., Thakur, A. K., and Garg, R. D.: Temporal Variability and Trend Analysis of Monthly Snow Cover in a Himalayan river basin, EGU General Assembly 2026, Vienna, Austria, 3–8 May 2026, EGU26-2219, https://doi.org/10.5194/egusphere-egu26-2219, 2026.

Seasonal snow cover in high mountain regions plays an important role in river flow hydrographs, water availability and land atmosphere interactions. In the Western Himalaya, mapping snow cover accurately is difficult due to frequent cloud cover, steep terrain, strong shadow effects and confusion between snow, clouds and bright rocky surfaces in satellite images. The study shows that these issues are clearly observed in the Western Himalayas, where the lack of sufficient ground reference data further limits the use of fully supervised classification methods. To address these challenges, the objective of the present study is to develop a snow cover mapping framework that leverages self-supervised learning for robust feature representation from satellite remote sensing data in the Western Himalaya. The method focuses on learning useful snow related features directly from large volumes of unlabelled satellite images, reducing the need for extensive manually labelled training data. Multi temporal optical satellite images are used so that the model can learn stable snow patterns across different seasons, illumination conditions and surface states. A convolutional neural network is trained using a contrastive self-supervised learning strategy, where different augmented versions of the same image patch are treated as similar samples, while patches from different locations are treated as dissimilar. The self-supervised encoder is coupled with a lightweight decoder in an encoder-decoder segmentation architecture, enabling pixel wise snow mapping while preserving spatial detail under limited supervision. Simple data augmentations, such as brightness changes, contrast adjustments and random cropping are applied to improve the model’s ability to recognize snow under varying conditions while preserving its key spectral and spatial characteristics. After self-supervised pretraining, the learned feature representations are fine tuned for snow and non-snow classification using a limited set of labelled samples derived from reference snow products and manual interpretation. This greatly reduces the dependence on large labelled datasets compared to conventional supervised learning methods. Snow cover maps are generated for different seasons and elevation zones to examine spatial and temporal variability of snow distribution across the basin. The results are compared with traditional index based methods, such as Normalized Difference Snow Index (NDSI) thresholding, especially in areas affected by clouds, shadows and mixed land cover. The study shows that the self-supervised learning provides a practical and reliable framework for snow cover mapping in data scarce and high altitude regions. The methodological framework developed in this study can be utilized for other basins also to have improved understanding of snow cover dynamics.

Keywords: Snow cover; self-supervised learning; remote sensing; Himalaya

How to cite: Thakur, V., Keshari, A. K., and Tak, S.: Monitoring of Spatio-Temporal Snow Cover using AI Based Self-Supervised Learning in Data Scarce Himalayan River Catchment, EGU General Assembly 2026, Vienna, Austria, 3–8 May 2026, EGU26-3445, https://doi.org/10.5194/egusphere-egu26-3445, 2026.

Water management represents a critical challenge for the mining industry, as large volumes of surface water must be controlled and treated during operations to ensure the stability of geotechnical structures and protect the environment. This extends beyond the operational phase, as it is essential to ensure the physical stability of tailings storage facilities and to limit the potential transport of contaminants on reclaimed mine sites. The water balance of tailings storage facilities is regulated by surface water management and often treatment infrastructures. In addition, the water balance is also closely linked to the performance of several engineered cover systems used to reclaim tailings storage facilities. Because tailings storage facilities generally occupy large areas, snow accumulation in winter and rapid melting in spring generate substantial volumes of meltwater within a short period. Thus, the spring freshet is a critical phase for water inventory control, from operation to post-reclamation. In this context, developing tailored monitoring tools is essential to ensure effective spring water management on tailings storage facilities.

This work aims to develop a high spatial resolution drone-based sensing approach for semi-real-time monitoring of the snow water balance in tailings storage facilities during snowmelt. This study is based on the results of several drone-based Structure-from-Motion photogrammetry and LiDAR surveys conducted during snowmelt on a reclaimed tailings storage facility. The site presents two major challenges for these sensing techniques: a flat, featureless area prone to oversaturated whites when covered with snow, and sections of dense low vegetation that reduce LiDAR signal penetration and hinder the generation of accurate digital elevation models. The accuracy and precision of the two remote sensing technologies to evaluate the snow depth were assessed based on manual measurements and conventional GNSS surveys. The impact of the reconstruction software/algorithms and parameters, as well as the number of ground control points (between 3 and 21) used in the reconstructions, on accuracy was also assessed. Finally, a preliminary snow-water equivalent model was developed and integrated within the data processing scheme to provide the changes of snow-water equivalent during snowmelt. Results show that LiDAR is the most accurate and reliable approach to monitor the snow depth. Photogrammetry-derived digital elevation models resulted in an error up to 66 cm. The quality and accuracy of photogrammetric surveys depend on the number of ground control points, the reconstruction algorithm used, and the absence of aerotriangulation tie points in certain areas. A snow-water equivalent model was integrated with LiDAR-derived snow depth data to characterize the temporal evolution of the tailings storage facility water balance during snowmelt. This presents an incremental improvement towards effective spring-water management on tailings storage facilities.

How to cite: Boulanger-Martel, V. and Blatter, N.: Potential of LiDAR and Structure-from-Motion Photogrammetry for High-Resolution Monitoring of Snowmelt Water Balance in Tailings Storage Facilities, EGU General Assembly 2026, Vienna, Austria, 3–8 May 2026, EGU26-8352, https://doi.org/10.5194/egusphere-egu26-8352, 2026.

EGU26-8577 | PICO | HS6.1

Updates on advancements of the Terrestrial Snow Mass Mission 

Benoit Montpetit, Chris Derksen, Vincent Vionnet, Marco Carrera, Julien Meloche, Nicolas Leroux, and Jean Bergeron

Snow is the only component of the water cycle that does not have a dedicated earth observation mission. Snow impacts many sectors like the health and well-being of communities, the economy, and sustains ecosystems. Snow also contributes to many costly hazards like floods, droughts, and avalanches. The current lack of information on how much water is stored as snow (snow water equivalent, SWE), and how it varies in space and time, limits the hydrological, climate, and weather services provided by Environment and Climate Change Canada (ECCC). To address this knowledge gap, ECCC, the Canadian Space Agency (CSA) and Natural Resources Canada (NRCan) are working in partnership to advance the scientific and technical readiness for a Ku-band synthetic aperture radar (SAR) mission presently named the ‘Terrestrial Snow Mass Mission’ – TSMM. An observing concept capable of providing dual-polarization (VV/VH), moderate resolution (500 m), wide swath (~250 km), and high duty cycle (~25% SAR-on time) Ku-band radar measurements at two frequencies (13.5; 17.25 GHz) is under development. This Canadian radar mission will provide weekly coverage of the northern hemisphere with Ku-band SAR data, and coupled with modeled data in the Canadian Land Data Assimilation System (CaLDAS), will provide daily snow water equivalent data, to assist hydrological applications and decision-making. It has been proven that Ku-Band backscatter measurements are sensitive to SWE through the volume scattering of the signal by the snow microstructure. Radar measurements are also well known to be able to discriminate between wet and dry snow conditions.

In this presentation, we will review recent progress at ECCC (supported by the mission science team and the international snow community). Key areas of ongoing development include:
(1) The Ku-band radar SWE retrieval algorithm proof of concept, based on the use of physical snow modeling to provide initial estimates of snow microstructure which can effectively parameterize forward model simulations for prediction of snow volume scattering.
(2) Improvements to radiative transfer modelling codes to improve computation efficiency.
(3) Improvements to physical snow modeling in the Canadian land surface model Soil Vegetation Snow version 2 (SVS2).
(4) Development of the capability for direct assimilation of Ku-band backscatter into environmental prediction systems at ECCC.
(5) Segmentation of wet from dry snow based on the time evolution of radar backscatter.

Testbed experiments in which snow physical modeling, SWE retrievals, and data assimilation are analyzed collectively are currently under development. These experiments will be facilitated by the TSMM simulator and will incorporate outputs from SVS2 and are supported by airborne and ground-based Ku-band radar measurements from national and international academic partners. 

How to cite: Montpetit, B., Derksen, C., Vionnet, V., Carrera, M., Meloche, J., Leroux, N., and Bergeron, J.: Updates on advancements of the Terrestrial Snow Mass Mission, EGU General Assembly 2026, Vienna, Austria, 3–8 May 2026, EGU26-8577, https://doi.org/10.5194/egusphere-egu26-8577, 2026.

Abstract: Snow is a critical component of the cryosphere, exhibiting substantial variations in both spatial and temporal dimensions. Accurately capturing the dynamic characteristics of seasonal snow cover is essential for predicting snowmelt runoff, monitoring hydrological cycle, and conducting climate change analysis. Optical satellite remote sensing has proven to be an effective tool for monitoring global and regional snow cover. However, existing fractional snow cover (FSC) data derived from optical imagery often encounters challenges, including large-scale spatial gaps caused by cloud cover and shadows. Meanwhile, passive microwave data, although valuable, typically possess lower spatial resolution, rendering them inadequate for detecting snow cover dynamics under complex surface conditions. In this study, we employed a fractional snow cover fusion estimation method to generate high-resolution (1 km) spatiotemporally continuous FSC estimation datasets for the Tibetan Plateau region from the years 2008 to 2021, regardless of weather conditions. The accuracy of the FSC data was systematically evaluated over the study period, demonstrating excellent consistency with independent datasets, including Landsat-derived FSC (total 20 scenes; RMSE = 0.092–0.193; R = 0.83–0.946) and ground-based snow observations (Approximately 70,000 site records; Overall Accuracy = 0.95; Kappa = 0.95). Furthermore, the FSC datasets produced by this method exhibits superior performance in accurately capturing the complex daily snow cover dynamics compared to other FSC datasets(Overall Accuracy: 0.95 vs. 0.91 vs. 0.85). In conclusion, the daily FSC maps of the Tibetan Plateau generated from 2008 to 2021 using data fusion methods in this study offer high accuracy and complete spatiotemporal coverage. These FSC datasets hold substantial value for climate projections, hydrological studies, and water management at both global and regional scales.

Fig.1 Spatial Distribution of Snow Cover (1 km) for daily FSC data over the Tibetan Plateau from 2008 to 2021. The dates are shown at the bottom of the subplots. The blank areas denote missing values due to various reasons. The range of snow cover variation is from 0 to 1, where 0 indicates no snow cover and 1 indicates full snow cover.

Table.1 Summary of accuracy metrics for the 1km daily fractional snow cover data over the Tibetan Plateau using 10 Landsat scenes FSC data as the reference data.

How to cite: Sun, T. and He, T.: Mapping 1 km Fractional Snow Cover from Passive Microwave Brightness Temperature Data and MODIS Snow Cover Product over The Tibetan Plateau, EGU General Assembly 2026, Vienna, Austria, 3–8 May 2026, EGU26-10752, https://doi.org/10.5194/egusphere-egu26-10752, 2026.

EGU26-10848 | ECS | PICO | HS6.1

Machine Learning–Based Gap-Filling of Satellite Snow Products Using Time-Lapse Photography and Meteorological Data 

Ján Krempaský, Veronika Lukasová, Ivan Mrekaj, Milan Onderka, and Svetlana Varšová

Reliable information on snow cover dynamics is essential for water resource management, climate impact assessments, and ecological studies. In mountainous regions, where spatial variability is high and long-term observations are limited, satellite-based snow products often present the primary source of information. However, their performance is constrained in complex terrain by cloud cover, coarse spatial resolution, and data gaps. Therefore, the validation of satellite-derived snow cover data is crucial for reducing uncertainty. In this study, we employed a low-cost, ground-based time-lapse camera to monitor snow cover (SC) and to support the validation, gap-filling, and improved reliability of satellite-derived snow cover products.

Time-lapse photography was obtained using a camera trap installed at the Skalnaté Pleso Observatory in the High Tatra Mountains (Slovakia). The camera captured daily images of a south-eastern slope during four snow seasons (2021/22–2024/25). An automated image-processing workflow was applied to derive snow cover percentage from the photographs, including horizon-based image alignment, masking of non-relevant areas, and automatic snow classification based on blue-band intensity thresholds. The resulting camera-derived SC was compared with satellite-based fractional snow cover (FSC) from Sentinel-2 products (Fractional Snow Cover and Gap-filled Fractional Snow Cover marked as S_FSC and S_GFSC) and MODIS products (MOD10 and MYD10 marked as M_TERRA_FSC and M_AQUA_FSC) within the camera’s field of view.

The analysis revealed substantial differences in data availability between ground-based and satellite observations, with time-lapse photography providing more continuous records during periods of frequent cloud cover. Camera-derived SC captured short-term snow accumulation and melt dynamics that were often missed or temporally smoothed in satellite products. Relative to camera observations, Sentinel products overestimated SC by 11.3 % (S_GFSC) and 9.1 % (S_FSC), whereas MODIS products underestimated SC by -9.5 % (M_AQUA_FSC) and -7.7 % (M_TERRA_FSC). 

Data gaps in satellite products were addressed using a Random Forest machine-learning approach trained on SC derived from terrestrial time-lapse photography. To avoid sensor-mixing biases, separate models were trained for each Sentinel-2 and MODIS product. By integrating local meteorological variables such as daily air temperature, precipitation, snow depth, and global radiation, the models were able to capture the non-linear nature of snow dynamics. Our study demonstrates that combining time-lapse photography with satellite products and in situ meteorological measurements enables more accurate reconstruction of snow cover dynamics, particularly in periods of rapid snow accumulation and melt in alpine environments.

Acknowledgement: This study was funded by the project VEGA 2/0048/25.

How to cite: Krempaský, J., Lukasová, V., Mrekaj, I., Onderka, M., and Varšová, S.: Machine Learning–Based Gap-Filling of Satellite Snow Products Using Time-Lapse Photography and Meteorological Data, EGU General Assembly 2026, Vienna, Austria, 3–8 May 2026, EGU26-10848, https://doi.org/10.5194/egusphere-egu26-10848, 2026.

EGU26-12080 | ECS | PICO | HS6.1

Measuring mine dust contamination of snow in northern Sweden using optical remote sensing 

Moon Taveirne, Christian Zdanowicz, Alexandre Langlois, Biagio Di Mauro, Giacomo Traversa, and Axel Hagermann

Mineral dust is produced as a by-product when mining for metals such as iron and rare-earth elements. Around mines in the Arctic and Subarctic, this dust is transported by wind and deposited on the snow surface, contaminating the seasonal snowpack. The presence of mine dust darkens the snow surface, resulting in a lower snowpack albedo. Due to their lowered albedo, seasonal snowpacks that contain mine dust experience accelerated melting. Nordic countries, including Sweden, are showing an increasing interest in the expansion of mining activities due to increasing demand for metals to use in technology and a desire to produce raw materials within Europe. The Kirunavaara mine in the Swedish Arctic is Europe’s largest iron mine, and is an accordingly large source of mineral dust, which spreads around the adjacent town of Kiruna and the surrounding areas.

One possible approach to quantify mine dust contamination of the seasonal snowpack is using optical remote sensing. The change in spectral reflectance of the contaminated snow surface is used to infer optical properties and the concentration of mine dust in the surface snow. Spectral indices and radiative transfer modelling are applied to the spectral reflectance data to retrieve dust concentrations. We have measured dust concentrations in snow around Kiruna during spring 2025, and measured reflectance of the affected snow surfaces. Snow darkening in Kiruna occurs predominantly in the area located downwind from the mine where dust concentrations in snow are highest. Dust loadings in surface snow around Kiruna reach over 2000ppm, with associated snow broadband albedo values as low as 0.3 in the most heavily contaminated areas. There is a clear relationship between broadband albedo and mine dust concentrations in the surface snow. However, the spectral signatures of the contaminated snow surface show that iron mine dust darkens the snow relatively evenly across all wavelengths of visible light. Combined with the high dust loading, this even darkening effect means that previously established spectral indices for minerals dust in snow are not applicable in the case of iron dust contamination, and an approach tailored specifically to this type of dust is required.

How to cite: Taveirne, M., Zdanowicz, C., Langlois, A., Di Mauro, B., Traversa, G., and Hagermann, A.: Measuring mine dust contamination of snow in northern Sweden using optical remote sensing, EGU General Assembly 2026, Vienna, Austria, 3–8 May 2026, EGU26-12080, https://doi.org/10.5194/egusphere-egu26-12080, 2026.

EGU26-12971 | PICO | HS6.1

Development of an Advanced L2 Processor for PRISMA Second-Generation within the COOL Project: Application to Snow-Covered Terrain 

Federico Santini, Angelo Palombo, Saham Mirzaei, Stefano Pignatti, and Simone Pascucci

The COOL project, funded by the Italian Space Agency (ASI), focuses on the development of an advanced, modular Level-2 (L2) processor for the PRISMA Second-Generation (PRISMA-SG) hyperspectral mission. The processor is designed to generate high-quality L2 products, including surface reflectance, water vapor content, and aerosol optical thickness, while addressing the unique challenges introduced by the off-nadir acquisition geometry of the PRISMA-SG sensor.

The processor builds upon state-of-the-art radiative transfer modeling and integrates physics-based atmospheric and topographic correction algorithms based on the MODTRAN6 model. The processing chain is derived and extended from previous work (Santini & Palombo, 2019; Palombo & Santini, 2020; Santini & Palombo, 2022), and incorporates second-order effects, such as adjacency corrections and topographic illumination variations. These algorithms are carefully adapted to the spectral, spatial, and viewing geometry characteristics of PRISMA-SG, aiming to achieve or exceed a Scientific Readiness Level (SRL) of 6.

Validation of the processor relies on both simulated datasets and in-situ measurements over dedicated calibration and validation (CAL/VAL) sites established within the COOL project. Top-of-atmosphere (TOA) radiance signals are simulated over these sites and compared with field measurements to quantify residual errors and assess the sensitivity of the inversion algorithms to off-nadir acquisition effects. These activities ensure the robustness and scientific usability of the derived L2 products in both nadir and off-nadir observation modes.

As a demonstration, the L2 processor was applied to PRISMA-SG images acquired over snow-covered areas in the Italian Alps. The results were compared with the standard L2 products provided by the image supplier. The comparison shows close general agreement in reflectance spectra while correcting artifacts present in the standard products, including topographic effects, adjacency effects, and off-nadir-induced reflectance overestimation. Notably, the corrected reflectance values remain physically consistent and do not exceed unity, a problem often observed in the standard products.

This work consolidates the L2 processing capabilities for PRISMA-SG, providing validated, reliable, and application-ready hyperspectral products. The approach demonstrates the importance of accounting for off-nadir geometry and second-order atmospheric and topographic effects, enabling robust use of PRISMA-SG data for environmental monitoring, snow cover studies, and other Earth observation applications.

How to cite: Santini, F., Palombo, A., Mirzaei, S., Pignatti, S., and Pascucci, S.: Development of an Advanced L2 Processor for PRISMA Second-Generation within the COOL Project: Application to Snow-Covered Terrain, EGU General Assembly 2026, Vienna, Austria, 3–8 May 2026, EGU26-12971, https://doi.org/10.5194/egusphere-egu26-12971, 2026.

EGU26-17516 | PICO | HS6.1

Are snow patterns well modelled when simulating river discharge in Mediterranean mountain catchments? A multimodel approach assessment using remote sensing data 

Raquel Gómez-Beas, Marta Egüen, Giuseppe Formetta, María José Polo, and Rafael Pimentel

Modelling streamflow in mountainous areas is challenging. The presence of snow is an additional factor to consider, as it is the primary driver of streamflow dynamics in mountain catchments. In addition, this complexity increases in the Mediterranean mountains, where snow dynamics are more variable, with specific characteristics, including shallow snowpack, high density, and evaposublimation rates that cannot be neglected when assessing water resource availability during the dry season. Many approaches, with varying levels of complexity, have been used to model streamflow in mountainous areas. In general, these models are calibrated and evaluated against streamflow without considering their performance with respect to snow dynamics. That is, river discharges are well represented, but not due to the correct reasons.

This study assesses the implications of selecting snow parameterizations for streamflow modelling in Mediterranean mountain catchments, considering not only streamflow but also snow performance. Five different hydrological models, with different conceptualizations – lumped, semi-distributed, and fully distributed – and with different levels of complexity regarding snow parameterization – degree-day, radiation-day, and mass and energy balance approach– have been used. These models are: (1) GR4J associated with CemaNeige (lumped with degree-day snow model), (2) SWAT (semidistributed with degree-day snow model), (3) HYPE (semidistributed with radiation-day snow model), (4) GEOFRAME (semidistributed with temperature-radiation-day snow model), and (5) WiMMed (distributed with mass and energy balance snow model). Models were calibrated against streamflow observations and evaluated for snow performance using remote-sensing-derived snow-cover area. A spectral mixture analysis carried out using Landsat imagery, considering the three main land cover types over the region: snow, shallow vegetation, and rocks, was performed to define the fraction of snow in each cell. The values of these pixels were aggregated at the catchment scale for comparison with the simulations. The Guadalfeo River basin in southern Spain has been selected as representative of a Mediterranean mountain-coastal catchment for this analysis.

Preliminary results indicate that the complexity of snow dynamics is better captured by the more complex approach, namely, the fully distributed mass and energy balance snow model. However, the assessment indicates that simpler approaches can be valid when analyzing changes and seasonality rather than actual values. This observation underscores the potential to use this model in an ensemble to compute hydrological uncertainty, as is common in hydrological seasonal prediction and climate studies.

Acknowledgments: This work is part of the project PCI2024-153496, funded by MCIU/AEI/10.13039/501100011033 and EU

How to cite: Gómez-Beas, R., Egüen, M., Formetta, G., Polo, M. J., and Pimentel, R.: Are snow patterns well modelled when simulating river discharge in Mediterranean mountain catchments? A multimodel approach assessment using remote sensing data, EGU General Assembly 2026, Vienna, Austria, 3–8 May 2026, EGU26-17516, https://doi.org/10.5194/egusphere-egu26-17516, 2026.

EGU26-18431 | PICO | HS6.1

Evaluating the use of NRB Sentinel-1 product for reconstructing high resolution SWE in mountains 

Carlo Marin, Valentina Premier, Nikola Mang, and Davide Castelletti

Seasonal snow in mountain catchments is highly heterogeneous, yet snow water equivalent (SWE) is rarely available at spatial and temporal scales useful for hydrology and ecosystem applications. We present a multi-source retrospective SWE reconstruction framework that produces daily 30-meter resolution SWE over mountains by integrating (i) SAR-based wet-snow information from Sentinel-1 Normalised Radar Backscatter (NRB) product; (ii) optical snow-cover dynamics given using Sentinel-2 and Sentinel-3 data and (iii) in-situ meteorological forcing. A key advantage is that the method does not rely on spatially distributed precipitation fields, which remain a dominant uncertainty in mountain snow modelling.

The approach is built around a pixel “state” concept (accumulation, equilibrium, ablation) that constrains physically plausible SWE evolution through the season. Snow presence is represented by a daily high-resolution snow-cover-area (SCA) time series obtained by gap-filling and downscaling coarse snow-cover fraction with high-resolution optical observations, followed by a state-aware regularization that removes implausible transitions. Snow melt is computed using an enhanced temperature-index (ETI) model driven by air temperature and incoming shortwave radiation. However, ETI formulations do not explicitly resolve cold content and internal energy storage; as a result, they can trigger melt earlier than expected, as they do not account for delays imposed by the snowpack thermal inertia. To constrain the onset of true meltwater conditions, we integrate Sentinel-1 wet-snow maps derived from the new NRB time series, using multi-temporal backscatter changes to detect wet-snow conditions.

The Sentinel-1 NRB product provides radiometrically terrain-corrected backscatter (γ⁰) using the local incidence angle and mapping the data onto a reference coordinate system [1]. This improves consistency over complex topography compared to conventional Level-1 GRD processing. In addition, a novel cloud-native Zarr format enables fast, chunked access to long time series, facilitating regional-scale analyses.

We demonstrate the method in the Maipo region (Andes), where shortwave radiation dominates snowmelt. Preliminary results show that combining daily optical snow-cover dynamics with NRB-informed wet-snow timing enables SWE reconstructions that are temporally consistent across full seasons and, critically, prevents ETI-driven melt before liquid water is detected. Additionally, in the presentation, the NRB products and their assessment for the analysis of timeseries over mountains will be provided.

References

[1]  G. H. X. Shiroma, M. Lavalle and S. M. Buckley, "An Area-Based Projection Algorithm for SAR Radiometric Terrain Correction and Geocoding," in IEEE Transactions on Geoscience and Remote Sensing, vol. 60, pp. 1-23, 2022.

How to cite: Marin, C., Premier, V., Mang, N., and Castelletti, D.: Evaluating the use of NRB Sentinel-1 product for reconstructing high resolution SWE in mountains, EGU General Assembly 2026, Vienna, Austria, 3–8 May 2026, EGU26-18431, https://doi.org/10.5194/egusphere-egu26-18431, 2026.

Mountain snow is a critical component of the hydrological cycle and climate system, making reliable information on snow depth (SD) essential for water resource management and climate studies. Estimating SD in mountainous terrain remains challenging due to complex topography, heterogeneous land cover, and highly variable snow and weather conditions. Synthetic Aperture Radar (SAR) is suitable in such environments, as it provides frequent observations, high spatial resolution, and sensitivity to snow properties independent of cloud cover and illumination. In particular, Sentinel-1 C-band SAR backscatter-based method enables large-scale and continuous SD monitoring, but faces limitations in vegetated, shallow, or wet snow conditions. To overcome these limitations, this study proposes an improved machine learning (ML) framework that incorporates new input variables derived from Sentinel-1 and other optical data, improving upon existing Sentinel-1–based ML approaches for SD estimation. Additionally, the framework is designed for efficient implementation using preprocessed Sentinel-1 data available in Google Earth Engine, thereby minimising the computational burden of handling SAR data and facilitating scalable application across regions and time periods. The methodology is implemented across three climatically and physiographically distinct mountainous regions: the Colorado Rocky Mountains, the European Alps, and the Indian Western Himalayas. Across all three regions, the proposed model substantially performs better than the existing methods, achieving MAE(r) values of 7.9 cm (0.96), 22.3 cm (0.91), and 68.4 cm (0.72), respectively. Since the physical scattering processes governing C-band SAR responses to snow are not yet fully characterized, explainable AI techniques are applied to interpret model predictions and quantify the influence of input variables under varying environmental conditions. The results show region-specific and seasonal dependencies linked to snow type, vegetation cover, and surface conditions, providing new physical insights into the sensitivity of Sentinel-1 C-band backscatter to snow depth.

How to cite: Rajendiran, C. P. and Ramsankaran, R.: Physical Insights into Sentinel-1 SAR-Based Snow Depth Estimation Using Machine Learning and Explainable AI Across Different Mountainous Regions, EGU General Assembly 2026, Vienna, Austria, 3–8 May 2026, EGU26-19246, https://doi.org/10.5194/egusphere-egu26-19246, 2026.

EGU26-19704 | ECS | PICO | HS6.1

Estimating daily high-resolution snow cover in the Central Pyrenees using logistic regression with Sentinel-2 and MODIS data 

Martí Navarro Planes, Xavier Pons, and Lluís Gómez Gener

The presence or absence of snow in the landscape strongly modulates land surface energy exchanges and governs key ecosystem processes in high-mountain catchments. In mid-latitude mountain regions, such as the Pyrenees, which are dominated by intermittent and ephemeral seasonal snowpacks, pronounced intra-annual spatial variability in snow cover complicates the accurate characterisation of snow temporal dynamics.

Although a wide range of snow products and remote sensing platforms are currently available, many of them have significant limitations when applied to complex, mountainous environments such as the Pyrenees. These limitations include data gaps caused by cloud cover and confusion between snow and clouds; reduced accuracy in areas affected by topographic shadows; insufficient illumination due to low solar elevation at the time of satellite overpass; and the trade-off between spatial and temporal resolution. Furthermore, as most existing products are designed for large-scale applications, they can introduce significant errors when high spatial detail is required. This is particularly pertinent in catchment- and sub-catchment-scale hydrological, biogeochemical, and ecological studies.

In this context, we propose a methodological approach that combines the daily temporal resolution of snow gap-filled MODIS products with Sentinel-2-derived snow cover as the ground truth, using k-nearest neighbour (k-NN) classification. We generated daily binary snow presence/absence maps at a spatial resolution of 20 m over the study area using a logistic regression model incorporating general explanatory variables such as elevation, slope, aspect, monthly solar radiation and the spatial and temporal information of snow cover, such as distance-to-snow maps derived from MODIS.

Preliminary results show that the logistic regression framework generates daily snow cover maps that are spatially and temporally consistent, substantially reducing data gaps and improving the representation of intermittent and ephemeral snow zones, which are expected to become increasingly prevalent under future climate change. Model outputs were evaluated against independent ground-based observations, including snow pole measurements, telenivometer data, showing good agreement across elevation gradients and seasons. Together, these results demonstrate the potential of the proposed approach to capture fine-scale spatio-temporal variability in snow cover, providing a robust basis for catchment-scale analyses of snow–hydrology and snow–biogeochemistry interactions in high-mountain regions.

How to cite: Navarro Planes, M., Pons, X., and Gómez Gener, L.: Estimating daily high-resolution snow cover in the Central Pyrenees using logistic regression with Sentinel-2 and MODIS data, EGU General Assembly 2026, Vienna, Austria, 3–8 May 2026, EGU26-19704, https://doi.org/10.5194/egusphere-egu26-19704, 2026.

EGU26-20414 | PICO | HS6.1

Evaluating uncertainties in modeled snow reflectance using UAV-based hyperspectral imaging and multispectral remote sensing 

Eric A Sproles, Dulio Fonseca-Gallardo, Shannon Hamp, Joseph A Shaw, Jeremy Wood, Henna-Retta Hanula, Roberta Pirazzini, and Riley D Logan

Snow albedo is a key control on surface energy balance in snow-covered environments, yet its estimation from multispectral satellite observations remains uncertain due to limited spectral resolution and spatial heterogeneity in snow reflectance. Thus, accurate surface albedo estimates over snow-covered landscapes are critical for the development of reliable satellite-based albedo products. However, validation data in snowy environments remains scarce, especially at high spatial resolution. This is problematic because within a single satellite scene, snow surfaces often exhibit substantial variability that challenges assumptions of spectral homogeneity of snowpack underlying many reflectance-to-albedo parameterizations.


We present a comparative framework that integrates hyperspectral Unmanned Aerial Vehicle (UAV) observations with multispectral satellite data to evaluate the limitations of derived snow albedo within the spectral configurations of Landsat 8, Landsat 9, and Sentinel 2. Our assessment extended across three distinct snowscapes: alpine, prairie, and taiga in Montana (USA), Montana, and Northern Finland; respectively. Our field-based approach employed two commercial hyperspectral sensors (Resonon Pika L and IR-L), to measure surface reflectance across the VIS–NIR–SWIR range (400-1700 nm; Landsat Bands 1-6; Sentinel 2 Bands 1-11) at high spectral (>250 bands) and spatial (0.3 m) resolution.


We isolated snow-only satellite scenes using a Convolutional Neural Network, enabling the identification of heterogeneous snow surfaces within each snowscape. Hyperspectral reflectance measurements were transformed into Landsat- and Sentinel-equivalent band reflectance using weighted sensor response functions, enabling direct band-wise comparison between hyperspectral and multispectral observations.


Our results highlight systematic discrepancies in Landsat reflectance: notably, strong overestimations in Bands 1, 2, and 5, and a consistent underestimation in Band 6 (SWIR1), with surface reflectance biases reaching up to 17%. The CNN-based classification highlighted the high spatial variability in snow reflectance, underscoring the limitations of assuming homogeneous conditions. These findings demonstrate the need to enhance validation strategies for snow-covered regions and provide a scalable protocol that integrates UAV-based acquisitions, high-resolution spectral measurements, and supervised scene analysis. This work contributes to improved characterization of snow albedo uncertainty and supports refinement of satellite-derived snow albedo products for cryospheric applications.

How to cite: Sproles, E. A., Fonseca-Gallardo, D., Hamp, S., Shaw, J. A., Wood, J., Hanula, H.-R., Pirazzini, R., and Logan, R. D.: Evaluating uncertainties in modeled snow reflectance using UAV-based hyperspectral imaging and multispectral remote sensing, EGU General Assembly 2026, Vienna, Austria, 3–8 May 2026, EGU26-20414, https://doi.org/10.5194/egusphere-egu26-20414, 2026.

EGU26-20729 | ECS | PICO | HS6.1

Snow Water Equivalent retrieval and InSAR Coherence modeling using L-band Lutan-1 data 

Jingtian Zhou, Yang Lei, Jinmei Pan, Weiliang Li, and Jiancheng Shi

Snow Water Equivalent (SWE) is a critical parameter in the global and regional water cycle and climate system. However, accurately measuring SWE change using satellite remote sensing remains a challenge. While the Interferometric Synthetic Aperture Radar (InSAR) is a promising technique to retrieve SWE from space, its application has been constrained until recently by the lack of spaceborne observations combining optimal low-frequency (e.g., L-band) radar frequencies with short temporal baselines. Furthermore, interferometric coherence is a key factor that affects the accuracy of the unwrapped phase and the subsequent SWE retrieval. However, the repeat-pass InSAR coherence modelling over snow has not been sufficiently investigated.

Our study presents the first demonstration of SWE change retrieval using spaceborne repeat-pass L-band InSAR observations from the Chinese Lutan-1 mission. The study area focused on the Altay region in Xinjiang, China, during the winter of 2023–2024. Continuous interferometric pairs with 4/8-day temporal baselines are processed for phase changes and then estimate SWE variations. The retrieved SWE change shows a good agreement with in-situ SWE observations during the dry snow period (January 12 to February 9, 2024), with a Root Mean Square Error (RMSE) of 9 mm and a correlation coefficient (R) of 0.48 for the 4-day temporal baselines. However, a heavy snowfall event observed from February 9 to 17, 2024, induced severe decorrelation, leading to phase unwrapping errors that pose a challenge to SWE retrieval. To address the decorrelation mechanism of snow, the InSAR coherence model for snow is established based on the assumption of a bivariate Gaussian distribution for the ground and snow surface. The time-series modeled coherence shows a consistent trend with the observed Lutan-1 coherence, capturing effectively the decorrelation process caused by snowfall events and snow compaction processes. Furthermore, validation of the modeled coherence against Lutan-1 observations shows a strong agreement (R=0.87) over the entire study period from January 12 to March 28, 2024.

Overall, this study demonstrates the capability of spaceborne L-band InSAR with short revisit intervals to effectively retrieve SWE change under appropriate snow conditions. However, the retrieval accuracy is significantly constrained by severe decorrelation during heavy snowfall events. These results highlight both the potential and challenges of operational SWE monitoring from existing and upcoming L-band SAR missions such as Chinese Lutan-1, NASA’s NISAR, JAXA’s ALOS-4, and ESA’s ROSE-L, which are characterized by short repeat cycles, wide swath coverage, and high spatial resolution.

How to cite: Zhou, J., Lei, Y., Pan, J., Li, W., and Shi, J.: Snow Water Equivalent retrieval and InSAR Coherence modeling using L-band Lutan-1 data, EGU General Assembly 2026, Vienna, Austria, 3–8 May 2026, EGU26-20729, https://doi.org/10.5194/egusphere-egu26-20729, 2026.

EGU26-21369 | ECS | PICO | HS6.1

Enhancing Snow Dynamics Monitoring in the Moroccan High Atlas Using Combined Optical and Microwave Satellite Observations 

Hamza Ouatiki, Chaimae Miorqi, Amal Lhimer, and Abdelghani Chehbouni

The seasonal dynamics of snow in Morocco's High Atlas Mountains play a crucial role in the region's water supply, particularly through snowmelt runoff and groundwater recharge in a semi-arid context. Snowmelt provides a significant amount of water to surface and groundwater reservoirs, especially during the summer when precipitation is very rare. However, monitoring snow cover and melt processes in this region remains difficult due to complex topography, high spatial variability, frequent cloud cover in winter, and limited in situ observations. To this end, in this study, we examine the synergistic use of optical and microwave satellite data to improve the monitoring of snow dynamics in the High Atlas.

Optical observations from the Moderate Resolution Imaging Spectroradiometer (MODIS) provide high temporal resolution estimates of snow cover extent, but they are limited by cloud contamination and variable illumination conditions in mountainous terrain. To overcome these limitations, microwave observations from the Sentinel-1 and the Global Microwave Imager (GMI)/Tropical Microwave Imager (TMI) are integrated. The combined optical-microwave framework enables us to improve the temporal continuity and robustness of dynamic snow retrievals, allowing for better characterization of snow accumulation and melt phases across elevation gradients in the High Atlas Mountains, under both clear and cloudy conditions.

The results show that the multi-sensor approach significantly improved the temporal continuity and reliability of snow dynamics monitoring compared to single-sensor approaches. The integration of microwave data allowed for consistent identification of accumulation and melt events, particularly during cloudy periods when MODIS data are not available. In particular, it allowed for better detection of rapid snow events that are often missed by optical data alone and also reduced uncertainty in estimates of snow cover duration, which is essential for assessments of water availability in the High Atlas Mountains. Overall, the approach developed here offers significant potential for improving hydrological modeling and quantifying the contribution of snowmelt to water reservoir storage in semi-arid mountainous regions where data are scarce.

How to cite: Ouatiki, H., Miorqi, C., Lhimer, A., and Chehbouni, A.: Enhancing Snow Dynamics Monitoring in the Moroccan High Atlas Using Combined Optical and Microwave Satellite Observations, EGU General Assembly 2026, Vienna, Austria, 3–8 May 2026, EGU26-21369, https://doi.org/10.5194/egusphere-egu26-21369, 2026.

EGU26-240 | ECS | PICO | HS6.2

Multi-sensor monitoring of soil moisture dynamics in subpolar environments using Sentinel-1 and Sentinel-2 data: A case study from the Falkland Islands 

Nyein Thandar Ko, Alastair Baylis, G.Matt Davies, Deborah Barlow, and Christopher Evans

Monitoring soil moisture is critical for understanding Earth’s climate, hydrological variability, and vegetation dynamics, particularly in remote regions where ground observations are limited. We develop and validate a multi-sensor approach integrating Sentinel-1 radar (2016-2021) and Sentinel-2 optical data (2021-2025) within Google Earth Engine (GEE) to characterize surface soil moisture dynamics across the Falkland Islands. The aim was to evaluate temporal patterns, sensor consistency, and agreement with in-situ measurements. This will provide a continuous nine-year record of soil moisture dynamics to facilitate regional climate change adaptation and mitigation. We used Sentinel-1 synthetic aperture radar (SAR) backscatter to compute a 10-day interval time series of soil moisture index (SMI) through radar backscatter calibration, temporal compositing, and vegetation correction. While Sentinel-1 soil moisture estimates showed limited correlation with in-situ measurements at 20 cm depth (likely due to sensing depth differences) they exhibited moderate to strong correlations with rainfall, supporting the satellite’s ability to capture rainfall-driven hydrological variation. Due to data discontinuities in Sentinel-1 acquisitions after 2021, we used Sentinel-2 imagery to extend the analysis through September 2025. Both datasets were analysed for seasonal and interannual variability and validated against in-situ volumetric soil moisture (VSM) from Temperature Moisture Sensor (TMS) dataloggers installed across representative grassland and peatland habitats. Results reveal coherent seasonal cycles across all major regions of the Falklands, with recurring summer minima and winter maxima corresponding to drought and recharge periods. Overall, both sensors consistently detected the same hydrological patterns, including wet winters and dry summers with interannual variability linked to regional rainfall dynamics rather than spatially distinct behaviours between subregions. The integration of optical and radar observations provides a robust means of monitoring soil-moisture variability in remote environments. This multi-sensor framework supports future data assimilation, drought assessment, and climate-impact studies. Establishing long-term monitoring that integrates multi-sensor approaches is essential to understand the Falklands’ evolving hydrological and ecological trends.

Keywords: Soil moisture; Remote sensing; Sentinel-1; Sentinel-2; Google Earth Engine.

How to cite: Ko, N. T., Baylis, A., Davies, G. M., Barlow, D., and Evans, C.: Multi-sensor monitoring of soil moisture dynamics in subpolar environments using Sentinel-1 and Sentinel-2 data: A case study from the Falkland Islands, EGU General Assembly 2026, Vienna, Austria, 3–8 May 2026, EGU26-240, https://doi.org/10.5194/egusphere-egu26-240, 2026.

Agricultural drought occurs when soil moisture available to crops is inadequate to meet their water requirements, resulting in reduced crop yields and agricultural production. Therefore, it is crucial to accurately monitor agricultural drought for effective irrigation planning and scheduling, water resources management and allocation, and food security protection. Soil moisture is a fundamental variable for estimating agricultural drought indicators; thus, reliable, accurate, continuous, and long-term datasets are essential for effective drought monitoring. L-band radiometry is the most effective passive microwave remote sensing technique for estimating global soil moisture. The ESA Soil Moisture and Ocean Salinity (SMOS) and NASA Soil Moisture Active Passive (SMAP) missions, launched in 2009 and 2015, respectively, were developed specifically to retrieve Surface Soil Moisture (SSM) at L-band (1.4 GHz) for the top 5 cm of soil, with a target accuracy of 0.04 m³ m⁻³. These missions also generate Root Zone Soil Moisture (RZSM) at 0–100 cm depth through assimilation of SSM into land surface models. Agricultural drought can be detected using the Soil Water Deficit Index (SWDI) and Soil Moisture Drought Index (SMDI) derived from SMAP and SMOS satellite-based soil moisture products. The Karkheh River Basin is one of the most important watersheds and agricultural regions in southwestern Iran, with a semi-arid to arid climate, which has experienced frequent droughts in recent years. This study evaluates the efficiency of SMOS and SMAP products for agricultural drought monitoring using the SMDI and SWDI indices over the Karkheh River Basin.

How to cite: Jamei, M., Asadi Oskouei, E., and Jamei, M.: Evaluation of SMAP and SMOS Microwave Satellite Soil Moisture Products for Agricultural Drought Monitoring: Karkheh River Basin Case Study, Iran, EGU General Assembly 2026, Vienna, Austria, 3–8 May 2026, EGU26-660, https://doi.org/10.5194/egusphere-egu26-660, 2026.

EGU26-703 | ECS | PICO | HS6.2

Fresnel-Based Reflectivity Index for Surface Soil Moisture Retrieval from Multi-Polarization SAR Observations 

Vaibhav Gupta, Mehrez Zribi, Nicolas Baghdadi, and Sekhar Muddu

In this study, we assess the performance of a recently proposed reflectivity index (IR), derived from Fresnel coefficients and implemented through a change-detection approach for soil moisture retrieval (Zribi et al., 2020). Initially developed for Sentinel-1 VV polarization, the IR is theoretically linked to surface dielectric properties and therefore to surface soil moisture (SSM). We extend its evaluation by integrating dual-frequency SAR observations from Sentinel-1 (VV) and EOS-04 (HH) acquired over a three-year period across three monitoring sites in the Berambadi watershed, India. At each site, multi-depth HydraProbe sensors were deployed to provide high-quality in-situ SSM measurements for validation. All satellite acquisitions from both missions were standardized to comparable spatial resolution (30 m) and matched for similar incidence angles to ensure consistency. Results show that the IR exhibits stronger sensitivity to SSM in VV polarization than in HH, yielding improved retrieval performance across heterogeneous land surface conditions. Nonetheless, the effectiveness of the IR decreases with increasing soil moisture, with a more pronounced reduction in sensitivity observed for VV polarization. Overall, the findings demonstrate the suitability of the IR for operational soil moisture monitoring and highlight the important role of polarization and moisture regime in controlling its performance.

How to cite: Gupta, V., Zribi, M., Baghdadi, N., and Muddu, S.: Fresnel-Based Reflectivity Index for Surface Soil Moisture Retrieval from Multi-Polarization SAR Observations, EGU General Assembly 2026, Vienna, Austria, 3–8 May 2026, EGU26-703, https://doi.org/10.5194/egusphere-egu26-703, 2026.

EGU26-765 | ECS | PICO | HS6.2

Behaviour of NISAR L and S band Backscatter for Soil Moisture and Crop Water Monitoring in India’s Mixed Cropping Landscapes 

Parekattuvalappil Shaju Anjali, Vaibhav Gupta, Jasmeet Judge, Debsunder Dutta, Elakkiyaa Thiyagarajan Logambal, Dnyaneshwar Gawai, Pratik Vithal Tikhe, Vidisha Chothani, Prem Singh Katroth, Nikhil Anand, Milan Goyal, Sonu Singh, Soundarrajan Murugeshan, and Sekhar Muddu

Understanding crop water status and soil moisture dynamics in heterogeneous agricultural landscapes remains a major challenge for microwave remote sensing, especially when multiple crop types coexist within a single pixel. With the NISAR mission providing fully polarimetric L- and S-band SAR observations, there is a unique opportunity to evaluate its retrieval capability in complex mixed-cropping systems.

In this study, we conduct an intensive field campaign across irrigated and rainfed plots in southern India to assess how NISAR L- and S-band backscatter responds to variations in vegetation water content (VWC) and surface soil moisture (SSM) under heterogeneous conditions. Each satellite-aligned pixel in the study region typically contains 4-5 crop types with distinct canopy structures and rooting characteristics. For selected NISAR acquisition dates, we measure VWC through destructive sampling of each crop species present within the pixel. Concurrently, surface soil moisture is measured using both handheld probes and permanently installed soil moisture sensors deployed across the heterogeneous fields to capture intra-pixel variability.

By combining in-situ VWC, multi-depth soil moisture observations, and crop-wise metadata with co-located NISAR L- and S-band backscatter, we evaluate (i) the sensitivity of each band to mixed vegetation conditions, (ii) the ability to distinguish irrigated vs. rainfed water-use patterns, and (iii) the impact of intra-pixel crop diversity on retrieval accuracy. This work provides one of the first ground-based evaluations of NISAR performance in complex Indian agroecosystems and contributes toward developing improved retrieval approaches for crop water assessment and soil moisture estimation in heterogeneous landscapes.

How to cite: Anjali, P. S., Gupta, V., Judge, J., Dutta, D., Thiyagarajan Logambal, E., Gawai, D., Tikhe, P. V., Chothani, V., Katroth, P. S., Anand, N., Goyal, M., Singh, S., Murugeshan, S., and Muddu, S.: Behaviour of NISAR L and S band Backscatter for Soil Moisture and Crop Water Monitoring in India’s Mixed Cropping Landscapes, EGU General Assembly 2026, Vienna, Austria, 3–8 May 2026, EGU26-765, https://doi.org/10.5194/egusphere-egu26-765, 2026.

EGU26-1263 | ECS | PICO | HS6.2

Quantifying the benefits of incorporating vegetation heterogeneity in farm-scale soil moisture simulations 

U Krishnan Vishnu, Noemi Vergopolan, Karthikeyan Lanka, and Indu Jayaluxmi

More than 80% of the world’s farms are small, with a farm size of less than 2 hectares. Under such highly fragmented agricultural systems, smallholder farmers require accurate, field-scale predictions of soil moisture and irrigation requirements that can capture local variability. Vegetation heterogeneity plays a crucial role in shaping soil moisture variability across various spatial scales. At the field scale, differences in crop types, cropping patterns, and management practices can substantially alter soil-water dynamics.

Traditional Land Surface Models (LSMs) simulate land surface processes with spatial, temporal, and physical consistency. However, their typically coarse spatial resolution (>10 km) fails to resolve the sub-grid heterogeneity relevant for small and marginal farms. While hyper-resolution (<100 m resolution) LSMs have the potential to simulate land surface processes at the field scale, many of their processes, including vegetation dynamics, are heavily parameterized. Previous studies have highlighted the sensitivity of soil moisture to Leaf Area Index (LAI), but the reliance of LSMs on lookup-table LAI parameterization introduces substantial errors in simulating crop phenology, yield, and growing-season length, especially in regions like India with a prevailing fragmented agricultural system. These errors arise from the assumption of uniform parameter values across different climatic regions and crop types, disregarding the scale effects of vegetation and soil heterogeneity. Addressing these limitations requires region-specific parameterization or using satellite-based LAI values in simulating soil moisture to enhance the accuracy of soil moisture predictions and improve the representation of vegetation dynamics in LSMs.

The present study evaluates the benefits of using satellite LAI data in generating a field-scale soil moisture simulation. Towards this, we set up HydroBlocks, a hyper-resolution LSM over Upper Bhima Basin, in India, to simulate 3-hourly 30 m resolution surface (0-5 cm)and root zone (0-30 cm) soil moisture. The Upper Bhima Basin is a sub-basin of the Krishna River, lying predominantly on the leeward side of the Western Ghats. The study area has the majority of its land under croplands and receives relatively low rainfall, making it an ideal location for studying soil moisture variability under varying vegetation conditions. In this study, we made four HydroBlocks simulation experiments with LAI data from different sources: 1) the default lookup table values, 2) monthly climatological  LAI data derived from MODIS for each land use land cover class, 3) assimilating MODIS  LAI data using the direct insertion technique, and 4) using the dynamic vegetation module. We compared the spatial and temporal dynamics of soil moisture simulation from different experiments. Further, we statistically evaluated both surface and root-zone soil moisture simulations against in situ observations.

How to cite: Vishnu, U. K., Vergopolan, N., Lanka, K., and Jayaluxmi, I.: Quantifying the benefits of incorporating vegetation heterogeneity in farm-scale soil moisture simulations, EGU General Assembly 2026, Vienna, Austria, 3–8 May 2026, EGU26-1263, https://doi.org/10.5194/egusphere-egu26-1263, 2026.

EGU26-1588 | ECS | PICO | HS6.2

Soil Moisture Retrieval in the Presence of Vegetation Using Dual-polarisation Data 

Marion Dugué, Nikita Basargin, and Irena Hajnsek

When retrieving the surface soil moisture over agricultural fields using Synthetic Aperture Radar (SAR), vegetation absorbs and scatters the signal, which then hinders the analysis of the underlying soil [1,2]. One method to circumvent this is by decomposing the radar signal into three components: surface, dihedral, and volume scattering [3,4]. Recent advancements have extended these models into a tensor framework and incorporated spatial information to then invert the geophysical parameters of the models and retrieve soil moisture for a wider range of crop scenarios  [5]. The soil moisture is retrieved through numerical optimization of the models' geophysical parameters. 

In this work, we compare the information loss when retrieving soil moisture using the tensor-based decomposition between full-polarisation and dual-polarisation inversion. We assess the ambiguity of parameter retrieval for different combinations of dual-polarisation channels and conclude on which set-up of dual-polarisations with VV, VH, and/or HH provides the most constrained and thus most optimal soil moisture retrieval with the tensor decomposition technique. 

This work is implemented using the full-pol airborne F-SAR data from DLR and soil moisture retrieval from the inversion is compared with ground measurements taken during the AgriROSE-L campaign around Munich, Germany, in 2025. 


[1] I. Hajnsek, E. Pottier and S. R. Cloude, "Inversion of surface parameters from polarimetric SAR," in IEEE Transactions on Geoscience and Remote Sensing, vol. 41, no. 4, pp. 727-744, April 2003, doi: 10.1109/TGRS.2003.810702.

[2] Dipankar Mandal, Vineet Kumar, Debanshu Ratha, Subhadip Dey, Avik Bhattacharya, Juan M. Lopez-Sanchez, Heather McNairn, Yalamanchili S. Rao, Dual polarimetric radar vegetation index for crop growth monitoring using sentinel-1 SAR data, Remote Sensing of Environment,  https://doi.org/10.1016/j.rse.2020.111954.

[3] Freeman, Anthony, and Stephen L. Durden. "A three-component scattering model for polarimetric SAR data." IEEE transactions on geoscience and remote sensing 36.3 (2002): 963-973.

[4] Yamaguchi, Yoshio, et al. "Four-component scattering model for polarimetric SAR image decomposition." IEEE Transactions on geoscience and remote sensing 43.8 (2005): 1699-1706

[5] Basargin, N., Alonso-González, A., & Hajnsek, I. “Model-based tensor decompositions for soil moisture estimation.” Proceedings of the European Conference on Synthetic Aperture Radar, EUSAR (2024)

How to cite: Dugué, M., Basargin, N., and Hajnsek, I.: Soil Moisture Retrieval in the Presence of Vegetation Using Dual-polarisation Data, EGU General Assembly 2026, Vienna, Austria, 3–8 May 2026, EGU26-1588, https://doi.org/10.5194/egusphere-egu26-1588, 2026.

Soil moisture is critical for understanding hydrological processes, with applications spanning weather forecasting, agricultural management, and flood prediction. However, the fundamental requirement is not merely large data volumes, but gap-free observations with spatiotemporal continuity. Gap-free data is essential to preserve long-term time series characteristics and comprehensively understand hydrological processes. More critically, in climate modeling and extreme event forecasting under climate change, seamless observations are fundamentally required—even sporadic gaps can fundamentally alter predictions.

The SMAP L3 AM (descending) product is widely recognized as a representative remote sensing product at 36 km resolution. Even accounting for the 2-3 day orbital revisit cycle, temporal coverage is severely limited: land grids average 62% temporal gaps, rising to 71% after quality control, with numerous regions experiencing over 80% data unavailability. This extreme temporal sparsity, driven by orbital constraints, RFI, and retrieval algorithm limitations, fundamentally limits applications requiring continuous observations.

Various methods have been developed to interpolate these temporal gaps. Approaches include data fusion using ground and satellite observations, or employing data assimilation through hydrological modeling to fill gaps. Recently, methods using deep learning models—which demonstrate high predictive performance—have been extensively researched for gap-filling. However, these methods suffer from critical limitations: (i) many existing interpolation methods distort data by ignoring the inherent characteristics of the original observations; (ii) when using external data sources, uncertainties such as sensor inconsistencies, temporal misalignments, and simultaneous missing data issues are introduced; and (iii) deep learning often fails to reflect underlying physical processes, producing unexplainable black-box results.

To address these limitations, this study proposes a hybrid framework that combines a Water Balance Model (WBM) with MDN-ConvLSTM (Mixture Density Network-Convolutional Long Short-Term Memory). The framework employs residual learning, where the WBM provides physically consistent baseline predictions and the MDN-ConvLSTM learns systematic differences between model estimates and SMAP observations. The MDN captures residual characteristics inherent to SMAP, enabling reconstruction using only SMAP observations. This design maintains physical interpretability while leveraging deep learning for complex residual patterns, marking the first MDN application to satellite soil moisture reconstruction.

The study compares two learning strategies and three spatial scales (16×16, 32×32, 64×64 pixels): Closed-Loop (using actual SMAP when available) and Open-Loop (recursively using own predictions), evaluating model stability, long-term gap response, and feasibility as proxy observations. Validation against original SMAP demonstrates successful reconstruction of temporally seamless SMAP-like data (ubRMSE = 0.029 m³/m³, R = 0.726, KGE = 0.679). Notably, Open-Loop achieved comparable performance to Closed-Loop, demonstrating robustness with limited data and potential as reliable proxy observations during satellite outages. This physics-guided residual learning approach establishes a novel paradigm combining physics-based water balance modeling with data-driven residual learning using only the target satellite product.

(This work was supported by the National Research Foundation of Korea(NRF) grant funded by the Korea government(MSIT) (RS-2025-23523230))

How to cite: Hong, C. and Kim, S.: Reconstruction of SMAP L3 Soil Moisture Data Using a Physical-Deep Learning Based Hybrid Approach, EGU General Assembly 2026, Vienna, Austria, 3–8 May 2026, EGU26-2704, https://doi.org/10.5194/egusphere-egu26-2704, 2026.

EGU26-3292 | PICO | HS6.2

Monitoring of vegetation and drought in France using the ISBA land surface model and satellite data 

Jean-Christophe Calvet, Yann Baehr, Bertrand Bonan, and Pierre Vanderbecken

The 2022 drought in Western Europe exposed major shortcomings in Europe's strategies for managing drought risk. In France, the drought was characterised by an unprecedented number of vegetation fires, as well as damage to buildings caused by clay shrink-swell. This has led to a growing awareness of the risks associated with drought and highlighted the need to improve climate risk management capabilities. While land surface models (LSMs) offer continuous temporal and spatial coverage, they may struggle to accurately represent certain processes due to their complexity. As LSMs cannot represent all relevant processes, data assimilation (DA) can be used to update them with observational data. This improves LSMs' capacity to monitor soil and vegetation variables driven by climatic and anthropogenic factors. In this study, we use the interactions between soil, biosphere and atmosphere (ISBA) land surface model within the SURFEX modelling platform, which was developed by Météo-France, to monitor land surface variables and characterise droughts. We analyse leaf area index (LAI) and root-zone soil moisture (RZSM) using sequential data assimilation (DA) and machine learning (ML) techniques in near-real time at a high spatial resolution, combining AROME weather forecast model forecasts with Copernicus Land Monitoring Service (CLMS) LAI observations derived from Sentinel-3. We use a satellite data assimilation system (LDAS, or Land Data Assimilation System) to correct ISBA model simulations by integrating LAI observations. We will present examples of applications related to monitoring natural hazards (e.g. clay shrinkage, wildfires and flash floods) in the context of the Integrated Research Insight into Climate Risks (IRICLIM) project (https://www.pepr-risques.fr/fr/projets-cibles/iriclim-recherche-integree-sur-risques-lies-au-climat).

How to cite: Calvet, J.-C., Baehr, Y., Bonan, B., and Vanderbecken, P.: Monitoring of vegetation and drought in France using the ISBA land surface model and satellite data, EGU General Assembly 2026, Vienna, Austria, 3–8 May 2026, EGU26-3292, https://doi.org/10.5194/egusphere-egu26-3292, 2026.

EGU26-3899 | ECS | PICO | HS6.2

To Average or Not to Average? Using ground reference networks to validate satellite soil moisture products  

Johanna Lems, Wouter Dorigo, and Alexander Gruber

The validation of remotely sensed Soil Moisture (SM) products against ground reference data is strongly affected by the spatial scale mismatch between the large satellite footprints and point-scale in situ measurements, exacerbated by differences in station density across in situ monitoring networks. A common but inconsistently applied practice is to average multiple in situ sensors falling within a single satellite grid cell prior to validation. However, there is currently no clear consensus on whether spatial averaging provides a more reliable reference for satellite validation.

In this study, we systematically assess the impact of spatially averaging in situ soil moisture measurements from different sensors of the International Soil Moisture Network (ISMN) on the validation of soil moisture products from the ESA Climate Change Initiative (CCI). The ESA CCI SM product is provided on a 0.25° grid (approximately 25 × 25 km). More than 20% of the CCI grid cells, with in situ stations on them, contain two or more in situ sensors, with an average of 9 sensors per such grid cell. Averaging these sensors within single grid cells may provide a more reliable proxy for grid cell average soil moisture dynamics, but only if their measurements are mutually consistent. Alternatively, satellite products may be compared against each sensor individually, but this causes grid cells that contain multiple sensors to be disproportionately represented in validation summary statistics, potentially biasing validation metrics.
We therefore examine the implications of different spatial averaging choices to answer the question of when and how in situ measurements from dense networks should be averaged for the validation of satellite products.

Our results suggest that, in most cases, averaging measurements from multiple, spatially distributed sensors yields more reliable reference time series that improve in situ-satellite comparison metrics. However, we also see a considerable number of cases where averaging sensors reduces the reliability of the time series, most commonly when averaging measurements from different sensor types. Our findings highlight the importance of methodological consistency and provide guidance for the validation of current and future satellite soil moisture products.

How to cite: Lems, J., Dorigo, W., and Gruber, A.: To Average or Not to Average? Using ground reference networks to validate satellite soil moisture products , EGU General Assembly 2026, Vienna, Austria, 3–8 May 2026, EGU26-3899, https://doi.org/10.5194/egusphere-egu26-3899, 2026.

EGU26-5483 | ECS | PICO | HS6.2

Monitoring groundwater dynamics across scales through satellite soil moisture: preliminary results from a novel PhD project 

Margherita Raffaella Blois, Jacopo Dari, Alessia Flammini, Renato Morbidelli, and Luca Brocca

Groundwater is the primary source of accessible freshwater globally, playing a vital role in food security, water supply, and industrial activities. However, excessive abstractions exacerbated by climate change and population growth scenarios threaten long-term availability of groundwater resources. In this context, Earth Observation technologies offer innovative monitoring solutions. Relying on the preliminary findings by Dari et al. (2025) through the SM-Inversion algorithm, this PhD project aims to expand the framework of monitoring groundwater dynamics through remotely sensed soil moisture. The assessment of the extent at which data resolution can be an issue, the upscaling across scale (regional, country, global), and the exploration of synergies with gravimetry missions are among the long-term objectives of the project. In fact, SM-Inversion method enables the estimation of aquifer recharge rates by integrating satellite soil moisture data at various spatial resolutions, in order to evaluate the accuracy of estimates across scales. Preliminary results obtained over eleven aquifers located in the Murray-Darling Basin (Australia) are presented here. Five remote sensing soil moisture products are evaluated: ASCAT (Advanced SCATterometer), CCI (Climate Change Initiative) Combined, CCI Passive, SMAP (Soil Moisture Active Passive), and SMOS (Soil Moisture and Ocean Salinity). Potential evaporation rates from GLEAM (Global Land Evaporation Amsterdam Model) and precipitation from ERA5 (European ReAnalysis-v5) are also used in the proposed aquifer-scale analysis.


References:

Dari, J., Filippucci, P., Brocca, L., Quast, R., Vreugdenhil, M., Miralles, D., Morbidelli, R., Saltalippi, C., and Flammini, A.: A novel approach for estimating groundwater recharge leveraging high-resolution satellite soil moisture, Journal of Hydrology, 652, 132678, https://doi.org/10.1016/j.jhydrol.2025.132678, 2025.

How to cite: Blois, M. R., Dari, J., Flammini, A., Morbidelli, R., and Brocca, L.: Monitoring groundwater dynamics across scales through satellite soil moisture: preliminary results from a novel PhD project, EGU General Assembly 2026, Vienna, Austria, 3–8 May 2026, EGU26-5483, https://doi.org/10.5194/egusphere-egu26-5483, 2026.

EGU26-5764 | ECS | PICO | HS6.2

Investigating the Climatic Drivers of Seasonal Ground Motion through Multisensor SAR Soil Moisture 

Benedetta Brunelli, Francesca Grassi, and Francesco Mancini

Seasonal ground deformations are caused by climatic and geophysical factors, including annual temperature fluctuations, elastic lithosphere response, and variations in soil moisture (SM) and groundwater levels. In particular, expansive clayey soils undergo volumetric changes depending on their moisture content, swelling with high SM and shrinking during dry periods. These processes can damage buildings, infrastructures, and hamper slope stability.

This study analyzes the impact of SM and land surface temperature (LST) on seasonal ground deformations in the Po Valley, characterized by clay–rich soils and highly vulnerable to climate-change drought. The analysis covers the period 2020–2023 at 500 m resolution, combining downscaled SMAP SM data, European Ground Motion Service (EMGS) deformation data, and MODIS LST.

SM is downscaled from 9 km to 500 m using an Extreme Gradient Boost model, trained on aggregated Sentinel-1, ALOS, and SAOCOM backscatter data and static variables. The model obtains a R²=0.80 and RMSE=0.012 m³/m³ on the test set, while validation against in-situ measurements shows improved correlation (0.6 vs 0.5) and reduced relative error (6% vs 10%) compared to the original SMAP product.

EGMS displacement time series are averaged within the 500 m cells, and seasonal deformations are extracted using a Loess method and analyzed using correlation and lagged correlation approaches. 33.5% of the samples show seasonal amplitudes greater than 2.5 mm, consistent with swelling–shrinking effects. For about half of the dataset, Spearman correlations with LST are above 0.6, while for SM are weaker (0.3). Time-lag analysis revealed that SM effects peak near zero lag but can persist up to 30 days due to groundwater influence, whereas LST effects are mostly instantaneous or exhibit lags up to 15 days.

Multivariate regression analysis quantifies the independent contributions of SM and LST: 16% of samples has R²≥0.8, indicating that these drivers explain most of the seasonal variability, 38% has 0.5≤R²<0.8, and the 46% shows R²<0.5, suggesting that other factors may be dominant. SM-driven deformations are located in valley areas, while LST-dominated signals are prevalent in mountainous zones.

These results demonstrate the effectiveness of the downscaling approach in improving SM estimation and show that SM and LST jointly explain most seasonal deformations in over half of the analyzed samples. However, SM-driven deformation is detectable in a limited number of samples, and can be masked by thermal expansion. Future work should integrate groundwater and geological data and exclude scatterers with high temperature sensitivity to better isolate SM-induced deformations.

This work was supported by the Università di Modena e Reggio Emilia – Fondazione di Modena Project “Ensembling SATellite monitoring and BIM methods in the SAFety assEssment of road infrastructure (SATSAFE)”, FAR 2024 - Bando per il finanziamento di progetti di ricerca interdisciplinari.

How to cite: Brunelli, B., Grassi, F., and Mancini, F.: Investigating the Climatic Drivers of Seasonal Ground Motion through Multisensor SAR Soil Moisture, EGU General Assembly 2026, Vienna, Austria, 3–8 May 2026, EGU26-5764, https://doi.org/10.5194/egusphere-egu26-5764, 2026.

EGU26-8188 | ECS | PICO | HS6.2

Assessment of bias correction techniques for satellite soil moisture data assimilation in the dry season of Southeastern South America 

Fabricio Matias Obregon, Manuel Pulido, María Magdalena Lucini, Omar Muller, and Romina Ruscica

Estimation of surface soil moisture (SSM) is fundamental for hydrological monitoring and agricultural management, particularly in regions affected by recurrent droughts such as central–northeastern Argentina. Data assimilation techniques provide a robust approach to estimating SSM variability by integrating numerical soil models—i.e., land surface models—with observations from satellite-based remote sensors. Satellite missions based on L-band microwave sensors, such as NASA’s SMAP and ESA’s SMOS, provide global SSM retrievals, yet these observations often exhibit systematic biases arising from instrument noise, indirect measurements (i.e., observational operator), and temporal and spatial heterogeneities. Within data assimilation techniques, the ensemble Kalman filter (EnKF) has been widely employed for SSM estimation. This algorithm assumes unbiased observations; thus, bias correction becomes necessary to ensure optimal assimilation. In this study, we evaluate three off-line observational bias-correction techniques within a land data assimilation framework based on the Noah-MP v4.0.1 land surface model and an EnKF. The assessment focuses on the 2022 dry season over the endorheic Pampas region. We introduce a bias correction approach to mitigate sampling errors in cumulative distribution function (CDF) matching: (i) the climatological statistics are  computed using homogeneous soil texture pixels within the bin, and (ii) a 45-day moving temporal sampling window is used to give a smoother evolution of the CDF. During dry periods, we empirically demonstrate that soil moisture probability density functions are statistically distinguishable across different soil textures within the bin. Furthermore the monthly-fixed statistics exhibited jumps during the dry season. This approach is compared with the standard CDF matching and the normal deviate scaling. These three off-line bias correction techniques are applied to correct SMAP and SMOS satellite retrievals prior to data assimilation. We show that this improved statistical sampling for CDF matching has a non-negligible impact on the SSM estimates resulting from  EnKF, particularly during dry periods. The corrected sampling of CDF matching shows better alignment and stronger correlation with the time series of the independent in-situ soil moisture measurements. Overall, the study emphasizes the need for context-aware bias-correction techniques to enhance SSM data assimilation in regions with strong seasonal precipitation variations. Moreover, SSM estimations influence deeper model layers through vertical propagation of the information. These results motivate future work exploring how surface corrections might lead to enhanced subsurface estimates.

How to cite: Obregon, F. M., Pulido, M., Lucini, M. M., Muller, O., and Ruscica, R.: Assessment of bias correction techniques for satellite soil moisture data assimilation in the dry season of Southeastern South America, EGU General Assembly 2026, Vienna, Austria, 3–8 May 2026, EGU26-8188, https://doi.org/10.5194/egusphere-egu26-8188, 2026.

EGU26-10162 | ECS | PICO | HS6.2

Investigating the global representativeness of the ESA CCI RZSM product 

Bettina Kroyer, Johanna Lems, and Wouter Dorigo

Root-Zone Soil Moisture (RZSM) is critical for understanding hydrological processes, predicting droughts, and improving agricultural yield forecasts. As RZSM cannot be directly measured by satellites, a simple Exponential Filter (EF) model is applied to the ESA Climate Change Initiative (CCI) Soil Moisture (SM) product to derive a global satellite-based RZSM product. The EF model uses a single parameter, T, to smooths and temporally delay the surface SM signal to estimate RZSM at three depth layers (0–10 cm, 10–40 cm, and 40–100 cm). Previously, the T parameter was defined with vertical variability only (one value per depth layer), and was otherwise assumed to be globally constant. The T parameter is calibrated for each RZSM layer based on in-situ observations of the International Soil Moisture Network (ISMN). Consequently, the resulting RZSM product is strongly influenced by the in-situ data used for calibration. Given that ISMN stations are unevenly distributed globally, the calibrated T parameter may not be fully representative at the global scale.

To investigate how the choice of ISMN stations influences the optimal T per depth layer, pre-filtered ISMN stations were first characterized according to land cover class (ESA CCI), climate class (Köppen-Geiger classification) and soil texture (USDA soil triangle). Based on these characteristics, station selection methods were defined to better match the global distributions of the characterization variables. The resulting T values were then compared to those without deliberate station selection.

This method did not result in major changes to the T parameter across the different station selection methods, demonstrating the stability of the EF model. However, the effectiveness of station selection is constrained by the spatial coverage of the ISMN, with some land cover, climate and soil texture classes represented by few or no stations. This limited coverage leads to deviations from the corresponding global distributions. Increasing numbers of ISMN stations and improved representativeness of the limiting classes in the future calls for further research.

How to cite: Kroyer, B., Lems, J., and Dorigo, W.: Investigating the global representativeness of the ESA CCI RZSM product, EGU General Assembly 2026, Vienna, Austria, 3–8 May 2026, EGU26-10162, https://doi.org/10.5194/egusphere-egu26-10162, 2026.

EGU26-10506 | PICO | HS6.2

Evaluation and application of medium resolution soil moisture data over Sub-Saharan Africa 

Christopher Taylor, Jawairia Ahmad, Bethan Harris, Dávid Kovács, Colin Moldenhauer, Wouter Dorigo, and Adrià Amell

Surface soil moisture exhibits strong day-to-day variability in response to antecedent rainfall. On scales beyond a few kilometres, soil moisture can generate daytime mesoscale circulations via sensible heat flux gradients which may influence the development of new convective rain events, creating a feedback loop. Numerical model simulations struggle to capture such feedbacks, due to shortcomings in the representations of convection, the water stress control on evapotranspiration, and uncertainties in the soil moisture itself. On the other hand, recent analysis of satellite observations has illustrated the importance of such feedbacks on storm initiation across Sub-Saharan Africa (Taylor et al, 2026). Here we examine how well observed mesoscale soil moisture structures across Africa are captured in medium resolution (0.1 degree) products generated within the European Space Agency Climate Change Initiative Soil Moisture project.

We use two approaches to evaluate soil moisture products at the mesoscale. Both are based on simple spatial correlations at the sub-1 degree scale with independent observations of related variables. Firstly, we quantify the spatial consistency between changes in soil moisture over 12 hours (consecutive overpasses) and accumulated precipitation. Interestingly, this analysis highlights the shortcomings of well-used precipitation products (e.g. IMERG) at this scale compared to a recent deep learning-based product (Rain Over Africa; Amell et al 2025). Secondly, we compare patterns of anomalous soil moisture with daytime Land Surface Temperature (LST) from Thermal Infrared imagery. We find that the active microwave-based ASCAT soil moisture product (with effective spatial resolution ~15km) outperforms passive microwave-based products (SMAP, SMOS, AMSR-2) and model-based ERA5-Land data in this exercise, with consistently stronger negative soil moisture-LST correlations . Finally, we use medium resolution soil moisture to demonstrate an impact on convective activity.

Amell, A., Hee, L., Pfreundschuh, S., & Eriksson, P. (2025). Probabilistic Near-Real-Time Retrievals of Rain Over Africa Using Deep Learning. Journal of Geophysical Research: Atmospheres. https://doi.org/https://doi.org/10.1029/2025JD044595  

Taylor, C. M., Klein, C., Barton, E. J., Hahn, S., & Wagner, W. (2026). Wind shear enhances soil moisture influence on rapid thunderstorm growth. Nature. https://www.nature.com/articles/s41586-025-10045-7  

How to cite: Taylor, C., Ahmad, J., Harris, B., Kovács, D., Moldenhauer, C., Dorigo, W., and Amell, A.: Evaluation and application of medium resolution soil moisture data over Sub-Saharan Africa, EGU General Assembly 2026, Vienna, Austria, 3–8 May 2026, EGU26-10506, https://doi.org/10.5194/egusphere-egu26-10506, 2026.

EGU26-11438 | ECS | PICO | HS6.2

Characterisation of extreme events through satellite and model-based soil moisture products over Europe and Africa  

Jaime Gaona, Luca Brocca, Vaibhav Kumar, Paolo Filipucci, Mohamad Usman Liaqat, and Imane Serbouti

Records of soil moisture dynamics are the land register of the convolution of footprints of the multiple water fluxes that intervene in the soil. Therefore, the variability of soil moisture changes occurring at a specific location expresses not only the stochastic nature of soil moisture but, more importantly, differences in the statistics of their distribution in space and time, which can be used to classify patterns of soil moisture regime across space and time. 

The analysis of hydrological extremes often deals with the scarcity of data (i.e. insufficient extreme events contained in the series, which biases the range of values from reality). Fortunately, earth observation data is increasingly providing reliable distributed datasets whose spatial detail can compensate for the limitation in time length. This is particularly true for soil moisture data whose ground records rarely surpass decades but whose distributed data is achieving resolutions that, despite persistent applicability limits below certain resolutions, can ease the analysis of soil moisture variability. 

Accordingly, this study analyses the temporal changes in soil moisture of various types of soil moisture products across all cells of the adopted 5 x 5 Km grid across Europe and Africa, in both the rewetting and drying signs of change, with the aim of finding distinct ranges and frequency-magnitude characteristics along the distribution of soil moisture changes. Special attention is devoted to the soil moisture changes distribution’s upper tail (extreme events like floods (positive change) and flash drought (negative change)) and lower tail (detection limit, product sensitivity).  

Three types of soil moisture products are used (remote sensing passive: ESA CCI passive subset; remote sensing active: EUMETSAT ASCAT; and model-based: LISFLOOD model integrated in the European Copernicus Emergency Monitoring System (CEMS)) to evaluate their ability to show consistency across ranges of the distribution of soil moisture changes so that it can ensure the efficacy of monitoring systems integrating earth observation and modelling data. 

The analyses to extremes applied to soil moisture change data show results consistent and complementary to those published for rainfall and runoff generation, identify the areas where soil moisture mediation of the water cycle is more relevant in relation to hydrological regime classification and map thresholds of impactful events.  

But more importantly, results reveal notable disparity in the estimation of the relevance of an event (magnitude (expressed as intensity of change) and occurrence (expressed in frequency or return period), particularly in the most impactful cases of extreme events, entailing gaps between the dynamics detected by current soil moisture products and their true dynamics. Such disparities among datasets must be prevented from propagating to monitoring systems. 

Therefore, the approach provides insights for the continuous upgrading of the products’ consistency (i.e. remote sensing and model-based datasets), while encourages adopting metrics of distribution consistency in the early warning system pipelines, particularly across impactful ranges of soil moisture value change, to improve the monitoring accuracy according to the regional characteristics, with subsequent benefits to the efficacy of responses to the impacts. 

How to cite: Gaona, J., Brocca, L., Kumar, V., Filipucci, P., Liaqat, M. U., and Serbouti, I.: Characterisation of extreme events through satellite and model-based soil moisture products over Europe and Africa , EGU General Assembly 2026, Vienna, Austria, 3–8 May 2026, EGU26-11438, https://doi.org/10.5194/egusphere-egu26-11438, 2026.

EGU26-14005 | ECS | PICO | HS6.2

Quality Assurance for Soil Moisture (QA4SM) - A Centralized Soil Moisture Validation and Inter-Comparison Platform 

Fabian Unterasinger, Daniel Aberer, Thomas Unterholzner, Svetlana Shmeleva, Wolfgang Preimesberger, Daria Ilina, Johanna Lems, Alexander Boresch, Zoltan Bakcsa, Arnoud Mialon, Safa Bousbih, Wouter Dorigo, Alexander Gruber, Raffaele Crapolicchio, and Klaus Scipal

Quality Assurance for Soil Moisture (QA4SM, available at https://qa4sm.eu/) is a centralized, cloud-based online tool for satellite soil moisture data validation that was launched in 2018. Via an easy-to-use web interface, the platform is designed to simplify the systematic intercomparison of satellite measurements, land surface models and reanalysis fields and validate them against globally available fiducial reference measurements (FRMs) from the International Soil Moisture Network (ISMN; https://ismn.earth). The platform delivers reproducible validation results, grounded in consistent methodology and community-agreed best practices, following requirements set forth by the Global Climate Observing System (GCOS) and the Committee on Earth Observation Satellites (CEOS).

QA4SM implements an extensive array of regularly-updated satellite products from missions including SMOS, SMAP, ASCAT, and Sentinel-1, along with multi-sensor datasets from the Copernicus Climate Change Services (C3S) and ESA Climate Change Initiative (CCI). It incorporates in situ reference data from the ISMN and reanalysis products such as ERA5(-Land) and GLDAS-Noah. Users can upload their own custom datasets in multiple formats for comparison against state-of-the-art reference products. The platform offers extensive customization options for validation, including dataset filtering, spatial and temporal sub-setting, scaling methods, temporal matching, and anomaly calculation. Results can be archived and published with digital object identifiers (DOIs) for traceability and scientific reproducibility.

QA4SM is continuously evolving to keep up with scientific developments and user needs. Several new capabilities are planned for the upcoming Release 4 in March:

  • Automated validation of NRT data streams will enable stable, continuous monitoring of data quality.
  • Spatial validation functionality will complement the existing temporal validation, addressing use cases that involve datasets with limited temporal coverage as well as high-resolution products.
  • A programmatic API will provide command-line access to the platform, enabling seamless integration with automated workflows.
  • A new interactive data viewer will facilitate intuitive exploration of validation results.

In this presentation, we demonstrate the functionalities of QA4SM, highlight the features introduced in Release 4, and discuss planned future developments.

QA4SM is developed as part of the European Space Agency’s Fiducial Reference Measurement for Soil Moisture (FRM4SM) project.

How to cite: Unterasinger, F., Aberer, D., Unterholzner, T., Shmeleva, S., Preimesberger, W., Ilina, D., Lems, J., Boresch, A., Bakcsa, Z., Mialon, A., Bousbih, S., Dorigo, W., Gruber, A., Crapolicchio, R., and Scipal, K.: Quality Assurance for Soil Moisture (QA4SM) - A Centralized Soil Moisture Validation and Inter-Comparison Platform, EGU General Assembly 2026, Vienna, Austria, 3–8 May 2026, EGU26-14005, https://doi.org/10.5194/egusphere-egu26-14005, 2026.

EGU26-14482 | ECS | PICO | HS6.2

Deriving the conditional distribution of soil moisture and its use in estimating memory in the water-soil system 

Furuya Takahiro, Mehmet Soylu, Elisa Arnone, and Rafael Bras

Soil moisture plays a crucial role in both ecosystems and human activities. It serves as a primary water source for plants and soil microorganisms. People use soil moisture information in irrigation strategies, predicting soil-borne plant diseases, and more. Soil moisture memory (SMM) refers to the soil’s ability to reflect signals of perturbations caused by anomalies such as intense storms or prolonged dry periods, over time. Its significance stems from its direct link to soil moisture dynamics, as understanding SMM characteristics helps predict soil moisture behavior over time. Many studies have investigated SMM, employing various metrics for its measurement, for example, the e-folding autocorrelation timescale. The time scale of SMM ranges from a couple of days to several months, but its duration and seasonality vary by location, depending on soil types, local hydrological settings, climatic regimes, and vegetation ecosystems. This study introduces a novel SMM metric based on the differences between the conditional and marginal distributions of soil moisture. First, a soil moisture simulation model is calibrated using modified ERA5 Potential Evapotranspiration (PET) and NASA’s GPM IMERG precipitation data as inputs, with SMAP soil moisture data as target values on a daily scale. Next, 2,000 years of daily precipitation and minimum/maximum temperature are generated using the stochastic weather generator WeaGETS, driven by GPM IMERG and CPC temperature data. PET is then estimated from the simulated temperature using the temperature-based Hargreaves-Samani equation. Using the generated 2,000-year input data, daily soil moisture is simulated. The simulation bias is then corrected using the CDF-matching method. With the bias-corrected daily soil moisture, the joint, marginal, and conditional probability distributions of soil moisture are analyzed at multiple lead times (3, 7, 14, 21 days) across four seasons and two study sites in Iowa and Ukraine. Results show that conditional distributions converge toward marginal distributions within 7-14 days in Iowa and 14-21 days in Ukraine in most seasons, with winter and spring exhibiting the longest SMM time scale for Iowa and Ukraine, respectively. This study shows how the conditional distributions of soil moisture gradually converge to the marginal distributions as lead prediction time increases. The time to convergence, dependent on soils, climate and season is a measure of the memory of soil moisture in the system. The conditional distributions are key to applications like irrigation scheduling.

How to cite: Takahiro, F., Soylu, M., Arnone, E., and Bras, R.: Deriving the conditional distribution of soil moisture and its use in estimating memory in the water-soil system, EGU General Assembly 2026, Vienna, Austria, 3–8 May 2026, EGU26-14482, https://doi.org/10.5194/egusphere-egu26-14482, 2026.

EGU26-15397 | PICO | HS6.2

How much does the soil dielectric model matter for passive microwave soil moisture retrieval? 

YuLin Shangguan, Cheng Tong, and Zhou Shi

Passive microwave soil moisture (SM) retrieval relies on an accurate representation of soil complex dielectric permittivity, yet the uncertainty introduced by dielectric model selection remains insufficiently quantified. In this study, we evaluated five widely used mineral soil dielectric models and two organic soil dielectric models, and assessed how errors and uncertainties from soil dielectric models propagated into SM retrievals using the single channel algorithm (SCA) based on L-band Soil Moisture Active Passive (SMAP) data. We revealed a substantial inter-model disagreement of retrieved SM with a global mean spread of 0.044 m3/m3. The largest divergence occurred in the tropics and northern high latitudes, where mean RMSE value exceeded 0.10 m3/m3. In generally, organic soil models outperformed mineral soil models, yielding significantly higher R (0.66 vs 0.64) and lower ubRMSE (0.068 m3/m3 vs 0.069 m3/m3) values. Among all models, the Mironov 2019 model that accounts for soil organic carbon (SOC) effect exhibited the best performance with a mean R value of 0.66 and ubRMSE value of 0.07 m3/m3. We further demonstrated that soil dielectric model choices overall contributed 27.6% of SM retrieval error, especially under high SOC conditions. Finally, we derived a global map of optimal dielectric model using triple collocation analysis, and showed that the R and ubRMSE metrics could be further improved by 0.04 and 0.006 m3/m3. compared with the SMAP SM product. Our results highlight the importance of dielectric model specific uncertainty characterization and support regionally adaptive dielectric parameterizations for more accurate L-band SM products.

How to cite: Shangguan, Y., Tong, C., and Shi, Z.: How much does the soil dielectric model matter for passive microwave soil moisture retrieval?, EGU General Assembly 2026, Vienna, Austria, 3–8 May 2026, EGU26-15397, https://doi.org/10.5194/egusphere-egu26-15397, 2026.

EGU26-15414 | ECS | PICO | HS6.2

Investigating Soil and Plant Xylem Dielectric Relationships in Boreal Forest 

Kayla Wicks, Alexandre Roy, Michael Cosh, and Aaron Berg

The boreal forest is the second largest terrestrial biome and owing to its vast extent, is a critical component of the global climate system, functioning as a major carbon reservoir and regulating land–atmosphere water and energy exchanges. However, boreal ecosystems are highly sensitive to climate-driven changes in water availability, exacerbating drought stress, wildfire risk, and widespread, drought-induced tree mortality, demonstrating the need for improved characterization of soil and plant water dynamics. More specifically, soil moisture is a fundamental control on boreal forest productivity and disturbance dynamics, governing water availability for transpiration, photosynthesis, and internal plant water storage. While microwave remote sensing instruments provide valuable large-scale soil moisture observations, their interpretation in forested environments remains challenging due to the combined influence of soil and vegetation water on the microwave signal and a lack of species-specific validation data. In particular, the contribution of internal plant water storage to microwave observations is poorly constrained in boreal ecosystems.

In this study we examined coupled soil–plant water dynamics in a mixed boreal forest in central Saskatchewan as part of the SMAPVEX22-Boreal field campaign. Hourly measurements of real dielectric constant (RDC) were collected from near-surface organic soil (5 cm), mineral soil, and tree xylem across 27 forested sites during the 2022 growing season. Measurements focused on three dominant boreal species representing contrasting functional types: jack pine (Pinus banksiana), black spruce (Picea mariana), and trembling aspen (Populus tremuloides). To independently characterize internal plant water storage, destructive vegetation sampling was conducted to quantify gravimetric water content in primary branches, secondary branches (including foliage), and whole branches. Soil water potential was estimated using texture-based parameterizations to better represent plant-available water.

Time series analyses revealed a strong and consistent relationship between soil RDC and tree xylem RDC, indicating tightly coupled soil–plant water dynamics throughout the growing season. Soil moisture exhibited greater short-term variability than tree RDC, while xylem RDC showed a gradual seasonal drydown and became less responsive to individual precipitation events as summer progressed. Pronounced species-specific differences were observed: trembling aspen exhibited significantly higher and more variable xylem RDC than the conifer species, whereas black spruce sites were characterized by persistently wetter soils associated with thicker organic layers. Lag-correlation analysis showed virtually no delay between soil moisture and tree RDC at an hourly timescale for jack pine and black spruce, and a short (~1 hour) lag for aspen, with the strongest correlations (~ 0.80) occurring in the mineral soil layer, suggesting the influence of relatively shallow rooting depth in water access strategies.

These results reflect contrasting species-specific hydraulic strategies, with jack pine adapted to drier conditions and black spruce and aspen maintaining greater internal water storage. The strong, near-synchronous coupling between soil and plant water at hourly timescales suggests limited temporal separation between soil wetting and vegetation uptake in boreal forests, constraining their use as a signal-separation mechanism in microwave remote sensing. Thus, species-level hydraulic differences should be explicitly considered in soil moisture retrieval and validation frameworks.

How to cite: Wicks, K., Roy, A., Cosh, M., and Berg, A.: Investigating Soil and Plant Xylem Dielectric Relationships in Boreal Forest, EGU General Assembly 2026, Vienna, Austria, 3–8 May 2026, EGU26-15414, https://doi.org/10.5194/egusphere-egu26-15414, 2026.

EGU26-15802 | ECS | PICO | HS6.2

A Data Fusion Framework for Sub-Daily Soil Moisture Mapping Using CYGNSS, SMAP, and SMOS 

Mina Rahmani, Alessio Di Simone, Gerardo Di Martino, Antonio Iodice, and Daniele Riccio

Accurate sub-daily soil moisture (SM) measurements at high spatial resolution on a global scale are essential for climate monitoring, agricultural management, and hydrological applications. Passive microwave missions including the Soil Moisture Active Passive (SMAP) and Soil Moisture Ocean Salinity (SMOS) satellites provide global SM products; however, their temporal revisit time (2–3 days) and coarse spatial resolution (36–50 km) limit their ability to capture short-term SM dynamics. In recent years, Global Navigation Satellite System Reflectometry (GNSS-R) has emerged as a promising alternative, offering a large number of sub-daily SM observations from low-cost, lightweight satellite platforms. Nevertheless, GNSS-R observations are spatially irregular and contain coverage gaps [1].

Here, we propose a weighted data fusion approach to integrate soil moisture estimates from NASA’s GNSS-R mission (CYGNSS) with SMAP Level-3 (36 km) and SMOS Level-2 (25–40 km) products independently, generating continuous sub-daily SM maps at a regular spatial resolution of 20 km. The weights are functions of the spatiotemporal distance between the output and input grid points, as well as the expected reliability of the input data. The proposed fusion framework aims to fill spatial gaps in CYGNSS-derived SM, improve its retrieval accuracy through the incorporation of passive microwave observations, and enhance the spatiotemporal resolution of SMAP and SMOS products.

The performance of the fusion model is evaluated over the Contiguous United States (CONUS) during the first five months of 2021. Strong spatial agreement is observed between CYGNSS–SMAP fused maps and SMOS products, as well as between CYGNSS–SMOS fused maps and SMAP products, demonstrating the model’s effectiveness in filling CYGNSS data gaps. Compared to CYGNSS-only SM estimates, the fused products show substantial improvements in accuracy. For the CYGNSS–SMOS fusion, the correlation with SMAP increases from approximately 0.64 to 0.80, while the RMSE decreases from about 0.07 to 0.04 m³/m³. Similarly, the CYGNSS–SMAP fusion improves the correlation with SMOS from about 0.43 to 0.58 and reduces the RMSE from approximately 0.10 to 0.06 m³/m³.

To further evaluate the model’s ability to generate sub-daily soil moisture observations, additional validation was performed using soil moisture time series from 11 in-situ stations obtained from the International Soil Moisture Network (ISMN) [2]. The fused products successfully capture the temporal variability observed in the in-situ measurements, with slightly better performance for the CYGNSS–SMOS fusion compared to the CYGNSS–SMAP fusion. Median correlation coefficients of approximately 0.60 and 0.56, and median RMSE values of about 0.076 and 0.083 m³/m³, are obtained for the CYGNSS–SMOS and CYGNSS–SMAP fused products, respectively.

[1] Senyurek, V., Gurbuz, A., Kurum, M., Lei, F., Boyd, D., & Moorhead, R. (2021). Spatial and temporal interpolation of CYGNSS soil moisture estimations. Paper presented at the 2021 IEEE International Geoscience and Remote Sensing Symposium IGARSS.

[2] Dorigo, W., Himmelbauer, I., Aberer, D., Schremmer, L., Petrakovic, I., Zappa, L., et al. (2021). The International Soil Moisture Network: serving Earth system science for over a decade. Hydrology and Earth System Sciences Discussions, 2021, 1-83. 

How to cite: Rahmani, M., Di Simone, A., Di Martino, G., Iodice, A., and Riccio, D.: A Data Fusion Framework for Sub-Daily Soil Moisture Mapping Using CYGNSS, SMAP, and SMOS, EGU General Assembly 2026, Vienna, Austria, 3–8 May 2026, EGU26-15802, https://doi.org/10.5194/egusphere-egu26-15802, 2026.

Soil moisture (SM) is a key variable in land-atmosphere interactions, and numerous efforts aim to produce consistent large-scale SM datasets. Satellite-based retrievals provide valuable complements to physically based approaches, particularly for achieving global coverage. Neural networks (NNs) have demonstrated strong potential for improving SM retrieval accuracy in recent years. This study benchmarks daily SM retrievals from Advanced SCATterometer (ASCAT) observations using multiple NN-based architectures, with varying degrees of localization, a strategy designed to help the models adapt to local conditions. Two model families are evaluated: multilayer perceptions (MLPs) and convolutional neural networks (CNNs). We examine configurations that incorporate physical variable augmentation, geographic coordinate inputs, and explicitly localized designs (pixel-scale MLP and locally-connected CNN) to assess the sensitivity of the model accuracy to input nature and localization strength. In non-localized settings, CNNs consistently yield higher spatial and temporal correlations, reflecting their ability to learn spatial hierarchies and local patterns. In strongly localized designs, the pixel-scale MLP and locally-connected CNN achieve very high overall correlations with substantially reduced local bias, highlighting the value of localized learning for capturing fine‑scale SM variability. In addition to providing improved daily SM estimates, our CNN-based retrieval can also capture intraday variability. This capability is particularly evident during intense precipitation events, offering new perspectives into short-term hydrological dynamics. Looking ahead, future efforts should focus on integrating complementary satellite measurements from other sensors (SMOS, SMAP, AMSR, CIMR) to further improve retrieval accuracy, robustness, and temporal resolution.

How to cite: Dinh, L. A., Aires, F., and Pellet, V.: Advancing ASCAT soil moisture retrievals: benchmarking neural-network models and exploring intraday estimation potential, EGU General Assembly 2026, Vienna, Austria, 3–8 May 2026, EGU26-17249, https://doi.org/10.5194/egusphere-egu26-17249, 2026.

EGU26-17579 | PICO | HS6.2

Evaluating soil moisture variability in complex environments through multiscale measurements: a multidisciplinary framework for ground-to-satellite data integration 

Teodosio Lacava, Raffaele Albano, Giuseppe Calamita, Luigi Martino, Beniamino Onorati, Antonio Satriani, and Angela Perrone

The advent of Cosmic Ray Neutron Sensing (CRNS) stations has represented a significant advancement in the field of soil moisture (SM) retrieval. With footprints of up to 300 m and measurements referring to soil depths of up to 50 cm, these stations can effectively contribute to improving the evaluation of satellite-derived and modelled SM products.

Recently, a CRNS station implemented by Finapp S.r.l. was installed in the peri-urban area of Tito (Contrada Carlone – 40.573425 N, 15.676042 E), located in the Basilicata region of southern Italy. The monitoring site, characterized by complex geomorphological conditions, features an integrated setup including time-lapse Electrical Resistivity Tomography (ERT) system, an array of hydrological sensors (tensiometers, soil moisture sensors, piezometers), and meteorological sensors (temperature, humidity, wind speed, and solar radiation). This open-air monitoring laboratory, supported by advanced methodologies for data integration, enables a multidisciplinary and multiscale approach to investigate SM variability and, more broadly, provides insights into the hydrogeological risks affecting the site. The laboratory was established within the framework of the “ITINERIS” project (PNRR M4C2 Inv.3.1 IR), funded by the EU’s Next Generation program.

Focusing on the CRNS station, SM data acquired since July 2025 have already been compared with different satellite-based SM products, such as the weekly Copernicus Surface Soil Moisture (SSM) derived from Sentinel-1 SAR data and the daily Soil Water Index (SWI) obtained from ASCAT (Advanced Scatterometer) acquisitions. Additional datasets and products acquired at different temporal and spatial scales, as well as based on diverse technologies (active, passive, and merged), will be considered in future analysis. Preliminary results are promising and highlight the strong potential of the laboratory to produce accurate SM measurements. These measurements will be scaled up to the regional level within the framework of the “Space It Up” project, funded by the Italian Space Agency and the Ministry of University and Research (contract No. 2024-5-E.0 – CUP I53D24000060005), to better investigate the impacts of climate change across the entire region. SM variability as well as spatiotemporal anomalies will be analyzed.

How to cite: Lacava, T., Albano, R., Calamita, G., Martino, L., Onorati, B., Satriani, A., and Perrone, A.: Evaluating soil moisture variability in complex environments through multiscale measurements: a multidisciplinary framework for ground-to-satellite data integration, EGU General Assembly 2026, Vienna, Austria, 3–8 May 2026, EGU26-17579, https://doi.org/10.5194/egusphere-egu26-17579, 2026.

EGU26-17805 | ECS | PICO | HS6.2

Identifying reliable in situ reference measurements for satellite root-zone soil moisture validation from the International Soil Moisture Network 

Daria Ilina, Johanna Lems, Alexander Gruber, Wouter Dorigo, and Raffaele Crapolicchio

Root-zone soil moisture (RZSM) represents water available for plant uptake and evaporation, making it a key variable for agricultural applications and drought monitoring. While satellite observations are restricted to near-surface soil moisture, modeling approaches exist that can approximate soil moisture conditions in deeper layers. The validation of such deeper-layer products requires reliable ground reference measurements at corresponding depths. However, existing soil moisture monitoring networks, such as those available from the International Soil Moisture Network (ISMN), are highly inconsistent in sensor depth placement and vertical coverage. 

In this study, we first investigate the spatial and vertical distribution of in situ sensors available within the ISMN. We then propose a best practice method for identifying Fiducial Reference Measurements (FRMs) for RZSM dynamics, which can be used to validate RZSM products for any assumed soil layer depth. Finally, we compare these RZSM FRMs against existing satellite-derived and modeled RZSM products from the ESA Climate Change Initiative Soil Moisture (CCI SM) dataset and the GLDAS-NOAH land surface model.

Results reveal substantial gaps and inconsistencies in spatial coverage and sampling depth among ISMN networks, with a bias towards agriculturally dominated regions in temperate and cold climate zones, where most stations measure only within the top 10 cm. Out of almost 3000 ISMN stations, a small subset of less than 300 FRM-labeled stations provides sufficiently consistent and deep vertical sampling within the root-zone , assumed as top 1 m soil layer. Those stations are selected to determine an optimal vertical sampling design for the reliable monitoring of specific soil layers. RZSM FRMs are derived for four different soil layers (0-0.1 m, 0.1-0.4 m, 0.4-1 m, and 0-1 m) and used to validate ESA CCI SM and GLDAS-NOAH RZSM estimates for the same layers.

How to cite: Ilina, D., Lems, J., Gruber, A., Dorigo, W., and Crapolicchio, R.: Identifying reliable in situ reference measurements for satellite root-zone soil moisture validation from the International Soil Moisture Network, EGU General Assembly 2026, Vienna, Austria, 3–8 May 2026, EGU26-17805, https://doi.org/10.5194/egusphere-egu26-17805, 2026.

EGU26-18242 | ECS | PICO | HS6.2

Understanding Seasonal Variability of Soil Moisture Patterns with Explainable Machine Learning 

Abinesh Colin A and Sarmistha Singh

Soil moisture plays a critical role in regulating the water and energy flux between land and atmosphere, influencing hydrological processes, vegetation dynamics, and climate feedbacks. The traditional data-driven approaches such as correlation and regression have been widely used for understanding the relationships between soil moisture and its controlling drivers, but these methods are limited in capturing complex nonlinear interactions between the multiple drivers, and not much robust enough to quantify the dominant key drivers that control soil moisture patterns. Machine learning algorithms can overcome this limitation by learning the complex non-linear interaction directly from observational datasets. However, the black box nature of the model limits its explainability, which can be improved by the integration of explainable artificial intelligence (XAI). The present study aims to understand the climatic and vegetation drivers controlling the seasonal variability of soil moisture patterns at a remote sensing scale across India, using a random forest modelling framework integrated with XAI. Satellite-derived soil moisture and other hydroclimatic and vegetation drivers were analysed at a large scale (36 km) across seasons. The result shows that the model performs well in capturing the grid-wise temporal variability of soil moisture based on seasons. The XAI based interpretation identifies precipitation as the dominant controlling driver during the monsoon season, covering nearly 70 percent of the areal extent across semi-arid and sub-humid regions. The diurnal land surface temperature and evaporative fraction are identified as the dominant drivers across the arid regions during the non-monsoon seasons. Our findings with the aid of model with XAI integrated explainability techniques, helps in understanding the complex drivers affecting soil moisture patterns across seasons in India, which is essential for improving weather and climate forecasting models and better preparedness for extreme events, including drought.

How to cite: Colin A, A. and Singh, S.: Understanding Seasonal Variability of Soil Moisture Patterns with Explainable Machine Learning, EGU General Assembly 2026, Vienna, Austria, 3–8 May 2026, EGU26-18242, https://doi.org/10.5194/egusphere-egu26-18242, 2026.

EGU26-18843 | ECS | PICO | HS6.2

Advancing Multi-Angular SMOS Retrievals within Land Parameter Retrieval Model for the Climate Change Initiative Programme 

Richa Prajapati, Diane Duchemin, Arnaud Mialon, Colin Moldenhauer, David Gabor D Kovacs, Richard de Jeu, Wouter Arnoud Dorigo, and Nemesio Rodriguez-Fernandez

The European Space Agency (ESA) developed the Climate Change Initiative (CCI) programme to integrate observations from successive active and passive satellite missions and to generate the first multi-decadal global soil moisture data set. The Land Parameter Retrieval Model (LPRM) has been widely used to derive soil moisture from passive microwave observations. Traditionally, LPRM employs a single incidence angle for soil moisture retrieval and has been successfully applied across multiple passive microwave sensors. However, unlike other passive sensors used within the CCI programme, the Soil Moisture and Ocean Salinity (SMOS) mission measures brightness temperatures over a wide range of incidence angles, from 0° to 65°. However, the existing algorithm relies on single incidence angle observations; therefore, there is a need to exploit the multi-angular information provided by SMOS. This study focuses on advancing and adapting the soil moisture retrieval algorithm to incorporate multi-incidence angle observations while maintaining compatibility with other sensors, thereby enabling the production of a consistent long-term climatological soil moisture data record. The LPRM cost function is modified to integrate brightness temperature information acquired at dual polarizations and multiple incidence angles. This enhancement is expected to improve the operational retrieval algorithm and contribute to the generation of a more reliable multi-decadal soil moisture data record.

How to cite: Prajapati, R., Duchemin, D., Mialon, A., Moldenhauer, C., Gabor D Kovacs, D., de Jeu, R., Arnoud Dorigo, W., and Rodriguez-Fernandez, N.: Advancing Multi-Angular SMOS Retrievals within Land Parameter Retrieval Model for the Climate Change Initiative Programme, EGU General Assembly 2026, Vienna, Austria, 3–8 May 2026, EGU26-18843, https://doi.org/10.5194/egusphere-egu26-18843, 2026.

EGU26-19306 | ECS | PICO | HS6.2

Spatiotemporal Evaluation of Downscaled and Native High-Resolution Satellite Soil Moisture Products 

Wolfgang Preimesberger, Pietro Stradiotti, María Piles, Dong Fan, Bernhard Raml, Jian Peng, and Wouter Dorigo

Since the launch of ESA’s Sentinel-1 mission, openly accessible soil moisture products at ~1 km spatial sampling have become popular for regional scientific studies and numerous applications in agriculture, on land use/change, and water resource management, among others. However, while community-agreed approaches exist for estimating data quality in the temporal domain - e.g., through comparison with in situ measurement time series - comparable quantitative assessments of spatial performance are still largely lacking. This is due to the limited availability of reference measurements and the lack of methods that can effectively exploit them for spatial evaluation.
Recently, a new Point-Scale-Downsampling (PSD) framework was proposed, which enables the computation of both temporal and spatial performance metrics between satellite observations and in situ point measurements. The framework uses coarse-scale benchmark data to assess relative differences between products across spatial scales.

In this presentation, we show results from a recent intercomparison study of native (Sentinel-1) and downscaled (SMAP, SMOS, ASCAT, ESA CCI) 1 km soil moisture products over Europe. We compute temporal and spatial performance metrics using the PSD framework with respect to reference in situ measurements from the International Soil Moisture Network (ISMN). We place our findings in the context of traditional temporal quality assessments and correlogram-based spatial variability characteristics. We conclude that, while high-resolution products overall outperform coarse-resolution benchmark products in terms of spatial information content, the downscaled products at this stage tend to show better spatio-temporal agreement with the available in situ measurements than native SAR retrievals. Additional reference measurements and novel, qualitative approaches to assess the suitability of satellite soil moisture for specific applications could further improve the understanding and reliability of these data in the future.

This study received funding from the European Space Agency (ESA) "Hyper-resolution Earth observations and land-surface modeling for a better understanding of the water cycle" (4Dhydro) project, with tender reference: ESA AO/1-11298/22/I-EF.

How to cite: Preimesberger, W., Stradiotti, P., Piles, M., Fan, D., Raml, B., Peng, J., and Dorigo, W.: Spatiotemporal Evaluation of Downscaled and Native High-Resolution Satellite Soil Moisture Products, EGU General Assembly 2026, Vienna, Austria, 3–8 May 2026, EGU26-19306, https://doi.org/10.5194/egusphere-egu26-19306, 2026.

EGU26-20060 | ECS | PICO | HS6.2

Synergistic Use of Sentinel-1, SMAP, and Ancillary Data for High-Resolution Soil Moisture Mapping 

Jiarong Ma, Jean-Baptiste Got, Yulin Pan, Sajad Tabibi, Christophe Craeye, and Sébastien Lambot

Accurate, field-scale soil moisture estimates are critical for hydrological modeling and agricultural monitoring, yet they remain difficult to obtain from any single satellite system. L-band radiometers such as SMAP provide reliable large-scale soil moisture retrievals, but their coarse spatial resolution limits local applicability. In contrast, C-band SAR observations from Sentinel-1 offer fine spatial detail, though their sensitivity to surface roughness and vegetation requires careful calibration.

We develop a multi-sensor downscaling framework that combines SMAP morning soil moisture with ascending and descending Sentinel-1 VV/VH backscatter. To better represent soil moisture dynamics, historical VV backscatter minima and maxima are used to derive a Soil Moisture Index (SMI), alongside NDVI to account for vegetation. These variables are complemented by the Antecedent Precipitation Index (API) and evapotranspiration to consider surface water fluxes, as well as topographic information from a digital elevation model.

Model robustness is evaluated using a strict temporal split: data from 2020–2024 are used for training, while 2025 is reserved as an independent test year. Three non-parametric algorithms—Random Forest, XGBoost, and K-Nearest Neighbors—are assessed against in-situ measurements from the International Soil Moisture Network.

Including meteorological information and historical backscatter features leads to consistent performance gains across models. On the independent test set, coefficients of determination exceed 0.5, with XGBoost achieving the lowest RMSE and outperforming both Random Forest and KNN. These results demonstrate the value of combining complementary satellite observations and targeted feature engineering for reliable, high-resolution soil moisture mapping.

How to cite: Ma, J., Got, J.-B., Pan, Y., Tabibi, S., Craeye, C., and Lambot, S.: Synergistic Use of Sentinel-1, SMAP, and Ancillary Data for High-Resolution Soil Moisture Mapping, EGU General Assembly 2026, Vienna, Austria, 3–8 May 2026, EGU26-20060, https://doi.org/10.5194/egusphere-egu26-20060, 2026.

Accurate evapotranspiration (ET) projections are essential for water resource management and drought prediction under a changing climate. However, ET estimates from Global Climate Models (GCMs) exhibit large uncertainties stemming from systematic biases in meteorological variables, coarse spatial resolution, and inter-model structural differences. This study addresses these limitations by developing an integrated framework combining CMIP6 projections, a proxy for observations, and a machine learning approach to improve the reliability of projected ET at a fine spatiotemporal scale (temporal: daily scale; spatial: 0.1°×0.1°) over the Krishna River Basin. To select a proxy for observed multiple ET products (ERA5-Land, GLDAS-NOAH, and GLEAM) were first validated against the water balance-based basin scale ET available from Ma et al. (2024). Results indicate superior performance of ERA5-Land for the selected river basin and was subsequently used to assess the uncertainty of seven CMIP6 GCMs (over the historical period 2015–2023). Through multi-metric analysis, EC-Earth (SSP5-8.5) outperformed all other models, showing low weighted mean absolute error (WMAE,) highest correlation and strongest 1:1 alignment. Despite this, initial evaluation of raw EC-Earth inputs revealed systematic biases in variables associated with ET like solar radiation (ssrd), thermal radiation (strd), and sensible heat flux (sshf), leading to substantial underestimation of ET. To resolve this, a Quantile Mapping (QMAP) technique was employed to bias-correct the meteorological drivers, successfully restoring their statistical distributions. Then a data-driven Bayesian Network (BN) model was developed to simulate ET using precipitation, temperature, and the bias corrected variables. The BN model demonstrated robust performance (R > 0.87) during both development and testing phases. Near-future projections (2024–2030) indicate that relying on raw GCM data dampens seasonal cycles; in contrast, the bias-corrected BN projections highlight a higher mean ET and effectively capture seasonal extremes, particularly during dry months (January–June). These findings underscore the critical role of bias correction in hydro-climatic modelling and establish this framework as a reliable tool for future hydrological assessment in the Krishna River Basin. This integrated methodology demonstrates that coupling statistical bias correction with machine learning models can substantially reduce projection uncertainty. The framework is transferable to other basins and provides reliable ET projections for improved water availability assessments and climate adaptation planning.

Keyword: - Quantile Mapping, Bayesian Network, CMIP6 downscaling ,Bias correction, Hydro-climatic modelling.

How to cite: Kumar, R. and Dutta, R.: Reliable basin-scale projection of evapotranspiration at fine spatiotemporal scale using machine learning-based techniques          , EGU General Assembly 2026, Vienna, Austria, 3–8 May 2026, EGU26-284, https://doi.org/10.5194/egusphere-egu26-284, 2026.

EGU26-616 | ECS | Orals | HS6.3

Early Forecasting of Crop Irrigation for Sustainable Water Use with Satellite Data and Machine Learning  

Hafsa Aeman, Mohsin Hafeez, and Sarfraz Munir

Early forecasting of crop irrigation demand improves water efficiency and supports food security. Accurate forecasts allow farmers and policymakers to schedule irrigation based on crop type and climate, ensuring timely water application throughout the growing season. Traditional biophysical models rely on fixed delivery schedules and broad hydrological trends, often lacking precision for specific crop stages. While machine learning (ML) has been widely used for yield and biomass prediction, its application in forecasting crop water requirements remains limited. This study bridges that gap by integrating remote sensing with ML to align water supply with crop demand under changing climate conditions, promoting sustainable irrigation. The study focuses on Pakistan’s Indus Basin, specifically Chaj Doab, located between the Jhelum and Chenab rivers. The region features flat terrain with coarse-textured alluvial soils and high evapotranspiration with wide variety of crops. The proposed methodology for estimating irrigation demand uses actual evapotranspiration (ETact) derived from satellite-based biophysical and climatic variables. Landsat imagery with a spatial resolution of 30 m resolution from 2015 to 2025 was used to calculate normalized difference vegetation Index (NDVI), soil adjusted vegetation index (SAVI), land surface temperature (LST), and net radiation (Rn).

The dataset was split with 80% used for training and 20% for validation, to simulate a continuous forecasting scenario. The primary objective was to evaluate model performance in an unseen future period, reflecting irrigation forecasts in practice rather than re-learning from shuffled segments through temporal cross-validation. By contrast, the 80-20 split ensured a long historical record for vigorous training and a sufficiently large, continuous block of unseen data that spans entire season irrigation requirement which validation against observed evapotranspiration (ET) and local climate data from the Eddy Covariance Flux Tower, providing reliable ground-truth checks across entire cropping cycle.

The machine learning models tested included CNN, XGBoost, and Random Forest. Among these, CNN achieved the highest performance with an R² of 0.89, followed by XGBoost (R² = 0.81) and Random Forest (R² = 0.76) on the testing samples. The short-term irrigation forecasting model was evaluated across two cropping seasons Kharif and Rabi, using observed ET values and local climate data from an Eddy Covariance Flux Tower. For rice during Kharif, CNN predicted 6.798 mm/day compared to the flux tower's 6.99 mm/day. During Rabi, the model predicted wheat ET at 2.041 mm/day, closely matching the observed 1.86 mm/day. During the growth phase of wheat in Rabi season, CNN forecasted ET at 29.87 mm/day, closely matching the flux tower measurement of 33 mm/day. Similarly, during early April, the model estimated 12.12 mm/day versus an observed 13.15 m/day. The lowest deviation occurred during the week of December, with both CNN and flux tower ET values closely aligned (6.99 and 6.89 mm/day, respectively). Overall, CNN showed the highest correlation than other models across multiple crops (maize, potato, guava, and orchards), showing strong spatial accuracy and temporal relevance. The outcomes support a wide range of users including farmers, local organizations, and decision-makers by enabling proactive irrigation planning.

How to cite: Aeman, H., Hafeez, M., and Munir, S.: Early Forecasting of Crop Irrigation for Sustainable Water Use with Satellite Data and Machine Learning , EGU General Assembly 2026, Vienna, Austria, 3–8 May 2026, EGU26-616, https://doi.org/10.5194/egusphere-egu26-616, 2026.

The west-central Himalayas are experiencing a major ecological shift with widespread, apparently water-conserving, Banj oak (Quercus leucotricophora) forests increasingly replaced by monoculture stands of Chir pine (Pinus roxburghii). This transition has been associated with declining streamflow and weakened hydrological services, yet the role of forest transpiration—an essential component of watershed hydrology—remains insufficiently understood.

This study reports findings from a two-year measurement campaign quantifying tree-level (Tf) and stand-level (Ts) transpiration in a Chir pine–dominated watershed. We analyze seasonal variability in transpiration, its age-related differences, and sensitivity to hydrometeorological drivers. We also compare this with a few months of transpiration data collected at a nearby Banj oak forest. At the tree scale, Tf increases markedly with tree age and peaks during the post-monsoon autumn season. At the stand scale, mean annual Ts is ~1.1 mm day⁻¹, with a maximum (~1.3 mm day⁻¹) in autumn and minimum (~0.85 mm day⁻¹) in summer, along with suppressed transpiration during the monsoon. Tsin the pine forest is consistently higher than that in the oak forest during the monsoon (~0.3 mm day-1) and post-monsoon autumn seasons (~0.2 mm day-1) with similar values in early autumn. Oaks also display a stronger regulation of transpiration post-monsoon with a sharper decline in Ts as compared to nearly stable values in the pine stand. Ts is also strongly controlled by solar insolation in the post-monsoon autumn and winter seasons, signifying energy-limitation, which may not have been earlier reported for these forests. However, pines still opportunistically utilise available water resources during this period with a stable Ts. The forests also seem to be water-limited during the dry summer season, which requires supporting evidence from direct measurements. However, again, pines have an opportunistically high transpiration rate during this period, apparently utilizing watershed storage.

These sap-flux measurements align well with complementary measurements of forest evapotranspiration (ET), made with the Bowen ratio method. Ts percentage contribution in ET varied with seasons, with the lowest in monsoon (24% and 40%) at the oak forest and pine forest, respectively. ET show stronger transipraive regulation in the oak forest, suggesting a conservative impact on regional hydrology. Annually, the pine forest evapotranspires nearly 168 mm more water as compared to the oak forest with a negative impact on watershed storage as shown by complementary discharge measurements. Overall, our study shows that the ongoing land cover change may have significant consequences for regional hydrological resources.

How to cite: Kumar, M., Mohanty, J. R., Khanna, J., Krishnaswamy, J., and Sen, S.: Comparative Transpiration Responses of Chir Pine and Banj Oak Forests in the West-Central Himalaya: Evaluation with Evapotranspiration and Hydrometeorological measurements, EGU General Assembly 2026, Vienna, Austria, 3–8 May 2026, EGU26-1072, https://doi.org/10.5194/egusphere-egu26-1072, 2026.

EGU26-1866 | Posters on site | HS6.3

Co-Developing Metadata Standards for In-Situ ET Measurements 

Sibylle K. Hassler, Damien Bonal, Martin Maier, Jannis Groh, Oscar Hartogensis, Martin Hirschi, Jacob Nelson, Reinhard Nolz, Sinikka Paulus, Corinna Rebmann, Stefan Seeger, Kathy Steppe, and Stefan Werisch

Evapotranspiration (ET) constitutes one of the most significant fluxes of matter and energy within terrestrial ecosystems and serves as a key indicator of landscape functioning. A range of in situ measurement techniques—such as lysimeters, eddy covariance systems, and sap flow sensors—are now widely employed in monitoring networks and research initiatives to obtain high-quality field observations. These datasets offer substantial potential for secondary use, including methodological intercomparisons and refinements, upscaling efforts, and analyses of large-scale or long-term patterns. However, effective and efficient data reuse—and thus scientific progress—is frequently hindered or rendered impossible by insufficient or missing metadata.

Previous sessions at EGU General Assemblies focusing on in situ and remote-sensing-based ET have highlighted the need to support comparisons of ET estimates obtained with different methods and to enable informed reuse of existing data. Given the rapid growth of available datasets and the increasing importance and potential of data reuse, there is an urgent need to reduce this persistent bottleneck caused by insufficient metadata. In response, we initiated a collaborative working group to address this issue by developing a set of standardized templates for relevant metadata and uncertainty information. These templates build upon and extend existing initiatives, including ICOS, FLUXNET, and SAPFLUXNET, and are tailored to eddy covariance, sap flow, and lysimeter measurements.

We present the templates, highlight their differences from existing initiatives and standards, and we outline our vision for future use cases, e.g. in inter-method comparisons and modelling studies enabled by the enhanced metadata descriptions. We invite feedback from the data producers whether the templates facilitate providing metadata, increasing the re-usability of the data; and from the data users on whether the proposed metadata templates meet their needs. Based on community input, we aim to further refine the templates to support useful and sustainable data description.

How to cite: Hassler, S. K., Bonal, D., Maier, M., Groh, J., Hartogensis, O., Hirschi, M., Nelson, J., Nolz, R., Paulus, S., Rebmann, C., Seeger, S., Steppe, K., and Werisch, S.: Co-Developing Metadata Standards for In-Situ ET Measurements, EGU General Assembly 2026, Vienna, Austria, 3–8 May 2026, EGU26-1866, https://doi.org/10.5194/egusphere-egu26-1866, 2026.

EGU26-1977 | Posters on site | HS6.3

Variation among desert shrub patches in evapotranspiration 

Xinping Wang

A major concern for revegetated desert ecosystem is accounting for the evapotranspiration dynamics which is influenced by the carrying capacity of the soil moisture content. Most field observations indicate that soil moisture at certain depth varies with the stochastically occurrence of rainfall events, and the evapotranspiration at community level also varies with the total of annual precipitation. Based on a study of the long-term field observation on the revegetated desert ecosystem, we find that the evapotranspiration of the shrub community correlates closely to the availability of soil moisture, and it can be quantified by analytical description of the stationary and transient joint behavior of plant transpiration and soil moisture. The experimental results indicate that the size and diversity of plant species in water-limited ecosystem can be determined by plant transpiration, which is a comprehensive indicator for plant water resource competition. These results suggest that revegetating large sandy areas with desert shrubs could reduce soil water storage by transpiration, which could significantly change groundwater recharge conditions. However, from a viewpoint of desert ecosystem restoration, it appears that natural rainfall can sustain desert shrubs which would reduce wind erosion. 

How to cite: Wang, X.: Variation among desert shrub patches in evapotranspiration, EGU General Assembly 2026, Vienna, Austria, 3–8 May 2026, EGU26-1977, https://doi.org/10.5194/egusphere-egu26-1977, 2026.

Groundwater is an important water source in water-limited desert ecosystem. Less attention has been paid to how the water balance and plant performance in such ecosystems vary with the presence or absence of groundwater. Appropriate replanting strategies play a pivotal role in preventing desertification. In this study, we used twelve large-scale weighing lysimeters with different replanting configurations, ranging from bare soil to various monocultures and mixtures of shrubs and semi-shrubs, to quantify water balance components and plant growth dynamics in contrasting desert ecosystems (groundwater-dependent vs. groundwater-independent) during 2019-2023. The results indicated that actual evapotranspiration in groundwater-dependent desert ecosystems was greater than in groundwater-independent ones. Linear mixed-effects models showed that groundwater had a significant effect on the water balance components and enhanced plant growth performance. Boosted regression tree models indicated that groundwater alleviated the influence of drought and sparse rainfall on the water balance components in deserts. The water use efficiency (WUE) of the semi-shrub A. ordosica (Ao) in monoculture was 6.74 and 3.10 kg m-3 in desert ecosystems with and without groundwater, respectively. The WUE of the C. korshinskii shrub (Ck) in monoculture and in a mixture with the semi-shrub A. ordosica (Ao & Ck) in groundwater-dependent desert ecosystems was 3.05 and 2.64 kg m-3, respectively. Vegetation restoration in arid areas serves as an effective nature-based solution for desertification control, where tailored replanting strategies are key to ensuring long-term sustainability.

Nan, Y. C., Huo, J. Q., Han, G. L., et al. (2025), Groundwater altered water balance and plant water use efficiency in desert ecosystems. Water Resources Research, 61(11), 1-15. doi: 10.1029/2025WR040545

How to cite: Nan, Y.: Groundwater altered water balance and plant water use efficiency in desert ecosystems - based on large-scale weighing lysimeters, EGU General Assembly 2026, Vienna, Austria, 3–8 May 2026, EGU26-2257, https://doi.org/10.5194/egusphere-egu26-2257, 2026.

Agriculture is confronted with multiple challenges globally and tasked with the transfer to sustainable and resilient production systems. At the same time, transfer from basic science to practice is ineffective and slow. To achieve this, understanding process dynamics of energy and matter cycle dynamics under management and Climate Change is crucial. Over the past decade, rapid technological and scientific advancements have led to unprecedented spatio-temporal resolution of (iso-)flux observations and allowing to monitor water and matter cycling continuously, automatically and simultaneously for different treatments, capturing the systems spatio-temporal heterogeneity. Novel automated and adaptive systems (such as the sensor platform AgroFlux established at ZALF) allow for the case-specific, simultaneous assessment of energy and matter cycle dynamics and their partitioning alongside a holistic set of complementing system variables. This integrated, flexible and automated approach paves the way for a process-based understanding of cross-scale carbon-water interactions as well as the development of participative, co-design researcher that includes various stakeholders in decision processes. We believe, that this actively supports the development of sustainable land management strategies in the face of Climate Change.

How to cite: Dubbert, M. and Hoffmann, M.: The AgroFlux Sensor Platform: Advancing Process-based understanding of carbon-water relations in agricultural systems, EGU General Assembly 2026, Vienna, Austria, 3–8 May 2026, EGU26-3023, https://doi.org/10.5194/egusphere-egu26-3023, 2026.

Evapotranspiration (ET) dominates the water balance of Mediterranean dune ecosystems, yet it is tightly coupled to small but frequent non-rainfall water inputs (NRWI) that modulate near-surface moisture availability during prolonged dry periods. Here, we present a three-year (2021–2024) lysimeter-based assessment of the interplay between ET and NRWI in a coastal Mediterranean dune system in Doñana National Park (SW Spain), using two large, high-precision weighing lysimeters installed under contrasting surface conditions: bare sand and shrub vegetation.

Hourly lysimeter mass changes were analysed under rain-free conditions to quantify ET and to detect and partition NRWI into dew, fog, frost, and water-vapour adsorption (WVA) using a physically based meteorological classification. Cumulative ET strongly exceeded NRWI at both sites, reaching 844.5 mm for bare soil and 931.9 mm for shrub-covered soil over the monitoring period, confirming vegetation as a major amplifier of evaporative losses. In contrast, cumulative NRWI amounted to 174.0 mm (bare soil) and 112.0 mm (shrub), highlighting a persistent but secondary moisture input.

Despite its smaller magnitude, NRWI occurred frequently, often on more than half of all rain-free nights, and directly offset early-morning evaporative losses. Bare soil consistently accumulated more NRWI due to stronger nocturnal cooling and tighter coupling to atmospheric humidity, whereas shrub cover reduced NRWI while enhancing daytime ET through transpiration and increased turbulent exchange. Among NRWI components, WVA dominated both in frequency and cumulative contribution across all seasons and years, while dew showed strong interannual variability linked to nighttime temperature and humidity, and fog inputs were negligible.

Our results demonstrate that while ET governs the annual water balance, NRWI, particularly vapor adsorption, plays a critical buffering role by repeatedly replenishing surface moisture prior to daytime evaporation. This interaction is highly sensitive to vegetation structure and climate variability and is considered to be highly relevant for ecohydrological models for Mediterranean drylands.

How to cite: Kohfahl, C. and Ruiz Bermudo, F.: Seasonal and Interannual Dynamics of Non-Rainfall Water Inputs and Evapotranspiration in a Coastal Mediterranean Dune Ecosystem, EGU General Assembly 2026, Vienna, Austria, 3–8 May 2026, EGU26-3037, https://doi.org/10.5194/egusphere-egu26-3037, 2026.

Evapotranspiration (ET) is a key component of terrestrial water balance and is vital in monsoon driven river basins where strong seasonal variability in land atmosphere interactions governs water availability and agricultural productivity. This study presents a basin scale ET estimation framework that integrates Atmosphere Land Exchange Inverse (ALEXI) model with multi-sensor optical thermal remote sensing through Sentinel Landsat data fusion for the Mahanadi River Basin, India. The approach enhances spatial and temporal characterization of land surface processes while retaining the physically based foundation of the ALEXI model. ALEXI is a two-source energy balance model that partitions surface fluxes between soil and vegetation canopy components and estimates latent heat flux based on the temporal increase in land surface temperature (LST) from early morning to mid-morning. In this study, thermal information from Landsat is combined with the high resolution surface reflectance, vegetation indices, and land cover information derived from Sentinel-2 to better represent surface heterogeneity across agricultural, forested, and mixed land-use areas. Meteorological forcing, including air temperature, wind speed, humidity, and incoming solar radiation, has been used to model atmospheric boundary layer (ABL) growth and derive sensible heat flux, while latent heat flux has been computed as a residual of the surface energy balance and converted to ET. The fusion of Sentinel and Landsat data improves spatial detail in canopy soil energy partitioning, enabling more accurate ET estimation in fragmented agricultural landscapes characteristic of the Mahanadi Basin. The temperature differential nature of ALEXI reduces sensitivity to absolute LST biases and atmospheric correction uncertainties, making it particularly suitable for large, cloud prone monsoon basins. The resulting ET estimates capture seasonal water use dynamics and drought stress patterns across kharif and rabi cropping cycles. This integrated ALEXI multi sensor framework provides a scalable and physically consistent approach for basin-scale hydrological assessment, offering valuable insights for irrigation management, drought monitoring, and sustainable water resources planning in data-scarce regions.

How to cite: Patel, G. P. and Keshari, A. K.: Integrating Sentinel Landsat Fusion with ALEXI Framework for Physically Based Evapotranspiration Estimation in a Monsoon-Dominated River Basin, EGU General Assembly 2026, Vienna, Austria, 3–8 May 2026, EGU26-3696, https://doi.org/10.5194/egusphere-egu26-3696, 2026.

EGU26-4541 | Posters on site | HS6.3

In-situ long-term monitoring of evapotranspiration via weighable lysimeters and stable water isotopes in seepage 

Jessica Landgraf, Jan Goetzie, Jens Wilhelmi, and Axel Schmidt

Lysimeters are experimental tools for identifying water fluxes in-situ in the soil-plant-atmosphere continuum. Weighable lysimeters are especially interesting for investigating evapotranspiration as they allow quantifying mass changes. Automated water balance estimations in weighable lysimeters are available in high-temporal resolution offering detailed information about diurnal processes. Besides water balance monitoring natural tracers like stable water isotopes are useful tools to investigate ecohydrological fluxes. Due to fractionation during phase transitions stable water isotopes are especially beneficial to identifying evaporative processes. Understanding the processes affecting evapotranspiration and groundwater recharge are essential for sustainable water management.

We investigated evapotranspiration based on water balance calculations and stable water isotopes at a lysimeter site in Koblenz, Germany between 2022 and 2025 to optimize our understanding of soil-plant-atmosphere water fluxes. The study site is located at the Rhine island Niederwerth in Koblenz and consists of eight drainage lysimeters, four of which are weighable with a grassland-area of 1 m² and a depth of 2 m. The corresponding soil monoliths consist of alluvial clay, loess loam, alluvial sand, and clayed pumice sampled within a 20 km radius surrounding Niederwerth. Seepage is collected weekly for evaluating automated measurements and to sample stable water isotopes. The site further includes a water basin for evaporation measurement and a meteorological measuring set up with air temperature, humidity, precipitation amount, solar radiation and others. The site-specific precipitation from 2022 to 2025 was 2885 mm (721 mm/a) while measured evaporation from a free water surface was 2473 mm (618 mm/a) and evapotranspiration 2291 mm (573 mm/a; mean over all four weighable lysimeters). The years of 2022 and 2025 were especially dry with evaporation exceeding precipitation input.

We found that normalized solar radiation measurements showed similar trends compared to normalized evapotranspiration measurements of the lysimeters which may offer the opportunity to investigate evapotranspiration via remote sensing techniques or to optimize model predictions. Preliminary results regarding stable water isotopes indicate a hysteresis cycle in lc-excess mean of seepage for alluvial sand and clayed pumice. Alluvial clay and loess loam showed little to no seepage in autumn and loess loam seepage lc-excess exhibited low variability. The seepage of loess loam with 142 mm/a was the lowest of the four soil types while alluvial sand showed the highest seepage of 194 mm/a. This supports a general understanding of stable water isotopic mixing in soils as in fine grained soils evaporated precipitation is mixing with surrounding water mitigating the effects of evaporation until percolating to the seepage depth of 2 m while highly permeable soils allow for evaporation effects to be monitored also in deeper soil depths.

With our study we will offer further insights into the variability of evapotranspiration based on soil types and aim to investigate evapotranspiration via tracer-aided modeling. Upcoming steps will include the estimation of the young water fraction and modeling evapotranspiration based on water balance and isotopic composition.

How to cite: Landgraf, J., Goetzie, J., Wilhelmi, J., and Schmidt, A.: In-situ long-term monitoring of evapotranspiration via weighable lysimeters and stable water isotopes in seepage, EGU General Assembly 2026, Vienna, Austria, 3–8 May 2026, EGU26-4541, https://doi.org/10.5194/egusphere-egu26-4541, 2026.

Groundwater plays a pivotal role in regulating water consumptive use within the soil-plant-atmosphere continuum and maintaining sustainable vegetation restoration in arid areas. Nevertheless, the mechanistic understanding of how groundwater influence root distribution patterns and evapotranspiration (ET) dynamics, as well as how it is partitioned into evaporation (E) and transpiration (T), remains incomplete. In this study, we employed four large-scale weighing lysimeters in a 2×2 factorial design (vegetation: Artemisia ordosica vs. bare soil; groundwater: presence vs. absence), complemented by Hydrus-1D simulations to investigate the groundwater effects on ecohydrological processes in the desert ecosystem. From April to August 2024, we analyzed the influence of groundwater (-2.5 m) on plant growth properties, soil water, ET and its partitioning. Findings revealed that the roots of A. ordosica in desert ecosystems with groundwater extended deeper (-3.0 m) than those without groundwater (-2.8 m). The ratios of root area to leaf area of A. ordosica under conditions without and with groundwater were 5.22-15.4 and 30.1-60.5, respectively. The groundwater increased soil water contents in the middle and deep soil layers, while the higher precipitation (31 mm d-1) could influence the soil water contents at depths of 0.8-1.0 m. The performance of the model for the simulated soil water contents, E or ET of the four lysimeters with Hydrus-1D achieves satisfactory results (R2 = 0.501-0.726, RMSE = 0.0135-0.590, NSE = 0.438-0.692). The observed mean daily ET of A. ordosica was 2.18 ± 0.0973 and 1.19 ± 0.0685 mm d-1 for the treatment with and without groundwater. The simulated root water uptake (RWU) was clearly higher for the groundwater treatment (1.15 ± 0.0625 mm d-1) than for the control (0.548 ± 0.0317 mm d-1). The RWU:ET ratios of A. ordosica were 52.7 ± 1.58% and 50.1 ± 1.57% with and without groundwater. Redundancy analysis and Pearson correlation showed that the presence of groundwater alleviated the influences of low precipitation, relative humidity, and high air temperature on ET and its partitioning. This study provides robust empirical evidence to help us understand the interactions between groundwater-soil-plant-atmosphere in desert ecosystems. This has significant implications for the sustainable revegetation management practices in arid areas.

How to cite: Zhang, Z.-S.: Observed and modeled root water uptake by sand-fixing semi-shrub in response to groundwater, EGU General Assembly 2026, Vienna, Austria, 3–8 May 2026, EGU26-4729, https://doi.org/10.5194/egusphere-egu26-4729, 2026.

EGU26-7080 | ECS | Posters on site | HS6.3

Effect of the representativeness of meteorological input data on the estimation of reference evapotranspiration (FAO-56) and crop evapotranspiration in intensive agricultural systems under a subtropical climate 

Maria Pinheiro, Richard Lobato, Mirta Petry, Paula Paredes, Vanessa Souza, Alecsander Mergen, Murilo Lopes, Eberton Souza, João Basso, and Débora Roberti

Reference evapotranspiration (ET0) is a key variable for quantifying crop water requirements and for irrigation management. The FAO-56 Penman–Monteith equation is widely adopted as the standard method for estimating ET0; however, its application depends strongly on the availability, quality, and spatial representativeness of the input meteorological variables. In agricultural regions with high microclimatic variability, the heterogeneous spatial distribution of meteorological stations can introduce substantial uncertainties into ET0 estimates. Southern Brazil is characterized by a subtropical climate with relatively well-distributed precipitation throughout the year, thus allowing for rainfed cropland systems. In this region, agricultural systems exhibit a high intensity of land use, with croplands remaining under production almost continuously. As a consequence of this intensification, rainfed systems are dominated by crop rotations involving soybean, wheat, and maize, often combined with cover crops. In lowland areas, production systems are primarily based on flood-irrigated rice, alternated with soybean or pasture. This diversity of land uses, together with the resulting variability in surface conditions, poses additional challenges for the accurate estimation of crop evapotranspiration (ETc), due to the strong influence of microclimatic conditions on soil–plant–atmosphere water and energy exchanges. Within this context, this study aims to evaluate the impact of using in situ versus regional meteorological data on the estimation of ET0 and on the determination of actual crop evapotranspiration (ETc,act) and therefore actual crop coefficients (Kc,act). To this end, the SIMDualKc model will be applied to estimate actual ETc following the FAO-56 approach, and the results will subsequently be evaluated against ET measurements derived from eddy covariance flux towers. These analyses will be conducted in two agricultural areas under crop rotation in the state of Rio Grande do Sul, Brazil: one under rainfed conditions and another located in a lowland system. For the application of the SIMDualKc model, meteorological data from the Instituto Nacional de Meteorologia (INMET) station located approximately 50 km from each field will be used, as well as data from a local meteorological station installed over a reference surface at a distance of about 1 km from the monitored areas. In addition to the difference in distance relative to the croplands, the local station provides direct measurements of net radiation and soil heat flux, variables that must be estimated when using INMET station data. Therefore, it is expected that the results will demonstrate that the use of local meteorological data allows a more robust quantification of the uncertainties associated with FAO-56-based ETc estimates and, if necessary, supports adjustments of actual Kc derived from regional data, accounting for local microclimatic patterns. Finally, the study seeks to highlight that spatial discrepancies related to station distance may fail to represent the local climatic conditions relevant for ET0 estimation and, consequently, may directly affect uncertainties in actual crop evapotranspiration estimates and irrigation management.

How to cite: Pinheiro, M., Lobato, R., Petry, M., Paredes, P., Souza, V., Mergen, A., Lopes, M., Souza, E., Basso, J., and Roberti, D.: Effect of the representativeness of meteorological input data on the estimation of reference evapotranspiration (FAO-56) and crop evapotranspiration in intensive agricultural systems under a subtropical climate, EGU General Assembly 2026, Vienna, Austria, 3–8 May 2026, EGU26-7080, https://doi.org/10.5194/egusphere-egu26-7080, 2026.

EGU26-7151 | ECS | Posters on site | HS6.3

Improved Evapotranspiration Estimation in Coarse-Textured Soils Using a Comprehensive Water Balance Model 

Diksha Chaudhary and Ickkshaanshu Sonkar

Advances in soil moisture monitoring techniques and sensor networks have made data assimilation a powerful approach for estimating evapotranspiration (ET). The commonly used simple water balance (SWB) model provides reliable ET estimates within data assimilation frameworks; however, it often neglects the influence of ET on vertical fluxes. While this assumption may be valid during drying periods in low-drainage soils, it is less appropriate for soils with high hydraulic conductivity. This study introduces a comprehensive water balance (CWB) model that explicitly accounts for ET-driven percolation. The model captures the effect of ET on vertical fluxes by comparing soil water depletion with and without ET, thereby highlighting the role of root water uptake (RWU) in controlling percolation. The CWB model, coupled with an ensemble Kalman filter, predicts daily ET using soil moisture sensor data across different soil types. Within this framework, RWU is treated as the observable variable for state updating. Model performance was evaluated against the conventional SWB model under varying drainage conditions. For loamy sand, the CWB model was independently validated using weighing lysimeter measurements. Results demonstrate that the CWB model outperforms the SWB model, particularly in coarse-textured soils, reducing ET estimation error by up to 45% and achieving higher accuracy (NSE = 0.918 vs. 0.727). Sensitivity analyses incorporating sensor uncertainty show that fine-textured soils exhibit lower sensitivity to measurement errors, resulting in more robust ET estimates. These findings underscore the importance of incorporating vertical flux effects to avoid ET underestimation, especially in highly permeable soils. 

Keywords: Water balance model, vertical flux, evapotranspiration, Ensemble Kalman filter, root water uptake.

How to cite: Chaudhary, D. and Sonkar, I.: Improved Evapotranspiration Estimation in Coarse-Textured Soils Using a Comprehensive Water Balance Model, EGU General Assembly 2026, Vienna, Austria, 3–8 May 2026, EGU26-7151, https://doi.org/10.5194/egusphere-egu26-7151, 2026.

EGU26-8548 | ECS | Posters on site | HS6.3

Integrating Landsat and Physics-Informed Neural Networks for reference evapotranspiration estimation 

Arvindd Kshetrimayum, Hyunho Jeon, and Minha Choi

Evapotranspiration (ET) is a key component of the hydrological cycle with important implications for water management and climate modeling. Despite the robustness of physically based evapotranspiration models, their application at high spatial resolution remains limited by point-scale forcing and the coarse representation of key meteorological drivers, particularly near-surface wind speed. In this study, we present a fully satellite-based framework to estimate reference evapotranspiration (ETo) at 30 m resolution by integrating Landsat observations with a physics-informed neural network (PINN). Near-surface wind speed at 2 m is first estimated to the Landsat scale using a Random Forest model that leverages static terrain and land-cover information together with dynamically retrieved land surface temperature, net radiation, and vapor-pressure deficit. These high-resolution meteorological fields are then used to drive a PINN constrained by the FAO-56 Penman–Monteith and Priestley–Taylor formulations, which are embedded as complementary physical losses to ensure consistency with both aerodynamic and radiative controls on ETo. The approach is evaluated across eight eddy covariance flux-tower sites spanning cropland, grassland, and forest ecosystems in Asia and Europe. Results demonstrate strong agreement with tower-based Penman–Monteith ETo (R = 0.80–0.97; RMSE = 0.52–1.43 mm/d), with the highest accuracy observed over homogeneous croplands and larger, yet systematic, deviations during short-duration high-flux periods in heterogeneous and structurally complex canopies. Spatial comparison with ERA5-Land ETo further highlights the added value of high-resolution, satellite-driven estimates in capturing sub-grid variability. These results indicate that physics-informed learning provides a robust and scalable pathway for canopy-scale ETo mapping in heterogeneous landscapes.

Acknowledgment: This research was supported by the BK21 FOUR (Fostering Outstanding Universities for Research) funded by the Ministry of Education (MOE, Korea) and National Research Foundation of Korea (NRF). This work is financially supported by Korea Ministry of Land, Infrastructure and Transport (MOLIT) as 「Innovative Talent Education Program for Smart City」. This work was supported by the National Research Foundation of Korea (NRF) grant funded by the Korea government (MSIT) (RS-2024-00416443). This work was supported by the National Research Foundation of Korea (NRF) grant funded by the Korea government (MSIT) (RS-2022-NR070339).

How to cite: Kshetrimayum, A., Jeon, H., and Choi, M.: Integrating Landsat and Physics-Informed Neural Networks for reference evapotranspiration estimation, EGU General Assembly 2026, Vienna, Austria, 3–8 May 2026, EGU26-8548, https://doi.org/10.5194/egusphere-egu26-8548, 2026.

EGU26-8913 | Posters on site | HS6.3

Integrating remotely sensed evapotranspiration into hydrological modelling of Mediterranean tree-grass ecosystems  

Ana Andreu, David Gabella, and Rafael Pimentel

Mediterranean mountain ecosystems play a key role in water supply and biodiversity conservation but are highly vulnerable to climate change. In these environments, vegetation strongly regulates key hydrological fluxes such as evapotranspiration and interception. However, the complex structure and marked seasonal dynamics of Mediterranean agroforestry systems remain poorly represented in many hydrological models, which often rely on static vegetation parameterizations or climate-driven evapotranspiration formulations. 

In this study, we investigate the integration of remotely sensed evapotranspiration and vegetation dynamics into the distributed, physically based hydrological model WiMMed (Watershed Integrated Model in Mediterranean regions) for a mountain catchment located in the Parque Natural de Cardeña y Montoro (southern Spain). Vegetation heterogeneity and dynamics are explicitly accounted for by combining MODIS-derived evapotranspiration estimates obtained from the Two-Source Energy Balance (TSEB) model with satellite-based fractional vegetation cover (FCV). Model performance and hydrological responses are evaluated against a conventional modelling approach based on a crop-modified Hargreaves formulation and static vegetation representation. 

Differences between the two approaches are analyzed in terms of evapotranspiration patterns, soil moisture dynamics, interception, and runoff generation. The inclusion of remotely sensed ET improved the simulation of water balance components and their spatial variability. Dynamic vegetation scenarios better capture seasonal and interannual variability in ET and runoff, highlighting vegetation-water interactions that are not reproduced by climate-only ET formulations.  Results show that neglecting vegetation dynamics or assuming static full cover leads to substantial biases in water flux partitioning, e.g., static vegetation scenarios “overestimate” interception (up to ~11.5% of annual precipitation), whereas incorporating dynamic vegetation reduces interception to ~3–4% and significantly alters the partitioning between infiltration and runoff, particularly during wet years. Overall, this approach provides a framework for identifying system inflection points, evaluating future climate and land-use scenarios.

How to cite: Andreu, A., Gabella, D., and Pimentel, R.: Integrating remotely sensed evapotranspiration into hydrological modelling of Mediterranean tree-grass ecosystems , EGU General Assembly 2026, Vienna, Austria, 3–8 May 2026, EGU26-8913, https://doi.org/10.5194/egusphere-egu26-8913, 2026.

EGU26-9032 | ECS | Posters on site | HS6.3

An Open-Source Graphical User Interface for Estimating Heat-Pulse Based Sap Flux 

spandan sogala balaram and Venkatraman Srinivasan

Heat-pulsed based Sap flow sensors are widely used to quantify plant water uptake by employing heat as a tracer. These methods estimate sap flow using the temperature breakthrough curves measured down and/or upstream of the heat source following a heat pulse. Several established methods, such as Marshall, Tmax, Compensation Heat Pulse (CHP), and Heat Ratio (HR) methods, rely on simple analytical formulations that can be implemented using spreadsheets or basic computing tools. In contrast, physically based inverse modelling approaches such as the Sum of Squares Error (SSE)  or Sapflow+ method estimate heat pulse velocity by fitting analytical solutions of the heat transport equation to measured temperature responses using nonlinear optimization. This involves  more complex computing tools that may not be easy to implement in spreadsheets. This computational complexity has limited the broader adoption of these methods. To address this, here we develop an interactive, Python-based open-source Graphical User Interface (GUI) for estimating sap flow using the SSE method. The GUI can be accessed through a web browser making it platform-independent. Additionally, users have the option to deploy the computational platform locally on their computers/tablets/mobile devices or access the cloud computing services we have enabled. The tool enables users to i) upload temperature data, ii) apply data filtering and wound correction, iii) perform automated parameter estimation, and iv) visualize heat pulse velocity and sap flow rates through interactive plots with downloadable outputs. Users also have the option to compare sap flux estimates from different methods. By providing a user-friendly interface for different sapflow methods, including the computationally intensive SSE method, our GUI facilitates more consistent and reliable sap flow analysis across research studies.

How to cite: sogala balaram, S. and Srinivasan, V.: An Open-Source Graphical User Interface for Estimating Heat-Pulse Based Sap Flux, EGU General Assembly 2026, Vienna, Austria, 3–8 May 2026, EGU26-9032, https://doi.org/10.5194/egusphere-egu26-9032, 2026.

EGU26-9899 | ECS | Posters on site | HS6.3

Enhancing Daily Evapotranspiration Estimates in Germany Using Multi-Source Data and Machine Learning Models 

Somayeh Ahmadpour and Katja Trachte

Evapotranspiration (ET) is the process describing the transfer of water from the land surface into the atmosphere. It includes evaporation from soil and plant surfaces, as well as transpiration through plant stomata. ET represents a central link between the terrestrial water cycle, energy cycle, and carbon cycle. Thus, an accurate estimation of ET is essential for understanding the landscape water budget and biomass production, as well as for improving agricultural water management and irrigation strategies. Additionally, more accurate ET values improve models of carbon-water interactions in land ecosystems and promote sustainable water use.

This study aims to identify an appropriate model for estimating daily ET across a west-east climate and land-use gradient in Germany, providing an effective method that accurately reflects ET variability. The main objectives of this study are to (i) estimate ET using a combination of machine learning, physics-based, and hybrid models; (ii) evaluate the performance, efficiency, and sensitivity of these models by comparing estimated ET with ET observations; and (iii) use the most accurate model to predict daily ET variability along the climate and land use gradient in Germany.

To achieve this, remote sensing data from Sentinel-2 and Landsat-8, as well as meteorological data from the German Weather Service (DWD) and the ERA-5 reanalysis, were used for model training. To assess the models' performance, eddy-covariance data from the Integrated Carbon Observation System (ICOS) and ET products from the Moderate Resolution Imaging Spectroradiometer (MODIS) for the years 2017 to 2024 were used.

We used five different approaches to estimate daily ET, including deep learning (DL), machine learning, hybrid models, and physical models. Specifically, we employed the Optical Trapezoid Model (OPTRAM), Artificial Neural Network (ANN), Adaptive Neuro-Fuzzy Inference System (ANFIS), Random Forest (RF), and TabTransformer. We evaluated the accuracy of each approach using ICOS ET observations.

The results indicated that DL models generally performed better than RF and OPTRAM-ET models in the study area. Among all the experiments, the ANN achieved the best performance, with a root mean square error of 0.6 and a correlation coefficient of 0.91. Additionally, we observed significant variations in modeling performance across different ecosystem types. In grassland, ET estimates showed the highest accuracy, whereas in cropland ecosystems, the greatest deviations were observed.

How to cite: Ahmadpour, S. and Trachte, K.: Enhancing Daily Evapotranspiration Estimates in Germany Using Multi-Source Data and Machine Learning Models, EGU General Assembly 2026, Vienna, Austria, 3–8 May 2026, EGU26-9899, https://doi.org/10.5194/egusphere-egu26-9899, 2026.

Evapotranspiration (ET) is an Essential Climate Variable (ECV) that plays a key role in the energy-water cycle, as it can influence precipitation and temperature dynamics, and it also has a direct impact on irrigation water demand in agricultural areas. However, its accurate estimation is still under debate, with a major unresolved challenge: cloudy-sky conditions. This issue arises because most evaporation satellite-based models rely on instantaneous land surface temperature (LST) as an input to solve the energy balance. As a result, capturing ET dynamics under all-sky conditions remains challenging.

Moreover, these models rely solely on daily data and fail to capture the full dynamics of ET throughout the day. This partial representation of daytime ET dynamics is closely related to the asymmetric relationship between ET and radiation, which is strongly linked to LST. This asymmetry becomes even more complex in arid environments, where environmental factors such as vapour pressure deficit and air temperature modulate vegetation behaviour, as well as in irrigated areas, where water inputs can sometimes be uncertain. To interpret and represent ET dynamics under both clear-sky and cloudy-sky conditions, it is necessary to use models capable of simulating ET without relying on data availability affected by cloud presence.

This work presents preliminary results of the hybrid version of the FEST-EWB model, which is able to compute energy fluxes under all-sky conditions, merged with LST data from the Meteosat Second Generation. Evapotranspiration estimates over the entire MSG disk will be analysed and validated against eddy covariance data. The hybrid approach combines the FEST-EWB model—which continuously simulates soil moisture and ET over time and space, resolving LST and closing the energy–water balance equations (Corbari et al., 2011), thus providing a physically based framework capable of filling gaps when satellite LST is not available due to cloud cover—and the residual version of the FEST model, which uses the available LST under clear-sky conditions. Preliminary results from the FEST-Hybrid approach highlight the strong potential of the model due to its adaptability across different spatiotemporal scales and all-sky conditions. The integration of satellite LST data when available allowed to properly represent ET dynamic also in irrigated areas.

How to cite: Torralbo Muñoz, P., Mallick, K., and Corbari, C.: All-Sky Evapotranspiration and its Diurnal Asymmetry Using Physically Based Modelling and Geostationary Land Surface Temperature Data , EGU General Assembly 2026, Vienna, Austria, 3–8 May 2026, EGU26-12020, https://doi.org/10.5194/egusphere-egu26-12020, 2026.

Evapotranspiration (ET) governs the exchange of water and energy between the land surface and the atmosphere, accounting for over 70% of agricultural water consumption. Accurate ET estimation is therefore crucial for efficient irrigation management and sustainable water allocation. Traditional in situ methods, such as lysimeters and eddy covariance towers, provide precise measurements but are costly and spatially limited. In contrast, remote sensing–based energy balance models like the Surface Energy Balance Algorithm for Land (SEBAL) offer scalable, cost-effective solutions for large-scale ET monitoring.

A critical factor determining SEBAL’s accuracy is the appropriate selection of hot and cold anchor pixels, which represent the limiting conditions of no ET and maximum ET, respectively. However, this step remains one of the most challenging and subjective aspects of SEBAL implementation. Previous approaches, including visual selection, statistical filtering, and threshold-based rules (e.g., based on NDVI, albedo, and LST), have improved consistency but still suffer from regional dependency, random selection biases, and inconsistent parameter thresholds. Methods relying on proximity to meteorological stations or calibration with lysimeter data improve accuracy but are not universally applicable due to data limitations and landscape heterogeneity. Consequently, the same scene can yield different anchor pixels across methods, leading to divergent ET estimates and reduced reproducibility.

To address these limitations, this study proposes the development of an automated, reproducible framework for anchor pixel selection using a Genetic Algorithm (GA) optimization approach. The GA systematically identifies biophysically consistent anchor pixels by exploring multidimensional feature space (NDVI, LST) while minimizing uncertainty and eliminating subjective human bias. The method is implemented using daily MODIS (Moderate Resolution Imaging Spectroradiometer) imagery, aggregated to 250 m spatial resolution to capture field-scale variability better while maintaining high temporal fidelity.

This automated approach ensures scalability, portability, and reproducibility across diverse agro-ecological regions without heavy data requirements. It offers a simple yet robust workflow suitable for operational ET monitoring and can be integrated into regional irrigation and drought management systems

How to cite: m a, N. and Narasimhan, B.: A Scalable Genetic Algorithm Framework for Automated Anchor Pixel Selection to Improve Satellite-Based Evapotranspiration Monitoring Using SEBAL, EGU General Assembly 2026, Vienna, Austria, 3–8 May 2026, EGU26-13206, https://doi.org/10.5194/egusphere-egu26-13206, 2026.

Accurate estimation of reference evapotranspiration (ETo) is fundamental for irrigation scheduling, hydrological modeling, and sustainable water-resources management, particularly in arid and semi-arid regions where strong climatic variability challenges predictive reliability. This study investigates the performance of advanced Transformer-based deep learning architectures and their hybrid extensions for daily ETo prediction at two climatically distinct inland stations—Nizwa and Rustaq in northern Oman. Three state-of-the-art single models, namely Autoformer, Informer, and FEDformer, were evaluated and further integrated with Multivariate Variational Mode Decomposition (MVMD) to develop hybrid frameworks capable of explicitly disentangling multi-scale temporal patterns and cross-variable dependencies. Meteorological data spanning 2018–2025 were used to train and test the models under five input scenarios: (i) temperature only, (ii) temperature with wind speed (U2), (iii) temperature with net radiation (Rn), (iv) temperature with vapor pressure deficit (es–ea), and (v) all available meteorological variables. Model performance was assessed using the coefficient of determination (R²), root mean square error (RMSE), and the RMSE–standard deviation ratio (RSR). Results indicate that hybrid MVMD-based models consistently outperform their single-model counterparts across all input scenarios and both stations, with the most pronounced improvements observed under multi-variable configurations. FEDformer-MVMD model demonstrated superior generalization, particularly under high evaporative demand conditions, highlighting its effectiveness in capturing long-term dependencies and non-stationary climatic signals. Scenario-based analysis further reveals that incorporating radiation and vapor pressure deficit substantially enhances prediction accuracy in inland arid environments. Overall, the findings confirm that combining Transformer architectures with multivariate signal decomposition significantly improves ETo prediction accuracy and robustness. The proposed frameworks provide a scalable and climate-adaptive solution for operational irrigation management and drought-risk assessment in data-scarce arid regions.

How to cite: Elzain, H. E., Al-Maktoumi, A., and Chen, M.: Enhancing Reference Evapotranspiration Prediction Using Deep Learning Transformer Models and Multivariate Variational Mode Decomposition in Arid Regions, EGU General Assembly 2026, Vienna, Austria, 3–8 May 2026, EGU26-13975, https://doi.org/10.5194/egusphere-egu26-13975, 2026.

EGU26-14176 | ECS | Posters on site | HS6.3

Sources of uncertainty in remote sensing based water productivity from evapotranspiration and net primary production inputs 

Suzan Dehati, Bich Ngoc Tran, Marloes Mul, and Poolad Karimi

Remote sensing based water productivity indicators are increasingly used in agricultural and ecosystem monitoring, yet their accuracy is constrained by uncertainties in evapotranspiration (ET) and net primary production (NPP) data. Here we evaluate four global ET and NPP products against eddy covariance (EC) flux tower data from AmeriFlux, ICOS, and OzFlux for 2018-2022. Tower latent heat flux is used to derive ET, while tower gross primary production (GPP) is converted to NPP. All satellite products are harmonized temporally and evaluated at dekadal scale using correlation, bias, and RMSE, with stratification by land cover classes. In cropland and forest land covers, WaPOR shows the highest overall performance against EC data for both ET and NPP, with strong correlations and low systematic bias. NPP products show much stronger site-to-site variability than ET, and no product is consistently superior at all locations. Overall, the comparison suggests a clear imbalance: ET estimates are relatively consistent across products, while NPP remains the main source of disagreement between datasets at many sites. This matters directly for any water productivity calculation based on ET and NPP, because water productivity can shift simply with the choice of NPP dataset. The next step of this work will use these results to quantify how much ET versus NPP drives uncertainty in remotely sensed water productivity over cropland and forest land covers.

How to cite: Dehati, S., Ngoc Tran, B., Mul, M., and Karimi, P.: Sources of uncertainty in remote sensing based water productivity from evapotranspiration and net primary production inputs, EGU General Assembly 2026, Vienna, Austria, 3–8 May 2026, EGU26-14176, https://doi.org/10.5194/egusphere-egu26-14176, 2026.

EGU26-14809 | ECS | Posters on site | HS6.3

Sub-daily microwave observations to constrain evaporation modelling over forest ecosystems 

Emma Tronquo, Nathan Van der Borght, Anna Selina Neyer, Diego G. Miralles, and Susan C. Steele-Dunne

Microwave remote sensing observations provide unique information on soil–plant water status as they are directly sensitive to changes in soil moisture, internal vegetation water content, and the water content present on vegetated surfaces due to precipitation, dew, or irrigation. These variables are key drivers of terrestrial evaporation (E) and important indicators of ecosystem functioning and health. Current E models that exploit microwave observations are largely constrained to daily time scales, due to the lack of sub-daily satellite microwave data. However, water transport within the soil–plant–atmosphere continuum exhibits strong diurnal dynamics, and E shows a pronounced diurnal hysteresis, with higher rates typically occurring during the morning compared to the afternoon. This highlights the need to monitor vegetation responses to environmental stress at sub-daily scales and to model transpiration (Et) at high temporal resolution. Sub-daily resolutions are also required to accurately represent rainfall interception loss (Ei), which exhibits strong intra-day variability, particularly during and shortly after precipitation events. Sub-daily microwave observations offer the potential to resolve these fast processes, thereby advancing the understanding of E, stomatal regulation, and the coupling between water, energy, and carbon cycles. In particular, sub-daily observations of vegetation optical depth (VOD) and canopy surface wetness are expected to improve the estimation of Et and Ei, respectively.

This study is motivated by the continued development of a sub-daily SAR mission concept to enable global monitoring of vegetation water dynamics, health, and stress. One of the challenges in the early development of the SLAINTE mission, as an ESA New Earth Observation Mission Idea (NEOMI) and as a concept in response to ESA’s 12th call for Earth Explorers, was the scarcity of sub-daily observations (Steele-Dunne et al., 2024; Matar et al., 2024). Here, the potential to constrain E estimates using sub-daily VOD data is revisited using observations from a new network of in-situ GNSS-based sensors.  

We assess the potential value of sub-daily microwave observations by constraining a sub-daily version of the Global Land Evaporation Amsterdam Model (GLEAM; Miralles et al., 2011), using sub-daily observations of VOD and binary wet/dry canopy state (WDCS). These observations are derived from in-situ GNSS-based sensors deployed across several European forest ecosystems. By analyzing the diurnal cycle of VOD, potential descriptors of vegetation water stress can be identified and incorporated as constraints in this sub-daily version of GLEAM. This study presents a methodology to exploit sub-daily VOD and provides a pathway to consolidate observation requirements for estimating E at sub-daily scales and for quantifying the impact of environmental stress. 

Matar, J., et al. “A Concept for an Interferometric SAR Mission with Sub-daily Revisit”, EUSAR 2024; 15th European Conference on Synthetic Aperture Radar, Munich, Germany, 2024, pp. 18-22.

Miralles, D. G., et al. “Global land-surface evaporation estimated from satellite-based observations”, Hydrology and Earth System Sciences, vol. 15, no. 2, pp. 453–469, 2011.

Steele-Dunne, S. C., et al. “SLAINTE: A SAR mission concept for sub-daily microwave remote sensing of vegetation”, EUSAR 2024; 15th European Conference on Synthetic Aperture Radar, Munich, Germany, 2024, pp. 870-872.

How to cite: Tronquo, E., Van der Borght, N., Neyer, A. S., Miralles, D. G., and Steele-Dunne, S. C.: Sub-daily microwave observations to constrain evaporation modelling over forest ecosystems, EGU General Assembly 2026, Vienna, Austria, 3–8 May 2026, EGU26-14809, https://doi.org/10.5194/egusphere-egu26-14809, 2026.

EGU26-14974 | Orals | HS6.3

GLEAM-HR: A 1-km terrestrial evaporation dataset with explicit representation of irrigation 

Oscar Manuel Baez Villanueva, Alfredo Crespo-Otero, Maximilian Söchting, Pierre Laluet, Miguel Mahecha, Olivier Bonte, Joppe Massant, Jaap Schellekens, Christian Massari, Chiara Corbari, Sara Modanesi, Jacopo Dari, Kwint Delbare, Wouter Dorigo, Hylke E. Beck, Pere Quintana-Seguí, Aaron Boone, Roger Clavera-Gispert, and Diego G. Miralles

Terrestrial evaporation (E) has traditionally been estimated either at coarse resolution over large domains or at high resolution over limited regions due to computational and storage constraints. Recent methodological and computational advances are bridging this gap, enabling regional- to global-scale E datasets at relatively high spatial resolutions for climate, water-management, and agricultural applications. Building on these developments and the fourth generation of the Global Land Evaporation Amsterdam Model (GLEAM4¹), we present GLEAM-HR, a 1-km E dataset for 2016–2023 covering Europe, Africa, and a portion of South America (Meteosat disk). GLEAM-HR combines precipitation from Multi-Source Weighted-Ensemble Precipitation (MSWEP) v2.8 with radiative forcing derived from merged Land Surface Analysis Satellite Application Facility (LSA SAF) and Moderate Resolution Imaging Spectroradiometer (MODIS) products.

Algorithmic enhancements in GLEAM-HR enable a more realistic representation of fine-scale E dynamics, particularly in agricultural regions, and improve the characterisation of droughts and heatwaves. A key innovation is the explicit representation of irrigation through a four-step framework that (i) identifies irrigation timing and location at a daily scale, (ii) raises soil moisture to field capacity in irrigated grid cells, (iii) assimilates 1-km Sentinel-1² soil moisture observations, and (iv) estimates evaporative stress using an XGBoost-based model driven by vegetation and atmospheric stressors. Unlike other existing approaches, GLEAM-HR does not assume potential evaporation over irrigated croplands, but constrains E using multiple environmental stress factors.

The resulting estimates show increases in annual evaporation of up to 450 mm yr⁻¹ over irrigated regions compared to simulations that neglect irrigation, with spatial patterns consistent with independent irrigation datasets. Evaluation against eddy-covariance measurements shows clear improvements at irrigated sites, with daily Kling–Gupta Efficiency (KGE) values of 0.20–0.40, while performance in non-irrigated regions ranges from 0.17 to 0.64. The dataset will be made publicly available through an interactive 3D data cube³ platform. Overall, GLEAM-HR provides a realistic high-resolution representation of irrigation effects on E, supporting applications in regional agricultural management and water-resource assessment. Future work includes global production of GLEAM-HR, development of a global 3D data cube, expansion of the record length, and propagation of algorithmic improvements to the next release of the long-term GLEAM climate record (0.1°) available via www.gleam.eu.


¹ Miralles, D.G., Bonte, O., Koppa, A., Baez-Villanueva, O.M., Tronquo, E., Zhong, F., Beck, H.E., Hulsman, P., Dorigo, W., Verhoest, N.E. and Haghdoost, S., 2025. GLEAM4: global land evaporation and soil moisture dataset at 0.1 resolution from 1980 to near present. Scientific data, 12(1), p.416

² Fan, Dong; Zhao, Tianjie; Jiang, Xiaoguang; García-García, Almudena; Schmidt, Toni; Samaniego, Luis; Attinger, Sabine; Wu, Hua; Jiang, Yazhen; Shi, Jiancheng; Fan, Lei; Tang, Bo-Hui; Wagner, Wolfgang; Dorigo, Wouter; Gruber, Alexander; Mattia, Francesco; Balenzano, Anna; Brocca, Luca; Jagdhuber, Thomas; Wigneron, Jean-Pierre; Montzka, Carsten; Peng, Jian (2025): A Sentinel-1 SAR-based global 1-km resolution soil moisture data product: Algorithm and preliminary assessment. Remote Sensing of Environment, 318, 114579

³ M. Söchting, M. D. Mahecha, D. Montero and G. Scheuermann, (2024): Lexcube: Interactive Visualization of Large Earth System Data Cubes. IEEE Computer Graphics and Applications, vol. 44, no. 1, pp. 25-37.

How to cite: Baez Villanueva, O. M., Crespo-Otero, A., Söchting, M., Laluet, P., Mahecha, M., Bonte, O., Massant, J., Schellekens, J., Massari, C., Corbari, C., Modanesi, S., Dari, J., Delbare, K., Dorigo, W., Beck, H. E., Quintana-Seguí, P., Boone, A., Clavera-Gispert, R., and Miralles, D. G.: GLEAM-HR: A 1-km terrestrial evaporation dataset with explicit representation of irrigation, EGU General Assembly 2026, Vienna, Austria, 3–8 May 2026, EGU26-14974, https://doi.org/10.5194/egusphere-egu26-14974, 2026.

Accurate mapping of evapotranspiration (ET) via remote sensing is crucial for water resource management, yet it remains challenging in water-limited environments where existing water stress proxies often lack physical robustness or spatiotemporal detail.

We here propose the Temperature-Shortwave Infrared Water Index (TSWI), a synergistic index that directly couples land surface temperature (LST) and shortwave infrared (SWIR) reflectance for ET estimation. TSWI demonstrates strong agreement with in-situ soil moisture and consistency with SMAP and MODIS products. TSWI-based ET estimates perform robustly against flux tower data (R² = 0.64) and water-balance ET (R² = 0.83). Moreover, the standardized TSWI effectively captured the 2022 Yangtze River Basin drought with finer detail than conventional indices. These results demonstrate TSWI as a robust, operational tool for regional ET estimation and drought monitoring, supporting improved water management and early warning systems.

How to cite: Yang, Y. and Yan, D.: A Novel Synergistic LST-SWIR Index for Evapotranspiration Estimation and Drought Assessment, EGU General Assembly 2026, Vienna, Austria, 3–8 May 2026, EGU26-15503, https://doi.org/10.5194/egusphere-egu26-15503, 2026.

High-resolution mapping of urban evapotranspiration (ET) is challenged by landscape heterogeneity and complex natural-anthropogenic interactions, with a critical gap in fine-scale ET products that capture these land-atmosphere dynamics. This study bridges this gap by developing a hybrid physics-based and machine learning framework to generate 10-meter, hourly urban ET maps for Wuhan, China. We first simulate hourly latent heat flux at 333-m resolution using the Weather Research and Forecasting (WRF) model to establish a physical background field. Concurrently, high-resolution (10-m) surface features, including the Normalized Difference Vegetation Index (NDVI) and urban morphological parameters, are derived from Sentinel-2 imagery. Spatial downscaling from 333 m to 10 m is achieved by leveraging eddy covariance data from Wuhan’s urban flux tower. Using flux footprint modeling, hourly tower measurements are linked to the fine-scale land-cover configuration of their source areas, establishing a physical relationship between latent heat flux and surface properties. A Random Forest model is trained on this relationship and applied citywide to generate 10-m hourly ET maps. The resulting dataset effectively resolves intra-urban variability, clearly capturing sharp ET gradients between impervious surfaces and green spaces. This work provides a scalable and physics-grounded pathway for high-fidelity urban ET mapping, offering valuable insights for urban heat mitigation and water resources management.

How to cite: zhou, Z. and Song, J.: High Spatiotemporal Mapping of Urban Evapotranspiration via a Hybrid Physics-Based and Machine Learning Framework, EGU General Assembly 2026, Vienna, Austria, 3–8 May 2026, EGU26-15790, https://doi.org/10.5194/egusphere-egu26-15790, 2026.

EGU26-16657 | Orals | HS6.3

Mapping evapotranspiration using satellite and eddy covariance in south-western Australia 

Konrad Miotlinski, Caitlin Moore, and Sally Thompson

Evapotranspiration (ET) is the dominant flux in the terrestrial water balance of Mediterranean-type climates and a primary control on groundwater recharge. In south-western Australia, a long-term decline in winter rainfall combined with increasing evaporative demand and urban growth has intensified pressure on groundwater resources that support endemic ecosystems, irrigated agriculture, and urban water supply. Reliable, spatially distributed ET estimates are therefore crucial for groundwater modelling and water resources management under a changing climate.

Despite the widespread availability of satellite-derived ET products, their direct application in regions dominated by endemic vegetation remains problematic. Banksia woodlands, which cover large parts of the Swan Coastal Plain, exhibit deep rooting systems, strong soil-vegetation feedbacks, and seasonal water use strategies that are poorly represented in global ET algorithm. Consequently, commonly used products such as MOD16 and PML show significant discrepancies in magnitude and seasonal dynamics, leading to large uncertainty in groundwater recharge estimation.

To address this limitation, we developed a locally constrained ET upscaling framework that integrates multiple satellite products with ground-based observations across the Swan Coastal Plain. Empirical regression relationships were first derived for MOD16 and PML ET estimates to characterise systematic product differences. Then, time series were used to train and apply a Random Forest (RF) model, constrained by eddy covariance observations. Finally, in Google Earth Engine (GEE) the ET was upscaled in space and time using satellite-based predictors and land-cover information.

This contribution presents a multi-year, monthly ET climatology for the Perth region and evaluates its spatial and temporal consistency across major land-cover classes, with particular emphasis on banksia woodland ecosystems. Rather than benchmarking individual products alone, we assess the implications of ET uncertainty and upscaling choices for groundwater recharge estimation and regional groundwater modelling.

The resulting ET maps reveal systematic biases in standalone MOD16 and PML products over Banksia woodlands and demonstrate that the RF-based upscaling produces more coherent seasonal patterns and spatial gradients consistent with field observations. In particular, the RF model systematically constrains the high ET values characteristic of PML while preserving the spatial structure captured by MOD16. Monthly mean ET fields show reduced inter-product variability and offer stable behaviour suitable for direct use as inputs to groundwater modelling.

These results indicate that combining satellite-derived ET products through locally informed regression and machine-learning upscaling substantially improves the representation of evapotranspiration in groundwater modelling frameworks. The derived ET climatology provides a defensible basis for recharge estimation and scenario analysis under ongoing and projected climate evolution in south-western Australia. Nevertheless, more eddy covariance sites would improve estimates.

More broadly, this approach offers a transferable framework for adapting global ET products to endemic and water-limited ecosystems, supporting more robust groundwater-resource management in regions facing increasing hydroclimatic stress.

How to cite: Miotlinski, K., Moore, C., and Thompson, S.: Mapping evapotranspiration using satellite and eddy covariance in south-western Australia, EGU General Assembly 2026, Vienna, Austria, 3–8 May 2026, EGU26-16657, https://doi.org/10.5194/egusphere-egu26-16657, 2026.

EGU26-17124 | ECS | Orals | HS6.3

Evapotranspiration Intercomparison of Field-to-Regional Scale Methods at the LIAISE Experiment  

Mary Rose Mangan, Oscar Hartogensis, Joaquim Bellvert, Aaron Boone, Guylaine Canut, Jordi Cristóbal, Joan Cuxart, Raquel Gonzalez Armas, Jannis Groh, Michel La Page, Rafael Llorens, Belén Martí, Daniel Martínez-Villagrasa, Josep Ramon Miró, Dražen Skokovi, José A. Sobrino, and Hugo J. de Boer

Quantifying the evaporative flux from the land surface into the atmosphere is important for local irrigation management, regional water management and global weather prediction, but measuring evapotranspiration (ET) remains a challenge. Methods that directly measure ET, including eddy covariance and lysimeters, have high temporal resolution but limited spatial coverage, while indirect estimates, including remote sensing techniques, have broad spatial coverage but lower temporal frequency. Each principle for estimating ET comes with unique uncertainties, so a combined use  of these methods under identical conditions, which is rarely done in field campaigns, should be promoted to assess its relative and overall performance.   

In order to quantify the relative uncertainty of different commonly-used ET estimation techniques, we performed an ET method intercomparison using data from the 2021 Land surface Interactions with the Atmosphere over the Iberian Semi-arid Environment (LIAISE) experiment (Boone et al., 2025). Fifteen ET estimation methods were evaluated across six crop types, spanning footprint extents from individual fields to the regional scale and encompassing multiple measurement principles. We also include an upscaled “mixed-agriculture” estimate from the eddy-covariance data to match the footprints of methodologies that cover more than one field (e.g. satellite remote sensing data and long-path scintillometry)  We find that the total sampling uncertainty in the eddy covariance measurements is between 10% and 20% of the latent heat flux regardless of time of day. Moreover, we find that standard deviation among different ET methods for a single crop type (between 2.0 and 3.7 mm day-1) is greater than the standard deviation among the different crop types (1.9 mm day-1) in the LIAISE domain.


References: 

Boone, A., Bellvert, J., Best, M., Brooke, J. K., Canut-Rocafort, G., Cuxart, J., Hartogensis, O., Moigne, P. L., Miró, J. R., Polcher, J., Price, J., Seguí, P. Q., Bech, J., Bezombes, Y., Branch, O., Cristóbal, J., Dassas, K., Fanise, P., Gibert, F., … Zribi, M. (2025). The Land Surface Interactions with the Atmosphere over the Iberian Semi-Arid Environment (LIAISE) field campaign. Journal of the European Meteorological Society, 2, 100007. https://doi.org/10.1016/j.jemets.2025.100007

How to cite: Mangan, M. R., Hartogensis, O., Bellvert, J., Boone, A., Canut, G., Cristóbal, J., Cuxart, J., Gonzalez Armas, R., Groh, J., La Page, M., Llorens, R., Martí, B., Martínez-Villagrasa, D., Miró, J. R., Skokovi, D., Sobrino, J. A., and de Boer, H. J.: Evapotranspiration Intercomparison of Field-to-Regional Scale Methods at the LIAISE Experiment , EGU General Assembly 2026, Vienna, Austria, 3–8 May 2026, EGU26-17124, https://doi.org/10.5194/egusphere-egu26-17124, 2026.

The semi-arid Gundar River Basin in South India is home to around two million people. Agriculture remains central to sustaining livelihoods in this region, and competition for water resources has intensified over the years owing to factors such as variability in monsoon precipitation, shifting agricultural practices, and migration to urban areas. The landscape is dotted with centuries old water storage tanks (reservoirs) built to collect runoff and recharge groundwater, and the hydrology of the region is further complicated by the widespread presence of Prosopis juliflora, a water consuming invasive species that increases competition for water. With evapotranspiration (ET) accounting for up to 60% of the water outflux in semi-arid regions, there is a pressing need to quantify ET in this region to support improved water and resource management.

The region lacks ET monitoring networks, is highly heterogeneous, and requires the use of satellite datasets and climate data products to understand catchment scale ET behaviour and its evolution over time. This study aims to intercompare ET derived from SEB methods: SEBAL (novel estimates generated using Landsat data) and METRIC (through the EEFlux product), both available at 30m resolution with global ET products such as MOD16 and GLEAM at the basin scale between 2010 and 2020. ET estimates will be aggregated to a common spatial scale, stratified using NDVI classes, and analyzed according to the study’s objectives: (1) examining consistency among datasets across different seasons, (2) investigating interannual variability using the correlation coefficient (r), root mean squared error (RMSE), anomaly assessment, and (3) assessing long term ET trends using the Mann–Kendall test and detecting breakpoints with Pettitt’s test given the basin’s recent history of frequent droughts. Physical consistency will be evaluated using reference ETo estimates, enabling an assessment of the utility of the various ET methods applied in this unique hydrological setting with significant implications for local livelihoods.

How to cite: Senthilkumaran, A. and Kelly, R.: Assessing the Suitability of Evapotranspiration Products and Surface Energy Balance Estimates in the Semi-Arid Gundar River Basin, South India, EGU General Assembly 2026, Vienna, Austria, 3–8 May 2026, EGU26-17387, https://doi.org/10.5194/egusphere-egu26-17387, 2026.

EGU26-18155 | Orals | HS6.3

How and how accurately can we measure transpiration of forest stands?  

Martin Maier, Stephan Raspe, Carina Mayer, Andreas Hartmann, Thomas Fichtner, and Stefan Seeger

Water supply plays a crucial role in the vitality and growth of forests. Forests are an important source of high-quality drinking water and play a key role in the landscape water balance. Rising temperatures and changes in precipitation are leading to more frequent and severe droughts, which can increase mortality and pose a challenge for forest management and planning. At the same time, this is substantially changing the water balance of forests and thus the future seepage water supply. These challenges can be met with appropriate silvicultural measures such as tree species selection and thinning, but requires reliable knowledge about the transpiration of forest stands and the factors that influence it.

The transpiration (evapotranspiration) of forest stands can be estimated using micrometeorological methods, e.g. eddy covariance measurements, or hydrological approaches, e.g. by measuring streamflow from clearly defined small catchment areas or large lysimeters with trees, or – due to their simplicity and availability often used nowadays – by measuring transpiration with sap flow sensors, with each method covering different scales and with each method including specific uncertainities. We developed a model system to improve the estimation of transpiration rates of forest stands based on sap flow and soil moisture measurements in combination with the stand water balance model LWF-Brook90 with the aim of integrating this approach into the Forest Environmental Monitoring Programme of ICP Forest  https://www.icp-forests.net/. The combination of measurements and modelling aims at reducing the uncertainties and potential errors of estimates based purely on measurement data, as these alone contain a considerable degree of uncertainty in terms of their absolute values.

Based on our 2-3 years measurements at three forest stands with simultaneous eddy covariance measurements as a reference, we would like to present the methodological approach and its improvements. Temporal dynamics of sap-flow measurements agreed well with EC data minus modelled evaporation, whereas absolute values were substantially over- or underestimated in most cases, indicating a high absolute uncertainty if estimates would be based on sap flow measurements alone. Comparing LWF Brook 90 modelling results of a set of established reference parameters to sap flow measurement dynamics showed that tree eco-hydrological parameters needed to be modified to yield a better agreement of modelled transpiration with the temporal sap flow dynamics, which is the more reliable information in the sap flow measurement. Together with the results from a further 13 forest stands in Germany the characteristic differences in the annual transpiration pattern and water consumption of theses stands will be presented.

How to cite: Maier, M., Raspe, S., Mayer, C., Hartmann, A., Fichtner, T., and Seeger, S.: How and how accurately can we measure transpiration of forest stands? , EGU General Assembly 2026, Vienna, Austria, 3–8 May 2026, EGU26-18155, https://doi.org/10.5194/egusphere-egu26-18155, 2026.

EGU26-18926 | ECS | Orals | HS6.3

High resolution evapotranspiration map over Austria : leveraging AI and Sentinel-2 

Maximilien Houël, Wassim Azami, and Alexandra Bojor

Climate change is accelerating at an unprecedented rate, profoundly impacting sectors, systems, individuals, and institutions worldwide. Adaptation to its effects has become a critical priority. In Austria, the consequences of climate change are particularly pronounced, with its existence, pace, and impacts clearly evidenced by extensive measurements and observations. Recent climate data indicate that the country’s annual mean temperature has risen at more than twice the global average, exacerbating challenges in urban areas, agriculture, mountainous and forest ecosystems (https://www.iea.org/articles/austria-climate-resilience-policy-indicator).

In response to these pressing challenges, this project aims to develop innovative services to support climate adaptation strategies. By leveraging existing satellite missions and in-situ data, the integration and monitoring of evapotranspiration (ET) can be used as a key indicator for assessing climate resilience and providing actionable insights to decision-making.

The tool developed for the FFG Project GET-ET is using the measurements of ECOSTRESS and Sentinel-2 imagery to perform high resolution estimation of evapotranspiration. ECOSTRESS measurements have been selected as reference for the modelling, the sensor provides 70m evapotranspiration daily maps. The input corresponds to a combination of multispectral bands and digital elevation model from Copernicus data. To fit the reference with the input, it has been decided to enhance ECOSTRESS measurements with a python implementation of Data Mining Sharpener, based on Leaf Area Index values obtained from Sentinel-2. A dataset has been generated over Austria between 2019 and 2025, considering the atmospheric perturbation and the time correlation of both sensors. The dataset has been fed into a Unet with ResNet blocks pre-trained with Sentinel-2 images. The perceptual loss has been used to increase the capabilities of producing precise estimation of the evapotranspiration. The model trained over Austria reached meaningful results in terms of metric: 0.91 of Structural Similarity Index Measurement (SSIM), letting a confident space for scale generalization. The service can then provide for each new Sentinel-2 image an estimation of evapotranspiration. In the context of the project, monthly aggregation over Austria is produced and integrated into the GTIF platform.

High resolution evapotranspiration maps are valuable tools in urban planning enabling the strategic design of green infrastructure to build climate-resilient cities. These maps allow the precise identification of urban heat islands (UHI), areas experiencing elevated heat stress due to the lack of green infrastructures (GI). By pinpointing these areas, planners can implement targeted green interventions, to enhance natural cooling mechanisms such as cooling corridors. Beyond heat mitigation, ET maps also support the ongoing monitoring of green spaces, such as green roofs and parks to ensure their vitality and long-term effectiveness in providing cooling benefits, therefore improving urban livability. Within this project, the ET maps are demonstrated through real-world use cases over Austria.

How to cite: Houël, M., Azami, W., and Bojor, A.: High resolution evapotranspiration map over Austria : leveraging AI and Sentinel-2, EGU General Assembly 2026, Vienna, Austria, 3–8 May 2026, EGU26-18926, https://doi.org/10.5194/egusphere-egu26-18926, 2026.

EGU26-19290 | Posters on site | HS6.3

ET partitioning method comparison for a winter wheat stand at the Land-Atmosphere-Feedback Observatory, Hohenheim, Germany 

Natalie Orlowski, Justin Eckert, Claudia Voigt, Joachim Ingwersen, and Thilo Streck

The partitioning of evapotranspiration (ET) into crop transpiration (T) and soil evaporation (E) is crucial for accurate modelling of land-atmosphere processes and for assessing climate sensitivity in agricultural systems, yet it remains methodologically challenging. Here, we quantify diurnal dynamics of ET and its components in winter wheat using high-resolution in-situ water isotope flux chamber measurements in comparison to estimates from micro-lysimeters, sap flow measurements and eddy-covariance (EC) measurements.

Field campaigns were conducted on 2-5 consecutive days per month during the 2025 growing season at an agricultural experimental site “The Land-Atmosphere-Feedback Observatory” (University of Hohenheim, Germany), spanning key crop phenological stages of winter wheat. Water isotope-based chamber measurements were performed in the vicinity of the EC tower from sunrise, after morning dew evaporation, until sunset. E, T and ET chambers were measured consecutively, resulting in 8-12 measurements per flux type per day. Isotopic compositions of E, T and ET used for ET partitioning were estimated using the Keeling plot method. Independent estimates of E and T were derived from five micro-lysimeters installed in a star-like pattern around the EC tower, and five sap flow micro sensors installed on five individual plants, and compared to the water isotopic partitioning results.

Our method comparison focuses on a measurement period in June 2025, whereas chamber-based water isotope measurements are presented for the entire growing season.

In June, ET derived from EC measurements ranged from 0 to 350 W m-2, peaking around midday, while E obtained from micro-lysimeters was always less than 120 W m−2. Sap flow measurements often led to reasonable values only in the afternoon, showing a decreasing trend of similar magnitude as ET. Daily patterns varied depending on meteorological conditions. Chamber-based E, T and ET estimates were close to EC tower/micro-lysimeter/sap flow flux-based measurements, but showed larger scattering, likely due to spatial heterogeneity. Across measurement approaches, T/ET ratios predominantly ranged between 0.5 and 1, indicating that T dominated ET. The T/ET ratio showed a “U-shaped” diurnal pattern when derived from micro-lysimeter and EC tower measurements but is decreasing over the day when sap flow and lysimeter data were considered. T/ET derived from chamber fluxes did not show a clear diurnal pattern. Isotope-based ET partitioning results showed large scattering mainly due to weak isotopic contrast between T and E, but also due to spatial heterogeneity and temporal variability in isotope flux signatures. In general, hydrogen isotope-based partitioning showed better agreement with flux-based estimates than oxygen isotopes, likely due to stronger isotopic fractionation signal between fluxes.

The dominant controls on isotopic variability and flux dynamics of E, T and ET will be discussed in relation to meteorological conditions, plant physiological parameters and soil water availability. Measurement uncertainty across approaches will be evaluated and a best-estimate ET and its partitioning will be derived. These findings will help to evaluate model representation of T/ET and reduce uncertainties associated with T/ET estimates.

How to cite: Orlowski, N., Eckert, J., Voigt, C., Ingwersen, J., and Streck, T.: ET partitioning method comparison for a winter wheat stand at the Land-Atmosphere-Feedback Observatory, Hohenheim, Germany, EGU General Assembly 2026, Vienna, Austria, 3–8 May 2026, EGU26-19290, https://doi.org/10.5194/egusphere-egu26-19290, 2026.

Evapotranspiration (ET), the largest water flux through which water returns to the atmosphere in vapor form, plays a central role in the terrestrial water and energy cycles. In the water-limited Mediterranean basin, in particular, relatively small changes in green water fluxes (i.e., ET), triggered for example by environmental factors and land cover changes, affect water resources, including runoff, groundwater, irrigation needs, and overall ecosystem functioning. Sustainable water resources management in these regions therefore requires accurate spatiotemporal characterization of ET losses. The increasingly available Earth Observations allow us to address some of these challenges by monitoring ecosystem functioning with high spatiotemporal resolution. Here, focusing on the Acheloos river basin (7531 km2), one of the most important hydrological systems of Greece with regards to water supply (domestic and irrigation uses), hydropower, and ecosystem services, we quantified the spatial variability of ET and its temporal dynamics at the seasonal, annual, and inter-annual time scales. We synthesized remotely sensed ET products together with auxiliary geospatial and environmental variables to tackle the following research questions: (1) What land cover contributes the most to the ET losses over the basin? (2) How did ET respond to recent climate extremes (i.e., droughts and heatwaves), and (3) What were the hotspots with the most sensitive land cover? By synthesizing spatially explicit historical estimates of ET across the study area, together with environmental and land use datasets, this study aims to provide constrained estimates of ET for the dominant land cover types at seasonal, annual, and inter-annual time scales. Such estimates could facilitate impact assessments of natural hazards (e.g., droughts, heatwaves, and wildfires) on the water balance via land cover change feedback (i.e., ET losses), providing valuable insights towards sustainable long-term water resources management in the Mediterranean region.

How to cite: Georgoutsou, K. F., Langousis, A., and Pappas, C.: Spatiotemporal variability of green water fluxes and their response climate extremes: pinpointing drought- and heatwave-hotspots over the Acheloos River basin, Western Greece, EGU General Assembly 2026, Vienna, Austria, 3–8 May 2026, EGU26-19448, https://doi.org/10.5194/egusphere-egu26-19448, 2026.

EGU26-19641 | ECS | Orals | HS6.3

A Dual Model Approach to Better Generalize Individual Tree Water Use 

Deep Prakash Sarkar, Rafael Poyatos, Anke Hildebrandt, Sung-Ching Lee, Basil Kraft, and Jacob A. Nelson

Transpiration is a critical component of the carbon-water cycle, driving water from the soil to the atmosphere through plants as sap flow and linking plants to larger climate fluctuations. While the measurement of sap flow using thermometric principles has been refined over decades, translating these in-situ measurements into generalized models remains a challenge. The availability of the SAPFLUXNET database now opens opportunities for global, data-driven modeling. Despite the sophistication of recent approaches, current models often demonstrate high accuracy within specific sites but suffer performance degradation during cross-site validation. This study aims to overcome the generalization gap by introducing a modeling framework that decouples the prediction of temporal dynamics from absolute magnitude using a dual-model approach. The first model predicts normalized temporal patterns based on the 90th percentile and nighttime sap flow for each tree using XGBoost. The second model predicts absolute magnitude using tree and site-level characteristics using Random Forest. Results show a significant improvement in overall performance, with R2 increasing from 0.47 to 0.54 compared to a single combined model. This gain is primarily driven by better performance in the temporal model. While the average Root Mean Squared Error (RMSE) showed only minor improvement, the performance gains were consistent across tree sizes, genera, and plant functional types, validating the dual-model approach. Future work could further improve this framework by incorporating memory-based temporal models and integrating trait and remote sensing datasets for better tree representation. Finally, this scalable approach can be adopted to estimate regional-scale transpiration using species and tree size distributions, helping to refine our understanding of tree water use.

How to cite: Sarkar, D. P., Poyatos, R., Hildebrandt, A., Lee, S.-C., Kraft, B., and Nelson, J. A.: A Dual Model Approach to Better Generalize Individual Tree Water Use, EGU General Assembly 2026, Vienna, Austria, 3–8 May 2026, EGU26-19641, https://doi.org/10.5194/egusphere-egu26-19641, 2026.

EGU26-20202 | Posters on site | HS6.3

Evapotranspiration, latent and sensible heat fluxes dataset within the CM SAF: present and future 

William Moutier, Nicolas Clerbaux, José-Miguel Barrios, Jan De Pue, Françoise Gellens-Meulenberghs, Varun Sharma, Marc Schröder, and Anke Duguay-Tetzlaff

The Satellite Application Facility on Climate Monitoring (CM SAF) of EUMETSAT develops satellite-derived climate data records to support climate monitoring and research. In 2024, CM SAF extended its product portfolio with a Climate Data Record (CDR) of land surface variables based on two sensors of the Meteosat suite of geostationary satellites: the Meteosat Visible and InfraRed Imager (MVIRI) and the Spinning Enhanced Visible and InfraRed Imager (SEVIRI). The CM SAF LANDFLUX Ed. 1 provides nearly 40 years (1983–2020) of parameters describing surface states and radiation fluxes, including the Surface Radiation Balance, Cloud Fractional Cover, Land Surface Temperature, Evapotranspiration (ET), and the Latent (LE) and Sensible (H) Heat Fluxes. This dataset constitutes one of the longest satellite-based records of land surface energy and water fluxes derived from geostationary observations. Close collaboration between CM SAF, the Land Surface Analysis (LSA) SAF and the EUMETSAT Secretariat ensures the uniqueness of this CDR and the consistency among its parameters.
This contribution focuses on ET and the LE and H fluxes. These parameters are retrieved using an adapted version of the LSA SAF methodology, itself derived from the Tiled ECMWF Scheme for Surface Exchanges over Land (TESSEL). Observations from MVIRI and SEVIRI onboard Meteosat First and Second Generation (MFG and MSG) are used as inputs for all radiation components. CDR parameters are provided hourly, daily and monthly (and monthly mean diurnal cycle) at a spatial resolution of 0.05 degrees (approximately 5.5 km), covering the Meteosat disk (65° N–65° S and 65° W–65° E).  The combination of high temporal resolution and multi-decadal coverage at 0.05° enables robust analyses of diurnal to interannual variability of land surface fluxes at continental scales, supporting climate monitoring and model evaluation, as well as hydrological and surface energy and water-balance applications.

The adopted methodology, validation results, and selected study case are presented, together with future perspectives focusing on the development of a quasi-global prototype (“GeoRing”). LE and H are validated against in situ observations (30 Fluxnet2015 and ICOS stations) and inter-compared with reanalysis (ERA5, GLDAS) and satellite-based products (LSA SAF, GLEAM). Errors are comparable to those reported in the literature, with daily biases of −10.8 W m⁻² (~0.38 mm/d) and −2.6 W m⁻², and daily unbiased RMSEs of 24.7 W m⁻² (~0.87 mm/d) and 34.1 W m⁻² for LE and H, respectively. The LANDFLUX Ed. 1 CDR represents a significant step toward long-term monitoring of land surface energy and water exchanges from geostationary satellites and is publicly available via the CM SAF website (https://wui.cmsaf.eu/safira/action/viewDoiDetails?acronym=SLF_METEOSAT_V001) to support scientific research and operational climate services.

How to cite: Moutier, W., Clerbaux, N., Barrios, J.-M., De Pue, J., Gellens-Meulenberghs, F., Sharma, V., Schröder, M., and Duguay-Tetzlaff, A.: Evapotranspiration, latent and sensible heat fluxes dataset within the CM SAF: present and future, EGU General Assembly 2026, Vienna, Austria, 3–8 May 2026, EGU26-20202, https://doi.org/10.5194/egusphere-egu26-20202, 2026.

Evapotranspiration (ET) is a major component of the global water cycle and provides a critical nexus between terrestrial water, carbon and surface energy exchanges. Climate change influences ET through the combined effects of rising temperatures and increased net radiation, both of which tend to increase ET rates. Reliable estimation of ET across different spatial and temporal scales is therefore crucial for sustainable water resource management and for improving hazelnut productivity. This study integrates multi source satellite observations from Sentinel-2 and Sentinel-3 to estimate high-resolution ET fluxes over 40 hazelnut orchards in Viterbo Province, Italy, from 2016–2024. The objectives of this study were to: (i) estimate and compare ET fluxes in hazelnut orchards using two methods: The Priestley–Taylor approach and the Time Domain Triangle method; and (ii) examine the relationships between ET, climatic variables, and vegetation indicators. The results showed a statistically significant increasing trend in latent heat flux (λET) across 38 hazelnut fields from 2016 to 2024. λET exhibited a strong and significant relationship with temperature in all fields (with R² 0.59 to 0.85) as well as good correlation with NDVI in 13 orchards (with R² > 0.5). Notably, from June to August, NDVI values tended to be negatively correlated with ET, thus suggesting potential water stress. The relationship between λET and cumulative precipitation was generally weak across all hazelnut orchard fields. These findings demonstrate the potential of synergistic Sentinel-2 and Sentinel-3 observations for monitoring field scale ET dynamics in hazelnut orchards.

How to cite: Tauro, F. and Alem, D. M.: Evapotranspiration assessment in agriculture: a case study in the hazelnut orchards of Viterbo Province, Italy., EGU General Assembly 2026, Vienna, Austria, 3–8 May 2026, EGU26-20407, https://doi.org/10.5194/egusphere-egu26-20407, 2026.

Recurrent drought between 2018 and 2021 resulted in decreased vitality and productivity of Central European forest ecosystems and increased mortality rates across many tree species. With progressing climatic change, drought and heat stress events are projected to further increase, highlighting the need for monitoring approaches that allow early detection and regular interpretation. Therein, changes in evapotranspiration (ET) may indicate plant water stress earlier than visible symptoms such as canopy browning or dieback. The ongoing temp-2-stress project across six broadleaved forest regions in Germany integrates space-borne satellite observations with high-resolution uncrewed aerial vehicle (UAV) measurements to assess ET, vegetation health and derived drought and heat stress indices from stand to regional scales. For larger-scale satellite analyses, the focus lies on ET (and, e.g., ESI, Evaporative Stress Index) products from the ECOSTRESS and MODIS missions and on multispectral indices (e.g., NDVI, Normalized Difference Vegetation Index) derived from a harmonized LANDSAT/Sentinel dataset; the data coverage spans several years encompassing the 2018 to 2021 period. For high-resolution imagery over long-term forest monitoring plots located within each of the studied forest regions, we employ a UAV-based multispectral and thermal camera system (Micasense Altum PT) combined with an on-board four-component net radiation system (Apogee), which provides quality in-situ data for modelling ET with energy-balance based approaches such as the DATTUTDUT model. For a validation of derived stress indices, independent ground measurements of meteorological key variables, soil moisture and tree growth are available at the long-term forest monitoring plots, of which one is additionally equipped with an eddy covariance tower for further methodological scrutiny. Here, we present preliminary results from a unique forest irrigation experiment that is covered in the temp-2-stress UAV missions in addition to the mentioned long-term monitoring sites. Three irrigated and three non-irrigated mixed broadleaf forest plots were surveyed repeatedly during the 2025 growing season, allowing to assess temporal dynamics in surface temperature, ET and vegetation vitality and their sensitivity to irrigation and meteorological conditions. We expect increasing differences among irrigated and non-irrigated plots with increasing summer temperatures (analyses in progress). These results will serve to evaluate the potential of the UAV-based approach to detect differences in water availability and evaporative response in forests at the (sub-) stand level. 

How to cite: Swatek, S. and Röll, A.: Remotely sensed surface temperatures for the analysis of evapotranspiration, drought and heat stress in Central European deciduous forests, EGU General Assembly 2026, Vienna, Austria, 3–8 May 2026, EGU26-20498, https://doi.org/10.5194/egusphere-egu26-20498, 2026.

EGU26-21799 | Orals | HS6.3

Water-Limited Evapotranspiration in Two Contrasting and Heterogeneous Mediterranean Ecosystems of Sardinia 

Serena Sirigu, Nicola Montaldo, and Roberto Corona

Two micrometeorological towers were installed at two contrasting sites characterized by different precipitation regimes. The first tower is located in Orroli, an area with a mean annual precipitation of approximately 600 mm, selected as a case study within the AQUEDUCT European project. This site is characterized by a heterogeneous landscape composed of wild olive trees interspersed with C3 herbaceous vegetation. Vegetation develops on shallow soils overlying a partially fractured basaltic bedrock, with soil depths ranging between 15 and 40 cm. Tree cover accounts for about 25% of the tower footprint.

The second tower is located in a mountainous forested area dominated by Quercus ilex, characterized by steeper slopes, frequent rocky outcrops, and higher annual precipitation, averaging about 800 mm. In this site, tree cover represents approximately 67% of the tower footprint.

At both locations, land surface energy fluxes and CO₂ exchanges were measured using the eddy covariance technique. Soil moisture was monitored using water content reflectometers, while leaf area index (LAI) was periodically estimated to capture vegetation dynamics. In addition, the tree transpiration component was quantified using sap flow sensors, allowing the separation of vegetation contributions to evapotranspiration.

Results indicate that the Orroli site is strongly influenced by rainfall seasonality. Vegetation species at this site rely on water stored within the fractured rocky substrate to maintain physiological activity during dry periods. Pronounced seasonal patterns were observed in both CO₂ fluxes and evapotranspiration (ET), with higher values during periods when both herbaceous and woody vegetation are active, and lower values following the senescence of the grass component.

In contrast, the Marganai forest site exhibited relatively stable ET rates throughout the year, highlighting the high efficiency of tree species in accessing deep water reserves. ET of the site is similar at the Orroli site during periods of active grass growth, latent heat fluxes became greater in the Marganai forest once the herbaceous layer senesced. The relationship between ET and potential ET versus soil moisture suggest that Quercus ilex in Marganai appears largely independent of surface soil moisture, emphasize the contribution of the rock water reservoir.  This contribution is also present at the Orroli site, and the water balance analysis shows that it plays a key role in sustaining grass vegetation during the late spring period. Overall, the results suggest the existence of a rainfall threshold of approximately 700 mm per year, below which precipitation becomes a limiting factor for tree cover development.

How to cite: Sirigu, S., Montaldo, N., and Corona, R.: Water-Limited Evapotranspiration in Two Contrasting and Heterogeneous Mediterranean Ecosystems of Sardinia, EGU General Assembly 2026, Vienna, Austria, 3–8 May 2026, EGU26-21799, https://doi.org/10.5194/egusphere-egu26-21799, 2026.

EGU26-850 | ECS | Orals | HS6.4

Assessing Hydrological Resilience in Inland Lakes Using Multi-Mission Satellite Altimetry 

Hatice Kılıç Germeç and Eren Germeç

Inland lakes increasingly face multiple stresses driven by climate change, anthropogenic pressures, hydrological modifications, and long-term ecosystem alterations. In this context, hydrological resilience refers to a lake’s ability to maintain stable water-level behaviour under disturbance. Whether inland lakes are losing resilience or approaching critical state transitions remains unclear, in part due to fragmented monitoring networks and limited availability of long-term lake-level observations.

This study introduces a resilience assessment framework that integrates multi-mission satellite altimetry to evaluate stability patterns in lake-level dynamics. The approach relies on radar and laser satellite altimetry to construct harmonized lake-level time series, using data from missions such as Sentinel-3, ICESat-2, and SWOT where available. In-situ measurements are incorporated as an independent validation benchmark to assess signal reliability. The resulting dataset is analysed within a resilience-based diagnostic framework. The aim is to determine whether observed fluctuations reflect stable hydrological functioning or signal increasing variability and reduced resilience.

Preliminary analysis indicates that satellite-derived lake water-level observations can provide meaningful signals for resilience-oriented assessment. These signals can reveal emerging hydrological instability earlier, particularly in lakes where field measurements are limited or challenging to maintain. These findings highlight the value of satellite-based lake-level monitoring for early-warning applications and adaptive management planning. The proposed framework is scalable and transferable, enabling resilience assessment across lakes with diverse monitoring and data conditions.

How to cite: Kılıç Germeç, H. and Germeç, E.: Assessing Hydrological Resilience in Inland Lakes Using Multi-Mission Satellite Altimetry, EGU General Assembly 2026, Vienna, Austria, 3–8 May 2026, EGU26-850, https://doi.org/10.5194/egusphere-egu26-850, 2026.

Accurate representation of river water levels is essential for flood forecasting in Narmada river basin, where complex river networks and limited observations cause significant challenges. In this study, we present data assimilation framework to assimilate surface water elevation observations into the 2D hydrodynamic model Triton. We will use ensemble Kalman filter (EnKF) data assimilation techniques with grid-to-grid along the stream localization by leveraging both upstream and downstream network information to account for hydrodynamic uncertainties. We will assimilate the surface water elevation from the central water commission (CWC) of India and HydroWEB. The proposed approach is expected to improve the simulation of flood propagation, river depth, and inundation dynamics over the Narmada river basin. By integrating observational data directly into Triton, we anticipate enhanced accuracy in peak water levels and flood timing. This study demonstrates the potential of combining hydrodynamic modeling with real-time data assimilation to provide actionable insights for flood risk 

How to cite: Prakash, V. and Saharia, M.: Towards High-Resolution River Forecasting over Narmada Using Surface Water Elevation Data Assimilation in Triton, EGU General Assembly 2026, Vienna, Austria, 3–8 May 2026, EGU26-1074, https://doi.org/10.5194/egusphere-egu26-1074, 2026.

EGU26-2572 | ECS | Posters on site | HS6.4

Evaluating hydrological forcing datasets for GRACE-based terrestrial water storage downscaling in Central Asia 

Shuxian Liu, Timo Schaffhauser, and Roland Pail

Gravity Recovery and Climate Experiment (GRACE) and GRACE Follow-On (GRACE-FO) observations provide unique large-scale information on terrestrial water storage (TWS), yet their coarse spatial and temporal resolutions limit their applicability for regional and event-scale hydrological analyses. In this study, we investigate the performance of different hydrological forcing datasets in a flexible three-step downscaling framework to derive daily, 1 km terrestrial water storage change (TWSC) estimates over the Naryn–Kara Darya basins and the Fergana Valley in Central Asia. The framework integrates monthly GRACE-derived TWSCs with high-resolution precipitation, evapotranspiration, and runoff information from multiple sources, including GLDAS, FLDAS-CA, ERA5-Land, and a mixed forcing combination based on MSWEP, GLEAM, and GloFAS. Temporal downscaling is achieved by constraining daily water-balance-derived storage changes with GRACE observations, while spatial downscaling maps coarse GRACE signals onto fine-scale hydrological predictors. Model performance is assessed using multiple validation strategies, including comparison with the ITSG-Grace2018 daily solution, consistency tests, and event-based analyses, accounting for the scarcity of in situ observations in the region. Our results demonstrate that the choice of hydrological forcing dataset strongly influences the quality of downscaled TWSCs. While all forcing scenarios capture the dominant seasonal and interannual variability, substantial differences emerge in their representation of trends, variability, and short-term events. In particular, the mixed forcing dataset shows the most consistent performance across validation metrics and better reproduces both long-term TWS changes and hydrologically relevant extreme events. These findings highlight the critical role of forcing data selection in GRACE downscaling applications and demonstrate the transferability of the proposed framework to other data-sparse regions.

How to cite: Liu, S., Schaffhauser, T., and Pail, R.: Evaluating hydrological forcing datasets for GRACE-based terrestrial water storage downscaling in Central Asia, EGU General Assembly 2026, Vienna, Austria, 3–8 May 2026, EGU26-2572, https://doi.org/10.5194/egusphere-egu26-2572, 2026.

EGU26-4930 | Orals | HS6.4

Driving factors of groundwater storage variability in the transboundary Bug River Basin 

Justyna Śliwińska-Bronowicz, Tatiana Solovey, Anna Stradczuk, Rafał Janica, and Agnieszka Brzezińska

Monitoring variations in groundwater storage (GWS) is essential for sustainable groundwater resource management, particularly in regions where groundwater constitutes the primary source of potable water. Effective management and planning of groundwater use further require a thorough understanding of the factors controlling GWS variability, including meteorological conditions, regional hydrogeological characteristics, and anthropogenic influences.

In this study, we investigate temporal changes in GWS in the Bug River basin, located along the border of Poland, Ukraine, and Belarus. GWS estimates are derived from in-situ point measurements as well as satellite- and model-based data. Satellite-based GWS is obtained from downscaled terrestrial water storage (TWS) anomalies derived from Gravity Recovery and Climate Experiment (GRACE) and GRACE Follow-On (GRACE-FO) observations, in combination with data from the Global Land Data Assimilation System (GLDAS) model. We analyse long-term trends, seasonal components, and non-seasonal variability in both in-situ and satellite-derived GWS. Furthermore, we examine the relationships between GWS variations and potential driving factors, including precipitation, evapotranspiration, land surface temperature, and climate indices such as the Standardized Precipitation Index (SPI) and the Standardized Precipitation-Evapotranspiration Index (SPEI). We further analyse GWS variability in relation to groundwater table depth and lithology. Additionally, the correspondence between in-situ observations and GRACE-derived GWS is investigated.

The study demonstrates a high level of agreement between in-situ and satellite-based GWS, with correlation coefficients ranging from 0.69 to 0.95. The strength of this relationship depends on groundwater table depth, with the highest correlations observed for shallow aquifers. Seasonal variations in GWS, which are mainly controlled by precipitation and evapotranspiration, exhibit the strongest agreement between in-situ and satellite data. Overall, the study area exhibited negligible long-term GWS trends (0.0 to +1.0 mm/year) despite rising evapotranspiration over the past decade. Nevertheless, the period 2013–2023 was characterized by episodic positive and negative anomalies, which were more typical of deeper groundwater layers and more clearly captured by in-situ measurements. These findings highlight the value of integrating in-situ observations with satellite gravimetry for improving the understanding of groundwater dynamics and supporting sustainable groundwater management in transboundary river basins.

How to cite: Śliwińska-Bronowicz, J., Solovey, T., Stradczuk, A., Janica, R., and Brzezińska, A.: Driving factors of groundwater storage variability in the transboundary Bug River Basin, EGU General Assembly 2026, Vienna, Austria, 3–8 May 2026, EGU26-4930, https://doi.org/10.5194/egusphere-egu26-4930, 2026.

Global water storage faces a crisis driven by climate warming, with significant declines observed in 53% of large water bodies (Yao et al., 2023). Crucially, recent analyses reveal that surface water dynamics are predominantly driven by seasonal variability (Li et al., 2025). However, as current assessments are biased toward large lakes, the high-frequency storage dynamics of small systems remain unquantified due to the spatiotemporal limitations of current satellite observations (Cooley et al., 2021). Scotland offers an ideal case study to address this observational gap: it hosts ~25,500 water bodies, of which > 90% are small (<0.1 km²) and poorly monitored (Taylor, 2021).

Currently, Scotland is undergoing a fundamental hydro-climatic transition, indicated by a pronounced intensification of seasonality, with substantially wetter winters but markedly drier summers (Lowe et al., 2018), challenging the reliability of these water resources. Recent extremes, such as Loch Ness recording its lowest levels since 1990 in May 2023, highlight the vulnerability of existing storage capacity (SEPA Water Scarcity Report, 2023). To effectively manage these emerging risks, a comprehensive understanding of storage dynamics is essential. Yet, a multi-decadal, daily-resolution dataset of water storage changes remains absent. Consequently, this study aims to bridge this gap by reconstructing continuous storage dynamics from 1980 to the present.

To account for heterogeneous basin morphology and anthropogenic regulation, we develop a scalable, typology-based framework that categorizes water bodies into three representative classes: (1) shallow/responsive basins (e.g., Loch Leven), where surface area is highly sensitive to water level changes; (2) deep, morphologically constrained basins (e.g., Loch Ness), where storage variability is primarily volumetric; and (3) regulated reservoirs (e.g., Loch Katrine), which exhibit non-natural level fluctuations due to abstraction. Targeting these calibration sites, we integrate Sentinel-1 (SAR) and Sentinel-2 (optical) imagery (2017-2024) with daily in-situ water level observations from SEPA to derive class-specific area-level relationships and validate model performance across contrasting hydrological regimes.

To extend storage reconstructions beyond the satellite era, we employ a machine learning approach driven by long-term meteorological reanalysis data. Models trained on the high-resolution dynamics of the Sentinel era are applied retrospectively to reconstruct daily water storage changes dating back to 1980. By including a dedicated class for regulated systems (Loch Katrine), this framework incorporates features to distinguish human-driven storage patterns from natural climatic responses. The resulting dataset provides the first multi-decadal quantification of Scottish water storage, enabling the identification of historical low water extremes and attribution of their climatic and anthropogenic drivers. This work provides a critical baseline for assessing hydrological resilience and water security in temperate regions under increasing climate variability.

How to cite: Zhu, Z., Bass, A., and Zhang, W.: Reconstructing Multi-Decadal Daily Water Storage Changes in Scottish Standing Waters: A Classification-Based Remote Sensing Framework, EGU General Assembly 2026, Vienna, Austria, 3–8 May 2026, EGU26-5932, https://doi.org/10.5194/egusphere-egu26-5932, 2026.

Flooding results in large economic and loss of life, which are further aggravated by the lack of precise forecasts of flood inundation depth and extent. Recent extreme flood events have highlighted the need for reliable operational flood forecasting systems. Conventional physics-based flood models are subject to multiple sources of uncertainty and are computationally demanding, which limits their applicability for real-time operational services. Artificial intelligence (AI)-based flood models, on the other hand, can significantly reduce computational cost and enable near real-time forecasting at high spatial resolutions. Despite recent advances, most AI-based flood models lack mechanisms to correct evolving prediction errors using real-time observations. Flood processes are highly nonlinear, with errors that evolve rapidly in space and time, while Earth Observation (EO) data provide only intermittent and spatially incomplete snapshots of the true system state. Deep data assimilation (DDA) addresses this gap by learning state-dependent error propagation and dynamically integrating multi-source EO information into AI-based flood forecasting models. In the recently funded Indo-German project FLAIR (Flood Forecasting using AI for Regional Sustainability, funded by BMBF), we develop observation operators linking simulated flood states to EO-derived flood extent and water surface elevation within a two-dimensional convolutional long short-term memory framework. DDA is then implemented through a state-parameter augmented approach to update model states in real time, accounting for dynamically evolving flood conditions. The proposed framework is evaluated for two human-altered test catchments with contrasting hydrological characteristics in India and Germany. Forecast performance is benchmarked against an open-loop configuration and a DDA-based CaMa-Flood model across multiple forecast lead times ranging from one to seven days. A specific innovation is the assimilation of reservoir Water Surface Elevations from EO altimeters which help determine their influence on the resulting flood propagation as well as enable reservoir optimization for dampening the flood wave. FLAIR demonstrates the potential of deep data assimilation and multi-source EO data to improve the accuracy and robustness of AI-based flood forecasts as well as builds trust in such forecasts through detailed benchmarking against physics-based models, supporting their application in operational flood risk management.

How to cite: Ramesh, V. and Dasgupta, A.: Towards Operational AI-based Flood Forecasting using Deep Data Assimilation of Multi-source Earth Observations, EGU General Assembly 2026, Vienna, Austria, 3–8 May 2026, EGU26-6311, https://doi.org/10.5194/egusphere-egu26-6311, 2026.

EGU26-8242 | ECS | Orals | HS6.4 | Highlight

20 Years of Daily River Discharge Estimation by Using Long Short-Term Memory 

Ceren Y. Tural, Paolo Filippucci, and Angelica Tarpanelli

Continuous monitoring of river discharge time series is essential for climate applications; however, it remains limited by sparse ground-truth measurements. As a result, there is an increasing demand for river discharge estimation based on satellite-derived observations. Nevertheless, generating daily discharge products remains challenging due to the irregular temporal resolution, which are not complementary for producing temporally continuous time series. Within the framework of the ESA River Discharge Climate Change Initiative (RD-CCI), this study addresses this limitation by producing daily river discharge estimates using Long Short-Term Memory (LSTM) networks that integrate multi-mission optical reflectance data and multi-mission altimetry-derived water level observations.

A major challenge in combining heterogeneous satellite missions is the irregular temporal sampling, which conflicts with the requirement of LSTM models for synchronized and regularly spaced input sequences. To address this issue, Akima interpolation was applied over short consecutive periods to harmonize temporal gaps across input features while preserving natural transitions in the time series. This approach significantly improved data continuity without introducing excessive artificial smoothing.

The LSTM model was implemented using a sliding window scheme of past time inputs to predict the one day ahead discharge value, and compared against other combined river discharge products available from the CEDA catalog (https://catalogue.ceda.ac.uk/uuid/dbba9cfe8d104648b19e39f4c2da1a27/). Input variables include reflectance data from multiple optical missions (Landsat 5, Landsat 7, Landsat 8, Landsat 9, Sentinel 2 Level-1C, Sentinel 3 OLCI, and MODIS on TERRA and AQUA) with orthometric heights obtained from multi-mission altimetry dataset from multiple missions (ERS-1, ERS-2, ENVISAT, Topex/Poseidon, Jason-1, Jason-2, Jason-3, Saral, Sentinel-3A and B, Sentinel-6A).

The LSTM approach was implemented across some diverse river basins, including the Amazon, Colville, Congo, Garonne, Lena, Limpopo, Mackenzie, Maroni, Mississippi, Niger, Ob, and Po rivers to produce daily-based river discharge estimation. Results across representative basins show Nash - Sutcliffe Efficiency values ranging from 0.11 in the Lena (Kyusur station, polar region) to 0.92 in the Amazon (Obidos station, tropical region). Kling–Gupta Efficiency varies between 0.22 for the Limpopo (Beithbrug station, arid region) and 0.95 for the Amazon, while relative Root Mean Square Error ranges from 288 % in arid basins to as low as 9 %in tropical regions. Overall, the results demonstrate that the LSTM model effectively captures the temporal dynamics of river discharge across diverse hydroclimatic regimes.

How to cite: Tural, C. Y., Filippucci, P., and Tarpanelli, A.: 20 Years of Daily River Discharge Estimation by Using Long Short-Term Memory, EGU General Assembly 2026, Vienna, Austria, 3–8 May 2026, EGU26-8242, https://doi.org/10.5194/egusphere-egu26-8242, 2026.

EGU26-9013 | ECS | Orals | HS6.4

Improved Inland Water Level Retrievals from CryoSat-2: Enhanced Spatial Coverage and Uncertainty Characterisation for Hydrological Applications 

Jérémy Guilhen, Angelica Tapanelli, Karina Nielsen, and Alessandro Di Bella

Accurate monitoring of inland water levels is essential for quantifying surface water storage, understanding hydrological extremes, and constraining hydrodynamic models through data assimilation. Satellite radar altimetry provides a unique long-term and global perspective on water surface height (WSH), yet its application over rivers and lakes remains challenging due to complex geometries, heterogeneous surface conditions, and limited characterisation of observation uncertainty. In the Cryo-TEMPO project, we present the Inland Water dataset delivering enhanced CryoSat-2 derived WSH products over lakes and rivers for the period 2011–2025. The processing relies on the CLS Data Handling and Processing System and integrates four retracking algorithms (OCOG, TFMRA, SAMOSA+, and MwAPP). Major advances rely on the improved spatial extraction of river observations using the global SWOT River Database (SWORD), combined with adaptive buffering. This increases the number of valid river measurements by up to a factor of five compared to previous baselines, while preserving physically consistent longitudinal water surface profiles over large river systems. A key innovation of the dataset is a new data-driven uncertainty estimation framework designed to support downstream applications, including hydrodynamic modelling and data assimilation. This approach at 20 Hz yields more representative and internally consistent uncertainty estimates, significantly reducing the occurrence of high-uncertainty outliers relative to earlier processing phases. Internal evaluation and external validation against in situ gauge records, ICESat-2 observations, and Hydroweb time series confirm good agreement for both lakes and rivers. Over rivers, OCOG and TFMRA retrackers provide the most robust results, while residual outliers are mainly associated with SARin measurements in complex or ice-affected regions.


CryoSat-2, Satellite Altimetry, Inland Waters, Water Level, Hydrology

How to cite: Guilhen, J., Tapanelli, A., Nielsen, K., and Di Bella, A.: Improved Inland Water Level Retrievals from CryoSat-2: Enhanced Spatial Coverage and Uncertainty Characterisation for Hydrological Applications, EGU General Assembly 2026, Vienna, Austria, 3–8 May 2026, EGU26-9013, https://doi.org/10.5194/egusphere-egu26-9013, 2026.

EGU26-11546 | Orals | HS6.4

Monitoring water volume dynamics in West African lakes and reservoirs using altimeters and optical satellite sensors 

Manuela Grippa, Félix Girard, Mathilde de Fleury, D. Edwige Nikiema, Cheikh Faye, Amadou Abdourahamane Touré, Roland Yonaba, and Laurent Kergoat

Lakes, reservoirs, and small water bodies play a pivotal role in West African drylands. They are widely distributed across the landscape, making them a primary source of water for both people and livestock. However, due to their generally small size and strong temporal variability, their hydrological dynamics remain poorly understood at the regional scale. Moreover, these water bodies are highly sensitive to both climatic and anthropogenic forcing, exhibiting complex and sometimes counter-intuitive dynamics, such as the increase in surface runoff observed in the Sahel despite a decrease in precipitation during and the after the major droughts of the 1970s and 1980s. Understanding the past and present dynamics of these water bodies is therefore crucial to anticipate their future evolution in a context of environmental change and rapid population growth.

Recent satellite missions provide an unprecedented view of small water bodies at large scales by combining high spatial resolution, high temporal frequency, and novel observations of water level and volume. This study relies on recent altimetric sensors coupled with surface water extent derived from optical imagery to investigate the dynamics of water levels and volumes across thousands of lakes within the study area.

Water level dynamics are first estimated using Sentinel-3 SRAL data for lakes intersected by satellite tracks, and then extended spatially by more than one order of magnitude using SWOT observations. We show that SWOT-derived water levels are in excellent agreement with in-situ measurements collected in Niger, Burkina Faso, and Senegal, as well as with water level estimates from other satellite sensors (Girard et al., 2025).

The analysis of dry-season water level dynamics allows to identify distinct hydrological behaviours at the regional scale, and to highlight the influence of anthropogenic water withdrawals in agricultural reservoirs, as well as connections between lakes, the river network, and/or groundwater (de Fleury et al., 2023).

Water volume variations are subsequently obtained by combining water level data with water surface areas. The latter are estimated appliying a U-Net convolutional neural network to optical imagery from Sentinel-2 and the Landsat archive. This approach, specifically developed for the study region, provides accurate estimates of water area for the different types of lakes encountered. These include water bodies covered by vegetation and extremely bright lakes characterized by high suspended sediment loads and very fine particles (de Fleury et al., 2025).

The resulting elevation-area relationships are then used to reconstruct past changes in water volume from Landsat-derived water surface areas (1984 to present) for more than 2,000 lakes and reservoirs (Girard et al., 2026). This analysis reveals long-term changes and trends in hydrological dynamics in relation to environmental drivers (i.e. precipitation, temperature, and land use/land cover) and anthropogenic activities (e.g. reservoir construction and management).

 References

  • Girard, L. Kergoat, J. S. Paiva, R. Yonaba and M. Grippa (2026) 40-Year Volume Changes of West African Lakes Derived from SWOT and Optical Imagery. Submitted to WRR
  • Girard et al. (2025b) https://doi.org/10.1109/JSTARS.2025.3570859
  • de Fleury et al (2025) https://doi.org/10.1016/j.rsase.2024.101412
  • de Fleury et al. (2023) https://doi.org/10.5194/hess-2022-367


How to cite: Grippa, M., Girard, F., de Fleury, M., Nikiema, D. E., Faye, C., Abdourahamane Touré, A., Yonaba, R., and Kergoat, L.: Monitoring water volume dynamics in West African lakes and reservoirs using altimeters and optical satellite sensors, EGU General Assembly 2026, Vienna, Austria, 3–8 May 2026, EGU26-11546, https://doi.org/10.5194/egusphere-egu26-11546, 2026.

EGU26-11772 | Orals | HS6.4

Joint training of hydrologic and hydraulic models using Deep Learning and remote sensing data for the Torne River 

Simon Köhn, Connor Chewning, Aske Folkmann Musaeus, Phillip Aarestrup, Roland Löwe, Cécile Kittel, David Gustafsson, Peter Bauer-Gottwein, and Karina Nielsen

Floods are among the most devastating natural disasters, affecting both developed and developing regions. However, developing countries often lack sufficient monitoring and early warning systems, making them more vulnerable. The ESA EO4FLOOD project aims to enhance flood forecasting by integrating satellite data with hydrologic and hydraulic models. Within this effort, we introduce a novel joint modelling framework that couples hydrologic and hydraulic models using differentiable programming.

Hydraulic and hydrologic models are constrained by data and traditionally rely on in situ measurements, which are expensive to obtain, may be access-limited, and can be dangerous to collect in remote terrain or during crises. Remotely sensed data from satellites or airborne campaigns offer a potent and low-cost alternative, with satellites providing data irrespective of national or geographic borders. Hydraulic-geometric parameters, water surface elevations (WSE), and slopes (WSS), as well as inputs to the hydrologic model, can be resolved through remote sensing.

With the launch of the Surface Water and Ocean Topography (SWOT) satellite mission, high-accuracy spatially distributed (2D) WSE and WSS observations have become available at a global scale. The primary instrument is a Ka-band radar interferometer that observes two, 50km wide swaths on each side of the ground track of the satellite, with a science requirement to detect rivers larger than 100m in width; however, even smaller rivers can be measured. The ICESat-2 satellite enables accurate global WSS and river topography observations, which can be locally substituted by national topographic LIDAR missions.

We present a differentiable hydraulic-hydrologic framework integrating large-scale Earth observation (EO) data while maintaining physical consistency. Both models are jointly trained using SWOT data, with the output of the hydrologic model serving as input to the hydraulic model. Joint training enables both models to benefit from the information contained in the SWOT data, as well as potentially satellite earth observations of additional state variables (e.g., soil moisture, evapotranspiration, terrestrial water storage). Additionally, the coupled approach allows independence from rating-curve-based discharge, marking a significant leap forward in the global applicability of hydraulic models.

We demonstrate this approach on the Torne River, located between northern Sweden and Finland. With extensive in-situ data, Torne provides an ideal case for validation. Our joint model supports accurate water level and discharge forecasting, aiding flood preparedness, informing local adaptation strategies, and enhancing climate resilience. This proof of concept highlights the method’s global potential under the EO4FLOOD initiative.

How to cite: Köhn, S., Chewning, C., Folkmann Musaeus, A., Aarestrup, P., Löwe, R., Kittel, C., Gustafsson, D., Bauer-Gottwein, P., and Nielsen, K.: Joint training of hydrologic and hydraulic models using Deep Learning and remote sensing data for the Torne River, EGU General Assembly 2026, Vienna, Austria, 3–8 May 2026, EGU26-11772, https://doi.org/10.5194/egusphere-egu26-11772, 2026.

EGU26-11822 | ECS | Posters on site | HS6.4

Estimating river cross-sections for hydrodynamic models from space-borne and airborne LIDAR altimetry 

Aske Folkmann Musaeus, Simon Jakob Köhn, Cécile Marie Margaretha Kittel, Karina Nielsen, Jakob Luchner, and Peter Bauer-Gottwein

Hydrodynamic models are vital for water resource management and flood forecasting, but their application is limited by available data sources. In addition to observations of water surface elevation (WSE) and discharge, river channel and floodplain geometry must be estimated to calibrate, validate and operate hydrodynamic models.

While traditional terrain surveying is limited by physical access, political boundaries, safety, or cost, remotely sensed terrain data provides an alternative in data-scarce areas. Digital Elevation Models (DEMs) based on regional or global products have been used for river and floodplain geometry, but their accuracy is limited by low resolution and the inability to estimate geometry in the submerged section of the river channel. Airborne LIDAR missions, where available, provide high resolution point clouds of terrain and water surface elevation. In addition, novel satellite missions provide new opportunities for sensing hydraulic parameters remotely, when airborne LIDAR is not accessible. Estimating hydraulic parameters from these LIDAR datasets allows for the development of hydrodynamic models in flood-prone areas where it was previously not possible to reach sufficient accuracy for effective operation.

With the launch of ICESat-2, water surface slope (WSS) observations became available on a global scale. The LIDAR instrument on ICESat-2 records both terrain and water surface elevation, and the six LIDAR tracks provide 6 simultaneous measurements of WSE, allowing for a WSS estimate. The spatial resolution of just 0.7 m allows for cross-section delineation. But, both ICESat-2 and airborne LIDAR observations reflect strongly on water, hindering observations of submerged channel geometry.

We present a method of combining airborne or ICESat-2 LIDAR observations of the exposed cross-section and WSS with discharge to estimate the conveyance curve for the submerged part of the cross-section. The 1D de Saint-Venant equations are solved while assuming diffusive wave conditions, where acceleration terms are neglected. Under these conditions, water surface slope is equal to the friction slope. Manning’s equation can then be solved for conveyance in the submerged section using observed discharge and water surface slope. With an assumed shape and Manning’s resistance number, a full cross-section is delineated.

The method was initially developed for use with ICESat-2 altimetry measurements but has been extended to work with Airborne LIDAR point clouds when available. The method is shared in an open-source python package, containing functions for processing ICESat-2 or airborne LIDAR data, calculating WSS and producing cross-sections in a preferred data format, using a discharge input from observations or from a hydrological model, provided by the user. The package will allow users to estimate cross-sections in data-scarce areas, ready to be implemented in hydrodynamic models. 

How to cite: Musaeus, A. F., Köhn, S. J., Kittel, C. M. M., Nielsen, K., Luchner, J., and Bauer-Gottwein, P.: Estimating river cross-sections for hydrodynamic models from space-borne and airborne LIDAR altimetry, EGU General Assembly 2026, Vienna, Austria, 3–8 May 2026, EGU26-11822, https://doi.org/10.5194/egusphere-egu26-11822, 2026.

EGU26-13284 | ECS | Orals | HS6.4

GNSS4SurfaceWater: an open data hub for rapid GNSS-IR surface water monitoring 

Makan Karegar, Ángel Martín Furones, Rosalie Reyes, Roelof Rietbroek, Alvaro Santamaría, Mohammad J. Tourian, and Simon Williams

GNSS Interferometric Reflectometry (GNSS-IR) has evolved from an opportunistic use of geodetic reference stations towards purpose-built, low-cost sensors optimized for water-surface monitoring. Affordable GNSS-IR instruments are now specifically designed and positioned to observe water surfaces with optimized antenna geometry and controlled viewing conditions. This means we are no longer just picking up reflections when and where they happen to occur but instead purposefully measuring them for hydrological and environmental applications. This also makes GNSS-IR attractive for current and future satellite altimetry validation, particularly in regions where geoid uncertainty, sparse in-situ gauges or complex hydrodynamics limit traditional approaches. With this rapid development and increasing community interest, we present GNSS4SurfaceWater, an open data hub for sharing water-level time series from affordable GNSS-IR sensors following open-science hardware and software principles. The platform provides interactive visualization tools for exploring time series, station metadata, and site characteristics. It works as an independent, ground-based service for monitoring both current and historical surface water levels. GNSS4SurfaceWater highlights ongoing projects using low-cost GNSS instrumentation, promotes reproducible processing workflows and supports community contributions through standardized data upload formats. GNSS-IR sea-level products are also distributed through the Permanent Service for Mean Sea Level (PSMSL) GNSS-IR portal. This portal also aggregates contributions from multiple providers and ensures long-term data continuity. PSMSL focuses on long-term archiving, whereas GNSS4SurfaceWater is designed to provide community-driven near-real-time data availability with low latency to support rapid monitoring and event detection. The two platforms complement each other by supporting open and scalable GNSS-IR surface water monitoring and helping to broaden the adoption of GNSS-IR for hydrological observations.

How to cite: Karegar, M., Martín Furones, Á., Reyes, R., Rietbroek, R., Santamaría, A., Tourian, M. J., and Williams, S.: GNSS4SurfaceWater: an open data hub for rapid GNSS-IR surface water monitoring, EGU General Assembly 2026, Vienna, Austria, 3–8 May 2026, EGU26-13284, https://doi.org/10.5194/egusphere-egu26-13284, 2026.

EGU26-14113 | Orals | HS6.4

Integrating AI-derived SAR Flood Extent Map Uncertainties in Remote Sensing Data Assimilation for Flood Forecasting 

Thanh Huy Nguyen, Yu Li, Sophie Ricci, Andrea Piacentini, Ludovic Cassan, Raquel Rodriguez Suquet, Santiago Peña Luque, Quentin Bonassies, Christophe Fatras, Marco Chini, and Patrick Matgen

Numerical hydrodynamic models are widely used to simulate and forecast river water surface elevation (WSE) and flow velocity, over lead times ranging from hours to several days. Their predictive skill, however, is limited by multiple sources of uncertainty related to simplified governing equations, numerical solvers, forcing and boundary conditions, and model parameters, e.g. friction coefficients, obtained through calibration. These uncertainties propagate to model outputs and can significantly affect flood forecasts. Data Assimilation (DA) provides a robust framework to reduce such uncertainties by sequentially combining numerical model predictions with observations as they become available, while explicitly accounting for their respective error statistics. 

In this work, a joint state-parameter EnKF is implemented to reduce uncertainties in upstream time-varying inflow discharges and spatially distributed friction coefficients through the assimilation of in-situ WSE observations. The performance of the EnKF strongly depends on ensemble size and on the spatial and temporal density of the observing network. However, the limited availability and continued decline of in-situ river gauge stations, particularly in floodplains, motivate the integration of remote-sensing (RS) observations into the DA framework, and with that the uncertainties associated with the flood extent maps.

Recent advances in deep learning (DL) have significantly improved automatic SAR-based flood extent mapping. Nevertheless, most existing approaches provide deterministic flood extent maps without associated uncertainty estimates, which are essential for stochastic DA methods. To address this, we here rely on a unified DL framework, called  Density-Aware Conformal Flood Mapping (DACFM), that explicitly quantifies two complementary sources of uncertainty in SAR-derived flood maps: (i) DL model’s knowledge-related uncertainty, caused by finite training data or model misspecification, and (ii) SAR data-related uncertainty arising from image noise and flood/non-flood class ambiguity. DL model’s knowledge uncertainty is characterized using feature density analysis in the latent space of a density-aware neural network, while data-related uncertainty is quantified via softmax entropy. These uncertainty estimates are operationalized through conformal risk control at a user-defined risk level (α, δ), enabling the rejection of out-of-distribution samples and the generation of set-valued predictions for in-distribution inputs. Such a method of uncertainty estimation was evaluated across diverse real-world flooding contexts, including built-up areas, vegetated regions, and bare soil, demonstrating improved uncertainty quantification.

The proposed approach is demonstrated using a high-fidelity TELEMAC-2D hydrodynamic model of the Ohio River reach between the Cannelton and Newburgh locks and dams. RS-derived flood extent products from Sentinel-1 SAR are assimilated in the form of wet surface ratios (WSR) over selected floodplain subdomains, each accompanied by uncertainty estimates derived from the DL-based flood mapping framework. Flood reanalyses for the major flood events of February and April 2025 yield significant WSE error reduction. Independent flood extent maps derived from Sentinel-2, and Landsat-8 optical images were also used to validate the experiments.  

How to cite: Nguyen, T. H., Li, Y., Ricci, S., Piacentini, A., Cassan, L., Rodriguez Suquet, R., Peña Luque, S., Bonassies, Q., Fatras, C., Chini, M., and Matgen, P.: Integrating AI-derived SAR Flood Extent Map Uncertainties in Remote Sensing Data Assimilation for Flood Forecasting, EGU General Assembly 2026, Vienna, Austria, 3–8 May 2026, EGU26-14113, https://doi.org/10.5194/egusphere-egu26-14113, 2026.

EGU26-15544 | Posters on site | HS6.4

Detecting water surface dynamics of a narrower man-made canal using SWOT 

Liguang Jiang and Tian Xia

The monitoring of global surface water is of critical scientific and societal importance, as these resources are essential for human activities and pose significant risks during extreme flood events. Accurately measuring river hydrodynamics, particularly water surface elevation (WSE), is fundamental for improving flood forecasting, validating hydraulic models, and understanding the global water cycle.

The launch of the Surface Water and Ocean Topography (SWOT) satellite in December 2022 represents a paradigm shift in remote sensing of hydrology. Equipped with the novel Ka-band Radar Interferometer (KaRIn), SWOT provides wide-swath, high-resolution measurements of water elevation and extent across two 50-km-wide swaths. Unlike traditional nadir altimeters, SWOT's 2D imaging capabilities allow for the characterization of complex hydrological processes at unprecedented scales. Despite these advancements, a major challenge remains in accurately observing "narrow" rivers—those below the mission's formal science requirement of 100 meters (with a goal of 50 meters). At the spatial resolution of current SAR sensors, extracting these narrow features is extremely difficult due to strong multiplicative speckle noise, low water-land contrast, and interference from surrounding land structures like roads or terrain artifacts. Furthermore, standard operational algorithms often rely on fixed prior databases (e.g., SWORD or GRWL) that may not account for real-time changes in river morphology, such as meandering or seasonal variations, or may suffer from positional shifts in radar geometry.

In this work, we assess SWOT’s capability to detect water surface elevation and slope of a narrower (~40 m wide) man-made canal. Instead of RiverSP and Raster products, PIXC offers the opportunity to detect such a narrower channel. Preliminary results show that SWOT can detect the canal although the data quality is not very high. In general, the longitudinal profile obtained from SWOT generally agrees with existing documentation, showcasing the potential to monitor narrower canals by analyzing PIXC product.

How to cite: Jiang, L. and Xia, T.: Detecting water surface dynamics of a narrower man-made canal using SWOT, EGU General Assembly 2026, Vienna, Austria, 3–8 May 2026, EGU26-15544, https://doi.org/10.5194/egusphere-egu26-15544, 2026.

EGU26-15716 | Orals | HS6.4

Wetland Water Level Monitoring Based on Hydrological Unit Division Using SBAS-InSAR: A Case Study in Louisiana, USA 

Jinqi Zhao, Changxu Shen, Chengbin Hou, Yufen Niu, and Qingli Luo

As one of the most important ecological indicators of wetlands, water level directly reflects hydrological processes and ecological patterns. Therefore, efficient and accurate monitoring of water level is critical for wetland conservation and restoration. Interferometric Synthetic Aperture Radar (InSAR), with its advantages of wide coverage, all-day/all-weather observation, and high measurement precision, has been successfully applied to wetland water level monitoring. However, due to pronounced heterogeneity in internal hydrological connectivity within wetlands, conventional InSAR techniques often suffer from phase discontinuities and error propagation across hydrological boundaries, making it difficult to accurately characterize water level variations over large and complex wetland systems. To address this limitation, we propose an absolute wetland water level monitoring method based on hydrological unit division using the Small Baseline Subset InSAR (SBAS-InSAR) framework, aiming to improve the reliability of InSAR-derived water level estimates under complex hydrological conditions. Taking the floodplain of Louisiana, USA, as a case study, multi-temporal Sentinel-1 SAR imagery combined with global land cover data is used to analyze hydrological connectivity and partition the study area into multiple relatively independent hydrological units. Within each hydrological unit, a small-baseline interferometric network is constructed to retrieve relative water level change time series, which are subsequently calibrated using in situ observations from United States Geological Survey (USGS) hydrological stations. Finally, least-squares estimation is applied to derive the spatiotemporal distribution of absolute water level changes. The experimental results demonstrate that: (1) hydrological unit division significantly improves the reliability of time-series inversion, reducing the overall root mean square error (RMSE) from 13.20 cm to 4.03 cm; (2) hydraulic barriers such as levees and urban infrastructure substantially disrupt the spatial continuity of wetland water level variations; and (3) C-band coherence in wetlands exhibits pronounced seasonal variability, with the highest coherence observed from late winter to early spring and the lowest from late summer to early autumn, mainly influenced by vegetation phenology and inundation conditions. Overall, the proposed method enables centimeter-level, large-scale monitoring of wetland water level changes, providing technical reference and data support for wetland water resource management and ecological protection.

How to cite: Zhao, J., Shen, C., Hou, C., Niu, Y., and Luo, Q.: Wetland Water Level Monitoring Based on Hydrological Unit Division Using SBAS-InSAR: A Case Study in Louisiana, USA, EGU General Assembly 2026, Vienna, Austria, 3–8 May 2026, EGU26-15716, https://doi.org/10.5194/egusphere-egu26-15716, 2026.

EGU26-16373 | ECS | Posters on site | HS6.4

Informing an integrated hydrological model with SWOT in the tropical Usangu wetland 

Sarah Franze, Paul Senty, Clemens Cremer, Christian Toettrup, and Peter Bauer-Gottwein

Tropical wetland hydrology is often poorly monitored by in situ gauges, yet it is critical for understanding the global carbon budget and water resource management. Earth observation (EO) data has long been used to calibrate and update hydrological and hydraulic models, providing valuable insights in poorly instrumented catchments. The recently launched Surface Water and Ocean Topography (SWOT) mission provides simultaneous observations of surface water extent and height at near global coverage. SWOT has been extensively used for informing river hydraulic and hydrodynamic models, but much less for integrated wetland hydrological models that represent surface water – groundwater interaction. Here we focus on modeling the hydrology of the Usangu wetlands in Tanzania. Usangu is representative of a wide range of tropical wetlands featuring a variety of land cover types (grasslands, forests, marshes, crops, permanent and seasonal flooding) and presents strong changes in hydrology both seasonally and interannually due to human impact. 

We developed a MIKE SHE integrated hydrological model for the Usangu wetlands and surrounding alluvial fans. The model is coupled with a 1D river routing model and forced by a lumped-conceptual rainfall runoff model at all major river inlets to the wetland. Model forcing data includes daily CHIRPS v2.0 precipitation data and FAO reference evapotranspiration data. From Sentinel-2 multispectral imagery we extract river widths used to inform cross section shape. Vegetation maps are built from a combination of MODIS leaf area index (LAI), maps from aerial surveys, and global land cover maps. For calibrating the base model, we use three river discharge stations located along three separate rivers feeding the Usangu wetlands. SWOT pixel cloud data is processed to make dynamic flood extent maps over the wetland area. To improve flood extent estimation under dense vegetation, additional radar satellites (PALSAR-2, Sentinel-1) are used in combination with SWOT. SWOT pixel cloud data is also used to estimate river heights and establish an updated rating curve at the main outlet of Usangu, along the Great Ruaha River.

We present the first results characterizing the Usangu wetland hydrology as seen from multiple earth observation satellites (SWOT, Sentinel-2, other radar satellites) and compare with predictions from the integrated MIKE SHE model. SWOT-derived flood extent maps are compared with the modeled flood extent over the wetland domain using overlap-based metrics such as CSI and F-score. River heights from SWOT are compared with modeled river water levels.

How to cite: Franze, S., Senty, P., Cremer, C., Toettrup, C., and Bauer-Gottwein, P.: Informing an integrated hydrological model with SWOT in the tropical Usangu wetland, EGU General Assembly 2026, Vienna, Austria, 3–8 May 2026, EGU26-16373, https://doi.org/10.5194/egusphere-egu26-16373, 2026.

EGU26-17279 | Posters on site | HS6.4

Insight into validation methods of Sentinel-3 Hydrology Thematic Products  

Julien Renou, Marie Chapellier, Karina Nielsen, Nicolas Taburet, Jérémie Aublanc, Alessandro Di Bella, Filomena Catapano, and Marco Restano

Sentinel-3 is an Earth Observation satellite series developed by the European Space Agency (ESA) as part of the European Copernicus Programme, currently composed of the two Sentinel-3A and Sentinel-3B satellites. Both satellites carry on-board SAR Radar Altimeter (SRAL), which aims at supplying operational topography measurements of the Earth’s surface. Over inland waters, the main objective is to provide accurate Water Surface Height (WSH) measurements to support the monitoring of freshwater stocks through dedicated Level-2 Hydrology Thematic Products. As part of the ESA Sentinel-3 Altimetry Mission Performance Cluster (MPC) project, the Hydrology Expert Support Laboratories (HY-ESL) evaluates the product performance using dedicated validation methodologies and proposes potential enhancements to the Hydrology Thematic Products. 

In this study, the performance of the Hydrology Thematic Products over rivers and lakes is assessed using complementary validation methodologies to better estimate WSH uncertainties over inland waters. First, Sentinel-3 WSH timeseries are compared with in-situ WSH timeseries over rivers using nadir validation method combined with river slope estimates derived from SWOT products. These results are complemented with the innovative off-nadir validation technique that redefines the notion of virtual station, reducing WSH uncertainties induced by the river slope bias. Cross-validation is then performed between Sentinel-3 and SWOT products to leverage the large spatial coverage of the SWOT mission, resulting in a distribution of WSH differences from thousands of lakes. Statistical metrics from this distribution are analyzed with respect to lake size and specularity. Finally, mean lake surfaces inferred from SWOT products are used over large lakes to quantify WSH uncertainties due to errors in global geoid models, which is currently the main contributor to the error budget over large lakes. 

How to cite: Renou, J., Chapellier, M., Nielsen, K., Taburet, N., Aublanc, J., Di Bella, A., Catapano, F., and Restano, M.: Insight into validation methods of Sentinel-3 Hydrology Thematic Products , EGU General Assembly 2026, Vienna, Austria, 3–8 May 2026, EGU26-17279, https://doi.org/10.5194/egusphere-egu26-17279, 2026.

EGU26-17780 | Posters on site | HS6.4

Optical and altimetry data integration for river discharge estimation on a global scale 

Luca Ciabatta, Ceren Y. Tural, Paolo Filippucci, Karina Nielsen, Alessandro Burini, and Angelica Tarpanelli

Rivers play a central role in the Earth’s hydrological system, acting as pathways for freshwater transport and supporting ecosystems, human societies, and economic activities. Accurate monitoring of river discharge is essential for understanding the global water cycle, managing water resources, and addressing the increasing pressures associated with climate change. Despite its importance, discharge monitoring based on in-situ measurements remains limited, with sparse and uneven coverage, particularly in remote and ungauged regions. In this context, satellite observations offer a unique opportunity to overcome these limitations by enabling large-scale and consistent estimation of river discharge across diverse environments.

This study presents an advanced framework that combines satellite observations from optical and altimetry sensors to generate a global river discharge product tailored for hydrological applications. Building on the capabilities of EUMETSAT satellite systems and Copernicus contributing missions, the framework integrates data from multiple satellite platforms to enhance information content and improve accuracy relative to single-sensor approaches. A key innovation lies in the fusion of complementary datasets (optical and altimetry), which improves both spatial and temporal resolution, especially in areas where ground-based observations are scarce or absent.

The analysis focuses on more than 300 sites distributed worldwide, covering a wide range of climatic conditions and hydrological regimes. This dataset enables an assessment of the long-term potential of satellite-derived discharge estimates for water resource management and climate impact studies. Particular emphasis is placed on evaluating the added value of the global product in ungauged basins, as well as identifying its limitations in monitoring smaller rivers, where higher spatial resolution is often required.

To ensure the robustness and transferability of the proposed framework, multiple river discharge estimation methods are systematically tested on a representative subset comprising approximately 30% of the analyzed sites. This intercomparison aims to identify the most reliable and scalable approach, which is then adopted to generate river discharge estimates for the full dataset. The outcomes of this evaluation are presented here and subsequently extended to a global-scale application.

The results highlight the strong potential of satellite-based technologies for river discharge monitoring, enabling more robust, consistent and timely information to support decision-making in the context of global environmental change.

How to cite: Ciabatta, L., Tural, C. Y., Filippucci, P., Nielsen, K., Burini, A., and Tarpanelli, A.: Optical and altimetry data integration for river discharge estimation on a global scale, EGU General Assembly 2026, Vienna, Austria, 3–8 May 2026, EGU26-17780, https://doi.org/10.5194/egusphere-egu26-17780, 2026.

EGU26-18189 | Orals | HS6.4

AltHydro: an operational system for real-time water level forecasting at virtual stations on the Odra River 

Tomasz Niedzielski, Michał Halicki, and Christian Schwatke

Floods are among the most disastrous natural hazards. Therefore, issuing accurate river water level forecasts is one of the key tasks of the hydrologic community. Such forecasts are usually computed only for gauging stations. Many basins, however, are poorly gauged with only a few monitoring stations available. In contrast, satellite altimetry provides regular water level measurements globally at the so-called virtual stations (VS), i.e. unmonitored river sites observed only by altimetry satellites. The temporal resolution of water level time series at VS is approximately 10-35 days. Due to such a long repeat cycle, altimetry observations have not been used very often for forecasting purposes.

In this study, we present the AltHydro system which represents the first approach to issue forecasts for VS of altimetry satellites. AltHydro computes hourly updated forecasts for VS with a 72-hour lead time. First, vector autoregressive models are employed to calculate water level predictions at gauge stations. Next, linear regressions between gauge and altimetry water levels are established and updated in real time. Finally, the predictions for gauge stations are transferred to the neighbouring VS using the regression coefficients and considering the along-river time lag, driven by the downward water propagation, calculated in real time. 

Our approach has been applied to 8 VS of the Sentinel-3A satellite located on the middle Odra/Oder River in southwestern Poland. The Odra/Oder is a transboundary river originating in the Sudetes Mountains. Major floods hit the Odra/Oder river basin regularly, e.g. in 1997, 2010 and 2024. The in situ data were taken from the gauges owned and maintained by the Polish Institute for Meteorology and Water Management — State Research Institute. To properly validate water level predictions at VS, we use both Sentinel-3A (since 2017) and the Surface Water and Ocean Topography (SWOT) measurements (since 2023). The accuracy assessment revealed root mean squared error (RMSE) of 0.17 m (ranging from 0.11 to 0.22 m) and the Nash-Sutcliffe efficiency (NSE) of 0.95 (ranging from 0.92 to 0.98) for the 24-hour predictions. Satisfactory accuracies were also found for the predictions with a lead time of 72 hours, with mean RMSE and NSE of 0.30 m and 0.88, respectively. The system showed robust performance during the major flood of September 2024, especially for the 24-hour lead time. The AltHydro system can lead to increasing the number of stations with water level predictions worldwide, especially when using the unprecedented geometry of the SWOT measurements.

The research presented in this paper has been carried out in frame of the project no. 2020/38/E/ST10/00295 within the Sonata BIS programme of the National Science Centre, Poland. The research has also been supported by the Bekker Programme of the Polish National Agency for Academic Exchange, as well as by the program “Excellence Initiative — Research University”. The experimental version of the system works in an operational fashion, and its real-time predictions are available at: http://althydro.uwr.edu.pl.

How to cite: Niedzielski, T., Halicki, M., and Schwatke, C.: AltHydro: an operational system for real-time water level forecasting at virtual stations on the Odra River, EGU General Assembly 2026, Vienna, Austria, 3–8 May 2026, EGU26-18189, https://doi.org/10.5194/egusphere-egu26-18189, 2026.

EGU26-18214 | ECS | Orals | HS6.4

Spatiotemporal dynamics of water extent, level, and storage of lakes with contrasting bathymetries: insights from the Trichonida – Lysimachia lake complex in Western Greece 

Konstantinos Panousis, Konstantinos M. Andreadis, Andreas Langousis, Nikolaos Th. Fourniotis, and Christoforos Pappas

Accurate spatiotemporal monitoring of inland water bodies is crucial, since, apart from numerous ecosystem services they also provide valuable water resources. This is particularly true in water-limited Mediterranean regions where detailed characterization of lake water extent, level and storage could facilitate sustainable water resources management under climate extremes (e.g., droughts). Here, focusing on the Trichonida – Lysimachia lake complex in Western Greece, we synthesized remote sensing observations, in-situ measurements, and auxiliary environmental and geospatial datasets, in order to characterize the spatiotemporal dynamics in their water extent, level, and storage. The Trichonida – Lysimachia lake complex is a sensitive ecosystem, protected as part of the Natura 2000 network; lake Trichonida is the largest natural lake in Greece (surface area of ~93 km2 and maximum depth of ~52 m) and is connected through an open channel with the much smaller and shallower lake Lysimachia (surface area of ~10 km2 and maximum depth of ~8 m). The analysis of optical (Landsat 5, 7, 8, 9, Sentinel 2) and microwave (Sentinel 1) satellite imagery revealed that both lakes displayed significant changes in their areal extent at the seasonal and annual time scale, with these results being more pronounced for the lake with shallower bathymetry (i.e., Lysimachia). The surface area of lake Trichonida (Lysimachia) decreased significantly during the period 1985 – 2024 at a rate equal of 32.3 m2 yr-1 (36.4 m2 yr-1) with hotspots that displayed more than 100 m shift in the shoreline. In-situ water level measurements agreed well with estimates from satellite altimetry (ICESat, SWOT), and, when combined with the detailed bathymetries of the two lakes, detailed water level-area-volume curves were derived. Such curves, synthesize multivariate observations, in-situ measurements, and cross-disciplinary hydrogeodetic techniques and reveal lake-specific 3D patterns. The obtained results offer valuable insights not only towards the sustainable management of the two lakes but can also contribute to the refinement of regional- and global-scale initiatives on satellite-based 3D lake monitoring.

How to cite: Panousis, K., Andreadis, K. M., Langousis, A., Fourniotis, N. Th., and Pappas, C.: Spatiotemporal dynamics of water extent, level, and storage of lakes with contrasting bathymetries: insights from the Trichonida – Lysimachia lake complex in Western Greece, EGU General Assembly 2026, Vienna, Austria, 3–8 May 2026, EGU26-18214, https://doi.org/10.5194/egusphere-egu26-18214, 2026.

EGU26-20510 | Orals | HS6.4

Absolute Water Volume Estimation from Multi-Sensor approach using SWOT and Sentinel-2 

Benjamin Tardy, Come Oosterhof, Mathilde De Fleury, Abderrahmane Aiche, and Gaël Nicolas

Water resources are under unprecedented pressure driven by climate change, societal demands, and geopolitical tensions. To address these issues in France, the FR2030 project supported by the Ministry for Ecological Transition, aims to improve water management. In this context, authorities have identified 18,500 water bodies requiring regular monitoring through satellite data. These water bodies of varying nature range from 3ha to several hundred hectares.

Current satellite missions provide data well-suited for regular monitoring thanks to their revisit frequency and spatial resolution, enabling observation of a large number of water bodies. The launch of SWOT in 2023 expanded significantly the number of observable water bodies through its near-global coverage, opening up new possibilities for monitoring water resources.

One of FR2030’s objectives is to provide volume measurements that decision-makers, such as prefectures, regional environmental agencies (DREAL) and other authorities, can rely on to act quickly in crisis situations. Most methods focus on estimating volume variations as this approach is more straightforward. However, end users also need absolute quantitative measurements.

The first developed approach is based on the hypsometric law commonly used for volume estimation (Crétaux et al., 2016). While SWOT provides height and surface data, its surface measurements lack the precision required for quantitative monitoring making a multi-sensor approach preferable. The hypsometric curve is derived by combining Sentinel-2 surface data (Peña-Luque et al, 2021) with water surface elevation data from SWOT_L2_HR_LakeSP_Prior products. Lake bottom information obtained from a DEM and dam base data (e.g. DEM4Water) is needed to compute absolute volume to correct the bias. This 2D approach already provides valuable insights for user but requires prior data.

A second method was developed to overcome this limitation. Water body contours are extracted from multiple clear Sentinel-2 surface images each linked to a water surface elevation from SWOT. Using 3D reconstruction, we derive bathymetry (Khazaei et al., 2022) discretized along a height scale. Water columns at the target elevation are then used to compute lake volume. This innovative 3D approach relying only on surface and height remote sensing data already shows strong potential. Its preliminary results are consistent with established datasets and methods. The method delivers in-situ validated results with an initial error of just 25% on absolute volumes. With several limitations already identified, this approach is on track for significant improvements.

These two approaches illustrate the potential for developing a global framework for dynamic monitoring of reservoir water storage under time constraints. By combining multi-sensor satellite data and advanced reconstruction techniques, they enable direct estimation of absolute water volumes, an innovative breakthrough compared to traditional methods focused on relative variations. While further validation and optimization are required, these methods open promising perspectives for decision-makers with actionable insights at scales relevant for resource management.

References:

  • Crétaux et al., 2016, Lake volume monitoring from space: https://doi.org/10.1007/s10712-016-9362-6
  • Peña-Luque et al, 2021, Sentinel-1&2 Multitemporal Water Surface Detection Accuracies, Evaluated at Regional and Reservoirs Level: https://doi.org/10.3390/rs13163279
  • DEM4Water: https://github.com/CNES/dem4water
  • Khazaei et al., 2022, GLOBathy, the global lakes bathymetry dataset: https://doi.org/10.1038/s41597-022-01132-9

How to cite: Tardy, B., Oosterhof, C., De Fleury, M., Aiche, A., and Nicolas, G.: Absolute Water Volume Estimation from Multi-Sensor approach using SWOT and Sentinel-2, EGU General Assembly 2026, Vienna, Austria, 3–8 May 2026, EGU26-20510, https://doi.org/10.5194/egusphere-egu26-20510, 2026.

EGU26-21316 | ECS | Orals | HS6.4

A novel approach for water level changes with SAR amplitude data:  first results using Sentinel-1 imagery on Trasimeno Lake, Italy 

Lorenza Ranaldi, Valeria Belloni, Andrea Nascetti, and Mattia Crespi

Traditional in-situ monitoring is often limited to major reservoirs in developed regions. However, rising water scarcity necessitates monitoring smaller, isolated water bodies critical for local agricultural systems. Remote sensing has emerged as an efficient alternative to complement or replace gauge stations. Satellite altimetry missions offer high accuracy, but they can be constrained by coarse spatial resolution and revisit time. Consequently, SAR imagery has been widely exploited. Interferometric techniques use phase to detect level changes but are limited to vegetated wetlands or sub-wavelength changes [1]. On the other hand, amplitude-based methods, which rely on shoreline backscatter differences, are often dependent on accurate DEMs [2]. This research aims to introduce a novel approach for estimating water level changes using SAR amplitude data, without relying on prior morphological information. The approach assumes that the horizontal shift Δ of a shoreline and its water level change Δh are geometrically dependent through the local coastal slope i, under the hypothesis that locally the coastal morphology can be approximated with a plane. From the satellite perspective, the level change on this plane is captured as a variation in the sensor-to-target distanced. By combining d and Δ with other parameters which describe the geometric configuration of the satellite-coast interaction (satellite azimuth, SAR local incidence angle, coastal aspect), a final observation equation is formulated to link the unknown water level change to the measured distance. This scheme can be applied to different coastal zones around the lake, assuming variable slopes, but the same water level change between two epochs, providing redundancy for the implementation. The model is developed first by applying an image-matching technique on coregistered SAR images to detect shoreline displacements in the range direction (d). Then, the displacements are used as input for a least squares approach, which incorporates initial assumptions regarding geometrically known parameters and preliminary estimates of the unknown values, yielding estimates of both the water level changes (Δh) between epochs and the slope of each coastal zone portion (i). A preliminary analysis was focused on Trasimeno Lake in Umbria, Italy, using a stack of 30 Sentinel-1 (S1) SLC images (IW mode, VV polarisation) acquired in 2022 on the same orbit, coregistered using the pyGMSTAR library [3]. When compared to the in-situ data, the differences with the estimated values achieved an accuracy of 4 cm and a NMAD of 9 cm, demonstrating the method's potential using S1 mid-resolution imagery. Other tests are under development to improve the overall performance and support the future integration of the method for enhancing water level monitoring in different basins.


[1] Aminjafari, S., Brown, I., Mayamey, F. V., & Jaramillo, F. (2024). Tracking centimeter-scale water level changes in Swedish lakes using D-InSAR. Water Resources Research, 60, e2022WR034290

[2] Lee, S., Kim, D.-j., Li, C., Yoon, D., Song, J., Kim, J., & Kang, K. (2024). A new model for high-accuracy monitoring of water level changes via enhanced water boundary detection and reliability-based weighting averaging. Remote Sensing of Environment, 313, 114360

[3] Pechnikov, A. (2024). PyGMTSAR (Python InSAR) (Version 2024.2.8)

How to cite: Ranaldi, L., Belloni, V., Nascetti, A., and Crespi, M.: A novel approach for water level changes with SAR amplitude data:  first results using Sentinel-1 imagery on Trasimeno Lake, Italy, EGU General Assembly 2026, Vienna, Austria, 3–8 May 2026, EGU26-21316, https://doi.org/10.5194/egusphere-egu26-21316, 2026.

EGU26-4 | ECS | Posters on site | HS6.5

Advanced phycocyanin detection in a South American lake using Landsat imagery and remote sensing 

Lien Rodríguez-López, David Bustos Usta, Lisandra Bravo Alvarez, Iongel Duran Llacer, Luc Bourrel, Frederic Frappart, and Roberto Urrutia

In this study, multispectral images were used to detect toxic blooms in Villarrica Lake in Chile, using a time series of water quality data from 1989 to 2024, based on the extraction of spectral information from Landsat 8 and 9 satellite imagery. To explore the predictive capacity of these variables, we constructed 255 multiple linear regression models using different combinations of spectral bands and indices as independent variables, with phycocyanin concentration as the dependent variable. The most effective model, selected through a stepwise regression procedure, incorporated seven statistically significant predictors (p < 0.05) and took the following form: FCA = N/G + NDVI + B + GNDVI + EVI + SABI + CCI. This model achieved a strong fit to the validation data, with an R2 of 0.85 and an RMSE of 0.10 μg/L, indicating high explanatory power and relatively low error in phycocyanin estimation. When applied to the complete weekly time series of satellite observations, the model successfully captured both seasonal dynamics and interannual variability in phycocyanin concentrations (R2 = 0.92; RMSE = 0.05 μg/L). These results demonstrate the robustness and practical utility for long-term monitoring of harmful algal blooms in Lake Villarrica.

How to cite: Rodríguez-López, L., Bustos Usta, D., Bravo Alvarez, L., Duran Llacer, I., Bourrel, L., Frappart, F., and Urrutia, R.: Advanced phycocyanin detection in a South American lake using Landsat imagery and remote sensing, EGU General Assembly 2026, Vienna, Austria, 3–8 May 2026, EGU26-4, https://doi.org/10.5194/egusphere-egu26-4, 2026.

EGU26-125 | ECS | Orals | HS6.5

Flood Dynamics and Frequency Mapping in the Lower Ganges Floodplain in India Using Multi-Temporal Sentinel-1 SAR Observations (2016–2024) 

Mohammad Sajid, Haris Hasan Khan, Arina Khan, and Abdul Ahad Ansari

The Ganges floodplains are among the most flood-prone regions in India, where recurrent inundations cause significant socio-economic and ecological impacts. Understanding the spatial distribution, frequency, and dynamics of flooding is essential for effective floodplain management and enhancing climate resilience. This study examines the flood frequency and spatial extent across a section of the Ganga River floodplains in Bihar, utilising multi-temporal Sentinel-1 Synthetic Aperture Radar (SAR) data spanning the period from 2016 to 2024. Flooded areas were delineated through an optimal threshold-based classification of VH-polarised backscatter images, with threshold values ranging from -19.5 dB to -22.3 dB. Annual flood extents were mapped, and an inundation frequency composite was generated to identify zones experiencing recurrent flooding. The spatial analysis revealed substantial variability in flood occurrence, with extensive inundation observed in low-lying regions. Several areas were inundated in more than 60% of the study years, indicating chronic flood exposure. The decadal analysis revealed that August and September were the peak months for flooding, with some areas remaining inundated for more than one month, which had an adverse impact on both human settlements and agricultural lands. Validation using optical satellite imagery from Sentinel-2 confirmed a 98% accuracy in the SAR-derived flood extent, reinforcing the reliability of the classification method. The temporal flood frequency analysis provides crucial insights into long-term flood dynamics and helps identify hydrologically sensitive zones. Overall, this study highlights the effectiveness of SAR-based monitoring in understanding floodplain behaviour under changing climatic and hydrological conditions, and supports improved flood hazard mapping, hydrodynamic model calibration, and sustainable flood risk management in the Ganges Basin and other monsoon-affected regions.

Keywords: Flood Inundation, Multi-Temporal, Time-Series, Flood Frequency, Sentinel-1 SAR, Ganges River

How to cite: Sajid, M., Hasan Khan, H., Khan, A., and Ansari, A. A.: Flood Dynamics and Frequency Mapping in the Lower Ganges Floodplain in India Using Multi-Temporal Sentinel-1 SAR Observations (2016–2024), EGU General Assembly 2026, Vienna, Austria, 3–8 May 2026, EGU26-125, https://doi.org/10.5194/egusphere-egu26-125, 2026.

Wetlands are very sensitive hydrological ecosystems that are essential for groundwater recharge, flood control, and biodiversity. Climate variability, changed river regimes, and unsustainable anthropogenic pressures are all posing new challenges to their stability. The current work evaluates the two-decade hydro-climatic dynamics of the Haiderpur Wetland (Ganga River, India) by merging optical (Landsat), radar (Sentinel-1), and gridded climate (ERA5, CHIRPS) datasets with GRACE-based groundwater anomalies. On the Google Earth Engine (GEE), processing of time-series Landsat (NDVI, NDWI, LST) and Sentinel-1 (SAR) data to monitor all-weather surface inundation and vegetation structure. To disentangle climatic and anthropogenic drivers, these remote sensing products are statistically correlated against ERA5-Land (Evapotranspiration) and CHIRPS (Precipitation) data, alongside GRACE groundwater anomalies. The findings demonstrated a considerable downward trend in pre-monsoon NDWI and wetland water distribution. This was accompanied by a significant increase in LST and an unexpected increase in NDVI. All-weather Sentinel-1 data validated the drying trend. On the other hand, 'greening' (as indicated by NDVI) in a drying environment suggests a structural shift from native wetland vegetation to more drought-tolerant or invasive terrestrial plants. The study assesses the capability of a multifaceted (optical-radar-climate) GEE strategy to quantify the individual contributions of climatic and anthropogenic factors, while also monitoring wetland development. Furthermore, these findings quantify the hydro-ecological vulnerability of major Ramsar wetlands and emphasize the vital need for coordinated water management to sustain ecosystems in the Ganga River Basin, with far-reaching implications for global wetland conservation.

Keywords: Hydrology, GRACE, Climate Change, SAR, NDVI, NDWI, LST

How to cite: Ansari, A. A., Hasan Khan, H., Khan, A., and Sajid, M.: Hydro-Ecological Vulnerability of  Ganga River Wetland (India): A Multi-Sensor Remote Sensing and GRACE-based Assessment of the Haiderpur Ramsar Site, EGU General Assembly 2026, Vienna, Austria, 3–8 May 2026, EGU26-147, https://doi.org/10.5194/egusphere-egu26-147, 2026.

Floods are the costliest and most frequently occurring natural disasters. One of the key factors in preventing and reducing losses is providing a reliable flood map. However, the uncertainty associated with either flood inundation model or data, specifically the Digital Elevation Model (DEM), may have adverse effects on the reliability of flood stage and inundation maps. Therefore, a systematic understanding of the uncertainty is necessary. In this study, an attempt is made to assess whether models are more susceptible to the uncertainties or the data itself. In order to do this, a SCIFRIM (Slope-corrected, Calibration-free, Iterative Flood Routing and Inundation Model) is employed, utilizing a list of DEM datasets to reconstruct the October 2024 Valencia flood event. The modelled flood extents were validated against those derived from multi-sensor remote sensing data. The Critical Success Index (CSI) was calculated to assess the agreement between observed and modelled flood extents, yielding values of 0.49 and 0.59 for October 30th and 31st, respectively, when combining SCIFRIM and Lidar-DEM. Additionally, a multi-model comparison has been performed between SCIFRIM and CaMa-Flood (Catchment-based Macro-scale Floodplain), HEC-RAS (Hydrologic Engineering Center's River Analysis System), and TUFLOW (Two-dimensional Unsteady FLOW), demonstrating its relevance in terms of outputs (flood extent and stage) and model runtime. The findings demonstrate that the proposed modeling framework offers a reliable approach for flood assessment. It has great potential to support rapid assessment and decision-making in data-scarce regions.

How to cite: Tripathi, G., Sarkar, E., and Biswal, B.: Evaluating Slope-corrected, Calibration-free, Iterative Flood Routing and Inundation Model (SCIFRIM)-based Flood Inundation against multi-satellite observation, EGU General Assembly 2026, Vienna, Austria, 3–8 May 2026, EGU26-436, https://doi.org/10.5194/egusphere-egu26-436, 2026.

Floods are highly dynamic hazards whose spatial extent can change rapidly within hours. Timely and accurate monitoring is essential for early warning, emergency response, and post-disaster assessment. A major challenge in current Earth Observation (EO) based approaches is the difficulty of capturing the complete evolution of a flood event, including its maximum flood extent. This information is often missing due to temporal gaps in Synthetic Aperture Radar (SAR) acquisitions and cloud cover in optical imagery. Missing the peak extent limits the accuracy of impact assessments and poses challenges for applications such as parametric insurance, which depend on reliable measurements of flood magnitude. Although daily flood products exist, they are often based on large-scale multi-spectral sensors and struggle during persistent cloud cover as well as with resolution for smaller events, creating an urgent need for a more reliable method for daily flood estimation from higher-resolution SAR datasets. To address these challenges, we propose a novel deep learning framework that fuses EO-based coarse dynamic hydrometeorological data with static geospatial datasets to produce high-resolution daily flood extent maps. Our approach integrates static flood conditioning inputs, including elevation, Height Above Nearest Drainage, Urban Development Area, flow direction, Normalized Difference Vegetation Index, Normalized Difference Built-up Index, soil clay and sand content, and pre-flood SAR and multispectral imagery with dynamic hydrometeorological variables such as daily precipitation and soil moisture. The model adopts a multi-stage vision transformer architecture: encoders extract multi-level latent representations from all inputs, which are then fused using cosine similarity, normalization, and temporal attention mechanisms. A decoder reconstructs high-resolution flood extent, followed by a Gaussian filter to reduce high-frequency noise. The framework is fully supervised using the globally available KuroSiwo flood mask dataset, ensuring transferability across diverse geographic regions and climate zones. In addition, this research provides a complete data preparation workflow that converts flood mask shapefiles into standardized image patch datasets, including a modular input selection interface that removes dependence on inputs included in specific datasets, directly suitable for deep learning training, enabling straightforward implementation and practical applicability. The model is trained and evaluated across three distinct climate zones on multiple continents, demonstrating a robust capability to overcome the temporal limitations of SAR data and cloud-induced gaps in optical observations. Held-out region tests with strict geographic separation to minimize spatial autocorrelation induced data leakage, further ensure unbiased evaluation and true transferability. Preliminary tests across multiple continents yield stable performance, with cross-site metric variations remaining within approximately 5-7 percent. This study introduces the first deep learning framework for daily fine-scale flood extent mapping using purely EO data which are globally accessible, providing a scalable and transferable solution for real-time flood monitoring, disaster management, and potential applications in parametric insurance by improving flood mapping cadence and reliably estimating maximum flood extents.

Keywords: spatio-temporal fusion, vision transformer, high-resolution flood mapping

How to cite: Surojaya, A., Kumar, R., and Dasgupta, A.: DeepFuse2.0: Novel Deep Learning-based Fusion of Satellite-based Hydroclimatic Data and Flood Conditioning Factors for Daily Flood Extent Mapping, EGU General Assembly 2026, Vienna, Austria, 3–8 May 2026, EGU26-1047, https://doi.org/10.5194/egusphere-egu26-1047, 2026.

EGU26-1092 | ECS | Posters on site | HS6.5

Cross-Biome Transferability of SAR-based Flood Mapping with Random Forests 

Paul Christian Hosch and Antara Dasgupta

Fully automated, globally applicable flood-mapping systems must earn user trust, which in turn requires systematic testing across diverse environmental conditions to understand performance stability and a clear understanding of model transferability. While some recent studies have evaluated cross-site performance of flood mapping algorithms, the cross-biome transferability of Random Forest (RF) models for SAR-based flood delineation has not yet been thoroughly evaluated. In this study, we assess how well RF classifiers trained for binary flood detection generalize across biomes using primarily Synthetic Aperture Radar (SAR) data. Our feature stack comprises 14 variables, including 9 SAR-derived features (Sentinel-1 VV and VH backscatter and associated temporal-change metrics) which provide information on the flood-induced land surface changes and 4 contextual predictors such as land cover and topographic indices which influence radar backscatter and help to reduce as well as mitigate uncertainties. Experiments were conducted across 18 flood events distributed equally amongst 6 distinct biomes: (1) Deserts and Xeric Shrublands, (2) Tropical and Subtropical Moist Broadleaf Forests, (3) Temperate Broadleaf and Mixed Forests, (4) Temperate Coniferous Forests, (5) Mediterranean Forests, Woodlands and Scrub, (6) Temperate Grasslands, Savannas and Shrublands. Model transferability is evaluated using a two-level nested cross-validation approach. First, intra-biome performance is established through an inner 3-fold Leave-One-Group-Out Cross-Validation (LOGO-CV), in which models are trained on all but one site within a biome and evaluated on the held-out site iteratively. Second, inter-biome transferability is quantified using an outer 6-fold LOGO-CV, treating each biome as a distinct group. In this setup, models are trained on all biomes except one and evaluated on all sites of the held-out biome. Classification performance is assessed using Overall Accuracy (OA), F1-score, Precision, Recall, and Intersection over Union (IoU), with all experiments repeated across 10 independent iterations to capture model structural and sampling variability.

Preliminary results on select biomes show substantial variation in inter-biome transferability. Notably, in some cases, models transferred between biomes outperform those trained within the same biome. These findings highlight the need for comprehensive biome-level transferability assessments to better understand the capabilities and limitations of RF-based flood mapping under globally diverse conditions, ultimately supporting more transparent and trustworthy flood-mapping products for end users.

How to cite: Hosch, P. C. and Dasgupta, A.: Cross-Biome Transferability of SAR-based Flood Mapping with Random Forests, EGU General Assembly 2026, Vienna, Austria, 3–8 May 2026, EGU26-1092, https://doi.org/10.5194/egusphere-egu26-1092, 2026.

EGU26-1266 | ECS | Posters on site | HS6.5

Cross-Biome Feature Importance Stability Analysis for SAR-based Flood Mapping with Random Forests 

Parisa Havakhor, Paul Hosch, and Antara Dasgupta

Flood mapping using machine learning methods such as Random Forests (RF) requires informed feature engineering and selection. Despite feature-importance rankings across different biomes and land covers varying substantially, the stability of these feature rankings has not been evaluated specifically for RF-based flood delineation. In this study, we investigate the consistency of RF feature-importance rankings in a binary flood-classification task primarily based on Synthetic Aperture Radar (SAR) imagery. The feature stack comprises 14 variables, including 9 SAR-based features, Sentinel-1 VV and VH polarizations and their temporal-change metrics which inform the flood extent identification, and 4 contextual features such as land cover and topographic indices which provide information on backscatter uncertainties. The classification task was conducted across 18 flood events spanning six distinct biomes: (1) Deserts and Xeric Shrublands, (2) Tropical and Subtropical Moist Broadleaf Forests, (3) Temperate Broadleaf and Mixed Forests, (4) Temperate Coniferous Forests, (5) Mediterranean Forests, Woodlands and Scrub, and (6) Temperate Grasslands, Savannas and Shrublands. Three feature-attribution methods were evaluated: (1) Shapley Additive exPlanations (SHAP) provides a game-theoretic framework for feature attribution and is widely recognized for its consistency and interpretability; (2) Mean Decrease in Impurity (MDI), computed during tree growth, is the most commonly used importance metric for RF models; (3) Permutation feature importance (MDA) offers a model-agnostic approach that assesses importance by measuring the reduction in model accuracy when feature values are randomly shuffled. Both feature cardinality and feature correlation, which bias the feature rankings for these algorithms in different ways, were considered during interpretation. All experiments were repeated across 10 independent iterations to account for random variability. We first examined feature-importance rankings independently across the three sub-sample studies within each biome to establish baseline intra-biome variability, followed by quantification of inter-biome variability to assess whether feature-importance patterns transfer across different environmental conditions. Preliminary results across select biomes indicate stable rankings for SAR-based features, with VV and VH event polarizations dominating the decision boundary, while contextual descriptors, particularly terrain indices such as Height Above the Nearest Drainage, exhibit greater variability both within and between biomes. Understanding the transferability of feature-importance patterns and feature stacks across biomes is critical for developing an RF-based flood-mapping pipeline that operates reliably under diverse environmental conditions worldwide and ultimately builds user trust in the resulting products.

How to cite: Havakhor, P., Hosch, P., and Dasgupta, A.: Cross-Biome Feature Importance Stability Analysis for SAR-based Flood Mapping with Random Forests, EGU General Assembly 2026, Vienna, Austria, 3–8 May 2026, EGU26-1266, https://doi.org/10.5194/egusphere-egu26-1266, 2026.

EGU26-1859 | ECS | Posters on site | HS6.5

Detecting Waterlogging in Agricultural Fields in Denmark using High-Resolution PlanetScope Time Series 

Jasper Kleinsmann, Julian Koch, Stéphanie Horion, Gyula Mate Kovacs, and Simon Stisen

Waterlogging in agricultural fields is the condition of temporally inundated areas driven by extreme rainfall, rising groundwater or poor drainage, and has been identified as a major issue by Danish farmers. During the inundation period, plants are deprived of oxygen which negatively affects the root development and leads to decreased yields and grain quality. Additionally, these waterlogged areas are a large source of greenhouse gas (GHG) emissions. The issue is expected to exacerbate under current climate projections through wetter winters and rising groundwater levels in Denmark. Hence, an increased understanding of the spatio-temporal dynamics of waterlogging is required to future-proof the management strategies. The research goals are three-fold: (1) to optimise the detection of waterlogging, (2) to reveal inter- and intra-annual patters across Denmark and (3) to investigate the drivers of waterlogging such as climate, topography and bio-physical conditions. We aim to detect waterlogged areas through a deep learning semantic segmentation approach utilising multi-temporal PlanetScope imagery and nation-wide high resolution elevation data. This approach requires a manually delineated reference dataset to train, validate and test the model which needs to be well-balanced spatially, e.g. covering various soil types, and temporally, e.g. including various illumination conditions. Additionally, we will experiment with various model architectures, backbones and covariate combinations to optimise the segmentation performance. Initial tests using a UNET architecture and building upon a published reference dataset by Elberling et al. (2023), show promising results and lay the foundation for the upcoming model development and extension of the existing reference data.


Elberling, B. B., Kovacs, G. M., Hansen, H. F. E., Fensholt, R., Ambus, P., Tong, X., ... & Oehmcke, S. (2023). High nitrous oxide emissions from temporary flooded depressions within croplands. Communications Earth & Environment, 4(1), 463.


How to cite: Kleinsmann, J., Koch, J., Horion, S., Kovacs, G. M., and Stisen, S.: Detecting Waterlogging in Agricultural Fields in Denmark using High-Resolution PlanetScope Time Series, EGU General Assembly 2026, Vienna, Austria, 3–8 May 2026, EGU26-1859, https://doi.org/10.5194/egusphere-egu26-1859, 2026.

EGU26-2995 | ECS | Orals | HS6.5

SaferSat: The Saferplaces’s  Operational Sentinel-1 Toolbox for Multi-Temporal Flood Extent Mapping, Water-Depth Estimation and Impact Assessment  

Saeid DaliriSusefi, Paolo Mazzoli, Valerio Luzzi, Francesca Renzi, Tommaso Redaelli, Marco Renzi, and Stefano Bagli

Operational flood intelligence for emergency response and insurance, providing a rapid overview of impacted land, population, and economic damages, requires mapping solutions that remain reliable under adverse observational conditions and across diverse landscapes. Although Sentinel-1 SAR provides consistent global, all-weather and day-and-night coverage, automated flood extraction is challenged by speckle noise, land-cover heterogeneity, and confusion between floodwater and permanent low-backscatter surfaces. These limitations highlight the need for approaches that exploit temporal backscatter changes while maintaining global robustness and computational efficiency.

We present SaferSat, a fully automated Sentinel-1 toolbox for flood-extent mapping, water-depth estimation, and impact assessment. SaferSat is part of SaferPlaces (saferplaces.co), a global Digital Twin platform for flood risk intelligence supporting emergency response and insurance applications. Central to the framework is Pr-RWU-Net (Progressive Residual Wave U-Net), a lightweight deep-learning model with 2.6 million trainable parameters, designed to detect flood-induced backscatter changes using VV-polarized SAR imagery. The model uses a three-channel input; pre-event VV, post-event VV, and their radiometric difference, enhancing inundation sensitivity while mitigating VH instability for global deployment.

SaferSat provides end-to-end processing: automated data retrieval, multi-date flood inference, and Maximum Flood Extent generation. To reduce SAR ambiguities, it generates auxiliary layers: a vegetation mask for SAR "blind spots" and a low-backscatter anomaly mask for permanent dark features. Flood extent layers are integrated with the FLEXTH model and GLO-30 or local high-resolution LiDAR DTMs for water-depth reconstruction. The system also analyzes acquisition patterns to predict short-term revisit opportunities. Impact assessment intersects flood extents with JRC GHS-POP and ESA WorldCover datasets.

The Pr-RWU-Net model was trained on the S1GFloods dataset, containing 5,360 paired pre- and post-event Sentinel-1 GRD images across 42 flood events from 2016–2022. Binary flood masks were generated via semi-automated thresholding and expert quality control. Evaluation on the test split achieved an IoU of 90.0%, F1-score 94.6%, Recall 95.6%, Precision 93.8%, and overall accuracy 96.6%.

Operational applicability was demonstrated on three 2025 flood events: Romania, Pakistan, and France. SaferSat flood extents closely matched SAR manual driven flood references (IoU 89–92%) and CEMS products (IoU 85–88%). Water-depth estimation against a reference hydrodynamic model yielded a MAE of 34–40 cm and correlation R of 0.78–0.82. For a 260 km² flood in Romania, the full processing chain completed in ~3 minutes on a standard CPU, demonstrating suitability for rapid, large-scale deployment.

SaferSat is available globally through SaferPlaces, supporting emergency response and insurance applications. Future developments aim to enhance SaferSat globally via integration of commercial satellite data to reduce revisit time and rapid hydrodynamic modeling to address radar limitations.

How to cite: DaliriSusefi, S., Mazzoli, P., Luzzi, V., Renzi, F., Redaelli, T., Renzi, M., and Bagli, S.: SaferSat: The Saferplaces’s  Operational Sentinel-1 Toolbox for Multi-Temporal Flood Extent Mapping, Water-Depth Estimation and Impact Assessment , EGU General Assembly 2026, Vienna, Austria, 3–8 May 2026, EGU26-2995, https://doi.org/10.5194/egusphere-egu26-2995, 2026.

EGU26-3018 | Posters on site | HS6.5

Advancing Flood Forecasting in Large River Basins Using Multi-Mission Satellite Data: the EO4FLOOD project 

Angelica Tarpanelli and the EO4FLOOD Team

Floods are among the most destructive natural hazards worldwide, causing severe impacts on human health, ecosystems, cultural heritage and economies. Over the past decades, both developed and developing regions have experienced increasing flood-related losses, a trend that is expected to intensify under climate change due to shifts in precipitation patterns and the frequency of extreme events. In many large river basins, particularly in data-scarce regions, flood forecasting remains highly uncertain because of limited in situ observations and complex hydrological and hydraulic dynamics.

EO4FLOOD is an ESA-funded project aimed at demonstrating the added value of advanced Earth Observation (EO) data for improving flood forecasting at regional to continental scales. The project focuses on the integration of multi-mission satellite observations with hydrological and hydrodynamic modelling frameworks to support flood prediction up to seven days in advance, with an explicit treatment of uncertainty.

A key outcome of EO4FLOOD is the development of a comprehensive and openly available EO-based dataset designed to support flood modelling and forecasting studies. The dataset covers nine large and hydrologically complex river basins worldwide, selected to represent a wide range of climatic, physiographic and anthropogenic conditions, and characterized by limited or heterogeneous availability of ground-based observations. It integrates high-resolution satellite products from ESA and non-ESA missions, including precipitation, soil moisture, snow variables, flood extent, water levels and satellite-derived river discharge.

Within EO4FLOOD, these EO datasets are combined with hydrological and hydraulic models, enhanced by machine learning techniques, to improve flood prediction skill and to better quantify predictive uncertainty in data-scarce environments. The project also investigates the role of human interventions, such as reservoirs and land-use changes, in modulating flood dynamics across the selected basins.By making this multi-variable EO dataset publicly available, EO4FLOOD aims to support the broader hydrological community in testing, benchmarking and developing flood modelling and forecasting approaches in challenging large-basin settings. The project provides a unique opportunity to explore the potential and limitations of EO-driven flood forecasting and contributes to advancing the use of satellite observations for global flood risk assessment and management.

How to cite: Tarpanelli, A. and the EO4FLOOD Team: Advancing Flood Forecasting in Large River Basins Using Multi-Mission Satellite Data: the EO4FLOOD project, EGU General Assembly 2026, Vienna, Austria, 3–8 May 2026, EGU26-3018, https://doi.org/10.5194/egusphere-egu26-3018, 2026.

            Water security in the Chi River Basin is critical for the agricultural economy and ecosystem stability of Yasothon Province, Thailand. However, effective spatiotemporal monitoring of water surface dynamics is frequently hindered by persistent cloud cover during the monsoon season, limiting the utility of traditional optical remote sensing. This study addresses this challenge by developing a robust Multi-Sensor Deep Learning Fusion system that integrates Synthetic Aperture Radar (SAR) and optical satellite imagery to ensure continuous observation capabilities.

            We employ a U-Net convolutional neural network architecture, selected for its high boundary precision and efficiency with limited training datasets. The model is trained on a fused six-channel input configuration, combining Sentinel-1 SAR data (weather-independent) with Sentinel-2 optical bands (RGB), augmented by the Normalized Difference Water Index (NDWI) and Normalized Difference Vegetation Index (NDVI). This multi-modal approach enhances feature extraction, allowing for the accurate differentiation of open water from floating vegetation and flooded agricultural lands in complex transition zones.

            The study analyzes the hydrological cycle of 2022, capturing distinct drought, flood, and post-flood conditions. To ensure hydrological validity, the model’s segmentation outputs are not merely visually assessed but are quantitatively validated against ground-truth water level data from the E.20A gauge station in Kham Khuean Kaeo District. By establishing a precise Stage-Area Relationship, this research demonstrates a scalable, cost-effective framework for flood risk assessment and water capital estimation, offering a resilient solution for river basin management in cloud-prone tropical regions.

How to cite: Pruekthikanee, P.: Multi-Sensor Deep Learning Fusion for Spatiotemporal Water Surface Monitoring in the Yasothon Province's Chi River Basin, Thailand, EGU General Assembly 2026, Vienna, Austria, 3–8 May 2026, EGU26-4154, https://doi.org/10.5194/egusphere-egu26-4154, 2026.

EGU26-5752 | ECS | Orals | HS6.5

Satellite-Enhanced Flood Modelling for the Niger River Basin using a Synergy of Hydrological Modelling and Earth Observation Data 

Shima Azimi, Alexandra Murray, Connor Chewning, Cecile Kittel, Henrik Madsen, Fan Yang, Maike Schumacher, and Ehsan Forootan

Accurate water cycle representation in data-scarce and flood-prone regions like the Niger River Basin demands stronger integration between remote sensing and hydrological modelling. Spanning ten water-stressed nations, this basin faces critical challenges under climate change, requiring robust water-budget assessments to guide resilience strategies. We employ DHI’s Global Hydrological Model (DHI-GHM) to simulate key hydrological components of the regional water cycle. Model outputs for surface and root-zone soil moisture (SSM and R-ZSM) and terrestrial water storage (TWS) are systematically compared against satellite observations (GRACE/GRACE-FO and multiple soil moisture products) to identify discrepancies and enhance the understanding of regional hydrological behavior. A near real-time SSM data assimilation scheme is implemented to enhance spatiotemporal accuracy of surface and top-soil interactions, particularly beneficial in the flood-sensitive Inner Niger Delta. Post-assimilation hydrological outputs are coupled with the CaMa-Flood surface hydraulic model to simulate inundation dynamics, enabling improved flood prediction and supporting risk management. Finally, we pursue two-way coupling of hydrological and hydrodynamic models by integrating river flow–storage feedbacks to advance flood forecasting and sustainable water-resources planning. 

How to cite: Azimi, S., Murray, A., Chewning, C., Kittel, C., Madsen, H., Yang, F., Schumacher, M., and Forootan, E.: Satellite-Enhanced Flood Modelling for the Niger River Basin using a Synergy of Hydrological Modelling and Earth Observation Data, EGU General Assembly 2026, Vienna, Austria, 3–8 May 2026, EGU26-5752, https://doi.org/10.5194/egusphere-egu26-5752, 2026.

EGU26-5862 | ECS | Orals | HS6.5

Refining global wetland characterization using an unsupervised, wetness-based dynamic framework 

Yang Li, Nandin-Erdene Tsendbazar, Kirsten de Beurs, Lassi Päkkilä, and Lammert Kooistra

Existing global wetland datasets and monitoring approaches emphasizepersistent inundation, while intermittent inundation and waterlogged states—especially where vegetation is present—are underrepresented or of lower accuracy. This leads to inaccurate estimates of greenhouse gas emissions from carbon-rich systems (e.g., peatlands). Meanwhile, the predominance of annual mapping limits the capture of intra-annual variability, further reinforcing these inaccuracies and obscuring sub-seasonal disturbances from human activities (e.g., shifts in rice-cropping intensity). This study presents an unsupervised, wetness-driven framework for improving global wetland monitoring that leverages earth observation data streams. For framework development, the OPtical TRApezoid Model is applied to Harmonized Landsat-Sentinel imagery to retrieve surface wetness, followed by wetland delineation using a scene-adaptive grid-based thresholding algorithm. This framework is applied to 824 globally distributed 0.1° grid cells encompassing 9,781 land-cover-labeled sites and 134 sites with daily wet–dry labels across 28 Ramsar wetlands, and validated for spatial delineation, thematic, and temporal accuracy. Comparative analysis employs Dynamic World, the first global 30 m wetland map with a fine classification system (GWL_FCS30), and the modified Dynamic Surface Water Extent algorithm (DSWE). Our framework achieved moderate spatial delineation accuracy with F1 of 0.64 (recall 0.75, precision 0.56), comparable in F1 to Dynamic World and with higher recall than DSWE and GWL_FCS30. It delivered the highest temporal accuracy (F1 0.72; precision 0.81; recall 0.64) and improved thematic accuracy for vegetated wetland, reducing omission with modest commission. The proposed wetland monitoring framework enables more accurate targeted policy interventions.

How to cite: Li, Y., Tsendbazar, N.-E., de Beurs, K., Päkkilä, L., and Kooistra, L.: Refining global wetland characterization using an unsupervised, wetness-based dynamic framework, EGU General Assembly 2026, Vienna, Austria, 3–8 May 2026, EGU26-5862, https://doi.org/10.5194/egusphere-egu26-5862, 2026.

EGU26-6114 | ECS | Orals | HS6.5

Evidential Deep Learning for Uncertainty-Aware Global Flood Extent Segmentation 

Chi-ju Chen and Li-Pen Wang

Flood extent mapping from satellite imagery plays a critical role in disaster response and flood risk management, particularly as flood events become more frequent and severe under a changing climate. At its core, the task involves classifying each pixel in an optical satellite image as flooded or non-flooded. Recent deep learning-based segmentation models have demonstrated strong performance at the global scale. However, despite their accuracy, most existing approaches provide deterministic predictions and offer limited information on the reliability of individual pixel-level outputs. This lack of uncertainty information constrains their operational applicability, especially in high-risk scenarios where models may exhibit overconfident but incorrect predictions.

To address this limitation, we extend a global flood extent segmentation framework by explicitly incorporating uncertainty quantification. Specifically, an Evidential Deep Learning (EDL) approach is integrated into a UNet++ architecture within the ml4floods framework, enabling simultaneous prediction of flood extent and associated pixel-wise uncertainty. Within the EDL formulation, network outputs are interpreted as evidence and parameterised using a Beta distribution, providing a principled estimate of predictive uncertainty. Furthermore, total uncertainty is decomposed into aleatoric and epistemic components, allowing clearer interpretation of whether uncertainty arises from data ambiguity or from limited model knowledge.

The proposed approach is evaluated using the extended WorldFloods global flood dataset. Preliminary results indicate that the EDL-enhanced model maintains promising segmentation performance while producing informative uncertainty maps. Elevated uncertainty is consistently observed in misclassified regions and along land-water boundaries, where optical signals are inherently ambiguous. These results demonstrate that uncertainty estimates offer valuable insight into model reliability and support operational decision-making by highlighting areas that require closer inspection. In practice, uncertainty-guided triage can help prioritise expert review and resource allocation, focusing attention on regions where decision risk is highest.

How to cite: Chen, C. and Wang, L.-P.: Evidential Deep Learning for Uncertainty-Aware Global Flood Extent Segmentation, EGU General Assembly 2026, Vienna, Austria, 3–8 May 2026, EGU26-6114, https://doi.org/10.5194/egusphere-egu26-6114, 2026.

EGU26-6180 | ECS | Orals | HS6.5

 The capabilities of virtual gauging stations in satellite monitoring of water bodies 

Ildar Mukhamedjanov and Gulomjon Umirzakov

Remote sensing technologies provide effective tools for monitoring and assessing the state of inland water bodies, enabling extraction of various hydrological parameters from satellite observation. Central Asian and some African countries are currently implementing practical programs aimed at mitigating water scarcity and improving the management of transboundary water resources. Rivers and their tributaries flowing across national boundaries require continuous monitoring to support early warning of droughts and floods at the basin scale.

Conventional ground-based hydrological stations are traditionally used to measure water level, estimate daily river discharge, and support hydrological forecasting. However, limitations related to accessibility, data-sharing restrictions, and the high cost of installation and maintenance often constrain their spatial coverage and long-term operation.  Virtual gauging station (VGS) represents a complementary remote-sensing approach, providing time series derived from the long-term satellite image archives. A VGS is defined as a free-shaped polygon on the map used to analyze data within the borders of this polygon and collect observations based on the requirements. Currently, VGS applications primarily rely on optical satellite imagery from Sentinel-2, Landsat-4, -5, -7, -8, -9 missions to estimate water surface area (WSA) using spectral water index (MNDWI, AWEI or AWEIsh). Variations in WSA serves as a proxy for surface water availability and river dynamics. 

In addition, VGS can be used to enrich satellite altimetry-based water level (H) time series. For this purpose, the VGS polygon is calibrated using reference altimetric observations obtained from open-access data source (e.g. SDSS, DAHITI, Hydroweb). Calibration involves estimating the parameters of a regression model describing the functional relationship between water level and water surface area.  The resulting values can finally be integrated into hydrological models to support short-term river discharge forecasting. Thus, VGS provides continuous hydrological information independent of ground-based measurements, while optional validation against in-situ observations allows for the assessment of the model uncertainty.  Based on the experimental analysis, optimal placement of VGS polygons is recommended dynamically active river sections that account for annual riverbed displacement, as well as in river reaches located near satellite altimeter ground tracks to improve calibration accuracy.

The experiments demonstrated that correlation between ground truth and forecasted water level values is upper 0,85 and mean absolute error is lower than 0,3 m. The following result has been obtained using linear regression which shows that application of more complex forecasting models could significantly improve the results.

How to cite: Mukhamedjanov, I. and Umirzakov, G.:  The capabilities of virtual gauging stations in satellite monitoring of water bodies, EGU General Assembly 2026, Vienna, Austria, 3–8 May 2026, EGU26-6180, https://doi.org/10.5194/egusphere-egu26-6180, 2026.

EGU26-6408 | ECS | Posters on site | HS6.5

Multisensor Ensemble Mapping of Sub-hectare Ephemeral Surface Water in Kenyan ASALs 

James Muthoka, Pedram Rowhani, Chloe Hopling, Omid Memarian Sorkhabi, and Martin Todd

Ephemeral pans and seasonal ponds in arid and semi-arid lands supply critical water for pastoral and ecological systems, yet are not routinely monitored due to their small size, highly dynamic and spectral confusion with vegetation and shadows. We present and evaluate a multisensor mapping approach to detect sub-0.5 ha surface water bodies and quantify their linkage to rainfall variability to inform decision making.

Our approach fuses Sentinel-1 SAR, Sentinel-2 optical indices and DEM derived covariates within an ensemble classifier (voting of Random Forest, Gradient Boosting, and Decision Tree models). Predictive uncertainty is mapped using ensemble agreement and class probabilities, and we compare SAR-only, optical-only, terrain-only, and fused configurations. Additionally, rain and ephemeral surface water dynamics are modelled using generalised additive models with CHIRPs  and local rain gauge observations to test the lagged relationships in monthly water area anomalies.

Results show the fused model achieves an overall accuracy of 85%, outperforming Sentinel-1, and Sentinel-2 (78% and 72%, respectively). Generalised additive models explain 62% of variance in monthly water area anomalies, with a strong response at 1-3 month lags. These results show multisensor fusion with  quantified uncertainty improves detection of ephemeral surface water and enables estimation of rainfall thresholds and lagged dynamics relevant to pastoral water planning and targeted anticipatory action interventions.

How to cite: Muthoka, J., Rowhani, P., Hopling, C., Memarian Sorkhabi, O., and Todd, M.: Multisensor Ensemble Mapping of Sub-hectare Ephemeral Surface Water in Kenyan ASALs, EGU General Assembly 2026, Vienna, Austria, 3–8 May 2026, EGU26-6408, https://doi.org/10.5194/egusphere-egu26-6408, 2026.

EGU26-6586 | ECS | Posters on site | HS6.5

Do Geospatial Foundation Models Improve SAR-Based Flood Mapping?  

Antara Dasgupta and Moetez Zouaidi

Accurate and timely flood delineation is a cornerstone of disaster response and hydrological risk management. Synthetic Aperture Radar (SAR) is uniquely suited to this task because it operates independently of cloud cover and illumination, yet its interpretation remains challenging due to speckle, terrain effects, vegetation scattering, and ambiguities between flooded and permanent water as well as shadows and smooth surfaces such as tarmac. While deep learning has substantially advanced SAR-based flood segmentation, most existing models are trained from scratch and often struggle to generalize across regions and flood regimes. Recently, geospatial foundation models (GFMs) pretrained on massive satellite archives have shown promise, but their benefits for SAR-based flood mapping remain insufficiently quantified. This paper presents a controlled, large-scale global scale evaluation and benchmarking of a vision-transformer based GFM (NASA IBM Prithvi) against two task-specific segmentation architectures, the SegFormer (hierarchical transformer) and the commonly used U-Net (convolutional neural network), including lightweight variants, for post-event SAR-based flood mapping. All models were trained and evaluated under a standardized pipeline that explicitly addresses extreme class imbalance via stratified negative sampling and weighted loss functions. Training and validation used the expert-annotated Kuro Siwo dataset (43 flood events, 67,490 Sentinel-1 VV/VH tiles), while generalization is assessed on both the in-distribution Kuro Siwo test set and the out-of-distribution Sen1Floods11 hand labelled benchmark dataset. Results show that stratified negative sampling (controlling how many background-only tiles are shown to the model in each training epoch) increases precision by approximately 6% and mean Intersection-over-Union (mIoU) by about 7% relative to no sampling, while stabilizing training loss dynamics. On the in-distribution data, all architectures reach similar performance (mIoU ≈ 0.82), indicating that well-designed task-specific models remain competitive with GFMs. However, under out-of-distribution conditions, the foundation model Prithvi (mIoU 0.768) closely matches the performance of the SegFormer (mIoU 0.772) and clearly outperforms the U-Net (mIoU 0.712), highlighting the robustness of transformer-based representations when transferring across datasets. Pretraining on optical imagery yields only modest gains for SAR (+3.4% mIoU), suggesting that architectural inductive biases and data handling matter more than cross-modal pretraining. Notably, lightweight GFM variants achieve comparable accuracy with up to 94% fewer parameters, demonstrating strong potential for operational deployment. Scene-level analysis reveals that CNNs suppress scattered false alarms due to the neighborhood contextualization but miss large, continuous floods, while transformers preserve spatial coherence yet overpredict along complex boundaries and scattered surface water ponding, especially near permanent water bodies. Findings demonstrate that while SAR-based flood mapping accuracy requires a combination of appropriate model architectures and class imbalance-aware training, rather than foundation-scale pretraining alone. However, for spatial and statistical transfer to out of distribution datasets, GFMs offer substantial advantages and provide above-average performance for unseen cases, even without localized fine-tuning.

How to cite: Dasgupta, A. and Zouaidi, M.: Do Geospatial Foundation Models Improve SAR-Based Flood Mapping? , EGU General Assembly 2026, Vienna, Austria, 3–8 May 2026, EGU26-6586, https://doi.org/10.5194/egusphere-egu26-6586, 2026.

EGU26-6617 | ECS | Posters on site | HS6.5

SARFlood: A Web-Based, Cloud-Native Platform for Automated and Optimized ML-based SAR Flood Mapping    

Patrick Wilhelm, Paul Hosch, and Antara Dasgupta

Synthetic Aperture Radar (SAR) imagery offers weather-independent observation capabilities critical for monitoring flood events. However, SAR-based flood detection workflows typically require specialized software, local computational resources, and expert knowledge in remote sensing. This work presents SARFlood, a web-accessible application that automates the complete SAR flood detection pipeline using the OpenEO platform. SARFlood is built on a Flask backend architecture designed for accessibility and reproducibility. Users interact with the system through a web interface that guides them through case study creation, including Area of Interest (AOI) definition via shapefile upload, event date specification, and optional ground truth data integration. The application implements OpenEO OAuth 2.0 authentication using the device code flow, enabling secure access to the Copernicus Data Space Ecosystem (CDSE) backend without requiring users to manage API credentials locally. Session-based project management allows users to track processing progress in real-time through a status reporting system that monitors each pipeline stage. Data acquisition is performed server-side via OpenEO, while feature engineering processors execute locally. The data acquisition module fetches multiple data sources through a unified OpenEO interface: pre-event and post-event Sentinel-1 VV and VH imagery, Digital Elevation Models (DEM) with automatic source fallback (FABDEM, Copernicus 30m/90m), and ESA WorldCover land cover classification. The OpenStreetMap water body features and the FathomDEM are acquired via their own APIs/websites. A caching system prevents redundant API calls for previously acquired datasets, significantly reducing processing time for iterative analyses, while keeping licensing in mind so only users who are logged in and have the according license will be able to access the cached files. The processing pipeline computes a comprehensive feature stack for flood detection. SAR derivatives include intensity bands, VV/VH polarization ratios, and change detection metrics computed in decibel space to enhance flood signal discrimination. Topographic features encompass slope and Height Above Nearest Drainage (HAND) derived from the DEM, as key indicators of flood susceptibility. Flow direction calculations use an expanded bounding box to determine the extended HAND computation domain to address edge artifacts, finally cropped to the original AOI during band compilation, ensuring computationally efficient and accurate flow routing. Additionally, stream burning is implemented to improve drainage network delineation. Further, contextual features include Euclidean Distance to Water and rasterized land cover classification. Users can currently upload ground truth shapefiles (e.g., Copernicus EMS), which are automatically rasterized and compiled into the output stack, enabling supervised classification workflows.  

SARFlood includes integrated sampling and training modules. Multiple strategies such as Simple Random, Stratified, Generalized Random Tessellation Stratified, and Systematic Grid sampling are supported. The training module implements Random Forest classification with Leave-One-Group-Out Cross-Validation across multiple case studies, hyperparameter optimization via Bayesian search, and feature importance assessment through Mean Decrease Impurity, permutation importance, and SHAP values. The platform-, data- and model-agnostic design principles used in developing SARFlood, support open science and FAIR practices in the geoscience community. By combining web accessibility with robust feature engineering and machine learning integration, SARFlood provides researchers with a reproducible platform for generating uncertainty-aware flood labels lowering barriers to use. 

How to cite: Wilhelm, P., Hosch, P., and Dasgupta, A.: SARFlood: A Web-Based, Cloud-Native Platform for Automated and Optimized ML-based SAR Flood Mapping   , EGU General Assembly 2026, Vienna, Austria, 3–8 May 2026, EGU26-6617, https://doi.org/10.5194/egusphere-egu26-6617, 2026.

EGU26-7132 | ECS | Orals | HS6.5

Monitoring Freshwater Bodies over the Past 40 Years Using Synthetic Monthly Sentinel-2 MSI Imagery  

Federica Vanzani, Patrice Carbonneau, Simone Bizzi, Martina Cecchetto, and Elisa Bozzolan

In the last decade rapid advancements in remote sensing have opened new frontiers in our ability to monitor freshwater bodies dynamics at the global scale. Most works have taken advantage of the long time series of Landsat constellations (30 m resolution) relying on spectral indices to identify water. Recently, much progress has also been made in the development and use of deep learning models capable of explicit semantic classification of river water, lake water and sediment bars, based on Sentinel-2 (S2) MSI imagery (10 m resolution). In this work, we present an approach that seeks to extend these existing, trained, fluvial landscape classification models to Landsat data in order to observe long-term water and morphological shifts in rivers and lakes. Rather than explicitly re-training the models with Landsat data and labour-intensive manual label data, we apply a domain transfer approach to generate synthetic S2 MSI imagery from Landsat inputs. This approach has the advantage that the training of deep learning domain transfer models only requires synchronous Landsat and Sentinel data and thus obviates the need for manual labels.

The results show that, when using these synthetic images, river water, lake water and sediment bars are classified with an F1 score of 0.8, 0.94, 0.65 respectively, which represents a decrease of ca. 10% for river water and 20% for sediment with respect to real S2 imagery. By adopting this integrated approach, we are therefore able to monitor, for the first time, lake water, river water and sediment bars at 10 m resolution, over a 40-year period, integrating both synthetic S2 and real S2 acquisitions through a single, fluvial landscape segmentation model. Classification obtained from median monthly images can then be aggregated at the yearly or multi-yearly scale to delineate river or lake water fluctuations, and active channels (river water plus sediment bars) trajectories, from specific freshwater bodies to the global scale.

How to cite: Vanzani, F., Carbonneau, P., Bizzi, S., Cecchetto, M., and Bozzolan, E.: Monitoring Freshwater Bodies over the Past 40 Years Using Synthetic Monthly Sentinel-2 MSI Imagery , EGU General Assembly 2026, Vienna, Austria, 3–8 May 2026, EGU26-7132, https://doi.org/10.5194/egusphere-egu26-7132, 2026.

EGU26-7320 | ECS | Posters on site | HS6.5

Evaluating multimodal optical and SAR learning strategies for flood and surface water delineation 

jiayin xiao, zixi li, and fuqiang tian

Flood and surface water mapping from satellite observations remains challenging due to the complementary yet heterogeneous characteristics
of optical and synthetic aperture radar (SAR) data. While deep learning has achieved promising results, existing studies are often evaluated on
isolated datasets or focus on a single modality, limiting their comparability and operational relevance. In this study, we conduct a large-scale and systematic evaluation of optical, SAR, and combined optical–SAR learning strategies for flood and surface water mapping across multiple public satellite benchmarks. Using a common training and evaluation protocol, we compare lightweight convolutional networks and large pretrained vision models under single-modality and multimodal settings. The analysis reveals that attention-based multimodal fusion consistently improves water delineation accuracy on most datasets, while model capacity and preprocessing choices play a critical role in balancing missed detections and false alarms. On global-scale benchmarks, moderately sized backbones coupled with dedicated fusion mechanisms achieve robust performance without relying on extremely large models.These findings provide practical guidance for selecting architectures and fusion strategies in operational flood mapping and establish a reproducible benchmark for future optical and SAR studies.

How to cite: xiao, J., li, Z., and tian, F.: Evaluating multimodal optical and SAR learning strategies for flood and surface water delineation, EGU General Assembly 2026, Vienna, Austria, 3–8 May 2026, EGU26-7320, https://doi.org/10.5194/egusphere-egu26-7320, 2026.

EGU26-7998 | Orals | HS6.5

Ten years of floods across Europe mapped from space with reconstructed water depths  

Andrea Betterle and Peter Salamon

Floods are among the most deadly and destructive natural disasters. Improving our understanding of large-scale flood dynamics is crucial to mitigating their dramatic consequences. Unfortunately, systematic observation-based datasets—especially featuring flood depths—have been lacking.

This contribution presents advancements in developing an unprecedented catalogue of satellite-derived flood maps across Europe from 2015 onwards. Results are based on the systematic identification of floods in the entire Sentinel-1 archive at 20 m spatial resolution as provided by the Global Flood Monitoring component of the Copernicus Emergency Management Service. Using a novel algorithm that accounts for terrain topography, flood maps are enhanced and provided with water depth estimates—a critically important information for flood impact assessments.

The resulting dataset represents a significant step towards the creation of a global flood archive. It provides new tools for interpreting flood hazards on large scales, with substantial implications for flood risk reduction, urban development planning, and emergency response.

How to cite: Betterle, A. and Salamon, P.: Ten years of floods across Europe mapped from space with reconstructed water depths , EGU General Assembly 2026, Vienna, Austria, 3–8 May 2026, EGU26-7998, https://doi.org/10.5194/egusphere-egu26-7998, 2026.

EGU26-8292 | Posters on site | HS6.5

Modelling wetland resilience to climate change and anthropogenic impacts. 

Patricia Saco, Rodriguez Jose, Breda Angelo, Eric Sandi, and Steven Sandi

Coastal wetlands provide a wide range of ecosystem services, including shoreline protection, attenuation of storm surges and floods, water quality improvement, wildlife habitat and biodiversity conservation. These ecosystems have been observed to sequester atmospheric carbon dioxide at rates significantly higher than many other ecosystems, positioning them as promising nature-based solutions for climate change mitigation.  However, projections of coastal wetland conditions under sea-level rise (SLR) remain highly variable, owing to uncertainties in environmental factors as well as the necessary simplifications embedded within the wetland evolution modelling frameworks. Assessing wetland resilience to rising sea levels and the effect of anthropogenic activities is inherently complex, given the uncertain nature of key processes and external influences. To enable long-term simulations that span extensive temporal and spatial scales, models must rely on a range of assumptions and simplifications—some of which may significantly affect the interpretation of wetland resilience.


Here we present a novel eco-hydro-geomorphological modelling framework to predict wetland evolution under SLR. We explore how accretion and lateral migration processes influence the response of coastal wetlands to SLR, using a computational framework that integrates detailed hydrodynamic and sediment transport processes. This framework captures the interactions between physical processes, vegetation, and landscape dynamics, while remaining computationally efficient enough to support simulations over extended timeframes. We examine several common simplifications employed in models of coastal wetland evolution and attempt to quantify their influence on model outputs. We focus on simplifications related to hydrodynamics, sediment transport, and vegetation dynamics, particularly in terms of process representation, interactions between processes, and spatial and temporal discretisation. Special attention is given to identifying modelling approaches that strike a balance between computational efficiency and acceptable levels of accuracy. We will present recent model results to assess the resilience of coastal wetland to SLR on several sites around the world and will discuss new results to assess the effect of human interventions and infrastructure on wetland resilience.

How to cite: Saco, P., Jose, R., Angelo, B., Sandi, E., and Sandi, S.: Modelling wetland resilience to climate change and anthropogenic impacts., EGU General Assembly 2026, Vienna, Austria, 3–8 May 2026, EGU26-8292, https://doi.org/10.5194/egusphere-egu26-8292, 2026.

EGU26-9354 | ECS | Orals | HS6.5

L-band InSAR to complement SAR inundation mapping under vegetation 

Clara Hübinger, Etienne Fluet-Chouinard, Daniel Escobar, and Fernando Jaramillo

Wetland inundation dynamics are key for understanding flood regulation, ecosystem functioning and greenhouse gas emissions. Synthetic Aperture Radar (SAR) can map water extent independent of cloud cover and can partly penetrate vegetation, particularly at L-band. Many SAR inundation products rely primarily on intensity thresholding and indicators such as specular reflection and double-bounce scattering. However, these approaches can underestimate inundation extent in densely vegetated wetlands where volume scattering can obscure the water signal. Here we demonstrate how L-band interferometric SAR (InSAR) can complement intensity-based inundation mapping under vegetation by exploiting phase differences between repeat SAR acquisitions. Using ALOS PALSAR-1 and PALSAR-2, together providing a nearly two-decade observational archive, we show that L-band InSAR can capture inundation dynamics in tropical floodplain wetlands, such as the Atrato floodplain (Colombia) and Amazon várzea floodplains (e.g., along the Río Pastaza). In the Atrato floodplain, the InSAR-derived flooded vegetation extent shows pronounced seasonal variability, ranging from ~500 to >1500 km² during 2007–2011. Comparison with existing L-band SAR inundation products yields ~70% overall agreement, while InSAR consistently detects broader inundated extents in densely vegetated floodplain areas where intensity-based thresholding underestimates inundation. This complementarity among methodologies is particularly relevant for inundation extent data products from the NASA–ISRO NISAR mission, which are expected to rely largely on SAR backscatter thresholding. Our results highlight the value of integrating InSAR-derived information to strengthen wetland inundation monitoring under vegetated canopies.

How to cite: Hübinger, C., Fluet-Chouinard, E., Escobar, D., and Jaramillo, F.: L-band InSAR to complement SAR inundation mapping under vegetation, EGU General Assembly 2026, Vienna, Austria, 3–8 May 2026, EGU26-9354, https://doi.org/10.5194/egusphere-egu26-9354, 2026.

EGU26-9758 | ECS | Orals | HS6.5

Hydrologically-Informed DTM Super-Resolution for Rapid Flood Depth Estimation 

Sandro Groth, Marc Wieland, Christian Geiß, and Sandro Martinis
Reliable estimation of flood depths from satellite-derived inundation extent information critically depends on the spatial resolution and hydrological consistency of the underlying digital terrain model (DTM). Accurate, very high–resolution DTMs are typically not publicly available, difficult to access within the time constraints of rapid mapping, and lack consistent coverage. Although open-access DTMs such as the Forest and Buildings removed Copernicus DEM (FABDEM) provide global coverage, their coarse spatial resolution often fails to represent important small-scale terrain features that control flow paths, slopes, and local water accumulation. To address these limitations, this study proposes a deep learning framework for DTM super-resolution that combines low-resolution DTMs with optical satellite imagery by integrating hydrological knowledge into the training process to force the reconstruction of relevant topographic features for improved flood inundation depth estimation.

The proposed approach employs a residual channel attention network (RCAN) enhanced with optical satellite imagery as auxiliary input to upscale low-resolution terrain data. Central to the methodology is a collaborative hydrologic loss function that guides network optimization beyond elevation-based accuracy. In addition to the mean absolute elevation error (MAE), the loss integrates slope deviation and flow direction disagreement to focus the learning on the reconstruction of terrain features that are directly relevant for hydrologic applications.

Unlike other super-resolution approaches, which are often using downscaled versions of the low-resolution inputs to learn super-resolved DTMs, the proposed framework was trained on a growing set of aligned patches of real-world globally available low-resolution elevation data, optical satellite imagery, and high-resolution reference DTMs derived from airborne LiDAR. Model performance is evaluated against conventional interpolation and standard super-resolution baseline architectures, including convolutional neural networks (CNN) as well as geospatial foundation models (GFM). To assess the practical impact on flood mapping, the super-resolved DTMs are tested on a set of real-world flood events in Germany by using the well-known Flood Extent Enhancement and Water Depth Estimation Tool (FLEXTH) to derive inundation depth metrics.

Results show that integrating DTMs derived using hydrologically guided super-resolution into flood depth tools can lead to more accurate flood depth estimates compared to low-resolution or other super-resolved inputs. The added hydrologic loss significantly improves the preservation of slopes and flow directions while maintaining elevation accuracy.

Overall, the presented framework offers a method to generate hydrologically meaningful high-resolution DTMs from globally available low-resolution inputs to benefit flood depth estimation in areas, where no high-resolution terrain information is available.

How to cite: Groth, S., Wieland, M., Geiß, C., and Martinis, S.: Hydrologically-Informed DTM Super-Resolution for Rapid Flood Depth Estimation, EGU General Assembly 2026, Vienna, Austria, 3–8 May 2026, EGU26-9758, https://doi.org/10.5194/egusphere-egu26-9758, 2026.

Flash flood disasters have increased by more than 50% in the first 20 years of the 21st century compared to the last 20 years of the 20th century. Monitoring and understanding flood events might lead to better mitigation of this natural hazard. Using SAR and SAR interferometry (InSAR) proved to be a useful tool for mapping flooded areas due to the lower backscatter or decorrelation of the SAR signal in an open-water environment. In Arid regiem, flash flood water is rapidly drained by evaporation or percolation, often before the satellite image is acquired. To overcome this challenge, we propose in this study to use the InSAR coherency loss, created by surface changes during a flash-flood, to map the runoff path and utilize it to quantify peak discharge (Qmax).

We focus on the Ze’elim alluvial fan along the western shore of the Dead Sea, Israel, an arid area affected by seasonal flash floods a few days a year. We use 34 interferograms of X-band (COSMO-SkyMed/TerraSAR-X) SAR data, covering 25 runoff events between 2017 and 2021, and upstream hydrological gauge data. To consider the natural decorrelation processes, we calculate a normalized coherence (ϒn) term, using the average coherence of the study area and the average coherence of a stable reference area, identified by differential LiDAR measurements.

We find a strong correlation between gn and the logarithm of the peak discharge (Qmax). However, the method is limited by a minimal peak discharge—where energy is too low to change the surface—and maximal total water volume—where decorrelation is saturated. The method may provide tools for reconstructing runoff data in arid areas where historical SAR data is available, and for monitoring in difficult access areas or where hydrological stations are sparse or damaged.

How to cite: Nof, R.: Estimating Flash Flood Discharge in Arid Environments Using InSAR Coherence: A Case Study of the Ze’elim Fan, Dead Sea, EGU General Assembly 2026, Vienna, Austria, 3–8 May 2026, EGU26-11948, https://doi.org/10.5194/egusphere-egu26-11948, 2026.

EGU26-12249 | Orals | HS6.5 | Highlight

Lessons Learned from Remote Sensing of River Ice for Flood Early Warning 

Arjen Haag, Tycho Bovenschen, Elena Vandebroek, Athanasios Tsiokanos, Ben Balk, and Joost van der Sanden

Rivers in regions with cold winters can seasonally freeze up. River ice breakup and freeze-up processes can lead to river ice jams, which are a major contributor to flood risk in cold regions (across most of the high latitudes of the northern hemisphere). In Canada, satellite remote sensing is used across the country to provide timely information on the status of river ice. Methods and algorithms to classify various stages of river ice from the Radarsat Constellation Mission (RCM) are available, but the operational implementation of these, especially the integration into larger flood forecasting and early warning systems, requires specific expertise, software and computational resources, and comes with its own set of challenges. In collaboration with various agencies across Canada we have set up operational monitoring systems with the purpose of assisting the daily tasks of forecasters on duty. These have been used in practice over multiple ice breakup and freeze-up seasons, which has highlighted both their usefulness and shortcomings. We will focus on various aspects of such a system and share lessons learned on its design, setup and operational use, as well as a framework to analyse various factors relevant for operational monitoring purposes (e.g. spatiotemporal coverage and latency of the data, critical elements in the support of decision-making relating to floods). In this, we do not shy away from problems and pitfalls, so that others can learn from these. While various challenges remain, this work is a good example of the value in the joint engagement of applied science and end users.

How to cite: Haag, A., Bovenschen, T., Vandebroek, E., Tsiokanos, A., Balk, B., and van der Sanden, J.: Lessons Learned from Remote Sensing of River Ice for Flood Early Warning, EGU General Assembly 2026, Vienna, Austria, 3–8 May 2026, EGU26-12249, https://doi.org/10.5194/egusphere-egu26-12249, 2026.

EGU26-13343 | Posters on site | HS6.5

Operational, national-scale monitoring of river trajectories using satellite imagery  

Elisa Bozzolan, Marco Micotti, Elisa Matteligh, Alessandro Piovesan, Federica Vanzani, Patrice Carbonneau, and Simone Bizzi

The global degradation of river ecosystems and the growing impacts of flood hazards have highlighted limitations in current river management approaches. In Europe, the Water Framework and Flood Directives promote integrated, catchment-scale assessments of hydromorphological conditions and flood risk. Such integration is essential for sustainable management. Planform dynamics and river bed aggradation/incision, for example, can modify channel conveyance and compromise flood mitigation measures, whereas granting more space to rivers can both enhance ecological quality and reduce flood peaks.

In this context, the availability of long-term satellite archives and advances in computational and machine-learning methods enable large-scale, high spatiotemporal resolution monitoring of large and medium river systems. However, despite this potential, the operational adoption of satellite-based river monitoring remains limited due to data complexity, interdisciplinary requirements, and the lack of harmonised computational infrastructures.

Thanks to a collaboration between industry, public institutions and the university, we developed a methodology to systematically map monthly water channel, channel width, sediment bars and vegetation dynamics, testing the results on the full archive of Sentinel-2 (10 m resolution) for medium-large Italian rivers (active channel > 30m - i.e. 3 Sentinel-2 pixels). In this talk, I will outline the applied methodology, discuss its applicability at national scale with Sentinel-2 data, and show how the generated products can better inform river habitat mapping, river conservation practices, and flood risk assessments by supporting consistent national scale geomorphic trajectories identification.

How to cite: Bozzolan, E., Micotti, M., Matteligh, E., Piovesan, A., Vanzani, F., Carbonneau, P., and Bizzi, S.: Operational, national-scale monitoring of river trajectories using satellite imagery , EGU General Assembly 2026, Vienna, Austria, 3–8 May 2026, EGU26-13343, https://doi.org/10.5194/egusphere-egu26-13343, 2026.

Flood inundation mapping has become increasingly critical as climate change intensifies the frequency and severity of flooding worldwide, amplifying risks to populations, infrastructure, and ecosystems. Recent advances in Earth Observation (EO) have shown unprecedented opportunities to monitor flood dynamics across large spatial scales.. However, significant challenges remain due to the limitations of single-sensor approaches. While multispectral imagery provides rich semantic information, it is frequently constrained by cloud cover during flood events. Conversely, Synthetic Aperture Radar (SAR) offers all-weather capability but suffers from signal ambiguity in complex terrains and urban environments. Effectively integrating these heterogeneous modalities therefore remains a challenge, particularly with limited labelled flood event data.

In this study, we propose a deep learning-based cross-modal fusion framework that leverages the representational capacity of Remote Sensing Foundation Models (RSFMs). High-level feature embeddings are extracted from Sentinel-1 and Sentinel-2 multispectral imagery by initializing modality-specific encoders with pretrained weights from state-of-the art multi-modal foundation models, providing a robust and semantically aligned feature space despite limited task-specific training data 

To integrate the multi-modal representations, we adopt a Gated Cross-Modal Attention mechanism, which adaptively modulates the information flow from each modality based on their observation reliability. Specifically, the model is trained to prioritise SAR features to ensure spatial continuity under cloud-obscured conditions, while simultaneously leveraging richer optical semantics to disambiguate SAR signals, correcting for example false detections caused by radar shadowing or smooth impervious surfaces. 

To assess the generalisation of the proposed framework across diverse regions and sensor conditions, we trained and evaluated our model using a comprehensive dataset compiled from publicly available benchmarks, including Kuro Siwo and WorldFloods. Our framework not only establishes a new benchmark for all-weather flood monitoring but also demonstrates the critical role of remote sensing foundation models in overcoming the limitations of traditional, data-hungry fusion approaches.

How to cite: Chen, Y. C. and Wang, L. P.: Integrating SAR and Multispectral Satellite Observations for Flood Inundation Mapping: A Cross-Modal Fusion Framework Leveraging Foundation Models and Gated Attention Mechanism, EGU General Assembly 2026, Vienna, Austria, 3–8 May 2026, EGU26-13502, https://doi.org/10.5194/egusphere-egu26-13502, 2026.

EGU26-13888 | ECS | Posters on site | HS6.5

A Comparative Assessment of Threshold-Based and Machine Learning Methods for Flood Detection 

Jawad Mones, Saeed Mhanna, Landon Halloran, and Philip Brunner


Flood mapping plays a key role in understanding hazard impacts, supporting emergency response, and guiding long-term risk planning. Remote sensing is now widely used in flood studies because it offers low-cost data, avoids the need for dangerous field surveys, and provides rapid observations over large areas. Despite these advantages, comparative research remains limited, particularly with respect to differences among flood-mapping algorithms, such as machine-learning versus threshold-based approaches, and the performance of optical versus radar sensors. This research addresses these gaps by applying multiple flood-mapping methods to the same flood event in Pakistan, and then comparing their performance with respect to a validation benchmark to provide a clearer insight into how data selection and methodological design influence flood detection outcomes

This study evaluates four distinct methods for mapping floods using multi-sensor satellite data. To ensure a fair comparison, three unsupervised machine-learning approaches including a synergetic Sentinel-1 and Sentinel-2 workflow, a method integrating harmonized Landsat–Sentinel data with radar, and a daily MODIS imagery technique were tested alongside a traditional Otsu thresholding baseline. All four were tested on the same 2025 Pakistan flood event, characterized by intense monsoon rains and flash flooding across regions such as Sindh and Punjab in mid- to late-2025.  The flood maps were then validated against UNOSAT flood reports for this event, where UNOSAT’s flood extent closely matches the results produced by the Sentinel-1/Sentinel-2 workflow, which yields the most conservative flood extent among the tested methods.

 Larger flood extents from some methods, especially the Sentinel-1 Otsu thresholding approach, include areas not clearly flooded in optical images. This happens because SAR backscatter also responds to wet soil and saturated vegetation, which a simple threshold can misclassify as water, leading to flood overestimation.

Overall, the results show that flood maps are not just different versions of the same answer, they reflect different satellite data and the utilized algorithms detect flooding. Approaches that combine multiple data sources with machine-learning strike a better balance, producing flood extents that are both spatially consistent and physically realistic. This indicates that multi-sensor, machine-learning–based methods are better suited for operational flood monitoring than simple thresholding, which is too sensitive to surface noise and often overestimates flooding. 

How to cite: Mones, J., Mhanna, S., Halloran, L., and Brunner, P.: A Comparative Assessment of Threshold-Based and Machine Learning Methods for Flood Detection, EGU General Assembly 2026, Vienna, Austria, 3–8 May 2026, EGU26-13888, https://doi.org/10.5194/egusphere-egu26-13888, 2026.

EGU26-16468 | ECS | Orals | HS6.5

Multidecadal Changes and Trends in Global River Positions 

Elad Dente, John Gardner, Theodore Langhorst, and Xiao Yang

Rivers play a central role in shaping the Earth's surface and ecosystems through physical, chemical, and biological interactions. The intensity and locations of these interactions change as rivers continuously migrate across the landscape. In recent decades, human activity and climate change have altered river hydrology and sediment fluxes, leading to changes in river position, or migration. However, a comprehensive perspective on and understanding of these recent changes in the rate of river position shifts is lacking. To address this knowledge gap, we created a continuous global dataset of yearly river positions and migration rates over the past four decades and analyzed trends. The global annual river positions were detected using Landsat-derived surface water datasets and processed in Google Earth Engine, a cloud-based parallel computation platform. The resulting river extents and centerlines reflect the yearly permanent position, corresponding to the rivers’ location during base flow. This approach improves the representation of position changes derived from geomorphological rather than hydrological processes. To robustly analyze river position changes across different patterns and complexities and at large scales, we developed and applied a global reach-based quantification method.

Results show that while alluvial rivers maintain stable positions in certain regions, others exhibit trends in the rates of position change. For instance, the Amazon Basin, which has experienced significant deforestation and hydrological modifications, has shown increased rates of river position change in recent decades, directly modifying active floodplains. In this presentation, we will discuss the advantages, limitations, and applications of the global yearly river position dataset, offer insights into the changing rates of river position, and highlight current and future impacts on one of Earth’s most vulnerable hydrologic systems.

How to cite: Dente, E., Gardner, J., Langhorst, T., and Yang, X.: Multidecadal Changes and Trends in Global River Positions, EGU General Assembly 2026, Vienna, Austria, 3–8 May 2026, EGU26-16468, https://doi.org/10.5194/egusphere-egu26-16468, 2026.

Satellite-based surface water monitoring is essential for traking the spatiotemporal dynamics of global water bodies. However, most existing systems rely on a single mission or sensor modality, constraining both accuracy and temporal coverage. To overcome these limitations, we propose a multi-mission data fusion framework that integrates SAR Sentinel-1 and optical Sentinel-2 observations. Two U-Net convolutional neural networks were trained independently on the S1S2-Water dataset: one using Sentinel-1 sigma-nought backscatter (VV/VH) and the other using Sentinel-2 RGB and NIR bands, with terrain slope incorporated as ancillary input in both models. Predictive uncertainty is quantified via Monte Carlo dropout embedded within the networks, modeling pixel-wise predictions as Gaussian distributions. These probabilistic outputs are subsequently fused using a Bayesian framework and refined through sensor-specific exclusion masks. Evaluation across 16 geographically diverse test sites demonstrates that the fused probabilistic predictions achieve an overall IoU of 89%, highlighting the synergistic benefits of uncertainty-aware, multi-sensor integration. Furthermore, we show that model evaluation restricted to cloud-free optical imagery introduces substantial bias, limiting applicability for near-real-time monitoring. The proposed framework improves temporal availability, robustness, and reliability, advancing multi-satellite approaches for global surface water monitoring.

How to cite: Hassaan, M., Festa, D., and Wagner, W.: SAR and optical imagery for dynamic global surface water monitoring: addressing sensor-specific uncertainty for data fusion, EGU General Assembly 2026, Vienna, Austria, 3–8 May 2026, EGU26-17524, https://doi.org/10.5194/egusphere-egu26-17524, 2026.

EGU26-18308 | Orals | HS6.5

RESCUE_SAT project: Leveraging Satellite Data to Improve Large‑Scale Flood Modeling 

Elena Volpi, Stefano Cipollini, Luciano Pavesi, Valerio Gagliardi, Richard Mwangi, Giorgia Sanvitale, Irene Pomarico, Aldo Fiori, Deodato Tapete, Maria Virelli, Alessandro Ursi, and Andrea Benedetto

The RESCUE_SAT project was launched as part of the “Innovation for Downstream Preparation for Science” (I4DP_SCIENCE) programme (Agreement no. 2025‑2‑HB.0), funded by the Italian Space Agency (ASI), with the goal of enhancing the performance of the RESCUE model through the integration of satellite data. RESCUE is a large‑scale inundation model that enables probabilistic flood‑hazard assessment over large areas by preserving computational efficiency while explicitly representing hydrologic-hydraulic processes along the full drainage network. Primarily based on digital terrain models (DTMs), RESCUE is a hybrid framework that combines a geomorphology-based representation of the river network with simplified hydrological and hydraulic formulations to estimate water levels and inundation extents. The central challenge of the RESCUE_SAT project is to deliver a flood‑modelling tool capable of providing a more reliable and detailed representation of both large‑scale hydrological behavior and local hydraulic processes, including flow interactions with structures such as levees, bridges and dams which are currently not explicitly represented in RESCUE. To this purpose, the Synthetic Aperture Radar (SAR) imagery acquired by the ASI’s COSMO-SkyMed constellation is processed using interferometric techniques to derive high-resolution digital elevation models (DEMs), reaching meter-scale resolution. Starting from high-resolution DEMs derived from COSMO-SkyMed satellite imagery, RESCUE_SAT enables the identification of the locations of structures that interacts with flow propagation, supporting their systematic mapping. Once the infrastructures have been identified and parameterized from the high-resolution DEM, the DEM is resampled and processed to a computationally advantageous coarser resolution, while the detected infrastructure elements are directly integrated into the hydrological–hydraulic model.

How to cite: Volpi, E., Cipollini, S., Pavesi, L., Gagliardi, V., Mwangi, R., Sanvitale, G., Pomarico, I., Fiori, A., Tapete, D., Virelli, M., Ursi, A., and Benedetto, A.: RESCUE_SAT project: Leveraging Satellite Data to Improve Large‑Scale Flood Modeling, EGU General Assembly 2026, Vienna, Austria, 3–8 May 2026, EGU26-18308, https://doi.org/10.5194/egusphere-egu26-18308, 2026.

EGU26-18518 | Orals | HS6.5

Automated Detection of Flood Events from CYGNSS: Observing Flood Evolution Along Propagating Tropical Waves  

Zofia Bałdysz, Dariusz B. Baranowski, Piotr J. Flatau, Maria K. Flatau, and Clara Chew

Flooding is a major natural hazard across the global tropics. Although flood occurrence is shaped by rainfall characteristics—including duration, frequency, and intensity—accurate prediction remains challenging. A key limitation is the lack of reliable, long-term flood databases that capture events across all spatial scales and durations, hindering a clear understanding of how rainfall variability translates into flood onset. This limitation is particularly critical in the Maritime Continent, where extreme rainfall is common and many small, short-lived, yet severe, floods remain undocumented. To address this limitation, we investigate whether a relatively new approach, global navigation satellite system reflectometry (GNSS-R), can help close this observational gap.

In this work, we assess whether data from the CYGNSS small-satellite constellation can be used to identify small- to regional-scale floods, including short-lived events. Our study focuses on Sumatra, an island within the Maritime Continent that is frequently affected by such hazards. A joint analysis of CYGNSS inundation estimates and two independent flood databases allowed us to evaluate how CYGNSS measurements can be used for flood detection. Three detailed case studies demonstrate that CYGNSS provides an unprecedented ability to monitor day-to-day changes in surface water extent, including floods at the urban scale. Specifically, we show that CYGNSS-derived inundation anomalies can clearly capture evolution of a flooding event, with the largest signature one day after known flood initiation. A systematic analysis of 555 flood events over a 21-month period enabled us to identify characteristic patterns in inundation anomalies that reliably distinguish flood events from non-flooding conditions, through the definition of an inundation-anomaly threshold and a maximum distance between CYGNSS detections and reported flood locations. We established that CYGNSS observations within 15 km not-only significantly differ from base-line conditions, but they allow tracking day-to-day flood dynamics as well.

The proposed methodology is transferable and can be applied to establish flood-inundation thresholds for any region within the global tropics, enabling automated detection of previously unreported flood events or the study of relationships between extreme precipitation and flood evolution. An example of its application is the automatic detection of flooding from CYGNSS data associated with subseasonal variability in tropical circulation: the passage of multiple convectively coupled Kelvin waves embedded within an active Madden–Julian Oscillation in July 2021. These waves propagated eastward across the Maritime Continent, triggering extreme rainfall and widespread flooding in equatorial Indonesia and East Malaysia. The day-to-day evolution of floods could be observed alongside the propagating waves, with the termination of the MJO coinciding with the cessation of the flood events.

Relying on low-cost small satellites, this approach shows strong potential for future scalability with larger constellations, ultimately improving flood monitoring and advancing our understanding of how rainfall patterns shape flood dynamics across global tropics.

How to cite: Bałdysz, Z., Baranowski, D. B., Flatau, P. J., Flatau, M. K., and Chew, C.: Automated Detection of Flood Events from CYGNSS: Observing Flood Evolution Along Propagating Tropical Waves , EGU General Assembly 2026, Vienna, Austria, 3–8 May 2026, EGU26-18518, https://doi.org/10.5194/egusphere-egu26-18518, 2026.

Accurate long-term monitoring of surface water dynamics in the Niger River and Lake Chad basins is crucial for regional ecological security and sustainable water resource management. However, such monitoring is often hindered by insufficient continuous high-frequency observations—necessary to capture rapid shifts between permanent and seasonal water bodies in semi-arid transition zones—as well as by persistent cloud cover. To address these limitations, we developed a spatio-temporal data fusion framework designed to delineate detailed evolutionary patterns and regime shifts in surface water. Our methodology integrates Sentinel-1 SAR, Sentinel-2 optical imagery, and digital elevation model (DEM) data, adopting a “zoning modeling” strategy to reduce sensor-specific biases and environmental noise, thereby producing annual and seasonal surface water distribution maps. Furthermore, we developed a pixel-level, climate-coupled model based on inundation frequency to quantify changes in the extent, timing, and type of water bodies across a multi-year time series. Integration of these outputs elucidated the spatial heterogeneity of water resources throughout the study region from 2015 to 2024. Validation using randomly distributed reference samples demonstrated strong consistency, with overall accuracy exceeding 90%, confirming the robustness of our framework. Through an ecology-oriented classification scheme, we identified permanent water bodies—largely concentrated in the southern reaches of the Niger River main channel and the central zone of Lake Chad—as serving a “core support” function within the ecosystem. In contrast, seasonal water bodies followed a “dense in the south, sparse in the north” spatial pattern and acted as critical “ecological buffers” for arid northern areas. Notably, seasonal water extent expanded significantly during high-rainfall years such as 2018 and 2022, underscoring its pronounced sensitivity to climatic variability. Compared with current state-of-the-art approaches, the proposed framework enables characterization of high-frequency surface water dynamics and associated ecological interactions as continuous spatio-temporal fields, thereby providing a reliable and scalable tool to inform sustainable watershed management strategies across Africa.

How to cite: Du, L., You, S., Ye, F., and He, Y.: Tracking Dynamic Regimes and Ecological Functions of Surface Water in the Niger-Lake Chad Basins through Multi-Source Fusion (2015–2024), EGU General Assembly 2026, Vienna, Austria, 3–8 May 2026, EGU26-19055, https://doi.org/10.5194/egusphere-egu26-19055, 2026.

EGU26-19963 | ECS | Orals | HS6.5

Development of routine flood mapping using SAR satellite observation for long-term monitoring system in the flood-prone regions, Cambodia 

Chhenglang Heng, Vannak Ann, Thibault Catry, Vincent Herbreteau, Cyprien Alexandre, and Renaud Hostache

Monitoring inland surface water in near-real time is a key challenge in cloud-prone tropical regions.  Recently, Synthetic Aperture Radar (SAR) products have been widely used to detect surface water. Our area of interest, the Tonle Sap Lake region is a complex environment where very large areas and floodplains are partially or fully submerged seasonally. As the population living around the lake strongly rely on the seasonal flooding dynamics for their socio-economic activities and can at the same time be at risk due to extreme flooding events, it is of main importance to develop tools for the monitoring of flooded areas. In this context, we are adopting and evaluating an algorithm which relies on parametric thresholding, and region growing approaches applied over time series of Sentinel-1 (S1) SAR backscatter images (VV and VH). To evaluate the produced water extent maps based on VV and VH polarizations, we used a cross evaluation using multi-sensor products: high-resolution optical data such as Sentinel-2 (S2) and the coarser resolution Sakamoto flood extend derived from MODIS product. The comparison is made using the Critical Success Index (CSI) and Kappa coefficient performance metrics. During the dry season, the VV polarization demonstrated very good performance using S2-derived maps as a reference, with CSI of 0.84 and a Kappa coefficient of 0.91, indicating highly accurate surface water detection. Performance was similar using the Sakamoto product as a reference (CSI=0.87). However, performance dropped during the rainy season, with the VV polarization's CSI decreasing to 0.76 comparing S2, reflecting challenges in detecting water in the extensive flooded vegetation areas. VH polarization consistently overestimated water extent by misclassifying wet vegetation and rice fields. A merge of VV and VH product yielded an intermediate performance, improving water detection in vegetated areas compared to VV alone. This comprehensive, multi-sensor and multi-season assessment clarifies the specific strengths of each S1 polarization, showing VV's superiority for open water mapping, especially in the dry season. It underscores the importance of selecting the appropriate product (VV for open water, merged for total inundation) and considering seasonal context for operational monitoring, thereby demonstrating the algorithm's robustness while also defining its operational limitations.

How to cite: Heng, C., Ann, V., Catry, T., Herbreteau, V., Alexandre, C., and Hostache, R.: Development of routine flood mapping using SAR satellite observation for long-term monitoring system in the flood-prone regions, Cambodia, EGU General Assembly 2026, Vienna, Austria, 3–8 May 2026, EGU26-19963, https://doi.org/10.5194/egusphere-egu26-19963, 2026.

The research focused on developing the framework for assessing marine, nearshore and transitional waters across Ireland and validated for generalization of the framework across at any geospatial scale using remote sensing (RS) products. To the best of authors knowledge, existing most of the studies only have demonstrated for retrieving particular water quality (WQ) indicators like turbidity, salinity or chlorophyll a without in depth validation results. Recently the authors comprehensively reviewed several studies focusing on the RS applications for assessing WQ using computational intelligence techniques (CIT) like machine learning, artificial intelligence, statistical approaches etc. Unfortunately, the reviewed findings reveals that most of the research are questionable in terms of using data transparency, and validation with independent or other geospatial domains applications of the existing developed tools. Therefore, the research aim was to develop a novel framework and validated with independent datasets including new domain(s) adaptation or validation. For developing the framework, to achieve the goal of the research, the study utilized Sentinel-3 (S3) OLCI RS reflectance data. For obtaining RS data, the study utilized S3-OLCI level 3(L3) and level 4 (L4) reflectance data Rhow_1 to Rhow_11 form the Copernicus Marine Services (CMS) repository datasets for 2016 to 2024. To obtain the overall WQ, the research considered 49 (in-situ) EPA, Ireland monitoring sites across various transitional and coastal waterbodies for computing the overall WQ (IEWQI scores) scores using recently developed and widely validated the IEWQI model. After than the RS data prepared and match-up with 49 considering monitoring sites. For predicting IEWQI scores, the research utilized the multi-scale signal processing framework (MSSPF) by following configurations: data augmentations: 2x to 20x, noise level from 0.0001 to 0.05, and data spilled ratios 60-20-20 and 70-20-10, respectively for train, test and validation of 43 CIT models using RS data from 2016 to 2023 both L3 and L4, whereas the 2024 dataset using for testing independent dataset to generalize the model prediction capabilities. Utilizing four identical model performance evaluation metrics, the results reveals that the PyTorchMLP could be effective (train performance : R2 = 0.86, RMSE =0.09, MSE = 0.008, and MAE = 0.067; test performance : R2 = 0.84, RMSE =0.094, MSE = 0.008, and MAE = 0.071; and validation performance : R2 = 0.81, RMSE =0.095, MSE = 0.009, and MAE = 0.074, respectively at 7x augmentation with 0.0001 of noise level for 60-20-20) compared to the 43 CIT models in terms of predicting and validating independent dataset (independent dataset validation performance for 2024 : R2 = 0.62, RMSE =0.164, MSE = 0.026, and MAE = 0.12). Based on the predicted IEWQI scores, the WQ ranked “marginal”, “fair” and “good” categories for Irish waterbodies. The findings of the framework align with the traditional EPA, Ireland monitoring approaches. However, findings of the research reveals that the proposed framework could be effective to monitoring WQ general purposes using RS data across any geospatial resolution.

Keywords: remote sensing; Copernicus database; MSSPF, IEWQI, Ireland.

How to cite: Uddin, M. G., Diganta, M. T. M., Sajib, A. M., Rahman, A., and Indiana, O.: A comprehensive framework for assessing marine, nearshore and transitional waters quality integrating Irish Water quality Index (IEWQI) model from remote sensing products using computational intelligence techniques, EGU General Assembly 2026, Vienna, Austria, 3–8 May 2026, EGU26-20016, https://doi.org/10.5194/egusphere-egu26-20016, 2026.

EGU26-20097 | ECS | Orals | HS6.5

Comprehensive validation of the benefits of multi-sensor flood monitoring 

Chloe Campo, Paolo Tamagnone, Guy Schumann, Trinh Duc Tran, Suelynn Choy, and Yuriy Kuleshov

Multi-sensor methodologies are gaining traction within flood monitoring research, grounded in the rationale that data fusion from diverse sources mitigates uncertainty and improves spatiotemporal coverage. However, these assumed benefits are rarely quantified.

This work aims to comprehensively compare the performances of multi-sensor and single-sensor approaches to understand to what extent increasing the number and variegate data source may improve the detection rate and temporal characterisation of flood events. A multi-sensor flood monitoring approach using AMSR2 and VIIRS data is assessed against each sensor individually and against standard benchmarks in EO-based flood detection (e.g., MODIS and Sentinel-1)  for major flood events in the Savannakhet Province of Laos.

The comparative analysis evaluates multiple metrics. First, detection comparison classifies events as captured by each considered approach, multi-sensor only, each individual sensor only, or missed by all, to directly quantify the improvement attributable to multi-sensor integration. The spatial agreement is assessed between the multi-sensor and single sensor approaches for jointly detected flood events. Additionally, the temporal component is characterized by an examination of the observation frequency, maximum observation gaps, and peak capture timing. Lastly, the various detection outcomes are related to event characteristics, including cloud cover persistence, flood magnitude, duration, and flood type, quantifying the conditions under which a multi-sensor approach performs optimally.

How to cite: Campo, C., Tamagnone, P., Schumann, G., Duc Tran, T., Choy, S., and Kuleshov, Y.: Comprehensive validation of the benefits of multi-sensor flood monitoring, EGU General Assembly 2026, Vienna, Austria, 3–8 May 2026, EGU26-20097, https://doi.org/10.5194/egusphere-egu26-20097, 2026.

Integrated Monitoring of Lake Garda with Radar, Optical Sensors and In Situ Instruments: Insights from the SARLAKES Project

Virginia Zamparelli1, Simona Verde1, Andrea Petrossi1, Gianfranco Fornaro1, Marina Amadori2,3, Mariano Bresciani2, Giacomo De Carolis2, Francesca De Santi4, Matteo De Vincenzi3, Giulio Dolcetti3, Ali Farrokhi3, Raffaella Frank2, Nicola Ghirardi2,5, Claudia Giardino2, Fulvio Gentilin6, Alessandro Oggioni2, Marco Papetti6, Gianluca Pari7 Andrea Pellegrino2, Sebastiano Piccolroaz3, Tazio Strozzi8, Marco Toffolon3, Maria Virelli7, Nestor Yague-Martinez9, and Giulia Valerio6


1Institute for Electromagnetic Sensing of the Environment (IREA), National Research Council, Naples, Italy

2Institute for Electromagnetic Sensing of the Environment (IREA), National Research Council, Milan, Italy

3Department of Civil, Environmental and Mechanical Engineering (DICAM), University of Trento, Trento, Italy

4Institute for Applied Mathematics and Information Technologies (IMATI), National Research Council, Milan, Italy

5 Institute for BioEconomy (IBE), National Research Council, Sesto Fiorentino, Italy

6Department of Civil, Environmental, Architectural Engineering and Mathematics (DICATAM), University of Brescia, Brescia, Italy

7Italian Space Agency (ASI), Rome, Italy

8GAMMA Remote Sensing, Gümligen, Switzerland

9Capella Space Corp., San Francisco, CA, USA


SARLAKES (SpatiAlly Resolved veLocity and wAves from SAR images in laKES) is a PRIN (Projects of National Interest) project funded in 2022 by the Italian Ministry of University and Research. The project is now in its final phase and is scheduled to end at the beginning of 2026. The project developed a novel, advanced and adaptable tool capable of accurately measuring water dynamics in medium- and large-sized lakes.

A key and innovative aspect of the project is the use of spaceborne Synthetic Aperture Radar (SAR) data, which are widely exploited for routine observation of the marine environments but remain relatively underutilized for lake monitoring. SARLAKES investigated the capability of SAR imagery to retrieve the spatial distribution of wind fields, surface currents, and wind-generated waves in lacustrine environments.

The project considers Lake Garda and Lake Geneva as case studies, with Lake Garda—the largest lake in Italy—selected as the primary test site due to the research group’s long-standing experience and the availability of extensive historical data.

This contribution presents the main results obtained over two years of project activity, with particular emphasis on outcomes from a multidisciplinary field campaign conducted on April 2025. The campaign aimed to reconstruct lake surface currents during a strong wind event in the peri-Alpine Lake Garda region.

The field instrumentation included a wave buoy, an acoustic Doppler current profiler (ADCP), Lagrangian drifters, anemometers, a ground-based radar, fixed cameras, a drone, and a conductivity–temperature–depth profiler. Satellite acquisitions from the COSMO-SkyMed Second Generation and Capella Space SAR sensors, as well as from the optical sensor PRISMA were scheduled over the study area during the campaign. Archive data from Sentinel-1, Sentinel-2, Sentinel-3, Landsat, and COSMO-SkyMed missions were also utilized.

The project demonstrates how the integration of in-situ instrumentation, spatially distributed flow measurements from remote sensing, and hydrodynamic modeling provides a comprehensive and scalable approach to next-generation monitoring of complex lake systems.

How to cite: Zamparelli, V. and the SARLAKES project team: Integrated Monitoring of Lake Garda with Radar, Optical Sensors and In Situ Instruments: Insights from the SARLAKES Project, EGU General Assembly 2026, Vienna, Austria, 3–8 May 2026, EGU26-21000, https://doi.org/10.5194/egusphere-egu26-21000, 2026.

Semi-urban vegetation systems play a critical role in ecosystem stability but are increasingly exposed to flood hazards due to climate variability and rapid land-use change. Accurate flood detection in such system remains challenging because radar backscatter is influenced by complex and mixed scattering mechanisms arising from vegetation, built-up structures, and surface water. Conventional intensity-based flood indices struggle to separate flooded vegetation from non-flooded rough surfaces and tend to miss inundated areas under mixed land-cover conditions. To address these limitations, this study presents a physically interpretable flood detection framework that integrates Synthetic Aperture Radar polarimetric descriptors with a machine learning classifier. The proposed approach utilizes dual-polarized Sentinel-1 SAR data to derive polarimetric features from Stokes parameters and the covariance matrix. Specifically, the Degree of Polarization and Linear Polarization Ratio are combined with eigenvalue-based information to capture changes in both amplitude and polarization state between pre-flood and during-flood conditions. These descriptors are integrated into a novel Flood Index (FI) designed to distinguish flooded urban areas dominated by double-bounce scattering from flooded vegetation characterized by depolarized volume scattering. Unlike commonly used indices such as the Normalized Difference Flood Index (NDFI) or VH/VV ratio, the proposed FI exploits polarization behaviour rather than relying solely on backscatter intensity. A Random Forest classifier is trained on the proposed FI using a tile-based sampling strategy to handle class imbalance between flooded and non-flooded pixels. The framework is evaluated across three flood events representing diverse geographic and land-cover conditions: the 2019 Typhoon Hagibis flood in Japan, the 2023 Yamuna River flood in India, and the 2023 Larissa flood in Greece. Model performance is assessed using multiple accuracy metrics, including F1 score, Intersection over Union (IoU), False Positive Rate (FPR), and False Negative Rate (FNR). Results demonstrate that the Random Forest model trained on the proposed Flood Index consistently outperforms threshold-based Otsu methods and NDFI across all study areas. The approach achieves F1 scores ranging from 0.81 to 0.86 and IoU values between 0.70 and 0.76, while maintaining a relatively low False Negative Rate (0.09-0.17), that is critical for minimizing missed flooded areas in disaster response applications. Sensitivity and ablation analyses further confirm the robustness of the Flood Index to speckle noise and highlight the complementary contribution of its individual components. Overall, the proposed framework offers a transferable and computationally efficient solution for flood mapping in semi-urban vegetation systems using widely available dual-polarized SAR data. The results highlight its potential for scalable flood monitoring and rapid damage assessment across regions with heterogeneous land-cover conditions.

How to cite: Adhikari, R. and Bhardwaj, A.: SAR polarimetry-based machine learning method for flood detection in semi-urban vegetation systems, EGU General Assembly 2026, Vienna, Austria, 3–8 May 2026, EGU26-21063, https://doi.org/10.5194/egusphere-egu26-21063, 2026.

EGU26-21507 | ECS | Posters on site | HS6.5

Flood Susceptibility Mapping with GFI 2.0 and Artificial Intelligence Models 

Jorge Saavedra Navarro, Ruodan Zhuang, Caterina Samela, and Salvatore Manfreda

Floods are among the most damaging natural hazards, motivating the development of rapid and scalable tools for floodplain mapping across multiple return periods and for post-event assessment. The Geomorphic Flood Index (GFI) is widely used to identify flood-prone areas using topographic information, but it can exhibit reduced reliability under complex hydraulic conditions—particularly near confluences where backwater controls water levels—and it may systematically overestimate inundation extents when used as a binary classifier.

This study advances the GFI framework by explicitly accounting for backwater effects at river confluences and along tributary junctions. In parallel, to reduce the intrinsic overestimation of GFI-derived floodplains, we test a suite of Artificial Intelligence (AI) classifiers—Random Forest, XGBoost, and Neural Networks—trained through a multi-parametric formulation that combines GFI with auxiliary predictors, including precipitation, lithology, land use, and slope. The approach is evaluated across multiple Italian catchments, using satellite-derived inundation and hydrodynamic simulations as independent benchmarks. Model performance is quantified against the baseline GFI approach using a standard threshold-based binary classification using an optimal cutoff.

The proposed framework aims to improve post-event flood delineation under observational constraints (e.g., satellite data gaps due to cloud cover, vegetation, or imaging limitations) and to provide a computationally efficient surrogate for extending hydrodynamic information to additional return periods or large basins where full numerical modelling is impractical. Preliminary results indicate that Random Forest provides the most robust performance across study sites. Incorporating backwater effects yields clear gains at confluences, primarily by reducing omission errors and improving the representation of hydraulically controlled inundation patterns. Moreover, the AI-based correction substantially mitigates the overestimation typically associated with standard GFI mapping, resulting in floodplain delineations that are more consistent with complex hydrodynamic processes and suitable for scalable flood hazard applications.

How to cite: Saavedra Navarro, J., Zhuang, R., Samela, C., and Manfreda, S.: Flood Susceptibility Mapping with GFI 2.0 and Artificial Intelligence Models, EGU General Assembly 2026, Vienna, Austria, 3–8 May 2026, EGU26-21507, https://doi.org/10.5194/egusphere-egu26-21507, 2026.

EGU26-21622 | ECS | Orals | HS6.5

Mapping and modeling coastal flood dynamics using remote sensing and hydrodynamic models 

Giovanni Fasciglione, Guido Benassai, Gaia Mattei, and Pietro Patrizio Ciro Aucelli

This study presents an integrated and multidisciplinary methodology for investigating coastal flooding and morphodynamic processes in low-lying coastal environments, with a comparative application to two geomorphologically distinct Mediterranean coastal plains: the Volturno Plain and the Fondi Plain. The methodological framework combines high-resolution topographic and bathymetric datasets, aerial remote sensing, sedimentological analyses, statistical wave climate assessment, numerical hydrodynamic modelling, and relative sea-level rise scenarios that incorporate both eustatic trends and local vertical land movements. This approach enables a robust evaluation of how differing coastal configurations influence flooding susceptibility under extreme marine conditions.

For both study areas, the topographic baseline was derived from 2 m resolution LiDAR-based Digital Terrain Models, subsequently refined using site-specific datasets. In the Volturno Plain, extensive GNSS field surveys were conducted along the beach between Volturno and Regi Lagni river mouths. In the Fondi Plain, DTM refinement relied on aerial drone surveys carried out over the beach sector between the Canneto and Sant’Anastasia river mouths. Photogrammetric processing of aerial imagery allowed the generation of high-resolution surface models, which were integrated with the existing LiDAR DTM to enhance the depiction of subtle morphological features critical for flood propagation.

Sedimentological characterization was performed to constrain morphodynamic responses. Granulometric samples were collected along cross-shore transects at elevations ranging from −1.5 m to +2 m. Grain-size distribution analyses supported the calibration and interpretation of sediment transport and wave dissipation processes within numerical models.

Bathymetric modelling was based on high-precision single-beam echo-sounder surveys, with depth data corrected for tidal variations using official tide-gauge records. Emerged and submerged datasets were merged into continuous topo-bathymetric models, ensuring consistency in vertical reference systems and numerical stability.

Marine storms were identified through the analysis of offshore buoy records using a Peak Over Threshold approach. Storm events were classified into five classes using their Storm Power Index calculated by combining significant wave height and event duration. Representative events were selected as boundary conditions for coupled hydrodynamic simulations performed with Delft3D and XBeach. Simulations were run for future scenarios based on high-emission IPCC projections (SSP 5-8.5), integrating local sea-level rise, local subsidence rates, and highest tidal and surge levels.

A comparative analysis of the simulation outcomes highlights marked differences between the two coastal plains. The Volturno Plain results highly prone to inundation, with storm surges overtopping dune systems and propagating inland due to low elevations, local subsidence, and limited effectiveness of existing coastal defenses. Conversely, the Fondi Plain exhibits significantly reduced flood penetration. The presence of a wide bar system, coupled with efficient coastal defense structures, promotes substantial dissipation of incoming wave energy. As a result, even under intense storm conditions, inundation remains confined to a narrow coastal strip immediately landward of the beach.

Overall, the comparative methodological application demonstrates how coastal morphology, sedimentological properties, and defense systems critically control flood dynamics. The proposed framework provides a transferable and decision-oriented tool for assessing coastal vulnerability and supporting adaptation strategies in heterogeneous low-lying coastal settings under climate change pressure.

How to cite: Fasciglione, G., Benassai, G., Mattei, G., and Aucelli, P. P. C.: Mapping and modeling coastal flood dynamics using remote sensing and hydrodynamic models, EGU General Assembly 2026, Vienna, Austria, 3–8 May 2026, EGU26-21622, https://doi.org/10.5194/egusphere-egu26-21622, 2026.

EGU26-21631 | ECS | Posters on site | HS6.5

Assessment of Multi-Mission Satellite Altimetry GDR L2 Products for River Water Surface Elevation in the Ganga Basin 

Barun Kumar, Shyam Bihari Dwivedi, and Shishir Gaur

Precise monitoring of water surface elevation (WSE) in data-deficient areas such as the Ganga River stretch is essential for hydrological modelling, flood prediction, and comprehensive water resource management. This study introduces a comprehensive evaluation framework for Level-2 Geophysical Data Records (GDR L2) derived from various satellite altimetry missions, including Sentinel-3A/B, Sentinel-6A, Jason-3, and SWOT Nadir, validated against in-situ gauge stations from the Central Water Commission (CWC) across a range of hydrological conditions. The process includes advanced geographical analysis. Gaussian-process Kriging interpolation generates continuous longitudinal WSE profiles across strategically placed virtual stations; rigorous outlier detection employs interquartile range (IQR) and Hampel filters; bias correction employs dry-season median alignment to a common orthometric datum; and Kalman filter smoothing effectively reduces measurement noise while preserving critical hydrological signal dynamics.

Comprehensive performance evaluations employ co-located time series analysis, scatter plots, and flow duration curves (FDCs), with seasonal stratification distinguishing monsoon high-flow variability from stable non-monsoon baseflow conditions. The evaluation stresses physically significant parameters based on Kling-Gupta Efficiency (KGE) and RMSE. Sentinel-6A is the strongest performer in all situations with high non-monsoon accuracy (KGE 0.894, RMSE 0.089 m) and monsoon performance (KGE 0.57, RMSE 3.08 m) despite turbulent flow issues, but SWOT Nadir's processing potential is limited by specific hooking artifacts. During non-monsoon periods, measurement reliability is consistently 2-4 times higher. This proven multi-mission system demonstrates satellite altimetry as an operationally viable method for WSE retrieval in major braided rivers, allowing for accurate rating curve generation and discharge computation. In future machine learning data fusion and hydrodynamic modelling can be incorporated to increase basin-scale forecast capabilities.

How to cite: Kumar, B., Dwivedi, S. B., and Gaur, S.: Assessment of Multi-Mission Satellite Altimetry GDR L2 Products for River Water Surface Elevation in the Ganga Basin, EGU General Assembly 2026, Vienna, Austria, 3–8 May 2026, EGU26-21631, https://doi.org/10.5194/egusphere-egu26-21631, 2026.

EGU26-21734 | Posters on site | HS6.5

Evaluating Copernicus Global Flood Monitoring (GFM) Service trade-offs in near-real-time flood mapping 

Shagun Garg, Ningxin He, Sivasakthy Selvakumaran, and Edoardo Borgomeo

Near-real-time satellite-based flood maps support disaster risk management and emergency response. One widely used service is the Global Flood Monitoring (GFM) product of the Copernicus Emergency Management Service, launched in 2021 and based on Sentinel-1 Synthetic Aperture Radar (SAR) data. The GFM service combines three flood-mapping algorithms: pixel-based thresholding, region-based approaches, and change-detection techniques, merged using a majority-voting scheme to generate the final flood extent product. Another key strength of the GFM service is its rapid analysis, providing flood maps within approximately five hours of satellite image acquisition through a fully automated processing chain. As the product is increasingly relied upon by practitioners and decision-makers, there is a growing need to assess its accuracy and robustness. Understanding false alarms and missed detections is critical for improving the reliability and usability of the service.


In this study, we systematically compare GFM flood maps across twenty real-world flood events using high-resolution reference datasets. To ensure temporal consistency, the GFM-derived flood maps are generated using Sentinel-1 acquisitions from the same day as the reference observations. Spatial agreement between datasets is quantified using the Intersection-over-Union metric.


Our results suggest that the GFM service performs well for large, extensive flood events but degrades for smaller, localized ones. Many of the observed errors come not from flood detection itself, but from inaccuracies in the reference water layer - while surface water is correctly identified, misclassification of permanent or seasonal water bodies leads to false alarms and missed floods. We evaluate the three-underlying flood-mapping algorithms individually for consistent patterns of misdetection or false alarms. In addition, we develop an automated framework to rapidly compare any external flood map with the GFM outputs, enabling near-instant evaluation of agreement and error patterns. 


This framework provides practical insights into where and why the GFM services achieve successes and failures and offers continuous validation and iterative improvement of global flood mapping services. 

How to cite: Garg, S., He, N., Selvakumaran, S., and Borgomeo, E.: Evaluating Copernicus Global Flood Monitoring (GFM) Service trade-offs in near-real-time flood mapping, EGU General Assembly 2026, Vienna, Austria, 3–8 May 2026, EGU26-21734, https://doi.org/10.5194/egusphere-egu26-21734, 2026.

EGU26-22077 | Orals | HS6.5

A fully automatic processing chain for the systematic monitoring of surface water using Copernicus Sentinel 1 satellite data: first results of the SCO-CASCADES project. 

Renaud Hostache, Cyprien Alexandre, Chhenglang Heng, Thibault Catry, Vincent Herbreteau, Vannak Ann, Christophe Révillion, and Carole Delenne

Water is essential to life and health of various ecological and social systems. Unfortunately, water is one of the natural resources most impacted by climate change, with increasingly intense hydro-meteorological extremes (floods, droughts, etc.) and growing societal demand. To help manage this vulnerable resource, it is vital to assess and monitor its availability on a regular basis, as well as to track its trajectory over time to better understand the impact of global change on it. Surface water (lakes, rivers, flood plains, etc.) represents an important component of total water resources, and it is of primary importance to monitor it to better understand and manage the consequences of climate change. Surface water resources provide populations around the world with essential ecosystem services such as power generation, irrigation, drinking water for humans and livestock, and space for farming and fishing.

In this context, the SCO-CASCADES project implements end-to-end processing chains for satellite Earth observation data, including Sentinel-1 and 2 (S-1 and S-2), in order to provide surface water products (surface water body and inundation depth maps) that will be made available via an interactive platform co-constructed with identified users.

In the first phase of the project a fully automated Sentinel-1 based processing chain has been implemented. This chain is based on automatic multiscale image histogram parameterization followed by thresholding, region growing and chain detection applied on individual, subsequent pairs, and time series of S1 images. This chain enables us to derive various products: i) an exclusion layer identifying areas where water cannot be detected on Sentinel 1 image (e.g. Urban and forested areas), ii) permanent seasonal water body maps, iii) a water body map for each S1 image, iv) an uncertainty map characterizing the water body classification uncertainty, v) an occurrence map providing the number of times (over the time series) each pixel was covered by open water.

Here, we propose to present and evaluate the robustness of the processing chain and the resulting maps produced using multi-year S1 time series over two large scale sites: the Mekong flood plains between Kratie, the Tonle Sap lake and the Mekong Delta, and the Tsiribihina basin in Madagascar. The kappa score obtained from the comparison between S1 and S2-derived maps shows a good agreement yielding CSI and Kappa Cohen scores most of the time higher than 0.7 and sometimes reaching values higher than 0.9.

How to cite: Hostache, R., Alexandre, C., Heng, C., Catry, T., Herbreteau, V., Ann, V., Révillion, C., and Delenne, C.: A fully automatic processing chain for the systematic monitoring of surface water using Copernicus Sentinel 1 satellite data: first results of the SCO-CASCADES project., EGU General Assembly 2026, Vienna, Austria, 3–8 May 2026, EGU26-22077, https://doi.org/10.5194/egusphere-egu26-22077, 2026.

EGU26-1531 | ECS | Orals | HS6.6

From SWOT Reaches to Model Grids: A Global Solution for Hydrologically Consistent Observation–Model Alignment 

Kaushlendra Verma, Simon Munier, Aaron Boone, and Patrick LeMoigne

The Surface Water and Ocean Topography (SWOT) mission provides the first global measurements of river water surface elevation at reach scale, captured through the vector-based SWORD database. While these observations offer unprecedented spatial detail, most large-scale hydrological models represent rivers on gridded routing networks, creating a structural mismatch that limits the direct use of SWOT data in global analyses. A robust and scalable translation between SWORD reaches and model grid cells is therefore essential for enabling SWOT-based hydrology. Here we present a global, confidence-oriented strategy for aligning SWORD reaches with the 1/12° river network of the CTRIP routing model. The method evaluates candidate associations using several hydrologically meaningful criteria, including geographic proximity, upstream area and basin delineation coherence inherited from MERIT-Hydro, reach morphology, and alignment with D8 flow directions. Each pixel receives a confidence category that distinguishes unambiguous single-reach matches from robust or uncertain multi-reach configurations. This classification provides transparent information on mapping quality and identifies locations where model–observation alignment is intrinsically ambiguous. We demonstrate the performance of the method through a global application at 1/12° resolution. The resulting reach-to-grid associations produce spatially coherent river corridors, consistent basin topology, and near-complete coverage across observable rivers. Diagnostics across continents show that the framework performs reliably in challenging systems such as deltas, braided rivers, and multi-thread channels where simpler geometric approaches commonly fail. The final outputs include confidence-tier maps, reach–pixel match tables, and gridded river masks that translate SWOT’s vector observations into hydrologically meaningful model space. These products provide the community with a ready-to-use, reproducible translation layer that supports a wide range of SWOT-based research activities, including large-scale river characterization, network comparison, uncertainty assessment, and future assimilation experiments. The approach enables consistent use of SWOT observations in global hydrology and opens new avenues for connecting reach-scale satellite measurements with continental-scale hydrological understanding.

How to cite: Verma, K., Munier, S., Boone, A., and LeMoigne, P.: From SWOT Reaches to Model Grids: A Global Solution for Hydrologically Consistent Observation–Model Alignment, EGU General Assembly 2026, Vienna, Austria, 3–8 May 2026, EGU26-1531, https://doi.org/10.5194/egusphere-egu26-1531, 2026.

EGU26-3368 | ECS | Posters on site | HS6.6

Validation of Surface Water and Ocean Topography (SWOT) river Water Surface Elevation using in-situ gauges in Finnish rivers 

Harusha Abeynayake, Mohammad J. Tourian, and Ali Torabi Haghighi

Rivers in cold-climate regions are fundamental components of coupled hydrological, cryospheric, and ecological systems by governing water availability, ecosystem functioning, and human activities under strong seasonal constraints. Snow accumulation, river ice processes, and freeze-thaw cycles are major factors for tightly controlling river dynamics, making them highly sensitive to climate variability and change. Consequently, to capture changes in flow, ice conditions, and water levels, systematic river monitoring is essential which enables reliable assessment of hydrological extremes, ecosystem responses, and infrastructure risks. However, river monitoring in cold climate regions remains challenging due to prolonged ice cover, limited accessibility during winter, sensor malfunction under freezing temperatures, harsh environmental conditions, and the complex interaction between hydrological and cryospheric processes that are difficult to observe continuously and at high resolution. Therefore, increasing attention have been gained for novel monitoring approaches that minimize direct physical contact, particularly those based on remote sensing techniques, because they enable spatially extensive, non-intrusive, and continuous observation of river dynamics in cold regions and hard to access environments. In this context, by representing a major milestone as the first wide-swath altimetry mission specifically designed to observe surface water dynamics, the Surface Water and Ocean Topography (SWOT) mission was first launched in December 2022. It provides high-resolution, near-global measurements of water surface elevation (WSE), river width, and surface slope using Ka-band Radar Interferometry (KaRIn), and SWOT significantly advances satellite-based monitoring of rivers, lakes, and reservoirs. In this paper, we assess the validity of WSE derived from RiverSP data of the SWOT mission over major Finnish rivers. WSE is extracted for 14 rivers which are available in SWOT mission and representing diverse hydrological settings, including 08 regulated and 06 unregulated, and is evaluated against observed daily water levels from the nearest in-situ gauging stations. This analysis enhances understanding of the influence of river ice cover on SWOT observations and enables evaluation of the associated quality flags. Temporal in-situ satellite derived water temperature observations before and after the ice season are examined to support interpretation of detected ice-cover and open water period with SWOT observation.

How to cite: Abeynayake, H., J. Tourian, M., and Torabi Haghighi, A.: Validation of Surface Water and Ocean Topography (SWOT) river Water Surface Elevation using in-situ gauges in Finnish rivers, EGU General Assembly 2026, Vienna, Austria, 3–8 May 2026, EGU26-3368, https://doi.org/10.5194/egusphere-egu26-3368, 2026.

EGU26-3842 | ECS | Orals | HS6.6

Beyond Static Priors: Unlocking High-Resolution Dynamic River Networks via a SWOT-Driven Machine Learning Pipeline 

Hamidreza Mosaffa, Louise Slater, Mohammad J. Tourian, Florian Pappenberger, Michel Wortmann, and Hannah Cloke

The advent of the Surface Water and Ocean Topography (SWOT) mission has ushered in a new era of global hydrology, providing unprecedented high-resolution 2D observations of water surface elevation and extent. However, standard processing chains for hydrological applications rely heavily on static a priori databases such as the SWOT River Database (SWORD). This reliance introduces significant biases, as static centerlines fail to capture the morphological dynamism of rivers, and divergent flows such as bifurcations, braided reaches, multi-threaded systems, and artificial canals. This leads to reduced accuracy in hydrological and hydraulic modelling, flood forecasting, and water resources management.

In this study, we present a proof-of-concept workflow that uses the SWOT mission’s Pixel Cloud (PIXC) dataset to generate a high-resolution (~20 m), vector-based river network with flow direction. Moving beyond the constraints of the static SWORD, our approach utilizes SWOT-derived surface-water features as inputs for Random Forest and XGBoost classifiers. The resulting classification undergoes a semi-automated post-processing chain including rasterization, skeletonization, cleaning, and vectorization to reconstruct the network topology, with flow direction inferred directly from SWOT water-surface elevation measurements.

We evaluated this methodology in the Indus River Basin (Pakistan), a system distinguished by its dense network of artificial channels and high flood frequency. Results show that the method identifies missing river segments, divergent channels, and small-scale artificial waterways not represented in existing global river datasets, and extends significantly beyond the SWORD database. This work highlights the potential of SWOT Pixel Cloud data to move beyond static river representations and support dynamic river network generation for hydrological applications. Future efforts will focus on full automation and global scalability, as well as integration with operational hydrological and flood forecasting systems. The proposed framework provides a scalable pathway toward next-generation river network products that better exploit SWOT’s unique observational capabilities.

How to cite: Mosaffa, H., Slater, L., Tourian, M. J., Pappenberger, F., Wortmann, M., and Cloke, H.: Beyond Static Priors: Unlocking High-Resolution Dynamic River Networks via a SWOT-Driven Machine Learning Pipeline, EGU General Assembly 2026, Vienna, Austria, 3–8 May 2026, EGU26-3842, https://doi.org/10.5194/egusphere-egu26-3842, 2026.

In recent years, advances in radar altimetry, particularly Synthetic Aperture Radar (SAR) techniques, have enabled the observation of fine-scale features over coastal oceans and inland water bodies. Since its launch in late 2022, the Surface Water and Ocean Topography (SWOT) mission has provided unprecedented spatial detail and measurement accuracy for resolving water surface gradients. This capability offers a unique opportunity for the timely and repeated monitoring of ungauged rivers and inland water bodies. In this study, SWOT Level-2 Lake and Pixel Cloud (PIXC) products are employed to monitor lakes, ponds, and reservoirs across Taiwan. Field validation conducted at 14 small ponds and 12 major reservoirs demonstrates that SWOT is capable of capturing water surface elevations and their temporal variations with sub-meter accuracy over mission cycles 3–37. Furthermore, reprocessing the PIXC data through clustering within predefined water masks improves the accuracy to better than 10 cm. These results indicate that SWOT provides a valuable alternative perspective on hydrological parameters and has significant potential to support future water resources monitoring and management.

How to cite: Tseng, K.-H.: Validation of Water Surface Elevation Estimated by SWOT Pixel Cloud Product in Taiwan, EGU General Assembly 2026, Vienna, Austria, 3–8 May 2026, EGU26-5144, https://doi.org/10.5194/egusphere-egu26-5144, 2026.

EGU26-5456 | Orals | HS6.6

Assessing and Enhancing SWOT Hydraulic Visibility and Slopes in Narrow Rivers Using High-Resolution Models 

Thomas Ledauphin, Guillaume Piasny, Pierre-André Garambois, Léo Pujol, Amanda Samine Montazem, Kevin Larnier, Louis Suchet, Maxime Azzoni, Jérôme Maxant, and Hervé Yesou

Evaluating the accuracy of SWOT water surface elevation (WSE) observations, including, slopes, and hydrodynamic signals, is crucial to determine their usefulness for river network monitoring and modeling.  The spatially distributed nature of SWOT measurements enables the characterization of local hydraulic signatures, which carry unprecedented information for improving hydraulic-hydrological models, enabling finer inferences of bathymetry and monitoring of river morphological evolution, which could support infrastructure management.

Ledauphin et al. (2025) demonstrated, using a comprehensive in situ dataset over the Franco-German Rhine (130–350 m wide), that SWOT elevation accuracy can exceed expectations for large rivers. Analyses of products from PIXC to reach-averaged scale confirm SWOT’s ability to detect fine-scale hydraulic variations driven by longitudinal hydraulic controls and dynamic phenomena such as flood wave propagation and associated water surface slope.

Building on these results, this study evaluates SWOT’s ability to capture hydraulic signatures over narrower rivers (20–80 m wide) located in France’s Grand Est region, with a focus on the Moselle River (25–80 m) This river, which includes diverse channel morphologies (e.g., step-pool sequences, meanders) as well as hydraulic structures (weirs, dams), benefits from long-term in situ gauge records complemented by field data, such as LiDAR bathymetric surveys and WSE profiles measurements. This rich dataset enabled to build and calibrate a high-resolution 1D HEC-RAS hydraulic model (Piasny G. 2023), providing simulated water surface elevation profiles for a range of discharges used as an independent reference for satellite-based validation. Complementary analysis were also performed on narrower rivers such as the Meurthe (20–40 m) and the Sarre (20–30 m, including a major flood event in May 2024).

Using data from the nominal science orbit, this study investigates SWOT performance close to the limits of its design specifications for narrow rivers. In this context, the use of official SWOT river products becomes challenging, as WSE profiles can be noisy, and multi-pass acquisitions introduce temporal variability in data quality that is difficult to filter with conventional methods, requiring advanced techniques. To overcome these limitations, hydraulic-preserving filtering methods specifically designed for SWOT data are applied to improve local slope estimation (Montazem et al., 2025; Larnier et al., 2025).  In the absence of full RiverSP coverage, the analysis here relies on PIXC pixel-cloud classes water-near-land and open-water, spatially filtered using a narrow riverbed polygon and existing flags, then projected onto the river centerline to produce a 1D product.

The impact of these processing and filtering methods is evaluated at fine scale through comparison with in situ measurements taken during the SWOT acquisitions and with WSE profiles from 1D hydraulic models at equivalent discharges. The use of high-resolution hydraulic model profiles enables a robust spatio-temporal validation of swot derived river altimetry and slope profiles at the node scale.

Variations in WSE due to discharge, bathymetry, and exceptional floods are well depicted with filtered SWOT data and validated against independent datasets. SWOT observations therefore demonstrate high accuracy across various hydrological conditions and river morphologies, even for narrow rivers, with a 1‑sigma error below 18 cm and a standard deviation below 30 cm compared to models and in situ measurements.

How to cite: Ledauphin, T., Piasny, G., Garambois, P.-A., Pujol, L., Samine Montazem, A., Larnier, K., Suchet, L., Azzoni, M., Maxant, J., and Yesou, H.: Assessing and Enhancing SWOT Hydraulic Visibility and Slopes in Narrow Rivers Using High-Resolution Models, EGU General Assembly 2026, Vienna, Austria, 3–8 May 2026, EGU26-5456, https://doi.org/10.5194/egusphere-egu26-5456, 2026.

EGU26-6095 | ECS | Orals | HS6.6

SWOT-based spatiotemporal deep learning for reach-scale forecasting of river and reservoir stages in the Mekong 

Yuan Liu, Simon Moulds, Robert Wilby, Duong Bui, Tien Du, Linh Bui, Boen Zhang, Yinxue Liu, Michel Wortmann, Ngoc Nguyen, Thomas Monahan, Hamidreza Mosaffa, and Louise Slater

Machine learning-based hydrological forecasting models are conventionally developed as lumped systems that predict watershed outflow using basin-averaged weather forcings. These approaches neglect the spatial information of meteorological inputs and their interactions with river network topology, limiting their ability to produce detailed reach-scale forecasts, i.e., for individual river reaches within the watershed. Here we introduce a new framework that provides reach-scale forecasts trained directly on SWOT water surface elevation (WSE) observations rather than outlet gauges. Incorporating spatially continuous SWOT observations allows the ML model to learn across the river network instead of only at gauged locations. The framework delivers 0- to 9-day forecasts of river and reservoir stages across an entire watershed. Our model integrates a graph neural network (GNN) with a long short-term memory (LSTM) network. The GNN encodes gridded meteorological forcings into the river network in a manner consistent with the runoff generation process. The LSTM component captures temporal dependencies and produces stage forecasts at key reservoirs and river reaches. Additional model inputs include 0- to 9-day Multi-Source Weather (MSWX) forecasts and river attributes from the Global River Topology (GRIT) dataset. The framework is implemented over the Mekong River Basin to generate forecasts for cascading reservoirs. Results demonstrate improved predictive performance relative to baseline Random Forest and LSTM models, highlighting the value of incorporating hydrological connectivity and satellite-based observations to improve forecasting in data-scarce regions.

How to cite: Liu, Y., Moulds, S., Wilby, R., Bui, D., Du, T., Bui, L., Zhang, B., Liu, Y., Wortmann, M., Nguyen, N., Monahan, T., Mosaffa, H., and Slater, L.: SWOT-based spatiotemporal deep learning for reach-scale forecasting of river and reservoir stages in the Mekong, EGU General Assembly 2026, Vienna, Austria, 3–8 May 2026, EGU26-6095, https://doi.org/10.5194/egusphere-egu26-6095, 2026.

EGU26-6157 | ECS | Posters on site | HS6.6

 Flood Monitoring and Classification in Canadian Rivers Using SWOT Observations 

Jingmao Zhang, Zhihua He, and John Pomeroy

Canada possesses one of the world's most extensive and diverse river networks, characterized by seasonal and regional variation in nival, glacial, and pluvial hydrological regimes and landscapes from lowland agricultural, to lakes and forests, to tundra and high mountains.  Long snow-covered winters and a large spring freshet characterize the hydrological regime of most of the country.  Monitoring river floods in this region faces significant challenges because of the sparse hydrometric gauging network, especially in northern Canada, and limited traditional remote sensing capabilities. The Surface Water and Ocean Topography (SWOT) satellite mission represents a transformative advance by providing all-weather, wide-swath measurements of water surface elevation (WSE) and water surface slope. This study presents a comprehensive framework to extract and classify river water wave dynamics across Canada using the SWOT_L2_RiverSP products. First, a quality-control protocol was established based on intrinsic orbital and geometric attributes. Evaluation of river width, cross-track distance, and WSE against observations from Water Survey of Canada hydrometric stations identified the river reaches where SWOT signals were most reliable. A novel Slope-WSE Phase Space method to classify river floods distinguished ice jam floods, confluence backwater effects, and freely propagating floods due to nival and pluvial mechanisms. The flood classification was then diagnosed using multi-source datasets, including ERA5 reanalysis precipitation/temperature and Landsat/Sentinel remote sensing imagery. SWOT successfully monitored floods, and the distinct hydraulic gradients of ice-jam induced backwater where water surface dynamics were previously unobservable by in-situ hydrometry. Even in the  narrow rivers (< 100 m), SWOT had good capability to measure the temporal propagation and hydraulic gradients of flood waves when compared with downstream hydrometric records. This research demonstrates the SWOT’s ability to monitor not just river water level dynamics, but also the underlying hydraulic processes of river systems under a wide range of cold regions processes on a continental scale, providing critical insights for observing and managing diverse flooding hazards.

How to cite: Zhang, J., He, Z., and Pomeroy, J.:  Flood Monitoring and Classification in Canadian Rivers Using SWOT Observations, EGU General Assembly 2026, Vienna, Austria, 3–8 May 2026, EGU26-6157, https://doi.org/10.5194/egusphere-egu26-6157, 2026.

EGU26-6576 | Orals | HS6.6

SWOT data assimilation in 2D hydrodnamic model for flood studies 

Quentin Bonassies, Ludovic Cassan, Thanh Huy Nguyen, Andrea Piacentini, Sophie ricci, Raquel Rodriquez, Santiago Peña Luque, and Christophe Fatras

To understand the dynamics of a flood, radar satellite imagery is a valuable tool because it can provide data during the event, even with cloud cover. The SWOT mission has the dual advantage of providing surface elevation readings and mapping flooded areas. While the revisit interval can be a drawback, coupling with a hydrodynamic model allows for real-time interpolation of water levels and velocities across the entire study area. SWOT data integration is achieved through data assimilation methods, which also improve hydrodynamic models, thus being useful for early warning and forecasting future events.

The work presented here demonstrates how to incorporate both water  surface elevations and flood front positions from SWOT into a data assimilation framework. Two types of methods are used to assimilate water masks. The first method has already been implemented in other studies; it is an ensemble Kalman filter where the domain is divided into homogeneous zones. Within each zone, the water level is modified at each analysis step to minimize the discrepancy between simulated and measured flooded area. The other method is an ensemble transform Kalman filter where the Chan Vese metric is used to minimize the distance between measured and simulated flood front positions. The novelty of this study therefore stems from the comparison of these two methods, each of which offers advantages for assimilating water masks from SWOT remote sensing data. Furthermore, it is necessary to verify that the two methods are also compatible for assimilating other data, whether in-situ water level measurements or direct water elevations in the river from SWOT products.

To carry out this study, a hydrodynamic model was built on an area around the Loire-Vienne confluence that experienced several flood events during 2023 and 2024. Calculations were performed using Telemac 2d software over a three-month period. Dual state-parameter data assimilation method estimates model parameters such as friction coefficients and inflow rates for each analysis cycle, as well as a uniform correction to the model state in subdomains of the flood plain. These parameters can vary depending on the method, and their interpretation provides information on the quality of the data used. Compared to previous studies, the dynamics of the floodplain can be modified by specific friction coefficients, in addition to the potential adjustment of water depth by zone (modification of the system state). These coefficients thus incorporate various phenomena responsible for flood propagation, such as hydraulic structures and land use.


Regardless of the assimilation method, SWOT data significantly reduces the estimation error for water depths and flooded areas with respect to SWOT water depths and flood extents. However, the Chan Vese method improves performance at the expense of computation time. When in-situ data is added, the simulation closely matches measurements in terms of water level at the observation stations. Nevertheless, thanks to the input of elevations measured by SWOT, it is possible to discuss the uncertainties of ground measurements and the best way to integrate data from different sources into the assimilation process.

How to cite: Bonassies, Q., Cassan, L., Nguyen, T. H., Piacentini, A., ricci, S., Rodriquez, R., Peña Luque, S., and Fatras, C.: SWOT data assimilation in 2D hydrodnamic model for flood studies, EGU General Assembly 2026, Vienna, Austria, 3–8 May 2026, EGU26-6576, https://doi.org/10.5194/egusphere-egu26-6576, 2026.

EGU26-7501 | ECS | Posters on site | HS6.6

From SWOT Cal/Val to Science Phase : Assessing and Enhancing Multi-Mission Satellite Altimeter Data (SWOT, Sentinel-3) for Hydraulic Visibility of the Natural Upper Rhine 

Léo Pujol, Thomas Ledauphin, Maxime Azzoni, Pierre-André Garambois, Laurent Schmitt, Valentin Chardon, Valentin Fouqueau, and Hervé Yesou

Early analysis conducted on a reach of the Upper Rhine during the daily revisit Calibration/Validation phase of the SWOT mission (Cal/Val 1-day) have demonstrated the very high quality of SWOT observations, both in terms of absolute water levels and the retrieval of fine hydraulic signatures such as riffles, pools, gravel bars, and slope breaks (Ledauphin et al., 2025). SWOT data have notably shown their ability to accurately reflect channel morphology, as well as temporal variations in the longitudinal water surface profile as a function of discharge. However, the strong hydrological and hydro-sedimentary dynamics of the Rhine cannot be fully captured during the SWOT Science phase, characterized by a 21-day revisit period and one or two overpasses, which is likely to miss rapid processes such as floods and related morphological adjustments.

In this context, this study focuses on the long Old Rhine, a 50-km long bypassed reach with a width ranging from 80 to 150 m, resulting of the successive of the Rhine’s course over the past two centuries, including the construction of hydroelectric plants. This reach has a minimum flow of 52 m3/s through it, most of which is diverted into the Grand Canal d’Alsace to supply power plants. The site is subject to pronounced hydro-sedimentary dynamics and benefits from a particularly dense observational framework, including in situ gauging stations, bathymetric surveys, topo-bathymetric LiDAR data, and drone acquisitions. It is also a calibration site for several satellite altimetry missions, including SWOT (Tier-1 site during the Cal/Val phase) and Sentinel-3 (ESA St3TART projects (Da Sylva et al., 2023)), making it a well-known reference site for multi-mission altimetric studies.

The primary objective of this study is to exploit the SWOT Cal/Val 1-day phase to consistently compare and validate observations from different satellite altimetry missions at equivalent dates. This multi-mission approach allows the assessment of data quality, consistency, and complementarity in a dynamic fluvial environment. Hydraulic-preserving filtering methods are applied to improve and homogenize water surface longitudinal profiles and derived slopes, particularly in morphologically complex areas, with their performance evaluated using in situ measurements (Montazem et al. 2025; Larnier et al., 2025). As a result, WSE profiles where longitudinal signatures and non linearities due to morphological variability are well preserved/depicted

In a second step, the complementarity of multi-mission observations is analyzed during the SWOT Science phase to determine to what extent their combination enables a denser temporal sampling and a more detailed monitoring of the long Old Rhine dynamics compared to individual missions. Finally, the combined datasets are used to assess the potential for calibrating and cross-validating hydraulic models, integrating recent topo-bathymetric data. Preliminary results highlight the strong potential of SWOT data and multi-mission altimetry for the dynamic monitoring of large rivers and for improving hydraulic modeling at reach to regional scales.

How to cite: Pujol, L., Ledauphin, T., Azzoni, M., Garambois, P.-A., Schmitt, L., Chardon, V., Fouqueau, V., and Yesou, H.: From SWOT Cal/Val to Science Phase : Assessing and Enhancing Multi-Mission Satellite Altimeter Data (SWOT, Sentinel-3) for Hydraulic Visibility of the Natural Upper Rhine, EGU General Assembly 2026, Vienna, Austria, 3–8 May 2026, EGU26-7501, https://doi.org/10.5194/egusphere-egu26-7501, 2026.

EGU26-7576 | ECS | Orals | HS6.6

Analysis and Validation of Water Surface Data in Two Reservoirs of Bogotá’s Water Supply System Using SWOT and Sentinel-2 Satellite Products 

Jorge Luis Leal Noy, Esteban Francisco Páramo Pérez, Andres Esteban Barrios Montoya, Luis Alejandro Morales Marín, and Erasmo Alfredo Rodríguez Sandoval

Bogotá, the capital of Colombia, relies on one of the largest and most complex urban water supply systems in the country. Drinking water is primarily sourced from high-altitude reservoirs located within the Chingaza National Park, situated in the Andean páramo ecosystems surrounding the metropolitan area. Beginning in late 2023 and continuing into 2024, severe drought conditions linked to the El Niño phenomenon led to historically low storage levels in the Chingaza system. As a consequence, in April 2024, Bogotá implemented water rationing for the first time in recent decades.

In this context, this study evaluates the potential of satellite-based observations to support reservoir monitoring and water resources management in Bogotá.  We analyze water surface elevation (WSE) and water surface area (WSA) for the Chuza and San Rafael reservoirs—both part of the Chingaza system—by integrating in situ observations with products from the Surface Water and Ocean Topography (SWOT) mission and Sentinel-2 imagery.

First, WSE estimates from SWOT Level-2 products (LakeSP and Raster) were validated against observed WSE between September 2023 and February 2026. Over the same period, WSA derived from SWOT and Sentinel-2 was validated against in situ WSA estimated from reservoir hypsometric curves.

Results show an excellent agreement between SWOT LakeSP WSE and observations for the Chuza reservoir, with a Pearson correlation coefficient of 0.9934. In contrast, performance for the San Rafael was substantially lower, with a correlation of 0.5971 and a systematic negative bias of −8.83 m, indicating reduced accuracy of SWOT-derived WSE in this smaller reservoir. Similar patterns were observed for the SWOT Raster product with moderate correlation for Chuza (0.7138), and large discrepancies for San Rafael. In contrast, WSA time series derived from the Normalized Difference Water Index (NDWI) from Sentinel-2 exhibited acceptable performance for San Rafael, with a correlation of 0.8535 and a bias of −0.37 km², and 0.6207 correlation and -0.61 km² bias for the Chuza reservoir.

Overall, the results demonstrate the strong potential of SWOT and Sentinel-2 products for monitoring strategic water supply reservoirs in the Colombian Andes, while also highlighting pronounced performance differences linked to reservoir size, shape and surrounding topography. The findings emphasize the usefulness of these satellite products for hydrological applications in the Colombian Andes but also underscore challenges such as persistent cloud cover and the need for more robust algorithms that integrate the high precision of SWOT with complementary datasets to improve area estimation.

How to cite: Leal Noy, J. L., Páramo Pérez, E. F., Barrios Montoya, A. E., Morales Marín, L. A., and Rodríguez Sandoval, E. A.: Analysis and Validation of Water Surface Data in Two Reservoirs of Bogotá’s Water Supply System Using SWOT and Sentinel-2 Satellite Products, EGU General Assembly 2026, Vienna, Austria, 3–8 May 2026, EGU26-7576, https://doi.org/10.5194/egusphere-egu26-7576, 2026.

EGU26-8283 | ECS | Orals | HS6.6

Global River Barrier Detection Using Multi-Temporal SWOT Water Surface Elevation Observations 

Youtong Rong, Paul Bates, and Jeffrey Neal

Rivers worldwide are increasingly harnessed to meet growing demands for hydropower, irrigation, water supply, and flood control. With over 58,000 large dams, 82,891 smaller hydropower installations, and countless undocumented barriers globally, humans have appropriated more than half of accessible freshwater runoff. Consequently, only an estimated 23% of the world's large rivers (>1,000 km in length) flow uninterrupted to the ocean.

Demand for non-fossil fuel energy and water security will likely increase reliance on river infrastructure throughout the 21st century, with hydropower production projected to grow by 50% by 2030. However, dam construction has modified flow conditions, altered thermal regimes and dissolved gas concentrations, disrupted fish migration routes, and degraded spawning habitats. Freshwater ecosystems are consequently among the most threatened globally, with biodiversity declining faster than in terrestrial or marine systems. In response, dam removals are accelerating in Europe and the United States, and the European Biodiversity Strategy aims to restore at least 25,000 km of free-flowing rivers by 2030 through barrier removal and floodplain restoration. Climate change amplifies these pressures, intensifying droughts and flooding while making river conservation increasingly urgent.

Regularly updating barrier databases is therefore essential for tracking new, existing, and removed structures, as well as those modified for fish passage or sediment transport. Yet significant gaps persist. While Global Dam Watch documents over 41,000 barrier locations and the AMBER database catalogues at least 1.2 million instream barriers across 36 European countries, current detection methods perpetuate systematic biases. Ground surveys are resource-intensive and geographically concentrated in developed regions. Optical satellite imagery cannot reliably identify submerged weirs, low-head structures beneath vegetation canopy, or barriers in cloud-prone areas. Smaller anthropogenic structures—which constitute the majority of barriers globally—remain underrepresented outside well-surveyed regions, and natural obstructions are rarely catalogued despite their ecological and hydraulic significance.

We present a detection framework exploiting multi-temporal Surface Water and Ocean Topography (SWOT) water surface elevation (WSE) observations to identify barriers through diagnostic hydraulic signatures. Any obstruction creating step changes in WSE—whether anthropogenic (dams, weirs, culverts) or natural (waterfalls, logjams, bedrock outcrops)—generates characteristic spatial discontinuities and temporal variations in upstream ponding extent. By analysing WSE patterns across multiple satellite overpasses, the framework identifies anomalous hydraulic behaviour indicative of flow obstruction. Applied globally, the framework successfully detects barriers previously absent from existing databases, proving particularly effective for submerged weirs, recently constructed structures, low-head barriers obscured in optical imagery, and natural obstructions in remote regions. While previous studies report that Europe has the highest density of medium and small river barriers, we found that Asian rivers—especially in China and India—are disproportionately impacted by large dams. This approach represents a paradigm shift from geographically constrained inventories toward continuous, satellite-based global monitoring. The resulting datasets will enhance hydrological modelling, inform ecosystem restoration and flood risk mitigation worldwide.

How to cite: Rong, Y., Bates, P., and Neal, J.: Global River Barrier Detection Using Multi-Temporal SWOT Water Surface Elevation Observations, EGU General Assembly 2026, Vienna, Austria, 3–8 May 2026, EGU26-8283, https://doi.org/10.5194/egusphere-egu26-8283, 2026.

EGU26-8599 | Orals | HS6.6

Evaluating estuarine ecosystem gradation and vulnerability through SWOT observations. 

Marc Simard, Alexandra Christensen, Ali Reza Payandeh, and Pascal Matte

Deltas and estuaries represent some of the most dynamic and complex transition zones on Earth, serving as vital ecological hubs that are increasingly vulnerable to the dual pressures of accelerated sea-level rise and anthropogenic modification. The NASA-CNES Surface Water and Ocean Topography (SWOT) mission provides a transformative capability to observe these environments by providing high spatial-resolution, wide-swath measurements of Water Surface Elevation (WSE). Unlike traditional nadir altimetry, SWOT’s interferometric SAR technology allows for the capture of two-dimensional water level gradients across scales of estuarine reaches. This study explores the utility of SWOT time-series measurements in resolving complex tidal components within intricate coastal geometries and assesses how these physical measurements can be translated into critical parameters for evaluating the health and long-term vulnerability of coastal ecosystems. In this presentation, we focus on hydroperiod and salinity.

By performing harmonic analysis on SWOT-derived WSE time-series, we demonstrate the ability to effectively resolve previously unknown but major tidal constituents in estuarine channels. These tidal components allow for the precise derivation of the hydroperiod—the frequency, duration, and depth of tidal inundation. Hydroperiod is the primary environmental driver of vegetation zonation, nutrient cycling, and carbon sequestration potential in mangroves and saltmarshes. Consequently, accurate SWOT-based mapping of inundation patterns offers a new lens through which to view coastal resilience and the potential for "blue carbon" sequestration. Another driver of ecosystem gradation and vulnerability is salinity, which distribution is a non-linear product of the interaction between tidal forcing, freshwater discharge, and complex bathymetry, making it far more difficult to resolve than surface height alone. Indeed, it requires numerical modeling, which presents significant technical hurdles.

We tested the implementation of numerical hydrodynamic models in several distinct geographical settings to evaluate the limits of SWOT-informed simulations. These sites included the high-discharge, tide-dominated Guayas Estuary in Ecuador, the marine-dominated and ecologically sensitive Langebaan Lagoon in South Africa, and the complex, Knysna Estuary, also in South Africa. Our results indicate that while SWOT provides unprecedented boundary conditions for water levels, the ability to simulate salinity and transport remains heavily constrained by a persistent lack of high-resolution bathymetry and other in situ measurements. To improve these simulations, there is an urgent need for better bathymetric data derived from bathymetric lidar for shallow sub-tidal zones and in-situ sonar transects for deeper primary channels. Secondly, the common lack of in situ data along the salinity gradient inhibit robust assessment of the methods. This work highlights the necessity of a synergetic approach, combining SWOT’s wide-swath observations with targeted bathymetric mapping and in situ data assimilation to provide the predictive accuracy required for effective coastal management and ecosystem conservation in a rapidly changing climate.

How to cite: Simard, M., Christensen, A., Payandeh, A. R., and Matte, P.: Evaluating estuarine ecosystem gradation and vulnerability through SWOT observations., EGU General Assembly 2026, Vienna, Austria, 3–8 May 2026, EGU26-8599, https://doi.org/10.5194/egusphere-egu26-8599, 2026.

EGU26-9542 | Posters on site | HS6.6

Assessing SWOT PIXC surface classification using imagery-based products 

Mohammad J. Tourian, Soheil Ettehadieh, Omid Elmi, Hind Oubanas, and Tamlin Pavelsky

The Surface Water and Ocean Topography (SWOT) mission provides unprecedented spatial detail for observing inland surface waters. Yet, the behavior and reliability of surface-type classification in the Level-2 KaRIn High-Rate Pixel Cloud (L2_HR_PIXC) product remain insufficiently characterized, due to the complexity of inland waterbodies, particularly across diverse hydromorphological and climatic settings. Because PIXC classification forms the foundation of all higher-level SWOT inland water products, a systematic evaluation of its performance is essential.

In this study, we systematically evaluate the SWOT PIXC surface classification and associated water fraction estimates using multiple river case studies spanning different climate regimes defined by the Köppen–Geiger classification. For each case study, PIXC surface classes and water fraction values are grouped by classification type and analyzed against independent water occurrence information derived from  DSWx-HLS (Harmonized Landsat& Sentinel-2), DSWx-S1 (Sentinel-1), and complementary long-term water occurrence datasets from Global Surface Water (Landsat).

Beyond inter-product comparison, we investigate how discrepancies between PIXC classification and imagery-based water occurrence depend on key KaRIn observables and geometric variables, including interferometric coherence, radar backscatter (σ⁰), phase noise standard deviation, incidence angle, etc. This analysis enables a process-oriented interpretation of classification behavior across surface classes, environments, and viewing conditions. The results provide a structured assessment of the strengths and limitations of SWOT PIXC classification, supporting informed use of SWOT inland water products and contributing to ongoing processing algorithm evaluation and future refinement efforts.

How to cite: Tourian, M. J., Ettehadieh, S., Elmi, O., Oubanas, H., and Pavelsky, T.: Assessing SWOT PIXC surface classification using imagery-based products, EGU General Assembly 2026, Vienna, Austria, 3–8 May 2026, EGU26-9542, https://doi.org/10.5194/egusphere-egu26-9542, 2026.

EGU26-10458 | Posters on site | HS6.6

Can surface elevation from SWOT over wet land areas be used to generate a DEM? 

Karina Nielsen and Simon Jakob Köhn

The Surface Water and Ocean Topography (SWOT) mission, launched at the end of 2022, marked a new area within satellite altimetry. Based on the data collected so far, many new and innovative results have already been obtained, e.g., for inland water,  coastal areas, and the ocean. In addition to reflections from these classical, permanent water sources, SWOT also provides potentially valid surface water elevations from temporary wet areas, such as fields and similar surfaces. In this initial study, we intend to investigate the quality of SWOT surface elevation from these surfaces. Denmark is continuously (in 5-year periods) mapped by airborne lidar campaigns to reconstruct an accurate (5 cm error) high-resolution (40 cm) digital elevation model. This high-quality data set enables investigation of the quality of SWOT observations over wetland areas. In this study, we will apply pixel cloud observations from several scenes to generate a SWOT-based DEM, assuming the surface is stationary, so that variations and noise in the SWOT observations will average out over time. Here, we will investigate the potential for selected areas in Denmark.             

How to cite: Nielsen, K. and Köhn, S. J.: Can surface elevation from SWOT over wet land areas be used to generate a DEM?, EGU General Assembly 2026, Vienna, Austria, 3–8 May 2026, EGU26-10458, https://doi.org/10.5194/egusphere-egu26-10458, 2026.

EGU26-10882 | ECS | Orals | HS6.6

40-Year Volume Changes of West African Lakes Derived from SWOT and Optical Imagery 

Félix Girard, Laurent Kergoat, Joao Marcelo Silva Paiva, Roland Yonaba, and Manuela Grippa

The thousands of lakes and reservoirs in West Africa are vital water resources for humans and ecosystems. In addition to marked annual and interannual dynamics, some of these lakes have experienced significant variations over the past sixty years related to climate and anthropogenic changes. Since existing studies have addressed the volume evolution of only a few lakes, large-scale volume trends in West Africa remain poorly documented. Here, we use the unprecedented spatial coverage of Surface Water and Ocean Topography (SWOT) swath altimetry, combined with the extensive temporal coverage of Landsat optical image archives, to derive the annual and 40-year volume dynamics of over 1300 West African lakes. Our results show that a few large reservoirs, mostly located in the sub-humid region, control most of the total annual volume dynamics. These large reservoirs have also driven the total lake volume increase observed across the entire study region over the past 40 years. At the individual scale, over the 1984 and 2024 period, 43% of lakes showed insignificant trends, 49% positive trends, mostly related to increased precipitation and reservoir impoundment during the analyzed period, and 8% negative trends. Furthermore, 17% of lakes have decreased in volume over the past two decades, suggesting a potential recent shift in volume for a number of lakes. This work is a significant step toward comprehensively quantifying annual and long-term changes in West African lake volumes. This information can inform hydrological modeling, global change impact assessments, and water management policies.

How to cite: Girard, F., Kergoat, L., Silva Paiva, J. M., Yonaba, R., and Grippa, M.: 40-Year Volume Changes of West African Lakes Derived from SWOT and Optical Imagery, EGU General Assembly 2026, Vienna, Austria, 3–8 May 2026, EGU26-10882, https://doi.org/10.5194/egusphere-egu26-10882, 2026.

EGU26-11551 | Orals | HS6.6

DAHITI – Monitoring Water Levels and Water Surface Slopes in Small Lakes and Rivers Using SWOT KaRIn Measurements 

Christian Schwatke, Daniel Scherer, and Denise Dettmering

Classical satellite altimetry has been successfully used to monitor the water levels of inland waters, such as rivers, lakes and reservoirs, for more than three decades. In December 2022, a new generation of altimeter mission called Surface Water and Ocean Topography (SWOT) was successfully launched. SWOT is equipped with a classical nadir radar altimeter similar to that on Jason-3, as well as a new Ka-band Radar Interferometer (KaRIn). KaRIn uses the principle of SAR interferometry and, thanks to its 120 km wide swath and 21-day repeat science orbit, has the capability to monitor almost every inland water body worldwide.

In this contribution, we present two new methods for deriving hydrological parameters over inland waters. Water level time series are derived for around 2,700 lakes and reservoirs in Germany. For around 250 river reaches, however, we have derived not only water levels, but also time-varying water surface slopes from the high-resolution SWOT pixel cloud dataset. This dataset enables us to monitor the water levels of very small water bodies. We use SWOT data measured during the fast sampling orbit (03/2023 – 07/2023, 1-day repeat cycle) and the science orbit (since 07/2023, 21-day repeat cycle). This contribution also discusses the challenges due to measurement noise, data gaps, and dark water pixels when using SWOT KaRIn data and how the new approach addresses these challenges. In addition, a preliminary quality assessment is performed on the SWOT pixel cloud data of Version C and the new Version D, which has been available since May 2025.

To assess the quality, the resulting time series of water levels and water surface slopes are validated against in-situ data and compared with the official LakeSP and RiverSP SWOT products. The validation of 112 lakes and reservoirs results in a median RMSE of 6.3 cm. The validation of 276 river reaches results in a median RMSE 10.7 cm. Compared with the official LakeSP and RiverSP products, the results of the new approach show higher accuracy and more data points. All time series of water levels and surface water slopes are freely available on the web portal of the „Database of Hydrological Time Series of Inland Waters„ (DAHITI, https://dahiti.dgfi.tum.de).

How to cite: Schwatke, C., Scherer, D., and Dettmering, D.: DAHITI – Monitoring Water Levels and Water Surface Slopes in Small Lakes and Rivers Using SWOT KaRIn Measurements, EGU General Assembly 2026, Vienna, Austria, 3–8 May 2026, EGU26-11551, https://doi.org/10.5194/egusphere-egu26-11551, 2026.

EGU26-11677 | ECS | Posters on site | HS6.6

Towards daily river monitoring from space: Reach-Reg, a first approach for spatiotemporal water level reconstruction using the SWOT geometry 

Michał Halicki, Tomasz Niedzielski, Christian Schwatke, Daniel Scherer, and Denise Dettmering

The Surface Water and Ocean Topography (SWOT) mission recently overcame the spatial limitation of satellite altimetry by using the wide-swath interferometry to simultaneously observe Water Surface Elevations (WSE) of inland waters within a 120 km wide swath. Thanks to this unique measurement principle, many river reaches are observed multiple times (typically two to four times) during SWOT’s 21-day repeat cycle. Nevertheless, even with these multiple observations, the resulting temporal resolution remains insufficient to capture the rapid sub-weekly dynamics of flood events. In this study, we present a novel approach to bridge this gap by exploiting the unique SWOT data geometry to densify multi-mission observations at Virtual Stations (VS) into a daily product.

Our method, named Reach-Reg, introduces a first approach to generate daily WSE time series from multi-mission satellite altimetry. Reach-Reg employs WSE data from Sentinel-3A/B, Sentinel-6A, and SWOT (provided by DAHITI, https://dahiti.dgfi.tum.de/). Our method introduces a chained regression approach that utilizes WSE from concurrent SWOT overflights to establish linear relationships between neighbouring river reaches. These regressions enable the precise transfer of the WSE measurements from various VS to a central Reference Station (RS). To ensure physical consistency, Reach-Reg employs a Manning-based time-lag correction using at-a-station hydraulic geometry simplification and calibration based on cross-validation. The daily product is achieved through the automated outlier rejection, smoothing, aggregation, and interpolation. Crucially, Reach-Reg also provides a rigorous uncertainty estimate.

We evaluated Reach-Reg across 95 RS on eight rivers (Elbe, Ganges, Mississippi, Missouri, Oder, Rhine, Po, Solimões) spanning four continents. These rivers represent diverse hydrological regimes and bed morphologies. Despite this variability, the method achieved consistent high performance, with mean RMSE of 0.30 m, normalised RMSE of 4.2%, and Nash-Sutcliffe Efficiency of 0.94. Notably, Reach-Reg significantly outperforms existing multi-mission densification techniques by improving both temporal resolution (daily vs. 2–5 days) and vertical accuracy (0.30 m vs. ≈1 m mean RMSE). Furthermore, this approach is computationally efficient (processing one station in ≈1 minute), open-source, and based solely on altimetry, ensuring global transferability. The introduction of daily WSE from multi-mission satellite altimetry will enable better understanding and modelling of river dynamics. It will also make it possible to issue WSE forecasts even in ungauged basins.

The research has been carried out in frame of the project no. BPN/BEK/2024/1/00047 within the Bekker Programme of the Polish National Agency for Academic Exchange. The Python implementation of the Reach-Reg method is available on GitHub (https://github.com/MichalHalicki4/Reach-Reg) and the daily WSE time series can be obtained from the Zenodo repository (https://doi.org/10.5281/zenodo.17928117).

How to cite: Halicki, M., Niedzielski, T., Schwatke, C., Scherer, D., and Dettmering, D.: Towards daily river monitoring from space: Reach-Reg, a first approach for spatiotemporal water level reconstruction using the SWOT geometry, EGU General Assembly 2026, Vienna, Austria, 3–8 May 2026, EGU26-11677, https://doi.org/10.5194/egusphere-egu26-11677, 2026.

EGU26-12506 | Posters on site | HS6.6

Use of satellite altimetry for monitoring river ice state and ice jams 

Elena Zakharova, Inna Krylenko, Pavel Golovlyev, Anastasia Lisina, Alexei Sazonov, Natalia Semenova, and Alexei V. Kouraev

In regions with low density of ground observational network, hydrodynamic models  and satellite observations are able to reproduce the river water level regime and inundated areas with an accuracy sufficient for  monitoring climate change. However, very limited number of studies demonstrated the capacity of synergy of satellite altimetry and hydrodynamic modelling in complex Arctic environment due to lack of certainty in interpretation of altimetric measurements over river ice and high errors in calculation of winter water levels. However, it is the winter regime of arctic and boreal rivers that experiences the most significant climate change. These changes are seen as a decrease in ice duration and thickness, ice jam occurrence and an increase in winter water levels.  We hypothesized that the river ice properties varying in space and time may affect the performance of water level retrievals from satellite altimetry and investigated the validity of our hypothesis using the synergy of satellite measurements and numerical experiment with hydrodynamic models. Two  models MIKE 11DHI and STREAM 2D were adapted for 90-300 km-long river reaches located on the Severnaya Dvina, Lena and Kolyma Rivers. The models were run for winter periods with ice modules switched on/off. Comparison of simulation results showed that in case of smooth ice of the Kolyma River the altimetry retrievals rather showed the elevation of the ice bottom, while in case of rough S.Dvina and Lena ice the satellite measurements were close to the elevation of the ice top. The latter allowed to reproduce with the altimetric measurements the mid-winter ice jam conditions occurred in 2019 on the S.Dvina River and to validate the model in ungauged sections.   
The verification of the altimetry return signal (waveform) over the test sites demonstrated that over the Kolyma's smooth ice,  the waveforms expressed two distinct peaks. The second peak dominated in power and was used by the SAMOSA 2 retracker algorithm for the range and elevation  estimation. In cases of rough ice, the return signals had one peak, which, according to comparison with the modeled levels, was produced by reflection of the signal from the ice top. Our finding can have an important implication for future adaptation of satellite altimetry for high latitude river hydrology and can explain the variable in space and time performance of the satellite altimetry over frozen rivers. 
The new interferometric altimetric instrument installed on the SWOT satellite (on orbit since 2023) globally maps the river water surface topography and potentially may indicate the locations and severity of the ice jams. However, the low instrument incidence angle makes surface elevation retrievals unrealistic in many locations characterized by low water/ice roughness. We investigated the performance of the SWOT surface elevation retrievals in winter period in our test sites and demonstrated that its measurements may have precision compared with the model simulations. This makes the SWOT measurements extremely valuable for hydrodynamic model runs in winter.  

The study was supported by CNES TOSCA SWIRL project; Water Problems Institute, RAS Governmental Order FMWZ-2025-0003 and RSF project №24-17-00084.     

How to cite: Zakharova, E., Krylenko, I., Golovlyev, P., Lisina, A., Sazonov, A., Semenova, N., and Kouraev, A. V.: Use of satellite altimetry for monitoring river ice state and ice jams, EGU General Assembly 2026, Vienna, Austria, 3–8 May 2026, EGU26-12506, https://doi.org/10.5194/egusphere-egu26-12506, 2026.

EGU26-12954 | ECS | Orals | HS6.6

Long-Term Assessment of Flood Inundation Using SWOT Satellite Observations 

Bhanu Kiran Verma, Ivana Rose Thomas, and Sreeparvathy Vijay

Flood inundation mapping is crucial for effective disaster management and well informed land use planning in flood prone regions. Optical sensors are often ineffective during flood events due to persistent cloud cover, limiting the usability of visible and near infrared imagery. While the SAR overcomes these limitations, there are no missions that monitor water from space in two dimensions. In contrast, the SWOT mission, through its Ka-band Radar Interferometer (KaRIn), provides cloud penetrating measurements of water extent and elevation, making it a powerful tool for long term flood inundation mapping despite its 21 day revisit cycle and limited real time availability. However, basin scale application of SWOT data is challenged by large data volumes, variable spatial resolution (10 to 60 m), overlapping swaths, and the absence of a standardized spatial indexing system. As a result, identical geographic locations may not appear consistently across multiple granules, complicating continuous time series extraction. This study uses the L2_HR_PIXC dataset, which is irregularly sampled and more complex than standard raster products, but better preserves critical hydrological information that is often lost during resampling. Although often neglected due to processing complexity, it contains crossover observations that hold  valuable information critical for accurate inundation analysis. To address these challenges, a dedicated national scale database was developed for India to efficiently organize and integrate spatiotemporal SWOT pixel data at 30 m resolution. Leveraging this database, a probabilistic clustering based approach was implemented to map seasonal and permanent flood inundation using both water extent and elevation information. The developed framework enables efficient flood inundation mapping over large spatial extents, including river basin scales, overcoming limitations of conventional hydraulic models that are data and resource intensive and often restricted to regional applications. The methodology was applied to major flood prone regions of India namely Bihar, Assam, Manipur, Kerala, and Andhra Pradesh, spanning diverse latitudes and exhibiting substantial variation in SWOT observation frequency. The resulting inundation maps were validated using ground based observations and Sentinel satellite imagery across multiple flood events. These maps effectively differentiate recurrent seasonal flood zones from rarely inundated areas that may be more vulnerable during extreme events, offering valuable insights to support targeted flood risk management and disaster preparedness.

Keywords: SWOT, Cluster, India, Inundation map, Flood, Database

How to cite: Verma, B. K., Thomas, I. R., and Vijay, S.: Long-Term Assessment of Flood Inundation Using SWOT Satellite Observations, EGU General Assembly 2026, Vienna, Austria, 3–8 May 2026, EGU26-12954, https://doi.org/10.5194/egusphere-egu26-12954, 2026.

EGU26-13034 | ECS | Posters on site | HS6.6

A Bayesian framework for Stage–Fall–Discharge Laws estimation from SWOT altimetry and slopes 

Ngoc Bao Nguyen, Kevin Larnier, Benjamin Renard, Jérôme Le Coz, and Pierre-André Garambois

River discharge is traditionally estimated using stage–discharge rating curves, yet their calibration relies on sparse and costly in situ measurements and remains highly uncertain, particularly under extreme flow conditions. The Surface Water and Ocean Topography (SWOT) mission provides unprecedented observations of river surface elevation, slope, and width; however, inferring discharge from these variables alone is fundamentally ill-posed and susceptible to structural biases. Overcoming these limitations requires additional physical constraints at the river-network scale, motivating the use of hydrological–hydraulic closure and data assimilation to derive robust, observation-conditioned rating curves from SWOT data. In this study, we propose a multi-scale Markov Chain Monte Carlo (MCMC) framework to infer three stage–discharge rating curve formulations by jointly exploiting SWOT observations, hydrological model outputs, and in situ discharge measurements. Our results demonstrate the feasibility of using SWOT data to infer reliable  parametric stage-discharge relationships including a conceptual river hydraulic geometry, while revealing spatially coherent patterns in model discharge quality consistent with previous studies. The analysis also highlights current limitations in SWOT data processing quality and establishes a foundation for deriving prior hydraulic knowledge to support future end-to-end hydrology–hydraulic learning frameworks.

How to cite: Nguyen, N. B., Larnier, K., Renard, B., Le Coz, J., and Garambois, P.-A.: A Bayesian framework for Stage–Fall–Discharge Laws estimation from SWOT altimetry and slopes, EGU General Assembly 2026, Vienna, Austria, 3–8 May 2026, EGU26-13034, https://doi.org/10.5194/egusphere-egu26-13034, 2026.

EGU26-13409 | ECS | Orals | HS6.6

Water surface elevation across the river-ocean interface from SWOT satellite 

Mónica Coppo Frias, Cécile Marie Margaretha Kittel, Karina Nielsen, Mohammad Shamsudduha, Sazzad Hossain, Aske Folkmann Musaeus, Christian Toettrup, and Peter Bauer-Gottwein

River deltas are home to more than 400 million people worldwide and are critical centers for industry and ecosystems. Many low-lying Asian Mega-deltas such as the Mekong Delta and the Ganges-Brahmaputra-Meghna (also known as the Bengal Delta) are increasingly exposed to compound coastal–river flooding, driven by tropical cyclones, storm surge, extreme river discharge, land subsistence, higher tides and sea-level rise. Reliable integrated coastal–river hydraulic models are needed to predict these events and support contingency planning, but model accuracy is often limited by sparse and discontinuous observations across the river–estuary–coastal transition zone. Developing reliable data sets for these environments is challenging because (i) coastal and estuarine water levels vary strongly in space and time, (ii) delta morphology is complex (floodplains, siltation, and human-made structures), and (iii) continuous observations capturing the interaction between river and ocean processes are generally lacking.

While in-situ gauges provide time-series data at a few monitoring locations, they cannot resolve the spatial structure of water levels across the delta. Previous satellite altimetry missions increased the spatial coverage of water surface elevation (WSE) observations but were typically limited to point-based observations (e.g., Sentinel-3) or cross-section tracks (e.g., ICESat-2). SWOT (Surface Water and Ocean Topography) is the first mission to provide two-dimensional WSE observations over both inland waters and the ocean. In this study, we explored the SWOT L2 HR Raster product at 100 m resolution over the Mekong (Vietnam) and Meghna (Bangladesh) rivers to generate continuous river-to-ocean WSE datasets. The raster product is sampled along river centerlines from upstream reaches, through the estuary, and tens of kilometers into the ocean, to generate 1D river-ocean WSE profiles. Assuming along-channel hydraulic continuity in the WSE, we remove outliers and fill gaps in the data to obtain consistent profiles.

These observations reveal key hydrodynamic features that are difficult to resolve with conventional monitoring, including the along-channel spatial variability of tidal propagation and damping, including zones of strong tidal influence, and changes in the tidal signal during high-discharge periods, when river flow alters tidal penetration and water-level gradients. By providing coincidence two-dimensional snapshots of river and coastal water levels, SWOT enables a consistent characterization of how ocean forcing and river discharge interact across the delta. The resulting coastal–river datasets are a foundation for validating integrated coastal–river hydraulic models and improving simulations of WSE along the river–ocean continuum, strengthening compound coastal flood modeling and climate-impact assessments in deltaic environments.

How to cite: Coppo Frias, M., Kittel, C. M. M., Nielsen, K., Shamsudduha, M., Hossain, S., Musaeus, A. F., Toettrup, C., and Bauer-Gottwein, P.: Water surface elevation across the river-ocean interface from SWOT satellite, EGU General Assembly 2026, Vienna, Austria, 3–8 May 2026, EGU26-13409, https://doi.org/10.5194/egusphere-egu26-13409, 2026.

EGU26-13484 | ECS | Orals | HS6.6

Global Riverbank Slope Patterns Inferred from SWOT-Derived Hypsometry Curves 

J. Daniel Vélez, Tamlin Pavelsky, and Brent Williams

Riverbank slopes are a fundamental component of river geometry, governing channel–floodplain connectivity, cross-sectional shape, and overbank flow behavior. These slopes constrain ecohydrological processes such as hyporheic exchange, riparian inundation, floodplain residence times, and hydrodynamic models. Despite their importance, riverbank slopes remain poorly quantified at regional to global scales due to the limited ability of remote sensing to resolve near-bank topography and the impracticality of applying high-resolution topobathymetric models across extensive river networks.

The Surface Water and Ocean Topography (SWOT) satellite provides global, simultaneous observations of river width and water surface elevation (WSE), but does not directly measure channel depth, bank geometry, or cross-sectional area. A further limitation is that raw SWOT width measurements exhibit systematic bias as a function of cross-track distance from nadir. As a result, repeated observations of the same river node from different satellite passes can exhibit width differences that exceed expected natural variability, reflecting sensor- and geometry-related bias rather than true hydraulic change. To mitigate this effect, we apply automated width corrections during data processing using the river-spatial-scale repository (available via GitHub at https://github.com/SWOTAlgorithms/river-spatial-scale). This framework implements bias adjustment through spatial comparison of measurements across nodes and applies configurable windowed smoothing to reduce cross-track-dependent errors while preserving natural along-river variations; additional quality filtering ensures consistent and physically meaningful width estimates for hypsometric analysis.

We examine monotonic width–WSE hypsometric curves using these bias-corrected SWOT data, as a proxy for inferring effective riverbank slope. This approach builds on hydraulic geometry theory, which posits that observable hydraulic variables can constrain unobserved channel properties. We construct hypsometric curves using SWOT vector products at node scale, in which individual nodes are spaced at approximately 200 m, across a global set of rivers. We evaluate performance and robustness in comparison with in situ measurements of bathymetry along six rivers in the United States, Colombia, France, and Italy, spanning diverse climatic, geomorphic, hydraulic, and anthropogenic conditions, including systems with significant channel modification and hydraulic infrastructure. We analyze the shape, slope, and regression behavior of the hypsometric curves to estimate effective riverbank slopes and assess spatial variability along river corridors. Results demonstrate that SWOT-derived hypsometric curves provide a practical and scalable proxy for riverbank slope, enabling global-scale characterization of channel geometry using SWOT data. This approach offers new opportunities to investigate spatial patterns in hydraulic geometry, evaluate landscape controls on river form, and support hydrologic, hydraulic, and geomorphic applications in data-limited regions.

How to cite: Vélez, J. D., Pavelsky, T., and Williams, B.: Global Riverbank Slope Patterns Inferred from SWOT-Derived Hypsometry Curves, EGU General Assembly 2026, Vienna, Austria, 3–8 May 2026, EGU26-13484, https://doi.org/10.5194/egusphere-egu26-13484, 2026.

EGU26-13827 | ECS | Orals | HS6.6

Using SWOT to revisit global river gas exchange 

Craig Brinkerhoff, Peter Raymond, Jonathan Flores, Minhui Li, Shuang Zhang, Xiying Sun, and Dongmei Feng

Air-water gas exchange influences aquatic ecosystem processes ranging from photosynthesis and respiration to greenhouse gas emissions. The speed of this exchange, termed the gas exchange rate, is a key parameter for carbon transport through the world’s river basins. Because of this, global maps of the gas exchange rate are often constructed from hydrographic and hydraulic datasets as one step towards constraining global river carbon budgets. However, existing maps rely on DEM-derived slopes that are not necessarily indicative of water surface conditions and are subject to other operational uncertainties. And more mechanistically, existing models assume that only bed-shear-induced near-surface turbulence drives river gas exchange, neglecting other potentially influential physical processes like wind-shear-induced turbulence (especially in wide rivers). Decades of theory and experimental work in lakes, estuaries, and the open ocean show that air-water gas exchange is a variable function of turbulence on both sides of the interface, but similar studies in rivers are limited to a few sites. To address these issues, we integrate (1) previous theoretical work on wide-river gas exchange, (2) global SWOT measurements of water surface slope, and (3) a downscaled wind model to calculate near-surface turbulent dissipation rates for global rivers. We then produce a first-order characterization of global river gas exchange rates and explore the impact of both wind-shear-induced turbulence and direct water surface observations from SWOT. We find that wind can play a significant role in unsheltered, wide, and flat rivers that are often (though not always) located near the mouths of the world’s river systems. Our results suggest that river gas exchange maps should leverage direct water surface measurements and account for air-side processes to better constrain global river carbon emissions, and we provide the first steps towards an empirical framework to do this.

How to cite: Brinkerhoff, C., Raymond, P., Flores, J., Li, M., Zhang, S., Sun, X., and Feng, D.: Using SWOT to revisit global river gas exchange, EGU General Assembly 2026, Vienna, Austria, 3–8 May 2026, EGU26-13827, https://doi.org/10.5194/egusphere-egu26-13827, 2026.

EGU26-15154 | ECS | Posters on site | HS6.6

Global Validation of SWOT Water Surface Elevation with Gauge Data and Analysis of River Width 

Shuhua Yu, Peyman Saemian, and Mohammad J. Tourian

The Surface Water and Ocean Topography (SWOT) mission, equipped with a Ka-band radar interferometer, is designed to provide high-precision measurements of inland water surface elevation (WSE), width, slope, and estimated discharge,, enabling global investigations of hydrological processes, ecosystem dynamics, and climate-driven changes in surface water resources. To fully exploit the advanced global observation capabilities of SWOT for hydrological applications, a robust and systematic validation of its inland water products is essential.

 In this study, we conduct a global-scale validation of SWOT-derived water surface elevation (WSE) by comparing SWOT measurements  (River and Lake Single-Pass Vector Product) against in situ observations from 4,676 gauges for rivers and 514 stations for Lakes and reservoirs worldwide. To this end, SWOT observations are first coarsely matched to gauge locations using spatial distance thresholds between satellite ground tracks and hydrological stations. This step is followed by station-by-station manual inspection to ensure accurate spatiotemporal matching. The accuracy of SWOT lake and river WSE products is then evaluated at the global scale using least-squares fitting. In addition, we assess the effects of different quality control flags and uncertainty parameters on data accuracy by testing individual and combined filtering strategies under multiple threshold settings. To evaluate the accuracy of SWOT river width estimates, we analyze the relationship between gauge-based WSE and river widths derived from different satellite passes. Gauge WSE is used as an intermediate variable to quantify systematic width offsets among passes and to examine the influence of cross-track distance on river width bias.

In addition, we establish empirical relationships between gauge-based WSE and SWOT-derived river width to assess the accuracy and uncertainty of SWOT width estimates. The analysis focuses on a wide range of inland water bodies, including rivers of varying widths and lakes and reservoirs of different sizes, allowing an assessment of SWOT performance across diverse hydrological conditions. To examine observational consistency across processing stages and to quantify the impact of algorithm updates, we compare SWOT Version C and Version D data, with a focus on changes in WSE and river width accuracy.

This study provides a comprehensive assessment of the accuracy and consistency of SWOT inland water products in global scale and offers practical guidance on data version selection and quality control strategies for long-term hydrological applications of SWOT observations.


How to cite: Yu, S., Saemian, P., and Tourian, M. J.: Global Validation of SWOT Water Surface Elevation with Gauge Data and Analysis of River Width, EGU General Assembly 2026, Vienna, Austria, 3–8 May 2026, EGU26-15154, https://doi.org/10.5194/egusphere-egu26-15154, 2026.

EGU26-16227 | ECS | Orals | HS6.6

Mapping Post-Flood Water Persistence with SWOT in Low-Gradient Drylands, Australia  

Mahdiyeh Razeghi and Ilyas Nursamsi

Western Queensland’s dryland floodplains are exceptionally low-gradient, with broad anabranching channels and extensive backswamps where the key driver of pastoral impact is not only flood magnitude but the residence time of standing water. Prolonged ponding induces waterlogging and sediment smothering of pastures, creating multi year feed deficits. Leveraging the exceptional rainfall flood sequence of early 2025 as a natural experiment, we investigate the space–time structure of post-flood water persistence across the Cooper Creek floodplain near Windorah and adjacent Channel Country. 

We exploit SWOT KaRIn Level-2 “pixel-cloud” hydrology to retrieve day-by-day water surface elevation and inundation and pair these with Bureau of Meteorology rainfall analyses to decouple local rainfall forcing from upstream flood-wave contributions. A conservative, class-aware filtering is applied to stabilize water detection; we then compute persistence diagnostics (e.g., pixel-wise residence time and a backswamp/active-channel persistence contrast index), quantify observational uncertainty via threshold perturbations, and cross-check timing and extent against independent situational reporting. The workflow is designed to be reproducible and extensible, providing assimilation-ready surface water states suitable for integration with hydrodynamic models or multi-sensor frameworks. 

By centering persistence rather than peak alone, this study targets a hydrologically meaningful and impact-relevant variable. The contribution is a rigorously specified method for mapping where water lingers after major floods in very low-slope rangelands, with clear pathways to generalization beyond the Cooper system and to fusion with national precipitation reanalyzes and river intelligence products for improved flood-recession understanding, forecasting, and rangeland decision-support. 

How to cite: Razeghi, M. and Nursamsi, I.: Mapping Post-Flood Water Persistence with SWOT in Low-Gradient Drylands, Australia , EGU General Assembly 2026, Vienna, Austria, 3–8 May 2026, EGU26-16227, https://doi.org/10.5194/egusphere-egu26-16227, 2026.

EGU26-16531 | ECS | Posters on site | HS6.6

Estimation of water elevation and volume changes over mountain lakes using Sentinel-1/2 and SWOT data 

Laurane Charrier, Fatima Karbou, Guillaume James, Nicolas Gasnier, Adrien Guerou, and Santiago Peña-Luque

Monitoring changes in lake water elevation and volume in mountainous regions is crucial for hydro-electricity management, natural hazard mitigation and quantifying water resources. The SWOT mission is revolutionising lake monitoring from space since its swath altimetry sensor provides data with a global spatial coverage and a better spatial resolution than previous nadir altimeters. This opens the door to the study of smaller lakes. However some challenges remain, especially in mountainous regions. It includes the impact of layover in steep terrain and the poor quality of the SWOT water area products. These limitations hinder the derivation of hypsometric curves (i.e. the area/height relationship) that are required to calculate changes in lake volume. One way to overcome this is to measure lake areas using the segmentation of SAR and optical images. However, mountain lake areas from SAR images are affected by layover and shadow effects while those derived from optical images are distorted by cloud cover.

In this context we first evaluate the quality of the SWOT Pixel Cloud (L2_HR_PIXC) products over several mountain lakes. We developed a processing chain to filter PIXC data based on quality flags, backscatter signals and spatio-temporal statistics. The filtered water surface elevations are validated using in-situ data from the Lacs Sentinelles network in the French Alps and from the FOEN network in Switzerland.

Next, we present a methodology for combining Sentinel-1 and Sentinel-2 areas with SWOT surface elevation using the hypsometric function, and a spatio-temporal interpolation of the lake water levels. Lake surface areas are derived from the Sentinel-1 OASIS index, a highly sensitive measure for water body detection, while Sentinel-2 based lake surface areas are extracted from the CNES Surfwater products, available on the hydroweb.next open access platform. We illustrate our strategy on three different mountain lakes of various sizes and in different environments: Joux Lake in the Jura Mountains, Switzerland (8-9 km²) ; the Lauvitel Lake in the Ecrins Massifs, French Alps (1-3 km²) and the Rosolin Lake, a supra-glacial lake in the Vanoise Massif, French Alps (0.01-0.03 km²). This work is a step towards a better quantification of changes in lake elevation and volume in complex terrains. 

How to cite: Charrier, L., Karbou, F., James, G., Gasnier, N., Guerou, A., and Peña-Luque, S.: Estimation of water elevation and volume changes over mountain lakes using Sentinel-1/2 and SWOT data, EGU General Assembly 2026, Vienna, Austria, 3–8 May 2026, EGU26-16531, https://doi.org/10.5194/egusphere-egu26-16531, 2026.

EGU26-17595 | ECS | Orals | HS6.6

Investigating SWOT observations for river hydrodynamics: Evidences from the Po River 

Farid Kurdnezhad, Angelica Tarpanelli, and Alessio Domeneghetti

This study presents an evaluation of the Surface Water and Ocean Topography (SWOT) mission for monitoring riverine hydrodynamics, using the Po River (Northern Italy) as a test case. Given the recent launch of SWOT, its application to river hydraulics remains relatively unexplored and requires thorough validation against in-situ observations and specially, physically based models. We assess SWOT Water Surface Elevation (WSE), water surface slope, and recently released discharge products during the science phase, by comparing them with gauge measurements and hydrodynamic simulations over a ~300 km reach of the Po River, including the delta section (a coupled 1D/2D HEC-RAS model is employed to dynamically simulate river hydraulics).

The analysis integrates multiple SWOT products, including the Level-2 High-Rate Pixel Cloud (SWOT_L2_HR_PIXC) and Level-2 River Single-Pass Vector Product (SWOT_L2_HR_RiverSP - RiverSP), explicitly accounting for quality flags and performance under different flow regimes.

Results highlight the critical importance of quality-aware filtering for reliable use of SWOT observations. Good- and degraded-flagged WSE data generally show strong agreement with both in-situ measurements and model simulations, whereas suspect and bad flagged observations exhibit significantly larger discrepancies, with deviations reaching several meters. The analysis also reveals spatial patterns in SWOT performance linked to geophysical and orbital factors.

Comparison of RiverSP WSE node data against 10 in-situ stations shows biases up to ~10 cm for good and degraded data, with mean Kling–Gupta Efficiency (KGE) values of 0.92 and 0.82 for high-flow and low-flow regimes, respectively. Across all 114 analysed SWOT passes (each representing a longitudinal river WSE profile), on average, 68% of node observations per pass, are flagged as good or degraded, while 12 passes contain no usable data. Nevertheless, approximately 82% of the profiles show high agreement with the hydrodynamic model (KGE ≥ 0.8), highlighting the strong performance of SWOT in reproducing river WSE profiles. Profile-based comparisons also reveal orbit-dependent performance variability among different SWOT passes.

To address data limitations and improve spatial coverage, complementary Pixel Cloud products are leveraged for their higher spatial resolution, although these require extensive preprocessing, including spatial filtering and noise/outlier removal.

The study further explores the spatial and temporal performance of SWOT observations in relation to (i) distance from nadir track, (ii) satellite pass orientation, (iii) river planform geometry (e.g. straight vs. meandering reaches), and (iv) flow regime (e.g. rising limb, peak, recession, low flow). Although based on a single case study, the results illustrate both the potential and current limitations of SWOT products for riverine applications. The findings emphasize the importance of integrating quality-controlled satellite observations with physically based hydrodynamic models to support operational hydrology, long-term monitoring, and decision-making for flood and drought risk mitigation in inland-to-coastal environments. The proposed methodology is readily transferable to other river systems for inter-basin comparative analyses under diverse hydraulic conditions.

How to cite: Kurdnezhad, F., Tarpanelli, A., and Domeneghetti, A.: Investigating SWOT observations for river hydrodynamics: Evidences from the Po River, EGU General Assembly 2026, Vienna, Austria, 3–8 May 2026, EGU26-17595, https://doi.org/10.5194/egusphere-egu26-17595, 2026.

EGU26-17924 | ECS | Orals | HS6.6

SWOT-QQ: Global River Discharge Estimates at Gauging Stations from SWOT Observations 

Peyman Saemian, Mohammad J. Tourian, Siqi Ke, Omid Elmi, Benjamin M. Kitambo, and Fabrice Papa

River discharge is a core element of the global water cycle and an Essential Climate Variable (ECV), yet direct observations remain limited in both space and time. The Surface Water and Ocean Topography (SWOT) mission provides high-resolution (~100 m) measurements of water surface elevation over rivers and lakes worldwide, creating new opportunities to advance the monitoring of surface water dynamics. Here, we present the SWOT-QQ data set, a global SWOT-based river discharge dataset developed by combining SWOT surface water elevation measurements with an extensive collection of historical and contemporary in situ discharge records from over 60,000 gauging stations. Relying on SWOT’s global coverage, SWOT-QQ incorporates substantially more gauges than previous satellite-based discharge products (e.g., SAEM, RSEG), thereby extending both the geographic and hydrological representativeness of the estimates. Discharge time series are derived using the non-parametric quantile mapping (NPQM) approach, enabling the translation of SWOT water surface elevations into discharge across diverse climatic and hydrological regimes. In addition, we develop a near-real-time (NRT) framework in which incoming SWOT observations are converted into discharge using non-parametric rating relationships established during the mission period.

The results show consistent skill across multiple performance metrics in several regions, highlighting the potential of SWOT-QQ to support hydrological studies. We further compare our discharge estimates with outputs from existing SWOT discharge algorithms, including neoBAM, HiVDI, MetroMan, MOMMA, SAD, SIC4DVar, and the consensus product from the latest L4 dataset. Our results show that, after matching gauges to SWOT reaches, SWOT-QQ exhibits a betteragreement with in situ discharge than the reach-based SWOT L4 products. SWOT-QQ is intended as a complementary resource for river discharge algorithm validation, as prior information for inferring flow-law parameters, and as input for hydrological modeling and data assimilation. Through this work, we aim to foster discussion and collaboration within the SWOT community and contribute to improved global river discharge characterization.

How to cite: Saemian, P., Tourian, M. J., Ke, S., Elmi, O., Kitambo, B. M., and Papa, F.: SWOT-QQ: Global River Discharge Estimates at Gauging Stations from SWOT Observations, EGU General Assembly 2026, Vienna, Austria, 3–8 May 2026, EGU26-17924, https://doi.org/10.5194/egusphere-egu26-17924, 2026.

EGU26-20219 | Posters on site | HS6.6

Estimating precipation in open ocean with SWOT at sub-kilometer resolution 

Bruno Picard, Aurélien Colin, and Romain Husson

Precipitation is a fundamental component of the Earths hydrological cycle, with profound implications for water resource management, marine traffic, and disaster risk mitigation. Accurate rainfall estimation is critical for understanding weather patterns, forecasting flood events, and modeling climate change scenarios. While ground-based systems, such as the NEXRAD WSR-88D network, provide high-resolution data, they are geographically limited and leave vast oceanic regions unmonitored. Alternatively, satellite missions offer global coverage but often lack the necessary spatial resolution for fine-scale analysis (e.g., IMERG provides rates at ~8 km/pixel) or have limited acquisition in open oceans (e.g., Sentinel-1's constellation default observation mode in open ocean is composed of scattered imagettes).

In this context, the Surface Water and Ocean Topography (SWOT) mission presents a novel opportunity to bridge the gap between global coverage and high spatial resolution. Although primarily designed for altimetry, SWOT’s Ka-band Radar Interferometer (KaRIn) is sensitive to atmospheric hydrometeors. KaRIn offers sub-kilometer resolution (250 m/pixel), matching NEXRAD resolution in range, and provides continuous data over both coastal zones and the open ocean.

We present a machine learning framework to estimate precipitation rates using SWOT observations. We build a NEXRAD/SWOT dataset between August 2023 and February 2025, composed of 7009 patches (512×512 pixels) out of which 1090 contains precipitation (more than 1 mm/h on more than 1\% of the observation). A U-Net architecture was trained to retrieve Digital Precipitation Rates (DPR) from the WSR-88D. The input features include the backscattering coefficient (normalized to mitigate the incidence angle variability), total coherence, incidence angle, and a wind speed prior from atmospherical models. To ensure robust performance, the training loss is spatially weighted: pixels closer to NEXRAD stations are prioritized to minimize ground-truth uncertainty related to radar beam broadening and elevation in altitude, while null-DPR pixels are down-weighted to address class imbalance. Furthermore, quantile mapping was applied to align the model’s output distribution with NEXRAD's statistics, ensuring the accurate replication of heavy rainfall tails. An ensemble of independently trained models allow to compute a consensus score, providing a metric for estimating confidence.

Evaluation against NEXRAD data shows the model achieves 67\% accuracy in categorical classification (rainless, low, high intensity), a performance comparable to dual-station consistency checks. In the open ocean, validation against collocated IMERG tracks reveals strong correlations of their respective time series, reaching 95\% in the Pacific Inter-Tropical Convergence Zone (ITCZ) and 75\% in the Atlantic ITCZ. However, correlation degrades at higher latitudes, suggesting a sensitivity to convective precipitation regimes. This behavior is consistent with observations from C-Band SAR rainfall retrieval such as the future rainfall product of the Sentinel-1 constellation.

These results demonstrate the feasibility of using SWOT KaRIn high-resolution products for robust rainfall estimation, particularly in tropical and equatorial regions. By unlocking precipitation data in data-sparse regions, this approach offers a significant contribution to global precipitation monitoring and hydrological modeling.


How to cite: Picard, B., Colin, A., and Husson, R.: Estimating precipation in open ocean with SWOT at sub-kilometer resolution, EGU General Assembly 2026, Vienna, Austria, 3–8 May 2026, EGU26-20219, https://doi.org/10.5194/egusphere-egu26-20219, 2026.

EGU26-20675 | ECS | Posters on site | HS6.6

SWOT enables the regional quantification of a record water stock fluctuation in the shallow lakes of the Pampas following a multi-year drought 

Paula Torre Zaffaroni, Marcos Niborski, and Esteban Jobbágy

In flat sedimentary landscapes, shallow lakes and ponds (hereafter, SLPs) are a highly dynamic component that provides habitat for local and migratory fauna, water resources for surrounding vegetation and livestock, as well as regulation of local climate and biogeochemical fluxes. In the Pampas of central Argentina, SLPs are highly sensitive to precipitation and evapotranspiration fluctuations, displaying strong multi-year (rather than seasonal) expansion-recession cycles. Here, with the aid of SWOT data, we report for the first time the volume stored by these SLPs, leveraging recent historical records of their recession minimum (early 2023) and subsequent expansion rate (2023-2025) and maximum (late 2025). This hydroclimatic turnover in concurrence with the deployment of the satellite mission provides a unique opportunity to study local to regional changes in water surface elevation, area, and inferred volumetric changes in small and temporary water bodies. 
We focus our study on the “Pampa Interior Plana” subregion, with 85,000 km2 and regional slopes < 0.01%, hosting > 50,000 SLPs of a median area of 1.3 ha that cover 10% of the region on the long-term average. We tracked the five highest rainfall events between October 2023 and December 2025 (40-130 mm), and corresponding Lake-SP-derived water surface elevation and area changes at regional (> 7,000 water bodies) and local (ten SLPs ranging 0.5-2000 ha) scales.
Preliminary results indicate directional increases in elevation over the whole region of up to 3 meters between the driest state and the maxima observed in 2025, which translates into more than 5 billion cubic meters of stored water. When comparing individual SLP responses to a gradient of rainfall intensity, a marked heterogeneity can be observed, with some systems exhibiting rapid surface elevation and area increases, others showing less-sensitive variations in elevation. This variability suggests either (a) the strong modulation by antecedent conditions in soil moisture and water table level, (b) morphometric differences between these shallow water bodies dictating e.g., predominantly lateral vs. combined lateral and vertical expansion, or (c) difficult to isolate, evaporative forcings between successive SWOT observations. Importantly, this work illustrates the insights that SWOT enables into the hydrological functioning of extensive lowland freshwater systems.

How to cite: Torre Zaffaroni, P., Niborski, M., and Jobbágy, E.: SWOT enables the regional quantification of a record water stock fluctuation in the shallow lakes of the Pampas following a multi-year drought, EGU General Assembly 2026, Vienna, Austria, 3–8 May 2026, EGU26-20675, https://doi.org/10.5194/egusphere-egu26-20675, 2026.

EGU26-21648 | ECS | Posters on site | HS6.6

Estimation of river discharge in areas without statistics using SWOT satellite  

Sepideh Hazhir and Alireza Gohari

Monitoring global river discharge is fundamentally limited by the sparse distribution and ongoing decline of ground-based gauging stations. This observational gap is most critical in "ungauged basins," where lack of data hinders water resource management and flood forecasting. The Surface Water and Ocean Topography (SWOT) satellite mission serves as a transformative solution, providing the first global inventory of Earth’s surface water by measuring river height, width, and slope from space.

Estimating discharge from satellite observations is a complex inverse problem because key hydraulic parameters, such as river bathymetry (bottom elevation) and bed roughness, are unknown in ungauged regions. This research explores various advanced methodologies to bridge this gap by integrating satellite-derived measurements of water surface elevation, width, and slope into hydraulic models. These approaches allow for the simultaneous estimation of unknown parameters and river flow, providing a globally consistent, observation-based record of discharge even in basins where ground-based statistics are entirely unavailable

The studies demonstrate that the unique spatial coverage of SWOT allows for a transition from traditional single-point calibration to a "multi-point" parameter selection approach. This strategy uses observations from numerous points across a river network, which significantly improves the model's ability to identify the correct hydrologic parameters compared to relying on a single virtual gauge.

While the satellite data contains inherent measurement noise and systematic biases, the spatially distributed nature of the observations helps compensate for these errors. The research indicates that SWOT is particularly effective at resolving temporal variations in discharge, providing a reliable record of hydrologic events even when absolute discharge values carry uncertainty. However, the effectiveness of the mission can be influenced by river "flashiness"—basins with very rapid changes in flow may be harder to characterize due to the satellite's specific overpass timing.

SWOT observations provide a vital resource for constraining hydrological processes globally. By enabling the calibration of hydrologic models in previously unmonitored regions, the mission allows for a better understanding of how streamflow responds to rainfall. This capability is expected to lead to transformative science in global hydrology, offering a consistent and observation-based measure of discharge that far exceeds the accuracy of existing uncalibrated global models.

How to cite: Hazhir, S. and Gohari, A.: Estimation of river discharge in areas without statistics using SWOT satellite , EGU General Assembly 2026, Vienna, Austria, 3–8 May 2026, EGU26-21648, https://doi.org/10.5194/egusphere-egu26-21648, 2026.

EGU26-23237 | Posters on site | HS6.6

Using SWOT KaRIn Backscatter and SMRT Modeling to Link Snow Properties with Melt‑Driven Water Level 

Corinne Bourgault-Brunelle, Campbell Browser, and Grant Guun

This study investigates the potential of the Surface Water and Ocean Topography (SWOT) mission to contribute to the study of snow cover and its hydrological impacts. Preliminary results indicate promising capabilities for detecting and potentially characterizing snow covers. This additional information can help interpret water‑level variations that are directly influenced by snow quantity and snowmelt processes in northern regions during the spring melt season. To better understand the behavior of the KaRIn backscatter signal over snow, in situ observations, reanalysis products, and modelled backscatter data generated with the Snow Microwave Radiative Transfer (SMRT) model are compared with SWOT measurements. This integrated analysis allows us to examine both the sensitivity of KaRIn to snow cover and the associated SWOT‑derived water‑elevation changes. Overall, this work contributes to ongoing efforts aimed at advancing the remote sensing of snow properties—such as snow water equivalent—and improving our ability to link snowpack evolution with hydrological responses.

How to cite: Bourgault-Brunelle, C., Browser, C., and Guun, G.: Using SWOT KaRIn Backscatter and SMRT Modeling to Link Snow Properties with Melt‑Driven Water Level, EGU General Assembly 2026, Vienna, Austria, 3–8 May 2026, EGU26-23237, https://doi.org/10.5194/egusphere-egu26-23237, 2026.

The Synthetic Aperture Radar (SAR) frequency on the Surface Water and Ocean Topography (SWOT) Mission is Ka-band with an 8mm wavelength. In contrast, lower frequencies, such as those from NISAR and Sentinel-1, are the preferred method for most land surface studies because they have all-weather capabilities, and they can penetrate vegetation to reveal sub-canopy ground deformations, and they make water detection easy as water surfaces are uniform. Lower frequencies make these types of vegetation and surface water observations easier, while higher frequencies make these observations harder. Because of this, as a high-frequency system, SWOT was never designed to penetrate canopies or examine ground deformations. Rather, the high frequency from SWOT was selected for its potential to produce very high-resolution observations and have strong sensitivities to surface water, with the primary goals of measuring water surface elevations and water surface extents. Despite this, recent studies being published have demonstrated SWOT sensitivities related to 1) wind-driven water surface roughness, 2) vegetation structure, and 3) sub-canopy ponding and soil moisture. This presentation highlights progress in examining SWOT observations for Even More Than Surface Water Topography in support of improving SWOT discharge algorithms and other critical water cycle algorithms, such as for evaporation, transpiration, and canopy interception, for further-reaching improvements to water resources research.


How to cite: Fayne, J.: More Phenomenology: Updates to Using the Surface Water and Ocean Topography (SWOT) Ka-band Satellite for Novel Inland Retrievals of Hydrological Parameters, EGU General Assembly 2026, Vienna, Austria, 3–8 May 2026, EGU26-23252, https://doi.org/10.5194/egusphere-egu26-23252, 2026.

Irrigation water management is a critical factor that influences crop biomass, yield, and water usage, since irrigation makes the crop development independent of rainfall. Poor irrigation management can result in many problems on the farm and off the farm, such as waterlogging, erosion, and non-point source pollution. Therefore, improving irrigation water-use-efficiency is essential to reduce the amount of water needed without penalizing the yields. Considering the growing competition for water resources, there is a need to explore novel methods for quantifying and enhancing water use efficiency in irrigated fields, such as Unmanned Aerial Vehicle (UAV)-based remote sensing. This study integrates UAV-derived vegetation indices with machine-learning (ML) algorithms to quantify biomass and yield response of rice under alternate wetting and drying (AWD) and wheat under different irrigation methods (drip, sprinkler, and flood) with variable rates of crop evapotranspiration (100%, 75%, 50% and 0% rainfed treatment) across two seasons of the rice-wheat cropping system in Roorkee, India. The biomass and yield results obtained from the different ML algorithms were compared. During the training process of the ensemble random forest model, it performed better with a higher KGE (0.91) and a lower value of NRMSE (0.033), and a minimal PBIAS of 0.13%. The ensemble random forest model performed better during the testing process of the rice yield estimation (R2 = 0.60, KGE = 0.71, PBIAS = −2.26%, NRMSE = 0.136). For wheat yield estimation, training results were similar with strong model performance (R2 = 0.8137, KGE = 0.83, PBIAS = 1.36%, NRMSE = 0.470). The UAV-ML workflow captured both the fine-scale spatial variability needed for site-specific field decisions and the process understanding needed for generalization across the seasons. This integrated workflow supports the UN Sustainable Development Goals (SDGs), specifically SDG 2 (Zero Hunger) and SDG 6 (Clean Water and Sanitation).

How to cite: Kumar Vishwakarma, S., Kothari, K., and Pandey, A.: Spatial Mapping of Biomass and Yield of Rice-Wheat Cropping Systems across Different Irrigation Methods Using UAV Images and Machine Learning Algorithms , EGU General Assembly 2026, Vienna, Austria, 3–8 May 2026, EGU26-452, https://doi.org/10.5194/egusphere-egu26-452, 2026.

EGU26-1139 | PICO | HS6.7

Floodalyzer: A QGIS Plugin for Accessible and Rapid Flood Event Assessment 

Luisa Fuest and Antara Dasgupta

Floods are among the most devastating natural disasters, causing significant loss of life and economic damage. As extreme flood events become more frequent, rapid and accessible flood analysis tools are crucial in guiding early recovery efforts. This study presents the QGIS plugin ‘Floodalyzer’ developed to provide a quick and easy workflow for flood event analysis. By automating the processing and visualization of flood extent data from the Global Flood Monitoring System (GFM), derived from remote sensing, in combination with building footprints from various data sources, the plugin enables users to analyze past flood events without requiring expert knowledge or expensive proprietary software.

Floodalyzer operates within the widely used open-source GIS platform QGIS, making it highly accessible. Users manually download raster data and shapefiles from the web, which serve as inputs for automated analysis. The plugin then processes the data and generates output files, including a shapefile showing which buildings were flooded and for how long. Additionally, it compiles a HTML report including graphs that further describe the area of interest and summarize the plugin’s results (e.g. Building Footprint Heatmap, Observed Flood Extent Raster Calendar Display, Flooded Area Duration Bar Chart). The effectiveness of the tool was evaluated using case studies in Pakistan and Germany, where results were compared against CEMS’s Rapid Mapping Product. The CEMS product was not captured at the time of maximum flooding and therefore shows smaller inundated areas in many places compared to the plugin’s results. However, the locations and overall shapes of the flooded areas are generally consistent.

The case studies highlight the unique selling point of Floodalyzer – it’s ability to process flood extent data over extended time periods to analyze flood duration and damage, which enables a more comprehensive analysis of the available data. At the same time the results highlight uncertainties in flood extent, primarily originating from the GFM input data. Large exclusion mask areas indicate zones of high uncertainty, especially in urban environments where flood detection is more challenging. Temporal uncertainties also arise from gaps in satellite coverage, limiting data availability, especially in regions between the tropics.

Future improvements will focus on reducing runtime, and integrating statistical uncertainty assessments in the plugin’s output with human-readable explanations. Further, automated GFM data retrieval from the Global Flood Awareness System automating the download of the flood masks given an input AOI, would eliminate the need for manual downloads and thereby streamline the analysis process. By bridging the gap between high, complex data amounts and the need for a rapid response to flooding events, this tool provides decision-makers with a sound basis for dealing with the impacts of flooding in the response and recovery phase. Floodalyzer thus supports improved flood management through broader uptake of remotely sensed flood information, by lowering barriers to accessibility for flood extent data.

How to cite: Fuest, L. and Dasgupta, A.: Floodalyzer: A QGIS Plugin for Accessible and Rapid Flood Event Assessment, EGU General Assembly 2026, Vienna, Austria, 3–8 May 2026, EGU26-1139, https://doi.org/10.5194/egusphere-egu26-1139, 2026.

Extreme rainfall events have become more frequent and intense under climate change, presenting increasing challenges for hydrological monitoring and flood risk management. High-resolution rainfall observations are essential for capturing the spatial and temporal variability of storm events, yet conventional rain-gauge networks suffer from limited spatial coverage and cannot resolve rapidly evolving convective structures. Moreover, high-intensity rainfall events are inherently rare in natural settings, resulting in data gaps in upper rainfall categories. To address this limitation, we integrate natural rainfall observations with controlled artificial rainfall experiments to construct a comprehensive and balanced multi-class dataset covering 0–70 mm/hr at 5 mm/hr intervals. We develop a multimodal deep learning framework that jointly leverages rainfall imagery and acoustic measurements for rainfall-intensity estimation. The two sensing modalities provide complementary physical information: imagery captures streak morphology, drop density, and spatial distribution patterns, while acoustics encode drop momentum, kinetic energy, and impact signatures. Neither modality alone fully characterizes rainfall processes across all intensity ranges; by combining them, the model benefits from richer and more discriminative features. Two-second audio segments are converted into log-mel spectrograms, and a Cross-Attention fusion mechanism enables the network to selectively emphasize the most informative cues from each modality for different rainfall categories. Image-based data augmentation such as horizontal flipping further expands the training space and improves model generalization.

Compared with previous studies that relied on single-modality inputs or coarse categorical schemes, our framework achieves a substantially finer classification resolution (0–70 mm/hr in 5-mm/hr bins) and exhibits improved discrimination between adjacent intensity levels. The multimodal architecture consistently outperforms single-modality baselines, with the performance gains being particularly notable in the moderate-to-heavy rainfall range, where the model achieves higher classification accuracy, highlighting the benefits of true cross-modal complementarity. The integration of artificial and natural rainfall further produces a balanced and physically representative dataset that captures both controlled high-intensity scenarios and real-world variability.Overall, this study demonstrates the potential of multimodal sensing and deep learning to advance rainfall monitoring capabilities. The proposed non-contact, low-cost, and high-resolution approach offers a promising pathway for enhancing rainfall observation in regions with sparse gauge coverage, strengthening flood early warning systems, and supporting real-time hydrological applications under a changing climate.

How to cite: Lin, C.-C. and Ho, H.-C.: Cross-Attention Multimodal Learning Using Image and Audio for Rainfall Intensity Estimation, EGU General Assembly 2026, Vienna, Austria, 3–8 May 2026, EGU26-2660, https://doi.org/10.5194/egusphere-egu26-2660, 2026.

EGU26-10725 | ECS | PICO | HS6.7

On the optimisation of numerical weather prediction model configuration for improved flood forecasting 

Elena Leonarduzzi, Katrin Ehlert, David Leutwyler, and Massimiliano Zappa

Hydrological forecasts are essential for the timely and accurate prediction of flooding events, which are among the most impactful natural hazards for both infrastructure and human life in Europe and many other regions worldwide. Most existing flood warning systems are supported by hydrological models. Their accuracy depends not only on the representativeness and proper calibration (when required) of the model itself, but also on the quality of its inputs. While static inputs, particularly soil parameters, are highly uncertain, weather forecasts are arguably the most influential drivers.

In this study, we recreate the entire operational modelling framework used in Switzerland. Weather forecasts are provided by ICON (MeteoSwiss) and are used as input for WaSiM (FOEN), which produces streamflow predictions and issues warnings when necessary. We focus on several case studies, including selected catchments (e.g., Thur) and historical events that exceeded national flood warning levels (e.g., 30 May–2 June 2024).

This setup allows us to experiment with different configurations of the numerical weather prediction (NWP) model and to assess their downstream impacts on hydrological forecasts. We test different lead times to evaluate how early flood peaks can be detected, varying ensemble sizes to determine how many members are required to capture “extreme” flooding scenarios, and different spatial resolutions (500m – 2km) to assess the impact of resolving small-scale processes (e.g., convection).

Model performance is evaluated using classical hydrological metrics (NSE, KGE, RMSE, etc.), as well as more operationally relevant metrics for warning systems, such as whether thresholds are exceeded, how early exceedances occur, and their duration. Finally, we test different products for initializing model runs, either interpolated station-based products or NWP analysis products and assess the influence of the hydrological model itself through a sensitivity analysis of its parameters.

The results of this study will shed light on how NWP model configurations affect flood forecasting and, in turn, improve flood early warning design and decision-making.

How to cite: Leonarduzzi, E., Ehlert, K., Leutwyler, D., and Zappa, M.: On the optimisation of numerical weather prediction model configuration for improved flood forecasting, EGU General Assembly 2026, Vienna, Austria, 3–8 May 2026, EGU26-10725, https://doi.org/10.5194/egusphere-egu26-10725, 2026.

EGU26-15447 | ECS | PICO | HS6.7

Remote sensing–based urban floodplain mapping: the added value of UAV-LiDAR compared to global and GNSS-derived DEMs 

Eduardo Luceiro Santana, Laura Martins Bueno, Gabriel Souza da Paz, Rafael De Oliveira Alves, Tamara Leitzke Caldeira, Samuel Beskow, Aryane Araujo Rodrigues, Julio Cesar Angelo Borges, Denis Leal Teixeira, Gustavo Adolfo Karow Weber, and Diuliana Leandro

Flood risk management in urban floodplains strongly depends on the spatial resolution of digital elevation models (DEMs), which control floodplain connectivity, flow pathways, and surface storage. In many developing countries, flood-related studies rely predominantly on publicly available global DEM products, whose spatial resolution and vertical accuracy are often insufficient to represent subtle topographic gradients, densely vegetated floodplains, and complex urban microtopography. These limitations are particularly critical in low-relief environments, where small elevation differences exert a disproportionate control on inundation extent and flood dynamics. This issue has become increasingly evident in subtropical lowland regions of southern Brazil, where extreme flood events in 2023–2024 exposed shortcomings of commonly used global DEMs for urban floodplain applications. Therefore, the Piratini River watershed has been the focus of ongoing efforts to develop a real-time hydrological forecasting system to support decision-making during flood emergencies under data-scarce conditions. The urban areas of Pedro Osório and Cerrito along the main floodplain of the Piratini River constitute the core operational domain of this system and are recurrently affected by flooding. The watershed drains approximately 4,700 km² upstream of the municipalities and is characterized by low relief and wide floodplains. This study investigates the applicability of publicly available global DEMs and locally derived high-resolution elevation datasets for floodplain mapping and hydrological–hydrodynamic applications in these urban areas. A comparative assessment was conducted using two global DEM products - ALOS PALSAR (12.5 m) and ANADEM (30 m) - and three locally derived DEMs generated from high-resolution surveys. Local datasets include two Global Navigation Satellite System (GNSS) Real-Time Kinematic (RTK)–based surveys (static and kinematic) acquired with an Emlid Reach RS2+ receiver using real-time corrections via NTRIP (Networked Transport of RTCM via Internet Protocol), and an unmanned aerial vehicle (UAV)–based Light Detection and Ranging (LiDAR) survey acquired with a DJI Matrice 350 RTK platform equipped with a Zenmuse L2 sensor. The static GNSS survey comprised 2,921 points, while the kinematic survey yielded approximately 34,000 at a 1-s sampling interval. The UAV–LiDAR survey covered 21.5 km² of the urban floodplain. Raw elevation data from local surveys were converted from ellipsoidal to orthometric altitude using the hgeoHNOR2020 geoid model. GNSS-derived altitudes were interpolated using ordinary kriging in ArcGIS Pro. LiDAR data were processed in DJI Terra, resulting in a high-density point cloud (> 98 points m⁻²) and a terrain model with decimetric spatial resolution. Results reveal clear differences among datasets. Global DEMs show limited capability to represent floodplain connectivity and microtopography, particularly in vegetated areas. GNSS RTK–based DEMs provide intermediate performance but are constrained by survey logistics and GNSS signal degradation. In contrast, the UAV-based LiDAR DEM provides the most detailed and hydrologically meaningful representation of floodplain morphology, including vegetated and off-street areas, enabling improved delineation of flow paths and floodplain storage. These findings highlight the critical role of high-resolution elevation data for floodplain mapping and hydrological–hydrodynamic analyses in low-relief urban environments, reinforcing UAV-based LiDAR as a key remote sensing tool for risk assessment and climate adaptation in data-scarce regions.

How to cite: Luceiro Santana, E., Martins Bueno, L., Souza da Paz, G., De Oliveira Alves, R., Leitzke Caldeira, T., Beskow, S., Araujo Rodrigues, A., Angelo Borges, J. C., Leal Teixeira, D., Adolfo Karow Weber, G., and Leandro, D.: Remote sensing–based urban floodplain mapping: the added value of UAV-LiDAR compared to global and GNSS-derived DEMs, EGU General Assembly 2026, Vienna, Austria, 3–8 May 2026, EGU26-15447, https://doi.org/10.5194/egusphere-egu26-15447, 2026.

Earthquakes can cause rapid changes in elevation and topographic relief, which, in turn, affect hydrologic regimes and modify flood risk in affected regions. The regulatory floodplain, an area of elevated flood hazard adjacent to water bodies, is critical for managing exposure and mitigating flood risk in nations. Shifts in the distribution of flood risk in regions impacted by seismic activity constitute a compound hazard. Tools are needed to enable reevaluation of regulatory flood maps after seismic events, minimizing exposure of affected populations to additional flood risk. In the United States, floodplain mapping is primarily implemented by the Federal Emergency Management Agency (FEMA), known as regulatory flood mapping. They are based on Hydraulic modeling and delineate the floodplain for areas representing a 1% annual chance of flooding. The floodplain map is not updated regularly by FEMA; it relies on manual, costly revision processes and does not consistently use current, high-resolution, and up-to-date elevation data. Therefore, these maps will struggle to detect recent flood behavior, thereby increasing flood risks and limiting the effectiveness of regulatory flood mapping management. This study presents a rapid, satelliteintegrated framework for updating regulatory flood maps in regions exposed to topographic shifts from earthquakes. Using the 2019 Ridgecrest earthquake sequence as a case study in the North and South Fork Kern River basin, California. Specifically, we used the U.S Geological Survey 3DEP/NED with 10-m resolution DEM, which represented the pre-earthquake topography, integrated with a vertical displacement data derived from InSAR time series analysis to generate a corrected post-earthquake DEM. Both DEMs were then used in the HEC-RAS model to quantify changes in floodplain extent and inundation patterns under multiple return-period scenarios. To assess model performance and quantify the accuracy improvements in regulatory flood mapping, observed flood inundation maps derived from high-resolution PlanetScope satellite imagery were used in the validation. Our integrated approach demonstrates how InSAR-updated topography improves floodplain mapping accuracy and enables rapid updates to regulatory flood maps. HEC-RAS modeling results across three reaches along the North and South Fork Kern River consistently showed larger flood extents in post-earthquake simulations relative to pre-earthquake conditions. Validation using PlanetScope-derived flood inundation maps demonstrates improved model performance for the post-earthquake DEM, with an F-score 84.52% compared to pre-earthquake simulations, using an optimal NDWI threshold of 0.35.

How to cite: Al-Amry, N. and Carter, E.: Assessing Fluvial Flood Risk Changes Using an Updated Digital Elevation Model Post-Earthquake: A Case Study, EGU General Assembly 2026, Vienna, Austria, 3–8 May 2026, EGU26-15883, https://doi.org/10.5194/egusphere-egu26-15883, 2026.

EGU26-16153 | ECS | PICO | HS6.7

Virtual Reality–Based Visualization of Urban Flood Dynamics Using SWMM 

Jiye Park, Minjeong Cho, Gihun Bang, Minhyuk Jeung, Daeun Yun, and Sang-Soo Baek

Urban flooding and water pollution have become increasingly severe challenges worldwide as a result of climate change and rapid urbanization, posing substantial risks to public safety, urban infrastructure, and environmental quality (Mark et al., 2004; Andrade et al., 2018). Intense rainfall events frequently exceed the capacity of urban drainage systems, leading to surface inundation and the transport of pollutants into receiving water bodies. To address these issues, numerical hydrological and hydraulic models have been widely applied to simulate urban runoff processes, sewer network performance, and water quality dynamics. Among these models, the Storm Water Management Model (SWMM) is one of the most commonly used tools for analyzing urban drainage systems and pollutant transport under various rainfall scenarios (Gironás et al., 2010). Despite its widespread adoption and robust modeling capabilities, SWMM primarily presents simulation outputs in the form of numerical tables and two-dimensional graphs. This conventional output format limits intuitive interpretation and restricts the ability to analyze spatial and temporal flood dynamics within complex urban environments (Zhang et al., 2016). This study proposes a virtual reality (VR)–based visualization framework that integrates SWMM simulation results with the Unity game engine to enhance the interpretability of urban flooding and water quality simulations. In the proposed framework, rainfall–runoff processes, inundation depth, and pollutant diffusion are first simulated using SWMM for a selected urban catchment. The resulting hydrological and hydraulic outputs are then converted into data formats compatible with the Unity environment. A three-dimensional urban model is constructed to represent surface topography and drainage infrastructure, enabling the visualization of flooding processes in a spatially explicit manner. Flood extent and water depth are visualized dynamically within the virtual environment, allowing users to observe flood propagation over time. In addition, pollutant transport is represented using color-based visualization techniques, where variations in color indicate changes in pollutant concentration. This approach provides an intuitive representation of water quality degradation during flood events. The VR system supports interactive exploration through the use of head-mounted displays and motion interfaces, enabling users to navigate the virtual urban space and examine flooding and pollution patterns from multiple perspectives. The immersive nature of the VR environment enhances spatial perception and facilitates a more comprehensive understanding of complex flood processes compared to traditional two-dimensional visualization methods. By allowing users to directly experience simulated flood scenarios, the proposed framework supports more effective interpretation of model results and improves communication of flood risk information. The results of this study demonstrate that VR-based visualization has significant potential as a decision-support tool for urban flood risk assessment, emergency response planning, and disaster management training.

How to cite: Park, J., Cho, M., Bang, G., Jeung, M., Yun, D., and Baek, S.-S.: Virtual Reality–Based Visualization of Urban Flood Dynamics Using SWMM, EGU General Assembly 2026, Vienna, Austria, 3–8 May 2026, EGU26-16153, https://doi.org/10.5194/egusphere-egu26-16153, 2026.

The accelerating impacts of climate change and subsequent impact on urban environments such as flooding risks, extreme heat and heavy rain, necessitate rapid and integrated planning strategies. Urban Digital Twins (UDT) have emerged as valuable tools, offering the ability to dynamically model, simulate, and visualize complex processes to support data-driven decision-making. However, a comprehensive strategy that supports the integration of the multitude of UDTs that is being developed specifically into climate adaptation measures, while ensuring interoperability, digital sovereignty and stakeholder participation, is still lacking.

This contribution introduces the collaborative project LINKUDT (“Coordination and Collaboration Platforms for the Synergetic Conception, Development, Interoperability, and Digital Sovereignty of Urban Digital Twins”). Funded by the German Federal Ministry of Research, Technology and Space for a duration of 48 months, LINKUDT serves as the overarching companion research project for six regional real-world laboratories across Germany. The primary objective of the project is to establish UDTs as central instruments for speeding up urban planning processes to improve climate adaptation and sustainable urban development by identifying synergies and supporting interoperability.

A core challenge addressed by LINKUDT is the creation of interoperable and sustainable data infrastructures. Following the FAIR principles (Findable, Accessible, Interoperable, Reusable), the project aims at advancing standards that allow for the efficient integration of heterogeneous data sources, such as sensor networks and environmental models. To prevent vendor lock-in and ensure long-term data portability, LINKUDT emphasizes digital sovereignty through the use and further development of open-source software modules and standards (e.g., OGC API Processes, SensorThings API, CityGML).

Further key outcomes of LINKUDT include training modules for stakeholders /e.g. public administration, developers), and policy recommendations for the nationwide application of digital twin technologies.

By linking the National Research Data Infrastructure for Earth System Sciences (NFDI4Earth) with administrative data infrastructures (GDI-DE), LINKUDT creates a scalable model for evidence-based urban governance. 

With our contribution we aim to reach out to further digital twin initiatives related to climate change to initiate further exchange on interoperability, digital sovereignty and emerging technologies.

How to cite: Jirka, S., Radtke, J., and Reiß, J.: LINK Urban Digital Twinning (LINKUDT): Advancing Climate Adaptation and Planning Acceleration through Interoperable Digital Twin Ecosystems, EGU General Assembly 2026, Vienna, Austria, 3–8 May 2026, EGU26-17814, https://doi.org/10.5194/egusphere-egu26-17814, 2026.

Non-contact river monitoring is essential for understanding hydraulic phenomena and providing real-time disaster mitigation information during large-scale floods. Our previous research (Yorozuya et al., 2026) developed a method to inversely estimate riverbed elevation by integrating UAV-derived surface velocity (via PIV) and water surface geometry (via LiDAR) into a Physics-Informed Neural Networks (PINNs) framework using automatic differentiation of the governing equations. However, that approach relied on a uniform velocity correction factor across the entire reach, which led to significant underestimations of water depth in complex flow fields, such as those near spur dikes.

In this study, we propose an enhanced estimation algorithm that incorporates secondary flow effects into the momentum equations to improve bathymetric accuracy. Following the methodology of Iwasaki et al. (2013), we identify regions where surface velocity vectors exhibit curvature and account for the resultant increase in flow resistance. This approach aims to correctly identify water depth even in regions where surface velocities are low but hydraulic complexity is high.

Field experiments were conducted in a reach of the Kurobe River (bed slope ≈1/100, 20m wide by 50m long), characterized by a spur dike in the center of the domain. High-resolution water surface geometry and velocity fields were captured using a UAV-mounted LiDAR (DJI Zenmuse L2) and a photogrammetric camera (P1). These data were integrated into the PINNs loss functions, which were defined based on the continuity equation, the shallow water equations, and the conservation of discharge across cross-sections.

The results demonstrated a marked improvement in estimation reliability, particularly in the separation zones downstream of the spur dike. Without secondary flow considerations, the model estimated near-zero water depth in large wake vortices due to the low surface velocities. By incorporating secondary flow effects, the model correctly evaluated the increased apparent roughness due to flow curvature, yielding deeper and more accurate bathymetry consistent with ground-truth data obtained by boat-mounted ADCP. This study highlights the potential of using only UAV-based remote sensing to achieve high-precision bathymetric inversion in morphologically complex river environments.

Iwasaki, T., Shimizu, Y., and Kimura, I. (2013). An influence of modeling of secondary flows to simulation of free bars in rivers. Journal of Japan Society of Civil Engineers, Ser. B1 (Hydraulic Engineering), Vol. 69, No. 3, 147–163.

Yorozuya et al. (2016) Seeing the unseen, RiverFlow2026 (Under review)

How to cite: Yorozuya, A., Inaba, R., and Kudo, S.: Bathymetry Estimation in Complex River Morphology using UAV-based Remote Sensing and Physics-Informed Neural Networks Incorporating Secondary Flow Effects, EGU General Assembly 2026, Vienna, Austria, 3–8 May 2026, EGU26-17859, https://doi.org/10.5194/egusphere-egu26-17859, 2026.

LiDAR-derived digital elevation models (DEMs) are increasingly adopted in hydrodynamic flood modelling; however, their direct use, particularly in complex urban environments, remains problematic. Although LiDAR provides high-resolution surface information and supports the generation of bare-earth digital terrain models (DTMs), unresolved flow-permeable structures such as bridges, culverts, and elevated transport infrastructure, together with micro-scale urban features including narrow river channels, pathways, kerbs, and missing submerged channel bathymetry, systematically distort flow connectivity and channel conveyance. These deficiencies introduce structural biases into flood simulations, yet existing studies typically address individual features in isolation, limiting transferability and large-scale applicability.

This study reframes LiDAR DEM preprocessing as a process-based investigation into how unresolved terrain features bias flood hydraulics and introduces an automated, physically consistent terrain reconstruction framework that explicitly targets these bias mechanisms. The framework is implemented at the national scale using the 2 m LiDAR-derived DTM for England.

Three dominant sources of hydrodynamic bias are addressed. First, flow-permeable structures, including bridges, culverts, and elevated transport infrastructure, are systematically identified using observed water surface information and river network data, and the terrain beneath these structures is reconstructed using interpolation-based techniques to restore hydraulic connectivity. Second, impermeable urban features, such as buildings and kerbs, are selectively elevated while preserving longitudinal connectivity along roads and pathways, ensuring realistic overland flow routing. Third, submerged river bathymetry is reconstructed using empirical relationships between river width and water depth to recover channel conveyance absent from bare-earth DTMs.

The resulting terrain dataset is directly applicable to hydrodynamic flood modelling without manual intervention. Sensitivity analyses across multiple historical flood events demonstrate that restoring flow connectivity and reconstructing channel bathymetry exert distinct and flow-regime-dependent controls on simulated flood extent, water levels, and discharge. In particular, unresolved flow-permeable structures predominantly govern urban inundation patterns, whereas missing bathymetry represents the primary source of error in channel hydraulics.

By systematically isolating and correcting key terrain-induced bias mechanisms, this study provides generalisable insights into the process sensitivity of catchment and urban flood models to DEM representation and offers a scalable pathway for improving large-scale flood simulations using LiDAR data.

How to cite: Chen, H., Tong, X., and Liang, Q.: Reconstructing Flow Connectivity and Channel Conveyance in LiDAR-Derived Terrain for National-Scale High-Resolution Flood Modelling, EGU General Assembly 2026, Vienna, Austria, 3–8 May 2026, EGU26-22261, https://doi.org/10.5194/egusphere-egu26-22261, 2026.

EGU26-693 | ECS | Posters on site | HS6.8

Analysing the Crop Model Inversion Technique in the AquaCrop model under varying levels of Rainfall, Initial Soil Moisture, and Soil Texture 

Aatralarasi Saravanan, Daniel Karthe, Boomiraj Kovilpillai, and Niels Schütze

Reliable identification of agro-hydrometeorological change in developing countries is hindered by sparse and declining monitoring networks as well as limited data-management capacity. Increasing access to accurate, high-resolution agro-hydrometeorological data would improve hydrological model predictions and ultimately support better decision-making. One promising strategy to address data scarcity is model inversion of crop simulation models, where time-resolved crop growth information at the field scale can act as a proxy for soil moisture and, by extension, irrigation amounts.

In this study, we evaluate a yield-based inversion approach within AquaCrop, in which the observed final crop yield is used as the inversion target to retrospectively estimate seasonal irrigation. Under uniform, continuously applied irrigation, inferred irrigation amounts were generally accurate, with errors within ±10%. Model performance was strongly affected by the soil’s available water storage capacity, which is governed by texture. Incorporating information on soil texture, irrigation pattern (continuous vs. non-continuous), and rainfall substantially improved inversion accuracy. In contrast, under non-uniform or non-continuous irrigation regimes, the method tended to overestimate irrigation substantially. These findings suggest that yield-constrained inversion can reliably estimate irrigation in controlled settings but is less robust under intermittent or spatially heterogeneous irrigation. As a next step, we will invert AquaCrop using temporally resolved vegetation data rather than final yield to better constrain soil-moisture dynamics and reduce bias under complex irrigation patterns.

How to cite: Saravanan, A., Karthe, D., Kovilpillai, B., and Schütze, N.: Analysing the Crop Model Inversion Technique in the AquaCrop model under varying levels of Rainfall, Initial Soil Moisture, and Soil Texture, EGU General Assembly 2026, Vienna, Austria, 3–8 May 2026, EGU26-693, https://doi.org/10.5194/egusphere-egu26-693, 2026.

EGU26-2359 | Orals | HS6.8

Remote Sensing-Based Estimation of Irrigation Water Use and Supply in the Amibara Irrigation Scheme, Ethiopia: A Multi-Scale Assessment  

Kirubel Mekonnen, Mulugeta Tadesses, Naga Manhoor Velpuri, Mohammed Abedella, Mansoor Leh, Komlavi Akpoti, Afua Owusu, and Abdulkarim H. Seid

Accurate estimation of irrigation water use and supply is essential for effective irrigation management, yet most withdrawals remain unmetered and unreported in many irrigation schemes. This study applied a remote sensing–based approach to quantify irrigation water use and supply in the Amibara Irrigation Scheme, Ethiopia. The irrigation component of crop evapotranspiration (Blue ET) was isolated using the Water Accounting Plus (WA+) framework and integrated with irrigation efficiency parameters to derive remote sensing–based irrigation supply (RbIS) estimates across multiple spatial scales. Moreover, we developed crop type maps for 2010 and 2024 and a digitized irrigation layout to evaluate irrigation performance using relative evapotranspiration (RET) and relative irrigation supply (RIS) and to compare changes between the two years.

Crop type mapping revealed a substantial decline in irrigated area, from 9,941 ha in 2010 to 4,532 ha in 2024.  RbIS showed  reasonable agreement with reported supply in 2010 (R² = 0.6) and measured supply in 2024 (R² = 0.8), though it consistently underestimated observed supply in both years. Irrigation distribution was relatively better in 2010, with 46% of blocks experiencing deficits compared to 70% in 2024, while excess irrigation decreased from 50% of blocks in 2010 to 26% in 2024.  RET and RIS estimates were generally consistent across most irrigation blocks, reinforcing the robustness of these performance indicators. However, irrigation performance varied substantially across blocks and canals, with irrigation deficits evident in both years. Key informant interviews and focus group discussions further corroborated these irrigation water deficits, supporting the remote sensing–based assessment. Overall, the methodology of this study is scalable for data-scarce regions and offers strong potential for operational irrigation monitoring to support targeted interventions.

How to cite: Mekonnen, K., Tadesses, M., Velpuri, N. M., Abedella, M., Leh, M., Akpoti, K., Owusu, A., and Seid, A. H.: Remote Sensing-Based Estimation of Irrigation Water Use and Supply in the Amibara Irrigation Scheme, Ethiopia: A Multi-Scale Assessment , EGU General Assembly 2026, Vienna, Austria, 3–8 May 2026, EGU26-2359, https://doi.org/10.5194/egusphere-egu26-2359, 2026.

EGU26-3046 | Posters on site | HS6.8

Integrating satellite vegetation indices and drought metrics for agro-hydrological monitoring of rainfed olive orchards 

Francisco Jesús Moral García, Nazaret Crespo-Cotrina, Francisco Javier Rebollo Castillo, Luis Padua, Paula Paredes, João A. Santos, and Helder Fraga

Rainfed olive orchards are highly vulnerable to drought in Mediterranean regions, where climate change is intensifying water scarcity and climatic variability. This study presents a spatio-temporal assessment of drought impacts on rainfed olive groves in two traditional olive-growing areas of the Iberian Peninsula: the Trás-os-Montes (TM) agrarian region in northeastern Portugal and the province of Badajoz (BA) in southwestern Spain. These regions share Mediterranean climatic conditions but differ in drought severity, land characteristics, and agro-environmental contexts.

Vegetation dynamics were analyzed over an eight-year period (2015–2023) using satellite data from the Harmonized Landsat–Sentinel-2 (HLSL30) product. Two vegetation indices were selected to characterize olive orchard conditions: the Soil-Adjusted Vegetation Index (SAVI), which reduces soil background effects in sparsely vegetated systems, and the Normalized Difference Moisture Index (NDMI), which is sensitive to canopy water content and vegetation moisture status. These indices enabled the evaluation of seasonal and interannual variability in vegetation response to water stress.

Drought conditions were quantified using the Mediterranean Palmer Drought Severity Index (MedPDSI), a drought indicator specifically adapted to Mediterranean climates and olive tree ecophysiology. The relationship between drought severity and vegetation response was examined through correlation and lagged-response analyses, allowing the identification of delayed vegetation reactions to drought events.

The results indicate clear regional contrasts in both drought characteristics and vegetation response. BA experienced more intense, prolonged, and frequent drought episodes than TM, particularly during the warm season. Seasonal variations in SAVI and NDMI were strongly correlated with MedPDSI values in both regions, with the strongest vegetation response observed at a lag of approximately two months. This delay reflects the cumulative physiological effects of water stress on olive trees rather than immediate responses.

Extreme drought years, especially 2017 and 2022, were associated with pronounced declines in both vegetation indices, indicating increased stress and reduced canopy vigor during the dry season. Rainfed olive orchards in BA showed greater susceptibility to long-term drought impacts, whereas TM exhibited slightly higher resilience, potentially related to milder climatic conditions or local environmental and management factors.

This study demonstrates the value of integrating satellite-derived vegetation indices with drought indicators to monitor drought impacts on rainfed olive systems. The proposed approach provides useful information for drought monitoring, risk assessment, and the development of adaptive management strategies aimed at improving the resilience and sustainability of Mediterranean olive orchards under ongoing climate change.

How to cite: Moral García, F. J., Crespo-Cotrina, N., Rebollo Castillo, F. J., Padua, L., Paredes, P., Santos, J. A., and Fraga, H.: Integrating satellite vegetation indices and drought metrics for agro-hydrological monitoring of rainfed olive orchards, EGU General Assembly 2026, Vienna, Austria, 3–8 May 2026, EGU26-3046, https://doi.org/10.5194/egusphere-egu26-3046, 2026.

EGU26-3047 | Posters on site | HS6.8

Integrating climatic aridity indices and satellite vegetation indicators for agro-hydrological monitoring of vineyard drought stress 

Francisco Javier Rebollo Castillo, Nazaret Crespo-Cotrina, Francisco Jesús Moral García, Luís Pádua, André M. Claro, André Fonseca, Luis Lorenzo Paniagua Simón, Abelardo García Martín, João A. Santos, and Helder Fraga

Vineyards in the Iberian Peninsula are highly sensitive to water stress driven by climate variability, particularly under the increasing frequency and intensity of drought events associated with climate change. Reliable, long-term indicators of water availability are therefore essential for monitoring vineyard vulnerability and supporting agro-hydrological assessment and adaptation strategies at regional scales. This study evaluates the performance of the De Martonne Aridity Index (DMI) as a climatic indicator for long-term monitoring of drought stress in vineyards across the Iberian Peninsula over the period 1993–2022.

Monthly DMI values were computed using bias-corrected temperature and precipitation data from the ERA5-Land reanalysis, allowing for a consistent characterization of aridity conditions over three decades. Vineyard conditions were independently assessed using the Vegetation Health Index (VHI), derived from satellite observations and spatially restricted to vineyard land-cover areas. The VHI integrates information on vegetation vigor and thermal stress, providing an effective proxy for plant response to water stress. Drought severity classes based on DMI were systematically compared with VHI-derived vegetation stress classes through spatial and temporal analyses.

The results reveal a strong correspondence between low DMI values and reduced VHI, particularly during periods classified as severe and extreme drought. This agreement indicates that the DMI effectively captures major water stress conditions affecting vineyard systems, despite its simple formulation and limited data requirements. Temporal analyses show that prolonged dry periods identified by DMI are consistently associated with sustained vegetation stress signals, while spatial patterns highlight a higher recurrence and persistence of drought impacts in central and southern regions of the Iberian Peninsula. In contrast, northern areas exhibit lower drought frequency and reduced vineyard vulnerability.

Overall, the findings demonstrate that the De Martonne Aridity Index provides a robust and practical indicator for regional-scale vineyard drought monitoring. When combined with satellite-based vegetation indices, DMI contributes valuable climatic context for agro-hydrological assessment, supporting drought impact analysis, water resource evaluation, and climate adaptation studies. Its simplicity and scalability make it particularly suitable for long-term monitoring frameworks and for complementing remote sensing approaches in viticultural water management under changing climatic conditions.

How to cite: Rebollo Castillo, F. J., Crespo-Cotrina, N., Moral García, F. J., Pádua, L., Claro, A. M., Fonseca, A., Paniagua Simón, L. L., García Martín, A., Santos, J. A., and Fraga, H.: Integrating climatic aridity indices and satellite vegetation indicators for agro-hydrological monitoring of vineyard drought stress, EGU General Assembly 2026, Vienna, Austria, 3–8 May 2026, EGU26-3047, https://doi.org/10.5194/egusphere-egu26-3047, 2026.

EGU26-5675 | ECS | Orals | HS6.8

From Water Deficits to Storage Solutions: A Remote Sensing–Based Water Balance Framework 

Afua Owusu, Felicia Yeboah, Naga Manohar Velpuri, Muluken Adamseged, Mansoor Leh, Komlavi Akpoti, Kirubel Mekonnen, and Petra Schmitter

Agriculture is the largest consumer of freshwater globally, yet reliable estimates of irrigation water requirements and withdrawals remain scarce, particularly in data-poor and rainfed-dominated regions. In sub-Saharan Africa, increasing climate variability and growing food demand are intensifying seasonal water stress and highlighting the need for improved water management and irrigation planning tools.

We present the Securing Water in Agriculture (SWAG) tool, an agro-hydrological framework that integrates remote sensing–derived evapotranspiration with land-use and crop data to quantify spatially and temporally explicit crop water demand, deficits, and irrigation surpluses. Beyond these, SWAG evaluates management interventions, including small-scale storage and water reallocation within irrigation schemes.

The framework was applied across Kenya’s central highlands from 2019 to 2023. Results indicate monthly deficit volumes are largest in the dry season from June to September, with particularly severe conditions in 2021 and 2022, when monthly deficits exceeded 150 million m³. Surplus volumes are present but generally smaller, typically remaining below 100 million m³. On a monthly basis, cropland deficit areas range from approximately 18,000 ha during wet months to up to 450,000 ha at the height of the dry season, whereas surplus areas in a given month are consistently smaller, varying between approximately 17,000 and 98,000 ha per month.

To support irrigation management and to meet the deficits, SWAG evaluates the spatial feasibility and seasonal performance of small-scale storage (e.g. 1,000 m³ farm ponds) through pond-scale water balance simulations. Results indicate that storage potential is highest in small headwater catchments, where potential pond densities locally exceed 25 ponds km⁻², while most catchments accommodate fewer than 10 ponds km⁻². On average, runoff volumes exceed 2,000 million m³ during the rainy season months (April–May and October–November), and pond water levels remain high during subsequent deficit periods, indicating that additional storage can generally offset deficits.

By coupling spatially and temporally explicit water demand analytics with storage and reallocation options, the SWAG framework helps close the agricultural water budget in data-scarce basins and provides a practical decision-support tool for improving irrigation management, water use efficiency, and climate resilience in vulnerable farming systems.

How to cite: Owusu, A., Yeboah, F., Velpuri, N. M., Adamseged, M., Leh, M., Akpoti, K., Mekonnen, K., and Schmitter, P.: From Water Deficits to Storage Solutions: A Remote Sensing–Based Water Balance Framework, EGU General Assembly 2026, Vienna, Austria, 3–8 May 2026, EGU26-5675, https://doi.org/10.5194/egusphere-egu26-5675, 2026.

EGU26-6080 | ECS | Posters on site | HS6.8

Detecting irrigation at catchment scale over recent years (2019-2025)  

Jackline Muturi, Sayantan Majumdar, Christopher Ndehedehe, and Mark Kennard

The use of satellite remote sensing for mapping the spatial-temporal extent of irrigation at catchment scale is a key ingredient for effective irrigation water management. A thresholding approach based on vegetation indices and evapotranspiration metrics  was applied in the Namoi catchment in Australia to detect irrigated areas. The results show that irrigation in the catchment is heterogeneous, with no consistent increasing or decreasing trend over the classification period. In addition, the method identifies irrigated area conservatively with a high precision and moderate accuracy when evaluated against independent reference data. The findings highlight the potential of the thresholding approach for agricultural water management. Further work will focus on refining this method and linking it to quantifying irrigation water use at catchment scale.   

How to cite: Muturi, J., Majumdar, S., Ndehedehe, C., and Kennard, M.: Detecting irrigation at catchment scale over recent years (2019-2025) , EGU General Assembly 2026, Vienna, Austria, 3–8 May 2026, EGU26-6080, https://doi.org/10.5194/egusphere-egu26-6080, 2026.

EGU26-6398 | ECS | Orals | HS6.8

Field-Scale Irrigation Source Attribution  

Musab Waqar and Landon Marston

Irrigated agriculture is a major freshwater user in the western United States, yet field-level information on whether irrigation relies on surface water, groundwater, or both remains limited. This lack of source attribution constrains water-scarcity assessments, curtailment analysis, and evaluations of irrigation efficiency, particularly where infrastructure and governance spatially decouple water sources from field locations. We present a data-driven framework for mapping field-level irrigation source access that integrates large-scale geospatial predictors with administrative water-rights information. The approach uses a two-stage probabilistic classification pipeline: first, estimating the likelihood of groundwater and surface-water access and then inferring conjunctive use from the structure and uncertainty of these probabilities. Preliminary findings suggest that single-source irrigation can be consistently identified at the field scale across diverse settings, whereas mixed-source conditions exhibit greater sensitivity to local context. This enables irrigation source information to be incorporated at the field scale, while explicitly identifying settings where local conditions govern source use. 

How to cite: Waqar, M. and Marston, L.: Field-Scale Irrigation Source Attribution , EGU General Assembly 2026, Vienna, Austria, 3–8 May 2026, EGU26-6398, https://doi.org/10.5194/egusphere-egu26-6398, 2026.

EGU26-6881 | ECS | Orals | HS6.8

An adaptive and unsupervised approach for irrigation detection at field scale from high-resolution soil moisture maps 

Sofia Rossi, Anna Balenzano, Davide Palmisano, Francesco P. Lovergine, Francesco Mattia, Michele Rinaldi, Sergio Ruggieri, Deodato Tapete, Patrizia Sacco, Alessandro Ursi, and Giuseppe Satalino

Monitoring irrigated areas and water requirements remains a key challenge in Earth Observation (EO), especially in regions experiencing growing water stress and agricultural intensification driven by rising demand and climate change [1-2]. An emerging methodology for detecting irrigated fields at large scale uses EO-derived high-resolution surface soil moisture maps (SSM). This approach can effectively segment irrigated and non-irrigated areas early in the season. Particularly, SSM derived from Synthetic Aperture Radar (SAR) data offer the resolution required to resolve irrigated fields and detect irrigation events, even before crop canopy development [3].

This study investigates the use of high-resolution (~100 m) SSM maps to detect irrigated fields in the Apulian Tavoliere agricultural district (Southern Italy), where winter cereals and tomato are the main cultivated crops. The SSM maps are derived from Sentinel-1, SAOCOM, and Sentinel-2 time series using the SMOSAR software developed at CNR-IREA [4]. The analysed data set covers the growing season 2024 and 2025. The irrigation detection is based on the application of the Constant False Alarm Rate (CFAR) algorithm. This methodology uses a sliding-window approach to classify the central pixel by comparing its value to a threshold derived from the probability distribution function of SSM values within the window, ensuring a fixed FAR. The result is the identification of fields showing higher SSM than their surrounding area. The probability distribution function adopted is the Gaussian Mixture, and the sliding window is a 3kmx3km square. Finally, the classified pixels are aggregated at the field scale using the parcel boundary information to evaluate the classification performance metrics.

Results indicate that the main factors affecting classification accuracy are satellite revisit time, vegetation stage, and radar frequency. Specifically, satellite revisit affects accuracy as SSM contrast decreases due to evapotranspiration, making detection challenging beyond three days after the irrigation. Furthermore, dense vegetation limits C-band SAR signal penetration into the soil, thereby ensuring detection is most effective during early crop growth. Analysis of the 2024 season shows that, at the start of growth, accuracy reaches 80%. While, at C-band, as vegetation matures, the canopy may dominate the backscattered signal. In contrast, L-band frequencies, less sensitive to vegetation, enable detection during later canopy development, therefore accuracy remains above 80% even in late growth stages. Analysis of the 2025 season is underway.

Acknowledgment: This study is funded by ASI under the Agreement N. 2023-52-HH.1-2025 (addendum MyGEO to the THETIS project) in the framework of ASI’s program “Innovation for Downstream Preparation for Science” (I4DP_SCIENCE).

References:

[1]      C. Massari et al., “A review of irrigation information retrievals from space and their utility for users,”, Remote Sensing, 2021.

[2]      C. Corbari et al., “Estimates of Irrigation Water Volume by Assimilation of Satellite Land Surface Temperature or Soil Moisture Into a Water-Energy Balance Model in Morocco,” Water Resour Res, 61, 7, 2025.

[3]      A. Balenzano et al., “Sentinel-1 and Sentinel-2 Data to Detect Irrigation Events: Riaza Irrigation District (Spain) Case Study,” Water, 14, 19, 2022.

[4]      A. Balenzano et al., “Sentinel-1 soil moisture at 1 km resolution: a validation study,” Remote Sens Environ, 263, 2021.


How to cite: Rossi, S., Balenzano, A., Palmisano, D., Lovergine, F. P., Mattia, F., Rinaldi, M., Ruggieri, S., Tapete, D., Sacco, P., Ursi, A., and Satalino, G.: An adaptive and unsupervised approach for irrigation detection at field scale from high-resolution soil moisture maps, EGU General Assembly 2026, Vienna, Austria, 3–8 May 2026, EGU26-6881, https://doi.org/10.5194/egusphere-egu26-6881, 2026.

EGU26-7446 | ECS | Posters on site | HS6.8

High-resolution irrigation estimates for maize across Europe from ensemble AquaCrop simulations 

Louise Busschaert, Michel Bechtold, Sujay V. Kumar, Michel Le Page, Christian Massari, and Gabriëlle De Lannoy

Irrigation plays a key role in the terrestrial water cycle and agricultural production, yet it remains one of the most uncertain components of large-scale water use estimates. In recent years, several irrigation datasets based on modeling approaches and remote sensing have been developed. While these products have improved the spatial and temporal characterization of irrigation water use, they often lack an explicit quantification of uncertainty, limiting their applicability for hydrological and land surface modeling, as well as data assimilation.

This study presents high-resolution irrigation estimates for maize across Europe using ensemble simulations with the crop model AquaCrop (version 7.2) coupled to NASA’s Land Information System. Simulations are run for the period 2010-2020 at a 0.05° lat–lon resolution over European regions with irrigated maize, assuming sprinkler irrigation. The ensemble mean crop and irrigation estimates are evaluated against ground-truth and satellite observations. At the field scale, simulated irrigation amounts are compared against reported irrigation data over maize fields in the Lot and Tarn departments in southern France for the period 2016–2019. At the continental scale, simulated vegetation dynamics are evaluated using the Copernicus Land Monitoring Service fraction of canopy cover (FCOVER) product across Europe.

To explicitly represent uncertainty, ensembles are generated by perturbing meteorological forcings and a key irrigation parameter, specifically the root-zone soil moisture threshold that triggers irrigation events. Multiple ensemble configurations are tested to account for uncertainties related to irrigation management practices and meteorology. In a first experiment, shortwave radiation and precipitation are perturbed. In a second experiment, this configuration is extended by additionally perturbing air temperature, leading to a larger spread in vegetation development since crop growth stages are defined by accumulated heat units (growing degree days). In a final experiment, the ensemble is further expanded by perturbing the irrigation threshold, resulting in an increased spread in simulated irrigation amounts. An ensemble verification against field-level irrigation observations is performed to assess the ensemble uncertainty, providing a basis for future data assimilation applications.

How to cite: Busschaert, L., Bechtold, M., Kumar, S. V., Le Page, M., Massari, C., and De Lannoy, G.: High-resolution irrigation estimates for maize across Europe from ensemble AquaCrop simulations, EGU General Assembly 2026, Vienna, Austria, 3–8 May 2026, EGU26-7446, https://doi.org/10.5194/egusphere-egu26-7446, 2026.

EGU26-7480 | ECS | Posters on site | HS6.8

European scale, satellite-based irrigation water use estimates at 1 km spatial resolution 

Jacopo Dari, Yogesh Kumar Baljeet Singh, Konstantin Ntokas, Norman Fomferra, Gunnar Brandt, Renato Morbidelli, Carla Saltalippi, Alessia Flammini, Mehdi Rahmati, Paolo Filippucci, Diego Fernández-Prieto, Espen Volden, and Luca Brocca

Irrigation is the most impactful yet less monitored human activity altering the natural hydrological cycle. In recent years, an ever-increasing number of studies have shown the potential of Earth Observation (EO) in tracking human dynamics along with natural ones, including estimates of irrigation water use (IWU). Particularly, the SM-Inversion method, a soil-water-balance approach adapted for quantifying IWU from satellite soil moisture, proved its skills across various scales of application. In this contribution, main results from the Irrigation-EU project will be presented. Its main objective is the development of the first ever European-scale, EO-based IWU data set. To do this, the SM-inversion algorithm has been optimized and implemented as operational Python processor. Features of the resulting IWU product include spatial and temporal resolutions equal to 1 km and 14-day, respectively. The temporal coverage spans from 2016 onwards. Operational input data has been leveraged for developing IWU estimates, i.e., Sentinel-1 soil moisture estimates delivered by the CLMS (Copernicus Land Monitoring Service) and total precipitation and potential evaporation from ERA5-Land (European ReAnalysis v5 – Land). Validation against reference irrigation volumes collected in several European case studies (mainly located in Spain, Italy, Greece, and Germany) will be presented. Moreover, the validation will benefit from the recently launched initiative which invites the scientific community to collaborate in developing the first database of in-situ IWU observations.

How to cite: Dari, J., Baljeet Singh, Y. K., Ntokas, K., Fomferra, N., Brandt, G., Morbidelli, R., Saltalippi, C., Flammini, A., Rahmati, M., Filippucci, P., Fernández-Prieto, D., Volden, E., and Brocca, L.: European scale, satellite-based irrigation water use estimates at 1 km spatial resolution, EGU General Assembly 2026, Vienna, Austria, 3–8 May 2026, EGU26-7480, https://doi.org/10.5194/egusphere-egu26-7480, 2026.

EGU26-7656 | ECS | Posters on site | HS6.8

Mapping yearly irrigation patterns across Italy using multiple satellite data from 2000 to 2025 

Jismi Joy and Chiara Corbari

Climate change and population growth are putting increased pressure on water resources and their users in Italy and the Mediterranean (IPCC 2023). Italy is among the European countries that make the greatest use of irrigation (70% of total freshwater consumption), and about 60% of the area is irrigated with low-efficiency techniques (ISTAT 2014). Despite its significance, the yearly detection of irrigated fields remains poorly quantified at national scales with 1-km spatial resolution. A multi-sensor, satellite-driven framework was developed to map irrigated areas across Italy over the past years based on a change detection algorithm for the 8-day normalized difference vegetation index (NDVI) from MODIS, soil moisture from Sentinel-1, land surface temperature (LST) from MODIS, and precipitation from ERA5-Land. The datasets are harmonized and analyzed to produce statistical maps and temporal trends, providing a detailed characterization of irrigated areas. The retrievals are intercompared and validated against reference datasets from local field knowledge, the official national statistics data, and global research datasets. Inconsistency has been found in some areas, especially due to the difficulties in differentiating between rainfed and irrigated crop areas. No significant differences in the irrigated areas were observed between the different years.

This spatially continuous, multi-decadal assessment provides a methodology applicable to Mediterranean and semi-arid regions and delivers essential insights to support sustainable water management, agricultural planning, and climate adaptation strategies.

How to cite: Joy, J. and Corbari, C.: Mapping yearly irrigation patterns across Italy using multiple satellite data from 2000 to 2025, EGU General Assembly 2026, Vienna, Austria, 3–8 May 2026, EGU26-7656, https://doi.org/10.5194/egusphere-egu26-7656, 2026.

EGU26-8102 | ECS | Orals | HS6.8

Operational irrigation monitoring in data-scarce schemes using field observations, water accounting tool and remote sensing in Northern Ghana 

Komlavi Akpoti, Seifu Tilahun, Mabel Kumah, Afua Owusu, Naga Manohar Velpuri, Benjamin Wullobayi Dekongmen, Kirubel Mekonnen, Mansoor Leh, Alemseged Tamiru Haile, Mulugeta Tadesse, Thilina Prabhath, Stefanie Kagone, Lahiru Maduskanka, Tharindu Perera, and Abdulkarim Seid

Irrigation is a major source of freshwater pressure in semi-arid regions and is increasingly constrained by water scarcity, operational inefficiencies, and user conflicts. Yet routine monitoring of irrigation withdrawals, conveyance losses, and field-level water use remains limited due to weak measurement infrastructure. This study demonstrates an integrated methodology of field observation of irrigation water use and efficiency,  water accounting tool validated with field observation, and a remote sensing products  to quantify irrigation performance, specifically efficiency, adequacy, and equity, in a reservoir-fed irrigation scheme in northern Ghana under a unimodal rainfall regime. During the 2025 dry season, monitoring combined daily water-level observations from standardized flow structures in the main canals, selected laterals and application of water on selected fields. Flow rates were estimated based on hydraulic empirical equations and Manning-hydraulic equations for defined concrete channels. Measurements covered upstream, midstream, downstream sections of both main canals and selected laterals. Results reveal strong spatial degradation of water delivery. In the main canals, average discharge declined from 1.80 to 1.20 m³ s⁻¹ (right canal) and 2.17 to 0.85 m³ s⁻¹ (left canal), corresponding to conveyance efficiencies of 87.1% and 83.8%, respectively. At lateral scale, losses were substantially higher, with efficiencies dropping to 78.4% in one lateral and 58.5% in another, reflecting seepage, overflow, sedimentation, and structural constraints. Application irrigation depths in selected fields varied widely (21–32 mm versus 29–77 mm), producing application efficiencies of 31% and 62%, and indicating inequities in delivery reliability and water access. Unregulated abstractions (pump and tanker withdrawals) were estimated at ~38,000–53,000 m³ over the monitoring period, contributing to instability during peak demand. Independent 30-m remote-sensing evapotranspiration (ETa) captured irrigation signals and enabled scheme-wide diagnostics that complement discharge monitoring. Relative ETa provided a proxy for adequacy across water user associations and irrigation blocks, while ETa variability highlighted inequitable allocation and inconsistent delivery. Combined indicators support actionable options, including prioritizing rehabilitation in high-loss reaches, improving rotational delivery to tail-end blocks, targeting enforcement in abstraction hotspots, and benchmarking performance across associations for adaptive irrigation management. This is done in collaboration with the Ghana Irrigation Development Authority to validate the results and create ownership of the results for decision-making for expanding the irrigation area and improving the scheme's efficiency.

How to cite: Akpoti, K., Tilahun, S., Kumah, M., Owusu, A., Velpuri, N. M., Dekongmen, B. W., Mekonnen, K., Leh, M., Haile, A. T., Tadesse, M., Prabhath, T., Kagone, S., Maduskanka, L., Perera, T., and Seid, A.: Operational irrigation monitoring in data-scarce schemes using field observations, water accounting tool and remote sensing in Northern Ghana, EGU General Assembly 2026, Vienna, Austria, 3–8 May 2026, EGU26-8102, https://doi.org/10.5194/egusphere-egu26-8102, 2026.

EGU26-9576 | ECS | Orals | HS6.8

Irrigation water management driven by agro-hydrological modelling and satellite data in drought- and salinity-affected areas in Morocco 

Nicola Paciolla, Chiara Corbari, Youssef Houali, Sven Berendsen, Justin Sheffield, and Kamal Labbassi

Climate change and global population growth, with increased vulnerability of agricultural areas and enhanced food demand, are particularly affecting arid and densely populated regions. The decreasing availability of freshwater for agricultural use is increasing the appeal of unconventional water sources, like grey and desalinated water. Accurate knowledge of crop development and vulnerability to changed environmental conditions is critical to prepare for these future scenarios.

The objective of this work is the evaluation of irrigation water management scenarios considering water availability and quality, and the impact on crop growth, by merging satellite data and a distributed, high-resolution agro-hydrological model for crop monitoring and management. Specifically, this activity focused on an irrigation district in Morocco, which has been exposed to a prolonged drought and has seen an increase in the use of (partially) saline water for irrigation. Because of the drought, all available freshwater was reserved for civil use, causing a surge in groundwater pumping to satisfy the irrigation demand. This, in turn, has progressively increased the salinity of the groundwater reserve.

The monitoring of salinity-affected areas was performed at high spatial resolution (30m) by integrating into the crop-energy-water balance model FEST-EWB-SAFY the remote sensing data of leaf area index (LAI, from Sentinel-2) and land surface temperature (LST, from Landsat-8/9 and also from Sentinel-3, downscaled to 30m using Sentinel-2) to monitor crop development. The crop-energy-water balance FEST-EWB-SAFY model couples the distributed energy-water balance FEST-EWB model, which allows computing continuously in time and distributed in space all the components of the surface energy and water balances (without requiring LST as an input, but instead computing it internally), and the SAFY (Simple Algorithm For Yield estimates) model, for crop development. Both satellite LST and LAI data were used for the calibration and validation of the different branches of the modelling framework. The model was able to pick up information regarding soil salinity via its effect on crops visible from the satellite imagery.

The application of the FEST-EWB-SAFY model, through the synergy with satellite observations of LST and LAI, constitutes a valuable tool to evaluate the impact on the crop of mutating environmental conditions and to formulate sustainable water and food policies in areas facing the harsh consequences of climate change.

How to cite: Paciolla, N., Corbari, C., Houali, Y., Berendsen, S., Sheffield, J., and Labbassi, K.: Irrigation water management driven by agro-hydrological modelling and satellite data in drought- and salinity-affected areas in Morocco, EGU General Assembly 2026, Vienna, Austria, 3–8 May 2026, EGU26-9576, https://doi.org/10.5194/egusphere-egu26-9576, 2026.

EGU26-10443 | ECS | Orals | HS6.8

Satellite-based optimization of irrigation in a land surface model accounting for scaling effects  

Sara Modanesi, Louise Busschaert, Gabrielle De Lannoy, Domenico De Santis, Martina Natali, Jacopo Dari, Pere Quintana-Seguì, Mariapina Castelli, Fabio Massimo Grasso, and Christian Massari

Irrigation strongly influences land-atmosphere interactions and the terrestrial water cycle, yet its representation in land surface models (LSMs) remains highly uncertain. These uncertainties arise from both the scarcity of reliable irrigation benchmarks and the challenge of representing heterogeneous irrigation practices within coarse model grid cells (e.g., kilometer-scale resolutions). 

In this study, we examine structural limitations in the representation of irrigation within the Noah-MP LSM, implemented in the NASA Land Information System, by testing different calibration strategies. A sprinkler irrigation scheme is optimized using Sentinel-1-derived irrigation estimates and a genetic algorithm over an intensively irrigated region of northeastern Spain at a 0.01° spatial resolution. Two calibration approaches are evaluated: (i) adjusting the soil moisture threshold (Thirr) that triggers irrigation, and (ii) introducing a Scale Irrigation Coefficient (SIC) to account for sub-grid heterogeneity in irrigated area and applications’ timing. 

Results show that calibrating Thirr alone provides limited flexibility, resulting in unrealistic irrigation peaks and excessive water application. By contrast, the optimized SIC-based parameterization substantially improves irrigation dynamics, reduces model errors relative to benchmark in situ observations, and better captures interannual variability in surface soil moisture. Findings demonstrate that assuming uniform, full-grid irrigation at resolutions of ~1 km or coarser is physically unrealistic due to both operational constraints on irrigation practices and the fragmented structure of agricultural landscapes. Comparisons with satellite-based evapotranspiration and gross primary production datasets also reveal inconsistencies in simulated vegetation responses, highlighting remaining limitations in vegetation parameterization.  

Overall, this work underscores the importance of explicitly accounting for scaling effects in irrigation schemes and points toward future integration of satellite data assimilation to enhance representation of irrigation-water-carbon interactions. 

How to cite: Modanesi, S., Busschaert, L., De Lannoy, G., De Santis, D., Natali, M., Dari, J., Quintana-Seguì, P., Castelli, M., Massimo Grasso, F., and Massari, C.: Satellite-based optimization of irrigation in a land surface model accounting for scaling effects , EGU General Assembly 2026, Vienna, Austria, 3–8 May 2026, EGU26-10443, https://doi.org/10.5194/egusphere-egu26-10443, 2026.

EGU26-11754 | ECS | Posters on site | HS6.8

Identification of Sprinkler anomalies using Multispectral Remote Sensing 

Milton José Campero-Taboada, Javier Casalí Sarasíbar, María González-Audícana, and Miguel A. Campo-Bescós

Irrigation uniformity is essential for the efficient use of water and depends on both the design of the irrigation system and the operation of the sprinklers. Manual monitoring of sprinklers is inefficient and prone to errors, which has driven the use of remote sensing technologies for crop monitoring.

This study explored the potential of high-resolution multispectral imagery for the detection of blocked sprinklers in maize fields during the irrigation season. The research was conducted in a field in Larraga (Navarra, Spain), irrigated with sprinklers spaced 15x18 m apart, with three sprinklers randomly blocked for 15 to 25 days during four stages of maize growth. Images captured with an unmanned aerial vehicle (UAV) were subsequently resampled to simulate a 3 m satellite resolution; this approach allowed the generation of complete time series of the Normalised Difference Vegetation Index (NDVI) without interruptions caused by cloud cover, ensuring detailed monitoring of crop development.

The study field was divided into a non-irrigated zone around the blocked sprinklers and a control zone with normal irrigation, allowing comparison of crop development through multitemporal NDVI analysis and time series incorporating daily data on irrigation applied to the field, as well as precipitation and evapotranspiration recorded at the nearest weather station, which allowed assessment of their influence on vegetation dynamics.

The results showed that the images enabled clear identification of areas affected by sprinkler blockage, with significant differences in vegetation indices between the control and non-irrigated areas. Continuously irrigated zones maintained high and stable NDVI values, whereas areas with interruptions showed marked decreases, only partially mitigated by rainfall events in early stages. These findings highlight that irrigation interruption has an adverse effect on crop health, which can be detected accurately using remote sensing tools, emphasising the importance of maintaining uniform irrigation for optimal plant development.

How to cite: Campero-Taboada, M. J., Casalí Sarasíbar, J., González-Audícana, M., and Campo-Bescós, M. A.: Identification of Sprinkler anomalies using Multispectral Remote Sensing, EGU General Assembly 2026, Vienna, Austria, 3–8 May 2026, EGU26-11754, https://doi.org/10.5194/egusphere-egu26-11754, 2026.

EGU26-11846 | ECS | Posters on site | HS6.8

Evaluating wireless soil moisture sensors for assessing the efficiency and uniformity of sprinkler irrigation 

Fathi Alfinur Rizqi, Arno Kastelliz, and Reinhard Nolz

In-situ soil moisture sensors provide continuous information on soil water status and soil–water–plant interactions. Such information can be used for irrigation planning and for evaluating and optimizing irrigation strategies and systems. Wireless sensors also have the advantage that they cause minimal disruption to field operations and can therefore generate spatially explicit data. Sensor performance and practicality depend on soil properties, the moisture range, and implementation conditions. We evaluated wireless dielectric soil moisture sensors under controlled laboratory conditions and on sprinkler-irrigated field plots. Twenty wireless “SoilScout” sensors were used. A dedicated logger recorded the data and transmitted it via the GSM network to a server for processing. In the laboratory, we used fine sand of known bulk density, saturated it, and then allowed it to dry at room temperature. We determined the gravimetric water content (θg) and converted it to volumetric water content (θv) using the bulk density (ρb). In the field, the 20 sensors were installed and operated in the dams of irrigated potatoes from May 2025 to July 2025 and carrots from July 2025 to November 2025. The soil was Sandy Loam. The sensor positions followed a regular grid within the 18 x 18 m sprinkler setup, and a rain gauge was installed at each point to assess distribution uniformity. Sensor data were recorded continuously, capturing both natural conditions (evapotranspiration and rainfall) and irrigation events. After each measurement period, we collected soil samples near the sensor positions to determine and , and computed . These volumetric water contents served as reference values to analyze sensor performance. We estimated the slope and intercept of the corresponding regression lines and assessed precision and accuracy using RMSE, bias, and R2 . To compare with applied irrigation depths measured by the rain gauges, we also analyzed changes in sensor-derived water content during irrigation events (Δθv). Based on these data, we calculated the uniformity of water distribution. Results show a strong correlation between the wireless sensor and the laboratory reference (R2>0.9), indicating reliable tracking of drying in homogeneous media. In the field, agreement with gravimetric sampling converted to θv was less robust. Although absolute values differed in both settings, the dynamics of soil water status were captured very well. Under the canopy, the wireless sensors produced a spatial pattern like the rain gauge data, enabling sensor-based evaluation of distribution uniformity and a rough estimation of application efficiency (and interception losses). The study demonstrates clear advantages of wireless sensors in managed fields, supporting their use for practical irrigation management. However, retrieving the sensors before harvest proved challenging: despite marking and using a metal detector, they were difficult to locate. Further work is needed to quantify the absolute measurement accuracy of the sensors used. Overall, the results support the use of wireless sensors for planning and evaluating irrigation.

How to cite: Rizqi, F. A., Kastelliz, A., and Nolz, R.: Evaluating wireless soil moisture sensors for assessing the efficiency and uniformity of sprinkler irrigation, EGU General Assembly 2026, Vienna, Austria, 3–8 May 2026, EGU26-11846, https://doi.org/10.5194/egusphere-egu26-11846, 2026.

EGU26-12064 | ECS | Posters on site | HS6.8

How well do high-resolution surface soil moisture products capture irrigation signals? 

Andreas Wappis, Pierre Laluet, and Wouter Dorigo

Irrigation profoundly alters near-surface hydrological processes, yet its representation and detectability in satellite-based surface soil moisture (SSM) products remain insufficiently understood. While SSM observations are increasingly used in irrigation-related studies and applications over managed agricultural landscapes, most existing evaluations focus on natural or rainfed conditions, leaving a critical gap in anthropogenically influenced environments. 

We assess the performance of six high-resolution (1 km) SSM products, including BEC SMOS L4, UFZ-Sentinel-1, RT1, CGLS, NSIDC SMAP, and a newly developed downscaled ESA CCI product. The analysis focuses on three major European irrigation hotspots: the Ebro Valley (Spain), the Po Valley (Italy), and the Thessaloniki region (Greece). 

The evaluation is structured around three complementary analyses. First, spatial and temporal consistency is examined by comparing SSM distributions over irrigated and rainfed areas using global irrigation maps, and by assessing temporal dynamics against district-scale irrigation records. Second, satellite SSM products are benchmarked against model-based ERA5-Land estimates that do not explicitly represent irrigation, in order to analyze anomalies and identify potential human-induced soil moisture signals. Third, physical consistency is assessed by examining the relationship between SSM and land surface temperature (LST), as irrigation is expected to induce surface cooling through increased evapotranspiration. 

The analysis highlights marked differences between products in their ability to detect irrigation-related SSM signals and provides a basis for their evaluation and use in irrigated, human-modified environments. 

How to cite: Wappis, A., Laluet, P., and Dorigo, W.: How well do high-resolution surface soil moisture products capture irrigation signals?, EGU General Assembly 2026, Vienna, Austria, 3–8 May 2026, EGU26-12064, https://doi.org/10.5194/egusphere-egu26-12064, 2026.

EGU26-12461 | ECS | Posters on site | HS6.8

A spatiotemporal analysis of irrigation water requirements in French croplands over the past decades 

Jules Michard, Bruno J. Lemaire, Vazken Andréassian, Bruno Cheviron, and Fanny Sarrazin

France is the first agricultural producer and the third most irrigated country in terms of surface area in the European Union. Agriculture weighs heavily on French water resources dynamics as it features the highest water consumptive use (i.e., most of the water applied on irrigated areas is evaporated and unavailable downstream). Water withdrawals for irrigated agriculture are usually quantified through modelling at catchment scale because direct measurements are incomplete. Models can conceptualise water withdrawals as a modulation of crop irrigation requirements (i.e., water added to rainfall to compensate crop evapotranspiration and alleviate water stress) by water availability and irrigation management constraints (e.g., yield objective, irrigation technology efficiency). Establishing these models over a large sample of catchments is challenging because this requires a large range of data at different spatial scales (plot, farm, catchment).

As a first step towards assessing water withdrawals, this study investigates the spatiotemporal dynamics of monthly irrigation water requirements at catchment scale over the past decades in France. It also evaluates the contribution of climate variability (e.g., precipitation, temperature) and changes in cropland characteristics (e.g., area, crop type) to irrigation water requirement trends. Using the soil-crop water balance models CROPWAT and Optirrig (Cheviron et al. 2020), we compute irrigation water requirements over irrigated area and total cropland to approximate the agricultural water usage and quantify the crop water deficit. We build gridded yearly maps of irrigated and cropland area in France by combining statistics at the district (“département”) level and remote sensing derived products like land cover maps. Using different models and parameter values (e.g., sowing dates, crop coefficients) enables structural and parametric uncertainty quantification. Our results show that, in spite of uncertainties, the increase and the distribution of irrigation water requirements follow the rise and expansion of irrigated area in France, while crop water deficit is highly driven by climate variability.

References:
Cheviron, Bruno, Claire Serra-Wittling, Magalie Delmas, Gilles Belaud, Bruno Molle, et Juan-David Dominguez-Bohorquez. 2020. « Irrigation Efficiency and Optimization: The Optirrig Model ». doi:10.5194/egusphere-egu2020-20547.

How to cite: Michard, J., Lemaire, B. J., Andréassian, V., Cheviron, B., and Sarrazin, F.: A spatiotemporal analysis of irrigation water requirements in French croplands over the past decades, EGU General Assembly 2026, Vienna, Austria, 3–8 May 2026, EGU26-12461, https://doi.org/10.5194/egusphere-egu26-12461, 2026.

EGU26-15043 | ECS | Posters on site | HS6.8

Comparing Methods of Identifying Irrigation Using High Resolution SMAP Soil Moisture 

Annelise Turman, Bin Fang, Ryan Smith, and Venkataraman Lakshmi

With the wide variety of methods using satellite soil moisture (SM) observations to identify irrigation, our study aims to recreate several of the methods with a newly developed soil moisture product that uses a downscaling algorithm to produce a 400-m resolution soil moisture product from the native 36-km Soil Moisture Active Passive (SMAP) soil moisture data (Fang et al. 2025). From this product, we can estimate deeper soil moisture (20-cm and 50-cm from the original 5-cm depth). The objectives of this project are to see which of the methods perform best in the state of Colorado, and if performance differs with crop type, irrigation type, precipitation levels, and soil moisture depth as compared with the irrigation/crop type spatiotemporal field data available through Colorado’s Decision Support System (CDSS).

Our methods for identifying irrigation include:

  • Summation of SM over the growth period: Because we are studying a relatively small area, we assume that all soil is receiving an approximately equal amount of moisture from precipitation. We deduce that regions with higher SM than those around them receiving additional moisture from irrigation.
  • High SM despite low precipitation: If SM is detected despite there being a lack of precipitation for 4 days or more, one can assume that detected moisture came from irrigation (Lawston et al., 2017; Shellito et al., 2016).
  • Changes in mean absolute deviation (MAD): MAD is used to understand the variability of SM within each pixel- because irrigation causes frequent and significant changes in SM, higher variability is a sign of irrigation (Jalilvand et al., 2021).
  • Isolating irrigation signals: To isolate irrigation signals, this method incorporates a soil water balance model that accounts for vertical fluxes such as evapotranspiration and drainage, which influence soil moisture changes independently of irrigation (Zappa et al., 2021).
  • Increases in NDVI after irrigation events: The normalized difference vegetation index (NDVI) measures plant greeness and vigor and is elevated for healthy plants. Previous studies have found that irrigated crops have an NDVI value greater than 0.8, while non irrigated vegetation is below 0.75 (Brown & Pervez, 2014; Ibrahim et al., 2023).

How to cite: Turman, A., Fang, B., Smith, R., and Lakshmi, V.: Comparing Methods of Identifying Irrigation Using High Resolution SMAP Soil Moisture, EGU General Assembly 2026, Vienna, Austria, 3–8 May 2026, EGU26-15043, https://doi.org/10.5194/egusphere-egu26-15043, 2026.

Irrigation represents one of the primary anthropogenic perturbations to the global terrestrial water cycle, locally reshaping the climate-driven transition between wet and dry seasons through managed water inputs in croplands. Yet the globally consistent and temporally continuous daily irrigation estimates are still lacking. Here we interpret the persistent positive bias between remotely sensed and model-simulated soil moisture as an observable signature of irrigation and develop a global framework to quantify irrigation consumptive water use at the daily scale. We integrate multi-source inputs and construct a suite of representative scenarios to span major sources of uncertainty, improving robustness and internal consistency through observation-based constraints and fusion concepts. Independent consistency assessments and cross-region validation are further conducted to systematically evaluate the robustness, transferability, and uncertainty structure across gradients of climatic background and irrigation intensity. The global gridded daily irrigation figures more clearly delineate characteristic response patterns in major irrigated regions. In climate transition zones and strongly water-limited areas, estimates are more sensitive to climatic context and thus associated with relatively higher uncertainty. These findings provide a testable basis for interpreting regional differentiation and divergent magnitudes of irrigation impacts reported in the literature.

How to cite: Wang, W. and Zhuo, L.: Global gridded daily irrigation detection and quantification through soil moisture bias, EGU General Assembly 2026, Vienna, Austria, 3–8 May 2026, EGU26-17059, https://doi.org/10.5194/egusphere-egu26-17059, 2026.

EGU26-17110 | Orals | HS6.8

FLI : a new spectral index to characterize flooding irrigation  

André Chanzy and Sameh Saadi

Flooding irrigation is a method still widely used in certain farming systems and in foothill areas. Although this traditional technique remains water-consuming, it offers significant external benefits such as groundwater recharge and biodiversity preservation. For example, on the Crau area (600 km²) in the south of France, flooding irrigation of grasslands contributes to 70% of the total recharge of the aquifer, which is strategic for a large number of human activities (irrigation of orchards, drinking water, industry). Remote sensing makes it possible to characterise the area of irrigated grasslands with a high degree of accuracy (Abubakar et al., 2022). However, the number of water cycles, which is determined by meteorological conditions and possible restrictions, remains poorly characterized as well as the irrigation dose, which depends on the length of the plot along the water flow axis. There is therefore a challenge in detecting irrigation events and the direction of flow.

In order to obtain a territorial view of flooding irrigation on grasslands, the objective of this study is to use high spatial resolution (~10m) remote sensing to characterize irrigation patterns (irrigation period, frequency and dose) at the plot scale.  A previous study (Bazzi et al., 2020) based on radar imagery shows that it is possible to detect flooding irrigation, but there are still many errors, mainly when vegetation is dense. In the present study, analysis of Sentinel 1 time series in both radar configurations did not show a clear signal of irrigation. The dense vegetation of the grasslands probably masks the water layer during irrigation or the wet soil after drying. On the other hand, plots undergoing irrigation appear clearly when Sentinel 2 measurements are placed in a diagram relating the reflectance in the SWIR -band 11 (RSWIR) and the NDVI. Plots undergoing irrigation have RSWIR that deviates from the RSSWIR=f(NDVI) relationship. The distance from the RSWIR/NDVI point to this relationship can therefore be used to identify flooded pixels. With adequate thresholding of this distance, it can be shown that the plots identified as being irrigated are indeed irrigated in more than 90% of cases. Intra-plot mapping of irrigated areas makes it possible to identify the direction of irrigation and some times the direction of flow, which makes it possible to specify the water amount applied and, consequently, the amount drained, contributing to groundwater recharge. Temporal analysis of the territory allows the identification of the start and end of irrigation period. The proposed method thus makes it possible to sample a large number of irrigation events and thus enable more realistic modelling of irrigation schedules.

Abubakar, M., Chanzy, A., Pouget, G., Flamain, F., Courault, D., 2022. Detection of Irrigated Permanent Grasslands with Sentinel-2 Based on Temporal Patterns of the Leaf Area Index (LAI). Remote Sensing 14, 3056. https://doi.org/10.3390/rs14133056

Bazzi, H., Baghdadi, N., Fayad, I., Charron, F., Zribi, M., Belhouchette, H., 2020. Irrigation Events Detection over Intensively Irrigated Grassland Plots Using Sentinel-1 Data. Remote Sensing 12, 4058. https://doi.org/10.3390/rs12244058

How to cite: Chanzy, A. and Saadi, S.: FLI : a new spectral index to characterize flooding irrigation , EGU General Assembly 2026, Vienna, Austria, 3–8 May 2026, EGU26-17110, https://doi.org/10.5194/egusphere-egu26-17110, 2026.

EGU26-17590 | Posters on site | HS6.8

Satellite-derived irrigation water requirement as a support tool for climate-resilient water management in the Alps 

Gianluca Filippa, Paolo Pogliotti, Marta Galvagno, Erica Vassoney, Michel Isabellon, and Francesco Avanzi

Water scarcity is increasingly emerging as a critical issue even in traditionally water-abundant regions such as the European Alps. The coexistence of multiple end users - often characterized by competing and sometimes conflicting demands, ranging from aquatic ecosystem conservation to hydropower generation - renders water management one of the most pressing socio-economic and environmental challenges in mountain catchments. Although irrigation represents the third-highest priority water use after drinking and sanitation, the volumes required and actually withdrawn for agricultural purposes remain poorly constrained in mountain environments. This knowledge gap stems from a combination of factors, including technical limitations, pronounced spatial fragmentation, and historically rooted governance. Improving the estimation of irrigation water requirements is therefore a key step toward a more informed, efficient, and climate-resilient management of water resources.

Here, we present an approach for estimating irrigation water requirements (IWR) based on Sentinel-2–derived NDVI, coupled with spatially explicit meteorological drivers, namely air temperature, precipitation, and potential evapotranspiration. Daily IWR maps at 20 m spatial resolution are produced for the Aosta Valley, an inner-Alpine valley of approximately 3,200 km² located in the western Italian Alps, covering the period 2018–2025. The analysis focuses in particular on dry years (e.g. 2022), for which anomalies are computed at multiple spatial and temporal scales in order to investigate the different dimensions of drought severity in a topographically complex setting.

A more detailed analysis is conducted for a ~81 km² sub-basin, where the coexistence of multiple surface-water uses frequently leads to substantial river depletion during the summer season. In this basin, a set of discharge measurements enables the quantification of water withdrawals for both irrigation and hydropower production, thereby allowing a quantitative assessment of the relationship between estimated water requirements and actual water use. We show that, through the optimization of water allocation strategies, the risk of water scarcity can be substantially mitigated even during exceptionally dry summers such as 2022.

Wall-to-wall products such as those presented here, characterized by adequate spatial and temporal resolution, further provide a valuable basis for planning the location, design, and sizing of multi-purpose water storage reservoirs in hydrologically critical areas.

How to cite: Filippa, G., Pogliotti, P., Galvagno, M., Vassoney, E., Isabellon, M., and Avanzi, F.: Satellite-derived irrigation water requirement as a support tool for climate-resilient water management in the Alps, EGU General Assembly 2026, Vienna, Austria, 3–8 May 2026, EGU26-17590, https://doi.org/10.5194/egusphere-egu26-17590, 2026.

EGU26-21629 | Orals | HS6.8

Trade-offs between data-driven and process-based approaches for root-zone soil moisture retrieval in a Mediterranean vineyard 

Pere Quintana-Seguí, Judith Cid-Giménez, Anaïs Barella-Ortiz, and María José Escorihuela

Accurate monitoring of water availability in the root zone is a prerequisite for generating precise irrigation recommendations and mitigating drought impacts in water-limited Mediterranean ecosystems. This work evaluates the performance and physical consistency of two distinct modelling paradigms to retrieve Root-Zone Soil Moisture (RZSM) in a vineyard located in Terra Alta (Catalonia, Spain), intended as a basis for operational decision support.

We contrast a purely data-driven method, utilizing a Multilayer Perceptron (MLP), against a process-based approach that couples a parsimonious multilayer soil model with an Ensemble Kalman Filter (EnKF) for the assimilation of Surface Soil Moisture (SSM). Both schemes are currently benchmarked using in-situ SSM observations and standard meteorological forcing.

The results highlight a clear dichotomy between predictive skill and physical interpretability. The neural network approach demonstrated excellent performance in capturing non-linear seasonal trends and rapid wetting events, yielding better Kling–Gupta Efficiency (KGE) scores during validation. Conversely, the physical model exhibited lower statistical metrics but ensured mass conservation and provided a transparent representation of vertical water transport.

We conclude that while machine learning excels in reproducing local dynamics, the physical framework offers the robustness required for consistent water accounting. Consequently, we propose a synergistic roadmap where machine learning is leveraged to regionalize model parameters, and the assimilation of high-resolution satellite Surface Soil Moisture serves to spatialize the state estimates. This integration is essential to scale up from plot-level findings to regional irrigation recommendations, supporting the next generation of Digital Twins in agriculture.

How to cite: Quintana-Seguí, P., Cid-Giménez, J., Barella-Ortiz, A., and Escorihuela, M. J.: Trade-offs between data-driven and process-based approaches for root-zone soil moisture retrieval in a Mediterranean vineyard, EGU General Assembly 2026, Vienna, Austria, 3–8 May 2026, EGU26-21629, https://doi.org/10.5194/egusphere-egu26-21629, 2026.

Spectral sensors have become an integral part of modern precision agriculture. It enables fast, non-destructive and map-based crop monitoring of key crop physiological parameters. The spectral resolution of a sensor plays an important role in determining its ability to detect subtle changes in the crop, nutrient status and canopy development. Sensor’s comparison based on spectral resolution remains limited particularly in the context of field-level agronomic monitoring. This study aims to address this gap by using three sensors UAV-based multispectral (MS), UAV-based hyperspectral (HS) and handheld Greenseeker (GS) NDVI measurements. Hyperspectral sensors provide continuous high-resolution data from visible to near infrared; MS use fewer broad bands; GS limits to two bands for quick NDVI field checks. The experimental study was conducted in the arid region of Uttar Pradesh, India. The experimental setup consisted of plots with same irrigation (100% ETc) and varying nitrogen dosage i.e. 150,120 and 90 kg/ha (Plot 1, Plot 2 and Plot 3, respectively) with three replications. Plots 4 and 5, representing farmer-field conditions with 120 kg ha⁻¹ nitrogen and no nitrogen respectively, followed regional irrigation practices, whereas Plot 6 (rainfed) was irrigated only once initially. A series of UAV-flights were conducted across critical phenological stages, and the reflectance was used to generate Normalized Difference Vegetation Index (NDVI) representing canopy density.

The results showed that NDVI rapidly increased during early vegetative stage (61-75) DAS, saturated around (75-85) DAS, followed by a decline during (101-117) DAS.  NDVI peaked around flowering stage for all the sensors. GS-NDVI varied between (0.46-0.78), MS-NDVI displayed (0.52-0.86), whereas HS- NDVI varied between (0.55-0.90). The mean NDVI values were (0.570 ± 0.085) for GS, (0.608 ± 0.075) for MS, and (0.664 ± 0.087) for the HS, with HS exceeding others by 16.5% (vs. GS) and 9.3% (vs. MS). Pearson correlation coefficients confirm strong inter-sensor agreement: Greenseeker-Hyperspectral r = 0.96, Multispectral-Hyperspectral r = 0.91, Greenseeker-Multispectral r = 0.87 (all p<0.001), indicating consistent vegetation health trends despite spectral resolution variances. Across days 61-117, fully irrigated plots with varying nitrogen dosage (Plot 1-3) maintained higher vegetation indices (0.60-0.90) than stressed plots. For Plot 4 (0.57-0.84), Plot 5(0.49-0.79) and Plot 6(0.46-0.76), the decline accelerated under water and nitrogen deficit. Water-stressed and nitrogen deficit plots show greater NDVI drops, indicating higher stress levels leading to early senescence, thus affecting the grain yield.

Overall, the three sensors show strong agreement in NDVI trends. For precision agriculture, HS optimized subtle changes, followed by MS; statistical trends aligned with established NDVI comparison protocols using correlation and regression. Hyperspectral sensor offered the highest diagnostic capability, multispectral provided spatial characteristics and greenseeker served as an efficient tool for rapid monitoring of field. These combined observations emphasize the importance of selecting sensors based on the required level of detail, operational constraints, and monitoring objectives in precision agriculture. Integrating data from multiple sensor types can further enhance crop assessment accuracy and support more informed decision-making in precision agriculture.

How to cite: Adwait, A., Upreti, H., and Singhal, G. D.: Evaluating Spectral Resolution Effects on Crop Monitoring: A Comparison of UAV-based Multispectral, Hyperspectral and handheld Greenseeker sensor, EGU General Assembly 2026, Vienna, Austria, 3–8 May 2026, EGU26-743, https://doi.org/10.5194/egusphere-egu26-743, 2026.

Canopy cover (CC) reflects canopy density, leaf area development, and early stress conditions acts as a significant indicator for crop health. Accurate CC estimation helps in mapping spatial variability in crops and facilitates early detection of disease or stress due to nutrient or water deficiency. For estimation of canopy cover, UAV multispectral data was acquired at different crop growth stages. This study estimated wheat canopy cover percentage from tillering to dough stage using Random forest classifier and MSAVI index thresholding for more accurate and robust assessment of canopy dynamics. Supervised classification approach was used based on given training samples for three different classes, i.e., soil, canopy and shadow and classification was performed through Random forest (RF) algorithm. The extracted canopy pixels were then used for finding canopy cover percentage. Additionally, a simplified approach was used based on MSAVI index thresholds to identify crop pixels, enabling reliable CC estimation through vegetation index segmentation method. The experiment was conducted on wheat crop using three ETc (Crop evapotranspiration) based irrigation treatments i.e., 100%, 80%, and 60% ETc and each treatment had three replications. In addition to ETc based treatments, the Farmer’s and rainfed treatments were also considered. The rainfed treatments with two replications, received a single life-saving irrigation and farmer treatments, with three replications were irrigated based on local farmer’s practice.

Canopy cover percentage observed across different growth stages (40 to 114 DAS) showed distinct variation in crop development among varying irrigation treatments. In the treatments with 100%, 80%, and 60% ETc irrigation, RF based CC ranged from 35.3–98.5%, 36.1–97.9%, and 29.2–95.2%, while MSAVI-based CC ranged from 33.8–96.5%, 34.2–95.9%, and 28.1–94.5%, respectively. In comparison to ETc treatments, farmers treatment exhibited lower canopy cover, with ranges of 28.6–95.6% (RF) and 28.9–92.8% (MSAVI). Rainfed treatment recorded the lowest CC values across the growing season, varying between 23.1–72.4% using RF and 25.3–69.7% using MSAVI. Canopy cover estimates from the Random Forest algorithm and the MSAVI index showed consistent seasonal patterns, with RF generally producing slightly higher CC values. The NDVI patterns were also observed for all stages to validate these findings and the values ranged from 0.29–0.89, 0.26–0.88, and 0.24–0.85 in 100%, 80%, and 60% ETc treatments, respectively. Rainfed (0.22–0.74) and Farmer’s treatments (0.26–0.81) had lower NDVI values, supported the CC trends observed with RF and MSAVI methods. The highest CC and NDVI values were obtained around flowering stage i.e., (85-95) DAS and the lowest at tillering stages for all treatments, followed by a gradual decline after the flowering stage as the crop progressed toward maturity. Canopy cover trends were comparable in the 100% and 80% ETc treatments, whereas CC in 60% ETc treatment remained lower at all stages, indicating the impact of water deficit on canopy growth.

The study highlights that MSAVI based vegetation-index methods can provide a reliable and highly efficient pathway for estimating canopy cover, reducing the need for extensive training datasets and complex classification models.

How to cite: Yadav, A., Upreti, H., and Singhal, G. D.: Assessment of UAV based Canopy Cover for Varying Irrigation Treatments using Random Forest Classifier and MSAVI Index Thresholding, EGU General Assembly 2026, Vienna, Austria, 3–8 May 2026, EGU26-773, https://doi.org/10.5194/egusphere-egu26-773, 2026.

EGU26-1114 | ECS | Orals | HS6.9

CropLizer: An Agro-Socio-Edapho-Climatological Tool for Rice Nutrient Management and Profitability Assessment 

Mukund Narayanan, Ankit Sharma, and Idhayachandhiran Ilampooranan

Smallholder farmers frequently rely on thumb rules assuming that higher fertilizer inputs guarantee higher yields due to the absence of site-specific edapho-climatological data. This dependence on generalized rules creates a disconnect between site-specific requirements and field management practices, necessitating modeling field dynamics and providing actionable advisories to farmers. To address this disconnect, this study developed ‘CropLizer’ a machine learning and remote sensing based tool (https://mukundn1997-croplizer.hf.space/) to function as an integrated decision support system for rice cultivation. To develop CropLizer, this study synthesized a comprehensive dataset comprising over 45,000 rice field points (60% was reserved for training and the rest for validation) integrated with broadly yields, irrigation, nutrient practices, social status (education and ethnic group), climatic variables (precipitation), soil quality variables (carbon, nitrogen, and bulk density), as well as market accessibility. Subsequently, seven models (linear, support vector, decision tree, random forest, neural network, LSTM, transformer) were trained and hyperparameter tuned to predict yield and fertilizer requirements based on 43 agro-edapho-socio-climatological variables through ‘sklearn’, ‘tensorflow’, and ‘optuna’ libraries in python using IIT Roorkee’s super computer PARAMGANGA. After optimization, a web application was developed to allow users to simulate different scenarios by adjusting specific farming inputs to identify optimal management practices. Consequently, the system generates prescriptions for nitrogen and phosphorus and potassium application rates based on the predicted yields. Moreover, a user could find the potential yield for their field and what adjustments in field practices are required to obtain the potential yield sustainably (without loss of soil carbon). Considering the practical difficulties of gathering meteorological record and soil data, an application programme interface was set up for automatic retrieval of these variables from the field coordinates from open-meteo and soilgrids datasets. Upon validation, the performance of the best performing model (random forest) demonstrated a satisfactory accuracy (65%). Beyond agronomic parameters the tool calculates economic viability by integrating local market prices to estimate potential net profit margins and benefit-cost ratios under current yield and potential yield.  This framework bridges the gap between scientific research and field application by providing assured predictions for pre-season planning to mitigate financial risks.

How to cite: Narayanan, M., Sharma, A., and Ilampooranan, I.: CropLizer: An Agro-Socio-Edapho-Climatological Tool for Rice Nutrient Management and Profitability Assessment, EGU General Assembly 2026, Vienna, Austria, 3–8 May 2026, EGU26-1114, https://doi.org/10.5194/egusphere-egu26-1114, 2026.

Global climate change has led to more frequent and severe droughts in the middle and lower reaches of the Yangtze River, intensifying the spatiotemporal variability of crop yields in this region. Winter rapeseed, a major oilseed crop in China, is particularly vulnerable to these drought conditions, which now pose greater risks to local food security. Accurate and timely regional yield predictions are increasingly important for effective agricultural management and disaster response. However, predicting rapeseed yield at the city level is challenging due to complex climate patterns and the strengthened impact of drought. Addressing these challenges requires the integration of multi-source data, including both remote sensing and weather data, to capture the full range of environmental influences on crop growth. Traditional statistical and machine learning methods have often proven inadequate for robust, transferable yield prediction across different regions and years.

This study presents a deep learning–based yield prediction framework that integrates multi-temporal remote sensing indicators and meteorological variables to estimate winter rapeseed yield under both normal and drought conditions. Using data from 2014 to 2023 for the middle and lower reaches of the Yangtze River, an Attention–Long Short-Term Memory (Attention-LSTM) model was developed by jointly incorporating time-series remote sensing indices, meteorological factors, and statistical yield records. Key phenological periods for yield estimation were identified through multi-temporal and multi-variable combinations, and input configurations were systematically optimized. The proposed framework outperformed LSTM, Random Forest, and Support Vector Regression models, achieving an R2 of 0.81 and RMSE of 306.73 kg/ha on the validation dataset. Spatiotemporal yield dynamics and regional applicability were further analyzed, and the model’s robustness and adaptability were assessed under drought conditions. Under drought scenarios, the model maintained high accuracy, with an R2 of 0.76 and RMSE of 358.32 kg/ha. These results indicate the framework’s potential for drought-resilient yield prediction and its value for agricultural management and drought assessment under future climate change.

How to cite: Liu, S., Dong, S., and Guan, Q.: Iintegrating deep learning and multi-source datasets for drought-resilient winter rapeseed yield prediction in the Yangtze River Basin, EGU General Assembly 2026, Vienna, Austria, 3–8 May 2026, EGU26-2352, https://doi.org/10.5194/egusphere-egu26-2352, 2026.

EGU26-2540 | ECS | Posters on site | HS6.9

Towards an Optimal Method for Assessing the Spatial and Temporal Hydrological Dynamics of a Keyline System 

Maurus Nathanael Villiger, Anna Leuteriz, Andrea Carminati, and Manfred Stähli

Climate change will heavily impact agriculture through alterations of precipitation dynamics which leads to more frequent agroecological droughts and intense precipitation events. Strategies to adapt to these changes are necessary to maintain food safety and sustain livelihoods in the agricultural sector. One method for farmers to mitigate the impacts from climate change is the Keylines design which can be described as open ditches parallel to the elevation line. These are designed to retain runoff, reduce erosion and increase infiltration which should lead to a higher amount of water available to plants during dry periods (e.g., Ponce-Rodríguez et al. 2021). However, scientific research and corresponding data regarding Keyline systems and their influence on field hydrological dynamics is sparse.


To quantify the hydrological impact of Keyline systems, a comprehensive field experiment has been set up combining Keyline systems with agroforest on two agricultural fields, one of which is located in the eastern Jura-range and one outside of Zurich. The goal of this study is to assess the optimal integration of tools to investigate how the soil moisture patterns are altered by Keyline systems and quantify the timing and amount of water retained. The work presented here shows the first results of a comparison between different soil moisture analysis methods applied to agricultural fields, including (a) soil hydrological modelling, (b) electric resistivity tomography, (c) UAV-based L-band radiometry, (d) in-situ soil matrix potential and volumetric water content measurements and (e) destructive gravimetric water content measurements. Several of these methods currently undergo rapid developments due to the technological advancements made in recent years, leading to an increased accessibility for a broader range of users (e.g. Du 2020; Zhou et al. 2025). This highlights the need to assess the tools regularly to showcase possible applications and directions for further development. The results presented here demonstrate the capabilities as well as the limitations of the individual methods and shows how the different systems can be used complementary with each other to obtain a complete assessment of the soil hydrological dynamics. This will help researchers investigating soil moisture dynamics to make informed choices regarding their research tools for the assessment of nature-based solutions to adapt to climate change impacts within but also beyond agriculture.


Literature:

Du, C. (2020). Comparison of the performance of 22 models describing soil water retention curves from saturation to oven dryness. Vadose Zone Journal, 19(1), e20072. https://doi.org/10.1002/vzj2.20072.

Ponce-Rodríguez, M. D. C., Carrete-Carreón, F. O., Núñez-Fernández, G. A., Muñoz-Ramos, J. de J., & Pérez-López, M. E. (2021): Keyline in bean crop (Phaseolus vulgaris l.) for soil and water conservation. Sustainability, 13(17), 9982. https://doi.org/10.3390/su13179982.

Zhou, Y., Schwank, M., Boutin, J., Richaume, P., Mialon, A., Holmberg, M., Kalescke, L. Zeiger, P., Leduc-Leballeur, M., ... , Kerr, Y. (2025, in review): Setellite Microwave Radiometry at L-band for Monitoring Earth’s Essential Climate Variables. IEEE Geoscience and Remote Sensing Magazine.

How to cite: Villiger, M. N., Leuteriz, A., Carminati, A., and Stähli, M.: Towards an Optimal Method for Assessing the Spatial and Temporal Hydrological Dynamics of a Keyline System, EGU General Assembly 2026, Vienna, Austria, 3–8 May 2026, EGU26-2540, https://doi.org/10.5194/egusphere-egu26-2540, 2026.

Quantification of crop evapotranspiration (ET) and yield is essential for precision agricultural water management and food security, particularly over long temporal and large regional scales. In this study, we combined a water-carbon coupled model with a GPP-driven crop growth simulation method utilizing remote sensing datasets, to simultaneously estimate ET and yield over the past two decades in the North China Plain. The developed model was tested for two major crops (winter wheat and summer maize) using approximately 20 site-years of observations. For wheat, the root mean square error (RMSE) values of ET and gross primary production (GPP) were 0.57 mm d-1 and 1.65 gC m-2 d-1, and for maize were 0.80 mm d-1 and 2.92 gC m-2 d-1, respectively. Besides, the crop growth simulation agreed well with measurements that R2 values were mostly larger than 0.66, and the RMSE of yield was 554.7 for wheat and 1346.6 kg hm-2 for maize, respectively. The results revealed an increasing trend in the crop water productivity (WP = yield/ET) of wheat, while maize maintained an overall higher WP than wheat during 2001-2018. In addition, the impacts of climate change and human management on the spatiotemporal dynamics of ET-GPP fluxes over the agroecosystems were evaluated. The significantly increased GPP rather than ET dominated the significant increase in water use efficiency (WUE=GPP/ET) in the NCP, accounting for 38.6% of its cropland area. The temporal dynamic of regional mean WUE indicated a significantly increased rate of 0.026 gC kg-1H2O per year during 2001-2018. The experimental simulations demonstrated that agricultural management dominated the interannual trend of WUE, with a relative contribution of 79.5%, which was obviously larger than that of atmospheric CO2 concentration (40.2%) and changes in climate variables (-19.7%). The effects of agricultural management on WUE were further disaggregated across the classified six cropping systems, and 82.4% could be attributed to the management of winter wheat-summer maize rotation system. The remote sensing-based model developed in this study effectively quantifies regional ET and yield for two typical crops, providing critical information for smart agricultural water management. The analysis of agroecosystem WUE under changing environments underscores the dominant role of agricultural management and offers insights for climate adaption in agriculture.

How to cite: Wang, X., Lei, H., and Huo, Z.: Coupled estimation of crop evapotranspiration-yield and assessment of water use efficiency in the North China Plain through a remote sensing-based model, EGU General Assembly 2026, Vienna, Austria, 3–8 May 2026, EGU26-3713, https://doi.org/10.5194/egusphere-egu26-3713, 2026.

EGU26-4845 | Orals | HS6.9

High-resolution long-term mapping of major crops using satellite data 

Qiongyan Peng, Ruoque Shen, Yangyang Fu, Jie Dong, Baihong Pan, Yi Zheng, Xuebing Chen, Shaoping Li, Xiangqian Li, and Wenping Yuan

Winter wheat, maize, rice, and sugarcane are among the most important crops for global food security and bioenergy production. However, consistent high-resolution crop distribution maps across large regions and long time periods remain limited. In this study, we developed crop-specific identification algorithms that integrate spectral and phenological characteristics derived from satellite observations. Using these methods, we generated high-resolution (≤30 m) distribution maps for winter wheat, maize, rice, and sugarcane in China from 2001 to 2024. In addition, we produced sugarcane maps for Brazil (2016–2019), global winter cereal maps (2017–2022), and rice maps across Asia (1990–2023). Validation against independent samples shows that producer’s and user’s accuracies for winter wheat, maize, and rice in China reached 89.3% and 90.6%, 76.2% and 81.6%, and 88.4% and 89.1%, respectively. The global winter cereal maps achieved producer’s and user’s accuracies of 81.1% and 87.9%, while overall accuracies for sugarcane exceeded 91% in both China and Brazil. Estimated crop planting areas exhibit strong agreement with official statistics across regions. The resulting datasets provide consistent, long-term, and high-resolution crop distribution information, offering valuable support for crop monitoring, food security assessment, and climate and land-use change studies.

How to cite: Peng, Q., Shen, R., Fu, Y., Dong, J., Pan, B., Zheng, Y., Chen, X., Li, S., Li, X., and Yuan, W.: High-resolution long-term mapping of major crops using satellite data, EGU General Assembly 2026, Vienna, Austria, 3–8 May 2026, EGU26-4845, https://doi.org/10.5194/egusphere-egu26-4845, 2026.

EGU26-6918 | ECS | Orals | HS6.9

Drought-induced early alterations in photosynthetic efficiency revealed by convergence of spectral and molecular evidence 

Kaihao Cheng, Congjia Chen, Kejing Fan, Hon-Ming Lam, and Jin Wu

Mounting climate volatility, characterized by increasingly frequent and severe events, poses a critical threat to global food security. Traditional irrigation methods, which react only to visible drought symptoms, often fail to prevent irreversible physiological damage to crops. This underscores the need for precise, early detection of sub-lethal plant stress—a core challenge for precision agriculture. Effective early warning would enable proactive, smart irrigation, optimizing water use while protecting crop yields in a changing climate. Current drought assessment methods face significant trade-offs. Direct physiological measurements, though accurate, are destructive and impractical for field-scale use. Hyperspectral imaging (HSI) offers a non-destructive alternative by capturing detailed reflectance spectra. While it has identified signatures of advanced drought stress, a critical gap still remains, reliably predicting the initial metabolic perturbations that precede visible decline, particularly the early drop in net photosynthetic assimilation (An) which is a sensitive indicator of plant metabolic function and stress tolerance.

Our research directly addresses this need. Through controlled drought experiments of model plant Arabidopsis thaliana, we simultaneously collected high-resolution HSI data, transcriptome profiles, and ground-truth An measurements. A partial least squares regression model trained on spectral features accurately predicted An values two days in advance. Feature analysis identified wavelengths near 700 nm within the red-edge and near-infrared transition, as optimal early predictors. Strikingly, transcriptome data revealed a concurrent increase in gene activity linked to red and far-red light response pathways in drought-stressed plants. This convergence of spectral and molecular evidence indicates that early drought-induced photosynthetic alterations, predictive of An decline, manifest in canopy reflectance at ~700 nm and are underpinned by specific light-responsive molecular changes. By integrating hyperspectral phenotyping with mechanistic transcriptomics, we bridge prediction and biological causality, transforming HSI from a correlative tool into a mechanistically grounded early-warning system. This approach enables proactive, physiologically informed water management, paving the way for more climate-resilient agriculture.

How to cite: Cheng, K., Chen, C., Fan, K., Lam, H.-M., and Wu, J.: Drought-induced early alterations in photosynthetic efficiency revealed by convergence of spectral and molecular evidence, EGU General Assembly 2026, Vienna, Austria, 3–8 May 2026, EGU26-6918, https://doi.org/10.5194/egusphere-egu26-6918, 2026.

EGU26-12062 | Orals | HS6.9

A GIS-Based Framework for the Spatial Design and Discrete Optimization of Drip Irrigation Subunits 

Miguel Ángel Campo-Bescós, Iñigo Barberena, and Javier Casalí

The sustainability of global agricultural systems is increasingly dependent on the precision and efficiency of water distribution networks. In regions facing water scarcity, the design of irrigation subunits is a critical factor; however, the complexity of irregular field geometries often leads to designs based on manual approximations that ignore the full potential of hydraulic and economic optimization. This research introduces a sophisticated computational approach that integrates spatial network generation with advanced diameter optimization within a unified geographic information environment.

The core of this methodology lies in its ability to simultaneously address two fundamental aspects of irrigation engineering: the automated spatial layout of the pipe network and the discrete optimization of pipe diameters. By leveraging a high-precision hydraulic simulation engine, a genetic algorithm evaluates multiple potential configurations to identify the most cost-effective solution that satisfies pressure uniformity and flow requirements. This dual-integrated approach replaces traditional fragmented workflows, where layout design and hydraulic dimensioning are often performed in separate, disconnected steps.

The framework’s performance was validated through a practical application. This case study demonstrates how the system processes complex topographical data and irregular field boundaries to generate a complete infrastructure plan. The results indicate that the automated selection of commercial diameters, combined with an optimized spatial distribution of laterals and manifolds, leads to a significant reduction in total investment costs compared to conventional engineering methods.

By streamlining the transition from raw geospatial data to a fully optimized hydraulic network, this work provides a robust decision-support tool for precision agriculture. It offers a scalable and adaptable solution that enhances the efficiency of irrigation projects, supporting long-term water conservation goals and improving the economic viability of modern farming practices in the face of a changing climate.

How to cite: Campo-Bescós, M. Á., Barberena, I., and Casalí, J.: A GIS-Based Framework for the Spatial Design and Discrete Optimization of Drip Irrigation Subunits, EGU General Assembly 2026, Vienna, Austria, 3–8 May 2026, EGU26-12062, https://doi.org/10.5194/egusphere-egu26-12062, 2026.

EGU26-13372 | ECS | Orals | HS6.9

A hybrid physics-artificial intelligence approach for accurate prediction of reference evapotranspiration 

Jawad Zlaiga, Amine Rghioui, Said Elhachemy, Mustapha Elyaqouti, and Salwa Belaqziz

In a context marked by water scarcity as is the case in Morocco - particularly in semi-arid regions most exposed to water challenges such as the Souss Massa region - cultivation under cover exerts enormous pressure on water resources, making increasingly precise irrigation management essential. This work proposes a hybrid approach to improve the accuracy, generalization and stability of reference evapotranspiration predictions, integrating physical laws into the neural network architecture, which makes it possible to create a model that respects both the observed data and the physical knowledge governing reference evapotranspiration. The proposed methodology is based firstly on the evaluation of three deep learning architectures with advanced attention mechanism (Attention-based LSTM, Attention-based bidirectional-LSTM, Attention-based CNN-LSTM), secondly the evaluation of the best architecture before and after the integration of the physical component (Physics-Informed Neural Networks) using a convex combination integrating the Priestley-Taylor physical model. The results show the superiority of the hybrid architectures outperforming the others, the Attention-based CNN-LSTM architecture already obtaining interesting performances (R2 = 0.934).

However, the PINNs architecture with a balance coefficient set at λ = 0.1 outperforms all other architectures with less error and better data explanation (R² = 0.945). This combination allows a reduction of the average absolute error of 7.5% compared to the Attention-based CNN-LSTM model also ensuring better stability of predictions against extreme values. The validation is carried out in a prototype connected greenhouse equipped with IoT sensors and a monitoring dashboard.

This hybrid physico-learned approach offers a scalable and interpretable solution for intelligent irrigation management in semi-arid conditions.

How to cite: Zlaiga, J., Rghioui, A., Elhachemy, S., Elyaqouti, M., and Belaqziz, S.: A hybrid physics-artificial intelligence approach for accurate prediction of reference evapotranspiration, EGU General Assembly 2026, Vienna, Austria, 3–8 May 2026, EGU26-13372, https://doi.org/10.5194/egusphere-egu26-13372, 2026.

EGU26-16806 | ECS | Orals | HS6.9

Addressing deployability concerns for AI-supported UAV-based High Throuput Phenotyping 

Jules Salzinger, Lorenzo Beltrame, Lukas-Till Schawerda, and Phillipp Fanta-Jende

Reliable, field-scale indicators of crop water status and plant condition are needed to support plant breeding, precision irrigation and climate adaptation, yet UAV-based monitoring must balance predictive accuracy with deployability. We present an explainable Deep Learning workflow (TriNet) for scalable UAV phenotyping from multispectral time series, aligned with agronomic and breeding practice through high-granularity in situ scoring in accordance with established standards (such as those of the AGES - Österreichische Agentur für Gesundheit und Ernährungssicherheit). TriNet disentangles spatial, temporal, and spectral information and incorporates attention-based interpretability to identify influential inputs and guide efficient acquisition strategies. The framework supports handling multispectral data acquired from comparatively high altitudes with respect to the state of the art (e.g., 60 m with 2.5 cm Ground Sampling Distance (GSD)), and allows the exploration of the trade-off between model performance and GSD. This supports a reduction of flight times and data volumes (e.g., 1.74 GB at 60 m vs. 5.96 GB at 20 m in our reference setup) while maintaining controlled predictive accuracy.

We study the case of winter wheat breeding, and extend this approach with new results for the traits drought stress and plant health and a comprehensive analysis of flight height as an operational design variable, systematically simulating and evaluating acquisitions from 20 to 120 m. Results indicate that predictive accuracy is largely insensitive to flight height across this range, supporting higher-altitude, high-coverage monitoring until the release of larger datasets provide a clear justification for lower-altitude, higher-resolution acquisitions. Finally, we translate these findings into practitioner-oriented operational insights for drone-based High-Throughput Phenotyping.

How to cite: Salzinger, J., Beltrame, L., Schawerda, L.-T., and Fanta-Jende, P.: Addressing deployability concerns for AI-supported UAV-based High Throuput Phenotyping, EGU General Assembly 2026, Vienna, Austria, 3–8 May 2026, EGU26-16806, https://doi.org/10.5194/egusphere-egu26-16806, 2026.

EGU26-20878 | Orals | HS6.9 | Highlight

More crop per drop: precision irrigation and water productivity from field-scale to global scale 

Florian Werner, Matteo Ziliani, Rick Chartrand, Laurel Hopkins, Tereza Pohankova, Vivien Stefan, Rim Sleimi, Joao Vinholi, Albert Abello, and Wim Bastiaanssen

Hydrosat leverages land surface temperature measured by thermal infrared (TIR) satellite technology to help growers save water and increase yields. Key agronomical parameters, e.g., soil moisture, crop development, and crop water demand, are monitored daily over arbitrarily large areas by solving the surface energy balance. Coupled to a soil water balance model based on meteorological data, remote sensing algorithms also estimate the amount of irrigation water applied by farmers and generate irrigation recommendations optimizing water productivity, i.e., maximizing crop yield while minimizing irrigation water consumption.

IrriWatch is Hydrosat’s irrigation management decision support system, which allows growers to track water demand and growth progress of their crops down to individual 10x10 m² pixels, daily, in near-real-time. With governments becoming more conscious about conserving their water reserves, applying high-resolution remote sensing algorithms over large irrigation districts - and potentially even whole nations - is becoming increasingly relevant. Compared to small proof-of-concept models, this requires careful balancing of complex steps, including automated field delineation and crop identification at scale early in the growing season, data fusion and sharpening to obtain high-fidelity daily TIR data at a spatial resolution compatible with detecting in-field variations, as well as energy and water balance modelling capable to handle diverse environmental conditions and soil or crop types without any local data or farm management information available. To effectively help governments preserve water while increasing farmers’ crop yields, the immense amount of data generated by our models must be condensed to clear actionable indicators that are intuitive to an audience not necessarily familiar with remote sensing concepts.

We will present an overview of an operational processing pipeline to support both field-level precision agriculture applications and large-scale water productivity monitoring and optimization. Leveraging daily high-resolution land surface temperature, both from Hydrosat’s own satellite constellation and from a novel thermal sharpening algorithm, allows to track water productivity over tens of thousands of square kilometers. We find that high spatio-temporal resolution is critical to accurately monitor crop development even at regional or seasonal scale, as insufficient resolution introduces substantial errors in actual evapotranspiration estimates. In addition, correcting for geomorphological factors, e.g., microclimate or effect of elevation or slope on surface temperature, becomes increasingly important over large spatial scales.

Statistical analysis of field-scale results over large areas reveals spatial patterns of conditions responsible for yield losses or excessive water consumption. We will demonstrate how such insights support automatic identification of root causes for low water productivity, forming the basis for efficiently implementing data-driven mitigation actions.

How to cite: Werner, F., Ziliani, M., Chartrand, R., Hopkins, L., Pohankova, T., Stefan, V., Sleimi, R., Vinholi, J., Abello, A., and Bastiaanssen, W.: More crop per drop: precision irrigation and water productivity from field-scale to global scale, EGU General Assembly 2026, Vienna, Austria, 3–8 May 2026, EGU26-20878, https://doi.org/10.5194/egusphere-egu26-20878, 2026.

EGU26-21620 | ECS | Posters on site | HS6.9

Estimating root-zone soil moisture in Mediterranean vineyards using machine learning 

Judith Cid-Giménez, Maria José Escorihuela, Anaïs Barella-Ortiz, and Pere Quintana-Seguí

Root-zone soil moisture (RZSM) reflects the water accessible to plants and is therefore central to precision irrigation support and agricultural drought monitoring, yet direct RZSM observations are limited. Satellite missions provide surface soil moisture (SSM), but they do not directly observe deeper layers, and in-situ measurements remain too sparse for broad coverage. We present a machine learning approach to estimate daily RZSM in vineyards in the Terra Alta region of Catalonia in northeastern Spain, using daily 2020 to 2024 in-situ observations from eight stations as reference data. This model provides a baseline for later experiments using satellite SSM to extend applicability beyond the instrumented network.
We train a multilayer perceptron (MLP) to predict soil moisture at 25 cm, taken as RZSM, using in-situ SSM at 5 cm, daily precipitation, mean, minimum and maximum temperature, a cyclic encoding of day of year, and static soil descriptors from SoilGrids. Robustness is assessed with year-block cross-validation to evaluate temporal generalisation and leave-station-out experiments to evaluate transferability across vineyards. Performance is quantified using non-parametric Kling–Gupta efficiency (KGE) and RMSE.
The model achieves strong skill when evaluated on independent years at training stations, with median KGE around 0.9. Transfer to unseen vineyards is more heterogeneous, with some stations retaining good performance around 0.85 and others showing biases and reduced efficiency, suggesting that additional information may be needed for consistent transfer across vineyards. Ongoing work aims to improve generalisation by incorporating antecedent moisture and precipitation information and by testing additional predictors such as vegetation, supported by feature importance analysis across the full set of inputs. To enable use beyond the instrumented network, we will transition the model towards configurations driven by or trained with satellite-derived SSM. Taken together, these steps are intended to move towards a transferable tool to support drought monitoring and irrigation-related decisions in agricultural regions.

How to cite: Cid-Giménez, J., Escorihuela, M. J., Barella-Ortiz, A., and Quintana-Seguí, P.: Estimating root-zone soil moisture in Mediterranean vineyards using machine learning, EGU General Assembly 2026, Vienna, Austria, 3–8 May 2026, EGU26-21620, https://doi.org/10.5194/egusphere-egu26-21620, 2026.

EGU26-884 | ECS | PICO | HS6.10 | Highlight

Advancing near-real-time water-quality monitoring in Brazil through remote sensing: the MAPAQUALI and MAPAQUALI-IA platforms 

Daniel Maciel, Claudio Barbosa, Evlyn Novo, Rogério Flores Júnior, Aurea Ciotti, Felipe Lobo, Fernando Lopes, Gilberto Ribeiro, Maurício Noernberg, Rogério Marinho, and Vitor Martins

Monitoring water quality in inland and coastal waters is essential for understanding biogeochemical cycles and the impacts of anthropogenic pressures such as land use and land cover change, mining, deforestation, dam construction, and climate change. Traditional field surveys, conducted bimonthly or quarterly at limited sampling stations, are valuable but do not offer the spatial and temporal coverage necessary to fully support public policies for sustainable aquatic system management. In this context, remote sensing plays a key role in enabling large-scale water quality monitoring across extensive and remote regions, such as Brazilian Amazon. Despite recent advances, there remains a lack of accessible platforms that deliver validated remote sensing products and algorithms to researchers, stakeholders, and decision-makers. To address this gap, the Instrumentational Laboratory for Aquatic Ecosystems (LabISA) at the Brazilian National Institute for Space Research (INPE) is developing MAPAQUALI, a semi-automatic cloud-based platform designed to generate and distribute water quality products at high spatial and temporal resolution for aquatic ecosystems in Brazil. MAPAQUALI integrates a set of semi-analytical and machine-learning algorithms developed and validated by INPE’s research team. These algorithms retrieve key water quality parameters, including chlorophyll-a, phycocyanin, Secchi disk depth, and total suspended solids, using observations from ESA and NASA multispectral sensors (Sentinel-2 MSI, Sentinel-3 OLCI, and Landsat-8/9 OLI) with a focus on specific reservoirs and lakes in Brazil. In addition to the MAPAQUALI, a new project named MAPAQUALI-IA is leveraging large-scale mapping of water quality in Brazil using artificial intelligence (i.e., machine learning and deep learning methods) to provide these water quality parameters using a single large-scale algorithm. The project will develop algorithms with the help of newly released open datasets, such as BRAZA and GLORIA. The MAPAQUALI/MAPAQUALI-IA processing pipeline incorporates advanced aquatic atmospheric correction techniques, specifically ACOLITE and 6SV, as well as corrections for glint and adjacency effects. A STAC-compliant data cube environment (Brazil Data Cube platform) allows to generate and store data enabling rapid access, visualization, and analysis. This publication introduces the current MAPAQUALI/MAPAQUALI-IA prototype, a modular and continuous monitoring system implemented for representative Brazilian aquatic environments, including Amazonian lakes, eutrophic cascade reservoir system, and coastal waters. Future developments will expand sensor compatibility, include new water-quality algorithms, and extend coverage to additional inland and coastal environments. Ultimately, MAPAQUALI aims to bridge the gap between scientific data and operational application, supporting more informed decision-making to improve aquatic ecosystem conservation and management in Brazil.

How to cite: Maciel, D., Barbosa, C., Novo, E., Flores Júnior, R., Ciotti, A., Lobo, F., Lopes, F., Ribeiro, G., Noernberg, M., Marinho, R., and Martins, V.: Advancing near-real-time water-quality monitoring in Brazil through remote sensing: the MAPAQUALI and MAPAQUALI-IA platforms, EGU General Assembly 2026, Vienna, Austria, 3–8 May 2026, EGU26-884, https://doi.org/10.5194/egusphere-egu26-884, 2026.

EGU26-1327 | ECS | PICO | HS6.10

A Multi-Sensor Remote Sensing Framework to Track Agricultural Drought in the Souss-Massa Basin, Morocco 

Soumia Gouahi, Mohammed Hssaisoune, El Houssaine Bouras, Yassine Ait Brahim, and Lhoussaine Bouchaou

Agricultural drought is a growing concern in Morocco, especially in the Souss-Massa basin, where the economy is heavily reliant on increasingly limited water resources. As climate As climate variability intensifies and groundwater levels decline, traditional drought monitoring tools (mainly based on rainfall alone) no longer provide a comprehensive representation of the evolution of water stress in crops and soils. Based on remote sensing, we developed a framework to facilitate understanding of these intricate interactions.

We combine four satellite indicators to reflect different aspects of drought stress: vegetation greenness (VCI), land surface temperature (TCI), soil moisture availability (SMCI), and photosynthetic activity (GPP anomaly). These datasets, derived from MODIS and ESA-CCI products, were processed into a consistent time series from 2000 to 2023. Utilising the seasonal Standardized Precipitation Evapotranspiration Index (SPEI-6) as a reference, we trained a Random Forest model to generate a Remote Sensing Drought Index (RSDI) specifically tailored to the wheat-growing season in the Souss-Massa basin.

The developed index demonstrates robust performances across the region, effectively capturing both rapid shifts in meteorological conditions and the slower cumulative effects of water stress on vegetation.

The model exhibits strong predictive accuracy (R² ≈ 0.75) and remains stable even when applied to stations not utilized during the training process.

Importantly, the RSDI aligns closely with observed wheat yield anomalies (r ≈ 0.9), indicating its relevance for agricultural decision-making. The framework also reproduces major drought years, such as 2015–2016 and 2023–2024, revealing clear spatial contrasts linked to topography and irrigation patterns.

The combined use of multiple remote-sensing indicators provides a reliable measure of drought evolution and supports regional actors in planning and managing water and agricultural activities under growing climatic pressure.

How to cite: Gouahi, S., Hssaisoune, M., Bouras, E. H., Ait Brahim, Y., and Bouchaou, L.: A Multi-Sensor Remote Sensing Framework to Track Agricultural Drought in the Souss-Massa Basin, Morocco, EGU General Assembly 2026, Vienna, Austria, 3–8 May 2026, EGU26-1327, https://doi.org/10.5194/egusphere-egu26-1327, 2026.

A widespread decline in dissolved oxygen (DO) has been observed in rivers, temperate lakes and oceans, yet the impacts of climatic warming on global lake deoxygenation remain unclear. Here, we train data-driven models using climatic data, satellite images and geographic factors to reconstruct surface DO and quantify the climatic contribution to DO variations in 15,535 lakes from 2003 to 2023. Our analysis indicates a continuous deoxygenation in 83% of the studied lakes. The mean deoxygenation rate in global lakes (-0.049 mg/L/decade) is faster than that observed in the oceans (-0.022 mg/L/decade) and in rivers (-0.038 mg/L/decade). By decreasing solubility, climatic warming contributes 55% of global lake deoxygenation. Meanwhile, heatwaves exert rapid influences on DO decline, resulting in a 7.7% deoxygenation compared to that observed under climatological mean temperatures. By the end of the century, global lake DO is projected to decrease by 0.41 mg/L (4.3%) under SSP2–4.5 and 0.86 mg/L (8.8%) under SSP5–8.5 scenarios.

How to cite: Zhang, Y.: Climate Warming and Heatwaves Accelerate Global Lake Deoxygenation, EGU General Assembly 2026, Vienna, Austria, 3–8 May 2026, EGU26-2496, https://doi.org/10.5194/egusphere-egu26-2496, 2026.

The Landsat Collection 2 (C2) archive is vital for inland water monitoring, yet the Land Surface Reflectance Code (LaSRC) atmospheric correction for Landsat-8/9 introduces Dark Plume Over Water (DPOW) artifacts. These aerosol extrapolation errors cause severe negative biases in shortwave bands, disrupting long-term consistency. To address this, we developed a cloud-native Alternative Correction (AC) method on Google Earth Engine. This data-driven approach employs random forest regression, trained on spatiotemporally aggregated high-quality water pixels, to reconstruct reliable surface reflectance (SR) from Top-of-Atmosphere observations. Validation against a global in-situ hyperspectral dataset and benchmarking against the physics-based ACOLITE processor demonstrate the robustness of the proposed method. While ACOLITE effectively resolves the negative bias issue, the AC method achieves superior radiometric accuracy, reducing the ultra-blue Root Mean Square Error to 0.019 (compared to 0.029 for ACOLITE and 0.031 for C2 SR). Notably, under high-aerosol conditions, the AC method minimizes the residual spectral distortions often observed in physical inversions, effectively restoring the natural spectral shape. Spatially, the method eliminates DPOW artifacts; furthermore, it removes systematic biases between Landsat-8/9 and legacy sensors (Landsat-4/5/7). By restoring radiometric integrity, this automated solution secures the foundation for reliable long-term global limnology.

How to cite: Bi, S., Shi, K., and Xu, J.: A cloud-native alternative correction for Landsat-8/9 Collection 2 surface reflectance over inland waters, EGU General Assembly 2026, Vienna, Austria, 3–8 May 2026, EGU26-3651, https://doi.org/10.5194/egusphere-egu26-3651, 2026.

EGU26-5592 | ECS | PICO | HS6.10

Monte Carlo–Based Uncertainty Propagation for Probabilistic Water Masking from Satellite Remote Sensing Reflectance Product 

Gomal Amin, Olivier Pourret, Victor Dupin, Sabrina Guérin-Rechdaoui, and Arnaud Dujany

Accurate and reliable delineation of surface water from optical satellite imagery is a pre-requisite for many hydrological applications. In inland and riverine environments, water masking is a major source of uncertainty due to optically complex waters, mixed land–water pixels and strong adjacency effects. Conventional water masks provide no explicit measure of classification confidence and do not account for uncertainty in pixel classification, particularly along riverbanks, under bridges, in building-shadows, and in highly dynamic systems, where small changes in reflectance or threshold parameters can lead to unstable water boundaries.

In this study, we present a generic Monte Carlo–based water detection framework that explicitly propagates Sentinel-2 ACOLITE remote sensing reflectance uncertainty through multiple spectral threshold-based water indices (NDWI, MNDWI, AWEI, and MBWI), resulting in per-pixel water occurrence probabilities. These indices are evaluated independently and combined using a deterministic voting-based fusion scheme. This decision logic is further constrained by physically motivated reflectance thresholds in the near-infrared and shortwave infrared bands, together with a low-signal filter, to suppress shadows and dark non-water surfaces that commonly generate false positives in index-based approaches.

The method is demonstrated as a proof of concept using a Sentinel-2 acquisition over the Seine River in Paris characterized by complex optical conditions. High-confidence water pixels dominate the main river channel, while intermediate probabilities are concentrated along riverbanks, bridges, and narrow tributaries. Within the final detected water mask, the mean water probability reaches 0.98, with more than 97% of water pixels classified with high confidence (P ≥ 0.9). Classification uncertainty is very low overall, indicating strong consistency across Monte Carlo realizations. Intermediate probabilities (0.3 < P < 0.7) represent less than 1% of detected water pixels and are spatially confined to water–land transition zones. Sensitivity experiments indicate that total water extent is weakly affected by increasing reflectance perturbation, whereas uncertainty increases systematically at water–land boundaries. By explicitly quantifying water-detection uncertainty, this Monte Carlo framework provides a statistically robust foundation for subsequent water-quality retrieval and uncertainty propagation.

How to cite: Amin, G., Pourret, O., Dupin, V., Guérin-Rechdaoui, S., and Dujany, A.: Monte Carlo–Based Uncertainty Propagation for Probabilistic Water Masking from Satellite Remote Sensing Reflectance Product, EGU General Assembly 2026, Vienna, Austria, 3–8 May 2026, EGU26-5592, https://doi.org/10.5194/egusphere-egu26-5592, 2026.

River discharge estimation is critical for flood forecasting and water resources management, yet traditional gauging methods are often limited in spatial coverage. Accurate estimation of river discharge from satellite observations remains challenging in large rivers where hydraulic controls and anthropogenic disturbances induce non-stationary width–discharge relationships. In this study, multi-decadal river width time series derived from multi-sensor satellite imagery (Landsat-5/7/8 and Sentinel-1/2) were employed to estimate discharge in the Ganjiang River Basin, China, using the Google Earth Engine (GEE) platform. Particular emphasis was placed on quantifying the impacts of backwater effects and channel morphological changes on inversion accuracy. Results indicate that: (1) satellite-based width–discharge scaling performs robustly in morphologically stable reaches, yielding high accuracy at the Ji’an, Xiajiang, and Zhangshu stations (R2 > 0.92$; NSE > 0.90); (2) in contrast, performance at the Waizhou station is strongly degraded by complex hydromorphological dynamics, where intensified backwater effects from Poyang Lake during the wet season weaken the functional coupling between river width and discharge (R2 decreases to 0.59), and pronounced channel incision associated with historical sand mining (mean bed lowering of 2.97 m) introduces additional non-stationarity into the rating relationship; and (3) to account for these time-varying controls, a segmented modeling framework was implemented to explicitly reflect periods of morphological adjustment, substantially improving discharge estimates at Waizhou and increasing both R2 and NSE to 0.90 from 2012 to 2019. These findings highlight the importance of considering morphodynamic evolution and hydraulic boundary conditions explicitly for reliable satellite-based discharge estimation in dynamically evolving river–lake systems.

How to cite: Wang, G. and Gu, P.: Satellite-Based Discharge Estimation in Morphologically Dynamic Rivers: A Segmented Modeling Approach for the Ganjiang River Basin, EGU General Assembly 2026, Vienna, Austria, 3–8 May 2026, EGU26-6227, https://doi.org/10.5194/egusphere-egu26-6227, 2026.

Accurate quantification of irrigation water use efficiency (IWUE) is essential for sustainable oasis agriculture in arid regions with multi-source water supply. Examining the Yongji Irrigation Area of the Hetao Irrigation District, this study developed a Surface Energy Balance System (SEBS)-based evapotranspiration (ET) model for the area using Landsat-8 imagery and 2023 meteorological data. Model performance was evaluated against ground-based observations. SEBS-derived ET was coupled with a regional water balance approach to estimate IWUE under multi-source irrigation and compared with the conventional canal water balance method. The main findings are as follows: (1) in 2023, remotely sensed ET totaled 5.4×10⁸m3, corresponding to an IWUE of 0.426; (2) SEBS-retrieved daily ET agreed well with in situ observations at the Linhe Meteorological Station on seven dates between April and October 2023, with a coefficient of determination R2 = 0.816 , root-mean-square error (RMSE) of 0.714 mm/day, mean absolute error (MAE) of 0.703mm/day, and bias of −0.337mm/day, confirming that SEBS reliably captures daily ET dynamics in the Yongji Irrigation District; (3) the SEBS-based IWUE differed by 6.33% from the traditional canal water balance estimate (0.455), suggesting good consistency between the two approaches. These findings indicate that SEBS-based remote sensing can provide spatially explicit, operational assessments of irrigation efficiency and support precision water resources management in arid and semi-arid agricultural regions.

How to cite: Xu, Y. and Feng, S.: Estimation and Analysis of Irrigation Water Use Efficiency in Multi-Source Irrigation Areas of Arid Regions Based on the SEBS Model, EGU General Assembly 2026, Vienna, Austria, 3–8 May 2026, EGU26-6814, https://doi.org/10.5194/egusphere-egu26-6814, 2026.

EGU26-10071 | ECS | PICO | HS6.10

Reconstructing the Hydrological Cycle of the Ebro River Basin through Satellite Observations 

Sindhu Kalimisetty, Serena Ceola, Irene Palazzoli, Alberto Montanari, Paolo Stocchi, and Stefania Camici

The Ebro River Basin is one of the most intensively managed and climatically sensitive basins in the Mediterranean region, where increasing water demands, pronounced climate variability, and environmental constraints pose major challenges for sustainable water resources management. Addressing these challenges requires hydrological models capable of consistently representing both natural processes and anthropogenic water use. In this context, the INTERROGATION project, funded by the Italian Ministry of Universities and Research, examines the interactions between climatic and anthropogenic factors in the development and recovery of major hydrological droughts that have affected the Ebro River Basin in recent decades (1990-2023).

In this study, we present a comprehensive reconstruction of the water cycle in the Ebro River Basin, explicitly accounting for both natural processes and human water use. For this purpose, three different precipitation datasets are used as input data to the flexible conceptual hydrological model MISDc (Modello Idrologico Semistribuito in Continuo): long-term (2000-2023) daily in situ observations and two versions of a daily integrated dataset obtained by merging GPM and SM2RAIN products at low (10 km) and high (1 km) spatial resolutions.

The hydrological model is calibrated against observed river discharge and validated through a multi-variable comparison with satellite-based estimates of soil moisture, evapotranspiration, snow water equivalent, and irrigation, which were developed within the framework of the European Space Agency Digital Twin Earth (DTE) Hydrology Next project. The results of this work demonstrate the significance of employing a suitable hydrological model in conjunction with accurate satellite information for capturing the spatiotemporal evolution of the hydrological cycle within highly managed basins. These results will be the basis for developing a decision support system that will guide stakeholders toward an integrated management of water resources in the Ebro River Basin.

How to cite: Kalimisetty, S., Ceola, S., Palazzoli, I., Montanari, A., Stocchi, P., and Camici, S.: Reconstructing the Hydrological Cycle of the Ebro River Basin through Satellite Observations, EGU General Assembly 2026, Vienna, Austria, 3–8 May 2026, EGU26-10071, https://doi.org/10.5194/egusphere-egu26-10071, 2026.

EGU26-11687 | ECS | PICO | HS6.10

High-resolution crop map generation in Mediterranean environments using IOTA2 chain 

Andrea Borgo, Vincent Thierion, Antonio Trabucco, Flavio Lupia, and Marta Debolini

Reliable crop mapping is essential in land and water management studies to understand the spatial distribution and dynamics of agricultural practices, to model resource use and production, and to propose sustainable scenarios for agricultural and water management. This work presents high-resolution crop mapping for the Mediterranean area, which is particularly interesting due to the limited data availability and the high level of land use heterogeneity. The main European land use dataset, Corine Land Cover (CLC), lacks the specificity required for accurate agricultural classification, especially for crop differentiation, and does not provide frequent or timely updates, which are crucial for many applications. Other more recent EU-wide crop mapping efforts (d’Andrimont et al, 2021) still lack regional accuracy due to widely scattered training data. To overcome these limitations, a large-scale crop mapping initiative was implemented in Sardinia to test and validate an artificial intelligence–based approach for Mediterranean environments. In this context, irrigated agriculture is a key sector for the sustainable management of limited water resources. The method uses Sentinel‑2 time series and survey data from the LPIS (Land Parcel Identification System). The study relies on IOTA2, a land‑use map production chain first developed and tested at the French level, producing maps with 24 land‑use classes. The originality of the approach lies in the use of open‑source satellite images and an automated processing workflow based on supervised classifiers, making crop mapping faster and easily reproducible across years.

Learning samples are derived from 2018 LPIS data, supplemented by CLC and CLCplus Backbone datasets for natural areas and the Urban Atlas for urban areas. Two nomenclatures are tested: a detailed versus a simplified one, with 32 and 26 thematic classes, respectively, both focusing on Mediterranean-relevant crop typologies. The two nomenclatures are evaluated with sampling rates of 10%, 50%, and 100% of training pixels. Results show that the simplified nomenclature achieves higher accuracy, with an Overall Accuracy (OA) of 0.77 compared to 0.61 for the detailed nomenclature, using 100% training pixels. Increasing the training sample rate improves classification quality in both nomenclatures: in the short nomenclature, OA values are 0.596, 0.613, and 0.774 for 10%, 50%, and 100% sampling rates. In the detailed nomenclature, the improvement is weaker, with OA values of 0.596, 0.601, and 0.610, indicating that increasing sample size does not resolve class confusion. Among agricultural classes, rice, citrus, vegetables, and grapevine achieve the highest classification scores, which are among the crops with the largest irrigation requirements. Nuts, cereals, and fruit trees perform poorly, mainly due to insufficient training samples. Overall, the proposed nomenclature significantly improves the crop classes available in the CLC by increasing crop specificity and differentiation. This study presents a framework for fully automatic crop‑map production in Mediterranean environments, ensuring fast reproducibility over the years thanks to the use of openly accessible satellite imagery and an automated processing chain. This can improve the accuracy and reliability of water accounting for the agricultural sector and help promote sustainable use of limited water resources in the Mediterranean areas.

How to cite: Borgo, A., Thierion, V., Trabucco, A., Lupia, F., and Debolini, M.: High-resolution crop map generation in Mediterranean environments using IOTA2 chain, EGU General Assembly 2026, Vienna, Austria, 3–8 May 2026, EGU26-11687, https://doi.org/10.5194/egusphere-egu26-11687, 2026.

EGU26-16751 | ECS | PICO | HS6.10

A Method for Assessing Trophic Status of Inland Lakes Based on the Forel–Ule Index and Red-edge Band Hue Angle 

Huizi Zhao, Yin Cao, Hongli Zhao, Huaiwen Zhang, Wenjing Hua, Yu Gan, and Haojiang Li

Eutrophication in inland lakes has become increasingly prominent, often accompanied by frequent algal blooms and risks of degraded aquatic ecosystem functions. Therefore, broad and dynamic monitoring of lake trophic status is crucial for aquatic ecosystem protection and refined water-resources management. Satellite remote sensing enables rapid, large-area monitoring of lakes. Previous studies have developed large-scale trophic status assessment methods based on the visible-band water color index, the Forel–Ule Index (FUI), to retrieve a chlorophyll-a-referenced trophic state index (TSI(Chl-a)). However, inland waters are optically complex; high concentrations of chromophoric dissolved organic matter (CDOM) or suspended matter can inflate FUI values. Consequently, the single-index approach using FUI alone to assess TSI(Chl-a) (Model1) tends to misclassify mesotrophic waters as eutrophic. To mitigate this interference, most studies have adopted an improved strategy in which FUI serves as the primary indicator and specific spectral bands provide auxiliary discrimination. In this study, we incorporate two medium-to-high resolution satellites with red-edge bands, GF-6 and Sentinel-2, and design Red-edge Band Hue Angle α’(RHA α’) based on bands Red(630nm-690nm/650nm-680nm),Red-edge1(690nm-730nm/698nm-713nm),Red-edge2(730nm-770nm/733nm-748nm). We then develop a coupled lake trophic status assessment method integrating FUI and RHA α’ (Model2).

The results indicate that: (1) RHA α’ can characterize the reflectance-peak feature of chlorophyll-a near 700 nm. For waters with FUI ≥ 11, if elevated FUI is primarily driven by high chlorophyll-a concentrations, RHA α’ tends to be high; conversely, if elevated FUI is mainly caused by high suspended matter concentrations, RHA α’ tends to be low. Thus, Model2 can effectively distinguish high-chlorophyll waters from highly turbid waters by leveraging RHA α’. (2) Using the IOCCG Hydrolight simulated dataset (including 500 synthetic water spectra under varying concentrations of phytoplankton pigments, CDOM, and non-pigmented suspended matter across 400–800 nm). For simulated Gaofen-6 data, the eutrophic-state monitoring assessment accuracies of Model1 and Model2 were respectively 84.1% and 95.8%, and the overall accuracies were respectively 88.6% and 90.4%; for simulated Sentinel-2 data, the corresponding eutrophic-state monitoring assessment accuracies were respectively 84.9% and 99.1%, and the overall accuracies were respectively 88.0% and 89.8%. Overall, Model2 markedly improves the accuracy of eutrophic-state assessment. (3) Taking 252 spatially representative lakes across China as monitoring targets, we produced lake trophic status products for 2021–2022 using Model2 and validated them against the National Surface Water Quality Report released by the Ministry of Ecology and Environment of the People’s Republic of China, achieving an overall accuracy of 79.84%.

In the next step, we will extend this method to long-term spatiotemporal analysis of TSI(Chl-a) for Chinese lakes with an area of 1 km² and above. The data preparation has been largely completed, and the related analyses are currently underway.

How to cite: Zhao, H., Cao, Y., Zhao, H., Zhang, H., Hua, W., Gan, Y., and Li, H.: A Method for Assessing Trophic Status of Inland Lakes Based on the Forel–Ule Index and Red-edge Band Hue Angle, EGU General Assembly 2026, Vienna, Austria, 3–8 May 2026, EGU26-16751, https://doi.org/10.5194/egusphere-egu26-16751, 2026.

EGU26-21227 | ECS | PICO | HS6.10

High-resolution net-shortwave and net-radiation products for Europe 

Karan Mahajan, Ye Tuo, and Jian Peng

Net radiation (Rn) is a key control on land–atmosphere exchanges and a primary forcing for transpiration modelling. However, commonly used radiation products often lack the spatial resolution required to resolve soil–plant–atmosphere interactions in heterogeneous landscapes, limiting their applicability for water management studies. Here, we present a new daily net shortwave and net radiation dataset for Europe at 1-arcminute (~1.4 km) spatial resolution covering the period 2001–2020, developed to support high-resolution transpiration modelling using the Priestley–Taylor approach.

The dataset is generated through the integration of multiple complementary data sources, combining station-based downward shortwave radiation from the EMO-1 dataset, satellite-derived longwave radiation from the ELITE product, and a physically based estimation of blue-sky albedo derived from GLASS black and white-sky albedo products, together with information on photosynthetically active radiation from BESS.

Evaluation against FLUXNET observations reveals that the high-resolution net shortwave radiation product outperforms the coarser ERA5-Land reanalysis across 7 of 9 analyzed European countries, with particularly strong improvements in topographically complex regions, such as the Alps, and in heterogeneous land-use areas. However, the net radiation product shows larger uncertainties in semi-arid regions and during high-latitude winter conditions, reflecting known limitations in satellite-based radiation retrievals. Nevertheless, the high spatial resolution represents a valuable contribution to remote-sensing-based water cycle studies, drought assessment, and land-surface modeling.

How to cite: Mahajan, K., Tuo, Y., and Peng, J.: High-resolution net-shortwave and net-radiation products for Europe, EGU General Assembly 2026, Vienna, Austria, 3–8 May 2026, EGU26-21227, https://doi.org/10.5194/egusphere-egu26-21227, 2026.

Growing demand for dates—driven by Morocco’s rising population and expanding international markets for well-branded, high-value (“noble”) varieties—is accelerating the expansion of date-palm cultivation in the country’s arid and semi-arid frontiers. Much of this growth relies on intensified groundwater pumping, increasing pressure on shared aquifers that have long sustained oasis agroecosystems. Historically, these aquifers were managed through locally embedded water-sharing institutions that supported efficient allocation and long-term use; the rapid spread of pumped irrigation is nowadays reshaping this balance by amplifying competition for the same resource.

We investigate these dynamics in the Figuig oasis (eastern Morocco) and its watershed by linking agricultural expansion to water demand and comparing this demand with watershed-scale water availability. We hypothesize that once recently established plantations reach full productive age—beyond the relatively low-demand establishment phase—total water demand will exceed the catchment’s available supply.

We develop a date-palm water demand model that combines evapotranspiration-based water requirements with high-resolution mapping of fields and palm abundance. Field boundaries are delineated using a U-Net + watershed segmentation workflow, and palm trees are detected and counted using a YOLO object-detection model applied to drone imagery (small, heterogeneous oasis parcels) and satellite imagery (newer, larger, more homogeneous plantations). These tools are applied within a remote-sensing time series to quantify agricultural expansion and the associated increase in demand over time. Field surveys provide key parameters to translate mapped plantations into water demand, including irrigation method and efficiency, tree age classes, irrigation frequency, and planting density.

Our results indicate an approximately threefold expansion of agricultural land relative to the historically stable oasis area. About 65% of farms remain in early production stages (0–5 and 6–12 years), when water needs are relatively low, yet estimated demand already nearly matches watershed-scale availability. As plantations mature, projected demand is likely to surpass catchment-scale availability within the next decade, increasing the risk of irreversible impacts. Consistent with this trend, we observe drying of traditional springs and deteriorating water quality, underscoring the need to prioritize surface-water use and water-harvesting measures and to strictly regulate groundwater pumping.

How to cite: Boubou, Y.: From Oasis Water Commons to Expanding Date-Palm Plantations: Deep Learning Mapping and Evapotranspiration-Based Water Demand in the Figuig Oasis, Morocco, EGU General Assembly 2026, Vienna, Austria, 3–8 May 2026, EGU26-21477, https://doi.org/10.5194/egusphere-egu26-21477, 2026.

EGU26-122 | Orals | HS6.11

A Multi-Source Remote Sensing and Machine Learning Framework for Detecting Ephemeral Sand Rivers across the West African Sahel 

Roland Yonaba, Axel Belemtougri, Claire Michailovsky, Tibor Stigter, Lawani Adjadi Mounirou, and Pieter Van der Zaag

Ephemeral sand rivers (ESRs) constitute a widespread but largely overlooked hydrological feature across the West African Sahel. These wide alluvial channels, dry for most of the year, store substantial volumes of subsurface water following seasonal flow events. Despite their importance for hydrological functioning and climate resilience in semi-arid environments, regional-scale information on their distribution, characteristics, and potential subsurface storage remains scarce. This study develops a multi-platform, remote sensing-based methodological framework (integrating satellite imagery, digital elevation data, machine learning and hydrological analysis) to systematically detect and map ESRs, with application in Burkina Faso, Mali, and Niger,

We first delineate a high-resolution river network using MERIT DEM-derived hydrological products refined with national hydrographic datasets and enhanced remote-sensing river masks. River flow intermittency is predicted through a Random Forest model trained on 1,269 gauging stations across Africa, enabling classification of rivers into perennial, weakly intermittent, highly intermittent, and ephemeral categories. Focusing on the ephemeral class draining large catchments (≥ 1,000 km²), we define a 250-m buffer along selected river reaches to support consistent remote sensing analysis.

Sentinel-2 multi-temporal imagery (2020-2024) is used to characterize land surface conditions and separate sandy riverbeds from surrounding land cover. An initial evaluation of sand-related spectral indices (NDESI, NSI, NDSI) combined with NDVI reveals that the NDESI-NDVI biplot provides the best discrimination of sandy substrates, but with limited detection performance when applied at regional scale (sensitivity 42-72%). We therefore implement a supervised LULC classification using a Random Forest classifier trained on 89,986 labelled samples derived from 313 ground-truth polygons interpreted from Maxar high-resolution imagery. Multi-season compositing proves essential, as spectral signatures of sand, bare soil, and vegetation vary markedly between dry, wet, and transitional periods. The final classification achieves an overall accuracy of 93% and F1-scores ≥ 0.90 for all classes, clearly outperforming spectral thresholding approaches.

To infer zones with potential shallow groundwater storage, we combine classified sandy riverbeds with riparian vegetation patterns and canopy height data (≥ 5 m). This proxy-based assessment identifies 402 km of ESR segments (19% of total ESR length) exhibiting persistent riparian vegetation indicative of shallow water availability. Although detailed hydro-geophysical verification would be required for site-specific development, these segments represent promising targets for nature-based water storage interventions and smallholder-led agricultural initiatives. The spatial integration of ESR mapping with population distribution highlights areas where such opportunities may be particularly relevant, although further socio-hydrological analysis is needed to quantify practical accessibility and use.

This study demonstrates the value of synthesising DEM-based hydrological information, multispectral satellite observations, canopy height products, and machine learning to characterize hydrological processes in data-sparse semi-arid environments. The resulting ESR inventory provides a foundation framework for improved understanding of river intermittency, subsurface storage dynamics, and seasonally accessible alluvial aquifers across the Sahel, and offers a scalable framework for application to other dryland regions worldwide.

How to cite: Yonaba, R., Belemtougri, A., Michailovsky, C., Stigter, T., Mounirou, L. A., and Van der Zaag, P.: A Multi-Source Remote Sensing and Machine Learning Framework for Detecting Ephemeral Sand Rivers across the West African Sahel, EGU General Assembly 2026, Vienna, Austria, 3–8 May 2026, EGU26-122, https://doi.org/10.5194/egusphere-egu26-122, 2026.

EGU26-689 | ECS | Posters on site | HS6.11

Hydrological Validation of Satellite-based and Reanalysis Precipitation Datasets in a Himalayan River Basin 

Anusha Somisetty, Vishal Singh, and Ashutosh Sharma

The Himalayan River systems sustain the livelihoods of millions of downstream inhabitants by providing water for diverse needs. However, the Himalayas are among the most adversely impacted ecosystems in the world due to global warming and climate change. Many Himalayan basins have reported an increase in extreme precipitation events and floods. As concerns grow about the changing hydrological regime and future water availability, accurately estimating water yield and streamflow under climate change scenarios becomes essential. Hydrological modelling in the Himalayan basins, however, is challenging due to the lack of in-situ measurements. With limited rain gauge networks in these areas, and the majority of observation stations located in valley bottoms, higher-elevation climates remain underrepresented. In recent times, satellite precipitation products (SPPs) and reanalysis products (RAPs) have emerged as alternatives to ground-based observations, offering precipitation estimates with good spatial and temporal resolution. In this study, several SPPs and Re-Analysis Products (RAPs)—including APHRODITE, CHIRPS, ERA5, ERA5-LAND, IMDAA, GPM-IMERG, and PERSIANN—were evaluated for their prediction accuracy and hydrological applications by comparing them with IMD gridded data in the Upper Beas Basin, located in the western Himalayas. The precipitation products (PPs) were assessed based on their ability to capture daily, seasonal, and annual precipitation, as well as extreme precipitation indices (90th, 95th, and 99th percentile rainfall) using statistical metrics such as correlation coefficient (CC), RMSE, R² and relative bias (RB). Their performance in detecting rainfall events was evaluated using Categorical metrics such as POD, FAR, and CSI. Their statistical performance was ranked as: APHRODITE > ERA5-LAND > PERSIANN > ERA5 > GPM > IMDAA > CHIRPS. Overall statistical performances of APHRODITE, ERA5-LAND, ERA5, GPM and PERSIANN were found to be satisfactory. Further, to assess the hydrological utility of these PPs, the SWAT model was employed to generate basin water yield and water balance components using different products. APHRODITE, PERSIANN and GPM satisfactorily reproduced streamflow well (NSE = 0.88, 0.65, & 0.61, RSR = 0.34, 0.59, & 0.62; and PBIAS = -2.18%, -10.86%, & -18.98% respectively). PERSIANN and APHRODITE generated the water yield with an error of 1.68% and 3.91%. Only through hydrological validation, it was revealed that ERA5-LAND, despite ranking second in the statistical evaluation, exhibited poor hydrological performance (PBIAS = -39.14%), while GPM proved to be capable of reproducing streamflow although it performed poorly in statistical evaluation.  Hydrological validation not only revealed such discrepancies but also provided insights into water balance components, water yield, and flow extremes such as high flows and low flows. Therefore, this study recommends hydrological validation in addition to statistical evaluation for selecting reliable precipitation datasets for hydrological modelling in complex mountainous regions.

Keywords: Beas basin, Precipitation products, categorical metrics, Hydrological evaluation, streamflow, water yield

How to cite: Somisetty, A., Singh, V., and Sharma, A.: Hydrological Validation of Satellite-based and Reanalysis Precipitation Datasets in a Himalayan River Basin, EGU General Assembly 2026, Vienna, Austria, 3–8 May 2026, EGU26-689, https://doi.org/10.5194/egusphere-egu26-689, 2026.

EGU26-2131 | ECS | Posters on site | HS6.11

A Grid-Based Conceptual Hydrological Modelling Framework Using Remotely Sensed Inputs: Preliminary Insights 

Greeshma B Nair and Raaj Ramsankaran

Conceptual hydrological models play a central role in streamflow estimation, yet their lumped formulations often fail to represent spatial variability in hydrological processes, thereby limiting their performance. With the growing availability of satellite observations, global reanalysis products and high-resolution terrain datasets, grid-based conceptual modelling has become increasingly feasible. However, despite the widespread use of the Génie Rural à 4 Paramètres Journalier (GR4J) model, its grid-to-grid implementations remain limited, even though these frameworks offer clear advantages for capturing spatial heterogeneity and enabling modelling in data-scarce regions. This study presents a grid-based GR4J framework coupled with Muskingum-Cunge routing and driven entirely by remote sensing and reanalysis-based inputs, applied across four Australian catchments representing tropical, semi-arid, temperate, and humid subtropical climates. To implement this framework, the catchments were discretised into 0.1° grids aligned with the spatial resolution of GPM IMERG precipitation and GLEAM potential evapotranspiration, enabling these inputs to be applied at the grid level to generate runoff. Flow routing was done using Muskingum-Cunge method through the channel grids obtained based on flow-direction map derived from a digital elevation model (DEM), enabling sequential upstream-to-downstream runoff transfer across the grid network. Model calibration and validation were carried out using observed daily streamflow at the study catchment outlets for the periods 2005–2018 and 2018-2023 respectively. Model performance was evaluated using the Kling-Gupta Efficiency (KGE) under two configurations: the grid-based framework and the conventional lumped GR4J model. Both achieved calibration KGE values above 0.6; however, the grid-based model consistently showed superior performance during validation. The tropical basin exhibited the greatest improvement, with KGE increasing from 0.09 to 0.51, while the semi-arid and temperate basins showed 21% and 14% gains, respectively. Performance in the humid subtropical basin remained comparable across both configurations. Overall, the grid-based framework shows clear benefits in accounting for spatial variability.


How to cite: Nair, G. B. and Ramsankaran, R.: A Grid-Based Conceptual Hydrological Modelling Framework Using Remotely Sensed Inputs: Preliminary Insights, EGU General Assembly 2026, Vienna, Austria, 3–8 May 2026, EGU26-2131, https://doi.org/10.5194/egusphere-egu26-2131, 2026.

With the challenges of cliamte change and increasing food demand, North China has produced more than 65% of cereal productions of China, and is of great importance in food security. However, North China is facing with significant ecological degradation subsequent to water withdrawal for irrigation. As a result, lots of rivers run drying-up and groundwater table declined fast in the past several decades. There is a observed positive precipitation trend in past 2 decades over North China, and most rivers' flow has been measured increasing, accompanied with vegeration revigorous, i.e. increase in vegetatoin cover.  Under this background of climate and land cover change, we find groundwater continued to subject overpumping and has played a key role to support the gain of food production and vegetation restoration during this period. In this study, we will present the results in detail to use combined method of ground-based and GRACE observations to screening up groundwater drought risk under the increasing precipitation or wetting background. Using some machine learning algoriths, we extropolated the GRACE observed Terrestiral Water Storage (TWSA) and Groundwater Storage (GWSA) back to 1960s, and proposed a groundwater drought index (GDI) to investigate the groundwater drough characteristics under the effects of climate change and human exploitation. And we found that in major basins across North China, such as Tarim River Basin, Yellow River Basin, Hai River Basin, and Songhua River Basin, groundwater experienced more frequent and severe drought in recent 20 years, than it was in the past 4 decades before 2000. This is mainly caused by agricultural withdrawal and vegetation restoration. And in future, groundwater would be likely encounter with more severe drought threats.

How to cite: Shen, Y., Liu, M., and Guo, Y.: Monitoring groundwater drought risks in major agricultural regions of China: A combined perspective of GRACE- and groundbased obervations and modeling, EGU General Assembly 2026, Vienna, Austria, 3–8 May 2026, EGU26-2166, https://doi.org/10.5194/egusphere-egu26-2166, 2026.

EGU26-2279 | ECS | Orals | HS6.11

Evaluating an NDVI-Driven, Locally Calibrated FAO-56 Evapotranspiration Model Against Global ET Products and In-Situ Measurements in Semi-Arid Agriculture 

Yassine Manyari, Vincent Simonneaux, Mohamed Hakim Kharrou, Jérémy Auclair, Saïd Khabba, and Salah Er-raki

Accurate estimation of evapotranspiration (ET) is fundamental for optimizing irrigation management in semi-arid regions, where water scarcity imposes severe constraints on agricultural productivity. The FAO-56 dual crop coefficient methodology provides a standardized framework for ET estimation; however, its fixed parameterization often fails to represent the spatial and temporal variability characteristic of heterogeneous cropping systems. To address these limitations, this study applies the Satellite Monitoring of Irrigation (SAMIR) model, a spatially distributed approach derived from the FAO-56 formulation that dynamically estimates basal crop coefficients (Kcb) from NDVI and explicitly accounts for vertical soil water redistribution. A data-fusion scheme combining Landsat and MODIS imagery was employed to produce daily NDVI maps at 30 m resolution, enabling high-resolution monitoring across an entire agricultural plain. Model performance was assessed by comparing ET estimates from a calibrated SAMIR configuration, the standard FAO-56 formulation, and three global satellite-based products (PML v2, WaPOR, and SSEBop) against in situ flux measurements at three contrasting sites within the Tensift Basin, Morocco: a drip-irrigated olive orchard (R3), a heterogeneous semi-arid landscape monitored by a large-aperture scintillometer (TAH-LAS), and a dense drip-irrigated wheat field (CHI-EC1). The calibrated SAMIR model consistently outperformed all other approaches, achieving monthly R² values of 0.50, 0.28, and 0.58 with corresponding RMSE of 0.85, 0.85, and 1.03 mm d⁻¹ at R3, TAH-LAS, and CHI-EC1, respectively. While the uncalibrated FAO-56 and PML v2 products exhibited moderate accuracy under certain conditions, WaPOR and SSEBop showed larger errors and lower correlations, including negative R² values and substantial PBIAS in sparse canopy environments. These findings demonstrate that spatially explicit, NDVI-driven modeling incorporating soil water dynamics and local calibration substantially improves ET estimation in semi-arid agricultural systems relative to both traditional FAO-56 approaches and existing global ET datasets.

How to cite: Manyari, Y., Simonneaux, V., Kharrou, M. H., Auclair, J., Khabba, S., and Er-raki, S.: Evaluating an NDVI-Driven, Locally Calibrated FAO-56 Evapotranspiration Model Against Global ET Products and In-Situ Measurements in Semi-Arid Agriculture, EGU General Assembly 2026, Vienna, Austria, 3–8 May 2026, EGU26-2279, https://doi.org/10.5194/egusphere-egu26-2279, 2026.

The mountainous “water towers” of Northern China are crucial for regional water security but face threats from climate change and ecological restoration projects. Understanding their hydrological responses requires tools that capture both intense climatic events and long-term land cover changes. This study presents an integrated assessment using multi-source remote sensing data and hydrological modeling across two critical regions: the Taihang Mountains and the broader Beijing-Tianjin-Hebei (BTH) mountainous area.

We employed the InVEST model to simulate water yield (WY). For the Taihang Mountains (1990–2020), we introduced a detrending analysis framework coupled with the Optimal Parameters-based Geographical Detector (OPGD) to attribute drivers. Results show a significant WY decline (-0.66 mm/yr), primarily (86.46%) driven by climate change. Crucially, OPGD analysis revealed that in areas of sharp decline, precipitation intensity (Q=0.369) was a more dominant factor than total precipitation (Q=0.305), highlighting the key role of changing precipitation patterns.

To assess the long-term impact of large-scale vegetation restoration, we extended the analysis to the BTH mountains over four decades (1980–2020). Multi-period scenario analysis showed that while land use/cover change (LUCC) exerted a short-term negative effect on WY during initial afforestation (2000–2020), it shifted to a positive contribution over the full 40-year period, especially in the Bashang region (+37.80%). This indicates that ecological restoration, despite initial water consumption, can enhance water retention and yield benefits over decadal scales.

Our integrated approach demonstrates that combining process-attribution tools (OPGD) with long-term scenario analysis provides a holistic view of mountain hydrology. The findings underscore that sustainable water management must simultaneously address increasing precipitation extremes and harness the long-term hydrological benefits of ecological restoration.

How to cite: yang, H. and Cao, J.: Integrated Assessment of Water Yield in Northern China's Mountain Using Remote Sensing and Modeling, EGU General Assembly 2026, Vienna, Austria, 3–8 May 2026, EGU26-3210, https://doi.org/10.5194/egusphere-egu26-3210, 2026.

EGU26-3314 | Posters on site | HS6.11

Water–Ecological Risks in Arid Central Asia Under Climate Warming 

Yaning Chen, Zhi Li, and Chuan Wang

Climate warming is reshaping cryospheric processes, hydroclimatic extremes, and ecosystem stability across the arid regions of Central Asia. This study presents an integrated assessment of climate change impacts on glacier dynamics, snow regimes, hydroclimatic extremes, and associated water–ecological risks.

Results indicate a pronounced decline in snowfall amount and duration since the late 20th century, accompanied by a widespread transition in snow drought regimes from precipitation-limited to temperature-driven conditions. Projections based on glacier evolution models suggest that glacier runoff in much of the Tianshan region is approaching, or has already passed, peak water. Peak glacier runoff in the Western Tianshan is projected to occur between the late 2020s and mid-century, depending on emission pathways, while the Eastern Tianshan likely entered a post-peak phase in the early 2020s. Meanwhile, the accelerated expansion of glacial lakes has raised the risk of glacial lake outburst floods (GLOFs), which are currently 3–4 times higher in the western subregion compared to other areas.

Concurrently, hydroclimatic extremes are intensifying. Heatwaves have become more frequent, longer-lasting, and more severe since the 1980s, particularly in the drylands of Central Asia, where declining soil moisture amplifies surface warming. Compound drought–heatwave events are projected to increase markedly under high-emission scenarios, with prolonged durations exceeding several weeks in some regions. Snow droughts are expected to occur more frequently, with warm snow droughts emerging as the dominant type and accounting for approximately two-thirds of future snow drought events by mid-century. These shifts signal a fundamental reorganization of drought dynamics, with cascading effects on hydrological, agricultural, and ecological systems.

Overall, this research highlights the escalating water-ecological risks in arid Central Asia driven by accelerated cryospheric change and intensifying heat extremes, and shifting drought regimes. The findings emphasize the importance of adaptive water management and climate resilience strategies to support sustainable development in this highly vulnerable region.

How to cite: Chen, Y., Li, Z., and Wang, C.: Water–Ecological Risks in Arid Central Asia Under Climate Warming, EGU General Assembly 2026, Vienna, Austria, 3–8 May 2026, EGU26-3314, https://doi.org/10.5194/egusphere-egu26-3314, 2026.

Ecological and water conservation projects, such as Returning Agricultural Land to Forest (RAF) and Returning Agricultural Land to River (RAR), have significantly altered land surface conditions and hydrological processes in many river basins. However, quantifying their spatial and temporal impacts remains challenging due to the complexity of land-use/cover change (LUCC) and the need for high-resolution data. This study focuses on the Qin River Basin, a major tributary in the middle reaches of the Yellow River, where RAF and RAR projects have been extensively implemented. We integrate multi-source remote sensing data, including the China Land Cover Dataset (CLCD) and SRTM DEM, with the Soil and Water Assessment Tool (SWAT) to simulate hydrological responses from 2010 to 2018. The model performed robustly (NSE: 0.70–0.72, R²: 0.71–0.79) and revealed that RAF reduced total runoff by 3.00%, with spatially heterogeneous effects: surface runoff increased in northern subbasins, lateral flow decreased in central regions, and groundwater flow rose dramatically (2366.67%). RAR scenarios showed that converting agricultural land to water bodies enhanced runoff components, with greater efficacy on slopes <15° compared to <6°. The study demonstrates the critical role of remote sensing in capturing LUCC dynamics and highlights the importance of spatially explicit planning for sustainable water resource management in semi-humid basins under intensive human intervention. Our approach provides a scalable framework for integrating remote sensing into hydrological modeling to assess and optimize ecological restoration strategies in data-scarce or heterogeneous regions.

How to cite: Cao, J. and yang, H.: Quantifying Hydrological Impacts of Ecological Restoration Projects in a Yellow River Tributary Using Remote Sensing and SWAT Modeling, EGU General Assembly 2026, Vienna, Austria, 3–8 May 2026, EGU26-3640, https://doi.org/10.5194/egusphere-egu26-3640, 2026.

Precipitation is important for hydrological monitoring and modeling. The accuracy of Mean Areal Precipitation (MAP) estimation relies largely on the the configuration of precipitation network. This study proposes a novel framework for optimizing rain gauge networks by leveraging high-quality reanalysis precipitation data to evaluate MAP estimation. Using the Qingyi River Basin as a case study, we employ the CMA Multi-source Precipitation Analysis System (CMPAS) data to characterize precipitation spatial patterns and establish a benchmark for network optimization. The framework introduces two metrics, i.e., bias of mean areal precipitation (MB) and Kullback-Leibler divergence (KL), to quantify differences between gauge-derived and CMPAS-derived precipitation fields. Evaluation of the current network reveals significant MAP estimation discrepancies in sub-basins with high precipitation variability. Through importance analysis of candidate gauges and hierarchical optimization, we demonstrate that strategic gauge placement guided by precipitation patterns markedly improves MAP estimation accuracy. The optimized network reduces MAP estimation bias by over 5\% in critical sub-basins. This framework offers advantages over traditional methods by enabling preliminary analysis of proposed gauge locations and explicitly incorporating spatial distribution considerations. The methodology proves effective for both network expansion and rationalization while maintaining computational efficiency through its hierarchical optimization strategy

How to cite: Fang, Y.-H., Qian, R., and Cao, Y.: Optimizing Precipitation Gauge Networks for Hydrological Modeling Using High-Quality Reanalysis Data: A Spatial Pattern-Based Approach, EGU General Assembly 2026, Vienna, Austria, 3–8 May 2026, EGU26-4334, https://doi.org/10.5194/egusphere-egu26-4334, 2026.

EGU26-4893 | Orals | HS6.11

The value of Sentinel-3 snow cover fraction data in improving hydrological simulations 

Mitra Tanhapour, Juraj Parajka, Gabriele Schwaizer, Mariette Vreugdenhil, Silvia Kohnová, Kamila Hlavčová, Roman Výleta, Ján Szolgay, and Saeid Okhravi

Runoff and snow simulations can be enhanced using multi-spectral snow cover mapping. The main focus of this research is to evaluate the potential of a new snow cover fraction (SCF) product to improve hydrological simulations. The SCF product derived from combined Sentinel-3 SLSTR and OLCI observations based on a multispectral unmixing method at a spatial resolution of 0.00200° × 0.00200°. This study first assesses the accuracy of a new snow cover fraction (SCF) product against in-situ snow depth measurements at climate stations. It then investigates the impact of assimilating this product on runoff and snow simulation using a conceptual semi-distributed hydrological model. For this purpose, the hydrologic model is calibrated with and without snow cover product using multi-objective calibration and single-objective calibration schemes, respectively. Based on the multi-objective calibration, both runoff and snow are optimized, whereas the single-objective calibration approach focuses on runoff alone. We evaluated the proposed framework across 188 catchments in Austria. The results showed a strong agreement between SCF and snow depth measurements, with a median overall accuracy of about 95%. The analysis of the results demonstrated that the added value of incorporating snow products into model calibration is more pronounced for snow simulation than for runoff estimation. Hence, runoff and snow simulations improved in 39% and 84% of catchments during the validation period, respectively. The findings reveal that our approach enhances the model’s efficiency to more effectively capture snow cover dynamics, which supports more consistent water balance simulations and provides a stronger basis for modeling of snow-induced high-flow conditions.

How to cite: Tanhapour, M., Parajka, J., Schwaizer, G., Vreugdenhil, M., Kohnová, S., Hlavčová, K., Výleta, R., Szolgay, J., and Okhravi, S.: The value of Sentinel-3 snow cover fraction data in improving hydrological simulations, EGU General Assembly 2026, Vienna, Austria, 3–8 May 2026, EGU26-4893, https://doi.org/10.5194/egusphere-egu26-4893, 2026.

Accurate precipitation monitoring is critical for Small Island Developing States (SIDS) like Saint Lucia, where complex topography and high vulnerability to tropical cyclones necessitate precise data for disaster preparedness and water resource management. While ground-based radar provides high-resolution estimates, it is spatially limited. Conversely, satellite products offer global coverage but often suffer from accuracy issues at island scales. This study presents a comprehensive evaluation and calibration framework comparing NASA’s IMERG and ERA5 reanalysis products downscaled to 2km spatial resolution against Caribbean radar observations with 1km spatial resolution. The objective is to quantify satellite performance during extreme weather events and demonstrate a robust operational workflow for bias correction.

The analysis employs a dual-framework approach. First, we conducted a spatial and temporal validation across nine major hurricane and storm events (2007-2024), including Hurricanes Dean and Tomas. This phase utilized Root Mean Square Error (RMSE) and Structural Similarity Index (SSIM) to assess agreement between radar, IMERG, and ERA5 datasets, alongside a point-based comparison at the Grace Station utilizing rain gauge data. Second, we developed a seven-step operational workflow using continuous 2021 data to implement pixel-wise Quantile Mapping bias correction. This workflow involved parallel processing of raw radar imagery, precise temporal-spatial matching, and the training of reusable correction functions.

Analysis of the storm events reveals that uncorrected satellite and reanalysis products systematically underestimate rainfall intensity, particularly during hazardous convective peaks. Satellite storm-mean values often capture only 10-60% of radar-observed totals. While ERA5 and IMERG exhibit comparable performance, both struggle to resolve fine-scale convective structures, yielding modest SSIM scores (averaging 0.15-0.40) that degrade as storm intensity increases. Point-based analysis at Grace Station highlights distinct "smoothing" effects in gridded products. For example, during Hurricane Tomas, a rain gauge recorded a peak intensity of 1516 mm/h (likely an extreme burst or anomaly) and radar recorded 33 mm/h, whereas satellite and ERA5 estimates were smoothed to 15.33 mm/h and 19.18 mm/h, respectively.

To address the identified underestimation, the Quantile Mapping method applied to the 2021 dataset yielded significant improvements. The correction reduced systematic bias by 87% (from a relative bias of -185% to -23%) and decreased the Mean Absolute Error (MAE) by 43%. Crucially, the correction dramatically improved the spatial structure of the precipitation fields, raising the temporal SSIM by 70% (from 0.490 to 0.834). The methodology successfully extended the dynamic range of satellite estimates to match radar observations, correcting the "capped" maximum values (from ~8 mm to >87 mm) and enabling a more realistic representation of extreme events. This study confirms that while raw satellite and reanalysis products underestimate intense Caribbean precipitation, they can be effectively calibrated using ground-based radar. The proposed workflow establishes a reusable framework for training bias correction functions, allowing meteorologists and hydrologists in Saint Lucia to better model flood risks and enhance climate resilience.

How to cite: shafei, A. and Cioffi, F.: Bridging the Gap Between Radar and Satellite: A Multi-Source Validation and Bias Correction Framework for Precipitation Estimation in Saint Lucia, EGU General Assembly 2026, Vienna, Austria, 3–8 May 2026, EGU26-5151, https://doi.org/10.5194/egusphere-egu26-5151, 2026.

EGU26-6474 | Posters on site | HS6.11

A combined global total column water vapour data record from microwave and near-infrared imager observations: new developments and results from validation 

Hannes Konrad, Johannes Bärlin, Anja Niedorf, Olaf Danne, Marc Schröder, Rene Preusker, Tim Trent, Jürgen Fischer, Carsten Brockmann, Michaela Hegglin, and Rainer Hollmann

Water vapour is the single most important natural greenhouse gas in the atmosphere, thereby constraining the Earth’s energy balance, directly and indirectly through the water vapour feedback mechanism. In addition, water vapour is a key component of the water cycle. There is consequently the need to consolidate our knowledge of natural variability and past changes in water vapour and to establish climate data records (CDRs) of both total column and vertically resolved water vapour for use in climate research. This is the objective of the ESA Water Vapour Climate Change Initiative (WV_cci).

Within WV_cci a global total column water vapour (TCWV) data record was generated by combining microwave-based TCWV observations over the ice-free ocean with near-infrared imager-based TCWV over land, coastal ocean and sea-ice. The data record relies on microwave imager observations, partly based on a fundamental climate data record from EUMETSAT CM SAF and on near-infrared observations from MERIS, MODIS and OLCI. The microwave and near-infrared data streams are processed independently and combined in a postprocessing, retaining the individual TCWV values and their uncertainties. The precursor version of the data record is freely available to the public via 10.5676/EUM_SAF_CM/COMBI/V001. A new version, which relies on more sensors and features improved stability and uncertainty characterisation, will be released in the coming months. In addition, a high-resolution regional product was generated covering three regions in the sub-tropics and tropics with a spatial resolution of 0.01°.

This presentation will briefly introduce WV_cci and new developments and improvements related to the data record generation. The TCWV over land is reliably possible in clear-sky conditions only. Thus, after aggregation and comparison to all-sky data a clear-sky bias is present. Results from the clear-sky bias analysis will be shown as well. A focus will be on results from intercomparisons and validation, including results from uncertainty validation through comparisons against radiosonde and GNSS observations.

How to cite: Konrad, H., Bärlin, J., Niedorf, A., Danne, O., Schröder, M., Preusker, R., Trent, T., Fischer, J., Brockmann, C., Hegglin, M., and Hollmann, R.: A combined global total column water vapour data record from microwave and near-infrared imager observations: new developments and results from validation, EGU General Assembly 2026, Vienna, Austria, 3–8 May 2026, EGU26-6474, https://doi.org/10.5194/egusphere-egu26-6474, 2026.

EGU26-6780 | Posters on site | HS6.11

HOAPS: A Satellite based Climate Data Record of Ocean-Atmosphere Interaction Parameters 

Anja Niedorf, Thomas Sikorski, Karsten Fennig, Hannes Konrad, Marc Schröder, Johannes Bärlin, Rainer Hollmann, Ralf Bennartz, and Frank Fell

The Hamburg Ocean-Atmosphere Parameters and Fluxes from Satellite Data (HOAPS) data set provides a long-term, consistent suite of global ocean-atmosphere climate variables over ice-free oceans derived from satellite passive microwave observations. Designed to support climate monitoring, air-sea interaction studies, and model evaluation, HOAPS offers more than three decades of key parameters such as vertically integrated water vapor, evaporation, near surface specific humidity, near surface wind speed, freshwater flux, latent heat flux, and, recently implemented, liquid water path.

A defining feature of HOAPS is its inter-sensor calibration and physically consistent algorithms, ensuring that all products are produced using a uniform retrieval framework, minimizing artificial trends and discontinuities.

In this presentation, we will focus on the upcoming HOAPS release (HOAPS v5.0), outline recent methodological updates such as newly implemented data sources, updates of the retrieval and radiative transfer model including a new bias correction scheme, improved uncertainty propagation, and more. Additionally, we will demonstrate the usefulness of the dataset through selected examples that highlight variability in the global water cycle. We will also discuss the implementation of a continuous extension of the dataset. HOAPS sustains to serve as a robust satellite-based reference for climate studies of air-sea fluxes and ocean-atmosphere coupling and more.

How to cite: Niedorf, A., Sikorski, T., Fennig, K., Konrad, H., Schröder, M., Bärlin, J., Hollmann, R., Bennartz, R., and Fell, F.: HOAPS: A Satellite based Climate Data Record of Ocean-Atmosphere Interaction Parameters, EGU General Assembly 2026, Vienna, Austria, 3–8 May 2026, EGU26-6780, https://doi.org/10.5194/egusphere-egu26-6780, 2026.

EGU26-9162 | ECS | Posters on site | HS6.11

Satellite-Based Estimation of Chlorophyll-a and Total Phosphorus in Saemangeum’s Hydrodynamically Complex Waters Using Machine and Deep Learning 

Yejin Lee, Dongjin Kim, Suhwan Kim, Dohee Han, Hyun-su Kim, Su-mi Kim, and Jong-Min Yeom

The coastal waters formed by the Saemangeum Dam are difficult to monitor and predict in terms of water quality because of complex mixing of seawater and freshwater caused by artificial water gate control, high optical variability, and other factors. The Saemangeum Dam area on South Korea's west coast is a representative artificial coastal water system where inflow of watershed water, seawater exchange through water gate operation, and nutrient accumulation interact nonlinearly, frequently leading to eutrophication and algal blooms.

This research developed a forecasting system for chlorophyll-a (Chl-a) and total phosphorus (T-P) levels in the Saemangeum aquatic region by integrating geostationary satellite GOCI data with artificial intelligence methods. We combined GOCI observations from 2011 to 2020 with in situ water quality measurements from 13 sites to compare machine learning and deep learning algorithms for estimating water quality.

To identify effective input variables for the optically complex Saemangeum environment, satellite reflectance was combined with meteorological information, gate-controlled water exchange, and nutrient indicators. Seven input scenarios were designed to evaluate how progressive variable integration influences prediction performance, and representative machine learning and deep learning models were compared.


Results showed that scenarios incorporating nutrient-related variables yielded the most robust predictions for both chlorophyll-a and total phosphorus. While deep learning models captured complex relationships under standard evaluation, spatially independent validation highlighted that machine learning approaches maintained more stable generalization under strong spatial heterogeneity and limited training data. This finding suggests that model suitability depends on data structure and validation context rather than algorithm complexity alone.

Overall, the artificial intelligence-based water quality prediction system presented in this study can effectively monitor fluctuations in chlorophyll a and T-P in embankment reservoir waters, and can be utilized as a practical tool for early warning systems and the development of water quality management policies. It is expected to contribute to strategies for responding to algal blooms and managing large-scale artificial coastal waters.


This work was supported by the National Research Foundation of Korea(NRF) grant funded by the Korea government(MSIT)(RS-2025-00515357).

How to cite: Lee, Y., Kim, D., Kim, S., Han, D., Kim, H., Kim, S., and Yeom, J.-M.: Satellite-Based Estimation of Chlorophyll-a and Total Phosphorus in Saemangeum’s Hydrodynamically Complex Waters Using Machine and Deep Learning, EGU General Assembly 2026, Vienna, Austria, 3–8 May 2026, EGU26-9162, https://doi.org/10.5194/egusphere-egu26-9162, 2026.

EGU26-12486 | ECS | Posters on site | HS6.11

Tracking Fluvial Inundations and Groundwater Recharge Areas in the Upper Mekong Delta by Combining Sentinel-1, SWOT, and In-Situ Data 

Ismail Bala Muhammad, Hind Oubanas, Christina Orieschnig, Pierre-Olivier Malaterre, Paul Baudron, Sylvian Massuel, Cécile Cazals, and Sambo Lun

Annual monsoon inundations are essential ecosystem services in the Cambodian Mekong Delta. These floods support agricultural cycles, fish production, ecosystem regulation and potentially groundwater recharge. However, recent development of hydropower and irrigation infrastructures, land use and climate change have influenced hydrological processes including surface water and groundwater exchanges. Satellite imagery like Sentinel-1 has been widely used in previous studies to map inundation extent due to its temporal availability in all weather conditions. Nevertheless, Sentinel-1 is limited by unwanted interference from vegetation, terrain, and anthropogenic features. Data from the Surface Water and Ocean Topography (SWOT) mission launched in December 2022, equipped with Ka-band Radar Interferometer (KaRIn), provides a complementary perspective by providing two-dimensional water surface elevations and extent from which water volumes can be estimated. To help better characterise surface water flows that may percolate into the deep aquifer, this study presents a methodology for tracking river dynamics and floodplains inundation  over the Mekong Delta in Cambodia, using a combination of SWOT and Sentinel-1. The datasets obtained from the two satellites  are compared with in-situ water level and discharge data and evaluate their effectiveness for tracking the river dynamics, inundation extent, and flow quantification. This validation is performed over the Tonle Sap River, a tributary of the Mekong River, and provides insights into the functionality of the ecosystem within the study region. This study also explores potential estimation of the possible contribution of the groundwater recharge areas to the groundwater budget.   

How to cite: Bala Muhammad, I., Oubanas, H., Orieschnig, C., Malaterre, P.-O., Baudron, P., Massuel, S., Cazals, C., and Lun, S.: Tracking Fluvial Inundations and Groundwater Recharge Areas in the Upper Mekong Delta by Combining Sentinel-1, SWOT, and In-Situ Data, EGU General Assembly 2026, Vienna, Austria, 3–8 May 2026, EGU26-12486, https://doi.org/10.5194/egusphere-egu26-12486, 2026.

EGU26-12508 | Orals | HS6.11

Multi-scale monitoring of irrigation volumes and evapotranspiration by assimilating satellite data into an energy-water balance model  

Chiara Corbari, Nicola Paciolla, Carolina Angeloni Valente, Carlo Belluati, Sven Berendsen, and Justin Sheffield

The agricultural sector is the biggest and least efficient water user, accounting for around 70% of total water use in the Mediterranean region, which is already strongly impacted by climate change with prolonged drought periods, imposing limitation to irrigation water availability. The objective of this study was to develop a procedure for the monitoring irrigation water use and evapotranspiration across different agricultural districts in the Po Valley at 30 m of spatial resolution from 2022 to 2024 and over the entire agricultural area of the basin at 250 m from 2015 to 2024.

The analysis is based on the FEST-EWB model, that computes continuously in time both soil moisture (SM) and evapotranspiration based on the coupling of the energy and water balances. A specific model procedure has been implemented to consider the presence of flooded paddies. The model has been calibrated and validated over non-irrigated areas, against land surface temperature (LST) from downscaled MODIS data at 250m and LANDSAT data at 100 m; Sentinel 1 soil moisture data and local eddy covariance evapotranspiration measurements.

The model has been run using as input the past meteorological forcings (ECMWF ERA5-Land or ground network) and vegetation data from Sentinel2 at 30 m and MODIS at 250 m. Groundwater dynamic was considered from the available groundwater wells from the regional networks.

The actual irrigation volumes have been estimated through the calibrated model implementing three different irrigation strategy: the FAO approach based on SM crop stress thresholds (Allen et al., 1998), the separate and jointly assimilation of satellite LST and SM data to update the modeled fluxes and estimate the irrigation volumes. The different irrigation efficiencies have been considered when modelling the irrigation volumes.

Overall, the results suggested that the yearly total irrigation volumes modeled with the FAO approach are generally underestimated in respect with the observed water allocations. Higher agreement was found when satellite LST or SM are assimilated, but with differences across the years.

How to cite: Corbari, C., Paciolla, N., Angeloni Valente, C., Belluati, C., Berendsen, S., and Sheffield, J.: Multi-scale monitoring of irrigation volumes and evapotranspiration by assimilating satellite data into an energy-water balance model , EGU General Assembly 2026, Vienna, Austria, 3–8 May 2026, EGU26-12508, https://doi.org/10.5194/egusphere-egu26-12508, 2026.

Abstract

Reliable knowledge of soil moisture at daily, field-scale (∼30 m) resolution is essential for flood forecasting, agricultural water management, and other applications that depend on accurate characterization of near-surface hydrologic conditions.  This work presents a thermal-inertia-based framework that integrates multi-sensor remote sensing, in situ observations, and physically based modeling to estimate soil moisture at high spatial and temporal resolution while maintaining physical interpretability.  Hourly land surface temperatures (LST) are obtained at 30 m resolution by downscaling geostationary GOES observations using Landsat-derived spatial covariates, enabling construction of spatially-detailed diurnal surface temperature time series.  Hourly surface energy-balance components are retrieved from ERA5, providing net radiative forcing information, from which ground heat flux is calculated as a residual.  ERA5 fluxes represent spatially aggregated thermal forcing across widely heterogeneous landscapes.   Local (30 m scale) subsurface heat dynamics vary greatly due to differences in soil properties, vegetation, and moisture state.  In situ observations from the International Soil Moisture Network (ISMN) are used to model how local subsurface heat dynamics depart from those implied by coarse-scale energy forcing. This step employs a support vector regression (SVR) modeling strategy that is well suited for multiple, non-linear, and non-independent predictors. The SVR model derives a physically interpretable quantity representing heat dynamics within the soil profile as a function of surface thermal response (LST magnitude, diurnal amplitude, and phase lag) and geographic context.  Soil moisture is subsequently estimated using an SVR approach. In this step, soil moisture is inferred from observed LST amplitude and LST lag relative to radiative forcing, together with the modeled representation of subsurface heat dynamics. To address periods when acceptable thermal remote sensing is unavailable, the framework is coupled with a physically based water-balance model. This model propagates soil moisture states through intervals with limited thermal data.  The resulting hybrid framework enables daily, field-scale soil moisture estimation that is physically grounded and well suited for hydrologic forecasting, agricultural decision support, and environmental monitoring.


How to cite: Zollweg, J.: Remote sensing of soil moisture at high spatiotemporal resolution using thermal inertia , EGU General Assembly 2026, Vienna, Austria, 3–8 May 2026, EGU26-15108, https://doi.org/10.5194/egusphere-egu26-15108, 2026.

EGU26-15713 | Orals | HS6.11

Modeling naturalized vs regulated flow regimes for E-Flows: Bias-corrected VegET–mizuRoute–mizuLake modelling in the Lerma–Santiago Basin, Mexico 

Naga Manohar Velpuri, Komlavi Akpoti, Afua Owusu, Ransford Bakuri, Felicia Yeboah, Romeo Koduah, Luis Palacios-Sanchez, Marissa Mar Pecero, Sandra Galindo, and Rolando Avila Cedillo

Environmental flow (e-flow) assessment requires robust characterization of both naturalized (baseline) and regulated (current) flow regimes at ecologically relevant spatial scales. The Lerma–Santiago River Basin (Mexico) is one of the most socio-economically important and hydrologically monitored basins in the country, yet translating point-based discharge observations into consistent, basin-wide flow information for environmental flow assessments remains challenging due to flow regulation, reservoirs, diversions, and spatial heterogeneity in climate forcing. Here we present a high-resolution hydrological modelling framework designed to generate spatially explicit discharge time series for environmental flow assessment and monitoring across the full basin.

The modelling system couples the VegET agro-hydrologic model for runoff generation with the vector-based mizuRoute routing model to simulate discharge along a MERIT-derived high-density river network and associated hydrologic response units (HRUs), enabling flow estimation across both major rivers and smaller tributaries. To quantify uncertainty linked to precipitation forcing, VegET is driven by multiple rainfall datasets (CHIRPS v2, CHIRPS v3, ERA5, and MSWEP), producing an ensemble of runoff and discharge simulations. Two flow regimes are generated: (i) a naturalized regime using VegET–mizuRoute to represent baseline hydrology without reservoir regulation, and (ii) a regulated regime integrating mizuLake, which explicitly accounts for lakes and reservoirs within routing to reproduce anthropogenically altered flow dynamics. Given the strong monitoring network in the basin, simulated discharge is additionally bias-corrected using observed streamflow, improving the realism of monthly hydrographs and low-flow/high-flow characteristics.

The resulting discharge products provide a consistent, reach-scale representation of flow variability and uncertainty, delivering the core hydrological inputs required to define, compare, and track e-flow targets across the Lerma–Santiago Basin under both naturalized and managed conditions.

How to cite: Velpuri, N. M., Akpoti, K., Owusu, A., Bakuri, R., Yeboah, F., Koduah, R., Palacios-Sanchez, L., Mar Pecero, M., Galindo, S., and Avila Cedillo, R.: Modeling naturalized vs regulated flow regimes for E-Flows: Bias-corrected VegET–mizuRoute–mizuLake modelling in the Lerma–Santiago Basin, Mexico, EGU General Assembly 2026, Vienna, Austria, 3–8 May 2026, EGU26-15713, https://doi.org/10.5194/egusphere-egu26-15713, 2026.

In many countries and regions of Southeast Asia, meteorological observation networks remain sparse, and high-accuracy precipitation data with rapid latency which are crucial for disaster mitigation are still not operationally available. Existing satellite precipitation products include those from the Global Precipitation Measurement Mission (GPM), such as NASA IMERG, and the JAXA GSMaP products. However, the near-real-time versions IMERG Early Run, GSMaP NOW, and GSMaP NRT exhibit data latencies of approximately 4 h, 1 h, and 4 h, respectively. Moreover, their estimation accuracies differ, and the most rapid product, GSMaP NOW, still shows limitations even in the qualitative detection of heavy rainfall.

Therefore, the objective of this study is to develop a near-real-time satellite precipitation product by integrating high-frequency infrared imagery from geostationary meteorological satellites with the GSMaP series. The datasets used include infrared imagery from the geostationary meteorological satellites Himawari‑8/9, microwave-based precipitation estimates from the GSMaP series, and elevation data derived from MERIT DEM. Precipitation estimation is performed using a deep-learning approach, in which infrared imagery, microwave precipitation data, and elevation data are used as input variables, and the output is a rainfall distribution with a spatial resolution of 2 km. The model is trained using meteorological radar data over Japan and subsequently applied to Southeast Asia.

The estimated precipitation product has a spatial resolution of 2 km, a temporal resolution of 10 min, and a data latency of 1 h. The results demonstrate that the proposed product successfully reproduces the heavy rainfall event that occurred in southern Thailand in late November 2025 and outperforms the existing GSMaP products.

How to cite: Fujimoto, K. and Tebakari, T.: Development of a Deep Learning–Based Satellite Precipitation Product for Hydrological Applications and Evaluation of Its Reproducibility for Extreme Rainfall, EGU General Assembly 2026, Vienna, Austria, 3–8 May 2026, EGU26-16074, https://doi.org/10.5194/egusphere-egu26-16074, 2026.

EGU26-16272 | ECS | Posters on site | HS6.11

Integration of SMAP L-band VOD and Multi-source Satellite Data for Improved Sentinel-1 Soil Moisture Retrieval in Complex Terrains 

Junhyuk Jeong, Doyoung Kim, Seulchan Lee, Wanyub Kim, and Minha Choi

Sentinel-1 SAR enables high-resolution soil moisture estimation using the C-band backscatter coefficient. To account for attenuation and volume scattering effects in densely vegetated areas, soil moisture retrieval methods using the Water Cloud Model (WCM) are widely employed. Traditional WCM utilizes the Normalized Difference Vegetation Index (NDVI) and C-band Radar Vegetation Index (RVI) as vegetation parameters, which have limitations due to the saturation of the NDVI and low penetration of C-band. To overcome these problems, this study introduced SMAP L-band Vegetation Optical Depth (VOD) as a vegetation parameter for WCM and applied it to the complex mountainous terrain of the Korean Peninsula. In the parameter estimation process of the WCM, the quantitative relationship between in-situ observations and soil texture was established, enabling the dynamic spatial extension of model parameters to ungauged regions. The validation results with in-situ soil moisture data showed improved correlation coefficient R and ubRMSE compared to existing WCM methods. It was found to enhance the accuracy of soil moisture estimation by more precisely correcting signal attenuation caused by vegetation in complex terrain. This study demonstrates the validity of high-resolution hydrological parameter estimation in complex terrain through satellite data fusion and is expected to provide essential foundational information for precise drought monitoring and water resource management in the future.


Keywords: Soil Moisture, Sentinel-1, Vegetation Optical Depth, Water Cloud Model, Multi-source fusion, Complex terrain


Acknowledgment

This research was supported by the BK21 FOUR (Fostering Outstanding Universities for Research) funded by the Ministry of Education (MOE, Korea) and National Research Foundation of Korea (NRF). This work is financially supported by Korea Ministry of Land, Infrastructure and Transport (MOLIT) as 「Innovative Talent Education Program for Smart City」. This work was supported by Korea Environment Industry & Technology Institute (KEITI) through Water Management Program for Drought Project, funded by Korea Ministry of Climate, Energy and Environment (MCEE)(RS-2023-00230286). This work was supported by the National Research Foundation of Korea (NRF) grant funded by the Korea government (MSIT) (RS-2024-00416443). This work was supported by the National Research Foundation of Korea (NRF) grant funded by the Korea government (MSIT) (RS-2022-NR070339).

How to cite: Jeong, J., Kim, D., Lee, S., Kim, W., and Choi, M.: Integration of SMAP L-band VOD and Multi-source Satellite Data for Improved Sentinel-1 Soil Moisture Retrieval in Complex Terrains, EGU General Assembly 2026, Vienna, Austria, 3–8 May 2026, EGU26-16272, https://doi.org/10.5194/egusphere-egu26-16272, 2026.

EGU26-19309 | Orals | HS6.11

Hydroterra+: an EO mission concept to reveal sub-daily water processes 

Cristian Rossi, Andrea Monti Guarnieri, and Antonio Parodi

Much of the change that our planet will experience in the coming decades is driven by climate. In this ever‑warming world, water is of central importance, and Hydroterra+ is an ESA mission concept designed to fill key observation gaps and improve our understanding of the water cycle and water management.

Hydroterra+ focuses primarily on the Mediterranean basin, identified as a climate‑change hotspot due to its transitional position between subtropical and mid‑latitude zones, and sub‑Saharan Africa, one of the regions most affected by increasing climate shocks. The mission also foresees the possibility of monitoring specific areas on an hourly basis, for example in emergency situations or for dedicated scientific studies.

The mission is based on a geostationary Synthetic Aperture Radar (SAR) operating in interferometric mode. Its near‑continuous observation capability, short revisit time, and very wide coverage make Hydroterra+ uniquely suited to monitor water‑related processes on timescales of hours at regional scale. Existing and planned low‑Earth‑orbit missions are poorly matched to this need.

Hydroterra+ will provide a suite of sub‑daily products, including:

  • Integrated Water Vapour (IWV) to improve understanding and forecasting of extreme weather events;
  • Surface Soil Moisture (SSM) to advance knowledge of soil dynamics and related processes, including agricultural practices;
  • Snow Water Equivalent (SWE) and Snow Melt Phases (SMP) to improve understanding of mid‑latitude cryosphere processes;
  • Surface Displacements (DQ) and Change Maps (CM) to enhance knowledge of geophysical hazards.

Hydroterra+ is an Earth Explorer 12 candidate mission and is currently progressing through Phase‑0 studies. This paper will present the mission concept and the first results of its feasibility analysis, including outcomes from several Observing System Simulation Experiments (OSSEs) conducted across the scientific mission domains.

How to cite: Rossi, C., Monti Guarnieri, A., and Parodi, A.: Hydroterra+: an EO mission concept to reveal sub-daily water processes, EGU General Assembly 2026, Vienna, Austria, 3–8 May 2026, EGU26-19309, https://doi.org/10.5194/egusphere-egu26-19309, 2026.

EGU26-20238 | ECS | Orals | HS6.11

Assessing Human Health and Infrastructure Vulnerability to Groundwater Stress in the Northern Indo-Gangetic Plains 

Anuja Girap, Shivam Chawla, Shubham Bhagat, Manoj Kumar, and Chandrakanta Ojha

The Satluj-Ghaggar river floodplains comprise a heterogeneous landscape, encompassing urban, agricultural, and industrial regions, which extend across the Punjab, Chandigarh, Haryana, and Himachal Pradesh states of the northern Indo-Gangetic Plains (IGP). Previous studies have reported groundwater quality deterioration with harmful heavy metals such as Mn, Fe, Ni, Zn, As, Tl, U, and Se exceeding WHO/BIS thresholds and associated health impacts, including gastrointestinal and skin issues (Kumar et al., 2024), along with groundwater over-extraction-induced land subsidence in parts of this study region, such as western Lundiana, where reported subsidence rates range from -2 to -21 mm/yr (Shankar et al., 2024). However, integrated assessments linking groundwater stress to both human health risks and infrastructure damage remain limited. 

This study provides a comprehensive evaluation of groundwater-related health hazards and land subsidence-driven infrastructure exposure, utilizing hydro-geochemical observations and satellite-based analysis. Using hydro-chemical analysis, we computed non-carcinogenic health indices (HI) for pre- and post-monsoon seasons based on concentrations of 19 heavy metals measured in groundwater (n = 69) and surface water (n = 11). The results indicate that areas exposed to moderate (HI = 1-4) to severe (HI > 4) health risks increased during the post-monsoon season, with children exhibiting higher vulnerability than adults. By integrating population data into the exposure analysis, we observe that rapidly urbanizing areas exhibit high exposure to health risks.

For assessing land deformation and infrastructure vulnerability resulting from groundwater over-drafting, we use multi-temporal Interferometric Synthetic Aperture Radar (MT-InSAR) time-series analysis over the period 2016-2023, utilizing Sentinel-1 data from the European Space Agency (ESA). We observed an average vertical land motion rate of approximately -6.1 mm/yr across the floodplain. Such deformation trends correlate with long-term average groundwater-level declines of approximately -0.3 m/yr observed in nearly 150 monitoring wells of Central Groundwater Board (CGWB) across the region.

The ongoing subsidence poses increasing risks to built-up areas, mainly near the Chandigarh, Mohali, Kharar, Rajpura, and Deabassi regions, where surface cracks and structural damage have been reported. Using Land Use Land Cover (LULC) map and subsidence results, it was calculated from ArcGIS that approximately 28% of built-up land is exposed to severe (< -20 mm/yr) subsidence-induced potential infrastructure damage. We are further analysing seasonal variations in both health and infrastructure risks to identify periods of higher vulnerability.

How to cite: Girap, A., Chawla, S., Bhagat, S., Kumar, M., and Ojha, C.: Assessing Human Health and Infrastructure Vulnerability to Groundwater Stress in the Northern Indo-Gangetic Plains, EGU General Assembly 2026, Vienna, Austria, 3–8 May 2026, EGU26-20238, https://doi.org/10.5194/egusphere-egu26-20238, 2026.

The Tibetan Plateau (TP) is characterized by complex and heterogeneous surface conditions across its multiple climate zones, leading to significant spatial variability in the dominant controls on surface water and energy fluxes. This complexity poses a significant challenge to mechanistic analyses of surface water and energy fluxes and to the evaluation of flux products from remote sensing and reanalysis. In this study, we synthesize multi-year eddy-covariance observations from 19 land–atmosphere interaction stations covering humid, semi-humid, semi-arid and arid regions of the TP and use convergent cross mapping (CCM) and boosted regression trees (BRT) to: (1) systematically identify the principal drivers of latent heat flux (LE) and sensible heat flux (H) and their regional variability; and (2) assess the performance of several commonly used remote-sensing and reanalysis flux products over the TP. We find pronounced climate-zone differences in the dominant controls on LE. In humid and semi-humid zones, net radiation (Rn) is the primary driver; within the semi-humid zone, increasing volumetric water content of the shallow soil (Shallow VWC) shifts LE progressively from a water-limited to energy-limited regimes. In semi-arid and arid zones, LE is jointly regulated by Shallow VWC and vapor pressure deficit (VPD): higher Shallow VWC consistently enhances LE, whereas low VPD favors LE and high VPD strongly suppresses it. These regional differences can be attributed to the differential responses of surface conductance (Gs) to Shallow VWC and VPD. In arid and semi-arid regions, Shallow VWC plays a key regulatory role: increases in Shallow VWC markedly enhance the sensitivity of Gs to VPD and increase the reference conductance (Gs_ref); meanwhile, Gs in these regions is more sensitive to VPD; therefore, under high VPD conditions, Gs declines rapidly, thereby strongly suppressing LE. By contrast, no comparable regulatory effect of Shallow VWC is observed in humid regions, and the sensitivity of Gs to VPD is overall lower than in arid and semi-arid regions. By contrast, controls on H are consistent across climate zones and are dominated by the land–air temperature gradient (Ts–Ta). Evaluation of remote-sensing and reanalysis products indicates critical weaknesses with pronounced regional specificity in their performance. Because the models fail to accurately characterize the roles of Shallow VWC and VPD, LE estimates are least accurate in arid regions; by contrast, biases in H are largest in humid regions, where most products still inadequately represent its modulation by Ts–Ta.

How to cite: Cai, Z., Wang, B., and Ma, Y. and the Zhengling Cai: Regional differences in the dominant controls and regulatory mechanisms of surface water and heat fluxes across the climate zones of the Tibetan Plateau, EGU General Assembly 2026, Vienna, Austria, 3–8 May 2026, EGU26-1473, https://doi.org/10.5194/egusphere-egu26-1473, 2026.

EGU26-1609 | Orals | HS6.14

A Comprehensive Monitoring System for Land-Atmosphere Interactions at Solar Farms on the Tibetan Plateau 

Cunbo Han, Zhenshi Zhang, Wei Hu, Duanchun Hui, Jiawei Liu, and Yaoming Ma

As traditional fossil energy resources become increasingly depleted and the associated environmental and ecological problems intensify, the importance of developing new energy sources, particularly solar energy, has steadily increased. Among them, installed solar power capacity has grown rapidly, and its share in total energy consumption has continued to rise. However, the large-scale deployment of solar power generation can exert different influences on the climatic and ecological environment.


The Gonghe region of Qinghai hosts the largest integrated solar and wind power generation base in China and is also among the largest in the world. In this study, a comprehensive land–atmosphere interaction monitoring system was established at two representative sites in Gonghe, Qinghai: a 500-MW photovoltaic (PV) power station and a 50-MW concentrated solar power (CSP) station. The monitoring instruments mainly include planetary boundary layer towers, eddy covariance systems, four-component radiation balance measurements, multi-layer automatic weather stations, optical-microwave scintillometer, soil temperature and moisture networks, and phenological cameras. In addition, unmanned aerial vehicle (UAV) remote sensing and UAV-based eddy covariance observation experiments were conducted. This study introduces the development of the land–atmosphere interaction monitoring system and presents preliminary observational and modeling results.

How to cite: Han, C., Zhang, Z., Hu, W., Hui, D., Liu, J., and Ma, Y.: A Comprehensive Monitoring System for Land-Atmosphere Interactions at Solar Farms on the Tibetan Plateau, EGU General Assembly 2026, Vienna, Austria, 3–8 May 2026, EGU26-1609, https://doi.org/10.5194/egusphere-egu26-1609, 2026.

EGU26-1653 | Posters on site | HS6.14

The observation and simulation of lake-atmosphere interaction processes over several high-elevation lakes of the Tibetan Plateau 

Binbin Wang, Xingdong Shi, Mingsheng Chen, Xuan Li, Lijun Sun, and Yaoming Ma

Lake-atmosphere interaction is the most important process that can significantly influence catchment water circulation, climate change and ecosystem preservation. However, the in situ measurements are still very limited because of the harsh conditions and difficult environments. In this study, we will introduce the comprehensive measurements over several high-elevation lakes, including Nam Co, Serling Co, Bangong Co, Laang Co. The filed measurements will include lake water temperature gradients, meteorological variables, lake-atmosphere turbulent flux exchanges by eddy covariance measurements and the satellite ice phenology. The results show the obvious under-ice warming before the ice-off events and the improved WRF-Lake model can reproduce the obvious process. The characteristics of meteorological conditions and lake-atmosphere turbulent heat flux will be explained. The long-term trends in lake evaporation and ice sublimation as well as lake ice phenology will be summarized. These datasets and results will show significance for lake process analysis over these data-scarce lakes of the Tibetan Plateau.

How to cite: Wang, B., Shi, X., Chen, M., Li, X., Sun, L., and Ma, Y.: The observation and simulation of lake-atmosphere interaction processes over several high-elevation lakes of the Tibetan Plateau, EGU General Assembly 2026, Vienna, Austria, 3–8 May 2026, EGU26-1653, https://doi.org/10.5194/egusphere-egu26-1653, 2026.

EGU26-1655 | Posters on site | HS6.14

The exchange of energy and water over the Tibetan Plateau 

Yaoming Ma

Containing elevated topography, the Tibetan Plateau (TP) has significant thermodynamic effects for regional environment and climate change, where understanding energy and water exchange processes (EWEP) is an important prerequisite. However, estimation of the exact spatiotemporal variability of the land-atmosphere energy and water exchange over heterogeneous landscape of the TP remains a big challenge for scientific community. Based on the observation, remote sensing, and numerical simulation, the major advances on EWEP over the past 35 years are systematically summarized in this work. All these results advanced the understanding of different aspects of EWEP over the TP by using in situ measurements, multisource satellite data and numerical modeling. Future studies are recommended to focus on the optimization of the current three dimensional comprehensive observation system, the development of applicable parameterization schemes and the investigation of EWEP on weather and climate changes over the TP and surrounding regions.


How to cite: Ma, Y.: The exchange of energy and water over the Tibetan Plateau, EGU General Assembly 2026, Vienna, Austria, 3–8 May 2026, EGU26-1655, https://doi.org/10.5194/egusphere-egu26-1655, 2026.

EGU26-1707 | Posters on site | HS6.14

Establishment of Integrated Hydrometeorological Observation Platforms in Lakes across Three Distinct Climatic Zones on the Tibetan Plateau 

Weiqiang Ma, Weiyao Ma, Yaoming Ma, Zhipeng Xie, Jianan He, Longtengfei Ma, and Binbin Wang

Lakes on the Tibetan Plateau play a crucial role in regional hydrology and climate, yet they are highly sensitive to climate change. Despite their importance, our understanding of lake-atmosphere interactions in this region remains limited, primarily due to lack of multi-scale observations constrained by harsh environmental conditions. To address this data gap, we established a comprehensive hydrometeorological observation network across three lakes representing different climatic zones on the Tibetan Plateau. Since 2019, this network has continuously collected key datasets, including meteorological conditions, turbulent fluxes, water levels, temperature profiles, and salinity measurements. Our study suggests that these lakes significantly influence local climate by alleviating temperature fluctuations, altering wind patterns, and reducing atmospheric stability. The observational network marks a substantial step forward in capturing the lake-region climate system, improving our understanding of lake-atmosphere interactions and their impact on regional climate dynamics. Additionally, it supports the validation of models and refinement of remote sensing products. In the future, we aim to expand the integration of in situ, satellite, and model-based data to better support environmental conservation and water resource management on the Tibetan Plateau.

How to cite: Ma, W., Ma, W., Ma, Y., Xie, Z., He, J., Ma, L., and Wang, B.: Establishment of Integrated Hydrometeorological Observation Platforms in Lakes across Three Distinct Climatic Zones on the Tibetan Plateau, EGU General Assembly 2026, Vienna, Austria, 3–8 May 2026, EGU26-1707, https://doi.org/10.5194/egusphere-egu26-1707, 2026.

High-resolution land surface temperature (LST) is a critical variable for quantifying fine-scale energy and water cycle variations. NASAs ECOSTRESS mission provides unprecedented high-resolution thermal infrared observations for investigating intricate land-atmosphere interactions. Nevertheless, previous LST validation efforts have been constrained by sparse ground networks with inadequate sample sizes, limited diversity in land cover types and atmospheric conditions, and insufficient high-elevation coverage. To overcome this long-standing challenge, a comprehensive validation framework was established by integrating a feasible radiance-based (R-based) validation method with conventional temperature-based (T-based) validation. The R-based method was first verified at a homogeneous site (BJ station, Mean Bias = 0.21 K) and subsequently extended to evaluate seven previously unvalidated surface types, addressing critical data gaps across challenging surfaces like glaciers and permafrost. A comprehensive uncertainty budget was then systematically quantified for both methodologies, revealing distinct error components and inherent differences between the two approaches. To reconcile these differences and establish a more representative and robust validation reference, results from both approaches were integrated using an Uncertainty-Weighted Averaging (UWA) framework. This integrated framework yielded an overall UWA-based RMSE of 2.12 K for the ECOSTRESS LST product. Notably, retrieval accuracy was significantly degraded over surfaces characterized by high spatiotemporal variability, including alpine meadows, urban environments, and shrubland ecosystems. Furthermore, atmospheric conditions over the Tibetan Plateau (TP) were found to be systematically misclassified by the ECOSTRESS processing chain compared to low-elevation regions, leading to significant emissivity-estimation anomalies. Under these challenging conditions, a split-window algorithm demonstrated superior performance (UWA-based RMSE: 1.71 K) when accurate emissivity information was available. Therefore, rigorous quality screening and consideration of alternative retrieval algorithms are recommended for the current ECOSTRESS LST product over the TP for applications requiring high precision. Collectively, the integrated framework established in this study provides the essential methodology to overcome in-situ data scarcity and enables, for the first time, a comprehensive and systematic validation of the new-generation thermal sensor across diverse surface and atmospheric conditions.

How to cite: Qi, Y., Zhong, L., and Ma, Y.: An Integrated Framework for Validating ECOSTRESS LST across Diverse Surface and Atmospheric Conditions: Fusing Radiance- and Temperature-Based Approaches to Overcome In-Situ Data Scarcity, EGU General Assembly 2026, Vienna, Austria, 3–8 May 2026, EGU26-1832, https://doi.org/10.5194/egusphere-egu26-1832, 2026.

EGU26-2040 | Orals | HS6.14

An integrated multi-scale Soil moisture and temperature observatory on the Tibetan Plateau 

Lixin Dong, Lizheng Wang, and Shihao Tang

Scarce in situ data in the western and central Tibetan Plateau (TP) hinders scientific research on physical process representation in climate models. Satellite remote sensing and climate models are effective data sources in complex topography and harsh environments; however, they have not been effectively validated or improved for the lack of multi-scale observations matching their pixel or grid scales. Therefore, it is necessary to develop an integrated multi-scale observatory. Since 2014, a satellite pixel oriented TP Integrated Multi-Scale moisture and temperature Observatory (TP-IMSO) was established and has been in operation for ten years to obtain a long-term multi-scale soil temperature and moisture dataset which integrates site point and spatial surface observation designs. The TP-IMSO is composed of two automatic wireless transmission networks over the Naqu and A’li areas, and atmospheric and soil temperature and humidity vertical profile observations in the “soil – atmosphere” interface layer. We also develop a dual frequency remote data transmission system based on Beidou satellite and 4G and a dual power supply system that is resistant to low temperature and low pressure in high-altitude regions. A cube dataset of soil temperature and humidity was obtained through spatial interpolation in both horizontal and vertical directions within the soil. It is found that the elements of the TP-IMSO networks have a highly variable character. The soil moisture in the top layer (0-3cm) is more variable than that in other layers, and the largest standard deviation of all the five layers occurs in July. Using observation data to validate multiple soil moisture remote sensing products, the root mean squared error (RMSE) of remote sensing products ranges from 0.038 to 0.177 cm3·cm-3, and for ERA-interim and National Centers for Environmental Prediction (NCEP) reanalysis data, the RMSE ranges from 0.038 to 0.081 cm3﹒cm-3.

How to cite: Dong, L., Wang, L., and Tang, S.: An integrated multi-scale Soil moisture and temperature observatory on the Tibetan Plateau, EGU General Assembly 2026, Vienna, Austria, 3–8 May 2026, EGU26-2040, https://doi.org/10.5194/egusphere-egu26-2040, 2026.

Habitat quality is a key indicator of ecosystem services. However, current habitat quality assessment methods mainly depend on land-use types, which ignore the differences within the specific land-use type and have difficulty reflecting the actual situation of an ecosystem. Therefore, this study proposes an improved habitat quality assessment method that incorporates vegetation growth status by introducing the leaf area index (LAI). This method first uses the LAI to assess pixel-level habitat suitability and then incorporates threat indicators for refined habitat quality evaluation. Finally, the proposed method is used to assess habitat quality and its changes on the Qinghai‒Tibet Plateau (QTP). The results show that the proposed method can effectively distinguish habitat suitability differences among pixels with the same land use type, enabling a more reasonable and precise evaluation of habitat quality. Habitat quality assessment on the QTP revealed that most regions improved between 2000 and 2020, except for urban areas, southeastern forests, and the Qiangtang region, where significant declines occurred. In particular, the Ruoergai Wetland, Qilian Mountains, Datong Beichuan River Source, and Yellow River Source exhibited greater improvements, with net habitat quality growth exceeding 30%. Furthermore, the proposed method has great potential for habitat quality assessment in other regions with various vegetation growth conditions, which will provide further support for environmental management.

This study is funded by the National Key R&D Program of China (Grant No. 2024YFF1306200).

How to cite: Zhao, L.: An Improved Habitat Quality Assessment Model Considering Vegetation Growth Status: A Case Study of the Qinghai–Tibet Plateau, EGU General Assembly 2026, Vienna, Austria, 3–8 May 2026, EGU26-2199, https://doi.org/10.5194/egusphere-egu26-2199, 2026.

EGU26-2398 | ECS | Posters on site | HS6.14

Planetary Boundary Layer Height on the Northern Mount Everest Region Retrieved from Wind Lidar Observations 

Xiaowen Zhou, Yaoming Ma, Fanglin Sun, and Binbin Wang

A coherent  Doppler wind lidar (Wind3D 6000) has been operating in the northern Mount Everest region since 2023.  We retrieved the planetary boundary layer height (PBLH) from the Lidar observation spanning October 2023 to September 2025 using a hybrid algorithm that combines SNR-based thresholding and wavelet covariance transform (WCT) techniques, adapted to cloud and humidity regimes. The results were compared with the PBLH from radiosonde observations and reanalysis data.  We find that the modified retrieval shows close agreement with radiosonde observations (R² = 0.895) and outperforms the manufacturer’s own default outputs and two reanalysis products (ERA5 and MERRA-2). Case studies for a clear-sky day, a cloudy day, and a strong-wind episode illustrate the  strengths of the lidar-derived PBLH: rapid convective growth under clear skies, abrupt collapse in cloud-limited conditions, and mechanically sustained deep layers during high-wind periods.  In contrast, the reanalysis product consistently misrepresents the timing and magnitude of these diurnal transitions. Composite statistics reveal a robust diurnal cycle characterized by a shallow nocturnal layer (≈300 – 400 m), rapid growth after sunrise, and a late-morning maximum of 1.5 – 1.8 km. Seasonally, daytime PBLH peaks  in spring and reaches its minimum in winter, except for a distinct June low attributable to enhanced monsoon-related clouds and moisture. Comparisons of monthly daytime biases show that ERA5 consistently underestimates PBLH, whereas MERRA-2 and the operational lidar algorithm overestimate it throughout the year. This two-year PBLH record from a  high-altitude site on the north of Mount Everest establishes a valuable benchmark for evaluating and improving boundary-layer parameterizations over extreme mountain terrain, despite limitations in nocturnal validation and occasional data gaps during adverse weather conditions.

How to cite: Zhou, X., Ma, Y., Sun, F., and Wang, B.: Planetary Boundary Layer Height on the Northern Mount Everest Region Retrieved from Wind Lidar Observations, EGU General Assembly 2026, Vienna, Austria, 3–8 May 2026, EGU26-2398, https://doi.org/10.5194/egusphere-egu26-2398, 2026.

Perfluorocarbons (PFCs) are one of the seven types of greenhouse gases regulated under the climate convention, and their emissions have drawn international attention. Existing studies have conducted atmospheric observations and source analyses of these substances at multiple global background sites (such as those in the AGAGE network), and estimated global and regional emissions using inversion models and other methods based on observational data. China and India, as the world's top one and top four greenhouse gas emitters, respectively, and the top two aluminum producers, warrant particular attention regarding their PFCs emissions. However, while China has some atmospheric background monitoring stations such as Shanghai Dongtan, Shenzhen Xichong, and Zhejiang Shanghuang, there is still little research on background observations in the Qinghai-Tibet Plateau region, especially the southern Himalayas. Moreover, South Asian regions, like India, lack background monitoring stations and few observational studies have been developed in the past five years. This study conducted a three-year atmospheric background observation experiment for three perfluorocarbons (PFCs, including PFC-116, PFC-218, PFC-318) at the Medog background station, located 30 km outside Medog County on the southern Himalayas. From August to November 2021 and July to October 2022, 229 valid instantaneous atmospheric samples (1–3 per day) were collected using Summa canisters and manual pressurization equipment, analyzed with Medusa. From June to August 2024, continuous observations were conducted using the Tianji ODS system, 434 valid samples were in-situ collected, 12 atmospheric samples daily. Based on the 663 valid samples, this study employed the Robust Extraction of Baseline Signal algorithm to analyze background concentrations of each substance and compared them with simulated background concentrations base on the AGAGE12-BOX model by Rigby et al. (currently updated only to December 2023). The results show that the observed background concentration of PFC-116 deviates from the simulated values by less than ±5%; For PFC-218, observed background concentrations also remained within ±5% of simulated values for most periods, except in August 2021 and early September 2021 when they exceeded 12-BOX simulation results by 10%–15%. However, PFC-318 background concentrations were elevated by at least 40% compared to 12-BOX simulations throughout the sampling period. During the study period, polluted information were only caught for PFC-116 in November 2021, accounting for 72% of samples with 16.8% concentration enhancement. Back Trajectory analysis indicated pollution information primarily originated from regions southwest of the sampling site, including Northeast India etc., while clean samples mainly derived from local sources, Tibet in northern China, and Bangladesh in the south. This study fills a gap in atmospheric background PFC observations over the southern Himalayas of the Tibetan Plateau and provides preliminary insights into PFC pollution sources from South Asian regions like Northeast India. Future work will build on these findings to conduct emission inversion studies for South Asian regions including India, offering scientific support for clarifying global PFC emissions.

How to cite: Peng, L., Wu, J., Wang, H., Liu, Z., and Yao, B.: Background Atmospheric Monitoring of Perfluorocarbons at the Medog Reference Site on the Southern Himalayan Slope of the Qinghai-Tibet Plateau, EGU General Assembly 2026, Vienna, Austria, 3–8 May 2026, EGU26-2425, https://doi.org/10.5194/egusphere-egu26-2425, 2026.

Ecosystem respiration (ER) is the second-largest carbon flux in terrestrial ecosystems after photosynthesis and plays a critical role in regulating regional carbon balance and carbon–climate feedbacks. Alpine grasslands are the dominant vegetation type on the Tibetan Plateau; however, under the ongoing warming and wetting climate, the spatiotemporal patterns and controlling mechanisms of ecosystem respiration in these grasslands remain poorly understood. To address this gap, we integrated eddy covariance observations from 35 flux sites widely distributed across the Tibetan Plateau with multi-source satellite remote sensing and reanalysis data, and applied machine learning approaches to upscale ecosystem respiration of alpine grasslands from 2000 to 2023, enabling a comprehensive assessment of its spatiotemporal variations and driving factors. 
Our results show that the multi-year mean ecosystem respiration of alpine grasslands on the Tibetan Plateau during 2000–2023 was 259.8 ± 7.4 g C m⁻² yr⁻¹ and exhibited a significant increasing trend, rising from 245.9 g C m⁻² yr⁻¹ in 2000 to 268.2 g C m⁻² yr⁻¹ in 2023, with an average growth rate of 0.96 g C m⁻² yr⁻¹. Spatially, ecosystem respiration displayed pronounced east–west contrasts, with high respiration rates exceeding 700 g C m⁻² yr⁻¹ in eastern alpine meadows, while much lower values, generally below 150 g C m⁻² yr⁻¹, occurred in western alpine desert steppes. Trend analyses indicate that ecosystem respiration increased significantly in more than 90% of the study area , with enhancement rates reaching up to 3 g C m⁻² yr⁻¹ in eastern alpine meadows, whereas the increasing trend was considerably weaker in western alpine desert steppes, remaining below 0.5 g C m⁻² yr⁻¹. Further analyses suggest that vegetation growth improvement under a warming and wetting climate was a key factor driving the sustained increase in ecosystem respiration across alpine grasslands on the Tibetan Plateau. 

How to cite: Wang, Y. and Ma, Y.: Increasing ecosystem respiration in Tibetan Plateau alpine grasslands under recent climate warming and wetting, EGU General Assembly 2026, Vienna, Austria, 3–8 May 2026, EGU26-2453, https://doi.org/10.5194/egusphere-egu26-2453, 2026.

The Tibetan Plateau (TP) is well known for its unique sensible heat driven air-pump in summer, characterized by low-level convergence and upper-level divergence. This study defines a Pumping Plateau Monsoon Index (PPMI) based on the divergence difference between 200 hPa and 600 hPa derived from NCEP-DOE Reanalysis-2 data. The PPMI characterizes the intensity of the TP thermal pumping effect and its associated three-dimensional circulation structure. The PPMI also shows significant correlations with the TP heat source, the east-west displacement of the South Asian High (SAH), and downstream East Asian Summer Monsoon (EASM) precipitation. During weak Tibetan Plateau Summer Monsoon (TPSM) years, an anomalous anticyclonic circulation is induced over the Iranian Plateau, shifting the SAH westward toward the Iranian High. Meanwhile, a reversal of the meridional gradient of potential vorticity leads to a bifurcation of the Rossby wave train, thereby suppressing its eastward propagation. During strong TPSM years, an anomalous cyclone-anticyclone-cyclone-anticyclone circulation pattern is correspondingly induced from the Iranian Plateau, the TP, Northeast China, to the Northwest Pacific. This pattern enhances the downstream propagation of quasi-stationary Rossby wave train and changes the upper-level circulation over the EASM oceanic region, thus inducing anomalous ascent that promotes precipitation development and latent heat release. These processes further accelerate the establishment of the EASM and deepen the East Asian Trough. These results clearly elucidate the teleconnection mechanism through which TPSM modulates the onset of EASM, providing a new dynamical perspective for forecasting EASM onset.

How to cite: Lizi, W. and Zeyong, H.: The Role of Thermal Pumping Action in the Tibetan Plateau Summer Monsoon and its impact on the South Asian High and East Asian Atmospheric Circulation, EGU General Assembly 2026, Vienna, Austria, 3–8 May 2026, EGU26-2490, https://doi.org/10.5194/egusphere-egu26-2490, 2026.

EGU26-2674 | Orals | HS6.14

Climate teleconnections among the Earth’s three poles 

Anmin Duan, Xin Li, Wenting Hu, Tao Che, Jun Hu, Yuzhuo Peng, Chao Zhang, Die Hu, Yuheng Tang, Zhulei Pan, Qilu Wang, and Guoxiong Wu

The Arctic, Antarctic, and Tibetan Plateau (TP) are often referred to as Earth’s three poles, and they exert outsized influence on the global climate. The three poles have undergone accelerating loss of sea ice, ice shelves, and/or glaciers, accompanied by pronounced warming in the Arctic and TP and region-specific warming in Antarctica. Despite their geographical remoteness, the three poles exhibit evident linkages, yet substantial gaps remain in our understanding of their climate teleconnections. This review summarizes the interactions among Earth’s three poles. The three poles are dynamically linked through a hierarchy of pathways. The Arctic–TP interactions are dominated by stationary Rossby-wave trains triggered by sea-ice and snow anomalies and reinforced by land-surface feedback over the plateau. The Arctic–Antarctic coupling relies on ocean heat transport through Atlantic Meridional Overturning Circulation and on the modulation of tropical Atlantic temperature and the Intertropical Convergence Zone. The Antarctic–TP signals travel via sea-surface temperature anomalies in the Indian Ocean forced by the Antarctic Oscillation, which propagate northward and excite wave trains and transport moisture onto the TP. Closing the remaining knowledge gaps will require coordinated paleoclimate constraints, targeted field campaigns over the Southern Ocean and TP, and next‑generation Earth‑system models equipped with machine‑learning techniques. Such integrative efforts are essential for more reliable projections of compound extremes and for informing adaptation strategies.

How to cite: Duan, A., Li, X., Hu, W., Che, T., Hu, J., Peng, Y., Zhang, C., Hu, D., Tang, Y., Pan, Z., Wang, Q., and Wu, G.: Climate teleconnections among the Earth’s three poles, EGU General Assembly 2026, Vienna, Austria, 3–8 May 2026, EGU26-2674, https://doi.org/10.5194/egusphere-egu26-2674, 2026.

This study investigates the spatiotemporal characteristics and governing mechanisms of winter extreme precipitation over the Tibetan Plateau (TP), identifying two distinct synoptic categories through spectral clustering analysis. Based on 192 regional extreme precipitation events (REPEs) during 1980–2020, we classify these events into Type 1 (68.23%, 131 events) characterized by precipitation centers over the western and eastern parts of the southern slope of the TP, and Type 2 (31.77%, 61 events) featuring precipitation centers located in the western TP. These types exhibit contrasting dynamic origins and long-term trend changes, with Type 2 REPEs showing a significant increase in occurrence frequency in recent decades, while Type 1 REPEs have declined. Type 1 REPEs are driven by a Rossby wave train originating over western North America, which propagates southeastward to induce equivalently barotropic cyclonic anomalies over the TP. This configuration enhances ascending motions and convective activity along the southern TP slopes, further supported by anomalous moisture convergence along the southern slope of the TP. In contrast, Type 2 REPEs are governed by a mid-latitude Rossby wave train along 40°N, generating an anomalous cyclonic-anticyclonic dipole southwest and southeast of the TP. This structure triggers ascent and convection over the western TP, with moisture concentrated over the western TP. These findings advance the understanding of TP extreme precipitation variability and its teleconnection drivers, highlighting the role of hemispheric-scale wave trains in modulating regional climate extremes.

How to cite: Ha, Y. and Ding, Z.: Impact of Synoptic-Scale Circulation Classifications on Winter Extreme Precipitation over the Tibetan Plateau, EGU General Assembly 2026, Vienna, Austria, 3–8 May 2026, EGU26-2884, https://doi.org/10.5194/egusphere-egu26-2884, 2026.

The complex topography and land surface conditions of the Tibetan Plateau (TP) result in uncertainty and nonlinearity of energy and water exchange between land and atmosphere. The quantification of nonlinear interactions facilitates understanding of complex land-atmosphere interaction on TP. The Conditional Mutual Information (CMI) difference method and ERA5-Land reanalysis dataset are involved to analyze the influence of shallow soil temperature and moisture on surface sensible and latent heat fluxes on TP. The results indicate as below. (1) There is a significant spatial difference about the sensitivity of sensible and latent heat fluxes on the shallow soil temperature and moisture on TP. The shallow soil is drier in central TP and Qaidam basin where the difference of CMI (∆I) is greater than 0.6. The sensible and latent heat fluxes exhibit greater sensitivity to soil moisture than soil temperature. Conversely, the shallow soil is wetter in eastern TP and western TP where ∆I is below -0.6. The sensible and latent heat fluxes exhibit greater sensitivity to temperature than soil moisture. (2) The strength of these sensitivities appears obvious seasonal variations. In soil moisture-sensitive regions, latent heat flux reaches maximum in summer while sensible heat flux in autumn. In soil temperature-sensitive regions, both latent and sensible heat fluxes reach maximum in summer. (3) The spatial distribution and seasonal variations of sensitivity of surface evaporation to shallow soil temperature and moisture on TP are consistent with latent heat flux, while those of land-air temperature difference are consistent with sensible heat flux. The correlation coefficient between ∆I of surface evaporation and latent heat flux is 0.48, while that between the land-air temperature difference and sensible heat flux is 0.65. They all pass the significance test at the 99% level. In summary, shallow soil temperature and moisture dominate surface evaporation and land-air temperature difference on TP and future influence the spatiotemporal characteristics of surface sensible and latent heat fluxes.

How to cite: Hou, Y. and Hu, Z.: Quantitative Analysis of the Influence of Shallow Soil Temperature and Moisture on Surface Energy and Water Exchange on the Tibetan Plateau, EGU General Assembly 2026, Vienna, Austria, 3–8 May 2026, EGU26-2928, https://doi.org/10.5194/egusphere-egu26-2928, 2026.

Summer precipitation over the inner Tibetan Plateau (TP) has increased markedly since the 1990s, leading to widespread lake expansion and exerting profound impacts on local ecosystems and infrastructure. While previous studies focused on external moisture transport associated with weakened westerlies, our study identifies a critical yet overlooked internal driver. To quantify the spatial origins of this increase, we employed an Eulerian moisture back-tracking model (Water Accounting Model: WAM-2layers) that decomposes the regional water vapor budget into specific source contributions. Using this framework combined with circulation diagnostics for 1979–2021, we reveal that internal moisture recycling within the TP is essential for sustaining the observed wetting trend. Specifically, the eastern TP (ETP), contributes an amount of moisture to western TP (WTP) precipitation comparable to major external sources. Moreover, the ETP’s contribution has increased by more than 23% compared to the earlier period, surpassing the growth from western and southern external sources. Our analysis bridges the gap between regional moisture budget equations and quantitative source attribution by demonstrating that this enhanced ETP contribution is driven not by local evapotranspiration, but by anomalous easterly winds. These anomalies, associated with a westward shift of the westerly jet core, intensified east-to-west moisture transport, suppressed vertical kinetic energy exchange, and increased lower-tropospheric moisture retention. These results highlight that intensified internal water recycling is a primary mechanism reshaping the regional hydrological balance and accelerating lake expansion in the western TP.

How to cite: Yuan, X., Wang, Y., Yang, K., and Ma, X.: Enhanced Internal Moisture Recycling from Eastern to Western Tibetan Plateau Sustains the Recent Increase in Inner Plateau Precipitation, EGU General Assembly 2026, Vienna, Austria, 3–8 May 2026, EGU26-2961, https://doi.org/10.5194/egusphere-egu26-2961, 2026.

EGU26-3240 | Posters on site | HS6.14

An Overview of Geothermal Resources in Tibet, China 

Ping Zhao

The Indian Plate has continued northward subduction following its collision with the Eurasian Plate, giving rise to the Tibetan Plateau — the highest and one of its youngest plateaus in the world. Endowed with abundant geothermal resources, Tibetan plateau exhibits a diverse array of surface manifestations, including geysers, hydrothermal explosions, steaming grounds, mud springs, boiling and thermal springs, montmorillonite–kaolinite alteration zones, and deposits of siliceous sinter and travertine.

Over the past decade, we have conducted surveys of more than 500 hot springs across the Tibet, collecting thermal water, gas and sinter samples for chemical composition analysis and H–O–Sr–Li isotopic studies. These investigations have identified numerous hot springs enriched in dissolved boron, lithium, and cesium, as well as in helium and hydrogen gases. Notably, the plateau’s salt lakes are closely linked to hot springs, with the two often coexisting: thermal springs continuously supply mineral substances to sustain the lakes.

High-temperature geothermal fields in Tibet are primarily concentrated along the Yarlung Zangbo suture zone and within north–south-trending rift systems, where they are closely associated with partially molten bodies, e.g. the Yangbajain, Yangyi, and Daggyai geothermal fields. In contrast, low- to medium-temperature geothermal systems are distributed extensively across the plateau, sustained by elevated regional heat flow; representative cases include the Nagqu, Ningzhong, and Cuna geothermal fields. Additionally, the presence of large-scale ancient sinter deposits in the northern Tibet further attests to the once highly developed hydrothermal activity in this region.

To date, four geothermal power stations have been constructed in Tibet, of which only the Yangyi Geothermal Power Station remains operational. A new Geothermal Power Station in Gulu is currently under construction. In 2024, we drilled an exploration well at the foot of Qomolangma (Mount Everest), where the temperature of the produced thermal fluid reached as high as 193 °C.

In recent years, geothermal district heating has expanded rapidly in Tibet. Beyond heating, geothermal water is also widely utilized for hot spring therapy, aquaculture, and recreational facilities such as swimming pools and water surfing venues. As a critical component alongside solar, wind, and hydropower, geothermal energy will play a pivotal role in advancing Tibet’s development into a national-level clean energy demonstration base, thereby providing robust support for the region’s high-quality economic and social development.

How to cite: Zhao, P.: An Overview of Geothermal Resources in Tibet, China, EGU General Assembly 2026, Vienna, Austria, 3–8 May 2026, EGU26-3240, https://doi.org/10.5194/egusphere-egu26-3240, 2026.

The spring (April–May–June) Barents Sea ice has been proven to affect the summer surface air temperature over the Tibetan Plateau (TP). However, its impact on summer (June–July–August) TP precipitation, a crucial climate component, remains unexplored. We investigate the physical linkage between spring Barents Sea ice and subsequent summer TP precipitation from 1979 to 2018. Our results indicate that above-normal spring Barents Sea ice leads to excessive summer TP precipitation, and vice versa. During spring, more Barents Sea ice induces remarkable cooling and subsidence over there and surrounding areas. The cooling over the Barents Sea can persist into summer, triggering a meridional wave-like pattern along the longitude of 60°E and, in turn, an anomalous atmospheric subsidence over the Caspian Sea and the eastern region adjacent to it. This alters 200 hPa convergence and modulates the Silk Road pattern (SRP). As a result, cyclonic anomalies form to the west of the TP, which enhance moisture transport toward the TP and increase its precipitation during summer. Numerical experiments reproduce these physical processes and further support our conclusions.

Key words: Barents Sea ice, Tibetan Plateau precipitation, Silk Road pattern, numerical experiment

How to cite: Han, Y.: Impact of Spring Barents Sea Ice on Summer Tibetan Plateau Precipitation, EGU General Assembly 2026, Vienna, Austria, 3–8 May 2026, EGU26-4616, https://doi.org/10.5194/egusphere-egu26-4616, 2026.

Abstract: Northeast China cold vortex (NEC-CV) plays an important role in modulating the extreme precipitation and have dramatic socioeconomic impacts over Northeast China. In this study, it is found that the extreme precipitation related to NEC-CVs can explain a considerable proportion (35%–40%) of total extreme precipitation over Northeast China and a more pronounced impact of the extreme precipitation related to NEC-CVs can be found for more extreme precipitation. The interaction between the typhoon and the NEC-CV contributes significantly for the increase of extreme precipitation. During 2001-2020, among the 39 northern typhoons affecting Northeast China, 82% triggered rainfall due to peripheral moisture, and 18% passed through Jilin Province. Under the background of cold vortex, 83.3% of the 12 northward typhoons caused heavy precipitation. Among the typhoons with heavy precipitation, 60% had daily precipitation reaching rainstorm and heavy rainstorm levels, and 70% had hourly rainfall intensity reaching short-term heavy precipitation levels (divided into steady and short-term types). Under the background of cold vortex, the high-value areas of northern typhoon track density were mainly distributed in the region of 130°E-140°E and 21°N-30°N. The northern tracks that caused heavy precipitation could be divided into four categories, with the northern-northward track being the most common (more than half) but with slightly weaker rainfall levels compared to other track types, while the northern-eastward track had the highest rainfall levels. Furthermore, this study evaluates the WSM6 (single-moment) and LIUMA (double-moment) microphysics schemes in CMA-MESO for simulating a cold vortex–typhoon induced heavy rainfall event in Northeast China in July 2023. Both schemes captured the event, but LIUMA showed better agreement with observations: higher correlation (0.75 vs. 0.70), lower RMSE (0.67 vs. 1.15 mm h⁻¹), and more realistic raindrop size distributions. WSM6 overestimated precipitation due to stronger latent heating (2.2 × 10⁻⁴ K s⁻¹ vs. 2.0 × 10⁻⁴ K s⁻¹), enhancing convection. LIUMA produced higher ice- and liquid-phase mixing ratios—especially excessive ice—which led to overly strong simulated radar reflectivity. Key differences stem from how each scheme treats ice-phase processes and ice–liquid interactions, highlighting the need for advanced cloud observations for further refinement.

How to cite: Liu, G., Shi, C., Yang, X., and Li, Y.: Characteristics of extreme precipitation influenced by Northeast China Cold Vortex and the possible mechanism of its interaction with northward typhoons by a numerical study, EGU General Assembly 2026, Vienna, Austria, 3–8 May 2026, EGU26-4821, https://doi.org/10.5194/egusphere-egu26-4821, 2026.

With the increasing number and intensity of drought events, understanding the ecological drought risk in the Yellow River Basin has become an important prerequisite for ecological protection in the Basin. Based on the climate, environment, and human activities in the Yellow River Basin, this study constructed the ecological drought risk evaluation index system and model, revealed the spatial distribution characteristics of risk, and analyzed the dominant factors responsible for ecological drought risk through the bivariate local Moran's I index and an optimal parameter-based geographic detector (OPGD) based model. The results show that the high-hazard areas are mainly located in the northeast of the upper reaches and the middle reaches, and the high-exposure areas are mainly located on the northeast slope of the Qinghai–Tibet Plateau, the Qinling Mountains, Ziwuling Mountains, Taihang Mountains, and Liupan Mountains. The high-vulnerability areas are mainly located in the middle and lower reaches of the Basin, and the high-sensitivity areas are mainly located in the source area of the Yellow River, the Loess Plateau area, except for the irrigated areas. High-risk areas of ecological drought are mainly located on the northern Shaanxi Plateau, the central Gansu Plateau, the Ningxia Plain, and the Hetao Plain (except for irrigated areas). From the perspective of land use types, the ecological drought risk from high to low is wasteland, grassland, woodland, farmland, and town areas. High risk areas account for 20.30% of the total watershed area. Through spatial correlation analysis, it was found that the upper reaches were affected by both surface temperature and precipitation, whereas the Guanzhong Basin and lower reaches were mainly affected by precipitation only. The dominant factors associated with vulnerability and sensitivity were precipitation utilization efficiency and fractional vegetation coverage, respectively. Hazard is the dominant factor leading to regional differences in ecological drought risk, and vulnerability, sensitivity, and exposure can alter the local characteristics of the spatial distribution of ecological drought risk.

How to cite: Wang, Y.: Analysis of Ecological Drought Risk Characteristics and Leading Factors in the Yellow River Basin, EGU General Assembly 2026, Vienna, Austria, 3–8 May 2026, EGU26-4935, https://doi.org/10.5194/egusphere-egu26-4935, 2026.

EGU26-6119 | ECS | Orals | HS6.14

NOx emissions from lakes in the Northern Hemisphere 

Wanshan Tan, Jintai Lin, Hao Kong, Sijie Wang, Mengying Wang, and Yuhang Zhang

Nitrogen oxides (NOx=NO+NO2) are a key player in the nitrogen cycle affecting health and climate, yet NOx emissions from lakes have received little attention compared with greenhouse gases. Many lakes are affected by local human activities such as shipping, but the existing bottom-up anthropogenic emission inventories contain large uncertainty in NOx emissions from lakes due to unrobust proxy data and many untracked vessels in public datasets. Moreover, natural NOx emissions from lakes away from human activities were traditionally thought to be negligible. However, recent work has discovered strong natural NOx emissions from 135 lakes on the Tibetan Plateau in summer 2019, which are comparable to anthropogenic emissions in several megacities such as Beijing and New York. Yet, whether such large natural emissions of NOx from lakes are a global phenomenon remains unknown.

Here, we quantify summertime (June-August) NOx emissions from 300 large lakes (> 200 km2) in the Northern Hemisphere (NH) during 2018-2024, based on satellite NO2 VCDs data and a physics-based emission inversion algorithm PHLET at a resolution of 0.05° x 0.05°. To ensure the quality of lake NO2 VCDs, we further exclude satellite lake pixels with unphysical, negative retrieved water vapor concentrations or affected by sun glint. Then we use PHLET to estimate gridded NOx emissions from NO2 VCDs, which describes the relationship between NOx emissions and NO2 VCDs and accounts for the nonlinear chemistry and horizontal transport. In this report, we will present the quantity and spatial distribution of lake NOx emissions.

How to cite: Tan, W., Lin, J., Kong, H., Wang, S., Wang, M., and Zhang, Y.: NOx emissions from lakes in the Northern Hemisphere, EGU General Assembly 2026, Vienna, Austria, 3–8 May 2026, EGU26-6119, https://doi.org/10.5194/egusphere-egu26-6119, 2026.

EGU26-6237 | Posters on site | HS6.14

Refinement of Gravel Parameterization and Its Impacts on Weather 

Yue Xu, Yaoming Ma, and Wei Hu

The Tibetan Plateau (TP) has substantial dynamic and thermal effects on regional and global climate, with plateau vortices (TPVs) playing a key role in summer precipitation. However, current land surface models often overlook the influence of gravel on soil hydrology and thermodynamics, which may influence vortex evolution. In this study, we incorporated the influence of gravel on soil properties into the Weather Research and Forecasting (WRF) model to explore its effect on TPV dynamics. Two simulations were conducted: one without gravel parameterization (WRF-Ctl) and one with gravel (WRF-Gravel). Results showed that WRF-Gravel produced a faster-moving vortex, with its track and structural characteristics more closely aligned with observational data in terms of position and scale. Sensitivity experiments with gravel content set to 0%, 50%, and 100% indicate that increased gravel content enhances soil permeability, reduces soil moisture, and decreases surface latent heat flux. This reduction in surface energy weakens atmospheric instability and convective potential, ultimately resulting in reduced precipitation and weaker vortex intensity, as indicated by lower central vorticity. While these results provide preliminary insights into the potential role of gravel in modulating TPV thermodynamic and dynamic processes, further multi-case and long-term studies are needed to validate these findings and assess their broader applicability.

How to cite: Xu, Y., Ma, Y., and Hu, W.: Refinement of Gravel Parameterization and Its Impacts on Weather, EGU General Assembly 2026, Vienna, Austria, 3–8 May 2026, EGU26-6237, https://doi.org/10.5194/egusphere-egu26-6237, 2026.

EGU26-8654 | ECS | Posters on site | HS6.14

Simulating the impact of a photovoltaic power station on soil temperature and moisture in Gonghe, China 

Wei Hu, Cunbo Han, and Yaoming Ma

This study employs the Noah-MP land surface model to simulate the environmental effects of a photovoltaic (PV) power station, incorporating modified parameterization schemes for radiation transfer, precipitation interception, surface roughness, gravel, and soil moisture transport. Validation was conducted using observational data collected from beneath PV panels and within inter-array spaces at a PV power station in the Gonghe Basin, Qinghai, China. Results indicate that the improved model effectively captures the spatiotemporal variation variations in radiation and soil temperature–moisture across different locations within the PV station. Both observations and simulations reveal higher soil moisture content beneath PV panels compared to inter-array areas, albeit with a weaker response to precipitation events. Due to seasonal variations in shading patterns, soil temperatures under PV panels are lower in summer and higher in winter relative to adjacent unshaded areas. This research provides a scientific basis for PV stations development and environmental conservation in the Tibetan Plateau.

How to cite: Hu, W., Han, C., and Ma, Y.: Simulating the impact of a photovoltaic power station on soil temperature and moisture in Gonghe, China, EGU General Assembly 2026, Vienna, Austria, 3–8 May 2026, EGU26-8654, https://doi.org/10.5194/egusphere-egu26-8654, 2026.

EGU26-8686 | Posters on site | HS6.14

Processes determining the seasonality of accelerated Tibetan Plateau warming during recent decades 

Mengchu Zhao, Xiu-Qun Yang, Lingfeng Tao, and Jing-Jia Luo

The accelerated surface air warming of Tibetan Plateau (TP) greatly alters the local cryosphere and ecosystem. The TP warming exhibits prominent seasonality, but the processes determining the seasonality remain unclear. This study investigates the issue from an energy budget perspective through analyzing air temperature budget and surface energy balance. The warming is relatively weak in summer and spring, while it becomes strong in autumn and winter. In summer and autumn, the warming is mainly driven by outside forcing processes. Anomalous summertime reduction of precipitation over western North Pacific triggers a circumglobal wavetrain that warms TP by increasing heat transport. In autumn, the superposition of zonal and meridional wavetrains enhances anomalous heat transporting into TP, intensifying the warming. The strongest wintertime warming is contributed jointly by outside forcing and local feedbacks. The outside forcing is due to atmospheric warming over the Barents Sea, which triggers a meridional wavetrain to transport heat into TP. Two local feedback processes enhance sensible heating to heat air by warming surface. Firstly, reduced snow cover increases surface-absorbed solar radiation through the snow-albedo feedback. Secondly, the surface warming tends to strengthen evaporation and moisten the atmosphere aloft, which increases downward longwave radiation and causes a further surface warming, forming a local moisture process feedback. In spring, the changes of outside forcing process have negligible impacts on the warming of TP, the warming is mainly contributed by increases of sensible heating, which is supported by increased surface absorption of radiation fluxes due to the two local feedback processes.

How to cite: Zhao, M., Yang, X.-Q., Tao, L., and Luo, J.-J.: Processes determining the seasonality of accelerated Tibetan Plateau warming during recent decades, EGU General Assembly 2026, Vienna, Austria, 3–8 May 2026, EGU26-8686, https://doi.org/10.5194/egusphere-egu26-8686, 2026.

While moisture transported by the mid-latitude westerlies constitutes a critical hydrological source for the Asian Water Towers (AWTs), the mechanisms governing its transport across the Himalayan barrier have remained elusive. In this study, we utilized a tethered balloon system to conduct high-altitude vertical profiling of atmospheric water vapor and its stable isotopic compositions (δD and d-excess) from the surface up to 9,050 meters above sea level (asl) on the northern slope of Mt. Qomolangma. Our measurements reveal that the westerlies can effectively facilitate the trans-Himalayan transport of moisture sourced from south regions. By integrating these observations with atmospheric model simulations, we demonstrate that water vapor undergoes significant isotopic depletion during transit. These findings provide the first direct empirical evidence of the pathways through which moisture from oceanic basins transports into the AWT interior. Furthermore, our results offer an unprecedented understanding of westerly advection across the Himalayas, establishing a crucial benchmark for future climate projections. 

How to cite: Gao, J.: Isotope Profiles in Atmospheric Water Vapor Reveal Vertical Moisture Transport process to the Asian Water Towers, EGU General Assembly 2026, Vienna, Austria, 3–8 May 2026, EGU26-9348, https://doi.org/10.5194/egusphere-egu26-9348, 2026.

EGU26-12225 | Orals | HS6.14

Tracking Warm-Season Mesoscale Convective Systems over the Tibetan Plateau and Their Impact on Sichuan Heavy Rainfall 

Mengjiao Jiang, Jingnan Jiang, Ping Zhao, Wei Shi, Dandan Chen, and Zhicheng Gui

Mesoscale convective systems (MCSs) over the Tibetan Plateau (TP) play a critical role in downstream heavy rainfall over Sichuan. However, conventional single-threshold identification and area-overlap tracking methods often suffer from substantial misidentification in plateau regions, primarily due to cold cirrus contamination and incomplete life-cycle representation. In this study, an improved area-overlap combined with Kalman-filtering (AOL-KF) tracking algorithm is developed for warm seasons (May–October) during 2019–2023 over the TP by introducing a rainfall constraint. FY-4A blackbody brightness temperature is jointly used with GMCP merged precipitation through a rain-rate threshold, with FY-4A cloud type serving as auxiliary information. The rainfall constraint is further evaluated using Ka-band ground-based millimeter-wave cloud radar observations at Naqu and Yushu during July–August 2020. Results show that cirrus-induced false identification is effectively suppressed, and the identified MCSs are more consistent with radar observations. Trajectory reconstruction indicates that potential MCSs are mainly distributed east of 85°E and south of 35°N, with 61.14% propagating eastward. Only 1.85% of TP MCSs move off the plateau, and 0.93% further affect Sichuan. MCS translation speed exhibits a clear meridional gradient and is significantly modulated by mid–upper-level (200–400 hPa) flow. A representative case demonstrates that TP-origin MCSs intensify over Sichuan due to enhanced moisture convergence, secondary circulation, and atmospheric instability.

How to cite: Jiang, M., Jiang, J., Zhao, P., Shi, W., Chen, D., and Gui, Z.: Tracking Warm-Season Mesoscale Convective Systems over the Tibetan Plateau and Their Impact on Sichuan Heavy Rainfall, EGU General Assembly 2026, Vienna, Austria, 3–8 May 2026, EGU26-12225, https://doi.org/10.5194/egusphere-egu26-12225, 2026.

EGU26-13253 | ECS | Orals | HS6.14

A Novel Snow Depth Retrieval Approach for the Northern Hemisphere Based on an Equivalent Volumetric Scattering Index 

Jing Wang, Tao Che, Liyun Dai, Yunming Su, Yanxing Hu, and Yazhen Li

The spatiotemporal heterogeneity of snowpack properties—particularly snow grain size, density, and liquid water content—combined with the attenuating and radiating effects of forest canopy, continues to pose critical challenges that limit the accuracy of snow depth retrieval from passive microwave remote sensing. To address these issues, this study introduces the Equivalent Volume Scattering Index (EVSI), a physically informed metric designed to isolate the radiative contributions of non-snow-depth factors in microwave signal propagation. The EVSI is defined as the ratio of the differential brightness temperature between high-frequency (e.g., 37 GHz) and low-frequency (e.g., 19 GHz) passive microwave channels to in situ ground-based snow depth observations. Leveraging the joint spatiotemporal patterns of in situ snow depth and EVSI, we first classified Northern Hemisphere snowpack into seven distinct snow types via unsupervised cluster analysis. This typology captures dominant regimes characterized by unique combinations of microphysical and environmental conditions. For each snow type, we then developed a dynamic, regionally adaptive, and partially non-resetting EVSI-based snow depth retrieval model. The “partially non-resetting” design preserves key snow state variables across time steps—such as grain size evolution and liquid water retention—while allowing radiative transfer parameters to adapt dynamically to evolving snow and canopy conditions. In contrast to conventional passive microwave snow depth algorithms, the proposed framework not only ensures physical interpretability through its foundation in microwave radiative transfer theory but also prioritizes operational feasibility by relying exclusively on readily accessible inputs, including daily air temperature, daily precipitation, and daily brightness temperatures from both low- and high-frequency microwave channels. Consequently, the algorithm simultaneously achieves higher retrieval accuracy and enhanced spatiotemporal generalizability, demonstrating robust performance across diverse climatic zones and seasonal cycles—thereby advancing both scientific understanding and practical applicability in global snow monitoring.

How to cite: Wang, J., Che, T., Dai, L., Su, Y., Hu, Y., and Li, Y.: A Novel Snow Depth Retrieval Approach for the Northern Hemisphere Based on an Equivalent Volumetric Scattering Index, EGU General Assembly 2026, Vienna, Austria, 3–8 May 2026, EGU26-13253, https://doi.org/10.5194/egusphere-egu26-13253, 2026.

The Qinghai–Tibet Plateau (QTP) is one of the most climate-sensitive regions in the world. Changes in snowmelt water resources are critical for sustaining the “Asian Water Tower” and downstream water security. However, due to the complexity of cryospheric processes and uncertainties in models, data, and temporal scales, a consistent understanding of snowmelt runoff evolution and its climatic drivers across multiple basins is still limited. This study applies the VIC-CAS hydrological model to simulate snowmelt runoff in 15 major watersheds on the QTP during 1970–2020. We analyze the spatiotemporal variations of snowmelt runoff, total runoff, and snowmelt contribution ratios, and examine their responses to climate change within a unified framework. Results show strong spatiotemporal heterogeneity in snowmelt water resources across the plateau. On average, snowmelt contributes 24.8% of total runoff and exhibits clear seasonality, with peak contributions in June–July. Afterward, runoff generation gradually shifts from snowmelt dominance to combined glacier melt and rainfall. Monsoon-dominated basins show strong runoff seasonality, while westerly-controlled basins exhibit more uniform intra-annual distributions. Total runoff displays a weak and non-significant decreasing trend, with transition years mainly between 1980 and 1995 and a delayed pattern from east to west. In contrast, the snowmelt contribution ratio decreases significantly at a rate of about 1.7% per decade, with later transition years, especially in monsoon-influenced basins. Process-based analyses further indicate that snowmelt runoff initiation and center-of-mass dates advance significantly across all basins, accompanied by prolonged runoff duration. Snowmelt runoff exhibits a clear elevation dependence, with a threshold near ~4,000 m a.s.l., below which runoff decreases and above which it increases; this threshold shifts downward in glacier-rich basins. Overall, precipitation anomalies emerge as the dominant driver of interannual snowmelt runoff variability by controlling runoff magnitude, while rising air temperature primarily regulates the timing and phase of snowmelt runoff generation. Cryospheric elements, including glaciers and permafrost, further modulate basin-scale hydrological responses by exerting buffering and amplifying effects.

How to cite: Li, Y., Che, T., and Wang, J.: Interannual Variability of Snowmelt Runoff and Its Climatic Controls across Major River Basins of the Tibetan Plateau, EGU General Assembly 2026, Vienna, Austria, 3–8 May 2026, EGU26-13431, https://doi.org/10.5194/egusphere-egu26-13431, 2026.

EGU26-14087 | Posters on site | HS6.14

Developing a spatial livelihood vulnerability index for third pole region 

Cholho Song, Sonam Wangyel Wang, and Woo-Kyun Lee

The Mid-Latitude Region Network (MLRN) focuses on ecotones, such as the transition zones between temperate and tropical forests, as well as mountainous and cryosphere ecosystems. These ecotones are primarily identified within the Third Pole Region, the high mountains of Asia. Livelihoods in this region face the destabilization of the water-food-energy nexus exacerbated by ecosystem degradation and climate change. Recently, livelihood vulnerability assessments have been conducted in several countries in the region, such as Mongolia, Bhutan, Kazakhstan, Nepal, and the Kyrgyz Republic. However, these vulnerabilities were primarily assessed using local community surveys without the application of spatial datasets. Therefore, this study aims to transition from a static survey framework to a spatial assessment framework. Focusing on the social, human, financial, physical, and natural aspects of livelihood vulnerability, representative and modified spatial data were selected for the assessment. The selected spatial data were aggregated using a normalization approach, and a spatial vulnerability index was generated. Through this study, regional and global livelihood vulnerabilities were evaluated. In addition, this research contributes to the further development of adaptation strategies in the Third Pole region.

How to cite: Song, C., Wang, S. W., and Lee, W.-K.: Developing a spatial livelihood vulnerability index for third pole region, EGU General Assembly 2026, Vienna, Austria, 3–8 May 2026, EGU26-14087, https://doi.org/10.5194/egusphere-egu26-14087, 2026.

EGU26-15757 | ECS | Posters on site | HS6.14

Variations in the Impacts of Large Lakes on Local Precipitation over the Tibetan Plateau 

Zhiyuan Yang and Kun Yang

Lakes are extensively distributed across the Tibetan Plateau (TP) and have experienced notable expansions under the background of climate change. This study investigates how large TP lakes influence local precipitation patterns. Our results show that local precipitation rates are higher in the warm season than in the cold season. These seasonal variations are attributed to differences in the thermal and moisture states of TP and the predominant weather processes, such as convection and cyclonic systems. More substantial increases in nighttime precipitation over lakes are also observed compared to daytime precipitation. These diurnal variations may be linked to differences in near-surface atmospheric dynamics (e.g., wind speed is lower at night than during the day). These findings provide important insights into the hydroclimatic role of TP lakes and call for deliberately incorporating observational evidence into simulating the lake-atmosphere interactions by climate models.

How to cite: Yang, Z. and Yang, K.: Variations in the Impacts of Large Lakes on Local Precipitation over the Tibetan Plateau, EGU General Assembly 2026, Vienna, Austria, 3–8 May 2026, EGU26-15757, https://doi.org/10.5194/egusphere-egu26-15757, 2026.

The cryosphere is highly sensitive to climate change, and melting-induced carbon release through river systems has likely shifted over past decades. Long-term carbon isotopes of riverine organic carbon provide critical insights into climate driven cryospheric carbon export. In glacial influenced high mountain catchments, dissolved organic carbon (DOC) is 14C depleted, whereas contributions of permafrost derived aged carbon to Arctic rivers remain limited. Elevated proportions of petrogenic particulate organic carbon (POC) in glacial dominated high mountain catchments reflect glacial erosion or precipitation-driven physical erosion. Meanwhile, Arctic rivers have experienced rising inputs of permafrost derived POC, reflecting intensified thaw. Overall, these trends demonstrate an increasingly dynamic cryospheric response to ongoing climate warming.

How to cite: Fang, L.: Accelerated aged carbon release from the cryosphere during past three decades, EGU General Assembly 2026, Vienna, Austria, 3–8 May 2026, EGU26-16424, https://doi.org/10.5194/egusphere-egu26-16424, 2026.

EGU26-16550 | Orals | HS6.14

Evaluation of the WRF model’s performance at gray-zone resolution in simulating climate over the Tibetan Plateau 

Xuejia Wang, Yijia Li, Tinghai Ou, Jiayu Wang, Xiaohua Gou, Guojin Pang, Meixue Yang, Hans Linderholm, Deliang Chen, and Mengqian Lu

The Tibetan Plateau (TP), also known as the “Water Tower of Asia”, profoundly impacts regional and global climates. Existing climate models exhibit substantial biases over the area, primarily due to low spatial resolution, deficient driving data, and inadequate model domains. Leveraging meteorological station data, the CN05.1 gridded meteorological dataset, and various reanalysis datasets, we comprehensively evaluate the performance of the Weather Research and Forecasting model at gray-zone resolution (9 km) (hereafter WRF9km) in simulating TP air temperature and precipitation during 1980—2019, and identify bias causes. WRF9km effectively captures the spatial patterns of observed air temperature, although it exhibits a cold bias that can mainly be explained by overestimated surface albedo (accounting for 64%), along with underestimated downward radiation and ground heat fluxes. WRF9km also simulates observed spatial precipitation patterns well (seasonal correlations > 0.5, significant at the 95% level); however, its precipitation biases exhibit pronounced spatial heterogeneity, with overestimation along the slope regions of the southern and eastern TP and underestimation over the interior TP, particularly the western TP, relative to CN05.1. These biases primarily arise from inadequate characterization of wind-field dynamics and moisture transport within the model framework. Meanwhile, the WRF9km effectively captures annual precipitation variation with minor deviations, although it does not fully reproduce the temporal trends in precipitation over the TP. Overall, compared to the driving ERA5 data, WRF9km yields only marginal improvement in mitigating the cold bias but substantially reduces the regional mean precipitation wet bias by 79%, particularly over the southern and eastern slopes. This evaluation provides critical insights to advance dynamic downscaling studies in complex terrain, highlighting the need for enhanced surface albedo parameterizations and improved quality of input driving data.

How to cite: Wang, X., Li, Y., Ou, T., Wang, J., Gou, X., Pang, G., Yang, M., Linderholm, H., Chen, D., and Lu, M.: Evaluation of the WRF model’s performance at gray-zone resolution in simulating climate over the Tibetan Plateau, EGU General Assembly 2026, Vienna, Austria, 3–8 May 2026, EGU26-16550, https://doi.org/10.5194/egusphere-egu26-16550, 2026.

EGU26-17561 | Orals | HS6.14

From Open Data to AI-Powered Digital Twins: The TPDC’s READY Framework for the Qinghai-Xizang Plateau 

Xiaoduo Pan, Xin Li, Min Feng, and Yanlong Guo

Abstract:

The Qinghai-Xizang Plateau, a pivotal regulator of global climate and hydrological cycles, hosts intricate multi-sphere interactions under accelerating global changes. Unlocking its full scientific potential requires not only open data sharing but also intelligent, AI-ready data governance. The National Tibetan Plateau Data Center (TPDC) has established a leading open-data ecosystem, hosting over 8,400 datasets (62% fully open access) totaling 674 TB, and implementing systematic FAIR (Findable, Accessible, Interoperable, Reusable) principles through automated lifecycle management, peer review, DOI assignment, and CC-BY licensing.

To advance from open data to AI-powered digital twins, TPDC has pioneered the READY framework (Richness, Ethics, Accessibility, Diversity, Yield), bridging geoscience data with AI-driven discovery through three transformative systems: (1) AI-Ready Data Governance & Semantic Automation, implementing cross-sphere quality control and ethics reviews, while utilizing NLP and knowledge graphs for automated metadata generation and semantic annotation; (2) AI-Ready Data Engineering, achieving multi-modal spatiotemporal anchoring and cross-scale alignment to build hierarchical Earth system models, notably treating uncertainty as a ‘first-class object’; and (3) AI-Ready Data Service, shifting from auxiliary analysis to a model-oriented continuous data supply, creating a dynamic loop that supports foundation model training and enables integrated prediction-decision making.. These capabilities are strengthened by integrating data from the Second Tibetan Plateau Scientific Expedition and Research (STEP), historical archives, and international collaborations (e.g., NSIDC, ICIMOD, WMO), ensuring global interoperability and scientific robustness.

TPDC’s data governance framework has underpinned over 8,000 SCI publications, enabling critical insights into climate adaptation, cryosphere-related hazards, and sustainable pathways. Ultimately, TPDC is committed to realizing the vision of ‘probing the past, assessing the present, and preparing for the future,’ providing robust, multi-scale predictions to support sustainable development and ecological security.

Keywords: National Tibetan Plateau Data Center (TPDC); Qinghai-Xizang Plateau; AI-Ready Data; READY Framework; Digital Twins; FAIR Principles; Earth System Science

References:

Li, X., Cheng, G., Wang, L., Wang, J., Ran, Y., Che, T., Li, G., He, H., Zhang, Q., Jiang, X., Zou, Z., & Zhao, G. (2021). Boosting geoscience data sharing in China. Nat. Geosci. 14, 541–542. https://doi.org/10.1038/s41561-021-00808-y

Pan, X., Guo, X., Li, X., Niu, X., Yang, X., Feng, M., Che, T., Jin, R., Ran, Y., Guo, J., Hu, X., & Wu, A. (2021). National Tibetan Plateau Data Center: Promoting Earth System Science on the Third Pole. Bull. Amer. Meteor. Soc., 102, E2062–E2078, https://doi.org/10.1175/BAMS-D-21-0004.1.

How to cite: Pan, X., Li, X., Feng, M., and Guo, Y.: From Open Data to AI-Powered Digital Twins: The TPDC’s READY Framework for the Qinghai-Xizang Plateau, EGU General Assembly 2026, Vienna, Austria, 3–8 May 2026, EGU26-17561, https://doi.org/10.5194/egusphere-egu26-17561, 2026.

EGU26-18121 | Posters on site | HS6.14

Microbial Reduction in Methane Emissions from High-altitude Thermokarst Lakes 

Mei Mu and Cuicui Mu

Thermokarst lakes, the typical landscape of abrupt permafrost thaw, are expected to be a substantial CH4 source. The CH4 dynamics are disrupted by climate change, particularly frequent dry-wet alternation of small thermokarst lakes. However, microbial community changes caused by wet-dry alternation remains uncertain, and it remains a challenge to quantify the impacts of microbial shifts on CH4 emissions from thermokarst lakes, especially at the high-altitudes. Here, by field observations, laboratory incubation experiments and amplicon sequencing, we show that thermokarst lakes with seasonal wet-dry alternation exhibit a 41–70% decrease in CH4 emissions compared with perennial lakes. The alternating wet-dry cycles lead to a 33–37% decrease in relative abundances of methanogens and a 39–59% decline in syntrophic partners in lake sediments, whereas a 43-fold increase in anaerobic methanotrophic archaea Candidatus Methanoperedens. Functional gene analyses indicate acetoclastic methanogenesis dominated by Methanosaeta is the primary pathway of CH4 production. The reduction in CH4 emissions is due to the decrease in methylotrophic Methanomassiliicoccaceae and syntrophs. Moreover, the denitrifying anaerobic CH4 oxidation processes mediated by Candidatus Methanoperedens leads to further decline in CH4 emissions. This study provides novel insights into microbial changes and pathways regulating CH4 emissions from seasonal thermokarst lakes, which is crucial for assessing permafrost carbon-climate feedback and prioritizing CH4 mitigation strategy.

How to cite: Mu, M. and Mu, C.: Microbial Reduction in Methane Emissions from High-altitude Thermokarst Lakes, EGU General Assembly 2026, Vienna, Austria, 3–8 May 2026, EGU26-18121, https://doi.org/10.5194/egusphere-egu26-18121, 2026.

 The distribution data of Pomatosace filicula (Primulaceae) , a second−class protected monotypic plant specied endemic to the Qinghai−Tibet Plateau, were investigated using MaxEnt (Maximum Entropy) ecological niche model and ArcGIS 10.7 software. 30 environmental variables, including climate, elevation, soil conditions and human activities were selected based on the species’ growth and distribution characteristics. The species’ potential distribution patterns and its responses to key environmental factors were simulated both with and without human activity impacts. The relationships between potential suitable distribution patterns and environmental factors were examined, and changes in potentially suitable distribution areas under human influence were analyzed. The following results were obtained: (1) the potential suitable areas for Pomatosace filicula in Qinghai province were primarily concentrated in the Three−river source region of southeastern Qinghai and the Qilian mountains in the northeast. Highly suitable areas, accounting for 14.2% of the province's total area, were mainly distributed across Chenduo, Maduo, Maqin, Gande, Dari, Jiuzhi, Henan and Zeku counties. Moderately suitable areas, comprising 15.4% of the provincial area, were predominantly found in Zhiduo, Zaduo, Qumalai, Tianjun, and Qilian counties. (2) When human activities were considered, the potential distribution area was found to be contracted and fragmented, displaying a strip−like pattern along plateau valleys. The total potential suitable area in Qinghai province was reduced by 35.6%, with highly suitable areas decreased by 9.96×10⁴ km2 and moderately suitable areas reduced by 10.97×10⁴ km2. (3) Without considering human influence, the primary environmental variables affecting Pomatosace filicula distribution were determined to be annual precipitation, elevation and precipitation in the driest season, with contribution rates of 27.7%, 14.5%, and 12.4%, respectively. When human activities were included, the main influencing factors were identified as the human footprint index, elevation and annual temperature range, with contribution rates of 57.6%, 11.6%, and 10.1%, respectively. 

How to cite: Wang, S.: Potential Distribution Pattern of the Endemic Species Pomatosace filicula (Primulaceae) on the Qinghai−Tibetan Plateau , EGU General Assembly 2026, Vienna, Austria, 3–8 May 2026, EGU26-21952, https://doi.org/10.5194/egusphere-egu26-21952, 2026.

HS7 – Precipitation and climate

To investigate the microphysical characteristics of summer precipitation in the Northern Yellow River Irrigation Area, the Central Arid Zone, and the Southern Mountainous Area of Ningxia, this study analyzed disdrometer data collected from Yinchuan, Yanchi, and Liupanshan stations from 2022 to 2024. A comparative analysis of Raindrop Size Distribution (RSD) was conducted from the perspectives of the overall dataset, different rainfall rates, and precipitation types. The results indicate that the average RSD at Liupanshan station is broader with a higher number concentration of small raindrops, whereas the average RSD at Yinchuan station is narrower with a higher concentration of mid-size raindrops. Under different rainfall rates and precipitation types, the number concentrations of both small and large raindrops increase with rising altitude. Specifically, when the rainfall rate is less than 2mm·h-1, the mass-weighted mean diameter (Dm) gradually decreases while the normalized intercept parameter (log10NW) increases with altitude. When the rainfall rate exceeds , the log10NW at Yanchi and Liupanshan stations surpasses that of Yinchuan station, whereas the Dm is smaller than that of Yinchuan. Furthermore, for a given shape parameter (µ), the slope parameter (⋀) increases with altitude. In convective precipitation events, the empirical relationships tend to overestimate the rainfall intensity at all three stations when the rainfall rate exceeds 20mm·h-1.

How to cite: Xue, Z.: Characteristics of Raindrop Spectrum in different areas of Ningxia during Summer, EGU General Assembly 2026, Vienna, Austria, 3–8 May 2026, EGU26-2128, https://doi.org/10.5194/egusphere-egu26-2128, 2026.

EGU26-5139 | ECS | PICO | HS7.1

Adaptive K–R relationships based on cloud phase classification using SEVIRI observations 

Taoufiq Shit, Martin Fencl, and Vojtěch Bareš

Errors in the representation of the drop size distribution are a major source of uncertainty in rainfall estimation, since both radar reflectivity and microwave attenuation depend nonlinearly on precipitation microphysics. These uncertainties propagate directly into the specific attenuation–rain rate (k–R) relationship through the interaction between electromagnetic waves and hydrometeors, leading to systematic biases when globally fixed coefficients are used. In standard practice, the k–R relationship is expressed as a power law of the form k=aRb, where the coefficients a and b are typically taken from the International Telecommunication Union (ITU) recommendations and assumed to be globally applicable. The use of the ITU coefficients implicitly assumes stationary rainfall microphysics, which is physically inconsistent under varying cloud and rain regimes. This highlights the need for stratified parameterizations in which the coefficients are optimized for different microphysical conditions. In this context, cloud phase information from geostationary satellites provides a physically meaningful basis for clustering the k–R relationship, as different cloud phases are associated with distinct precipitation formation processes and drop size distributions.

The objective of this study is to derive cloud phase dependent k–R parameterizations and to assess their performance across a large disdrometer network. A global disdrometer dataset (Ghiggi et al., 2021, DISDRODB) covering multiple climatic regions is used to simulate k–R relationships across a wide frequency range from 5 to 100 GHz using the T-matrix scattering method. SEVIRI MSG observations are used as input to the Cloud Physical Properties (CPP) product provided by the EUMETSAT Climate Monitoring Satellite Application Facility (CM SAF), from which cloud phase is classified into water, supercooled water, mixed phase, deep convective, cirrus, and opaque ice categories. Frequency dependent k–R coefficients are derived separately for each cloud type. The framework is evaluated across more than 100 independent disdrometer sites, primarily concentrated in Europe.

Relative to the ITU recommended model (ITU-R P.838-3), the cloud phase adaptive parameterization substantially reduces root mean square error (RMSE), with the strongest improvements observed at 5 to 8 GHz. At these frequencies, more than 90 percent of sites show lower RMSE, with average reductions reaching up to 1.5 mm.h-1. More moderate improvements are found at higher frequencies from 60 to 100 GHz, where around 60 percent of sites show RMSE reductions, with average improvements below 0.5 mm.h-1.

These results show that cloud phase informed k–R parameterizations can significantly improve rainfall estimation from commercial microwave links and indicate potential applicability to radar systems.

Reference:

Ghiggi, G., Billault-Roux, A. C., Candolfi, K., Pillac-Mage, L., Unal, C., Schleiss, M., Uijlenhoet, R., Raupach, T., and Berne, A.: DISDRODB – A global disdrometer archive of raindrop size distribution observations, PrePEP 2025, Karlsruhe, Germany, 10–12 March 2025, https://indico.kit.edu/event/4015/contributions/18545/, 2025.


This work was supported by the Czech Science Foundation (GACR), Czech Republic, under Grant No. 24-13677L (MERGOSAT).

How to cite: Shit, T., Fencl, M., and Bareš, V.: Adaptive K–R relationships based on cloud phase classification using SEVIRI observations, EGU General Assembly 2026, Vienna, Austria, 3–8 May 2026, EGU26-5139, https://doi.org/10.5194/egusphere-egu26-5139, 2026.

EGU26-6612 | ECS | PICO | HS7.1

Do Satellite-Based Precipitation Datasets Capture Flash Flood-Producing Cloudburst Events? 

Nandana Dilip K and Vimal Mishra

Cloudbursts and mini-cloudbursts are on the rise over India, frequently triggering flash floods. According to the India Meteorological Department (IMD), a cloudburst is defined as rainfall exceeding 100 mm in an hour over a spatial extent of 20-30 km², while mini-cloudbursts are characterized by rainfall of about 50 mm in an hour. Although IMD issues cloudburst reports within 24 hours of occurrence, accurate identification and categorization of these events remain challenging in several regions due to the sparse distribution of meteorological stations, particularly in complex terrain. Satellite-based observations provide high spatial coverage and can detect intense clouding or heavy rainfall events. However, satellites often infer rainfall or cloud properties from radiance, which can introduce uncertainties compared to direct ground measurements. Here, we assess how effectively satellite-based precipitation datasets capture cloudburst events over India by comparing satellite-based rainfall estimates with station-based hourly observations. We evaluate the performance of IMERG and ERA5-Land datasets to identify regions where satellites successfully detect cloudburst events and regions where their performance is limited across India. The results aim to improve understanding of the regional strengths and limitations of satellite datasets for monitoring extreme rainfall and enhancing flash flood preparedness in data-sparse regions of India.

How to cite: Dilip K, N. and Mishra, V.: Do Satellite-Based Precipitation Datasets Capture Flash Flood-Producing Cloudburst Events?, EGU General Assembly 2026, Vienna, Austria, 3–8 May 2026, EGU26-6612, https://doi.org/10.5194/egusphere-egu26-6612, 2026.

Precipitation falling onto vegetation is partly intercepted by the canopy and subsequently evaporates, while the remainder reaches the ground as throughfall or stemflow. Throughfall refers to precipitation that reaches the ground after crossing the canopy. It comprises free throughfall (raindrops not intercepted), drips, and splash droplets. Different rainfalls and foliage yield different number, size and velocity of each throughfall droplet type [1]. The resulting drop size distribution significantly affects infiltration and surface runoff processes [2]. Moreover, drips may induce the erosion and compaction of bare soil [3] while splash droplets may transport pathogenic spores [4]. Finally, the part of leaves that remains wet may experience significant leaching or water/nutrient uptake [5].

Predicting throughfall drop size distribution with physical models is complex because the physically relevant scale is that of a raindrop impacting a leaf, while the scale of interest is at least that of a tree. Previous studies (e.g., [6-8]) provided measurements at either scale but never at both. A few numerical models [4, 9-10] were proposed to estimate throughfall statistics and rain-induced transport by modelling interception at raindrop scale, but these models relied on strong and unverified assumptions on drop-scale dynamics.

In this original study, we first provide a detailed experimental characterization of interception at leaf scale. Hundreds of raindrop surrogates impacted single birch leaves. The leaf was weighed and imaged over time, and water storage variations were resolved at the scale of individual impacts. The storage capacity, the wetting-up time, the drip diameter and the splash fraction were measured as functions of the leaf area, the leaf inclination and the raindrop size. The results are extensively compared to previous studies at leaf scale.

Then rain interception is quantified at tree scale, with the same birch species and leaves in the same phenophase. Rain amount, intensity and drop size distribution in both open rainfall and throughfall were measured using two disdrometers positioned respectively above and below the canopy of a birch tree. Free throughfall, splash droplets and drips were separated for selected rainfall events with different intensities. The storage capacity and the wetting-up time were also estimated for each event. We relate these tree-scale measurements to the mechanisms observed at the leaf scale.

[1] D. F. Levia et al., Hydrol. Process. 33, 1698-1708 (2019)

[2] K. Nanko et al., Hydrol. Process. 24, 567-575 (2010)

[3] M. Beczek et al., Geoderma 347, 40-48 (2019)

[4] T. Vidal et al., Ann. Bot. 121, 1299-1308 (2018)

[5] T. E. Dawson and G. R. Goldsmith, New Phytol. 219, 1156-1169 (2018)

[6] C. Bassette and F. Bussière, Agric. For. Meteorol. 148, 991-1004 (2008)

[7] X. Li et al., Agric. For. Meteorol. 218, 65-73 (2016)

[8] C. D. Holder, Ecohydrol. 6(3), 483-490 (2012)

[9] Q. Xiao et al., J. Geophys. Res. 105 (D23), 29173-29188 (2000)

[10] R. P. de Moraes Frasson and W. F. Krajewski, J. Hydrol. 489, 246-255 (2013)

How to cite: Gilet, T. and Zabret, K.: Bridging the scales of rainfall interception, from raindrop impacts on leaves to throughfall under a tree., EGU General Assembly 2026, Vienna, Austria, 3–8 May 2026, EGU26-6681, https://doi.org/10.5194/egusphere-egu26-6681, 2026.

Accurate rainfall measurement remains challenging, even for in-situ point observations commonly considered the “ground truth”, owing to precipitation undercatch primarily caused by wind effects and instrument design. These biases limit reliable rainfall estimation, especially at very high and low intensities, and hinder the robust characterisation of precipitation variability. This study first used disdrometer data from multiple sites across the UK to develop a new rainfall classification system based on observed drop size distributions rather than intensity thresholds alone. The proposed classification distinguished periods of rainfall with similar bulk intensities but different microphysical structures, providing a more physically meaningful framework for precipitation characterisation and supporting the development of more targeted undercatch correction strategies. Second, a custom-built rainfall simulator was developed to replicate the identified rainfall types under controlled laboratory conditions. The simulator enables independent control of rainfall rate and drop size distribution, allowing the reproduction of a wide range of precipitation regimes representative of natural UK rainfall. Controlled experiments were used to systematically quantify the response of rain gauges to different drop populations and intensities, providing new insights into the mechanisms driving undercatch and its dependence on rainfall microstructure. By explicitly linking drop-scale processes, controlled experimentation, and population-level rainfall classification, this work contributes to the improved accuracy of precipitation measurements and the representation of rainfall at hydrologically relevant scales, with direct implications for rainfall monitoring, model input uncertainty, and flood risk assessment.

How to cite: Dunn, R., Fowler, H., Green, A., and Lewis, E.:  Understanding Rain Gauge Undercatch Through Drop Size Distribution–Based Rainfall Classification and Artificial Rainfall Generation, EGU General Assembly 2026, Vienna, Austria, 3–8 May 2026, EGU26-7894, https://doi.org/10.5194/egusphere-egu26-7894, 2026.

EGU26-10315 | PICO | HS7.1

Leveraging opportunistic rainfall sensors to improve hydrological flood modelling in a peri-urban catchment 

Andrijana Todorović, Nebuloni Roberto, De Michele Carlo, Cazzaniga Greta, Deidda Cristina, Kovačević Ranka, and Ceppi Alessandro

Accurate flood simulations necessitate rainfall inputs with fine spatiotemporal resolution, especially if semi- or fully-distributed hydrological models are used. Rainfall data are commonly obtained from rain gauges and/or weather radars, each with their associated uncertainties and challenges, especially with capturing heavy, localised events, and with high implementation- and maintenance costs [1]. This further translates into high costs of hydrological modelling of flood events [2].

An interesting alternative to rain gauges and radars are the rainfall data gathered from opportunistic sensors, such as Commercial Microwave Links (CMLs). CML data come at no infrastructure cost as they are generated by the network management system of mobile networks to monitor link performance. Furthermore, CMLs cover a large part of the world. Their strong potential to providing near-surface, fine-resolution rainfall fields has been demonstrated in many studies [3]. However, their usage for hydrological modelling has been little investigated so far. CML data have been mostly used for fully-distributed models in small catchments with an area of few square kilometres [1], with isolated examples of application in large catchments and/or with semi-distributed models [1],[4].

In this study, we analyse the impact of various modelling decisions about application of CML rainfall data on simulated flood hydrographs. Specifically, selection of (i) the approach to pre-processing CML signals to obtain hyetographs [3], (ii) CML data usage as a standalone input or in a combination with conventional datasets, and (iii) the way to calculate sub-catchment-averaged rainfall, are analysed. Different rainfall inputs are created accordingly, and used to force a semi-distributed model of the pre-alpine, peri-urban Lambro catchment in northern Italy notorious for intensive, tightly-localised events that trigger floods [4]. The simulated hydrographs of twelve flood events are compared to the observed ones in terms of the Nash-Sutcliffe coefficient, relative errors in peak magnitudes and runoff volumes, and timing of peak occurrence. Based on our analyses, specific recommendations are provided, with the ultimate goal to promote a wider application of CML data for hydrological modelling.


Acknowledgments

The authors would like to thank the “OpenSense” COST Action (CA20136) for supporting their collaboration through the STSM program.

References

[1]           J. Olsson et al., ‘How close are opportunistic rainfall observations to providing societal benefit?’, Journal of Hydrometeorology, Aug. 2025, doi: 10.1175/JHM-D-25-0043.1.

[2]           J. Seibert, F. M. Clerc‐Schwarzenbach, and H. J. (Ilja) Van Meerveld, ‘Getting your money’s worth: Testing the value of data for hydrological model calibration’, Hydrological Processes, vol. 38, no. 2, p. e15094, Feb. 2024, doi: 10.1002/hyp.15094.

[3]           S. C. Doshi, C. De Michele, G. Cazzaniga, and R. Nebuloni, ‘A Framework for Minimizing the Impact of Wet Antenna Attenuation on Rainfall Estimates Provided by Commercial Microwave Links’, IEEE J. Sel. Top. Appl. Earth Observations Remote Sensing, vol. 19, pp. 421–437, 2026, doi: 10.1109/JSTARS.2025.3632933.

[4]           G. Cazzaniga, C. De Michele, M. D’Amico, C. Deidda, A. Ghezzi, and R. Nebuloni, ‘Hydrological response of a peri-urban catchment exploiting conventional and unconventional rainfall observations: the case study of Lambro Catchment’, Hydrol. Earth Syst. Sci., vol. 26, no. 8, pp. 2093–2111, Apr. 2022, doi: 10.5194/hess-26-2093-2022.

How to cite: Todorović, A., Roberto, N., Carlo, D. M., Greta, C., Cristina, D., Ranka, K., and Alessandro, C.: Leveraging opportunistic rainfall sensors to improve hydrological flood modelling in a peri-urban catchment, EGU General Assembly 2026, Vienna, Austria, 3–8 May 2026, EGU26-10315, https://doi.org/10.5194/egusphere-egu26-10315, 2026.

Rainfall retrieval algorithms for weather radars are linked to assumptions about drop size distributions (DSDs), but DSD properties vary strongly across rainfall regimes. To reduce regime-dependent biases in radar-based quantitative rainfall estimation, we use high-temporal-resolution disdrometer observations to quantify microphysical differences between strong convection, embedded convection, and stratiform rainfall with a bright-band, and to test how well these regimes can be separated in the (Dm, log10Nw) phase space, where Dm is the mass-weighted mean diameter and Nw the normalized intercept parameter.

Our analysis shows a systematic convective–stratiform contrast. Strong convection has larger characteristic drop sizes and higher normalized concentrations (mean Dm ≈ 1.07 mm; mean Nw ≈ 2.93 × 10⁴ m−3 mm−1). Embedded convection has slightly smaller Dm but Nw remains comparably high (mean Dm ≈ 1.02 mm; mean Nw ≈ 2.00 × 10⁴ m−3 mm−1). Stratiform rainfall with a bright-band has smaller Dm and markedly lower Nw (mean Dm ≈ 0.92 mm; mean Nw ≈ 6.38 × 10³ m−3 mm−1).

Cumulative DSD curves indicate that regime separation is driven primarily by the large-drop tail: strong convection shows the highest contribution of drops above ~2–3 mm, embedded convection is intermediate, and stratiform rainfall declines steeply at large diameters. To translate these findings into an objective regime indicator, we train a linear SVM (Support Vector Machine) on canonical samples (strong convection vs stratiform rainfall with a bright-band) and apply it to all events. Convective and stratiform rainfall are largely separable, while embedded convection occurs on both sides of the boundary, supporting a probabilistic classification with a transition band. These results provide microphysical insights that can be used to refine regime-dependent radar retrieval parameterizations and improve radar-based rainfall estimates at hydrologically relevant scales.

How to cite: Rulfova, Z. and Potuznikova, K.: Disdrometer-based microphysical contrasts between convective and stratiform rainfall to improve radar rainfall retrievals, EGU General Assembly 2026, Vienna, Austria, 3–8 May 2026, EGU26-10645, https://doi.org/10.5194/egusphere-egu26-10645, 2026.

Analyzing the transition probability of disdrometer data revealed a sigmoid relation between precipitation intensity of the current and next minute. The sigmoid changes in it's parameters slope, location and asymmetry based on the intensity of the current value. In particular the evolution of the parameters shows some distinct bends that mark transition points. Replicating how the sigmoid morphs with intensity we build a Markov chain model that generates realistic precipitation data. In particular it can generate the power law relation in the high intensity range of the distribution and also correctly includes a transition to exponential distribution at low intensities. To complete the algorithm we included a threshold based transition to dry periods. This introduces realistic intermittency into the data. What makes our findings compelling is that we strictly replicated the micro structures we found in the data and ended up with a random walk that generates the large scale structure of the data set. No optimizing was involved. We still have to fully validate the performance of our algorithm and understand the essential components that generate key characteristics as for example the transition between exponential and power law. With that we hope to find a universal mechanism that is able to generate very different precipitation distributions based on how we shape the morphing of the sigmoid function.

How to cite: Frechen, T. N. and Hinz, C.: Replicating the micro structure of disdrometer data leads to a rainfall generator that correctly reproduces the large scale structure of the data set, EGU General Assembly 2026, Vienna, Austria, 3–8 May 2026, EGU26-11452, https://doi.org/10.5194/egusphere-egu26-11452, 2026.

EGU26-11781 | ECS | PICO | HS7.1

Multifractal analysis of Drop Size Distribution parameters vertical and temporal variability 

Emna Chikhaoui and Auguste Gires

Rainfall exhibits extreme spatial and temporal variability observable across wide range of scales. This variability is not limited to precipitation totals but also concerns the microphysical structure of the rain characterized with the help of the drop size distribution (DSD). It is defined as the number of raindrops per unit volume of air with a given equivolumic diameter. The  DSD can be described through its statistical parameters (basically its moments) such as the rain rate (RR), the liquid water content (LWC), the mass-weighted mean diameter (Dm) and the total number concentration (Nt). The vertical variability of DSD remains an active field of research, particularly due to the challenges associated with observing and generalizing microphysical profiles which are used to improve rainfall ground estimates from radar measurements.

Vertically-oriented radar measurements are a valuable tool for studying the vertical variability of DSD along the precipitation column with small spatial and short temporal observation scales. In this study, nine months of a Micro Rain Radar PRO (MRR-PRO) measurements were gathered in Ecole nationale des ponts et chaussées (ENPC), Institut Polytechnique de Paris (IPP), which is located in the eastern part of the Paris region, France. The MRR-PRO is a K-band weather radar that provides high-resolution vertical profiles of precipitation features that reach more than 4 kilometers of altitude above its position with a 35 meters spatial resolution and a 10 seconds time step. Based on the collected data and simple assumptions, several parameters related to the raindrop size distribution can be estimated empirically, such as RR, LWC, Dm and Nt. The spatial and temporal variability of the DSD was studied using the Universal Multifractal (UM) framework, a physically based framework designed to characterize geophysical fields across wide  range of scales through a limited set of physically interpretable parameters.

Two types of UM analysis were conducted in this study. First, the time series of DSD statistical moments is explored at each altitude. Then, vertical profiles of these moments are examined to extract UM parameters that characterize the variability along the vertical column. The results and their interpretation within a spatiotemporal framework will be presented.

Authors acknowledge the France-Taiwan Ra2DW project for financial support (grant number by the French National Research Agency – ANR-23-CE01-0019-01).

How to cite: Chikhaoui, E. and Gires, A.: Multifractal analysis of Drop Size Distribution parameters vertical and temporal variability, EGU General Assembly 2026, Vienna, Austria, 3–8 May 2026, EGU26-11781, https://doi.org/10.5194/egusphere-egu26-11781, 2026.

EGU26-12024 | ECS | PICO | HS7.1

Determination of Z-R Relationships for Rainfall Estimation from Weather Radar, Rain Gauges, and Disdrometers 

Nicolás Andrés Chaves González, Alessandro Ceppi, Carlo De Michele, Giovanni Ravazzani, and Orietta Cazzuli

Z-R relationships are a fundamental component of rainfall estimation and are widely applied in radar meteorology and hydrology supporting operational applications such as flood forecasting. Despite their extensive use, the procedures adopted to derive Z-R coefficients are often not described in sufficient detail, and key methodological choices, such as the selection of the dependent variable in the regression analyses, are frequently left implicit.

In this study, we analyze the determination of Z-R relationships using rain gauge, disdrometer, and X-band radar observations with solid-state transmitters collected over the Seveso-Olona-Lambro river basin and the Milan metropolitan area (northern Italy). A set of rainfall events recorded in 2023 is examined, including both stratiform and convective events. Z-R coefficients are determined using a regression-based approach following a leave-one-out methodology across events and multiple instrument pairings, to account for differences in sampling volumes and measurement characteristics.

The resulting relationships are evaluated by comparing radar-based rainfall estimates against rain gauge observations and estimates obtained using standard Z-R formulations. The analysis focuses on the performance of rainfall estimates for different methodological choices in the regression process and for stratiform and convective events, and includes an assessment of mean areal accumulated rainfall to emphasize the hydrological relevance of properly defining Z-R relationships. The study highlights the sensitivity of rainfall estimation to methodological choices in Z-R coefficient determination and underscores the importance of clearly documenting regression setups.

How to cite: Chaves González, N. A., Ceppi, A., De Michele, C., Ravazzani, G., and Cazzuli, O.: Determination of Z-R Relationships for Rainfall Estimation from Weather Radar, Rain Gauges, and Disdrometers, EGU General Assembly 2026, Vienna, Austria, 3–8 May 2026, EGU26-12024, https://doi.org/10.5194/egusphere-egu26-12024, 2026.

EGU26-12669 | ECS | PICO | HS7.1

Numerical evaluation of the wind-induced bias for the 2D Video Disdrometer 

Enrico Chinchella, Arianna Cauteruccio, Pak-Wai Chan, and Luca G. Lanza

Reconciling rainfall records from different sources, even from co-located instruments, is often difficult unless proper adjustment for instrumental and environmental sources of bias is applied. Comparisons between disdrometer and rain gauge measurements may show deviations that are usually attributed to their very different measurement principles. In this work, we show that rainfall intensity measurements from the 2D Video Disdrometer (2DVD) and a co-located tipping-bucket rain gauge can be largely reconciled once the relevant sources of bias are quantified and raw measurements are consequently adjusted.

The instrumental bias of the co-located tipping-bucket rain gauge is obtained from laboratory calibration performed at the Hong Kong Observatory (HKO). Meanwhile we rely on factory calibration for the instrumental bias of the 2DVD. Wind is assumed as the primary source of environmental bias for both instruments. Adjustment curves for the wind-induced bias of cylindrical rain gauges are here derived from existing literature (see Cauteruccio et al. 2024).

For the 2DVD, the wind-induced bias is obtained by means of numerical simulation. Using the OpenFOAM software, Computational Fluid Dynamics (CFD) and Lagrangian particle tracking simulations have been performed. CFD simulations provide the wind velocity field around the instrument body for different combinations of wind speed and direction. A k-ω SST turbulence model and a local time-stepping approach are used. Hydrometeor trajectories are modelled by numerically releasing drops ranging from 0.25 mm to 8 mm in diameter into the computational domain. The wind-induced bias is then expressed in terms of the Catch Ratio (CR), representing the ratio between the number of drops crossing both the 2DVD’s light beams in the presence of wind and their number considering undisturbed conditions.

The simulations shows that wind direction is a relevant factor since the instrument is not radially symmetric. A significant geometric shielding effect is also present and CRs may reach zero for medium to high wind speeds and small raindrop size, meaning that no drops are sensed by the 2DVD in certain conditions.

After adjustment, measurements from the 2DVD installed at the HKO’s field test site at the Hong Kong International Airport are compared against co-located rain gauge measurements. Results show an average reduction of the deviation between measurements to less than about 1 mm/h. Adjusted measurements from both instruments also report about 10% higher RI values, indicating that the raw data significantly underestimate precipitation. The adjustment procedure presented in this work is quite general and can be applied to raw measurements obtained from any 2DVD sensor if measurements from a co-located anemometer are available at the site.

Measurements obtained from the 2DVD in windy conditions should be therefore treated with caution, especially when the measured DSD is used to inform research studies on the microphysical properties of the rain process or for any comparison with other disdrometers or precipitation gauges.

References:

Cauteruccio, A., Chinchella, E., & Lanza, L. G. (2024). The overall collection efficiency of catching‐type precipitation gauges in windy conditions. Water Resources Research, 60(1), e2023WR035098. https://doi.org/10.1029/2023WR035098

How to cite: Chinchella, E., Cauteruccio, A., Chan, P.-W., and Lanza, L. G.: Numerical evaluation of the wind-induced bias for the 2D Video Disdrometer, EGU General Assembly 2026, Vienna, Austria, 3–8 May 2026, EGU26-12669, https://doi.org/10.5194/egusphere-egu26-12669, 2026.

EGU26-13237 | PICO | HS7.1

Enhancing Rainfall Spatial Representation through Quality-Controlled Personal Weather Stations 

Jochen Seidel, Damaris Zulkarnaen, Benedetta Moccia, Elena Ridolfi, Francesco Napolitano, Fabio Russo, and András Bárdossy

The high spatial and temporal variability of precipitation, especially during short, high-intensity events, is typically not captured by rain gauge networks. Furthermore, the actual precipitation maxima do not necessarily occur at the locations of the rain gauges. This consequently leads to a systematic underestimation of interpolated precipitation amounts (Bárdossy and Anwar, 2023). Since this phenomenon depends on the sample size, i.e., the number of rain gauges, a way to increase the sample size is to use additional data of so-called opportunistic precipitation sensors. A suitable data source is provided by personal weather stations (PWS) equipped with rain gauges, which have exceeded the number of stations operated by national weather services and other authorities. They therefore offer the potential to improve quantitative precipitation estimates (Bárdossy et al. 2021, Graf et al. 2021). 

In this study, we investigate the behaviour of precipitation extremes from interpolations  in the Lazio region in Italy using different rainfall data sets. The Lazio region is characterized by a dense network of approximately 230 professionally maintained rain gauges and more than 300 Netatmo Personal Weather Stations, both providing data in  high temporal resolution Although these stations offer a valuable opportunity to enhance the spatial coverage of rainfall observations, they do not generally comply with professional standards in terms of installation, maintenance, and data reliability, and therefore require a rigorous quality control (QC) procedure. In this study, the most recent QC filters and bias correction methodologies are applied to the PWS dataset. Following the QC process, the performance of the corrected PWS observations is assessed through comparison with co-located professional rain gauges. Furthermore, the potential added value of incorporating PWS data is investigated by analyzing their contribution to the representation of rainfall spatial variability, with particular emphasis on extreme precipitation events, as well as their impact on precipitation interpolation results. The outcomes of this study aim to provide insights into the effective integration of crowdsourced weather observations into operational and research-oriented hydrometeorological applications.

References:

Bárdossy, A., Seidel, J., El Hachem, A.: The use of personal weather station observations to improve precipitation estimation and interpolation, Hydrology and Earth System Sciences, 25, 583-601, 2021. https://doi.org/10.5194/hess-25-583-2021

Bárdossy, A., Anwar, F.: Why do our rainfall–runoff models keep underestimating the peak flows? Hydrology and Earth System Sciences, 27, 1987–2000, 2023. https://doi.org/10.5194/hess-27-1987-2023

Graf, M.,  El Hachem, A., Eisele, M., Seidel, J., Chwala, C., Kunstmann, H., Bárdossy, A.: Rainfall estimates from opportunistic sensors in Germany across spatio-temporal scales. Journal of Hydrology: Regional Studies, 37. https://doi.org/10.1016/j.ejrh.2021.100883

How to cite: Seidel, J., Zulkarnaen, D., Moccia, B., Ridolfi, E., Napolitano, F., Russo, F., and Bárdossy, A.: Enhancing Rainfall Spatial Representation through Quality-Controlled Personal Weather Stations, EGU General Assembly 2026, Vienna, Austria, 3–8 May 2026, EGU26-13237, https://doi.org/10.5194/egusphere-egu26-13237, 2026.

EGU26-15175 | ECS | PICO | HS7.1

Developing a Gauge–Radar Merged Precipitation Dataset (1 hour and 1 km) for Great Britain: GRaD-GB (1H1K) 

Xiaobin Qiu, Amy C. Green, Stephen Blenkinsop, and Hayley J. Fowler

High-quality gridded precipitation datasets are essential for climate analysis and flood-risk assessment in Great Britain (GB); however, such datasets remain limited, and existing products suffer from important limitations. Rain gauge measurements provide highly accurate point-scale observations, but sparse gauge networks limit their applicability. Radar quantitative precipitation estimates (QPEs) offer useful spatial information on rainfall fields at national scale, but suffer from multiple artefacts and errors. Blended rainfall datasets therefore represent a promising approach, as they capitalise on the complementary strengths of radar and gauge observations. Accordingly, this study aims to develop a high-resolution blended precipitation dataset for GB, focusing on two key components: quality control (QC) of radar QPEs and the merging of radar and gauge rainfall.

First, radar QPEs are shown to contain substantial and spatially variable errors even after standard reflectivity-based QC. We assess the Met Office composite radar QPE for GB (hourly, 1 km resolution; 2006–2018) against approximately 1300 hourly rain gauges, demonstrating that errors increase with elevation, distance from radar, and rainfall intensity. Radar QPEs frequently underestimate high-intensity hourly rainfall and fail to detect many extreme events (≥40 mm h⁻¹), with underestimation occurring approximately 1.7 times more often than overestimation (for rainfall ≥0.2 mm h⁻¹). To address these issues, we develop a holistic, rule-based QC framework that exploits spatial–temporal continuity and rainfall-field uniqueness to further quality-control radar QPEs already processed by the Met Office. The framework (i) detects and recovers beam-blocked regions, (ii) classifies normal versus suspect rainfall fields, and (iii) identifies and replaces bad rainfall pixels associated with radar malfunction, ground clutter, and electronic noise. Application of this framework reduces the Root Mean Squared Error (RMSE) relative to gauges from 0.546 to 0.386 (−29%) and increases the correlation coefficient from 0.552 to 0.725 (+31%), while preserving genuine extreme rainfall.

Second, building on the quality-controlled radar product, we introduce a Gauss Blending Method (GBM), adapting the Gauss–Seidel method to merge radar rainfall with gauge constraints (970 gauges) and generate a spatially complete, structure-preserving hourly precipitation field at 1-km resolution. Independent evaluation using 194 gauges (2006–2018) shows that the blended product improves RMSE and mean absolute error by ~14.5% and reduces mean relative error by ~22% compared with radar-only data. The GBM also enhances rainfall detectability and outperforms commonly used adjustment approaches, including the Additive Adjustment, Multiplicative Adjustment, Mixed Adjustment, and Mean Field Bias Adjustment methods. Its overall performance is comparable to Kriging with External Drift; however, GBM shows superior performance for higher rainfall intensities (≥10 mm h⁻¹), provides substantially greater spatial data coverage, better preserves local rainfall variability, and is easier to implement in practice.

Together, the proposed QC framework and GBM enable the production of GRaD-GB (1H1K), an hourly 1-km gauge–radar merged precipitation dataset for Great Britain covering the period 2006–2023. The dataset combines hourly quality-controlled radar QPEs with hourly rainfall observations from approximately 1500 quality-controlled rain gauges. GRaD-GB (1H1K) is well suited for analysing precipitation variability, storm life cycles, and extreme rainfall, thereby providing a robust basis for hydrological applications, flood risk estimation, and extreme rainfall analysis.

How to cite: Qiu, X., C. Green, A., Blenkinsop, S., and J. Fowler, H.: Developing a Gauge–Radar Merged Precipitation Dataset (1 hour and 1 km) for Great Britain: GRaD-GB (1H1K), EGU General Assembly 2026, Vienna, Austria, 3–8 May 2026, EGU26-15175, https://doi.org/10.5194/egusphere-egu26-15175, 2026.

EGU26-18043 | PICO | HS7.1

Urbanization and Air Pollution Effects on Precipitation Microphysics: Evidence from Disdrometer Observations in Belgium 

Armani Passtoors, Kwinten Van Weverberg, Ricardo Reinoso-Rondinel, Maarten Reyniers, Dieter Poelman, and Nicolas Ghilain

Urbanization and air pollution are increasingly recognized as important modifiers of precipitation microphysics, yet their combined influence on raindrop size distributions (DSDs) remains uncertain. This study investigates how urban land cover and particulate air pollution affect rainfall microphysical properties using multi-year disdrometer observations at three urban-edge sites near Brussels, Liège, and Ghent. Measurements from two optical laser disdrometers and one forward-scattering disdrometer are combined with ERA5 reanalysis data, Local Climate Zone (LCZ) classifications, and gridded air-quality datasets. Disdrometer data are subjected to quality control, including filtering for liquid precipitation, internal consistency checks based on rainfall rate, and comparison with nearby rain-gauge measurements. Raindrop size distributions are characterised using integral microphysical parameters, including volume mean diameter (VMD), area mean diameter (AMD), rainfall rate, reflectivity, and kinetic energy. Convective and stratiform precipitation are distinguished using reflectivity-based thresholds and variability in rainfall rate. Urban effects are quantified by relating wind-direction-dependent urban fraction to disdrometer-derived DSD parameters. Preliminary results indicate a site-dependent response of raindrop diameter to upwind urban fraction, with statistically significant positive relationships at two locations and a negative relationship at one location, highlighting the complexity and heterogeneity of urban–precipitation interactions. Seasonal stratification and wind-speed filtering do not reveal a consistent pattern across all instruments. The influence of air pollution is assessed using daily mean PM2.5 and PM10 concentrations, with initial analyses suggesting that elevated pollution levels are associated with more extreme DSD behaviour, characterised by an increased occurrence of significantly smaller and larger drop sizes compared to more narrowly distributed DSDs under cleaner conditions. Ongoing analyses further examine how these effects depend on precipitation type and how they translate into changes in rainfall kinetic energy. This work provides new observational insight into the nonlinear interactions between urban environments, aerosols, and precipitation microphysics with implications for urban hydrology, radar-based rainfall estimation, and the representation of aerosol-cloud-interactions in climate models.

How to cite: Passtoors, A., Van Weverberg, K., Reinoso-Rondinel, R., Reyniers, M., Poelman, D., and Ghilain, N.: Urbanization and Air Pollution Effects on Precipitation Microphysics: Evidence from Disdrometer Observations in Belgium, EGU General Assembly 2026, Vienna, Austria, 3–8 May 2026, EGU26-18043, https://doi.org/10.5194/egusphere-egu26-18043, 2026.

EGU26-18161 | PICO | HS7.1

Flood forecasting based on personal weather station rainfall data 

Claudia Brauer, Jisca Schoonhoven, and Linda Bogerd

An increasing number of personal weather stations (PWSs) is installed by citizens, resulting in a large amount of real-time available precipitation data. This study assesses the applicability of these data for flood forecasting. We focussed on 30 catchments (total area 2474 km2) located in the management area of Water Board Rijn and IJssel, a water authority in the Netherlands which uses PWS data as input for their operational flood forecasting system. We compared rainfall from a network of 869 Netatmo PWSs (after applying a quality filter) and the real-time radar product from the KNMI (Royal Netherlands Meteorological Institute). Next, we used both products as input for the rainfall-runoff model WALRUS and compared the simulated discharges. These two datasets with almost no latency were validated with the final reanalysis KNMI radar product and discharge observations, for a full year (2023).

For precipitation, the real-time radar was closer to the final reanalysis radar than the PWSs in terms of Kling-Gupta Efficiency, Pearson correlation coefficient and coefficient of variation, but had a stronger negative bias. However, discharge simulations based on PWSs were closer to observations and simulations with the final reanalysis radar than simulations based on the real-time radar. This contrasting result can be explained by the bias, which was stronger for the real-time radar than for the PWSs, and is amplified in the discharge simulations due to the memory in the hydrological system. We found no clear relation between catchment size, PWS density and PWS distribution and the performance of PWS rainfall product. Reducing the density of the PWS network only led to a small deterioration in performance. The results indicate the potential of these devices to be used in hydrological applications, especially when initial hydrological model conditions are improved with data assimilation in operational flood forecasting systems.


How to cite: Brauer, C., Schoonhoven, J., and Bogerd, L.: Flood forecasting based on personal weather station rainfall data, EGU General Assembly 2026, Vienna, Austria, 3–8 May 2026, EGU26-18161, https://doi.org/10.5194/egusphere-egu26-18161, 2026.

EGU26-18992 | ECS | PICO | HS7.1

Wind effects on disdrometer measurements at different elevations along a meteorological mast 

Arianna Cauteruccio, Auguste Gires, Enrico Chinchella, and Luca G. Lanza

Disdrometers positioned at different elevations above the ground experience different wind conditions, with increasing wind velocity as the elevation increases and possibly changing wind direction. On the contrary, bulk properties of the rainfall process, such as the rainfall intensity, are not expected to change along the vertical within a limited elevation gain.

In this work, high resolution data collected over 2.5 years on a meteorological mast located at Pays d'Othe wind farm, 110 km South-East of Paris France is used. More precisely, data from an OTT Parsivel2 disdrometer, with 30 s observation time step, and a Thies Clima 3D sonic anemometer at 100 Hz, located at roughly 40 m, are used. The same setting is replicated at 80 m.

In previous research (Chinchella et al., 2025), the expected wind-induced bias of the OTT Parsivel2 disdrometer was numerically quantified using computational fluid dynamics simulation. Adjustments are here applied to raw disdrometer data depending on the measured wind speed and direction. Not only updated rain rate is provided but also the whole DSD enabling to study a few key features such as mean diameter or total concentration.

The disdrometer measurements (rain rate and DSD) at the two heights are compared before and after the correction. In a first step standard scores such as RMSE, normalized bias or Nash-Sutcliffe efficiency are used. In a second step, Universal Multifractal (UM) features are compared to get results valid, not only at a few selected scales, but across a wide range of scales. UM is a parsimonious mathematically robust framework, relying on the physically based notion of scale invariance inherited from the governing Navier-Stokes equations. It has been widely used to characterize and simulate geophysical fields extremely variable over wide range of scales such as rainfall, with the help of only 3 parameters.

This study enables to discuss the effect of the wind correction with increasing wind on the same location. It also enables to quantify the influence of wind on disdrometers measurements and retrieved UM features, an effect that has been neglected in previous investigations.

Authors acknowledge the ANR PRCI Ra2DW project supported by the French National Research Agency – ANR-23-CE01-0019-01 for partial financial support.

References

Chinchella, E.; Cauteruccio, A.; Lanza, L.G. Impact of Wind on Rainfall Measurements Obtained from the OTT Parsivel2 Disdrometer. Sensors 2025, 25, 6440. https://doi.org/10.3390/s25206440.

How to cite: Cauteruccio, A., Gires, A., Chinchella, E., and Lanza, L. G.: Wind effects on disdrometer measurements at different elevations along a meteorological mast, EGU General Assembly 2026, Vienna, Austria, 3–8 May 2026, EGU26-18992, https://doi.org/10.5194/egusphere-egu26-18992, 2026.

EGU26-19729 | ECS | PICO | HS7.1

Large-scale Clustering of Natural Snowfall: Collective Precipitation Dynamics in Three Dimensions 

Koen Muller, Rafael Bölsterli, Sergi Gonzàlez-Herrero, Michael Lehning, and Filippo Coletti

The interactions between large collections of settling snowflakes and various turbulence intensity levels within the air column make snow precipitation difficult to forecast. Characterizing the multi-scale spatial distribution and transport of snowflakes is crucial for understanding the spatial modulations in the snow deposition process and for interpreting remote sensing signals. In this work, we perform large-scale three-dimensional tracking of snowflakes falling through the atmospheric surface layer in the Swiss Alps. We utilize a novel super-resolution field imaging system that combines 16 high-resolution cameras mounted on arrays and is flexibly deployed in ice-fishing tents at different instrumented field sites with collocated snow and wind characterization. Each camera array is fitted with shifted lenses to stitch an equivalent 100 Megapixel imaging over a 20x20 square Meter field of view at a 2-Millimeter diffraction-limited tracking resolution. Snowflakes are illuminated using white light of 5500 Kelvin at 250′000 Lumens from multiple powerful 1575 Watt stadium floodlight panels mounted on snowboards and retrofitted with lenticular lenses. Shooting data at a 150 Hertz, the system is capable of tracking millions of snowflakes over 10x10x10 cubic Meters simultaneously. We first present collective snow tracking data obtained in a mild wind vector of approximately 3 Kilometers per hour. Analyzing the fall velocity, our data suggests a multimodality for fast and slow falling snow particles, which we discuss in relation to recorded snow particle variability. Subsequently, analyzing the point-cloud data using a Voronoi tessellation, we find a predominance of clusters and voids compared to the clustering diagram for a random Poisson process. Secondly, we present field experiments being caught in a blizzard with windspeeds exceeding 30 Kilometers per hour. We first conduct a qualitative assessment of the observed patterning of snowfall in the atmosphere at high wind speeds, as well as the appearance of saltation and blowing snow layers during the field measurements. We then identify signatures of these field observations in the acquired tracking data and compare events of extreme clustering dynamics against those of the cluster diagram for the mild wind vector.

How to cite: Muller, K., Bölsterli, R., Gonzàlez-Herrero, S., Lehning, M., and Coletti, F.: Large-scale Clustering of Natural Snowfall: Collective Precipitation Dynamics in Three Dimensions, EGU General Assembly 2026, Vienna, Austria, 3–8 May 2026, EGU26-19729, https://doi.org/10.5194/egusphere-egu26-19729, 2026.

EGU26-246 | ECS | Posters on site | HS7.2

Rainfall Erosivity Estimation Accuracy and Its Impact on Soil Loss Assessments: A Case Study in Southern Italy  

Athanasios Serafeim, Andreas Langousis, Francesco Viola, Dario Pumo, Nunzio Romano, Paolo Nasta, and Roberto Deidda

Accurate and robust estimation of soil loss is essential in Mediterranean basins, where sediment transfer rates exhibit pronounced seasonal aspects driven by high-intensity storm events. While the Revised Universal Soil Loss Equation (RUSLE) is the most widely used tool for assessing soil loss, its accuracy is highly dependent on the rainfall erosivity (R-factor). This study evaluates the effect of different R-factor quantification approaches on soil loss estimates within the Tirso River basin, Sardinia’s largest basin (> 3000 km²), which provides water resources for agriculture, hydropower, and domestic supply.

We applied the RUSLE method within a geographic information system (GIS) framework. The key factors for soil erodibility (K), topography (LS), land cover-management (C), and conservation practices (P) were derived from established sources, including the European Soil Data Center, a high-resolution Copernicus DEM, the Copernicus Global Land Service, and local authorities. To estimate the R-factor, we used high-resolution (10-minute resolution) precipitation data from more than 40 rainfall gauges, applying two distinct storm identification approaches: Renard et al. (1997) and the recently developed Serafeim et al. (2025). The soil loss estimates obtained from these high-resolution methods were then compared against results derived from a suite of widely applied empirical erosivity models calibrated in Mediterranean regions. This comparative analysis reveals how relying on generalized erosivity equations can distort soil erosion assessments at the basin level.

Keywords
Soil erosion; RUSLE; rainfall erosivity uncertainty; high-resolution precipitation; sediment yield; watershed management

References

Renard, K.G., Foster, G.R., Weesies, G.A., McCool, D.K., Yoder, D.C., 1997. Predicting Soil Erosion by Water: A Guide to Conservation Planning With the Revised Universal Soil Loss Equation (RUSLE). USA, U.S, Department of Agriculture, Washington, DC.

Serafeim, A.V., R. Deidda, A. Langousis, et al., (2025) A Critical Review of Rainfall Erosivity Estimation Approaches: Comparative Analysis and Temporal Resolution Effects (To be submitted).

How to cite: Serafeim, A., Langousis, A., Viola, F., Pumo, D., Romano, N., Nasta, P., and Deidda, R.: Rainfall Erosivity Estimation Accuracy and Its Impact on Soil Loss Assessments: A Case Study in Southern Italy , EGU General Assembly 2026, Vienna, Austria, 3–8 May 2026, EGU26-246, https://doi.org/10.5194/egusphere-egu26-246, 2026.

Accurate precipitation estimates depend critically on the calibration fidelity of ground-based Doppler Weather Radar (DWR) systems. While these radars provide high-resolution observations essential for hydrological modelling and forecasting, their measurements often suffer from bias due to radar constant drift. Conventional calibration approaches, such as using metallic spheres, are operationally demanding and poorly maintained. As a result, biases in reflectivity can propagate, thereby degrading quantitative precipitation estimation (QPE) and introducing uncertainty into downstream applications.

This study develops a correction strategy that utilizes the well-calibrated reflectivity measurements from satellite radar (SR) to account for the systematic underestimation in ground radar (GR) measurements. A machine-learning approach based on the XGBoost algorithm is used to model the bias between GR and SR reflectivity along with key radar-geometric parameters, including range, elevation angle, and azimuth, to capture the spatial heterogeneity. The proposed framework is evaluated using eight years (2017-2024) of collocated observations from the C-band DWR at the Thumba Equatorial Rocket Launching Station (TERLS), Thiruvananthapuram, India. The proposed correction framework significantly enhances consistency between GR and SR observations. The correlation coefficient increases from 0.23 to 0.88 with a marked reduction in mean bias, mean absolute error and root mean squared error. The results demonstrate the potential of space-ground radar synergy to mitigate calibration-driven uncertainties and strengthen the reliability of near-real-time precipitation products. This framework offers a scalable pathway for enhancing operational QPE and for supporting climate-scale radar reflectivity reanalysis where long-term consistency is essential.

How to cite: Tyagi, V. and Das, S.: Correction of Systematic Calibration Drift in Weather Radar Observations to Improve Precipitation Uncertainty Modelling, EGU General Assembly 2026, Vienna, Austria, 3–8 May 2026, EGU26-504, https://doi.org/10.5194/egusphere-egu26-504, 2026.

Increasing anthropogenic activities in the post-industrial era, coupled with variability in natural forcings (e.g., solar radiation, volcanic eruption) and changes in geomorphological characteristics make the climate highly non-stationary in nature. This hinders effective climate projections, adaptation and mitigation strategies for extreme weather events, hydraulic structure planning, and irrigation activity. Regionalization, which is the process of demarcating regions of similar hydroclimatic characteristics, is therefore essential for water resources planning and management. However, there are no existing approaches which take into account the non-stationarity inherent in the hydroclimatic variables (e.g., precipitation, temperature, humidity, water level) during the process of regionalization. The most widely used feature based clustering techniques involve identifying key static attributes of the hydroclimatic time series to identify dominant patterns. However, these methods often fail to capture the temporal dynamics and evolving non-stationary characteristics of the climate variables, which is a major concern in the era of climate change. To address this research gap, this study integrates two major objectives - (a) develop a novel model based regionalization procedure that accounts for non-stationarity in the hydroclimatic time series, and (b) evaluate the performance of the proposed methodology against the existing regionalization approaches using a real world case study for the Indian subcontinent. 

By coupling the Latent Gaussian State Space Models (LGSSM) with advanced fuzzy ensemble clustering techniques, the proposed methodology aims to capture this inherent non-stationarity of the hydroclimatic data, yielding better domain informed homogeneous regions. Largely used in the field of data science for future data predictions and grouping; the LGSSM model is a parametric model with sufficient flexibility which can effectively describe the non-stationary climate variables in the Euclidean Space. Further, fuzzy ensemble clustering techniques aggregate results from multiple clustering realizations, mitigating the biases inherent in any single clustering approach and incorporate fuzzy set theory by assigning membership degrees to each study area grid. Cluster validity indices such as the Dunn Index and Davies-Bouldin Index are used to find the optimal number of clusters based on intra cluster compactness and inter cluster separation. 

Hydroclimatic datasets (eg., IMD data, ERA5 reanalysis data) are obtained at 0.25x0.25 degrees spatial and daily temporal frequency for the Indian subcontinent. The methodology identified K=10 and K=6 optimum number of clusters for precipitation and temperature respectively. Final homogeneous regions are delineated by integrating topographical features such as distance from sea, elevation etc. The identified major climate regions are - (a) Northern Cold Himalayan Zone, (b) Thar Desert Area, (c) Indo-Gangetic Plain, (d) Southern Peninsular Region, (e) Western Ghats Area and (f) Dry Semi-Arid Zone. These regions are validated using regional homogeneity tests such as HoskinWallish Test. This study is the first to integrate the advanced state space modeling with fuzzy ensemble clustering for climatic regionalization, making a paradigm shift in hydrology research, from solely relying on basin-scale boundaries to an integrated approach that considers both atmospheric and physiographic boundaries. This proposed methodology provides a ready to use powerful tool for homogeneous regionalization and future projections of complex non-stationary hydroclimatic variables.

How to cite: Sengupta, D. and Vijay, S.: A Novel Framework for Homogeneous Climate Regionalisation using Advanced State Space Modeling and Ensemble Fuzzy Clustering  , EGU General Assembly 2026, Vienna, Austria, 3–8 May 2026, EGU26-561, https://doi.org/10.5194/egusphere-egu26-561, 2026.

Mountainous areas and the hill stations, which were traditionally considered cooler and with stable climatic conditions, are proving to mirror certain warming and changes in rainfall patterns. Considering the broader context of global climate change, this study investigates the presence of statistically quantifiable climatic shifts in the hill stations of South India by integrating observed IMD datasets with CMIP6 model simulations. An extensive bias-correction framework was employed to analyse and address the substantial systematic errors commonly associated with applying global climate models to complex terrain. The study combines established bias-correction techniques, including Quantile Mapping (QM) and Quantile Delta Mapping (QDM), with advanced machine learning algorithms such as CART, XGBoost, and a stacked ensemble model, enabling a more robust and comprehensive correction of model biases. XGBoost and the stacked model were the only approaches that demonstrated substantial improvements, showing reduced RMSE (0.55–0.76 for temperature and approximately 83–85 mm for precipitation), near-zero bias, and strong predictive skill (R² = 0.96 for temperature and NSE = 0.71 for precipitation). These models also achieved the lowest prediction uncertainty (RMSE) and the highest overall predictive performance (R²). The bias-corrected projections reveal pronounced warming across all the hill stations examined, aligning with recent evidence that traditionally cool regions are experiencing increased heat exposure. Rainfall forecasts indicate greater variability, suggesting a potential rise in both heavy rainfall events and prolonged dry spells. These findings strongly support the emerging understanding that the hill stations of South India are transitioning toward warmer and more climate-sensitive conditions. The study provides high-resolution, bias-adjusted datasets essential for climate impact assessments, tourism planning, ecosystem management, and the development of targeted adaptation policies to safeguard these vulnerable high-elevation environments.

How to cite: Devaraj, S. and Shanmugam, P. S.: Machine Learning–Enhanced Bias Correction of CMIP6 Data for Detecting Warming and Rainfall Shifts in Indian Hill Stations, EGU General Assembly 2026, Vienna, Austria, 3–8 May 2026, EGU26-755, https://doi.org/10.5194/egusphere-egu26-755, 2026.

Precipitation drives the hydrologic cycle and directly impacts sectors from agriculture to electricity generation. However, modeling its statistical distribution is challenging. Precipitation data typically consists of frequent dry days with zero values mixed with rare, extreme events. Both ends of this spectrum can cause disasters, such as flash floods or severe droughts. In the Eastern Mediterranean, this challenge is complicated by complex topography and changing climate patterns. While machine learning (ML) models are widely used for classification or regression of the precipitation, they often treat large areas as uniform regions. However, this generalization misses important local features, such as orographic lifting along mountains or rain shadows in interior basins. Furthermore, most operational models focus only on minimizing error metrics through exact point predictions. Similar to the spatial generalization, this approach yields another problem by ignoring the forecast uncertainty, which is essential for risk-based decision-making.

This study addresses these issues by developing a spatially explicit deep learning framework based on the Probability Integral Transform (PIT). Training models on raw precipitation amounts often leads to underestimating extremes and assigning trace amounts to dry days because machine learning models tend to regress to the mean or the overrepresented classes. To solve this, the target variable (i.e., precipitation based on EOBS data) is transformed into a probability space. Each 0.1-degree pixel is normalized using its own cumulative distribution function (CDF) calculated from the 1985–2015 climatology. Here, instead of a fixed baseline assumption, the Pettitt test is applied to each pixel to detect structural breaks in the historical time series. Yet, this is applied with a condition that at least the last 10 years (2005–2015) are preserved for the CDF analysis, to ensure the approach has enough data. This ensures that the reference climatology reflects the current hydro-climatic conditions.

The deep learning model utilized in this study uses downscaled Global Forecasting System (GFS) forecasts with a 24-hour horizon. To capture the vertical structure of the atmosphere, inputs include wind components (u, v), geopotential height, and specific humidity at 500, 700, and 850 hPa pressure levels. This multi-level approach allows the model to learn the interactions between large-scale circulation, mid-tropospheric moisture transport, and low-level topographical effects. This offers a significant physical advantage over surface-only models. The study covers the period from 2015 to 2025, divided into training (2015–2020), hyperparameter tuning and validation (2020–2022), and testing (2022–2025) sets.

Finally, the deep learning model is extended with conformal prediction to bridge the aforementioned gap between statistical accuracy and yielding exact values. Unlike traditional approaches with a specific error distribution (e.g., Gaussian) assumption, conformal prediction yields distribution-free prediction intervals with a coverage guarantee. This results in adaptive confidence bounds, which can be interpreted with a widened confidence interval during unstable weather patterns and a narrowed one during stable atmospheric conditions. Consequently, the proposed approach ensures that the output is not just a forecast, but a reliable measure of its certainty across the diverse climates and topography of the Eastern Mediterranean.

How to cite: Senocak, A. U. G.: Probabilistic Precipitation Forecasting over the Eastern Mediterranean via PIT-Normalized Conformal Quantile-MOS, EGU General Assembly 2026, Vienna, Austria, 3–8 May 2026, EGU26-1043, https://doi.org/10.5194/egusphere-egu26-1043, 2026.

Accurate precipitation estimation is of vital importance for hydrological simulation and water resources management. However, large uncertainties existed in  precipitation datasets in high-alpine regions due to the scare gauged observations and complex terrains. Data fusion technologies are widely applied to integrate advantages of multi-source precipitation datasets, but the spatial information of precipitation is usually negelected. To overcome this limitation, this study developed a two-step machine learning framework for merging multi-source precipitation datasets based on the 2D convolutional neural network (CNN) incorporating Neighboring spatial information, hereafter referred to as nCNN. The framework employs a hybrid classification-regression model to merge three gridded precipitation products (i.e., ERA5-Land, TPReanalysis and GPM) and gauged observations over a high alpine watershed in China during the period 2001-2019. Two merged precipitation datasets were generated by CNN and the proposed nCNN framework, respectively. The results show that the proposed framework effectively integrates the advantages of multiple datasets. The CNN and nCNN merged precipitation datasets have similar spatial distribution with the original products but differ in precipitation amounts. Precipitation amounts of merged data are much closer to gauged observations than original precipitation products. Both merged datasets outperform original products in terms of statistical and categorical indices evaluated based on 25 independently meteorological stations with complete time period (covering 2001-2019). However, the nCNN merged dataset exhibits superior performance over the CNN merged dataset in capturing precipitation amounts and detecting precipitation event, especially for moderate (5~10 mm/d) and heavy precipitation (>10 mm/d). Compared with the CNN merged result, the nCNN framework reduces the station-averaged root mean square error (RMSE) from 4.25 mm/d to 3.74 mm/d for moderate precipitation and from 9.43 mm/d to 8.57 mm/d for heavy precipitation, while increasing the station-averaged critical success index (CSI) by 0.03 and 0.04, respectively. Overall, this study highlights the importance of incorporating spatial information in precipitation merging, especially for high-alpine regions. 

How to cite: Li, H. and Chen, J.: A two-step machine learning framework for incorporating spatial information into multi-source precipitation merging over high-alpine regions, EGU General Assembly 2026, Vienna, Austria, 3–8 May 2026, EGU26-1833, https://doi.org/10.5194/egusphere-egu26-1833, 2026.

EGU26-1995 | Posters on site | HS7.2

Investigation of the Spatial and Temporal Variability of the Precipitation and Temperature Lapse Rates in Greece and its Application in Evaluation and Calibration of Metanalysis Meteorological Data 

Xenofon Soulis, Karampetsa Evaggelia, Konstantinos Soulis, Stergia Palli Gravani, Evaggelos Nikitakis, and Dionissios Kalivas

Accurate meteorological forcing is a prerequisite for reliable hydrological modelling, particularly in regions with complex topography like Greece. Global reanalysis datasets offer continuous coverage but often fail to capture local orographic effects when downscaled using standard, constant lapse rates. This study investigates the spatial and temporal variability of precipitation and temperature gradients across Greece and evaluates their application in calibrating reanalysis data.

We utilized a hybrid dataset comprising long-term records from 140 meteorological stations and a dense network of 777 stations for the year 2023. To process this data, we developed a specialized Python-based algorithm to estimate lapse rates and the Coefficient of Determination ($R^2$) dynamically across the domain. The methodology utilizes a "moving-window" approach, where the window dimensions and moving step were first optimized by maximizing the determination coefficient ($R^2$) to ensure statistical robustness. Using these optimized parameters, we estimated the lapse rate and $R^2$ at each grid point of the study area. Subsequently, spatial interpolations were generated to create continuous maps of vertical gradients and their statistical reliability.

The resulting spatial patterns were analyzed in relation to the country’s distinct geomorphology, including the complex coastline, the orientation of major mountain ranges (Pindos), and the insular environments. The analysis revealed that while temperature lapse rates exhibit high spatial coherence and predictability, precipitation gradients are highly sensitive to local topographic features and continentality.

These empirically derived, spatially explicit lapse rates were applied to downscale and bias-correct AgERA5 temperature and precipitation fields for the DT-Agro Digital Twin. The proposed methodology significantly reduced biases in mountainous and coastal zones compared to standard interpolation methods, demonstrating that geomorphologically informed, dynamic gradient estimation is critical for effective model calibration in data-scarce, complex terrains.

How to cite: Soulis, X., Evaggelia, K., Soulis, K., Palli Gravani, S., Nikitakis, E., and Kalivas, D.: Investigation of the Spatial and Temporal Variability of the Precipitation and Temperature Lapse Rates in Greece and its Application in Evaluation and Calibration of Metanalysis Meteorological Data, EGU General Assembly 2026, Vienna, Austria, 3–8 May 2026, EGU26-1995, https://doi.org/10.5194/egusphere-egu26-1995, 2026.

EGU26-2553 | ECS | Orals | HS7.2

Change Factor Based Downscaling of Precipitation Through Neyman-Scott Rectangular Pulse based Rainfall Field Generators 

Mohammed Azharuddin, David Pritchard, and Hayley Fowler

We present a multi-site weather generator with a stochastic rainfall field generator (RFG) at its core. The weather generator is developed with the motive to produce downscaled projections for the future by utilizing the UKCP18 projections and a suite of climate models from the CMIP5/6 archive. The rainfall fields are sampled from the spatio-temporal Neyman-Scott Rectangular Pulse (NSRP) process. When considering a single site, the NSRP model parameterizes storm arrivals as a poisson process and storm separation time as exponential distribution. Each storm is assigned a certain number of raincells (a poisson random number) with each raincell having a duration and intensity which are exponentially distributed. For a multi-site model, additional considerations are made which include the radius of raincell parameterised by exponential distribution and the raincell density as a uniform poisson process (which is a replacement to the raincell generation process of single site model). The RFG has shown its efficacy in capturing the statistics of the observed rainfall across point and catchment scales which include mean monthly rainfall totals, daily variance, skewness, lag-1 autocorrelation, dry-day proportion and daily annual maximum in addition to capturing intergauge correlations. . Following the calibration and testing of the NSRP-based RFG, the other weather variables such as temperature and wind speed are ascertained through regression relationships by considering wet and dry transition states of rainfall. With the RFG established, climate model downscaling is performed by computing multiplicative and additive change factors for rainfall and temperature respectively. The RFG paramaters are perturbed by the computed change factor(s) to derive downscaled projections of precipitation thereby offering multiple plausible future scenarios in addition to a band of uncertainty associated with the projections. These projections can be further translated to hydrological responses by leveraging hydrological models thereby aiding in climate change impact assessment and adaptation.

How to cite: Azharuddin, M., Pritchard, D., and Fowler, H.: Change Factor Based Downscaling of Precipitation Through Neyman-Scott Rectangular Pulse based Rainfall Field Generators, EGU General Assembly 2026, Vienna, Austria, 3–8 May 2026, EGU26-2553, https://doi.org/10.5194/egusphere-egu26-2553, 2026.

EGU26-2939 | Orals | HS7.2

Generation of high-resolution design rainfall using duration adjustment factors  

Hannes Müller-Thomy, Gioia Groth, Sinuhé Alejandro Sánchez Martínez, Maritza Liliana Arganis Juárez, and Kai Schröter

Temporal high-resolution design rainfall is frequently required for the dimensioning of critical infrastructure. While daily precipitation time series are generally of sufficient length to derive design rainfall for high return periods (e.g. T=100 years), the limited length of high-resolution time series often only allows for the reliable derivation of lower return periods.

Using the proposed duration adjustment factors (DAFs), design rainfall can be scaled from coarser duration levels to finer duration levels as D={5 min, 1 h}. The DAFs were derived and evaluated nationwide for Germany based on the national rainfall extreme value catalogue KOSTRA-DWD-2020 data for various durations D and return periods T (D={5 min, …, 24 h}, T={1 year, …, 100 years}). In addition, the influence of physiographic characteristics (climate zone, land use, elevation, slope, and distance to the sea) was investigated using Spearman’s rank correlation coefficient ρ for continuous variables and the effect size η² for categorical characteristics.

The DAFs depend strongly on the basis duration level (D=24 h or D=1 h) from which the scaling is applied, but show only a weak dependence on the considered return period. Elevation exhibits a weak to moderate influence, which is greater than the influence of slope and distance to the sea. Climate zone has a moderate effect on the DAFs, whereas land use exerts only a weak influence.

For 1,414 selected KOSTRA-DWD-2020 grid cells design rainfall values with D={5 min, 60 min} were generated from daily design rainfall values (D=1 day), and validated with the original high-resolution design rainfall values from the KOSTRA-DWD-2020. The impact of taking elevation into account when deriving the DAFs was examined as well. Three elevation clusters were defined, and the DAFs were derived (i) separately within each cluster and (ii) without considering clustering. Without clustering, the generation of design rainfall from an initial duration of D=1 day with T=100 years results in a relative RMSE (rRMSE) of 10 % for D=1 h, which is below the data-based uncertainty of 25 % reported by KOSTRA-DWD-2020. For D=5 min, a rRMSE of 15 % is obtained, which is slightly lower than the KOSTRA-DWD-2020 uncertainty of 18 %. Clustering leads to only a minor improvement in the median performance (considering all 1,414 grid cells), but results in a substantial reduction in the spread, i.e. the resulting uncertainties. Notably, the quality of the generated design rainfall does not deteriorate when DAFs for T=2 years are used instead of those for T=100 years, although the former can already be estimated on the basis of relatively short time series.

Consequently, the DAF approach provides a solution for deriving design rainfall for short durations and high return periods in regions where long observed daily precipitation time series are available, but only short high-resolution precipitation records exist, which is the case in most regions worldwide.

How to cite: Müller-Thomy, H., Groth, G., Sánchez Martínez, S. A., Arganis Juárez, M. L., and Schröter, K.: Generation of high-resolution design rainfall using duration adjustment factors , EGU General Assembly 2026, Vienna, Austria, 3–8 May 2026, EGU26-2939, https://doi.org/10.5194/egusphere-egu26-2939, 2026.

EGU26-3612 | ECS | Posters on site | HS7.2

A stochastic approach for the continuous simulation of ordinary and extreme precipitation in Alpine environments 

Beatrice Carlini, Simon Michael Papalexiou, Gianluca Botter, and Francesco Marra

Predicting the impacts of climate change on hydroclimatic processes in small mountainous catchments requires long and realistic high-temporal-resolution simulations of key environmental variables, particularly precipitation, under future scenarios. Stochastic models provide an effective way to generate multi-decadal projections, but existing approaches struggle to reproduce the alternation of weather systems and sub-hourly extremes. We propose a stochastic framework that accurately describes both ordinary and extreme precipitation events, explicitly links intermittency with event inter-arrival characteristics, and represents different storm types (e.g., convective and stratiform). Our approach combines CoSMoS, which generates stochastic time series preserving probability distributions and correlation structures, with concepts from TENAX, which relates the occurrence frequency and the probability distribution of extreme precipitation to near-surface temperature. Climate change impacts are incorporated through projected changes in temperature distributions and large-scale weather patterns from regional climate models. The method is tested on the Rio Valfredda, a small Alpine catchment in the eastern Italian Alps. The sub-hourly resolution of the framework allows explicit representation of convective precipitation, a key driver of extreme events in Alpine environments.

How to cite: Carlini, B., Papalexiou, S. M., Botter, G., and Marra, F.: A stochastic approach for the continuous simulation of ordinary and extreme precipitation in Alpine environments, EGU General Assembly 2026, Vienna, Austria, 3–8 May 2026, EGU26-3612, https://doi.org/10.5194/egusphere-egu26-3612, 2026.

EGU26-4929 | Posters on site | HS7.2

How Reliable are Rainfall Observations? Assessing Credible Intervals with Bilinear Surface Smoothing 

Nikolaos Malamos, Theano Iliopoulou, Panagiotis D. Oikonomou, and Demetris Koutsoyiannis

Rainfall regionalization refers to a broader spatial modeling process that transforms point measurements into reliable continuous fields, incorporating additional information.  Yet the fidelity of the resulting continuous surface is strongly influenced by the quality of the underlying data, as well as by the density and spatial configuration of the observational network. This contribution addresses the question of how reliable rainfall data are when evaluated against a regionalized rainfall surface, by extending the Bilinear Surface Smoothing with Explanatory variable (BSSE) framework to explicitly incorporate Bayesian credible intervals.

The proposed formulation exploits the linear smoother representation of BSSE to derive the posterior covariance of the fitted bilinear surface as a function of residual variance and effective degrees of freedom. Credible intervals are obtained analytically, allowing uncertainty in variance estimation to be accounted for without resampling. Beyond quantifying uncertainty in the spatial estimates, the credible intervals provide a diagnostic measure of data reliability relative to the regionalized signal.

The extended framework is demonstrated through the regionalization of average and extreme rainfall characteristics across Greece, using ground-based observations together with elevation as explanatory variable. Stations falling outside the 95% credible interval are identified and examined, revealing that such cases frequently occur in areas with sparse gauge coverage or complex rainfall regimes. These locations highlight regions where the observational network provides limited support to the regionalized surface, leading to increased uncertainty and reduced confidence in the available data.

The analysis further reveals a strong dependence of uncertainty on temporal aggregation scale, with markedly wider credible intervals at sub-daily extremes, where station density is lowest. The BSSE methodology is implemented in a fully reproducible workflow, facilitating straightforward application of the proposed uncertainty-aware regionalization framework to other hydro-climatic datasets.

How to cite: Malamos, N., Iliopoulou, T., Oikonomou, P. D., and Koutsoyiannis, D.: How Reliable are Rainfall Observations? Assessing Credible Intervals with Bilinear Surface Smoothing, EGU General Assembly 2026, Vienna, Austria, 3–8 May 2026, EGU26-4929, https://doi.org/10.5194/egusphere-egu26-4929, 2026.

EGU26-5978 | ECS | Orals | HS7.2

Understanding the Role of Adversarial Learning in Precipitation Super-Resolution Through Explainable AI 

Shivam Singh, Simon M. Papalexiou, Hebatallah M. Abdelmoaty, Tom Hartvigsen, and Antonios Mamalakis

High-resolution precipitation information is essential for hydrological impact assessment, flood risk analysis, and the characterization of extreme events, yet climate and weather model outputs are typically available at spatial resolutions too coarse to resolve fine-scale variability. Deep-learning-based statistical downscaling has emerged as an effective approach for bridging this resolution gap; however, models trained with pixel-wise objectives often suppress spatial variability and underestimate extremes. Adversarial learning has been shown to improve the realism of downscaled precipitation fields, particularly for extreme events, but the mechanisms through which adversarial objectives influence model behavior remain insufficiently understood. In this study, we investigate how adversarial training modifies the internal representation of precipitation extremes within a super-resolution downscaling framework, using explainable artificial intelligence (XAI) as a diagnostic tool. We employ a unified U-Net architecture trained under two optimization strategies: (i) a deterministic formulation using a pixel-wise mean-squared-error loss, and (ii) an adversarial formulation in which the same U-Net generator is trained jointly with a critic through an adversarial loss. This controlled design isolates the effects of adversarial learning while holding architecture and input information constant. XAI techniques are applied to analyze differences in spatial sensitivity and attribution patterns between the two training regimes, with particular emphasis on extreme precipitation events. Rather than serving as a performance metric, XAI is used to interrogate how adversarial training reshapes the model’s reliance on spatial structure and localized variability. This work highlights the potential of XAI to provide mechanistic insight into generative downscaling models and to support more transparent evaluation of adversarial approaches for extreme precipitation.

How to cite: Singh, S., Papalexiou, S. M., Abdelmoaty, H. M., Hartvigsen, T., and Mamalakis, A.: Understanding the Role of Adversarial Learning in Precipitation Super-Resolution Through Explainable AI, EGU General Assembly 2026, Vienna, Austria, 3–8 May 2026, EGU26-5978, https://doi.org/10.5194/egusphere-egu26-5978, 2026.

EGU26-6160 | Posters on site | HS7.2

Temporal Downscaling Using Deep Learning for Sub-hourly Time Series 

Soobin Cho, Sangbeom Jang, Jiyeon Park, and Ju-young Shin

Recent climate change has been linked to more frequent and more intense short-timescale rainfall extremes, increasing exposure to urban pluvial flooding. Because many urban catchments respond within minutes, rainfall information at sub-hourly resolution is often needed for hydrologic analyses. An AI-driven temporal downscaling approach is introduced here to derive 10-minute rainfall series from hourly observations using a conditional diffusion generative model. Rain-gauge observations at Seoul Gwanaksan (#1917), operated by the Korea Forest Service, were used. The record covers the years 2015 through 2024. Paired hourly totals and observed 10-minute series were prepared to examine whether sub-hourly rainfall sequences can be reconstructed from hourly totals while preserving realistic within-hour variability. The feasibility of loss function variation was investigated. The experiments indicate that incorporating distributional and temporal statistics into the objective function can enhance the realism of sub-hourly rainfall structure under hourly constraints. The proposed framework is expected to provide more reliable 10-minute rainfall inputs for urban hydrologic analyses and pluvial-flood–relevant applications in rapid-response catchments.

How to cite: Cho, S., Jang, S., Park, J., and Shin, J.: Temporal Downscaling Using Deep Learning for Sub-hourly Time Series, EGU General Assembly 2026, Vienna, Austria, 3–8 May 2026, EGU26-6160, https://doi.org/10.5194/egusphere-egu26-6160, 2026.

EGU26-6400 | Posters on site | HS7.2

SEEPS4ALL: all you need to compute SEEPS (and more) when evaluating daily precipitation forecasts over Europe  

Zied Ben Bouallègue, Ana Prieto-Nemesio, Angela Iza Wong, Florian Pinault, Marlies van der Schee, and Umberto Modigliani

SEEPS4ALL [1] combines a precipitation dataset in a Zarr format and a set of verification Jupyter Notebooks for the evaluation of daily precipitation forecasts over Europe. The dataset is primarily based on daily in-situ observations from the European Climate Assessment & Dataset project (www.ecad.eu). Climate statistics are derived from long time series at each station location to enable the computation of meaningful verification metrics. For example, the Stable and Equitable Error in Probability Space (SEEPS [2]) is a score specifically designed to assess the performance of precipitation forecasts, and it requires climate statistics.

The verification notebooks showcase the computation not only of SEEPS but also of the diagonal score (the equivalent of SEEPS for probabilistic forecasts) and of the brier score as a function of climate percentiles. Finally, when comparing a gridded forecast and a point observation, one can account for observation representativeness uncertainty by dressing the forecast with pre-defined scale-dependent parametric distributions [3]. In a nutshell, SEEPS4ALL helps promote the benchmarking of daily precipitation forecasts against in-situ observations over Europe.


[1] Ben Bouallègue Z, A. Prieto-Nemesio, A.I. Wong, F. Pinault, M. van der Schee, and U. Modigliani (2025), SEEPS4ALL: an open dataset for the verification of daily precipitation forecasts using station climate statistics. Earth System Science Data, https://doi.org/10.5194/essd-2025-553

[2] Rodwell, M.J., D.S. Richardson, T.D. Hewson and T. Haiden (2010), A new equitable score suitable for verifying precipitation in numerical weather prediction. Q.J.R. Meteorol. Soc., https://doi.org/10.1002/qj.656

[3] Ben Bouallègue, Z., T. Haiden, N. J. Weber, T. M. Hamill, and D. S. Richardson (2020), Accounting for Representativeness in the Verification of Ensemble Precipitation Forecasts. Mon. Wea. Rev., https://doi.org/10.1175/MWR-D-19-0323.1

How to cite: Ben Bouallègue, Z., Prieto-Nemesio, A., Wong, A. I., Pinault, F., van der Schee, M., and Modigliani, U.: SEEPS4ALL: all you need to compute SEEPS (and more) when evaluating daily precipitation forecasts over Europe , EGU General Assembly 2026, Vienna, Austria, 3–8 May 2026, EGU26-6400, https://doi.org/10.5194/egusphere-egu26-6400, 2026.

EGU26-7614 | ECS | Orals | HS7.2

Optical Flow with Recurrent All-Pairs Field Transform (RAFT) for weather radar nowcasting 

Janni Mosekær Nielsen, Michael Robdrup Rasmussen, Søren Thorndahl, Ida Kemppinen Vester, Malte Kristian Skovby Ahm, and Jesper Ellerbæk Nielsen

Weather radar nowcasting is a crucial technique in real-time urban hydrological applications, as weather radars provide spatially distributed rainfall measurements. Uncertainties in weather radar nowcasting stemming from errors in rainfall observations, motion field estimates, and rainfall evolution predictions are, however, inevitable. In this study, we implement a well-established deep learning model within computer science and image processing to estimate weather radar motion fields for nowcasting.

The deep learning model, Recurrent All-Pairs Field Transform (RAFT), developed by Teed and Deng (2020), is demonstrated to outperform several existing deep learning models for optical flow estimation. The RAFT model consists of a feature encoder that extracts features from consecutive images, a correlation layer that computes visual similarities, and a recurrent unit that iteratively updates the estimated flow field. The method is computationally efficient and highly accurate, making it relevant in real-time applications. Due to the similarities between image processing and weather radar rainfall nowcasting, the method has the potential to produce accurate motion fields for extrapolating weather radar rainfall.

In this study, three years of observation data from a Danish C-band weather radar are used to nowcast 51 rainfall events. The rainfall events consist of both linear and non-linear rainfall pattern motions. We systematically compare weather radar rainfall forecasted with Lagrangian persistence using six different motion field approaches: Global vector, COTREC (Li et al., 1995), VET (Variational Echo Tracking; Germann and Zawadski, 2002), Lucas-Kanade (Lucas and Kanade, 1981), DARTS (Dynamic and Adaptive Radar Tracking of Storms; Ruzanski et al., 2011), and RAFT.

The optical flow with RAFT is shown to statistically perform as well as the well-established methods VET and Lucas-Kanade and to outperform the global vector, COTREC, and DARTS. It is demonstrated that RAFT produces accurate and robust motion fields for both linear and non-linear rainfall motion. Thus, the RAFT model for optical flow estimation is shown to be highly relevant for weather radar nowcasting in urban hydrological applications.

References:

Germann, U., Zawadzki, I., 2002. Scale-Dependence of the Predictability of Precipitation from Continental Radar Images. Part I: Description of the Methodology. Mon Weather Rev 130, 2859–2873. https://doi.org/10.1175/1520-0493(2002)130<2859:SDOTPO>2.0.CO;2

Li, L., Schmid, W., Joss, J., 1995. Nowcasting of Motion and Growth of Precipitation with Radar over a Complex Orography. J Appl Meteorol Climatol 34, 1286–1300. https://doi.org/10.1175/1520-0450(1995)034<1286:NOMAGO>2.0.CO;2

Lucas, B.D., Kanade, T., 1981. An iterative image registration technique with an application to stereo vision, in: IJCAI’81: 7th International Joint Conference on Artificial Intelligence. pp. 674–679

Ruzanski, E., Chandrasekar, V., Wang, Y., 2011. The CASA nowcasting system. J Atmos Ocean Technol 28, 640–655. https://doi.org/10.1175/2011JTECHA1496.1

Teed, Z., Deng, J., 2020. Raft: Recurrent all-pairs field transforms for optical flow, in: European Conference on Computer Vision. pp. 402–419

How to cite: Nielsen, J. M., Rasmussen, M. R., Thorndahl, S., Vester, I. K., Ahm, M. K. S., and Nielsen, J. E.: Optical Flow with Recurrent All-Pairs Field Transform (RAFT) for weather radar nowcasting, EGU General Assembly 2026, Vienna, Austria, 3–8 May 2026, EGU26-7614, https://doi.org/10.5194/egusphere-egu26-7614, 2026.

EGU26-7647 | ECS | Posters on site | HS7.2

Temporal Downscaling of ICON Precipitation from Hourly to 10‑Minute Resolution Using a Physically Constrained U-NET 

Midhuna Thayyil Mandodi, Caroline Arnold, Keil Paul, David Greenberg, Beate Geyer, and Stefan Hagemann

 The availability of high temporal resolution precipitation data is essential for understanding sub‑hourly hydrometeorological processes, extreme rainfall, and their impacts on hydrology and urban flooding. Especially with respect to climate change where precipitation extremes are expected to enlarge a profound data base is needed as an ensemble of downscaled climate scenarios. To store meteorological fields with high resolution in time and space is very resource demanding. The standard EURO-CORDEX dataset includes hourly precipitation data. For impact modellers however it is important to get data for the extreme events with higher resolution in time. In this study, we present a deep‑learning‑based framework to temporally downscale hourly ICON precipitation to 10‑minute resolution using a convolutional U‑Net architecture.

The source data consist of two input images corresponding to 1-hour accumulated precipitation fields. The target data are 10-minute precipitation fields derived from ICON simulations. The model is trained and evaluated over the following periods: 1980–1994 for training, 1995–1997 for validation, and 1998–1999 for testing. The model learns a mapping from the source data to the corresponding sequences of 10-minute precipitation. The U‑Net is trained to reconstruct the temporal distribution of rainfall within each hour while conserving the total hourly precipitation amount. We test the enforcement of conservation of total hourly precipitation with different techniques: a penalty term in the loss function, a constraint layer embedded into the architecture and conservation through a post-processing routine.

Model performance is evaluated using multiple statistical metrics to assess both the distribution and magnitude of precipitation. The histograms of predicted and target 10‑minute precipitation indicate that the model reproduces the marginal distribution well, while the scatter plot of total predicted versus total target precipitation summed over all grid cells and time steps shows that the model closely preserves the overall accumulated rainfall. Results also demonstrate that the U‑Net with the conservation enforcing constraint layer successfully reproduces sub‑hourly precipitation variability and captures the timing and intensity of short‑duration rainfall events more accurately than simple temporal disaggregation approaches.

This work highlights the potential of machine learning for efficient temporal downscaling of regional climate model outputs. The ultimate goal is to provide a tool for impact modelers to produce high-resolution precipitation data on their own demand . This framework has the potential to support applications in future warming scenarios. Since interested researchers can run the temporal downscaling model for their period of interest, there is no need for large memory resources to store precipitation datasets with a very high temporal resolution.


How to cite: Thayyil Mandodi, M., Arnold, C., Paul, K., Greenberg, D., Geyer, B., and Hagemann, S.: Temporal Downscaling of ICON Precipitation from Hourly to 10‑Minute Resolution Using a Physically Constrained U-NET, EGU General Assembly 2026, Vienna, Austria, 3–8 May 2026, EGU26-7647, https://doi.org/10.5194/egusphere-egu26-7647, 2026.

EGU26-7985 | ECS | Orals | HS7.2

Sensitivity of Microphysical Parameters in the Thompson Scheme Using Idealized WRF Simulations 

Eulàlia Busquets, Stefano Serafin, Mireia Udina, and Joan Bech

In numerical weather prediction models, microphysics schemes represent water vapor, cloud, and precipitation processes. These schemes rely on fixed parameters that are inherently uncertain or known to vary in space and time, such as the densities of snow and graupel. Inaccurate specification of these parameters leads to errors in the partitioning of surface precipitation into liquid and ice phases. To assess the sensitivity of model results to these parameters, in this study the Weather Research and Forecast (WRF) model version 4.5 was used to perform a set of idealized two-dimensional simulations of wintertime stable orographic precipitation. The design of the experiment was inspired by observations made on 25 and 26 October 2024 on the southern slope of the Pyrenees. The model configuration includes a mountain centered in the domain with a height of 1500 m and a half-width of 10 km, a horizontal grid spacing of 1 km, and 200 vertical levels. Microphysical processes are parameterized with the Thompson scheme, which is characterized by a special snow treatment that includes snow-size distribution dependence on ice water content and temperature, and a nonspherical shape of snow particles.

Model sensitivity was assessed by running-ensemble simulations, which were created by varying 6 empirical parameters of the microphysical scheme: the exponent a in the snow mass–size relation (aₘₛ), graupel density (ρg), the shape parameter of the gamma particle size distribution for rain (μr), snow (μs), and graupel (μg), and the coefficient controlling the conversion of rimed snow to graupel (rsg). Two sets of experiments were conducted. First, 6 single-parameter perturbation experiments were run, each one with 64 members. Second, a multi-parameter perturbation experiment with 1024 members in which all parameters were perturbed simultaneously. Preliminary results indicate that cloud and snow species exhibit the strongest response to single-parameter perturbations, with particularly high sensitivity to aₘₛ and μs. Specifically, increasing aₘₛ leads to snow at higher altitudes (5000–6000 m), while increasing μs lowers the melting layer to approximately 3000 m.

This research has been funded by projects ARTEMIS (PID2021-124253OB-I00), LIFE22-IPC-ES-LIFE PYRENEES4CLIMA and the Institute for Water Research (IdRA) of the University of Barcelona.

How to cite: Busquets, E., Serafin, S., Udina, M., and Bech, J.: Sensitivity of Microphysical Parameters in the Thompson Scheme Using Idealized WRF Simulations, EGU General Assembly 2026, Vienna, Austria, 3–8 May 2026, EGU26-7985, https://doi.org/10.5194/egusphere-egu26-7985, 2026.

Downscaling of rainfall time series is the process of transforming rainfall data from a coarse temporal resolution (e.g., daily or hourly totals) into finer time scales (e.g., minutes) while preserving key statistical and physical characteristics of the original data. Downscaling techniques are widely used in hydrology, urban drainage design, flood modeling, and climate impact studies where fine-resolution rainfall data are essential for simulating hydrological response and studying the impact of extreme rainfall events.

Numerous stochastic downscaling approaches have been proposed in the literature, including point process models, random cascades, Markov chains, and weather generators, each designed to reproduce specific rainfall characteristics such as intermittency, intensity distributions, and temporal dependence. However, these methods are typically developed and evaluated independently, often using different datasets and climates, which makes it hard to assess their relative strengths and limitations.

This study presents the first joint and systematic comparison of two independently developed, state-of-the-art stochastic rainfall downscaling methods based on random cascades. Specifically, the Standard and Blunt extension cascades derived from the Universal Multifractal (UM) theory are compared with the Equal-Depth Area (EDA) approach. The methods are applied to 300 high-resolution (1-minute) rainfall events in the Netherlands and France, using increasingly challenging downscaling ratios of 4, 16, and 64. The raw data was collected with the help of optical disdrometers (OTT Parsivel2) located at three different sites.

We analyze (i) the estimation and selection of cascade generator models and their impact on performance going from event based to climatic average key parameters, (ii) the statistical properties of the downscaled rainfall time series across scales, events and cascade types, using both standard scores, quantile comparison and Universal Multifractal analysis and (iii) the relative strengths and limitations of each method in terms of ensemble spread, temporal dependence structure and extreme rainfall reproduction. By jointly evaluating multiple methods on identical datasets, we aim to advance the science behind stochastic rainfall disaggregation and lay the foundation for further model refinements and application-driven method selection.

How to cite: Schleiss, M. and Gires, A.: One Dataset, Multiple Cascades: Insights from a Joint Evaluation of Stochastic Rainfall Downscaling Methods in France and the Netherlands, EGU General Assembly 2026, Vienna, Austria, 3–8 May 2026, EGU26-9128, https://doi.org/10.5194/egusphere-egu26-9128, 2026.

EGU26-9227 | ECS | Posters on site | HS7.2

Characterizing Global Flood Extremeness Through Physically Informed Neural Networks 

Hsiang Hsu and Hsing-Jui Wang

The tails of flood distributions provide key insights into the occurrence probability of extreme floods, which is commonly quantified by the shape parameter of an empirical Generalized Extreme Value (GEV) distribution fitted to annual maximum flood series. Despite the usefulness of fitting empirical GEV distributions to observations, considerable uncertainty remains in the estimated shape parameter across different parameter estimation approaches. In addition, most existing studies focus on regional scales, and a global-scale analysis is required to investigate the roles of varying climatic conditions and data quality in shaping extreme flood occurrence.

In this study, we first apply the L-moment method—an approach known for its robustness in extreme value statistics— to conduct a global analysis of extreme flood occurrence based on optimized GEV distributions. The Anderson–Darling test is used to evaluate the goodness-of-fit. We then integrate additional hydrological information, represented by up to 20 descriptors, into a supervised neural network (NN) model to construct a physically informed, data-driven framework for improving the estimation of GEV distribution parameters. A global-scale dataset comprising more than 6,600 river gauges, with record lengths ranging from 20 to 200 years, is used in this analysis.

Preliminary results indicate that the proposed framework can achieve flood distribution tail estimates comparable to those obtained from purely statistical methods (i.e., L-moment estimates), while providing additional physical insights into the estimation process. Overall, this study highlights the potential of integrating multi-dimensional common hydrological descriptors within a data-driven framework to support large-scale and consistent characterization of global flood extremeness.

How to cite: Hsu, H. and Wang, H.-J.: Characterizing Global Flood Extremeness Through Physically Informed Neural Networks, EGU General Assembly 2026, Vienna, Austria, 3–8 May 2026, EGU26-9227, https://doi.org/10.5194/egusphere-egu26-9227, 2026.

EGU26-9981 | ECS | Posters on site | HS7.2

Mitigating Checkerboard Artifacts for Enhanced Precipitation Nowcasting: A Comparison of Upsampling Techniques 

Jiseong Lim, Yong Oh Lee, and Dongkyun Kim

In the field of precipitation nowcasting, the application and advancement of deep learning techniques have enabled resource-efficient predictions. In particular, U-Net variants and attention-based architectures achieve computational reduction by extracting features with wide receptive fields through downsampling and upsampling processes. However, upsampling methods can induce checkerboard artifacts when spatially adjacent pixels in high-resolution feature maps are computed from different low-resolution pixels, resulting in overlooked dependencies compared to those derived from identical pixels. This leads to discrepancies with the ground truth patterns, ultimately degrading the performance of prediction models. This paper introduces upsampling techniques known to prevent checkerboard artifacts in the super-resolution domain into precipitation prediction models, aiming to improve performance while minimizing increases in model complexity. At the upsampling stage, we incorporate sub-pixel convolution or decouple the upsampling and channel reduction processes, comparing performance against models using transposed convolution, the standard upsampling approach in U-Net. Additionally, the Checkerboard Artifacts Score (CAS) is proposed to quantify the degree of checkerboard artifacts in images, which is applied to each model for analysis. CAS is defined as the ratio of errors between pixels forming artifact boundaries to errors between all adjacent pixels. In experiments, sub-pixel convolution and the combination of nearest neighbor or bilinear interpolation with subsequent convolution record lower CAS values than transposed convolution, while also demonstrating improved performance across metrics including NSE, CSI, and RMSE. Notably, sub-pixel convolution exhibits pronounced performance with balanced POD and FAR, while the bilinear approach generates spatially natural patterns with competitive performance. Analysis of the experimental results suggests that the reduction of checkerboard artifacts contributes to performance improvement. Furthermore, this work highlights the importance of upsampling method selection in video prediction tasks and provides practical guidance for model design.

How to cite: Lim, J., Lee, Y. O., and Kim, D.: Mitigating Checkerboard Artifacts for Enhanced Precipitation Nowcasting: A Comparison of Upsampling Techniques, EGU General Assembly 2026, Vienna, Austria, 3–8 May 2026, EGU26-9981, https://doi.org/10.5194/egusphere-egu26-9981, 2026.

EGU26-10004 | ECS | Posters on site | HS7.2

A Hybrid Bias-Correction Framework for Extreme Precipitation in Convection-Permitting Models 

Petr Vohnicky, Eleonora Dallan, Francesco Marra, and Marco Borga

Convection-permitting models (CPMs) better represent sub-daily precipitation than coarser models, but they still exhibit substantial biases in low probability occurrence extremes, with elevation-dependent patterns. In addition, the relatively short simulation periods, typically around 10 years, limit the robust estimation of rare events. This constrains the direct use of raw CPM output for applications that depend on extreme-value statistics. To address these limitations, this study introduces a hybrid bias-correction framework for CPM precipitation that targets hourly resolution.

The proposed method combines non-parametric and parametric components within an elevation-based pooling strategy. Stations and co-located CPM grid cells are grouped into elevation bands, and a common, monthly varying correction is estimated for each band to represent both spatial and seasonal variability. Low-to-moderate precipitation intensities are corrected using robust empirical quantile mapping. The upper tail is adjusted using an optimized Weibull tail model with left censoring, inspired by the Simplified Metastatistical Extreme Value approach. The optimal threshold is searched within the 0.8 to 0.97 quantile range using an adjusted Weibull tail test.

Model performance is evaluated using both extreme-value and distributional metrics derived from observations, raw CPM output, and bias-corrected series. Extreme behavior is assessed through 20-year return levels of 1-hour and 24-hour precipitation. Distributional performance is quantified using mean absolute bias computed over empirical quantiles, allowing improvements to be tracked across the full range of precipitation intensities.
Robustness is examined through a structured validation framework. Spatial robustness is tested by evaluating the elevation-based pooling approach using k-fold schemes in which subsets of stations are withheld from calibration. Temporal robustness is assessed through repeated cross-validation on the 10-year CPM slices, with six years randomly assigned to calibration and four years to validation.

Preliminary results show a reduction in mean absolute bias after correction, largely driven by an improved representation of the wet-hour ratio. When a minimum rainfall threshold is applied to the raw CPM data, the bias becomes comparable to that of the bias-corrected output, indicating that drizzle remains a key issue. For extremes, biases in 1-hour 20-year return levels generally decrease but are not fully eliminated, reflecting the large uncertainty in the distribution upper tail. For 24-hour 20-year return levels, results are mixed: biases are reduced for some CPMs but introduced or amplified for others, highlighting model-specific differences in the spatial characteristics of storm structure and organization. The validation indicates that the elevation-based pooling yields spatially robust corrections for sufficiently small, climatically homogeneous domains, while the assessment of temporal robustness remains inconclusive due to the limited length of the available 10-year CPM simulations.

How to cite: Vohnicky, P., Dallan, E., Marra, F., and Borga, M.: A Hybrid Bias-Correction Framework for Extreme Precipitation in Convection-Permitting Models, EGU General Assembly 2026, Vienna, Austria, 3–8 May 2026, EGU26-10004, https://doi.org/10.5194/egusphere-egu26-10004, 2026.

EGU26-12352 | Posters on site | HS7.2

On the limitations of interchangeability between canonical and microcanonical multiplicative cascade models 

Alin Andrei Carsteanu, Stergios Emmanouil, Roberto Deidda, Anastasios Perdios, César Aguilar-Flores, and Andreas Langousis

Being the most widely used generators of multifractal measures, multiplicative cascade models have been extensively applied in the field of geophysics, and particularly in hydrometeorology. As in any modeling effort, solving the "inverse problem" is essential, and in this case, it can be described as finding the appropriate cascade model that generates a given multifractal measure. Direct measurement of a generated field (e.g., a rainfall field, or a time series thereof) results in an immediate decomposition into breakdown coefficients,  producing a microcanonical (strictly normalized) multiplicative cascade over a limited range of scales. Yet, the canonical (expectation-normalized) phenomenology at underlying scales may generate statistical properties that are non-trivial to reproduce. The present work analyzes such properties for the simplified case of a one-dimensional, beta-lognormal discrete multiplicative cascade.

How to cite: Carsteanu, A. A., Emmanouil, S., Deidda, R., Perdios, A., Aguilar-Flores, C., and Langousis, A.: On the limitations of interchangeability between canonical and microcanonical multiplicative cascade models, EGU General Assembly 2026, Vienna, Austria, 3–8 May 2026, EGU26-12352, https://doi.org/10.5194/egusphere-egu26-12352, 2026.

EGU26-13895 | Posters on site | HS7.2

A new daily gridded precipitation dataset for the island of Ireland 

Mojolaoluwa Daramola, Conor Murphy, and Peter Thorne

Reliable high-resolution precipitation datasets are essential for climate analysis, hydrological modelling, and the assessment of climate extremes. Many existing gridded rainfall products are limited by national boundaries, making it difficult to carry out consistent regional-scale climate and hydrological assessments across the island of Ireland. Here, we present a new daily gridded rainfall product developed using a homogenous methodology across the entire island of Ireland. The dataset covers the period 1980-2020 and is based on rain gauge observations from Met Éireann and UK Met Office. The gridded product is generated using a high-resolution climatological interpolation framework based on inverse distance weighting (IDW) regression, with elevation included as a covariate. This approach allows the dataset to capture fine-scale spatial variability associated with orography, while preserving daily variability and extreme rainfall events. The daily grids are first produced at 1km x 1km resolution and then resampled to a common 0.1deg x 0.1deg resolution for comparison with other gridded datasets. To assess the quality of the product, we first validate the gridded rainfall estimates using observations from a crowd-sourced citizens rain gauges from the weather observation website, providing independent evaluation of the dataset. We then evaluate the dataset through grid-to-grid comparisons with Met Éireann daily grids and other widely used regional products such as E-OBS and Multi-Source Weighted-Ensemble Precipitation (MSWEP), focusing on annual and seasonal rainfall patterns, spatial biases, and selected storm events. The new datasets provides a spatially consistent representation of daily rainfall across the island of Ireland and offers a valuable resource for climate variability studies, extreme event analysis, and hydrological applications.  

How to cite: Daramola, M., Murphy, C., and Thorne, P.: A new daily gridded precipitation dataset for the island of Ireland, EGU General Assembly 2026, Vienna, Austria, 3–8 May 2026, EGU26-13895, https://doi.org/10.5194/egusphere-egu26-13895, 2026.

EGU26-15328 | Orals | HS7.2

A framework for benchmarking precipitation type classifiers used in weather and climate models  

Ali Nazemi, Ramin Ahmadi, and Amin Hammad

Diagnosing precipitation type (ptype) is a major source of uncertainty in hydroclimatological applications. We propose a systematic framework for benchmarking the algorithms used for identifying ptype in numerical weather predictors and climate models. Six widely-used ptype algorithms, proposed by Derouin (1973), Cantin & Bachand (1993), Baldwin & Contorno (1993), Ramer (1993), Bourgouin (2000), and the European Centre for Medium-Range Weather Forecasts (ECMWF, 2024), are considered over a box region in north eastern North America with Montreal at its center. The benchmarking is made using hourly data collected at 25 Automated Surface Observing Systems during the period of 2007 to 2024. All ptype algorithms are fed by ERA5 single- and pressure-level climate reanalysis fields at 0.25° resolution. We consider four skills for benchmarking: (1) efficiency at the local scale, (2) temperature conditioning at the regional scale, as well as (3) spatial, and (4) spatiotemporal coherences. For assessing the efficiency at the local scale, we use three measures of precision, recall and F1-score that reveal how modeled ptypes are compared with observed ones at each station. For regional temperature conditioning, we extract probabilities of ptypes conditioned to near-surface temperature and compare the observed and modeled conditional density function using Kolmogorov–Smirnov test and the Wasserstein-1 (W1) distance. For both spatial and spatiotemporal coherences, we consider probabilities of co-occurrence and the Jaccard similarity index at the 0-hour time lag (spatial) and 1–48-hour lags (spatiotemporal) and quantify agreements between modeled and observed ptypes using F1-score. Our results show the excessive weakness of current ptypes algorithms in distinguishing rare and high impacts ptypes, such as freezing rain and ice pellets. Temperature conditioning show that rain, freezing rain, and ice pellets are frequently shifted toward colder regimes with W1 reaching up to 8.3 °C.  While rain classification shows moderate spatial realism, the skills in snow and freezing rain are substantially weaker. When temporal structure is added, the coherence is declined even further, with Bourgouin (2000) standing out among other algorithms with F1-score reaching to 0.5 for freezing rain and 0.61 for other/mixed types.  Our findings are a call for improving ptype algorithms in weather and climate models, particularly for predicting rare but high impact ptypes.

How to cite: Nazemi, A., Ahmadi, R., and Hammad, A.: A framework for benchmarking precipitation type classifiers used in weather and climate models , EGU General Assembly 2026, Vienna, Austria, 3–8 May 2026, EGU26-15328, https://doi.org/10.5194/egusphere-egu26-15328, 2026.

Remote sensing technology is essential for real-time monitoring of spatiotemporal precipitation patterns. However, inherent limitations in indirect observation lead to significant errors in satellite-based precipitation products. Most existing correction methods depend on real-time ground observations, which limits their applicability for high-precision, operational use. To address this, we propose a two-stage synergistic correction framework specifically for the Global Satellite Mapping of Precipitation Near Real-Time product (GSMaP-NRT), with the goal of systematically enhancing the accuracy of its daily-scale estimates worldwide. Central to this framework is the Terrain-aware Two-stage Correction Framework (TTCF-NRT). In the first stage (historical modeling and real-time correction), we jointly utilize historical GSMaP-NRT and CPC merged precipitation data to train an improved Cumulative Distribution Function (CDF) matching model. Once trained, the model operates independently, requiring only real-time GSMaP-NRT data to perform rapid correction without needing concurrent CPC or ground-based inputs. In the second stage (near-real-time spatial refinement), we integrate the contemporaneous CPC product as a spatial reference into the first-stage corrected output. An improved Convolutional Neural Network (CNN) model, trained and validated through rigorous cross-validation, is then applied for spatial enhancement. This step significantly improves the characterization of precipitation spatial distribution, especially over complex terrain. Using the TTCF-NRT framework, we produced a daily corrected precipitation dataset for global land areas from 2020 to 2024 at a 0.5° spatial resolution. Comprehensive evaluation shows that: (1) globally, the TTCF-RT product significantly outperforms both the original GSMaP-NRT and its gauge-adjusted version (GSMaP-Gauge-NRT) in terms of Root Mean Square Error (RMSE) and Relative Bias (BIAS); (2) regionally, TTCF-NRT excels over the Continental United States (CONUS) and Western Europe. It also demonstrates consistent improvement at independent validation sites across China, though performance can still be enhanced, partly due to the limited spatial representativeness of the training data. In summary, the TTCF-NRT framework effectively combines historically calibrated real-time CDF correction with CNN-driven near-real-time spatial fusion. It offers an efficient, robust, and operationally viable correction solution for GSMaP-NNRT that does not rely on real-time external data. This approach substantially improves the accuracy and practical utility of satellite-derived precipitation estimates on a global scale, particularly in regions with complex topography.

How to cite: Wu, H.: A Terrain-Aware Two-Stage Correction Framework for Near-Real-Time Improvement of GSMaP-NRT Precipitation Estimates, EGU General Assembly 2026, Vienna, Austria, 3–8 May 2026, EGU26-15630, https://doi.org/10.5194/egusphere-egu26-15630, 2026.

EGU26-15956 | Orals | HS7.2

Spatial-temporal modelling of convective storms with temperature-conditioned convective cell lifecycles 

Li-Pen Wang, Chien-Yu Tseng, and Christian Onof

Stochastic convective storm generators are widely used for hydrological and climate-impact applications; however, most existing methods suffer from two fundamental limitations. First, once a convective cell is sampled, its properties are typically assumed to remain constant throughout its lifetime, neglecting the intrinsic evolution of cell intensity, size, and structure during growth and decay. Second, storm events are commonly generated by repeatedly sampling cell properties from fixed distributions, which limits inter-event variability and prevents systematic modulation of storm characteristics by large-scale weather or climate conditions, despite growing evidence that convective cell properties depend on variables such as near-surface temperature.

To address these limitations, this study develops a spatial–temporal convective storm generator that explicitly represents the lifecycle evolution of individual convective cells and its dependence on temperature. Storm arrivals are described using a point-process formulation, while individual storms are modelled as clusters of rainfall cells whose intensity and geometric properties evolve dynamically through time. The temporal evolution of cell properties is governed by a copula-based lifecycle model, within which key statistical parameters are conditioned on near-surface temperature using a regression-based model. Although the temperature dependence is introduced at the level of individual cell evolution, it propagates through the generator to influence storm-scale structure and inter-event variability.

The model is calibrated using 167 convective storm events observed over the Birmingham region (UK) between 2005 and 2017, identified and tracked with a state-of-the-art storm-tracking algorithm that provides detailed information on cell tracks and physical properties, including rainfall intensity, spatial extent, lifetime, storm duration, and motion. Results show that the proposed generator more realistically reproduces observed intra-event evolution, storm-to-storm variability, and extreme rainfall behaviour than conventional generators based on stationary cell assumptions. The resulting temperature-dependent storm generator offers a computationally efficient and physically consistent alternative to convection-permitting models for applications requiring large ensembles of convective rainfall realisations.

How to cite: Wang, L.-P., Tseng, C.-Y., and Onof, C.: Spatial-temporal modelling of convective storms with temperature-conditioned convective cell lifecycles, EGU General Assembly 2026, Vienna, Austria, 3–8 May 2026, EGU26-15956, https://doi.org/10.5194/egusphere-egu26-15956, 2026.

EGU26-16177 | ECS | Posters on site | HS7.2

Downscaling and bias-correcting satellite precipitation using a hybrid machine learning framework for flood modelling in ungauged basins. 

Hari Prakash, Pramod Soni, and Kamlesh Kumar Pandey

Hari Prakasha,  Pramod Soni b K .K Pandeyc

aResearch Scholar, Department of Civil Engineering IIT (BHU), Varanasi (U.P),221005,India,Email:hariprakash.rs.civ23@iitbhu.ac.in

bAssistant Professor,Department of Civil Engineering IIT (BHU), Varanasi(U.P),221005, India. Email: pramod.civ@iitbhu.ac.in

cAssociate Professor,Department of Civil Engineering,IIT(BHU),Varanasi(U.P),221005,India

Email: kkp.civ@iitbhu.ac.in

* Corresponding author: hariprakash.rs.civ23@iitbhu.ac.in

Accurate estimation of flood peaks in ungauged and data-scarce basins critically depends on the accuracy of rainfall inputs, still remains challenging due to the limited availability of ground observations and inherent uncertainties in satellite precipitation datas. Although datasets such as CHIRPS and GPM IMERG provide high-resolution rainfall information, their direct application in hydrological modelling is often constrained by regional bias, spatial scale mismatch, and temporal inconsistencies. Moreover, physically consistent representation of large-scale atmospheric variables is rarely incorporated in conventional bias-correction approaches.To address these limitations, this study proposes an integrated and scalable framework that combines satellite precipitation, ERA5 reanalysis variables, machine learning, and process-based hydrological modelling for flood peak estimation in ungauged basins. The framework is demonstrated over the Varuna River Basin (Varanasi, India). To resolve spatial scale mismatch, ERA5 atmospheric variables are spatially aggregated within an approximately 30 km buffer around each CHIRPS grid point prior to their use as predictors. A time-aware artificial neural network (ANN) is then developed to integrate multi-pixel GPM IMERG rainfall and aggregated ERA5 predictors, using CHIRPS as a reference dataset to generate physically informed, bias-corrected daily rainfall fields. Model robustness is ensured by systematically testing different network architectures with varying numbers of hidden neurons. The framework is implemented over more than one thousand grid cells, ensuring spatial consistency while maintaining computational efficiency.The corrected rainfall products are subsequently used to drive the SWAT hydrological model, and streamflow simulations are calibrated and validated using SWAT-CUP, with particular emphasis on reproducing peak discharge and high-flow extremes. At the daily scale, the proposed framework achieves coefficient of determination (R²) values of up to 0.76 for rainfall estimation, and leads to substantial improvements in streamflow simulation compared to uncorrected satellite rainfall, including reduced bias, improved temporal variability, and markedly enhanced simulation of flood peaks.

How to cite: Prakash, H., Soni, P., and Pandey, K. K.: Downscaling and bias-correcting satellite precipitation using a hybrid machine learning framework for flood modelling in ungauged basins., EGU General Assembly 2026, Vienna, Austria, 3–8 May 2026, EGU26-16177, https://doi.org/10.5194/egusphere-egu26-16177, 2026.

EGU26-16535 | Orals | HS7.2

Estimates of Point Rainfall Extremes from Satellite Precipitation Products: Application and bias correction in Italy 

Cesar Arturo Sanchez Peña, Francesco Marra, and Marco Marani

Reliable estimates of extreme precipitation are essential for understanding, predicting, and mitigating natural disasters. However, global-scale assessments are limited by the sparse and uneven distribution of ground-based observations. Satellite-based rainfall products provide valuable support for extreme value analysis, but their applicability is constrained by high uncertainty and coarse spatial resolution. The coarse resolution of global datasets (100–600 km² grids) prevents direct comparison with point-scale extreme value estimates, as point and area-averaged statistics differ inherently.

This study addresses this limitation by applying a downscaling approach for extreme-value statistics based on random field theory and the Metastatistical Extreme Value Distribution (MEVD). The method exploits the autocorrelation structure of precipitation fields and is applied to each product at grid cells corresponding to rain gauge locations. Six remote sensing and reanalysis (RSR) products, along with their ensemble, are evaluated using a rain gauge network in Italy.

Downscaled estimates of daily 50-year return period precipitation are compared with corresponding estimates derived from rain gauge time series, considering both individual products and their ensemble median. To further improve the accuracy of satellite maps, two bias correction techniques are applied: quantile mapping and linear regression. The final results show that the ensemble obtained from the median of the RSR products provides the best overall performance.

This research was supported by the "raINfall exTremEs and their impacts: from the local to the National ScalE" (INTENSE) project, funded by the European Union - Next Generation EU in the framework of PRIN (Progetti di ricerca di Rilevante Interesse Nazionale) programme (grant 2022ZC2522). Marco Marani was also supported by the RETURN Extended Partnership and received funding from the European Union Next-GenerationEU (National Recovery and Resilience Plan – NRRP, Mission 4, Component 2, Investment 1.3 – D.D. 1243 2/8/2022, PE0000005).

How to cite: Sanchez Peña, C. A., Marra, F., and Marani, M.: Estimates of Point Rainfall Extremes from Satellite Precipitation Products: Application and bias correction in Italy, EGU General Assembly 2026, Vienna, Austria, 3–8 May 2026, EGU26-16535, https://doi.org/10.5194/egusphere-egu26-16535, 2026.

EGU26-16977 | ECS | Posters on site | HS7.2

Scale-Aware Machine Learning for Precipitation Downscaling: Impact on Regional Applications in Europe 

Hyeonjin Choi, Quyet The Nguyen, Oldřich Rakovec, Hyungon Ryu, and Seong Jin Noh

Accurate high-resolution precipitation is critical for hydrological modelling, climate impact assessment, and flood risk analysis, yet reanalysis products like ERA5 often lack the necessary spatial detail required at regional scales. This study investigates machine learning-based super-resolution techniques for precipitation downscaling, specifically examining scale-dependency and uncertainty.

We test several downscaling strategies, including convolutional neural networks with channel‑attention mechanisms and generative diffusion models. Precipitation fields are downscaled from coarse-resolution ERA5 inputs (0.25° resolution) to finer spatial resolutions using gridded observational datasets as reference: E‑OBS (0.125°) for pan‑European evaluation and, for selected regions, higher‑resolution products such as EMO‑1 (~1 km). By considering multiple scale factors, we adopt a scale‑aware framework that quantifies how downscaling skill and the associated uncertainty in super-resolution machine learning methods vary with spatial resolution and with the choice of reference dataset.

Model evaluation combines conventional accuracy metrics with diagnostics of field structure, focusing on spatial heterogeneity, intensity‑dependent behaviour (including extremes), and robustness across seasons and climatic regimes. We also discuss how scale‑dependent changes in precipitation variability and spatial structure can inform uncertainty characterisation for machine‑learning downscaling and guide its use in regional hydrological modelling and flood‑risk assessments across Europe.

How to cite: Choi, H., Nguyen, Q. T., Rakovec, O., Ryu, H., and Noh, S. J.: Scale-Aware Machine Learning for Precipitation Downscaling: Impact on Regional Applications in Europe, EGU General Assembly 2026, Vienna, Austria, 3–8 May 2026, EGU26-16977, https://doi.org/10.5194/egusphere-egu26-16977, 2026.

EGU26-18143 | Orals | HS7.2

The sensitivity of convective precipitation in South Africa to horizontal turbulent exchange in the km-scale regional climate model REMO-NH 

Thomas Frisius, Torsten Weber, Sophie Biskop, Muhammad Fraz Ismail, and Francois Engelbrecht

This study addresses the challenges of simulating precipitation in South Africa using the convection-permitting climate model REMO-NH. In the WaRisCo project, which focuses on hydroclimatic extremes under a changing climate, a realistic representation of precipitation is essential for providing suitable forcing data for hydrological modelling. Traditional regional climate models (RCMs) with resolutions of about 11km have the limitation of not accurately reproducing extreme precipitation events such as thunderstorms. Convection-permitting RCMs (CP-RCMs) represent an alternative that offers a higher resolution and explicit simulation of convection.

For the study, the non-hydrostatic climate model REMO-NH is adopted with a resolution of about 3 km and driven by ERA5 using the double nesting technique. It enables explicit simulation of deep cumulus clouds with high vertical velocities. As entrainment of ambient air strongly influences precipitation, its representation depends critically on horizontal turbulent transfer in the model. In the standard model setup, second-order horizontal diffusion (DIFF2) takes care of this transfer. However, excessively high precipitation occurs in the autumn and winter seasons in comparison to the CHIRPS precipitation data.

A simulation with fourth order horizontal diffusion (DIFF4) reveals an even stronger precipitation bias. As an alternative to artificial diffusion, a 3D turbulence scheme has been implemented. A simulation with this scheme (TURB3D) removes this bias. Further evaluation of the results shows that the bias appears mainly for intermediate values in the frequency distribution and that the boundary layer moisture and, therefore, CAPE (convective available potential energy), are higher in the simulations with artificial horizontal diffusion. These results demonstrate that accurate treatment of 3D turbulent exchange is essential for improving convection-permitting simulations, and it will, therefore, be used for the km-scale climate projections within the WaRisCo project, which is part of the “Water Security in Africa – WASA” program.

How to cite: Frisius, T., Weber, T., Biskop, S., Ismail, M. F., and Engelbrecht, F.: The sensitivity of convective precipitation in South Africa to horizontal turbulent exchange in the km-scale regional climate model REMO-NH, EGU General Assembly 2026, Vienna, Austria, 3–8 May 2026, EGU26-18143, https://doi.org/10.5194/egusphere-egu26-18143, 2026.

EGU26-18828 | Posters on site | HS7.2

A Novel Conditional Two-Phase Framework for High-Resolution Long-Term Precipitation Reconstruction: The Case of Sicily (1951–2025) 

Antonio Francipane, Niloufar Beikahmadi, Dario Treppiedi, and Leonardo Valerio Noto

Reliable, high-resolution gridded precipitation data are nowadays indispensable for modern climate science, hydrological modeling, and engineering applications, particularly in the Mediterranean region, where sharp topographic gradients and convective dynamics drive significant spatial variability. This study presents the development of a new daily gridded precipitation dataset for Sicily at a 2-km resolution, spanning the period 1951–2025. To address the challenges of reconstructing physically plausible fields from sparse historical records, we propose a "Conditional Two-Phase Reconstruction" framework that explicitly separates rainfall occurrence from conditional magnitude.

The methodology integrates heterogeneous in-situ observational sources, merging long-term historical archives with a modern, high-density automated rain gauge network. A core innovation of this work lies in the transfer of spatial model structures and precipitation regime definitions learned from the short-term dense network to the data-scarce historical period.

The framework first models spatial intermittency (Phase I) using regime-specific Indicator Kriging to distinguish between widespread precipitation and localized convective events. Subsequently, for magnitude estimation (Phase II), the study evaluates and implements three competing approaches: Geostatistical interpolation, hybrid Regression-Kriging utilizing Generalized Additive Models (GAMs), and Machine Learning via Extreme Gradient Boosting (XGBoost). To capture non-linear atmospheric interactions, the reconstruction leverages static physiographic predictors alongside dynamic atmospheric covariates derived from ERA5 reanalysis data, including Convective Available Potential Energy (CAPE) and Vertical Integrated Moisture Flux Divergence (VIMFD). By stratifying events into hydrometeorological regimes based on spatial coverage and intensity, the proposed framework provides a transferable blueprint for climate reconstruction in complex orographic domains. Models’ performance is evaluated through comprehensive Leave-One-Out cross validation using uncertainty and prediction error metrics.

How to cite: Francipane, A., Beikahmadi, N., Treppiedi, D., and Noto, L. V.: A Novel Conditional Two-Phase Framework for High-Resolution Long-Term Precipitation Reconstruction: The Case of Sicily (1951–2025), EGU General Assembly 2026, Vienna, Austria, 3–8 May 2026, EGU26-18828, https://doi.org/10.5194/egusphere-egu26-18828, 2026.

EGU26-19062 | ECS | Posters on site | HS7.2

Diffusion model based downscaling of extreme precipitation in southern Europe 

Joshua Miller, Peter Watson, Kate Halladay, and Rachel James

Climate models produce enormous amounts of atmospheric data. However, these models often have very large spatial resolution, making hazard-scale, e.g. an individual city or catchment, forecasts based on future climate data impossible. Diffusion models (DMs) are a class of deep-learning generative models that can rapidly produce ensemble-like realisations of high-resolution weather states, allowing for uncertainty quantification. Numerous studies have demonstrated the efficacy of these models in faithfully downscaling weather variables from both observational datasets and from global climate models to regional climate models. However, little is known about how well DMs can perform when trained and evaluated on heterogeneous and multi-source datasets, and even less regarding their ability to faithfully emulate high-resolution extreme rainfall events. To evaluate this, we train a DM to emulate 0.1° by 0.1° hourly precipitation data from IMERG (satellite-based), using hourly 1° by 1° atmospheric fields from ERA5 (reanalysis) as the model’s input. We are also performing an out-of-distribution experiment in which extreme events are excluded from the DM’s training data in order to investigate to what extent it can accurately extrapolate to severe weather. Our domain is centred in southern Europe and was chosen to cover many diverse regions, including the Alps, Mediterranean Ocean, and northern Africa. According to continuous rank probability score, power spectral density, histograms and many other metrics, after training on balanced data our DM accurately downscales precipitation across all rainfall intensity levels, preserves fine-scale spatial structures, learns regional precipitation dynamics, and captures extreme events in the tails of the distribution. Our DM also outperforms a strong climatological baseline, and it is superior to other commonly used models such as a deterministic deep convolutional network, which tends to over-smooth and underestimate extreme events. Our results affirm the ability of diffusion models to generate robust, hazard-relevant rainfall realisations using coarse atmospheric data.

How to cite: Miller, J., Watson, P., Halladay, K., and James, R.: Diffusion model based downscaling of extreme precipitation in southern Europe, EGU General Assembly 2026, Vienna, Austria, 3–8 May 2026, EGU26-19062, https://doi.org/10.5194/egusphere-egu26-19062, 2026.

EGU26-20546 | ECS | Orals | HS7.2

Downscaling Precipitation Projections using Generative AI: Benchmarking against the WRF Dynamical Climate Model  

Jorge Sebastián Moraga, Nans Addor, Natalie Lord, and Chris Lucas

High-resolution climate projections are essential for hydrological and meteorological impact assessments, yet dynamical numerical simulations remain computationally prohibitive for large ensembles and domains. Generative AI, specifically Probabilistic Diffusion Models (DMs), offer a promising, computationally efficient alternative. Recently, these models have demonstrated skill in reproducing historical data and serving as efficient emulators of dynamical models. The question is, therefore, whether models trained on historical observations can infer the non-stationary statistics of future climate projections.

In this work, we downscale CESM2-LENS simulations over large domains using a DM trained on reanalysis data. We investigate the model's capability to bridge the scale gap between GCM outputs (~100 km resolution) and data requirements for local hydrological impact modelling (~10 km resolution) under both historical and end-of-century scenarios. Furthermore, we compare the diffusion-based approach with the outputs of the state-of-the-art WRF dynamical model, with a focus on the changes to key hydrometeorological indices. By benchmarking DM-downscaled data against both dynamically-downscaled data and GCM baselines, we aim to assess the trade-offs between computational efficiency and physical consistency, offering insights into the generalization limits of generative AI for climate change impact studies.

How to cite: Moraga, J. S., Addor, N., Lord, N., and Lucas, C.: Downscaling Precipitation Projections using Generative AI: Benchmarking against the WRF Dynamical Climate Model , EGU General Assembly 2026, Vienna, Austria, 3–8 May 2026, EGU26-20546, https://doi.org/10.5194/egusphere-egu26-20546, 2026.

EGU26-20641 | ECS | Orals | HS7.2

SLRainGrid-D05: High-Resolution Daily Precipitation Dataset for Sri Lanka Derived from Machine Learning and Satellite-Gauge Fusion 

Chamal Perera, Nadee Peiris, Lalith Rajapakse, Nimal Wijayaratna, and Ajith Wijemannage

Long-term, accurate fine-scale precipitation estimates are essential for hydrological and climate-related analyses, particularly in regions characterized by strong spatial rainfall variability. This study introduces SLRainGrid-D05, the first high-resolution gridded daily precipitation dataset for Sri Lanka, developed at a spatial resolution of 0.05°×0.05° and covering the entire country, including the wet, intermediate, and dry climatic zones. Sri Lanka’s tropical climate exhibits pronounced spatial variability in annual rainfall, ranging from approximately 900 mm to 5,500 mm, which cannot be adequately captured by the sparsely distributed rain-gauge network alone. In addition, satellite-based precipitation products (SPPs) are known to exhibit considerable biases over the region.

To address these limitations, a spatially consistent gridded precipitation dataset was developed by merging ground-based observations with SPPs. An initial evaluation of two widely used SPPs, IMERG and CHIRPS, demonstrated that IMERG performs better at the daily time scale, while CHIRPS shows superior performance at monthly scale. Based on these findings, daily IMERG precipitation was downscaled from its native 0.1°×0.1° resolution to 0.05°×0.05° using CHIRPS rainfall as spatial reference information. The downscaled IMERG product was subsequently merged with rain-gauge observations using machine-learning-based approaches.

The study introduces a novel hybrid merging framework that integrates graph neural networks (GNN) with inverse distance weighting (IDW) to explicitly account for the spatial autocorrelation of rainfall. The proposed method was benchmarked against conventional machine-learning models, including random forest, extreme gradient boosting, support vector machines, and artificial neural networks. Results indicate that the hybrid GNN-IDW framework consistently outperforms these benchmark methods in both rainfall detection and magnitude estimation. Specifically, it achieved the highest probability of detection (0.97) and reduced root mean square error (RMSE) and mean absolute error (MAE) by 13-41% and 9-36%, respectively, relative to the original SPPs. The SLRainGrid-D05 dataset offers a reliable, high-resolution precipitation product and represents a valuable resource for hydrological modeling, climate analysis, and improved preparedness for hydrological extremes, supporting water resources assessment and management across Sri Lanka, with the proposed methodology also being transferable to other tropical regions.

How to cite: Perera, C., Peiris, N., Rajapakse, L., Wijayaratna, N., and Wijemannage, A.: SLRainGrid-D05: High-Resolution Daily Precipitation Dataset for Sri Lanka Derived from Machine Learning and Satellite-Gauge Fusion, EGU General Assembly 2026, Vienna, Austria, 3–8 May 2026, EGU26-20641, https://doi.org/10.5194/egusphere-egu26-20641, 2026.

EGU26-21546 | ECS | Orals | HS7.2

Benchmarking High-Resolution Quasi–Real-Time Satellite Precipitation Products over Northern Tunisia 

Abir Naceur, Hamouda Dakhlaoui, Giovanni Battista Chirico, and Anna Pelosi

Using a two-stage evaluation framework, this study evaluates five near-real-time (NRT) satellite precipitation products (GPM-IMERG V07, GSMAP V06, GSMAP V07, GSMAP V08, PERSSIAN PDIR NOW) over northern Tunisia. The evaluation is conducted at hourly temporal resolution using complementary point-to-pixel statistical analyses and hydrological modelling experiments.

The first stage consists of a comprehensive statistical assessment based on continuous, categorical, and event-based verification metrics. While continuous and categorical approaches have been widely used in previous studies, event-based evaluation methods have been applied far less frequently; their joint use in this study therefore provides a more comprehensive and complementary assessment of NRT precipitation products. 

The second stage involves a rainfall–runoff model to investigate how errors in satellite-derived precipitation propagate through the hydrological system and affect simulated streamflow.

Continuous metrics highlight considerable differences in performance among the five products. GSMaP-V8 and GPM-IMERG demonstrate the most consistent with gauge observations, followed by GSMaP-V6, with Pearson correlation coefficients (PCC) ranging from 0.32 to 0.35 and RMSE values below 0.20 mm. By contrast, GSMaP-V7 shows lower performance. PERSIANN-PDIR-NOW systematically exhibits the weakest accuracy, characterized by low correlation and large error magnitudes.

Categorical verification validates that GPM-IMERG presents the highest rainfall detection capability, achieving probability of detection (POD) values exceeding 0.45 and critical success index (CSI) values above 0.23 for light and moderate rainfall thresholds. Conversely, PERSIANN-PDIR-NOW suffers from frequent false alarms, contributing to decreased categorical skill.

Event-based analyses reveal a general tendency of satellite products to overestimate rainfall event frequency and peak characteristics. GSMaP-V8 exhibits the most balanced and consistent overall performance. GPM-IMERG and GSMaP-V6 better reproduce mean event intensity. GSMaP-V7, however, systematically overestimates event depth, intensity, and peak timing. Moreover, PERSIANN-PDIR-NOW underestimates the mean event precipitation rate, accompanied by a peak rainfall timing shifted earlier relative to observations.

The hydrological evaluation shows that rainfall–runoff modeling propagates precipitation uncertainties non-linearly into simulated streamflow. GPM-IMERG, GSMAP-V7 and GSMAP-V6 yield the most realistic flow simulations (KGE up to 0.68), Other products with comparable rainfall-level statistics nonetheless generate biased streamflow responses

Overall, the findings provide relevant information for improving NRT satellite precipitation algorithms and offer practical guidance for Community stakeholders and practitioners in selecting suitable alternative precipitation datasets in hydrological applications across specific basins, regions, or climatic zones.


Keywords: Hourly rainfall, Near-real-time satellite precipitation products, GPM-IMERG V07, GSMAP V06, GSMAP V07, GSMAP V08, PERSSIAN PDIR NOW, Northern Tunisia

How to cite: Naceur, A., Dakhlaoui, H., Chirico, G. B., and Pelosi, A.: Benchmarking High-Resolution Quasi–Real-Time Satellite Precipitation Products over Northern Tunisia, EGU General Assembly 2026, Vienna, Austria, 3–8 May 2026, EGU26-21546, https://doi.org/10.5194/egusphere-egu26-21546, 2026.

EGU26-21742 | ECS | Orals | HS7.2

Process-Informed Regional Climate Modeling for South Asia: The SARCI Framework 

Debi Prasad Bhuyan, Pankaj Upadhyaya, and Saroj Kanta Mishra

South Asia—home to more than a quarter of the global population—faces escalating climate risks that require scientifically credible and actionable climate information. Yet current global climate models exhibit persistent temperature and precipitation biases, reaching up to 25% and 100% of their mean values, respectively, which limits their utility for regional assessments and policy planning. To address these limitations, we develop the South Asia Regional Climate Information (SARCI) framework: a regionally optimized, process-informed system designed to improve simulations of the South Asian Summer Monsoon (SASM) and generate high-fidelity climate information.

SARCI features a customized atmospheric model based on NCAR CESM/CAM5, incorporating targeted enhancements to key physical parameterizations—stochastic entrainment for deep convection (STOCH), a dynamic convective adjustment timescale (DTAU), supplementary gravity-wave sources (GW), and region-specific similarity functions for land–air turbulent fluxes (LTF)—alongside structured parameter tuning and a statistical bias-correction and downscaling module. A systematic component-wise attribution quantifies the incremental influence of each enhancement. DTAU reduces precipitation biases and improves the annual cycle through better moisture convergence, cloud cover, and equatorial waves. STOCH and GW improve precipitation, circulation, and moisture distribution, with STOCH providing additional skill in equatorial waves. LTF primarily improves near-surface temperature with marginal precipitation benefits. Parameter tuning consolidates these gains and resolves residual inconsistencies, while the downscaling module corrects remaining magnitude errors and delivers quarter-degree, policy-relevant fields.

Together, these sequential improvements reduce longstanding SASM-related biases, yield more realistic regional circulation, and preserve acceptable global model performance. By clarifying the physical origins of model improvements and integrating co-production and regional optimization, the SARCI framework provides credible, actionable climate information for South Asia and offers a scalable pathway for other climate-vulnerable regions of the Global South.

How to cite: Bhuyan, D. P., Upadhyaya, P., and Mishra, S. K.: Process-Informed Regional Climate Modeling for South Asia: The SARCI Framework, EGU General Assembly 2026, Vienna, Austria, 3–8 May 2026, EGU26-21742, https://doi.org/10.5194/egusphere-egu26-21742, 2026.

Groundwater contamination risk is influenced by hydroclimatic constraints, abstraction-driven dilution capacity, and ecological sensitivity, rather than chemical levels alone. However, groundwater pesticide assessments generally prioritize sites based on measured concentrations. We developed a groundwater-focused Level of Concern (LOC) indicator that integrates cumulative pesticide mixture toxicity expressed as an ecological Risk Quotient (RQ) derived from reported groundwater concentrations and groundwater Predicted No-Effect Concentrations (PNECGW), baseline water stress (BWS) as a proxy for groundwater scarcity and reduced assimilative capacity, and composite tetrapod biodiversity richness as an index of ecological sensitivity. The aridity index (AI) was retained as a supporting context to interpret recharge limitations and the persistence or mobility of contaminants across climatic zones. The framework was applied across diverse Indian aquifer provinces spanning semi-arid, dry sub-humid, and humid regions, including the Indo-Gangetic Plains and stressed urban aquifers (Delhi; Farrukhabad, Agra, Kanpur, Unnao, Varanasi, Lakhimpur Kheri, Gorakhpur), semi-arid transition and irrigated belts (Jaipur in Rajasthan; Hisar, Ambala, Gurgaon in Haryana), humid floodplains (Nagaon and Dibrugarh in Assam), deltaic and coastal aquifers (North 24 Parganas and South 24 Parganas in West Bengal; Thiruvallur in Tamil Nadu), and hard-rock basalt systems in central India (Bhandara, Amravati, Yavatmal in Maharashtra).

Results show pronounced spatial heterogeneity and two dominant pathways of groundwater vulnerability. In semi-arid provinces with high to extremely high BWS, medium to very high pesticide risk classes align with constrained dilution and persistence, and these sites are predominantly categorized as medium concern (LOC=2). In humid alluvial systems, very high pesticide-risk classes can occur under low to high BWS, consistent with recharge-driven transport and strong groundwater–surface water connectivity. These locations also cluster in the medium concern class (LOC=2). High concern (LOC=1) is identified at Yavatmal, where semi-arid conditions and extremely high BWS coincide with cumulative stress. Low concern classifications (LOC = 3-4) are limited to Kanpur, Gorakhpur, and South 24 Parganas, where cumulative stress is lower under their respective BWS, RQ, and AI classes.

How to cite: Mitra, S. and Ray, S.: Risk Assessment of Pesticides in Groundwater of India: An Integrated Index of Water Stress, Climate, and Biodiversity, EGU General Assembly 2026, Vienna, Austria, 3–8 May 2026, EGU26-1608, https://doi.org/10.5194/egusphere-egu26-1608, 2026.

EGU26-13693 | ECS | PICO | HS7.3

Irrigation amplifies the benefits of rotational diversity on crop yields and their stability under climatic extremes 

Mahmoud Suliman, Maoya Bassiouni, Paolo D'Odorico, Riccardo Bommarco, and Giulia Vico

The increasing frequency and intensity of hot and dry extremes under climate change are expected to reduce crop yields and their stability. Irrigation and diverse crop rotations have separately been shown to buffer against the negative impacts of such extremes, potentially leading to higher and more stable yields compared with rainfed cropping and monoculture. Yet, their joint effects remain unquantified across a broad range of pedoclimatic conditions and field management practices. Using the newly developed USDA crop sequence boundary data and remotely sensed estimates of annual irrigation occurrence, we quantified the combined effects of crop diversity, prevalence of irrigation, and dry-spell length and temperature on county-level corn and soybean yields in the USA from 2008 to 2023. We also assessed how these factors jointly influence yield stability, defined as low interannual yield variability and measured via the yield standard deviation over the same period. Initial results show that, where rainfed agriculture was more prevalent, corn and soybean yields and their stability were higher with more diversity in rotated crops independently of dry-spell length and temperature. Conversely, under widespread irrigation, more stable corn and soybean yields were generally associated with higher rotational diversity under long or warm dry spells. Under the same conditions, soybean, but not corn, yields were higher with more diverse rotations. Under both longer and warmer dry spells, corn and soybean yields increased with diversity and even more so under higher irrigation prevalence, suggesting that the capacity of rotational diversity to mitigate yield losses under adverse climatic conditions is amplified by irrigation.

How to cite: Suliman, M., Bassiouni, M., D'Odorico, P., Bommarco, R., and Vico, G.: Irrigation amplifies the benefits of rotational diversity on crop yields and their stability under climatic extremes, EGU General Assembly 2026, Vienna, Austria, 3–8 May 2026, EGU26-13693, https://doi.org/10.5194/egusphere-egu26-13693, 2026.

EGU26-14776 | ECS | PICO | HS7.3 | Highlight

Climate Change Perceptions and Resilience Readiness among Agricultural Practitioners in Greece: Evidence from a National Survey Dataset 

Maria Vasiliki Kanellaki, Eleni Kritidou, Anastasios Perdios, Stergios Emmanouil, Maria Margarita Ntona, Alexandra Aspioti, Maria Nefeli Georgaki, and Athanasios V. Serafeim

The current works aims to identify the perspectives of agricultural sector practitioners on climate risk and their response strategies for improving climate resilience, in Greece, using a recently published nationally representative survey data (Serafeim et al. in 2025).

Based on the survey, almost every responder related to the agricultural sector (i.e. farmers), believes in the existence of climate crisis, while 84,2% of them has experienced environmental changes in their region, including extreme phenomena like droughts, rising temperatures, forest fires, and flooding, all of which pose a significant threat to agricultural production in Greece. Despite this notably high level of awareness the responders highlighted a low level of preparedness, since only 2.6% of the agricultural related group has attended training on either climate change or disaster preparedness. However, there is a high level of adaptive readiness, given that 71.1% showed a strong willingness to attend such training sessions.

These results underscore the need for specific training and adaptation policies based on local perceptions to enhance the resilience of the agricultural communities of the Mediterranean region. This can be done by capitalizing the use of national perception data to inform the development of an evidence-based climate change adaptation strategy to address the resilience gap in rural livelihoods.

References

Serafeim, A. V., Perdios, A., Emmanouil, S., Kritidou, E., Ntona, M. M., Aspioti, A., Georgaki, M. N., Papailiopoulou, M. and Kanellaki, M.V. (2025). National survey-based investigation of climate risk perceptions and adaptation readiness in Greece [Dataset]. Dryad. https://doi.org/10.5061/dryad.t1g1jwtg1.

How to cite: Kanellaki, M. V., Kritidou, E., Perdios, A., Emmanouil, S., Ntona, M. M., Aspioti, A., Georgaki, M. N., and Serafeim, A. V.: Climate Change Perceptions and Resilience Readiness among Agricultural Practitioners in Greece: Evidence from a National Survey Dataset, EGU General Assembly 2026, Vienna, Austria, 3–8 May 2026, EGU26-14776, https://doi.org/10.5194/egusphere-egu26-14776, 2026.

Climate change–induced droughts have intensified water stress in rain-fed agricultural systems, challenging traditional management practices that often optimize for single objectives, such as yield or water use efficiency. Tea fields in Pinglin, Taiwan, are particularly sensitive to hydroclimatic variability, as tea growth and quality depend strongly on soil moisture dynamics, evapotranspiration, and microclimatic conditions.

Previous studies have demonstrated that organic and conventional tea fields exhibit distinct soil water dynamics and energy partitioning, suggesting potential trade-offs between water use, microclimate regulation, and production-related management objectives.

Building on existing empirical and modeling-based insights into tea field hydrology, this study aims to reframe tea plantation management through the lens of a Water–Energy–Food Nexus. By treating management as a clear multi-objective decision problem, we reframe the competing objectives between water availability, irrigation, energy dynamics, and food production relevant to tea yield and quality.

To operationalize this decision framework at the field level, this study employs the Conditional Water Depletion Index (CWDI) to translate physical water demand (evapotranspiration) and supply(rainfall and irrigation) into a dimensionless indicator of system scarcity. The CWDI effectively represents the vulnerability and sensitivity of the tea field. This quantified state serves as the basis for informing the timing and intensity of management interventions.

By clarifying the structure of water–energy–production trade-offs in tea fields, this exploratory study provides a conceptual and analytical basis for future research that may incorporate dynamic decision-making and learning-based approaches to enhance agricultural resilience under increasing climate and water uncertainties.


How to cite: Chen, H. and Hsu, S.-Y.: Toward a Multi-objective Decision Framing for Tea Fields Management under Water Stress, EGU General Assembly 2026, Vienna, Austria, 3–8 May 2026, EGU26-19977, https://doi.org/10.5194/egusphere-egu26-19977, 2026.

A rational evaluation of virtual land and water resource flows within the grain trade can potentially serve: (i) to mitigate regional resource scarcity, (ii) as the basis for agricultural water and land resource management, and (iii) to support policymakers in making strategic choices for resource redistribution and sustainable development. Failing to reflect real-world agricultural production systems and irrigation-driven resource management practices, existing evaluation frameworks consider only the virtual water and land content embedded in traded grain, neglecting the marginal productivity enhancement effect of irrigation under cropland constraints. In this study, a modified framework was developed to incorporate irrigation effects into virtual water and land resource accounting and was applied to an empirical analysis of interprovincial grain transfers in China, where arable land resources are strictly constrained. The results indicate that China's land and water productivity under irrigated agriculture are 2.18- and 1.32-fold greater than under rainfed agriculture, respectively; however, the irrigation provision rate remains below 50%. Failure to consider the role of irrigation leads to contradictory evaluation results for virtual water and land flows in certain trade routes, thereby generating misleading policies. Aiming at the 2030 grain production target, this study further explores the feasibility of boosting grain production capacity by expanding irrigation coverage using water resources saved through efficiency improvements. Furthermore, the modified trade framework is utilized to identify optimal pathways for interprovincial production increases. By altering the perspective of virtual water and land resource assessment, this study provides a basis for agricultural layout optimization, irrigation development, and water resource management policies.

How to cite: Wu, N., Gerbens-Leenes, W., Yi, J., and Cao, X.: Assessing the Real Impact of Inter-provincial Grain Trade on Water and Land Resources in China: A Modified Framework Incorporating Irrigation Productivity, EGU General Assembly 2026, Vienna, Austria, 3–8 May 2026, EGU26-20656, https://doi.org/10.5194/egusphere-egu26-20656, 2026.

EGU26-20821 | ECS | PICO | HS7.3

Quantifying Food Security Impacts of Hydrological Disasters Through Post-Event Assessments  

Nikolas Galli, Camilla Govoni, and Maria Cristina Rulli

Climate change is altering the frequency and intensity of hydrological extremes, amplifying their consequences for agriculture and food security. In regions already burdened by socioeconomic vulnerabilities, agricultural losses from floods and similar events can disrupt food systems far beyond crop produce availability alone. Despite growing recognition of these cascading effects, methods to estimate food security impacts—while remaining compatible with local data and time constraints—are still limited. This study introduces a practical framework for translating post-disaster assessments into indicators of food availability, access, and utilization, placing affected communities at the center of the analysis and offering insights into food stability. We apply this approach to the 2015 floods in Malawi, estimating that crop losses equated to food sufficient for over 300,000 people and dietary balance for nearly 2.3 million, with disproportionate impacts on poorer districts. Although simplified, the methodology is transparent, replicable, and adaptable to other disaster contexts, providing actionable evidence for policy and recovery strategies aimed at safeguarding food security.


How to cite: Galli, N., Govoni, C., and Rulli, M. C.: Quantifying Food Security Impacts of Hydrological Disasters Through Post-Event Assessments , EGU General Assembly 2026, Vienna, Austria, 3–8 May 2026, EGU26-20821, https://doi.org/10.5194/egusphere-egu26-20821, 2026.

Assessing the reliability of irrigation water-allocation plans under climate change is essential for sustainable agriculture, especially when alternative water sources such as reclaimed water are considered. This study evaluates an irrigation allocation plan for a sorghum–wheat rotation in Kinmen, Taiwan, combining stakeholder engagement, climate analysis, stochastic rainfall simulation, and system modeling. Two local workshops with farmers and experts were conducted to refine feasible irrigation practices and design paired experimental and control fields for subsequent calibration. Historical rainfall from the Kinmen weather station (2005–2025) indicates fewer rainy days and more concentrated events in the recent decade, suggesting increasing rainfall extremity. Future climate scenarios (SSP2-4.5 and SSP5-8.5) were bias-corrected using quantile-based adjustment over 2015–2025, then analyzed for seasonal shifts and extremes. Rainfall temporal structure was simulated using the NEOPRENE Neyman–Scott framework, while XGBoost models were trained on observations to generate daily meteorological variables and reference evapotranspiration. These climate inputs drove a WEAP-based irrigation allocation model coupled with the MABIA method to estimate yields, water use, and economic performance over a 20-year planning horizon. Results show that weekly irrigation increases yields but yields the lowest net profit due to higher labor and energy costs. Under SSP2-4.5 (wetter and more evenly distributed rainfall), a three-week irrigation interval maximizes profit, whereas under SSP5-8.5 (more concentrated rainfall and longer dry spells), a two-week interval provides the best balance between yield stability and cost. The framework provides decision support for robust irrigation planning under uncertain future climate conditions.

How to cite: Hsu, S.-C., Chen, Y.-R., and Yu, H.-L.: Reliability of Irrigation Water Allocation under Climate Change: A WEAP–MABIA Assessment for Kinmen Using Stochastic Rainfall and ML-Based Weather Generation, EGU General Assembly 2026, Vienna, Austria, 3–8 May 2026, EGU26-20921, https://doi.org/10.5194/egusphere-egu26-20921, 2026.

EGU26-21523 | ECS | PICO | HS7.3

Integrated Modeling of the Water–Food–Ecosystem Nexus in the Upper Main Catchment under Future Climate and Socioeconomic Scenarios 

Sreya Prakash, Sawparnika Ayyappan Preetha Kumari, and Jingshui Huang

Understanding the complex interplay between hydrology, agricultural productivity, and ecosystem health is critical for sustainable catchment management under future climate and socioeconomic change. The Upper Main Catchment in Bavaria is a productive rainfed agriculture region with efficient sectoral water allocation and established cropping systems. This balance may be increasingly threatened by projected changes in temperature, precipitation patterns and water availability under future climate scenarios. Rising irrigation demands, coupled with shifts in crop phenology and soil nutrient dynamics, could intensify pressure on water resources and ecological stability. As such, this calls for integrated, forward-looking assessments to capture the dynamic interlinkages between water, food and ecosystem entities across diverse future pathways.

The present study employs a coupled modeling framework using the Soil and Water Assessment Tool (SWAT+) and the Water Evaluation and Adaptation Planning (WEAP) model to evaluate the water-food-ecosystem nexus under climate-driven socioeconomic scenarios. The framework is applied under three Shared Socioeconomic Pathway (SSP) scenarios, SSP126, SSP370 and SSP585, using bias-corrected climate projections from five Global Climate Models (GCMs) sourced from the ISIMIP3b dataset. A historically calibrated SWAT+ model simulates streamflow, percolation, crop yield, irrigation water demand and nitrate dynamics under 15 future scenario combinations (3 SSPs × 5 GCMs). WEAP simulations assess how much of the estimated irrigation demand can be met, allowing evaluation of unmet demands across sectors and time periods.

Scenario-specific projections are used to assess increase in irrigation demand and shortfalls, yield variability and soil nitrate accumulation. By integrating SWAT+-simulated demands with WEAP allocation outcomes, the study identifies spatial and seasonal mismatches between crop water requirements and available supply. Trade-off analysis highlights how future changes in water availability affect agricultural productivity and nitrate loading risks, revealing tensions between maximizing yield and maintaining environmental sustainability. Scenario-driven differences reveal potential stress hotspots, in both spatial and temporal scales. The ensemble spread across GCMs and SSPs underscores the uncertainty associated with climate projections, highlighting the need for resilient strategies for a range of plausible futures. The findings provide a critical evidence base to support integrated water, agriculture, and ecosystem management in Bavaria.

How to cite: Prakash, S., Ayyappan Preetha Kumari, S., and Huang, J.: Integrated Modeling of the Water–Food–Ecosystem Nexus in the Upper Main Catchment under Future Climate and Socioeconomic Scenarios, EGU General Assembly 2026, Vienna, Austria, 3–8 May 2026, EGU26-21523, https://doi.org/10.5194/egusphere-egu26-21523, 2026.

EGU26-439 | ECS | PICO | HS7.4

Assessing the Impact of Climate Change on Frequency and Intensity of Compound Coastal Extremes in India  

Diljit Dutta, Srinivas Venkata Vemavarupu, and Govindasamy Bala

The Indian coastline, flanked by the Bay of Bengal and the Arabian Sea, is prone to the impact of intense low-pressure systems, specifically tropical depressions and storms, which are accompanied by extreme rainfall and storm surges. The vulnerability of the Indian East Coast to compound flooding, characterized by the concurrent occurrence of extreme rainfall and wind-driven extreme storm surges, poses a significant challenge in the face of changing climatic conditions. This study examines how anthropogenic climate change may influence the frequency and intensity of such compound extremes on the Indian East Coast by the end of the 21st century. For this purpose, observed sea level data at three tide gauge (TG) stations (Paradip, Haldia, and Chennai) were used to extract storm surge time series for the period 1980-2010. Daily rainfall was obtained from the 0.25° gridded dataset of the India Meteorological Department (IMD), while mean sea level pressure anomalies and surface wind speeds were extracted from ERA5 reanalysis data within a 500 km radius of the coastal stations along the East Coast of India. A logistic regression model was utilized to identify the suitable atmospheric predictor for storm surge extremes, and the corresponding threshold of the variable leading to storm surge extremes (exceeding the 95th percentile) at the tide gauge station was identified. Subsequently, the bias-corrected GCM simulated precipitation and wind stress (identified from a logistic regression model) variables were obtained at the grid points near the TG stations from 10 models corresponding to CMIP6 simulations for the historical period as well for the end of the century (2070-2100), corresponding to the extreme ssp585 scenario. The compound extremes were identified in the GCM data for both the historical and future periods by using thresholds of simulated rainfall and wind stress (identified from logistic regression) data consistent with those derived from observations. The change in seasonal, annual and decadal variability of the frequency of the compound extremes was investigated for data from each of the 10 models as well the ensemble mean from the models for the future period with respect to the historical period. Initial results show a greater change in the frequency of these extremes in the post-monsoon season than the monsoon season for the majority of the models. Additionally, a higher mean annual intensity of the compound extremes with respect to the historical counterpart was expected to occur under the SSP585 scenario at the end of the century. The synoptic patterns corresponding to the compound extremes were also investigated to understand the changing dynamics of these extremes on the Indian Coast.

How to cite: Dutta, D., Venkata Vemavarupu, S., and Bala, G.: Assessing the Impact of Climate Change on Frequency and Intensity of Compound Coastal Extremes in India , EGU General Assembly 2026, Vienna, Austria, 3–8 May 2026, EGU26-439, https://doi.org/10.5194/egusphere-egu26-439, 2026.

EGU26-1107 | ECS | PICO | HS7.4

Integration of stochastic and statistical approaches for drought risk estimation through long-length timeseries 

Sofia Vrettou, Demetris Koutsoyiannis, Panayiotis Dimitriadis, Theano Iliopoulou, and Alberto Montanari

Droughts are among the most intense and impactful natural hazard-related disasters facing humanity. The European Commission’s adaptation strategy report (2021) highlights that water scarcity increasingly disrupts a wide spectrum of socioeconomic aspects, ranging from agriculture and food industry to enhancing social and gender inequalities and consequently leading to human, material and economic losses. Therefore, efforts for creating resilient societies, able to deal with climate induced hazards, are high on the agenda both in European and global level. For achieving this universal objective, one of the primary steps suggests deeper understanding of the natural processes responsible for the hazards. In the case of droughts, the detailed study of precipitation patterns and the use of appropriate stochastic simulation methods, which capture the inherent characteristics of natural processes, are crucial for drought risk estimation and forecasting. In this work, we use the state-of-the-art stochastic modeling framework CoSMoS, which implicitly, in terms of the autocorrelation function, and explicitly, in terms of the probability distribution function, adequately simulates the expected variability and interdependence characterizing precipitation records. The stochastic scheme is applied to the precipitation time series of Bologna, which; being one of the longest rainfall time series worldwide, provides a significant advantage in the field of stochastic generation. Following a Monte Carlo simulation approach, 500 synthetic precipitation time series of 100 years each are generated and subsequently analyzed applying run theory to estimate drought risk, frequency and duration, across the city of Bologna and the adjacent provinces. Rather than relying on urgent adaptation measures during a water crisis, the findings and generally the application of the methodology followed in this study, foster a proactive approach in drought management and offer valuable insights in urban and water resources planning, public awareness initiatives, insurance risk assessment and encourage legislative amendments. By integrating probabilistic and statistical methods in drought risk analysis, this work contributes to the global demand to strengthen the resilience of societies against climate related risks.

How to cite: Vrettou, S., Koutsoyiannis, D., Dimitriadis, P., Iliopoulou, T., and Montanari, A.: Integration of stochastic and statistical approaches for drought risk estimation through long-length timeseries, EGU General Assembly 2026, Vienna, Austria, 3–8 May 2026, EGU26-1107, https://doi.org/10.5194/egusphere-egu26-1107, 2026.

EGU26-1304 | ECS | PICO | HS7.4

Increasing Influence of Temperature on Recent Hydrological Extremes across European Alpine Rivers 

Rui Guo, Hung Nguyen, Stefano Galelli, Serena Ceola, and Alberto Montanari

Four of the largest river basins in Europe – Rhine, Rhône, Po, and Danube – rely heavily on Alpine headwaters. Recently, these basins have experienced intensifying hydroclimatic fluctuations, including catastrophic floods and prolonged droughts, highlighting the vulnerability of these basins to climatic variability. Understanding the potential drivers behind changes in streamflow patterns, particularly the relative contributions of precipitation and temperature, is essential for improving the attribution of extreme hydrological events and informing sustainable freshwater resource management. However, relatively short instrumental hydroclimatic records in the European Alps limit our understanding of the long-term influence of climate variability on hydrological extremes. This research integrates proxy-based reconstructions with paleo-climate reanalysis to assess streamflow variations over an extended timeframe. Through statistical regression, we quantify how changing rainfall and temperature patterns contribute to the onset of extreme events, with a specific focus on recent droughts. By comparing historical trends with future projections across different climate scenarios, we aim to identify the primary climatic drivers of hydrological extremes and their evolution over time. This work emphasizes the necessity of long-term perspectives in attributing extreme events and securing water resources in the Alps.

How to cite: Guo, R., Nguyen, H., Galelli, S., Ceola, S., and Montanari, A.: Increasing Influence of Temperature on Recent Hydrological Extremes across European Alpine Rivers, EGU General Assembly 2026, Vienna, Austria, 3–8 May 2026, EGU26-1304, https://doi.org/10.5194/egusphere-egu26-1304, 2026.

EGU26-5936 | ECS | PICO | HS7.4

From Deterministic to Stochastic: A Hybrid Machine Learning Framework for Reliable Satellite Precipitation Merging over Greece 

Nikolaos Tepetidis, Theano Iliopoulou, Panayiotis Dimitriadis, Ioannis Benekos, Alberto Montanari, and Demetris Koutsoyiannis

Accurate precipitation estimations are crucial for hydrological modelling and water resource management, especially in geographically complex regions like Greece. Satellite-based products are valuable as they encompass extensive spatial coverage with high data density, but their accuracy is limited compared to ground truth measurements. To address this bias, we leverage machine learning (ML) approaches. We present a hybrid machine learning framework that employs post-processing techniques to integrate satellite-derived precipitation data with ground-based gauge observations. The methodological framework upgrades a deterministic ML regressor (D-model) into a fully stochastic system (S-model) using Bluecat methodology. We use data for the period 2000-2021 over Greek territory, from gauge observations and Integrated Multi-Satellite Retrievals for GPM (IMERG). The S-Model significantly improves reliability and statistical consistency, effectively transforming the ML output into actionable, risk-aware intelligence.

How to cite: Tepetidis, N., Iliopoulou, T., Dimitriadis, P., Benekos, I., Montanari, A., and Koutsoyiannis, D.: From Deterministic to Stochastic: A Hybrid Machine Learning Framework for Reliable Satellite Precipitation Merging over Greece, EGU General Assembly 2026, Vienna, Austria, 3–8 May 2026, EGU26-5936, https://doi.org/10.5194/egusphere-egu26-5936, 2026.

The frequency of extraordinary floods (EF) has risen globally in recent years, often accompanied by substantial economic losses and fatalities. However, these changes are not uniform and exhibit pronounced spatial and temporal variability. Extreme precipitation (EP) is considered one of the key factors triggering EF and is associated with various weather systems. However, studies examining how different types of EP contribute to EF, particularly in terms of the spatiotemporal variability of these relationships in response to climate change, remain limited.

This study proposes a framework to assess the impacts of different types of EP on the occurrence of EF. We use data from Taiwan as a case study, where multiple flood-associated types of EP occur, including tropical cyclones (TCs), mesoscale convective systems (MCSs), and frontal systems (FSs). To examine differences among EP-EF groups, a mechanism-based framework is developed to classify EP types and flood events. Meanwhile, weather types are identified using an unsupervised k-means clustering approach based on three groups of variables: precipitation, storm-related characteristics, and topographic controls. EF events are defined using a peak-over-threshold (POT) approach and are linked to their corresponding weather types. Our findings reveal varying temporal trends across different EP-EF groups, providing insights into how the spatiotemporal variability of extreme rainfall affects the occurrence of extraordinary floods.

How to cite: Wu, H. and Wang, H.-J.: Disentangling the Mechanisms Linking Extreme Precipitation Types to Extraordinary Floods: An Assessment in Taiwan, EGU General Assembly 2026, Vienna, Austria, 3–8 May 2026, EGU26-6159, https://doi.org/10.5194/egusphere-egu26-6159, 2026.

Social prosperity fundamentally relies on the sustainable management of natural resources. In the contemporary world, however, this
perspective has been distorted, as economic optimization increasingly dominates resource allocation decisions, often prioritizing short-term financial gains over long-term societal and environmental benefits. To highlight this distortion, we evaluate a planned pumped-storage hydropower (PSH) project in Northern Euboea, Greece, using two contrasting operational frameworks:

  • Resource- and needs-oriented approach (socio-environmental perspective): The PSH system is coupled with renewable energy sources (RES) and operated to optimize water and energy resource use, ensuring stable and reliable energy supply aligned with actual societal demand, irrespective of short-term market fluctuations.
  • Market-driven approach (economic optimization perspective): The system exploits price volatility in the energy exchange market by pumping (storing energy) when electricity prices are low and generating (turbine operation) when prices are high, aiming to maximize economic profitability.

We analyze the stochastic properties and dynamics of relevant time series — including RES production, electricity market prices, and
demand patterns — to quantify and compare system behavior under each paradigm. Key metrics include resource efficiency, supply
reliability, economic returns, and alignment with broader sustainability goals. The results reveal fundamental tensions between the two approaches: the market-driven strategy yields higher short-term revenues. In contrast, the needs-oriented operation better supports long-term social prosperity and resource conservation, though at the potential cost of lower immediate financial performance. This comparative analysis underscores how the dominance of market mechanisms can distort natural resource management and advocates for a reorientation of decision-making criteria toward long-term societal well-being and environmental
sustainability in energy infrastructure planning. 

How to cite: Saperopoulou, D., Kouzelis, V., Sargentis, G.-F., Efstratiadis, A., and Tepetidis, N.: Social prosperity and natural resource management: Stochastic evaluation of two operational paradigms of pumped-storage hydropower in North Euboea under renewable energy integration and energy market dynamics, EGU General Assembly 2026, Vienna, Austria, 3–8 May 2026, EGU26-8099, https://doi.org/10.5194/egusphere-egu26-8099, 2026.

EGU26-9920 | ECS | PICO | HS7.4

Cause-effect based modelling for reliable results under changing climatic conditions 

Vivek Kumar Yadav, Murray Peel, Keirnan Fowler, Dongryeol Ryu, and Bramha Dutt Vishwakarma

Identifying the drivers of a process is imperative to its understanding and forecasting, especially under changing climate. Hydrometeorological systems are complex with multiple closely related variables. In such systems a process can have multiple drivers, coupled to the system, across timescales. Thus, identifying the drivers of a process becomes challenging. In Hydrology, multivariate regression and recently Big Data machine learning methods have gained popularity. However, these methods rely on finding correlation between variables and fall short of identifying causal (cause-effect) relations.

This work explores causal discovery (CD) algorithms to identify the drivers in a hydrological system. Specifically, we evaluate the following four theoretically distinct multivariate CD algorithms, (i) TCDF (ii) VARLiNGAM, (iii) PCMCI+, and (iv) DYNOTEARS. We evaluate these algorithms within a large and complex simulated environment of the Global Land Data Assimilation System (GLDAS) where the drivers, reference truth, are known perfectly. We evaluate the drivers identified by CD methods against this reference truth and contrast its results with the widely used method of co-relation identification, Pearson’s Correlation Coefficient (PCC). While identifying a causal link is important to understand cause-effect relations between variables, eliminating spurious correlation as false causality is also important to obtain a parsimonious set of predictors. Accordingly, we evaluate the performance of CD methods and PCC for both these aspects.

The results show that CD methods identify fewer false drivers compared to PCC, which is prone to spurious associations from cross-correlations and lagged correlations, typically present in hydrometeorological systems. In contrast, CD methods eliminate a higher number of false instantaneous and lagged drivers. Thus, although PCC identifies the highest number of true drivers, it suffers from a high number of false drivers. Overall, CD methods perform similar to or better than PCC, with PCMCI+ and DYNOTEARS performing the best.  

Further, we evaluate the effect of focusing on causal drivers by training machine learning models for surface soil moisture prediction. We evaluate their performance under changing climate conditions of drought. PCC-based models show higher performance in the training period (median R2=0.85 & NSE=0.84); however, they suffer a sharp drop in performance during the test period. In contrast CD-based models show decent performance in training (median R2~0.8 & NSE~0.78) and are more robust in the testing period. Together, these findings highlight the value of CD for eliminating spurious relations and retrieving a robust, parsimonious set of predictors for process understanding and predictions under diverse climate conditions.

This study overviews, demonstrates and tests the efficacy of CD methods in identifying cause-effect relations in hydrometeorological systems. By exposing their capabilities and differences in a simulated environment, we hope to encourage their use in the real world and move beyond co-relation.

How to cite: Yadav, V. K., Peel, M., Fowler, K., Ryu, D., and Vishwakarma, B. D.: Cause-effect based modelling for reliable results under changing climatic conditions, EGU General Assembly 2026, Vienna, Austria, 3–8 May 2026, EGU26-9920, https://doi.org/10.5194/egusphere-egu26-9920, 2026.

EGU26-9942 | ECS | PICO | HS7.4

Stochastic Investigation of Solar and Wind Processes for Renewable Energy Storage in Greece 

Pavlina Pagoulatou, Eleni Mandilaki, Theano Iliopoulou, G.-Fivos Sargentis, and Romanos Ioannidis

Periods of low Renewable Energy Sources (RES) production are critical for power system reliability. This study investigates the stochastic dynamics linking solar radiation, wind conditions, and renewable energy production in Greece. Emphasis is placed on characterizing energy droughts by analyzing temporal variability and persistence features of the relevant climatic variables using the Hurst–Kolmogorov framework. Based on historical datasets, we identify prolonged deficit periods and quantify the probability of critical concurrent low-wind and low-solar events. Finally, synthetic future scenarios are generated to estimate energy storage requirements, in order to support resilient infrastructure design under the inherent stochastic variability of climatic processes.

How to cite: Pagoulatou, P., Mandilaki, E., Iliopoulou, T., Sargentis, G.-F., and Ioannidis, R.: Stochastic Investigation of Solar and Wind Processes for Renewable Energy Storage in Greece, EGU General Assembly 2026, Vienna, Austria, 3–8 May 2026, EGU26-9942, https://doi.org/10.5194/egusphere-egu26-9942, 2026.

EGU26-9974 | ECS | PICO | HS7.4

Comparison of temporal changes in aridity in European and African regions 

Konstantinos Maravitsas, Panagiotis Makris, Theodora Bousoula, G.-Fivos Sargentis, and Theano Iliopoulou

Recurring droughts under climate variability pose increasing challenges for drinking-water supply and irrigation. This study compares the temporal dynamics of aridity in selected European and African regions. Although these areas lie within similar latitude bands according to the IPCC SREX classification, they differ substantially in climate regimes and adaptive capacity. Aridity dynamics are assessed using key hydroclimatic variables—precipitation, temperature, evaporation and potential evapotranspiration—together with established aridity indices. Temporal changes are analyzed, and the stochastic structure of climatic variability is evaluated within the Hurst–Kolmogorov framework. The results are interpreted in relation to regional water infrastructure and its role in shaping the capacity to cope with evolving aridity conditions.

How to cite: Maravitsas, K., Makris, P., Bousoula, T., Sargentis, G.-F., and Iliopoulou, T.: Comparison of temporal changes in aridity in European and African regions, EGU General Assembly 2026, Vienna, Austria, 3–8 May 2026, EGU26-9974, https://doi.org/10.5194/egusphere-egu26-9974, 2026.

EGU26-10737 | ECS | PICO | HS7.4

European snow dynamics and changing patterns under climate variability 

Ioannis Filippos Bozanas, G.-Fivos Sargentis, and Theano Iliopoulou

Snow plays a crucial role in Europe’s hydrological cycle, influencing water availability,
river runoff, and seasonal storage in mountain and northern regions that support both
national and transboundary water systems. This study examines key snow-related
processes including snowfall, snow cover fraction, and snow water equivalent across
Europe. Stochastic approaches are applied to quantify long-term persistence
characteristics in snow and hydrological processes. Synthetic scenarios are further
generated to assess potential responses of snow under regional warming. The
results are expected to provide insights into European snow dynamics and their role
in shaping seasonal streamflow and water availability. This study offers a Europe-
wide stochastic perspective on cryosphere–hydrosphere interactions under climate
variability, where changes in snow storage and melt dynamics can affect hydropower
production, agricultural water demand, and drinking water supply.

How to cite: Bozanas, I. F., Sargentis, G.-F., and Iliopoulou, T.: European snow dynamics and changing patterns under climate variability, EGU General Assembly 2026, Vienna, Austria, 3–8 May 2026, EGU26-10737, https://doi.org/10.5194/egusphere-egu26-10737, 2026.

EGU26-14786 | PICO | HS7.4

Water availability assessment across Southern Italy under future climate scenarios 

Silvano F. Dal Sasso, Htay Htay Aung, Luca Furnari, Alfonso Senatore, and Giuseppe Mendicino

Assessing the impact of climate change on water availability requires robust and spatially consistent modelling frameworks, particularly in Mediterranean regions characterized by strong hydroclimatic variability. The Mediterranean basin is widely recognized as a climate-change hotspot, where increasing temperatures and changes in precipitation regimes are expected to exacerbate water scarcity and hydrological extremes, especially in southern areas (Lazoglou et al., 2024). This study investigates future water availability across Southern Italy, with a specific focus on the Southern Apennines River Basin District, by coupling high-resolution climate projections with a large-scale gridded hydrological model.

Future climate forcing was derived from the Global Climate Model MPI-ESM-1-2-HR under the SSP5-8.5 scenario and dynamically downscaled at a convection-permitting scale (~4 km) using the WRF model. Bias-corrected precipitation and air temperature fields were subsequently re-gridded to 1-km resolution and used to force HYGRID-M (an acronym for HYdrological GRIDed – Monthly), a distributed water balance model operating at monthly time scale. HYGRID-M simulates actual evapotranspiration and runoff by integrating climatic inputs with spatially distributed information on land use, soil properties, and topography. The modelling framework was applied to simulate water balance components for the future period 2025–2044 and compared with a observed baseline (2000–2023), analyzing changes in precipitation seasonality and temperature, together with their impacts on evapotranspiration and runoff at both temporal and spatial scales.

Results indicate a marked reduction in summer precipitation and a consistent increase in air temperature across all months, with warming reaching approximately +2°C. Despite higher temperatures, both actual evapotranspiration and runoff exhibited predominantly negative anomalies relative to the observed period, reflecting increased water limitations rather than a persistent long-term decreasing trend. Actual evapotranspiration (AET) exhibited yearly variations ranging from -29% to +16% with a mean of -2% and a standard deviation of 10.2% while runoff (Q) ranged from –39% to +46%, with a mean of –1.3% and a standard deviation of 24%, indicating the strong interannual variability with alternating dry and wetter years. The negligible contribution of snow accumulation and melting under future climatic conditions further alters seasonal runoff dynamics. Spatially, evapotranspiration responses were heterogeneous, with localized increases in Puglia and parts of Basilicata, whereas runoff showed mixed signals, with widespread reductions across Campania, Molise, Abruzzo and parts of Calabria.

Overall, the results highlight a shift toward drier and more variable hydroclimatic conditions in Southern Italy, emphasizing the importance of integrated high-resolution climate–hydrological modelling for supporting climate adaptation and sustainable water resource planning at river basin scale.

How to cite: Dal Sasso, S. F., Aung, H. H., Furnari, L., Senatore, A., and Mendicino, G.: Water availability assessment across Southern Italy under future climate scenarios, EGU General Assembly 2026, Vienna, Austria, 3–8 May 2026, EGU26-14786, https://doi.org/10.5194/egusphere-egu26-14786, 2026.

EGU26-16191 | ECS | PICO | HS7.4

A Study on the Response of Flood Vulnerability to Changes in IDF Characteristics across Major River Basins 

Hyeongbin Pak, Geonwoo Kwak, and Jeongseok Yang

As climate change intensifies the variability of precipitation patterns, understanding the shifts in Intensity-Duration-Frequency (IDF) characteristics is becoming essential for sustainable water resource management. This study aims to investigate the long-term trends of extreme rainfall events across the major river basins of South Korea and evaluate their potential implications for regional flood risk.

The research framework focuses on identifying the transition of rainfall intensities by comparing historical observations with future climate projections. By analyzing how the relationship between rainfall duration and frequency evolves, we expect to characterize the changing nature of hydrologic extremes in different geographical contexts. Furthermore, this study explores the link between these shifting IDF curves and their impact on basin-scale flood responses, aiming to provide a comprehensive assessment of infrastructure resilience.

The anticipated findings will offer a fundamental basis for understanding hydro-climatic risks and contribute to developing more adaptive flood mitigation strategies. This work serves as a preliminary step toward bridging the uncertainty in climate data and practical engineering applications for future-ready disaster management.

How to cite: Pak, H., Kwak, G., and Yang, J.: A Study on the Response of Flood Vulnerability to Changes in IDF Characteristics across Major River Basins, EGU General Assembly 2026, Vienna, Austria, 3–8 May 2026, EGU26-16191, https://doi.org/10.5194/egusphere-egu26-16191, 2026.

EGU26-18542 | ECS | PICO | HS7.4

Hydroclimatic Variability of Cyprus with Emphasis on Extreme Events 

Theodoros Georgiou, Theano Iliopoulou, and Demetris Koutsoyiannis

This project investigates the hydroclimatic variability of Cyprus through an integrated statistical and spatial analysis framework, with emphasis on precipitation and streamflow extremes. The main objectives are to (i) characterize the spatial and temporal variability of rainfall and runoff across the free territory of the Republic of Cyprus by identifying patterns, trends, and extreme events, and (ii) evaluate the stability of rainfall–runoff relationships under both natural and regulated hydrological conditions.

The analysis uses long-term, quality-controlled precipitation and streamflow datasets from Cyprus, comprising 167 daily rainfall series (up to 107 years) and 45 hydrometric records (up to 58 years). Analyses were conducted for multiple minimum record lengths to assess record-length effects and were supported by documented drought events identified using the Standardized Precipitation Index. Spatial rainfall patterns were examined using Inverse Distance Weighting and Ordinary Kriging, while rainfall–runoff relationships were quantified for 12 station pairs using correlation analysis of mean and maximum annual values.

The results demonstrate that mean annual rainfall remains largely stable across all examined temporal scales, indicating long-term stability of average hydroclimatic conditions, whereas maximum annual rainfall exhibits a slight increasing tendency across all records, suggesting a gradual intensification of extreme events rather than changes in total rainfall amounts. Record statistics show consistency between low rainfall records and documented drought periods. Spatial analyses highlight the dominant orographic influence of the Troodos mountain range, with rainfall amounts and variability increasing with elevation, while rainfall–runoff correlations weaken in catchments regulated by hydraulic structures.

Overall, the results indicate a persistent mean hydroclimatic regime accompanied by gradual intensification of extreme precipitation events without a corresponding change in total annual rainfall. The island’s orography remains the dominant control on rainfall patterns, while increasing anthropogenic intervention disrupts the hydrological response.

How to cite: Georgiou, T., Iliopoulou, T., and Koutsoyiannis, D.: Hydroclimatic Variability of Cyprus with Emphasis on Extreme Events, EGU General Assembly 2026, Vienna, Austria, 3–8 May 2026, EGU26-18542, https://doi.org/10.5194/egusphere-egu26-18542, 2026.

EGU26-22780 | ECS | PICO | HS7.4

Co-variability and relative strength of hydroclimatic drivers in the Mediterranean region 

Theano Iliopoulou, Nikos Tepetidis, and Demetris Koutsoyiannis

The Mediterranean region is often described as a “climate change hotspot” in model projections due to pronounced warming signals. However, recent empirical analyses indicate that the hydrological response to regional warming is more nuanced and complex than represented by climate models. In this study, we examine the co-variability of several atmospheric and land–surface drivers that influence the behaviour of key hydroclimatic variables—precipitation, temperature, and evaporation—across the Mediterranean domain. The analysis is based on the ERA5 reanalysis dataset and explicitly distinguishes between land and sea domains to account for their differing dynamical and thermodynamic characteristics. To assess the strength and structure of associations, we employ complementary approaches including feature-importance metrics from machine-learning models and a revised formulation of the impulse response function based on the stochastic covariance structure, suitable for hydroclimatic dynamics. We investigate how different drivers relate to each other across space and scales, and we discuss methodological implications for developing more reliable hydroclimatic scenarios for water-resources and climate-impact studies.

How to cite: Iliopoulou, T., Tepetidis, N., and Koutsoyiannis, D.: Co-variability and relative strength of hydroclimatic drivers in the Mediterranean region, EGU General Assembly 2026, Vienna, Austria, 3–8 May 2026, EGU26-22780, https://doi.org/10.5194/egusphere-egu26-22780, 2026.

EGU26-381 | ECS | Posters on site | HS7.5

Exploring the seasonality of extreme precipitation in Italy: the SEASONEX project 

Dario Treppiedi, Paola Mazzoglio, Leonardo Valerio Noto, and Pierluigi Claps

Abstract

Extreme precipitation events are among the most critical hydro-meteorological hazards in Italy, causing flash floods, landslides, and severe infrastructure damage. In 2023 alone, the extreme rainfall event that triggered floods and landslides in Emilia-Romagna caused 17 fatalities and 8.5 billion euros in damages (SNPA, 2024). While most studies generally focus on how the intensity of precipitation extremes is changing, the shift in their seasonality remains largely unexplored, such as the connection that can exist between these two characteristics. Indeed, extreme precipitation events are generally modulated by localized or large-scale weather conditions that can have a strong seasonal concentration. Moreover, the same precipitation amount can lead to markedly different consequences depending on when it occurs, due to different antecedent conditions (e.g., soil moisture, snowpack, etc.), making timing as important as intensity for risk assessment.

Italy’s complex morphology and climatic variability, from Alpine regions to Mediterranean coasts, lead to diverse seasonal patterns of precipitation extremes driven by atmospheric circulation, orography, and land–sea interactions (Mazzoglio et al., 2025). To the best of our knowledge, no systematic, nation-wide investigation across multiple sub-daily durations using historical rain gauge observations has been conducted to assess potential changes in the seasonality of extreme precipitation, also using intensity-related information.

The SEASONEX (a data-based investigation of the SEASONality of EXtreme rainfall in Italy) project aims to bridge this gap, delivering the first national characterization of the seasonality of extreme precipitation in Italy for durations ranging from 1 to 24 hours. The project is creating an extensive dataset of annual maxima dates by digitizing historical hydrological yearbooks and integrating recent observations from regional agencies, which are combined with magnitude information from the I2-RED database (Mazzoglio et al., 2020). This approach enables a multi-scale characterization of precipitation extremes, identifying predominant or multimodal seasonal concentration across the Italian territory. Beyond descriptive characterization, SEASONEX also investigates the spatial and temporal variability of seasonality. Innovative trend tests based on circular statistics are applied to detect non-stationarity and climate-driven shifts in seasonality, offering insights into how changing atmospheric conditions alter the timing of high-impact events. Finally, to advance risk understanding, the project employs circular–linear copulas to jointly model precipitation magnitude and timing (Treppiedi et al., 2025), enabling an assessment of out-of-season event probabilities.


Acknowledgments

Paola Mazzoglio and Dario Treppiedi gratefully acknowledge the Italian Hydrological Society for awarding the SEASONEX project the Florisa Melone Prize 2025.


References

Mazzoglio, P., Butera, I., & Claps, P. (2020). I2-RED: a massive update and quality control of the Italian annual extreme rainfall dataset. Water12(12), 3308.

Mazzoglio, P., Lompi, M., Marra, F., Dallan, E., Deidda, R., Claps, P., ... & Borga, M. (2025). Orographic and land-sea contrast effects in convection-permitting simulations of extreme sub-daily precipitation. Weather and Climate Extremes, 100798.

SNPA (2024). Il clima in Italia nel 2023. Report ambientali SNPA, n. 42/2024, Rome. https://www.snpambiente.it/wp-content/uploads/2024/07/Rapporto-SNPA-clima-2023.pdf.

Treppiedi, D., Villarini, G., Bender, J., & Noto, L. V. (2024). Precipitation extremes projected to increase and to occur in different times of the year. Environmental Research Letters20(1), 014014.


How to cite: Treppiedi, D., Mazzoglio, P., Noto, L. V., and Claps, P.: Exploring the seasonality of extreme precipitation in Italy: the SEASONEX project, EGU General Assembly 2026, Vienna, Austria, 3–8 May 2026, EGU26-381, https://doi.org/10.5194/egusphere-egu26-381, 2026.

EGU26-575 | ECS | Orals | HS7.5

Downscaling of space-time rainfall using a Bernoulli-lognormal multiplicative framework 

Esteban Gaviria Arias, Carlos Hernández, Aldo Ruano, Israel Villegas Cocone, and Alin Andrei Carsteanu

We present an analytical framework for the space-time downscaling based on Bernoulli-lognormal (BLN, traditionally known as beta-lognormal) multiplicative cascades. Considering recent results about the analytical parametrization of the BLN generator, we derive the explicit relation for obtaining fine-scale statistics directly from the coarse-resolution inputs while preserving the space-time dependence structures characteristic multi-scale extreme precipitation. The method is implemented in an automated workflow on Google Earth Engine, which enters precipitation data in real time and dynamically updates the multifractal parameters to generate high-resolution space-time synthetic fields. We evaluate the performance of the scheme by comparing the disaggregated fields with independent observations. The results indicate that the procedure provides a robust approach for the downscaling of precipitation in hydrometeorological applications and supports improved occurrence probability estimation and uncertainty quantification for extreme events.

How to cite: Gaviria Arias, E., Hernández, C., Ruano, A., Villegas Cocone, I., and Carsteanu, A. A.: Downscaling of space-time rainfall using a Bernoulli-lognormal multiplicative framework, EGU General Assembly 2026, Vienna, Austria, 3–8 May 2026, EGU26-575, https://doi.org/10.5194/egusphere-egu26-575, 2026.

EGU26-611 | ECS | Orals | HS7.5

Hybrid Data-Driven and Enhanced AHP Framework for Flood Susceptibility Mapping 

Amirhossein Haddadi and Ammar Safaie

Flood susceptibility mapping plays a vital role in understanding and mitigating flood hazards, particularly in rapidly urbanizing regions where land-use and climate variability intensify runoff and exposure. Developing reliable susceptibility maps enables planners and decision-makers to enhance resilience, prioritize mitigation strategies, and design future-proof urban infrastructure. The Analytical Hierarchy Process (AHP) is widely applied in multi-criteria flood assessment as it provides a systematic framework to determine the relative importance of topographical and environmental factors affecting flood susceptibility. However, traditional AHP relies on expert judgment or values adopted from previous studies; these subjective weights vary across regions and reduce the accuracy and consistency of susceptibility zonation. The present study establishes a data-driven framework to improve AHP weight determination through machine learning and objective evaluation techniques. The coastal region along Jakarta Bay, Indonesia, which was severely impacted by the extreme flooding event of late December 2019 and early January 2020— caused by exceptionally intense monsoon rains and widespread surface runoff—was selected as the case study. Multiple geospatial layers were incorporated, including DEM, slope, curvature, aspect, TWI, TRI, SPI, STI, distance to river, NDVI, LULC, soil lithology, and rainfall frequency. Four complementary categories of methods were utilized to derive and refine AHP weights which include (1) probabilistic approaches (FR, WoE) and (2) statistical approaches (LR, GAM) and (3) objective weighting techniques (CV, Shannon Entropy, Entropy–CRITIC hybrid) and (4) machine-learning algorithms (RF, XGBoost, CatBoost, AdaBoost, SVM). The proposed hybrid framework enhances AHP objectivity through systematic integration of these methods which creates a solid base for flood susceptibility mapping in urban areas. The resulting susceptibility assessment show improved reliability, transparency, and spatial consistency, which enables planners to make evidence-based decisions for flood-risk management and long-term urban resilience development.

How to cite: Haddadi, A. and Safaie, A.: Hybrid Data-Driven and Enhanced AHP Framework for Flood Susceptibility Mapping, EGU General Assembly 2026, Vienna, Austria, 3–8 May 2026, EGU26-611, https://doi.org/10.5194/egusphere-egu26-611, 2026.

Assessing the statistical behavior of future extreme precipitation is a topical issue for the mitigation of pluvial and flood risk. There is increasing evidence that extreme short-duration precipitation is intensifying, but the quantification of such increase is still a challenging issue. Using one of the longest available daily precipitation series—continuously recorded in Bologna since 1 January 1813—we applied five extreme precipitation indices (Rx1day, R99p, R10mm, R20mm, and R99d) to evaluate the ability of 22 bias-corrected CMIP6 climate models in reproducing historical precipitation statistics. On this basis, we compared a dynamic weighted multi-model ensemble (DW-MME) based on multi-objective Pareto optimization with an equal-weighted multi-model ensemble (EW-MME) and individual models. We further assessed the performance of the DW-MME in projecting XXIst century changes under different emission scenarios. The results show that the DW-MME provides a substantially more robust and credible representation of extreme precipitation than both the EW-MME and single-model simulations. Under high emission scenario, future extremes exhibit a clear more extreme response, with the precipitation distribution shifting toward stronger and more extreme events, revealing a pronounced dependence on climate forcing.

How to cite: Lai, Y., Guo, R., and Montanari, A.: Extreme future precipitation in Bologna: an exploration based on different weighted multi-model ensemble methods, EGU General Assembly 2026, Vienna, Austria, 3–8 May 2026, EGU26-1166, https://doi.org/10.5194/egusphere-egu26-1166, 2026.

EGU26-1559 | ECS | Orals | HS7.5 | Highlight

Extending tropical cyclone risk assessment through recovery simulations 

Simona Meiler, Nikola Blagojevic, Meredith Lochhead, and Jack W. Baker

Extreme weather events such as tropical cyclones increasingly threaten societies as climate change amplifies their impacts. While climate risk assessments have traditionally focused on direct impacts, such as economic losses, population exposure, or mortality, post-disaster recovery remains largely absent from these frameworks, limiting our ability to assess long-term resilience.

This talk presents an approach to integrating recovery modeling into climate risk assessment using open-source, regional disaster recovery simulations that capture key dynamics such as resource constraints and interdependencies across systems.

Results reveal spatial disparities in rebuilding capacity relative to climate risks, highlighting where targeted policy and planning interventions could accelerate recovery and strengthen long-term resilience.

How to cite: Meiler, S., Blagojevic, N., Lochhead, M., and Baker, J. W.: Extending tropical cyclone risk assessment through recovery simulations, EGU General Assembly 2026, Vienna, Austria, 3–8 May 2026, EGU26-1559, https://doi.org/10.5194/egusphere-egu26-1559, 2026.

EGU26-1983 | ECS | Posters on site | HS7.5

Event-based rainfall-driven flooding in Great Britain using Convection Permitting Models  

Leanne Archer, Laura Devitt, Jeffrey Neal, Gemma Coxon, Paul Bates, Elizabeth Kendon, and Dan Bernie

Current flood risk estimates in Great Britain consider the impacts of climate change using uniform rainfall change factors, which fail to capture the spatiotemporal variability of short-duration, high-intensity rainfall that is vitally important for understanding surface water flood risk. The UKCP Local high-resolution (5 km, hourly) convection-permitting rainfall projections, with 12 ensemble members spanning 1980–2080, offer a unique opportunity to improve flood risk assessment in Great Britain. We developed a national-scale LISFLOOD-FP hydrodynamic model to spatiotemporally simulate 120,000 extreme rainfall events across Great Britain, examining how changes in short-duration rainfall influence surface water flood risk at the national scale and how these relationships evolve over time under climate change. We present the first comprehensive assessment of current and future changes in the frequency and severity of surface water flooding across Great Britain. Our results demonstrate the importance of explicitly representing spatiotemporal rainfall variability and its projected evolution in flood risk assessments, and highlight the value of an event-based approach for understanding current and future surface water flood risk in a changing climate.

How to cite: Archer, L., Devitt, L., Neal, J., Coxon, G., Bates, P., Kendon, E., and Bernie, D.: Event-based rainfall-driven flooding in Great Britain using Convection Permitting Models , EGU General Assembly 2026, Vienna, Austria, 3–8 May 2026, EGU26-1983, https://doi.org/10.5194/egusphere-egu26-1983, 2026.

EGU26-3126 | ECS | Posters on site | HS7.5

Beyond Historical Records: Using Counterfactual Scenarios to Improve Flood Risk Management 

Paul Voit, Felix Fauer, and Maik Heistermann

Floods caused by heavy precipitation events (HPEs) rank among the most damaging natural hazards. Under climate change, HPEs are projected to intensify in both spatial extent and rainfall magnitude. Yet extreme rainfall does not necessarily translate into extreme flooding because flood severity depends on the spatial coincidence of intense rainfall with catchments that have the hydrological properties to produce extreme floods. Such rare alignments may be poorly captured in historical observations, rendering conventional flood risk assessment, typically based on stream gauge records and extreme value analysis (EVA), inherently uncertain.

To address this uncertainty, counterfactual analysis - exploring alternative, hypothetical event scenarios - can help remove randomness in the spatial distribution of rainfall and reduce the element of surprise. Advances in precipitation monitoring, such as weather radar, together with increased computational capacity, now enable the systematic application of counterfactual approaches in flood risk management. This way the data basis can be artificially broadened. As a result, the method is gaining momentum in both the United States and Europe, supporting the development of more robust flood scenarios, also for ungauged catchments.

We introduce a framework to include counterfactual scenarios in conventional EVA for flood hazard assessments, with a particular focus on flash floods, and demonstrate that this approach substantially improves the anticipation of extreme floods. However, a central challenge lies in ensuring the physical plausibility of counterfactual scenarios. We therefore present and compare multiple methods for selecting counterfactual events and evaluate their influence on overall EVA-based hazard estimates. By identifying potential flood hotspots and reducing uncertainty, counterfactual thinking offers a valuable tool for disaster risk management, particularly in data-scarce regions.

How to cite: Voit, P., Fauer, F., and Heistermann, M.: Beyond Historical Records: Using Counterfactual Scenarios to Improve Flood Risk Management, EGU General Assembly 2026, Vienna, Austria, 3–8 May 2026, EGU26-3126, https://doi.org/10.5194/egusphere-egu26-3126, 2026.

EGU26-4494 | ECS | Orals | HS7.5

Multi-scale impacts of climate change on flash floods in a heterogeneous, mixed land-use Mediterranean catchment 

Omri Levin, Yair Rinat, Moshe Armon, and Efrat Morin

Flash floods are a major natural hazard in Mediterranean regions, causing significant damage to property, infrastructure, and loss of life. Climate change plays a crucial role in altering rainfall patterns, thereby directly affecting flash-flood behavior. The Mediterranean, a recognized climate change hotspot, is expected to experience more intense extreme rainfall events alongside decreasing total rainfall, both of which may influence flash-flood severity, with responses further modulated by land-use characteristics. Despite substantial research efforts, key gaps remain in understanding flash floods across scales, particularly regarding event-based assessments using high spatiotemporal resolution distributed models capable of capturing flash-flood dynamics in heterogeneous catchments and their sensitivity to climate-driven rainfall changes across catchment sizes, land-use types, and local rainfall characteristics.

This study addresses these gaps by investigating flash-flood behavior in the large Mediterranean Yarkon–Ayalon catchment, located in central Israel, covering 1,800 km². The catchment is characterized by pronounced spatial heterogeneity. The upper part is mountainous and dominated by natural and forested areas on highly permeable Terra Rossa soils, resulting in high infiltration rates. In contrast, the lower part of the catchment is flatter and characterized by lower infiltration rates due to heavy Grumusol soils underlying extensive agricultural land and widespread urban development, with built-up areas covering approximately 70% of the area, promoting rapid runoff generation during rainfall events. A unique streamflow network in the catchment includes 14 hydrometric stations spanning a wide range of spatial scales (7–953 km²) and dominant land use, enabling a multi-scale, multi-land-use evaluation of flash-flood response.

We employ the Grid-Based Hydrological Distributed Runoff (GB-HYDRA) model, an event-based, high-resolution (100 m, 5 min) hydrological model, developed to capture runoff and flash-flood dynamics. The model’s input includes high-resolution radar rainfall data, and it computes runoff at each grid cell and streamflow at any channel cell. To calibrate and evaluate model performance, 37 historical flash flood events with varying intensities and durations are simulated. Of these events, 24 were used for calibration and 13 for independent validation, and 5 hydrometric stations are excluded from calibration, allowing a fair evaluation of the model’s ability to simulate streamflow in ungauged locations. Calibration is performed using a multi-objective optimization approach, resulting in moderate overall model performance, with KGE values of approximately 0.75 for runoff volume and 0.70 for peak discharge across stations and spatial scales.

As a next step, we utilize high-resolution rainfall simulations for a set of storms, derived from the Weather Research & Forecasting (WRF) model under historical conditions and end-of-century projections (RCP8.5), as input to the calibrated hydrological model. The analysis focuses on comparative changes in flash-flood properties across different parts of the catchment and as a function of spatial scale and dominant land use. The results will provide insight into the processes linking changing rainfall patterns to flash-flood response, advancing understanding of flash-flood dynamics across scales in Mediterranean catchments and supporting improved flash-flood risk assessment under climate change.

How to cite: Levin, O., Rinat, Y., Armon, M., and Morin, E.: Multi-scale impacts of climate change on flash floods in a heterogeneous, mixed land-use Mediterranean catchment, EGU General Assembly 2026, Vienna, Austria, 3–8 May 2026, EGU26-4494, https://doi.org/10.5194/egusphere-egu26-4494, 2026.

EGU26-7580 | Orals | HS7.5

Managing Drought Risk with Parametric Insurance: Addressing Food Insecurity in Senegal  

Sumeet Kulkarni, Shubham Choudhary, Dorra Berraies, and Kavit Khagram

Agricultural production is highly sensitive to drought and extreme droughts are projected to increase globally in both frequency and severity. Agriculture accounts for more than 80 percent of drought related economic losses, estimated at USD 29 billion, globally. For subsistence farmers, timely financial assistance is critical to prevent prolonged income losses and worsening food insecurity. Parametric insurance helps address this need by triggering rapid payouts based on objectively measured and observed climatic conditions- rather than post-event loss assessments- thereby enabling faster and more predictable compensation.

This study develops a parametric insurance framework to protect vulnerable subsistence farming communities in Senegal against extreme drought and the resulting food insecurity. Agriculture contributes significantly to Senegal’s economy and employs a large share of the population, making the sector and population at large highly exposed to drought risk. The framework uses the Standardized Precipitation Evapotranspiration Index (SPEI) as the primary drought indicator, adjusted for vulnerable population density and crop-specific coefficients to better reflect water requirements across growth stages.The climatic variables used demonstrate a clear relationship with observed yield reductions during drought events. Different SPEI time scales (3, 6,12-months and combinations thereof) are tested against crop calendars and regional climatology to select the most suitable index structure for payouts triggering.

Payout structures are calibrated using historical yield data, food insecurity reports and estimates of affected populations to reduce basis risk. Ground validation and actuarial analysis strengthen the reliability of the index and its link to actual losses, thereby improving payout accuracy. This approach demonstrates the potential of parametric insurance as a scalable and practical tool for managing climate-related agricultural risks and supporting resilience among vulnerable farming communities.

How to cite: Kulkarni, S., Choudhary, S., Berraies, D., and Khagram, K.: Managing Drought Risk with Parametric Insurance: Addressing Food Insecurity in Senegal , EGU General Assembly 2026, Vienna, Austria, 3–8 May 2026, EGU26-7580, https://doi.org/10.5194/egusphere-egu26-7580, 2026.

EGU26-9190 | ECS | Posters on site | HS7.5

Reproducing extremes in continuous stochastic precipitation series 

Andrea Bassi, Francesco Marra, and Elisa Arnone

Weather generators are widely used in impact and risk assessment studies to produce long synthetic series of meteorological variables that reproduce current or future climate statistics and natural variability. Most stochastic weather generators are trained to well reproduce the bulk of the precipitation distribution, but they often fail to adequately represent extremes, leading to poor performance in flood hazard and hydrological risk applications. This limitation becomes particularly critical under climate change, as projected impacts on precipitation are expected to manifest differently for ordinary and extreme precipitation values. Here, we address this issue by integrating parametric Weibull tails estimated using the Simplified Metastatistical Extreme Value (SMEV) approach in ordinary weather generator series using a quantile mapping.

The methodology is tested using the AWE-GEN (Advanced WEather GENerator) model applied to a mountainous case study in Friuli Venezia Giulia (north-eastern Italy), characterized by a mean annual precipitation of ~1650 mm.  The AWE-GEN implements the Neyman-Scott Rectangular Pulse (NSRP) model to reproduce the precipitation process. We generate 500 years of synthetic precipitation at 1 hour resolution for the current climate, and for the horizons 2050 and 2100 under RCP 4.5 and RCP 8.5 scenarios. To this end, we use EURO-CORDEX projections and the Clima Nord-Est platform to estimate the factors of change. Specifically, two different approaches are compared: a stochastic downscaling method implemented in AWE-GEN, which uses the EURO-CORDEX projections to assess the NSRP parameters for the future, and a simplified method that requires direct modification of the NSRP model parameters based on the expected factors of change. The parameters of the Weibull distribution for the future were obtained from transient simulations from a convection-permitting model (Lompi et al., 2025).  The adopted downscaling methods led to significant changes in mean annual precipitation, mean annual number of events and mean intensity per event.

This research received funding from European Union NextGenerationEU – National Recovery and Resilience Plan (PNRR), Mission 4, Component 2, Investment 1.1 -PRIN 2022 – 2022ZC2522 - CUP G53D23001400006.

How to cite: Bassi, A., Marra, F., and Arnone, E.: Reproducing extremes in continuous stochastic precipitation series, EGU General Assembly 2026, Vienna, Austria, 3–8 May 2026, EGU26-9190, https://doi.org/10.5194/egusphere-egu26-9190, 2026.

EGU26-9350 | ECS | Orals | HS7.5

Landlords’ Perceptions of Flood Risk and Adaptation Responsibility: Evidence from a Swedish Survey   

Fredrik Schück, Berit Arheimer, Maurizio Mazzoleni, and Luigia Brandimarte

Effective flood risk mitigation requires action at multiple levels. One key aspect is property-level flood risk management, which aims to decrease flood impacts on a local scale. Commonly, property owners bear the legal responsibility for flood prevention measures. However, about 30 percent of people in the European Union, including Sweden, are tenants who lack both the mandate and responsibility to carry out these measures since they do not own their homes. Instead, a landlord, often a company that rents out multiple housing units, is responsible for flood adaptation. In addition to the lack of mandate, tenants generally have fewer resources than homeowners and can therefore be more vulnerable to natural hazards, increasing the importance of landlord flood adaptation. 

Despite the significant role of landlords in property-level flood management, their perceptions of flood risk and their strategies for implementing flood mitigation measures remain understudied, with previous studies mainly focusing on adaptation among homeowners or households in general. To fill this gap, we surveyed approximately 16% (95 respondents) of corporate landlords in Sweden regarding their perceptions of flood risk, attitudes toward flood mitigation measures, and views on responsibility for flood adaptation. The survey was designed using a combined framework of Protection Motivation Theory (PMT) and the Protective Action Decision Model (PADM). 

The results of our survey show that nearly half of the landlords have experienced flooding, and more than half have taken precautionary measures such as acquiring pumps and improving drainage in and around properties. Yet most landlords also report a low perception of risk for future floods and believe that authorities have a significant responsibility for protecting properties as well. The interaction between landlords and tenants is limited, indicating that tenants may be vulnerable to future flood risks if landlords neglect their flood responsibilities. Our findings highlight the importance of incorporating landlords into broader flood risk management strategies to enhance protection for a large and vulnerable population.   

How to cite: Schück, F., Arheimer, B., Mazzoleni, M., and Brandimarte, L.: Landlords’ Perceptions of Flood Risk and Adaptation Responsibility: Evidence from a Swedish Survey  , EGU General Assembly 2026, Vienna, Austria, 3–8 May 2026, EGU26-9350, https://doi.org/10.5194/egusphere-egu26-9350, 2026.

EGU26-9456 | Orals | HS7.5

A harmonised European database of flood impacts derived from satellite observations 

Claudia D'Angelo, Andrea Betterle, and Peter Salamon

Reliable and spatially consistent information on flood impacts is essential for understanding recent flood risk patterns and supporting risk assessment and management across Europe. However, existing flood impact databases are often fragmented, rely on heterogeneous documentary sources, and provide limited spatial detail, particularly for recent years.

In this contribution, we present a harmonised, event-based European database of flood impacts covering the period 2015–2024. The database provides spatially explicit estimates of flood impacts for flood events detected by the Copernicus Global Flood Monitoring (GFM) system within a pixel-based framework. Flood depth maps derived from SAR satellite observations using a JRC-developed algorithm are combined with harmonised exposure datasets, including population, land use, transport networks and critical infrastructure, to derive indicators of economic and social impacts such as flooded area, affected population, exposed assets and estimated direct economic losses.

Impact indicators are computed for each event and aggregated at NUTS2 administrative level, enabling harmonised regional-scale assessments across Europe. Although individual event-level estimates are subject to uncertainty, the uniform treatment of events allows robust interpretation of relative spatial and temporal patterns of flood impacts.

The results highlight pronounced interannual variability and strong spatial heterogeneity of flood impacts, illustrating that similar numbers of flood events can lead to substantially different impact outcomes depending on their location and affected assets. By providing a systematic, measurement-based perspective on recent flood impacts, this database complements existing documentary-based datasets and offers a valuable resource for flood risk research, model evaluation and European-scale risk assessments.

How to cite: D'Angelo, C., Betterle, A., and Salamon, P.: A harmonised European database of flood impacts derived from satellite observations, EGU General Assembly 2026, Vienna, Austria, 3–8 May 2026, EGU26-9456, https://doi.org/10.5194/egusphere-egu26-9456, 2026.

EGU26-9601 | Orals | HS7.5

Spatio-temporal transitions of disaster vulnerability in Nepal 

Anup Shrestha, Josias Láng-Ritter, Dipesh Chapagain, Maija Taka, and Olli Varis

Climate change, in combination with evolving development pathways, is contributing to increasing disaster risks globally. Understanding these risks requires the assessment of risk components, i.e., hazard, exposure, and vulnerability. Among them, social vulnerability is particularly challenging to assess due to its dynamic nature and the limited data availability in resource-constrained, high-risk countries for instance, Nepal. Existing studies in such regions often utilize open-source census data to assess vulnerability using a composite vulnerability index, but overlook spatio-temporal shifts in vulnerability and its components.

To address this gap, our study explores spatio-temporal disaster vulnerability in Nepal by applying Principal Component Analysis (PCA) to municipal-level population census data of 2011 and 2021. We applied PCA separately to individual vulnerability components of both years to identify changes in explanatory indicators. Then, we illustrate disaster vulnerability across Nepal for 2011 and 2021 and assess how it has changed over the decade. Finally, we investigate changes in central vulnerability components, namely, sensitivity and adaptive capacity.

The PCA reveals both continuity and transformation of drivers of sensitivity and adaptive capacity. Migration and literacy newly emerged in 2021 as principal components in sensitivity, while housing ownership and quality, as well as access to electricity, emerged in adaptive capacity. Overall, we observe a slight increase in the aggregated national vulnerability score, with approximately 45% of municipalities exhibiting high vulnerability classes in 2021. Most urban metropolitan cities and lowland regions (Terai) exhibit increased vulnerability, whereas Far Western regions witnessed a slight decrease in their vulnerability levels. A closer look at the shifts in sensitivity and adaptive capacity reveals that the increase in overall vulnerability was largely driven by a strong decrease in adaptive capacity in metropolitan cities and increased sensitivity in Terai regions. These findings suggest that focusing solely on composite vulnerability might lead to misguided mitigation strategies and that dissecting vulnerability into sensitivity and adaptive capacity offers actionable insights for decision-making. Furthermore, our approach supports multi-hazard risk and impact assessments in data-limited settings.

By investigating the temporal and spatial changes in vulnerability components, our study enhances the understanding of vulnerability dynamics in Nepal over the past decade, developing a refined approach for spatio-temporal index-based vulnerability assessments. To illustrate the potential applications of the findings in disaster risk management, we explored sectoral vulnerability interventions through key informant interviews with relevant authorities. Furthermore, our vulnerability assessment is being employed in a flood impact model that aims to identify the main drivers for reported flood fatalities in Nepal.

How to cite: Shrestha, A., Láng-Ritter, J., Chapagain, D., Taka, M., and Varis, O.: Spatio-temporal transitions of disaster vulnerability in Nepal, EGU General Assembly 2026, Vienna, Austria, 3–8 May 2026, EGU26-9601, https://doi.org/10.5194/egusphere-egu26-9601, 2026.

EGU26-10263 | Orals | HS7.5

Beyond Levees: Controlled Overflows for Managing Residual Flood Risk in the Enza River  

Alessio Domeneghetti, Susanna Dazzi, Paolo Mignosa, Renato Vacondio, Andrea Colombo, and Marta Martinengo

This contribution presents a systematic framework for managing residual flood risk in embanked fluvial systems, focusing on the Enza River (Italy), a right-bank tributary of the Po River. Even with planned structural and maintenance measures, the fluvial system cannot safely convey extreme flood events (e.g., 500-year floods). Under these conditions, controlled overflows implemented through engineered spillways offer a robust risk-mitigation strategy, enabling the controlled release of floodwaters and reducing the consequences associated with accidental levee failure.

The proposed approach integrates two-dimensional hydrodynamic simulations with the PARFLOOD model to delineate levee segments susceptible to overtopping, support the iterative optimization of spillway location and design parameters, and simulate flood inundation resulting from both uncontrolled levee breaches and controlled overflow conditions. Impact analyses are carried out using advanced tools developed under the MOVIDA project to quantify potential damage to population, infrastructure, and economic assets.

The analysis of multiple flood scenarios (ranging from uncontrolled breaches to controlled overflow configurations, with and without complementary mitigation measures) demonstrates the strong potential of controlled overflows through engineered spillways to reduce flood impacts. The results indicate that controlled overflows can reduce inundated areas by up to 80% and direct economic losses by up to 96%, while substantially decreasing population exposure from approximately 7,900 to 64 individuals.

These findings highlight the effectiveness of controlled overflows as a key element of residual flood risk mitigation, particularly when combined with conventional structural interventions. Such an approach enhances system adaptability and supports anticipatory, risk-informed floodplain management, representing a shift from passive flood defense toward proactive resilience-based planning.

How to cite: Domeneghetti, A., Dazzi, S., Mignosa, P., Vacondio, R., Colombo, A., and Martinengo, M.: Beyond Levees: Controlled Overflows for Managing Residual Flood Risk in the Enza River , EGU General Assembly 2026, Vienna, Austria, 3–8 May 2026, EGU26-10263, https://doi.org/10.5194/egusphere-egu26-10263, 2026.

EGU26-11097 | ECS | Posters on site | HS7.5

Groundwater-driven land subsidence as an emerging risk to historical monuments in central Germany 

Wiebke Lehmann, Lukas Römhild, Wolfgang Gossel, and Peter Bayer

Climate change is altering the dynamics of groundwater fluctuations and posing new challenges for groundwater management worldwide. The decline in winter snow cover shifts precipitation infiltration more toward the winter season, while a prolonged vegetation period enhances evapotranspiration, leading to greater summer groundwater depletion. Extreme weather events such as floods and droughts, together with increasing water extraction driven by rising water demand, promote repeated cycles of drying and rewetting in near-surface, unconsolidated sediments. Over time, these cycles alter the hydromechanical properties of the subsoil and increase its susceptibility to deformation and subsidence.

In this study, we investigate these subsidence and deformation processes at historical monuments in central Germany, which have experienced pronounced structural damage. Since 2024, five observation sites of historic churches in the federal states of Saxony and Saxony-Anhalt have been monitored. These sites were selected because they are predominantly located in rural regions, where groundwater systems are comparatively less affected by urban-related stressors, allowing climate-related groundwater fluctuations to be examined with reduced interference from superimposed anthropogenic signals. The monuments were constructed several centuries ago and have remained largely stable over time. However, after several years of extreme weather conditions, significant cracks began to appear around 2016. In some cases, the buildings were temporarily classified as being at risk of collapse. Since the damage did not occur immediately following individual extreme events but developed over an extended period, the long-term trend in subsurface water saturation needs to be investigated. To distinguish persistent drying trends from seasonal fluctuations, quarterly electrical resistivity tomography (ERT) measurements were conducted in the vicinity of the monuments along fixed profiles with lengths of up to 160 m during six field campaigns between April 2024 and November 2025. During the observation period, the electrical resistivity in the shallow subsurface increased significantly, indicating progressive desiccation to a depth of approximately 5 m, with wintertime rewetting insufficient to restore moisture levels. This prolonged desiccation likely induced further shrinkage and deformation, especially in the clay-rich layers. In contrast, a decrease in electrical resistivity was measured in the deeper layers, indicating a higher moisture content compared to the drier upper soil layers. Continued monitoring will further contribute to determining the long-term effects of climate variability on subsurface moisture dynamics, delineating zones with critical moisture changes, and linking these to settlement-prone areas of the monuments.

How to cite: Lehmann, W., Römhild, L., Gossel, W., and Bayer, P.: Groundwater-driven land subsidence as an emerging risk to historical monuments in central Germany, EGU General Assembly 2026, Vienna, Austria, 3–8 May 2026, EGU26-11097, https://doi.org/10.5194/egusphere-egu26-11097, 2026.

EGU26-12883 | ECS | Orals | HS7.5

Pluvial Flood Risk in Megacities under Future Climate and Demographic Scenarios 

Alan Spadoni, Adèle Traineau, Serena Ceola, and Attilio Castellarin

Sub-daily extreme precipitation can trigger severe flooding in urban catchments due to short hydrological response times. Although recent evidences show heterogeneous trends in magnitude and frequency across different regions of the world, rapid soil sealing from urban expansion – outpacing population growth – may significantly amplify pluvial flood risk. This study evaluates projected changes in pluvial flood risk for four megacities (population >10 million in 2010) under the Shared Socioeconomic Pathway-Representative Concentration Pathway (SSP-RCP) 2-4.5 and 5-8.5 from 2020 to 2100. Megacities are selected globally based on geomorphic flood-prone areas, identified through digital elevation and floodplain datasets, and on population hotspots derived from historical gridded data. Pluvial flood hazard is assessed using a DEM-based hierarchical filling-and-spilling algorithm, and compared against detailed hydrodynamic modeling. Vulnerability assessment is conducted at present-day for simplicity, while a data-driven algorithm for predicting future building footprints associated with future demographic scenarios is under development. Results provide insights into how climate and urbanization interact to cast future pluvial flood risk in the world’s largest cities, informing adaptation strategies for sustainable urban planning.

How to cite: Spadoni, A., Traineau, A., Ceola, S., and Castellarin, A.: Pluvial Flood Risk in Megacities under Future Climate and Demographic Scenarios, EGU General Assembly 2026, Vienna, Austria, 3–8 May 2026, EGU26-12883, https://doi.org/10.5194/egusphere-egu26-12883, 2026.

EGU26-14820 | ECS | Posters on site | HS7.5

Attempts to Close the Protection Gap: Preliminary Evaluation of Italy's Compulsory Disaster Insurance Reform for Firms 

Ceren Kale, Mario Lloyd Virgilio Martina, Francesco Dottori, and Mert Sepetoglu

The present study investigates the firm-level impacts of Italy’s recently enacted compulsory insurance law for natural disasters (Law No. 213 of December 30, 2023), with a focus on flood risk. By disaggregating firm data and classifying it by sector, the study compares the number of insured firms with catastrophic (natural hazard) insurance and the total value of insured assets before and after the policy was implemented. Before the reform, the data reveal a market structure in which insurance coverage was held mainly by larger firms, with most SMEs remaining uninsured. The post-policy scenario indicates a substantial structural shift, with near-universal insurance penetration expected among SMEs and a significant expansion in the total insured asset base, despite insured firms increasing at a much faster rate than insured values.

This study also analyzes the various insured values of assets by sector, firm size, and flood hazard zones throughout Italy. Using flood hazard maps, a spatial analysis highlights approximately 1.13 million firms located in areas with varying levels of flood risk. These findings provide a preliminary overview of the expected changes in insurance penetration and geographic exposure resulting from the reform. However, a comprehensive assessment of the reform’s effectiveness in enhancing resilience and reducing risk remains a complex and ongoing challenge that requires further empirical investigation.

How to cite: Kale, C., Martina, M. L. V., Dottori, F., and Sepetoglu, M.: Attempts to Close the Protection Gap: Preliminary Evaluation of Italy's Compulsory Disaster Insurance Reform for Firms, EGU General Assembly 2026, Vienna, Austria, 3–8 May 2026, EGU26-14820, https://doi.org/10.5194/egusphere-egu26-14820, 2026.

The Intermountain Andean basins are characterized by complex topography and rapid peri-urban expansion. The central Paute River basin faces escalating threats from hydrogeomorphological hazards, particularly flash floods and landslides. Currently, in Ecuador, risk management strategies carried out by national and international institutions often lack high-resolution economic quantification of potential damages (Pinos & Timbe, 2020). This research bridges that gap by developing a multi-scalar methodology to quantify physical vulnerability and estimate economic losses, providing a critical tool for evidence-based land management.

This study integrates hydrogeomorphological hazard analysis with socioeconomic exposure modeling. The databases used are high-resolution digital elevation models from the Military Geographic Institute (SIGTIERRAS, 2014) and high-resolution drone surveys in identified active sectors that characterize the hazard (Torres Ramírez & Freire-Quintanilla, 2022). In contrast, this was coupled with microdata from the 2022 Census, provided by the National Institute of Statistics and Census (INEC, 2022), disaggregated to the census sector level. By applying a dasymetric mapping approach and cross-referencing building typologies with the 2025 Construction Price Index (IPCO) in Ecuador, we established a robust valuation framework for the building stock based on structural vulnerability and replacement costs.

The results reveal a distinct spatial correlation between high-vulnerability clusters and historical hazard events, particularly in the peri-urban periphery of the cantons Biblián, Azogues, Déleg, Paute, and Guachapala, which are among the cantons with the highest migration rates in Ecuador. These areas, defined by steep slopes and non-engineered masonry, exhibit the highest potential for economic loss. Conversely, consolidated urban centers demonstrate lower vulnerability despite high exposure density. This study indicates that integrating census-derived socioeconomic data into physical hazard models significantly refines risk estimation, offering a replicable framework for Disaster Risk Reduction (DRR) in the Andean region.

References:

INEC. (2022). Censo de Población y Vivienda. https://www.censoecuador.gob.ec/data-y-resultados/#pix-tab-398c8f9c-4977318

Pinos, J., & Timbe, L. (2020). Mountain Riverine Floods in Ecuador: Issues, Challenges, and Opportunities. Frontiers in Water, 2. https://doi.org/10.3389/frwa.2020.545880

SIGTIERRAS. (2014). Mosaicos de ortofotos a nivel nacional. Sistema Nacional de Información de Tierras Rurales e Infraestructura Tecnológica. Quito, Ecuador. https://bit.ly/2twJiRn

Torres Ramírez, R., & Freire-Quintanilla, K. (2022). Vehículos aéreos no tripulados en el análisis y monitoreo de eventos adversos en la zona centro de la cuenca del río Paute, Ecuador. XVII Coloquio Ibérico de Geografía, 312–331.

How to cite: Torres-Ramírez, L., Torres-Ramírez, R., and Marco-Molina, J. A.: Integrating a multi-scalar methodology to estimate vulnerability and economic losses for hydrogeomorphological risk assessment in the central Paute River basin, Ecuador, EGU General Assembly 2026, Vienna, Austria, 3–8 May 2026, EGU26-15247, https://doi.org/10.5194/egusphere-egu26-15247, 2026.

EGU26-16266 | Orals | HS7.5

Territorial expansion and hydroclimatic change as drivers of landslide risk in Brazil 

Gean Paulo Michel, Franciele Zanandrea, Nelson Fernandes, Danúbia Teixeira, Artur Cereto, Rodrigo Loureiro, and Clara Cardoso

Landslides are among the most damaging natural hazards in Brazil. While impacts have long been concentrated in steep coastal mountain ranges, particularly in the Southeast, recent extreme rainfall events and expanding human occupation point to a broader and more complex national risk landscape. Because landslide occurrence is shaped by both hydro-meteorological forcing and land-use and settlement dynamics, a key question is how hydroclimatic shifts and territorial expansion interact with pre-existing susceptibility to shape hazard, exposure, vulnerability, and overall risk at the country scale.

Here we present a national-level assessment integrating: (i) landslide-susceptible terrain, (ii) geomorphometric controls, (iii) a spatial classification of hydrological-cycle tendencies, and (iv) population characteristics derived from census-based spatial units, together with indicators of spatial expansion. Susceptibility is represented through a nationalized interpretation of an existing global framework that combines topographic factors with proxies for geology, vegetation disturbance, and infrastructure. Terrain attributes are derived from elevation-based products, and hydroclimatic tendencies are summarized using a nationwide synthesis describing contrasting modes of hydrological-cycle change. All datasets are integrated at the census-tract scale, enabling direct comparisons among susceptibility patterns, hydroclimatic tendencies, and population distribution and expansion.

Results show that areas mapped as more susceptible often coincide with zones of higher human presence, indicating that exposure remains elevated where terrain conditions are unfavorable. In addition, vectors of population expansion frequently point toward more susceptible areas, which commonly include settlements with higher vulnerability. When hydroclimatic tendencies are intersected with the higher susceptibility classes, “drying” conditions appear more widespread, whereas “acceleration” occupies a smaller, yet still meaningful, portion of susceptible terrain. These patterns motivate two working hypotheses. First, in regions tending toward drying, a potential reduction in rainfall frequency or totals may lower landslide occurrence in typical years, but could also create conditions for larger responses during rare, high-intensity storms. Second, in regions tending toward hydrological acceleration, increases in rainfall intensity and/or event clustering are expected to promote more frequent triggering, consistent with observed behavior in well-known Brazilian hotspots.

Overall, this synthesis suggests that hydroclimatic tendencies may steer landslide regimes in different directions across Brazil, while continued settlement expansion increases exposure in susceptible terrain.

How to cite: Michel, G. P., Zanandrea, F., Fernandes, N., Teixeira, D., Cereto, A., Loureiro, R., and Cardoso, C.: Territorial expansion and hydroclimatic change as drivers of landslide risk in Brazil, EGU General Assembly 2026, Vienna, Austria, 3–8 May 2026, EGU26-16266, https://doi.org/10.5194/egusphere-egu26-16266, 2026.

EGU26-16376 | ECS | Posters on site | HS7.5

Spatio-Temporal Evolution of Compound Hydro-Climatic Extremes in a Monsoon-Dominated River Basin in India 

Abhimanyu Verma, Kamlesh Kumar Pandey, and Suresh Kumar

Abstract

Understanding the spatio-temporal evolution of compound hydro-climatic extremes is critical for assessing climate-related risks in monsoon-dominated river basins. This study examines long-term changes in rainfall and temperature extremes across the Damodar River Basin, India, using station-based extreme climate indices derived from daily observations. Fifteen meteorological stations representing diverse physiographic and climatic conditions within the basin were analyzed to capture spatial variability and temporal evolution of hydro-climatic extremes.

A comprehensive suite of rainfall-based indices (CDD, CWD, PRCPTOT, R10mm, R20mm, R95p, R99p, RX1day, RX5day, and SDII) and temperature-based indices (TNn, TNx, TXn, TXx, and DTR) was employed to characterize changes in the frequency, intensity, and persistence of extreme events. Monotonic trends in individual indices were assessed using the non-parametric Mann–Kendall test, while Sen’s slope estimator was applied to quantify the magnitude of change. Statistical significance was evaluated at the 95% confidence level, ensuring robustness against non-normality, outliers, and data heterogeneity commonly associated with hydro-climatic time series.

To investigate compound behavior, rainfall and temperature extremes were jointly interpreted within the framework of hot–wet, hot–dry, and wet–cold event combinations. Station-wise comparisons of trend direction and magnitude were used to identify spatial patterns and emerging hotspots of compound hydro-climatic extremes across the basin. The results reveal pronounced upstream–downstream contrasts and substantial regional heterogeneity in the evolution of compound extremes, reflecting the combined influence of monsoon dynamics, topographic variability, and local climatic conditions.

The proposed framework offers a systematic and data-efficient approach for analyzing the spatio-temporal evolution of compound hydro-climatic extremes using observed climate indices. The findings provide valuable insights for basin-scale climate risk assessment and support informed decision-making related to water resources management, infrastructure resilience, and disaster risk reduction in monsoon-affected river basins.

Keywords

Compound hydro-climatic extremes; Extreme climate indices; Trend analysis; Spatio-temporal variability; Damodar River Basin.

How to cite: Verma, A., Pandey, K. K., and Kumar, S.: Spatio-Temporal Evolution of Compound Hydro-Climatic Extremes in a Monsoon-Dominated River Basin in India, EGU General Assembly 2026, Vienna, Austria, 3–8 May 2026, EGU26-16376, https://doi.org/10.5194/egusphere-egu26-16376, 2026.

EGU26-16976 | Posters on site | HS7.5

Analysis of Underground Flooding Phenomena and Decision Support Using 3D CFD Simulation 

Jeong Ah Um, Sungsu Lee, and Seulgi Lee

The frequency of underground flooding has been increasing due to the intensification of extreme rainfall events and rapid urbanization. Three-dimensional (3D) CFD simulations enable the analysis of complex flow behaviors that are difficult to capture using two-dimensional (2D) models, particularly in areas with large hydraulic gradients, where turbulent and vortical flows frequently occur. In addition, the CFD simulations allow for detailed representation of structural effects, including buildings, underground facilities, and flood protection structures such as flood barriers.

In this study, an underground parking facility within a multi-use building is selected as a case study to analyze flood hydraulics in underground spaces. The flooding process is analyzed in both spatial and temporal dimensions to identify the onset time of inundation and the progression of flood depths. Based on this analysis, evacuation times are estimated to support decision-making for emergency response and flood risk management in underground facilities.(This research was supported by a grant(RS-2025-02313776) of the Regional Customized Disaster-Safety R&D Program funded by Ministry of Interior and Safety(MOIS, Korea).)

How to cite: Um, J. A., Lee, S., and Lee, S.: Analysis of Underground Flooding Phenomena and Decision Support Using 3D CFD Simulation, EGU General Assembly 2026, Vienna, Austria, 3–8 May 2026, EGU26-16976, https://doi.org/10.5194/egusphere-egu26-16976, 2026.

Translating global climate projections into decision-relevant information for climate adaptation is a critical hurdle for applied geosciences. This study presents a climate-informed landslide risk mapping framework developed for Taiwan, designed to bridge climate science with operational landslide risk management under climate change. Statistically downscaled daily precipitation projections from CMIP6 are employed to characterize future rainfall extremes, integrating them with geological susceptibility, bare land ratio, and population density to represent hazard, vulnerability, and exposure, respectively. Relative landslide risk is assessed using a quantile-based classification approach under Global Warming Levels (GWLs) of 1.5 °C, 2 °C, and 4 °C. To support applications across multiple decision scales, landslide risk maps are generated at 5 km grid resolution for regional-scale screening, at the township level for administrative planning, and at minimum statistical areas for detailed exposure assessment. The results demonstrate a consistent intensification of landslide risk with increasing global warming levels. Significantly, mountainous regions in northern and eastern Taiwan exhibit a nonlinear expansion of high-risk clusters under the 4 °C warming scenario, indicating heightened sensitivity to extreme precipitation changes. To explicitly address uncertainty in climate model projections, the framework incorporates a risk credibility indicator based on inter-model agreement, enabling a transparent interpretation of model robustness and avoiding deterministic use of climate projections. The framework has been operationalized through the Climate Change Disaster Risk Adaptation Platform (Dr. A), a web-based geospatial decision-support system that allows users to visualize landslide risk patterns across warming scenarios and to perform spatial overlay analyses with infrastructure datasets such as transportation networks and settlements. By providing multi-scale and scenario-based risk information, this study contributes a transferable methodology for integrating climate projections into landslide risk assessment and adaptation planning within regions.

How to cite: Chen, Y.-J., Lin, H.-J., and Liou, J.-J.: Bridging Climate Science and Adaptation Plan: Operationalizing Landslide Risk Management under Climate Change Scenarios, EGU General Assembly 2026, Vienna, Austria, 3–8 May 2026, EGU26-17656, https://doi.org/10.5194/egusphere-egu26-17656, 2026.

EGU26-17901 | Posters on site | HS7.5

A quality-controlled hourly precipitation dataset for the analysis of intense precipitation over Italy 

Leonardo Valerio Noto, Dario Treppiedi, Cesar Arturo Sanchez Pena, Matteo Darienzo, Assumpta Ezeaba, Uzair Khan, Roberta Paranunzio, Antonio Francipane, Elisa Arnone, Francesco Marra, and Marco Marani

Despite the growing abundance of precipitation datasets, the availability of high temporal and spatial resolution observations from rain gauges is still limited and fragmented. However, these data are essential especially when the focus is on intense precipitation, since other products (e.g., satellite, radar, and reanalysis) may be affected by important biases.

In Italy, hourly precipitation measurements are managed independently by regional or sub-regional institutions, resulting in the absence of a unified national-scale dataset. To address this gap, we present the first comprehensive hourly precipitation database for Italy, obtained by integrating observations from ~ 3,000 continuously monitoring rain gauges. The database spans several decades, with some time series beginning in the early 1980s, while the highest spatial coverage is achieved from the early 2000s up to 2024. An extensive pre-processing phase was carried out to standardize and organize the dataset, e.g., by removing duplicate stations and standardizing the coordinates and the timing to a common reference system. To ensure data reliability and consistency, a comprehensive quality control procedure was also applied, by adapting to the specific characteristics of the Italian climate a set of well-established methodologies from the literature (e.g., Blenkinsop et al., 2017, Lewis et al, 2021). Quality control was designed to identify and correct common issues such as the erroneous aggregation of daily totals into single hourly records, outliers (detected using statistical thresholds based on observed data extremes), and unrealistically high values occurring after prolonged data gaps, usually indicative of sensor malfunction.

The resulting dataset represents a robust basis for a wide range of applications. For instance, it allowed us to characterize how intense precipitation is distributed across the Italian territory in terms of magnitude and seasonality, and to further investigate the diurnal cycle of extreme rainfall. Another key outcome concerns the probabilistic analysis of extreme precipitation. Although the temporal extent of the dataset is not adequate to support analyses based on classical extreme value theory, it can be analyzed with more effective recent approaches, such as the MEV (Marani & Ignaccolo, 2015) and the SMEV (Marra et al., 2019) frameworks. Finally, beyond research applications, the dataset offers a valuable support for risk management, adaptation planning, and infrastructure design under changing climate conditions.


Acknowledgments

This research received funding from European Union NextGenerationEU – National Recovery and Resilience Plan (PNRR), Mission 4, Component 2, Investiment 1.1 - PRIN 2022 – 2022ZC2522 - CUP G53D23001400006.


References

Blenkinsop, S., Lewis, E., Chan, S. C., & Fowler, H. J. (2017). Quality‐control of an hourly rainfall dataset and climatology of extremes for the UK. International Journal of Climatology, 37(2), 722-740.

Lewis, E., Pritchard, D., Villalobos-Herrera, R., Blenkinsop, ... & Fowler, H. J. (2021). Quality control of a global hourly rainfall dataset. Environmental Modelling & Software, 144, 105169.

Marani, M., & Ignaccolo, M. (2015). A metastatistical approach to rainfall extremes. Advances in Water Resources, 79, 121-126.

Marra, F., Zoccatelli, D., Armon, M., & Morin, E. (2019). A simplified MEV formulation to model extremes emerging from multiple nonstationary underlying processes. Advances in Water Resources, 127, 280-290.

How to cite: Noto, L. V., Treppiedi, D., Sanchez Pena, C. A., Darienzo, M., Ezeaba, A., Khan, U., Paranunzio, R., Francipane, A., Arnone, E., Marra, F., and Marani, M.: A quality-controlled hourly precipitation dataset for the analysis of intense precipitation over Italy, EGU General Assembly 2026, Vienna, Austria, 3–8 May 2026, EGU26-17901, https://doi.org/10.5194/egusphere-egu26-17901, 2026.

EGU26-18066 | Orals | HS7.5

Understanding and modelling Tropical Cyclone risk in Oman  

Carlotta Scudeler, Daniel Richards, Jesen Kurien, and Marco Carenzo

In recent years Oman and the MENA region have been significantly impacted by Tropical Cyclones (TC) which, on top of affecting the society in various aspects, have also led to unprecedented (re)insurance losses. Notable cyclones include Gonu (2007), Mekunu (2018), and Shaheen (2021). For instance, this last developed from the remnants of TC Gulab and made landfall on the coast of Al-Musannah, Oman, on 3rd October 2021 as a Category 1 Cyclone, while causing strong winds and heavy rainfall also around the capital city of Muscat and, in turn, deaths and widespread damage to both public and private properties. It is thus of increasing importance to accurately understand and reproduce TC risk in Oman. In general, this can serve to predicting and preparing for any event and, in the context of the (re)insurance industry, to avoid poor risk assessment and weak financial protection.

Reproducing and quantifying TC risk in Oman results still very challenging, mainly because it can be considered as an unmodelled country, i.e., it is not part of the domain of main catastrophe model vendors. In this study it is shown how Antares Global, under Qatar Insurance Company, the main insurance in the region, has faced this challenge in developing its own TC view of risk and catastrophe model for Oman. The study has mostly focused on the Wind component of the model, which consists of 10,000 years of stochastic catalogue relying on IBTracs data; a claim-based vulnerability module for main line of business, i.e., commercial, residential, and industrial, adjusted to four recent historical events; and a financial module that considers the conditional probability of having a loss, also in this case calibrated to the same recent historical experience.

It is shown how it has been possible to converge to a robust View of Risk with best combining the three main components of the model and adjusting them to the input exposure. Claim data has also required a detailed analysis to isolate the windstorm component from the flood and efficiently use it for the validation. Ongoing work is looking at expanding the framework to include the TC and extra tropical cyclones flood components.

How to cite: Scudeler, C., Richards, D., Kurien, J., and Carenzo, M.: Understanding and modelling Tropical Cyclone risk in Oman , EGU General Assembly 2026, Vienna, Austria, 3–8 May 2026, EGU26-18066, https://doi.org/10.5194/egusphere-egu26-18066, 2026.

EGU26-18165 | ECS | Posters on site | HS7.5

Climate Change Induced Extreme Rainfall and Its Impacts on Large Reservoir Systems: A Non-Stationarity Perspective 

Dinesh Roulo, Naveen Kumar Nakka, Iqra Mansuri, and Subbarao Pichuka

Design Flood (DF) inputs for large reservoir systems, such as Intensity-Duration-Frequency (IDF) curves and Probable Maximum Precipitation (PMP), are traditionally derived under stationarity assumptions, which are increasingly challenged under a changing climate. The current study examines changes in extreme rainfall characteristics across ten important dams in the Godavari River Basin (GRB), India, under three climate scenarios (SSP1-2.6, SSP2-4.5, and SSP5-8.5). Daily rainfall projections from the NEX-GDDP-CMIP6 dataset are evaluated against gridded observations of the India Meteorological Department (IMD) for the historical period (1951-2014). Nine statistical performance metrics, combined with five Multi-Criteria Decision-Making (MCDM) methods and a Group Decision-Making (GDM) framework, are used to identify the best-performing (top-five) Global Climate Models (GCMs). Based on this evaluation, five GCMs – BCC-CSM2-MR, CMCC-ESM2, MPI-ESM1-2-HR, MPI-ESM1-2-LR, and NESM3 are selected for GRB. Next, non-stationarity in extreme rainfall is assessed using epoch-wise analysis, trend detection methods (Mann-Kendall test and Sen’s slope estimator), and a change-point detection technique (Pettitt’s Test). The results of statistical analyses show significant increases in short-duration rainfall extremes in recent decades. Subsequently, IDF curves are developed for multiple return periods (100-, 200-, 500, and 1000-year) using the Gumbel distribution (GEV-1). The results revealed a robust intensification of short-duration rainfall extremes under future climate scenarios, with SSP5-8.5 exhibiting the largest increases, implying that stationary design assumptions may underestimate future dam safety risks. Furthermore, PMP is estimated using the Hershfield method, and the results indicated increases ranging from 8.55% to 44.11% across the selected dam locations. Overall, the study underscores the necessity of revisiting stationary design assumptions and offers a scalable framework for climate-resilient design storm estimation for large reservoir systems. While increases in PMP are evident, their direct application without field-level validation may lead to over- or under-conservative design decisions. Hence, future work should focus on reconciling model-based PMP estimates with observed extreme events, local meteorological records, and dam-specific field conditions, alongside hydrological and reservoir routing analyses, to support robust and reliable dam safety assessments.

Keywords: Climate Change, Non-stationarity, Intensity-Duration-Frequency (IDF), Probable Maximum Precipitation (PMP), NEX-GDDP-CMIP6 models

How to cite: Roulo, D., Nakka, N. K., Mansuri, I., and Pichuka, S.: Climate Change Induced Extreme Rainfall and Its Impacts on Large Reservoir Systems: A Non-Stationarity Perspective, EGU General Assembly 2026, Vienna, Austria, 3–8 May 2026, EGU26-18165, https://doi.org/10.5194/egusphere-egu26-18165, 2026.

EGU26-18553 | ECS | Orals | HS7.5

Towards a global assessment of rooftop rainwater harvesting for hydro-meteorological hazard mitigation 

Yueli Chen, Andrea Reimuth, and Xiao Xiang Zhu

Urban areas worldwide are increasingly exposed to hydro-meteorological extremes, including intense rainfall events and prolonged dry periods, which exacerbate flood hazards and water scarcity. Rooftop rainwater harvesting is widely discussed as a decentralised adaptation option that may contribute both to urban water supply and to the mitigation of hydrological extremes. However, existing assessments are largely limited to local case studies, and a consistent global-scale framework that links rooftop harvesting potential to hydro-meteorological hazard characteristics is still missing.

In this contribution, we present a global assessment framework to quantify the potential of rooftop rainwater harvesting using high-resolution building footprint data in combination with reanalysis-based precipitation datasets. The approach integrates detailed global building roof areas (LoD1) with ERA5-Land precipitation data for the period 2014–2024. Mean monthly precipitation climatologies are used to estimate long-term average harvestable water volumes, while daily precipitation data are considered to characterise precipitation intensity, seasonality, and temporal continuity relevant for flood and drought mitigation. Capture efficiency is applied to account for system-level losses.

By explicitly combining multiple precipitation timescales, the proposed framework enables a differentiated interpretation of rooftop rainwater harvesting potential under varying hydro-climatic regimes. While monthly precipitation provides a basis for estimating average water supply contributions, daily-scale metrics enable the assessment of conditions under which rooftop harvesting may be relevant for mitigating flood peaks or buffering dry spells. The study aims to provide a globally consistent, spatially explicit basis for evaluating rooftop rainwater harvesting as a complementary measure for increasing urban resilience to hydro-meteorological hazards.

How to cite: Chen, Y., Reimuth, A., and Zhu, X. X.: Towards a global assessment of rooftop rainwater harvesting for hydro-meteorological hazard mitigation, EGU General Assembly 2026, Vienna, Austria, 3–8 May 2026, EGU26-18553, https://doi.org/10.5194/egusphere-egu26-18553, 2026.

EGU26-19249 | ECS | Orals | HS7.5

Global changes in Compound Spatial Precipitation 

Tiantian Xing, Carlo De Michele, and Günter Blöschl

Compound spatial precipitation events, occurring when extreme or moderate precipitation values manifest simultaneously or in sequence across multiple regions, amplify hydrological risks far beyond those of isolated events. This study assesses, at global scale, changes in compound spatial precipitation from 1980 to 2024, enabling the disentanglement of the individual contributions of spatial extent and intensity across regions. Our findings reveal that the expansion rate of the concurrent spatial area generally outpaces its intensification rate globally. This divergence is particularly pronounced in the tropical zone, suggesting that enhanced moisture supply in a warming atmosphere may be driving the increased spatial organization of extremes.

How to cite: Xing, T., De Michele, C., and Blöschl, G.: Global changes in Compound Spatial Precipitation, EGU General Assembly 2026, Vienna, Austria, 3–8 May 2026, EGU26-19249, https://doi.org/10.5194/egusphere-egu26-19249, 2026.

EGU26-19735 | ECS | Posters on site | HS7.5

Socio-economic impacts, characteristics, and perception of floods in the European Union and the Middle East and North Africa region 

Mélanie Coleman, Andries-Jan de Vries, Caroline Roberts, and Daniela I.V. Domeisen

Floods represent the most common type of natural disaster worldwide, resulting in devastating socio-economic impacts. While much research has been conducted on flood impacts in the Global North, much less is known about how these impacts vary across regions with different economic and social conditions. Moreover, little is known about how measured impacts compare with public perception of flood risk, which is relevant for how populations respond to flood risk management measures. This study has two main objectives: 1) to quantify and compare flood impacts within and between the European Union (EU) and the Middle East and North Africa (MENA) region using the Emergency Events Database EM-DAT and 2) to compare the recorded impacts with the public perception of flood risk within the EU with the results from the SP547 Eurobarometer survey. More floods were recorded in the EU, and they caused economic losses that were almost two times more important as a proportion of GDP. However, human impacts were nearly four times greater in the MENA region. The seasonality of floods and of their impacts varies strongly across regions, being more prevalent in summer in central and eastern Europe, in autumn in the western Mediterranean, and in autumn and winter in the eastern Mediterranean. The comparison between recorded impacts and public perceptions shows that flood risk is overestimated by the population in northern EU countries and underestimated in southern EU countries. Our results highlight the need for improved flood impact and flood perception data to facilitate flood research, especially in the MENA region where available data is limited yet the population is greatly impacted by flood disasters.

How to cite: Coleman, M., de Vries, A.-J., Roberts, C., and Domeisen, D. I. V.: Socio-economic impacts, characteristics, and perception of floods in the European Union and the Middle East and North Africa region, EGU General Assembly 2026, Vienna, Austria, 3–8 May 2026, EGU26-19735, https://doi.org/10.5194/egusphere-egu26-19735, 2026.

EGU26-19898 | Orals | HS7.5

Hurricane Melissa in Jamaica: humanitarian catastrophe and protection gap in residential buildings 

Jose Luis Salinas Illarena, Sacha Khoury, Jessica Williams, and Arno Hilberts

Melissa made landfall as a Category 5 major hurricane near New Hope, St. Elizabeth Parish in southwestern Jamaica on Tuesday, October 28 2025. It had maximum sustained winds of 295 km/h, and an accumulated precipitation exceeding 600 mm in most of the Caribbean island.

Moody’s RMS Event Response estimated private market insured losses from Hurricane Melissa to be between US$3 billion and US$5 billion. More striking, the total economic losses in Jamaica from this event are expected to be around one order of magnitude higher, and could potentially exceed the island’s GDP, which was approximately US$20 billion in 2024. 

Several field reconnaissance surveys highlighted a dichotomy in Jamaica’s building stock between the insured and uninsured. Most insured buildings (in the industrial and commercial lines, e.g. hotels) are well-built, traditionally designed for seismic risk with concrete or reinforced masonry structures. In contrast, uninsured residential buildings largely exhibit less stringent build quality or enforcement of wind and flood design provisions, due in part to a lack of major hurricane landfalls since Gilbert in 1988. For example the flood insurance penetration in single-family dwelling is estimated to be as low as 7% in the island.

While the capital city of Kingston was largely spared from damaging winds, many other towns were devastated by a combination of catastrophic winds and widespread inland flooding. Being an island, repairs and recovery will inevitably go through significant supply chain challenges, even as several key ports on the island remain operational. For these reasons, recovery efforts are expected to take several months, if not years.

This analysis will explore the modelling behind the loss estimates presented, as well as the humanitarian catastrophe that this event represented for the general population, addressing the issues of the protection gap and building quality in the residential stock.

How to cite: Salinas Illarena, J. L., Khoury, S., Williams, J., and Hilberts, A.: Hurricane Melissa in Jamaica: humanitarian catastrophe and protection gap in residential buildings, EGU General Assembly 2026, Vienna, Austria, 3–8 May 2026, EGU26-19898, https://doi.org/10.5194/egusphere-egu26-19898, 2026.

EGU26-21677 | ECS | Posters on site | HS7.5

Linking vulnerability and impact of floods in Austria – A case study of the flood events in 2024 

Vanessa Streifeneder, Zahra Dabiri, Daniel Hölbling, Maciej Adamiak, Marta Borowska-Stefańska, Szymon Wiśniewski, and Magdalena Magiera

In September 2024, a record rainfall of up to 300 to 400 mm, or even more, fell in northeastern Austria just within five days, leading to massive floods that significantly surpassed a 100-year flood event. In the future, climate change will further increase the frequence and intensity of flooding, making the reduction of risk and damage from floods a continuing challenge. Assessing and understanding social, economic, and environmental vulnerability, alongside resilience, is therefore crucial to strengthening the adaptive and mitigation capacities of communities. Vulnerability is defined as a function of sensitivity, susceptibility, and capacity to cope and adapt. From this perspective, vulnerability describes the tendency or predisposition of exposed elements to suffer adverse effects from flooding. It is determined by physical characteristics of buildings and infrastructure, as well as social, economic, institutional, and environmental conditions that influence the capacity of individuals, households, and communities to anticipate, cope with, and recover from floods.

Knowledge of flood hazards and exposure has improved significantly in recent years. However, the assessment of vulnerability remains a major challenge. Detailed insights on municipality level are needed to evaluate and improve current protection measures for residents and mitigation strategies. Therefore, it is important to understand how vulnerability relates to flood impacts not only theoretically but also practically. In this study, we conduct a pre-event vulnerability assessment of Austrian municipalities affected by a major flood event in 2024 and evaluate if lower vulnerability correlates with a lower impact (e.g. fewer affected buildings and infrastructure, lower economic damage), and vice versa.

The exposure, susceptibility, and resilience of affected communities will be analysed to create an indicator-based vulnerability index. Based on a literature review, a set of indicators will be defined, including socio-economic (e.g. age, income), physical (e.g. proximity to rivers, elevation) and other (e.g. accessibility to health services, land use) data. The indicators are normalized and statistically weighted using machine learning techniques, such as regression analysis or random forest. The flood extent will be derived from the Copernicus Sentinel-1 Synthetic Aperture Radar (SAR) satellite data. Geospatial data will be used to obtain for example, accessibility, land use data and statistical data will be used for obtaining socio-economic or demographic information per municipality. Finally, the calculated flood vulnerability index will be evaluated by comparison with observed flood impacts, SAR-derived flood extent, as well as official flood risk maps.

Our findings will improve the understanding of the factors influencing the vulnerability of communities to floods and how vulnerability is linked to the impact of major flood events in Austria. The results can support policymakers in formulating recommendations for those responsible for flood risk management at the municipal level.

How to cite: Streifeneder, V., Dabiri, Z., Hölbling, D., Adamiak, M., Borowska-Stefańska, M., Wiśniewski, S., and Magiera, M.: Linking vulnerability and impact of floods in Austria – A case study of the flood events in 2024, EGU General Assembly 2026, Vienna, Austria, 3–8 May 2026, EGU26-21677, https://doi.org/10.5194/egusphere-egu26-21677, 2026.

EGU26-22154 | Orals | HS7.5

High-Resolution Framework for Urban Pluvial Flood Risk Mapping  

Malte von Szombathely, Anastasia Vogelbacher, Marc Lennartz, Benjamin Poschlod, and Jana Sillmann

We introduce a high-resolution framework for evaluating climate-related risks at the building level, based on the IPCC risk model which conceptualizes risk as a function of vulnerability, exposure, and hazard. The framework focuses on pluvial flood risk, emphasizing impacts on residents’ well-being and mobility. The flood hazard is represented based on a 1-meter resolution hydrodynamic simulation of urban flooding triggered by a 100-year hourly rainfall event. Exposure is nuanced by impact type, considering ground-floor residents’ well-being and proximity to flooded streets affecting mobility and accessibility. Social vulnerability is quantified through socioeconomic indicators such as age, income, and education levels. Applying this framework to empirical data from Hamburg, Germany, we identify perilous hotspots where areas of high social vulnerability are combined with significant flood exposure. The framework was co-designed and tested with stakeholders from the city of Hamburg. To facilitate practical application also for other cities, we developed a Python-based ArcGIS toolbox for automated, building-level risk mapping. The framework’s transparent and adaptable design ensures broad transferability, to support local climate adaptation strategies and informed decision-making in urban resilience planning.

How to cite: von Szombathely, M., Vogelbacher, A., Lennartz, M., Poschlod, B., and Sillmann, J.: High-Resolution Framework for Urban Pluvial Flood Risk Mapping , EGU General Assembly 2026, Vienna, Austria, 3–8 May 2026, EGU26-22154, https://doi.org/10.5194/egusphere-egu26-22154, 2026.

EGU26-22308 | Posters on site | HS7.5

A long-term perspective of floods in the Spanish Mediterranean Basins from historical archives (1035–2020 CE) 

Clara Rodriguez Morata, Guillem Lloberas-Milan, Roberto Molowny-Horas, Pino David, Jordi Tuset, Carles Balasch, Josep Barriendos, Caroline Ummenhofer, Mariano Barriendos, and Laia Andreu-Hayles

An increase in globally occurring extreme precipitation events during recent decades has led to catastrophic floods, a trend projected to intensify in the future. In Spain, this issue is particularly critical due to the irregular and convective nature of Mediterranean precipitation and the high exposure of populated and agricultural areas, as well as transport infrastructure. However, the scarcity of long-term observational records limits our understanding of past flood variability and recurrence. Here we present a comprehensive analysis of historical floods in the Mediterranean basins of the Iberian Peninsula based on historical documentary records. The dataset spans from 1035 to 2020 CE and compiles 14,417 individual flood cases, grouped into 4,394 flood episodes, each characterized by location, geographic coordinates, river basin, and affected rivers. Additional information includes impacts on fluvial systems and infrastructure, classified by impact intensity, and in many cases, precise temporal resolution (day, month, year). Although the dataset represents a partial reconstruction of past reality, its magnitude provides robust insights into long-term flood dynamics. Spatial analyses reveal that events can range from basin-restricted to large multi-basin episodes extending from the Andalusian Mediterranean to the Ebro basin. Event duration varies widely and is not always correlated with spatial extent. From a seasonal perspective, most floods occur in autumn, though intense summer and spring floods are also recorded, the latter often linked to snowmelt in the Pyrenees and other mountain ranges. While a long-term increase in flood occurrence is observed, with a marked peak in the most recent decades, interpretations of recurrence variability must be made cautiously, as the record also reflects changes in exposure, increasing social impacts, and improvement in reporting capacity over time. This study constitutes a solid foundation for exploring hydroclimatic variability, societal vulnerability, and the evolving human–environment relationship over the last millennium.

How to cite: Rodriguez Morata, C., Lloberas-Milan, G., Molowny-Horas, R., David, P., Tuset, J., Balasch, C., Barriendos, J., Ummenhofer, C., Barriendos, M., and Andreu-Hayles, L.: A long-term perspective of floods in the Spanish Mediterranean Basins from historical archives (1035–2020 CE), EGU General Assembly 2026, Vienna, Austria, 3–8 May 2026, EGU26-22308, https://doi.org/10.5194/egusphere-egu26-22308, 2026.

EGU26-327 | ECS | Orals | HS7.6

WRF Hindcast Sensitivity for Delhi's 28 June 2024 Extreme Rainfall: Role of Boundary Conditions, Microphysics, and Initial Time 

Aakanksha Agrawal, Vinnarasi Rajendran, Mukul Tewari, and Francisco Salamanca

The extreme rainfall event of 27–28 June 2024 resulted in 228.1 mm of rain in Delhi, the heaviest in nearly eight decades, causing severe damage across the city and its surrounding regions. To understand the evolution of the spatio-temporal variability of this event and to quantify uncertainties in short-range forecasts of such urban extreme precipitation, we employ an ensemble of high-resolution, urban-aware WRF simulations. This study examines the sensitivity of WRF hindcasts to boundary condition datasets by comparing simulations forced with ERA5 and NCEP-FNL reanalyses. We also assess the model's sensitivity to microphysics parameterizations, as an accurate representation of cloud microphysical processes is crucial for forecasting extreme rainfall. Two widely used schemes, Thompson and WSM6, are evaluated. In addition to boundary conditions and microphysics schemes, we test the model performance for four different initialization times, starting from 1200 UTC on 25 June at 12-hour intervals, using both ERA5 and NCEP-FNL forcing. Preliminary results (from NCEP-FNL-driven runs) show that both microphysics schemes underestimate total rainfall. The Thompson scheme, when initialized at 0000 UTC on 26 June 2024, effectively captures the spatial structure of intense rainfall. The WSM6 scheme better reproduces the overall magnitude of the extreme rainfall but exhibits a spatial displacement bias. Among all initialization times, simulations starting at 0000 UTC on 26 June 2024 perform the best. The same experimental setup will be applied using ERA5 boundary conditions, and the outcomes will be compared against the NCEP-FNL-driven simulations to determine which boundary condition better represents the observed extreme rainfall event.

How to cite: Agrawal, A., Rajendran, V., Tewari, M., and Salamanca, F.: WRF Hindcast Sensitivity for Delhi's 28 June 2024 Extreme Rainfall: Role of Boundary Conditions, Microphysics, and Initial Time, EGU General Assembly 2026, Vienna, Austria, 3–8 May 2026, EGU26-327, https://doi.org/10.5194/egusphere-egu26-327, 2026.

EGU26-613 | ECS | Orals | HS7.6

Evidence from XAI for how extreme precipitation relates to urbanisation 

Yuanhao Zhang, Bailey J. Anderson, Neil Hart, and Louise J. Slater

Rapid urbanisation is coinciding with a rising trend in the intensity of extreme precipitation. Beyond this large-scale trend, urbanisation further alters local climate by modifying land cover, energy fluxes and airflow. However, it remains unclear how much urbanisation alters heavy precipitation, and how robust different machine learning (ML) models are in uncovering its influence. This uncertainty limits our ability to design targeted adaptation measures (e.g. managing impervious surfaces, cooling hotspots). To address these gaps, we analyse extreme daily precipitation across more than 5,000 stations in Europe using gauge observations, high-resolution meteorological reanalyses and 1km land-use data. Stations are classified into four urbanisation levels (rural, suburban, urban, highly urban) based on impervious surface fraction of surrounding area, and predictors are grouped into geographic, surface, thermal and dynamic categories. We train multiple ML models (ElasticNet, RF, LightGBM, and ANN) under a unified framework and applied explainable AI techniques (SHAP and ALE) to diagnose how these models use physical information across urbanisation levels. Tree-based ensembles achieve the highest skill (R2 = 0.45, RMSE=9.28 mm), while all models systematically underestimate the most intense events (>100 mm/d). Our analysis of the ML models finds that thermodynamic variables (dewpoint temperature and heat flux) are the primary controls on extreme precipitation across all urbanisation levels, as evidenced by their larger SHAP ranges (1.36–1.66) compared with the other categories. In contrast, dynamic predictors (U/V component of wind, pressure, and vertical velocity) exert a weaker but relatively consistent influence (SHAP range: 0.74–0.88). In non-urban models, surface processes play a limited role in explaining extreme precipitation. However, in the highly urban model, increasing impervious surface fraction contributes positively to predicted rainfall intensity (net ALE change of about 8 percentage points across the data range). Hence, as urbanisation intensifies, we find impervious surfaces are becoming an increasingly significant explanatory factor in ML models of heavy rainfall.

How to cite: Zhang, Y., Anderson, B. J., Hart, N., and Slater, L. J.: Evidence from XAI for how extreme precipitation relates to urbanisation, EGU General Assembly 2026, Vienna, Austria, 3–8 May 2026, EGU26-613, https://doi.org/10.5194/egusphere-egu26-613, 2026.

EGU26-2625 | ECS | Posters on site | HS7.6

Rainfall response to urban expansion in Beijing and its local climate drivers 

Zeyu Qiao, Marika Koukoula, Guangheng Ni, and Nadav Peleg

Urban areas can substantially modify local hydroclimate, enhancing precipitation over and downwind of cities. Yet, the urban expansion effects on rainfall remain insufficiently understood, and a quantitative relationship between urban growth and rainfall intensification remains to be established. Using the WRF model with eight urban size scenarios for Beijing, a numerical modeling framework was implemented to investigate how changes in urban extent influence rainfall during two representative summers, one relatively wet and one relatively dry. Results show that the rainfall response exhibits an approximately linear dependence on the degree of urban expansion, with the largest impacts occurring over the city center and downwind regions. In general, rainfall increases with urban area enlargement, particularly during nighttime in relatively wet summers due to higher humidity and a more pronounced urban heat island effect. In relatively dry summers, limited moisture supply leads to smaller changes in total rainfall. Changes in hourly rainfall intensity demonstrate a contrasting pattern. Heavy rainfall intensities further intensify in response to urban expansion, while light rainfall is suppressed or remains largely unchanged. Daytime and nighttime rainfall intensity respond to urban expansion in opposite ways, with daytime intensity generally weakening and nighttime intensity strengthening as Beijing expands. These contrasting diurnal behaviors ultimately lead to a reduction in rainfall intensity during relatively dry summers and a slight increase during relatively wet summers. Overall, the results highlight the dependence of urban rainfall modification on city size and background climatic conditions.

How to cite: Qiao, Z., Koukoula, M., Ni, G., and Peleg, N.: Rainfall response to urban expansion in Beijing and its local climate drivers, EGU General Assembly 2026, Vienna, Austria, 3–8 May 2026, EGU26-2625, https://doi.org/10.5194/egusphere-egu26-2625, 2026.

Precipitation extremes associated with climate change are exacerbating urban flood risks worldwide,  impacting rapidly urbanizing and socioeconomically vulnerable regions in the world. Addressing these challenges requires integrated approaches that link precipitation dynamics, urban hydrology, and community-centered adaptation. This work presents a multi-regional framework for precipitation-driven urban flood forecasting and mitigation aligned with the United Nations Sustainable Development Goals (SDGs), particularly SDG 11 (Sustainable Cities and Communities), SDG 13 (Climate Action), and SDG 6 (Clean Water and Sanitation). The research is led by the United Nations University (UNU) Hub at the City College of New York—the first and only UNU hub in the United States dedicated to advancing urban resilience through science–policy integration.

The presented framework integrates artificial intelligence (AI) and high-resolution hydrometeorological data  across diverse urban environments. In Mumbai, India, machine-learning-based flood forecasting models are developed using high-resolution precipitation data, topography, land-use dynamics, and satellite observations to simulate real-time flood depths and extents during extreme rainfall events. These methods explicitly capture spatial variability in urban precipitation and evolving impervious surfaces, enhancing early warning capabilities in one of the world’s most flood-prone megacities.

The transferability of the methodology is demonstrated at different urban communities, including Mumbai, New York City, and the Caribbean. In New York City, precipitation-driven flash flood alert systems estimate real-time inundation risks during short-duration, high-intensity rainfall events. In Puerto Rico and the U.S. Virgin Islands, high-resolution inland flood risk maps are generated by integrating Depth–Duration–Frequency (DDF) precipitation relationships with terrain, soil, and land-use data, enabling the identification of flood hotspots under both current and projected rainfall regimes.

Beyond forecasting, the study advances a participatory framework for implementing nature-based solutions (NBS) in rural areas of Puerto Rico. By incorporating social vulnerability indicators and engaging local stakeholders, the approach supports equitable, community-driven flood mitigation strategies that enhance resilience actions.

Overall, this work demonstrates how precipitation-focused urban hydrology and  AI-driven forecasting can be  applied across global contexts to reduce flood risk, provide climate resilience, and facilitate the UN SDGs in both the Global South and developed urban regions.

How to cite: Khanbilvardi, R. and Goldberg, M.: Urban Flood Resilience Under Extreme Precipitation: AI-Based Forecasting and Participatory Solutions Aligned with the UN Sustainable Development Goals, EGU General Assembly 2026, Vienna, Austria, 3–8 May 2026, EGU26-4558, https://doi.org/10.5194/egusphere-egu26-4558, 2026.

EGU26-4609 | ECS | Posters on site | HS7.6

High-resolution analysis of convective rainfall properties in a tropical city 

Qi Zhuang, Nadav Peleg, Andreas Prein, Vladan Babovic, and Simone Fatichi

Urban hydrological systems are highly sensitive to precipitation variability at fine spatial and temporal scales, yet such variability remains poorly characterized due to limited high-resolution observations. Here, we analyze extreme rainfall in equatorial Singapore using a uniquely dense observational network, including 122 rain gauges at 5-min resolution (2020–2024), and long-term hourly gauge records (1980–2024), which are then combined with X-band radar data at 100-m and 5-min resolution to produce a high-resolution gridded rainfall reanalysis. We use this new dataset to quantify the changing space–time organization of extreme convective rainfall over 45 years. Results show that extreme convective rainfall in this tropical urban environment is more highly localized and short-lived than previously thought, with spatial and temporal correlations halving over just 1.6 km and 4 min. In response to climate warming, the total rainfall amount, spatial extent, and temporal persistence of extreme events have increased, while peak rainfall intensities remained largely stable, likely due to limitations in local humidity supply. Such compact storm structures challenge the representativeness of sparse rain gauge networks and underscore the need for high-resolution analysis in tropical regions.

How to cite: Zhuang, Q., Peleg, N., Prein, A., Babovic, V., and Fatichi, S.: High-resolution analysis of convective rainfall properties in a tropical city, EGU General Assembly 2026, Vienna, Austria, 3–8 May 2026, EGU26-4609, https://doi.org/10.5194/egusphere-egu26-4609, 2026.

Under global warming, the intensification of extreme precipitation poses a critical threat to dense coastal metropolises like Hong Kong, where complex terrain and high population density amplify flood risks. While daily rainfall trends are well-documented, existing studies largely focus on coarse regional simulations or daily-scale metrics, leaving a gap in understanding the granular evolution of sub-daily extremes and their specific drivers within complex intra-urban environments. This study investigates the spatiotemporal characteristics of hourly extreme rainfall in Hong Kong from 1991 to 2024, utilizing continuous hourly records from approximately 80 Geotechnical Engineering Office (GEO) stations. We spatially categorize the territory into four distinct subregions—Hong Kong Island, Kowloon, New Territories, and Lantau—to examine regional heterogeneity. The analysis employs indices including hourly precipitation percentiles (95th, 97.5th, 99th, and 99.9th) and Maximum Rolling Rainfall (MRR) across 1, 3, 6, and 12-hour durations to capture both short-term intensity and cumulative event magnitude. Furthermore, a Structural Equation Modelling (SEM) framework is developed to disentangle the contributions of key drivers, specifically quantifying the impact of urbanization (e.g., built-up area, patch density) alongside large-scale climate variability (e.g., ENSO, monsoons) and socioeconomic factors. We hypothesize that short-duration rainfall intensity (1-hour MRR) exhibits a more significant upward trend than longer durations, particularly in highly urbanized sectors like Kowloon. The SEM analysis is expected to reveal that urbanization acts as a primary localized driver exacerbating extreme rainfall frequency and intensity, distinct from background climatic warming. These findings will provide essential insights for refining urban drainage standards and disaster mitigation strategies in high-density mountainous cities. 

How to cite: Lu, Y., Tang, X., and Wang, D.: Spatiotemporal Variability and Attribution of Hourly Extreme Rainfall in Hong Kong: A Multi-Regional Analysis Using Structural Equation Modelling , EGU General Assembly 2026, Vienna, Austria, 3–8 May 2026, EGU26-6258, https://doi.org/10.5194/egusphere-egu26-6258, 2026.

EGU26-7034 | ECS | Orals | HS7.6

Radar Rainfall Input for Urban Stormwater Modelling 

Fereshteh Taromideh, Pasquale Marino, Giovanni Francesco Santonastaso, and Roberto Greco

Accurate representation of radar-based rainfall inputs remains a critical challenge in urban stormwater modelling, particularly in densely urbanized environments exposed to short-duration intense storm events. While weather radar provides high spatio-temporal resolution precipitation estimates (Taromideh et al., 2025), its direct application in urban stormwater models is often affected by biases and spatial inconsistencies. Improving the integration of radar-derived rainfall information with hydrological observations is therefore essential to reliably simulate urban runoff and sewer system response.

The framework is applied to the coastal city of Portici, located within the metropolitan area of Naples in southern Italy. The study area is characterized by a highly urbanized combined sewer system serving a catchment of approximately 3.2 km², with an imperviousness of about 78% and elevations ranging from sea level to 144 m above sea level. The drainage network includes multiple regulators and combined sewer overflow structures that discharge excess stormwater to the sea during intense rainfall events (Marino et al., 2025). Discharge measurements at the main outlet are available at high temporal resolution over a multi-year period, providing a reliable dataset for model calibration and validation. While no rain gauges are installed within the catchment, nearby rain gauge stations and meteorological radar data are available. Radar precipitation is provided on a regular grid with 1 km × 1 km spatial resolution and 5-minute temporal resolution, enabling the estimation of spatially distributed rainfall fields over the study area. These data provide the necessary context for applying and evaluating the proposed optimization framework.

The objective of this study is to develop an optimization-based framework to adjust subcatchment-scale rainfall inputs in an urban stormwater model, using observed outlet discharge as an indirect reference for rainfall correction. Initial rainfall values for each subcatchment are derived from radar precipitation fields, and the optimization aims to ensure consistency with observed outlet discharges while preserving the spatial and temporal structure of radar-derived rainfall. The approach constrains rainfall adjustments to physically plausible patterns and prevents unrealistic hydrological responses, such as excessive runoff variability or flooding within the sewer network.

The proposed methodology couples the calibrated Storm Water Management Model (SWMM) with a genetic algorithm optimization scheme. Time-series rainfall values for each subcatchment are treated as decision variables over the duration of the storm event. Radar-derived precipitation fields are used both to initialize these variables and to activate them only during periods when radar precipitation is detected. The objective function integrates flow-based performance metrics, correlation measures between radar and subcatchment rainfall data, and runoff consistency indicators, while a flooding volume constraint penalizes solutions leading to surcharging or surface flooding. Model evaluations are parallelized to reduce computational cost. The proposed framework offers a robust methodology for improving the consistency between radar-based rainfall inputs and observed sewer system responses in urban environments, that can be used for the development of predictive models of rainfall-runoff transformation in urban catchments.

How to cite: Taromideh, F., Marino, P., Santonastaso, G. F., and Greco, R.: Radar Rainfall Input for Urban Stormwater Modelling, EGU General Assembly 2026, Vienna, Austria, 3–8 May 2026, EGU26-7034, https://doi.org/10.5194/egusphere-egu26-7034, 2026.

EGU26-7653 | Posters on site | HS7.6

Forecasting of Streamflow and Water Levels for Urban Flood Protection in Vejle, Denmark 

Jesper Ellerbæk Nielsen, Janni Mosekær Nielsen, Ida Kemppinen Vester, Søren Thorndahl, and Michael Robdrup Rasmussen

Urban areas are increasingly vulnerable to extreme rainfall events, which can cause severe flooding and significant infrastructure damage. This study focuses on predicting water levels and flows in a Danish stream to support urban flood mitigation using rainfall observations and numerical weather predictions. The city of Vejle, Denmark, is vulnerable to extreme rainfall due to flooding risks associated with the stream that traverses the city; hench, a pump and sluice facility have been installed as protective measures. However, effective flood mitigation depends on timely early warning and informed decision-making, highlighting the need for accurate and reliable stream water level forecasts.

The approach presented in this study integrates observed rainfall from rain gauges and numerical weather predictions as inputs to two distinct hydrological modeling frameworks: a linear reservoir model and a neural network model. Both models aim to predict streamflow and water levels in the critical stream through Vejle. Real-time flow and water level sensors installed in the stream provide continuous measurements for model calibration and validation.

Results from this study demonstrate that the proposed models achieve high accuracy in forecasting both flow and water levels. The neural network model shows particular promise in capturing nonlinear dynamics, while the linear reservoir model offers robustness and interpretability. These forecasts are operationally significant: they enable the local utility to optimize pump and sluice operations, reducing the risk of urban flooding and minimizing potential damage during extreme events.

This work highlights the value of combining rainfall observations and weather forecasts with hydrological runoff models to enhance urban flood resilience. The proposed methodologies are computationally efficient, scalable, and adaptable, making them highly valuable in real-time applications used by municipalities for flood mitigation.

How to cite: Nielsen, J. E., Nielsen, J. M., Vester, I. K., Thorndahl, S., and Rasmussen, M. R.: Forecasting of Streamflow and Water Levels for Urban Flood Protection in Vejle, Denmark, EGU General Assembly 2026, Vienna, Austria, 3–8 May 2026, EGU26-7653, https://doi.org/10.5194/egusphere-egu26-7653, 2026.

This study evaluates the hydrologic resilience of the Beitou–Shilin Technology Park (BSTP), a high-density newly developed district in Taipei, under intensified extreme rainfall induced by climate change. To support climate-adaptive urban water management, an integrated modeling framework combining urban drainage simulation and future climate projections was established.
A detailed urban drainage model was developed using EPA SWMM to characterize the drainage system of the study area. Subcatchment geometries were delineated through QGIS-based spatial analysis, while infiltration parameters were assigned based on land-use types and vegetation coverage. This modeling framework provides a physically-based representation of surface runoff generation and urban flood response.
To address climate uncertainty, future rainfall data were generated using the MultiWG stochastic weather generator. The projection process incorporated five Global Climate Models (GCMs) under three Shared Socioeconomic Pathway scenarios (SSP1-2.6, SSP2-4.5, and SSP5-8.5). After completing data preprocessing, the daily synthetic rainfall series were temporally downscaled to an hourly resolution to enable continuous hydrologic simulations within the SWMM framework.
Finally, a systematic sensitivity analysis of Low Impact Development (LID) strategies was conducted. Incremental implementation levels ranging from 0% to 100%, at 20% intervals, were simulated to quantify their effectiveness in reducing peak discharge and mitigating urban flood risk under extreme rainfall conditions. The results reveal a clear nonlinear relationship between LID implementation scale and runoff reduction efficiency. These findings provide quantitative insights for optimizing LID configurations in compact urban developments and support long-term, ESG-oriented urban infrastructure planning.

How to cite: Chen, Y.-C. and Tung, C.-P.: Strategic Assessment of Urban Flood Risk and LID Mitigation under Climate Change: A Case Study of the Beitou–Shilin Technology Park, EGU General Assembly 2026, Vienna, Austria, 3–8 May 2026, EGU26-7937, https://doi.org/10.5194/egusphere-egu26-7937, 2026.

Accurate precipitation estimation is fundamental for hydrological forecasting and disaster risk management, with radar-based Quantitative Precipitation Estimation (QPE) providing high-resolution rainfall input for real-time applications. In recent years, machine learning approaches have been widely adopted to improve radar QPE, with both forest-based models (e.g., Random Forest, gradient-boosted trees) and deep learning architectures outperforming traditional reflectivity-rain rate (Z-R) relationships. Despite this progress, most studies emphasise performance comparisons, offering limited insight into how forest-based models exploit radar-derived information across different temporal scales.

In this study, we move beyond accuracy benchmarks to investigate the predictive behaviour of forest-based models for radar rainfall estimation. We conduct a systematic set of experiments in which the input feature space is progressively expanded to include three-dimensional reflectivity profiles, derived radar products (e.g. MaxDBZ, VIL and so on), dual-polarization variables (e.g. Kdp), and geographical information.Model performance and feature importance are analysed for QPE at both 10-min and 1-h timescales.

Our results reveal clear, scale-dependent patterns in model behaviour. At the hourly timescale, predictive performance is primarily governed by simplified radar intensity measures (i.e. MaxDBZ) combined with geographic information, suggesting a dependence on regional weather patterns. In contrast, at the 10-min timescale, performance is more strongly associated with three-dimensional and vertically integrated radar features, indicating a more localized and dynamic regime. These findings highlight that forest-based models adapt their effective use of radar information depending on temporal scale, motivating further diagnostic analyses of ensemble behaviour to better characterise how tree-based models balance local and aggregated information in radar QPE.

How to cite: Yang, P.-H. and Wang, L.-P.: Why do forest-based models work for radar rainfall estimation? Insights from 10-minute and hourly QPE experiments, EGU General Assembly 2026, Vienna, Austria, 3–8 May 2026, EGU26-9148, https://doi.org/10.5194/egusphere-egu26-9148, 2026.

EGU26-9324 | ECS | Posters on site | HS7.6

A new copula-based approach for storm events analysis to support urban catchment modeling 

Giulio Paradiso and Daniele Ganora

Urban flood risk management requires innovative approaches to address the increasing variability of extreme meteorological events, intensified by climate change and urban expansion. This study proposes a novel and replicable methodology for the classification of rainfall events in urban areas to obtain more precise design storm events respect to the more used IDF curves. The selected study area is the hill of the municipality of Turin, characterized by steep slopes, widespread urbanization, and a dense network of minor streams, partially open-channel and partially culverted, which are not represented in standard flood hazard maps.

Extreme rainfall events exhibit complex dependencies among key attributes such as duration, intensity, and cumulative precipitation, which cannot be correctly described using univariate approaches that may cause significant over-simplification. To address this limitation, in this work a statistical framework based on an unconventional application of Peak Over Threshold (POT) theory and a trivariate copula-based dependence modeling is proposed to describe the joint behaviour of rainfall event characteristics and to estimate multivariate return periods.

Rainfall events are extracted from sub-daily pluviometric time series using the concept of the inter event time definition (IETD) and characterized in terms of duration, mean intensity, and cumulative depth. Suitable marginal distributions are identified for each variable and finally events exceeding predefined thresholds are analysed to assess their frequency of occurrence. Dependence structure among event characteristics is modelled using multivariate copula framework capable of capturing complex, non-linear relationships and tail dependences. The fitted model is then used to simulate synthetic rainfall events and to compute joint exceedance probabilities in the trivariate space. Multivariate return periods associated with compound extreme events are derived and visualized, highlighting the importance of dependence in the assessment of rainfall severity.

The proposed methodology wants to provide a robust and flexible tool for the probabilistic characterization of compound rainfall extremes and represents valuable support for flood risk assessment and hydrological design in complex urban settings.

How to cite: Paradiso, G. and Ganora, D.: A new copula-based approach for storm events analysis to support urban catchment modeling, EGU General Assembly 2026, Vienna, Austria, 3–8 May 2026, EGU26-9324, https://doi.org/10.5194/egusphere-egu26-9324, 2026.

EGU26-10586 | ECS | Posters on site | HS7.6

A Multi-Site Spatiotemporal Stochastic Rainfall Generator for Realistic Rainfall Generation    

Yuran Li, Limin Zhang, and Jian He

To enhance flood risk assessment and management, particularly in catastrophe models used for estimating potential losses, generating realistic extreme rainfall scenarios is crucial for accurate flood mapping. Current probabilistic rainfall models primarily focus on either single-station analysis or the spatial dependence of static rainfall properties. However, these approaches often fail to capture the dynamic spatiotemporal characteristics of short-duration extreme rainfall events—the primary drivers of urban flooding. In this study, we propose a novel spatiotemporal stochastic rainfall generator to simulate rainfall sequences at multiple stations while preserving spatial correlations and realistic temporal dynamics at the same time.

The generator is calibrated and applied in Hong Kong, a densely urbanized and flood-prone coastal city, using hourly in-situ observations from 141 stations for 1984–2017. Although operating at hourly resolution, the model consistently reproduces rainfall statistics across 1–24 h accumulation durations. It closely matches the statistical characteristics of historical rainfall, achieving Nash–Sutcliffe efficiency (NSE) values of 0.939–0.969 for the top 10% of events, and captures the spatial patterns of extremes with a Pearson correlation of 0.831.

Hydrodynamic simulations further demonstrate that the realistic temporal variability produced by the proposed generator leads to average flood depth differences of 18.1% and 25.8% compared with the simplified exponential and constant hyetograph scenarios, respectively.  Overall, the results underscore the importance of representing realistic short-term rainfall variability in stochastic rainfall modeling to support robust flood risk assessment.

How to cite: Li, Y., Zhang, L., and He, J.: A Multi-Site Spatiotemporal Stochastic Rainfall Generator for Realistic Rainfall Generation   , EGU General Assembly 2026, Vienna, Austria, 3–8 May 2026, EGU26-10586, https://doi.org/10.5194/egusphere-egu26-10586, 2026.

A critical challenge in urban hydrometeorology is achieving accurate nowcasting of storms and inundation risks, hindered by the high heterogeneity of both urban surfaces and precipitation fields, which jointly induce nonlinear and abrupt spatiotemporal patterns of inundation risk. To address this, we develop a cascaded deep learning framework that performs end-to-end, high-resolution forecasting from radar extrapolation to inundation risk. First, a ConvLSTM-UNet model is trained on a decade-long (2015–2025), highspatiotemporal-resolution (1 km, 6 min) radar echo mosaic dataset over Wuhan, China, to generate skillful short-term quantitative precipitation nowcasts, thereby capturing fine-scale rainfall heterogeneity. Second, using a large set of historical waterlogging points collected from online platforms as labeled data, another deep learning model is trained to learn the complex coupling between nowcasted rainfall and high-resolution urban features with 12.5 m DEM, 30 m Local Climate Zone maps, and fine road networks, thereby quantifying how surface heterogeneity modulates runoff accumulation and flood susceptibility. By chaining these two stages, the framework produces high spatiotemporal resolution, probabilistic inundation risk nowcasts directly from radar observations. This data-driven approach offers an effective and novel tool for real-time early warning and refined risk management in complex urban environments.

How to cite: Zhao, L. and Song, J.: Chained Nowcasting of High Spatiotemporal Resolution Urban Rainfall and Inundation Risk Using Deep Learning, EGU General Assembly 2026, Vienna, Austria, 3–8 May 2026, EGU26-11991, https://doi.org/10.5194/egusphere-egu26-11991, 2026.

EGU26-14345 | ECS | Orals | HS7.6

Auditing the Physical Fidelity of Urban Flood Model with Large Multimodal Model-Derived High-Resolution Observational Data 

Shunan Zhou, Anette Eltner, Pedro Zamboni, Heng Lyu, and Chi Zhang

Characterized by high spatial heterogeneity and short response times, urban flood research has long been constrained by the scarcity of precise, high-spatiotemporal resolution observational data required to capture the complex dynamics. Without such data, it remains challenging to distinguish whether model simulation errors stem from uncertain parameters or fundamental structural deficiencies, obscuring the model's reliable physical representation. Consequently, the physical fidelity of urban hydrodynamic models in reproducing complex, spatiotemporal flood dynamics needs to be further validated. To address this, we constructed the first large-scale, 1-minute resolution urban surface inundation dataset derived from camera videos using a Large Multimodal Model (GPT-5). Using the observations, we audited the physical driving mechanisms of 1D-2D coupled hydrodynamic models by examining the spatial stratified heterogeneity of flood responses.

Focusing on 5 diverse rainfall-flood events recorded by 226 traffic surveillance cameras in Dalian, China, we utilized GPT-5 to automatically extract real-time waterlogging levels. The extracted data underwent manual verification by experts to strictly correct errors, resulting in a high-fidelity urban surface inundation dataset at a 1-minute resolution. Subsequently, we constructed and calibrated a 1D-2D coupled urban flood numerical model to obtain simulation results for the corresponding events. The Geodetector model was then employed to quantify and compare the spatial stratified heterogeneity of waterlogging derived from observations versus simulations, attributing them to 9 potential drivers including rainfall, topography, and drainage infrastructure.

Results indicate that GPT-5 achieved satisfactory extraction performance, with an average accuracy of 77%. Comparative Geodetector analysis of observations versus simulations revealed critical discrepancies. The factor detector showed low individual explanatory power (q<0.1) but distinct rankings, with simulations underestimating rainfall's role. The interaction detector revealed stronger observed synergy, where the dominant control shifted from the observed "rainfall-imperviousness" coupling (16.6%) to a simulated "pipe-imperviousness" one (14%). While the risk detector confirmed consistent trend patterns, it highlighted significant "peak-shaving" effects, with simulated depths averaging 20 cm lower. Finally, the ecological detector verified that these structural discrepancies are statistically significant rather than random errors.

Observations confirm that urban flood distribution is governed by the non-linear synergy of multiple factors, reflecting high system complexity. The model reveals a systematic structural defect: it erroneously shifts the dominant control from a dynamic rainfall-surface coupling to a static boundary condition. This bias causes the model to be insensitive to dynamic meteorological forcing and to underestimate severe localized inundation caused by micro-environments. Future improvements must move beyond parameter calibration to focus on enhancing sensitivity to rainfall fluctuations and micro-environmental representation.

How to cite: Zhou, S., Eltner, A., Zamboni, P., Lyu, H., and Zhang, C.: Auditing the Physical Fidelity of Urban Flood Model with Large Multimodal Model-Derived High-Resolution Observational Data, EGU General Assembly 2026, Vienna, Austria, 3–8 May 2026, EGU26-14345, https://doi.org/10.5194/egusphere-egu26-14345, 2026.

EGU26-15291 | Posters on site | HS7.6

Evaluating urban flood impacts under climate change using temporal-spatially varied design rainfall 

Xilin Xia, Qian Li, and Emma Ferranti

Climate change is expected to increase both the frequency and intensity of extreme rainfall events, which poses a particularly high risk to urban areas due to their high levels of impervious surfaces and population density. Consequently, surface flooding is likely to intensify in the future, highlighting the importance of assessing climate change impacts in urban flood risk management. Design rainfall based on Depth-Duration-Frequency (DDF) curves is commonly used to assess flood risk, while climate change effects are incorporated by applying a rainfall uplift allowance to represent future scenarios. However, this approach typically assumes spatially uniform rainfall over the simulation domain, which can misrepresent storm movement as well as the timing and location of rainfall peaks, thereby compromising the accuracy of flood risk assessment. To address this limitation, it is important to use temporally and spatially variable rainfall as input to flood risk assessments. In this study, a temporally and spatially variable rainfall generator is developed, which generates spatial-temporal design rainfall events from Depth-Duration-Frequency (DDF) curves. To ensure that the generated rainfall realistically represents observed storm characteristics, the parameters of the rainfall generator are derived from historical weather radar observations. The generated events are used to drive hydrodynamic flood models to evaluate flood impacts in the West Midlands, UK, under climate change. By producing more realistic design storms, the proposed approach provides a basis for more reliable flood mapping and risk-informed adaptation planning at city-scales.

How to cite: Xia, X., Li, Q., and Ferranti, E.: Evaluating urban flood impacts under climate change using temporal-spatially varied design rainfall, EGU General Assembly 2026, Vienna, Austria, 3–8 May 2026, EGU26-15291, https://doi.org/10.5194/egusphere-egu26-15291, 2026.

EGU26-15978 | Orals | HS7.6

AI for urban hydrometeorology: insights into processes, model suitability, and challenges 

Li-Pen Wang, Chien-Yu Tseng, Chi-Ju Chen, Bing-Zhang Wang, and Yi-Chang Yu

Artificial Intelligence (AI) is no longer a novelty in hydrometeorology. From computer vision to rainfall nowcasting, AI-based models now routinely outperform traditional approaches in many benchmark comparisons. Yet, as these tools move closer to operational use --particularly in dense and vulnerable urban environments-- it is timely to step back and ask a more fundamental question: what is AI actually good at, and how should we use it wisely?

This talk reflects on recent advances in AI for urban hydrometeorology through three interconnected research regimes: smart environmental monitoring (“eyes on the water”), short-term rainfall nowcasting, and spatial–temporal rainfall reconstruction. Rather than promoting AI as a universal solution, the talk focuses on model suitability, uncertainty, and the alignment between data-driven methods and physical processes.

In environmental monitoring, modern deep-learning computer vision models have reached an impressive level of maturity. Tasks such as object detection, classification, and segmentation can now be performed reliably using images from fixed cameras, mobile devices, CCTVs, and citizen sensors, enabling scalable monitoring of urban rivers, flooding, and water quality indicators. At the same time, these applications reveal a recurring limitation: AI performs extremely well on what it has seen before, but struggles with rare events, or poorly defined labels --often the cases of greatest societal relevance.

In rainfall nowcasting, AI is often positioned as a disruptive replacement for traditional methods. This talk argues instead for a complementary view. While classical extrapolation efficiently handles storm motion, AI’s real strength lies in learning evolution: how rainfall structures grow, decay, and reorganise across spatial and temporal scales. Deep learning models excel at capturing multiscale spatial–temporal patterns that are difficult to encode explicitly, making them particularly valuable when combined with physically informed frameworks.

A central challenge across these applications is overconfidence. Can we teach AI to say “I don’t know”? Recent uncertainty-aware learning approaches demonstrate that AI models can be trained not only to make predictions, but also to indicate when they are operating outside familiar regimes --an essential requirement for trustworthy deployment.

Finally, the talk highlights the Point-to-Image (P2I) model to illustrate AI’s ability to learn spatial–temporal structure from extremely sparse data. By reconstructing realistic rainfall fields from limited point observations, P2I demonstrates that AI can infer coherent spatial patterns and temporal consistency even when traditional methods fail. This capability challenges long-held assumptions about data density requirements and opens new possibilities for urban hydrometeorology in data-limited environments.

Overall, this talk argues that the most effective use of AI in urban hydrometeorology arises not from replacing physical insight, but from combining process understanding with models that are well matched to the questions they are asked to answer.

How to cite: Wang, L.-P., Tseng, C.-Y., Chen, C.-J., Wang, B.-Z., and Yu, Y.-C.: AI for urban hydrometeorology: insights into processes, model suitability, and challenges, EGU General Assembly 2026, Vienna, Austria, 3–8 May 2026, EGU26-15978, https://doi.org/10.5194/egusphere-egu26-15978, 2026.

EGU26-577 | ECS | Orals | HS7.8

Comparative parametrization of the Bernoulli-lognormal cascade generator through binary breakdown coefficients and using its autocorrelation function 

Aldo Ruano, Israel Villegas, Esteban Gaviria, Carlos Hernandez, and Alin Andrei Carsteanu

The multifractal Bernoulli-lognormal (BLN, traditionally known as beta-lognormal) cascade has been effectively used to model the intermittence and scale invariance found in precipitation intensities, particularly under extreme hydro-meteorological events that generate hydrologic and geomorphological hazards such as floods, landslides, and debris flows. However, the parametrization of its generator based on a single realization has been a challenge due to the inherent non-ergodic nature of the process, and it is relevant for understanding vulnerability, risk mitigation and societal response to weather-induced extremes. In this work, we compare two recently proposed advances in parametrisation: (i) an approximation for the distribution of the BLN breakdown coefficients (BDCs) and (ii) the explicit expression of the dressed-cascade autocorrelation function in terms of the moments of its generator. Based on these two statistics, we derive an equation system that directly links the parameters ($C_b$, $C_{ln}$) with the observable quantities: the BDCs' distributional moments and the decay rate of the autocorrelation. We use these two parametrisation methods on multiscale precipitation data obtained from Google Earth Engine, enabling the analysis of weather–precipitation relationships, socio-hydrological interactions, and their implications for preparedness, impact-based forecasting, and even insurance and reinsurance applications.

How to cite: Ruano, A., Villegas, I., Gaviria, E., Hernandez, C., and Carsteanu, A. A.: Comparative parametrization of the Bernoulli-lognormal cascade generator through binary breakdown coefficients and using its autocorrelation function, EGU General Assembly 2026, Vienna, Austria, 3–8 May 2026, EGU26-577, https://doi.org/10.5194/egusphere-egu26-577, 2026.

EGU26-650 | ECS | Posters on site | HS7.8

It Never Rains but It Pours 

Mijael Rodrigo Vargas Godoy, Yannis Markonis, Simon Michael Papalexiou, and Michal Jenicek

Recent theory and model projections indicate that climate change should intensify and reorganize global precipitation patterns; however, observational confirmation has been hindered by the proliferation and interdependence of gridded products. This study revisits the changing precipitation characteristics using an artifact-controlled ensemble of gauge-, satellite-, and reanalysis-based datasets at 0.25° daily and monthly resolution for the 1995–2024 period. Concentrated along the tropics, a drying pattern has emerged, while annual maxima daily precipitation has increased simultaneously. In other words, our results indicate that a growing share of annual precipitation is delivered by upper-percentile daily events, even as the annual mean precipitation decreases. The co-occurrence of drying and intensification patterns suggests that extreme events are efficiently depleting atmospheric moisture, leading to longer dry spells and reduced total precipitation. The results highlight regions shifting toward a more intense and abrupt hydrological regime, with higher flood and drought risks despite declining mean precipitation.

How to cite: Vargas Godoy, M. R., Markonis, Y., Papalexiou, S. M., and Jenicek, M.: It Never Rains but It Pours, EGU General Assembly 2026, Vienna, Austria, 3–8 May 2026, EGU26-650, https://doi.org/10.5194/egusphere-egu26-650, 2026.

EGU26-857 | ECS | Orals | HS7.8

Summer Precipitation Intensity-Duration-Area-Frequency Patterns in Complex Terrain using Radar Data 

Talia Rosin, Francesco Marra, Marco Gabella, Urs Germann, Daniel Wolfsenberger, and Efrat Morin

Extreme precipitation in complex Alpine terrain exhibits pronounced spatial and temporal variability, challenging the reliable estimation of design-relevant return levels. Rain-gauge networks provide accurate point measurements but are often sparsely distributed and located in accessible valley floors, with few instruments on steep slopes or exposed crests where wind-induced undercatch is substantial. This limits their ability to capture localised extremes and fine-scale spatial variability. Weather radar offers the necessary coverage and resolution, yet radar archives are typically short and subject to various uncertainties. The Simplified Metastatistical Extreme Value (SMEV) framework offers a solution by enabling robust inference of rare extremes from short and error-prone datasets.

We analyse summer (JJA) rainfall extremes in Switzerland to derive intensity–duration–area–frequency (IDAF) relationships across multiple spatial and temporal scales, using nine years (2016–2024) of 1-km²/5-min dual-polarisation radar data from the MeteoSwiss C-band network. Return levels for durations from 30 min to 24 h and areas from 1 to 500 km² are estimated for return periods of 2 to 100 years using the SMEV framework. The extension of the SMEV to the areal scale was first developed by Rosin et al. (2024) for the eastern Mediterranean. We adapt and apply it here to the complex, heterogeneous Alpine topography of Switzerland. To reduce sampling noise inherent to the short radar archive, we spatially smooth the Weibull shape parameter, preserving coherent physical gradients while suppressing pixel-scale artefacts. Radar-derived SMEV return levels show strong regional agreement with SMEV estimates from 60 long-term (≥30 yr) gauges.

Rainfall extremes across Switzerland exhibit strong dependence on both spatial and temporal aggregation, affected by orography and location. Short-duration, small-area extremes display sharp, topographically anchored maxima over the Jura, Pre-Alps, and southern Alpine slopes, and persistent minima across the Plateau and inner-Alpine valleys. With increasing duration and area, small-scale peaks are progressively smoothed and broad-scale maxima emerge. The southern Alps remain the most prominent hotspot across all scales. Derived IDAF relationships display pronounced spatial differences at sub-hour scales and increasing spatial coherence for 12–24 h events, with pronounced regional differences.

Case studies of recent significant flooding events demonstrate how hydrological impacts depend on the spatio-temporal characteristics of rainfall. For each event, return levels were computed across all duration–area combinations using the IDAF framework, enabling a direct assessment of how 'extreme' the event was at different hydrologically relevant scales. Events that are highly extreme at short durations and small areas trigger flash floods and debris flows, reflecting the rapid response of steep Alpine basins. Conversely, events most extreme at long durations and large spatial scales, even when short-duration intensities are unremarkable, cause more widespread river flooding, elevated lake levels, and prolonged saturation. These results highlight the importance of evaluating extremes across multiple scales, rather than relying solely on point-scale intensities.

Overall, our findings highlight the value of combining short-record high-resolution radar precipitation fields with the SMEV framework to obtain a scale-aware extreme-rainfall climatology. The resulting multi-scale return-level maps and IDAF relationships provide improved information for flood-hazard assessment and infrastructure design.

How to cite: Rosin, T., Marra, F., Gabella, M., Germann, U., Wolfsenberger, D., and Morin, E.: Summer Precipitation Intensity-Duration-Area-Frequency Patterns in Complex Terrain using Radar Data, EGU General Assembly 2026, Vienna, Austria, 3–8 May 2026, EGU26-857, https://doi.org/10.5194/egusphere-egu26-857, 2026.

EGU26-1025 | ECS | Orals | HS7.8

Reference period matters, so do altitude and geography: understanding trends in rainfall extremes across the Italian landscape 

Paola Mazzoglio, Gianluca Lelli, Alessio Domeneghetti, and Serena Ceola

Extreme rainfall and its temporal evolution critically influence flood hazard, slope stability, and infrastructure resilience. Yet in Italy, where complex topography and diverse climates shape precipitation, studies of rainfall extremes have produced conflicting outcomes, with neighboring sites often showing opposite trends. Much of this inconsistency stems from differences in data length, baseline period selection, and orographic context.

This study builds upon and extends the recent national-scale analysis by Mazzoglio et al. (2025), which, for the first time, quantified trends in rainfall extremes across Italy for the 1960–2022 period. Using the Improved Italian - Rainfall Extreme Dataset (I2-RED), which compiles data of thousands of rain gauges, we apply distributed quantile regression to annual maximum precipitation for short (1 h) and long (24 h) durations. Trends are expressed as percentage variations per decade and evaluated over multiple baseline windows (1960–2022, 1970–2022, 1980–2022, and 1990–2022) to test the sensitivity of results to the observational timeframe. Elevation effects are assessed by stratifying rain-gauge samples into low- and high-altitude groups and by comparing the regression slopes obtained for each.

Results reveal that short-duration extremes exhibit widespread and coherent positive trends, while 24-hour events show more heterogeneous and regionally variable patterns. Shortening the analysis period strengthens the positive signal, indicating that the intensification of sub-daily rainfall is largely a recent phenomenon. The most pronounced increases occur at higher elevations, especially in the Alps and Apennines. By contrast, lowlands and coastal areas show weaker or negligible changes. The geographic segmentation further demonstrates that spatial patterns of change align closely with major Italian physiographic structures, highlighting the combined roles of orography and regional geography in shaping rainfall evolution.

These findings suggest that trends in rainfall extremes in Italy cannot be interpreted through a single national lens: both methodological choices (baseline period and rainfall duration) and environmental factors (topography and geography) fundamentally shape the detected signals. The combined sensitivity to time window and elevation highlights the importance of accounting for Italy’s physiographic diversity when assessing hydrological risk and designing climate-resilient infrastructure.


Reference

Mazzoglio P., Viglione A., Ganora D., Claps P. (2025). Mapping the uneven temporal changes in ordinary and extraordinary rainfall extremes in Italy. Journal of Hydrology: Regional Studies, 58, 102287. https://doi.org/10.1016/j.ejrh.2025.102287

How to cite: Mazzoglio, P., Lelli, G., Domeneghetti, A., and Ceola, S.: Reference period matters, so do altitude and geography: understanding trends in rainfall extremes across the Italian landscape, EGU General Assembly 2026, Vienna, Austria, 3–8 May 2026, EGU26-1025, https://doi.org/10.5194/egusphere-egu26-1025, 2026.

EGU26-3109 | ECS | Posters on site | HS7.8

Tackling Sparse High‑Resolution Data in Extreme‑Value Statistics: A Spatial Multi‑source Approach 

Felix S. Fauer and Henning W. Rust

Intensity-duration-frequency (IDF) relations describe the major statistical characteristics of extreme precipitation events (return level, return period, time scale). These IDF relations help to visualize either how extreme (in terms of probability/frequency/return period) a specific event is or which intensity is expected for a given probability. We model the distribution of annual precipitation maxima in an extreme-value-statistics setting for the study region Berlin, Germany. To increase model efficiency, we include the accumulation duration and model a duration-dependent GEV. The durations range from 5 minutes to days and are modeled in one single model in order to prevent quantile-crossing. Latitude and longitude are considered as covariates for the GEV parameters.

A major challenge is the need for long precipitation records in order to reliably estimate return levels of long return periods. Especially for short durations (minutes to hours), long records are rare. Therefore, we pool 3 data sources: radar-based Radklim (5-minute) and spatially-interpolated HYRAS (daily) and station-based measurements (minutely). This way, data from sources with daily resolution can borrow information from sources with minutely resolution at nearby locations. This is possible because we assume a functional relationship between short and long durations. Also we assume similar characteristics between nearby stations. This requires a spatial model since different data sources are not collocated. IDF relations will be estimated for any given point in space by using all available multi-source data in a radius of a few kilometers. Two different models are compared to do that: (1) A parametric model is using latitude and longitude as covariates. (2) We plan to create and show a non-parametric Bayesian Hierarchical Model (BHM), including a Gaussian process which models the spatial dependence between locations. The quality of estimated IDF relations will be assessed in terms of a cross-validated quantile score.

How to cite: Fauer, F. S. and Rust, H. W.: Tackling Sparse High‑Resolution Data in Extreme‑Value Statistics: A Spatial Multi‑source Approach, EGU General Assembly 2026, Vienna, Austria, 3–8 May 2026, EGU26-3109, https://doi.org/10.5194/egusphere-egu26-3109, 2026.

EGU26-3218 | Orals | HS7.8

Using the 4-parameter Kappa distribution to model extreme rainfall 

Conrad Wasko, Robert Strong, Olivia Borgstroem, Declan O'Shea, and Rory Nathan

Rainfall frequency analysis is routinely required for hydrological applications such as in the derivation of intensity-duration-frequency (IDF) curves for engineering design and planning. Commonly the Generalized Extreme Value (GEV) is used for rainfall frequency analysis, but it encounters limitations in capturing rare events which have heavy tailed distributions. An alternative is to use the four-parameter Kappa distribution which is a generalization of commonly used three-parameter extreme value distributions. Here, the applicability of the four‐parameter Kappa distribution for modelling extreme daily rainfalls using a global data set of annual rainfall maxima is presented.

The second shape parameter (h) of the four‐parameter Kappa distribution was found to vary regionally. Consistent with theoretical expectations, the second shape parameter converged toward zero (i.e., toward the limiting GEV distribution) as the average number of rain days events per year increased. However, in arid regions h was greater than zero suggesting there is merit in using the four‐parameter Kappa distribution for modelling heavy tail behaviour, particularly in regions which experience a small number of rainfall events per year. Information on the uncertainty in h as a function of the number of wet days per year is provided to facilitate Bayesian inference for at-site analyses.

As the four‐parameter Kappa distribution can be difficult to estimate, parameter estimation can be improved by using a two-step fitting approach based on maximum likelihood estimation which separately models storm intensity and the arrival frequency. Leveraging additional information from a peak-over-threshold series in the fitting improves quantile estimation and reduces uncertainty compared to fitting using annual maxima. These results demonstrate that the four‐parameter Kappa distribution is suitable for both at-site and regional rainfall frequency analyses.

How to cite: Wasko, C., Strong, R., Borgstroem, O., O'Shea, D., and Nathan, R.: Using the 4-parameter Kappa distribution to model extreme rainfall, EGU General Assembly 2026, Vienna, Austria, 3–8 May 2026, EGU26-3218, https://doi.org/10.5194/egusphere-egu26-3218, 2026.

Hydroclimate extremes such as floods and droughts are associated with increasing socio-economic losses worldwide, reflecting their diverse spatial and temporal characteristics and growing exposure. Reliable forecasting across seasonal to interannual timescales is therefore critical for mitigating their impacts and informing risk management. Although machine learning approaches have demonstrated considerable potential, they often depend on large volumes of high-quality data and on distributional transformations of predictors, while neglecting mismatches in temporal scale and spectral structure between predictors and hydrological responses. These mismatches can mask physically meaningful signals, particularly for extremes influenced by scale-dependent climate variability.

Here we address this limitation by introducing the Wavelet System Prediction (WASP), a frequency-domain method designed to enhance hydroclimate predictors through spectral transformation. WASP employs discrete wavelet transforms to decompose predictors and responses into scale-specific components and systematically adjusts the spectral variance of predictors to align with that of the response under an assumed stationary predictor–response relationship. This approach explicitly accounts for temporal dependence and scale interactions, enabling the extraction and amplification of predictive signals that are weak or hidden in the raw predictor space.

We apply WASP to two contrasting hydroclimate extremes and spatial contexts: seasonal flood forecasting across multiple European catchments and interannual drought forecasting at the continental scale over Australia. In both applications, the proposed method substantially improves forecast skill compared to conventional methods. These results highlight the value of scale-aware, frequency-based transformations for advancing statistical modelling of hydroclimate extremes, contributing to improved hazard assessment and climate risk management.

How to cite: Jiang, Z. and Sharma, A.: Spectral transformation of hydroclimate predictors enhances flood and drought forecasting, EGU General Assembly 2026, Vienna, Austria, 3–8 May 2026, EGU26-3661, https://doi.org/10.5194/egusphere-egu26-3661, 2026.

EGU26-5288 | ECS | Orals | HS7.8

The role of antecedent temperature in controlling extreme rainfall statistics: multi-temporal and geomorphic patterns across Northern Italy 

Gianluca Lelli, Athanasios Paschalis, Alessio Domeneghetti, and Serena Ceola

Convective storms frequently trigger flash floods, debris flows, and urban flooding, making robust sub-hourly precipitation statistics essential for risk assessment and infrastructure design. The TENAX model (TEmperature-dependent Non-Asymptotic statistical model for eXtreme return levels) offers a physically-based framework to estimate future extreme rainfall by linking precipitation intensity to near-surface air temperature. Its standard configuration adopts a 24-hour temperature window with zero offset preceding the rainfall event, which is mainly driven by compatibility with daily climate model outputs rather than empirical optimization. Yet, its sensitivity to alternative configurations remains largely unexplored. We hereby analyze 145 rain gauges from Arpae Emilia-Romagna (106) and ARPA Lombardia (39), from the Po plains to the Alpine forelands, spanning 2003–2024, each with at least 15 years of precipitation records at 10- to 15-minute resolution. Temperature data come from VHR-REA_IT reanalysis at 2.2 km resolution. We test twelve model configurations obtained by combining three alternative window durations (1, 12, and 24 h) with four temporal offsets (0, 1, 5, and 12 h). The analysis is performed both at the annual and at the seasonal levels, and model performance is assessed through repeated split-sample validation (50–50 random temporal splits), where the optimal configuration is selected by minimizing the mean squared error with respect to empirical return levels derived using Weibull plotting positions. Our annual analysis shows that the 24 h window with 12 h offset consistently outperforms the default configuration. In contrast, seasonal analyses reveal marked differences: summer extremes show a clear preference for short (1-h) temperature windows, consistent with convective storm dynamics, whereas autumn and winter exhibit higher variability with no single dominant configuration. Moreover, we identify a statistically significant relationship (p < 0.05) between the optimal temperature window configuration and station elevation, suggesting that elevation-dependent thermodynamic and convective processes modulate the temperature–precipitation link. The findings provide practical guidance for calibrating TENAX in data-rich regions and support more physically consistent applications to future climate projections.

How to cite: Lelli, G., Paschalis, A., Domeneghetti, A., and Ceola, S.: The role of antecedent temperature in controlling extreme rainfall statistics: multi-temporal and geomorphic patterns across Northern Italy, EGU General Assembly 2026, Vienna, Austria, 3–8 May 2026, EGU26-5288, https://doi.org/10.5194/egusphere-egu26-5288, 2026.

In recent decades, climate change has intensified extreme rainfall events and expanded their spatial extent, highlighting the need for area-based design rainfall estimation in regional flood control planning. Conventional Depth–Area–Frequency (DAF) curves rely on point rainfall observations combined with empirical Area Reduction Factors (ARFs), which limits their ability to represent actual area-averaged rainfall and spatially connected rainfall structures. This study develops a probabilistic DAF framework that explicitly accounts for spatial adjacency and area-averaged rainfall characteristics. Using 30 years of rainfall observations from the Automated Synoptic Observing System (ASOS) across South Korea, spatially connected area combinations were constructed through adjacency analysis, and representative area sets were selected using the Latin Hypercube Sampling technique. Area-averaged annual maximum rainfall was then derived for each area scale, and multiple probability distributions were applied to characterize extreme rainfall behavior. Goodness-of-fit evaluations indicate that the Generalized Extreme Value (GEV) distribution most appropriately describes area-based extreme rainfall across different spatial scales. Based on the selected GEV distribution, probabilistic DAF curves corresponding to various return periods were derived. The proposed framework eliminates reliance on empirical ARFs and provides a physically consistent and probabilistically rigorous approach for estimating design rainfall, thereby improving the reliability of regional and national-scale flood control and hydrologic design applications.


How to cite: Kim, J., Shin, J.-Y., Lee, G., and Kim, S.: Derivation of Probabilistic Depth–Area–Frequency Curves Based on Spatial Adjacency Using the Generalized Extreme Value Distribution in South Korea , EGU General Assembly 2026, Vienna, Austria, 3–8 May 2026, EGU26-6136, https://doi.org/10.5194/egusphere-egu26-6136, 2026.

Under global warming, high-density coastal cities face the dual challenge of intensifying precipitation extremes and increasing atmospheric evaporative demand. While rainfall trends in Hong Kong have been widely monitored, determining whether the region is becoming wetter or drier requires a comprehensive assessment of the water-energy balance beyond simple precipitation totals. This study investigates the spatiotemporal characteristics of hydro-climatic changes in Hong Kong over the past 40 years (1985–2024), utilizing a hybrid data fusion approach. We integrate hourly precipitation records from 84 Geotechnical Engineering Office (GEO) stations with temperature data from the Hong Kong Observatory (HKO) and reanalysis products from ERA5-Land. To address the coarse resolution of reanalysis data in complex terrains, a topography-based bias-correction and downscaling scheme is applied to generate high-precision, 1-km resolution fields of both Evaporation (E) and Potential Evapotranspiration (PET).

The analysis evaluates hydro-climatic indices across wet (April to September) and dry (October to March) seasons to capture the changing patterns of the urban water cycle. Precipitation metrics include accumulated rainfall, total wet/dry days, and Consecutive Dry Days (CDD), while thermal stress is assessed through daily maximum temperatures, the aggregate count of hot days (>30°C), and the duration of consecutive hot days. Beyond statistical trend analysis, the study adopts the Budyko framework to physically characterize the shift in hydro-climatic regimes. We analyze the joint trajectories of the Aridity Index (PET/P) and the Evaporative Index (E/P) within the Budyko space. This framework is applied spatially across four distinct subregions—Hong Kong Island, Kowloon, New Territories, and Lantau—to reveal how varying degrees of urbanization and vegetation cover alter the partitioning of available water and energy.

By exploring these metrics, this study elucidates the potential decoupling between water supply and atmospheric demand. The research aims to identify transitions towards compound extremes, such as the alternation between intense rainfall pulses and prolonged, hotter dry spells. These insights provide a physical basis for understanding the changing flashiness of the local climate, offering critical guidance for adaptive water resource management in the Guangdong-Hong Kong-Macao Greater Bay Area.

How to cite: Tang, X., Wang, D., and Lu, Y.: Wetter or Drier? Spatiotemporal Evolution of Hydro-climatic Extremes in Hong Kong via High-Resolution Data Fusion and the Budyko Framework, EGU General Assembly 2026, Vienna, Austria, 3–8 May 2026, EGU26-6272, https://doi.org/10.5194/egusphere-egu26-6272, 2026.

EGU26-7545 | ECS | Orals | HS7.8

Deriving Precipitation Frequency Estimates from High-Resolution Weather Radar Rainfall Data 

Ida Kemppinen Vester, Janni Mosekær Nielsen, Jesper Ellerbæk Nielsen, and Søren Thorndahl

Climate change and the expected resulting changes in precipitation patterns call for robust and resilient climate adaptation solutions, including urban drainage systems that can handle the precipitation of the future.  One of the most commonly used engineering tools when designing urban drainage systems is precipitation frequency estimates (PFEs) that allow for estimation of extreme precipitation rates, also called return levels, and the associated return periods. Oftentimes PFEs are based on point rain gauge measurements, either directly computed from a rain gauge precipitation time series or from a regionalized model that is based on a larger network of rain gauges, when representing extreme precipitation in ungauged areas. Weather radar precipitation measurements pose an alternative data source for computing PFEs as longer precipitation time series become available. Here, PFEs can be computed directly at the weather radar pixel scale (corresponding to the spatial resolution of the radar data) without the need for interpolation or other models of ungauged areas.

In this study, we aim to investigate how weather radar derived PFEs compare to rain gauge derived PFEs, especially at the short timescales that are necessary in urban drainage design. In addition to rain gauge radar pixel PFE comparisons, we aim to utilize the fully spatially distributed weather radar derived PFEs to analyze the spatial structure of model parameters over a study area in Denmark. Utilizing a 18-year long C-band weather radar record, PFEs are derived in the form of IDF curves at the pixel scale, along with the corresponding PFEs of rain gauges located within the study area. Timescales ranging from 1 minute to 2 days are considered. The weather radar and rain gauge data sets are analyzed using the median plotting formula for empirical return levels and extrapolated to longer return periods by constructing a partial duration series (PDS). The PDS is then modelled by the Generalized Pareto distribution, where model parameters are determined via maximum likelihood estimation. The resulting PFEs display clear scale differences, where weather radar derived PFEs are underestimated at short timescales. However, IDF curves converge at timescales around 200-300 minutes. The spatially distributed model parameters reveal novel insights with regards to spatial variation of extreme precipitation in the study area. Clear gradients are found in the number of yearly exceedances, the mean exceedance, and the shape parameter controlling the PFEs. Moreover, these parameters are also clearly dependent on the timescale considered, where higher timescales equal smoother parameter surfaces with higher spatial correlation. These results highlight the advantages of supplementing rain gauge data with weather radar data for supplementary information about spatial variation of extreme precipitation over a given area. They also underline methods for determining the specific timescales where users should be aware of scale differences, given the inherent different measurement techniques of rain gauges and weather radar.

How to cite: Vester, I. K., Nielsen, J. M., Nielsen, J. E., and Thorndahl, S.: Deriving Precipitation Frequency Estimates from High-Resolution Weather Radar Rainfall Data, EGU General Assembly 2026, Vienna, Austria, 3–8 May 2026, EGU26-7545, https://doi.org/10.5194/egusphere-egu26-7545, 2026.

EGU26-8124 | ECS | Posters on site | HS7.8

Assessing the risk of failure of tailings storage facilities due to changes in hydroclimatic stressors in a warming world - Case study of Chile 

Pablo Baquedano, Tomás Gómez, Eduardo Muñoz-Castro, and Ximena Vargas

Tailings storage facilities (TSFs) present a persistent stability challenge to the global mining industry, particularly given the large quantity of inactive, closed or abandoned deposits. Due to the potential for catastrophic failures, hydrometeorological hazards, such as extreme precipitation, are one of the main threats to these structures. This stems from the stress that infrastructure can undergo when dealing with these extreme events.  

Current design standards require that TSF be capable of handling the Probable Maximum Precipitation (PMP) and the associated Probable Maximum Flood (PMF). However, the reliability of these design values, traditionally derived from stationary statistical records, is increasingly uncertain in the context of global warming. 

Here, we assessed the hydrological failure hazard of four TSFs across significantly diverse climatic zones -ranging from arid to cold-humid climates- in Chile, a leading country in global copper production with nearly 800 TSF associated with these activities, most of which are inactive or abandoned. To do so, we first estimated PMP values over the historical period 1960-2014 using physically based hydrometeorological methods, including moisture and wind maximization, and contrasted these values with statistically obtained estimations typically used in consultancy. Secondly, to assess long-term safety, projected PMP values for the 21st century were calculated using data from four GCMs following SSP2-4.5, SSP3-7.0, and SSP5-8.5 climate projections with the same hydro-meteorological approach. Changes in the values of PMP throughout the century were analyzed through overlapping 30-year rolling windows over the period 2015-2100.  

Preliminary results for the historical period reveal marked methodological discrepancies between physically based hydrometeorological and statistical methods. For example, while moisture maximization yields estimated values closely aligned with statistical baselines, the incorporation of wind maximization drives PMP values significantly higher, surpassing other methods by up to 78%. Furthermore, no convergence of trends is observed among the four sites in the near future (2015-2044). However, consistent upward trajectory in PMP becomes evident by the century’s end. This is most pronounced under high-emission scenarios, where estimates for the 2075–2100 period rise by 24% to 81% relative to the historical baseline. 

Ultimately, these findings highlight that relying solely on historical statistics may significantly underestimate failure risks due to hydroclimatic extreme events. Ongoing efforts are focused on better understanding how changes in PMP propagate into PMF and how methodological decisions influence hydrological design. 

How to cite: Baquedano, P., Gómez, T., Muñoz-Castro, E., and Vargas, X.: Assessing the risk of failure of tailings storage facilities due to changes in hydroclimatic stressors in a warming world - Case study of Chile, EGU General Assembly 2026, Vienna, Austria, 3–8 May 2026, EGU26-8124, https://doi.org/10.5194/egusphere-egu26-8124, 2026.

EGU26-9156 | Posters on site | HS7.8

A meta-Gaussian stochastic rainfield generator for France 

Emmanuel Paquet

The RAINSIM stochastic daily rainfield generator is based on weather pattern sub-sampling and meta-gaussian models (Ayar et al., 2020). RAINSIM is coupled with an air temperature generator to feed a a distributed hydrological model, allowing to simulate large hydrological chronicles for extreme estimation (both floods and low flows). A large-scale application of RAINSIM to the whole French continental territory (about 500 000 km²) is presented here.

The parameters of the statistical models (both at-site distributions and temporal and spatial covariances) are infered from observed precipitation data at stations, sub-sampled into subsets by seasons and weather types. Before the rainfield generation, sequences of weather types are generated by a Markov model. Here the seasonal transition matrixes are conditionned to observed large-scale climatic indexes such as NAO and WeMO. This conditionning allows a better representation of the year-to-year and decadal variabilities.

The presented application challenges a key assumption of RAINSIM: the stationarity of the spatial covariance.  At the French scale, the diversity of climatology and of the spatial structures of rain fields are significant, thus questioning this hypothesis. To tackle this, an approach based on the deformation of the geographical space (Monestiez et al., 2007) has been tested, thanks to its implementation in the deform R-package (Youngman, 2023). The deformations are computed independently for each subset, illustrating that the spatial covariance structure of the rain fields depends on the weather, and to a lesser extend to the season. Comparisons to observed data with suitable metrics are presented to score this use of covariance-oriented deformations of space.

Perspectives and first developments for application in projected climate are also evoked.


References:

Ayar, P. V., Blanchet, J., Paquet, E., & Penot, D. (2020). Space-time simulation of precipitation based on weather pattern sub-sampling and meta-Gaussian model. Journal of Hydrology581, 124451.

Monestiez, P., Meiring, W., Sampson, P. D., & Guttorp, P. (2007). Modelling Non‐Stationary Spatial Covariance Structure from Space—Time Monitoring Data. In Ciba Foundation Symposium 210‐Precision Agriculture: Spatial and Temporal Variability of Environmental Quality: Precision Agriculture: Spatial and Temporal Variability of Environmental Quality: Ciba Foundation Symposium 210 (pp. 38-51). Chichester, UK: John Wiley & Sons, Ltd..

Youngman, B. D. (2023). deform: An R Package for Nonstationary Spatial Gaussian Process Models by Deformations and Dimension Expansion. arXiv preprint arXiv:2311.05272.


How to cite: Paquet, E.: A meta-Gaussian stochastic rainfield generator for France, EGU General Assembly 2026, Vienna, Austria, 3–8 May 2026, EGU26-9156, https://doi.org/10.5194/egusphere-egu26-9156, 2026.

EGU26-9309 | ECS | Orals | HS7.8

Including prior information on temperature-dependent sub-daily extreme precipitation in a Bayesian framework 

Matteo Darienzo, Antonio Canale, Ella Thomas, Marco Borga, and Francesco Marra

Improving our estimates of extreme precipitation magnitudes with low exceedance probability under climate change scenarios is crucial for disaster preparedness. The task is particularly challenging for sub-daily extremes, as they are hardly resolved by current climate models and they are expected to change at faster rates than longer-duration extremes. A statistical approach to predict future sub-daily extremes using a physically-based dependence on temperature was proposed (TENAX). The approach establishes a functional dependence between the parameters of the statistical model and near-surface air temperature. A temperature model is then used to represent the probability of having a precipitation event at a given temperature. While an exponential relation between scale parameter and temperature can be physically obtained from the Clausius–Clapeyron relation, the dependence of the shape parameter (related to tail heaviness) on temperature is less trivial and may significantly affect the model’s accuracy. Here, we implement a Bayesian framework to investigate this issue and to include prior knowledge on the parameter in the statistical inference. We test both linear and exponential dependencies of the shape parameter on temperature, as well as different temperature models. Preliminary results on several stations in Germany, Japan, the UK, and the USA show consistency of the past return levels with the previous TENAX model (based on maximum likelihood estimation with only the scale parameter dependent on temperature), and with benchmark estimates from a non-asymptotic method (SMEV), in both its classic and time-dependent implementations.

How to cite: Darienzo, M., Canale, A., Thomas, E., Borga, M., and Marra, F.: Including prior information on temperature-dependent sub-daily extreme precipitation in a Bayesian framework, EGU General Assembly 2026, Vienna, Austria, 3–8 May 2026, EGU26-9309, https://doi.org/10.5194/egusphere-egu26-9309, 2026.

EGU26-10332 | Orals | HS7.8

Patterns of low-flow and zero-flow events in Polish rivers: climate signal or catchment impact? 

Krzysztof Kochanek, Ayisha Mammadova, Maria Grodzka-Łukaszewska, Grzegorz Sinicyn, and Mateusz Grygoruk

Climate change is an obvious driver of changes in water regimes in Polish rivers. However, human interventions in catchments strongly magnify its negative effects. One of the most visible consequences is the increasing intermittence of rivers that only a few years ago flowed throughout the year. In Poland, river intermittence is a relatively new phenomenon. Smaller rivers now disappear for significant parts of the year due to prolonged hydrological droughts.

Within the project “Intermittent rivers of Central Europe: Identifying threats to protection goals and biodiversity for efficient nature conservation and climate-proof environmental management”, we analysed all available Polish records of daily discharges and identified 22 gauging stations where extremely low or zero flow occurred at least once during the observation period.

We observed strong temporal unevenness in the occurrence of low-flow events, suggesting that gradual climatic change alone may not fully explain the development of river intermittence. Indeed, when compared with land-cover changes derived from successive CORINE Land Cover maps, some stations revealed sudden increases or decreases in the frequency of low-water events. Although this pattern was not observed for all analysed intermittent rivers, it may provide further evidence that unsustainable water management practices in catchments amplify the effects of climate change.

How to cite: Kochanek, K., Mammadova, A., Grodzka-Łukaszewska, M., Sinicyn, G., and Grygoruk, M.: Patterns of low-flow and zero-flow events in Polish rivers: climate signal or catchment impact?, EGU General Assembly 2026, Vienna, Austria, 3–8 May 2026, EGU26-10332, https://doi.org/10.5194/egusphere-egu26-10332, 2026.

EGU26-10900 | ECS | Posters on site | HS7.8

Critical role of hydrological extreme events in future water security and management of the Integrated Vaal River System 

Muhammad Fraz Ismail, Sophie Biskop, Hubert Lohr, Torsten Weber, Francois Engelbrecht, Auther Maviza, Deborah Schaudt, Sven Kralisch, Thomas Frisius, Johan Malherbe, Chris Moseki, and Yolandi Ernst

The southern African region is heavily impacted by climate change, which significantly alters water availability. The intensity and frequency of hydrological extremes, such as droughts and floods, have greatly increased in the past decades and will likely persist into the future due to projected rises in extreme precipitation and rising temperatures. In this regard, water resource management remains a major challenge in this region. Climate change impacts make it even more critical by transforming water security risks into substantial water insecurity and management challenges, especially for one of the key river systems in South Africa, the highly complex Integrated Vaal River System (IVRS). The IVRS involves inter-basin and transboundary water transfers (i.e., Lesotho Highlands) and is considered a lifeline for Gauteng Province’s water supply. The system faces the risk of a day-zero drought when water levels drop to around 20% or lower in the Vaal Dam, causing taps to run dry.

This study offers insights and prospects on how integrating advanced hydrological models with km-scale (i.e., 4km) high-resolution projected climate change data can help better understand and quantify the role of hydrological extremes in the IVRS.

Initial calibration at different gauging stations shows Kling-Gupta Efficiency (KGE) ranges between 0.60 and 0.70, and the Talsim hydrological model effectively captured seasonal flow and storage dynamics in the Vaal Dam. The storage volumes within the Vaal dam show approximately 8% deviation from observations when operational rules are excluded. The absence of operational rules is identified as the main limitation in current simulation runs. The future work will focus on integrating operational rules and long-term storage changes within the IVRS.

This research is part of the WaRisCo (Water Risks and Resilience in Urban-Rural Areas in Southern Africa - Co-Production of Hydro-Climate Services for Adaptive and Sustainable Disaster Risk Management) project, which is funded within the “Water Security in Africa – WASA” programme.

How to cite: Ismail, M. F., Biskop, S., Lohr, H., Weber, T., Engelbrecht, F., Maviza, A., Schaudt, D., Kralisch, S., Frisius, T., Malherbe, J., Moseki, C., and Ernst, Y.: Critical role of hydrological extreme events in future water security and management of the Integrated Vaal River System, EGU General Assembly 2026, Vienna, Austria, 3–8 May 2026, EGU26-10900, https://doi.org/10.5194/egusphere-egu26-10900, 2026.

EGU26-11355 | ECS | Posters on site | HS7.8

Future changes in sub-daily extreme areal precipitation and their temperature scaling in the Great Alpine Region 

Rashid Akbary, Eleonora Dallan, Paul Astagneau, Raul Wood, Francesco Marra, Manuela Brunner, and Marco Borga

Sub-daily precipitation extremes are a primary trigger of flash floods and debris flows in the Great Alpine Region, yet their future evolution is still uncertain, especially in relation to changes at the catchment scale. Recent work using convection-permitting ensembles has demonstrated added value and different change signals relative to the Regional Climate Models (RCMs) that drive them, but most analyses remain focused on grid-point indices. This study addresses this gap by focusing on areal rather than local precipitation. It provides a unified comparison of Convection Permitting Models (CPMs) and RCM projections of areal extremes, together with a temperature-scaling framework to provide a physical interpretation of the projected changes.

We use the CORDEX-FPS kilometer-scale CPMs and their driving regional climate models to assess changes in areal extreme precipitation between a historical (1996–2005) and far-future (2090–2099) period under the RCP8.5 emission scenario. We quantify projected changes in extreme precipitation across durations from sub-daily to daily and across spatial scales up to 5000 km². We directly compare the change signals from CPMs against those from their driving RCMs. To understand the physical mechanisms behind these changes, we analyse precipitation-temperature scaling relationships, diagnosing where they follow thermodynamic expectations (Clausius-Clapeyron-like scaling) versus where they deviate from those, pointing to more dynamical controls across spatial scales.

How to cite: Akbary, R., Dallan, E., Astagneau, P., Wood, R., Marra, F., Brunner, M., and Borga, M.: Future changes in sub-daily extreme areal precipitation and their temperature scaling in the Great Alpine Region, EGU General Assembly 2026, Vienna, Austria, 3–8 May 2026, EGU26-11355, https://doi.org/10.5194/egusphere-egu26-11355, 2026.

EGU26-11369 | ECS | Orals | HS7.8

How rare are rapid transitions in streamflow? A conditional probability approach 

Bailey Anderson, Maybritt Schillinger, Eduardo Muñoz-Castro, Larisa Tarasova, Wouter Berghuijs, and Manuela Brunner

Drought-to-flood transitions, where low-flow conditions are rapidly followed by high flows, are increasingly framed as compound hydrological hazards. However, it remains unclear whether such transitions are genuinely rare events or simply reflect how they are defined. Most existing studies apply uniform magnitude thresholds and fixed time windows across diverse catchments, implicitly assuming comparable extremeness. Here, we challenge this assumption by reframing transitions in probabilistic terms, quantifying the conditional likelihood of large streamflow swings across a range of severities, durations, and seasonal contexts.

Using daily streamflow records from 4,299 European catchments, we perform three conditional probability experiments to assess how transition likelihood depends on threshold choice, low-flow duration, and timing within the hydrological year. We identify pronounced and spatially coherent patterns in transition probability. Very rapid transitions (e.g. within 14 days) are common in the Alps, coastal Scandinavia, and the United Kingdom, while catchments with strong hydrological memory exhibit consistently low probabilities, even over long time windows (up to 365 days). Transition probability generally decreases with increasing low-flow duration, except in snow-influenced catchments, where seasonal processes can increase the likelihood of transitions when only longer-duration low flow periods are considered. Examined continuously, low-flow events also exert a persistent influence on subsequent streamflow distributions, particularly when they occur in phase with the climatological dry season.

Our results show that transition definitions commonly used in the literature correspond to frequent events in some regions and extremely rare events in others. This demonstrates that the extremeness of drought-to-flood transitions cannot be inferred from magnitude and timing alone, but must be evaluated relative to their conditional or joint probability of occurrence. We argue that compound hydrological transitions should be defined consistently with other extremes, using probability-based or impact-relevant criteria rather than uniform thresholds.

How to cite: Anderson, B., Schillinger, M., Muñoz-Castro, E., Tarasova, L., Berghuijs, W., and Brunner, M.: How rare are rapid transitions in streamflow? A conditional probability approach, EGU General Assembly 2026, Vienna, Austria, 3–8 May 2026, EGU26-11369, https://doi.org/10.5194/egusphere-egu26-11369, 2026.

EGU26-12005 | Orals | HS7.8

Estimation of areal reduction factors of extreme precipitation based on radar data  

Golbarg Salehfard and Uwe Haberlandt

Areal Reduction Factor (ARF) is a well-established hydrological concept used to convert point precipitation to areal precipitation. The aim of this work is to develop a dataset of ARFs all over Germany, which can be utilized to convert point precipitation extremes to areal precipitation extremes for different area sizes, using RADKLIM radar Product. Initially, point and areal precipitation quantiles, covering seven distinct area sizes up to 1225 km², are estimated at more than 10000 randomly selected RADKLIM pixels. Following the extreme value analysis, areal depth-duration-frequency (ADDF) curves are derived and pixels with the crossing problem - as defined in Goshtasbpour & Haberlandt (2025)- are filtered out. The remaining pixels are further analyzed as study locations. ARFs are then calculated at these study locations, for nine durations from 5 to 1440 minutes, and eight return periods from 1 to 50 years. ARFs typically increase with increasing duration and decrease with increasing area. To model the calculated ARFs as a function of area and duration, a well-performing four-parameter ARF expression from De Michele et al. (2001) is utilized. This model accurately represents the expected behavior of ARFs in relation to area and duration, and has been widely used in the literature. The application of the De Michele model simplifies the representation of ARFs at each study location and for each return period by representing them with only four estimated parameters, instead of 63 different ARF values considering all durations and area sizes. The estimated ARF fitting parameters show solid performance across most study locations, as indicated by the goodness-of-fit criteria: R², Percent Bias, and normalized Root Mean Square Error. Finally, the estimated parameters are interpolated in the space using various geostatistical techniques to provide countrywide raster based ARFs.


How to cite: Salehfard, G. and Haberlandt, U.: Estimation of areal reduction factors of extreme precipitation based on radar data , EGU General Assembly 2026, Vienna, Austria, 3–8 May 2026, EGU26-12005, https://doi.org/10.5194/egusphere-egu26-12005, 2026.

EGU26-12036 | Orals | HS7.8

Analysis of projected compound climate extremes across two major river systemsin South Africa 

Torsten Weber, Sophie Biskop, Muhammad Fraz Ismail, Yolandi Ernst, and Francois Engelbrecht

Projected increases in temperature and alterations in precipitation patterns across two major river systems in South Africa necessitate the implementation of adaptation strategies to address water scarcity and flood hazards. The Integrated Vaal River System (IVRS), the primary freshwater supply system for Johannesburg, is increasingly challenged by extreme drought conditions, and the coastal rivers, including the Umgeni, Mlazi, and Mbokodweni rivers, east of the Lesotho highlands in the Greater Durban region, face significant flood risks. To develop adaptation measures, compound climate extremes, such as coincident or sequential meteorological droughts and heatwaves, as well as meteorological droughts followed by extreme precipitation, are of particular interest.

In the present study, the focus is on the changes in frequency and spatial distribution of coincident and sequential compound climate extremes across both river systems. Using the bias-adjusted CORDEX-CORE Africa climate RCP8.5 projection ensemble at a 0.22° spatial resolution, generated by three regional climate models that dynamically downscaled three distinct Earth system models, enables a comprehensive assessment of model uncertainties. Initial results indicate that the occurrence of coincident meteorological droughts and heatwaves increases along a south-to-north gradient, with longer durations over the IVRS toward the end of the century. This research is conducted in the WaRisCo project, which is a part of the “Water Security in Africa – WASA” programme.

How to cite: Weber, T., Biskop, S., Ismail, M. F., Ernst, Y., and Engelbrecht, F.: Analysis of projected compound climate extremes across two major river systemsin South Africa, EGU General Assembly 2026, Vienna, Austria, 3–8 May 2026, EGU26-12036, https://doi.org/10.5194/egusphere-egu26-12036, 2026.

EGU26-12498 | ECS | Posters on site | HS7.8

Intra-annual variation in the driving mechanisms of drought in the southern Peruvian Andes 

Olivia Atkins, Pierina Milla, Waldo Lavado-Casimiro, Jhan Carlo Espinoza, and Wouter Buytaert

Early warning of drought in the southern Peruvian Andes could enable anticipatory action to reduce the economic, social and environmental impacts. However, accurate and timely drought prediction is inhibited by a complex hydroclimate across time and space, owing to mountainous topography and the influence of multiple interacting climate drivers. Current understanding of the mechanistic link between oceanic and atmospheric variability, and drought, is limited, and possible intra-annual variation in the driving mechanisms of drought remains unconstrained. In this study we explore the effects of large-scale climate variability on the dominant modes of atmospheric circulation over South America, and the subsequent influences on precipitation- and temperature-driven drought. We find that meteorological drought during the onset of the wet season occurs during La Niña, which inhibits the development of the Bolivian High. In contrast, during the peak and termination of the wet season, El Niño causes drought via a weakening and northeast shift of the Bolivian High. Propagation to soil moisture and vegetation drought occurs quickly and is broadly driven by these same driving mechanisms, although temperature variability becomes more influential than precipitation variability. Propagation is modulated locally by land cover heterogeneity; higher elevation grasslands are particularly vulnerable. Hydrological drought develops over longer timescales due to buffering by catchment-scale processes. We conclude that actionable early warning of drought in the southern Peruvian Andes must be localised in time and space to account for this complexity in drought driving mechanisms.

How to cite: Atkins, O., Milla, P., Lavado-Casimiro, W., Espinoza, J. C., and Buytaert, W.: Intra-annual variation in the driving mechanisms of drought in the southern Peruvian Andes, EGU General Assembly 2026, Vienna, Austria, 3–8 May 2026, EGU26-12498, https://doi.org/10.5194/egusphere-egu26-12498, 2026.

Derived flood frequency analysis (DFFA) allows the estimation of design floods with hydrological modelling for both poorly observed basins and for catchments under nonstationary conditions. For mesoscale catchments long records of sub-daily precipitation are required. As these are usually not easily available, stochastic weather data can be used as an alternative. Objective of this research is to find the optimal calibration strategies of a hydrological model for DFFA using stochastic weather data as input by comparing various calibration alternatives. The optimal calibration of the hydrological model should a) consider long records regarding robust estimation of the extremes b) select the most informative parts from these records and c) utilise the stochastic input data.

Hourly climate variables are disaggregated from long daily records using a k-nearest neighbour approach. For hydrological modelling the semi-distributed conceptual HBV model is used. The model is calibrated alternatively on observed flow data and on various flow statistics considering different temporal discretisations and time periods. The main validation of the hydrological model is based on long term flood statistics. The calibration approaches are tested for several mesoscale catchments of the Mulde River basin in Germany. The results will reveal the advantages and disadvantages of the different calibration strategies and if there is an optimal approach.

How to cite: Haberlandt, U. and Brandt, A.: Optimal calibration of hydrological models for derived flood frequency analyses using stochastic rainfall - revisited, EGU General Assembly 2026, Vienna, Austria, 3–8 May 2026, EGU26-12536, https://doi.org/10.5194/egusphere-egu26-12536, 2026.

EGU26-14683 | Orals | HS7.8

Universal Multifractals characterization of Intensity-Duration-Frequency curves 

Auguste Gires, Eleonora Dallan, Francesco Marra, Daniel Schertzer, and Ioulia Tchiguirinskaia

Quantifying rainfall extremes and their temporal evolution is essential for hydrological risk analysis and infrastructure design, and is commonly based on intensity–duration–frequency (IDF) curves. In this study, we further develop the framework proposed by Bendjoudi et al. (1997), in which IDF curves are theoretically derived within the Universal Multifractals (UM) formalism. This approach is mathematically robust and parsimonious, and is grounded in the physically based concept of scale invariance inherited from the Navier–Stokes equations.

Relying on either a unique scaling regime or two scaling regimes with a break at roughly 14 days, and the existence of a multifractal phase transition associated with moment divergence, IDF curves can be derived where rainfall intensity follows a power-law relationship with both return period (positive exponent) and duration (inverse exponent). The values of the exponents and of a prefactor can be directly inferred from the UM characterization of the rainfall process.

The framework was tested using rain-gauge data from six stations in Northern Italy, with record lengths ranging from 30 to 38 years. The agreement between the theoretically predictions from the UM analysis and the observed values of the prefactor and the two exponents, according to the quality of the scaling, is discussed. Possible directions for further improvements of the framework will also be discussed.


Authors acknowledge the France-Taiwan Ra2DW project for financial support (grant number by the French National Research Agency – ANR-23-CE01-0019-01).

References:

Bendjoudi H., Hubert P., Schertzer D., Lovejoy S., 1997, Interprétation multifractale des courbes intensité-durée-fréquence des précipitations, Comptes Rendus de l'Académie des Sciences - Series IIA - Earth and Planetary Science, 325, 5, 323-326,https://doi.org/10.1016/S1251-8050(97)81379-1

How to cite: Gires, A., Dallan, E., Marra, F., Schertzer, D., and Tchiguirinskaia, I.: Universal Multifractals characterization of Intensity-Duration-Frequency curves, EGU General Assembly 2026, Vienna, Austria, 3–8 May 2026, EGU26-14683, https://doi.org/10.5194/egusphere-egu26-14683, 2026.

EGU26-14732 | Orals | HS7.8

Flood frequency analysis and a regional peak streamflow correction factor model for Kashkadarya Region, Uzbekistan 

Elena Crowley-Ornelas, William H. Asquith, Alisher Khudoyberdiev, Theodore Barnhart, and Gulomjon Umirzakov

Floods are the most common natural hazard in the Republic of Uzbekistan and cause loss of life for humans and livestock, damage infrastructure, destroy or impair habitats, and disrupt the economy. To inform infrastructure design and water management scenarios, statistical flood frequency analyses are performed. Ideally, statistical flood frequency analyses are based on instantaneous annual peak streamflows because peak streamflows are causative to maximum flood inundation surfaces. When instantaneous annual peak streamflows are not available, such as the historical hydrologic data portfolio in Uzbekistan, the largest daily mean streamflow becomes the surrogate for the annual peak. These 1-day annual maxima are usually an underestimation of the true peak streamflow for the year, particularly in a region where flood hydrograph durations are short and flashy. This problem in hydrologic risk analysis is exemplified in the Kashkadarya Region of Uzbekistan where long-term (50+ years) daily mean streamflow data exist, but digitized streamflow data is limited to 1991 to present at ten streamgages. Given that instantaneous peaks are not available for the Uzbek streamgages, a correction factor was calculated based on 3,466 station-years of daily mean streamflow and peak streamflows at 185 streamgages in, New Mexico, USA. New Mexico was chosen because it is a comparatively data-rich region with somewhat analogous topography and precipitation to Kashkadarya, Uzbekistan. The analysis showed that on average, instantaneous annual peaks were 38% higher than annual daily maxima. A regional statistical model was made using basin characteristics as explanatory variables to estimate an adjustment factor to increase flood streamflows based on the annual daily maxima. The modeled adjustment factor was then applied to annual exceedance probability streamflows from a flood frequency analysis performed at the ten streamgages in the Kashkadarya Region. The frequency analysis was performed using generalized extreme value probability distribution on daily streamflows from 1992 to 2020.

How to cite: Crowley-Ornelas, E., Asquith, W. H., Khudoyberdiev, A., Barnhart, T., and Umirzakov, G.: Flood frequency analysis and a regional peak streamflow correction factor model for Kashkadarya Region, Uzbekistan, EGU General Assembly 2026, Vienna, Austria, 3–8 May 2026, EGU26-14732, https://doi.org/10.5194/egusphere-egu26-14732, 2026.

EGU26-14969 | ECS | Posters on site | HS7.8

A Parsimonious Semi-Distributed Framework for Event-Based Runoff Modeling 

Chrysanthos Farmakis, Andreas Langousis, Emmanouil N. Anagnostou, and Stergios Emmanouil

Event-based hydrologic modeling is typically governed by a fundamental trade-off: lumped models are straightforward to implement but neglect spatial variability, whereas fully distributed models require extensive parameterization, limiting their applicability. This study proposes a semi-distributed modeling framework coupled with data-driven parameter estimation, requiring minimal calibration. The studied basin is divided in sub-catchments, within which runoff generation is modeled using the Soil Conservation Service (SCS) Curve Number (CN) method.  Basin-specific CN relationships are developed for November–April and May–October, and used to rescale subbasin CNII values, preserving spatial heterogeneity. The effective precipitation is transformed to direct-runoff using the SCS Unit Hydrograph. This approach avoids over-parameterization while maintaining spatial detail and consistent performance at ungauged locations. In a case study over the Housatonic River Basin, the model reproduces observed storm peak discharges without calibration and performs consistently across gauges. Systematic and random error components, as well as CN uncertainty, are quantified to assess their effects on the simulated peak discharges. The findings show that the proposed modeling framework is well-suited for basin-scale applications, including integration into infrastructure risk assessment models.

How to cite: Farmakis, C., Langousis, A., Anagnostou, E. N., and Emmanouil, S.: A Parsimonious Semi-Distributed Framework for Event-Based Runoff Modeling, EGU General Assembly 2026, Vienna, Austria, 3–8 May 2026, EGU26-14969, https://doi.org/10.5194/egusphere-egu26-14969, 2026.

EGU26-15379 | Orals | HS7.8

Stochastic Simulation of Unprecedented Rainfall Events under Climate Change: From Hurricane Harvey to Continental-Scale Risk Assessment 

Rajarshi Das Bhowmik, Ashlin Ann Alexander, Tabassum Rasool, and Nagesh Kumar Dasika

Unprecedented rainfall events are characterized by extremely high magnitudes and very low probabilities. Such events are occurring more frequently under a warming climate, despite being poorly represented in historical records. While former studies investgated physical drivers of such extremes, statistical approaches to quantify their likelihood and impacts remain limited. The current study presents a serial-type stochastic rainfall generator (SRG) explicitly designed to simulate unprecedented rainfall by incorporating non-stationarity through resampling and perturbation of model parameters governing the power-law tails of rainfall distributions. The approach is first evaluated over Southeast Texas using daily rainfall simulations for the 2017 Hurricane Harvey event, based on rainfall accumulation data from eight weather stations. By adjusting two power-law tuning parameters to represent warming conditions, the SRG successfully generates Harvey-like rainfall extremes. Simulated rainfall magnitudes associated with 50-, 100-, 250-, and 500-year return periods substantially exceed historical estimates. Additionally, the inferred return period of Harvey-scale rainfall closely aligns with previous independent assessments. The framework is subsequently extended to the Indian region, where thirty-six climate-change-relevant precipitation scenarios are generated by perturbing SRG parameters. High-performance computing is used to simulate daily rainfall across the domain, from which rainfall return levels and depth–duration–frequency (DDF) curves are derived. Results indicate substantial increases in rainfall return levels across all frequencies when unprecedented events are considered, particularly in coastal, northeastern, and Himalayan regions. Consistent spatial patterns and low spatial uncertainty across climate zones demonstrate the robustness of the SRG despite its point-based formulation. The proposed framework provides a statistically grounded pathway for revising design storms and supporting climate-resilient flood risk management under non-stationary climate conditions.

How to cite: Das Bhowmik, R., Alexander, A. A., Rasool, T., and Dasika, N. K.: Stochastic Simulation of Unprecedented Rainfall Events under Climate Change: From Hurricane Harvey to Continental-Scale Risk Assessment, EGU General Assembly 2026, Vienna, Austria, 3–8 May 2026, EGU26-15379, https://doi.org/10.5194/egusphere-egu26-15379, 2026.

The stationarity of rainfall extremes is increasingly challenged by a changing climate, necessitating a deeper understanding of both remote and regional atmospheric drivers. While traditional risk assessments for India often rely on global climate indices like the El Niño–Southern Oscillation (ENSO) and the Indian Ocean Dipole (IOD), these one-dimensional approaches often struggle with covariate multicollinearity and fail to capture interacting physical processes. This study explores the Principal Component Analysis (PCA) with wavelet coherence to evaluate the influence of nine climate indices on extreme monthly rainfall across peninsular India (1901–2021). By transforming correlated predictors into orthogonal joint modes, we found that while the primary modes of global climate variability account for nearly half of the total variance, their direct coherence with localized rainfall extremes remains weak and intermittent. In contrast, principal components dominated by regional thermodynamic indicators (specifically Integrated Vapor Transport (IVT) and local temperature anomalies) demonstrated the most persistent and statistically significant coherence, affecting over 80% of the study area. Furthermore, cross-correlation analysis revealed that while ENSO exhibits a 2–3 month lag, regional variables exert a contemporaneous influence on extreme events. Our findings suggest that the governance of rainfall extremes is shifting toward regional-scale processes. Consequently, we argue that for the development of non-stationary extreme value models, local covariates should be prioritized over remote teleconnections. In practical applications, high-resolution products from regional climate models, offer a more physically representative and contemporaneous basis for capturing the drivers of extreme events. This shift in covariate selection has critical implications for improving the accuracy of hydrological hazard assessments and infrastructure design in a non-stationary world.

How to cite: Dixit, S. and Pandey, K.: Assessing the Shifting Drivers of Rainfall Extremes in Peninsular India: From Remote Teleconnections to Regional Thermodynamics, EGU General Assembly 2026, Vienna, Austria, 3–8 May 2026, EGU26-16072, https://doi.org/10.5194/egusphere-egu26-16072, 2026.

EGU26-16267 | Orals | HS7.8

Flood frequency hydrology with a non-stationary, climate-informed weather generator 

Sergiy Vorogushyn, Viet Dung Nguyen, Li Han, Xiaoxiang Guan, and Bruno Merz

Flood risk management faces a fundamental challenge in robustly estimating flood quantiles in a changing climate and developing appropriate adaptation measures. Furthermore, sound risk estimates require spatially coherent and temporally consistent scenarios of extreme precipitation and flood events. In this contribution, we address both challenges by deploying a novel non-stationary climate-informed stochastic weather generator conditioned on dynamic and thermodynamic change signals from global climate models. We generate synthetic weather datasets for present and future climate states in Germany, which are subsequently used to estimate flood quantiles through continuous hydrologic simulations. The seasonality of extremes is analyzed and compared between present and future periods. The robustness of the weather generator-based estimates is exemplified for the flood frequency estimation in the Ahr basin hit by an extreme flood in July 2021 and benchmarked against temporal information expansion using historical floods.

How to cite: Vorogushyn, S., Nguyen, V. D., Han, L., Guan, X., and Merz, B.: Flood frequency hydrology with a non-stationary, climate-informed weather generator, EGU General Assembly 2026, Vienna, Austria, 3–8 May 2026, EGU26-16267, https://doi.org/10.5194/egusphere-egu26-16267, 2026.

EGU26-16793 | Posters on site | HS7.8

Flood risk assessment under different multi-purpose reservoir allocation strategies: an operational driven copula approach  

Diego Avesani, Nicola Di Marco, Filippo Zambon, Bruno Majone, and Giuliano Rizzi

Multi-purpose reservoirs in Alpine regions must balance competing demands for flood protection, hydropower generation, and water supply. This requires robust flood risk assessment frameworks to support decision-making under uncertainty. To this end, the aim of this work is to develop an innovative copula-based approach to evaluate flood risk mitigation strategies for Alpine reservoirs by simulating compound events of flood peaks and volumes through Monte Carlo generation.

Bivariate copulas are fitted to observed flood peak discharges and corresponding event volumes extracted from streamflow data, and subsequently employed to generate Monte Carlo synthetic flood events for risk assessment. This enables estimation of conditional probabilities of flood volumes given fixed peak discharges, the key variable controlling available storage capacity and thus the reservoir's ability to mitigate subsequent flood events. The simulated scenarios allow systematic exploration of reservoir responses across diverse flood conditions, evaluating how different initial water levels and water release patterns affect downstream flood risk.

A key innovation of our framework is the operation-based definition of flood events rather than statistical percentiles: we use the maximum turbine discharge capacity as the minimum peak threshold, which varies across reservoirs based on their operational characteristics. This directly links the statistical analysis to management constraints. A minimum inter-event duration, determined through sensitivity analysis, distinguishes between multi-peaked events (where volume accumulates from successive peaks) and truly independent flood occurrences.

The framework provides a quantitative basis for optimizing risk-based trade-offs among multiple water uses, explicitly accounting for how stored volumes affect both flood protection and competing demands, enabling reservoir operators and local authorities to quantify flood risk under alternative water allocation scenarios.

How to cite: Avesani, D., Di Marco, N., Zambon, F., Majone, B., and Rizzi, G.: Flood risk assessment under different multi-purpose reservoir allocation strategies: an operational driven copula approach , EGU General Assembly 2026, Vienna, Austria, 3–8 May 2026, EGU26-16793, https://doi.org/10.5194/egusphere-egu26-16793, 2026.

Flood Frequency Analysis (FFA) is a fundamental tool for flood‐risk assessment and hydraulic design and constitutes the statistical basis of the flood hazard scenarios defined under the European Floods Directive and its national implementations. Classical FFA is typically applied under assumptions of temporal independence and spatial representativeness at individual gauging stations and within the framework of the design storm paradigm. However, these assumptions are increasingly challenged during more extreme compound hydroclimatic events, where rainfall and runoff responses occur synchronously across multiple connected catchments and in successive phases in time. The October 2024 flood in southern Valencia Metropolitan Area (Spain) offers a unique opportunity to revisit FFA under such conditions. Over the course of that day, a spatially extensive and temporally clustered rainfall event affected the five catchments draining in this area, producing an exceptional hydrological response. The accumulated hydrograph had a peak of 7,500 m3/s, but with significant delays between the individual hydrograpghs. The event was characterized by two distinct rainfall phases, with an initial episode in the morning modifying the antecedent hydrological conditions of the catchments, followed by an extreme afternoon-evening phase that induced a strongly non-linear runoff response. Several tributaries responded almost simultaneously, resulting in spatial compounding of peak discharges and unprecedented flow magnitudes at the basin scale. Such a response challenges the assumptions underpinning classical FFA and highlights the need for alternative frameworks capable of representing compound hydrological behavior.

Rather than relying solely on point-based discharge records, this study proposes an integrated approach that combines regional extreme rainfall analysis, stochastic weather generation, and distributed hydrological modelling to estimate discharge quantiles beyond the limitations imposed by short instrumental records and thee design storm hypothesis.

The results indicate that applying the proposed integrated framework leads to a substantial downward revision of discharge quantiles associated with fixed return periods when compared to classical point-based FFA. Flood frequency estimates derived exclusively from local discharge records are strongly influenced by limited sample sizes and by the extrapolation of the upper tail, which can result in unrealistically high discharge quantiles. By combining regional precipitation analysis, stochastic weather generation, and distributed hydrological modelling, the proposed approach better constrains the range and frequency of rainfall-runoff conditions capable of producing extreme flows. As a consequence, discharge magnitudes previously associated with very long return periods are shown to occur more frequently, implying lower discharge values for a given return period and a higher effective frequency of potentially damaging flows.

Overall, this study demonstrates that the proposed framework provides a more consistent and physically grounded basis for estimating flood quantiles under spatially and temporally compounding hydroclimatic conditions, and offers a robust foundation for the derivation of flood hazard maps within the context of current European and national flood-risk management frameworks.

How to cite: Francés, F., Beneyto, C., and Aranda, J. Á.: Flood Frequency Analysis revisited under spatially and temporally Compound Flood Extremes: evidence from southern Valencia Metropolitan Area, Spain, EGU General Assembly 2026, Vienna, Austria, 3–8 May 2026, EGU26-17214, https://doi.org/10.5194/egusphere-egu26-17214, 2026.

EGU26-18039 | ECS | Orals | HS7.8

Emerging Links Between Droughts, Heatwaves and Extreme Precipitation in Europe and the Mediterranean basin 

Belén Rico-Bordera, Pau Benetó, and Samira Khodayar

Extreme climate hazards can occur in isolation or interact as concurrent, compound or transitional events, amplifying their impact on key socioeconomic sectors such as agriculture, tourism and health. In Europe and the Mediterranean basin region, these interactions pose significant risks over the densely populated regions which are highly vulnerable to the combined occurrence of climate hazards. Hence, the study of this aggravating issue in the context of global warming emphasizing the analysis of concurrent, compound, sequential and transitional climate extreme events is crucial to better comprehending their relationships and improving early warning systems and adaptive strategies in emerging climate hotspots.  

In this study daily high-resolution datasets from different sources, (ROCIO-IBEB, EMO1, CERRA, EFFIS, ICV, ERA-5 and MED-REP-L4), have been used to identify atmospheric and marine heatwaves, droughts, wildfires, extreme precipitation events and extreme wind, as well as to detect emerging hotspots.  

Our findings over specific Mediterranean climate change hotspot such as the Valencia Region in eastern Spain reveal a rising frequency of concurrent hazards, with droughts emerging as a key driver of both summer wildfires and extreme autumn precipitation. Besides, our results also indicate an increasing influence of Mediterranean Sea warming on both maximum 2-meter air temperature over land and extreme autumn precipitation highlighting the relevance of the welldocumented Mediterranean SST increase on climate extremes. Besides, relationships among key climate variables have been studied using different methodologies, such as lagged correlations and normalized information flows, to estimate climate factors influences on climate extremes.  

The extension of the analysis to Europe and the Mediterranean basin yielded results that were consistent with those of the regional analysis. It has been determined that the proportion of hazards and drivers that compound forest fires is similar between in and out identified hotspots. Furthermore, AHW-drought and drought-AHW transitions have been analyzed, with heightened intensity observed in the latter. Evidence suggests that drought-EPE transitions occur most severely in regions where droughts and EPEs are most intense as a singular event, too. Regarding MHW analyses in the northeastern Atlantic Ocean and Euro-Mediterranean seas, the results reveal the presence of large high-intensity MHW hotspots over northern seas, especially in the Artic Sea, in contrast with the localized Mediterranean hotspots. 

The present study seeks to determine whether areas susceptible to dry-heat-wet hazards are concomitantly exposed to forest fires and floods. Furthermore, an ongoing analysis of flooding risk will provide additional information on a local scale, which is crucial for identifying interactions among climate hazards, and for evaluating potential risks and vulnerability over these areas. 

How to cite: Rico-Bordera, B., Benetó, P., and Khodayar, S.: Emerging Links Between Droughts, Heatwaves and Extreme Precipitation in Europe and the Mediterranean basin, EGU General Assembly 2026, Vienna, Austria, 3–8 May 2026, EGU26-18039, https://doi.org/10.5194/egusphere-egu26-18039, 2026.

The El Niño–Southern Oscillation (ENSO) is a dominant source of interannual climate variability, strongly influencing hydroclimatic extremes across the U.S. Great Plains (USGP). This study examines the seasonal and lagged impacts of ENSO phases—El Niño, La Niña, and Neutral—on precipitation-based extremes over the USGP for the period 1950–2023. ENSO phases were identified using the Oceanic Niño Index (ONI) with ±0.5 °C thresholds, and seasonal transitions (DJF, MAM, JJA, SON) were analyzed to characterize persistent, isolated, and whiplash ENSO extremes. High-resolution precipitation datasets from PRISM and NOAA Climate Divisions were integrated within a GIS framework to develop seasonal time series and conduct spatial analyses at the climate-division scale. Composite anomaly maps of precipitation percentiles were generated and spatially aggregated using zonal statistics, while Pearson and Spearman correlation analyses, including 3–12-month lags, quantified delayed and region-specific ENSO responses. Statistical significance of phase-wise differences was evaluated using ANOVA, Kruskal–Wallis, and Mann–Whitney U-tests. Results reveal pronounced seasonal asymmetry in ENSO impacts, with La Niña strongly associated with drought conditions in the southern plains and El Niño linked to enhanced wet anomalies across central and eastern regions. The identification of ENSO-sensitive zones improves regional climate predictability and provides actionable insights for anticipatory water-resources management. Overall, the study demonstrates the effectiveness of integrating geospatial analysis, long-term climatological datasets, and robust statistical methods to attribute hydroclimatic extremes to large-scale ocean–atmosphere variability.

How to cite: Talukdar, G. and Wadhawan, K.: Large-Scale Climate Drivers of Spatially and Temporally Compounding Hydroclimatic Extremes, EGU General Assembly 2026, Vienna, Austria, 3–8 May 2026, EGU26-18772, https://doi.org/10.5194/egusphere-egu26-18772, 2026.

Global warming has intensified the frequency and intensity of precipitation anomalies, resulting in extreme drought and wetness that severely affect ecosystems and society. While most existing studies often examine spatial or temporal aspects separately, few have treated these extremes as spatiotemporally contiguous events. Here, we analyze the distinct characteristics of spatiotemporally contiguous extreme drought and wetness events across China during 2001-2024, employing a three-dimensional perspective. The results show that since the 21st century, both extreme drought and wetness events have increased in duration. However, the spatial extent and intensity of drought events have decreased, whereas those of wetness events have expanded significantly. During the growing season, drought events tend to suppress vegetation growth in arid regions yet promote it in humid areas, whereas wetness events exhibit an opposite pattern. Moreover, drought events have detrimental impacts on forests, croplands, and grasslands, while wetness events benefit croplands and grasslands but continue to adversely impact forests. Our findings emphasize the necessity of studying extreme events from a three-dimensional spatiotemporal perspective.

How to cite: Su, R. and Li, Y.: Spatiotemporally Contiguous Extreme Drought and Wetness Events in China and their Impacts on Vegetation, EGU General Assembly 2026, Vienna, Austria, 3–8 May 2026, EGU26-19283, https://doi.org/10.5194/egusphere-egu26-19283, 2026.

EGU26-19494 | Posters on site | HS7.8

Extreme value frameworks for sub-hourly rainfall: comparison of predictive performance across Europe 

Sigrid Schødt Hansen, Roland Löwe, Hjalte Jomo Danielsen Sørup, and Peter Steen Mikkelsen

Several extreme value frameworks are available for modelling rainfall extremes. These include classical asymptotic approaches, such as the Generalised Extreme Value (GEV) distribution applied to annual maximum series, as well as more recently proposed non-asymptotic methods, namely the Metastatistical Extreme Value (MEV) and the Simplified MEV (SMEV) distributions applied to ordinary events. While the non-asymptotic frameworks have been evaluated at daily and hourly timescales, they have not yet been systematically evaluated at sub-hourly timescales across climatic regimes. As a result, it remains unclear whether relative differences in predictive performance observed at longer timescales extend to sub-hourly durations.

We compare the predictive performance of the GEV, MEV, and SMEV distributions using sub-hourly rain gauge observations from 2,810 stations across six European countries. We conduct a cross-validation experiment in which at-site distribution parameters are estimated from a training subset and used to predict the return level associated with the most extreme event in an independent test subset. Performance is quantified as the root mean square error between predicted return levels and observed extreme events, computed over 1,000 iterations per rain gauge and duration.

Results show systematic differences in relative predictive performance across durations and regions, with SMEV being favoured at short durations (up to 3 hours) for the majority of rain gauges, MEV at longer durations, and GEV being competitive for a non-negligible fraction of rain gauges. Overall, no framework consistently outperforms the others across countries and durations, indicating that superior predictive performance of any one extreme value framework cannot be assumed across space or timescales.

How to cite: Hansen, S. S., Löwe, R., Sørup, H. J. D., and Mikkelsen, P. S.: Extreme value frameworks for sub-hourly rainfall: comparison of predictive performance across Europe, EGU General Assembly 2026, Vienna, Austria, 3–8 May 2026, EGU26-19494, https://doi.org/10.5194/egusphere-egu26-19494, 2026.

Many Clausius-Clapeyron (CC) scaling studies relate warming to changes in a single precipitation quantile, which can obscure how “extremes” are defined and overlook the fact that events of different rarity are expected to scale at different, yet physically related, rates. CC analyses are also commonly conducted separately for different event durations, limiting insight into whether distinct processes control precipitation variability across timescales. To overcome this limitation, we propose a framework in which the full precipitation-intensity probability distribution is allowed to vary with climate conditions, enabling multiple quantiles to respond differently and to be associated with different drivers.

We apply this approach to observations from 605 stations across the continental United States, exploring how the parameters of hourly and daily precipitation distributions vary with local thermodynamic covariates and indicators of large-scale atmospheric circulation. An additional set of 456 stations with dew point temperature data is used to further assess the role of atmospheric moisture. Stations are grouped by Köppen-Geiger climate zones to ensure robust and coherent relationships. Results show that at the hourly scale, changes in extremes are primarily explained by local temperature and atmospheric moisture availability, with distributional tail thickening under warmer and moister conditions leading to increasingly rapid intensification for rarer events. At the daily scale, controls shift toward non-local influences associated with large-scale circulation. By characterizing scaling behavior across the entire distribution, this framework provides a physically grounded view of how warming affects both typical precipitation and extremes, and highlights the limitations of CC-based approaches.

Our results suggest that the assessment of future extremes should fully account and  resolve the physical processes, such as convection and orographic forcings, responsible for extreme rainfall generation rather than rely on simplistic CC-based methodologies.

How to cite: Andria, S., Borga, M., and Marani, M.: Redefining Clausius-Clapeyron Scaling to Disentangle Local Thermodynamic vs Large-scale Circulation Controls on Extreme Precipitation, EGU General Assembly 2026, Vienna, Austria, 3–8 May 2026, EGU26-19771, https://doi.org/10.5194/egusphere-egu26-19771, 2026.

EGU26-19991 | ECS | Orals | HS7.8

Spatiotemporal Dynamics of Rain Spell Persistence across the Indian Ganga Basin (IGB) 

Amit Kumar Maurya and Somil Swarnkar

Understanding the evolving dynamics of rainfall extremes is critical for assessing hydroclimatic risks in the Indian Ganga Basin (IGB), one of the world’s most densely populated and monsoon-dependent river systems. This study presents a comprehensive, century-long (1901–2023) assessment of rain spell dynamics across the IGB using a multivariate and probabilistic framework. Rain spells are characterized through the joint consideration of duration, intensity, and rainfall volume, enabling a clear distinction between short-duration (1–3 days) and long-duration (>3 days) events. For each category, a joint probability-based severity index is developed to quantify rainfall extremeness in an integrated manner. The analysis reveals a pronounced basin-scale reorganization of rainfall regimes over the last century. Historically, the IGB was dominated by spatially coherent and persistent long-duration rainfall events. However, recent decades show a marked shift toward increasingly frequent, intense, and spatially fragmented short-duration spells. Since the 1990s, short-duration rainfall events have exhibited rising persistence, increased recurrence rates, and enhanced severity across most parts of the basin. In contrast, long-duration wet spells display declining spatial continuity, reduced stability, and weakening basin-wide coherence. Notably, the entire basin now experiences an elevated occurrence of short, high-intensity events, indicating a fundamental transformation in monsoon rainfall behaviour. These evolving patterns significantly amplify hydrological hazards, including flash floods, rapid surface runoff, soil erosion, and landslides. Concurrently, the decline in sustained rainfall limits groundwater recharge, reduces soil moisture replenishment, and poses challenges for agricultural productivity and water security. The novelty of this study lies in its integration of multivariate rain spell characteristics within a joint probability framework to assess the long-term evolution of rainfall regimes. The findings provide robust evidence of hydroclimatic reorganization across the IGB and establish a probabilistic foundation to inform water resource management, disaster risk reduction, and climate adaptation strategies under a changing monsoon system.

How to cite: Maurya, A. K. and Swarnkar, S.: Spatiotemporal Dynamics of Rain Spell Persistence across the Indian Ganga Basin (IGB), EGU General Assembly 2026, Vienna, Austria, 3–8 May 2026, EGU26-19991, https://doi.org/10.5194/egusphere-egu26-19991, 2026.

EGU26-19999 | Orals | HS7.8

An Event-Based Framework for Multivariate Return Periods of Extreme Rainfall  

Mario Di Bacco, Fernando Manzella, Bernardo Mazzanti, and Fabio Castelli

Rainfall events are inherently spatially extended phenomena that can be described through multiple physical attributes. Nevertheless, return period estimates are still commonly derived from point-scale rainfall intensity series, whose extension to regional-scale hazard assessment and rainfall–runoff modeling relies on strong and often implicit assumptions.

This study presents an event-based framework for the multivariate analysis of extreme rainfall events and the estimation of their return periods at regional scale. Rainfall events are reconstructed over Tuscany (Italy) from high-resolution precipitation records collected from a dense rain gauge network over the period 1999–2024, using a spatio-temporal aggregation approach. Aggregated events are represented through a set of physically meaningful attributes describing their intensity, spatial extent, duration, and precipitation volume, allowing a coherent characterization at event scale.

Extreme-value behavior is modeled through a Peak Over Threshold approach applied to the selected event attributes. Multivariate dependence among extreme events is described using flexible dependence models, enabling the joint behavior of intensity- and extent-related characteristics to be captured without imposing restrictive assumptions. A large synthetic population of extreme events is then generated to support a probabilistic interpretation beyond the limits of the observed sample.

To define multivariate return periods in a consistent manner, events are analyzed within a reduced space of independent latent variables derived from the original attributes. This representation allows extreme events with different physical signatures to be compared within a unified probabilistic framework, while accounting for the multivariate nature of rainfall extremes.

The proposed approach provides a robust basis for the regional-scale assessment of extreme rainfall hazards and highlights key challenges related to the definition and interpretation of return periods for spatially extended events. The framework is designed to support more physically consistent comparisons of extreme rainfall events and to improve their integration into hydrological risk analyses.

How to cite: Di Bacco, M., Manzella, F., Mazzanti, B., and Castelli, F.: An Event-Based Framework for Multivariate Return Periods of Extreme Rainfall , EGU General Assembly 2026, Vienna, Austria, 3–8 May 2026, EGU26-19999, https://doi.org/10.5194/egusphere-egu26-19999, 2026.

Quantifying extreme precipitation is fundamental for effective flood risk management and climate change adaptation. This study seeks to advance the physical interpretation of extreme precipitation statistics by explicitly connecting the properties of statistical distributions to the characteristics of the underlying physical processes. High-temporal resolution observations from approximately 400 rain gauges and temperature stations distributed across the Alpine region are analyzed. Extreme precipitation depths are estimated for durations ranging from sub-hourly to daily, and for return periods of up to 100 years, using a non-asymptotic framework based on the duration maxima of independent meteorological events (storms). Key storm characteristics, such as peak and mean intensity, storm duration, temporal variability, temporal profile metrics, antecedent temperature, are derived and examined in relation to extreme precipitation statistics.

Preliminary findings reveal a strong dependence of extreme precipitation estimates on both topography and accumulation duration. At short timescales, extremes are more intense in lowland regions than in mountainous areas, indicating a reverse orographic effect, whereas the pre-Alpine zone exhibits larger extremes at longer durations. These spatial patterns are consistent with variations in the parameters governing storm intensity and tail behavior of the precipitation distributions. Distribution parameters exhibit weak to strong correlations with storm characteristics, varying across accumulation durations. At sub-hourly scales, the intensity and tail-heaviness parameters display opposite correlations with the same storm properties (that is, an antagonistic effect on return level estimates). Although at these durations the heavy storms are predominantly convective across the whole domain, our results indicate that local storm features play a key role in shaping the extreme precipitation distribution.

By exploring the links between storm structure and extreme precipitation statistics, this work contributes to a more robust characterization and improved prediction of precipitation extremes.


This study was carried out within the RETURN Extended Partnership and received funding from the European Union Next-GenerationEU (National Recovery and Resilience Plan – NRRP, Mission 4, Component 2, Investment 1.3 – D.D. 1243 2/8/2022, PE0000005).

How to cite: Dallan, E.: Storm-scale characteristics governing extreme precipitation statistics in an Alpine region, EGU General Assembly 2026, Vienna, Austria, 3–8 May 2026, EGU26-20115, https://doi.org/10.5194/egusphere-egu26-20115, 2026.

As torrential flood-inducing heavy rainfall intensifies under climate change, new indicators for quantifying short-term precipitation concentration are essential. This study introduces the Modified Inter-Amount Time (M-IAT), which measures the duration required to reach critical precipitation thresholds, and develops the Standardized Torrential Flood Index (STFI) using Generalized Extreme Value (GEV) and Generalized Pareto Distribution (GPD) models. Analysis of 65 ASOS stations (1990–2024) shows that as critical rainfall values (CV) increase, the GPD model evaluates extreme temporal concentration more conservatively than the GEV model. Validation against 39 historical flood events revealed that the GPD-STFI median reached 3.72 (99.99th percentile) during actual damage occurrences, effectively identifying extreme risks. Conversely, the GEV-STFI established stable long-term and structural risk baselines for different regions. The STFI facilitates a paradigm shift from precipitation-centered forecasting to dynamic, hydrological response-time-centered warnings. This study presents an integrated risk management strategy by combining design-oriented GEV models with operation-oriented GPD models, providing a robust framework for flood mitigation.

How to cite: Yoon, S., Kwak, M., and Lee, B.: Development and Application of a Time-Based Standardized Torrential Flood Index via Modified Inter-Amount Time (M-IAT), EGU General Assembly 2026, Vienna, Austria, 3–8 May 2026, EGU26-20262, https://doi.org/10.5194/egusphere-egu26-20262, 2026.

EGU26-21628 | Posters on site | HS7.8

Global Characteristics of Ultra-Extreme Precipitation in Major Cities 

Yookyung Jeong, Alan Hamlet, and Kyuhyun Byun

Climate change is reshaping the statistical characteristics of precipitation, leading to an increased probability of precipitation events that exceed the range of historically observed extremes. Such ultra-extreme precipitation events are exceedingly rare with limited representation in observational record. However, they pose substantial risks to urban systems and hydrologic infrastructure. The scarcity of observations makes it challenging to robustly quantify their frequency and intensity, constraining the scientific basis for climate risk assessment and long-term adaptation planning. To address these challenges, we propose a statistical framework to characterize ultra-extreme precipitation by integrating observational records and climate model projections. The probability of ultra-extreme precipitation events is estimated at each station by counting the number of occurrences with a standardized deviation from the station mean that exceeds a specified threshold. These exceedances are divided by the total number of observations to derive the regional probability of exceedance. In order to evaluate changes under future climate, daily precipitation from Coupled Model Intercomparison Project Phase 6 (CMIP6) models is statistically downscaled to individual station using observation-based quantile mapping. This ensures consistency between modeled and observed precipitation distributions. The framework is applied to approximately 200 global major cities with populations exceeding one million and Gross Domestic Product (GDP) over 100 billion USD. Using this framework, we evaluate changes in ultra-extreme precipitation characteristics between historical and future climate conditions. We expect this framework to facilitate the analysis of spatial and temporal patterns of ultra-extreme precipitation and their potential changes in future. The framework further supports the interpretation of rare but high-impact precipitation events and provides insights for urban flood risk management. Therefore, this study contributes to the development of hydrologic infrastructure design and adaptation strategies that are robust to increasing precipitation extremes under climate change.


Acknowledgment

This work was supported by Korea Environment Industry & Technology Institute(KEITI) through R&D Program for Innovative Flood Protection Technologies against Climate Crisis Program(or Project), funded by Korea Ministry of Environment(MOE)(RS-2023-00218873).

How to cite: Jeong, Y., Hamlet, A., and Byun, K.: Global Characteristics of Ultra-Extreme Precipitation in Major Cities, EGU General Assembly 2026, Vienna, Austria, 3–8 May 2026, EGU26-21628, https://doi.org/10.5194/egusphere-egu26-21628, 2026.

As Earth System Models (ESMs) move toward kilometer-scale grid spacing, resolving small-scale atmospheric processes substantially improves the representation of convection and precipitation. However, the land component remains a major source of uncertainty in the atmospheric water cycle. Inadequate soil moisture and groundwater representations affect evaporation, land–atmosphere coupling, and ultimately the atmospheric supply of water as precipitation. These hydrological biases therefore influence not only local surface conditions but also remote moisture transport and recycling. In this work, we improve the representation of subsurface hydrology in the JSBACH land surface model, coupled to the ICON atmospheric model. We introduce additional soil layers, implement lateral groundwater flow between grid cells, and connect shallow groundwater to the river network. We evaluate the new developments using standalone kilometer-scale JSBACH simulations against flux tower measurements of latent and sensible heat fluxes and soil moisture observations in the Pyrenees (Spain and France). We then assess their impact on atmospheric variables, specifically 2 m temperature and precipitation, within ICON simulations at 3-km grid spacing over Europe.

How to cite: Lalonde, M. and Prein, A. F.: Atmospheric Feedbacks to Improved Subsurface Hydrology in a km-Scale Earth System Model (ICON–JSBACH), EGU General Assembly 2026, Vienna, Austria, 3–8 May 2026, EGU26-2115, https://doi.org/10.5194/egusphere-egu26-2115, 2026.

Large-scale agricultural activities can intensify atmospheric–terrestrial interactions, of which precipitation recycling plays a critical role. During 1982–2018, irrigated area has dramatically expanded in Northwest China (NWC). In this study, a regional precipitation recycling model—the Brubaker model was used to investigate the precipitation recycling ratio (PRR) and recycled precipitation (RP). Evapotranspiration (ET) estimated by the atmospheric–terrestrial water balance method (A–T) was employed to investigate precipitation recycling. Statistically, there was a turning point in 2002 for the rate in irrigated area increase, from 0.07 × 10⁶ ha/year before 2002 to 0.217 × 10⁶ ha/year after 2002. There were significant shifts in ET, PRR, and RP in NWC, using the turning point of irrigated area expansion as the line of demarcation. The contribution of the change in irrigated area to PRR increased from 18.3% (1982–2002) to 22.9% (2003–2018) in NWC. Prior to 2002, enhanced RP offset the increased ET by 72.9%. After 2002, the positive effect of irrigated area expansion on precipitation recycling disappeared in NWC. Due to the different climate and irrigation practices at the province level, the variations in irrigated area and their contributions to PRR were examined in three provinces, Xinjiang, Gansu, and Shaanxi. Results based on the Brubaker model and Budyko framework indicate that in Xinjiang and Gansu, the contribution of the irrigated area change after the turning point to PRR were 24.5% and -95.6%, respectively, and there is no potential for continued expansion of irrigated area. In Shaanxi, however, there is potential for continued expansion of irrigated area. The methodology for quantifying the impact of irrigated area change on PRR provides reliable references for the sustainable use of cultivated land and the protection of agricultural water resources.

How to cite: Wang, X.: Improved understanding of how irrigated area expansion enhances precipitation recycling by land–atmosphere coupling, EGU General Assembly 2026, Vienna, Austria, 3–8 May 2026, EGU26-2498, https://doi.org/10.5194/egusphere-egu26-2498, 2026.

The Tibetan Plateau (TP), often termed the “Asian Water Tower”, is a critical reservoir and regulator of the Asian hydrological cycle. In recent decades, summer precipitation over the TP has exhibited a pronounced South Drying-North Wetting dipole pattern, with profound implications for regional water security and ecosystem stability. Both externally advected and internally recycled precipitation may contribute to this pattern. However, their respective roles and the extent to which anthropogenic forcing has shaped their contributions remain unclear. Here, we use the WAM2layers moisture-tracking model to partition TP summer precipitation into externally sourced and internally recycled components, and to quantify how changes in precipitation frequency and intensity shape the dipole. We find that the dipolar pattern is primarily driven by changes in externally sourced precipitation, which strengthens precipitation in the north while inducing drying in the south, with internally recycled precipitation further amplifying southern aridification. Specifically, increases in the frequency of externally sourced precipitation events lead to a plateau-wide precipitation increase. However, this effect is offset over the southern TP by a concurrent decline in event intensity, thereby shaping northward moistening associated with the externally sourced component. Meanwhile, the reduction of internally recycled precipitation in the southern TP is primarily attributable to a decrease in event frequency, while increases in the north result from simultaneous enhancements in both frequency and intensity. Mechanistically, a weakened subtropical westerly jet, due to spatially uneven emissions of anthropogenic aerosols, strengthens the dipole by enhancing externally sourced precipitation intensity over the northern plateau while suppressing it in the south. By contrast, negative phases of the Interdecadal Pacific Oscillation mainly reduce the frequency of internally recycled precipitation in the south. These findings reveal that anthropogenic forcing and natural variability jointly shape the TP summer precipitation dipole trend.

How to cite: Du, F., Li, C., He, X., and He, Y.: Moisture source partitioning reveals how human influence shapes the Tibetan Plateau summer precipitation dipole pattern, EGU General Assembly 2026, Vienna, Austria, 3–8 May 2026, EGU26-4622, https://doi.org/10.5194/egusphere-egu26-4622, 2026.

In the tropics, the land-ocean precipitation partitioning χ is skewed toward land. We analyze how CO2- and uniform sea surface temperature increase affect this partitioning. To do so, we use 15 years of global simulations conducted with the ICON model at 10 km horizontal grid spacing and explicitly resolved convection, unlike previous studies that parameterized convection. ICON produces a precipitation partitioning that is more consistent with observations compared to the AMIP6 ensemble. Under 4xCO2, precipitation partitioning toward land increases, whereas it decreases in +4K. We develop a framework based on energy and moisture budgets to decompose the response of the precipitation partitioning into contributions from the land column-integrated atmospheric heating, circulation efficiency, moisture cycling, and tropical radiative cooling. In ICON and the AMIP6 ensemble, the land's column-integrated atmospheric heating is identified as the primary driver of changes in precipitation partitioning. This is a result of the change in land moisture convergence and land precipitation in response to circulation adjustments driven by land-sea asymmetries in atmospheric heating. The response of the controlling factors are similar in ICON and in the AMIP6 ensemble, apart from two qualitative differences. First, the land's circulation efficiency is more stable in ICON than in AMIP6, which we interpret to be due to a stronger coupling of precipitation to surface heat fluxes in AMIP6. Secondly, the opposing response in χ  upon 4xCO2 and +4K are virtually equal in magnitude in ICON, whereas in AMIP6 χ decreases more in +4K than it increases in 4xCO2. These findings suggest that coarse-resolution GCMs may overestimate the predicted decrease in land precipitation under global warming.

How to cite: Schulz, M.: The Response of Tropical Land-Ocean Precipitation Partitioning to SST and CO2 increase in Global Storm Resolving Simulations, EGU General Assembly 2026, Vienna, Austria, 3–8 May 2026, EGU26-6701, https://doi.org/10.5194/egusphere-egu26-6701, 2026.

EGU26-6959 | PICO | HS7.9

Global trends in atmospheric dryness dominated by Clausius-Clapeyron scaling 

Tejasvi Ashish Chauhan, Sarosh Alam Ghausi, and Axel Kleidon

Atmospheric dryness, often quantified by Vapor Pressure Deficit (VPD) or Relative Humidity (RH), is a prominent variable for terrestrial water and carbon cycles. While global warming is widely expected to amplify atmospheric dryness, the physical drivers governing this intensification and its regional variations remain poorly understood. Here we analytically decompose trends in daily maximum VPD and minimum RH into contributions from three key factors: the Clausius-Clapeyron temperature sensitivity of saturation vapor pressure, the diurnal temperature range (reflecting daily heat storage changes in lower atmosphere), and the proximity to saturation of the atmosphere at night (defined as the difference between minimum temperature and the dew point). Applying this framework to long-term observations from FLUXNET and ERA5 reanalysis reveals that Clausius-Clapeyron scaling is the dominant driver of global atmospheric drying trends. In addition, we find that regional variations in drying trends between arid and humid regions primarily come from contrasting trends in nighttime atmospheric dryness. This regionally asymmetric response amplifies dryness trends in arid regions while dampens it in humid regions, aligning with the "dry-gets-drier, wet-gets-wetter" paradigm under future climate change. Our analytical framework helps explain observed spatial heterogeneity in atmospheric drying trends and also offers a new pathway for evaluating its representations in climate models.

How to cite: Chauhan, T. A., Ghausi, S. A., and Kleidon, A.: Global trends in atmospheric dryness dominated by Clausius-Clapeyron scaling, EGU General Assembly 2026, Vienna, Austria, 3–8 May 2026, EGU26-6959, https://doi.org/10.5194/egusphere-egu26-6959, 2026.

Atmospheric rivers (ARs) efficiently transport moisture from tropical and/or subtropical regions to middle and high latitudes, serving not only as the most important global poleward moisture transport belts but also as one of the primary causes of extreme precipitation and flooding in many parts of the world. Research on ARs in East Asia started relatively late; however, due to the region’s unique climatic characteristics, the manifestations of ARs differ from those in regions such as North America. In recent years, studying the lifecycle characteristics of consecutive AR events has become increasingly important. Nevertheless, on a climatic timescale, the moisture origins and transport processes during consecutive AR events in East Asia remain poorly understood, which is critical for understanding the genesis and sustenance of such events. In this study, the ERA5 reanalysis data from 1980 to 2024 were used to extract a dataset of consecutive AR events that made landfall in East Asia during this period, based on which the basic climatic characteristics of AR lifecycles were analyzed. Furthermore, this research focuses on the moisture sources and transport processes of ARs, employing an extended dynamic moisture recycling model specifically designed for tracking moisture in consecutive ARs to conduct a detailed quantitative analysis of the moisture budget during the lifecycle of ARs affecting East Asia. The findings reveal that ARs impacting East Asia typically originate from the Bay of Bengal to southwestern China and dissipate over the Yangtze–Huai River region, the Korean Peninsula, and Japan. The moisture contributing to ARs in East Asia mainly originates from the Indian Ocean, the Western Pacific, and high-latitude Eurasian regions, with the most significant contributions coming from the Arabian Sea, the Bay of Bengal, the Western Pacific, and terrestrial areas in eastern China. Notably, the moisture contribution from land areas in East Asia, particularly South China, is crucial for sustaining and transporting moisture during the AR lifecycle, highlighting the reliance of consecutive AR events on moisture transport from mid- and even high-latitude regions.

How to cite: Hua, L. and Zhong, L.: Quantitative Analysis of Moisture Budget in the Lifecycle of Consecutive Atmospheric River Events Affecting East Asia, EGU General Assembly 2026, Vienna, Austria, 3–8 May 2026, EGU26-8606, https://doi.org/10.5194/egusphere-egu26-8606, 2026.

EGU26-9037 | PICO | HS7.9 | Highlight

Future trajectories of terrestrial moisture recycling 

Arie Staal, Chiel Lokkart, Xi Cai, Merwin Slagter, and Nico Wunderling

Roughly half of continental precipitation originates from terrestrial evaporation in upwind regions, yet how these land–atmosphere moisture connections will evolve under climate and land-cover change remains poorly constrained. Earth System Models (ESMs) simulate future precipitation, evaporation, and atmospheric circulation, but they do not explicitly resolve the pathways linking evaporation to downwind precipitation. These pathways can, however, be reconstructed from ESM outputs using moisture tracking.

Here we present different forward- and backward-tracking experiments with the Lagrangian atmospheric moisture tracking model UTrack, forced by multiple CMIP6 ESMs, that quantify future changes in terrestrial moisture recycling across Shared Socioeconomic Pathways (SSP1-2.6, SSP2-4.5, SSP3-7.0 and SSP5-8.5) throughout the 21st century. Across models and scenarios, we find an average weakening of terrestrial moisture recycling with warming, with the strongest declines occurring in drying hotspots. In the Amazon rainforest specifically, we find that combined climate change and deforestation may trigger cascading forest transitions mediated by moisture recycling.

We further present results from experiments that investigate whether large-scale ecosystem restoration globally and regionally can counteract specific drying trends through targeted precipitation enhancement.

Our results show that climate change will not only modify precipitation patterns, but will reorganize the continental origins of that precipitation, indicating both future risks for water-stressed ecosystems as well as the potential of ecosystem restoration to mitigate those risks.

How to cite: Staal, A., Lokkart, C., Cai, X., Slagter, M., and Wunderling, N.: Future trajectories of terrestrial moisture recycling, EGU General Assembly 2026, Vienna, Austria, 3–8 May 2026, EGU26-9037, https://doi.org/10.5194/egusphere-egu26-9037, 2026.

The Northern Sandy Belt, a key ecological barrier and fragile zone in China, has its regional sustainable development determined by the coordination status of its water and soil resources system. This study takes the Horqin-Hunshandake Sandy Area as the research object. Based on data from 2006 to 2022, we established an adaptive evaluation system consisting of 18 indicators, and combined the coupling coordination degree model with Tobit regression to reveal the evolutionary characteristics and influencing mechanisms of the system’s coupling coordination. The results show that:(1) During the study period, the coupling coordination degree showed a fluctuating upward trend, rising from 0.367 in 2009 to 0.602 in 2021. The coordination status shifted from mild imbalance to basic coordination, but its stability was insufficient, with significant declines in 2017, 2019, and 2022;(2) There was significant spatial differentiation: Tongliao City had the highest and most stable coordination level, while Hinggan League had the lowest, and Xilingol League experienced the most drastic fluctuations. Regional differences are closely linked to the natural background and socio-economic patterns;(3) The system development exhibited phased transitions: the water resources system dominated from 2006 to 2014, while the contribution of the land resources system increased from 2015 to 2022;(4) Annual precipitation had a significant positive promoting effect on the coupling coordination degree, while annual water consumption had a significant negative inhibiting effect; population pressure indirectly affected the system balance through resource demand.

This study indicates that water resources are the core constraint for the development of the Northern Sandy Belt, and exceeding the carrying capacity will lead to system imbalance. For future development, it is necessary to adhere to the principle of "determining land use and production based on water availability", strengthen rigid constraints on water resources, implement differentiated management, and build a monitoring and early warning system to achieve sustainable development. This study provides a scientific basis for the optimal allocation of regional water and soil resources and ecological management.

How to cite: Wang, K.: Research on the Coupling Coordination Degree andInfluencing Mechanisms of the Water and Soil ResourcesSystem in the Northern Sandy Belt, EGU General Assembly 2026, Vienna, Austria, 3–8 May 2026, EGU26-9803, https://doi.org/10.5194/egusphere-egu26-9803, 2026.

EGU26-10910 | ECS | PICO | HS7.9

Climatological Drivers of Pan Evaporation in the Riau Islands, Indonesia 

Miranda Anjelina Parhusip, Miranda Putri Permatasari, and Shien-Tsung Chen

Pan evaporation (Epan) is widely used as an indicator of atmospheric evaporative demand and plays an important role in understanding land-atmosphere interactions under climate variability. However, observed changes in Epan do not always follow the expected increase with rising temperature, a phenomenon known as the pan-evaporation paradox. The relative influence of climatological drivers on Epan remains particularly uncertain in humid equatorial regions, where high moisture availability may alter the controls on evaporation. This study examines pan evaporation and associated climatological variables in Riau Island, Indonesia. Temporal trends are assessed using the Trend-Free Pre-Whitening Mann–Kendall test, while Spearman correlation analysis is applied to evaluate the relationships between Epan and key climatic factors, including solar radiation duration, relative humidity, precipitation, wind speed, and air temperature. The results show that correlation analysis indicates that Epan is strongly and positively associated with solar radiation duration and negatively associated with relative humidity and precipitation. Wind speed shows a moderate positive relationship with Epan, while temperature variables exhibit weaker associations. Trend analysis further shows that minimum temperature exhibits a statistically significant increasing trend, whereas wind speed displays a statistically significant declining trend. In contrast, pan evaporation does not exhibit a statistically significant long-term trend. Overall, the findings suggest that pan evaporation variability in humid equatorial climates is primarily governed by radiative and moisture-related controls rather than temperature alone. The opposing effects of increasing temperature and declining wind speed likely contribute to the statistically insignificant long-term trend in pan evaporation observed, providing observational insight into evaporation dynamics under humid tropical conditions.

How to cite: Parhusip, M. A., Permatasari, M. P., and Chen, S.-T.: Climatological Drivers of Pan Evaporation in the Riau Islands, Indonesia, EGU General Assembly 2026, Vienna, Austria, 3–8 May 2026, EGU26-10910, https://doi.org/10.5194/egusphere-egu26-10910, 2026.

Extreme precipitation associated with landfalling tropical cyclones poses major forecasting challenges, particularly over complex terrain. This study investigates the sensitivity of simulated hurricane rainfall to microphysics parameterization and horizontal resolution using the Weather Research and Forecasting (WRF) model for Hurricane Melissa, a Category 5 storm that made historic landfall over Jamaica in October 2025 and produced rainfall exceeding 1,000 mm in mountainous regions. Four WRF simulations were conducted using two commonly applied microphysics schemes, WSM6 (single-moment) and Morrison (double-moment), across two domain configurations: a single 9 km grid covering the Caribbean basin and a nested configuration with a 3 km convection-permitting inner domain centered over Jamaica. Model outputs were evaluated against satellite-based precipitation estimates from IMERG and CHIRPS. Results suggest that horizontal resolution strongly controls the spatial pattern of simulated precipitation. The 3 km nested simulations capture sharper gradients, localized maxima, and more physically consistent rainfall structures compared to the smoother and more diffuse patterns produced at 9 km resolution. Differences between microphysics schemes are secondary to resolution but remain evident, with the Morrison scheme producing more coherent and structured precipitation fields, while WSM6 generates more fragmented and spatially patchy rainfall. All simulations accurately reproduce the timing of peak precipitation during landfall, indicating weak sensitivity of storm evolution to microphysics choice. However, total rainfall amounts vary substantially across configurations, with convection-permitting simulations producing significantly higher accumulations. These totals exceed CHIRPS estimates, likely due to the underestimation tendency of extreme precipitation in complex terrain by CHIRPS, while agreement with IMERG varies by location and intensity. These findings highlight that accurate representation of extreme tropical cyclone precipitation requires convection-permitting resolution, while rainfall intensity remains sensitive to both microphysics selection and observational reference datasets.

How to cite: Muna, T. S., Miller, P. W., and Bushra, N.: Sensitivity of Extreme Hurricane Precipitation to WRF Microphysics and Grid Spacing: Hurricane Melissa (2025) Landfall over Jamaica, EGU General Assembly 2026, Vienna, Austria, 3–8 May 2026, EGU26-15243, https://doi.org/10.5194/egusphere-egu26-15243, 2026.

EGU26-18321 | ECS | PICO | HS7.9

Deep root vegetation adaptations to drought and their modulation of evapotranspiration (ET) in Africa 

Dana Romera-Otero and Gonzalo Míguez-Macho
Soil moisture exerts a strong influence on the surface energy balance, boundary layer development, convection, and precipitation, particularly in climates with seasonal drought where ET is water-limited. Lacking precipitation and surficial water sources, vegetation develops deep roots to access subsurface moisture stores from past precipitation or groundwater, effectively coupling the atmosphere to these slowly varying water reservoirs. Here we focus on Africa and ask how vegetation deep rooting systems over seasonally dry climates like those in the savannas modulate land surface fluxes, particularly during the transition from dry to wet seasons. We use the Noah-MP model with a newly implemented deep rooting scheme coupled to the MMF groundwater scheme and perform off-line simulations over Africa, comparing results with the default version with 2m soil columns and fixed roots depending on vegetation class- an approach still used by most land surface models. Atmospheric forcing is from ERA5.
Our results reveal that vegetation has a greater influence on ET fluxes across much of the African continent than most models assume, which can have implications for our current understanding of soil moisture-precipitation interaction in this well known hot-spot for land-atmosphere coupling.

How to cite: Romera-Otero, D. and Míguez-Macho, G.: Deep root vegetation adaptations to drought and their modulation of evapotranspiration (ET) in Africa, EGU General Assembly 2026, Vienna, Austria, 3–8 May 2026, EGU26-18321, https://doi.org/10.5194/egusphere-egu26-18321, 2026.

EGU26-18978 | ECS | PICO | HS7.9

Irrigation boosts precipitation on cropland for international trade through atmospheric moisture transport 

Elena De Petrillo, Marta Tuninetti, Luca Ridolfi, and Francesco Laio

Agriculture accounts for approximately 70% of global freshwater withdrawals, while around 20% of global cropland is irrigated and supports nearly 40% of total crop production. In an increasingly globalized food system, up to one-third of this production is traded internationally, redistributing the water embedded in crop production, i.e., virtual water, from producing to importing countries. Previous studies have extensively assessed the hydrological and socio-economic impacts of freshwater withdrawals embedded in food trade, focusing on both surface and groundwater resources. However, how irrigation contributes to agricultural production and consequent virtual water exports when returns on land as precipitation through atmospheric transport, is currently unexplored.

This study addresses this gap by quantitatively assessing to what extent irrigation for primary crop production in one country contributes to precipitation in other countries and how this precipitation subsequently supports crop production and trade. The methodology integrates agro-hydrological modelling of the crop evapotranspiration attributable to irrigation with harmonized bilateral datasets on atmospheric moisture transport and virtual water trade.

Specifically, we use the agro-hydrological model waterCROP to estimate the blue water demand associated with 167 primary crops, scaling total virtual water volumes from the CWASI database to blue virtual water flows. These estimates are coupled with atmospheric moisture tracking data from the RECON dataset, a processed version of the Lagrangian output of the UTrack model reconciled with ERA5 reanalysis data for the period 2008–2017. The analysis is conducted at the global scale for the representative year 2013, ensuring consistency between atmospheric moisture flows and virtual water trade datasets.

By coupling these bilateral networks, we construct a new set of water teleconnections that explicitly links agricultural water use to atmospheric moisture transport, precipitation, crop production, and trade. Within this framework, we assess how irrigation in one country contributes to precipitation in other countries, and if this contribution alleviates, compensates, or worsens the need for freshwater withdrawals. This allows us to identify synergies and trade-offs in the geographic redistribution of precipitation originating from irrigation and the associated water use embedded in the international trade of crops.

By revealing how the precipitation originated from the evapotranspiration of irrigated crops contributes to agricultural production beyond national borders, the analysis highlights previously overlooked feedbacks between water use, atmospheric moisture transport, and food trade.


How to cite: De Petrillo, E., Tuninetti, M., Ridolfi, L., and Laio, F.: Irrigation boosts precipitation on cropland for international trade through atmospheric moisture transport, EGU General Assembly 2026, Vienna, Austria, 3–8 May 2026, EGU26-18978, https://doi.org/10.5194/egusphere-egu26-18978, 2026.

HS8.1 – Subsurface hydrology – Transport processes & Groundwater Quality

EGU26-651 | ECS | Orals | HS8.1.1

The role of Stylolites as Proto-Karsts in Speleogenesis 

Silvana Magni, Jean-Pierre Gratier, and Andrej Šmuc, Šmuc

Karst features are often linked to fractures and faults, considered the main pathways for water circulation and dissolution. Our study shows this view is incomplete, highlighting the overlooked role of stylolites, serrated seams formed under compressive stress, as starting points for karst. Fieldwork in Apulia (Southern Italy), combined with laboratory analyses, reveals that stylolites can initiate porosityguide fluid flow, then acting as proto-karst structures. They concentrate insoluble minerals such as clays, micas, and oxides that, under the right conditions, promote localized dissolution. Microscopic analyses of 15 samples show higher porosity within stylolites than in the host rock, with pores often clustering at stylolite–matrix boundaries. This suggests that what begins as a sealing surface can later evolve into a porous interface once stress regimes change or insoluble residues are removed. Mineral re-precipitation and localized dolomitization confirm past fluid circulation along stylolites. Field surveys reinforce these findings: in Apulia, over 80% of stylolites display dissolution features, compared with far fewer in faults or fractures. Orientation data from caves such as Grave Rotolo show main passages often align with stylolites rather than other tectonic structures. We propose a three-stage model of stylolite evolution: (1) sealed seams enriched in insoluble residues, (2) microporosity nucleation under favorable conditions, and (3) growth of interconnected pores into early conduits. This model shows stylolites can shift from barriers to fluid pathways. Recognizing them as proto-karst has practical implications for hydrogeology and carbonate reservoir management.

How to cite: Magni, S., Gratier, J.-P., and Šmuc, A. Š.: The role of Stylolites as Proto-Karsts in Speleogenesis, EGU General Assembly 2026, Vienna, Austria, 3–8 May 2026, EGU26-651, https://doi.org/10.5194/egusphere-egu26-651, 2026.

EGU26-869 | Orals | HS8.1.1

Unraveling Anomalous Thermal Transport in Fracture–Matrix Systems: Interplay Between Advective Transport and Matrix Conduction 

Alessandro Lenci, Yves Méheust, Maria Klepikova, Vittorio Di Federico, and Daniel Tartakovsky
Heat transport in geological fractures is controlled by the heterogeneity of the fracture aperture arising from wall roughness. Spatial variations in aperture, here obtained from self-affine fracture walls, generate pronounced channelization, wall-contact regions, and quasi-stagnant zones where velocities drop sharply. This geometric structure controls transmissivity and governs the localization of velocities.
We investigate how these roughness-induced flow patterns shape thermal dynamics over time. At early times, fast channels inhibit heat uptake. As fluid particles increasingly explore low-velocity pockets, intermediate-time heat exchange accelerates, revealing the buffering role of quasi-stagnant regions. At late times, conduction into the surrounding rock matrix imposes a robust t -1/2 scaling of the fracture-to-matrix heat flux, consistent with semi-infinite diffusion.
To quantify these mechanisms, we employ a stochastic Time-Domain Random Walk (TDRW) framework in which fracture–matrix heat exchange is represented through a Lévy–Smirnov residence-time kernel, providing a physically based description of non-local conduction. We analyse the temporal evolution of thermal breakthrough-curve (BTC) moments, demonstrating how roughness-controlled residence-time distributions regulate heat-exchange efficiency.
By combining TDRW simulations with high-resolution aperture fields and finite-element benchmarks, we characterize the interplay between aperture heterogeneity, velocity localization, and matrix conduction. The results clarify the physical origin of the observed non-Fickian thermal response and provide guidance for interpreting temperature signals in geothermal systems and thermal tracer tests.

How to cite: Lenci, A., Méheust, Y., Klepikova, M., Di Federico, V., and Tartakovsky, D.: Unraveling Anomalous Thermal Transport in Fracture–Matrix Systems: Interplay Between Advective Transport and Matrix Conduction, EGU General Assembly 2026, Vienna, Austria, 3–8 May 2026, EGU26-869, https://doi.org/10.5194/egusphere-egu26-869, 2026.

Nowadays, the demand for the utilization of geothermal energy is growing worldwide. Several countries have numerous geothermal projects in the preparatory phase, but in many cases, it is difficult to decide which projects should be financed from a limited budget. To aid decision-making, various risk assessments are carried out to rank the projects, defining various technical and geological risk factors. One from risk factors can be the reservoir quality.

In this study, heterogeneity of porous sedimentary reservoirs is examined as a risk factor, since it (1) can significantly affect the amount of extractable water, (2) can have a strong influence on the thermal breakthrough time, (3) and strongly influences the size of the protection zone (PZ) around the geothermal well. Regarding the PZ, the size of the area associated with both the concentration front (SPZ – solute protection zone related to potential pollution) and the thermal front (TPZ – thermal protection zone) was examined separately. Two- and three-dimensional numerical models were built to study the effects of heterogeneity on geothermal well doublet where stochastic permeability distributions generated by sequential Gaussian simulation represent the heterogeneous reservoir. Detailed comparative simulations were used to reveal how (1) the scale of heterogeneity and (2) the permeability anisotropy influence the size of the PZ and the thermal performance of geothermal well doublet at different well distances and yields.

The results reveal how the required PZ increases with the scale of heterogeneity and provide probabilities for the size of PZ at different times for each heterogeneity scale. On a short time scale (<1 yr), there is no significant difference between the sizes of the SPZ and TPZ, and compared to the homogeneous approach, there is an increase of up to 50–75%. This decreases after 50 yr to 20% in the case of SPZ, while the thermal conduction smears the effects of heterogeneity for the TPZ size. The research also provides the probability of heat power achievable for each heterogeneity scale. Therefore, the research facilitates the more accurate risk assessment, i.e., based on the information about reservoir heterogeneity, it yields an estimate of the recoverable heat power and PZ size by calculating probabilities. Finally, the research applies the findings of synthetic simulations to a real geothermal project in Hungary, where the PZ probability map for geothermal well doublet was completed and the risk of heterogeneity was evaluated on the thermal performance.

Project no. KT-2023-900-I1-00000975/0000003 has been implemented with the support provided by the Ministry of Culture and Innovation of Hungary from the National Research, Development and Innovation Fund, financed under the KDP-2023 funding scheme.

How to cite: Molnár, B., Garaguly, I., and Galsa, A.: Numerical investigation of reservoir heterogeneity as a risk factor on the size of the protection zone and on the thermal performance of geothermal well doublet, EGU General Assembly 2026, Vienna, Austria, 3–8 May 2026, EGU26-1202, https://doi.org/10.5194/egusphere-egu26-1202, 2026.

EGU26-1801 | ECS | Orals | HS8.1.1

Dispersion on laminar and turbulent network flow 

Tobias Grundhöfer, Marco Dentz, and Jannes Kordilla

Karst aquifers are highly dynamic and heterogeneous systems, where solutes can be transported rapidly through conduit networks while parts of the contaminant mass temporarily reside in immobile zones, resulting in complex transport behavior and prolonged tailing in breakthrough curves. Accurately predicting solute dispersion in these systems remains challenging due to their multiscale structure and highly variable flow dynamics. To investigate these processes, flow in synthetic karst networks and in the real conduit system of the Seefeldhöhle (Switzerland) is simulated using a graph-based Laplacian solver capable of capturing both laminar and turbulent conditions. Solute transport is modeled using a Time-Domain Random Walk (TDRW) particle tracking approach. Particular attention is given to the role of mixing at conduit intersections, where both complete-mixing and streamline-routing rules are implemented to assess their influence on longitudinal and transverse dispersion. Transport behavior is characterized through first passage time distributions, particle visitation maps, and spatial moments. To further analyze the structure of particle velocities along trajectories, Lagrangian speed series are derived and their dependence structure is quantified using speed copulas. This analysis reveals distinct forms of correlation and intermittency that govern spreading, breakthrough tailing, and the sensitivity to network heterogeneity. While specific mixing processes at intersections affect local dispersion patterns, bulk metrics such as breakthrough curves and spatial moments remain comparatively insensitive. Building on these findings, the framework will be extended toward a multiscale upscaling approach based on a Continuous-Time Random Walk (CTRW), aiming to link conduit-scale velocity statistics with emergent network-scale transport dynamics.

How to cite: Grundhöfer, T., Dentz, M., and Kordilla, J.: Dispersion on laminar and turbulent network flow, EGU General Assembly 2026, Vienna, Austria, 3–8 May 2026, EGU26-1801, https://doi.org/10.5194/egusphere-egu26-1801, 2026.

EGU26-1936 | ECS | Orals | HS8.1.1

Structural Controls on Solute Diffusion in Porous Media 

Tingchang Yin and Brian Berkowitz

Diffusion in natural porous media, e.g., in soils, rocks and geological formations, is a widely observed phenomenon and is critical to many subsurface applications, such as deep nuclear waste disposal and contaminated aquifer remediation. In much of the existing literature, diffusion is considered to be effectively Fickian. However, recent experimental studies have shown that diffusion can exhibit non-Fickian behavior. To explain this behavior, and in the spirit of percolation theory, we hypothesize that non-Fickian diffusion arises from the low-connectivity nature of pore networks, even when percolating channels exist. Based on a systematic study involving a large number of particle tracking simulations in two- and three-dimensional domains, with low and high connectivity, we demonstrate that non-Fickian diffusion appears in domains nearer the percolation threshold, while it approaches Fickian behavior in high-connectivity domains. Low-connectivity domains contain primary diffusive channels as well as dead ends and even isolated pore clusters that can trap diffusive plumes over extremely long times. This leads to diffusion occurring with power-law transition time behavior. This study highlights the limitations of using purely Fickian models to characterize diffusion behavior in geological settings, as structural features such as pore network connectivity can have a significant influence.

How to cite: Yin, T. and Berkowitz, B.: Structural Controls on Solute Diffusion in Porous Media, EGU General Assembly 2026, Vienna, Austria, 3–8 May 2026, EGU26-1936, https://doi.org/10.5194/egusphere-egu26-1936, 2026.

EGU26-2985 | ECS | Posters on site | HS8.1.1

Anisotropy in Fractured and Porous Media: A Simulation Approach 

Rayaan Biswas, Brutideepan Sahoo, Ankur Roy, and Subhasish Tripathy

Subsurface heterogeneity and directional variance in the connectivity of permeable zones influences the movement of fluids which in turn, leads to anisotropy in permeability and flow. Our study investigates this anisotropy in both fractured and porous media by employing a set of synthetic fractal-fracture networks and multifractal models respectively, along with natural datasets. The latter include a high-resolution soil thin-section and a set of outcrop-based fracture maps that are evaluated using a “dynamic” approach. This is achieved by the means of simulating flow using TRACE3D, PFLOTRAN and Processing Modflow. TRACE3D, a streamline simulator, used by reservoir engineers, is employed for generating recovery curves assuming that each flow model is saturated with oil which is “recovered” by injecting water from a series of wells. It essentially serves as an indicator of connectivity, a time-varying “response curve” in our case, a practice not uncommon in the literature where multiple realizations of a pattern are compared using some kind of a “response”.  In order to assess flow in x-direction a series of injection and production wells are placed along the boundaries parallel to the y-axis, with no-flow boundaries along the x-axis. The setup is then rotated 90 degrees to evaluate flow in the y-direction. For evaluating anisotropy in terms of equivalent permeability along x and y-directions, PFLOTRAN and Processing Modflow are used. PFLOTRAN is a high-performance, massively parallel simulator designed for modelling fluid flow and reactive transport in geologic porous media. Processing Modflow, on the other hand, implements Darcy’s law and mass conservation equations to simulate groundwater flow in aquifers. The flow setup used in PFLOTRAN and Processing Modflow is similar to the one used in case of TRACE3D, except that, instead of injection and production wells, PFLOTRAN applies pressure heads and Modflow applies hydraulic heads along the boundaries parallel to the y-axis that facilitate flow along the x-direction. This study adopts a “dynamic” approach for delineating subsurface anisotropy in terms of connectivity, permeability and flow in multifractal porous media and fractal-fracture networks.

How to cite: Biswas, R., Sahoo, B., Roy, A., and Tripathy, S.: Anisotropy in Fractured and Porous Media: A Simulation Approach, EGU General Assembly 2026, Vienna, Austria, 3–8 May 2026, EGU26-2985, https://doi.org/10.5194/egusphere-egu26-2985, 2026.

EGU26-4188 | ECS | Orals | HS8.1.1

Comparison of numerical approaches for groundwater flow modelling within mining environment 

Roberto Tonucci, Monica Ghirotti, Fabio Canova, Stefano Castellani, Giuseppe Giaramida, Guido Bonfedi, and Leonardo Piccinini

In groundwater flow modelling within mining environments, three main numerical approaches are commonly used: i) the Equivalent Porous Media (EPM), according to which the rock mass and its discontinuities are represented as a continuum; ii) the Discrete Fracture Network (DFN), where hydraulic properties are assigned to natural and/or anthropic discontinuities; iii) the hybrid approach, a combination of the above. To evaluate the advantages and limitations of each method, a selected mine located in the Metalliferous Hills (Colline Metallifere; GR), Tuscany Region, Italy, was selected as a case study. The mine is part of a five-unit complex, joined by a level at −200 m asl, that was active for pyrite extraction until 1981. It was selected due to the availability of hydrogeological and operational data covering a time span of almost 100 years, from around 1920 to 2024. Currently, two 3d transient numerical models have been developed with FEFLOW 10, following the hybrid and EPM approaches. In the former, 1-D anthropic discontinuities (tunnels, shafts, and wells) and 2-D natural discontinuities (major faults) have been represented as discrete features, while in the latter they are implemented as boundary conditions and zones with specific hydrogeological properties, respectively. Hence, the main difference between the two modelling approaches is the representation of geological and anthropic elements. Both models have been successfully used to simulate three managed flooding events that occurred in the period 1997-2014, during which groundwater levels in the mine were raised from −140 m asl to the current −95 m asl by controlling pumping rates of the dewatering system wells active 24/7. At this stage of the research project, the main objective is to evaluate which model better fits observations during managed flooding events. The best fitting model will be used to run predictive simulations of the planned dewatering systems shutdown, which will raise groundwater levels from the current −95 m asl to 70 m asl, where a drainage tunnel is located. In the next stage of the research project, both models will be compared with a DFN model, to evaluate which approach is the most representative of the hydrogeological conditions of the study area and suitable for applications of similar case studies.

How to cite: Tonucci, R., Ghirotti, M., Canova, F., Castellani, S., Giaramida, G., Bonfedi, G., and Piccinini, L.: Comparison of numerical approaches for groundwater flow modelling within mining environment, EGU General Assembly 2026, Vienna, Austria, 3–8 May 2026, EGU26-4188, https://doi.org/10.5194/egusphere-egu26-4188, 2026.

Fractured porous media and karst systems are two heavily studied families of geological formations. Both types of systems tend to display highly heterogeneous hydrogeological properties over a wide range of pore-to-field length scales, and they both typically display irregular or non-uniform flow and transport behaviors in both space and time. While these features suggest commonalities in the mechanisms that control flow and transport dynamics, several key features distinguish these two systems and demand different perspectives on assessment and quantification. More specifically, for example, quantifying “just” the volumetric water fluxes in fractured systems – for which the host rock permeability can vary over orders of magnitude, e.g., considering sandstone to carbonate to granitic formations – first faces the obstacle of obtaining a realistic, site-specific delineation of the (3D) fracture geometry. In addition to this difficulty, karst systems can contain large cave-like features (which are not “fractures”) that strongly influence flow and even induce turbulent flow; and at the catchment scale, a critical problem is to assess total system response subject to time-dependent input (precipitation, flooding) conditions and/or output (pumping) conditions. Assessment of chemical and radionuclide transport in both fractured and karst systems, and then chemical reactions and interactions such as precipitation and dissolution, requires even more complex considerations and increased degrees of uncertainty and variability over pore-to-field spatial and temporal scales. Addressing relevant questions requires field measurements, laboratory experiments, and appropriate model formulation. Significantly, data acquisition at field scales is highly restricted and extensive field studies conducted already three to four decades ago in fractured formations – notably at Aspö and Stripa (Sweden), Yucca Mountain (USA), and Chalk River (Canada) – illustrated the severe limitations to detailed characterization, which lead to serious limitations in realistic mimicking and prediction of flow and transport behaviors. Moreover, while laboratory studies provide important insights at pore, column (generally 1D) and flow cell (generally 2D) scales, they are limited in terms of spatial and temporal scales, and realistic representation of fracture network and karst complexities. In terms of model conceptualization and development, the question of how to model flow, transport, and reactive chemical transport should thus be based, first and foremost, on the specific phenomenon or problem of interest (e.g., flow, transport, chemical reactions, local dynamics or overall system behavior, spatial and temporal scale). This then directs conceptualization and the choice of a model that focuses, principally, either on “exact” dynamics or on phenomenological or overall ”functional” dynamics. We will address both similarities and differences in fractured porous media and karst systems, suggesting methods of characterization and quantification that can be common to both, and other methods that are tailored to address the distinct features and real hydrogeological relevance between these systems. 

How to cite: Berkowitz, B.: Fractured Porous Media and Karst Systems – Shared and Distinguishing Features in Conceptualization and Assessment of Flow and Transport Processes, EGU General Assembly 2026, Vienna, Austria, 3–8 May 2026, EGU26-4236, https://doi.org/10.5194/egusphere-egu26-4236, 2026.

EGU26-6992 | ECS | Posters on site | HS8.1.1

Roughness effects on flow in karst conduits 

Ismail El Mellas, Juan José Hidalgo González, and Marco Dentz

Karst aquifers are formed by intricate conduit networks where variations in geometry significantly influence groundwater flow and transport. At the conduit scale, pronounced wall roughness (k/D∼10 -1), variable cross-sections, and tortuous centrelines challenge classical hydraulic descriptions based on smooth or idealised pipes.

In this work, we investigate flow dynamics in real karst conduits using numerical simulations over a wide range of Reynolds numbers (Re=1-104). The objectives are to quantify key geometrical and hydraulic descriptors, including effective cross-sectional areas, conduit centrelines, velocity distributions, and friction factors. Roughness characterisation is performed through spectral analysis of the conduit walls using Fourier-based techniques.

The conduit geometries are directly obtained from high-resolution scans of natural karst formations and retain their full geometric complexity. Flow simulations are carried out without geometric simplification, allowing wall-induced disturbances and roughness effects to be fully resolved.

The results highlight strong deviations from classical smooth-conduit behaviour, with geometry-driven heterogeneity significantly affecting velocity fields and friction losses across all flow regimes. These findings show that the dominant contribution to flow dispersion arises from large-scale roughness, allowing simplified conduit representations that preserve these features to yield hydraulic predictions comparable to those obtained in fully resolved geometries.

How to cite: El Mellas, I., Hidalgo González, J. J., and Dentz, M.: Roughness effects on flow in karst conduits, EGU General Assembly 2026, Vienna, Austria, 3–8 May 2026, EGU26-6992, https://doi.org/10.5194/egusphere-egu26-6992, 2026.

EGU26-7053 | ECS | Orals | HS8.1.1

Multi-scale evaluation of high-permeability hydrothermal conduits in crystalline rocks (Karlovy Vary Spa, Czech Republic)  

David-Aaron Landa, Jiří Bruthans, Tomáš Vylita, and Jakub Mareš

Quantitative assessment of long-distance hydrothermal groundwater flow in crystalline rock is challenging, primarily due to low matrix permeability and extreme heterogeneity. However, sites exist worldwide where deep groundwater circulation occurs over long distances within crystalline rocks. For instance, the Idaho Batholith (USA) hosts dozens of hot springs within granitic formations, featuring discharges in the tens of L/s and recharge areas of at least 5 000 km². Moreover, such flow can be remarkably rapid, as observed in Karlovy Vary (Carlsbad) in the Czech Republic. The main spring, known as the Vřídlo hot spring, has a temperature of 73 °C and a discharge of 30 L/s. Considering the local terrestrial heat flow, a recharge area of at least hundreds of km² is required to heat the Vřídlo spring, assuming a circulation depth of ≈ 2.5 km.
This study evaluates over a century of research on the Vřídlo hot spring and addresses the question of why water is channelized from hundreds of square kilometers into a single discharge point. Radiometric dating of spring travertine accumulations reveals that the Vřídlo hot spring has been active for at least 230 000 years. Stable isotope analysis confirms the thermal water is of meteoric origin, having infiltrated after the last Ice age. Evidence of high-permeability fractures with large apertures exists both directly within Karlovy Vary and in the broader region. Extensive drilling campaigns have identified fracture apertures on the order of tens of centimeters, with these zones characterized by flow rates of up to 30 L/s. Tracer tests revealed high anisotropy in flow velocities both within the Vřídlo discharge conduit and in the surrounding granite massif, demonstrating the presence of relatively voluminous conduits. Notably, a well-logging probe inadvertently descended through the bottom of a 133 m deep borehole into the conduit feeding the Vřídlo hot spring, reaching a final depth of 370 m in the granite.
Highly permeable flow paths extend at least tens of km from Vřídlo within the granite. Hydraulic tests conducted 15 km from Karlovy Vary established a direct hydraulic connection with the Vřídlo hot spring. This repeatedly verified relationship manifests as a decrease in the Vřídlo discharge following increased abstraction at the distant site, with a time lag of approximately three months. Without elucidating the origin of highly permeable conduits in granite and understanding the effect of hot groundwater flow on porosity and permeability changes, the implementation of deep geological repositories (DGRs) for radioactive waste cannot be considered safe. This is particularly critical given that a considerable proportion of such facilities are planned within granitic formations.
Funded by the GAUK No. 356525: Character of the feeding vents of thermal springs.  

How to cite: Landa, D.-A., Bruthans, J., Vylita, T., and Mareš, J.: Multi-scale evaluation of high-permeability hydrothermal conduits in crystalline rocks (Karlovy Vary Spa, Czech Republic) , EGU General Assembly 2026, Vienna, Austria, 3–8 May 2026, EGU26-7053, https://doi.org/10.5194/egusphere-egu26-7053, 2026.

EGU26-9085 | ECS | Posters on site | HS8.1.1

Rethinking Tracer Interpretation in Alpine Karst: Comparing Physically Plausible Models for Comprehensive Transport Assessment 

Simon Seelig, Magdalena Seelig, Nadine Goeppert, and Gerfried Winkler

Tracer tests in alpine karst aquifers often produce characteristic breakthrough curves, but turning them into reliable transport information remains difficult. Multiple peaks, strong asymmetry, and persistent tailing challenge many routinely applied models. We present a long-term tracer dataset from a karst spring in the Eisenerz Alps (Austria), comprising 15 tracer experiments conducted with the same setup over more than a decade. This exceptional consistency allows us to evaluate tracer transport across a wide range of hydrologic conditions and to systematically test how different modeling concepts respond to changing flow states. We examine the performance of commonly used approaches, from classical moment-based analyses and advection–dispersion models to mobile–immobile and multi-dispersion formulations. While more complex models offer greater flexibility, they also introduce issues of non-uniqueness, overfitting, and limited physical interpretability—especially when attempting to reproduce both peak structure and long-term tailing. Instead of favoring model simplicity or complexity, we focus on aligning model structure with the information content of the tracer data. Tracer transport is interpreted within a physically informed conceptual framework that integrates modeling results with independent evidence from local geology, hydrogeology, and speleological observations. This combination allows transport models to be constrained by system-specific knowledge, providing a more defensible basis for interpreting breakthrough curves across contrasting hydrologic conditions. By combining long-term tracer observations with physically constrained modeling and explicit uncertainty considerations, this contribution outlines a robust framework for interpreting alpine karst tracer tests—an essential step toward conservative assessments of contaminant persistence and risk at alpine karst springs.

How to cite: Seelig, S., Seelig, M., Goeppert, N., and Winkler, G.: Rethinking Tracer Interpretation in Alpine Karst: Comparing Physically Plausible Models for Comprehensive Transport Assessment, EGU General Assembly 2026, Vienna, Austria, 3–8 May 2026, EGU26-9085, https://doi.org/10.5194/egusphere-egu26-9085, 2026.

EGU26-10893 | Posters on site | HS8.1.1

Topothermohaline convection – from synthetic simulations to reveal processes in the thick geothermal system of the Buda Thermal Karst, Hungary 

Attila Galsa, Márk Szijártó, Ádám Tóth, and Judit Mádl-Szőnyi

In real carbonate geothermal systems, the groundwater flow can be influenced by both forced convection driven by the water table topography, as well as free thermal and haline convection induced by buoyancy forces (topothermohaline convection). The interaction of different driving forces has an impact on reservoir parameters such as water temperature and salt content, the most accurate knowledge of which is extremely important for the planning, implementation, and operation of successful geothermal projects. In this study, (1) we performed a series of 2D synthetic simulations to quantify the role of each driving force in the topothermohaline convection system, and (2) we applied the model to the Buda Thermal Karst (BTK) system as a demonstration area (Galsa et al. 2025).

During the synthetic model study, the effect of the water table gradient, the bottom heat flux, and the bottom salt concentration were examined on the dynamics of the coupled system using control parameters. We found in the base model that the recharge area is controlled by cold, fresh, and young infiltrated waters driven by water table topography, while a thermohaline dome characterized by warm, saline, and old waters forms beneath the discharge area. By increasing the water table gradient, topography-driven forced convection becomes dominant, so that intense regional groundwater flow sweeps warm, saline and old water out of the model, leading to a purely advective, stationary solution. By increasing the bottom heat flux, thermal convection becomes prevailing, and thus, paradoxically, intense thermal convection effectively cools the model. By enhancing the salt concentration, the density of the water increases, and a multi-layered thermohaline dome forms beneath the discharge zone with extremely high temperature, salt content, and water age.

This methodology was applied along a 2D section crossing the Buda Thermal Karst system to examine the evolution of the geothermal reservoir. After 10 kyr, precipitation saturated the western, unconfined karst by cold, young and fresh water, while in the eastern, confined part of the deep reservoir, thermohaline convection dominated the groundwater flow. The boundary separating the two regions shifted slowly but steadily to the east, so after 1 Myr, the zone with high-temperature (>200 °C), old (>100 kyr) brackish water retreated to the eastern, deeper (>2–3 km) part of the BTK. Overall, the thermally and chemically mixed water moves westward directly beneath the clayey Oligocene aquitard, can promote karstification and reach the surface in the vicinity of the Danube River, the main discharge zone of the area, producing both cold and lukewarm springs.

By taking into account the interaction of various forces driving groundwater flow, we can obtain a more accurate picture of the temperature, salinity, and water age distribution of the reservoir, which facilitates the precise design and efficient and sustainable operation of deep geothermal systems, minimizing the vulnerability of water resources.


References

Galsa, A., M. Szijártó, Á. Tóth, J. Mádl-Szőnyi, Topothermohaline convection – from synthetic simulations to reveal processes in a thick geothermal system, Hydrology and Earth System Sciences, 29/17, 4281–4305, 2025.

How to cite: Galsa, A., Szijártó, M., Tóth, Á., and Mádl-Szőnyi, J.: Topothermohaline convection – from synthetic simulations to reveal processes in the thick geothermal system of the Buda Thermal Karst, Hungary, EGU General Assembly 2026, Vienna, Austria, 3–8 May 2026, EGU26-10893, https://doi.org/10.5194/egusphere-egu26-10893, 2026.

EGU26-11205 | Posters on site | HS8.1.1

openKARST: From detailed karst conduit dynamics to simplified hydraulic flow dynamics 

Jannes Kordilla, Marco Dentz, and Juan Hidalgo

In this work we employ openKARST, which has been developed to simulate free-surface and pressurized dynamics in large conduit networks. The solver is designed to model transient flood waves as well as steady flow states under mixed flow conditions. Turbulence is represented via Darcy–Weisbach friction, with support for classical correlation function as Churchill and Colebrook-White. A particle-tracking and advection-diffusion module allows to model tracer transport and travel-time analyses. Verification and validation against analytical benchmarks and applications to large cave networks, such as the Ox Bel Ha system, demonstrates the numerical robustness. In this work we introduce a steady-state analysis workflow that condenses complex network solutions into simpler hydraulic metrics. Using conduit-specific Reynolds numbers and friction factors based on high fidelity simulations, we quantify how effective resistance evolves from partial filling to pressurized conditions with discharge, viscosity and diameter along karst conduits. To recover the observed trends without running full simulations, we propose a simple steady-state approximation in which the longitudinal water surface is represented by a generalized water depth profile, where cross-sectional hydraulics follow circular partial-filling geometry. This reduced model enables to compute conduit-averaged Reynolds numbers and friction factors and further provides conduit profiles that can be compared directly to simulated distributions, including regimes influenced by pressurization. Hence, this work offers a practical bridge between complex network hydraulics and compact predictive relationships to enable systematic exploration of parameter space and upscaling.

How to cite: Kordilla, J., Dentz, M., and Hidalgo, J.: openKARST: From detailed karst conduit dynamics to simplified hydraulic flow dynamics, EGU General Assembly 2026, Vienna, Austria, 3–8 May 2026, EGU26-11205, https://doi.org/10.5194/egusphere-egu26-11205, 2026.

EGU26-11938 | ECS | Orals | HS8.1.1

Linking flow cytometry signatures with flow and transport behaviour in karst aquifer systems 

Luka Vucinic, David O'Connell, Catherine Coxon, and Laurence Gill

Karst aquifers commonly exhibit non-linear responses to rainfall and recharge due to the activation of preferential flowpaths and time-variable exchange between conduit, epikarst, and fractured matrix domains. Discharge, electrical conductivity, and turbidity are widely used to gain insight into these processes and to inform conceptual and numerical models; however, they often do not provide comprehensive information on internal connectivity and the mobilisation of stored water during transient recharge events. This contribution explores the use of flow cytometry (FCM) as a complementary observational approach for characterising karst aquifer system behaviours.

FCM has previously been applied in karst hydrogeology for purposes such as microbial contamination fingerprinting (Vucinic et al., 2022; 2023) and the detection of injected artificial microbial tracers such as yeast (Vucinic et al., 2024). These measurements can be interpreted in terms of changes in cell concentration, forward and side light-scatter distributions (used here as proxies for relative particle size and structural heterogeneity), and physiological state. Taken together, FCM observations can provide useful information on transport conditions and mixing processes within the aquifer, rather than solely reflecting water quality or pollution impacts. Hence, we argue that FCM signals can be used as indicators of hydrodynamic behaviour and relative mobilisation from fast and slower flow domains, capturing changes associated with rapid recharge, threshold behaviour, and recession-driven storage mobilisation.

The potential influence of microbial and chemical pollution on FCM signals is considered within this framework. While water quality conditions may affect baseline cytometric characteristics, event-driven deviations and response timing should remain informative for hydrological/hydrogeological interpretation. Emphasis is, therefore, placed on relative changes and event-phase behaviour rather than on absolute cytometric values.

The approach has implications for karst modelling, where FCM may provide additional constraints on connectivity changes, conduit–matrix exchange, and storage release during recharge events. When used in combination with standard hydrological/hydrogeological observations and measurements, FCM data may help refine conceptual understanding and support the parameterisation and evaluation of models describing transient karst aquifer system dynamics.


REFERENCES

Vucinic, L., O’Connell, D., Teixeira, R., Coxon, C., Gill, L. (2022). Flow cytometry and fecal indicator bacteria analyses for fingerprinting microbial pollution in karst aquifer systems. Water Resources Research, vol. 58, no. 5, e2021WR029840. https://doi.org/10.1029/2021WR029840

Vucinic, L., O'Connell, D., Dubber, D., Coxon, C., Gill, L. (2023). Multiple fluorescence approaches to identify rapid changes in microbial indicators at karst springs. Journal of Contaminant Hydrology, vol. 254, 104129. https://doi.org/10.1016/j.jconhyd.2022.104129

Vucinic, L., O’Connell, D., Coxon, C., Gill, L. (2024). Back to the future: comparing yeast as an outmoded artificial tracer for simulating microbial transport in karst aquifer systems to more modern approaches. Environmental Pollution, vol. 349, 123942. https://doi.org/10.1016/j.envpol.2024.123942 

How to cite: Vucinic, L., O'Connell, D., Coxon, C., and Gill, L.: Linking flow cytometry signatures with flow and transport behaviour in karst aquifer systems, EGU General Assembly 2026, Vienna, Austria, 3–8 May 2026, EGU26-11938, https://doi.org/10.5194/egusphere-egu26-11938, 2026.

EGU26-12570 | Posters on site | HS8.1.1

Karst network geometry and groundwater flow in the Aup du Seuil catchment (Chartreuse, France) 

Domitille Dufour, Philippe Renard, Jannes Kordilla, and Julien Straubhaar

Groundwater flow in karstic aquifers is highly dependent on the geometry of the conduit network. Not integrating the geometry explicitly leads to inaccurate predictions of the aquifer's behavior under both high and low flow conditions.

At the same time, discharge time series at the spring contain information about the internal network organization. Hence, we study how hydrological properties can be related to the statistical metrics developed to characterize network geometry and topology.

One possible way to answer this question is to compare the results of flow simulations in an ensemble of karst networks. We propose using pyKasso, a pseudo-genetic karst network simulator, to obtain a large number of karst networks constrained by the same geological and hydrological settings. We then run flow simulations with openKARST, a flow simulator that handles turbulent and laminar flow in complex karst networks.

Here we present the first results of this comparison exercise on a catchment in the Chartreuse Mountains (France). The Aup du Seuil catchment (~10 km2) was chosen due to its 17-year record of discharge measures at the outlet, and the 25 kilometers of conduits explored and mapped by speleologists. In addition, its geology is relatively simple.

How to cite: Dufour, D., Renard, P., Kordilla, J., and Straubhaar, J.: Karst network geometry and groundwater flow in the Aup du Seuil catchment (Chartreuse, France), EGU General Assembly 2026, Vienna, Austria, 3–8 May 2026, EGU26-12570, https://doi.org/10.5194/egusphere-egu26-12570, 2026.

EGU26-14150 | ECS | Orals | HS8.1.1

Influence of Fracture Orientation and Stress Fields on Hydraulic Conductivity Under Strong Topographic Relief 

Ronny Figueroa, Landon Halloran, Benoît Valley, Philippe Davy, Romain Le Goc, Caroline Darcel, and Clement Roques

Fractured crystalline rocks form highly heterogeneous subsurface systems in which fluid flow is controlled by the connectivity and aperture of fracture networks. These hydraulic properties are controlled by in-situ stress fields, which, in the shallow crust, results from the combined effects of regional tectonic stress, gravitational forces, and topographic relief. Although stress-dependent fracture behavior has been extensively studied at the fracture scale, the role of spatially variable stress tensors in controlling hydraulic conductivity at the catchment scale remains poorly constrained.

In this study, we investigate how topography and tectonic stresses interact with fracture network geometry to produce heterogeneity and anisotropy in hydraulic conductivity across a high mountain catchment. A three-dimensional geomechanical model is used to compute spatially variable stress tensors for both synthetic and real topographic surfaces. The resulting stress tensors are extracted cell by cell and applied to discrete fracture networks with different orientation statistics. Subsequently, for each fracture within every cell, the normal stress is calculated and used to determine stress-dependent hydraulic apertures through an exponential closure law. This is followed by the computation of fracture transmissivities using the parallel-plate cubic law. Finally, directional hydraulic conductivities are then obtained by numerical flow simulations in the principal directions (Kx, Ky, Kz).

The results show strong spatial heterogeneity and directional dependence of hydraulic conductivity across the catchment. At first order, the anisotropy of Kx, Ky and Kz is controlled by fracture network geometry, with low conductivities occurring in directions poorly aligned with dominant fracture orientations (e.g., low Kx for predominantly N–S–oriented vertical fractures or low Kz for horizontal fracture sets). Together with this geometric control, the relative orientation between fractures and the local stress tensor exerts a strong mechanical influence, fractures oriented perpendicular to the principal compressive stress experience increased normal stress, reduced aperture, and consequently lower hydraulic conductivity. In addition, spatial variations in topography introduce local perturbations in the stress tensor that produce zones of relatively higher hydraulic conductivity, where fractures remain less compressed. These combined effects lead to pronounced hydraulic anisotropy and preferential pathways at the catchment scale, highlighting the importance of explicitly accounting for spatially variable stress fields when modeling flow in fractured catchments.

How to cite: Figueroa, R., Halloran, L., Valley, B., Davy, P., Le Goc, R., Darcel, C., and Roques, C.: Influence of Fracture Orientation and Stress Fields on Hydraulic Conductivity Under Strong Topographic Relief, EGU General Assembly 2026, Vienna, Austria, 3–8 May 2026, EGU26-14150, https://doi.org/10.5194/egusphere-egu26-14150, 2026.

EGU26-16875 | ECS | Posters on site | HS8.1.1

Towards a Virtual Laboratory for Karst Groundwater Modelling 

Max G. Rudolph, Thomas Reimann, Navneet Sinha, Philippe Renard, and Andreas Hartmann

Groundwater modelling serves as an important tool for the study and management of karst water resources. In such context, and especially when we try to obtain karst system understanding through groundwater models, it is not only important to get the right answers (e.g., a well-fitted spring discharge simulation), but we have to get those answers for the right reasons (i.e., because our model realistically reflects the underlying system). This problem has been addressed before, e.g., via model evaluation upon multiple system signatures such as spring discharge and solute concentrations. However, because the conduit network and the geological structure of karst systems is usually largely unknown, lumped models are often employed, which simplify the karst system and simulate the processes in a spatially aggregated manner. Due to those simplifications, assessing model (structural and process related) realism beyond a model’s ability to simulate system output signals is often impossible. Yet, using models to better understand karst system functioning is vital for sustainable karst water resources management. This discrepancy necessitates the study of karst systems and corresponding (lumped or spatially aggregated) models on the basis of systems that are fully known. For this purpose, we develop a virtual laboratory for karst groundwater modelling. This virtual laboratory facilitates the generation and simulation of synthetic karst systems and system signatures such as spring discharge using state-of-the-art spatially distributed numerical modelling. The virtual laboratory makes the generation of synthetic systems more accessible to a wider hydro(geo)logical community, taking a step towards more realistic process representation in (lumped) karst models in the future. Building on our previous work, this combination allows for the stochastic generation of conduit networks using pyKasso [1] and their subsequent embedding and simulation with the spatially distributed discrete-continuum model MODFLOW CFPv2 [2] via the CFPy package for the Python programming language [3]. We demonstrate the capabilities of the virtual laboratory for a number of cases, show upcoming development goals, and discuss opportunities for future applications.


[1] Miville, F., Renard, P., Fandel, C., & Filipponi, M. (2025). pyKasso: An open-source three-dimensional discrete karst network generator. Environmental Modelling & Software, 186, 106362.

[2] Reimann, T., Giese, M., Geyer, T., Liedl, R., Maréchal, J. C., & Shoemaker, W. B. (2014). Representation of water abstraction from a karst conduit with numerical discrete-continuum models. Hydrology and Earth System Sciences, 18(1), 227-241.

[3] Reimann, T., Rudolph, M. G., Grabow, L., & Noffz, T. (2023). CFPy—A python package for pre‐and postprocessing of the conduit flow process of MODFLOW. Groundwater, 61(6), 887-894.

How to cite: Rudolph, M. G., Reimann, T., Sinha, N., Renard, P., and Hartmann, A.: Towards a Virtual Laboratory for Karst Groundwater Modelling, EGU General Assembly 2026, Vienna, Austria, 3–8 May 2026, EGU26-16875, https://doi.org/10.5194/egusphere-egu26-16875, 2026.

EGU26-16916 | Posters on site | HS8.1.1

Hydrogeological coupling of epikarst dynamics and tectonic discontinuities: Impacts on water intrusion at the Holy Monastery of Kleiston, Greece 

Christos Filis, Emmanuel Skourtsos, Emmanuel Vassilakis, Evelina Kotsi, Aliki Konsolaki, and Efthymios Lekkas

The hydrogeological regime and the persistent moisture intrusion phenomena at the Holy Monastery of Kleiston are fundamentally dictated by a complex tectonic framework within the Sub-Pelagonian Unit of Mount Parnitha, NW of Athens, Greece. This study identifies the monastery’s location as a site of intense structural deformation, where the stratigraphic sequence is governed by a series of successive tectonic nappes. The structural architecture is defined by two primary thrust faults: an upper thrust (No 1) that positions carbonate rocks over volcanosedimentary formations, and a lower, sub-parallel thrust (No 2) that repositions the volcanosedimentary sequence atop an underlying lower carbonate series. Central to the water intrusion mechanism is the identification of two low-angle fault surfaces, designated as No 3 and No 4, which act as primary hydraulic discontinuities. Crucially, both of these tectonic surfaces are situated within the mass of the lower carbonate rocks and are oriented sub-parallel to the lower thrust, effectively mirroring its geometry. These intra-lithic discontinuities serve as the primary structural controls for groundwater movement, with the upper surface (No 3) coinciding with the main foundation level and the roof of the Catholicon, while the lower surface (No 4) dictates the base of the local epikarst hydrogeological system.

The interaction between this tectonic fabric and the carbonate lithology has facilitated the development of an extensive epikarst zone, exceeding 10 meters in thickness, characterized by high secondary porosity. This zone is defined by two principal discontinuity systems -striking NNW-SSE and NE-SW- alongside secondary fractures that have undergone significant karstification. The mechanical widening of these joints is further enhanced by the deep penetration of root systems, which extend up to seven meters into the rock mass, creating vertical conduits. Hydrogeologically, the epikarst functions as a perched aquifer, recharged through a combination of direct autogenic precipitation and lateral allogenic contribution from upstream debris and weathered volcanosedimentary mantles.

The manifestation of water and humidity within the monastery's functional spaces is the direct result of epikarst spring fronts emerging at the intersections of these specific tectonic surfaces with the building infrastructure. The upper fault surface (No 3) directs groundwater discharge into the Catholicon and the adjacent storage caverns, a process exacerbated by the thin carbonate cover which offers minimal lag time between precipitation events and intrusion. Simultaneously, the lower fault surface (No 4) facilitates discharge into minor caves and areas beneath the monastery’s retaining walls and communal spaces. This structural control explains the persistence of moisture even during arid periods, as the complex network of tectonic voids and karstified joints within the epikarst serves as a shallow reservoir. Consequently, the study concludes that the water intrusion at the Holy Monastery of Kleiston is a structurally driven phenomenon, where sub-parallel tectonic discontinuities within the lower carbonates serve as the primary conduits for the localized hydrogeodynamic discharge of the epikarst aquifer.

How to cite: Filis, C., Skourtsos, E., Vassilakis, E., Kotsi, E., Konsolaki, A., and Lekkas, E.: Hydrogeological coupling of epikarst dynamics and tectonic discontinuities: Impacts on water intrusion at the Holy Monastery of Kleiston, Greece, EGU General Assembly 2026, Vienna, Austria, 3–8 May 2026, EGU26-16916, https://doi.org/10.5194/egusphere-egu26-16916, 2026.

EGU26-18331 | Posters on site | HS8.1.1

Understanding Spatio-Temporal Variability in Spring Water Hydrogeochemistry of the Chakrata Region, Lesser Himalaya, India 

Anupam Painuly, Santosh Kumar Rai, and Virendra Bahadur Singh

The Chakrata region in the Lesser Himalayas of Uttarakhand, India, is characterized by complex lithology, steep topography, and a strong dependence of local communities on natural springs for domestic and agricultural water supply. This study investigates the hydrogeochemical characteristics, controlling processes, and drinking-water suitability of representative springs across the region. The results suggest that the spring water is fresh, transparent, and odorless in nature. The results suggest that surface water is slightly acidic to highly alkaline in nature (pH: 6.7 to 9.02) and moderately mineralized (TDS: 8 to 252 mg L-1and EC:16 to 503 µS/cm). The temperature of springs water varied from 6.5˚C to 26˚C, which depends on the ambient temperature of the infiltrating water, thermal conductivity of reservoir rocks and groundwater movement along with its residence period.The major ionic composition followed the order Ca²⁺ > Mg²⁺ > Na⁺ > K⁺ and HCO₃⁻ > SO₄²⁻ > Cl⁻ > F⁻, with Ca–HCO₃ and Ca–Mg–HCO₃ as dominant water facies. Various trace elements such as Al, As, Ba, B, Cr, Cu, Li, and Sr found in the spring water samples that contribute to its mineral profile and potential health benefits. Gibbs plot reveals that rock–water interaction, particularly the dissolution of carbonate and silicate minerals, primarily controls the chemistry of spring water. The LULC raster was clipped using WQI zone boundaries, and class-wise area statistics were computed. Zone III (WQI 18–47), is dominated by forest cover (~68.1%) and rangeland (~30.7%), while built-up areas (~0.2%), water bodies (~0.7%), bare land (~0.09%), and agriculture (~0.002%). Similar LULC patterns were observed in Zones I and II. Most samples fall within the permissible limits of BIS (2012) and WHO (2011) standards, indicating good to excellent water quality, although localized chloride enrichment suggest minor anthropogenic influence. The study provides critical baseline data for sustainable spring management and highlights the importance of lithology and recharge dynamics in governing spring water chemistry in the Lesser Himalayan region.

How to cite: Painuly, A., Rai, S. K., and Singh, V. B.: Understanding Spatio-Temporal Variability in Spring Water Hydrogeochemistry of the Chakrata Region, Lesser Himalaya, India, EGU General Assembly 2026, Vienna, Austria, 3–8 May 2026, EGU26-18331, https://doi.org/10.5194/egusphere-egu26-18331, 2026.

EGU26-18554 | Posters on site | HS8.1.1

Karst network simulation with statistical learning 

Philippe Renard, Julien Straubhaar, Dany Lauzon, and Celia Trunz
A key factor controling flow and solute transport in karstic aquifers is the connectivity of karst networks over long distances. However, in many situations the geometry and position of the karst network is unknown and hard to detect with indirect methods such as geophysics. This is the reason why several Discrete Karst Network (DKN) simulation techniques have been developped in the last decade. Some methods are based on statistical principles (subnetworks of percolation clusters for example). Other methods are based on pseudo-genetic principles.

In this presentation, we explore the possibility to learn the structure of karst networks from a large data set of geometries acquired by cavers and simulate new networks using generative statistical learning techniques. So far, the best results are obtained by combining a recurrent neural network that is capable of simulating the topology of the network (adjencency matrix), and a denoising diffusion probability model on graph to generate the spatial position of the nodes. This technique is capable to produce networks having similar patterns and geometry as the ones used in the training phase. The resulting networks can be used as input for the simulation of flow and transport.


How to cite: Renard, P., Straubhaar, J., Lauzon, D., and Trunz, C.: Karst network simulation with statistical learning, EGU General Assembly 2026, Vienna, Austria, 3–8 May 2026, EGU26-18554, https://doi.org/10.5194/egusphere-egu26-18554, 2026.

The interaction between the low-permeability matrix and high-permeability conduits is a governing mechanism in karst hydrogeology, yet it remains difficult to quantify, especially under the disturbance of underground engineering. This study investigates the spatiotemporal evolution of groundwater exchange and the impact of tunnel drainage in a typical karst system in Southwest China. We developed a regional dual-permeability model by integrating GemPy for 3D geological structural modeling and MODFLOW-CFPv2 for hydraulic simulation. The model achieved a high reliability with a Pearson correlation coefficient of 0.98 between simulated and observed heads, outperforming traditional MODFLOW-Drain/River methods in capturing non-Darcy conduit flows.

Simulation results under natural conditions reveal significant spatial heterogeneity: while the matrix-to-conduit recharge dominates the spatial extent (37% of the area), the conduit-to-matrix leakage dominates the total exchange volume (58%). Sensitivity analysis identifies matrix hydraulic conductivity and conduit wall permeability as the most critical factors controlling exchange intensity, whereas rainfall intensity primarily influences local flow directions rather than the overall exchange pattern. Furthermore, the study quantifies the disturbance of tunnel drainage. Tunnel construction caused a maximum groundwater drawdown of 5.44 m and a residual drawdown of 2.00 m during the stable phase. Crucially, drainage activities induced flow reversals (transforming matrix recharge zones into leakage zones) and reduced the regional exchange flux by an average of 2,987 m³/d. These findings clarify the non-linear controls on karst flow exchange and provide a robust scientific basis for groundwater management and geo-hazard mitigation in engineering-disturbed karst aquifers.

How to cite: yang, D. and huang, T.: Quantifying Groundwater Exchange Mechanisms and Tunnel Drainage Impacts in a Regional Karst Aquifer: A Coupled GemPy and MODFLOW-CFPv2 Approach, EGU General Assembly 2026, Vienna, Austria, 3–8 May 2026, EGU26-18855, https://doi.org/10.5194/egusphere-egu26-18855, 2026.

EGU26-20101 | ECS | Posters on site | HS8.1.1

Systematic characterisation of cave conduits geometry from dense 3D point clouds 

Tanguy Racine, Benoît Noetinger, Otfried Cheong, Sergio Cabello, Ismail El Mellas, Julien Straubhaar, and Philippe Renard

Karst landscapes are characterised by dissolution landforms, including cave conduit networks along which meteoric waters flow. Experimental setups and field monitoring reveal that two main geometric parameters, namely hydraulic diameter and relative roughness, control head losses and flow in a karst conduit. In empirical flow models, the first can be roughly estimated from the topometric data of traditional cave surveys, while the second is usually sampled from a range of plausible values to fit the observed hydraulic signals. A higher resolution representation of cave geometry, in the form of a dense 3D point cloud allows 1) for more complex geometric descriptors and their spatial correlations to be computed, and 2) their impact on hydraulic response to flow conditions to be tested.

We collected field data by mapping the cave passages of interest with a high-resolution dynamic laser scanner in various hydrologically active caves of the European Alps. We modelled the cave walls as triangulated meshes using Poisson reconstruction. We subsequently developed and compared various strategies to automatically extract a cave centreline based on these triangulated meshes. First, we approximated the curve skeleton of the cave conduit by contraction of mesh vertices. Second computed a path supported by a voxel set of the cave interior, maximising clearance to the cave walls. Third we implemented an iterative virtual stepper, finding at each step the next optimal direction of travel based on local cave geometry. We finally confronted these purely geometric approaches to build curvilinear objects with two hydraulic paths from numerical experiments.

Travelling along this 1D object, we implemented an algorithm to find optimal section orientations and compute sequential mesh-plane intersections. We computed a suite of 2D shape descriptors on this family of 2D polylines and analysed the spatial correlation of key descriptors designed to summarise passage size, shape and roughness. Using this newly assembled pipeline for dense point cloud geometric description, we highlight the value of generating new morphometric indicators adapted to the complexity of cave datasets to calculate equivalent hydraulic radii, or along passage roughness, both of which can be used to inform cave-network scale models of flow and transport.

How to cite: Racine, T., Noetinger, B., Cheong, O., Cabello, S., El Mellas, I., Straubhaar, J., and Renard, P.: Systematic characterisation of cave conduits geometry from dense 3D point clouds, EGU General Assembly 2026, Vienna, Austria, 3–8 May 2026, EGU26-20101, https://doi.org/10.5194/egusphere-egu26-20101, 2026.

Identifying Structural Controls on Nonlinear Flow and Transport in Network Representations of Heterogeneous and Karst-Like Media Using Interpretable Machine Learning

Understanding how structural heterogeneity and connectivity control flow and transport remains a central challenge in fractured-porous media and karst systems, where strong velocity contrasts, preferential pathways, and non-Fickian transport are commonly observed across scales. Conceptual network representations provide a physically grounded framework to investigate these processes, but isolating the combined effects of geometry, topology, and finite connectivity on flow and transport behavior remains difficult.

In this work, we use pore network models as generic network representations of heterogeneous and karst-like media and combine them with interpretable machine learning to systematically identify the structural characteristics that govern flow and transport responses. Large ensembles of synthetic networks are generated with controlled variations in coordination number, throat size distributions, throat lengths, and connectivity. For each network, single-phase flow and advective-diffusive transport are simulated, and metrics characterizing flow heterogeneity and transport nonlinearity, such as velocity and flow-rate distributions, dispersion coefficients, spatial moments, and breakthrough curve scaling, are extracted.

Interpretable machine learning is used as a diagnostic tool, rather than a surrogate model, to quantify the influence of geometric and topological descriptors on flow localization, preferential channeling, and anomalous transport behavior. Feature importance and sensitivity analyses identify dominant structural controls and interactions, highlighting how connectivity, heterogeneity, and finite network structure shape nonlinear flow and transport. The results provide insight into the mechanisms controlling transport in strongly heterogeneous systems and illustrate how data-driven analysis can support physics-based modeling of fractured and karst environments.

How to cite: Puyguiraud, A., Gouze, P., Hyman, J., and Dentz, M.: Identifying Structural Controls on Nonlinear Flow and Transport in Network Representations of Heterogeneous and Karst-Like Media Using Interpretable Machine Learning, EGU General Assembly 2026, Vienna, Austria, 3–8 May 2026, EGU26-20128, https://doi.org/10.5194/egusphere-egu26-20128, 2026.

EGU26-21153 | ECS | Posters on site | HS8.1.1

Modelling the impact of film flow and adjustable surface tension in reservoir flow management 

Sona Rustamova, Renaud Toussaint, Paula Reis, Marcel Moura, and Knut Jorgen Maloy

Studying fluid flow in porous media is essential for various applications which include hydrocarbon extraction, groundwater management, sequestration or oil and gas extraction. Drainage efficiency influences recovery, storage capacity, and the long-term stability of reservoirs. During primary drainage, invasion of a non-wetting fluid through pore bodies and throats leaves behind trapped and disconnected clusters of wetting fluid leading to higher residual saturation. Recent studies have shown that capillary bridges and corner films can connect such trapped clusters and enable their subsequent drainage.

This work develops a pore-network model that incorporates film flow and adjustable surface tension on a 2D porous matrix generated by Random Sequential Adsorption and analyzed via Delaunay–Voronoi geometry. Pore pressure–volume relations are derived from a Young–Laplace description and combined with Poiseuille-type fluxes. In addition, pressure diffusion is studied on heterogeneous pore networks with fractal-like geometry, to quantify how this type of structure controls the spreading of pressure and dissolved species at the surface.

The objective of this study is to investigate how such film flows enhance connectivity and reduce residual saturation during drainage. Additionally, the transport of dissolved species that modify wetting properties and surface tension will be modeled, exploring their impact on flow efficiency. By combining numerical simulations with theoretical analysis, our work aims to quantify the impact of surface-chemical interactions on macroscopic flow behavior, providing new insights into optimizing fluid displacement and improving efficiency in subsurface processes.

How to cite: Rustamova, S., Toussaint, R., Reis, P., Moura, M., and Maloy, K. J.: Modelling the impact of film flow and adjustable surface tension in reservoir flow management, EGU General Assembly 2026, Vienna, Austria, 3–8 May 2026, EGU26-21153, https://doi.org/10.5194/egusphere-egu26-21153, 2026.

Continental alkaline lacustrine shale oil reservoirs are typically characterized by extensive fracture networks infilled with alkaline minerals, such as trona and nahcolite. These mineral veins play a crucial role in hydrocarbon storage and migration. However, the diagenetic evolution of these minerals during thermal maturation and their impacts on reservoir storage capacity remain inadequately understood. In this study, thermal simulation (pyrolysis) coupled with integrated mineralogical characterization techniques (including XRD, SEM, TG-DSC, XPS, and FTIR spectroscopy) was systematically employed to investigate the phase transformation and pore structure evolution of alkaline fracture-fillings. Results indicate that a unique synergistic thermal instability exists within the trona-nahcolite assemblage. Specifically, the in-situ dehydration of trona releases structural water, which creates a localized hydrothermal environment and significantly facilitates the decomposition of coexisting nahcolite. Concurrent with these transformations, a substantial solid volume reduction (~38%) is induced. Consequently, the initially dense mineral veins are converted into porous frameworks, leading to a significant expansion of pore space. Thus, we propose that this thermally driven mineral conversion serves as a key diagenetic mechanism for secondary porosity generation. It is concluded that this phenomenon significantly contributes to the formation of effective reservoirs in deep alkaline lacustrine basins, thereby providing novel insights for the evaluation of continental shale oil resources.

How to cite: yang, J. and cheng, F.: Thermally Induced Diagenesis and Pore Space Evolution of Trona-Nahcolite Aggregates in Continental Alkaline Lacustrine Shale Oil Reservoirs , EGU General Assembly 2026, Vienna, Austria, 3–8 May 2026, EGU26-1838, https://doi.org/10.5194/egusphere-egu26-1838, 2026.

EGU26-2244 | ECS | Posters on site | HS8.1.2

NMR T2 Profile Reveals Connectivity-Controlled Permeability Breakthrough during Pore-Scale Carbonate Dissolution 

Bin Wang, Junwen Zhou, Sheng Zhou, Yixing Yang, Bate Bate, and Chi Zhang

Carbonate rock formations constitute common hydrocarbon reservoirs and are often considered as candidates for geological CO2 storage, where acid-driven carbonate dissolution may occur in the near-wellbore region. Calcite dissolution can substantially reconfigure pore networks, altering permeability and influencing storage efficiency and long-term containment integrity. While carbonate dissolution has been extensively studied experimentally and numerically, its detection and characterization using non-invasive monitoring tools remain challenging. Nuclear magnetic resonance (NMR) is a particularly promising tool as it is sensitive to pore geometry and fluid distribution. However, a quantitative framework that links regime-dependent pore-scale dissolution patterns to NMR observables remains underdeveloped. In this work, we establish such structure–signal mapping by coupling pore scale reactive transport simulations of calcite dissolution with forward modeling of low-field NMR responses, generating synthetic observables from dynamically evolving pore geometries due to calcite dissolution. By varying the relative timescales governing advection, diffusion, and surface reaction rates, we analyze the evolution of three representative dissolution patterns: uniform face dissolution, conical channeling dissolution, and wormholing dissolution. To capture the spatial heterogeneity of these features, we segment the pore geometry along the flow axis and derive an NMR T2 relaxation time distribution for each section, constructing flow-direction T2 profiles. In contrast, bulk T2 distributions derived from the entire pore volume tend to average out the spatial heterogeneity of dissolution patterns. Furthermore, to capture the propagation of reaction fronts and characterize the permeability of emerging channels, we formulate specific NMR-based metrics: a pore-enlargement index Ei(t), a heterogeneity index H(t), and a connectivity index C(t). Dissolution breakthrough, defined by k/k0 ≥ 10, occurs at PV10 ≈ 314 for face dissolution, 138 for channeling, and 144 for wormholing. While H(t) consistently evolves non-monotonically, breakthrough is governed by the emergence and strengthening of an inlet-to-outlet pathway. Accordingly, C(t) closely tracks breakthrough during channeling, whereas in wormholing it indicates early connectivity without an immediate permeability increase. Our weighted pore network connectivity by cumulative enlargement yields a single metric that correlates with permeability growth across regimes. This structure–signal framework provides a workflow for using spatially distributed NMR signals to identify pathway formation and provide an early indication of permeability surges. The framework for mapping structures to signals enhances the interpretation of NMR signals in dissolution reactive settings and provides a quantitative foundation for interpreting NMR monitoring signals and informing risk assessment for geological CO2 storage in settings where carbonate dissolution may alter flow pathways.

How to cite: Wang, B., Zhou, J., Zhou, S., Yang, Y., Bate, B., and Zhang, C.: NMR T2 Profile Reveals Connectivity-Controlled Permeability Breakthrough during Pore-Scale Carbonate Dissolution, EGU General Assembly 2026, Vienna, Austria, 3–8 May 2026, EGU26-2244, https://doi.org/10.5194/egusphere-egu26-2244, 2026.

EGU26-3195 | ECS | Posters on site | HS8.1.2

Fracture-Controlled Gas Leakage through the Hydrate Stability Zone under Coupled THMC and Salinity Effects in Subsea Sediments 

Li Zhang, Shubhangi Gupta, and Christian Berndt

Natural gas hydrates are crystalline, ice-like compounds formed by water molecules arranging into cage-like lattices that encapsulate gas molecules under low-temperature and high-pressure conditions typical of continental margins. Within these environments, free gas migrating upwards is generally expected to be trapped upon entering the hydrate stability zone (HSZ) through hydrate formation. Nevertheless, extensive geological and geophysical observations indicate that free gas can traverse the HSZ and escape at the seafloor, suggesting the presence of dynamic leakage mechanisms that are not yet fully understood.

In this study, we develop a fully coupled thermal–hydro–mechanical–chemical (THMC) framework [1] that explicitly incorporates salt transport and hydrate generation and apply it to a three-dimensional subsea geological model. The model is used to investigate gas migration and leakage through the HSZ under realistic pressure–temperature conditions. Simulation results reveal that gas leakage is governed by a transient, fracture-controlled process. Initial hydrate formation locally reduces permeability, acting as a temporary barrier that traps migrating gas and promotes progressive pore pressure build-up beneath HSZ. Continued pressurization compromises sediment mechanical stability, triggering fracture initiation and propagation.

Following fracture development, gas preferentially migrates through these newly formed high-permeability pathways, bypassing the surrounding low-permeability hydrate-bearing sediments. Within the fractured zones, rapid gas invasion promotes local hydrate formation, which is inherently self-limiting. Hydrate growth results in a progressive reduction in local water saturation, while salt is excluded from the hydrate phase and accumulates in the remaining pore fluid. The combined effects of water depletion and salinity increase thermodynamically suppress further hydrate formation, even under favourable pressure–temperature conditions. At the margins of the fractured zones, hydrate saturation becomes locally elevated, forming low-permeability hydrate-rich barrier that effectively restrict lateral water supply and salt diffusion into the fractured zone. This spatial heterogeneity in hydrate distribution reinforces the persistence of gas-conductive pathways within fractures zone. In contrast, the central parts of fractured zone remain characterised by high gas saturation and limited hydrate accumulation, preserving high gas relative permeability and enabling sustained gas flow through the hydrate stability zone.

As gas continues to be supplied, pore pressure progressively increases within and beneath the existing fracture network. This renewed pressurisation promotes further mechanical weakening of the surrounding sediments, leading to the second and more fractured zones. Ultimately, the development of interconnected fracture networks allows free gas to breach the hydrate stability zone and reach the seafloor, resulting in gas leakage into the overlying water column. Once these fractures connect to the seafloor, natural gas is released, causing leakage into the overlying water column.

Therefore, the limited water availability and salinity effects on hydrate formation are fundamental controls on gas leakage through the HSZ, as they restrict further hydrate growth and accelerate more generation of fractures, thereby maintaining highly permeable pathways for gas migration. This highlights the importance of fully coupled THMC processes with considerating salt transport in assessing subsea gas escape and associated geohazards.

[1] L. Zhang, B. Wu, Q. Li, Q. Hao, H. Zhang, Y. Nie, A fully coupled thermal–hydro–mechanical–chemical model for simulating gas hydrate dissociation, Applied Mathematical Modelling, 129 (2024) 88-111.

How to cite: Zhang, L., Gupta, S., and Berndt, C.: Fracture-Controlled Gas Leakage through the Hydrate Stability Zone under Coupled THMC and Salinity Effects in Subsea Sediments, EGU General Assembly 2026, Vienna, Austria, 3–8 May 2026, EGU26-3195, https://doi.org/10.5194/egusphere-egu26-3195, 2026.

EGU26-3207 | ECS | Posters on site | HS8.1.2

Geochemical Controls on Uranium Behavior During Water–Rock Interactions at a Natural Analogue Site in Korea 

Hakyung Cho, Soyeon Lim, Minyoung Choi, and Sung-Wook Jeen

Uranium behavior during water–rock interactions is strongly influenced by geochemical conditions relevant to geological disposal environments. This study investigated how variations in pH, redox conditions, carbonate availability, and temperature regulate uranium behavior through a series of batch experiments. Uranium-bearing coaly slate was collected from a natural analogue site in Boeun-gun within the Okcheon Metamorphic Belt, Korea. The coaly slate contains approximately 99.6 ppm of uranium, primarily hosted in uranium-bearing minerals such as uraninite and ekanite. Five batch experiments were conducted using artificial groundwater designed to represent the groundwater chemistry of the study site. The experimental design isolated the effects of pH, carbonate buffering, temperature, and uranium spiking. Batch 1 and Batch 2 were conducted under initially acidic (pH 5) and alkaline (pH 9) conditions, respectively. Batch 3 involved uranium-spiked artificial groundwater (2 mg L-1), while Batch 4 and Batch 5 were conducted under carbonate-buffered, near-neutral pH conditions at 15 °C and 30 °C, respectively. In Batches 1–3, pH decreased rapidly immediately after the reaction began, resulting in acidic and high Eh conditions driven by pyrite oxidation in the coaly slate. This process promoted the formation of secondary Fe(III) (oxyhydr)oxides and Fe-bearing secondary phases. In Batch 1 and Batch 2, uranium concentrations increased rapidly, reaching approximately 60 and 30 µg L-1 within 72 hours, respectively, and approached near-equilibrium, indicating limited uranium release under acidic conditions. In contrast, despite similarly acidic conditions, Batch 3 exhibited a gradual decrease in aqueous uranium concentration over time, suggesting uranium removal through adsorption or surface complexation onto newly formed Fe(III) (oxyhydr)oxides. In carbonate-buffered systems (Batch 4 and Batch 5), pH remained near neutral throughout the experiments, and uranium concentrations increased continuously with time, reaching levels of up to ~20 µg L⁻¹, which were lower than those observed under acidic conditions. Uranium speciation was dominated by aqueous carbonate complexes, with Ca₂UO₂(CO₃)₃ prevailing at 15 °C and UO₂(CO₃)₂²⁻ dominating at 30 °C. This sustained increase under neutral conditions contrasts with the rapid but limited uranium release observed in acidic systems, highlighting the role of carbonate complexation in regulating uranium mobility in groundwater.

How to cite: Cho, H., Lim, S., Choi, M., and Jeen, S.-W.: Geochemical Controls on Uranium Behavior During Water–Rock Interactions at a Natural Analogue Site in Korea, EGU General Assembly 2026, Vienna, Austria, 3–8 May 2026, EGU26-3207, https://doi.org/10.5194/egusphere-egu26-3207, 2026.

EGU26-3306 | Posters on site | HS8.1.2

Geochemical Modelling for Carbon Dioxide Removal Applications 

Ting Hu, David Dempsey, Zhencheng Zhao, Jie Dong, and Zhenhua Rui

Water-rock and aqueous reactions affect CO2 geological storage in several ways, including through carbonate mineralization, dissolution and reprecipitation, silicate dissolution, and acid-base buffering. However, complex water chemistry compositions and multiple rock mineral types make the quantitative characterization of these reactions difficult. Here, predictive models of geochemical reactions were developed taking place within strong to moderately reactive storage formations where pH-sensitive silicate dissolution and carbonate precipitation dominate. To do this, the TOUGHREACT thermal-hydrological-chemical multiphysics subsurface reactive transport simulator was used to develop well-calibrated models based on field monitoring data.

This study first benchmarked a model against a single-well CO2 push-pull field test conducted in a pH 11.02, shallow peridotite formation in Oman, described in Matter et al. (2025). The simulation included the 13.7-hour carbonated water injection, the subsequent 45-day shut-in, and then 11.2 days of pumping. Calibration of the porosity, permeability and formation mineral assemblage primarily occurs against recorded ion concentrations during the pumping period. The model suggests calcite precipitation dominated at the margins of the 6.4 m radius mineralization zone, with dolomite at intermediate distances and magnesite in the immediate vicinity of the well. Magnesite precipitation is associated with lower pH conditions near the well where there is sufficient available Mg2+ dissolved from the host rock, whereas dolomite and calcite are deposited at higher pH and sufficient available Ca2+. During the storage period, our model underpredicts mineralization (52%) compared to that inferred by Matter et al. (88%), likely due to underprediction of dolomite or magnesite. The precipitated carbonates remain stable upon re-equilibration of the groundwater.

The model was then applied to a hypothetical doublet storage operation in a CO2-rich hydrothermal system at Ohaaki, New Zealand. The goal was to predict CO2 phase evolution subject to long-term geochemical reactions as well as boiling of the fluid phase. Simulations show that ions primarily controlled by a single mineral (Ca2+, Na+, K+, and Fe2+) all reach their peak concentrations within five years, whereas subsequent geochemical evolution is influenced by the dynamic equilibrium of aqueous complexes, such as CaSO4(aq), NaCl, MgHCO3+, and FeCl+. Driven by the injection of aqueous solutions with high carbonic acid concentrations, the mineral volume fraction at the injection well changes at a rate 2–11 times greater than that observed in the rest of the simulation domain. Under high-temperature and low-pressure conditions of the production well, a CO2 boiling zone forms in the reservoir, with the peak gas saturation of CO2 exsolved from the liquid phase reaching 7.6 wt% over the simulation period. This research shows that the geochemical reaction simulation holds significant scientific value for CO2 storage applications in strong to moderately reactive storage formations.

How to cite: Hu, T., Dempsey, D., Zhao, Z., Dong, J., and Rui, Z.: Geochemical Modelling for Carbon Dioxide Removal Applications, EGU General Assembly 2026, Vienna, Austria, 3–8 May 2026, EGU26-3306, https://doi.org/10.5194/egusphere-egu26-3306, 2026.

EGU26-3925 | ECS | Orals | HS8.1.2

In-situ, real-time replacement of calcite under geometrical confinement. 

Joanna Dziadkowiec, Gaute Linga, Kristina G. Dunkel, Markus Valtiner, and François Renard

Mineral replacement by dissolution-precipitation reactions that occur under confinement critically influences subsurface deformation by modifying rock porosity, permeability, and cohesion, and by inducing fracturing. Yet real-time, experimental observations of these phenomena at the nano- to microscale remain insufficient. In this work, we follow the in-situ replacement of confined calcite crystal using a surface force apparatus (SFA) technique. Calcite undergoes dissolution under low pH conditions, followed by replacement into three various Ca-minerals: calcium oxalate, calcium sulfate (gypsum), or calcium phosphate (brushite), depending on the initial composition of the solution. We monitor these reactions in real time, map the spatial distribution of precipitates as a function of confinement gap size, and evaluate how epitaxy between the secondary phases and the parent calcite governs preferred nucleation and growth sites. In addition, we measure forces that act on the confining pore wall during the replacement and estimate the associated crystallization pressures. This work contributes to the understanding of the mineral growth under confinement and its consequences for porous rock integrity, with immediate relevance to subsurface fluid and gas storage operations, where rapid mineralization is common.

How to cite: Dziadkowiec, J., Linga, G., Dunkel, K. G., Valtiner, M., and Renard, F.: In-situ, real-time replacement of calcite under geometrical confinement., EGU General Assembly 2026, Vienna, Austria, 3–8 May 2026, EGU26-3925, https://doi.org/10.5194/egusphere-egu26-3925, 2026.

Bioturbation is the reworking and alteration of sediments, which can significantly impact the petrophysical properties of an aquifer. Numerous studies have shown that bioturbation can alter the porosity and permeability by creating extensive connected networks of burrows, in otherwise low or impermeable porous media. The Upper Cretaceous Aruma Formation in the Arabian Shelf outcropping in central Saudi Arabia contains segments of bioturbated strata with open and large burrows. Although, the common characteristics of these types of bioturbated aquifers are extensively addressed and well documented; however, groundwater flow modelling in such aquifers is limited.

This study aims to address this gap and lack of understanding of flow characteristics in such geological setting by introducing a workflow for modelling groundwater flow in bioturbated strata. The workflow involves integrating high-resolution computed tomography (CT) scans and physics-based numerical modelling, aiming to find a reliable characterization of bioturbated aquifers. First, the bioturbated limestone rock sample was scanned, and the images were used to construct different-scale 3D digital models of the sample. Following this, models for each 3D digital domain were built in COMSOL Multiphysics, using the Darcy’s law module, to simulate the flow.

The CT scan results demonstrated the extensive network of large, connected burrows, which created high permeability zones in the domain. The modelling results showed bioturbation can generate a connected burrow network responsible for high permeabilities, which probably indicates non-Darcian flow. Further, we modelled the groundwater flow at different scales to check the reliability of our workflow. The results for different scale models also verified the high permeability values, confirming the enhancement of permeability by bioturbation.

Results reveal various properties depending on the scale, which highlights the importance of multi-scale modelling in such geological settings.

How to cite: Rehman, A., Fahs, M., and Musa Baalousha, H.: Pore-Scale Groundwater Flow Modeling in a Bioturbated Strata: Insights from the Sedimentary Aquifer in Central Saudi Arabia, EGU General Assembly 2026, Vienna, Austria, 3–8 May 2026, EGU26-4373, https://doi.org/10.5194/egusphere-egu26-4373, 2026.

    Volcanic hydrothermal fluids in sedimentary basins continuously alter sedimentary strata and influence the development of hydrocarbon reservoirs. However, there has been ongoing debate regarding whether volcanic hydrothermal alteration degrades reservoir quality by metamorphism and filling or improves it by dissolution. Taking the Ordovician Yijianfang Formation limestone in the Tarim Basin for example, renowned for ultra-deep burial conditions, the development of strike-slip fault reservoirs and abundant hydrocarbon resources, this study investigated the alteration lithofacies and reservoir characteristics of limestone within the YAB ~YJF series of outcrops featuring diabase intrusions in the Bachu area. The result reveals that alterations in the limestone by volcanic hydrothermal fluids include marbleization, dissolution, silicification, and filling.

    Marbleization is identified as a destructive diagenesis, where the marble formed from limestone exhibits dense lithology, coarse calcite crystals in mutual interlocking contact. Dissolution displays selectivity, strongly dissolving reefal limestone, bioclastic limestone and grain limestone. Features such as moldic pores formed after the dissolution of nautiloids and their fragments, as well as needle-like dissolution pores, are commonly observed. Particularly in fluorite-rich outcrop (YJF-B), strata-bound dissolution caves formed by volcanic hydrothermal fluids are evident, with the largest cave measuring approximately 2.5 m in height, 5 m in width, and 15 m in length. These caves, varying in size, are distributed in a stepped pattern from top to bottom, interconnected by fractures, and contain fluorite, hydrothermal travertine, and gypsum. Caves and pores of various sizes are commonly filled with calcite. Analyses of ⁸⁷Sr/⁸⁶Sr ratios for calcite fillings yield values mostly between 0.710 and 0.711. Reservoirs quality tests of the dissolution layer show a porosity of 4.12% and a permeability of 0.052 × 10⁻³ μm². In some layers with well-developed dissolution pores, porosity and permeability can reach 11.74%, 7.803 × 10⁻³ μm² individually, significantly higher than the average porosity, being lower than 2%, for the unaltered host rocks. This indicates that deep-seated volcanic hydrothermal fluids associated with magma emplacement substantially improved the reservoirs quality of the limestone.

    Based on the types of precipitated hydrothermal minerals, the main fluid components are inferred to include CO₂, Si, F, S. Establishing the spatial relationships among dissolution pores, caves, and hydrothermal mineral reveals that during ascent, volcanic hydrothermal fluids preferentially cause dissolution, forming smaller strata-bound dissolution pores. When fractures are present, the fluids migrate upward along them, leading to continuous dissolution and the formation of large dissolution caves. As the dissolution diminishes, earlier dissolution products precipitate as silicification and filling, forming a sealing layer above the layers with dissolution pores and caves. Although silicification and filling accompany dissolution, with precipitation occurring immediately within newly formed dissolution pores, the two diagenesis is relatively weak where bottom dissolution is strong. However, when dissolution weakens, pore-filling and host silicification becomes the primary destructive diagenesis for reservoir formation.

    The research confirms that within the Ordovician limestone of the Tarim Basin, in areas characterized by ultra-deep burial, strike-slip fault and volcanic activity development such as the Fuman Oilfield, reservoirs formed by volcanic hydrothermal dissolution could do exist.

How to cite: Zhang, T., Qiao, Z., and Chen, J.: Volcanic Hydrothermal Diagenesis and Its Implication for Reservoir Formation in the Ordovician Limestone, Tarim Basin, NW China, EGU General Assembly 2026, Vienna, Austria, 3–8 May 2026, EGU26-5218, https://doi.org/10.5194/egusphere-egu26-5218, 2026.

The Ediacaran dolomites of the Tarim Basin constitute a strategic frontier in global ultra-deep hydrocarbon exploration, yet their complex diagenetic evolution and porosity preservation mechanisms remain pivotal challenges for predicting reservoir "sweet spots." To decipher this history, our study employs an integrated approach—combining detailed petrography with in-situ U-Pb geochronology, trace element analysis, and  in-situ C-O isotopic data-to reconstruct a high-precision, multi-stage diagenetic fluid sequence for the Qigebrak Formation dolomites.

This work not only clarifies the primary origin of the Ediacaran microbial dolomites (Md1) but also delineates six key diagenetic phases: four dolomite cement generations (Cd1-Cd4), one episode of hydrothermal saddle dolomite (Sd), and late-stage calcite veins (Cd5). The evolutionary trajectory is defined as follows: (1) Penecontemporaneous Stage (~583-538 Ma): The microbial matrix (Md1) yields U-Pb ages of 583–559 Ma, consistent with deposition. Its seawater-like REE signatures (high Y/Ho, LREE depletion) and C-O isotopes confirm penecontemporaneous dolomitization in an evaporative setting. Subsequent fibrous/bladed cements (Cd1, Cd2), dated to ~541–538 Ma, display high Mg and inherited seawater chemistry, marking the end of early marine cementation. (2) Shallow-to-Intermediate Burial Stage (~466–409 Ma): Cement Cd3 (~466 Ma) shows negative Ce anomalies and elevated BSI, reflecting mildly reducing modified seawater. A significant fluid shift is recorded by Cd4 (~409 Ma), which exhibits marked MREE enrichment ("bell-shaped" REE patterns) and sharply increased BSI, indicating influence from deep, reducing connate brines during the Late Caledonian to Hercynian. (3) Deep Burial and Tectonic-Hydrothermal Stage (~215 Ma): Saddle dolomite (Sd) is dated to ~215 Ma (Indosinian). Coupled with strong positive Eu anomalies and hydrothermal mineralogy, it unequivocally records tectonically driven, fault-focused hydrothermal fluid influx. Late calcite veins (Cd5) represent final fracture-fill during deep burial.

By establishing an absolute geochronological diagenetic framework, this study precisely pins the timings of fundamental fluid-property shifts. Our results demonstrate that the early rigid framework of penecontemporaneous dolomite (Md1) and marine cements (Cd1/Cd2) was essential for preserving primary porosity against deep burial compaction. In contrast, mid-to-late diagenetic fluids were governed by the basin's tectonic rhythm; the Indosinian hydrothermal event (Sd) underscores the critical role of deep-seated faults in superimposing reservoir modification. These findings deliver a temporally calibrated evolutionary model for ancient cratonic dolomites and provide seminal geological evidence to guide the prediction of ultra-deep hydrocarbon "sweet spots."

How to cite: chen, X., xu, Q., and Hao, F.: From Penecontemporaneous Seawater to Deep Hydrothermal Fluids: Records of Multi-Stage Superimposed Fluid Evolution in Ediacaran Dolomites, Tarim Basin, EGU General Assembly 2026, Vienna, Austria, 3–8 May 2026, EGU26-7825, https://doi.org/10.5194/egusphere-egu26-7825, 2026.

EGU26-8818 | ECS | Orals | HS8.1.2

Karst cave system formation driven by coupled deep-seated processes: modelling and case studies 

Roi Roded, Marco Dentz, and Amos Frumkin

The upper crust evolves through tightly coupled thermal, fluid-flow, mechanical, and geochemical processes, often termed thermo-hydro-mechano-chemical (THMC) interactions. These processes involve multiple nonlinear feedbacks operating across wide spatial and temporal scales, making their interpretation challenging. The integrated outcome of these hidden processes is often recorded in water-rock interactions and alteration patterns, providing valuable clues. In particular, morphologies of hypogene karst and cave systems formed by deep-seated ascending fluids are of great importance. This type of karst is distinct from the shallower, commonly more evident epigenic karst formed by surface infiltration of CO₂-rich meteoric water. Despite being often less visible, it is globally extensive and in many regions dominant, producing voluminous and structurally complex cave systems. As such, hypogene karst offers a unique natural laboratory for investigating coupled upper-crustal dynamics [1–2].

Here, we consolidate field observations of different components into a THMC conceptual scenario for hypogene cave system formation, which is explored using numerical and theoretical modelling. The results reproduce and help clarify hypogene cave morphologies that have been difficult to explain. Several global case studies demonstrate systematic relationships between cave development and structural-tectonic context, supporting the proposed scenario. This work improves understanding of obscured coupled subsurface processes, with relevance to geothermal systems, critical-mineral exploration, and geohazard assessment.

References

[1] Klimchouk, A., in Hypogene karst regions and caves of the world, 1–39, Springer (2017).

[2] Roded, R. et al., Commun. Earth Environ. 4, 465 (2023).

How to cite: Roded, R., Dentz, M., and Frumkin, A.: Karst cave system formation driven by coupled deep-seated processes: modelling and case studies, EGU General Assembly 2026, Vienna, Austria, 3–8 May 2026, EGU26-8818, https://doi.org/10.5194/egusphere-egu26-8818, 2026.

EGU26-9620 | ECS | Orals | HS8.1.2

Experimental studies on reactive transport processes in Enhanced Geothermal Systems (EGS) 

Gina Rüdiger, Juliane Kummerow, Laurenz Schröer, Chandra Widyananda Winardhi, Veerle Cnudde, and Timm John

Reactive transport processes are crucial in various geological settings, driving rock alteration, ore deposit formation, CO2 sequestration and Enhanced Geothermal Systems (EGS). In EGS, these processes, triggered by chemical stimulation, result in dynamic changes in mineral composition and petrophysical properties. Porosity generation and maintenance of permeability are essential for EGS, as they enable efficient fluid flow and hence heat transport. However, the parameters that control the efficiency of chemical stimulation of low-permeable are incompletely understood and experimental studies are still scarce.

To simulate coupled reactive transport processes in low-permeable crystalline reservoirs and to investigate the change of the respective petrophysical properties, we conducted hydrothermal closed-system experiments on the lab-scale, stimulating granite with modified regular mud acid (RMA) under geothermal reservoir conditions.

We characterized and quantified chemical, mineralogical, and microstructural changes of granite samples exposed to reactive fluids, partly in three dimensions, using X-ray powder diffraction (XRD), scanning electron microscopy (SEM), electron microprobe analyses (EMPA), Raman spectroscopy, X-ray micro-computed tomography (µCT) through the EXCITE network at the Centre for X-ray Tomography at Ghent University, and fluid chemical analyses. Furthermore, fluid pathways and distribution of secondary phases, after the fluid-rock interaction, in the granite samples are detected, offering insights into the reaction process and the influence of experimental parameters on the reactions.

Our results show that the experiments effectively stimulate granite and significantly increase interconnected porosity, driven by coupled mineral dissolution and the formation of denser phases replacing the original mineral assemblages. Depending on the fluid composition, secondary phases coat the initial phases or fill the newly-generated pore space. Key findings underscore the potential of reactive transport by laboratory chemical stimulation to affect substantially the petrophysical properties (porosity and permeability) of granites under geothermal reservoir conditions.

How to cite: Rüdiger, G., Kummerow, J., Schröer, L., Winardhi, C. W., Cnudde, V., and John, T.: Experimental studies on reactive transport processes in Enhanced Geothermal Systems (EGS), EGU General Assembly 2026, Vienna, Austria, 3–8 May 2026, EGU26-9620, https://doi.org/10.5194/egusphere-egu26-9620, 2026.

EGU26-9914 | Orals | HS8.1.2

Nanoscale investigation of calcite dissolution processes in Cd-bearing solutions 

Martina Siena, Samantha Ancellotti, Monica Riva, and Alberto Guadagnini

Mineral dissolution is a key process driving the evolution of porous structures in natural environments. Among all minerals, calcite is the most widespread in the Earth crust. Moreover, due to its high affinity for divalent metals, calcite plays a prominent role in the studies of heavy-metal sequestration and groundwater remediation techniques. Cadmium (Cd) is among the most toxic and persistent heavy metals detected in industrial wastewater. Its interaction with carbonate minerals is crucial to understand contaminant mobility and retention in natural systems. A comprehensive understanding of the kinetics of Cd interaction with calcite is essential to unravel the fundamental mechanisms governing these phenomena.

In this work, we rely on in-situ, real time measurements of calcite surface topography acquired via Atomic Force Microscopy (AFM) at nano-scale resolution. The main objectives of this study are: (i) to quantitatively assess the spatial heterogeneity of calcite dissolution; (ii) to evaluate the temporal evolution of the reaction kinetics; (iii) to investigate the effects of dissolved Cd ions on characteristic reaction patterns and on the spatial distribution of rates.

Freshly cleaved calcite crystals are exposed to deionized water and Cd-bearing solutions in a flow-through cell, where AFM acquisition is performed simultaneously with the continuous flow of the liquid phase. This set up allows spatial distributions of dissolution rates to be obtained by comparing topographic maps acquired at successive times.

Stochastic models based on multimodal Gaussian and sub-Gaussian random fields successfully reproduce the statistical behavior of nano-scale dissolution-rate datasets. The temporal evolution of the model parameters provides insights into the key mechanisms controlling mineral surface dynamics and its interaction with Cd.

How to cite: Siena, M., Ancellotti, S., Riva, M., and Guadagnini, A.: Nanoscale investigation of calcite dissolution processes in Cd-bearing solutions, EGU General Assembly 2026, Vienna, Austria, 3–8 May 2026, EGU26-9914, https://doi.org/10.5194/egusphere-egu26-9914, 2026.

Hydrothermal dolomitization is a critical process in carbonate diagenesis, capable of nonlinearly and heterogeneously restructuring pore networks, thereby fundamentally affecting permeability and fluid pathways in carbonate-hosted geothermal systems. Reaction rates and mechanisms in natural rocks remain poorly constrained, as few experimental setups permit direct observation of the process. Here, we present early analyses of operando (4D) µCT data acquired at the PSICHÉ beamline of Synchrotron SOLEIL (France) that document hydrothermal dolomitization in a fractured limestone from the Terwagne Formation of the Lower Carboniferous Kohlenkalk sequence (North Rhine-Westphalia, Germany). Our data provide mechanistic insights that cannot be obtained from conventional experimental approaches.

The fine-grained oosparitic limestone contains microstylolites, which are likely to be diagenetic. A cylindrical core (20.08 × 9.76 mm) was drilled sub-parallel to bedding and axially fractured ex situ (UCS = 98.1 MPa) to promote fluid flow in an otherwise low-porosity (<2%) rock. The initial permeability at experimental conditions was 1.1–2.9 × 10⁻¹⁰ m2. The experiment was conducted using the X-ray transparent Heitt Mjölnir triaxial flow-through rig (Freitas et al., 2024), with continuous injection of a 2.05 M NaCl–MgCl₂–CaCl₂ brine at 1.5 µL min-1, at 260 °C, 20 MPa confining pressure, and 15 MPa pore fluid pressure. Reaction progress was documented in 62 three-dimensional volumes at a 5.8 µm voxel size over 128 h. Each tomography volume is based on 1,400 projections acquired over 180° using a pink beam with a peak energy of ~81 keV. Fluid samples collected after 49, 79, 105, and 128 h were analysed by ICP-OES for Na, Ca, and Mg concentrations, and post-mortem SEM/EDX analyses corroborated the µCT-based interpretations.

Our 4DµCT data resolve the spatiotemporal evolution of reaction products, allowing observation of phase formation sequences, quantification of local reaction rates, and identification of rate-limiting transport mechanisms controlling phase growth within a fractured carbonate rock. Early analyses show that calcite reacts with brine and forms several distinct phases nearly simultaneously, including magnesite, dolomite-type carbonate, and locally brucite where carbonate availability is limited. Post-mortem SEM/EDX reveals that the dolomite-type phase comprises both Ca-dolomite and stoichiometric dolomite, which cannot be distinguished in our 4DµCT data. Magnesite and brucite remain largely confined to the inlet region, whereas dolomite-type carbonate nucleates preferentially along hydraulically active fractures and stylolites with apertures exceeding ~32 µm, reflecting the evolving fluid pathways during reaction. Our observations indicate that magnesite precipitation generates macro-porosity (10–100 µm), facilitating advective fluid transport, whereas dolomite-type carbonate develops sub-micron to micron-scale porosity, likely resulting in transport dominated by grain-boundary diffusion. Brucite locally reduces porosity, but its metastable nature likely limits its impact on bulk fluid flow. Porosity generation associated with dolomite-type replacement enhances fracture and stylolite connectivity, establishing preferential fluid pathways in the process. These spatially and temporally heterogeneous transport regimes reflect local chemical-hydraulic feedbacks, producing differential growth rates among phases and exerting first-order control on the overall rate of dolomitization. ICP-OES data are consistent with bulk mineralogical evolution, while 4DµCT uniquely resolves a spatiotemporal coupling between fluid flow and reaction progress.

How to cite: Ng, A.: Operando 4D synchrotron tomography resolves multiphase hydrothermal dolomitization in a natural carbonate rock, EGU General Assembly 2026, Vienna, Austria, 3–8 May 2026, EGU26-10300, https://doi.org/10.5194/egusphere-egu26-10300, 2026.

Authigenic clay minerals may serve as effective solute carriers, enabling the movement of less mobile pollutants, including pesticides, heavy metals, and polycyclic aromatic hydrocarbons through subsurface environments. When present as colloidal suspensions, clays are highly mobile and can dramatically accelerate the transport of pollutants adsorbed to their surfaces, sometimes increasing mean transport velocities by several orders of magnitude. As a result, delineated groundwater protectionzones and riverbank filtration systems designed solely based on pollutant mobility may be inadequate if the impact of carrier-facilitated transport is ignored. Clay’s ability to mobilize pollutants may be also exploited by using carrier-facilitated (carrier-assisted) transport to release harmful substances from soil or groundwater in in-situ remediation techniques. However, quantitatively evaluating carrier-facilitated transport—especially the parameters governing co-sorption and competitive adsorption between mobile and immobile sorbents—is challenging due to the complex interplay of transport and interaction processes in natural porous media. In this case study, we conducted column experiments demonstrating an enhanced mobilization and transport of poly(ethylene glycol) polymers by montmorillonite in limestone media by a factor of ten. The polymer’s strong affinity for montmorillonite promotes competitive adsorption and enables clays as carriers to mobilize polymers that were previously adsorbed at the immobile phase. Our numerical analysis revealed that high flow rates, e.g. during events like ponding or flooding, further promote carrier-facilitated transport, even when mobile sorbent adsorption is weak. By combining experimental observations with a comprehensive numerical sensitivity analysis, we advanced an experimental protocol to identify and infer the multitude of parameters present in models describing carrier-facilitated transport in an uncorrelated manner, thereby overcoming ambiguity in parameter estimation.

How to cite: Ritschel, T., Kwarkye, N., Pihan, A., and Totsche, K.: Experimental evidence and numerical analysis of competitive sorption and carrier-facilitated transport: How mobile clays shape solute mobility in limestone media, EGU General Assembly 2026, Vienna, Austria, 3–8 May 2026, EGU26-11022, https://doi.org/10.5194/egusphere-egu26-11022, 2026.

EGU26-12091 | ECS | Posters on site | HS8.1.2

Modeling Nitrogen Cycling in Hyporheic Zones: A Comparison of First-Order and Monod-Type Kinetics 

Jingwen Xing, Yi Cai, and Nianqing Zhou

Dynamic interactions between surface water and groundwater induce pronounced temporal and spatial variability in redox conditions and substance concentrations within hyporheic zones, giving rise to highly complex nitrogen transformation dynamics. However, under environmentally heterogeneous and data-limited conditions, the level of kinetic complexity required to adequately represent nitrogen processes remains poorly constrained. In this study, we use soil microcosm experiments representative of hyporheic environments to systematically evaluate the applicability and modeling performance of first-order and Monod-type kinetics for simulating nitrogen transformations. Time-series measurements of ammonia nitrogen (NH4+-N), nitrate nitrogen (NO3--N), nitrite nitrogen (NO2--N) and dissolved organic carbon (DOC) were used to constrain nitrogen transformation rates, while functional gene abundances quantified by quantitative PCR served as indicators of microbial functional potential. Two kinetic frameworks, consisting of parsimonious first-order kinetics and Monod-type kinetics that explicitly incorporate substrate limitation, were independently calibrated to the experimental observations.
Our results indicate that both kinetic frameworks reproduced the overall temporal evolution of nitrogen species, including the general trends of ammonium oxidation and nitrate reduction. However, only the Monod-type kinetics captured substrate-dependent process controls and reactions associated with anoxic microenvironments, even when overall concentration variability was limited. While the first-order kinetics provide an efficient representation of net nitrogen turnover, the Monod-type kinetics offer a more mechanistic description of pathway sensitivity and environmental regulation that is essential for interpreting nitrogen transformation processes in hyporheic zones. The derived kinetic parameters therefore provide scenario-dependent priors for reactive biogeochemical modeling and highlight the importance of explicitly representing substrate limitation and redox regulation using Monod-type kinetics when coupling biogeochemical dynamics with hydrologic variability. 

How to cite: Xing, J., Cai, Y., and Zhou, N.: Modeling Nitrogen Cycling in Hyporheic Zones: A Comparison of First-Order and Monod-Type Kinetics, EGU General Assembly 2026, Vienna, Austria, 3–8 May 2026, EGU26-12091, https://doi.org/10.5194/egusphere-egu26-12091, 2026.

EGU26-12691 | ECS | Posters on site | HS8.1.2

Unraveling dissolution regime transitions in carbonates during CO2-rich water injection 

Atefeh Vafaie, Iman Rahimzadeh Kivi, and Sam Krevor

Carbonate dissolution by CO2-rich brine (carbonic acid) can strongly modify pore structure and flow pathways in subsurface systems relevant to geological CO2 storage. However, predicting the resulting dissolution regimes remains challenging, as widely used transport–reaction scaling approaches based on Péclet and Damköhler numbers often fail to reproduce experimentally observed dissolution patterns. Here, we present a new set of core-scale dissolution experiments designed to directly observe the coupled evolution of pore structure, flow, and reaction-front migration during CO2-rich water injection. Experiments were performed on cylindrical limestone cores with a diameter of 12 mm and a length of 36 mm from two formations exhibiting contrasting pore-scale heterogeneity: (1) Ketton limestone, representing a relatively homogeneous system, and (2) Estaillades limestone, representing a heterogeneous system. Carbonated water with an initial pH of 3 was injected into three samples of each limestone at ambient temperature and a pore pressure of 50 bar under constant flow rates of 0.1, 1, and 10 ml/min. Dissolution processes were monitored using time-lapse X-ray microcomputed tomography at approximately 6 µm spatial resolution. Scans were acquired under initial dry conditions, fully water-saturated conditions, and after successive intervals of 100 injected pore volumes of CO2-rich water, enabling four-dimensional visualization of dissolution pattern development. Across both lithologies, systematic transitions in dissolution behaviour are observed with increasing flow rate: compact or inlet-localized dissolution at low flow rate, dominant wormhole formation at intermediate flow rate, and increasingly distributed, multi-branch, or ramified wormholing (nearly uniform) at the highest flow rate. While pore-scale heterogeneity influences the geometry and symmetry of the resulting dissolution structures, the overall regime transitions remain consistent across both carbonate systems. We observe that dissolution patterns cannot be solely explained by classical Pe-Da scaling based on initial flow and kinetic conditions. Instead, the results demonstrate that the spatial persistence of fluid reactivity governs both the extent and morphology of dissolution across flow rates and lithologies with contrasting heterogeneity. These experiments show that accounting for the evolution of fluid reactivity and reaction-front migration is essential for more accurate prediction of carbonate dissolution during CO2 injection.

How to cite: Vafaie, A., Rahimzadeh Kivi, I., and Krevor, S.: Unraveling dissolution regime transitions in carbonates during CO2-rich water injection, EGU General Assembly 2026, Vienna, Austria, 3–8 May 2026, EGU26-12691, https://doi.org/10.5194/egusphere-egu26-12691, 2026.

EGU26-14201 | Posters on site | HS8.1.2

Reactive Flow Experiments on Granite: Implications for Chemical Stimulation of Enhanced Geothermal Systems 

Juliane Kummerow, Gina Rüdiger, Laurenz Schröer, Chandra Widyananda Winardhi, Veerle Cnudde, and Timm John

Enhanced Geothermal Systems (EGS) rely on heat extraction from deep crystalline rocks, whose inherently low permeability requires reservoir stimulation to establish effective fluid circulation. Current stimulation strategies are largely limited to hydraulic methods, while chemical approaches remain underexplored in crystalline lithologies, even though natural hydrothermal analogues demonstrate that fluid–rock reactions can substantially modify pore structure and flow properties. 

Here, we investigate the reaction-driven evolution of porosity and permeability in low-porosity granite using controlled reactive flow-through experiments conducted under conditions relevant to chemical stimulation of EGS. Reactive fluids with modified regular mud acid (RMA), are continuously circulated through saw-cut granite cores, enabling direct monitoring of hydraulic property evolution during fluid flow. These measurements are complemented by post-experimental mineralogical and microstructural characterisation using electron microprobe analyses (EMPA), scanning electron microscopy (SEM), surface profilometry, and X-ray micro-computed tomography (µCT), conducted via the EXCITE network at the Ghent University Centre for X-ray Tomography. Previous batch experiments, presented separately at this conference (see Rüdiger et al., EGU2026), demonstrate that the used modified RMA fluid reacts preferentially with feldspar and mica, resulting in increased porosity. Building on these findings, the flow-through experiments examine how such mineral reactions progress under dynamic conditions and assess whether the newly formed porosity contributes to connected flow pathways and enhance permeability. In addition, the experiments further address the formation and stability of secondary phases and quantify the advance of reaction fronts into the granite matrix as function of time and flow. Together, these data allow to assess whether the substantial porosity increases observed in batch experiments are sustained under flow-through conditions, and how these changes affect both the magnitude and long-term stability of permeability enhancement.

How to cite: Kummerow, J., Rüdiger, G., Schröer, L., Winardhi, C. W., Cnudde, V., and John, T.: Reactive Flow Experiments on Granite: Implications for Chemical Stimulation of Enhanced Geothermal Systems, EGU General Assembly 2026, Vienna, Austria, 3–8 May 2026, EGU26-14201, https://doi.org/10.5194/egusphere-egu26-14201, 2026.

EGU26-15203 | ECS | Posters on site | HS8.1.2

Evaluation of Potential Carbon Storage of Cement-based Material in Aqueous Media Using PHREEQC  

Yu-Hsuan Tai, Wenxin Wu, Scott Smith, and Philippe Van Cappellen

Cement-based material has great potential to store carbon dioxide (CO2) as carbonate minerals (mainly calcite, CaCO3), through aqueous carbonation, driven by their alkaline nature and high portlandite (Ca(OH)2) content. The carbonation capacity is influenced by many variables, such as cement mass, particle size, and water volume. However, the mechanistic understanding of how these parameters collectively control carbonation kinetics and long-term CO2 uptake under dynamically evolving conditions remains underexplored. In this study, we developed a geochemical model using PHREEQC that integrates thermodynamic descriptions of aqueous speciation and mineral equilibria with kinetic rate laws to simulate simultaneous reactions in dynamically evolving systems. Portlandite dissolution releases Ca2+ into solution, which subsequently reacts with dissolved CO2 to form CaCO3 over time. By tracking phase assemblages involving Ca(OH)2 dissolution, CaCO3 precipitation, and pore-solution evolution, the progression of carbonation can be quantitatively resolved. Model results under experimentally relevant conditions indicate that CO2 dissolution is the rate-limiting step of the overall process. Elevated pH is sustained for a finite duration, which depends on key controlling factors such as cement mass and particle size. This modeling framework provides a mechanistic foundation for upscaling laboratory observations and evaluating the potential performance of cement-based carbonation processes in natural environments, supporting the development and optimization of mineral-based carbon sequestration strategies under environmentally relevant conditions.

How to cite: Tai, Y.-H., Wu, W., Smith, S., and Van Cappellen, P.: Evaluation of Potential Carbon Storage of Cement-based Material in Aqueous Media Using PHREEQC , EGU General Assembly 2026, Vienna, Austria, 3–8 May 2026, EGU26-15203, https://doi.org/10.5194/egusphere-egu26-15203, 2026.

EGU26-15688 | Orals | HS8.1.2

Controls of the Nucleation Rate and Advection Rate on BaritePrecipitation in Fractured Porous Media 

Qiurong Jiang, Ran Hu, Hang Deng, Bowen Ling, Zhibing Yang, and Yi-Feng Chen

Mineral precipitation is ubiquitous in natural and engineered environments, such as carbon mineralization, contaminant remediation, and oil recovery in unconventional reservoirs. The precipitation process continuously alters the medium permeability, thereby influencing fluid transport and subsequent reaction kinetics. The diversity of preferential precipitation zones controls flow and transport efficiency as well as the capacity of mineral sequestration and immobilization. Taking barite precipitation as an example, previous studies have examined this process in porous and/or fractured media, but pore-scale mechanisms under varying flowing and geochemical conditions remain unexplored. In this study, we conducted real-rock microfluidic experiments to investigate the precipitation dynamics within a fractured porous system. Direct observations of the evolution of the porous structure and flow channel and quantifications of barite precipitation dynamics using X-ray diffraction (XRD) and scanning electron microscopy with energydispersive X-ray spectroscopy (SEM-EDS), revealed two distinct precipitation regimes: precipitation on the fracture surface (regime
I) and precipitation in the alteration zone (regime II). Through theoretical analysis of the rate of advection and nucleation, we defined a dimensionless number Da above which regime I occurs and regime II prevails otherwise. At the large Da number, when the precipitation rate is large compared with the flow rate, precipitation on the fracture surface is favored. As the precipitation regimes are expected to impact differently the permeability of the fractured porous media, the mass transfer across matrix and fractures, and the spatial distributions of coprecipitated contaminants, our work sheds light on accurately modeling reactive transport in fractured porous media across diverse applications.

How to cite: Jiang, Q., Hu, R., Deng, H., Ling, B., Yang, Z., and Chen, Y.-F.: Controls of the Nucleation Rate and Advection Rate on BaritePrecipitation in Fractured Porous Media, EGU General Assembly 2026, Vienna, Austria, 3–8 May 2026, EGU26-15688, https://doi.org/10.5194/egusphere-egu26-15688, 2026.

EGU26-17522 | ECS | Posters on site | HS8.1.2

From miscibility development to microbial biomineralization: visualization of pore scale process in microfluidic porous medium.  

Hanbang Zou, Martí Pla-Ferriol, Sophie van Velzen, Dimitri Floudas, and Edith Hammer

Pore-scale processes govern the emergence of macroscopic patterns in porous media. Direct experimental access to these coupled processes at the pore scale, however, remains limited by the opacity and structural heterogeneity of natural geomaterials. Microfluidic porous media offer real-time visualization of flow, interfacial phenomena, and chemical reactions within well-defined pore networks.

Here, we present a microfluidic platform that bridges pore-scale physical chemistry and biologically mediated precipitation process. The device architecture was originally developed to quantify multiple-contact miscibility in CO₂-enhanced oil recovery, providing direct measurements of phase behaviour and interfacial dynamics in a controlled pore network. We now extend this same framework to investigate microbial biomineralization as a precipitation-driven reactive process in porous media.

Using an optically transparent microfluidic porous medium, we resolve microbial transport, attachment, and growth, together with spatially localized mineral precipitation within individual pores and throats. This enables quantitative analysis of nucleation sites, precipitation kinetics, and pore-scale clogging. We apply the platform to study fungal-induced calcium carbonate precipitation, a biologically mediated mineralization pathway relevant to soil stabilization and the development of bio-based construction materials.

Our results demonstrate that a single microfluidic porous medium can be used to transition from physicochemical multiphase flow studies to biologically driven dissolution–precipitation processes. This approach provides a versatile experimental framework for reactive transport research, with implications for biomineralization, subsurface engineering, and biomaterial design based on microbially controlled mineral formation.

How to cite: Zou, H., Pla-Ferriol, M., van Velzen, S., Floudas, D., and Hammer, E.: From miscibility development to microbial biomineralization: visualization of pore scale process in microfluidic porous medium. , EGU General Assembly 2026, Vienna, Austria, 3–8 May 2026, EGU26-17522, https://doi.org/10.5194/egusphere-egu26-17522, 2026.

EGU26-17699 | Orals | HS8.1.2

Linking δ¹³CDIC and microbial respiration to calcium carbonate dissolution in a complex groundwater system: evidence from a large-scale field study 

Elisabetta Preziosi, Stefano Amalfitano, Barbara Casentini, Marco Melita, and Andrea Cisternino

The relationships between groundwater chemistry and the structure and metabolism of microbial communities inhabiting pristine aquifers remain poorly understood, as do the bidirectional interactions between groundwater pollution and microbial activity. In this study, we investigated more than 60 sites within a large groundwater system in central Italy, aiming to integrate geochemical, isotopic, and microbiological information to elucidate key biogeochemical processes.

The relationships between groundwater chemistry and the structure and metabolism of microbial communities inhabiting pristine aquifers remain poorly understood, as do the bidirectional interactions between groundwater pollution and microbial activity. In this study, we investigated more than 60 sites within a large groundwater system in central Italy, aiming to integrate geochemical, isotopic, and microbiological information to elucidate key biogeochemical processes.

The study area is the Sacco River Valley, which hosts multiple hydrogeological complexes, including Quaternary alluvial deposits, Pleistocene volcanic products and travertines, Miocene flysch sequences, and Meso–Cenozoic limestones. Aquifer potential is medium to high, with moderate vulnerability. A regional unconfined aquifer develops along the valley, mainly within volcanic deposits, alluvial sediments, and travertines, and is drained by the river along most of its course. A deeper groundwater system circulates in the Meso-Cenozoic limestones, confined beneath the Neogene-Quaternary formations.

Groundwater samples were collected from wells and springs between November 2024 and December 2025, together with in situ measurements of physical and chemical parameters. Chemical analyses included major ions, trace elements, DOC, and stable isotopes (δ¹³CDIC, δ²H, and δ¹⁸O). Microbial communities were characterized by total cell counts (flow cytometry) and heterotrophic respiration potential (Biolog-MT2™ assay).

Most samples belong to the Ca–HCO₃ facies, and exhibited near-neutral pH. Approximately 30% of the sites showed slightly to strongly reducing conditions. δ¹³CDIC values indicated that groundwater was predominantly influenced by biogenic CO₂ derived from soil respiration (δ¹³CDIC < −10‰). A limited number of samples showed less negative to slightly positive δ¹³CDIC values, associated with elevated iron and manganese concentrations, sub-neutral pH, anoxic conditions and field evidence of dissolved gases, suggesting localized interaction with deep geogenic CO₂ sources.

Preliminary statistical analyses revealed significant correlations between microbial respiration and Ca2+, electrical conductivity, HCO₃⁻, Mg2+, SO₄²⁻, δ¹³CDIC, and iron, while a weaker negative correlation occurred with redox potential. Multivariate analyses discriminated sample groups related to redox conditions and conductivity, the latter being positively associated with heterotrophic microbial respiration. The significant correlation of microbial respiration with calcium concentration suggested a potential role of microbial activity in promoting calcium dissolution in groundwater. Overall, these results highlight the tight coupling between groundwater geochemistry and microbial metabolic activity, providing new insights into biogeochemical controls operating in complex groundwater systems.


How to cite: Preziosi, E., Amalfitano, S., Casentini, B., Melita, M., and Cisternino, A.: Linking δ¹³CDIC and microbial respiration to calcium carbonate dissolution in a complex groundwater system: evidence from a large-scale field study, EGU General Assembly 2026, Vienna, Austria, 3–8 May 2026, EGU26-17699, https://doi.org/10.5194/egusphere-egu26-17699, 2026.

EGU26-17861 | ECS | Posters on site | HS8.1.2

Connecting groundwater age to subsurface weathering reactions at the catchment scale using silicon isotopes and reactive transport modeling 

Nicole Fernandez, Hunter Jamison, Sofía López-Urzúa, Zachary Meyers, Laura Rademacher, Adrian Harpold, and Louis Derry

Fluid-mineral interactions taking place within the natural reactor at the Earth’s surface, the Critical Zone (CZ), are fundamental processes that regulates Earth’s surface conditions and terrestrial weathering fluxes across multiple spatiotemporal scales. Dissolution, precipitation and chemical reaction networks established through fluid-mineral interactions generally take place in the subsurface, and their extent is largely dictated by both the pathways of infiltrating water and the timescales of fluid transport. Deriving a quantitative understanding of how subsurface fluid residence times relate to weathering reaction rates remains a key challenge. This study seeks to better address this unknown by applying advanced geochemical tracers of weathering (silicon stable isotopes, δ30Si) and groundwater ages tracers, along with reactive transport modeling approaches to a well-characterized natural system.

Our work focuses on Sagehen Creek basin, a small (27 km2) montane catchment situated in the Central Sierra Nevada of Northern California, USA. Sagehen Creek hosts robust, multi-decadal hydrologic and geochemical records of groundwater sourced from 12 naturally occurring springs. Over the course of a water year, > 80 spring water samples were collected at a bi-weekly frequency to develop a comprehensive geochemical (δ30Si and dissolved solutes) and groundwater age tracer (CFCs, SF6) dataset. Preliminary results from the field data show spring δ30Si signatures to exhibit a strong correlation with groundwater ages over decadal timescales where the oldest springs have the lowest δ30Si (+0.16 ± 0.08 ‰) and the youngest, the most elevated δ30Si (+1.45 ± 0.07 ‰). This result suggests that weathering reaction progress varies as a function of mean groundwater ages and evolving transit time distributions (TTDs). A series of 1D isotope-enabled reactive transport models (RTMs) were developed to identify the major hydrogeochemical factors underlying the observed relationship between δ30Si and groundwater ages. The leading framework generated from our preliminary RTM efforts centers on secondary mineral precipitation reactions and stable isotope equilibration. Younger groundwaters reflect early reaction progress dominated by active secondary mineral precipitation, which produce elevated δ30Si due to kinetic effects. Older groundwaters on the other hand, reflect late stage, (near)equilibrium conditions for secondary mineral reactions, facilitating continued isotope exchange between minerals and the surrounding fluids, and thereby producing low δ30Si values. Together, these preliminary results provide new constraints on the links between subsurface fluid residence times, weathering reaction progress, and solute generation in catchment-scale CZ systems.

How to cite: Fernandez, N., Jamison, H., López-Urzúa, S., Meyers, Z., Rademacher, L., Harpold, A., and Derry, L.: Connecting groundwater age to subsurface weathering reactions at the catchment scale using silicon isotopes and reactive transport modeling, EGU General Assembly 2026, Vienna, Austria, 3–8 May 2026, EGU26-17861, https://doi.org/10.5194/egusphere-egu26-17861, 2026.

EGU26-94 | ECS | Orals | HS8.1.3

Impact of beaver re-colonization on aquifer recharge and water quality in two topographically contrasting lowland agricultural catchments  

Maria Magdalena Warter, Dörthe Tetzlaff, Tobias Goldhammer, and Chris Soulsby

Increasing hydroclimate extremes and land degradation have intensified concerns over aquifer recharge, water quality, and climate resilience in lowland continental regions across Western and Central Europe, as these are vital areas for agricultural production. Concurrently, the re-colonization of beavers in Germany and across Europe has revived interest in their function as natural ecosystem engineers and their ability to support ecosystem restoration. Despite mounting evidence of beavers’ impacts on restoration of wetlands and natural riparian areas, evidence from agriculturally impacted lowlands remains limited. In this study, we explore how catchment structure, hydrogeology, and land use mediate beaver activity, and how in turn beavers impact hydrology and water quality, as well as drought resilience, in two topographically contrasting lowland agricultural catchments; the Sophienfliess and the Demnitz Mill Creek in eastern Brandenburg, Germany.

Integrative assessments of water quality, water sources and flowpaths, as well as landscape settings have revealed differential impacts of beavers in both catchments. In the Sophienfliess catchment, extensive beaver dam cascades in the lower catchment significantly impacted downstream water quality, indicating strong denitrification and reduction of organic carbon, as well as fertilizer-based nutrients. Furthermore, increased water retention and storage in beaver ponds has resulted in strong surface-groundwater connectivity and increased aquifer recharge. In contrast, lower dam density and spatially diverse dynamics of nutrient fluxes in den Demnitz Mill Creek catchment revealed a strong influence of local hydrological conditions on mobilization processes and water quality dynamics. As a result, changes in water quality and groundwater recharge could only be partially linked to beaver activity. Ultimately, understanding these relationships is crucial for evaluating the role of beavers in ecosystem restoration, how their engineering efforts modify catchment hydrology, infiltration, and groundwater recharge across different topographic settings, and whether they can sustainably contribute to groundwater management, drought resilience and ecosystem restoration of degraded agricultural lowland catchments under ongoing climate change.

How to cite: Warter, M. M., Tetzlaff, D., Goldhammer, T., and Soulsby, C.: Impact of beaver re-colonization on aquifer recharge and water quality in two topographically contrasting lowland agricultural catchments , EGU General Assembly 2026, Vienna, Austria, 3–8 May 2026, EGU26-94, https://doi.org/10.5194/egusphere-egu26-94, 2026.

EGU26-1990 | Posters on site | HS8.1.3

Stormwater MAR in pre-alpine catchments 

Thomas Baumann, Jörn Bartels, Lea Augustin, Saulo Vieira, and Anne Schultze

Managed aquifer recharge (MAR) is a state-of-the-art strategy to maintain groundwater levels and sustain groundwater-dependent ecosystem services. Increasing rainfall intensity and prolonged drought periods caused by climate change put the availability of river water for MAR at risk. To adapt, MAR has to include stormwater as a source. This requires to infiltrate high volumes of water with high recharge rates, increase buffer and retention capacity and times, and maintain water quality. In the project Smart-SWS we have developed a stormwater-based MAR scheme which consists of an infiltration ditch connected to a stream and a geotechnical barrier set in the aquifer. Water quality issues were addressed with a combination of catchment risk analysis, on-line monitoring backed by extended laboratory analyses, and tailored treatment techniques.

The site is located downstream of a flood retention basin (FRB) in the Bavarian alpine foreland. The upstream catchment is 16 km². The maximum discharge from the FRB at a 100-year event is 4.7 m³/s. The aquifer is composed of highly conductive quaternary gravel with a thickness of 10 to 20 m in the storage area. The hydrogeological model was transformed into a numerical groundwater model which was used to find the optimal position for the infiltration ditch (1400 m long) and the geotechnical groundwater flow barrier (1100 m long, top 3 m b.s.l.).

A first real-world proof-of-concept for the design and model was established during the 100-year flooding event in June 2024. The recorded water levels were modeled with an infiltration rate of 1.1 m³/s along a 630 m relief diversion from the main stream which runs along the planned infiltration ditch. Water quality during the flooding event was better than expected and met the criteria for infiltration.

A modeled extreme drought situation (no recharge for six months) showed that Smart-SWS will be able to still buffer up to 130.000 m³ of groundwater which is sufficient to supply drinking water for 2.600 capita. The geotechnical barrier prevents flooded basements in the village and helps to sustain ecosystem functions in the nearby wetlands.

How to cite: Baumann, T., Bartels, J., Augustin, L., Vieira, S., and Schultze, A.: Stormwater MAR in pre-alpine catchments, EGU General Assembly 2026, Vienna, Austria, 3–8 May 2026, EGU26-1990, https://doi.org/10.5194/egusphere-egu26-1990, 2026.

We assess the applicability of the InVEST model suite to quantify the benefits of managed aquifer recharge (MAR) for groundwater-dependent ecosystem services (GDES). GDES are of high importance for a wide range of human activities and therefore should be assigned substantial value and integrated into sustainable groundwater management planning.

Given the growing need to enforce sustainable groundwater management, a tool that enables the environmental impact assessment of MAR operations—and thus the quantification of MAR impacts on GDES—would be highly beneficial. Such a tool could facilitate and accelerate the integration of MAR’s positive effects on GDES into management and planning processes.

The selected pilot region is located in the pre-alpine foreland in southern Bavaria. This region strongly depends on local GDES, particularly for agricultural and tourism-related purposes. Since 2014, a large-scale flood protection concept with a total retention volume of approximately 7.5 million m³ of floodwater has been under development. In our project Smart-SWS² we have developed a concept to couple flood protection and MAR.

In this study, we apply the InVEST model suite¹ as an evaluation framework to compare different scenarios and their capacity to safeguard regional water resources and associated GDES. The baseline scenario represents conditions prior to the implementation of the flood protection concept, while the other scenarios incorporates the retention basins and the planned MAR systems. For these scenarios, we evaluate the model outputs and the feasibility of quantifying GDES using InVEST.

¹ Natural Capital Project
² Augusting & Baumann, 2024


How to cite: Schultze, A., Dietmaier, A., and Baumann, T.: Testing the quantification of groundwater-dependent ecosystem services enhanced through managed aquifer recharge via the InVEST model suite, EGU General Assembly 2026, Vienna, Austria, 3–8 May 2026, EGU26-2925, https://doi.org/10.5194/egusphere-egu26-2925, 2026.

EGU26-4358 | Posters on site | HS8.1.3

Physics-Informed Bayesian Neural Network for Groundwater Recharge in South Al-Batinah Aquifer, Oman. 

Husam Baalousha and MD Shaibaz Khan

Groundwater recharge in arid and semi-arid regions is very important component to quantify, however, it is highly episodic, spatially heterogeneous, and subject to substantial uncertainty. This study estimates groundwater recharge in the South Al Batinah (SAB) Basin of northern Oman using a soil-moisture mass balance framework driven by long-term remote sensing and land surface model data. Monthly water-balance components—including precipitation, evapotranspiration, runoff, and soil moisture storage change—were derived from the FLDAS Noah land surface model for the period 1990–2023 and aggregated at the basin scale. Recharge was computed as the residual of the water balance and uncertainty was quantified using Latin Hypercube Sampling (LHS) with 5,000 realizations per month. To further constrain recharge estimates and reduce physically implausible outcomes, a Physics-Informed Bayesian Neural Network (PI-BNN) was developed, integrating mass-balance constraints, non-negativity conditions, near-dry penalties, and Bayesian uncertainty quantification within a unified probabilistic framework.

Results indicate that groundwater recharge in the SAB Basin is strongly seasonal and highly variable, with negligible recharge during most dry months and irregular recharge pulses associated with intense rainfall events in winter and mid-summer. Mean monthly recharge is generally low, with the highest values occurring in December (≈5–6 mm) and moderate recharge in February–March and July. Uncertainty analysis show that precipitation variability is the dominant control on recharge uncertainty, accounting for more than 70% of total variance during wet months, followed by evapotranspiration, surface runoff, and soil storage change. The PI-BNN produces recharge estimates consistent with the water-balance approach but with a reduced uncertainty bounds, effectively ruling out implausibly large recharge values while preserving physically realistic variability.

The results show that groundwater recharge mechanism in the SAB Basin is dominated by rare, high-intensity rainfall events. The combined use of remote sensing, stochastic sampling, and physics-informed machine learning provides a good framework for recharge estimation and uncertainty reduction in data-scarce arid environments.

How to cite: Baalousha, H. and Khan, M. S.: Physics-Informed Bayesian Neural Network for Groundwater Recharge in South Al-Batinah Aquifer, Oman., EGU General Assembly 2026, Vienna, Austria, 3–8 May 2026, EGU26-4358, https://doi.org/10.5194/egusphere-egu26-4358, 2026.

In regions with thick unsaturated zone and arid climate, the complicated subsurface hydrological processes and little water flux challenge the studies related to groundwater recharge. It is necessary to explore the recharge mechanism from different scales with multiple methods. The Loess Platea has loess deposits with mean thickness of ~100 m, and the groundwater recharge mechanism remains controversial in the past. We employed traditional monitoring of soil water and water table with multiple tracers to explore the connectivity among precipitation, soil water and groundwater. Vegetation change can substantially alter the hydrological connectivity. Because of the Grain for Green Project, the Loess Plateau has experienced large-scale vegetation change including increased vegetation cover and conversion from shallow- to deep-rooted plants. Previous studies have shown that the soil water has been depleted, however, its impacts on groundwater recharge remain unclear. We thus develop different techniques to quantify how vegetation changes influence the subsurface hydrological processes. The precipitation-soil water-groundwater connectivity is identified, and the impacts of vegetation change on the connectivity has been investigated.

How to cite: Li, Z., Wang, W., and Huang, Y.: Precipitation-soil water-groundwater connectivity under changed vegetation pattern in China's Loess Plateau, EGU General Assembly 2026, Vienna, Austria, 3–8 May 2026, EGU26-4572, https://doi.org/10.5194/egusphere-egu26-4572, 2026.

EGU26-6432 | ECS | Posters on site | HS8.1.3

The importance of 3D geological modelling for MAR planning: An example from the Po valley margin (northern Italy) 

Alessio Mainini, Luca Demurtas, Francesco Ronchetti, and Luigi Bruno

Managed Aquifer Recharge (MAR), defined as the intentional and controlled infiltration of water into aquifer, has been successfully applied to enhance groundwater quantity and quality, restore overexploited system, prevent saltwater intrusion, limit land subsidence, mitigate flooding and support other environmental benefits.  

The planning phase and the correct site selection are essential for creating a fully functional MAR system. During this phase, several parameters are usually considered, involving geomorphology, water management aspects, hydrology, groundwater quantity and quality, and aquifer characteristics. However, the latter is often limited to a few hydrogeological features of the aquifer, such as storage capacity, hydraulic conductivity, and lithology.

This study aims to highlight the importance of detailed stratigraphic knowledge of the aquifer system for MAR site selection, through a 3D geological modelling approach focused on understanding the geometries, volumes and the degree of interconnection between aquifer bodies. These data are crucial for identifying areas where subsurface conditions are most favorable for MAR development.

The 3D geological modelling approach is proposed for the Middle Pleistocene–Holocene gravelly fluvial deposits located at the margin between the uplifting Apennine chain and the subsiding Po Plain, in northern Italy. Stratigraphy of alluvial deposits of the Secchia River, one of the main tributaries of the Po River, was reconstructed through a grid of seven stratigraphic cross-sections covering an area of about 650 km², subsequently implemented in a 3D model using the software Leapfrog Geo.

The 3D geological modelling was based on stratigraphic correlations between outcrops, boreholes and water-well data down to 350 m depth, most of which are available in a regional geological database.

Results highlight a cyclic alternation of gravel bodies and mud layers. Mud layers increase in thickness away from the river-valley outlet, whereas gravel bodies show a parallel decrease in thickness and in their degree of interconnection. Moreover, an overall upward increase in thickness and degree of interconnection is observed. Gravels are poorly sorted and clast-supported, with clasts ranging from a few centimetres to half a metre, often showing imbrication. The mud layers, which locally contain thin pebble layers and carbonate concretions, may laterally transition to lens-shaped gravel or sand bodies with fining-upward trends.

Overall, the gravel bodies represent efficient groundwater reservoirs, while the muddy horizons may act as hydraulic barriers to subsurface flow. By integrating stratigraphic results with information on water table fluctuation, it is possible to identify areas where hydrogeological conditions, lithology, and aquifer-body connectivity are most favorable for MAR development.

How to cite: Mainini, A., Demurtas, L., Ronchetti, F., and Bruno, L.: The importance of 3D geological modelling for MAR planning: An example from the Po valley margin (northern Italy), EGU General Assembly 2026, Vienna, Austria, 3–8 May 2026, EGU26-6432, https://doi.org/10.5194/egusphere-egu26-6432, 2026.

This study provides a detailed investigation of emerging contaminants of concern (CECs) in surface water and groundwater within the semi-arid Mediterranean basin of Kasserine (central Tunisia, North Africa). During a monitoring campaign conducted in May 2023, 368 CECs were analysed, of which 101 compounds were detected across the sampled waters. Detection frequencies and concentrations were generally higher in surface waters, indicating that wastewater inputs to river systems constitute the main source of organic contamination. Pharmaceutical compounds were the most commonly detected class, reflecting their widespread occurrence in the aquatic environment. Hydrophobic CECs showed the highest concentrations and detection frequencies, while hydrophilic compounds, although more readily biodegradable, exhibited greater mobility and were efficiently transported towards downstream areas of the catchment. The shallow Plio-Quaternary aquifer, characterised by highly permeable sand and gravel formations, is hydraulically connected to surface waters, enabling rapid contaminant transfer from surface sources to groundwater. This geological context strongly enhances aquifer vulnerability to contamination. Based on these findings, a conceptual model is proposed to characterise aquifer sensitivity to urban pressures and to assess the potential impacts of future urbanisation on groundwater quality. The results emphasise the necessity for strengthened monitoring and management strategies to mitigate CEC contamination and safeguard water resources in vulnerable semi-arid environments.

How to cite: Hayouni, W., Pistre, S., Chkir, N., and Zouari, K.: Contaminants of Emerging Concern as Tracers of Pollution and Hydrological Processes in an Anthropized Mediterranean Basin: The Kasserine Basin (Central Tunisia), EGU General Assembly 2026, Vienna, Austria, 3–8 May 2026, EGU26-7420, https://doi.org/10.5194/egusphere-egu26-7420, 2026.

EGU26-7432 | ECS | Posters on site | HS8.1.3

Hydrodynamic functioning of a Mediterranean multi-aquifer system inferred from isotopic and hydrochemical tracers 

Khaoula Khaoula KHMILA, Rim Trabelsi, Séverin Pistre, and Kamel Zouari

Groundwater resources in Mediterranean semi-arid basins are increasingly challenged by climate variability and agricultural intensification, yet recharge processes in multi-aquifer systems remain insufficiently constrained. This contribution presents research from Central-Western Tunisia focusing on the Sidi Marzoug–Sbiba basin, a strategic agricultural area dependent on cascading Cretaceous, Miocene, and Mio-Plio-Quaternary aquifers.

A multi-tracer approach was implemented combining piezometric mapping, major-ion geochemistry, and stable and radioactive isotopes (δ¹⁸O, δ²H, ³H, ¹⁴C). The data reveal a coherent regional flow from SW highlands toward the NE Sbiba plain, controlled by major faults and fractured outcrops that enhance lateral hydraulic connectivity. The upstream sector stores isotopically young waters with homogeneous compositions, indicating active meteoric recharge originating from relatively high elevations during the wet season (November–April). Downstream, decreasing ³H and ¹⁴C values together with higher TDS and sulfate-rich facies reflect older, slowly circulating groundwater affected by dissolution of surrounding gypsum-bearing formations and mixing with evaporated surface water from dams. Localized nitrate levels exceeding the 50 mg/L WHO guideline highlight emerging contamination risks despite the overall dominance of geogenic salinization.

These findings demonstrate how complementary tools can be jointly used to reduce uncertainty in recharge assessment of complex Mediterranean semi-arid aquifers and to guide sustainable management and monitoring priorities.

How to cite: Khaoula KHMILA, K., Trabelsi, R., Pistre, S., and Zouari, K.: Hydrodynamic functioning of a Mediterranean multi-aquifer system inferred from isotopic and hydrochemical tracers, EGU General Assembly 2026, Vienna, Austria, 3–8 May 2026, EGU26-7432, https://doi.org/10.5194/egusphere-egu26-7432, 2026.

EGU26-7718 | ECS | Orals | HS8.1.3

Integrating a New Groundwater Module into ORCHIDEE: Regional Effects of Stream Meandering on Groundwater Recharge 

Siméon Lang, Marine Lanet, Alain Dupuy, and Laurent Li

As climate change exacerbates the frequency and intensity of hydrological extremes, the restoration of natural river dynamics—such as stream meandering—has emerged as a promising nature-based solution (NBS) to enhance water retention, reduce flood risks, and sustain low flows. While local experiments demonstrate the benefits of meandering for ecosystem resilience, their large-scale impacts on groundwater recharge and regional hydrology remain poorly understood.
Within the European NBRACER project, we explore the potential of upscaling stream meandering across France using the IPSL land surface model ORCHIDEE. However, the model’s initial groundwater representation lackscritical processes, including horizontal flow between grid cells and feedbacks between groundwater, soil moisture, and rivers. To address these limitations, we implemented an enhanced groundwater scheme [1] incorporating lateral exchanges and retroactive river-aquifer coupling. Using a regional configuration over continental France and the high-resolution hydrogeological dataset BDLISA, we simulate the hydrological effects of increased river length on groundwater recharge and low flows.
This study highlights the technical challenges of integrating subgrid-scale processes in large-scale simulations and provides insights into the scalability
of stream meandering as an NBS. Our findings aim to inform water management strategies and climate adaptation policies by assessing the broader
hydrological impacts of river restoration.

[1] Vergnes, J.-P., Decharme, B., Alkama, R., Martin, E., Habets, F., & Douville, H. (2012). A simple groundwater scheme for hydrological and climate applications: Description and offline evaluation over France. Journal of Hydrometeorology, 13(4), 1149-1171. https://doi.org/10.1175/JHM-D-11-0105.1

How to cite: Lang, S., Lanet, M., Dupuy, A., and Li, L.: Integrating a New Groundwater Module into ORCHIDEE: Regional Effects of Stream Meandering on Groundwater Recharge, EGU General Assembly 2026, Vienna, Austria, 3–8 May 2026, EGU26-7718, https://doi.org/10.5194/egusphere-egu26-7718, 2026.

EGU26-9991 | Posters on site | HS8.1.3

Comprehensive evaluation of genetic fecal markers and pharmaceutical tracers along the full municipal (=human) fecal pollution gradient for water quality monitoring and management of tomorrow 

Rita Linke, Sophia Steinbacher, Domenico Savio, Martin Karl, Wolfgang Kandler, Alexander Kirschner, Regina Sommer, and Andreas Farnleitner

Fecal water pollution is a global problem, as it is associated with risks to human health. For more than 100 years now, so-called fecal indicator bacteria (FIB), usually E. coli and intestinal enterococci, have been used to assess microbiological water quality. However, as these bacteria are ubiquitous in the digestive tract of humans and animals, the identification of the contamination source, which plays an important role in risk assessment, is impossible. Since the early 2000s, aided by rapid advances in molecular biology methods, techniques have been developed that allow targeted source detection via host-associated markers. These MST (microbial source tracking) methods are increasingly used for the analysis and modeling of microbial hazards and risks to support decision-making in water management. In addition, the feasibility of organic micropollutants for risk assessment (chemical source tracking) has been discussed. However, there are currently no comprehensive studies that have systematically compared the performance of these parameters along the full fecal pollution gradient (groundwater to untreated wastewater). In this study, a unique sample set was compiled and examined, covering the entire fecal contamination gradient for the first time. It included untreated and conventionally treated municipal wastewaters, various surface waters, and a broad set of porous groundwater resources covering a gradient from non-influenced (i.e., deep wells) to surface-influenced resources (i.e., shallow wells).

The results showed that the human-associated contamination gradient could be accurately represented using cultivation-based FIB markers (E. coli, enterococci). No FIB were detected in deep wells or wells, sporadic detections were encountered in surface influenced wells and continuous detections in surface waters and raw and treated wastewater. FIBs determined by molecular techniques (qPCR) corresponded well with those of the cultivation-based methods. All genetic markers used (human-associated: BacHum, HF183/BacR287, wastewater associated: Lachno3) also accurately represented the gradient, but the concentrations detected were higher than those for the classical FIB. This is due to their significantly higher concentrations in feces and represents a clear advantage for detection in the environment. In contrast, the mitochondrial marker (mtDNA_hum) appeared in significantly lower concentrations compared to the bacterial markers. Of the 37 investigated chemical substances, it was mainly small traces of artificial sweeteners that could be detected even in some deep wells. In rivers, treated and raw wastewater nearly all determined compounds (predominantly pharmaceuticals) were detected. Regarding concentrations of these tracers the pollution gradient also became apparent. To summarize, applicable genetic MST markers follow the same gradient as standardized FIB and are equally sensitive (no false positives in no-influenced habitats). They exhibit comparable sample limits of detection in equivalent sample volumes, but with the advantage that they can directly track the municipal wastewater path (source specific detection of human fecal pollution). This makes them an ideal complement to the FIB approach. Chemical tracers can be a useful aid, but they must be chosen carefully because, unlike genetic MST markers, they do not occur ubiquitously in municipal raw sewage (primary sources of pollution). Regional differences due to the use of different therapeutic agents play a major role.

How to cite: Linke, R., Steinbacher, S., Savio, D., Karl, M., Kandler, W., Kirschner, A., Sommer, R., and Farnleitner, A.: Comprehensive evaluation of genetic fecal markers and pharmaceutical tracers along the full municipal (=human) fecal pollution gradient for water quality monitoring and management of tomorrow, EGU General Assembly 2026, Vienna, Austria, 3–8 May 2026, EGU26-9991, https://doi.org/10.5194/egusphere-egu26-9991, 2026.

EGU26-10816 | Orals | HS8.1.3

How salinity affects drinking water biofiltration of anaerobic brackish aquifer recharge water 

Doris van Halem, Suzanne van der Poel, Mark van Loosdrecht, and Michele Laureni

Managed aquifer recharge has been the primary source for drinking water for decades in the most populated, western part of the Netherlands. In the coastal dune areas, pre-treated surface water is infiltrated and, after a residence time of months, abstracted through wells or open channels. Due to increasing drinking water demands and extended periods of drought, this sustainable water source is under pressure.

To increase water availability, research is ongoing to enlarge the subsurface freshwater lens in the dunes through extraction of anaerobic brackish groundwater at the fresh-saline interface. Consequently, the freshwater lens will be pulled downward, with the added benefit that the abstracted brackish groundwater itself can serve as a source for drinking. This new drinking water source, however, contains elevated levels of salinity, as well as ammonium (NH4+) and manganese (Mn2+) above drinking water standards, which thus needs treatment.

A sustainable treatment method for NH4+ and Mn2+ is aeration followed by biofiltration, to be combined with reverse osmosis for salts removal. There is, however, only limited knowledge on biofiltration of saline waters, hampering its uptake by water utilities. 

In this study we therefore investigated the growth of NH4+ and nitrite (NO2-) oxidizing bacteria in aerated biofilters under fresh and saline conditions, to understand their conversion kinetics, interaction with Mn2+ oxidizing bacteria and metal reaction products.

Results demonstrated that under saline conditions, both nitritation and nitration did not develop spontaneously. After inoculation, growth of NO2- oxidizers was extremely slow and more sensitive to salinity than NH4+ oxidation. Upon the onset of NO2- production, immediate Mn2+ release was observed, presumably caused by chemical reduction of Mn oxides present on the filter sand grains.

These results suggest that salinity strongly constrains nitrification and alters manganese cycling, which must be considered when implementing biofiltration for anaerobic brackish groundwater as a drinking water source. Furthermore, this insight helps to understand the fate of NH4+ and Mn2+ in natural saline environments where they interact with NO2-oxidizing bacteria, including coastal marshes and ocean sediments.

How to cite: van Halem, D., van der Poel, S., van Loosdrecht, M., and Laureni, M.: How salinity affects drinking water biofiltration of anaerobic brackish aquifer recharge water, EGU General Assembly 2026, Vienna, Austria, 3–8 May 2026, EGU26-10816, https://doi.org/10.5194/egusphere-egu26-10816, 2026.

EGU26-11118 | Orals | HS8.1.3

A large-scale tracer test in a SAT system verifying residence time of effluents in the subsurface 

Daniel Kurtzman, German Rudnik, Ido Nitsan, Sigal Brody, Ran Gabay, and Ido Negev

The largest managed aquifer recharge operation in Israel is the Shafdan system where ~ 130*106 m3 of secondary effluents percolate from surface and recovered through ~ 150 wells annually, to be used for unlimited irrigation (i.e. as freshwater).  The residence time of effluents in the subsurface, during their passage in a Soil Aquifer Treatment (SAT) system, from the infiltration pond to the pumping wells' screens is a concern of health regulators. Therefore, a large-scale tracer test in a segment of the Shafdan SAT system was initiated in July 2024 and still ongoing. Various estimates of the residence time were done during the >40 years of operation of the Shafdan SAT, nevertheless, this is the first time a tracer test is performed, to directly derive travel-time distributions from soil surface to the first ring of recovery wells (200-500 m laterally, 50-80 m vertically).

A subgroup of 4 infiltration ponds with a total area of 5.6 hectare was chosen for spread of tracers. The first ring of working production wells surrounding these infiltration basins includes 6 wells. Four observation wells at smaller distances than 200m from the infiltration basins were also used for monitoring. Two tracers were applied: the anion Bromide (Br-) and the fluorescent organic salt known as Uranine (Na-fluorescein). Additionally, the cheaply monitored water characteristic, electrical conductivity (EC), is used as a precursor for the tracers. A total of 47 tons of the 3 salts NaBr, NaCl and CaCl2 (introducing Br-, elevating EC and keeping SAR low) and 75 kg of Uranine were spread evenly over the 5.6 ha of the infiltration pond's surface using a mechanized broadcast fertilizer.

Uranine is still observed in pumped water of this sandy aquifer 18 months after application. Nevertheless, it was retarded in comparison to Br- by ~10 days in the closest observation well and by 30-115 days in the furthest production wells. First arrival (Br-) in a production well was observed 164 days after tracer application at surface, easing health regulators concern (90 days). EC was found correlated good with Br- in most production wells, but not in observation wells. Only ~ 1% of tracers' mass was recovered in wells after 280 days, and ~ 10% after 400 days. The main conclusion so far is residence time in sub surface is long enough, mixing and dilution of effluents in the recovery wells is very high enhancing the effectiveness of the physical and bio-chemical processes of the SAT system. Stay tuned for more results in May at Vienna.  


How to cite: Kurtzman, D., Rudnik, G., Nitsan, I., Brody, S., Gabay, R., and Negev, I.: A large-scale tracer test in a SAT system verifying residence time of effluents in the subsurface, EGU General Assembly 2026, Vienna, Austria, 3–8 May 2026, EGU26-11118, https://doi.org/10.5194/egusphere-egu26-11118, 2026.

EGU26-12097 | Posters on site | HS8.1.3

Groundwater Replenishment through Aquifer Recharge with Treated Wastewater: Enhancing  Water Security in Arid and Semi-Arid Regions 

Mohammed Benaafi, Zehra Fatima, Bassam Tawabini, Sherif Hanifi, and Abdullah Basaleh

Groundwater resources worldwide are under increasing stress, particularly in arid and semi-arid regions. Urbanisation, intensive agriculture, and industrial development place heavy pressure on the fossil groundwater, resulting in depletion of major aquifers worldwide, with more severe consequences in arid regions such as Saudi Arabia. This study aims to evaluate the feasibility of Treated Wastewater (TWW) for sustainable managed aquifer recharge (MAR) in the eastern coastal region of Saudi Arabia using an experimental approach. Twelve 1D MAR experiments were conducted to assess the efficiencies of various treated wastewater effluents for groundwater replenishment in the coastal sandy aquifer in the eastern region of Saudi Arabia.  Three recharge scenarios (low, medium, and high) and two types of TWW (tertiary and secondary) were evaluated to optimise the MAR system. Clogging materials and water quality change were evaluated to determine the optimal recharge scenario. The results showed that the tertiary treated wastewater with low recharge scenarios was the optimal case with minimal impact on groundwater quality and aquifer integrity. In contrast, the high recharge scenarios with either tertiary or secondary treated wastewater showed a significant reduction in the hydraulic performance of aquifer materials, thus, the efficiency of the recharge system. The study found that the tertiary treated wastewater from the eastern region of Saudi Arabia is suitable for aquifer recharge with minimal pretreatment to remove nutrients, ions, and emerging contaminants (e.g., microplastics). The study findings provide insights into effective water resource management strategies that reduce water scarcity risks and strengthen long-term water security in arid environments. Moreover, the study demonstrated that implementing MAR with TWW can reduce non-renewable groundwater withdrawals by up to 30% in eastern Saudi Arabia, mitigating aquifer depletion and ensuring a more sustainable water supply.

How to cite: Benaafi, M., Fatima, Z., Tawabini, B., Hanifi, S., and Basaleh, A.: Groundwater Replenishment through Aquifer Recharge with Treated Wastewater: Enhancing  Water Security in Arid and Semi-Arid Regions, EGU General Assembly 2026, Vienna, Austria, 3–8 May 2026, EGU26-12097, https://doi.org/10.5194/egusphere-egu26-12097, 2026.

EGU26-12489 | ECS | Orals | HS8.1.3

Pilot site of a MAR injection trench in Northern Italy: preliminary lessons learned from field monitoring and modelling 

Alessia Amendola, Maria Adele Taramasso, Filippo Miraldi, Lorenzo Gallia, Nicolò Giordano, Marco Coha, Alessandro Casasso, Rajandrea Sethi, and Tiziana Tosco

The Cuneo Plain, located in Northwestern Italy, hosts a vast unconfined alluvial aquifer mainly exploited for agrozootechnical activities. Besides conventional pumping wells, groundwater is conveyed to the irrigation network through lowland springs, locally known as fontanili. These drainage trenches were excavated since the Middle Ages to reclaim marshy lands by intercepting the shallow aquifer and lowering its water table. In recent years, some lowland springs have run dry during severe summer droughts, fostering the experimentation of Managed Aquifer Recharge (MAR) to recover their former discharges.

As a result, a pilot injection trench consisting of a 100 m long perforated pipe enables the infiltration of the surplus surface water that is circulated in the canals off the irrigation season. After a few months of testing, the first results regarding injected volumes and aquifer response are available. Preliminary findings highlight both the benefits and downsides associated to the high hydraulic conductivity of the studied aquifer. In particular, the time-lag in water table rise and the rapid dissipation of injection effects are key parameters for planning sustainable and effective injection strategies. Moreover, the spatial distribution of monitoring wells and their proximity to the MAR infrastructure proved, in this case, crucial to detect the water table rise and its spatial extent.

A monitoring network is currently being developed to enable real time visualization of data from monitoring wells, water levels in the lowland springs and infiltrated volumes. This is particularly useful to verify proper operation of the injection trench and implement alert systems able to identify and communicate malfunctions (e.g. clogging of the inlet), allowing prompt intervention.

Finally, a groundwater flow model has been developed for multiple purposes: to better interpret the interaction between the lowland spring and the aquifer; to validate the effects of the artificial recharge; to plan injection times based on the spring response time lag; and, ultimately, to explore possible developments in the MAR injection method. The model simulates the main hydrogeological features of the study area: the lowland spring, the surrounding streams, and the artificial recharge. The model was calibrated based on a piezometric map produced in October 2025 and having high spatial resolution thanks to the engagement of citizens from surrounding municipalities, who granted access to their private wells, providing dense observation points and demonstrating the effectiveness of citizen science initiatives.

How to cite: Amendola, A., Taramasso, M. A., Miraldi, F., Gallia, L., Giordano, N., Coha, M., Casasso, A., Sethi, R., and Tosco, T.: Pilot site of a MAR injection trench in Northern Italy: preliminary lessons learned from field monitoring and modelling, EGU General Assembly 2026, Vienna, Austria, 3–8 May 2026, EGU26-12489, https://doi.org/10.5194/egusphere-egu26-12489, 2026.

EGU26-13115 | ECS | Posters on site | HS8.1.3

Interaction between nitrate and clay during an Aquifer Storage and Recovery cycle 

Dalal Sadeqi and Wouter Buytaert

Aquifer storage and recovery (ASR) is used to sustain the quality and quantity of groundwater by means of the injection of high-quality water. However, these systems face challenges such as physical clogging and poor recovered water quality. This study investigates the outcomes of injecting a low ionic strength water source into a clastic nitrate contaminated aquifer. The investigation is conducted by using a column experiment. We implemented six runs, representing a combination of two soil mixtures (loamy sand with clay content of 10% and 12% respectively), and three nitrate concentration in the injected groundwater (resp. 71, 114 and 187 mg/l).


Each of the six runs consists of two phases: in the first phase the contaminated groundwater flows through the soil column for an average of 13.8 pore volume units, which followed by a phase in which the low ionic strength water flows through for an average of 12.5 pore volume units. The results of the experiment indicate that the hydraulic conductivity decreases from an average of 0.31 cm/min to 0.25 cm/min after the introduction of the low ionic strength water. The nitrate breakthrough curves display a delay in the equilibrium which can be explained by dispersion and the creation of soil immobile zones.


Subsequently, these breakthrough curves are analysed using HYDRUS 1D with physical nonequilibrium transport model to determine the dispersivity, the immobile water content and the mass transfer coefficient. Our finding highlight that these parameters generally increased after the introduction of the low ionic strength water. Also, these parameters tended to increase, on average when the soil’s clay content increased. Our results enable the prediction of change in the recovery efficiency of the ASR systems.

How to cite: Sadeqi, D. and Buytaert, W.: Interaction between nitrate and clay during an Aquifer Storage and Recovery cycle, EGU General Assembly 2026, Vienna, Austria, 3–8 May 2026, EGU26-13115, https://doi.org/10.5194/egusphere-egu26-13115, 2026.

EGU26-13175 | ECS | Orals | HS8.1.3

Leveraging irrigation–groundwater interactions for climate change adaptation: results from an Ag-MAR application in a complex agri-urban setting 

Paolo Colombo, Claudia Medina Montecinos, Pietro Mazzon, Rachele Eliana Riva, Enrico Weber, Veronica Piuri, and Luca Alberti

Agricultural managed aquifer recharge (Ag-MAR) harnesses agricultural settings and practices to infiltrate additional water replenishing groundwater systems. Can this method be used as an adaptation measure to current and future climate changes, posing a threat to water resources availability worldwide? Which are its requirements and limitations in an agri-urban context, characterized by a coexistence and sometimes a conflict of ecosystems and human activities with their needs and risks?

To address these questions, a two-year field experiment was conducted near Milan (Northern Italy), a densely urbanized area that still hosts intensive agricultural activities. In the area, and throughout the Po plain, summer crop water demand is met through surface irrigation, diverting river and stream water via a capillary network of canals. By providing additional water to the aquifer during autumn and winter, periods of high surface water availability, the enhanced groundwater reserves could be managed to cover the demand during hydrological droughts, avoiding the need for new reservoirs and their associated impacts on the water cycle.

The existing canal network served as the infrastructure for the experiment: during the 2023-2024 and 2024-2025 winters, water was diverted into canals and onto agricultural fields with the collaboration of local farmers, while groundwater levels and groundwater-dependent ecosystems were monitored. The collected data was then utilized to build a numerical groundwater flow model (MODFLOW) and an agro-hydrological model (IdrAgra), capable of estimating groundwater recharge through the simulation of irrigation management and irrigation-groundwater interactions, even under climate change conditions. Outputs (precipitation, temperature, humidity) from three regional circulation models were downscaled to generate a cascade of scenarios: future surface water availability and irrigation diversion, groundwater recharge, and groundwater levels. Multiple Ag-MAR configurations were then tested to assess their effectiveness in increasing groundwater storage and water table levels, while balancing infiltration targets with canal system capacity and minimizing risks to underground infrastructure.

We found that the spatial distribution of the irrigated fields plays a key role in the net groundwater storage increase, since groundwater-dependent ecosystems (lowland springs locally known as fontanili) scattered around the area can drain part of the additional recharge. Despite the losses, the measure increases the water available for the following summer months, enabling emergency withdrawals in case of drought. Results indicate that, even using only the volumes applied during the field tests, well below the system’s full potential, Ag-MAR could have supplied approximately 20% of the unmet water demand recorded in the study area during the 2022 drought.  This contribution increases under the scenarios considered. These findings provide a basis for regional authorities and local communities to develop long-term strategies for implementing Ag-MAR as an aquifer-based climate change adaptation measure.

This research was carried out as a Pilot Action of the MAURICE Interreg project (CE0100184).

How to cite: Colombo, P., Medina Montecinos, C., Mazzon, P., Riva, R. E., Weber, E., Piuri, V., and Alberti, L.: Leveraging irrigation–groundwater interactions for climate change adaptation: results from an Ag-MAR application in a complex agri-urban setting, EGU General Assembly 2026, Vienna, Austria, 3–8 May 2026, EGU26-13175, https://doi.org/10.5194/egusphere-egu26-13175, 2026.

In a context of intensified pressures on the groundwater resource, managed aquifer recharge (MAR) has emerged as a strategic mean to enhance water security and strengthen the resilience of groundwater systems under changing climatic conditions. MAR encompasses a range of techniques for intentionally enhancing aquifer recharge using various kind of source water through infiltration basins, injection wells, induced riverbank filtration, and other engineered systems. When appropriately designed and operated, MAR can maintain groundwater levels, increasing storage, improve water quality, mitigate land subsidence, combat seawater encroachment in coastal aquifers, and sustain groundwater-dependent ecosystems. These often multifunctional benefits position MAR at the interface between climate change adaptation, integrated water resources management, and ecosystem conservation.

Still several issues prevent MAR systems to be adopted at full scale. Among the most relevant, governance and regulatory barriers discourage investment and slow project approval and scaling. MAR projects often fall between surface water and groundwater regulatory frameworks, leading to unclear institutional responsibility. Permitting/authorisation processes are frequently complex, fragmented, poorly aligned with MAR practices, or lacking. Even if MAR construction costs are relatively low, compared to traditional water infrastructures, the benefits deriving from MAR are less visible and often long-term. Furthermore, the lack of funding mechanisms, especially in Europe, limits expansion beyond pilot or demonstration projects. Concerns persist around risks such as groundwater contamination, and even in cases when risks are technically manageable (as for many other types of waterworks), these perceived risks remain a major obstacle to large-scale adoption. Finally, social acceptance and stakeholder understanding of MAR is often low, particularly when reclaimed water is proposed for recharge.

On the other hand, recent years have seen a surge in pilot and demonstration schemes and the regulatory point view started gaining attention. Moreover, the need for low-carbon and low-cost solutions may sustain the widespread adoption of MAR schemes. Two more elements may drive the change. The first one is the likely possibility that MAR qualifies as a nature-based solution. Yet, many MAR schemes mimic natural processes to enhance recharge. However, the debated question now relates to the fact whether MAR infrastructures may directly provide net biodiversity gains. Achieving the biodiversity gain, thanks to the geoengineered infrastructure, by, i.e., supporting wetland ecosystems, providing more water to riverine ecosystems during period of low-flow, would constitute a positive value, and likely  position MAR waterworks in a prominent position respect to other options. Second, so called Agricultural-MAR may constitute a cornerstone for scaling up at watershed level. To this, significant discussion  and capacity building need to be set with the agricultural world. Relevant scientific questions need to be addressed, such as those related to potential aquifer contamination by nutrients and plant protection products/pesticides, and the impact on crops produced by the recharge techniques.

Advancing MAR from niche applications to a mainstream water management practice will require a shift from project-by-project implementation toward coordinated, cross-sectoral strategies. Embedding MAR within broader climate adaptation, land-use, and agricultural policies, while strengthening the science–policy interface, can help translate its conceptual potential into measurable and durable benefits.

How to cite: Rossetto, R.: Managed Aquifer Recharge: Bridging Climate Change, Water Security, and Ecosystem Conservation, EGU General Assembly 2026, Vienna, Austria, 3–8 May 2026, EGU26-15100, https://doi.org/10.5194/egusphere-egu26-15100, 2026.

EGU26-16700 | ECS | Orals | HS8.1.3

Sequential managed aquifer recharge technology (SMART) for enhancing biodegradation of trace organic chemicals in a heterogeneous aquifer  

Felicia Linke, Jonas Aniol, Magdalena A. Knabl, Alexander Sperlich, Josefine Filter, Sofiene Zerelli, Anne König, Regina Gnirss, Janek Greskowiak, and Jörg E. Drewes

Managed aquifer recharge (MAR) can improve water availability by enhancing storage, and water quality through biodegradation and filtration processes. Impaired water sources such as WWTP effluent often contain trace organic chemicals (TOrCs) which may have adverse effects on the environment and human health. Removing TOrCs using activated carbon or ozonation is costly and energy intensive. Instead, biodegradation of TOrCs in the aquifer can be enhanced by changing the environmental conditions e.g. via sequential managed aquifer recharge technology (SMART). SMART consists of an initial infiltration step (e.g., bank filtration) followed by an aeration step and subsequent infiltration step under oxic and carbon limited conditions. This study aims to implement SMART in a heterogeneous aquifer and demonstrate the attenuation of TOrCs.  

SMART was implemented on a demonstration scale at a former waterworks site in Berlin to produce raw water which could potentially be used for later drinking water production. Impaired bank filtrate is aerated and iron and manganese are removed. Then, the water is infiltrated into a 25 m long, 1 m wide, 7 m deep infiltration trench filled with gravel. Two production wells located 25 m away from the trench establish a controlled, homogeneous flow field. Another production well 60 m away hydraulically shields the system. The pumping regime extracts more water (approx. 24 m³/h) than is infiltrated (10 m³/h) to comply with permitting requirements. Hydraulic retention time confirmed by tracer tests is approximately seven days from the trench to the first two wells. Groundwater monitoring wells provide online monitoring data at different depths (groundwater level, electrical conductivity, temperature, and dissolved oxygen (DO)). Due to operational constraints, drinking water was infiltrated for approximately one year, facilitating the establishment of plug-flow conditions and an oxic zone (>1 mg/L of DO) in the subsurface. Pre-treated bank filtrate has been infiltrated since February 2024. Additionally, hydraulic and reactive transport models of the site were created to understand and confirm subsurface processes.

Trace organic contaminants were removed in the flow field and can be categorized into different groups. Persistent compounds such as candesartan showed limited biodegradation potential (removal of less than 30 %). A group of easily degradable and volatile substances was already removed during pre-treatment under oxic conditions. The third group of redox-sensitive compounds such as diclofenac were better removed under the oxic and carbon-limited conditions of SMART with removal between 30 % and up to 80 % from the influent to the monitoring well located 20 m downstream of the trench.

This strong attenuation demonstrates the potential of enhancing biodegradation in a heterogeneous aquifer by actively managing the in-situ redox regime to achieve sustainable TOrCs biodegradation. The demo-scale system is currently in operation and open research questions are being investigated, such as how the microbiome adapts and what is needed for a transfer to new locations. Depending on the local conditions, SMART needs to be combined with further advanced drinking water treatment steps to ensure sufficient TOrCs removal. Overall, this approach is a promising solution to implement water reuse locally.

How to cite: Linke, F., Aniol, J., Knabl, M. A., Sperlich, A., Filter, J., Zerelli, S., König, A., Gnirss, R., Greskowiak, J., and Drewes, J. E.: Sequential managed aquifer recharge technology (SMART) for enhancing biodegradation of trace organic chemicals in a heterogeneous aquifer , EGU General Assembly 2026, Vienna, Austria, 3–8 May 2026, EGU26-16700, https://doi.org/10.5194/egusphere-egu26-16700, 2026.

EGU26-18773 | ECS | Posters on site | HS8.1.3

Hydrological controls on greenhouse gas fluxes and soil carbon quality in a Belgian floodplain 

Nicolas Kovacs, Jens Leifeld, Karen Vancampenhout, Gert Verstraeten, Gilles Colinet, Bernard Longdoz, Suzanna Lettens, Maud Raman, and Jeroen Meersmans

Floodplain hydrology regulates soil carbon dynamics and is a key factor in ecosystem restoration strategies for climate regulation. In Belgium, floodplains have been extensively modified by drainage and land-use change, yet the combined effects of hydrology, land use, and soil carbon quality on greenhouse gas (GHG) fluxes remain unclear. In the Dijle valley, located in central Belgium within the Belgian loess belt, we conducted a comprehensive study combining in situ GHG flux measurements with soil carbon quality characterization.

We measured soil carbon dioxide (CO2) and methane (CH4) fluxes during the wettest year on record across three hydrological zones: (i) a moderately drained floodplain with fluctuating water table (Fluctuating WT), (ii) a poorly drained floodplain with shallower water table (High WT), and (iii) freely drained soils of the adjacent plateau. Representative land uses included forest, grassland, cropland, and marsh. Temperature sensitivity (Q10) varied with soil moisture and water regime: under Fluctuating WT, Q10 decreased with increasing moisture, whereas under High WT, Q10 increased as moisture declined. CH4 contributed substantially to total GHG emissions only in High WT sites, though its relative impact declined under very wet conditions. Maintaining water tables below but close to the soil surface through rewetting could therefore reduce soil CO2 emissions and their temperature sensitivity, primarily by imposing environmental constraints on microbial activity. This highlights the importance of floodplain rewetting as a management strategy for climate regulation through the control of soil GHG emissions.

We also explored soil carbon quality and its possible relationship to C-specific basal respiration (R10, µg CO2-C gC-1 h-1). Soil samples (0–10 cm) were analyzed for organic carbon (C), nitrogen (N), and C/N ratio. Thermal properties were assessed using differential scanning calorimetry (DSC), including Energy Density (ED, J mgC-1) and T50 (temperature at 50% energy release). ED varied along the hydrological gradient (High WT < Fluctuating WT < Plateau), while T50 followed High WT < Plateau < Fluctuating WT. In addition, R10 was negatively correlated with C/N, slightly positively correlated with ED, but not with T50. These patterns suggest that hydrology shapes the energetic quality and thermal stability of soil carbon, which may partially explain variations in respiration.

Combining field flux measurements with energetic characterization provides a novel perspective on links between hydrology, land use, and soil carbon quality. Appropriate floodplain management, including rewetting, can enhance their contribution to climate regulation by limiting soil GHG emissions and influencing carbon cycling.

How to cite: Kovacs, N., Leifeld, J., Vancampenhout, K., Verstraeten, G., Colinet, G., Longdoz, B., Lettens, S., Raman, M., and Meersmans, J.: Hydrological controls on greenhouse gas fluxes and soil carbon quality in a Belgian floodplain, EGU General Assembly 2026, Vienna, Austria, 3–8 May 2026, EGU26-18773, https://doi.org/10.5194/egusphere-egu26-18773, 2026.

Drought is the primary ecological-hydrological stress in arid regions, and its impacts are often not confined to a single hydrological component but are transmitted through various land surface system components, leading to cumulative effects. To explore the continuous coupling between different types of droughts and their differential propagation mechanisms across various ecosystems, this study focuses on the Three-North region. Based on the Standardized Precipitation Evapotranspiration Index (SPEI), Standardized Runoff Index (SRI), Surface Soil Moisture Drought Index (SMDIs), Root-zone Soil Moisture Drought Index (SMDIrz), and Groundwater Drought Index (SGI), the study introduces Convergent Cross Mapping (CCM) to systematically characterize the causal coupling relationships between different types of droughts and their propagation structural characteristics across different vegetation types.

The results show that significant continuous coupling relationships exist between different types of droughts, generally presenting the structural pattern of SPEI ↔ SRI ↔ SMDIs ↔ SMDIrz ↔ SGI. This indicates that drought signals in the “meteorological—runoff—soil—root-zone—groundwater” system do not evolve in isolation but are continuously transmitted through various components of the land surface system, forming a typical long-chain drought propagation process. At the regional level, root-zone soil moisture plays the most crucial role in the drought propagation network. It not only significantly responds to upstream meteorological and hydrological droughts but also has an important modulation effect on groundwater drought, acting as a key intermediary between surface hydrological processes and the groundwater system. Significant differences in drought propagation structures exist under different vegetation types: in forest and shrubland areas, the causal effect of runoff drought on root-zone soil moisture drought is the strongest, reflecting the critical control of deep moisture processes on plant-available water. The coupling intensity is relatively weak in grassland systems, exhibiting drought dynamics with rapid response and weak memory. In areas with sparse vegetation and bare soil, there is a high degree of bidirectional coupling between runoff drought and surface soil moisture drought, indicating that the drought process is mainly driven by surface hydrological processes.

How to cite: Liu, X.: Decoding Drought: The Full-Chain Propagation Process from Atmosphere to Groundwater in Arid Ecosystems, EGU General Assembly 2026, Vienna, Austria, 3–8 May 2026, EGU26-19413, https://doi.org/10.5194/egusphere-egu26-19413, 2026.

EGU26-20313 | Posters on site | HS8.1.3

Reframing Managed Aquifer Recharge for Conjunctive Flood-Groundwater Resilience 

Shaonli Mishra, Sarth Dubey, Vivek Kapadia, and Udit Bhatia

Groundwater depletion and Flooding are increasingly co-located problems: flood risks rise with more frequent and intense rainfall extremes, while underlying aquifers decline due to persistent abstraction. Managed Aquifer Recharge (MAR) offers a pathway to improve groundwater sustainability, yet site selection is commonly guided by recharge volume and subsurface feasibility, with limited quantification of how recharge operations influence surface inundation during flood events. This separation constrains conjunctive strategies that can simultaneously relieve flood impacts and support aquifer recovery. 

This study explores a conjunctive planning approach that redesigns MAR from a basin-centric focus on recharge maximisation to an inundation-centric focus on minimising flood impact. We employ the integrated MIKE SHE modeling system to simulate rainfall-runoff, overland flow routing, unsaturated-zone processes, and groundwater flow in a single dynamical representation. The proposed framework systematically searches where recharge structures could be placed to intercept floodwater and reduce overall flood damages in high-impact locations, while remaining consistent with hydrogeological feasibility and operational constraints. Historical flood events are used as scenario datasets for representative Indian basins, allowing event-based stress testing of candidate locations under realistic forcing.

The simulations show that MAR benefits are highly site- and event-dependent: some locations yield meaningful reductions in local inundation while contributing to groundwater replenishment, whereas others primarily increase subsurface storage with limited flood response. Strategically identified recharge zones produce measurable reductions in peak flood depths in localized high-risk areas, while simultaneously yielding substantial increases in groundwater recharge relative to baseline conditions. The findings underscore the value of reframing MAR to evaluate recharge interventions in support of flood resilience and long-term water security.

How to cite: Mishra, S., Dubey, S., Kapadia, V., and Bhatia, U.: Reframing Managed Aquifer Recharge for Conjunctive Flood-Groundwater Resilience, EGU General Assembly 2026, Vienna, Austria, 3–8 May 2026, EGU26-20313, https://doi.org/10.5194/egusphere-egu26-20313, 2026.

EGU26-21772 | ECS | Posters on site | HS8.1.3

Thermal Heterogeneity and Habitat Complexity as Drivers of Brown Trout Resilience in Boreal River Restoration 

Seble Hailemariam, Hannu Marttila, Pauliina Louhi, and Ali Torabi Haghighi

Restoration strategies in boreal rivers should aim to enhance ecosystem resilience to climate change. This requires better understanding of fish habitat preferences, protection of thermal refuges, and mitigation of habitat loss.

In TRIWA LIFE-project, we examined the role of ground water in boreal rivers for brown trout (Salmo trutta). The streams surveyed varied in ecological status, ranging from near natural to restored and channelized conditions. To assess trout habitat, use and availability, we employed innovative methods including thermal infrared imaging, machine learning, alongside electrofishing surveys.

Preliminary results indicate that trout were more abundant in stream sections characterized by higher sinuosity and the presence of groundwater. Machine-learning models further revealed that trout occurrence was strongly associated with thermal conditions and habitat structure, with temperature metrics, coarse gravel substrate, water depth, and flow velocity emerging as the most influential predictors. Model performance was high (AUC > 0.9), indicating robust discrimination of suitable habitats and highlighting the combined importance of thermal heterogeneity and geomorphological complexity for trout habitat use.

How to cite: Hailemariam, S., Marttila, H., Louhi, P., and Torabi Haghighi, A.: Thermal Heterogeneity and Habitat Complexity as Drivers of Brown Trout Resilience in Boreal River Restoration, EGU General Assembly 2026, Vienna, Austria, 3–8 May 2026, EGU26-21772, https://doi.org/10.5194/egusphere-egu26-21772, 2026.

Ecological restoration and managed aquifer recharge (MAR) are widely promoted to enhance groundwater resources and buffer hydrological extremes, yet quantitative evidence on their effectiveness and co-benefits remains fragmented across land-use types and disciplinary silos. Existing reviews rarely compare not only hydrological responses but also side-benefits such as flood peak reduction, carbon sequestration, water quality improvements, biodiversity gains, and associated implementation costs across contrasting land-use/land-cover (LULC) settings. This study presents a systematic literature review that (i) maps the global evidence base on groundwater recharge responses to restoration and MAR, (ii) compares co-benefits and trade-offs across major LULC classes (river lowlands, wetlands, mountainous aquifers, forests, urban areas, cropland, pasture), and (iii) evaluates how study design, metrics, and cost information influence the strength of inference and decision relevance.​

Searches in three bibliographic databases follow a pre-specified protocol with semi-automated deduplication and AI-assisted screening. Two reviewers independently screen titles/abstracts and full texts in a dedicated review platform, targeting substantial to almost perfect agreement (Cohen’s κ ≥ 0.7 for titles/abstracts; κ ≥ 0.8 for full texts). Eligible studies are coded for hydroclimatic region, LULC, intervention type, study design (before–after, control–impact, paired-catchment, BACI), and methodological approach (field monitoring, tracer tests, modelling). Extracted response variables include quantitative metrics of groundwater recharge, baseflow and storage, flood peak attenuation, carbon-related indicators, water quality parameters, biodiversity indices where available, and reported capital and operational costs or cost proxies. Risk of bias and inferential strength are appraised using criteria adapted for quasi-experimental hydrological studies and economic evaluations.​

The review is expected to yield a sufficient number of primary studies (on the order of 80-150) to enable cross-LULC comparisons of hydrological effectiveness, co-benefits, and costs. Anticipated outputs include evidence maps identifying LULC-intervention combinations with robust multi-benefit support versus critical gaps, and syntheses highlighting where relatively small investments deliver disproportionately high recharge gains and side-benefits. These insights will inform the design of future experiments and models and support practitioners and policy-makers in prioritising restoration and MAR options that maximise groundwater recharge while delivering broader ecosystem and societal benefits.

How to cite: Julia, D., Merz, R., Farnleitner, A., and Boano, F.: Hydrological and multi‑benefit outcomes of ecological restoration and managed aquifer recharge across land‑use types: a systematic literature review, EGU General Assembly 2026, Vienna, Austria, 3–8 May 2026, EGU26-22694, https://doi.org/10.5194/egusphere-egu26-22694, 2026.

In Kanpur Dehat, India, the Rania–Khan Chandpur villages have multiple Chromite Ore Processing Residue (COPR) dumps that have been open for decades. This procedure has allowed leachate from rain to infiltrate into the soil-groundwater systems and elevated the levels of Chromium (Cr) in groundwater up to 39 mg L⁻¹ in 2023 and 27 mg L⁻¹ in 2024. Despite ongoing contamination, there is limited quantitative understanding of local soil’s retention or release capacity for Cr, making it difficult to predict plume migration or design effective remediation. Therefore, the present study specifically focuses on Rania–Khan Chandpur to generate site-relevant sorption and transport parameters essential for assessing long-term groundwater monitoring. To understand the specific characteristics of Cr in the soil–groundwater system, a batch experiment was performed and fitted with isotherm models. The distribution coefficient (Kd) values for Rania soil ranged from 0.088 to 0.047 L kg⁻¹, indicating substantial Cr adsorption capacity. The KL values were 0.043 at pH 4, 0.015 at pH 7, and 0.007 at pH 11. Freundlich parameters (Kf and 1/n) further confirmed favorable and heterogeneous surface-controlled adsorption behavior across all pH levels. A rainfall-driven column experiment was conducted to evaluate Cr leaching and transport from a 2 cm COPR layer through 15 cm of soil collected from Rania-Khan Chandpur, simulating natural seasonal recharge conditions at the site. Breakthrough curves (C/C₀ vs Pore Volume (PV)) showed Cr breakthrough at approximately 0.3 PV, reaching a peak near 0.8–0.9 PV, followed by long tailing extending up to around 7 PV, indicating strong initial adsorption and subsequent slow desorption and release over time. This finding suggests that while soil can temporarily restrict Cr movement, it gradually releases retained Cr, acting as a long-term source, which helps explain the persistent groundwater contamination. These findings highlight that although soil temporarily retains Cr, long-term release sustains plume persistence, emphasizing the need for site-specific remediation and improved predictive modelling for soil-groundwater systems.

How to cite: Deoli, V. and Malik, A.: Isotherm-Driven Sorption Dynamics and Breakthrough Behaviour of Chromium in COPR-Impacted Soils: A Field-scale Study from Rania–Khan Chandpur, India, EGU General Assembly 2026, Vienna, Austria, 3–8 May 2026, EGU26-925, https://doi.org/10.5194/egusphere-egu26-925, 2026.

EGU26-1124 | ECS | Orals | HS8.1.4

From Local Mixing to Macrodispersion: A Sigmoid Approach to Modelling Scale-Dependent Contaminant Transport 

Kumar Rishabh Gupta and Pramod Kumar Sharma

Understanding and predicting contaminant migration in heterogeneous aquifers remains a central challenge for groundwater protection and remediation. Accurately predicting the fate and transport of reactive contaminants is hindered by subsurface heterogeneity, scale-dependent dispersion, and complex reaction chains, all of which control plume architecture and thus remediation performance. This study advances current transport theory by introducing a novel sigmoid dispersivity model that provides a bounded, physically meaningful transition from local-scale pore mixing to field-scale macrodispersion. Focusing on a five-species chlorinated solvent (CS) decay chain, the approach is implemented using a two-dimensional advection-dispersion equation solved by an implicit finite difference scheme. The proposed model uniquely introduces an effective dispersivity function that dynamically represents concentration distributions, apprehending non-linear retardation, first-order decay, and pre-asymptotic spreading patterns more accurately than conventional analytical solutions. A comparative evaluation against four widely used dispersivity models demonstrates that the sigmoid model more accurately captures plume skewness, early-time breakthrough behaviour, and long-distance tailing, verified through spatial-moment analysis. Crucially, the results uncover a significant coupled effect where the dispersion of a parent plume exerts a strong control on the mobility and risk footprint of daughter products, a theoretical insight with profound implications for field applications. By improving the upscaling transport parameters across scales, this model provides a robust tool for improved aquifer characterisation, improved vulnerability assessment, and a strong basis for optimised remediation schemes for persistent groundwater contaminants. Moreover, it directly contributes to bridging theoretical developments in transport modelling with practical field applications, offering a promising tool for risk management and long-term groundwater sustainability.

How to cite: Gupta, K. R. and Sharma, P. K.: From Local Mixing to Macrodispersion: A Sigmoid Approach to Modelling Scale-Dependent Contaminant Transport, EGU General Assembly 2026, Vienna, Austria, 3–8 May 2026, EGU26-1124, https://doi.org/10.5194/egusphere-egu26-1124, 2026.

The migration of groundwater pollutants is concealed, and accurately and efficiently tracing the source of groundwater pollution is the difficulty in the remediation and control of groundwater pollution. To ensure the accuracy and efficiency of source tracing, this paper takes a contaminated site along the lower reaches of the Ganjiang River as an example and constructs a groundwater pollution source tracing framework based on Bayesian optimization. The Kepler optimization algorithm was adopted to optimize the parameters of the basic water flow model. A dynamic model was established by coupling the water level of the Ganjiang River, and the migration law of pollutants in the dynamic groundwater flow field was studied. Qualitative identification of site pollution sources is carried out through self-organizing mapping neural networks to determine the homology of pollution indicators. By using the IFM interface provided by FEFLOW and combining the Bayesian optimization algorithm with the solute transport model through the Python language, the parameters of pollution sources are inverted. The main achievements are as follows:

(1) Through the statistical analysis of groundwater quality data, it can be known that the typical pollutants in groundwater are manganese, ammonia nitrogen, iron and fluoride. There is an abnormal enrichment phenomenon caused by multi-source input and local pollution release in the field area.

(2) The pollution sources were qualitatively identified based on the self-organizing mapping neural network method. The results showed that they originated from agricultural production, livestock activities, and industrial production activities in the original factory area.

(3) Based on the site investigation data, a basic groundwater flow model was established. The model parameters were optimized through the Kepler optimization algorithm. The absolute error between the simulated water head and the actual water head at 39 water level observation points decreased from 2.62 to 0.36.

(4) By coupling the water level of the Ganjiang River to establish a dynamic water flow model, it was calculated that the influence radius of the Ganjiang River water level is approximately 350 meters. The contaminated site is precisely located at the edge of the influence radius. Through comparative experiments, it was found that the solute transport results within the site are less affected by the water level of the Ganjiang River.

(5) For the nonlinear high-dimensional optimization problem of groundwater pollution source parameter inversion, a physical constraint inversion framework based on Bayesian optimization is proposed. The Bayesian optimization algorithm can quickly identify the location with the highest possibility of pollution sources and simulate the matching parameter groups of pollution sources within a finite number of iterations. The entire process only takes 20 minutes. Subsequently, by means of combined source inversion, the locations of potential pollution sources are identified, and the causes and mechanisms of their formation are analyzed based on the integration of multi-source data.

How to cite: Xu, M., Zhang, C., and Guo, J.: Research on Groundwater Pollution Source Tracing of Abandoned Industrial Sites along the River Based on Bayesian Optimization, EGU General Assembly 2026, Vienna, Austria, 3–8 May 2026, EGU26-3344, https://doi.org/10.5194/egusphere-egu26-3344, 2026.

Managed Aquifer Recharge (MAR) is increasingly recognized as a key strategy to mitigate water scarcity, enhance groundwater quality, and ensure long-term aquifer sustainability. Among the various MAR techniques, infiltration basins are widely implemented due to their operational simplicity and effectiveness in promoting recharge through surface infiltration.

However, the design and operation of infiltration basins involve significant scientific and technical challenges. These challenges stem from the multidisciplinary nature of the system, which integrates diverse hydrological processes such as rainfall variability, surface runoff concentration, reservoir management, and the complex dynamics of flow and solute transport through the vadose zone and into the aquifer. Each of these components introduces uncertainties that complicate predictive modeling and practical implementation.

Critical design aspects include determining appropriate basin dimensions, understanding infiltration dynamics and consequent solute transport, and addressing operational features such as emptying time and clogging. Clogging, in particular, not only reduces infiltration capacity but also influences solute transport behavior in the subsurface, adding complexity to performance assessment. Furthermore, temporal variability in recharge rates requires adaptive management strategies to maintain efficiency over time.

Selected challenges associated with the design and operation of infiltration basins are discussed, emphasizing the interplay between hydrological processes and engineering decisions. It is highlighted the need for simple and integrated approaches to optimize basin performance and ensure sustainability.

How to cite: Fiori, A.: Challenges in Designing Infiltration Basins for Managed Aquifer Recharge, EGU General Assembly 2026, Vienna, Austria, 3–8 May 2026, EGU26-3512, https://doi.org/10.5194/egusphere-egu26-3512, 2026.

EGU26-4219 | ECS | Orals | HS8.1.4

Experimental Insights into Cadmium Transport in a Heterogeneous Saturated Subsurface Using a Two-Dimensional Tank 

Shibaraj Brahma Gayari, Sumedha Chakma, and Pankaj Kumar Gupta

Cadmium (Cd) is a priority groundwater contaminant of significant environmental concern, as its presence in subsurface water systems poses serious risks to both human and ecosystem health. A better understanding of cadmium transport under heterogeneous subsurface conditions representative of real aquifers is essential for accurately predicting its fate and for designing effective remediation strategies. This study investigates cadmium transport in saturated heterogeneous subsurface using a two-dimensional laboratory tank packed with an undisturbed soil core to generate high-quality experimental data under realistic flow regimes. Initially, a conservative tracer test using sodium chloride (NaCl) was conducted to assess flow dynamics, hydraulic connectivity, and preferential flow pathways within the heterogeneous medium system. The tracer results confirmed non-uniform flow behaviour and significantly reduced pore-water velocities due to the low permeability and structural heterogeneity of the undisturbed soil. After achieving steady-state flow conditions, a cadmium transport experiment was performed by introducing a 1000 ppb Cd solution under constant hydraulic conditions.  Water samples were collected at selected time intervals and analysed using inductively coupled plasma mass spectrometry (ICP-MS) to quantify cadmium concentrations. The experimental results reveal delayed cadmium breakthrough and pronounced tailing behaviour, highlighting the dominant influence of heterogeneity, reduced hydraulic conductivity, and enhanced sorption processes on cadmium transport dynamics in natural subsurface systems. The dataset generated provides a robust foundation for calibrating and validating reactive transport modelling under heterogeneous conditions. This experimental framework supports science-based groundwater quality management and informed decision-making in contaminated aquifers.

How to cite: Gayari, S. B., Chakma, S., and Gupta, P. K.: Experimental Insights into Cadmium Transport in a Heterogeneous Saturated Subsurface Using a Two-Dimensional Tank, EGU General Assembly 2026, Vienna, Austria, 3–8 May 2026, EGU26-4219, https://doi.org/10.5194/egusphere-egu26-4219, 2026.

Aquifers are typically heterogeneous in both structure, which appears as variations in hydraulic conductivity (K), and chemistry, which is governed by the spatial distribution of electron accepting and donating capacity (EAC and EDC). Arsenic (As), a highly toxic and strongly mobile groundwater pollutant, requires a comprehensive understanding of its transport and transformation behaviour—especially during early remediation stages. Studying the dynamics of As is challenging in highly heterogeneous aquifers, where both flow paths (controlled by structure) and reaction rates (influenced by chemistry) play complex roles. For the first time, the redox capacity is used to characterize biogeochemical reaction processes. Static batch experiments confirmed that the redox capacity-mediated reaction kinetics framework effectively captured electron transfer from various active components. Furthermore, the validated reaction kinetics was applied to a two-dimensional radial model to examine how As transports and transforms in the aquifer matrix and lens structures. The study also quantified the relationship between physicochemical heterogeneity and the breakthrough curves (BTCs) of As. The research offered a new framework for understanding arsenic dynamics from an electron-transfer-based perspective.

How to cite: Gong, K.: Arsenic dynamics in physicochemically heterogeneous aerobic aquifers mediated by redox capacity, EGU General Assembly 2026, Vienna, Austria, 3–8 May 2026, EGU26-4265, https://doi.org/10.5194/egusphere-egu26-4265, 2026.

Climate change has increased the frequency and intensity of wildfires, resulting in enhanced accumulation of incompletely combusted organic materials such as black carbon (BC) in soil and subsurface environments. The presence of wildfire-derived BC modifies the physicochemical characteristics of groundwater–soil systems and can alter the retention behavior of various contaminants. Among these, radiocesium (Cs), which may be released into the environment following nuclear power plant accidents, is of particular concern due to its high mobility and long-term persistence. Understanding how BC formation conditions influence Cs retention is therefore essential for predicting radionuclide behavior in wildfire-affected subsurface environments.

In this study, BC was produced from oak and pine biomass under controlled laboratory conditions, with final pyrolysis temperatures ranging from approximately 300–400 °C to ≥500 °C. Previous batch sorption experiments showed that Cs is preferentially sorbed onto low-temperature BC, whereas high-temperature BC exhibits reduced Cs uptake. To investigate the physical mechanisms underlying this temperature-dependent behavior, synchrotron-based X-ray computed tomography (CT) was conducted at the Pohang Accelerator Laboratory (PAL 6C) using 25 keV X-rays with a voxel resolution of 3.25 μm. CT images reveal that BC produced at lower temperatures preserves an interconnected internal pore structure inherited from the original biomass, whereas BC produced at ≥500 °C exhibits pronounced microstructural degradation, including pore collapse and loss of pore connectivity. These structural trends were consistently observed despite inherent heterogeneity associated with different biomass precursors. The results indicate that Cs sorption onto BC is controlled by a coupled effect of surface chemical functionalities and microstructural integrity, which governs the accessibility of reactive sites. High-temperature thermal alteration induces physical damage to the BC structure, thereby limiting effective Cs retention even as aromaticity increases. These findings highlight the importance of considering wildfire-induced changes in BC properties when assessing radionuclide retention in subsurface environments.

How to cite: Choung, S. and Bae, H.: Wildfire-derived black carbon alters cesium retention in subsurface environments: insights from synchrotron X-ray imaging, EGU General Assembly 2026, Vienna, Austria, 3–8 May 2026, EGU26-4684, https://doi.org/10.5194/egusphere-egu26-4684, 2026.

Groundwater contamination has become an increasingly critical environmental concern worldwide. In-situ chemical oxidation (ISCO) is considered a promising technology for groundwater remediation, but its performance in heterogeneous aquifers is often constrained by mass-transfer limitations in low-permeability zones, leading to suboptimal treatment efficiency. Theoretically, ultrasound can enhance permeability in low-permeability regions, accelerate oxidant transport, and activate oxidants to strengthen their degradation capacity; however, the remediation performance and underlying mechanisms of ultrasound-ISCO coupling have not yet been systematically validated through experiments. To address this gap, this study conducted degradation experiments under three ultrasonic modes (no ultrasound, ultrasonic pre-treatment, and continuous ultrasound) and employed nuclear magnetic resonance (NMR) to quantitatively characterize contaminant distribution and degradation behavior within the pore space. The results show that ultrasonic pre-treatment reconstructs the pore structure of the porous medium via cavitation and mechanical vibration, thereby enhancing permeability and oxidant mass transfer and consequently accelerating contaminant removal. When ultrasound is continuously applied during ISCO, it not only maintains permeability enhancement but also activates the oxidant, modulates the transformation pathways of key intermediates, and promotes deeper oxidation and mineralization, ultimately yielding the highest degradation efficiency due to the synergistic action of permeability enhancement and oxidant activation. This study demonstrates the effectiveness of ultrasound-ISCO coupled technology for remediation of contaminated heterogeneous aquifers and systematically elucidates the synergistic mechanisms between ultrasonic permeability enhancement and intensified oxidation, providing theoretical support for its engineering application under complex hydrogeological conditions.

How to cite: Zhao, Y.: Mechanisms of Enhanced In-situ Chemical Oxidation for Groundwater Remediation via Ultrasonic Permeability Improvement, EGU General Assembly 2026, Vienna, Austria, 3–8 May 2026, EGU26-5126, https://doi.org/10.5194/egusphere-egu26-5126, 2026.

EGU26-6183 | ECS | Orals | HS8.1.4

Dynamic Purging for Groundwater Sampling Informed by a Storage–Mixing Model 

Yu He, Francesco Maria De Filippi, Shen Qu, and Jian Luo

Groundwater sampling is a critical component of hydrogeological investigations and is essential for accurate hydrogeochemical analyses. Fully representative samples can be obtained after effective purging of non-representative stagnant water from monitoring wells. However, the procedure and threshold for sufficient well purge remain unresolved. In practice, wells are often purged from 5 to 60 minutes according to the stabilization of chemical-physical parameters or 3–5 well volumes without a rigorous scientific basis, after which samples are collected under the assumption that they represent formation conditions. This introduces substantial uncertainty and potential errors into sampling data.

To address this issue, we develop a well storage-mixing model to characterize the combined effects of two key processes during purging: well storage depletion and wellbore mixing. By modeling the dimensionless completion variables of these two processes, ηq [-] and ηc [-], we demonstrate that sufficient well purge is controlled by the process with the longer characteristic timescale. In high-yield aquifers or large, deep wells, wellbore mixing limits the time required to achieve sufficient purging; conversely, in low-yield aquifers or shallow, small wells, storage depletion is the limiting process. Field data from recent sampling campaigns in Rome, Italy, and Inner Mongolia, China, exhibit mixing-limited and storage-limited purge modes, respectively, indicating that different well geometries and hydrogeological settings lead to distinct purge times and volumes. Accordingly, purge criteria should be dynamic to avoid over-purging (unnecessary capital costs) or insufficient purging (non-representative samples). Dynamic purging informed by the storage-mixing model significantly improves data accuracy while reducing capital costs and should be widely adopted, particularly for monitoring well networks with highly variable well geometries and aquifer conditions.

How to cite: He, Y., De Filippi, F. M., Qu, S., and Luo, J.: Dynamic Purging for Groundwater Sampling Informed by a Storage–Mixing Model, EGU General Assembly 2026, Vienna, Austria, 3–8 May 2026, EGU26-6183, https://doi.org/10.5194/egusphere-egu26-6183, 2026.

EGU26-8092 | ECS | Orals | HS8.1.4

Coupled effects of local dispersion, density and chaotic advection on mixing enhancement 

Francesca Ziliotto, Mónica Basilio Hazas, Michelle Kotynek-Winter, Massimo Rolle, and Gabriele Chiogna

In the subsurface, many biogeochemical reactions are characterized by inefficient mixing. Therefore, it is essential to investigate mechanisms that can enhance mixing processes. One example is the case of transient flow conditions. Specifically, Engineered Injection and Extraction (EIE) protocols can generate chaotic advection and are well known in the literature to enhance solute mixing and contaminant degradation. The objective of this work is to provide experimental evidence of the interplay between local dispersion, density-driven flow, and chaotic advection on solute transport and mixing. Density-contrasts are indeed particularly relevant in the context of groundwater remediation and saltwater intrusion. We conducted a series of experiments in a quasi-two-dimensional chamber representing a vertical cross-section of a homogeneous unconfined aquifer. The setup is equipped with four wells which operate sequentially following a prescribed pumping schedule. In our set of experiments, two different grain sizes are used to investigate the role of local dispersion, while different injected solute concentrations are used to study the impact of density contrasts. The effect of chaotic flow generated by the operation of the EIE system is compared to experiments run under no-flow conditions in the surroundings to isolate the contribution of purely density-driven flows to solute mixing. The conservative tracer is injected in the middle of the area delimited by the four wells, and a non-invasive optical method is applied to track the evolution of the solute at a high temporal resolution. Mixing is quantified by computing the plume area. Our results show that local dispersion plays a significant role in density-driven flow as experiments performed in coarse porous media display higher mixing enhancement in comparison to those conducted in the fine porous media. At early times in the experiments, density effects are more pronounced in the experiments performed in the coarse porous material, but they decrease over time when the plume is more diluted and the density-contrasts are less pronounced. Finally, chaotic advection has a major effect on mixing enhancement. However, its impact decreases as the plume area increases, and at later times local dispersion is the dominant process contributing to the enhancement.

How to cite: Ziliotto, F., Basilio Hazas, M., Kotynek-Winter, M., Rolle, M., and Chiogna, G.: Coupled effects of local dispersion, density and chaotic advection on mixing enhancement, EGU General Assembly 2026, Vienna, Austria, 3–8 May 2026, EGU26-8092, https://doi.org/10.5194/egusphere-egu26-8092, 2026.

EGU26-8272 | Posters on site | HS8.1.4

Mibitrans: A python package for modelling subsurface contaminant transport and natural attenuation decision support  

Alraune Zech, Jorrit Bakker, Johan van Leeuwen, Robin Richardson, and Jaro Camphuijsen

Bioremediation is a promising strategy for sustainable management and treatment of field sites with soil and groundwater contamination. Understanding the fate of contaminants is key for identifying optimal conditions and prediction of biodegradation in the subsurface. We develop the open-source Python package mibitrans for hydrogeological reactive transport modelling for simple use of field site modelling, transport prediction and management optimization. Mibitrans is developed in the frame of the EU-funded MiBiRem project.

Mibitrans is based on physics-based (semi-)analytical solutions for multidimensional solute transport in groundwater. Biodegradation can be modelled in various ways, including simple first-order decay and chemical reactions based on electron acceptor concentrations. The mibitrans package is modular, fully tested, well documented and well-structured to allow for easy adaptation and use in various field situations. We will present the use with example field site data from ongoing bioremediation projects.

How to cite: Zech, A., Bakker, J., van Leeuwen, J., Richardson, R., and Camphuijsen, J.: Mibitrans: A python package for modelling subsurface contaminant transport and natural attenuation decision support , EGU General Assembly 2026, Vienna, Austria, 3–8 May 2026, EGU26-8272, https://doi.org/10.5194/egusphere-egu26-8272, 2026.

Light non-aqueous phase liquids (LNAPLs) are common industrial contaminants, posing significant environmental risks. Understanding the distribution of LNAPL in the vadose zone is crucial for developing effective remediation strategies. This study combined capillary modeling with sandbox experiments across dry sand to capillary zones to analyze the spatial and temporal distribution of LNAPL using modified light transmission techniques. The research examined the effects of particle size, viscosity, and the slope of phreatic surface on the spatiotemporal distribution behavior of LNAPL. Key findings reveal that capillary pressure transitions from gas-LNAPL driving to LNAPL-water resistance, which significantly influences the vertical infiltration of LNAPL in dry sand and horizontal migration in the capillary zone. This transition leads to the formation of a "levitational" lens above the groundwater table. Moreover, finer particles elevate LNAPL-water capillary resistance, forming a new "double shark-fin" vertical saturation profile. Higher viscosity narrows "shark-fin" profiles by impeding vertical migration. Enhanced hydraulic gradients expand distribution vertically/horizontally, elevating saturation peaks by 50%. Notably, optical transmission imaging detects sub-residual LNAPL in "shark-fin" saturation overlooked by conventional models. Underestimation of this critical zone directly compromises contamination severity assessment. Our study corrects residual saturation benchmarks for accurate risk management, informing more effective LNAPL remediation strategies.

How to cite: Cui, Y.: Insights into LNAPL saturation distribution in capillary zone based on light transmission and mechanical analysis, EGU General Assembly 2026, Vienna, Austria, 3–8 May 2026, EGU26-10367, https://doi.org/10.5194/egusphere-egu26-10367, 2026.

EGU26-10368 | Posters on site | HS8.1.4

Coupled MODFLOW–MT3DMS simulation of nitrate transport in the Plana de Valencia coastal aquifer (Spain): calibration to monitoring wells and implications for groundwater–wetland interactions 

Javier Rodrigo-Ilarri, Eduardo Cassiraga, María-Elena Rodrigo-Clavero, and Laura Escrivá-Benito

Nitrate contamination is one of the dominant groundwater-quality pressures in Mediterranean irrigated plains. In the Plana de Valencia (eastern Spain), intensive agriculture and irrigation return flows coexist with strong groundwater–surface water connectivity and ecologically sensitive receptors such as the Albufera wetland system. We present a regional-scale numerical framework that couples groundwater flow and conservative solute transport to reproduce observed nitrate dynamics and to provide a basis for scenario testing of mitigation measures.

A previously developed transient groundwater-flow model of the Plana de Valencia was implemented in the ModelMuse graphical environment and used as the hydraulic driver for MT3DMS multi-species transport simulations. The hydrogeological conceptualization comprises four model layers representing (i) highly permeable Quaternary detrital deposits, (ii) Tertiary formations of intermediate permeability (limestones/sandstones/conglomerates), (iii) low-permeability Miocene marls, and (iv) permeable Mesozoic carbonates over an impermeable Keuper basement. External stresses include spatially distributed recharge (rainfall infiltration and irrigation returns), exchanges with rivers, channels and wetlands (“ullals”), pumping abstractions, and lateral boundary transfers, consistent with a predominantly inland-to-coast hydraulic gradient.

Agricultural nitrate inputs were spatially allocated using land-use information (CORINE) and fertilization constraints from the regional regulatory framework, translated into gridded source terms (1 km × 1 km) and applied through the sink/source mixing package. Simulations covered 1980–2017 and were evaluated against nitrate time series from the Júcar River Basin Authority monitoring network at multiple observation wells across both the northern and southern sectors of the aquifer. Manual multi-well calibration produced acceptable agreement in most wells; a classification of fit quality indicates good performance for 8 wells and poor performance for 3 wells, with no clear spatial clustering of misfits, suggesting the need for local refinement or parameter regionalization. Model performance improved after reducing the fraction of applied nitrate reaching groundwater from 10% to 7%, and the best correspondence commonly occurred in the second layer (typical monitoring depths ~40–50 m).

Results confirm widespread exceedance of the 50 mg/L threshold in the majority of wells and a generally increasing temporal trend even under regulated application rates, highlighting the risk of persistent degradation and potential downstream impacts on the Albufera system. The proposed model constitutes a transferable decision-support baseline for testing management scenarios (fertilization control, irrigation efficiency, drought sequences, and saltwater intrusion) and for advancing toward automated calibration and uncertainty quantification.

How to cite: Rodrigo-Ilarri, J., Cassiraga, E., Rodrigo-Clavero, M.-E., and Escrivá-Benito, L.: Coupled MODFLOW–MT3DMS simulation of nitrate transport in the Plana de Valencia coastal aquifer (Spain): calibration to monitoring wells and implications for groundwater–wetland interactions, EGU General Assembly 2026, Vienna, Austria, 3–8 May 2026, EGU26-10368, https://doi.org/10.5194/egusphere-egu26-10368, 2026.

EGU26-10433 | ECS | Orals | HS8.1.4

Stochastic modelling of aquifer heterogeneity and hydraulic conductivity field distribution: implications for solute transport modelling 

Felipe Gallardo Ceron, Landis Jared West, James Graham, Luca Colombera, and Ian T. Burke

Flow and solute transport in groundwater are primarily controlled by the hydraulic conductivity (K) field. Variations in the K field greatly influence subsurface flow rates and solute migration and dispersion. Due to the importance of aquifer heterogeneity, several approaches have been proposed in the literature for modelling K field spatial distribution based on borehole data. In this work, we evaluate two methods to generate spatial realisations of the K field of a heterogeneous aquifer. Results are analysed in terms of the connectivity of high-K cells, and solute transport results are compared and discussed.  

The methodology consists of three main steps. First, borehole PSD data are used to characterise hydrofacies and generate 3D stochastic realisations of those hydrofacies using the Markov-Chain/Transition Probability approach (MC/TP). Resultant realisations are used to fill a 3D grid. Then, two methods are used to generate hydraulic conductivity fields by assigning a K value to each cell on those grids: (1) using the geometric mean of each hydrofacies (GMEAN) and (2) using a value sampled from the KDE probability functions of each hydrofacies (KDE). Two different porosity scenarios are considered (high porosity, HP; and low porosity, LP). Finally, solute transport estimates were computed using MODFLOW and MT3DMS.

Connectivity analysis of the stochastic realisations shows a higher degree of connectivity of high-K cells on the GMEAN mode than in the KDE. The latter leads to overall higher average K values, but also to slower flow regions with lower K values than the GMEAN.

Solute transport runs result in slower travel times and lower peak concentrations on the KDE realisations than in the GMEAN case. Breakthrough curves at different observation points show that, when concentrations fall after peaking (for a time-limited input pulse), both GMEAN and KDE curves tend to converge. The field-scale longitudinal dispersivity implied from the ensemble probability plumes is similar between the two K field realisation approaches modelled, but the vertical dispersivity is higher in the KDE realisations. The high porosity scenario shows higher dispersivities and considerably longer travel times.

Results show that, for the same porosity scenario, contaminant plumes behave similarly for the KDE and GMEAN approaches at longer times and distances from the source. This suggests that, on the studied site, the small-scale heterogeneity has a reduced effect on the on the long term, field scale macrodispersivity and solute transport behaviour.

How to cite: Gallardo Ceron, F., West, L. J., Graham, J., Colombera, L., and Burke, I. T.: Stochastic modelling of aquifer heterogeneity and hydraulic conductivity field distribution: implications for solute transport modelling, EGU General Assembly 2026, Vienna, Austria, 3–8 May 2026, EGU26-10433, https://doi.org/10.5194/egusphere-egu26-10433, 2026.

Groundwater is the most dependent source of irrigation and public water supply in most countries; hence, it requires the best quality management practices to safeguard against contamination. Groundwater quality management requires the best models to assess the extent of migration and spatiotemporal variation.  The extent of contamination is often studied through the application of mesh-based methods, such as the finite difference method (FDM) and the finite element method (FEM). Moreover, in recent decades, various groundwater meshless studies have provided better alternatives to mesh-based methods for solving complex groundwater contamination problems. The meshless methods eliminate the need for generating a computational mesh; they operate on a set of scattered nodes distributed across the aquifer domain, which can be easily added or removed as needed, depending on the field scenario and its complexity. Recent studies have demonstrated the development of various meshless methods for modeling groundwater contaminant transport, enabling the assessment of transport behavior. In this study, a groundwater contaminant transport model is developed using the generalized finite difference method (GFDM), which employs the Taylor series and the moving least squares (MLS) method to determine the spatial and temporal variations of contaminant in the aquifer domain. The application of the developed GFCT model is demonstrated for various heterogeneous porous media, and the results are compared with those from the MT3DMS model.

How to cite: Singh, K. G. and Pathania, T.: Two-dimensional meshless simulation of contaminant transport in porous media using the generalized finite difference method (GFDM), EGU General Assembly 2026, Vienna, Austria, 3–8 May 2026, EGU26-10814, https://doi.org/10.5194/egusphere-egu26-10814, 2026.

EGU26-12915 | ECS | Posters on site | HS8.1.4

Evaluating transverse dispersivities obtained from large laboratory and field datasets 

Sreelekshmi Sreelekshmi, Utkarsh Puri, Anton Köhler, Moulsree Tripathi, Prabhas K Yadav, Alvin Yadav, Peter Grathwohl, Peter Dietrich, and Bhagu R. Chahar

Transverse dispersivity 𝛼𝑇[𝐿], both horizontal (𝛼𝑇 [L]) and vertical (𝛼𝑇𝑣 [L]), is frequently cited as a major source of error in groundwater contamination modeling. These dispersivities depend on several subsurface factors (e.g., sediment structure, grainsize); however, their sub-centimeter scale makes accurate estimation for field data highly uncertain. Consequently, only limited highly reliable field transverse dispersivity data can be found in the literature, leading to their insufficient characterization and dependence on quantities’ affecting reactive transport in the groundwater.

This study evaluates over 150 laboratory transverse dispersivity data, obtained from the literature, considering various flow and transport factors (e.g., grainsize, flow-velocity). The evaluation considers the combined data as a global dataset, i.e., independent of a particular experimental setup. The analysis leads to a development of a new transverse dispersivity model: 𝐷𝑇= 𝐷𝑝+ 0.23𝐷𝑎𝑞Pe0.59, (similar to Olsson et al., 2007); 𝐷𝑇, 𝐷𝑝 and 𝐷𝑎𝑞 [L2T−1] denote the transverse dispersion coefficient, pore and aqueous diffusion coefficients, respectively and Pe [-] is the Peclet number.

Field based 𝛼𝑇 and 𝛼𝑇𝑣 are obtained using field site data (over 60 sites, mostly BTEX sites) by inverting an Analytical Element Model (AEM) developed by Köhler et al (2026). The maximum plume length (𝐿max) in the dataset was used as the controlling factor, while source geometry and different combination of reactants (O2, NO3, SO4 etc.), among others, served as the experimental variables in quantifying 𝛼𝑇. The obtained results for both 𝛼𝑇 and 𝛼𝑇𝑣 range from 1mm to 60 mm and generally agree with literature results when the source thickness is much smaller (< 50%) than aquifer thickness and when combination of several reactants are considered. For all other scenarios, the obtained results significantly differ (up to order of magnitude) from the published values. In general, laboratory dispersivities are substantially smaller compared to field data. Furthermore, field 𝛼𝑇 is mostly less than 5 times compared to 𝛼𝑇𝑣. The ongoing work involves analyzing obtained 𝛼𝑇 results with different field properties (e.g., hydraulic  conductivity) and  applying the findings to contaminated sites.

References:

Köhler, A. V., J. R. Craig, P. K. Yadav, and R. Liedl. 2026. An Analytic Element Method solution for simulating multiple steady-state groundwater contamination scenarios. J. Contam. Hydrol. 276, January: 104733, https://doi.org/10.1016/j.jconhyd.2025.104733.

Olsson, A.H., Grathwohl, P. (2007): Transverse Dispersion of Non-reactive Tracers in Porous Media: A new Nonlinear Relationship to Predict Dispersion Coefficients. J. Contam. Hydrol., 92, 3-4, 149 – 161


How to cite: Sreelekshmi, S., Puri, U., Köhler, A., Tripathi, M., Yadav, P. K., Yadav, A., Grathwohl, P., Dietrich, P., and Chahar, B. R.: Evaluating transverse dispersivities obtained from large laboratory and field datasets, EGU General Assembly 2026, Vienna, Austria, 3–8 May 2026, EGU26-12915, https://doi.org/10.5194/egusphere-egu26-12915, 2026.

EGU26-13066 | ECS | Orals | HS8.1.4

Modeling nitrate remediation in groundwater using CH₄/H₂ gas injections 

Vinicius Falchi Bernardo, Jan Fleckenstein, Anja Wunderlich, Adrian Seeholzer, Florian Einsiedl, and Matthias Alte

Groundwater pollution from decades-old NO3 inputs is still a problem throughout Germany and the rest of the EU, with concentrations in many aquifers exceeding the 50 mg/l threshold mandated by the EU groundwater and drinking water directives. This situation has remained largely unchanged since the early 2000’s and quality targets for groundwater set by the European Environment Agency until 2030 are projected to not be met (EEA, 2025). In the light of these nitrate pollution legacies in situ remediation schemes have some appeal. In the NitratLURCH project funded by the German Federal Ministry of Research, Technology and Space (BMFTR, FONA-LURCH) as part of a funding scheme on sustainable groundwater management, we investigate the in situ remediation of nitrate pollution in groundwater via stimulated denitrification using CH₄/H₂ gas injections. In a pilot study at a former drinking water well contaminated with nitrate, nested numerical groundwater flow and transport models, in conjunction with intensive geologic site characterization, are used to support the setup of a gas injection system and to evaluate its ability to reduce nitrate concentrations in the groundwater flowing to the well. Regional geologic and hydrogeologic data were compiled to build a MODFLOW subcatchment scale groundwater model surrounding the drinking water well. The local aquifer system consists of about 150m thick glacio-fluvial Quaternary and Tertiary deposits with high transmissivity shallow sands and gravel beds significantly affecting groundwater flux dynamics in uppermost 10 – 20 m. A complex hydrofacies architecture, revealed during site characterization, was implemented into evolving versions of the flow model and further refined for a local, inset reactive transport model (codes Min3P and PHT3D) for a 1600 m2 area and 20 m deep section of the local aquifer. Conservative and reactive transport simulations and dozens of scenarios were realized to plan and operate an in situ CH4/H2 gas injection system, controlling and mitigating explosivity risks, optimizing reactant quantities and budgets, and evaluating reactions and turnover (e.g. incomplete denitrification leading to NO2 generation, unreacted CH4 etc.) in order to ensure legal compliance with the local water agency. Modeled optimal system performance under the local physical constraints and the assumption of maximum denitrification rates predicted a 30% reduction in nitrate concentrations in the pumped water (from about 50 to 35 mg/l) considering dilution from untreated water from parts of the complex groundwater flow system. Overall our modeling results suggest the viability of the tested remediation concept at the site.

EEA (2025). Nitrate in groundwater in Europe. Published 10 Nov 2025.

How to cite: Falchi Bernardo, V., Fleckenstein, J., Wunderlich, A., Seeholzer, A., Einsiedl, F., and Alte, M.: Modeling nitrate remediation in groundwater using CH₄/H₂ gas injections, EGU General Assembly 2026, Vienna, Austria, 3–8 May 2026, EGU26-13066, https://doi.org/10.5194/egusphere-egu26-13066, 2026.

EGU26-13073 | Orals | HS8.1.4

Geothermal heating impacts on BTEX biodegradation in various soils under cyclic fluctuating temperatures 

Magdalena Krol, Gurpreet Kaur, and Satinder Brar

Urban contamination of soil and groundwater by BTEX (benzene, toluene, ethylbenzene, xylene) compounds remains a widespread environmental concern that requires effective remediation strategies. Among available technologies, biological methods have gained significant attention for being both cost‑effective and environmentally sustainable. However, in‑situ bioremediation of BTEX is often limited by low subsurface temperatures (10–15 °C), which suppress microbial activity. Raising subsurface temperatures can stimulate microbial growth and accelerate contaminant degradation, but conventional heating methods can be costly. Geothermal heating offers a sustainable alternative by using shallow subsurface systems to extract heat in winter and inject excess heat in summer through ground‑source heat pumps. This excess thermal energy can serve as a heat source to enhance bioremediation processes.

This study investigates the effects of cyclic temperature fluctuations (5–40 °C) on BTEX biodegradation in contaminated soils at a small scale. Experiments using native microbial consortia across three soil types showed that cyclic heating significantly enhanced microbial metabolism and BTEX degradation compared with constant subsurface temperatures. Among the tested soils, silty loam exhibited the highest biodegradation under cyclic heating, outperforming sandy soil.

Overall, this research highlights the potential for leveraging geothermal heating systems to support more sustainable and efficient in‑situ remediation of BTEX‑contaminated subsurface environments.

How to cite: Krol, M., Kaur, G., and Brar, S.: Geothermal heating impacts on BTEX biodegradation in various soils under cyclic fluctuating temperatures, EGU General Assembly 2026, Vienna, Austria, 3–8 May 2026, EGU26-13073, https://doi.org/10.5194/egusphere-egu26-13073, 2026.

Elevated Fe/Mn in coastal groundwater threatens water safety and ecosystems, yet their coupled natural-anthropogenic drivers remain poorly quantified in complex multi-aquifer systems. Given the quantitative limitations of conventional hydrochemical and statistical analyses, this study developed a numerical modeling-driven framework integrating PMF-based quantitative source apportionment of Fe/Mn with PHREEQC-constrained reactive transport modeling (via GMS) in Zhanjiang City, China. Dataset from 1970s to present revealed persistent Fe/Mn contamination across this groundwater-dependent region. PMF analysis quantitatively differentiated natural sources (dominantly silicate weathering and Fe/Mn-bearing mineral dissolution) from anthropogenic inputs, constraining reaction pathways. PHREEQC inverse modeling further quantified Fe/Mn-bearing mineral dissolution rates, generating essential reaction parameters for transport simulations. Forward modeling assessed Fe/Mn mobility under saline-water mixing and CO2 equilibrium conditions. Simulations indicated that low seawater mixing best reproduced observed Fe/Mn levels, with Ca2+/Mg2+ exchange as a key control. Discrepancies between modeled and observed ion compositions implied possible contributions from deep brine upcoming or anthropogenic inputs. 3D numerical simulations characterized flow dynamics and reactive transport. Results revealed spatially constrained Fe/Mn dispersion, indicating limited aquifer hydrogeological connectivity regardless of pollution source location. Large-scale pumping neither induced significant downstream dispersion nor facilitated upstream transport, highlighting the dominance of natural hydrogeochemical controls. Redox conditions and hydraulic parameters were key regulators of Fe/Mn mobility. This framework quantifies redox-driven Fe/Mn contamination mechanisms under combined stressors, offering transferable solutions for global coastal groundwater management.

How to cite: Xiao, S. and Wang, Y.: Quantifying Mechanisms of Elevated Iron and Manganese Concentrations in Coastal Multi-Layer Aquifers via Numerical Modeling, EGU General Assembly 2026, Vienna, Austria, 3–8 May 2026, EGU26-13203, https://doi.org/10.5194/egusphere-egu26-13203, 2026.

EGU26-16265 | Orals | HS8.1.4

Uncertainty assessment with multi-conceptual models and sedimentology in a key role – The MADE case  

Joost Herweijer, Steven Young, Phil Hayes, and Okke Batelaan

Reliable modelling of contaminant spreading remains a formidable challenge in hydrogeology. The MADE (macro-dispersion) natural-gradient tracer field experiments and related data provide an excellent opportunity to test methods for solute transport and related uncertainty.

Most published MADE- models have been based on a single conceptualisation and on spatial hydraulic conductivity structures derived from large volumes of published data. At best, this approach allows parametric uncertainty to be determined, but it provides no assessment of the impact of conceptual uncertainty.

Herweijer et al. (2026) conducted a ‘back to basics’ review of the original MADE reports and concluded that there are significant unexplored conceptual issues that influenced the migration of the tracer plume and or biased observations. These issues include geology (sedimentological heterogeneity at three scale levels), unreliable measurement of hydraulic conductivity, biased tracer concentrations, and a non-stationary flow field. As a result, we developed a framework of knowns and unknowns, with the latter category being very important for further uncertainty analysis.

We demonstrate that, with limited drilling and hydraulic conductivity data, but using sedimentological inferences, a 3D spatial hydrogeological architecture can be established for MADE. Using this architecture and lithological information a heterogenous hydraulic conductivity field can be established. The latter involves some alternate conceptual models reflecting sedimentological uncertainty, which can be further constrained using affordable and reliable piezometric data. Additional conceptual models are proposed to test uncertainty in boundary conditions and data validity.

The known-and-unknown framework yields an ensemble of numerical and analytical models that can be built to address the underdetermined nature of modelling results arising from multiple concepts and imperfect data. It is concluded that the ensemble result would provide a more holistic assessment of transport uncertainty


Herweijer J.C., S. C Young, P. Hayes, and O. Batelaan, 2026, A multi-conceptual model approach to untangling the MADE experiment, Accepted for Publication in Groundwater.

How to cite: Herweijer, J., Young, S., Hayes, P., and Batelaan, O.: Uncertainty assessment with multi-conceptual models and sedimentology in a key role – The MADE case , EGU General Assembly 2026, Vienna, Austria, 3–8 May 2026, EGU26-16265, https://doi.org/10.5194/egusphere-egu26-16265, 2026.

EGU26-16462 | Posters on site | HS8.1.4

Investigation and Analysis of seasonal Groundwater Flow dynamics and Contaminant Migration at Chlorinated-Solvent-Contaminated Sites 

Jui-Sheng Chen, Ching-Ping Liang, Yu Chieh Ho, Zhong-Yi Liao, Thi-Tuyet-Han Nguyen, and Jui-Yu Chang

This study establishes a systematic framework for investigating seasonal groundwater flow dynamics and contaminant migration at chlorinated-solvent-contaminated sites in Taiwan. Due to strong seasonal rainfall patterns, groundwater levels fluctuate significantly, influencing flow directions and contaminant transport behavior. Continuous groundwater-level monitoring from April to September 2025 shows noticeable seasonal variations, with well K00318 exhibiting the greatest decline, suggesting potential shifts in the local flow field. Rainfall–water level correlations further indicate high vertical hydraulic conductivity in the unsaturated zone. Seven rounds of groundwater sampling reveal exceedances of TCE, DCE, and occasionally VC in several monitoring wells, including K00407, K00381, K00296, K00237, K00284, and K00358, while all remaining wells stayed below monitoring and regulatory limits. The results highlight spatial variability in contamination severity and emphasize the need for continued monitoring to assess plume behavior and support future management decisions.


How to cite: Chen, J.-S., Liang, C.-P., Ho, Y. C., Liao, Z.-Y., Nguyen, T.-T.-H., and Chang, J.-Y.: Investigation and Analysis of seasonal Groundwater Flow dynamics and Contaminant Migration at Chlorinated-Solvent-Contaminated Sites, EGU General Assembly 2026, Vienna, Austria, 3–8 May 2026, EGU26-16462, https://doi.org/10.5194/egusphere-egu26-16462, 2026.

Freshwater security in Mediterranean islands is under threat due to the decoupling of water demand from natural recharge rates, which is being pushed by climate instability and tourism-induced urbanization. This study assesses the hydro-geochemical mechanisms that influence groundwater quality on Bozcaada Island, Türkiye, to determine its appropriateness for drinking and irrigation. A total of 21 groundwater samples were collected during the dry season (June 2025), coinciding with a demographic surge from approximately 1,200 to over 40000 inhabitants to evaluate the groundwater salinity and water quality parameters (EC, TDS, pH, HCO3, NO3, SO42−, Cl, Na+, Ca2+, K+, Mg2+, As, Fe, Mn). The methodological framework combined multivariate statistical analyses, notably Principal Component Analysis (PCA) and Hierarchical Cluster Analysis (HCA), with geochemical modeling, water quality index (WQI) analysis, and GIS-based spatial distribution mapping. Hydro-geochemical analysis shows that the groundwater chemistry in the permeable Fıçıtepe and Kirazlı formations is primarily influenced by lateral seawater intrusion and water-rock interactions. The Principal Component Analysis (PCA) successfully distinguished between geogenic weathering processes and anthropogenic salinity inputs, indicating that seasonal over-abstraction reverses hydraulic gradients in sensitive coastal zones. As a result, hydrochemical facies change from Na-HCO3 in interior recharge areas to Na-Cl in coastal over-abstraction areas. Increased electrical conductivity (EC) and chloride concentrations were spatially linked with saltwater intrusion and high-populated tourism areas, depicting an important fraction of coastal groundwater unsuitable for drinking usage and irrigation due to elevated sodium adsorption ratio (SAR), residual sodium carbonate (RSC), and magnesium hazard exceeding the limits set by the World Health Organization (WHO) and Turkish drinking water standards. The groundwater is of type Na-HCO3, Na-CL, and Ca-Mg-HCO3. The Water Quality Index (WQI) assessment shows that groundwater quality for domestic use is frequently contaminated due to excessive EC, Cl-, Na+, SO42-, F-, As, Mn, and Fe content, requiring treatment before consumption. As of current, the island depends on submarine pipelines water supply to address its water deficit, the research highlights how important this dependence is during moments of peak demand. The findings' conclusion summarizes that sustainable water security needs the integration of Nature-Based Solutions, especially Managed Aquifer Recharge, to restore hydrodynamic equilibrium and mitigate the continuity of salinization fronts in the coastal aquifer.

How to cite: Zulal, K., Baba, A., and Gündüz, O.: Evaluation of Hydro-Geochemical Processes Affecting Groundwater Quality in Bozcaada Island Using Water Quality Index, Multivariate Statistical Analyses, and Spatial Distribution Mapping, EGU General Assembly 2026, Vienna, Austria, 3–8 May 2026, EGU26-16624, https://doi.org/10.5194/egusphere-egu26-16624, 2026.

EGU26-17099 | Orals | HS8.1.4

Innovative in situ treatments of NAPL source zones 

Richard Martel and Pejman Abolhosseini

Contaminated sites with non-aqueous phase liquid (NAPL) source zones are persistent due to the slow release of the dissolved phase in the generated plume. The groundwater quality criteria for many NAPL chemical compounds are very low, making complete remediation difficult.  Most of the ‘easy’ sites with shallow and accessible source zones were remediated using excavation and off site treatment or landfill, leaving the deep, complex and buried source zones under infrastructure to be treated, which requires in situ remediation technologies. The development of innovative solution involves a multi-scale experimental approach. This involves progressing from batch tests to evaluate compatibility and performance, to 1D column experiments to determine cleaning efficiency and NAPL recovery mechanisms, and finally to 2D and 3D sand tank models to visualize solute propagation and performance, prior to a field pilot test and the full implementation of the technology. This paper presents and discusses some examples of thermal (e.g. electrical resistivity heating and thermal conduction heating), chemical (e.g. surfactant, chemical oxidation and foam) and biological (e.g. enzyme) treatments, showing their limitations and the challenges to be overcome. 

How to cite: Martel, R. and Abolhosseini, P.: Innovative in situ treatments of NAPL source zones, EGU General Assembly 2026, Vienna, Austria, 3–8 May 2026, EGU26-17099, https://doi.org/10.5194/egusphere-egu26-17099, 2026.

EGU26-19419 | ECS | Orals | HS8.1.4

The effect of source discontinuities on steady-state plume extents 

Anton V. Köhler, Prabhas K. Yadav, Moulshree Tripathi, James R. Craig, Rudolf Liedl, Peter Grathwohl, and Peter Dietrich

Recent development of the Analytic Element Method (AEM) (Köhler et al., 2026) enables simulation of steady-state reactive transport in two-dimensional aquifers considering several types of contamination scenarios, which otherwise would only be feasible with numerical models.

But even in numerical models, source geometries and architectures are often overly simplified as, e.g., simple line or patch sources. Such simplifications may significantly impair the reliability of model results. The AEM approach facilitates the representation of more complex source shapes also including discontinuities and multiple sources by superposition of elements. In the developed 2D model, the contaminant sources are considered as a combination of line and circle elements of constant concentration.

The effect of source discontinuities on steady-state plumes is qualitatively evaluated for both horizontally and vertically oriented domains. Further, an empiric relation between both number and width of source discontinuities, and the maximum plume length, in both domain orientations is derived. Evaluation of plume lengths from synthetic cases provide a linear and quadratic dependency of the number and width of discontinuities, respectively. This leads to an empirical formulation of a simplified effective source extent based on these two parameters.

The results highlight the advantages of the AEM model for simulating practical cases, particularly, in the early assessment stages, but also show that the method is appropriate for gaining insight in complex problem settings at a conceptual modelling stage. Computationally efficient methods such as the AEM may also help in future developments as part of hybrid modelling approaches to improve early site assessment.


Köhler, A. V., Craig, J. R., Yadav, P. K.,&Liedl, R. (2026). An Analytic Element Method solution for simulating      multiple steady-state groundwater contamination scenarios. Journal of Contaminant Hydrology, 276,            104733. https://doi.org/10.1016/j.jconhyd.2025.104733

How to cite: Köhler, A. V., Yadav, P. K., Tripathi, M., Craig, J. R., Liedl, R., Grathwohl, P., and Dietrich, P.: The effect of source discontinuities on steady-state plume extents, EGU General Assembly 2026, Vienna, Austria, 3–8 May 2026, EGU26-19419, https://doi.org/10.5194/egusphere-egu26-19419, 2026.

Diffuse nitrate pollution in groundwater from intensive agriculture continues to contribute to a persistent risk to groundwater quality. While natural nitrate degradation processes can mitigate anthropogenic nitrate inputs, the available electron donors in the pore structure of aquifers, primarily pyrite (FeS₂) and organic carbon (Corg), are finite resources. Quantifying these resources is crucial for the long-term management of groundwater resources; however, the quality of this quantification is often limited by a lack of real-world data.

This study presents a comprehensive approach to characterizing denitrification potentials in various aquifers (porous and bedrock) based on solid-phase analysis of drill core samples combined with hydrochemical and isotopic data in the state of Sachsen-Anhalt, Germany. The methodology integrates the geochemical quantification of reducing agents with hydraulic parameters to calculate a specific lifetime of nitrate degradation (denitrification potential) for the historical reference period (1961 – 2020) and for future projections (2020 – 2100) using modeled groundwater recharge rates for the RCP 2.6 and RCP 8.5 climate scenarios.

The results show a clear division between aquifer types. Aquifers in bedrock (e.g., Keuper, bunter sandstone) exhibit high resilience with lifetimes > 10,000 years, primarily due to a high autotrophic denitrification potential. In contrast, porous aquifers, particularly the covered Pleistocene units, were identified as highly vulnerable groundwater systems. Historical analysis shows that these aquifers have significantly lower reducing agent reserves, resulting in lifetimes of less than 1,000 years. Future climate projections indicate a critical depletion of these resources, mainly driven by climate-related changes in groundwater recharge and continuous nitrate inputs. The remaining lifetime of porous aquifers is projected to decrease to less than 40 years in some cases this century under both climate scenarios, potentially leading to a large-scale nitrate breakthrough. The combination of rapidly depleting denitrification buffer and the hydraulic lag of the systems underscores the urgency of implementing strategies in vulnerable catchment areas, as reliance on natural attenuation is no longer a sustainable safeguard.

How to cite: Rößger, J. and Siebert, C.: Historic and future classification of nitrate degradation for porous and fractured aquifers in terms of their denitrification potential using isotopic, hydrochemical and borehole data, EGU General Assembly 2026, Vienna, Austria, 3–8 May 2026, EGU26-21109, https://doi.org/10.5194/egusphere-egu26-21109, 2026.

EGU26-115 | Orals | HS8.1.5

Upscaling mass transport with heterogeneous reaction, adsorptionand accumulation in porous media 

Francisco Valdés-Parada and Jessica Sánchez-Vargas

Modeling reactive mass transport in porous media systems is often performed using effective-medium approaches due to the difficulties of solving the microscale equations throughout the entire system. Under an effective-medium framework, transport processes at the solid-fluid interface are usually assumed to be quasi-steady with respect to the transport in the bulk phase that saturates the pores of the system. This has led to effective-medium models in which the reaction term is present in the macroscopic mass balance equation, which cannot be used to predict transport at the early stages of the process but rather under steady conditions. To address this issue, this work presents an alternative modeling approach in which transport at the interface is assumed to be unsteady. This leads to a macroscopic model consisting of a set of two coupled partial differential equations that can be used to predict the average concentration in the phase and at the interface under unsteady conditions. These equations are derived using the volume averaging method, which also allows for predicting the associated effective-medium coefficients by solving the corresponding closure problems in periodic unit cells. The model is validated through comparisons with direct numerical simulations under several transport and reaction conditions. From this analysis, and by comparison with a previously derived interface-steady model, specific situations in which the two-equation model excels compared to previous approaches are identified. The results of this work are relevant in many water resources, chemical, and biological systems involving the transport and adsorption of reactive species under unsteady conditions. 

How to cite: Valdés-Parada, F. and Sánchez-Vargas, J.: Upscaling mass transport with heterogeneous reaction, adsorptionand accumulation in porous media, EGU General Assembly 2026, Vienna, Austria, 3–8 May 2026, EGU26-115, https://doi.org/10.5194/egusphere-egu26-115, 2026.

EGU26-7734 | ECS | Posters on site | HS8.1.5

Chemically Reactive Transport in imperfect Hele-Shaw cell: 2-Phase Flow Experiments and Simulations 

Gauthier Legrand, Jordi Ortín Rull, and Tomás Aquino

Access to clean water is one of today’s major global challenges. Human health, food production and biodiversity all rely on groundwater, yet this vital resource is increasingly exposed to soil pollution. Substances such as pesticides, fertilizers, plastics and industrial chemicals seep into the ground and travel downwards with rainwater. Before reaching groundwater, pollutants must pass through soil layers that act as natural filters. These layers can slow down or transform contaminants, but their effectiveness is uncertain. Predicting whether pollutants stay trapped in the soil or reach aquifers remains a central unresolved problem in environmental science.

A key difficulty is that soils are highly heterogeneous. They contain pores and grains of different sizes, shapes and chemical properties, producing complex flow pathways where some regions transmit water rapidly while others remain stagnant. Most soils are also only partly saturated, with water coexisting alongside pockets of air. These air–water–solid interfaces strongly influence motion and mixing, often causing pollutants to spread in irregular, non-predictive ways. How all these processes combine under partially saturated conditions remains poorly understood.

This work aims at addressing this gap through controlled experiments and advanced simulations. The experimental work, uses a transparent soil analogue known as a Hele-Shaw cell: two glass plates separated by a thin gap and patterned with microstructures that reproduce aspects of natural soil heterogeneity. By injecting water, air, and chemical solutes into the cell and filming their movement with high-sensitivity cameras, I observe pollutant pathways and reactions directly under realistic but fully controlled conditions. Unlike standard column tests, this approach provides real-time visualization over large areas while still resolving fine spatial details.

This poster presents my preliminary work for the study chemical reactions in partially saturated soils, examining how structure and water content affect reaction rates when reactions are fast compared to molecular mixing. These experiments are complemented by detailed simulations using OpenFOAM, more specifically a solver developed by Krishna et al. By reproducing flow patterns in the Hele-Shaw cell and modeling chemical transport within them, the simulations help identify which microscopic processes most strongly control large-scale behavior.

How to cite: Legrand, G., Ortín Rull, J., and Aquino, T.: Chemically Reactive Transport in imperfect Hele-Shaw cell: 2-Phase Flow Experiments and Simulations, EGU General Assembly 2026, Vienna, Austria, 3–8 May 2026, EGU26-7734, https://doi.org/10.5194/egusphere-egu26-7734, 2026.

EGU26-7844 | ECS | Posters on site | HS8.1.5

Solute Mixing Under Unstable Two-Phase Flow in Heterogeneous Porous Media 

Eugenio Pescimoro, Marco Dentz, Juan J. Hidalgo, and Federico Municchi

Heterogeneous porous media saturated with two liquid phases represent a complex system that can be observed in many natural and engineering processes. The transport of passive solutes in this type of environment is at the centre of our research whose final aim is to quantify and mathematically describe the physical mechanisms that regulate the displacement of the solute, such as twisting and stretching. To analyse and quantify the dynamics of the solute mixing and dispersion, we rely on numerical simulations where a passive solute is transported by two fluids through a heterogeneous porous media, such as a reservoir or an aquifer. Based on the mutual miscibility of the fluids two main scenarios are identified, one where the fluids that transport the passive solute are miscible and one where they are immiscible. In both cases the passive solute can freely cross the interface between the two fluids. The setup for the numerical experiment is a three-dimensional flow and transport domain where permeability is represented by an indicator multi-Gaussian random field whose continuous parent fields are characterised by exponential covariance function. We prescribe the mean flow while periodic conditions are applied to the permeability on the lateral boundaries. The injection of the less viscous fluid into the domain saturated with a more viscous fluid happens along a control plane perpendicular to the mean flow direction. The consequent displacement of the more viscous fluid by a less viscous fluid leads to fingering instabilities. The flow fluctuations are governed by the unstable displacement of the two fluids and the spatial heterogeneity. To study the mixing of a passive solute in this flow, we consider an instantaneous solute injection over the control plane at time zero. For both scenarios, the solute dispersion is quantified in terms of the spatial moments of the solute distribution while mixing is measured through the scalar dissipation rate, dilution index, and the probability density function of concentration point values. Mixing metrics that show regular trends are fitted using power and exponential laws. Compared to the constant viscosity case, it is observed that the viscosity difference between the liquid phases enhances the mixing of the passive solute. 

How to cite: Pescimoro, E., Dentz, M., Hidalgo, J. J., and Municchi, F.: Solute Mixing Under Unstable Two-Phase Flow in Heterogeneous Porous Media, EGU General Assembly 2026, Vienna, Austria, 3–8 May 2026, EGU26-7844, https://doi.org/10.5194/egusphere-egu26-7844, 2026.

EGU26-8938 | Orals | HS8.1.5

Mixing of complex fluids in confined porous media 

Marco De Paoli and Sergio Pirozzoli

Convective mixing in porous media plays a central role in a wide range of geophysical and environmental processes, including geological CO2 storage, groundwater contamination, and reactive transport in subsurface formations. We investigate how fluid properties and boundary conditions control solutal convection and mixing in confined porous media. The system consists of two miscible fluid layers initially separated by a horizontal interface, where density variations are induced by solute concentration. Mixing can locally increase fluid density, triggering buoyancy-driven instabilities that enhance mass transport. The relative importance of convective and diffusive mechanisms is quantified by the Rayleigh-Darcy number. Using high-resolution numerical simulations, we explore mixing dynamics at high Rayleigh-Darcy numbers (O(10,000)) for fluids with different density-concentration relationships, including linear, parabolic, and piecewise non-monotonic laws. These scenarios are representative of realistic fluids encountered in subsurface applications, such as CO2-brine mixtures or chemically reactive solutes. We analyse how (i) the density contrast between the mixed fluid and the initial layers, and (ii) the concentration at which density is maximized relative to the initial conditions, influence the onset and efficiency of convective mixing. Across all cases considered, we find that the mixing process is controlled by the mean scalar dissipation rate, allowing us to develop simple physical models that capture the observed behaviour. We further assess the impact of boundary conditions on the mixing rate and identify configurations that promote efficient mixing. Finally, we compare two- and three-dimensional systems and discuss the implications of our results for predicting and optimizing solute transport in geophysical porous-media flows. Funded by the European Union (ERC, MORPHOS, 101163625). Views and opinions expressed are however those of the author(s) only and do not necessarily reflect those of the European Union or the European Research Council. Neither the European Union nor the granting authority can be held responsible for them.

How to cite: De Paoli, M. and Pirozzoli, S.: Mixing of complex fluids in confined porous media, EGU General Assembly 2026, Vienna, Austria, 3–8 May 2026, EGU26-8938, https://doi.org/10.5194/egusphere-egu26-8938, 2026.

EGU26-10198 | Orals | HS8.1.5

Enhanced mixing in porous media by dispersed two-phase flow 

Yang Liu, Marco Dentz, and Moran Wang

Efficient solute mixing in porous media is essential for a wide range of natural processes and industrial applications, including nutrient transport in biological systems, groundwater bioremediation, and carbon dioxide geological sequestration. The extent of mixing directly controls the rates of associated biological and chemical reactions. Although turbulence is widely employed to promote mixing due to its transient and chaotic nature, its effectiveness in porous media is severely limited by the presence of extensive solid boundaries that suppress turbulent fluctuations. In contrast, dispersed two-phase flows—characterized by inherently transient flow features—offer a promising alternative for enhancing mixing efficiency.

Despite substantial research on dispersion and mixing in two-phase flow systems, the majority of existing studies assume static phase interfaces [1]. However, dispersed two-phase flows are intrinsically associated with dynamic and evolving phase interfaces. While recent studies [2, 3] have begun to explore this issue, the pore-scale mechanisms that control solute transport and mixing in porous media under dispersed two-phase flow remain poorly understood.

In this study, we examine transverse solute mixing in porous media under dispersed two-phase flow and steady single-phase flow conditions using microfluidic experiments. The results show that, at a Péclet number of 1000, dispersed two-phase flow leads to a substantial enhancement of transverse mixing relative to single-phase flow. Mixing efficiency, quantified by the dilution index, is approximately doubled under dispersed two-phase flow compared with single-phase flow at identical injection rates. Complementary direct numerical simulations indicate that this improvement originates from transient flow structures, including vortex formation induced by dynamically evolving phase interfaces, which are absent in steady single-phase flow. Together, these findings offer new pore-scale mechanistic insights into solute mixing in porous media and highlight flow-regime modulation as an effective strategy for enhancing mixing performance.

Keywords: mixing; porous media; dispersed two-phase flow.

Reference

[1] J. Jiménez-Martínez, P.d. Anna, H. Tabuteau, R. Turuban, T.L. Borgne, Y. Méheust, Pore-scale mechanisms for the enhancement of mixing in unsaturated porous media and implications for chemical reactions, Geophys. Res. Lett. 42 (13) (2015) 5316-5324.

[2] J. Mathiesen, G. Linga, M. Misztal, F. Renard, T. Le Borgne, Dynamic Fluid Connectivity Controls Solute Dispersion in Multiphase Porous Media Flow, Geophys. Res. Lett. 50 (16) (2023) e2023GL105233.

[3] X. Zhang, Z. Dou, M. Hamada, P. de Anna, J. Jimenez-Martinez, Enhanced Reaction Kinetics in Stationary Two-Phase Flow through Porous Media, Environ. Sci. Technol. 59 (2) (2025) 1334-1343.

How to cite: Liu, Y., Dentz, M., and Wang, M.: Enhanced mixing in porous media by dispersed two-phase flow, EGU General Assembly 2026, Vienna, Austria, 3–8 May 2026, EGU26-10198, https://doi.org/10.5194/egusphere-egu26-10198, 2026.

EGU26-10467 | ECS | Posters on site | HS8.1.5

Investigating Permeability Anisotropy in a Rough Fracture: A Novel Shear-Flow Setup 

Sobhan Sheikhi, Jordi Ortín, and Tomás Aquino

The coupled flow, transport, and hydro-chemo-mechanical processes in fractured porous media have great relevance for numerous applications including underground water management, hydrocarbon recovery, CO2 sequestration, and geological waste disposal. We developed a novel experimental setup designed to investigate these coupled processes. The setup uses fully matched transparent rectangular fracture blocks. These blocks are created by molding a granite fracture surface with resin. The design of the experimental setup provides controlled shear and normal stresses with simultaneous measurement of the resulting stresses and displacement in both the normal and shear directions. The fluid is injected from the center and flows radially toward the outputs. There are nine discrete outlets per side to provide highresolution measurements of the redistribution of flow and permeability anisotropy at various flow and stress conditions. Moreover, we utilize high-resolution imaging to visualize real-time flow.


The results of shear-flow experiments showed that shear displacement enhances the permeability in the direction perpendicular to the applied shear stress. This anisotropic behavior is the result of the development of preferred flow paths due to the dilation and changes in the geometry of fractures caused by shear. 

This experimental setup enables us to study coupled hydraulic, mechanical, and chemical processes, with precise evaluation of permeability anisotropy under a wide range of conditions. In the next step, we will utilize this setup for two-phase flow studies, as it has often been a challenging complexity in fractured porous media.


*This reasearch activity is funded by Hydropore II project (PID2022-137652NB-C42)

How to cite: Sheikhi, S., Ortín, J., and Aquino, T.: Investigating Permeability Anisotropy in a Rough Fracture: A Novel Shear-Flow Setup, EGU General Assembly 2026, Vienna, Austria, 3–8 May 2026, EGU26-10467, https://doi.org/10.5194/egusphere-egu26-10467, 2026.

EGU26-10914 | Posters on site | HS8.1.5

Experimental validation of a depth-integrated model for immiscible two-phase flow in rough fractures 

Insa Neuweiler, Rahul Krishna, Rezaei Amin, Oshri Borgman, Francesco Gomez, and Yves Méheust

Displacement of a wetting fluid by a non-wetting fluid in fractured media is relevant to many subsurface applications, including fluid storage and groundwater contaminant remediation. Such flows are difficult to predict because they are governed by fracture-scale geometric heterogeneity embedded within complex fracture networks, which sets a large contrast of relevant length scales. The flow is also governed by the coupled action of viscous, capillary, and gravitational forces. These effects are further compounded by wetting films, contact-line dynamics, and spatial variations in wettability. As a result, developing models that are both computationally efficient and faithful to the governing physics remains challenging.

At the scale of individual fractures, two main modeling strategies are commonly employed. Fully resolved three-dimensional direct numerical simulations provide detailed descriptions of interfacial dynamics but are computationally expensive and impractical for extensive parameter exploration. Conversely, continuum-scale approaches offer efficiency but typically neglect aperture-scale hydrodynamic instabilities and geometric controls that govern displacement morphology. Recently, we introduced a two-dimensional depth-integrated model for immiscible two-phase flow in rough fractures [1], which retains the dominant hydrodynamic and capillary effects while substantially reducing computational cost. Although this model has been tested against idealized configurations and numerical benchmarks, its performance against laboratory experiments in realistic rough-walled fractures has not yet been systematically evaluated.

A direct comparison between model predictions and controlled drainage experiments was carried out using transparent fracture analogs and corresponding numerical simulations. The fracture geometry was first generated numerically as a self-affine rough fracture with a Hurst exponent of 0.8 and a domain size of 145 mm by 80 mm. The geometry has a mean aperture of 0.4 mm and a correlation length equal to one eighth of the fracture length, resulting in a strongly heterogeneous aperture field characterized by a relative closure of 0.57. The rough surfaces were fabricated by precision milling into polymethylmethacrylate plates [2]. The experimental fracture geometry was subsequently reconstructed from X-ray tomography and employed directly in the numerical simulations. Drainage experiments were conducted with three immiscible fluid pairs spanning viscosity ratios of 1/200, 1/100, and 70, and capillary numbers between 10−3.0 and 10−7.0, thereby covering viscous-dominated stable and unstable, as well as capillary-dominated, displacement regimes. Two-dimensional depth-integrated simulations were performed under identical flow conditions, enabling direct comparison. Model performance is assessed using quantitative descriptors of invasion dynamics, including displacement morphology, finger width, interfacial length evolution, breakthrough saturation, and longitudinal saturation profiles.

The depth-integrated model reproduces the dominant displacement features observed in the experiments while requiring substantially less computational effort than fully resolved three-dimensional simulations. This demonstrates its suitability as an efficient and physically consistent framework for studying immiscible two-phase flow in rough-walled fractures.

[1] Krishna, R., Méheust, Y. and Neuweiler, I., 2025. A two-dimensional depth-integrated model for immiscible two-phase flow in open rough fractures. Journal of Fluid Mechanics, 1011, p.A43.

[2] Amin Rezaei, Francesco Gomez Serito, Insa Neuweiler, Yves Méheust. Dynamic Displacement of Wetting Fluids by Non-Wetting Fluids in a Geological Fracture: An Experimental Study. American Geophysical Union Annual Meeting 2024 (AGU24), Dec 2024, Washington DC, United States. pp.H53K-1232

How to cite: Neuweiler, I., Krishna, R., Amin, R., Borgman, O., Gomez, F., and Méheust, Y.: Experimental validation of a depth-integrated model for immiscible two-phase flow in rough fractures, EGU General Assembly 2026, Vienna, Austria, 3–8 May 2026, EGU26-10914, https://doi.org/10.5194/egusphere-egu26-10914, 2026.

EGU26-11786 | ECS | Posters on site | HS8.1.5

Flow statistics in a 2D disordered pillar array 

Jose Arnal, Guillem Sole-Mari, and Tomás Aquino

This work investigates steady Stokes flow through a two-dimensional array of circular obstacles. We develop a minimal statistical model for the flow rate distribution based on a mapping of the pore space to a network of Poiseuille-flow tubes. Our work shows that the flow rate at the pore bodies follow a Gamma distribution, and that the flow distribution at the pore throats is fully determined in terms of it. Furthermore,  the parameters of this Gamma distribution are satisfactorily linked to the geometrical properties of the the medium. The predictions agree closely with computational fluid dynamics simulations and show better agreement than prior mean-field models, clarifying how local splitting and merging shape flow in disordered porous networks.

How to cite: Arnal, J., Sole-Mari, G., and Aquino, T.: Flow statistics in a 2D disordered pillar array, EGU General Assembly 2026, Vienna, Austria, 3–8 May 2026, EGU26-11786, https://doi.org/10.5194/egusphere-egu26-11786, 2026.

EGU26-13355 | ECS | Posters on site | HS8.1.5

Influence of Soil Heterogeneity and Gravity Fingers on Unsaturated Flow During Infiltration–Evaporation Cycle 

Yajaira Castillo, Juan Hidalgo, and Marco Dentz

Water infiltration in the vadose zone is a transient and unstable process influenced by several factors, including the non-linearity of soil hydraulic properties, rapidly changing boundary conditions, root growth, hysteresis, and soil heterogeneity. As a result, infiltration is often non-uniform and develops into preferential flow. This complex phenomenon, commonly manifested as gravity fingers, originates from wetting-front instabilities and saturation overshoot, the latter being a prerequisite for finger formation.

Experimental studies have consistently shown that infiltration into both homogeneous and heterogeneous soils frequently produces preferential pathways in the form of fingers. However, simulations of unsaturated flow typically rely on the Richards equation, which accounts only for local capillary pressure and therefore fails to reproduce preferential flow patterns. Alternative formulations have been proposed to overcome this limitation, such as the model by Cueto-Felgueroso et al. (2020), which incorporates non-local capillary effects.

In this work, we investigate unsaturated flow under infiltration–evaporation cycles, explicitly considering soil heterogeneity and the formation of gravity fingers. Our objective is to improve the modeling of infiltration and evaporation processes in soils, to better predict water flow behavior, and to characterize the impact of soil heterogeneity, non-linear properties, and gravity fingers on these processes. We are comparing two modeling approaches: the traditional Richards equation and the fourth-order spatial derivative model proposed by Cueto-Felgueroso et al. (2020). Flow is solved using the finite element library FEniCS, and soil heterogeneity is represented by Gaussian random permeability fields with varying correlation lengths and variances.

Keywords: infiltration and evaporation cycles, unsaturated flow, heterogeneity, gravity fingers, finite element method.

References

Luis Cueto-Felgueroso, Marı́a José Suarez-Navarro, Xiaojing Fu, and Ruben Juanes. Numerical simulation of unstable preferential flow during water infiltration into heterogeneous dry soil. Water, 12(3):909, 2020.

How to cite: Castillo, Y., Hidalgo, J., and Dentz, M.: Influence of Soil Heterogeneity and Gravity Fingers on Unsaturated Flow During Infiltration–Evaporation Cycle, EGU General Assembly 2026, Vienna, Austria, 3–8 May 2026, EGU26-13355, https://doi.org/10.5194/egusphere-egu26-13355, 2026.

EGU26-14139 | Orals | HS8.1.5

A “Coulomb friction” model of two-phase flow in a rough fracture 

Mykyta V. Chubynsky, Marco Dentz, Jordi Ortín, and Ran Holtzman

An “imperfect” Hele-Shaw cell (IHSC) with random variations of the aperture provides a useful analogue for a rough fracture. For flow of two immiscible fluids with a single interface between the phases in an IHSC tilted with respect to the horizontal plane, with pressure control at the inlet, there are, in general, multiple equilibrium interface profiles. This leads to hysteresis (history dependence) of the interface evolution and finite energy dissipation even in the limit of infinitely slow (quasistatic) driving, due to Haines jumps between the equilibria.

We use a recently developed spectral method that predicts the interface evolution and energy dissipation in such a system with high accuracy and computational efficiency. We show that, given the inlet pressure, the set of equilibrium interface configurations forms a band with rough boundaries. This constitutes a “sticky region”: an interface starting within it only undergoes minor deformations (maintaining its overall position without moving as a whole), whereas an interface starting outside it advances to the nearest boundary of the region. Drawing analogy between this behaviour and that of an object in a well with dry (Coulomb) friction, we hypothesise — and confirm numerically — that if the motion of the interface is reduced to a single variable, the mean height, then the evolution of this variable follows a simple law akin to a combination of viscous and dry friction. We then proceed to study systematically how the “dry friction” coefficient depends on the properties of the cell’s roughness, such as the aperture variance and the correlation length. Our results may serve as an input to an upscaled model of flow in fractures, replacing the full aperture field (typically unknown) with continuum roughness parameters.

How to cite: Chubynsky, M. V., Dentz, M., Ortín, J., and Holtzman, R.: A “Coulomb friction” model of two-phase flow in a rough fracture, EGU General Assembly 2026, Vienna, Austria, 3–8 May 2026, EGU26-14139, https://doi.org/10.5194/egusphere-egu26-14139, 2026.

EGU26-14555 | Orals | HS8.1.5

Linking flow and structure in heterogenous porous and karstic networks 

Marco Dentz, Philippe Gouze, and Alexandre Puyguiraud

The sound quantification of the flow distribution in heterogenous groundwater systems is
a cornerstone for the prediction of solute dispersion and solute travel times with implications
for the assessment of the vulnerability and management of groundwater resources.  
A broad distribution of flow velocities leads to a broad distribution of mass transfer times,
which is at the root of non-Fickian transport features such as strong tailings of solute breakthrough curves.
The relation between the medium structure and the distribution of flow rates and flow velocities
is a missing link that would allow to estimate solute dispersion directly from the hydraulic medium
properties. While the structure-flow relation is well known for simple stratified
and composite medium geometries, it remains an open question for flow in heterogeneous pore,
fracture and karst networks. To decipher this relation, we analyze flow rate and velocity statistics
across heterogeneous networks of different connectivities and conductance distributions. We quantify
the average flow in terms of the effective conductivity and the full statistics in terms of the
probability density function of flow rates and flow velocities, which are the key quantities for
the prediction of solute transport. The analysis of the conditional flow statistics reveals that
flow in random networks is organized in distinct substructures of different hydraulic
behaviors. These structures can be delineated using percolation theory. The flow distribution can
then be quantified by the interaction between these structures using a random aggregation approach.  

How to cite: Dentz, M., Gouze, P., and Puyguiraud, A.: Linking flow and structure in heterogenous porous and karstic networks, EGU General Assembly 2026, Vienna, Austria, 3–8 May 2026, EGU26-14555, https://doi.org/10.5194/egusphere-egu26-14555, 2026.

EGU26-14619 | Posters on site | HS8.1.5

The role of reactive air–water interfaces in contaminant transport in the vadose zone 

Daniel Dominguez Vazquez, Hui Wang, Khalil Hanna, Guillem Sole-Mari, Oshri Borgman, Joris Heyman, Tanguy Le Borgne, Yves Méheust, and Tomás Aquino

Under unsaturated conditions, the coexistence of air and water generates complex, dynamically evolving interfacial structures, whose impact on solute mixing, residence times, and reactivity remains poorly understood at the pore scale. Substances transported in the water phase can interact with the air phase at the fluid-fluid interface. In particular, per- and polyfluoroalkyl substances (PFAS) are emerging contaminants of concern that are known to preferentially accumulate at air–water interfaces, where interfacial processes control their retention and mobility in the vadose zone. Darcy-scale models and experimental observations suggest that transient hydrological conditions and interfacial area dynamics can strongly influence PFAS fate. However, the pore-scale mechanisms governing transport toward air–water interfaces and the resulting mixing-limited reactivity remain largely unexplored even under steady flow. This gap limits the development of models capable of upscaling pore-scale interfacial mixing processes and predicting solute fate at larger spatial and temporal scales. We investigate these mechanisms using a Lagrangian particle-tracking approach to resolve solute transport in steady two-dimensional pore-scale flow fields under partial saturation. Solute trajectories are governed by advection, diffusion, and interactions with both fluid–fluid (air–water) and fluid–solid interfaces, enabling direct quantification of interfacial encounter statistics and residence-time distributions. These metrics provide natural descriptors of mixing-limited regimes, in which effective reaction rates are controlled by transport toward interfacial zones rather than intrinsic kinetics, and allow identification of pore-scale features that control the large-scale evolution of solute transport. This study contributes to ongoing efforts to connect pore-scale physical processes with effective models of solute transport in the vadose zone, with direct implications for predicting the fate of reactive contaminants under transient unsaturated conditions.

How to cite: Dominguez Vazquez, D., Wang, H., Hanna, K., Sole-Mari, G., Borgman, O., Heyman, J., Le Borgne, T., Méheust, Y., and Aquino, T.: The role of reactive air–water interfaces in contaminant transport in the vadose zone, EGU General Assembly 2026, Vienna, Austria, 3–8 May 2026, EGU26-14619, https://doi.org/10.5194/egusphere-egu26-14619, 2026.

EGU26-14901 | Orals | HS8.1.5

Pore network modeling of drying-induced salt precipitation 

Ran Holtzman, Nihal-Muhammed Habeeb, Fatima-Zohra Sahraoui, Mykyta V. Chubynsky, and Lucas Goehring

Evaporation of brine leads to salt precipitation, which can clog pores and affect further evaporation and reactions. The transport of vapor and liquid, reactions and the intricate feedback of these with change in transport properties are influenced by microstructural heterogeneity at the pore (micron to cm) scale, however their impact is felt at scales of meters and above. Evaporation-induced salt precipitation is of interest to for cultural heritage, as well as mineralization in carbon geosequestration. We present a modeling platform based on a computationally-efficient pore-network approach, that aims to perform this upscaling. The model is trained and validated by laboratory mock-ups: glass bead samples soaked in brine and left to dry under controlled environmental conditions. We apply this to study the impact of the type of salt, initial salt concentration, and the dependence of the vapor pressure on salt concentration, on the amount, location and timing of salt precipitation.

How to cite: Holtzman, R., Habeeb, N.-M., Sahraoui, F.-Z., Chubynsky, M. V., and Goehring, L.: Pore network modeling of drying-induced salt precipitation, EGU General Assembly 2026, Vienna, Austria, 3–8 May 2026, EGU26-14901, https://doi.org/10.5194/egusphere-egu26-14901, 2026.

EGU26-16493 | Posters on site | HS8.1.5

Optimal strategies for assigning prior boundary settings in Hydraulic Tomography analysis 

Xiaoru Su and Tian-Chyi Jim Yeh

Hydraulic tomography (HT) is a high-resolution method for identifying aquifer hydraulic property heterogeneity. Despite decades of development that have led to the relative maturation of HT, the influence of prior boundary information on HT estimations remains insufficiently explored. In this study, HT methods were applied to a synthetic heterogeneous aquifer to examine the impacts of boundary condition types, boundary sizes, and prescribed head values on parameter estimation. The results indicate that boundary size has a limited impact on HT outcomes, regardless of data adequacy, whereas boundary condition type plays a critical role in HT inversion. Increasing the boundary size can mitigate errors arising from incorrect assumptions about boundary type. The SimSLE-HCA iterative algorithm effectively estimates optimal boundary head values when sufficient HT survey data are available. For practical applications, when the boundary size is unknown, a moderate expansion of the simulation domain is recommended. When the boundary type is uncertain, specifying a constant-head boundary is a practical and robust choice.

How to cite: Su, X. and Yeh, T.-C. J.: Optimal strategies for assigning prior boundary settings in Hydraulic Tomography analysis, EGU General Assembly 2026, Vienna, Austria, 3–8 May 2026, EGU26-16493, https://doi.org/10.5194/egusphere-egu26-16493, 2026.

EGU26-19683 | ECS | Orals | HS8.1.5

Evaluation of uncertainty in kinetically controlled and unsaturated heterogeneous reservoirs under wastewater-groundwater mixing  

Micaela Raviola, Daniela Cabiddu, Marianna Miola, Tommaso Sorgente, Simone Pittaluga, and Marino Vetuschi Zuccolini

Effective management of Managed Aquifer Recharge (MAR) systems is strongly influenced by the interplay between geological reservoir features and kinetically controlled geochemical reactions. The former are often approximated by a simple geometrical distribution of hydrofacies, while the latter are approximated as unreactive systems or as systems that always reach geochemical equilibria. Fluid-rock interactions induce modifications of the physical-chemical characteristics of the mineral porous medium, the dissolved gases compositions, and the aqueous solution. This setup induces modifications in preferential flow paths, pollutant residence time, and pollutant persistence in the reservoir. The numerical simulation of such multiphase systems is thus challenging due to the combined nonlinear and time-dependent effects acting on them. The presented results focus on the evaluation of the multifaceted uncertainty through a sensitivity analysis, derived from the quantification of the individual impact of: (i) the adaptive spatial discretization resolution, (ii) the kinetically controlled processes, and (iii) the heterogeneity uncertainty in multiphase reactive transport simulations. A MAR system is modelled over a highly heterogeneous geological section, accounting for reactive processes associated with water-rock-gas interactions. These processes are evaluated through the Transition State Theory. The workflow involves (i) geometric spatial discretization of the reservoir in the form of an unstructured mesh, coupled with geostatistical generation of porosity and permeability fields (as continuous and categorical variables, respectively) using MUSE software (Miola 2025, PhD thesis & EGU25); (ii) segmentation of the domain into homogeneous regions via FSUM (Sorgente et al. 2026, Computers & Geosciences) and localized mesh refinement with an increase of details over hydraulic impedance surfaces; (iii) conversion of stochastic geological models into data formats, and (iv) execution of parallel multiphase reactive transport simulations with PFLOTRAN (Hammond et al. 2014, Water Resources Research). The entire process is managed through EWOPE (Miola et al. 2026, Computers & Geosciences), an open-source computational workflow tracker, which ensures full reproducibility and traceability by recording metadata, enabling the backward reconstruction of computational history and a deep analysis of the single multi-realization computations, the core of the uncertainty evaluation. Simulation results indicate that a MAR can be planned and managed by considering a multi-scenario involving variations in unsaturated medium properties, pollutant arrival times, and variations in the flow patterns, from a probabilistic point of view.

How to cite: Raviola, M., Cabiddu, D., Miola, M., Sorgente, T., Pittaluga, S., and Vetuschi Zuccolini, M.: Evaluation of uncertainty in kinetically controlled and unsaturated heterogeneous reservoirs under wastewater-groundwater mixing , EGU General Assembly 2026, Vienna, Austria, 3–8 May 2026, EGU26-19683, https://doi.org/10.5194/egusphere-egu26-19683, 2026.

EGU26-20332 | Posters on site | HS8.1.5

Dynamics of gravity currents in heterogeneous porous media 

Juan J. Hidalgo and Albert Jiménez-Ramos

We numerically analyze the impact of the porous media heterogeneity in the mixing, migration and spreading of a CO2 gravity current in a saline aquifer. Heterogeneity is represented by multi-Gaussian log-permeability fields of varying correlation length and variance of the log-permeability. We characterize the dynamics of the gravity current using the quantity of buoyant mass, the scalar dissipation rate, and the mixing interface width and length. The results show that, at initial times, heterogeneity favors mixing because of increased the interface length and tortuosity. CO2 gets trapped in low permeability regions and dissolves faster due to high concentration gradients. At later times, low permeability regions prevent the formation and proliferation of fingering instabilities and mixing is similar to homogeneous media. Only for large anisotropy ratio or high variance permeability fields, we observe a more efficient mixing in heterogeneous media compared to the homogeneous media.

How to cite: Hidalgo, J. J. and Jiménez-Ramos, A.: Dynamics of gravity currents in heterogeneous porous media, EGU General Assembly 2026, Vienna, Austria, 3–8 May 2026, EGU26-20332, https://doi.org/10.5194/egusphere-egu26-20332, 2026.

EGU26-23099 | ECS | Orals | HS8.1.5

A geometric parameter linking aperture heterogeneity and drainage morphology in rough fractures 

Rahul Krishna, Yves Méheust, and Insa Neuweiler

The immiscible displacement of a wetting fluid by a non-wetting fluid (drainage) in rough-walled fractures is central to subsurface applications such as CO₂ sequestration and underground hydrogen-storage. Predicting displacement outcomes, including residual trapping and invasion morphology, requires understanding how viscous and capillary forces interact with fracture-scale geometric heterogeneity. In horizontal systems, where gravity effects are negligible, this interaction gives rise to complex and spatially variable invasion patterns. In porous media, drainage morphologies are commonly interpreted using the viscosity ratio M and capillary number Ca within the classical framework of [1]. However, even within this framework, the influence of structural heterogeneity on displacement patterns remains unresolved. In rough fractures, aperture variations introduce an additional geometric control that further complicates this picture. The competition between smoothing by in-plane interfacial curvature and roughening induced by out-of-plane aperture variability makes invasion morphologies difficult to predict [2]. As a result, the commonly used roughness measure, the closure δ, is insufficient: fractures with identical δ can exhibit markedly different invasion patterns under identical flow conditions.

A more complete geometric description must therefore account for both the amplitude and spatial organization of aperture variability. The fracture aperture field a(x,y), is characterized not only by its variance σa but also by a lateral correlation length Ic relative to the fracture length L. Focusing on the out-of-plane contribution to capillary pressure, which scales with ,1/a(x,y) we derive a dimensionless geometric parameter quantifying capillary heterogeneity. Introducing Ic as the characteristic lateral scale of variability leads to a dimensionless parameter which links aperture variance and spatial correlation to capillary pressure fluctuations. This formulation revisits the curvature-ratio introduced by [2], while reformulating it in terms of statistically measurable aperture variability, yielding a practical geometric measure of capillary heterogeneity.

Direct numerical simulations of horizontal drainage were performed using a validated Volume-of-Fluid framework [3] for Ca between 10-2 and 10-5 and M=0.1, 0.8. Synthetic self-affine fractures with systematically varied mean aperture, aperture variance, and correlation length were considered. Displacement morphology was quantified using fractal dimension, fluid-fluid interfacial length, and typical finger width. Preliminary results show that fractures sharing similar values of the aforementioned dimensionless parameter, exhibit comparable invasion structures, regardless of how the roughness is generated, indicating that this parameter provides a physically grounded link between fracture geometry and drainage morphology.

[1] Lenormand, R., Touboul, E., & Zarcone, C. (1988). Numerical models and experiments on immiscible displacements in porous media. Journal of fluid mechanics, 189, 165-187.

[2] Glass, R. J., Rajaram, H., & Detwiler, R. L. (2003). Immiscible displacements in rough-walled fractures: Competition between roughening by random aperture variations and smoothing by in-plane curvature. Physical Review E, 68(6), 061110.

[3] Krishna, R., Méheust, Y., & Neuweiler, I. (2024). Direct numerical simulations of immiscible two-phase flow in rough fractures: Impact of wetting film resolution. Physics of Fluids, 36(7).

How to cite: Krishna, R., Méheust, Y., and Neuweiler, I.: A geometric parameter linking aperture heterogeneity and drainage morphology in rough fractures, EGU General Assembly 2026, Vienna, Austria, 3–8 May 2026, EGU26-23099, https://doi.org/10.5194/egusphere-egu26-23099, 2026.

EGU26-23109 | ECS | Orals | HS8.1.5

Diffusiophoresis of colloids in partially saturated three-dimensional porous media 

Guillem Sole-Mari, Saif Farhat, Diogo Bolster, and Mamta Jotkar

The term diffusiophoresis refers to the phenomenon by which colloids migrate following salt concentration gradients. The strength of this effect actually follows a logarithmic scaling, and thus the diffusiophoretic drift can be very pronounced over small salt concentration variations when those concentrations are low. Therefore, this phenomenon could potentially be engineered for colloid manipulation. In the context of porous media, the emerging colloid transport behaviors that can arise from diffusiophoresis are still not fully understood. Some recent two-dimensional experimental and simulation results have demonstrated upscaled effects of diffusiophoresis in porous media. Depending on the sign of both the diffusiophoretic coefficient and the concentration gradients, diffusiophoresis can lead to either increased retention or increased flushing of colloids in the medium. This is magnified in the presence of pronounced small-scale medium heterogeneities, which are able to support concentration gradients for relatively longer times. Because water velocity fields are a lot more heterogeneous in the presence of air, unsaturated conditions enhance the accumulation or depletion of colloids. How these two-dimensional findings apply to natural three-dimensional porous media is still unclear, since recent work has shown that, compared to their two-dimensional counterparts, water velocity fields in unsaturated three-dimensional media tend to display a markedly lower occurrence of very low velocity regions, and a distinct non-monotonic behavior of mixing as a function of saturation. These features affect solute gradients and are therefore expected to have an impact on diffusiophoretic drift. Hence, the goal of the work presented here is to elucidate the effective behavior of diffusiophoresis in three-dimensional unsaturated porous media. We perform high-performance computing pore-scale simulations of Stokes flow at various saturation degrees and solute–colloid transport with diffusiophoretic drift. We identify the upscaled behaviors and their dependence on parameter configurations, and we compare them to the two-dimensional case. Our results provide new insight into how diffusiophoretic mechanisms operate under realistic three-dimensional unsaturated flow conditions, revealing scenarios in which diffusiophoresis can substantially influence colloid mobility and retention in porous media.

How to cite: Sole-Mari, G., Farhat, S., Bolster, D., and Jotkar, M.: Diffusiophoresis of colloids in partially saturated three-dimensional porous media, EGU General Assembly 2026, Vienna, Austria, 3–8 May 2026, EGU26-23109, https://doi.org/10.5194/egusphere-egu26-23109, 2026.

EGU26-942 | ECS | Orals | HS8.1.8

Investigating the Occurrence of Riverine Microplastic Pollution in Western Himalayan region 

Nikita Gupta, Dr. Tanushree Parsai, and Dr. Harshad Vijay Kulkarni

The Himalayas are critical geographical regions, recognized for their remarkable beauty; however, plastic littering in the Himalayas is increasing exponentially due to ignorance in every matrix. Due to long-term nescience, the degradation of microplastics has been observed and found ubiquitous. Microplastics (MPs) belong to plastic particles less than 5 mm in size. The MPs are one of the critical environmental contaminant reported by various studies, such as oceans, rivers, lakes, and estuaries. Yet, their distribution in western Himalayan river systems are poorly understood. To understand this knowledge gap in research, this study provides a brief quantification, characterization, and its fate in selected western Himalayan rivers: Beas river, Parvati river, Uhl river, and Suketi river, originating from high altitude. Sediment samples were collected from 25 locations, while sampling, field images were taken to understand the source of contamination. The established protocol was performed for pre-treatment process involving sediment sieving: coarse sand (4.75 mm-2.36 mm), medium sand (2.36 mm-0.3 mm), fine sand (0.3mm-0.075mm), siltyclay (<0.075mm) and their organic digestion, and density separation for MPs. Afterward, isolated MPs were followed for visual identification, Raman spectroscopy and Fe-SEM analysis represented polymer specification and surface weathering. The results reveal notable spatial variations with highest MPs concentration 185±14 MPs/gm in Beas river followed by 182±15 MPs/gm in Suketi river due to direct waste disposal. The trend followed by MPs concentration in sediment fraction were siltyclay> fine sand> medium sand, including remote locations. All the samples resulted transparent MPs within the size range of 10-20 µm mainly belonging to PVDF (polyvinylidene fluoride), followed by PEG (polyethylene glycol), PE (polyester), and others prevailing types of MPs. The MPs was notably higher in siltyclay sediment fraction, which are easily transported from higher altitude to lower altitude. This study offers novel insights into the fate of MPs in fragile mountain ecosystems and emphasizes the role of sediments as an important reservoir influencing pollutant transport.

Keywords- Himalayas, Microplastics, Sediment fraction, Raman Spectroscopy, Fe-SEM

How to cite: Gupta, N., Parsai, Dr. T., and Kulkarni, Dr. H. V.: Investigating the Occurrence of Riverine Microplastic Pollution in Western Himalayan region, EGU General Assembly 2026, Vienna, Austria, 3–8 May 2026, EGU26-942, https://doi.org/10.5194/egusphere-egu26-942, 2026.

EGU26-983 | ECS | Orals | HS8.1.8

Membrane technologies for the effective removal of Per- and Polyfluoroalkyl substances from contaminated water 

Longjam Riccirani Chanu and Bhaskar Jyoti Deka

Per- and Polyfluoroalkyl substances (PFAS), also known as “forever chemicals” pose significant environmental and health risks due to their persistence, mobility, and resistance to conventional water treatment methods. PFAS entirely contaminates the earth, but monitoring data are often scarce, limited, or hard to access. The strong C-F (536 kJ/mole) bonds allow them to accumulate in the environment, wildlife, and human bodies, leading to potential health risks such as cholesterol, immune system suppression, thyroid disease, cancer, and  other developmental issues. PFAS contamination in water bodies, landfill leachates, soils, and the atmosphere is a growing concern globally. Previous studies in India detected PFAS in surface water (up to 23.1 ng/L), tap water (10-100 ng/L), and in biotas like fish, shrimp, and dolphins (0.093-83.9 ng/g), human breast milk. Treatment of PFAS-contaminated water, soil and wastewater is essential to ensure the destruction of persistent chemicals harmful to the surrounding environment. Traditional treatment technologies, such as biological treatment processes, chemical processes such as coagulation and chlorination, and physical processes such as sand filtration, cannot eliminate these pollutants. Membrane technologies particularly nanofiltration (NF), reverse osmosis (RO), membrane distillation (MD) offer an advanced and sustainable solution for removing persistent PFAS from contaminated water, landfill leachates, and industrial effluents. Processes such as NF, RO, MD, provide high rejection of both long and short chain PFAS, enabling effective cleanup where conventional treatments fail. Their selectivity, efficiency and compatibility with hybrid systems make membranes a powerful tool for mitigating PFAS across diverse environmental systems. This study highlights the importance of advanced membrane technologies for the remediation of PFAS contaminated water.

How to cite: Chanu, L. R. and Deka, B. J.: Membrane technologies for the effective removal of Per- and Polyfluoroalkyl substances from contaminated water, EGU General Assembly 2026, Vienna, Austria, 3–8 May 2026, EGU26-983, https://doi.org/10.5194/egusphere-egu26-983, 2026.

EGU26-1517 | ECS | Orals | HS8.1.8

A Novel Approach to Contaminant Transport Modelling for Groundwater Sustainability 

Kamalakanta Sahu, Sumedha Chakma, and Yellamelli Ramji Satyaji Rao

Drinking water is essential for sustaining households, industries, and agriculture, yet groundwater—the primary source across the Mahanadi Sub-Basin is increasingly burdened by human-driven pollution. This study employs FEFLOW to model the co-transport of nitrate and PFAS (per- and polyfluoroalkyl substances) over a ten-year period, marking the first integrated assessment of their linked behavior in the region. With a calibrated accuracy exceeding 90%, the model reveals that both contaminants share overlapping pathways influenced by aquifer slopes, hydraulic gradients, and pumping stresses. The simulations show that regions with intense agricultural activity and legacy waste disposal exhibit simultaneous rises in nitrate and PFAS levels, indicating common pollution sources and co-migration mechanisms. Purnokot emerges as the most impacted zone, where the convergence of these contaminants underscores the vulnerability of local aquifers. High nitrate concentrations in the eastern and southeastern sectors are driven by fertilizer inputs and landfill leachate, while PFAS plumes persist and extend due to their low sorption and high mobility—often mirroring nitrate distribution patterns. Together, these contaminants pose serious health risks, particularly for infants, pregnant women, and communities exposed to long-term PFAS accumulation. Although some wells may remain usable for irrigation with appropriate treatment, the study highlights the need for continuous monitoring, regulated chemical usage, and smarter water-management tools including sensors and real-time alert systems. Strengthening community engagement and adopting sustainable farming practices will be crucial for protecting public health and ensuring groundwater security in the future.

How to cite: Sahu, K., Chakma, S., and Rao, Y. R. S.: A Novel Approach to Contaminant Transport Modelling for Groundwater Sustainability, EGU General Assembly 2026, Vienna, Austria, 3–8 May 2026, EGU26-1517, https://doi.org/10.5194/egusphere-egu26-1517, 2026.

EGU26-1679 | ECS | Orals | HS8.1.8

When Co-Contaminants Compete: Limits of PFAS sorption in mixed-contaminant groundwater 

Alexandra Hockin, Bas van der Grift, Wolter Siegers, Thomas van Kuik, Alraune Zech, and Johan van Leeuwen

Per- and polyfluoroalkyl substances (PFAS) are increasingly detected in groundwater co-contaminated with conventional pollutants, such as hydrocarbons, heavy metals and chlorinated solvents. Such mixtures are challenging for groundwater treatment because co-contaminants can strongly compete with PFAS for sorption sites, thereby reducing sorbent performance. Moreover, while ion-exchange resins and activated carbon remain the industry standards for PFAS removal, innovative sorbents may offer new pathways for improved PFAS removal. Understanding the sorption behaviour of PFAS in the presence of co-contaminants is essential for designing effective groundwater treatment strategies for complex contaminated sites.  

In this study we investigate the performance of 17 sorbents for PFAS removal in co-contaminated groundwater. The sorbents included 6 industry standards, ion exchange resins (n=3), activated carbon (n=3), as well as 11 innovative sorbents: surface-modified bentonites (n=2), surface-modified zeolites (n=3), proteins (n=3), a cyclodextrin (n=1), an iron-oxide based material (n=1) and an activated carbon/aluminum hydroxide-based material (n=1). The groundwater tested was pre-treated to remove volatile aromatic hydrocarbons but contained high dissolved organic carbon (20 mg/L) and had elevated ionic strength (0.017 M), along with residual phenols (phenol index: 7.3 µg/L) and mineral oil (C10–C40: 60 µg/L), concentrations typical for residually contaminated groundwater. PFAS concentrations were dominated by PFOA (~830 ng/L) and PFOS (~100 ng/L), with additional short-chain PFAS, e.g. PFBA (24 ng/L) and PFBS (18 ng/L).

All sorbents were initially screened at two sorbent concentrations (0.1 and 1.0 mg/L) and the six best performing sorbents were tested on a range of eight sorbent concentrations (0.01-2.0 mg/L). Finally, column experiments were performed with three sorbents to simulate full-scale treatment plant flow conditions. Despite residual co-contamination, several sorbents achieved high (>96%) PFAS removal at 1.0 g/L. Notably, at low sorbent concentrations albumin, an egg-based protein, showed PFOA removal comparable to activated carbon at the same sorbent concentration (~30%), whereas casein, a bovine milk-based protein, was contaminated and caused PFOA concentrations in the groundwater to increase to 2500 ng/L. Sorption capacities (Langmuir qmax) ranged from 1.24 to 10.45 µg/g, with ion-exchange resins highest. All sorbents were sensitive to interfering co-contaminants, which was especially apparent at low sorbent concentrations (10-50 mg/L). Overall, this study highlights that the presence of co-contaminants can substantially interfere with the sorption of PFAS in groundwater treatment and underscores the need for sorbents capable of maintaining high PFAS removal efficiencies under the complex chemical conditions typical of co-contaminated groundwater.

How to cite: Hockin, A., van der Grift, B., Siegers, W., van Kuik, T., Zech, A., and van Leeuwen, J.: When Co-Contaminants Compete: Limits of PFAS sorption in mixed-contaminant groundwater, EGU General Assembly 2026, Vienna, Austria, 3–8 May 2026, EGU26-1679, https://doi.org/10.5194/egusphere-egu26-1679, 2026.

EGU26-2057 | Posters on site | HS8.1.8

Interaction and Cotransport of λ-Cyhalothrin and Chitosan in Saturated Quartz Sand: Sorption Mechanisms and Remediation Implications 

Vasileios Katzourakis, Evangelia Xenou, Anastasios Malandrakis, and Constantinos Chrysikopoulos

The λ-Cyhalothrin is a type II synthetic pyrethroid and a widely applied hydrophobic insecticide. Its accumulation in subsurface environments raises environmental and public health concerns due to its persistence and toxicity. Chitosan, a biodegradable polymer with notable physicochemical and adsorptive properties, is increasingly explored for environmental remediation. This study investigates the interaction and cotransport behavior of λ-cyhalothrin and colloidal chitosan in water-saturated quartz sand under static, batch and column flow conditions at 25°C. Sorption kinetics followed a pseudo-second-order model, while transport behavior was simulated using the advection–dispersion equation, incorporating two-site attachment mechanisms both linear and nonlinear, with ripening effects. The results indicate that λ-cyhalothrin undergoes chemisorption onto both chitosan and quartz sand. Cotransport experiments revealed significant bidirectional interactions: chitosan–λ-cyhalothrin aggregates enhanced chitosan retention while concurrently reducing λ-cyhalothrin attachment. These findings demonstrate that chitosan increases λ-cyhalothrin mobility in porous media, while also increasing its own immobilization through aggregate formation. The developed model effectively captured these dynamics, suggesting chitosan’s promising role as a dual-function agent for pesticide mitigation and nanoparticle delivery in groundwater remediation applications.


How to cite: Katzourakis, V., Xenou, E., Malandrakis, A., and Chrysikopoulos, C.: Interaction and Cotransport of λ-Cyhalothrin and Chitosan in Saturated Quartz Sand: Sorption Mechanisms and Remediation Implications, EGU General Assembly 2026, Vienna, Austria, 3–8 May 2026, EGU26-2057, https://doi.org/10.5194/egusphere-egu26-2057, 2026.

EGU26-2706 | Posters on site | HS8.1.8

Hybrid Ensemble Machine Learning Models with SHAP Explainability for Robust Prediction of Suspended Particle Attachment Efficiency in Complex Environmental Systems  

Maher Maalouf, Gharisa AlMehairi, Ilhaam A. Omar, Maryam Tariq, Shamma Almaazmi, Vasileios E. Katzourakis, and Constantinos V. Chrysikopoulos

The accurate prediction of aggregation attachment efficiency (α) is critical for suspended nanoparticle and microplastic fate in environmental systems, yet existing models struggle with nonlinear interactions and limited interpretability.  This study evaluates two recently proposed hybrid ensemble machine learning frameworks, Improved Harris Hawks Optimized XGBoost (IHHO-XGBoost) and AdaBoost-ExtraTrees, for predicting α across mono- and binary-particle systems. Using a curated dataset spanning diverse particle types and environmental conditions, we demonstrate that IHHO-XGBoost outperforms six benchmark algorithms, achieving test R2 values of 0.865 (mono particle) and 0.797 (binary particle).  SHAP analysis reveals distinct mechanistic drivers: salt concentration dominates mono particle aggregation, while zeta potential asymmetry controls binary systems. By adapting these advanced ensembles to colloidal stability prediction, this work provides a computational framework for improving the prediction of particle interactions in complex environmental matrices. 

How to cite: Maalouf, M., AlMehairi, G., Omar, I. A., Tariq, M., Almaazmi, S., Katzourakis, V. E., and Chrysikopoulos, C. V.: Hybrid Ensemble Machine Learning Models with SHAP Explainability for Robust Prediction of Suspended Particle Attachment Efficiency in Complex Environmental Systems , EGU General Assembly 2026, Vienna, Austria, 3–8 May 2026, EGU26-2706, https://doi.org/10.5194/egusphere-egu26-2706, 2026.

EGU26-3621 | ECS | Orals | HS8.1.8

Enhanced PFAS Degradation by Electro-Oxidation Using Granular Activated Carbon Anodes: Performance Improvement and Scale-Up Potential 

Vahid Alimohammadi, Calvin He, Jun Sun, Denis O’Carroll, and Michael Manefield

Water contamination is a growing global concern, particularly due to the presence of per- and polyfluoroalkyl substances (PFAS) in drinking water, surface water, groundwater, wastewater, and sludge. These persistent pollutants pose significant health risks to humans and animals by accumulating in the body and affecting the immune system and liver. To address the emerging challenge of PFAS contamination, Granular Activated Carbon (GAC) is widely used as an adsorbent for PFAS removal in water and wastewater treatment plants. However, once saturated, it either requires additional GAC for continued use, or regeneration through processes such as chemical desorption that often produce highly concentrated secondary waste streams. To move beyond capture and address these limitations, advanced destructive treatment technologies are needed. A promising approach involves integrating GAC as a conductive material for use within electrochemical systems. This hybrid method not only retains GAC’s high adsorption capacity but also enables in situ degradation of PFAS. Despite its potential, the electrooxidation method for PFAS degradation and defluorination, particularly with GAC as an anode, remains underexplored.

 Initially, electro-oxidation using GAC alone showed limited effectiveness in the degradation and defluorination of various PFAS. In addition, PFAS adsorbed onto GAC were found to undergo minimal degradation when treated with chemical oxidants such as peroxydisulfate (PDS). However, experimental results demonstrate that incorporating PDS as a reactive oxidative species during electro-oxidation with a GAC anode enhances both the degradation and defluorination of a wide range of PFAS, including linear and branched, as well as saturated and unsaturated compounds, compared to systems operated without reactive oxidative species. These findings highlight the potential of GAC-based electrochemical oxidation as an innovative and effective approach for remediating diverse PFAS classes. This method reduces the need for frequent GAC replacement by enabling in situ degradation and defluorination of adsorbed PFAS, thereby enhancing both treatment efficiency and sustainability of water treatment systems. Furthermore, the widespread commercial use of GAC in existing water treatment infrastructure supports the potential for scaling up this remediation approach to real-world applications.


How to cite: Alimohammadi, V., He, C., Sun, J., O’Carroll, D., and Manefield, M.: Enhanced PFAS Degradation by Electro-Oxidation Using Granular Activated Carbon Anodes: Performance Improvement and Scale-Up Potential, EGU General Assembly 2026, Vienna, Austria, 3–8 May 2026, EGU26-3621, https://doi.org/10.5194/egusphere-egu26-3621, 2026.

Transport of hydrophobic nanoparticles in porous media is of growing interest in relation to the presence of nanoplastics and engineered NPs in the subsurface, where both hydrophobic collector surfaces and high salt concentrations may be simultaneously present by accident or design. This study investigates the effects of NP input concentration, surface wettability, and salt valence on the transport and deposition of model hydrophobic ethyl cellulose (EC) NPs in 2D hydrophilic and hydrophobic microfluidic networks under flow conditions representative of subsurface environments.   Uniform porous geometries and low hydrodynamic dispersion enhance NP residence time, promoting aggregation and irreversible retention, particularly in immobile zones. Our results show that higher NP concentrations and the presence of divalent cations (Ca²⁺) result in fractal aggregate formation, permeability loss, and formation of secondary porosity, altering flow paths and elution behavior. Direct porous medium visualization during and after experiments reveals transient flocculation, post-flush release, and pore structure changes such as pore throat occlusion and dead-end zone accumulation. Surface wettability further modulates transport; hydrophobic collectors enable irreversible attachment of mostly single particles via hydrophobic interactions. Fluorescence imaging, extended DLVO theoretical calculations, particle remobilization and permeability measurements corroborate observations of nanoparticle elution, showing that the effect on NP and aggregate deposition of surface hydrophobicity outweighs that of monovalent salt, whereas divalent salt accelerates and promotes irreversible deposition. Traditional interpretation of breakthrough curves does not resolve key microscale retention mechanisms under varying physicochemical conditions. In the presence of hydrophobic attraction between particles and collector surfaces, coagulation induced by high ionic strength results in complex interactions that shape transport, aggregation, and retention of hydrophobic NPs in porous media. These findings offer critical insights into the fate of hydrophobic NPs in subsurface environments for risk assessment and design of nanoremediation interventions in the form of injectable permeable adsorptive barriers.

How to cite: Ioannidis, M. and Rahham, Y.: Transport and Retention of Unstable Nanoparticle Suspensions in Porous Media: Effects of Salinity and Hydrophobicity Observed in Microfluidic Pore Networks , EGU General Assembly 2026, Vienna, Austria, 3–8 May 2026, EGU26-4661, https://doi.org/10.5194/egusphere-egu26-4661, 2026.

EGU26-4694 | Posters on site | HS8.1.8

Transport of Unstable Nanoparticle Suspensions in Porous Media: Pore Network Model of Coagulation and Deposition 

Marios Ioannidis, Ali Mansourieh, and Jeff Gostick

Groundwater contamination remains a significant environmental challenge, necessitating the development of advanced remediation strategies. One promising approach involves the injection of nanomaterials, such as nano-sized zero-valent iron (nZVI) or colloidal activated carbon, to degrade or immobilize contaminants in situ. The success of nanoremediation hinges on quantitative understanding of nanoparticle transport under geochemical conditions which may promote coagulation by accident or design.  Within porous media, nanoparticles tend to undergo complex interactions, including coagulation after particle–particle collisions, leading to aggregation and deposition onto the solid–fluid interface. These interactions directly influence their mobility and retention, with potential implications for permeability alterations caused by pore clogging. A comprehensive understanding of these coupled mechanisms is essential for improving the design of injectable adsorptive or reactive contaminant barriers.

We develop here a pore network modeling (PNM) framework to simulate the transport and aggregation of unstable nanoparticles within a computer-generated porous medium. By incorporating the Smoluchowski coagulation model, the framework captures particle–particle interactions governing aggregation, while also considering particle–collector interactions that govern attachment and deposition on solid surfaces. The effects of ionic strength on both aggregation and deposition processes are explicitly examined. To capture the influence of aggregation on deposition, the collector contact efficiency is determined as a function of aggregate size and local pore-scale hydrodynamic conditions, using a neural-network model trained on pore-scale numerical simulations (Lin et al., 2022). Ionic strength regulates particle–particle collision efficiency, such that higher ionic strength enhances aggregation and promotes deposition. Furthermore, differences in the transport and retardation of dissolved salts and nanoparticles cause their concentration fronts to propagate at different velocities within the porous medium, leading to spatially heterogeneous aggregation and deposition zones. The insights gained from this research contribute to the advancement of pore-scale modeling techniques for nanoparticle transport and retention.

How to cite: Ioannidis, M., Mansourieh, A., and Gostick, J.: Transport of Unstable Nanoparticle Suspensions in Porous Media: Pore Network Model of Coagulation and Deposition, EGU General Assembly 2026, Vienna, Austria, 3–8 May 2026, EGU26-4694, https://doi.org/10.5194/egusphere-egu26-4694, 2026.

EGU26-5235 | Posters on site | HS8.1.8

Analytical Improvements Using Orbitrap-IRMS to Measure Solutions of Per- and Polyfluoroalkyl Substances (PFAS) for Stable Isotopic Ratios 

Maura Pellegrini, Paul K. Wojtal, Brett Davidheiser-Kroll, Chad S. Lane, and Ralph N. Mead

Orbitrap based Isotope Ratio MS is preferable to classical IRMS techniques for measuring PFAS compounds for a verity of reasons. The powerful new Thermo Scientific™ Orbitrap Exploris™ Isotope Solutions workflow harnesses the combination of electrospray ionization (ESI) and high-resolution accurate mass to enable the detection of isotopologues that were previously inaccessible. ESI allows ionization of PFAS directly from the solution without the necessity of converting it to a gas. ESI also has the advantage of performing “soft” ionization, which produces intact molecular ions. These intact molecules can be fragmented within the Orbitrap mass spectrometer to gain intramolecular information on site specific isotope ratios.


Here we present the analytical improvements we have developed specifically for investigating the isotopic composition and structure of PFAS. This including sample introduction to enhance the accuracy and reliability of the isotope ratio analysis, buffers, tuning and optimization of ionization and Orbitrap MS parameters, and focusing on fine-tuning of critical parameters such as AGC target and resolution to achieve optimal performance. We will also explore data acquisition strategies for acquiring high-quality data in isotope analysis, including setting up full scan and fragmentation experiments, and data processing techniques to ensure precise and accurate results.

How to cite: Pellegrini, M., Wojtal, P. K., Davidheiser-Kroll, B., Lane, C. S., and Mead, R. N.: Analytical Improvements Using Orbitrap-IRMS to Measure Solutions of Per- and Polyfluoroalkyl Substances (PFAS) for Stable Isotopic Ratios, EGU General Assembly 2026, Vienna, Austria, 3–8 May 2026, EGU26-5235, https://doi.org/10.5194/egusphere-egu26-5235, 2026.

EGU26-5552 | ECS | Posters on site | HS8.1.8

Hydrophobic–Hydrophilic Switching in Thermo-Responsive Hydrogels: A Novel Pathway for PFAS Control and Remediation 

Haojie Zhang, Jenish Zalaria, and Anett Georgi

Per- and polyfluoroalkyl substances (PFAS) are persistent contaminants widely detected in terrestrial systems, where their high mobility and resistance to degradation pose long-term risks to soil and groundwater resources. Although traditional adsorbents such as activated carbon are widely used for PFAS remediation, their limited regenerability often necessitates high-temperature treatment or direct incineration with high CO₂ emissions, or the use of expensive and toxic organic solvents for desorption, thereby constraining their sustainable application in environmental systems. Here, we present a novel thermo-responsive hydrogel adsorbent that enables temperature-controlled adsorption and release of PFAS, offering a new pathway for the sustainable management and remediation of PFAS.

The hydrogel was synthesized via copolymerization of N-isopropylacrylamide (NIPAM) and 2-(methacryloyloxy)ethyltrimethylammonium chloride (MTAC) and exhibits a lower critical solution temperature (LCST) of approximately 35 °C. Above the LCST, the hydrogel surface becomes hydrophobic, promoting the adsorption of long-chain PFAS including perfluorooctanoic acid (PFOA) and perfluorooctanesulfonic acid (PFOS) through hydrophobic interactions. Below the LCST, the surface transitions to a hydrophilic state, weakening these interactions and enabling PFAS desorption. As a result, the adsorption coefficient (Kd) of the hydrogel for PFOA at 45 °C is 35-fold higher than that at 25 °C. By exploiting this reversible hydrophobic–hydrophilic transition, adsorption and desorption of long-chain PFAS can be achieved without the use of organic solvents. Lab-scale batch experiments demonstrated that approximately 80% of PFOA and PFOS could be desorbed through temperature control alone, with complete desorption achieved upon the addition of chloride ions (Cl⁻). Notably, after ten adsorption–desorption cycles, PFOS desorption efficiency remained above 80%, indicating excellent reusability.

The environmental relevance of this approach was further evaluated using rapid small-scale column tests with tap water as a proxy for natural water matrices. Through temperature modulation and the addition of 1% NaCl, 84% of PFOS and 75% of PFOA were desorbed, with enrichment factors of 32 and 15, respectively. These results demonstrate that thermo-responsive hydrogels can provide a controllable and solvent-free strategy for PFAS retention and release, offering new opportunities for sustainable remediation and management of PFAS.

How to cite: Zhang, H., Zalaria, J., and Georgi, A.: Hydrophobic–Hydrophilic Switching in Thermo-Responsive Hydrogels: A Novel Pathway for PFAS Control and Remediation, EGU General Assembly 2026, Vienna, Austria, 3–8 May 2026, EGU26-5552, https://doi.org/10.5194/egusphere-egu26-5552, 2026.

EGU26-6039 | Posters on site | HS8.1.8

Impacts of Eco-Corona on Surface Properties of Nanoplastics 

Markus Flury, Xueyu Zhou, and Yingxue Yu

Plastics exposed to environmental conditions can develop eco-coronas. Here, we investigated how the eco-corona impacts the surface properties and transport of nanoplastics in unsaturated sand. Four different plastics, polyethylene (PE), polypropylene (PP), polystyrene (PS), and poly(butylene adipate terephthalate)-based (PBAT) were used in pristine and UV-weathered forms. The nanoplastics were exposed to a water-extractable soil solution to form an eco-corona. Transport of nanoplastics was studied under unsaturated flow condition at 40\% water saturation. Weathering and eco-corona had no obvious effect on the transport of nanoplastics under low ionic strength conditions. For most UV-weathered nanoplastics the zeta potentials became less negative after UV-weathering, indicating decreased surface charge, except for PBAT, whose zeta potentials became considerably more negative after weathering. The eco-corona caused the zeta potentials of the different nanoplastics to become more similar, except for pristine PBAT, which had a considerably less negative zeta potential than the other plastics. The eco-corona decreased contact angles in some cases (PP and PS) but increased the contact angle in others (PE and PBAT). This study demonstrates that both UV-weathering and eco-corona formation modify the physicochemical properties of nanoplastics, such as surface charge and hydrophobicity, with a tendency to make different plastics more similar. 

How to cite: Flury, M., Zhou, X., and Yu, Y.: Impacts of Eco-Corona on Surface Properties of Nanoplastics, EGU General Assembly 2026, Vienna, Austria, 3–8 May 2026, EGU26-6039, https://doi.org/10.5194/egusphere-egu26-6039, 2026.

EGU26-6135 | ECS | Posters on site | HS8.1.8

Soil Solution Promotes Nanoplastic Aggregation via Eco-corona Formation and Hetero-aggregation 

Yingxue Yu and Markus Flury

Nanoplastics in soil are exposed to soil solution, which is a mixture of microbial metabolites, dissolved organic matter, mineral and organic colloids, as well as inorganic ions. These components can interact with nanoplastics, thereby altering their surface properties and environmental behavior. Here, we examined how soil solution affects the aggregation kinetics and colloidal stability of nanoplastics made from a soil-biodegradable plastic (poly(butylene adipate-co-terephthalate), PBAT) and a conventional plastic (polyethylene). We found that both PBAT and polyethylene nanoplastics formed bigger aggregates in the presence of a soil solution extracted from a sandy loam soil, suggesting that the soil solution promoted the aggregation of both nanoplastics, thereby reducing their colloidal stability. Fluorescent excitation–emission spectroscopy revealed that microbial biomass in the soil solution dominantly adsorbed onto nanoplastics, followed by humic acid, forming an eco-corona that induced polymer bridging and attractive patch-charge interactions. Despite the observed bigger aggregates, the critical coagulation concentrations did not decrease correspondingly for either PBAT or polyethylene nanoplastics, which is likely due to the uncertainties of the critical coagulation concentrations as well as the hetero-aggregation between nanoplastics and colloids present in the soil solution. These results indicate that interactions with soil solution can decrease the colloidal stability of nanoplastics via eco-corona formation and hetero-aggregation, underlining the role of the complex interactions between nanoplastics and their surrounding matrices on the environmental behavior of nanoplastics.

How to cite: Yu, Y. and Flury, M.: Soil Solution Promotes Nanoplastic Aggregation via Eco-corona Formation and Hetero-aggregation, EGU General Assembly 2026, Vienna, Austria, 3–8 May 2026, EGU26-6135, https://doi.org/10.5194/egusphere-egu26-6135, 2026.

EGU26-7118 | ECS | Orals | HS8.1.8

Coupling Adsorption and Persulfate Oxidation Using FeS2-Zeolite for Efficient PFOA Removal 

Pengpeng Guo, Sarah Sühnholz, and Katrin Mackenzie

 Abstract

Per- and polyfluoroalkyl substances (PFAS) are widespread groundwater contaminants that are increasingly causing concern and prompting regulatory action due to their extreme persistence, mobility, limited biodegradability, and harmful properties. Perfluorinated compounds in particular, such as perfluorooctanoic acid (PFOA), one of the most common and most studied representatives of this class of PFAS, also show high resistance to chemical degradation and pose particular challenges for conventional remediation methods. Current treatment approaches are therefore based either on adsorptive removal from water without destruction or on energy-intensive processes that allow the molecules to be destroyed. Therefore, new low-energy methods are urgently needed. Integrated systems that combine pre-enrichment with efficient degradation under environmentally relevant conditions are therefore the focus of recent research.

In this study, FeS2-zeolite composites were developed by immobilizing crystalline pyrite on a hydrophobic BEA-35 zeolite to achieve coupled in-situ adsorption and peroxydisulfate (PS) activation for PFOA degradation. FeS2-BEA35 facilitated hydrophobic enrichment of PFOA within its porous structure with a KD value of 1.8 × 10⁴ L/kg at a cfree of around 50 µg/L. The study on the mechanism illustrated that sulfate radicals (SO4•−) were predominantly generated through surface-mediated homolytic PS cleavage on the FeS2-BEA35 surface, serving as the dominant species for PFOA degradation. Alongside sulfate radicals, the results showed the involvement of previously unrecognized FeIV=O2+ species, generated by the oxidation of Fe(OH)(H2O)52+-PFOA complex by SO4•−. The FeIV=O2+ species acted as a secondary reactive species capable of abstracting electrons from the coordinated PFOA, thereby promoting decarboxylation and C-C bond cleavage. Although coexisting inorganic ions and natural organic matter reduced adsorption and degradation rates of PFOA, yet FeS2-BEA35 still maintained strong affinity and reactivity. Fixed-bed column experiments started with an influent PFOA of 1 mg/L, designed to approximate continuous treatment conditions, demonstrated a high PFOA adsorption capacity of about 1.2 × 10³ mg/kg at a cfree of around 60 µg/L and sustained over 70 % removal efficiency under cyclic oxidation with low Fe leaching. The efficient PS utilization also confirmed dominant heterogeneous activation and excellent catalyst stability.

Therefore, FeS2-BEA35 integrates efficient adsorption and durable catalytic reactivity, offering a promising platform for continuous perfluorocarboxylic contaminant remediation through interfacial enrichment and surface-mediated PS cleavage.  

How to cite: Guo, P., Sühnholz, S., and Mackenzie, K.: Coupling Adsorption and Persulfate Oxidation Using FeS2-Zeolite for Efficient PFOA Removal, EGU General Assembly 2026, Vienna, Austria, 3–8 May 2026, EGU26-7118, https://doi.org/10.5194/egusphere-egu26-7118, 2026.

EGU26-10517 | ECS | Orals | HS8.1.8

Investigation of the Transformation Products Formed During Thermal Desorption of PFAS 

Anna Burkhardt, Tobias Junginger, and Claus Haslauer

Per- and polyfluoroalkyl substances (PFAS), “forever chemicals”, are persistent, ubiquitous, and toxic. They pose a threat to both human health and the environment, therefore efficient remediation strategies are urgently needed. One possible remediation technology to treat contaminated soil is thermal desorption. However, the transformation mechanisms and products created during thermal desorption have not been fully assessed yet. Precursor substances, which transform to persistent PFAS substances in the environment, are of particular interest.

This study investigates the thermal desorption and transformation of PFAS. We conducted multiple thermal desorption experiments with artificially contaminated PFAS-sand in a stainless-steel column, which was heated by a heating rod and mantle. The maximum temperature reached in the column is 500 °C. We hypothesize that during this experiment the PFAS will desorb from the sand and enter the gas phase. Further, we assume that chemical transformation processes will occur, leading to products with shorter chain lengths. To understand the fate of the PFAS substances, we analyze the gas phase and the concentration of PFAS in the sand before and after the heat application. We use target and non-target approaches to identify transformed products. Furthermore, the decomposition of PFAS is examined by measuring the produced fluoride ions and evaluating the fluorine mass balance.

Our experiments showed that thermal desorption of PFAS is taking place in the regions of the column where the boiling temperatures of the individual compounds were exceeded. Depending on the substance and temperature setting used, complete removal of the spiked PFAS from the sand was achieved. By using LC-MS/MS target analysis we found multiple PFAS with shorter chain-length than the spiked substance after heating. In rare cases longer chain lengths were observed. These transformation products were mainly found in the samples taken from the gas stream. Based on these results we conclude that thermal desorption can be used as a treatment method to remove PFAS from contaminated material ­­– however, it is essential to keep in mind that PFAS transformation products will exist in the gas phase and therefore adequate treatment of the exhaust gas is necessary. Further studies will be conducted with artificial PFAS-soil as well as with additives. By using additives, we hope to improve the mineralization rate, suppress the formation of undesired transformation products, and minimize the energy demand. With our experiments we expect to enhance the chemical process understanding of thermal desorption of PFAS, which will lead to an improved application design of this thermal treatment method.

How to cite: Burkhardt, A., Junginger, T., and Haslauer, C.: Investigation of the Transformation Products Formed During Thermal Desorption of PFAS, EGU General Assembly 2026, Vienna, Austria, 3–8 May 2026, EGU26-10517, https://doi.org/10.5194/egusphere-egu26-10517, 2026.

EGU26-10646 | Posters on site | HS8.1.8

Microplastics in Central Asian Wastewater Systems: Analytical Workflows, Quality Assurance, Quality Control, Uncertainties, and Research Priorities 

Maria-Elena Rodrigo-Clavero, Javier Rodrigo-Ilarri, Kulyash K. Alimova, Natalya S. Salikova, Lyudmila A. Makeyeva, Meiirman Berdali, and Nurlan Kyzylbayev

Microplastics (MPs) are increasingly detected in wastewater treatment systems, where treatment plants act simultaneously as interception nodes and point sources via treated effluents and sludge management. This contribution synthesizes a PRISMA-guided critical review focused on Kazakhstan and Central Asia, benchmarking the region against a harmonized global dataset while explicitly interrogating how methodological choices drive inter-study variability.

A structured evidence map (2010–Sept 2025) was compiled and curated into a comparable database of 63 wastewater-treatment studies worldwide, yielding 402 matrix–stage observations across influent, effluent, and sludge streams. Observation-level descriptive statistics show that global raw influent concentrations cluster around 100 particles/L (median ≈65 particles/L), whereas final/tertiary effluents are typically 1 particles/L (median ≈2.2 particles/L). Overall MP removal increases from secondary treatment (median ≈85.5%) to tertiary/advanced trains (median ≈95.0%), while sludge acts as the dominant sink, retaining MP burdens on the order of 1000–100.000 particles/kg dry weight. Across matrices, fibers dominate the reported morphologies and polymer signatures are consistently led by PET/PES, PP, and PE, consistent with textile and packaging sources.

Central Asian plant-level evidence remains extremely limited (two eligible wastewater treatment plants case studies, both in Kazakhstan), but when comparisons are restricted to like-for-like analytical windows, influent levels align with the global interquartile range. In contrast, secondary-only configurations tend to place effluent concentrations in the upper half of the global envelope, supporting the inference that the presence/absence of post-secondary barriers (filtration, DAF/BAF, membranes/MBR) is the primary determinant of regional performance relative to international benchmarks. The review identifies three dominant uncertainty drivers—sampling representativeness (grab vs. composite), minimum size cut-offs (especially <100 µm), and incomplete quality assurance and quality control (QA/QC) reporting—and proposes an actionable 2025–2030 agenda: ISO-aligned protocol harmonization with explicit QA/QC, expansion of monitoring to tertiary/advanced trains, coordinated interlaboratory ring trials and reference-library development, and integration of monitoring with hydrodynamic/fate models to translate plant upgrades into reach-scale benefits in arid, episodic-flow receiving waters.

How to cite: Rodrigo-Clavero, M.-E., Rodrigo-Ilarri, J., Alimova, K. K., Salikova, N. S., Makeyeva, L. A., Berdali, M., and Kyzylbayev, N.: Microplastics in Central Asian Wastewater Systems: Analytical Workflows, Quality Assurance, Quality Control, Uncertainties, and Research Priorities, EGU General Assembly 2026, Vienna, Austria, 3–8 May 2026, EGU26-10646, https://doi.org/10.5194/egusphere-egu26-10646, 2026.

Active swimmers, such as microorganisms, are widespread in natural ecosystems and engineered systems. It is crucial to quantifying the effects of active swimming and gravitational settling during their transport in turbulent flows. Building on the previously established theoretical framework for open-channel flows, this study further addresses the case of circular pipes, a configuration highly common in engineering applications but is much more complicated due to the cylindrical geometry. In this case, active swimming is mainly affected by the flow shear in the radial direction, while gravitational settling acts vertically downward. This difference prevents straightforward superposition of swimmer motions in the same vertical direction as that for open channel flows, making analytical approaches challenging. We first neglect the mechanism of gravitational settling, and adopt the key dimensionless parameter α to quantify the interplay between active swimming and turbulent diffusion. The critical threshold is identified at the same order of magnitude as that for open channel flows, as α~0.1, to distinguish between an active swimming dominated- and turbulence dominated- transport. Numerical simulations using a particle tracking algorithm validate these theoretical results. The influence of gravitational settling is further incorporated by simulations combining particle tracking with Direct Numerical Simulation (DNS), revealing that gravitational settling plays a non-trivial role during transport in turbulent pipe flows, which significantly affects the spatial distribution of the swimmers.

How to cite: Li, G. and Wu, Z.: Effects of Active Swimming and Gravitational Settling on Particle Dispersion in Turbulent Pipe Flow, EGU General Assembly 2026, Vienna, Austria, 3–8 May 2026, EGU26-11181, https://doi.org/10.5194/egusphere-egu26-11181, 2026.

EGU26-11209 | Posters on site | HS8.1.8

Impacts of Military Activities on Groundwater Quality 

Anja Koroša, Metka Petrič, Nataša Ravbar, Alen Albreht, Kristijan Vidović, Nina Prezelj, Sonja Cerar, Denis Kutnjak, Ion Gutierrez-Aguirre, and Rok Poglajen

Increased military exercises, including activities conducted at military training grounds and battlefields, as well as other operations such as mining and quarrying, can release hazardous chemicals into the environment, leading to pollution. Also compounds used in explosives during the First and Second World Wars, for instance, remain widely distributed in the environment even decades after. Slovenian territory was significantly affected by military activities during both world wars; as a result, substantial quantities of unexploded and detonated munition residues persist in the environment and represent a potential source of pollution. Similar concerns regarding soil and water contamination by explosive-related chemicals have been reported in several other countries. According to the U.S. Environmental Protection Agency (EPA), lifetime exposure (assumed to be 70 years) to certain explosive compounds in drinking water should not exceed recommended health-based limits, which range from 1 to 700 µg/L depending on the specific contaminant.

The primary objective of this study is to assess the impact of military training areas in Slovenia on groundwater and drinking water resources. To achieve this, key chemical, bacteriological, and isotopic parameters were monitored.

How to cite: Koroša, A., Petrič, M., Ravbar, N., Albreht, A., Vidović, K., Prezelj, N., Cerar, S., Kutnjak, D., Gutierrez-Aguirre, I., and Poglajen, R.: Impacts of Military Activities on Groundwater Quality, EGU General Assembly 2026, Vienna, Austria, 3–8 May 2026, EGU26-11209, https://doi.org/10.5194/egusphere-egu26-11209, 2026.

The increasing recognition of PFAS contamination in soil and groundwater necessitates effective and sustainable remediation strategies. Steam-activated biochars (SA-BCs), derived from renewable feedstocks (e.g., agricultural waste), are gaining attention as alternatives to conventional activated carbons for PFAS sorption due to their lower environmental footprint. However, studies on the sorption of PFAS to SA-BCs under field-realistic flow-through conditions remain scarce. Rapid small-scale column tests (RSSCTs) provide a versatile tool to estimate the performance of sorbents in full-scale systems (e.g., fixed-bed filter) in the lab. Yet, the influence of experimental uncertainties (e.g., varying flow rates) on the resulting breakthrough curves is often not discussed. Therefore, the aim of this study was twofold: (i) to investigate the performance of a SA-BC for the immobilization of PFAS in soil under flow-through conditions and (ii) to estimate the effect of experimental uncertainties on the fitting results.
Sorption of seven C4 to C8 per- and polyfluoroalkyl acids in synthetic groundwater to loamy sand amended with 0.5% SA-BC was investigated in small-scale columns (4cm x 1cm). Breakthrough curves were analysed using the ‘Ogata-Banks’ solution for the 1D ADE, including a Monte Carlo framework to assess the influence of experimental/ analytical uncertainties for flow rate, porosity and measured PFAS concentrations on the results.
Compared to untreated soil blanks, in which immediate breakthrough was observed for most compounds, the addition of 0.5% SA-BC led to a significant retardation with retardation factors of ~10 for PFBA to ~1500 for PFOS – with the elution order correlating with chain-length and functional group. Monte Carlo simulations for PFOS with relative uncertainties of 5% for flow rate, porosity and PFOS concentrations resulted in retardation factors of 854 to 3420 with a mean ± one standard deviation of 1545 ± 333. Corresponding breakthrough times for 50% PFOS range from 678 to 861 min, indicating that estimation of retardation and consequently breakthrough times based on single experiments could lead to substantial underestimation.
While our data highlight the potential of SA-BC for in-situ immobilization of PFAS in contaminated soils, they also emphasize the importance of considering experimental uncertainties. Ongoing work is focused on the influence of environmental factors, such as matrix composition, on reactive transport. Together, these advances will support a robust, uncertainty-integrated framework for getting deeper insights into the interaction of PFAS with SA-BCs and estimating PFAS immobilization in the field und varying conditions.

How to cite: Martin, P. R., Herbst, A., and Hofmann, T.: Estimating PFAS Immobilization by Activated Biochars: Insights from Rapid Small-Scale Column Tests and Uncertainty Modelling , EGU General Assembly 2026, Vienna, Austria, 3–8 May 2026, EGU26-12423, https://doi.org/10.5194/egusphere-egu26-12423, 2026.

Firefighting training sites constitute common hotspots for per- and polyfluoroalkyl substances (PFAS) originating form aqueous film forming foams (AFFF) in Europe and worldwide. An example is  Örnsköldsvik airport (OER) in northern Sweden,  with groundwater concentrations downstream the hotspot exceeding 100,000 ng/L. To investigate how PFAS migration from these sites can be reduced, a pilot-scale colloidal activated carbon (CAC) barrier was injected at OER within a governmental assignment to the Swedish Geotechnical Institute and Swedish Geological Survey. Two years of monitoring shows that the barrier successfully has  slowed PFAS migration,however, the long-term performance still  remains uncertain, as PFAS breakthrough under field conditions can take decades. This study focuses on numerical modelling of PFAS transport in laboratory-scale soil columns representing CAC-embedded barrier sections from the Örnsköldsvik site, aiming to predict long-term barrier performance. A one-dimensional model was developed using MODFLOW and MT3DMS to simulate PFAS transport, incorporating both equilibrium and kinetic sorption processes. Different sorption models were tested to predict CAC adsorption behaviour and model calibration against experimental breakthrough curves. The simulation will quantify adsorption and retardation for individual PFAS compounds, assessing the influence of CAC content and sorption mechanisms on transport dynamics. By linking laboratory data to predictive modelling, this study provides a robust framework for evaluating CAC barrier efficiency, optimising in situ remediation strategies, and improving predictions of long-term PFAS behaviour in contaminated soils and groundwater.

How to cite: Das, M. and Fagerlund, F.: Model-Based Evaluation of PFAS Transport in Colloidal Activated Carbon Permeable Reactive Barriers based on Laboratory  Column Studies, EGU General Assembly 2026, Vienna, Austria, 3–8 May 2026, EGU26-14342, https://doi.org/10.5194/egusphere-egu26-14342, 2026.

EGU26-15060 | ECS | Posters on site | HS8.1.8

Modelling of transport of per- and polyfluoroalkyl substances in natural soil downstream a pilot-scale colloidal activated carbon barrier 

Agnes Zúniga Ekenberg, Robert Earon, Dan Berggren Kleja, and Fritjof Fagerlund

Per- and polyfluoroalkyl substances (PFAS) are a widespread group of pollutants. One of the more common sources of PFAS pollution in Swedish groundwater is related to firefighting and training activities using aqueous film forming foams (AFFFs). While the data available on PFAS is increasing, differences in transport characteristics between the large number of PFAS species and lack of data relating to transport of precursors give rise to significant challenges within environmental risk assessment. At a fire training site in connection to Örnsköldsvik airport, Sweden, a pilot-scale colloidal activated carbon (CAC) barrier was installed on the 23rd of November 2023, intercepting the PFAS plume and effectively ceasing downstream PFAS transport in the groundwater. The pilot-scale study is part of an ongoing governmental mission assigned to the Swedish Geotechnical Institute, in collaboration with the Geological Survey of Sweden and the Swedish Environmental Protection Agency among other governmental institutes. The contaminated site has been monitored over the span of two years, and geological and transient hydrological models have been done as groundwork to account for heterogeneity and seasonal variability in the area. The detailed monitoring of PFAS concentrations in space and time, including monthly time series for more than 50 points, in combination with the installation of the CAC barrier, allows careful observation of PFAS migration downstream the barrier.

The aim of this study is to improve our knowledge of PFAS transport and determine governing field parameters in the natural soil downstream the barrier by numerical modelling in MODFLOW/MT3D in combination with field observations. Several different PFAS are found in the groundwater and included in the modelling, as well as some target precursors. Calibration of the model allows estimation of field sorption parameters (Kd), which are critical for PFAS transport in the soil-groundwater system. Detailed total oxidizable precursor (TOP) measurements further allow analysis also of the migration and transport behaviour of unknown precursors connected to different terminal PFCAs accounting for 20 to 30% of the PFAS in the groundwater plume. The model and extensive measurements have shown real-world differences in transport parameters and precursor retardation greater than for perfluorinated PFAS.

How to cite: Zúniga Ekenberg, A., Earon, R., Berggren Kleja, D., and Fagerlund, F.: Modelling of transport of per- and polyfluoroalkyl substances in natural soil downstream a pilot-scale colloidal activated carbon barrier, EGU General Assembly 2026, Vienna, Austria, 3–8 May 2026, EGU26-15060, https://doi.org/10.5194/egusphere-egu26-15060, 2026.

The Krško aquifer in southeast Slovenia is a Quaternary intergranular system composed of highly permeable carbonate and silicate gravels. Due to its geological vulnerability and the surrounding land use that ranges from intensive agriculture to urban and industrial centres, the aquifer is susceptible to contamination. This study presents a comprehensive monitoring campaign initiated in September 2025 to capture seasonal variations in groundwater quality during the 2025-2026 winter recharge cycle. To characterize the chemical status of the aquifer, a multi-proxy analytical framework was implemented. The baseline characterization included a broad suite of physical and chemical parameters with major ions (e.g., NO3-, SO42-, Cl-, TOC, redox sensitive metals such as Fe and Mn, etc.). They were coupled with targeted quantitative grab sampling for a wide array of contaminants that include pesticides and metabolites, persistent organic contaminants such as Per- and Polyfluoroalkyl Substances (PFAS) and Volatile Halogenated Hydrocarbons (VHHs), pharmaceuticals and hormones. Parallel to grab sampling, Chemcatcher passive samplers were installed to provide time-weighted average concentrations of specific organic compounds. By comparing the validated quantitative laboratory results (LC-MS) with the results from the passive samplers, this research and integrated approach aim to refine groundwater vulnerability models and improve the reliability of chemical status assessments in porous alluvial systems.

How to cite: Perović, I. and Koroša, A.: Monitoring of emerging organic contaminants (EOCs) in Krško aquifer (Slovenia) by integrating passive and grab sampling, EGU General Assembly 2026, Vienna, Austria, 3–8 May 2026, EGU26-16565, https://doi.org/10.5194/egusphere-egu26-16565, 2026.

EGU26-17092 | Posters on site | HS8.1.8

Tiny plastics, big impact? Towards an improved understanding of the interaction between microplastics and sedimentary rocks. 

Hanne De Lathauwer, Veerle Cnudde, Laurenz Schröer, and Thiemen De Viaene

In recent years, microplastics have become a pollutant of global concern: they have been identified in virtually every environment, including the hydrosphere, atmosphere and pedosphere. A growing amount of research now focuses on their impact on these environments. In this context, however, rocks have largely been overlooked.

In particular, sedimentary rocks constitute the majority of Earth’s exposed surface and are widely used as building materials, notably in cultural heritage. Serving as an important interface between the atmosphere, the terrestrial environment and human influences, they are likely susceptible to microplastic pollution and could potentially act as (temporary) storage media for microplastics. This could have implications for the long-term durability and weathering behaviour of the rocks.

The goal of this research, funded by the Research Foundation - Flanders (FWO), is therefore to gain more insight into the interaction between sedimentary rocks and microplastics. Specifically, we aim to investigate the factors that control microplastic adhesion to rock surfaces and examine how these pollutants might modify the physical and water transport properties of the rock. Given the inherent heterogeneity of sedimentary rocks and the many anticipated factors involved in this interaction (e.g. rock specific properties, microplastic specific properties, environmental conditions), this is a challenging task that requires a systematic approach.

Our experimental setup involves four types of sedimentary rock with variable physical properties that commonly occur in Belgium: Lede sandy limestone, Bentheimer sandstone, Maastricht limestone and Belgian Blue limestone. The rocks were treated with a selection of the most prevalent microplastic types (polyethylene (PE), polypropylene (PP), polyvinyl chloride (PVC), and polyethylene terephthalate (PET)) and studied using advanced visualization and characterization methods, including light microscopy, micro-computed tomography and 3D profilometry. Contact angle measurements were also performed to evaluate changes in rock-water interaction after microplastic exposure.

The preliminary findings of this study indicate that microplastics can alter the roughness of the rock surface, though this effect depends on the type of rock. We also observed that microplastics tend to reduce the wettability of rock surfaces. This effect is most likely due to the hydrophobic nature of the microplastics. 

Furthermore, the preliminary findings suggest that rock surface roughness and (surface) porosity can facilitate microplastic adherence to the rock surface. Moreover, certain microplastic types seem to have a greater affinity to attach to rocks than others. We anticipate that additional factors, such as environmental conditions, microplastic characteristics and rock characteristics, play a role in this interaction as well. Further study is required to determine the extent of their influence. 

How to cite: De Lathauwer, H., Cnudde, V., Schröer, L., and De Viaene, T.: Tiny plastics, big impact? Towards an improved understanding of the interaction between microplastics and sedimentary rocks., EGU General Assembly 2026, Vienna, Austria, 3–8 May 2026, EGU26-17092, https://doi.org/10.5194/egusphere-egu26-17092, 2026.

EGU26-17307 | Orals | HS8.1.8 | Highlight

Exposure and impacts of advanced (nano)materials : using aquatic mesocosms to evaluate and minimize environmental risks 

Melanie Auffan, Andrea Carboni, Amazigh Ouaksel, Danielle Slomberg, and Jerome Rose

Advanced (nano)materials have and will play a key role in environmental and energy transitions by enabling innovative solutions in water treatment, agriculture, energy production, electronics, and building efficiency. Past technological developments have taught us that long-term sustainability also depends on the accurate assessment of environmental and health risks. For advanced (nano)materials, whose properties are strongly influenced by size, shape, surface chemistry, and structural defects, risk assessment must explicitly account for realistic exposure scenarios and material transformations throughout their life cycle. In this context, mesocosm experiments represent a powerful approach to bridge the gap between laboratory studies and complex real-world environments.

This presentation highlights how aquatic mesocosms can be used to assess exposure, fate, and the ecological impacts of advanced (nano)materials and nano-enabled products under environmentally relevant conditions, thereby supporting Safe- and Sustainable-by-Design strategies. We will present several case studies involving pristine nanomaterials, nano-enabled products, and incidental nanoparticles generated during the advanced (nano)materials use phase or end-of-life. They include tungsten-based nanomaterials used for energy applications, tritiated stainless steel (nano)particles potentially released during nuclear dismantling scenarios, silver nanowires embedded in printed paper electronics, and mixed-metal oxide nanoparticles incorporated into infrared-reflective outdoor paints. Results from these mesocosm studies have revealed complex biogeochemical transformations such as dissolution, redox reactions, polymerization, and matrix-driven partitioning, which in turn drive the bioavailability, trophic transfer, and biological responses to the advanced (nano)materials.

Finally, we will discuss how mesocosm-based datasets support environmental risk assessment in relevant exposure conditions and guide material innovation toward safer and more sustainable outcomes. Their integration into collaborative platforms and decision-support tools enhances Safe- and Sustainable-by-Design implementation across technology readiness levels.

How to cite: Auffan, M., Carboni, A., Ouaksel, A., Slomberg, D., and Rose, J.: Exposure and impacts of advanced (nano)materials : using aquatic mesocosms to evaluate and minimize environmental risks, EGU General Assembly 2026, Vienna, Austria, 3–8 May 2026, EGU26-17307, https://doi.org/10.5194/egusphere-egu26-17307, 2026.

At Örnsköldsvik aiport in northern Sweden historical firefighting training activities has resulted in a strongly contaminated hotspot with per- and polyfluoroalkyl substances (PFAS), with total concentrations exceeding 100000 ng/L in the groundwater. As part of a governmental assignment on PFAS mitigation, the Swedish Geotechnical Institute and Swedish Geological Survey have installed a large pilot-scale colloidal activated carbon (CAC) barrier intercepting the PFAS plume. Field observations show that the CAC barrier has effectively reduced PFAS mobility, with strongly reduced downstream concentrations and no notable breakthroughs detected within two years after barrier installation. To predict the long-term performance and carefully evaluate sorption processes within the barrier, controlled laboratory-scale column experiments were designed using soil from the barrier and the natural PFAS-contaminated groundwater. The spatial variation of injected carbon in the barrier has been characterized by soil coring. Soil from two representative locations with different CAC contents (0.037% and 0.103% by weight) as well as natural soil from before CAC injection were examined in flow-through column experiments monitoring the breakthrough of different PFAS. The groundwater taken from upstream the barrier contained several perfluoroalkyl carboxylic acid (PFCA), perfluoroalkyl sulfonic acids (PFSA), fluorotelomer sulfonates as well as unknown precursors indicated by total oxidizable precursor (TOP) analyses. The results provide quantitative estimates of PFAS adsorption capacity, retardation factors, competition effects and breakthrough characteristics in relation to injected CAC content. The findings can be used to estimate the breakthrough of PFAS at the field site and predict the longevity and sorption capacity of the CAC barrier. The data can further be used to refine, develop and calibrate PFAS transport models and serve as a basis to optimise the long-term effectiveness of in-situ sorbent-based remediation.

Keywords: PFAS, groundwater, contamination, remediation, activated carbon

How to cite: Fagerlund, F. and Das, M.: Predicting the long-term PFAS sorption performance in a colloidal activated carbon barrier using laboratory column experiments, EGU General Assembly 2026, Vienna, Austria, 3–8 May 2026, EGU26-17428, https://doi.org/10.5194/egusphere-egu26-17428, 2026.

EGU26-18313 | ECS | Orals | HS8.1.8

Plasma-treated polystyrene microplastics for enhanced transport studies in porous media: A surfactant-free approach 

Yifan Lu, Rizwan Khaleel, Rohan Hassan Shanthakumar, Nurgül Tosun, Markus Rolf, Hannes Laermanns, Kavita Verma, Lakshminarayana Rao, Thomas Fischer, Sanjay Mathur, and Christina Bogner

Microplastics (MPs) are increasingly recognized as persistent contaminants in soils and groundwater systems worldwide. Polystyrene MPs are highly hydrophobic and show strong homoaggregation, which affects their mobility in porous media. Most laboratory transport studies therefore use chemical dispersants, such as Tween 20, to achieve a uniform distribution of particles during transport experiments. However, these additives coat plastic surfaces and alter plastic–soil interactions, making it difficult to assess environmentally realistic transport behavior. Here, we introduce a surfactant-free approach based on controlled radio-frequency oxygen plasma treatment to modify MP surface properties. Oxygen plasma-treated polystyrene particles (<10 μm) became fully hydrophilic, with water contact angles decreasing from 137° to 0°. This surface modification enabled the formation of stable, well-dispersed particle suspensions at loadings of 200 mg L⁻¹ without any surfactants, overcoming the strong aggregation typically observed for pristine particles. Importantly, plasma treatment did not cause bulk polymer degradation, and the particles remained physically intact without melting or fragmentation. We hypothesize that plasma-treated MPs will exhibit transport behavior distinct from both pristine hydrophobic MPs and chemically dispersed MPs. Column experiments using quartz sand will compare the mobility of untreated, surfactant-assisted, and plasma-treated polystyrene particles to evaluate whether dispersants artificially enhance MP transport by suppressing soil–particle interactions. Overall, this surfactant-free method offers a step toward supporting more accurate environmental risk assessments without bias from additional surfactants.

How to cite: Lu, Y., Khaleel, R., Hassan Shanthakumar, R., Tosun, N., Rolf, M., Laermanns, H., Verma, K., Rao, L., Fischer, T., Mathur, S., and Bogner, C.: Plasma-treated polystyrene microplastics for enhanced transport studies in porous media: A surfactant-free approach, EGU General Assembly 2026, Vienna, Austria, 3–8 May 2026, EGU26-18313, https://doi.org/10.5194/egusphere-egu26-18313, 2026.

EGU26-19433 | ECS | Orals | HS8.1.8

Mesoporous and P-doped Kraft Lignin-derived biocarbon for PFAS removal 

Surabhi S. Raj, Oleg Tkachenko, Alina Nikolaichuk, Fritjof Fagerlund, and Tetyana M. Budnyak

Per- and polyfluoroalkyl substances (PFAS) are persistent microcontaminants originating from sources such as firefighting foams, non-stick cookware, and industrial applications. Due to their high chemical stability, PFAS are environmentally pervasive and have been associated with severe adverse health effects, including carcinogenicity.

This study investigates the remediation of PFAS from groundwater using sustainable, biomass-derived carbon materials synthesized from kraft lignin. They were synthesized under systematically varied conditions, including carbonization temperature, acid concentration, and treatment duration, to optimize their surface characteristics in order to enhance the adsorption properties. Two representative PFAS: long-chain Perfluorononanoic acid (PFNA) and Perfluorooctane sulfonate (PFOS), were selected to evaluate adsorption efficiency and material selectivity. Based on screening experiments, two optimized carbons (denoted P1 and P2) were identified for detailed removal studies. Comprehensive material characterization was performed using BET surface area analysis, SEM, XRD, XPS and FTIR to elucidate porosity, surface morphology, crystallinity and functional group chemistry. Adsorption experiments demonstrated high removal efficiencies. For P1, PFNA removal reached 97.5% at 25 ppm and 96.7% at 50 ppm, while PFOS removal was 89% and 85.7% at the respective concentrations. P2 exhibited superior performance, achieving 96% (25 ppm) and 98% (50 ppm) removal for PFNA, and 98% (25 ppm) and 98.8% (50 ppm) for PFOS. Overall, removal efficiencies exceeding 90% were achieved for both long-chain PFAS, with enhanced performance of P2 attributed to its higher phosphorus doping. Adsorption isotherm analysis showed that the Langmuir-Freundlich model provided the best fit, indicating heterogeneous surface adsorption and multilayer uptake. Kinetic studies revealed rapid adsorption within the first 60–90 minutes, indicating fast adsorption kinetics and efficient uptake of contaminant molecules onto the adsorbent surfaces. Subsequently, the synthesized carbons were investigated under dynamic adsorption conditions through continuous-flow column studies to evaluate their performance for the treatment of PFAS contaminated groundwater. In conclusion, lignin-derived, heteroatom-doped carbons demonstrate excellent potential for the efficient removal of long-chain PFAS from groundwater. The use of a renewable biomass precursor enhances the sustainability of the process, while the high removal efficiencies and favourable kinetics highlight its potential for application at contaminated sites.

Acknowledgments. This work was supported by the Wallenberg Initiative Materials Science for Sustainability (WISE), funded by the Knut and Alice Wallenberg Foundation. Oleg Tkachenko gratefully acknowledges support from the Olle Engkvist Foundation for the scholarship (235-0413).

How to cite: S. Raj, S., Tkachenko, O., Nikolaichuk, A., Fagerlund, F., and M. Budnyak, T.: Mesoporous and P-doped Kraft Lignin-derived biocarbon for PFAS removal, EGU General Assembly 2026, Vienna, Austria, 3–8 May 2026, EGU26-19433, https://doi.org/10.5194/egusphere-egu26-19433, 2026.

EGU26-19542 | ECS | Orals | HS8.1.8

Irregularly Shaped True-To-Life Microplastics with Embedded Optical Labels 

Sophia J. Baumann, Alissa J. Wieberneit, Hannah Triebel, and Antje J. Baeumner

Each year, several thousand tons of microplastics (MPs) end up in the environment. While available techniques for the identification and quantitative characterization of microplastics are getting more elaborate, studies investigating the fate and ecotoxicological impact of MPs face a major challenge: differentiating between naturally occurring and artificial MPs once they are released into the environment. This issue can be addressed by labeling the artificial MPs; however, there is currently a lack of surrogates that combine labeling with a close resemblance to MPs found in the environment. Most studies use labeled polystyrene microspheres as surrogates, but these differ considerably from environmental MPs in terms of shape, chemical composition, and surface charge. 


In this study, we aim to address this challenge by introducing electrospun microfibers as a precursor for irregularly shaped, optically labeled MPs. The labels were directly embedded into the microfibers, which were then broken down by shear-force exfoliation and ball milling, yielding irregularly shaped fibers and fragments. The resulting MPs exhibited a heterogeneous morphology much closer to that of environmental MPs than commercially available spherical MP surrogates commonly used. In addition to organic fluorophores, we introduced lanthanide-doped upconversion nanoparticles (UCNPs) as optical labels. This special class of luminophores combines excitation in the near infrared (NIR) with high photostability, multiple sharp emissions in the UV/visible and NIR ranges, and versatility in doping composition. The low abundance of lanthanides in the environment also enables the quantitative detection of UCNP-doped MPs using element-specific analytical methods. Overall, this new type of artificial MP offers exciting opportunities for biological and environmental studies.

How to cite: Baumann, S. J., Wieberneit, A. J., Triebel, H., and Baeumner, A. J.: Irregularly Shaped True-To-Life Microplastics with Embedded Optical Labels, EGU General Assembly 2026, Vienna, Austria, 3–8 May 2026, EGU26-19542, https://doi.org/10.5194/egusphere-egu26-19542, 2026.

EGU26-20301 | Orals | HS8.1.8

Revealing Hidden Interrelationships of PFAS-Pesticides-Microplastics in Urban Waters: Integrating Target and Non-Target Chemical Analyses Across Mexico 

Manish Kumar, David Octavio Martínez Narváez, Priyansha Gupta, and Kanika Dogra

Urban aquatic systems are increasingly burdened by complex mixtures of emerging contaminants whose interactions and cumulative risks are often underestimated by conventional monitoring strategies focused on individual compound classes. The co-occurrence of pesticides, per- and polyfluoroalkyl substances (PFAS), pharmaceuticals, volatile organic compounds (VOCs), and microplastics (MPs) poses significant challenges for water quality management in rapidly urbanizing and agro-industrial regions. Here, an integrated framework combining targeted and non-target analytical approaches was applied to assess emerging contaminants across surface water, groundwater, wastewater, and reservoir systems in multiple Mexican cities. Surface waters influenced by intensive agricultural and peri-urban activities exhibited the highest contaminant burdens. Pesticide concentrations ranged from 0.01 to 92 µg L⁻¹, with peak loads in agro-industrial reaches of the Pesquería basin where irrigation return flows and municipal wastewater converge. Transformation processes unified contaminant behavior along the river–reservoir continuum. The widespread detection of neonicotinoid transformation products and PFCA homologues derived from precursor degradation demonstrates that transformation sustains long-term, low-level contamination rather than eliminating parent compounds. Non-target screening expanded chemical coverage beyond predefined target lists and revealed diverse regulated and previously unmonitored VOCs, including industrial solvents and fragrance-related compounds, many showing limited removal during wastewater treatment. Within the semi-arid Presa de la Boca reservoir, MPs were ubiquitous (4–66 particles L⁻¹; median 21 particles L⁻¹). Alkaline pH (8.09–8.60), elevated temperatures (27.6–34.1 °C), and low dissolved oxygen (2.7–3.7 mg L⁻¹) promoted MP weathering and fragmentation. Small particles (<500 µm ≈ 87%), fragments (57.8%), and fibres (35.6%) dominated, while metal enrichment on MP surfaces highlighted their role as secondary vectors linking particulate and dissolved contaminant pathways. Overall, this study demonstrates that integrated target and non-target approaches are essential for resolving interconnected contaminant behavior and supporting mixture-aware monitoring, risk assessment, and management strategies.

How to cite: Kumar, M., Martínez Narváez, D. O., Gupta, P., and Dogra, K.: Revealing Hidden Interrelationships of PFAS-Pesticides-Microplastics in Urban Waters: Integrating Target and Non-Target Chemical Analyses Across Mexico, EGU General Assembly 2026, Vienna, Austria, 3–8 May 2026, EGU26-20301, https://doi.org/10.5194/egusphere-egu26-20301, 2026.

HS8.2 – Subsurface hydrology – Groundwater

EGU26-5064 | ECS | Posters on site | HS8.2.1

A pan-European map of shallow aquifer transmissivity in crystalline headwater catchments inferred from wetland and stream networks 

Ronan Abhervé, Alexandre Gauvain, Rémi Dupas, Etienne Bresciani, Alexandre Boisson, Jean Marçais, Jordy Salmon-Monviola, Patrick Durand, Hervé Squividant, Ophélie Fovet, Hugo Delottier, Philip Brunner, Laurent Longuevergne, Luc Aquilina, Jean-Raynald de Dreuzy, and Clément Roques

Groundwater systems in headwater catchments are poorly represented at continental scales due to model resolution constraints and limited observations available to characterize the wide diversity of catchments. Yet, low-order headwater streams accounting for a major fraction of the global river network. This is particularly true in upland crystalline bedrock regions with dense drainage networks, where the lithology has long been considered impermeable, without aquifers, and thus has received limited hydrogeological attention.

We present a new continental-scale assessment of effective transmissivity for 3,333 European crystalline headwater catchments (median ≈35 km²), underlain by unconfined, shallow hard-rock aquifers where subsurface-surface interactions strongly shape hydrological connectivity. Catchments including dams, glaciers, and extensive permafrost were excluded.

The methodology represents lateral hillslope groundwater flow within shallow subsurface systems, capturing the spatial patterns of saturated areas at the catchment scale. This framework of physically based groundwater flow models enables steady-state simulation of perennial surface water networks (springs, streams, wetlands), whose length and structure are highly sensitive to shallow aquifer transmissivity (Abhervé et al., 2023). Transmissivity was inferred through optimization of simulated seepage areas against observed wetland and stream networks, using constant recharge estimates from an independent land surface model and assuming dominant superficial subsurface flow in the upper 50 m. Across all calibrated models, the simulated networks closely replicate the available European-scale extended wetland ecosystem layer and stream network from the EU-Hydro database.

Estimated transmissivity ranges from 10⁻⁸ to 10⁻² m² s⁻¹ (mean ≈10⁻⁴ m² s⁻¹), with pronounced spatial variability across geological provinces, massifs, or regions sharing similar tectonic framework legacies. The broad transmissivity range demonstrates the method’s sensitivity and its ability to resolve catchment-scale effective hydraulic properties across diverse climatic, topographic, and geological contexts. Values are consistent with textbook estimates for the studied lithologies and with hydraulic test data (pumping and slug tests) from regional or global datasets. Both measurements and estimates follow a log-normal distribution. Hydraulic conductivity was also derived from transmissivity using independent aquifer thickness datasets, including global depth-to-bedrock and regolith thickness maps.

Our results provide the first EUropean crystalline bedRock hydrogeological HEADwater map of transmissivitY (EURHEADY), explicitly accounting for groundwater flows at the catchment scale. All calibrated simulations are provided as a georeferenced dataset, complemented by physiographic, climatic, hydrologic, pedologic, geologic, hydrogeologic, and anthropogenic attributes. This approach addresses a critical gap in estimating hydrogeological properties, a long-standing challenge for the critical zone community, and opens new opportunities for large-scale hydro(geo)logical modeling with improved representation of groundwater contributions.

Reference:
Abhervé, R., Roques, C., Gauvain, A., Longuevergne, L., Louaisil, S., Aquilina, L., & de Dreuzy, J. (2023). Calibration of groundwater seepage against the spatial distribution of the stream network to assess catchment-scale hydraulic properties. Hydrology and Earth System Sciences, 27(17), 3221–3239. https://doi.org/10.5194/hess-27-3221-2023

How to cite: Abhervé, R., Gauvain, A., Dupas, R., Bresciani, E., Boisson, A., Marçais, J., Salmon-Monviola, J., Durand, P., Squividant, H., Fovet, O., Delottier, H., Brunner, P., Longuevergne, L., Aquilina, L., de Dreuzy, J.-R., and Roques, C.: A pan-European map of shallow aquifer transmissivity in crystalline headwater catchments inferred from wetland and stream networks, EGU General Assembly 2026, Vienna, Austria, 3–8 May 2026, EGU26-5064, https://doi.org/10.5194/egusphere-egu26-5064, 2026.

Groundwater nitrate (NO3-) pollution jeopardizes drinking-water safety under the UN’s Sustainable Development Goal 6. Recovery lags behind policy ambitions because legacy nitrogen (N) stored in the vadose zone creates a “long tail” of persistent contamination, where NO3- continues to leach for decades. Here, we integrate the “long tail” mechanism into a global N-balance model, and couple this enhanced model with 0.5° × 0.5° simulations to project centennial-scale NO3- dynamics (1961–2100) in groundwater systems worldwide. Our modeling suggests that by 2020, shallow aquifers had accumulated 162 ± 6 Tg N of NO3-, contaminating approximately 10% of global land area above the WHO drinking water safety limit (11.3 mg N L-1). More critically, a vast NO3- reservoir (4,037 ± 214 Tg N) in vadose zones sustains this long tail, which may generate new contamination hotspots over the next 80 years. Even with an immediate transition to zero-N-surplus, 4% of affected regions are projected to remain above the WHO limit beyond 2100. To guide effective governance, we classify global croplands into four management archetypes, from “no additional action” to “multi-generational remediation”, and propose tailored strategies balancing water quality, food security, and soil sustainability. Our findings redefine the temporal scope of environmental governance, highlight priority regions for targeted interventions, and provide a science-based roadmap for achieving safe groundwater within realistic socioeconomic constraints.

How to cite: Zhao, W. and Jia, X.: Vadose zone nitrogen legacy threatens achievement of global groundwater quality goals, EGU General Assembly 2026, Vienna, Austria, 3–8 May 2026, EGU26-5606, https://doi.org/10.5194/egusphere-egu26-5606, 2026.

In catchments characterised by complex hydrological regimes, where streamflow is derived from significant groundwater contributions alongside diverse surface and anthropogenic inputs, accurate process representation is crucial. To address this challenge, this study presents a novel coupling of the Water System Integrated Modelling Framework (WSIMOD), which simulates water quality and quantity across the urban-rural integrated catchment, with the fully distributed groundwater model MODFLOW. The coupled framework is evaluated in the Upper River Lee catchment (UK), specifically focusing on two sub-catchments with distinct hydrological characteristics. To ensure a robust evaluation, the standalone WSIMOD, standalone MODFLOW, and the coupled model were all calibrated automatically using the PEST. While all three model configurations demonstrated satisfactory performance, the coupled model exhibited superior predictive capability, particularly regarding baseflow and groundwater levels. The study highlights the distinct added value of this hybrid approach. Compared to WSIMOD alone, the coupled model captures local spatial variations in groundwater and river dynamics, which is vital for investigating groundwater abstraction impacts. Conversely, relative to standalone MODFLOW, the coupled model provides a more detailed representation of surface water processes, specifically capturing the complex influence of urban infrastructure on the catchment’s hydrology. These results demonstrate that coupling lumped and distributed models is effective for resolving the complex water cycle dynamics of human-impacted catchments.

How to cite: Zong, W.: Coupling WSIMOD and MODFLOW to Enhance the Representation of Groundwater-Surface Water Interactions in Complex Catchments, EGU General Assembly 2026, Vienna, Austria, 3–8 May 2026, EGU26-7577, https://doi.org/10.5194/egusphere-egu26-7577, 2026.

Groundwater levels are declining in many regions of Europe, raising concerns about long-term water security. However, sparse temporally continuous groundwater observations constrain our ability to fully understand the impacts of groundwater depletion, especially its socio-economic consequences. According to a recent report by the European Environment Agency, groundwater supplied around 28% of agricultural water in European Union Member States during the twenty-first century. This dependence highlights the vulnerability of European agriculture and the societies it supports to ongoing reductions in groundwater availability. 

To understand the connection of socio-economic well-being, agriculture, and groundwater , we link a new 0.11° monthly water table depth anomaly dataset for Europe, spanning 1950 to the present, with existing European and global socio-economic datasets on crop production, crop prices and related agricultural indicators. This analysis enables us to assess how different crop types respond during periods of groundwater droughts. We examine long-term trends, identify crop-specific and region-specific sensitivities to groundwater decline, and evaluate how groundwater droughts propagate into market-level effects such as price fluctuations. Our results reveal distinct temporal and spatial patterns in both agricultural production and crop prices under groundwater stress, with some crops showing strong sensitivity to water table decline while others exhibit relative resilience. These findings provide a more nuanced understanding of the potential socio-economic risks associated with long-term groundwater depletion in a changing climate. Based on this study, we plan to provide recommendations for climate-resilient agricultural planning in regions facing persistent groundwater decline.

How to cite: Ma, Y. and Kollet, S.: Long-Term Socio-Economic Consequences of Groundwater Depletion Under Climate Change, EGU General Assembly 2026, Vienna, Austria, 3–8 May 2026, EGU26-8201, https://doi.org/10.5194/egusphere-egu26-8201, 2026.

EGU26-8890 | ECS | Orals | HS8.2.1

Global hyper-resolution modelling of historical and future groundwater dynamics 

Barry van Jaarsveld, Niko Wanders, Nicole Gyakowah Otoo, Edwin H. Sutanudjaja, Jarno Verkaik, Daniel Zamrsky, and Marc F.P. Bierkens

Sustainable management of global groundwater resources is a key societal challenge and central to the Sustainable Development Goals. The localized impacts of groundwater abstraction and the subtle interaction with topography of groundwater dependent ecosystems call for high resolution groundwater information to support effective management. At the same time, groundwater observations are very limited and concentrated in a few countries, rendering large parts of the groundwater resources ungauged. To address limited observations and coarse global models, we use the global groundwater model GLOBGM to simulate past and project future groundwater heads and water table depth at 30 arc-seconds (~1 km) at a monthly time step. Using ISIMIP3a inputs, groundwater dynamics are simulated for a reference period (1960–2019) to support model evaluation and attribution of observed impacts to climate variability and change. Following ISIMIP3b, historical baselines (1960–2014) and three combined socioeconomic–climate scenarios (2015–2100; SSP1-RCP2.6, SSP3-RCP7.0, SSP5-RCP8.5) are simulated with five GCMs, supporting robust detection and impact assessment of future change. Regions of reduced reliability are mapped, and quality assurance flags are provided to guide appropriate use and interpretation of the results. The resulting dataset offers comprehensive, high-resolution information to assess groundwater dynamics for the past and future, supporting improved global water resource management and climate impact assessments.

How to cite: van Jaarsveld, B., Wanders, N., Otoo, N. G., Sutanudjaja, E. H., Verkaik, J., Zamrsky, D., and Bierkens, M. F. P.: Global hyper-resolution modelling of historical and future groundwater dynamics, EGU General Assembly 2026, Vienna, Austria, 3–8 May 2026, EGU26-8890, https://doi.org/10.5194/egusphere-egu26-8890, 2026.

Baseflow recession analysis provides direct insight into catchment-scale groundwater drainage behavior under low-flow conditions, when river discharge is predominantly sustained by subsurface storage. The recession time constant (K) is widely used to characterize groundwater drainage timescales and describe how catchments release stored groundwater. Although recent studies have applied this metric across regional catchments, the large-scale variability of K and the relative importance of environmental factors governing its spatial variability remain insufficiently constrained, particularly at the global scale. In this study, recession time constants were systematically estimated for global catchments spanning a broad range of climatic and geological settings, following the theoretical framework proposed by Brutsaert. Estimates were derived from baseflow-dominated recession segments extracted from long-term daily streamflow records, enabling a large-sample assessment of both the statistical properties and spatial variability of K across heterogeneous environments. The resulting distribution reveals pronounced clustering around characteristic timescales, while also exhibiting substantial spatial heterogeneity among catchments. The dominant controls on recession timescales were examined using an explainable machine-learning framework based on a LightGBM model combined with SHAP-based interpretation. Drainage porosity emerges as the most influential predictor of K, highlighting the central role of effective groundwater storage capacity in regulating baseflow recession duration. Hydraulic conductivity provides additional explanatory power, reflecting the importance of subsurface transmissivity, whereas soil thickness and drainage density exert secondary but still detectable influences through their effects on storage volume and flow-path organization. These results support a physically consistent interpretation of baseflow recession time constants as emergent properties of groundwater storage and drainage efficiency at the catchment scale. By clarifying the environmental controls on K across diverse settings, this study advances process-based understanding of groundwater–streamflow interactions and demonstrates the utility of recession analysis as a scalable approach for diagnosing subsurface hydrological behavior from widely available discharge data.

How to cite: Cheng, S. and Zhang, L.: Global patterns and controls of baseflow recession timescales from large-sample streamflow analysis, EGU General Assembly 2026, Vienna, Austria, 3–8 May 2026, EGU26-9100, https://doi.org/10.5194/egusphere-egu26-9100, 2026.

EGU26-9357 | ECS | Posters on site | HS8.2.1

Multi-model assessment of uncertainties in continental groundwater vulnerability and pollution risk mapping in Africa 

Dor Fridman, Rebekah Hinton, Sara Nazari, Silvia Artuso, Barbara Willaarts, and Taher Kahil

Groundwater is among the largest freshwater storages on Earth and is a vital source of water for domestic, industrial, and irrigation purposes worldwide. In Africa, domestic water supply in both urban and rural areas largely depends on groundwater, often abstracted from shallow aquifers. Although groundwater is commonly perceived as a clean and safe water source, increasing anthropogenic pressures threaten its quality, potentially leading to negative health, social, and economic outcomes. Despite its importance, groundwater quality remains poorly monitored across much of the continent. Consequently, groundwater vulnerability and pollution risk assessments frequently rely on index-based approaches such as DRASTIC, which integrates hydrogeological factors including depth to the water table, net recharge, aquifer media, soil, topography, vadose zone, and hydraulic conductivity. At continental scales, these assessments depend heavily on global datasets and large-scale model outputs, introducing substantial uncertainty that is rarely quantified.

Here, we present the first pan-African multi-model intercomparison of groundwater vulnerability and pollution risk based on the DRASTIC framework. We analyze an ensemble of 12 groundwater vulnerability maps, generated by combining three depth-to-water-table datasets and four groundwater recharge models, and 48 groundwater pollution risk maps that additionally incorporate four gridded population datasets. Model disagreement is systematically quantified using Fleiss’ extent of agreement, enabling the identification of dominant sources and spatial patterns of uncertainty across Africa.

Our results reveal widespread disagreement among groundwater pollution risk maps across the continent, highlighting the strong sensitivity of continental-scale assessments to key hydrogeological and anthropogenic inputs. Uncertainty in population datasets drives major disagreement hotspots in the Sahel and parts of Central and East Africa, whereas differences among depth-to-water-table datasets dominate uncertainty across arid regions such as the Sahara and Kalahari deserts. Uncertainty in groundwater recharge estimates further contributes to model divergence in several humid and semi-arid regions across the continent. Using the ensemble, we explore compromise mapping approaches that synthesize model outputs to produce more informative and robust groundwater vulnerability and pollution risk maps.

Overall, our findings demonstrate that large-scale groundwater vulnerability and risk maps should be interpreted as uncertainty-informed products rather than deterministic outputs. Explicitly quantifying and communicating uncertainty is essential for improving confidence, transparency, and the responsible use of groundwater vulnerability assessments in data-scarce regions of Africa.

How to cite: Fridman, D., Hinton, R., Nazari, S., Artuso, S., Willaarts, B., and Kahil, T.: Multi-model assessment of uncertainties in continental groundwater vulnerability and pollution risk mapping in Africa, EGU General Assembly 2026, Vienna, Austria, 3–8 May 2026, EGU26-9357, https://doi.org/10.5194/egusphere-egu26-9357, 2026.

EGU26-9445 | ECS | Posters on site | HS8.2.1

Improving baseflow in within-grid large-scale hydrologic models through a groundwater response-time scale 

Afid Kholis, Sabine Attinger, Thomas Kalbacher, and Luis Samaniego

Accurate representation of baseflow remains challenging in within-grid large-scale hydrologic models, where groundwater is often represented as a single storage compartment per grid cell that exchanges water only vertically with the overlying soil column, without lateral groundwater flow between neighboring cells.  Here we test how groundwater formulation, infiltration physics, and calibration strategy control baseflow skill in the mesoscale Hydrologic Model (mHM) [1]. We systematically compare two within-grid groundwater schemes (the linear scheme originally implemented in mHM and an exponential scheme newly implemented following Niu et al. [2]) and two soil infiltration representations (infiltration capacity and the one-dimensional Richards equation [3]) across 200 catchments in Germany. We use individual-basin calibration to quantify the best achievable performance of each model variant and multi-basin calibration to test parameter transferability and identify a single German-wide parameter set.  Parameters are estimated within the Multiscale Parameter Regionalization (MPR) framework [1], and the baseflow index (BFI) is explicitly included in a joint calibration discharge (Q) and baseflow index (Q+BFI).

Including the baseflow index in calibration substantially improves long-term runoff-baseflow partitioning and daily baseflow dynamics, while maintaining the performance for streamflow, evapotranspiration, soil moisture, and terrestrial water storage anomalies.  Incremental calibration experiments further show that baseflow skill in exponential formulations commonly used in SIMGM- and TOPMODEL-type approaches is primarily controlled by two parameters that are often prescribed as fixed values: the decay rate f and the maximum baseflow QBx. Calibrating only f improves baseflow markedly, while calibrating only QBx yields smaller gains. Calibrating both is required for reliable baseflow dynamics.  

Across both individual-basin and multi-basin calibrations, the exponential groundwater scheme reproduces the weakest baseflow performance.  This deficiency can be attributed to the absence of an explicit response time scale: the scheme reacts either too rapidly or too slowly to recharge variations, and therefore fails to capture observed baseflow behavior. To address this, we introduce a single damping parameter that represents a groundwater response time scale, analogous to the delay process that is explicitly represented in linear groundwater formulations. We refer to this modified formulation as the damped-exponential scheme. Introducing this damping markedly improves baseflow performance and yields comparable performance to the linear formulation at both basin and Germany-wide scales. The improvement is not limited to streamflow partitioning: the damped-exponential scheme also better reproduces groundwater dynamics, supported by comparisons of water-table depth variability at 118 monitoring wells across Germany.

References:

[1] Multiscale parameter regionalization of a grid‐based hydrologic model at the mesoscale. Water Resources Research 46 (2010), 10.1029/2008WR007327.

[2] Development of a simple groundwater model for use in climate models and evaluation with Gravity Recovery and Climate Experiment data. J. Geophys. Res. 112 (2007), 10.1029/2006JD007522.

[3] Evaluating Richards Equation and Infiltration Capacity Approaches in Mesoscale Hydrologic Modeling. Water Resources Research 61 (2025), 10.1029/2024WR039625.

How to cite: Kholis, A., Attinger, S., Kalbacher, T., and Samaniego, L.: Improving baseflow in within-grid large-scale hydrologic models through a groundwater response-time scale, EGU General Assembly 2026, Vienna, Austria, 3–8 May 2026, EGU26-9445, https://doi.org/10.5194/egusphere-egu26-9445, 2026.

EGU26-9966 | Posters on site | HS8.2.1

Spatio-temporal changes of river-aquifer interactions in North-central Bangladesh 

José Zolezzi-López, Edinsson Muñoz-Vega, Mohammad Shamsudduha, and Stephan Schulz

Bangladesh, one of the most densely populated countries in the world, relies primarily on its irrigated agriculture to sustain rice production for a population that rose from 90 million in 1981 to about 165 million in 2022. Consequently, over the past three decades, irrigated land in Bangladesh has expanded from 2.58 million ha in 1990 to approximately 5.63 million ha in 2020, increasing the share of irrigated land from 31% to 66%. This rapid expansion has relied heavily on shallow groundwater abstraction, which, together with increasing domestic and industrial abstraction, has led to declining groundwater levels, altering the river-aquifer exchange in the Bengal Delta. Previous studies have estimated the overall change in the total groundwater recharge associated with increased abstraction through freshwater capture (“Bengal Water Machine”). However, these studies have not quantified the change in the focused recharge from river leakage into the groundwater system. To address this issue, we have developed a numerical groundwater flow model to assess the impact of increasing abstraction over the past four decades on the river-aquifer interactions in the North-central Bangladesh.

The 3D unstructured numerical model domain (area: 27670 km2) is delimited by the Shillong Plateau (i.e., Precambrian basement) to the north, and by the Brahmaputra (locally known as Jamuna), Meghna, and Ganges (locally known as Padma) rivers, to the west, east and south, respectively. The groundwater flow model was implemented in MODFLOW-6 and was set up using Flopy environment. The flow model consists of 11 layers (370 m average thickness) based on a regional geological model developed from borehole lithological data, and reflecting the multilayer aquifer distribution described in the literature. Main river networks within the study area, direct (diffuse) recharge from effective precipitation, and abstraction for domestic, irrigation, and industrial purposes were considered as boundary conditions. River-aquifer exchanges were simulated using the RIV package, driven by long-term monthly stage observations at several fluviometric stations within the domain. Hydraulic properties including hydraulic conductivities, vertical anisotropies, and specific storage, along with the riverbed conductance were calibrated using PEST++, based on long-term groundwater levels and drawdowns between 1980 and 2018 in over 80 observation wells located within the model domain.

The preliminary results show that the steady increase in groundwater abstraction for irrigation, especially using wells located in the shallow aquifer, has reversed the direction of flow in most rivers compared to the pre-irrigation (i.e., natural) condition, changing the hydrological system from gaining to losing regime. The magnitude of these changes is subject to high uncertainty, due to the intrinsic heterogeneity of the aquifer system and to the conductances in the riverbed, the morphology of the channels and other factors, especially during the monsoon (wet season).

How to cite: Zolezzi-López, J., Muñoz-Vega, E., Shamsudduha, M., and Schulz, S.: Spatio-temporal changes of river-aquifer interactions in North-central Bangladesh, EGU General Assembly 2026, Vienna, Austria, 3–8 May 2026, EGU26-9966, https://doi.org/10.5194/egusphere-egu26-9966, 2026.

The Ganga River basin has been subject to increasing water stress in recent decades.  Due to an increase in anthropogenic activities and climate factors, the terrestrial water storage of this basin is affected. Traditional groundwater monitoring using observation wells often fails to represent basin-scale spatial and temporal variability of groundwater storage due to the sparse distribution of monitoring wells. Satellite-based remote sensing provides an effective alternative in regions with limited in-situ data. In the present study, the Gravity Recovery and Climate Experiment (GRACE) data are used for a large-scale assessment of terrestrial water storage (TWS) variability in the Ganga basin for the period 2003–2024. The Groundwater Storage Anomalies (GWSA) are estimated by removing the soil moisture, snow water equivalent, and canopy water storage components available through the Global Land Data Assimilation System (GLDAS) from the TWS anomalies. Precipitation characteristics, basin-scale hydrogeological and topographic properties, are used to interpret the observed spatio-temporal variability in groundwater storage. Furthermore, basin-scale evapotranspiration, associated baseflow, and runoff are analysed using GLDAS products, and by combining them with GRACE-based observations, the interactions between surface water fluxes and subsurface storage variability are obtained. Results indicate a persistent decline in groundwater storage, accompanied by high evapotranspiration and reduced baseflow, which leads to increasing groundwater stress, potentially influenced by anthropogenic water use. Groundwater exhibits a lagged and damped response to precipitation, reflecting a delayed recharge process in the basin. Enhanced evapotranspiration are observed during dry and pre-monsoon periods. Finally, soil moisture and groundwater drought characteristics in the basin, derived from standardised storage anomalies, are used to assess spatio-temporal groundwater stress conditions and thereby water-stressed hotspots are identified in the Ganga basin.

Keywords: GLDAS, GRACE, Groundwater Storage Anomalies, Groundwater stress.

How to cite: Pathak, A. and Pathania, T.: Evaluating the spatio-temporal groundwater stress with data-driven models and satellite data for the Ganga River Basin., EGU General Assembly 2026, Vienna, Austria, 3–8 May 2026, EGU26-10369, https://doi.org/10.5194/egusphere-egu26-10369, 2026.

EGU26-11264 | ECS | Posters on site | HS8.2.1 | Highlight

The impact of climate change, land use change    and groundwater extraction on groundwater-dependent wetlands extent worldwide 

Nicole Gyakowah Otoo, Barry van Jaarsveld, Edwin H. Sutanudjaja, Michelle T.H. van Vliet, Aafke M. Schipper, and Marc F. P. Bierkens

Wetlands are recognised as one of the most important ecosystems in terms of their unique biodiversity. Yet since 1900, the world has lost more than 50% of its wetland area (Davidson, 2014; Dugan, 2005; Winkler & DeWitt, 1985). Groundwater dependent wetlands (GDWs) provide critical ecological functions but face increasing pressure from climate variability and groundwater abstraction, while their global extent and dynamics remain poorly quantified. Here we present the first spatially and temporally explicit global assessment of GDW extent using a high resolution, physically based groundwater modelling framework.

We developed a dynamic GDW mapping framework based on GLOBGM global groundwater model (Verkaik et al. (2022), a 30 arc second, two-layer MODFLOW model, coupled offline with PCR-GLOBWB (Sutanudjaja et al., 2018). We include improved recharge estimates through bias correction and enhanced groundwater-surface water coupling via dynamically updated drainage elevation using saturated area fraction to better represent shallow groundwater processes.

Following ISIMIP3a and ISIMIP3b protocols, we simulated monthly groundwater conditions from 1960 to 2014 and projected changes up to 2050 under SSP1-2.6, SSP3-7.0 and SSP5-8.5 using five CMIP6 global climate models per scenario (Lange & Büchner, 2021). Evaluation of groundwater heads against more than 15000 wells from the IGRAC dataset (IGRAC, 2024) show strongest performance for shallow water tables (average depth less than 5m) with about 67 % of wells with Kling Gupta Efficiency KGE ≥ −0.41.

Following earlier work (Otoo et al., 2025), we identified GDWs as areas with a saturated area fraction greater than 0.5 and water table depth less than or equal to 5 m, capturing both core groundwater fed wetlands and peripheral drought adapted systems while accounting for sub-grid variability. We exclude areas where groundwater results remain unreliable due to spin up issues, karst, permafrost and mountain areas (in total, only about 19 % of global areas). This approach shows strong spatial agreement with independent datasets, achieving a global hit rate of 76 % against the Global Lakes and Wetlands Database 2 (GLWD 2) (Lehner et al, 2025), and exceeding 80 % against the Australian Atlas (Doody et al., 2017).

We also account for land conversion when simulating area changes by excluding potential GDWs that coincide with agricultural areas in PCR-GLOBWB (rainfed and irrigated agriculture and pasture) for both past and future periods. For the historical period, we attributed groundwater level trends to climate-driven recharge changes, human-driven groundwater abstraction or a combination of both and quantified GDW area changes aggregated by WWF biome realm units (Olson et al., 2001). Preliminary results show strong reductions of past and future wetlands in Afrotropical, Indo-Malayan and Neotropical regions with distinct areas where either groundwater level decline or land use change are the dominant drivers. This framework addresses a major gap in global wetland assessments and provides a physically groundwater basis for evaluating past and future GDW dynamics in support of conservation planning, climate impact assessment and policy development aligned with Ramsar Convention, the Sustainable Development Goals and global biodiversity targets.

How to cite: Otoo, N. G., Jaarsveld, B. V., Sutanudjaja, E. H., van Vliet, M. T. H., Schipper, A. M., and Bierkens, M. F. P.: The impact of climate change, land use change    and groundwater extraction on groundwater-dependent wetlands extent worldwide, EGU General Assembly 2026, Vienna, Austria, 3–8 May 2026, EGU26-11264, https://doi.org/10.5194/egusphere-egu26-11264, 2026.

EGU26-11629 | ECS | Orals | HS8.2.1

Dynamic specific yield explains accelerated groundwater loss 

Maya Raghunath Suryawanshi, Kuruva Satish Kumar, Balaram Shaw, Chethan Varadaganahalli Anandagowda, Vandana Sukumaran, Aayushi Kochar, Muddu Sekhar, Shubham Goswami, Shard Chander, Bhaskar R. Nikam, Nagesh Kumar Dasika, and Bramha Dutt Vishwakarma

Specific yield is an important parameter capturing sub-surface characteristics, such as grain size, shape, and pore distribution. Specific yield is used to estimate change in groundwater storage from groundwater levels. Hence, it is critical for estimating changes in groundwater availability, a critical resource for ensuring socioeconomic prosperity. At present the norm is to consider specific yield as a constant in time. In the present study, using the Gravity Recovery and Climate Experiment (GRACE) data based total water storage anomalies and quality controlled well observations at global scale (the United States, Europe, Australia, India, and China), we show that specific yield is not constant in time and varies with groundwater level. Further, we establish an exponential relation between groundwater levels and specific yield. The parameters  (α = specific yield at zero groundwater level, β =  rate of groundwater level decay) of the best fit exponential function  are found to be the same across the United States (α= 0.17 ± 0.02, β= 0.02 ± 0.01 m-1), Europe (α= 0.11 ± 0.01, β= 0.03 ± 0.01 m-1), Australia (α= 0.12 ± 0.03, β= 0.02 ± 0.02 m-1), China (α= 0.11 ± 0.03, β= 0.05 ± 0.02 m-1), and India (α= 0.07 ± 0.02, β= 0.03 ± 0.03 m-1), within the uncertainty of the exponent. The methodology is validated using literature based specific yield values across the United States. In addition, improvement in modelling groundwater levels using AMBHAS-1D is observed when using a varying specific yield instead of a constant (NSE= 0.92, RMSE= 5.23 m). Hence, we conclude that with increased groundwater exploitation, its availability will drop faster than expected. Most of the regions investigated experienced a decline in specific yield over the last two decades, and the perceived groundwater availability for some locations is 80% less than that estimated using constant specific yield.

How to cite: Suryawanshi, M. R., Satish Kumar, K., Shaw, B., Varadaganahalli Anandagowda, C., Sukumaran, V., Kochar, A., Sekhar, M., Goswami, S., Chander, S., Nikam, B. R., Dasika, N. K., and Vishwakarma, B. D.: Dynamic specific yield explains accelerated groundwater loss, EGU General Assembly 2026, Vienna, Austria, 3–8 May 2026, EGU26-11629, https://doi.org/10.5194/egusphere-egu26-11629, 2026.

EGU26-11646 | ECS | Posters on site | HS8.2.1

Spatially Contrasting Groundwater Trajectories in the Indo-Gangetic Basin. 

Pratibha Mishra, Simon Moulds, Donald John MacAllister, Johanna Scheidegger, and Alan MacDonald

The Indo-Gangetic Basin (IGB) is a large trans-boundary aquifer system encompassing the alluvial Indo-Gangetic Plain (IGP) as well as the southern parts of the Indus, Ganges and the Rajasthan Inland drainage basin, supporting a large agrarian population. In recent decades, expansion of groundwater irrigation through shallow-medium tubewells (<70m) has boosted crop yields by reducing reliance on monsoon rains, enabling India to achieve food security and improving the livelihoods of millions. Although the IGP now accounts for around 25% of global groundwater abstraction, groundwater use in many parts of the wider IGB remains unsustainable and has driven widespread depletion. However, the Indo-Gangetic basin is not a single hydrogeological unit but a complex and heterogeneous aquifer system that is responding differently to the various pressures, including groundwater abstraction for irrigation and climate variability. Here, we analyse a groundwater well dataset to characterise the long-term patterns and trends in groundwater resources in the IGB for the time period 1998-2024, and improve our understanding of how the groundwater system interacts with various hydro-meteorological and anthropogenic factors. We compiled a new quality-controlled dataset of quarterly groundwater well data in the IGB which includes quarterly water level data for 5877 unique wells in the region. Our dataset also includes meteorological and land use data from various sources. Mann–Kendall trend analysis of groundwater levels between 1998–2010 across 2,585 wells indicates predominantly negative trends across the Indo-Gangetic Basin. These patterns can be attributed to intensification of the use of deep tubewells (>70m) in the Rajasthan Inland drainage basin and the Indus basin and shallow-medium tubewells in the Ganges basin during this period. Post-2010, we show that groundwater levels have shifted from a declining trend to a more stable trend in the Ganges basin overall. Nevertheless, in the north-west Ganges basin, Indus basin and Rajasthan inland drainage basin, despite experiencing increased rainfall and an extended multi-annual wet anomaly, groundwater levels continue to decline post-2010. The rate of decline has stabilised in the Indus basin but continues to increase in Rajasthan Inland drainage basin. In the Central Ganges basin, the trend shifts from a declining trend pre-2010 to a positive trend with rising groundwater levels. Groundwater levels in south-western parts of the Ganges basin that were stable between 1998-2010 now show a rising trend. The Minor Irrigation Census indicates no significant increase in the number of shallow–medium and deep tubewells across the Indo-Gangetic Basin between 2014 and 2017. However, land use inventory data for 2014–2024 show an expansion of cropped area in the Rajasthan Inland Drainage and Indus basins, along with an overall increase in the area sown more than once across the IGB. These patterns suggest that changes in agricultural practices, crop types and cropping patterns across sub-basins are contributing to long-term groundwater trends and variability in the region. Our results reveal pronounced, scale-dependent heterogeneity in the response of the IGB to climatic, environmental and anthropogenic stressors.

How to cite: Mishra, P., Moulds, S., MacAllister, D. J., Scheidegger, J., and MacDonald, A.: Spatially Contrasting Groundwater Trajectories in the Indo-Gangetic Basin., EGU General Assembly 2026, Vienna, Austria, 3–8 May 2026, EGU26-11646, https://doi.org/10.5194/egusphere-egu26-11646, 2026.

EGU26-12235 | Orals | HS8.2.1

Global assessment of manganese in groundwater 

Joel Podgorski and Michael Berg

Although manganese (Mn) is an essential component of human nutrition, high levels of Mn consumption may be toxic. Despite most dietary Mn generally coming from food, Mn intake via drinking water sourced from groundwater can be substantial. With new evidence pointing to greater detrimental health effects, particularly for infants, from excess Mn in drinking water, the World Health Organization (WHO) lowered its health-based guideline for Mn in drinking water several years ago from 400 µg/L to 80 µg/L. With the new guideline value being just one-fifth of the previous one, we have employed machine learning to model Mn concentrations in groundwater globally in order to assess the implications of this change on affected regions and populations. This was done by first assembling a large dataset of groundwater Mn concentrations and relevant environmental parameters, which were then used in machine-learning modeling. Based on these results and considering national-scale rates of household use of unmanaged groundwater, we estimate that over 200 million people are at risk from consuming >80 µg/L Mn in drinking water, which happens to be about five times more than the 39 million people at risk based on the previous guideline of 400 µg/L. Although the number of people at risk due to high Mn in drinking water is comparable to that for arsenic and fluoride, Mn generally receives much less attention than do these other, also naturally occurring, groundwater contaminants. As such, the groundwater Mn hazard and risk maps produced in this study are important guides in helping identify safe groundwater sources.

How to cite: Podgorski, J. and Berg, M.: Global assessment of manganese in groundwater, EGU General Assembly 2026, Vienna, Austria, 3–8 May 2026, EGU26-12235, https://doi.org/10.5194/egusphere-egu26-12235, 2026.

EGU26-15402 | ECS | Posters on site | HS8.2.1

Human-induced global groundwater decline simulated by H08-GMv1.0 

Qing He, Naota Hanasaki, Akiko Matsumura, Edwin Sutanudjaja, and Taikan Oki

Decline in groundwater levels has induced severe socio-economic consequences globally. These include water scarcity, land subsidence, and salinization of arable land. However, the capability of current Global Water Models (GWMs), including H08, to simulate groundwater level declines is still limited, partly because the groundwater, especially the lateral flow processes, used to be downplayed. A recent effort has been made to enable explicit representation of groundwater level and lateral flows in H08. The newly developed model is named as H08-GMv1.0 but has previously only been validated in terms of steady-state simulation. Here, we present the monthly transient simulation results from H08-GMv1.0 during 1979-2019, validated by ~20,000 USGS monitoring wells. The Theil-Sen trend of global groundwater level demonstrates severe decline in major aquifer systems worldwide. The results also show that in several irrigation intensive systems, i.e., High Plains aquifer, Indus River Basin aquifer, and Northern China Plain, the human groundwater pumping is the main cause for groundwater level declines, which calls for urgent and coordinated groundwater governance and demand-side management interventions.

How to cite: He, Q., Hanasaki, N., Matsumura, A., Sutanudjaja, E., and Oki, T.: Human-induced global groundwater decline simulated by H08-GMv1.0, EGU General Assembly 2026, Vienna, Austria, 3–8 May 2026, EGU26-15402, https://doi.org/10.5194/egusphere-egu26-15402, 2026.

EGU26-15769 | ECS | Orals | HS8.2.1

Climate-Driven Changing Groundwater Depth across North America 

Mohammad Haghiri, Kerry Callaghan, Roger Creel, Jacqueline Austermann, and Andrew Wickert

Groundwater provides a critical freshwater resource for agriculture, industry, and drinking water across North America. However, the long-term impacts of climate variability and change on groundwater availability remain poorly constrained at continental scales. Here, we evaluate how changing climate variability impacts North American groundwater table depths under three different future climate scenarios. We use the Water Table Model (WTM), a large-scale, physically based hydrological model, to simulate depth to water table at an annual scale from 1800 to 2100 CE. The model is forced by changing precipitation and evapotranspiration based on climate simulations and data from TraCE-21ka (past), CMIP6 (historical and future), and Terraclimate (present). Model results for the historical period (1800–2015) are evaluated against available lake, wetland, and groundwater well observations. Based on this, we find patterns of historical groundwater variability across North America. We then quantify spatial and temporal changes in depth to groundwater and identify regions of long-term groundwater stability, rise, or decline in response to climate forcing under three future scenarios (SSP1-2.6, SSP2-4.5, and SSP5-8.5). Our results reveal strong regional heterogeneity, with relatively stable or rising groundwater levels in humid and high-latitude regions, in contrast to persistent declines in arid and semi-arid zones. Future groundwater availability depends strongly on the emission scenario simulated, highlighting increasing climate-driven groundwater vulnerability across large parts of North America. This work provides a novel, annually resolved, continental scale assessment of climate impacts on groundwater availability and offers valuable insights for large-scale water balance studies, drought assessment, and sustainable groundwater management under a changing climate.

How to cite: Haghiri, M., Callaghan, K., Creel, R., Austermann, J., and Wickert, A.: Climate-Driven Changing Groundwater Depth across North America, EGU General Assembly 2026, Vienna, Austria, 3–8 May 2026, EGU26-15769, https://doi.org/10.5194/egusphere-egu26-15769, 2026.

Nile downstream countries, particularly Egypt, which depend on the Nile as their primary water resource, face a water budget deficit due to increasing consumption, hydroclimatic changes, and upstream damming (i.e., the Grand Ethiopian Renaissance Dam (GERD)). To address these challenges, Egyptian authorities introduced new management strategies for the High Aswan Dam Reservoir (HADR), the third largest artificial reservoir globally, is proposed to develop new agricultural areas. However, the interconnectivity between the HADR and the fossil Nubian aquifer, Africa's largest transboundary aquifer, remains speculative due to a lack of in situ investigations. To address this gap, we constructed a hydrogeological flow model to simulate HADR-Nubian Aquifer interaction under various upstream damming operation and flow condition scenarios, using the Moldflow model, incorporating geological, geophysical, and hydrogeological data. Our results indicate that the water-saturated normal faults serve as preferential flow pathways connecting the HADR to the Nubian Aquifer, potentially facilitating bidirectional water exchange depending on relative hydraulic head gradients. Our findings underscore forthcoming challenges for this linkage if the level of the HADR falls below approximately 160 m above mean sea level due to unmanaged upstream damming operations during the Nile’s extended drought periods. Under these conditions, the Nubian Aquifer's pressure head could surpass the HADR's reservoir head, resulting in aquifer discharge back into the HADR. This would alter the aquifer's water budget and compromise the planned agricultural developments in the adjacent areas, which constitute approximately 10% of Egypt's total arable land. These findings support a cooperative transboundary water management agreement that considers maintaining HADR water levels above critical thresholds to ensure both agricultural development and long-term aquifer sustainability across the Eastern Nile Basin.

How to cite: Ramah, M., Heggy, E., and Hanert, E.: Investigating the Interaction Between the High Aswan Dam Reservoir and Nubian Aquifer Under Increasing Nile Upstream Damming, EGU General Assembly 2026, Vienna, Austria, 3–8 May 2026, EGU26-17083, https://doi.org/10.5194/egusphere-egu26-17083, 2026.

EGU26-18523 | ECS | Posters on site | HS8.2.1

Density-dependent groundwater flow and hydrogeological response to brine extraction and reinjection in salt flat 

Deby Jurado Duarte, Sonia Valdivieso, Benjamín Crisóstomo, Aline Concha_Dimas, Enric Vázquez-Suñé, and Sergio Carrero

The increasing demand of Li, required in the electrification of motoring industry, has intensified the exploitation of brines in salt flats, as one of the main known sources of this element. Continental salt falt are hydrogeological systems characterized by extreme salinity gradients that generate significant spatial variations in groundwater density and give rise to complex flow patterns dominated by thermohaline circulation. Despite their relevance, density-dependent processes are often simplified or neglected in hydrogeological models used to assess brine exploitation, introducing substantial uncertainty in the interpretation of system behavior and associated impacts.

In this contribution, a coupled numerical modelling approach is presented to analyze the hydrogeological response of a salar subject to brine exploitation under variable-density flow conditions. First, a three-dimensional regional-scale groundwater model was developed and calibrated against observed hydraulic heads and salinity distribution. The model represents basin-scale flow patterns and incorporates existing brine pumping associated with exploitation, providing a reference framework for evaluating anthropogenic perturbations.

Building on the calibrated regional model, the system response to a controlled brine injection test associated with Direct Lithium Extraction (DLE) schemes was investigated. The simulations allow assessment of the spatial and temporal evolution of the injected brine plume, as well as the interaction between pumping- or injection-induced hydraulic gradients and buoyancy forces related to density contrasts

Results indicate that both brine extraction and reinjection induce non-linear and spatially propagated responses that are strongly controlled by density contrasts and hydrostratigraphic architecture, and that differ markedly from predictions obtained using constant-density approaches. The study highlights the necessity of explicitly accounting for density-dependent flow when evaluating the impacts of brine exploitation and reinjection strategies, and provides a physically consistent modelling framework to support the assessment and management of salars under conventional and DLE schemes. Those models would help to predict not only the evolution of phreatic level in a strategy based on DLE, but also would predict groundwater flow paths and the stability of the freshwater–brine mixing zone in marginal areas.

How to cite: Jurado Duarte, D., Valdivieso, S., Crisóstomo, B., Concha_Dimas, A., Vázquez-Suñé, E., and Carrero, S.: Density-dependent groundwater flow and hydrogeological response to brine extraction and reinjection in salt flat, EGU General Assembly 2026, Vienna, Austria, 3–8 May 2026, EGU26-18523, https://doi.org/10.5194/egusphere-egu26-18523, 2026.

EGU26-19300 | ECS | Posters on site | HS8.2.1

Linking Regional Aquifers Heterogeneity with Nonlinear Storage-Baseflow Relationships for European Catchments 

Anais Ibourichene and Sabine Attinger

Groundwater is the main source of fresh water on Earth. It provides drinking water, supports agriculture, and sustains ecosystems. During droughts, this subsurface reservoir also maintains river flow through baseflow. Groundwater systems can buffer temporal fluctuations in recharge and moderate the severity of both short-term dry spells and prolonged droughts.

In this study, we investigate the recession behavior of baseflow of European catchments during periods of droughts assuming a non-linear storage-baseflow relationship. We focus on two key parameters: the recession constant (k) and the nonlinearity exponent (n). Using a large set of recession segments, we show that the duration of the recession period strongly influences the parameter estimation. In particular, the degree of nonlinearity strongly depends on the length of the recession periods. Short recession periods (<1 month) show a stronger degree of nonlinearity than longer ones. For very long recession periods of about a year the nonlinearity exponent approaches 1 indicating a linear relationship between storage and baseflow.

In order to explain these findings, we develop a theory based on the assumption that regional groundwater systems contributing to baseflow are spatially heterogeneous. To that end, different parts of the groundwater system contribute with a different recession behavior to the total baseflow. Based on stochastic theory, we derive an effective nonlinear-storage-baseflow relationship which links statistical properties of a groundwater systems with the recession constant (k) and the nonlinearity exponent (n). Using our theory, we can explain why the estimated degree of non-linearity depends on the length of the recession period.

Our results emphasize the importance of the length of selected recession periods in the characterization of non-linear storage-baseflow relationships.  We will discuss how to make use of this finding and propose to use a spectrum of different recession periods to get more information on the spatial heterogeneity of groundwater systems contributing to baseflow.

Moreover, we will discuss the relevance of spatial heterogeneity of regional groundwater systems on buffering short and long term hydrological droughts.

How to cite: Ibourichene, A. and Attinger, S.: Linking Regional Aquifers Heterogeneity with Nonlinear Storage-Baseflow Relationships for European Catchments, EGU General Assembly 2026, Vienna, Austria, 3–8 May 2026, EGU26-19300, https://doi.org/10.5194/egusphere-egu26-19300, 2026.

Geogenic salinisation threatens groundwater in the German State of Brandenburg, where 25% of drinking water aquifers are already affected. The source are deep-seated brines originating from Upper Permian (Zechstein) salt dissolution, migrating upward via structural flow paths. The Oligocene Rupelian Clay isolates freshwater aquifers, but Quaternary glacial erosion created localised "windows" filled with permeable sands, enabling saline water ascent. Climate change drives declining groundwater recharge (GWR) in Brandenburg, projected to worsen and, coupled with extraction, increasingly compromise the freshwater-saline interface. Understanding the interplay between erosion windows, reduced recharge, and extraction is paramount for sustainable water management in this climate-vulnerable region.

A high-resolution 3D density-dependent flow and transport model is developed and employed using the Geomodelator-GUI [1] and TRANSPORTSE software [2] to investigate salinisation mechanisms in Brandenburg’s Lower Spree catchment area. The 3D framework integrates detailed hydrostratigraphy, capturing complex window geometry and anisotropic flow, assessing preferential pathways and clay barrier efficacy. Simulations assess four 100-year scenarios: (i) a Zero-Extraction Baseline, ZE, (ii) a Constant Recharge Baseline, CR, (iii) a Uniform Recharge Decline, UR, (linear 42% GWR reduction by 2050), and (iv) a Differential Recharge Decline, DR (spatially variable reductions: -20% to -60% in recharge/depletion zones). The model incorporates seven waterworks and utilises strata-specific porosity and hydraulic conductivity parameters derived from regional studies. Maximum salt concentrations are 10 g/L below the Rupelian.

Results demonstrate increased salinisation from upwelling under reduced recharge and extraction, particularly in deeper Tertiary aquifers and Quaternary window sediments itself. UR causes the highest intrusion: salt concentrations increase by 17% (9.6 mg/L) in the erosion windows. DR reduces intrusion by maximum 38% vs. UR at 100 years, but deep aquifers remain critically vulnerable. Shallow aquifers show minor changes (from an initial 0.1 mg/L to 0.17 mg/L), indicating salinisation predominantly affects deeper aquifers. Critically, even constant recharge with extraction drives salinisation, proving that groundwater extraction over long time periods is a decisive factor that is exacerbated by GWR decline.

3D model outcomes have elucidated critical processes inaccessible to 2D approaches [3] and provide an essential scientific foundation for proactive water resource management in Brandenburg and analogous basins. Results will directly support strategies to mitigate salinisation risks, such as adjusting sustainable extraction rates under future climate scenarios, and prioritising areas for enhanced monitoring or managed aquifer recharge. As subsurface utilisation for energy storage increases, this work also offers insights for safeguarding freshwater resources from potential deep brine mobilisation. Ultimately, the study underscores the urgency of integrating climate adaptation and detailed subsurface characterisation into groundwater governance to secure freshwater supplies in the face of escalating geogenic and anthropogenic pressures.

References:

[1] Kempka, T. et al. (2026, in review): GEOMODELATOR-GUI: A Web-Based Graphical User Interface for 3D Geological Modeling. SoftwareX.

[2] Kempka, T. (2020): Verification of a Python-based TRANsport Simulation Environment for density-driven fluid flow and coupled transport of heat and chemical species, doi: 10.5194/adgeo-54-67-2020.

[3] Chabab, E. et al. (2022): Upwelling mechanisms of deep saline waters via Quaternary erosion windows considering varying hydrogeological boundary conditions, doi: 10.5194/adgeo-58-47-2022.

How to cite: Chabab, E., Kühn, M., and Kempka, T.: Climate-driven groundwater recharge decline as a potential accelerant of geogenic salinisation in Brandenburg: A regional-scale 3D hydrogeological modelling study, EGU General Assembly 2026, Vienna, Austria, 3–8 May 2026, EGU26-19362, https://doi.org/10.5194/egusphere-egu26-19362, 2026.

EGU26-19708 | Posters on site | HS8.2.1

Hydrogeological Complexity and Ground Fissures in the Amyntaio Basin: The Role of Tectonics and Anthropogenic Interventions 

Emmanouil Skourtsos, Christos Filis, Emmanouil Andreadakis, Elina Kapourani, Haralambos Kranis, Christos Roumpos, Petros Kostaridis, and Georgios Louloudis

This study evaluates the complex hydrogeological conditions of the Amyntaio Basin by synthesizing historical data with updated 2021 piezometric measurements. The region’s geological framework is defined by intense neotectonic activity and lithological anisotropy, resulting in a system of overlapping granular aquifers—unconfined, leaky, or confined—that exhibit complex hydraulic behaviors.

The Groundwater aquifers of Amyntaio-Florina and Perdikka-Filota are categorized as having "Poor" quantitative status under EU Water Framework Directive criteria. While industrial dewatering associated with Public Power Corporation Lignite Mining has decreased since 2018 and stopped in may 2020, the basin remains under significant stress due to sustained abstractions for irrigation and municipal supply. The research indicates that the basin's response deviates from classical porous media models due to the presence of hydraulic boundaries and fault-controlled lateral recharges.

A critical re-evaluation of the monitoring network revealed that historical data (pre-2021) often lacked the resolution to distinguish between distinct aquifer horizons. The integration of deep-seated piezometers (>200m) into the 2021 network facilitated a high-fidelity mapping of the piezometric surface. Findings indicate that the hydraulic influence of mine dewatering is characterized by a high hydraulic gradient but a limited spatial radius, typically restricted to a zone of 500–800m from the mine’s crest.

The investigation into ground fissures and land subsidence in the settlements of Valtonera, Fanos, and Rodonas suggests a multi-causal mechanism, almost independent of mining activities:

  • Lithological Vulnerability: Settlements are founded on Holocene deposits with poor geomechanical properties.
  • Piezometric Drawdown: Localized intensive irrigation creates discrete cones of depression, often deeper than those observed near the industrial fronts.
  • Peat Oxidation and Consolidation: Following the historical reclamation of the Chimaditida marsh (1960s), the aeration of organic-rich horizons initiated biochemical oxidation. This process, coupled with the loss of buoyancy in the drained peat layers, has resulted in sustained, long-term volumetric shrinkage and surface deformation.
  • Tectonic Control: Major fault systems (e.g., Petron-Sklithro) act as planes of weakness, facilitating differential subsidence and aseismic creep.

In conclusion, the environmental degradation in the Amyntaio Basin is a long-term process governed by a synergy of tectonic constraints and initiated by marsh drainage and century-long anthropogenic interventions. The limited recovery potential of the aquifers, particularly in zones distal to the primary recharge points (Sklithro and Rodonas streams), necessitates a specialized management strategy that accounts for the basin's compartmentalized hydraulic behavior.

How to cite: Skourtsos, E., Filis, C., Andreadakis, E., Kapourani, E., Kranis, H., Roumpos, C., Kostaridis, P., and Louloudis, G.: Hydrogeological Complexity and Ground Fissures in the Amyntaio Basin: The Role of Tectonics and Anthropogenic Interventions, EGU General Assembly 2026, Vienna, Austria, 3–8 May 2026, EGU26-19708, https://doi.org/10.5194/egusphere-egu26-19708, 2026.

EGU26-21017 | ECS | Orals | HS8.2.1

Data-Driven Modelling of Large-Scale Groundwater Dynamics 

Sia Ghelichkhan and Liam Morrow

Reliable prediction of groundwater behaviour is essential for sustainable water resource management, particularly as climate variability intensifies pressure on subsurface reserves. Richards' equation provides a physically rigorous description of water movement through both unsaturated and saturated zones, yet its computational demands have long precluded application at continental scales.

Here we present a novel three-dimensional solver for Richards' equation built on Firedrake, a flexible finite element framework. This approach enables simulation of groundwater dynamics across spatial scales ranging from metres to thousands of kilometres, bridging the gap between local process studies and regional water management.

We demonstrate the solver through a case study of the Lower Murrumbidgee basin in Australia, encompassing approximately 3600 km². The simulation assimilates observational data from the Bureau of Meteorology, including basin stratigraphy comprising three layers of varying depth, annual rainfall estimates, and present-day water table depths. Our results capture decadal-scale flow dynamics at spatial resolutions previously unattainable for basins of this size. This work addresses critical limitations in current operational approaches, which do not fully couple unsaturated and saturated flow processes, and offers a pathway toward improved hydrological forecasting and water resource assessment at regional to continental scales.

How to cite: Ghelichkhan, S. and Morrow, L.: Data-Driven Modelling of Large-Scale Groundwater Dynamics, EGU General Assembly 2026, Vienna, Austria, 3–8 May 2026, EGU26-21017, https://doi.org/10.5194/egusphere-egu26-21017, 2026.

EGU26-105 | ECS | Orals | HS8.2.2

Physics-informed multi-task neural networks for joint mapping of fracture network and hydraulic conductivity in fractured aquifers: PI-XNET 

Prem Chand Muraharirao, Phanindra kbvn, Carlos Minutti-Martinez, Walter A Illman, and Chandramouli Sangamreddi

We develop a novel, physics-informed multi-task learning framework (PI-XNET) for steady-state hydraulic tomography in fractured aquifers. The model employs a SegNet-based encoder-decoder architecture with feature fusion to jointly reconstruct hydraulic conductivity (K) and the fracture network. The residuals of the governing partial differential equations (PDEs) are incorporated into the model to integrate the groundwater flow dynamics and enforce physical constraints. The unified loss combines data mismatch residuals, PDE constraints, and hard constraint loss, with each component weighted based on the task uncertainty. Through synthetic experiments, we evaluate the performance of PI-XNET and its robustness to data noise, reduced pumping datasets, and data resolution. In comparison to the standard multi-task learning network (RMSEmedian= 1.27, median R2k= 0.73), PI-XNET (RMSEmedian= 1.11, median R2k= 0.78) has improved the conductivity reconstruction and achieved higher fracture segmentation accuracy (ACCmedian>99%). Moreover, PI-XNET consistently achieved higher accuracy in hydraulic head reproducibility (median R2h= 0.61, median L1 norm = 0.19 m, median RMSEh = 0.14 m2). With fewer pumping test data and with data noise, the performance of PI-XNET declines modestly yet remains reliable. With coarser data resolution, head predictions remain robust (median R2h = 0.82), whereas K and fracture mapping deteriorated with increased fracture complexity. Our results demonstrate that incorporating physics constraints within an uncertainty-weighted, multi-task framework improves the parameter estimation and fracture mapping and achieves high accuracy even with reduced pumping data. Further, we emphasize that the reliability of PI-XNET in realistic fractured geologic settings depends on data quality and resolution.

How to cite: Muraharirao, P. C., kbvn, P., Minutti-Martinez, C., Illman, W. A., and Sangamreddi, C.: Physics-informed multi-task neural networks for joint mapping of fracture network and hydraulic conductivity in fractured aquifers: PI-XNET, EGU General Assembly 2026, Vienna, Austria, 3–8 May 2026, EGU26-105, https://doi.org/10.5194/egusphere-egu26-105, 2026.

EGU26-522 | ECS | Posters on site | HS8.2.2

Machine Learning framework for groundwater quality prediction in the upper Guadiana basin under climate variability 

Sharon Lee Vizcarra Mondragon, Anna Jurado Elices, Estanislao Pujades Garnes, and Nafiseh Salehi Siavashani

Understanding the interactions between climate variability and groundwater quality remains a major challenge in arid and semi-arid regions, where aquifers are increasingly affected by altered recharge regimes and more frequent droughts. The aims of these study are to: (i) investigate how climate and groundwater quality linkages and, (ii) propose a data-driven machine learning framework to predict hydrochemical parameters in a pilot catchment of the Upper Guadiana Basin (Spain).

Daily climatic variables (maximum and minimum temperature and precipitation) from the Spanish Meteorological Agency were compiled together with hydrochemical data collected between 2001 and 2021, including electrical conductivity, pH, dissolved oxygen, and major ions (HCO₃⁻, Cl⁻, NO₃⁻, SO₄²⁻, Na⁺, Mg²⁺, Ca²⁺) measured at ten groundwater sampling points from Guadiana River Basin authority.

The proposed methodology analyzes the variability, correlations, and long-term behaviour of the hydrochemical dataset in order to identify which parameters respond most clearly to climate conditions. Subsequently, a climate driven predictive component is constructed using multivariate regression models based on ensemble methods, such as Random Forest. The climate predictors obtained from this step allows the estimation of each hydrochemical variable. This workflow allows both datasets to be integrated in a coherent way despite their different temporal resolutions, while keeping the influence of climate on groundwater quality interpretable.

The resulting data-driven framework will support the prediction of groundwater quality parameters and the assessment of aquifer sensitivity under contrasting climate scenarios. Beyond its local application, the methodology offers a transferable and efficient approach for groundwater management in regions facing increasing climate stress and contributes to the climate change impact assessments and practical decision-support tools.

Keywords: groundwater quality, climate variability, machine learning, upper Guadiana basin.

How to cite: Vizcarra Mondragon, S. L., Jurado Elices, A., Pujades Garnes, E., and Salehi Siavashani, N.: Machine Learning framework for groundwater quality prediction in the upper Guadiana basin under climate variability, EGU General Assembly 2026, Vienna, Austria, 3–8 May 2026, EGU26-522, https://doi.org/10.5194/egusphere-egu26-522, 2026.

Groundwater quality is increasingly threatened by urban, agricultural, and industrial pressures, many of which introduce persistent pollutants into aquifers. Reliable prediction of solute migration toward surface water bodies is therefore critical for sustainable water‐resources management. This study investigates groundwater contamination dynamics by integrating an analytical groundwater-flow solution with a numerical advection–dispersion model and machine learning (ML). The objective is to improve predictive capability for contaminant arrival timing in stream–aquifer systems while reducing the computational burden associated with repeated physical simulations. This work contributes to the growing field of hybrid, data-driven groundwater modelling by demonstrating how machine-learning surrogates can efficiently emulate computationally intensive contaminant-transport simulations.

A hybrid computational framework was developed in which groundwater flow was solved analytically to obtain the spatial distribution of hydraulic heads and the corresponding stream–aquifer interaction fluxes. These analytically derived velocities along the stream boundary were then used as inputs to an explicit finite-difference solution of the advection–dispersion equation (ADE) for an instantaneous point-source release. The aquifer domain was discretized into a 40×40 grid, and Darcy velocities along the (0, y) interface were multiplied by local solute concentrations to obtain spatially distributed mass fluxes. Numerical integration (trapezoidal rule) yielded the total mass discharged into the river as a function of time. The time at which this discharge reached its maximum was extracted and used as the ML target variable. To explore a wide range of hydrogeological behaviors, a synthetic dataset was generated by sampling physically meaningful parameter ranges, including streambed slope, river length, aquifer width, longitudinal and transverse dispersivities, molecular diffusion, hydraulic conductivity, and initial particle positions. A total of 1200 analytical–numerical realizations were generated and partitioned into training and verification subsets to enable unbiased ML evaluation. All realizations were simulated using a uniform grid resolution to maintain numerical consistency across varying aquifer geometries. Preprocessing involved eliminating variables that did not influence arrival timing, such as total contaminant mass. Spearman correlation analysis and physics-based reasoning indicated that the transverse-dispersivity multiplier and molecular diffusion coefficient contributed negligibly to the target variable and were removed. Physics-informed feature engineering was then applied to strengthen predictor–response relationships, producing composite variables such as hydraulic-gradient proxies, dimensionless spatial coordinates, transmissivity-like ratios, and domain geometry indicators. After removing outliers via the IQR method and applying a logarithmic transformation to the target variable, a CatBoostRegressor model was optimized through Bayesian hyperparameter search. Model evaluation using R², RMSE, MAE, MAPE, and PBIAS demonstrated strong predictive skill with minimal bias (such as R² = 0.9367). These results indicate that the analytical–numerical–ML framework offers a computationally efficient alternative to repeated contaminant-transport simulations and reliably estimates contaminant-arrival timing across a wide spectrum of hydrogeologic settings.

How to cite: boyraz, U. and Baycan, H.: Rapid Prediction of Contaminant Arrival Times in Stream–Aquifer Systems Using Machine Learning, EGU General Assembly 2026, Vienna, Austria, 3–8 May 2026, EGU26-729, https://doi.org/10.5194/egusphere-egu26-729, 2026.

High-fidelity groundwater (GW) models are powerful tools for simulating complex subsurface processes and predicting groundwater levels with high accuracy—provided that high-quality input data is available. However, in many real-world applications, such high-quality data is rare. Input data are often noisy, sparse, and lack spatial resolution, which compromises the predictive power of these models. This presents a fundamental challenge: while the high-fidelity model is available, its application is limited by the low quality of the data typically encountered in operational settings. While physics-based simulations can help overcome the issue of data scarcity by generating synthetic training datasets, they do not address the issue of poor data quality—particularly the lack of spatial resolution in key inputs such as hydraulic conductivity (K), net recharge (R = N–ET), and pumping rates. These inputs should ideally be spatially distributed, but in practice, they are often poorly resolved or only available as point measurements. This raises a critical question: Should we deliberately degrade high-quality synthetic data during training to match the expected quality of application data? Or can we develop a surrogate model that is inherently robust to the data quality gap?

We propose the latter: a novel approach that trains a deep learning model to be aware of and compensate for residuals that occur due to a lack of input fidelity. The presented method tightly integrates the UNET deep learning architecture, physics-based MODFLOW model, and Gaussian process regression models into a hybrid training and prediction pipeline for building a residual-aware surrogate model. We tested this modelling approach on a study area in Germany, where we generated multi-fidelity training datasets with the MODLFOW 2005 simulator by varying the fidelity of the input permeability field. The presented hybrid approach is suitable for surrogating models where multi-fidelity models are available, but inference is only required for low-fidelity inputs.

How to cite: Ahmed, W., Khan, A. Q., and Nowak, W.: Making surrogates robust against model misspecification: A residual-aware combination of Gaussian processes and U-Net architectures. , EGU General Assembly 2026, Vienna, Austria, 3–8 May 2026, EGU26-1806, https://doi.org/10.5194/egusphere-egu26-1806, 2026.

In deep learning, as in any other modeling endeavor, the quality and scale of the data used are important. To use the prediction of groundwater levels as an example, satellite data have gained considerable attention for monitoring groundwater storage anomalies. However, such data have a coarse resolution and uncertainties due to the disintegration process. At the same time, the lack of sufficiently dense groundwater monitoring networks also remains a significant barrier. In many real-world applications, high-quality data are rare. Thus, input and target (calibration) data are often noisy, spatially/temporally sparse, and lack spatial resolution, which compromises the predictive power of deep learning models.

In this work, we investigate the robustness of deep learning for estimating groundwater levels at the continental scale from sparse observations. We utilize the CONUS2 dataset (https://hydroframe.org/parflow-conus2), derived from the physics-based simulator ParFlow. Inspired by a recent study (HydroStartML [1]), we utilize this dataset to train a deep learning model that estimates the “depth to water table” (DTWT) from easily accessible and spatially distributed covariates. These covariates include elevation, slope, and hydrographic features such as hydraulic conductivity and net recharge.

As a deep-learning model, we implement a U-Net architecture to map the relationship between these covariate maps and WTD. Beyond a baseline estimation, where we use the entire CONUS2 data set for training, we conduct a rigorous ablation to evaluate the model's robustness under simulated data scarcity, reflecting real-world observational constraints. To simulate data scarcity, we apply a masking protocol, where we systematically occlude a wide range of data fractions from the target data, thus forcing the U-Net model to reconstruct the WTD field from limited information. Finally, we assess model performance using standard metrics, such as the Nash-Sutcliffe Efficiency and the Root Mean Squared Error. Our results demonstrate a strong predictive capability, even in data-sparse scenarios, thereby validating the approach. However, a spatial analysis of the error distribution reveals a distinct topographical dichotomy: while the network achieves high precision and stability in low-relief plains, it exhibits systematic errors in complex mountainous terrain, where the prediction task is more challenging due to the larger spatial variability of covariates and the target variable. Overall, our findings suggest that, while U-Net architectures are surprisingly robust for groundwater mapping, distinct physical scenarios may require adaptations to the architecture.


[1] L. Pawusch, S. Scheurer, W. Nowak, R.M. Maxwell: “HydroStartML: A combined machine learning and physics-based approach to reduce hydrological model spin-up time”, Advances in Water Resources, 206, 2025. https://doi.org/10.1016/j.advwatres.2025.105124

How to cite: Nowak, W., Ahmed, W., and Buccini, E.: How far can we stretch big-data ideas with limited data? Machine-learned groundwater level predictions at a continental scale with smaller and smaller data sets., EGU General Assembly 2026, Vienna, Austria, 3–8 May 2026, EGU26-2374, https://doi.org/10.5194/egusphere-egu26-2374, 2026.

EGU26-2803 | Posters on site | HS8.2.2

A multi-scale machine learning framework for interpretable groundwater level prediction 

Sheng-Wei Wang and Wen-Chi Chen

Accurate prediction of groundwater level variations remains challenging in intensively exploited aquifers, particularly where recharge processes operate at daily scales while pumping activities are recorded at coarser temporal resolutions. Conventional data-driven models often struggle to reconcile these mismatched time scales and provide limited physical interpretability. This study aims to develop an interpretable, multi-scale machine learning framework that explicitly separates recharge-driven dynamics from pumping-induced impacts, thereby facilitating both predictive performance and enhanced hydrological insight. A two-stage, multi-scale modeling framework is proposed for a catchment-scale groundwater monitoring network consisting of nine monitoring wells. Daily groundwater levels and rainfall data were used alongside monthly electricity consumption records from surrounding pumping wells, disaggregated by pumping purpose. In Stage A, a monthly-scale model was constructed to capture long-term groundwater trends driven by aggregated rainfall and pumping intensity. Monthly groundwater levels were modeled using gradient boosting with rainfall sums, purpose-specific pumping electricity consumption, and optional autoregressive terms. Out-of-fold (OOF) predictions were generated using a five-fold time-series cross-validation scheme, and monthly predictions were subsequently upsampled to daily resolution. In Stage B, daily-scale residuals were defined as the difference between observed groundwater levels and Stage A monthly predictions. A residual learning model was then developed to represent short-term recharge responses using daily autoregressive information (with a 7-day lag), cumulative rainfall indices (7- and 14-day sums), and antecedent dry-day counts. To enhance robustness against extreme fluctuations, a pseudo-Huber loss function was adopted within an XGBoost regression framework. A small nested time-series grid search was employed to tune key hyperparameters, thereby balancing model stability and the risk of overfitting. Model performance was evaluated using OOF predictions across all wells. Interpretability was assessed through SHAP value analysis, rainfall event-aligned composite response analysis, and lag-to-peak diagnostics. Additional scenario-based comparisons were conducted to contrast observed responses, no-pumping counterfactual predictions, and simulations that included pumping. The proposed multi-scale framework achieved stable and physically consistent groundwater level predictions across the monitoring network. Stage B residual modeling substantially improved daily-scale performance relative to autoregressive-only baselines, particularly during recharge events. SHAP analysis confirmed that short-term rainfall accumulation and antecedent wetness were the dominant drivers of residual groundwater responses, while autoregressive terms captured local memory effects. Event-aligned composite analyses revealed heterogeneous lag-to-peak responses among wells, reflecting spatial variability in hydrogeological connectivity and the influence of pumping. While incorporating pumping information improved monthly trend representation in Stage A, scenario comparisons indicated that pumping effects on event-scale dynamics were well-separated from recharge-driven responses. The pseudo-Huber loss function provided marginal but consistent gains in robustness, particularly for wells exhibiting heavy-tailed residual behavior, without compromising interpretability. This study demonstrates that a multi-scale, residual-based machine learning framework can effectively reconcile disparate temporal resolutions in groundwater datasets while preserving hydrological interpretability. By explicitly decoupling long-term pumping impacts from short-term recharge dynamics, the proposed approach provides a transparent and extensible foundation for groundwater management applications. The framework is well-suited for exploratory analysis and international knowledge exchange, with future work focusing on refined representations of pumping and extended scenario-based assessments.

How to cite: Wang, S.-W. and Chen, W.-C.: A multi-scale machine learning framework for interpretable groundwater level prediction, EGU General Assembly 2026, Vienna, Austria, 3–8 May 2026, EGU26-2803, https://doi.org/10.5194/egusphere-egu26-2803, 2026.

Accurate national-scale modelling of surface water concentrations of trace elements requires accounting for both anthropogenic and geogenic inputs. In Denmark, groundwater concentrations of geogenic elements show pronounced spatial variability, making the natural groundwater component a potentially important contributor to the variability of surface water quality. However, quantifying groundwater–surface water interactions and groundwater-derived geogenic element concentrations at large spatial scales remains challenging due to limited data availability, model resolution constraints, and conceptual uncertainty.

This study aims to estimate the potential input of groundwater concentrations of selected geogenic elements (As, Ba, Cd, Cr, Cu, Ni, Pb, and Zn) to surface waters across Denmark. The resulting concentration estimates are intended as inputs to a nationwide surface water model. Therefore, the target spatial unit is the ID15 catchment, the smallest unit used in Danish national water management, representing topographic catchments with an average area of 15 km² (n = 3351).

To enable national-scale application, the complex three-dimensional groundwater–surface water system was simplified into a hierarchical structure with three levels: (1) well-screens, (2) groundwater bodies, and (3) ID15 catchments. Groundwater chemistry observations were available at the well-screen level. Well-screens were assigned to groundwater bodies with hydraulic contact to streams and lakes and thus feeding water into individual ID15 catchments.

We applied a hierarchical mixed-effects modelling framework to estimate typical (latent) concentrations of geogenic elements in groundwater bodies at depths relevant for groundwater–surface water contact. The model quantified the influence of hydrogeochemical and geological factors while accounting for spatial grouping within groundwater bodies and repeated measurements at individual well-screens. Each element was modelled separately, and concentrations were log-transformed prior to analysis.

The expected latent log-concentrations were described using a linear predictor with fixed and random effects. Fixed effects included redox class, pH class, geology, and depth, with interaction terms between redox and pH. Random effects were specified for groundwater bodies and well-screens. Measurements reported below detection limits were treated as left-censored observations and incorporated directly into the likelihood using cumulative log-normal probabilities.

Model parameter values including standard errors were estimated by minimising the joint negative log-likelihood using the R software package RTMB (R Template Model Builder), which is a high-performance statistical modelling tool. Model selection was based on Akaike’s Information Criterion. The model predicted latent groundwater concentrations at the depth assumed representative for groundwater–surface water contact: 3 m for groundwater bodies and 1 m for shallow near-surface groundwater not part of a groundwater body. Predicted log-concentrations were then aggregated to derive typical groundwater concentration inputs for each ID15 catchment.

We present a hierarchical modelling framework for estimating depth-dependent geogenic element concentrations at the groundwater body and ID15 catchment scales, enabling national-scale integration with surface water models, while interpreting and contextualising key model parameters and discussing limitations and future directions.

How to cite: Voutchkova, D., Troldborg, L., Thorling, L., Damgaard, C. F., and Sørensen, P. B.: National-scale modelling of spatially heterogeneous groundwater concentrations of selected geogenic elements to predict local-scale concentration-inputs to surface waters in Denmark, EGU General Assembly 2026, Vienna, Austria, 3–8 May 2026, EGU26-5889, https://doi.org/10.5194/egusphere-egu26-5889, 2026.

EGU26-6184 | Posters on site | HS8.2.2

Deep Learning-Based Detection of Seawater Intrusion Using Multivariate Hydrogeochemical Data 

Gyu Hyun Han, Kyoung-Ho Kim, and Sung-Wook Jeen

Seawater intrusion is a groundwater salinization process caused by seawater influx into coastal aquifers, and its severity has increased due to sea-level rise associated with climate change and excessive groundwater extraction. Previous studies on seawater intrusion detection have primarily relied on chemical indicators or fixed threshold values; however, these approaches have limitations in accounting for interactions among multivariate water quality data and variations in hydrogeochemical characteristics. This study aimed to develop a model for detecting seawater intrusion-affected samples using machine learning and deep learning techniques. In this study, data from the National Groundwater Monitoring Network in Korea were collected to define the background characteristics of domestic freshwater groundwater. The dataset consisted of 16 variables, including 13 original water quality parameters (electrical conductivity (EC), Na, Mg, K, Ca, Cl, SO4, HCO3, pH, Fe, Mn, NO3 and dissolved oxygen (DO)) and 3 derived variables reflecting the geochemical characteristics of seawater intrusion (Na/Cl ratio, Ca/Mg ratio, and Base Exchange Index; BEX). These data were used to train a Variational Autoencoder (VAE), a deep learning-based generative model, which compressed the data into a 4-dimensional latent space. To quantify the degree of differentiation from freshwater according to seawater mixing ratios, synthetic data were generated by coupling PHREEQC with R to incorporate key geochemical reaction mechanisms associated with seawater intrusion, including cation exchange reactions during seawater-freshwater mixing. Anomaly detection techniques were then applied to evaluate detection performance. The results demonstrated that samples could be distinguished from the freshwater distribution even at low seawater mixing ratios, suggesting the potential for determining minimum detectable contamination levels for seawater intrusion monitoring. This study presents a novel approach for seawater intrusion detection based on machine learning and deep learning, and is expected to contribute to early detection of seawater intrusion and sustainable management of coastal groundwater resources.

How to cite: Han, G. H., Kim, K.-H., and Jeen, S.-W.: Deep Learning-Based Detection of Seawater Intrusion Using Multivariate Hydrogeochemical Data, EGU General Assembly 2026, Vienna, Austria, 3–8 May 2026, EGU26-6184, https://doi.org/10.5194/egusphere-egu26-6184, 2026.

The research was carried out at the Manorhamilton karst spring in County Leitrim, northwest Ireland, a representative site of the region’s Carboniferous limestone terrain, notable for its complex subsurface flow networks and rapid hydrological dynamics. The study sought to simulate spring discharge using five years of hydrological observations and to evaluate ten distinct modeling methods. These included a physically based numerical pipe network model built in InfoWorks ICM 2025.1, three neural network (NN) models—Long Short-Term Memory (LSTM), Gated Recurrent Unit (GRU), and Nonlinear Autoregressive with Exogenous Inputs (NARX) and six hybrid numerical–NN configurations. Two hybridization strategies were tested: Residual Error Correction (REC) and Sequential Combination (SC). Results revealed that all NN models surpassed the standalone numerical model in reproducing karst spring discharge time series. Among the hybrids, the LSTM+PN+SC model achieved the highest accuracy, stability, and generalization across various flow regimes. These outcomes underscore the advantages of integrating physical process knowledge with deep learning approaches for modelling intricate karst hydrological systems. The study also outlines the strengths and limitations of applying different NN architectures and hybrid methods for groundwater management and prediction in comparable Irish karst settings.

How to cite: Chowdhury, N., Morrissey, P., and Gill, L.: A comparative analysis of numerical, neural network, and hybrid modelling techniques for simulating karst spring discharge based on long-term hydrological records., EGU General Assembly 2026, Vienna, Austria, 3–8 May 2026, EGU26-6926, https://doi.org/10.5194/egusphere-egu26-6926, 2026.

EGU26-7056 | ECS | Posters on site | HS8.2.2

Exploring the Generalisation Ability of Deep Learning Models for Large-Sample Groundwater Level Predictions across Space and Time 

Qidong Fang, Mostaquimur Rahman, Thorsten Wagener, and Francesca Pianosi

In hydrology, deep learning (DL) models have already achieved remarkable breakthroughs in predicting streamflow. These DL models are fed with meteorological time-series and static catchment attributes across large samples of catchments, and predict streamflow remarkably well in both gauged and ungauged situations. In recent years, some studies have transferred the idea of constructing multi-basin/station DL models – particularly Long-Short Term Memory (LSTM) neural networks – to large-sample groundwater level modelling to explore their potential for temporal and spatial extrapolation. To the best of authors’ knowledge, existing multi-station LSTM applications are limited to three, covering 76 climate-sensitive stations in Northern France, 108 nationwide stations in Germany, and 1,800 coastal stations across nine countries/regions. Notably, spatial generalisation was investigated solely in the German study, which suggests that the model utilised static features primarily as ‘unique identifiers’ to memorise local behaviour rather than deriving the generalisable hydrological insights required for spatial extrapolation. Given the limited number of studies and the potentially biased datasets, the generalisation ability of multi-station DL models for groundwater level modelling is still under exploration.

A newly released large-sample groundwater dataset by the Environment Agency of England, comprising more than 200,000 daily and 200 million sub-daily sampling observations for over 3,400 wells, offers a unique opportunity to test the generalisation ability of multi-station DL models in time and space, and whether these models can yield process-relevant insights on groundwater dynamic mechanisms. In this study, we want to investigate the following questions:

  • 1) How well can multi-station DL models simulate the groundwater variability across England?
  • 2) Which input features does the DL model use to make its predictions (especially in places where it does well)?

How to cite: Fang, Q., Rahman, M., Wagener, T., and Pianosi, F.: Exploring the Generalisation Ability of Deep Learning Models for Large-Sample Groundwater Level Predictions across Space and Time, EGU General Assembly 2026, Vienna, Austria, 3–8 May 2026, EGU26-7056, https://doi.org/10.5194/egusphere-egu26-7056, 2026.

EGU26-9072 | Orals | HS8.2.2

Data-driven modelling of groundwater level time series: challenges posed by contrasting response dynamics 

Maria Wetzel, Kunz Stefan, Doll Fabienne, Habbel Bastian, Liesch Tanja, and Broda Stefan

Groundwater systems exhibit substantially different response dynamics depending on site-specific and hydrogeological characteristics: While shallow aquifers often respond rapidly to meteorological forcing, deeper groundwater systems typically show delayed and strongly damped dynamics. In particular, monitoring wells with large depths to groundwater and long response times to external drivers remain challenging to model reliably using data-driven approaches. However, these systems are hydrogeologically highly relevant, as their substantial storage capacity and persistence across wet and dry periods strongly influence long-term water availability and the attenuation of climatic extremes.

To assess the potential of data-driven models for capturing contrasting groundwater dynamics, groundwater level time series from approximately 400 monitoring wells in the federal state of Brandenburg (Germany) are selected. All wells provide continuous observations since 1980, are distributed across three major aquifer complexes at different depths, and thus represent a wide spectrum of response behaviours. Recurrent neural networks (Gated Recurrent Units - GRU) are applied to predict groundwater levels based on meteorological inputs (precipitation and air temperature). Two key aspects are systematically investigated: (1) the length of the input sequence and (2) the optional integration of aggregated meteorological predictors. This design evaluates whether extended look-back periods or the incorporation of site-specific smoothed climate signals improves the predictability of damped groundwater systems.

The results indicate that input sequence lengths of two to three years substantially improve model performance for slow-responding groundwater systems, whereas shorter sequences are sufficient for more dynamic systems. Incorporating site-specific aggregated meteorological inputs further enhanced the representation of characteristic response times and led to a considerable increase in predictive skill for slow-responding aquifers. Although some strongly damped systems remain difficult to predict even with optimised model configurations, the overall results demonstrate a clear potential to better capture slow-responding groundwater dynamics and improve predictive performance.

How to cite: Wetzel, M., Stefan, K., Fabienne, D., Bastian, H., Tanja, L., and Stefan, B.: Data-driven modelling of groundwater level time series: challenges posed by contrasting response dynamics, EGU General Assembly 2026, Vienna, Austria, 3–8 May 2026, EGU26-9072, https://doi.org/10.5194/egusphere-egu26-9072, 2026.

The sustainable management of groundwater resources faces significant challenges in light of progressing climate changes with decreasing groundwater recharge, as well as the associated increase in withdrawals. At several observation wells in Germany in particular, declining groundwater levels are being observed, highlighting the need for robust forecasting methods to assess both the long-term availability of water resources and the vulnerability and resilience of aquifers.

Using spectral analysis of groundwater level fluctuations, hydrogeological parameters such as transmissivity, storativity, and the characteristic response time can be derived from time series of groundwater levels and recharge in the frequency domain. The characteristic response time serves as a measure of an aquifer’s resilience to droughts, enabling the classification of groundwater monitoring wells and their respective aquifers, while the derived transmissivity and storativity can be used for transient groundwater modelling.

Thus, the presented methodological workflow allows a rapid assessment of hydrogeological properties as well as the application of these parameters in numerical and analytical models for predicting groundwater levels under changing climatic conditions.

How to cite: Houben, T., Siebert, C., and Attinger, S.: Spectral Analysis of groundwater level time series: Hydrogeological parameter estimation for groundwater modelling, EGU General Assembly 2026, Vienna, Austria, 3–8 May 2026, EGU26-9346, https://doi.org/10.5194/egusphere-egu26-9346, 2026.

The valley of the River Göta Älv in southwest Sweden is highly prone to landslides due to the presence of underlaying clay deposits. Landslides occur when driving forces and moments exceed resisting forces and moments, and this balance can be altered by elevated pore-water pressures thereby reducing effective stress. Pore pressure varies with climatic drivers (precipitation and evapotranspiration) and with changes in external loading, such as river stage fluctuations.

Here we apply the impulse–response modelling framework Pastas to calibrate, validate, and simulate pore-pressure time series from piezometers installed along the Göta Älv valley. Since 2019, pore pressure has been monitored at multiple locations and depths. Model calibration used daily precipitation, temperature, potential evapotranspiration (PET), and river level time series. In total, 127 pore-pressure series were modelled using multiple combinations of impulse response functions and evapotranspiration formulations. Based on calibration and validation performance, 58 series were deemed suitable for climate-driven simulations. The most common causes of unsatisfactory model performance were (i) failure to reproduce rapid responses, (ii) threshold-like behaviour leading to underestimation of extreme high levels, (iii) short records limiting representation of inter-annual variability, (iv) shifted dynamics from the calibration to the validation period, and (v) potential outliers related to initialization of pressure sensors, measurement errors, or gas intrusion in instruments.

The acceptable models were forced using the CMIP5 ensemble of EURO-CORDEX regional climate model (RCM) simulations for 1970–2100 (daily precipitation and temperature). Extreme high pore-pressure levels were quantified as 100-year return levels using a generalized extreme value (GEV) distribution under RCP8.5. For most series, the projected median change in the 100-year return level by 2100 is <0.1 m relative to 1970–2010, while a small subset shows increases up to ~0.3 m (excluding outliers). Considering the 95th percentile of the projected change in the 100-year return level, most series remain <0.4 m, with a small subset reaching up to ~1.3 m. These point-scale changes in extreme pore pressure may increase landslide susceptibility. The results enable slope-scale landslide probability assessment by upscaling piezometer-scale return levels to a three-dimensional slope geometry.

The presentation will highlight (i) the use of data-driven impulse–response modelling for pore-pressure time series (to our knowledge not previously applied in this context), (ii) key challenges in obtaining robust calibrations and validations, and (iii) scenario-based projections and extreme-value analysis under a changed climate.

How to cite: Sundell, J. and Haaf, E.: Modelling extreme pore-water pressures in clay under climate change for landslide risk assessment: the Göta Älv river valley, Sweden, EGU General Assembly 2026, Vienna, Austria, 3–8 May 2026, EGU26-9355, https://doi.org/10.5194/egusphere-egu26-9355, 2026.

EGU26-9876 | ECS | Posters on site | HS8.2.2

Simultaneous Identification of a Contamination Source and Hydraulic Conductivity Based on a Multimodal Direct Forward Machine Learning Model 

Yan Zhu, Zhi Dou, Chaoqi Wang, Meng Chen, Yun Yang, and Jinguo Wang

Groundwater contamination source identification (GCSI) is critical for water resources management but depends on the accurate characterization of aquifer parameters, especially hydraulic conductivity (K). A novel multimodal direct forward machine learning (MDFML) model was developed to simultaneously predict GCSI parameters and reconstruct K-fields. This model utilizes constrained residual fusion to integrate temporal concentration and spatial head data, and improve complementarity. Tested on synthetic Gaussian and non-Gaussian aquifers, MDFML consistently outperformed single-modal models. In Gaussian fields, MDFML improved source parameter prediction by 2.20% (R²) and K-field reconstruction by 7.50% (SSIM, structural similarity index) compared to single-modal baselines. In non-Gaussian fields, structured dispersion patterns achieved higher K-field reconstruction (SSIM=0.951, +6.70% vs. 0.892 for Gaussian), but nonlinearity lowered source prediction accuracy (R²=0.900, -2.75% vs. 0.925 for Gaussian). These results demonstrate the robustness and reliability of MDFML under complex hydrogeological conditions and provide an efficient solution for accurate GCSI and sustainable groundwater remediation.

How to cite: Zhu, Y., Dou, Z., Wang, C., Chen, M., Yang, Y., and Wang, J.: Simultaneous Identification of a Contamination Source and Hydraulic Conductivity Based on a Multimodal Direct Forward Machine Learning Model, EGU General Assembly 2026, Vienna, Austria, 3–8 May 2026, EGU26-9876, https://doi.org/10.5194/egusphere-egu26-9876, 2026.

Global change poses significant challenges to water resource management. Water Table Depth (WTD) is a critical variable linking subsurface dynamics with land surface processes. Local observations support WTD monitoring; however, observations are sparse and unevenly distributed. Transfer learning applications are a solution for WTD monitoring; however, prediction quality assessment is challenging in locations without observations. Consequently, a generalized, scalable, and transferable WTD monitoring framework with a prediction quality assessment tool is essential for such locations.

This contribution explores a method to estimate prediction quality for transfer learning applications from observed grid cells to target locations without observations. Specifically, we implement an ensemble approach with 100 Long Short-Term Memory (LSTM) networks to predict WTD. By leveraging the ensemble spread, we develop spread-skill relationships (which measure the ability of the ensemble uncertainty to predict accuracy) to assess prediction quality in target locations.

We use the Terrestrial Systems Modelling Platform Ground to Atmosphere (TSMP-G2A) dataset from 2001 to 2020, and spatially split it into training and transfer sets. Each ensemble LSTM member was trained on a spatial subset of the training set from 2001 to 2015, randomly sampled based on geographic location. We also evaluated the local prediction performance on the training grid cells over the testing period from 2016 to 2020. The transfer learning performance was assessed on the transfer set, with the same testing period but different locations from the training set. The spread-skill relationships were explored between ensemble spread and performance metrics on the transfer set.

Results indicate good generalization and transfer abilities. Additionally, expanding the spatial size of each ensemble member’s training subset from 100 to 400 grid cells leads to a global improvement in transfer prediction accuracy by 11.52% and 17.42% in RMSE and Pearson correlation, respectively. The spread-skill relationships show a strong correlation between ensemble spread (ensemble variance and interquartile range) and both RMSE and absolute mean bias, demonstrating a potential effective estimation of prediction quality for certain performance metrics without the need for observations. In contrast, the ensemble spread exhibits a weak relationship with Pearson correlation.

The study highlights the potential of transfer learning to improve hydrological modeling and provides an assessment tool for prediction quality, particularly in regions lacking observations. These findings demonstrate the feasibility of scalable data-driven groundwater prediction and suggest that future research could extend this framework to evaluate its transferability and performance at the global scale.

How to cite: Miaari, S., Klotz, D., and Kollet, S.: Application of Ensemble LSTM Transfer Learning for Water Table Depth Prediction and Uncertainty Assessment in Data-Scarce Regions, EGU General Assembly 2026, Vienna, Austria, 3–8 May 2026, EGU26-9892, https://doi.org/10.5194/egusphere-egu26-9892, 2026.

EGU26-10303 | Orals | HS8.2.2

Integrating physical constraints into neural networks for piezometric time series modeling: application to the Beauce limestone aquiferAbstract: 

Pascal Audigane, Etienne Lehembre, Hugo Breuillard, Thi-Bich-Hanh Dao, Vincent Nguyen, and Christel Vrain

Accurate simulation of groundwater level dynamics remains a major challenge due to the complex interplay between climatic forcing, subsurface properties, and hydrological processes. In this study, we propose a hybrid modeling approach that combines data-driven neural networks with physically based constraints to reproduce piezometric time series of the Beauce limestone aquifer, located in the Centre–Val de Loire region (France). This aquifer has been monitored for several decades and benefits from an extensive observation network. Twelve piezometers were selected to represent the diversity of groundwater responses, including systems characterized by strong inertial behavior.

The neural network is trained by minimizing a cost function measuring the mismatch between observed and simulated groundwater levels. To enhance training convergence and predictive skill, the cost function is augmented with a term derived from physical processes governing groundwater evolution. These processes are based on the inter-reservoir drainage laws implemented in the global hydrological model Gardenia (©BRGM). Gardenia conceptualizes the transfer of water from precipitation to the aquifer through three reservoirs: soil, unsaturated zone, and saturated zone. Infiltration is controlled by the square of soil saturation, effective rainfall is partitioned between runoff and percolation following an exponential law defined by a half-life parameter and a partitioning factor, and groundwater discharge to the river is described by an exponential recession law governed by a distinct half-life.

The proposed architecture combines a Long Short-Term Memory (LSTM) network with a Multi-Layer Perceptron (MLP), allowing the model to exploit both the temporal dependency structure of hydrological time series and the nonlinear representation capacity of feedforward neural networks. Results show that incorporating physical constraints into the learning process significantly improves both training stability and predictive performance compared to a purely data-driven approach. Finally, the hybrid model performances are compared with those of the Gardenia model, highlighting the added value of combining physical understanding with machine learning for groundwater level simulation.

How to cite: Audigane, P., Lehembre, E., Breuillard, H., Dao, T.-B.-H., Nguyen, V., and Vrain, C.: Integrating physical constraints into neural networks for piezometric time series modeling: application to the Beauce limestone aquiferAbstract:, EGU General Assembly 2026, Vienna, Austria, 3–8 May 2026, EGU26-10303, https://doi.org/10.5194/egusphere-egu26-10303, 2026.

EGU26-10493 | ECS | Posters on site | HS8.2.2

From Large-scale Hydrological Models to Local Action: A Framework for Operational Groundwater Level Forecasting at the Point Scale 

Simon Paasch, Timo Houben, Thomas Ohnemus, and Hannes Mollenhauer

As climate change alters precipitation patterns, regional water governance and the agricultural sector face a critical challenge: transitioning from reactive crisis management to proactive water allocation. In recent years, regional authorities in Germany have increasingly been forced to issue water extraction bans to protect groundwater and surface water resources. However, such restrictions rely on water budget assessments derived from point-scale water level observations. While large-scale integrated hydrological models provide essential insights into long-term trends, their coarse spatial resolution often fails to accurately predict point-scale groundwater levels, creating a resolution gap for local decision-makers who require site-specific information for regulatory and operational purposes.

We present a Proof of Concept for an operational groundwater level forecasting framework designed to bridge this gap between large-scale modeling and local application. This approach focuses on the integration of existing, openly available data, combining historical local groundwater observations with large-scale recharge data from the integrated ParFlow hydrologic model. By applying a hybrid methodology—utilizing Fourier-based time-series analysis coupled with a simplified 2D groundwater table model —we demonstrate how large-scale model outputs can be downscaled into point-scale information.

Currently, the operational pipeline has been implemented for selected groundwater gauges in Saxony, featuring automated data ingestion and processing. We showcase the potential of this framework to provide agricultural stakeholders and water authorities with lead time needed for informed management decisions. Future developments will focus on expanding the gauge network, implementing a GIS-based interface for spatial visualization, and potentially integrating thresholds for groundwater extraction bans to increase regulatory predictability. By utilizing established scientific methods and data, this work provides a blueprint for transferring hydrological outputs into actionable information for stakeholders in regional water management and agriculture.

How to cite: Paasch, S., Houben, T., Ohnemus, T., and Mollenhauer, H.: From Large-scale Hydrological Models to Local Action: A Framework for Operational Groundwater Level Forecasting at the Point Scale, EGU General Assembly 2026, Vienna, Austria, 3–8 May 2026, EGU26-10493, https://doi.org/10.5194/egusphere-egu26-10493, 2026.

EGU26-10721 | ECS | Posters on site | HS8.2.2

Thermo-hydraulic sensitivity of the North-Central European subsurface under glacial forcing 

Nimisha Anna George, Magdalena Scheck Wenderoth, Mauro Cacace, Denise Degen, Ritske S Huismans, and Elco Luijendijk

The subsurface of North-Central Europe has been shaped by repeated glaciations, which have altered pore pressure, temperature, and groundwater flow over geological timescales. Understanding these coupled thermo-hydraulic responses is essential for groundwater management, geothermal energy utilization, and subsurface storage applications such as CO₂ sequestration.

In this study, we investigate the thermo-hydraulic response of a multi-layered subsurface model of North-Central Europe over a time period the last glacial maximum up to present-day, while considering the thermal and hydraulic feedback of the glacier dynamics on the distribution in time and space of pore pressure and temperature.Independent hydraulic and thermal simulations are constructed, followed by controlled in which porosity and permeability are systematically varied within selected stratigraphic units while all other parameters are held constant. The resulting transient pore pressure and temperature fields are analyzed to assess the relative roles of conductive and advective heat transport and to identify formation-specific controls on pressure dissipation and thermal redistribution.

Based on the generated simulation ensemble, we further explore the development of physics-preserving, interpretable AI-assisted surrogate models and parameter estimation. These surrogates aim to efficiently reproduce key thermo-hydraulic responses while retaining physical consistency, thereby enabling rapid sensitivity analysis and uncertainty quantification in large-scale subsurface systems.

How to cite: George, N. A., Wenderoth, M. S., Cacace, M., Degen, D., Huismans, R. S., and Luijendijk, E.: Thermo-hydraulic sensitivity of the North-Central European subsurface under glacial forcing, EGU General Assembly 2026, Vienna, Austria, 3–8 May 2026, EGU26-10721, https://doi.org/10.5194/egusphere-egu26-10721, 2026.

EGU26-11009 | Orals | HS8.2.2 | Highlight

An Operational Groundwater-Level Forecasting System for Europe 

Mariana Gomez, Hector Aguilera, Julian Koch, Augustin Thomas, Georgina Arno, Montse Colomer, Peter van der Keur, and Stefan Broda

In order to manage groundwater effectively at the pan-European scale, it is essential to treat groundwater as a shared, transboundary resource and to assess it consistently from in-situ observations. In the course of the Geological Service for Europe (GSEU) project, we compiled groundwater-level records from participating national and regional surveys. These records were subsequently harmonized into the European Groundwater Monitoring (EUGM) database. Groundwater level time series encompass diverse data sampling intervals, record lengths, continuity, and quality, frequently exhibiting non-uniform spatial coverage. The data undergoes a quality assurance process comprising the detection of stagnation periods, outlier screening, and the imputation of missing values. After the quality assurance process, the EUGM release contains 12,797 groundwater-level time series, of which 2,654 are designated as near-real-time (NRT) monitoring points, with expected monthly updates across 11 European countries.

Focusing on NRT stations, we plan to develop an operational forecasting system for monthly groundwater levels using a single LSTM model trained at sites with a minimum of 20 years of observations. Meteorological predictors include precipitation, air temperature, relative humidity, and standardized precipitation indices (SPI) from ERA5-Land. The modelling period varies by site according to record length and, with the earliest possible start being 1950 in order to align with ERA5-Land availability. Results are intended for integration into the European Geological Data Infrastructure (EGDI) platform with the objective of enabling Europe-wide access, comparison, and operational use. The EUGM thereby provides a consistent observational base for cross-border assessment, modelling, and forecasting of groundwater dynamics.

How to cite: Gomez, M., Aguilera, H., Koch, J., Thomas, A., Arno, G., Colomer, M., van der Keur, P., and Broda, S.: An Operational Groundwater-Level Forecasting System for Europe, EGU General Assembly 2026, Vienna, Austria, 3–8 May 2026, EGU26-11009, https://doi.org/10.5194/egusphere-egu26-11009, 2026.

EGU26-11041 | ECS | Orals | HS8.2.2

A New Global Deep Learning Framework to Generalize Groundwater Simulation Across Hydrogeological Diversity and Anthropogenic Influence 

Asmae Ez-zahy, Nicolas Massei, Abderrahim Jardani, Lisa Baulon, Hugo Breuillard, Augustin Thomas, and Sivarama Krishna Reddy Chidepudi

Groundwater levels integrate the combined effects of climate variability, surface–subsurface interactions, and anthropogenic activities. Capturing their temporal dynamics across diverse hydrogeological settings and varying degrees of human influence remains a major scientific challenge, particularly in regions where physical descriptors and anthropogenic forcing data are scarce or uncertain. This study investigates whether a single deep learning model can generalize groundwater level simulations across a large number of hydrogeologically contrasted monitoring stations in metropolitan France. The proposed framework relies on long-term time series of groundwater levels and meteorological forcings (precipitation and temperature), collected from the French groundwater  monitoring network and meteo-france SAFRAN reanalysis. Climate-driven groundwater dynamics is first learned from meteorological inputs only, and the architecture of the Deep Learning model is subsequently extended to account for anthropogenic influences by incorporating groundwater pumping data where available, despite their sparse and uneven spatial coverage. This strategy enables the integration of human-induced forcing while maintaining consistency with climate-driven groundwater behavior under heterogeneous spatio-temporal water abstraction data availability. The results show the ability of the proposed framework to reproduce temporal groundwater dynamics across a wide range of hydrogeological contexts and degrees of anthropogenic influence. They also highlight the relevance of the approach for developing scenarios of regional-scale groundwater evolution under changes in climate conditions and water uses.

How to cite: Ez-zahy, A., Massei, N., Jardani, A., Baulon, L., Breuillard, H., Thomas, A., and Chidepudi, S. K. R.: A New Global Deep Learning Framework to Generalize Groundwater Simulation Across Hydrogeological Diversity and Anthropogenic Influence, EGU General Assembly 2026, Vienna, Austria, 3–8 May 2026, EGU26-11041, https://doi.org/10.5194/egusphere-egu26-11041, 2026.

Groundwater monitoring networks are often particularly well established in areas where groundwater resources are exploited. Groundwater withdrawals in such areas potentially affect the observed groundwater levels. Models that are aimed at simulating groundwater levels therefore need to account for temporarily varying groundwater abstraction rates. Unfortunately, such information is rarely available, particularly in agricultural areas where multiple users extract groundwater for irrigation, depending on the seasonally varying crop water requirements. The objective of this work is to develop and test an approach for incorporating unreported irrigation withdrawals into data-driven time-series models of groundwater levels. To this end, irrigation is integrated into a lumped-parameter model coupling a root-zone model to a linear storage representing the groundwater body. While the irrigation demand is determined from the root-zone model, the groundwater abstraction needed to meet this demand is considered in the linear storage. The model is tested for the case of the shallow Seewinkel aquifer (Austria), which is almost exclusively used for irrigation. The model calibration yields a time-varying rate of groundwater abstraction. When compared with available irrigation estimates, the average groundwater abstraction obtained from the model is reasonable. The model suggests that the depletion of groundwater levels resulting from the groundwater abstraction for irrigation varies depending on the hydrological conditions. For example, an observation well where the depletion amounted to around one metre in wet years exhibited a depletion of around two metres in the years following the European drought 2003.

How to cite: Birk, S.: Integration of unreported irrigation withdrawals in time-series models of groundwater levels (Seewinkel, Austria), EGU General Assembly 2026, Vienna, Austria, 3–8 May 2026, EGU26-13119, https://doi.org/10.5194/egusphere-egu26-13119, 2026.

EGU26-13153 | ECS | Posters on site | HS8.2.2

Using LSTM and Metrological Time Series to forecast Lysimeter leachate 

Florian Lam, Simon Damm, Asja Fischer, and Thomas Heinze

Quantifying groundwater recharge remains a central challenge in hydrology, particularly in the context of climate variability and water resource management. Lysimeter measurements provide direct estimates of recharge but are spatially sparse and costly to maintain. In this study we train and evaluate long short-term memory (LSTM) networks on high-resolution Lysimeter data of multiple decades to predict seepage fluxes based on precipitation, temperature, and related meteorological  features. LSTM architectures are well-suited to capture the delayed and nonlinear nature of recharge processes, where precipitation may influence measurable seepage weeks or months later. The selection of meteorological features is guided by well-established empirical relations. We use feature importance to investigate the relevance of meterological input parameters on the model prediction and to guide the design of a compact neural network using the fewest possible input features to simplify future data acquisition. We envision the replacement of Lysimeters by trained neural networks as soft-sensors.

Our results highlight key limitations, particularly the need for sufficiently large datasets and the degradation of model performance in the presence of data gaps. Nevertheless, machine learning shows promise for extrapolating recharge dynamics in data-sparse regions if trained appropriately. This work contributes to the growing discourse on integrating physical understanding with data-driven methods to support groundwater assessments.

How to cite: Lam, F., Damm, S., Fischer, A., and Heinze, T.: Using LSTM and Metrological Time Series to forecast Lysimeter leachate, EGU General Assembly 2026, Vienna, Austria, 3–8 May 2026, EGU26-13153, https://doi.org/10.5194/egusphere-egu26-13153, 2026.

EGU26-13775 | Orals | HS8.2.2

Recursive neural networks for application-focussed emulation of groundwater models 

Matthew Arran, Kirsty Upton, Christopher Jackson, Setareh Nagheli, and Benjamin Marchant

With changes in climate and water demand placing increasing pressure on UK groundwater resources, water companies need to be able to rapidly and reliably simulate a wide range of scenarios for precipitation, evapotranspiration, and borehole abstraction. But models derived purely from historical data are unreliable in changing conditions, while physics-based groundwater models require time and expertise to run. Here, we show that a Recursive-Neural-Network-based emulator of a physics-based model can make predictions that are both rapid and reliable, giving water companies a tool for both operational decision-making and long-term planning. We discuss the practical importance of representative training data, user-friendly interfaces, and clear uncertainty communication. Finally, we indicate the broader applicability of our work.

How to cite: Arran, M., Upton, K., Jackson, C., Nagheli, S., and Marchant, B.: Recursive neural networks for application-focussed emulation of groundwater models, EGU General Assembly 2026, Vienna, Austria, 3–8 May 2026, EGU26-13775, https://doi.org/10.5194/egusphere-egu26-13775, 2026.

EGU26-14206 | Orals | HS8.2.2

Probabilistic decision-support for groundwater management made feasible through artificial neural networks  

Mathias Busk Nielsen, Troels Norvin Vilhelmsen, Rasmus Bødker Madsen, and Thomas Mejer Hansen

Groundwater management in Danish municipalities relies heavily on decision-support from numerical flow simulations to evaluate the impact of drinking‑water abstraction on the surrounding environment and the risk of contamination. We would require that this decision-support is as informative as possible and should therefore consider uncertainty in model input data. However, most applied groundwater models are deterministic, built on a single geological interpretation and a fixed set of hydraulic parameters. Such models provide only a single outcome drawn from a whole distribution of possible outcomes, blinding decision-makers to potential unforeseen environmental risks. Fully propagating geological and hydrological uncertainty in these models is necessary to explore all possible outcomes, but this comes at the cost of computationally expensive simulations infeasible to perform within everyday administrative workflows.

To address this challenge, we present an approach that utilizes artificial neural networks trained on simulated results from a stochastic model ensemble to emulate the computationally heavy numerical models. The approach constructs an ensemble of groundwater models of the same location with stochastic geology and hydrological layer properties. Simulations run in the model ensemble using MODFLOW present the full outcome space as a distribution instead of a single value. We perform forward particle tracking in the ensemble to delineate probabilistic catchment areas of abstraction wells. The probabilistic catchment areas are used as target data for the neural network to learn from along with a selection of input features. Applied to the Egebjerg catchment, Denmark, the neural network produces catchment probabilities with high accuracy compared to MODFLOW while reducing computation time from hours to seconds.

The achieved reduction in computation time makes the neural network suitable within a decision-support tool enabling the use of stochastic models in practice and improving the decision-making process of administrative groundwater management.

How to cite: Nielsen, M. B., Vilhelmsen, T. N., Madsen, R. B., and Hansen, T. M.: Probabilistic decision-support for groundwater management made feasible through artificial neural networks , EGU General Assembly 2026, Vienna, Austria, 3–8 May 2026, EGU26-14206, https://doi.org/10.5194/egusphere-egu26-14206, 2026.

EGU26-15057 | Orals | HS8.2.2

Mapping groundwater discharge potential from Earth observation data using machine learning: Evidence from an arid basin 

Hayat Ghachoui, Abdelhalim Tabit, Ahmed Algouti, and Said Moujane

Groundwater stands as a vital buffer against the growing impacts of climate change, especially in arid and semi-arid regions where surface water is ephemeral and rainfall patterns are becoming increasingly erratic. Understanding how recharge zones respond to climatic variability is crucial for ensuring long-term water security. This study provides a basin-scale assessment of groundwater discharge potential by integrating field measurements, geospatial predictors and supervised machine-learning techniques. A dataset of 239 boreholes with measured discharge (L s⁻¹) from 2015-2025 was compiled to identify high-potential sites. Sixteen conditioning factors representing topography, hydrology, climate, vegetation, land use and structural characteristics were generated from remote-sensing products, DEM-derived indices and thematic datasets. After evaluating multicollinearity through correlation analysis and variance inflation factors, four single classifiers,Random Forest, Extreme Gradient Boosting (XGBoost), Light Gradient Boosting Machine (LightGBM) and k-Nearest Neighbours (KNN), were developed, along with several hybrid ensembles and a four-model stacking configuration.

All models reveal a consistent spatial pattern. Favourable zones trace a continuous corridor along the main Drâa Valley, from the upstream sectors around Aguim and Taznakht through Ouarzazate and Agdz to the Zagora plains, with frequent extensions across adjacent piedmonts and alluvial surfaces. Around half of the basin is classified as favourable (class 1), underscoring the central geomorphological role of this valley system in concentrating infiltration and sustaining groundwater discharge. Among the single models, LightGBM shows the strongest performance (accuracy = 0.941; ROC_AUC = 0.985; LogLoss = 0.166; Brier score = 0.046). The four-model ensemble achieves an accuracy of 0.943 and an MCC of 0.885, with very low probability errors in independent validation. Elevation, soil moisture, drainage density, precipitation and NDWI are consistently identified as the most influential predictors. Overall, the proposed framework offers a robust decision support tool for guiding drilling, managed aquifer recharge and the protection of key groundwater corridors in one of Morocco’s most water stressed regions.

How to cite: Ghachoui, H., Tabit, A., Algouti, A., and Moujane, S.: Mapping groundwater discharge potential from Earth observation data using machine learning: Evidence from an arid basin, EGU General Assembly 2026, Vienna, Austria, 3–8 May 2026, EGU26-15057, https://doi.org/10.5194/egusphere-egu26-15057, 2026.

Identifying the source and release history of groundwater contaminants is a crucial task, as removal operations largely depend on these factors. Link Simulation Optimisation (LSO) is a proven method for identifying the history of the source for the groundwater contaminants in inverse problem matrices. In a conventional LSO optimisation algorithm, the simulation algorithm is encapsulated within it. The optimisation algorithm drives the search, whereas the simulation model responds. The main strong point of the LSO is how the tandem optimisation algorithm and simulation model work. However, simulation models often increase the computational burden; as a result, they are replaced with a surrogate model.

Historically, statistical surrogates such as Polynomial Response Surface, Gaussian Process Regression, and radial basis function have been used in the groundwater source release history problem. More recently, machine–learning–based surrogates, such as Artificial Neural Networks, Deep Neural Networks, and Convolutional Neural Networks, have been extensively used in groundwater source release history problems. The main drawbacks of these surrogates are that they don’t consider physics within their training process. As a result, they are heavily dependent on the training data. Outside information beyond their training data often relates to poor performance. Moreover, the source identification of groundwater problems is ill-posed, but surrogates often smooth the objective landscape and provide a false sense of uniqueness. Additionally, a noise level of 1% to 2% in the training data typically results in a significant error in prediction within the LSO framework.

To overcome the aforementioned drawback, we propose a surrogate based on a physics-informed neural network (PINN) in an LSO framework for identifying the source contamination strength in a hypothetical case scenario. The hypothetical scenario is homogeneous and governed by the Dirichlet boundary condition. The proposed PINN learns the spatio-temporal contaminant concentration C(x,y,z,t) by minimising errors in observed data while simultaneously enforcing the 3D advection–dispersion equation, boundary conditions, and initial conditions. The contaminant source is represented as a time-limited mass-loading well (active until 0 to t_on), embedded directly into the governing PDE, ensuring physically consistent transport and mass conservation. Apart from conventional practices, validation is performed during the training process, which provides advantages in avoiding overfitting and retaining the most effective features. This 3D-PINN tested 1000 data points generated using random uniform, Sobol, and Latin hypercube sampling.  Results show that with the correct implementation of the PINN, we can estimate the source strength C(x, y, z, t) with greater accuracy. In this LSO model, we utilise simulated annealing as the optimisation method.

How to cite: Dey, S. and Hansen, S. K.: Solving 3D Inverse Groundwater Source History Problems in a LSO Framework Using Physics-Informed Neural Networks and Simulated Annealing  in Homogeneous Aquifers, EGU General Assembly 2026, Vienna, Austria, 3–8 May 2026, EGU26-15889, https://doi.org/10.5194/egusphere-egu26-15889, 2026.

Detecting and attributing groundwater droughts requires models that both capture complex temporal memory and provide interpretable representations of drivers. We present a framework that models weekly Standardised Groundwater Index (SGI) at multiple wells in Norway and Sweden using a Long Short-Term Memory (LSTM) network in combination with SHapley Additive exPlanations (SHAP) to attribute drought drivers. The LSTM ingests weekly climate and meteorological predictors (e.g., precipitation, temperature) together with large-scale teleconnection indices (e.g. NAO) to learn nonlinear, lagged responses that govern groundwater anomalies. We configure relatively deep LSTM network to represent long-range dependencies controlling weekly to seasonal anomalies and apply light regularisation to preserve natural SGI variability and avoid suppression of seasonal peaks. SHAP is used post-hoc to quantify feature importance and the timing and sign of impacts on predicted SGI at both aggregated and event specific scales. This allows identifying which predictors and lag times drive rapid groundwater decline or recovery, how teleconnection phases modulate drought risk, and the spatial heterogeneity of dominant drivers across wells. The primary objective of the LSTM–SHAP framework is to deliver local, well-specific attribution across the study region, complemented by spatial maps that identify the dominant controlling features (e.g., summer precipitation or winter snow). The results demonstrate that the integrated LSTM–SHAP approach produces accurate weekly SGI estimates for monitoring purposes while providing attribution of drought drivers. This capability supports early warning, and enhances understanding of hydroclimatic influences on groundwater droughts.

How to cite: Nair, A. S., Giese, M., and Tallaksen, L. M.: Groundwater drought attribution in Norway and Sweden using interpretable LSTM models of the Standardised Groundwater Index , EGU General Assembly 2026, Vienna, Austria, 3–8 May 2026, EGU26-16963, https://doi.org/10.5194/egusphere-egu26-16963, 2026.

EGU26-18571 | Posters on site | HS8.2.2

Short-term and long-term uncertainty analysis in groundwater level forecasting 

Leticia Baena-Ruiz, David Pulido-Velazquez, Antonio-Juan Collados-Lara, Juan de Dios Gómez-Gómez, Héctor Aguilera, Miguel Mejías, and Juan Grima

Groundwater resources are essential to ensure future water security, especially in semi-arid areas such as the Mediterranean region. Groundwater level forecasting allows to predict the availability of the resource under different scenarios (including potential future climate change scenarios), although sometimes there is not enough monitoring data to develop distributed models. Some approaches such as lumped models and/or artificial intelligence algorithms have been demonstrated to provide satisfactory results by using a reduced amount of data.

In this work, we analyse the impact of some sources of uncertainty in the generation of local future groundwater level forecasts by using lumped models and artificial neural networks (ANN). The climate uncertainty is constrained from specific warming scenarios by removing the projections coming from inferior models (from multi-criteria analyses) taking into account their availability to reproduce historical climate statistics. A stochastic weather generator was used to generate multiple series of exogenous variables, which will allow to perform a stochastic forecast. The structural uncertainty related with the propagation of hydrological impact of ensembled climatic series is analysed by simulating with different lumped and ANN models.

The lumped models were calibrated through an automatic procedure. We also applied a sensitivity analysis in order to adjust the range of some hydrogeological parameters. Multiple configurations of ANN (approaches, number of neurons and delays) and exogenous variables were tested to select the best experiments by considering the mean value of MSE.

We analyse the climatic and structural uncertainty for short-term forecasting using both modelling approaches. We also analyse the long-term uncertainty by simulating with lumped models. The generation of stochastic predictions will be explored, by applying the Monte Carlo Method from the simulation with multiple selected models with good performance indicators.

The methodology was applied to the Campo de Montiel aquifer in central Spain, an area where groundwater and surface water are closely interconnected, with recognized Natural Park and Ramsar site such as Lagunas de Ruidera wetland, but also an intensive groundwater extraction due to the agricultural demand. This aquifer is essential as strategic water reserve under drought periods in a semi-arid climatic context.

The results have been also compared with those obtained with MODFLOW, showing the differences between distributed vs lumped approaches (sensitivity of the results to the spatial resolution of the methods).


Funding: This research was partially funded by the project SIGLO-PRO (PID2021- 128021OB - I00/ AEI / https://doi.org/10.13039/501100011033/FEDER,UE), from the Spanish Ministry of Science, Innovation and Universities.

How to cite: Baena-Ruiz, L., Pulido-Velazquez, D., Collados-Lara, A.-J., Gómez-Gómez, J. D. D., Aguilera, H., Mejías, M., and Grima, J.: Short-term and long-term uncertainty analysis in groundwater level forecasting, EGU General Assembly 2026, Vienna, Austria, 3–8 May 2026, EGU26-18571, https://doi.org/10.5194/egusphere-egu26-18571, 2026.

EGU26-19011 | Posters on site | HS8.2.2

A Hybrid Physically Based–AI Framework for Improving Groundwater Level Simulations 

Antonio-Juan Collados-Lara, David Pulido-Velazquez, Leticia Baena-Ruiz, and Miguel Mejías

The combination of physically based models and artificial intelligence techniques enhances the simulation of piezometric levels by integrating the hydrological consistency of the former with the ability of the latter to capture nonlinear patterns and reduce uncertainties, ultimately providing more robust predictions. In this work, we coupled a Modflow groundwater flow model with nonlinear autoregressive neural networks with exogenous input (NARX) to simulate piezometric levels in the Campo de Montiel groundwater body (GWB).
The Campo de Montiel GWB, located in the Upper Guadiana Basin (south‑eastern Spain), represents a critical area where groundwater‑dependent ecosystems coexist in tension with intensive groundwater abstraction, mainly for irrigation. This aquifer plays a key role in the regional hydrological system and constitutes an essential water reservoir in this semi‑arid environment.
A numerical Modflow model developed by the river basin authority was used to simulate groundwater flow and river–aquifer interactions across the eight groundwater bodies of the Upper Guadiana Basin, providing hydraulic head maps and flow budgets. In a subsequent step, NARX neural networks were trained to reproduce piezometric levels using the Modflow‑simulated heads as exogenous inputs in Campo de Montiel groundwater body.
This hybrid modelling approach improved the accuracy of piezometric level simulations compared to the standalone flow model. For the pilot piezometer, the Modflow model yielded an RMSE of 8.12 m, whereas the hybrid approach reduced the RMSE to 5.08 m.

Funding: This research was partially funded by the project SIGLO-PRO (PID2021- 128021OB - I00/ AEI / https://doi.org/10.13039/501100011033/FEDER,UE), from the Spanish Ministry of Science, Innovation and Universities.

How to cite: Collados-Lara, A.-J., Pulido-Velazquez, D., Baena-Ruiz, L., and Mejías, M.: A Hybrid Physically Based–AI Framework for Improving Groundwater Level Simulations, EGU General Assembly 2026, Vienna, Austria, 3–8 May 2026, EGU26-19011, https://doi.org/10.5194/egusphere-egu26-19011, 2026.

EGU26-19031 | ECS | Posters on site | HS8.2.2

Attention-Based Insights into Surface–Groundwater Coupling: Transformer Forecasting of 10-Day Groundwater Levels in the Zhuoshui River Basin 

Zhen Chen, Guang-Yi Chen, Meng-Sin Shih, and Li-Chiu Chang

Under a changing climate, shifts in the spatiotemporal patterns of rainfall can markedly influence catchment-scale hydrological processes and alter interactions between surface water and groundwater systems. Groundwater level is a key indicator of basin hydrological status, jointly controlled by rainfall infiltration, river recharge, pumping, and aquifer properties. Yet, at longer horizons, the nonlinear coupled relationships among rainfall, river discharge, and groundwater levels remain challenging to model and forecast, especially at the regional (multi-site) scale. The Zhuoshui River Basin, a critical water-supply and agricultural region in Taiwan, provides a representative setting to investigate these surface water–groundwater interactions.
Here we develop a long-horizon groundwater-level forecasting model at the 10-day (dekadal) scale based on the Transformer architecture for approximately 22 monitoring wells across the basin. The model is trained and optimised using historical hydrometeorological time series, with inputs including rainfall, river discharge, groundwater levels, and other key hydrological drivers. By leveraging the Transformer's attention mechanism, the proposed approach captures long-range dependencies in multivariate sequences and enables attribution analyses of dominant drivers influencing groundwater responses across lead times.
The model achieves strong predictive skill over the multi-site system (test RMSE = 0.23 m; R² = 0.95), demonstrating its capability to reproduce basin-wide groundwater dynamics at the dekadal scale. Attention weight analyses reveal how rainfall and river-flow signals propagate into groundwater variability across different time lags and spatial locations, deepening understanding of surface water–groundwater coupling mechanisms in the basin.
The developed forecasting framework provides actionable information for integrated water resources management under changing climatic and anthropogenic pressures, including early warnings for groundwater depletion risks, optimized conjunctive use strategies, and informed agricultural irrigation planning. By explicitly modeling multivariate hydrological interactions through attention mechanisms, this approach advances both scientific understanding and operational capabilities for regional groundwater management. The methodology is transferable to other groundwater-dependent regions facing similar forecasting and management challenges.

Keywords: climate change; surface water–groundwater interactions; groundwater-level forecasting; Transformer

How to cite: Chen, Z., Chen, G.-Y., Shih, M.-S., and Chang, L.-C.: Attention-Based Insights into Surface–Groundwater Coupling: Transformer Forecasting of 10-Day Groundwater Levels in the Zhuoshui River Basin, EGU General Assembly 2026, Vienna, Austria, 3–8 May 2026, EGU26-19031, https://doi.org/10.5194/egusphere-egu26-19031, 2026.

EGU26-19137 | Posters on site | HS8.2.2

Inversion-Free Prediction of Contaminant Plume Fronts in Fractured Media from Hydraulic Tests: A Georesponse-Driven, Dual-Head Multitask Mixture Density Network 

Kehan Miao, Yong Huang, Huiyang Qiu, Chao Zhuang, Le Zhang, Liming Guo, Xiaolan Hou, Ze Yang, and Thomas Hermans

Accurate prediction of contaminant transport in fractured geological systems remains a formidable challenge due to the complex spatial distribution and connectivity of fracture networks, which often induce abrupt plume front shifts and preferential pathways. Conventional predictive workflows typically rely on a two-step inversion-simulation paradigm. However, these approaches often face persistent challenges in fractured media, including computational intensity, structural underrepresentation, and inherent non-uniqueness where disparate geological configurations yield similar hydraulic responses (Ringel et al., 2024).

In this study, we propose an inversion-free georesponse mapping framework that bypasses explicit structural reconstruction by learning a direct statistical mapping from hydraulic test (HT) fingerprints to transport outcomes (Hermans et al., 2016). The framework is implemented via a dual-head multitask mixture density network (MDN). This architecture jointly predicts the contaminant plume front, represented by a signed distance field (SDF), and the latent structural features of the fracture network, encoded by a convolutional variational autoencoder (CVAE). By integrating these tasks, the shared encoder is forced to extract a geologically consistent representation of the subsurface from sparse pumping test data.

We evaluated the framework’s performance using two stochastic fracture networks. Results demonstrate that the proposed multitask MDN yields statistically reliable probabilistic forecasts and successfully identifies secondary plume branches controlled by individual fractures compared to hydraulic tomography inversion (Figure 1). This study highlights the potential of georesponse-driven deep learning as a robust and computationally efficient alternative for risk assessment and remediation management in highly heterogeneous fractured aquifers.

Figure 1. Performance of the multitask MDN for contaminant plume front prediction in two test cases. (A) Reference discrete fracture network (DFN) geometries for Test 1 and Test 2. (B) Ensembles of predicted contaminant plume fronts. The blue lines represent the prior training ensemble (5000 realizations), while the red lines represent the posterior prediction ensemble (200 realizations) generated by the dual-head multitask MDN. Yellow dots indicate the true plume front for each test case. Green markers represent the plume fronts obtained via forward solute transport simulation using the hydraulic conductivity fields inverted through hydraulic tomography. (C) Contaminant spatial arrival probability maps derived from the MDN posterior distribution.


References:

Hermans, T., Oware, E., & Caers, J. (2016). Direct prediction of spatially and temporally varying physical properties from time-lapse electrical resistance data. Water Resources Research, 52, 7262-7283. https://doi.org/10.1002/2016WR019126
Ringel, L. M., Illman, W. A., & Bayer, P. (2024). Recent developments, challenges, and future research directions in tomographic characterization of fractured aquifers. Journal of Hydrology, 631, 130709. https://doi.org/10.1016/j.jhydrol.2024.130709

How to cite: Miao, K., Huang, Y., Qiu, H., Zhuang, C., Zhang, L., Guo, L., Hou, X., Yang, Z., and Hermans, T.: Inversion-Free Prediction of Contaminant Plume Fronts in Fractured Media from Hydraulic Tests: A Georesponse-Driven, Dual-Head Multitask Mixture Density Network, EGU General Assembly 2026, Vienna, Austria, 3–8 May 2026, EGU26-19137, https://doi.org/10.5194/egusphere-egu26-19137, 2026.

Understanding how groundwater levels respond to hydroclimatic forcings and human activities is essential for sustainable groundwater management yet remains challenging in many regions due to incomplete pumping records, heterogeneous datasets, and non-stationary system behavior. In this study, we explore a hybrid, data-driven framework to disentangle climate-driven and anthropogenic influences on long-term groundwater head time series using monitored piezometric networks. We first apply transfer function–noise (TFN) modelling, implemented through the Pastas framework, to simulate groundwater head dynamics as a response to observed hydroclimatic forcings, including precipitation, evapotranspiration, and river stage. The resulting model residuals exhibit structured, behaviours that cannot be attributed to random noise alone, suggesting the presence of missing processes or stresses not explicitly represented in the model. The results show that the Pastas model is able to optimize the parameters of response functions of the recharge while separating out other drivers of the groundwater head. We then analyse residual patterntemporal shifts, and spatial coherence across multiple wells to assess the residual patterns and classify them between unresolved natural processes and anthropogenic stresses. To this end, wdeploy unsupervised anomaly detection algorithms (Isolation Forest) on these residuals to automatically classify the temporal schedule of pumping events without prior labelling. This work demonstrates how interpretable time-series models and data-driven learning can be combined to reduce uncertainty, improve process understanding, and extract management-relevant information from groundwater monitoring data under data-scarce conditions. 

How to cite: Mishra, S., Baulon, L., and Thomas, A.: Deciphering the dependencies of piezometric signals on hydroclimatic and anthropogenic forcings using time-series models, EGU General Assembly 2026, Vienna, Austria, 3–8 May 2026, EGU26-19215, https://doi.org/10.5194/egusphere-egu26-19215, 2026.

Groundwater assessment in India makes extensive use of publicly available datasets, including long-term monitoring well records, hydrogeological maps, and derived spatial products. However, accessing and interpreting these datasets typically involves multiple software tools, manual data extraction, and specialist expertise in GIS and hydrogeology, limiting their usability for broader user groups.

GWFlowAI is a location-based Artificial Intelligence (AI) framework designed to enable exploratory groundwater analysis through a single user input step: the entry of an address or geographic location. The system performs automated geocoding and spatial buffering to identify relevant administrative units and hydrogeological features. Public groundwater datasets are retrieved and harmonized using standardized coordinate reference systems and metadata-aware preprocessing pipelines.

The framework follows an agent-based architecture, in which specialized Artificial Intelligence agents are responsible for tasks such as data retrieval, geospatial processing, time-series analysis, and result interpretation. Time-series analysis methods are used for groundwater level trend detection, including statistical smoothing and change-point identification, while spatial analysis methods such as interpolation and zonal statistics are applied to characterize regional groundwater conditions. AI agents assist with workflow orchestration, analytical query interpretation, and generation of human-readable summaries, while core numerical and geospatial computations remain explicit and reproducible.

GWFlowAI is intended to support multiple user groups, including researchers, consultants, planners, students, and policy practitioners, enabling consistent access to the same public datasets at varying analytical depths. To the authors’ knowledge, this represents an early effort in India to provide a single-entry, integrated Artificial Intelligence (AI) workflow for groundwater data exploration based entirely on public datasets. The paper presents the system architecture, analytical methods, and representative outputs, and discusses limitations related to data resolution, uncertainty, and spatial coverage.

How to cite: Gaddam, S. J. and Chittimireddy, S.: GWFlowAI: A One-Step, Location-Based Artificial Intelligence (AI) Framework for Exploring Public Groundwater Datasets in India, EGU General Assembly 2026, Vienna, Austria, 3–8 May 2026, EGU26-20010, https://doi.org/10.5194/egusphere-egu26-20010, 2026.

EGU26-20548 | Posters on site | HS8.2.2

A Deep Learning surrogate for groundwater storage change prediction at regional scale (Duero River Basin, Spain) 

Hector Aguilera, Víctor Gómez-Escalonilla, Eva García Tricás, Olga García Menéndez, África de la Hera-Portillo, Manuel Rodríguez del Rosario, and Pedro Martínez-Santos

Accurate, high-resolution estimation of groundwater storage changes (GWSC) is critical for sustainable water management, particularly in semi-arid basins facing increasing climatic and anthropogenic pressures. Traditional process-based hydrogeological models often fall short due to computational constraints, coarse resolution, and poor performance in data-scarce regions. This study presents an innovative data-driven surrogate modelling framework that overcomes these limitations by fusing large-scale model outputs with local observations to generate reliable, high-resolution GWSC estimates.

We demonstrate the framework in the Duero Basin as a pilot site, an 80,000 km2 basin in central Spain. The methodology involves a multi-step hybrid data conditioning process. First, total water storage (TWS) outputs from the Terrestrial Systems Modelling Platform (TSMP, 11 km) are corrected and downscaled using in-situ groundwater level (GWL) observations via spatiotemporal kriging. This generates a corrected GWSC target variable with an explicit pixel-level uncertainty flag (low, moderate, high). This conditioned dataset then trains a state-of-the-art Spatiotemporal Transformer (STT) deep learning model, designed to capture complex spatiotemporal dependencies. The STT uses 48 months of historical data to forecast GWSC 12 months ahead, incorporating static (e.g., geology, land use, socio-economic) and dynamic (precipitation, potential evapotranspiration, temperature) features. An uncertainty-aware training scheme uses the uncertainty flags both as an input feature and to weight the loss function. A key architectural innovation is the implementation of a "late fusion" concatenation strategy, which enhances spatial awareness. A learned coordinate embedding, generated by a small Multi-Layer Perceptron (MLP) from geographic coordinates, is concatenated to the transformer's final layer outputs before prediction. This allows the model to learn and correct for persistent, location-specific biases (e.g., systematic differences between southeastern and northwestern aquifer dynamics) without disrupting the core temporal attention mechanisms, thereby stabilizing training and improving regional accuracy. The STT’s performance is benchmarked against an XGBoost model and combined into an optimal linear ensemble.

Results show the ensemble model achieves robust performance, with a train, validation and test R2 of 0.82, 0.46 and 0.44, respectively, outperforming individual models. Spatial analysis reveals that predictive skill is highest in areas where data conditioning yielded low uncertainty. Feature importance analysis ranks precipitation, evapotranspiration, and water demands as the most influential predictors. The framework successfully generates spatially explicit maps of GWSC and associated uncertainty across the basin.

This study concludes that integrating process-model outputs with local observations through geostatistical conditioning provides a viable pathway for creating reliable training data for deep learning surrogates. The proposed STT-based framework offers a scalable, computationally efficient alternative to traditional models for operational groundwater monitoring and forecasting. Its modular design ensures transferability to other basins, marking a significant step towards improving groundwater resource management in data-scarce and hydrogeologically complex regions worldwide.

How to cite: Aguilera, H., Gómez-Escalonilla, V., García Tricás, E., García Menéndez, O., de la Hera-Portillo, Á., Rodríguez del Rosario, M., and Martínez-Santos, P.: A Deep Learning surrogate for groundwater storage change prediction at regional scale (Duero River Basin, Spain), EGU General Assembly 2026, Vienna, Austria, 3–8 May 2026, EGU26-20548, https://doi.org/10.5194/egusphere-egu26-20548, 2026.

EGU26-20586 | ECS | Orals | HS8.2.2

Reliable and interpretable machine learning for groundwater nitrate pollution mapping: the Duero River Basin (Spain) 

Manuel Rodríguez del Rosario, Víctor Gómez-Escalonilla, África de la Hera-Portillo, and Pedro Martínez-Santos

Advances in machine learning offer new opportunities to enhance the assessment and regional-scale mapping of groundwater nitrate contamination, a long-standing and widespread environmental problem. This study illustrates this potential in the Duero River Basin (Spain), where nitrate concentrations in aquifers have increased steadily over recent decades due to intensive agricultural and livestock farming. Machine learning techniques are applied to predict groundwater nitrate pollution using monitoring data combined with spatially derived environmental and anthropogenic predictors, framing the problem as a binary classification task based on a threshold concentration of 37.5 mg/L. Several tree-based ensemble algorithms were evaluated, with Random Forest selected due to its superior predictive performance and robustness. Model reliability was ensured through a repeated nested cross-validation strategy, resulting in an ensemble of 50 models and the generation of out-of-fold probability estimates. Model performance was evaluated using metrics tailored to imbalanced datasets and focused on the minority class, including the F1-score and the Area Under the Precision–Recall Curve. A temporal analysis based on different hydrological years was conducted to assess the persistence and spatial variability of nitrate pollution risk over time. Spatial validity and model reliability were further evaluated by comparing predicted risk patterns with officially designated nitrate vulnerable zones (NVZs). This comparison revealed a high degree of agreement, while also identifying areas outside current NVZs boundaries exhibiting similar contamination characteristics, suggesting the presence of potentially unrecognised nitrate pollution risks. Model interpretability was explored using SHAP values, which highlighted precipitation, diffuse agricultural pressures, distance to surface water bodies, NDVI, and soil properties as the most influential predictors of nitrate contamination. Overall, the results demonstrate the value of interpretable machine learning approaches for improving the assessment, understanding, and management of groundwater nitrate pollution at the basin scale.

How to cite: Rodríguez del Rosario, M., Gómez-Escalonilla, V., de la Hera-Portillo, Á., and Martínez-Santos, P.: Reliable and interpretable machine learning for groundwater nitrate pollution mapping: the Duero River Basin (Spain), EGU General Assembly 2026, Vienna, Austria, 3–8 May 2026, EGU26-20586, https://doi.org/10.5194/egusphere-egu26-20586, 2026.

Over the past two decades, hydraulic tomography (HT) has been proven as a robust method for subsurface heterogeneity characterization with high resolution, which is critical for predicting solute transport.

In this study, HT was used to characterize the hydraulic conductivity (K) distribution within a laboratory sandbox aquifer, following established workflows from previous studies. The influence of estimated K fields on model calibration and validation performance was evaluated. Additionally, tracer injection data were considered as a key factor in the analytical framework. The simulated concentrations were compared to the observed data using inverse results derived from multiple modeling approaches, coupled with the classical advection–dispersion equation.

The analysis yielded the following results: 1) geostatistical inversion provided better heterogeneity characterization compared to geology based zonation model, particularly in terms of hydraulic head data; 2) geostatistical inversion exhibited enhanced performance over the geology-based zonation model in predicting solute transport as evidenced by tracer concentration data, when injection data was incorporated into the inverse modeling framework; 3) breakthrough curve analysis revealed that solute transport predictions derived from HT still exhibited notable limitations, highlighting the need for further improvements; 4) overestimation issue identified in the HT results is linked to factors beyond observational error.

Overall, this study highlights that the advantages of geostatistical inversion are obvious in heterogeneity characterization, and the involving of the tracer injection data is critical for improving solute transport prediction.

How to cite: qiu, H., Hu, R., and Huang, Y.: Comparative predictions of solute transport with hydraulic tomography in a laboratory sandbox aquifer: the importance of the injection data, EGU General Assembly 2026, Vienna, Austria, 3–8 May 2026, EGU26-150, https://doi.org/10.5194/egusphere-egu26-150, 2026.

EGU26-2299 | ECS | Posters on site | HS8.2.3

Evaluation of flood-driven bank infiltration effects on hyporheic zone groundwater age distributions 

Ye Ji Kim, Dugin Kaown, Suh-Ho Lee, Ha-Yeong Seok, Seong-Sun Lee, and Kang-Kun Lee

The hyporheic zone is the shallow subsurface beneath and adjacent to streams characterized by bidirectional groundwater-surface water exchange. This exchange can intensify during high-flow events, driving stream water into streambanks where it may persist as bank storage for weeks to months. However, groundwater ages in shallow near-stream wells (often used as proxies for hyporheic exchange) are frequently interpreted with exponential mixing assumptions that may not be valid under prolonged bank storage. As a result, bank-infiltrated water can be misidentified as young groundwater discharge, leading to biased estimates of stream-aquifer exchange and erroneous source attribution. In this study, we quantify how flood-driven bank infiltration perturbs near-stream groundwater age distributions in Pyeongjeong Stream (Chungcheongnam-do, South Korea) by integrating hydraulic head, electric conductivity (EC), and tritium data. Event-scale hydraulic gradients show that flood onset rapidly enhances stream-to-aquifer flow as stream stage rises faster than groundwater head. Consistent with this mechanism, EC-stage hysteresis indicates contrasting recovery behavior: stream EC decreases during precipitation events and quickly returns to pre-event levels, whereas groundwater EC remains suppressed much longer, implying persistent bank-stored water and delayed flushing. Tritium concentrations further support sustained contributions of modern recharge and/or infiltrated stream water. We then evaluate transit time distributions (TTDs) using conceptual mixing models that explicitly represent episodic bank infiltration and extended storage. The resulting TTDs deviate from a single exponential form, exhibiting a composite structure that combines a short-transit event component with a broader, older background associated with bank storage. These results highlight the need to account for flood-driven bank infiltration to interpret near-stream groundwater ages and to constrain the water sources and timescales governing hyporheic zone exchange and associated solute transport.

Keywords: Hyporheic exchange, Bank infiltration, Flood event, Transit time distribution

Acknowledgement: This work was supported by the National Research Foundation of Korea (NRF) grant funded by the Korean government (RS-2025-00552981).

How to cite: Kim, Y. J., Kaown, D., Lee, S.-H., Seok, H.-Y., Lee, S.-S., and Lee, K.-K.: Evaluation of flood-driven bank infiltration effects on hyporheic zone groundwater age distributions, EGU General Assembly 2026, Vienna, Austria, 3–8 May 2026, EGU26-2299, https://doi.org/10.5194/egusphere-egu26-2299, 2026.

EGU26-3431 | Orals | HS8.2.3

Groundwater Age and Isotope Tracers to Understand Sources, Flowpaths, and Sinks of Nitrate 

Uwe Morgenstern, Laura Buckthought, Roland Stenger, and Peter Gardner

High-intensity land use – mainly market gardening on the weathered basalts that form rich horticultural soils – has caused high nitrate concentrations in groundwater and streams discharging from the Pukekohe and Bombay volcanoes, New Zealand, exceeding the national bottom line for nitrate toxicity in rivers and maximum acceptable value in drinking water.

The main nitrate load, from market-gardening activity, infiltrates into large groundwater stores in the basalt formation, discharging mainly through three large springs with a Mean Transit Time (MTT) of 17 and 36 years.

Without denitrification in this groundwater system (no electron donors to facilitate microbial denitrification reactions), the entire nitrate load into the basalt eventually returns to the surface with a lag time of 17 and 36 years at the springs, with high nitrate-N concentrations up to 25 mg/L, causing high nitrate-N concentrations in the receiving streams. Because of the long MTTs of nitrate loads through the basalt, results of potential source-mitigation actions will be delayed.

Tritium data showed that all sampled streams contained younger water in winter compared to summer, indicating activation of shallower flow paths into the streams during the wet season. However, even at winter baseflow, the stream waters were still relatively old, with MTTs 6-12.5 years.

While the passage of the high nitrate load through the basalt formation and the seasonal flushing of nitrate from the pastoral grazing land in the Pleistocene is reasonably well understood, little is known about nitrate sinks within this catchment. Nitrate loads significantly decreased along the course of most of the sampled streams. Some streams, mainly those
in the Pleistocene formation, had near-zero nitrate concentrations despite pastural farming being the predominant land use in their catchments. This implies significant nitrate sinks in these catchments. Better understanding of these nitrate sinks may enable enhancement of natural attenuation of high nitrate loads in these waterways.

Anoxic groundwater discharges, presence of excess nitrogen, and dilution of stream nitrate loads by anoxic groundwater discharges indicate that denitrification in groundwater systems occurs in some formations.

The largest nitrate sinks within the catchment were found within the surface waterways. Nitrate stable isotopes indicate that the main process of nitrate removal from these waterways is through natural denitrification.

In smaller streams and a pond, 80–100% of nitrate from land-use activities was found to have been removed. In two of the largest streams, nitrate-load reductions of c. 30% were observed between sampled sites.

In the Pleistocene formation, with land use mostly pastural farming, nitrate is flushed
out seasonally. This area discharges water and nitrate loads only via shallow flow paths, which are not active in summer. In one stream, nitrate had been completely removed from the water during the low summer flow. But even in winter, when discharges are active,
around 80% of the nitrate is being removed from the water. This nitrate removal may partially occur within the stream bed but could also have significant 

How to cite: Morgenstern, U., Buckthought, L., Stenger, R., and Gardner, P.: Groundwater Age and Isotope Tracers to Understand Sources, Flowpaths, and Sinks of Nitrate, EGU General Assembly 2026, Vienna, Austria, 3–8 May 2026, EGU26-3431, https://doi.org/10.5194/egusphere-egu26-3431, 2026.

EGU26-5858 | Orals | HS8.2.3

Development of multi-metric eDNA-based indicators of water quality based on planktonic microorganisms 

Savvas Genitsaris, Maria Moustaka-Gouni, Efstathios Alonaris, Fragiskos Kolisis, Polina Polykarpou, Gerald Dörflinger, Elias Dimitriou, Konstantinos Kormas, Michalis Omirou, and Konstantinos Soulis

Assessing the ecological quality of inland waters is key to managing resources and guiding sustainable agriculture practices. In EU member states, the monitoring of surface waters is based on the Water Framework Directive (WFD; 2000/60/EC), which links the ecological status with anthropogenic pressures. For this, the framework introduced the biological quality elements (BQEs) that are used to establish ecological status. Among BQEs, a key element for assessing nutrient enrichment reflecting eutrophication is phytoplankton, for which several multi-metric indicators have been proposed and used for different types of lake and river water bodies. Among the metrics included in phytoplankton indicators, biomass, cyanobacterial contribution to total phytoplankton and composition are routinely integrated. However, classical phytoplankton measurements are based on the microscopic identification of several morphologically dubious taxa, cryptic and rare species, especially in the pico- and nanoplankton. Thus, eDNA high-throughput sequencing is emerging as a cost-effective, massively parallel approach to resolve morphology-based bottlenecks on phytoplankton water quality indicators. Aiming to propose and develop a multi-metric eDNA-based water quality indicator, we applied a staggered strategy using SSU rRNA gene metabarcoding of planktonic communities across lakes of different typologies in Greece and Cyprus. First, the mirroring of metabarcoding normalized abundance data, presented as relative number of reads per taxon, with conventional estimates of phytoplankton abundance and biomass was attempted. We found that correcting for unicellular eukaryotic rRNA gene copy number based on taxon-specific biovolume data provided reliable coupling of biomass-based metrics and read numbers. Then, assessment metrics were selected to reflect eutrophication conditions in the eDNA-based indicator through ecological modelling tools, including multiple linear regression models and random forest predictors. Among the tested metrics, the most fitted were the relative number of cyanobacterial reads, the dominance of bloom forming taxa, and the ratio of harmful:non-harmful groups or taxa. Using eDNA tools will further lead to the development of emerging indicators of additional quality elements, such as bacterioplankton, zooplankton, and functional diversity. Bacterial groups, albeit not included in the WFD legislation, can play key roles in nitrogen, phosphorus, and organic carbon cycling, with metabolic pathways that process many of the pollutants associated with eutrophication. Zooplankton species are the link between primary producers and higher trophic levels, containing taxa that are directly linked to eutrophication. In addition, by integrating shotgun metagenomics to resolve the underlying gene content, the functional genetic capacities of planktonic communities can be associated with environmental stressors reflecting the overall water quality. By associating phytoplankton metacommunity dynamics (composition, functional traits, and indicator taxa metrics), to hydro-ecological connectivity gradients, eDNA can provide a scalable tool for assessing ecosystem health, resilience, and the impacts of fragmentation or homogenization.

How to cite: Genitsaris, S., Moustaka-Gouni, M., Alonaris, E., Kolisis, F., Polykarpou, P., Dörflinger, G., Dimitriou, E., Kormas, K., Omirou, M., and Soulis, K.: Development of multi-metric eDNA-based indicators of water quality based on planktonic microorganisms, EGU General Assembly 2026, Vienna, Austria, 3–8 May 2026, EGU26-5858, https://doi.org/10.5194/egusphere-egu26-5858, 2026.

Accurate prediction of groundwater flow dynamics is often limited by the assumption of spatially uniform aquifer properties, which can result in biased hydraulic head estimates. Although the depth dependence of aquifer parameters is well recognized, most available analytical solutions remain confined to homogeneous aquifer systems. This study presents a two-dimensional transient analytical model for a regional single-layer aquifer subjected to a fluctuating water table, explicitly incorporating depth-dependent hydraulic conductivity and specific storage, along with pumping effects. The analytical solution is obtained using the Generalized Integral Transform Technique (GITT), which implicitly enforces continuity of hydraulic head and flux across depth variations without the need for iterative eigenvalue estimation, thereby providing a robust framework for representing stratified aquifer behavior. Model verification is conducted using a benchmark single-layer solution, and independent validation is performed through COMSOL Multiphysics simulations, demonstrating excellent agreement. The influence and reliability of model parameters are further evaluated using global sensitivity analysis. A key novel contribution of this work is the identification of chaotic flow behavior within a single-layer Tóthian basin, examined using the Finite-Time Lyapunov Exponent (FTLE). The results reveal that chaotic dynamics are most pronounced near the upper boundary, where FTLE values are significantly higher than in deeper regions, with further intensification observed under periodic injection in a single-well system. Overall, the proposed analytical framework addresses a critical gap in transient single-layer groundwater flow modeling, enhances the theoretical understanding of stratified aquifer systems, and provides a reliable benchmark for numerical simulations and field-scale groundwater studies.

How to cite: Maurya, S., Sarmah, R., and Sonkar, I.: An Analytical Model of Chaotic Advection in Regional Groundwater Flow Driven by Periodic Water Table Fluctuations and Depth-Dependent Aquifer Properties, EGU General Assembly 2026, Vienna, Austria, 3–8 May 2026, EGU26-7228, https://doi.org/10.5194/egusphere-egu26-7228, 2026.

EGU26-12987 | Posters on site | HS8.2.3

Integrating MODPATH modelling and tritium data to assess groundwater residence time in the Campo de Montiel Aquifer (Spain). 

Juan-de-Dios Gómez-Gómez, Leticia Baena-Ruiz, David Pulido-Velázquez, Héctor Aguilera-Alonso, Miguel Mejías-Moreno, and Juan Grima-Olmedo

This research outlines work conducted by the Geological Survey of Spain (IGME-CSIC) within the SIGLO-PRO project (PID2021-128021OB-I00/AEI/ https://doi.org/10.13039/501100011033/FEDER, UE) to characterise groundwater residence times in the Campo de Montiel aquifer. The study combines numerical particle-tracking simulations using MODPATH with existing empirical groundwater dating based on tritium measurements undertaken by CEDEX (Centro de Estudios y Experimentación de Obras Públicas, Spanish Ministry of Transport and Sustainable Mobility) across multiple sampling campaigns between 1971 and 2007.
A total of 61 observation points were incorporated, including wells and springs, each with one to four measurements collected over four multi-decadal sampling periods. Backward particle-tracking simulations were initiated from these sampling locations, using columns of particles in wells and radial distributions around springs to approximate natural recharge capture zones and flow pathways across the carbonated aquifer system.
Model outputs indicate that the mean groundwater residence time across the network ranges between approximately 13 and 36 years, in broad agreement with the tritium-derived ages. Although both approaches contain inherent uncertainties, their convergence supports the robustness of the residence-time estimates and suggests the aquifer behaves as a moderately slow-turnover groundwater reservoir under current recharge conditions.
Travel time across the unsaturated zone has been also considered. Although limited field evidence is available for this parameter in the Campo de Montiel system, estimates informed by previous carbonated aquifer studies suggest lag times of several months, and alternative methods—such as those proposed by Fenton et al.—are being evaluated to refine these values further. These preliminary results will be incorporated into future modelling iterations to improve understanding of recharge-to-discharge transit times, particularly for springs where shallow pathways may dominate.
Overall, the integration of particle tracking and isotopic dating provides a coherent first-order estimate of groundwater age structure for the Campo de Montiel aquifer. These findings form a basis for assessing vulnerability, understanding contaminant transport potential, and evaluating future scenarios of groundwater abstraction and recharge variability under climate and land-use change.

How to cite: Gómez-Gómez, J.-D., Baena-Ruiz, L., Pulido-Velázquez, D., Aguilera-Alonso, H., Mejías-Moreno, M., and Grima-Olmedo, J.: Integrating MODPATH modelling and tritium data to assess groundwater residence time in the Campo de Montiel Aquifer (Spain)., EGU General Assembly 2026, Vienna, Austria, 3–8 May 2026, EGU26-12987, https://doi.org/10.5194/egusphere-egu26-12987, 2026.

EGU26-13224 | ECS | Posters on site | HS8.2.3

Physically Constrained Storage Age Selection (SAS) Functions: Benchmarking SAS-based Simulations of Catchment Nitrate Export 

Qiaoyu Wang, Jie Yang, Tam Nguyen, Andreas Musolff, and Jan Fleckenstein

StorAge Selection (SAS) functions describe how catchments selectively remove water of different ages in storage via discharge, providing insights into subsurface flow paths and solute export behavior. SAS-based models have been used to study conservative and reactive solute exports and are typically calibrated against in-stream solute concentrations. However, as the simulated transit times in these models are not explicitly linked to physical processes, questions remain regarding the consistency of SAS-derived transit times with transit times derived from physically based model. To evaluate the validity of transit times obtained from SAS-based models such as the conceptual mHM-SAS model (Nguyen et al. 2021), we employ the 3D physically-based model HydroGeoSphere coupled with particle tracking. The physically based model coupled with particle tracking can explicitly simulate catchment water storage dynamics, spatial heterogeneity in subsurface flow and solute transport pathways, water ages, and transit time distributions (TTDs). We hypothesize that both modeling approaches are expected to reproduce comparable nitrate concentration dynamics and concentration–discharge relationships at the catchment outlet, but may differ in water age compositions due to conceptual differences between the models. Through this comparison, we can evaluate the capabilities and limitations of mHM-SAS model to simulate catchment-scale nitrate export and clarify the conditions under which the mHM-SAS model may be sufficient for rapid prediction of concentrations in heterogeneous agricultural catchments. Overall, this study demonstrates that particle-tracking-based SAS functions derived from a physically based model can provide a robust benchmark for evaluating the physical consistency of calibrated SAS-based models.

Nguyen, T. V., R. Kumar, S. R. Lutz, A. Musolff, J. Yang, and J. H. Fleckenstein (2021). Modeling Nitrate Export From a Mesoscale Catchment Using StorAge Selection Functions. Water Resources Research, 57(2), https://doi.org/10.1029/2020WR028490 

How to cite: Wang, Q., Yang, J., Nguyen, T., Musolff, A., and Fleckenstein, J.: Physically Constrained Storage Age Selection (SAS) Functions: Benchmarking SAS-based Simulations of Catchment Nitrate Export, EGU General Assembly 2026, Vienna, Austria, 3–8 May 2026, EGU26-13224, https://doi.org/10.5194/egusphere-egu26-13224, 2026.

Predicting elemental cycles and maintaining water quality under increasing anthropogenic influence requires knowledge of the spatial drivers of river microbiomes. However, understanding of the core microbial processes governing river biogeochemistry is hindered by a lack of genome-resolved functional insights and sampling across multiple rivers. Here we used a community science effort to accelerate the sampling, sequencing and genome-resolved analyses of river microbiomes to create the Genome Resolved Open Watersheds database (GROWdb). GROWdb profiles the identity, distribution, function and expression of microbial genomes across river surface waters covering 90% of United States watersheds. Specifically, GROWdb encompasses microbial lineages from 27 phyla, including novel members from 10 families and 128 genera, and defines the core river microbiome at the genome level. GROWdb analyses coupled to extensive geospatial information reveals local and regional drivers of microbial community structuring, while also presenting foundational hypotheses about ecosystem function. Building on the previously conceived River Continuum Concept, we layer on microbial functional trait expression, which suggests that the structure and function of river microbiomes is predictable. We make GROWdb available through various collaborative cyberinfrastructures, so that it can be widely accessed across disciplines for watershed predictive modelling and microbiome-based management practices.

How to cite: Borton, M. and the GROWdb USA: Drops to Data: Harnessing Participatory Science to Decode Aquatic Microbiomes Across the United States, EGU General Assembly 2026, Vienna, Austria, 3–8 May 2026, EGU26-14131, https://doi.org/10.5194/egusphere-egu26-14131, 2026.

EGU26-14239 | Orals | HS8.2.3

A multi-tracer approach reveals groundwater inflows to a soda lake and its streams suffering from water shortage in Hungary  

Anita Erőss, Petra Baják, Fanni Luca Bujbáczi, Katalin Hegedűs-Csondor, Ákos Horváth, György Czuppon, Eleonora Bená, and Henrietta Dulai

Lake Velence is a shallow soda lake, the third largest natural lake in Hungary. It is a valuable protected aquatic ecosystem but at the same time it is exposed to various anthropogenic pressures such as commercial and recreation activities, including water sports and fishing. Its shallow depth makes it susceptible to droughts and evaporation. In recent years, the water level of the lake has decreased dramatically, resulting in changes in water management, declining water quality and conflicts over its multiple uses. Climate change effects in Hungary will likely stress the lake’s water resources and ecosystems even further in the future.

Despite groundwater mapping in the area proving that the lake is at the discharge point of local groundwater flow systems, only the surface water components and precipitation are considered in the lake’s water budget. Numerical models showed that groundwater contributes an annual average of 5% (up to 12%) of Lake Velence's inflows. Considering that the watercourses flowing into the lake are groundwater fed as well, the share of groundwater in the lake’s inflow can be as high as 56%. Revisiting water management practices in the area is thus necessary for the local ecosystem and tourism industry. We assessed surface water-groundwater interactions in the catchment area using natural tracers to collect further evidence on the importance of this connection. Water samples were collected from different water sources: from the lake, inflow streams, an artificial reservoir, and groundwater wells. The samples were analysed for stable isotopes of oxygen and hydrogen, and natural radioactive isotopes of uranium, radium, and radon. Additionally, these geochemical tracers were mapped across the lake, providing a spatially specific signal of groundwater inputs throughout the entire water body. Radon activity concentration was measured by liquid scintillation (LSC) technique and by a radon-in-air monitor with RAD-AQUA attachment (RAD7, Durridge). Uranium and radium were measured using selectively absorbing NucFilm discs and alpha spectroscopy.

The results provided not just physical proof of groundwater inflow into Lake Velence and its inflowing streams but a detailed spatial distribution of these inputs. For example, radon concentrations were significantly higher than expected from just in-situ production alone and was detected even by liquid scintillations technique (1-6 Bq/L) both in the lake and in the streams. Measurements with the RAD7 showed values between 0.017 and 4.72 Bq/L. Uranium values were between 96 and 498 mBq/L. All isotopes combined provide unequivocal evidence that groundwater contribution to lake water budgets is important and that groundwater management has to be reconsidered in order to improve lake water levels and water quality.

The research was supported by the János Bolyai Research Scholarship of the Hungarian Academy of Sciences. This work has been implemented by the National Multidisciplinary Laboratory for Climate Change (RRF-2.3.1-21-2022-00014) project within the framework of Hungary's National Recovery and Resilience Plan supported by the Recovery and Resilience Facility of the European Union.

How to cite: Erőss, A., Baják, P., Bujbáczi, F. L., Hegedűs-Csondor, K., Horváth, Á., Czuppon, G., Bená, E., and Dulai, H.: A multi-tracer approach reveals groundwater inflows to a soda lake and its streams suffering from water shortage in Hungary , EGU General Assembly 2026, Vienna, Austria, 3–8 May 2026, EGU26-14239, https://doi.org/10.5194/egusphere-egu26-14239, 2026.

EGU26-14373 | ECS | Posters on site | HS8.2.3

Tracing groundwater recharge and contributions to perennial coastal wetlands in a semi-arid Chilean catchment using an integrated geochemical, isotopic, and groundwater dating approach 

Cassandra Euzen, Sarah Leray, Sebastian Vicuña, Megan Williams, Milton Quinteros, and Camille Bouchez

In the context of climate change and the increasing frequency of droughts, sustainable water resource management has become a major challenge worldwide, particularly in Mediterranean and arid regions such as central Chile. In systems strongly constrained by both climatic and anthropogenic pressures, understanding (i) recharge processes and (ii) groundwater-surface water partitioning in catchments and their associated sensitive coastal wetlands is essential for effective catchment-scale management.
This study aims to characterize the origin of freshwater within the semi-arid coastal Huaquén catchment and the associated perennial wetland located at its outlet to the Pacific Ocean. Fully distributed numerical models, calibrated at the regional scale, indicate significant inter-catchment groundwater flow, suggesting the contribution from deep and potentially old groundwater to the shallow aquifer and, consequently, to the coastal wetland. This hypothesis is tested using a multi-tracer approach applied to groundwater and surface water samples collected at multiple locations across the catchment.
The investigation integrates water geochemistry, strontium isotopes to identify source variations, stable water isotopes (δ¹⁸O) to constrain recharge and hydrological processes, chlorofluorocarbons (CFCs) as groundwater age tracers, and noble gases to identify recharge areas. By combining these tools, this study assesses the respective contributions of surface water, shallow groundwater, and deeper groundwater to the hydrological functioning of the catchment and the coastal wetland.

How to cite: Euzen, C., Leray, S., Vicuña, S., Williams, M., Quinteros, M., and Bouchez, C.: Tracing groundwater recharge and contributions to perennial coastal wetlands in a semi-arid Chilean catchment using an integrated geochemical, isotopic, and groundwater dating approach, EGU General Assembly 2026, Vienna, Austria, 3–8 May 2026, EGU26-14373, https://doi.org/10.5194/egusphere-egu26-14373, 2026.

EGU26-14480 | Orals | HS8.2.3

 Microbial eDNA Predicts Hydrologic Recession Dynamics  

Stephen Good, Colton Avila, and Byron Crump

Both the quantity and quality of water in streams is influenced by the flowpaths of water as it moves through the subsurface. Hydrologic flowpaths are interconnected with streamflow recession dynamics as highly nonlinear recessions are indicative of the drainage front rapidly receding towards the hydrologic divide. However, quantifying these flow paths remains a challenge with geochemical or isotope-based tracer methods when underlying geologic or temporal structures have limited variation. As DNA sequencing has advanced rapidly, it has been observed that microbial communities are also affected by changes in hydrologic dynamics and thus might indicate flow paths. Currently, the predictive capacity of genomic information about hydrologic flowpaths is unknown. Here we show that Amplicon Sequence Variants (ASVs) and the microbial metagenome is predictive of various summertime baseflow recession dynamics in the Pacific Northwest of the United States. Evaluation of the Kyoto Encyclopedia of Genes and Genomes (KEGG) pathways associated with genes measured during recessions demonstrates that multiple plant specific genes such as zeatin biosynthesis show elevated presence during highly nonlinear recession periods (p =0.051). Overall, we find the phylogenetic annotated metagenome is able to accuracy predict bi-weekly mean log discharge (R2 = 0.79), sample date discharge (R2 = 0.22) and recession non-linearity (R2 = 0.66). By linking microbial metabolic pathway profiles to hydrologic behavior, we identify potential biological indicators of watershed recession dynamics and the pathways that water flows through in the subsurface. These findings offer a promising approach for integrating microbial ecology with hydrologic modeling, advancing our understanding of how water drains from catchments.

How to cite: Good, S., Avila, C., and Crump, B.:  Microbial eDNA Predicts Hydrologic Recession Dynamics , EGU General Assembly 2026, Vienna, Austria, 3–8 May 2026, EGU26-14480, https://doi.org/10.5194/egusphere-egu26-14480, 2026.

EGU26-15256 | Orals | HS8.2.3

 An integrated tracer approach to determine spring aquifer attribution in Australia’s Great Artesian Basin 

Harald Hofmann, Matthias Raiber, Andrew McDougall, Julie Pearce, Luke Wallace, Margaux Dupuy, Justin Wu, Sharon Marshall, Tim Ransley, Dioni Cendon, Elizabeth Bell, James Hansen, Michael Burt, and Audrey Quealy

The Great Artesian Basin (GAB) in Australia is one of the largest aquifer systems in the world which hosts valuable groundwater resources and supports groundwater dependent ecosystems, townships and a substantial agricultural industry. While groundwater recharge and flow through the GAB and its sub-basins have been studied for decades, the regional-scale discharge mechanisms, e.g. springs, have received a lot less attention. The springs of the Great Artesian Basin hold immense ecological and cultural significance. They have sustained Australian Indigenous communities for millennia and support complex, unique ecosystems that are critical to biodiversity and global heritage protection. Greater confidence on spring source aquifer attribution is a crucially missing part of protecting these unique spring systems as water demands from the contributing aquifers for mineral extraction, agriculture and townships is steadily increasing.

Here, we present an example of spring hydrogeochemistry and aquifer attribution conducted as part of a large collaborative initiative between major Australian federal and state government agencies and universities. The work involves a multi-tracer approach, including major ions, stable isotopes, Sr-isotopes, cosmogenic isotopes as well as dissolved gases concentrations and gas isotope compositions to better constrain the aquifers which contribute to spring discharge in the eastern part of the Great Artesian Basin. We have sampled multiple spring complexes, 29 springs across 6 complexes, across Queensland as well as groundwater bores in the regions around the springs to characterise spring source aquifers and provide baseline data for management decisions. The hydrogeochemistry is combined with conceptual geological models to understand the impact from water abstraction to spring discharge. Isotopes, in particular the Sr-isotopes show significant differences between aquifer units across the Great Artesian Basin.

The information on spring aquifer attribution is crucial to inform decision makers in the process of developing policies to protect these unique springs. The methodology for the spring aquifer attribution can be translated to other large sedimentary basins across the world.

How to cite: Hofmann, H., Raiber, M., McDougall, A., Pearce, J., Wallace, L., Dupuy, M., Wu, J., Marshall, S., Ransley, T., Cendon, D., Bell, E., Hansen, J., Burt, M., and Quealy, A.:  An integrated tracer approach to determine spring aquifer attribution in Australia’s Great Artesian Basin, EGU General Assembly 2026, Vienna, Austria, 3–8 May 2026, EGU26-15256, https://doi.org/10.5194/egusphere-egu26-15256, 2026.

EGU26-15995 | ECS | Orals | HS8.2.3

Glacial-Groundwater connectivity through DNA Metabarcoding and stable isotope tracers in Peruvian Central Andes 

Albert Johan Mamani Larico, Heidi de la Cruz Solano, Maria Julia Gonzales-Llontop, Marty Frisbee, Maria Custodio Villanueva, and Tatiana Erika Boza Espinoza

Characterizing the influence of glacial meltwater on groundwater recharge remains a significant challenge due to the complex geology, rugged topography of high-mountain environments and overlapping isotopic fingerprints of potential recharge sources in some settings. In the Peruvian Central Andes, the Mantaro aquifer serves as the primary water source for human consumption in Huancayo city. While surface water resources are increasingly threatened by the accelerated retreat of the Huaytapallana Cordillera glaciers, the specific impact of glacial retreat on groundwater storage remains unknown. This study investigates the hydrological connectivity between Huaytapallana glacier meltwater and the Mantaro aquifer by integrating microbial DNA metabarcoding and stable isotope analysis 2H and 18O in water. We collected 32 samples including water (from glacier meltwater, lakes, springs, streams, and groundwater) and sediments in the Shullcas basin. Microbial biomass was collected by filtration and DNA was extracted. The V3-V4 region of the 16S rRNA gene was sequenced using Illumina Next-Generation Sequencing (NGS). Bioinformatics processing was conducted via the DADA2 pipeline in R platform. We analyzed microbial community composition, alpha/beta diversity, and shared taxa (ASVs/genera) to identify biological tracers. At the same time, monthly stable isotope data 2H and 18O from 2025 were analyzed using dual isotope plots to determine seasonal recharge sources.

Isotopic signatures indicate that groundwater consists of a stable mixture across both dry and rainy seasons, with precipitation, glacier meltwater and surface rivers identified as primary recharge sources. Microbial analysis identified 12,989 ASVs and 695 genera. Taxonomic analysis revealed that the top 10 genera in terms of relative abundance were Hgcl clade, Flavobacterium, Brevundimonas, Sphingorhabdus, Romboutsia, Fusibacter, Pseudarthrobacter, Cypionkella, Sphingomonas, and Ferruginibacter. Alpha and beta diversity analysis and the detection of the genus CL500-29 marine group y Pseudarthrobacter in both meltwater and groundwater supports the existence of a cold, oxygenated hydrological glacial origin for recharge. Although 317 genera were shared across all sites, 12 genera were found exclusively in both glacier meltwater and groundwater. This exclusive community comprises psychrotolerant, oligotrophic, and acidotolerant taxa, including degraders of ancient organic matter (Granulicella, Cellulomonas) and taxa associated with ice environments (Subtercola, Arcticibacter).

Despite the complex geology and the 20 km distance between the Huaytapallana Cordillera and the Mantaro aquifer, our findings confirm a direct hydrological and biological connectivity between the glacier and aquifer. This link is evidenced by shared microbial taxa (specifically psychrotolerant taxa) and stable isotope signatures. Currently, we are further quantifying the proportion of glacial meltwater that contributes to aquifer recharge and estimating the travel time from the glacier to the extraction wells. These ongoing analyses are crutial for predicting the long-term impact of glacier retreat on water availability. Our results emphasize the need to integrate glacial dynamics into groundwater management plans and high-mountain recharge programs to ensure sustainable water supply for the Shullcas River basin.

How to cite: Mamani Larico, A. J., de la Cruz Solano, H., Gonzales-Llontop, M. J., Frisbee, M., Custodio Villanueva, M., and Boza Espinoza, T. E.: Glacial-Groundwater connectivity through DNA Metabarcoding and stable isotope tracers in Peruvian Central Andes, EGU General Assembly 2026, Vienna, Austria, 3–8 May 2026, EGU26-15995, https://doi.org/10.5194/egusphere-egu26-15995, 2026.

EGU26-17721 | ECS | Orals | HS8.2.3

2-D Hydrodynamic Modelling of eDNA Dispersion and Occurrence in a Restored Alpine River Reach 

Mohammad Areeb Anwer, Martin Schletterer, Michael Traugott, and Markus Aufleger

Two-dimensional (2-D) hydrodynamic models based on high resolution bathymetric data from Airborne Lidar Bathymetry (ALB) surveys and cross-profile surveys are widely used to describe spatial flow variability in river systems and are particularly important in restored and widened river reaches, where flow patterns are highly heterogeneous. In parallel, environmental DNA (eDNA) has emerged as a cost-effective and non-invasive tool for biodiversity monitoring. However, linking eDNA signals to hydraulic processes in complex river geometries remains a key challenge, limiting its application for assessing restoration success.
This study investigates the relationship between hydrodynamic conditions and fish eDNA dispersion and occurrence in a restored alpine river reach. The study site is located on the Inn River between Stams and Rietz in Tyrol, Austria, where as part of river restoration measures, bank protections were removed to widen the river and side arms were created to provide hydraulically diverse conditions for habitats. A controlled eDNA source, consisting of a cage containing dead eels (Anguilla anguilla), was placed in a side arm of the restored reach. Water samples were collected at multiple locations downstream and across the river and filtered on site. The eDNA was extracted from the filters and analysed for fish DNA using metbarcoding and general fish primers. Additionally, all samples were screed for eDNA of eel using qPCR and the total amount of overall fish eDNA from was determined for each sample. 
The spatial distribution and occurrence of eDNA from fish is analysed in relation to simulated hydraulic parameters, including flow velocity and water depth, derived from a 2-D hydrodynamic model. The results provide insights into how local flow conditions influence eDNA transport and dilution in restored river sections. This improved process understanding supports the use of eDNA as a monitoring tool for river restoration projects and contributes to the ecological assessment of restored reaches in line with the European Water Framework Directive.

How to cite: Anwer, M. A., Schletterer, M., Traugott, M., and Aufleger, M.: 2-D Hydrodynamic Modelling of eDNA Dispersion and Occurrence in a Restored Alpine River Reach, EGU General Assembly 2026, Vienna, Austria, 3–8 May 2026, EGU26-17721, https://doi.org/10.5194/egusphere-egu26-17721, 2026.

EGU26-18174 | ECS | Orals | HS8.2.3

Elevated Argon-39 Concentrations in Groundwater of a Sub-Alpine Fractured Mountain Aquifer in the East River Watershed, CO, USA 

Christoph West, Nicholas Thiros, Franka Neumann, Kerstin Urbach, David Wachs, Emmy Hieronimus, Florian Meienburg, Niclas Mandaric, Alexander Junkermann, Markus Oberthaler, Werner Aeschbach, and W. Payton Gardner

Mountain groundwater systems face imminent changes due an increasing low-snow winter occurrences related to climate change. Understanding how these systems react to the changing water availability is of great importance, especially the dynamics between recent recharge and older groundwater. Environmental age tracers can be useful to inform on the groundwater mixing dynamics in mountain aquifers. However, these mixing dynamics often remain poorly constrained. The radioactive isotope argon-39 (39Ar, T1/2=268 yr) is an important groundwater age dating tracer, filling the dating gap (ca. 50-1000 years) between the widely used tracers tritium and radiocarbon. With the development of the Atom Trap Trace Analysis (ATTA) technique, 39Ar can now be sampled in smaller sample sizes (~5-10 L), making it accessible for sampling in mountainous regions.

We report on a study sampling groundwater for 39Ar from three bedrock monitoring wells of ~10-70 m depth along a mountain hillslope underlain by fractured shale in the East River Watershed near Crested Butte (Colorado, USA). Measured 39Ar concentrations show a downslope increasing gradient from 1.5 times enrichment, compared to modern concentration, on the upslope to 17 times atmospheric abundance at the bottom of the slope. Modeling results show that the observed elevated 39Ar activities in the groundwater can be reproduced by subsurface production of 39Ar in the rock, predominantly due to muon capture reactions, which has been recently demonstrated in a Danish sand aquifer (Musy et al., 2023). The results and their implications will be discussed in the hydrogeological context of the study area.


Musy, S., Hinsby, K., Troldborg, L., Delottier, H., Guillon, S., Brunner, P., and Purtschert, R., 2023. Evaluating the impact of muon-induced cosmogenic 39Ar and 37Ar underground production on groundwater dating with field observations and numerical modeling. Sci. Total Environ., Volume 903, 166588, ISSN 0048-9697

How to cite: West, C., Thiros, N., Neumann, F., Urbach, K., Wachs, D., Hieronimus, E., Meienburg, F., Mandaric, N., Junkermann, A., Oberthaler, M., Aeschbach, W., and Gardner, W. P.: Elevated Argon-39 Concentrations in Groundwater of a Sub-Alpine Fractured Mountain Aquifer in the East River Watershed, CO, USA, EGU General Assembly 2026, Vienna, Austria, 3–8 May 2026, EGU26-18174, https://doi.org/10.5194/egusphere-egu26-18174, 2026.

EGU26-19846 | ECS | Posters on site | HS8.2.3

Tracing terrestrial organic matter dynamics in the subarctic North Pacific using sedimentary ancient DNA metabarcoding 

Hongyu Lu, Kathleen R. Stoof-Leichsenring, Josefine Friederike Weiß, Heike H. Zimmermann, Lester Lembke-Jene, and Ulrike Herzschuh

The subarctic North Pacific serves as a critical repository for terrestrial organic matter, yet the limited taxonomic resolution of traditional isotope and biomarker proxies constrains our ability to identify both its source taxa and source regions. Therefore, the source and transport dynamics of terrestrial organic matter in this basin remain poorly understood. Here we use land-plant sedimentary ancient DNA (sedaDNA) metabarcoding as a high-resolution proxy to trace the taxonomic composition and continental source regions of terrestrial organic matter, performing a same-proxy comparison between marine sediment cores from off-Kamchatka and the Bering Sea and lake records from Siberia and Alaska. We obtained unprecedented taxonomic resolution of terrestrial plant signals in both marine sediment cores, revealing a persistent, taxonomically coherent assemblage dominated by riparian taxa (e.g. Salicaceae). The comparison between marine and lake records reveals that marine archives largely represent a nested subset of the regional terrestrial taxon pool, with riparian vegetation overrepresented and steppe-tundra herbs and conifers underrepresented relative to lakes. This reflects integration across catchments, with hydrological filtering further amplifying these abundance contrasts in marine archives. A few region-specific indicator taxa (e.g. Spiraea salicifolia and Shepherdia canadensis) could be identified, providing direct taxonomic evidence for continental source attribution. Across the glacial–deglacial–Holocene transition, land-plant DNA assemblages in marine records shifted significantly, capturing changes in source taxa. These shifts are accompanied by changes in the coupling between marine and lacustrine records, highlighting dynamic source–sink connectivity over time. Our results demonstrate the potential of sedaDNA as a high-resolution tool to trace terrestrial organic matter in high-latitude oceans, highlighting the need for expanded DNA reference databases and further research into taphonomic processes affecting DNA in marine sediments.

How to cite: Lu, H., Stoof-Leichsenring, K. R., Weiß, J. F., Zimmermann, H. H., Lembke-Jene, L., and Herzschuh, U.: Tracing terrestrial organic matter dynamics in the subarctic North Pacific using sedimentary ancient DNA metabarcoding, EGU General Assembly 2026, Vienna, Austria, 3–8 May 2026, EGU26-19846, https://doi.org/10.5194/egusphere-egu26-19846, 2026.

EGU26-21321 | Posters on site | HS8.2.3

On the origins of DNA in sediments 

Benjamin Vernot and Kevin Nota

Living organisms are constantly shedding DNA in to their environment. Some portion of that DNA may
eventually become bound to sediments, buried, and later recovered in an ancient DNA laboratory. Many
studies have used such ancient DNA from sediments to study past ecosystems, or to zoom in on the
population genetics of specific organisms. The source, the specific route that this DNA took on its way to
adhering to a mineral particle, and the subsequent fate of that mineral particle are critically important to
the interpretation of the genetic results, yet in many studies are unknown. Here we examine data from
several studies to investigate the source of ancient DNA in lake, terrestrial, and archaeological
sediments.

How to cite: Vernot, B. and Nota, K.: On the origins of DNA in sediments, EGU General Assembly 2026, Vienna, Austria, 3–8 May 2026, EGU26-21321, https://doi.org/10.5194/egusphere-egu26-21321, 2026.

Safe drinking water in the Sundarbans, a UNESCO world heritage site, is increasingly at risk as coastal aquifers are repeatedly impacted by salinity intrusion, tidal influence, cyclones, and anthropogenic stresses such as population growth, urbanization, and over-extraction. Consequentyly, this ecologically vulnerable delta-front region is experiencing growing groundwater stress, threatening about 4.5 million people. Therefore, this study aimed to assess groundwater vulnerability in the Sundarbans using stable water isotopes (δ²H and δ¹⁸O) and hydrochemistry to apprehend SW-GW mixing processes and salinity pathways from coastal shoreline to further inland across four zones (I, II, III, and IV). Results revealed that despite an increasing rainfall trend, groundwater levels (GWL) and salinity (Cl⁻) have shown a decreasing trend over the past decade. Groundwater salinity and δ¹⁸O values varied widely in Zone I (salinity: 0.7–4 PSU, δ¹⁸O: −2.3 to +0.5‰) and Zone II (0.7–9 PSU, δ¹⁸O: −2.8 to −0.5‰), while Zones III and IV exhibited narrow ranges (Zone III: salinity 0.8–1.2 PSU, δ¹⁸O: −2 to −0.6‰; Zone IV: salinity 0.7–1.2 PSU, δ¹⁸O: −1.6 to −1.1‰). Groundwater in zones I and IV closely aligns with the Global and Local Meteoric Water Line (GMWL and LMWL), indicating direct meteoric recharge. In contrast, groundwater zones II and III slightly deviates, suggesting evaporative enrichment prior to recharge. This is further supported the by average d-excess in zones I, II, III, and IV are 4.5 ± 3‰, -2. ± 1.7‰, -2 ± 1‰, and 5 ± 6‰, respectively. River water, with high salinity (10 and 24 PSU in Zones I and II, respectively), appears to be a major source of saline intrusion, and seawater near coast (salinity: 33 PSU, zone IV)  elevating groundwater salinity suggesting the potential pathways of SW-GW interaction and solute mobilization contributing to groundwater vulnerability in the study area. Consequently, it is evident that the inland groundwater is more depleted indicating monsoonal rainfall recharge with very less maritime influence while the delta-front groundwater near shoreline suggest enriched isotopic signature indicates possible vertical mixing which raise concern for water security. Therefore, this study emphasizes for implying immediate and effective groundwater management strategies for sustainable drinking-water management in the Sundarbans.

Keywords: Groundwater; Coastal aquifers; Stable isotopes; δ²H; δ¹⁸O; Sundarbans; Salinity intrusion; Drinking water security

How to cite: Mondal, M. and Das, K.: Insight into surface water-groundwater interaction derived solute mobilization using stable isotopes in Sundarbans delta front aquifer: An implication to drinking water sustainability, EGU General Assembly 2026, Vienna, Austria, 3–8 May 2026, EGU26-475, https://doi.org/10.5194/egusphere-egu26-475, 2026.

EGU26-1111 | ECS | Orals | HS8.2.4

Application of an Automated and Enhanced Dataset Index for Agricultural Leaching Assessment in Coastal Areas: Insights from the Mediterranean and Baltic Seas 

Yassine Ez-zaouy, Gianluigi Busico, Beata Jaworska-Szulc, Nebojsa Jovanovic, Konstantinos Chalikakis, Ricardo Hirata, and Micòl Mastrocicco

Assessing groundwater vulnerability is a tenet of sustainable groundwater management. As a result, developing new practical approaches is an ongoing task that needs to be improved over time, considering growing knowledge and getting new evidence regarding groundwater contamination and risk. In this regard, the DATASET project (Groundwater salinization and pollution assessment tool: a holistic approach for coastal areas) aims to introduce an innovative framework for evaluating groundwater vulnerability and risk related to agricultural products and to salinization phenomenon in coastal aquifers.  The proposed methodology integrates the most relevant influencing factors identified in literature, including ground elevation (slope), hydraulic conductivity, soil texture (clay/sand/silt composition), depth to groundwater, vertical and lateral recharge, hydraulic resistance, and pollution probability. These parameters are systematically incorporated into a flexible assessment framework supported by an open-access database. To enhance applicability, the approach introduces two complementary levels of implementation. The first, the Automatic Dataset Index (ADI), relies solely on freely available open-source data to provide an initial assessment of aquifer vulnerability, with a focus on specific pressures such as agricultural pollution and salinization. The second, the Improved Dataset Index (IDI), allows users to incorporate local knowledge and modify parameters, thereby improving accuracy and tailoring the assessment to site-specific conditions. Case studies conducted in Morocco, Italy, and Poland illustrate the robustness of the approach, demonstrating its ability to identify agricultural pollution hotspots and areas at risk of salt accumulation with high reliability. The results highlight the adaptability of the framework across different hydrogeological and climatic contexts. Overall, this methodology offers a practical and scalable tool for the evaluation and management of coastal aquifer systems, supporting both scientific research and decision-making for sustainable groundwater use worldwide.

How to cite: Ez-zaouy, Y., Busico, G., Jaworska-Szulc, B., Jovanovic, N., Chalikakis, K., Hirata, R., and Mastrocicco, M.: Application of an Automated and Enhanced Dataset Index for Agricultural Leaching Assessment in Coastal Areas: Insights from the Mediterranean and Baltic Seas, EGU General Assembly 2026, Vienna, Austria, 3–8 May 2026, EGU26-1111, https://doi.org/10.5194/egusphere-egu26-1111, 2026.

EGU26-3014 | ECS | Posters on site | HS8.2.4

Beyond Piezometers: Integrated Supersite Monitoring Framework for Seawater Intrusion in the Brenta and Adige Coastal Plain, Italy 

Pablo Agustín Yaciuk, Luigi Tosi, Marta Cosma, Iva Aljinović, Andrea Artuso, Jadran Čarija, Cristina Da Lio, Lorenzo Frison, Veljko Srzić, Fabio Tateo, and Sandra Donnici

Saltwater intrusion poses an increasing threat to groundwater sustainability in coastal aquifers worldwide, where relative sea-level rise, climate variability, and drainage management jointly alter groundwater recharge and flow regimes. To properly understand these forcings and implement effective management strategies, adequate monitoring approaches are required. However, conventional regional monitoring networks, typically based on sparse and infrequent measurements, often fail to capture these coupled dynamics, complicating the development of regional models and long-term assessments.
This study presents the design and first observations of an integrated coastal “supersite” monitoring framework implemented in strategic areas of the coastal plain between the Brenta and Adige rivers (northern Adriatic coast, Italy), within the SWAMrisk project. The region hosts a multi-layer aquifer system composed of a shallow unconfined aquifer and several deeper confined units, separated by discontinuous silty–clayey aquitards, and is heavily modified by a dense network of drainage channels and pumping stations that regulate groundwater levels. Two supersites were established at Gorzone and Buoro, characterized by contrasting hydrostratigraphic settings and located next to pumping stations hydraulically connected to tidally influenced drainage networks. Each supersite integrates three multilevel piezometers equipped with fixed-depth conductivity–temperature–depth sensors, periodic high-resolution vertical electrical conductivity (EC) profiling, surface-water level monitoring in canals and pumping stations, and information from nearby meteorological and tide-gauge stations.
Despite the limited initial observation period (July–September 2025), the combined approach reveals consistent and site-specific fresh–saline groundwater structures and dynamics. Both sites exhibit vertically layered systems, with small fluctuations in groundwater level and pronounced vertical variability in EC. A persistent freshwater cap above more saline groundwater was identified in both aquifer systems. At Gorzone, where a thicker and laterally continuous aquitard promotes hydraulic isolation, the upper confined aquifer remains relatively fresh (~2.3 mS/cm) and stable, increasing to ~12 mS/cm at depth. The phreatic aquifer shows EC values rising from ~2 to 18 mS/cm in the upper part, driven mainly by pressure perturbations associated with tidal propagation and drainage management. At Buoro, a thinner and discontinuous aquitard allows partial vertical connectivity, resulting in faster phreatic responses to local recharge and pumping, and subtle, delayed confined-aquifer responses linked to inland rainfall. Here, the phreatic aquifer hosts a thicker fresh-to-brackish lens (~3–10 mS/cm), stabilizing at ~15 mS/cm near its base, while a thin freshwater lens (~2 mS/cm) caps the confined aquifer and rapidly transitions to saline conditions (~24 mS/cm) at depth.
These observations support a dual-forcing conceptual model in which short-term groundwater and salinity fluctuations are dominated by local mechanical controls, whereas longer-term stratification and freshwater preservation in confined aquifers are governed by regional recharge and density-driven processes. The results demonstrate that integrated coastal supersites provide a robust, scalable, and management-relevant platform for improving process understanding, model calibration, and adaptive management of coastal aquifers under climate change and increasing human pressures. 
Research funded by the Interreg Italy–Croatia 2021–2027 Programme, Project ID: ITHR0200479—SWAMrisk “Subsurface Water Monitoring and Management to Prevent Drought Risk in Coastal Systems”.

How to cite: Yaciuk, P. A., Tosi, L., Cosma, M., Aljinović, I., Artuso, A., Čarija, J., Da Lio, C., Frison, L., Srzić, V., Tateo, F., and Donnici, S.: Beyond Piezometers: Integrated Supersite Monitoring Framework for Seawater Intrusion in the Brenta and Adige Coastal Plain, Italy, EGU General Assembly 2026, Vienna, Austria, 3–8 May 2026, EGU26-3014, https://doi.org/10.5194/egusphere-egu26-3014, 2026.

EGU26-5544 | ECS | Orals | HS8.2.4

Assessing the hydrogeological potential of shallow coastal cheniers in Suriname.  

Oclaya Sophia Verwey, Gualbert OudeEssink, and Marc Bierkens

Cheniers are sandy or shelly sediment ridges that are formed, often parallel to the shore, on silty and clay-rich coastlines. We will investigate Chenier plains in Suriname’s low-lying coastal region to quantify their hydrogeological potential to function as a medium for sustainable drinking water supply and irrigation in rural areas, where people lack access to reliable water supply for now and in the future.

In the study area, the cheniers are of Quaternary age and occur as elongated sandy depositions surrounded by clayey swamps and tidal deposits (Augustinus, 1989; Groen 2000,2002). Substantial research has been conducted on the depositional environments, formation processes, and internal structure of cheniers, but large knowledge gaps remain regarding their hydro(geo)logical potential. Previous hydro(geo) logical investigations indicate that the saline groundwater originally entrapped during deposition, has been completely flushed out through sustained recharge from abundant precipitation. This study will therefore focus on understanding the hydro(geo)logy of the cheniers in the study area. We will investigate to what extend cheniers interact with underlaying stratigraphy and surrounding sedimentary layers, the relationship between the geomorphology and their water bearing capacity, and the current groundwater quality.  Additionally, we will determine the impact of climate variability, climate change and groundwater extraction on chenier groundwater availability and quality.   

We will use hydrogeological and geophysical methods (electrical resistivity and electromagnetic methods) to characterize the subsurface by understanding their hydrogeology and groundwater occurrence in relation with geology and depositional environment. We will install piezometers to monitor groundwater levels and hydraulic heads variations and to assess the impact of seasonal changing weather conditions on recharge and groundwater levels, while water samples will be collected to assess water quality and determination of the chemical composition of major ions and stable isotopes. In addition, we will take chenier sediment samples  to determine hydraulic parameters together with pumping test analysis.

We will use the field data acquired to develop conceptual and numerical models for the study area mimicking groundwater flow and salinity patterns within and around the cheniers. We will make projections of groundwater availability and quality under future groundwater extractions, sea level rise and climate change scenarios. The variable-density groundwater flow and salt transport model will also be used to evaluate different management scenarios in order determine management practices for protection and sustainable groundwater use of the cheniers containing freshwater lenses.

How to cite: Verwey, O. S., OudeEssink, G., and Bierkens, M.: Assessing the hydrogeological potential of shallow coastal cheniers in Suriname. , EGU General Assembly 2026, Vienna, Austria, 3–8 May 2026, EGU26-5544, https://doi.org/10.5194/egusphere-egu26-5544, 2026.

EGU26-6065 | Orals | HS8.2.4

Impact of land subsidence and drainage infrastructure on estuarine aquifer salinization 

Chi San Tsai, Jiaqi Liu, Yuka Ito, and Tomochika Tokunaga

Flood management through drainage infrastructures effectively removes inundated water yet creates a critical hydrogeological trade-off. By artificially altering hydraulic gradients, these systems can accelerate saltwater intrusion into freshwater aquifers—particularly in regions where land subsidence from groundwater extraction has increased flooding vulnerability. In this study, we used a coupled surface–subsurface flow model to assess how land subsidence and drainage infrastructure affect shallow groundwater salinization in subsided estuarine zones. Comparison of simulated groundwater salinities with field measurements indicates that the model captures relatively well the primary spatial patterns in salinity distributions. However, agreement with 1D resistivity inversion results varied across locations, with some sites showing close correspondence while others exhibited marked discrepancies—likely reflecting spatial heterogeneity and complexity beyond the model's representation. The results showed that although pumping stations effectively reduce surface inundation, they alter hydraulic gradients by removing surface water, thereby promoting the inland transport of high-salinity water. These findings demonstrated that conventional flood-management strategies can exacerbate aquifer salinization in subsided coastal areas. While land subsidence is often a localized phenomenon, the mechanisms identified here may have broader relevance to coastal regions under sea-level rise globally, as both subsidence and sea-level rise reduce relative land elevation and intensify the hydraulic gradient driving saltwater intrusion. This suggests the need for coupled surface–groundwater assessment frameworks that account for alterations to both flooding patterns and subsurface salinity transport in vulnerable coastal regions.

How to cite: Tsai, C. S., Liu, J., Ito, Y., and Tokunaga, T.: Impact of land subsidence and drainage infrastructure on estuarine aquifer salinization, EGU General Assembly 2026, Vienna, Austria, 3–8 May 2026, EGU26-6065, https://doi.org/10.5194/egusphere-egu26-6065, 2026.

EGU26-8301 | Orals | HS8.2.4

Hydrological budget of Mayotte: groundwater flow and water resources of Petite Terre Island 

Francois Metivier, Alexis Groleau, Jonas Frere, Louise Levagueresse, Didier Jézequel, Ader Magali, and Maud Deves

Based on an analysis of available data combined with new observations, we propose a steady-state model of the freshwater lens of Petite Terre island in Mayotte. The hydrological balance of the airport's meteorological station allows us to estimate the annual recharge using Turc formula. This recharge is on the order of two million cubic meters per year, a portion of which could be extracted for the drinking water supply. Simple modeling under the Dupuit Boussinesq approximation enables to characterise the form of the lens and estimate its volume. We show that the model accords with available data. These results suggest the existence of a significant resource and call for the implementation of further monitoring and analysis, coupled with a review of the groundwater extraction strategy by public authorities in a socially and politically tense island context.

How to cite: Metivier, F., Groleau, A., Frere, J., Levagueresse, L., Jézequel, D., Magali, A., and Deves, M.: Hydrological budget of Mayotte: groundwater flow and water resources of Petite Terre Island, EGU General Assembly 2026, Vienna, Austria, 3–8 May 2026, EGU26-8301, https://doi.org/10.5194/egusphere-egu26-8301, 2026.

EGU26-8418 | Posters on site | HS8.2.4

Perspectives for the Neretva delta under climate change: From saltwater abundance to freshwater scarcity 

Veljko Srzic, Marin Milin, Pablo Agustin Yaciuk, Iva Aljinovic, Marta Cosma, Cristina Da Lio, Marko Dzaja, Luigi Tosi, and Sandra Donnici

The river-delta system of the Neretva, located in the southeastern Adriatic Sea, confronts the simultaneous influence of basin-driven processes and coastal oceanographic conditions, which together exert dominant control over the land-sea interaction and the balance between surface-water and groundwater regimes across the delta. River Neretva Delta represents the largest cultivated agricultural area (4500 ha) along the Croatian coast and it is increasingly exposed to climate change and reduced freshwater availability, which intensifies salinization through saltwater intrusion. Since the 1960s, the delta area has been significantly transformed from its natural state into an intensively cultivated landscape, primarily via the extensive implementation of melioration infrastructure. Up to date, after the preconditions for agriculture have been met, no significant improvements to the melioration system’s operating regime have been implemented, nor has novel infrastructure been introduced, although a clear decline in both freshwater quality and quantity is evident.

This study aims to highlight the adverse effects of climate change, relying on datasets obtained via several cross-border collaboration programmes. Initially, monitoring was focused on capturing groundwater salinity and related volumetric features in the area. As an add-on, a monitoring infrastructure has been implemented to ensure insight into surface-water quality and quantity parameters. Since the Neretva River has been identified as a dominant boundary condition for the hydrological and hydrogeological setting of the delta, the estimation of the freshwater discharge has been significantly improved to ensure the real-time information on freshwater availability and on upstream penetration of the seawater wedge, which can infiltrate through the riverbed and feed the aquifer with saltwater. In addition to the onshore monitoring network, further activities led to the installation of subsea piezometers to support offshore groundwater characterization, sampling, and the collection of Rn222/226 datasets.

Results obtained revealed several emerging trends. With ongoing sea-level rise, the impact of saltwater intrusion on freshwater availability is evident at both seasonal and short-term timescales. Land subsidence analyses highlight a steady trend with minor spatial variability. Upstream freshwater discharge is regulated by hydropower plants in operation, thereby reducing freshwater availability during the dry season. Even though the phreatic aquifer is sensitive to external conditions, deeper lithological units appear comparatively insensitive, reflecting the dominant influence of the Adriatic Sea and a persistent lack of freshwater throughout the hydrological year. Considering climate change-induced effects, this study indicates a deterioration of the water quality and highlights the associated challenges for water management.

Research funded by the Interreg Italy–Croatia 2021–2027 Programme, Project ID: ITHR0200479—SWAMrisk “Subsurface Water Monitoring and Management to Prevent Drought Risk in Coastal Systems”.

How to cite: Srzic, V., Milin, M., Agustin Yaciuk, P., Aljinovic, I., Cosma, M., Da Lio, C., Dzaja, M., Tosi, L., and Donnici, S.: Perspectives for the Neretva delta under climate change: From saltwater abundance to freshwater scarcity, EGU General Assembly 2026, Vienna, Austria, 3–8 May 2026, EGU26-8418, https://doi.org/10.5194/egusphere-egu26-8418, 2026.

EGU26-8522 | ECS | Orals | HS8.2.4

Post-surge recovery of coastal aquifers under climate change 

Satoshi Tajima, René Therrien, and Philip Brunner

Storm surge increases the salinity of coastal aquifers through subsequent vertical seawater intrusion. Climate change is expected to reduce the frequency of storm surges while increasing their intensity, raising complex challenges for the recovery of coastal aquifers to pre-surge conditions. Using integrated surface–subsurface numerical simulations of a generalized coastal aquifer, we examine how the shifts in storm-surge frequency and intensity control long-term salinization. The results show the emergence of two regimes: full recovery, where the aquifer returns to pre-surge conditions, and a shifted equilibrium, characterized by salt accumulation and reduced fresh groundwater availability. The transition between the regimes is captured by a dimensionless number E, linking recurrent storm-surge characteristics and aquifer properties to salt loading. This framework provides an efficient basis for assessing climate-change impacts on vulnerable coastal groundwater systems.

How to cite: Tajima, S., Therrien, R., and Brunner, P.: Post-surge recovery of coastal aquifers under climate change, EGU General Assembly 2026, Vienna, Austria, 3–8 May 2026, EGU26-8522, https://doi.org/10.5194/egusphere-egu26-8522, 2026.

EGU26-10108 | Posters on site | HS8.2.4

Integrating Sr isotopes into coastal aquifer management: evidence for early marine intrusion in Tenerife  

Beverley C. Coldwell, Nemesio M. Pérez, Maria Asensío-Ramos, Gladys V. Melían, and Eleazar Padrón González

The island of Tenerife (Canary Islands, Spain) relies on basalt-hosted aquifers to supply approximately 90% of its water for agriculture and human consumption. The hydrogeological system is highly compartmentalised, consisting of a low-permeability volcanic core overlain by permeable units and dissected by impermeable dykes that form discrete groundwater “pockets”. Recharge is spatially variable and frequently intercepted by wells and horizontal galleries, while water demand is highest in coastal areas, where intensive extraction has historically led to marine intrusion, conventionally identified using chloride concentrations and electrical conductivity. 

In volcanic ocean island settings, salinity-based indicators can be ambiguous due to evaporative concentration, marine aerosol input, and diffuse volcanic degassing. To improve detection of marine influence, strontium isotopes (87Sr/86Sr) were analysed together with Sr concentrations and major ions in 43 coastal groundwater extraction sites across Tenerife. Strontium isotopes provide a conservative tracer of fluid source, unaffected by biological or physical fractionation, with distinct end-members for basalt-derived groundwater and seawater. 

Groundwaters display unradiogenic 87Sr/86Sr ratios (0.7032–0.7039), consistent with interaction with basaltic lithologies and defining a well-constrained freshwater end-member. Seawater samples show homogeneous 87Sr/86Sr values (~0.70917) and high Sr and chloride concentrations, providing a clear marine reference. Several groundwaters exhibit isotopic enrichment toward the marine signature (up to 87Sr/86Sr = 0.7055) at moderate chloride concentrations (<900 mg L⁻¹), indicating early-stage seawater mixing that would not be readily identified using salinity indicators alone. In many cases, Sr concentrations remain low relative to seawater, suggesting buffering by water–rock interaction during intrusion. One highly radiogenic sample (87Sr/86Sr = 0.7072) deviates from marine mixing trends, reflecting local lithological control rather than seawater contribution. 

The combined isotopic and hydrochemical dataset reveals that seawater intrusion affects not only the western but also parts of the northern coastal aquifers of Tenerife. These results demonstrate that 87Sr/86Sr provides a sensitive and robust indicator of incipient marine intrusion in volcanic island aquifers, supporting improved assessment and management of coastal groundwater resources. 

How to cite: C. Coldwell, B., M. Pérez, N., Asensío-Ramos, M., V. Melían, G., and Padrón González, E.: Integrating Sr isotopes into coastal aquifer management: evidence for early marine intrusion in Tenerife , EGU General Assembly 2026, Vienna, Austria, 3–8 May 2026, EGU26-10108, https://doi.org/10.5194/egusphere-egu26-10108, 2026.

EGU26-10507 | Posters on site | HS8.2.4

Identification of Areas Vulnerable to Salinisation in a Coastal Aquifer of Western Sicily (Southern Italy) within the Framework of the Water Body Status Update 

Chiara Cappadonia, Federica Lo Medico, Iolanda Borzì, Marcella Perricone, Antonino Granata, Rudy Rossetto, Giampiero Mineo, and Edoardo Rotigliano

As of December 19, 2025, Sicily Island is under a water crisis emergency due to severe and prolonged drought. Monitoring conducted by the Permanent District Observatories, utilising indicators such as the Standardised Precipitation Index (SPI) and saline intrusion data, confirms a critical level of water scarcity, necessitating extraordinary management measures. Current water resource management in Sicily requires updating the status of groundwater bodies, for which a comprehensive framework is presently lacking; to address this gap, Sicilian Universities and the Sicilian River Basin District Authority are collaborating to update the regional’s hydrogeological framework. In this context, the University of Palermo is currently characterizing the aquifers of Western Sicily. These can be grouped into three main categories: carbonate aquifers, alluvial aquifers (river valleys), and porous aquifers in calcarenitic rocks (coastal plains). The latter are highly productive shallow aquifers, easily accessible via wells often only a few tens of metres deep. The study focused on the 286 km² coastal plain aquifer of the Marsala-Mazara coastal plain, which is characterised by intense urbanization, a strong tourism sector, diversified agricultural activities (encompassing general and greenhouse farming as well as viticulture), and aquaculture. As part of the collaboration-which involves creating hydrogeological databases, redefining groundwater body geometries, updating hydrogeological data, and implementing a monitoring network-hydrogeochemical and groundwater data were updated using both historical and recently surveyed wells and springs. The aquifer's shallow depth and proximity to the coastline render it extremely vulnerable to both nitrate pollution (intensive agriculture) and saline intrusion, which is driven primarily by excessive groundwater abstraction—often unauthorized—and is exacerbated by climate change. Drought conditions impede winter aquifer recharge, while torrential rainfall events favour surface runoff over infiltration. The resulting decline in piezometric levels allows the saline wedge to advance inland. Furthermore, geochemical interactions between saltwater and the calcarenitic matrix promote ion exchange and the resulting release of specific ions, compromising water quality for irrigation and increasing the risk of soil desertification. The new hydrogeological characterisation of the Marsala-Mazara water body and the and the implementation of the monitoring network allowed updating of the hydrogeological and hydrogeochemical characteristics as well as their temporal evolution through the comparison of historical and recent data, including climate data. Surveys have allowed the identification also of high electrical conductivity values in numerous coastal wells and the identification of the most vulnerable zones, which are now subject to in-depth analysis to define concrete strategies for aquifer recovery and salinisation mitigation.

How to cite: Cappadonia, C., Lo Medico, F., Borzì, I., Perricone, M., Granata, A., Rossetto, R., Mineo, G., and Rotigliano, E.: Identification of Areas Vulnerable to Salinisation in a Coastal Aquifer of Western Sicily (Southern Italy) within the Framework of the Water Body Status Update, EGU General Assembly 2026, Vienna, Austria, 3–8 May 2026, EGU26-10507, https://doi.org/10.5194/egusphere-egu26-10507, 2026.

EGU26-11313 | Orals | HS8.2.4

Reframing Deltaic Salinisation: Why Offshore Controls are Primary Drivers and Anthropogenic Factors are Accelerants 

Mohammad Hoque, Sean Feist, ChiSan Tsai, Muntaha Aurthy, Kristine Belesova, Ashraf Dewan, and Adrian Butler

Coastal salinisation is frequently attributed to contemporary anthropogenic and climatic drivers, such as upstream freshwater withdrawal, land-use change, and sea-level rise. However, these explanations often overlook the fundamental role of offshore bathymetry and continental shelf geometry in regulating tidal dynamics and saltwater retention. We argue that these deeper geological and oceanographic controls govern where salinisation is spatially persistent, structurally organised, and resistant to reversal.

Across many large deltas, offshore geometry exerts first-order control on inland flushing efficiency. While wide, gently sloping shelves typically support large tidal ranges, the narrow and steep shelves—such as those found in the western Bengal Delta—generate tidal ranges approximately  1m lower than in the eastern delta. This reduction in tidal energy supports the development of dense, intricate tidal creek networks, while the accompanying weaker vertical mixing promotes the persistence of saline water. These networks distribute saline water laterally across the landscape and facilitate the formation of persistent, density-driven salinity wedges in underlying shallow aquifers. The lateral prevalence of these high-density wedges, coupled with relict salinity from the geological past, renders groundwater salinity a ubiquitous feature of the coastal region.

We illustrate this structural vulnerability using the Bengal Delta, where a pronounced east–west hydro-salinity divide is dictated by the "Swatch of No Ground"- a 1-km deep Pleistocene submarine canyon. This NNE-SSW deep-water feature on the narrow western shelf fundamentally influences creek-induced salinity patterns. While the eastern delta remains comparatively fresh due to higher-magnitude tidal ranges that promote the mixing and flushing of fluvial and saline water, the south-western delta exhibits persistent salinisation despite similar climatic forcing.

Leveraging a two-decade spatio-temporal dataset from 54 stations, we reveal a sharp asymmetry in salinisation rates: the Western Estuarine System is experiencing rapid increases averaging 111 ± 28 µS/cm yr-1. To explain this variability, we introduced the Offshore Controlled Estuarine and Aquifer Nexus (OCEAN) Salinisation Framework. Our findings indicate that while declining river discharge and polderisation are critical accelerating factors, they operate within a system already structurally predisposed to salinity. Notably, similar anthropogenic forcing in the eastern delta has not produced comparable salinity responses, reinforcing the primacy of underlying structural controls.

Recognising that contemporary drivers function primarily as accelerants of existing vulnerabilities, rather than root causes, is essential for realistic adaptation planning and water security strategies. Interventions targeting only recent drivers risk underestimating the persistence of salinity in systems where offshore-controlled geometry imposes long-term constraints on freshwater recovery. This reframing has global relevance for the management and health-oriented water security of low-lying coastal deltas.

How to cite: Hoque, M., Feist, S., Tsai, C., Aurthy, M., Belesova, K., Dewan, A., and Butler, A.: Reframing Deltaic Salinisation: Why Offshore Controls are Primary Drivers and Anthropogenic Factors are Accelerants, EGU General Assembly 2026, Vienna, Austria, 3–8 May 2026, EGU26-11313, https://doi.org/10.5194/egusphere-egu26-11313, 2026.

Patterns of seawater intrusion (SWI) over most of the coastal aquifers in Lebanon have been noticed since more than 5 decades. This hazard is now assessed over the entire Lebanese coast through field measurements and sampling of available groundwater resources. The results show elevated salt content present in several zones and ongoing salinization to variable extents in others. Porous non-consolidated aquifers show the most permanent and growing patterns of SWI along the coast, while fractured and karstic aquifers appear to be more resistant to the intrusion spread. Comparison with previous SWI studies confirms early salinization signs detected at several points of the coast, and well-established salinization over the recent years in many other coastal zones.

The largest impact on SWI comes from a mix of anthropogenic factors essentially related to urbanization including change in land use, modification of natural flow, along with growth in excessive groundwater abstractions related to a failing water-resources development and management. For example, flood control and land management plans of two major coastal rivers implemented since the 1960s are now associated with two of the sharpest SWI patterns of the entire coast. Climate-related and other natural SWI drivers do not appear to play important roles in the observed coastal groundwater salinization so far. However, integrated water resources management covering the entire watersheds of coastal river basins and aquifers is needed to forecast and mitigate longer term climatic effects especially those related to the snowmelt driven recharge of more inland aquifers and the availability of water resources outside the coastal aquifer areas. Mitigating SWI hazard at national scale requires 1) appropriate policy for water resources management to be adopted at national governmental level, 2) continuous awareness and education campaigns on water resources and water use, 3) implementing a monitoring plan for groundwater quality in all coastal aquifers and 4) undertaking detail hydrogeological studies in key coastal areas to better understand the mechanisms and amplitude of seawater intrusion.      

Reference: Ata Elias, Wisam M. Khadra & Michel A. Majdalani (2025) Saltwater intrusion in coastal Lebanon: evolution of patterns, and database for groundwater quality monitoring and management, Hydrological Sciences Journal, 70:6, 975-993, DOI: 10.1080/02626667.2025.2468839

How to cite: Elias, A. R.: Seawater Intrusion in the Coastal Aquifers of Lebanon: the Importance of Reducing the Anthropogenic Factors., EGU General Assembly 2026, Vienna, Austria, 3–8 May 2026, EGU26-11684, https://doi.org/10.5194/egusphere-egu26-11684, 2026.

EGU26-13458 | Orals | HS8.2.4

Beyond the Coastline: The Role of Offshore Data in Understanding Coastal Aquifers 

Albert Folch, Jose Tur, Bella Almillategui, Jiangyue Jin, Marc Diego-Feliu, Valentí Rodellas, Manel Grifoll, Manuel Espino, Daniel Fernàndez-Garcia, Juanjo Ledo, and Jesús Carrera

 Traditionally coastal aquifers have been monitored and modelled by restricting the spatial extent of observations and simulations to the inland portion of the aquifer. As a result, most hydrogeological studies and numerical models focus on the terrestrial part of the system, assuming that the key marine processes affecting hydrogeological dynamics are adequately captured at the coastline interface. However, important hydrological processes take place offshore, and may significantly influence the inland aquifer behaviour.

Offshore processes such as tides, sea storms, and even groundwater discharge can generate rapid variations in pressure and salinity in the submerged part of coastal aquifers. These processes operate at temporal scales typically shorter than those governing inland groundwater flow, which is mainly controlled by seasonal fluctuations. Consequently, aquifer dynamics and behaviour may not be fully captured when observations are limited to the terrestrial domain.

In this contribution, we show how offshore monitoring data, such as salinity measurements or geophysical observations can improve the understanding of inland aquifer behaviour. Offshore data provide direct information on marine-driven dynamics that cannot be inferred from inland observations alone and help to better constrain the conceptualisation of coastal aquifer systems.

We further demonstrate that integrating offshore observations into hydrogeological numerical models improves their representativity and ability to reproduce observed inland aquifer responses, including seawater intrusion dynamics. This integrated terrestrial–offshore perspective is particularly relevant for improving the assessment and management of coastal aquifers, including seawater intrusion and submarine groundwater discharge.

Aknowledgements: This research has been supported by the project MUCHOGUSTO (PID2022-140862OB-C21 and PID2022-140862OB-C22 funded by MCIN/AEI/10.13039/501100011033/ and “FEDER Una manera de hacer Europa”) anf SecuCoast financed for the European Commission and Spanish Research Council (AEI)  under the 2023 Joint call of the European Partnership 101060874 — Water4All.

How to cite: Folch, A., Tur, J., Almillategui, B., Jin, J., Diego-Feliu, M., Rodellas, V., Grifoll, M., Espino, M., Fernàndez-Garcia, D., Ledo, J., and Carrera, J.: Beyond the Coastline: The Role of Offshore Data in Understanding Coastal Aquifers, EGU General Assembly 2026, Vienna, Austria, 3–8 May 2026, EGU26-13458, https://doi.org/10.5194/egusphere-egu26-13458, 2026.

Sustaining groundwater resources in coastal and island aquifers is increasingly challenged by seawater intrusion driven by groundwater abstraction, land-use change, and climate-related shifts in recharge. Freshwater lenses are particularly vulnerable, and their response is strongly conditioned by subsurface heterogeneity, although many conceptual and analytical approaches still assume homogeneous conditions. The role of layered heterogeneity in controlling freshwater-lens development and saltwater upconing is investigated through an integrated framework combining controlled laboratory experiments, density-dependent numerical modelling with FEFLOW, and comparisons with classical analytical solutions.

Sandbox experiments are conducted under homogeneous and stratified configurations to examine lens evolution under steady recharge and during pumping. The heterogeneous setting, characterized by contrasts in vertical hydraulic conductivity, markedly altered lens geometry by reducing its maximum thickness, laterally extending the mixing zone, and promoting preferential flow pathways. Numerical simulations successfully reproduced the observed system behavior and enabled further exploration of pumping scenarios beyond the limitations of the physical model.

Results indicate that stratification accelerates and intensifies saltwater upconing, effectively lowering sustainable pumping rates and increasing vulnerability to salinization under human impacts. Analytical solutions are shown to overestimate lens stability and delay the predicted onset of upconing in layered systems, highlighting limitations when applied to heterogeneous coastal aquifers.

The findings provide quantitative evidence that layered heterogeneity exerts a first-order control on seawater-intrusion dynamics relevant to integrated water resources management. The combined physical–numerical approach supports improved assessment of pumping sustainability, monitoring design, and adaptation strategies to enhance resilience to salinization under changing climate and extraction pressures.

How to cite: Tinjacá, N., Rodrigo-Ilarri, J., and Rodrigo-Clavero, M. E.: Influence of layered heterogeneity on freshwater lens development and seawater upconing in island aquifers: insights from integrated physical and numerical modelling., EGU General Assembly 2026, Vienna, Austria, 3–8 May 2026, EGU26-13477, https://doi.org/10.5194/egusphere-egu26-13477, 2026.

EGU26-14580 | ECS | Orals | HS8.2.4

Influence of ocean tides and atmospheric pressure on a coastal karstic aquifer 

Citlali Salas-Barrena, Ismael Mariño-Tapia, Iris Neri-Flores, Eric Morales-Casique, and Tihui Núñez-Fernández

In coastal aquifers, one of the most common processes is seawater intrusion, which is the incursion of seawater towards the continent, displacing and mixing with the fresh groundwater, causing multiple difficulties in drinking and agricultural coastal water supply systems.

In the peninsula of Yucatán, a karstic platform in the southeast of Mexico, seawater intrusion is frequently found along the coast. However, the extension of the saline water mass is still undetermined as well as its temporal variations. Particularly, the lack of deep (> 100 m) sampling sites in the central and western part of the peninsula, hinders a general understanding of the groundwater system dynamics.

Sea level is one of the main drivers of seawater intrusion, therefore, by analyzing the effect of tidal oscillations on groundwater levels a better understanding of the aquifer connectivity and seawater intrusion can be achieved.

In previous studies, tidal oscillation analysis in lakes and sinkholes water levels have suggested that the central region of Yucatán is heavily connected to the sea. This has been explained by the high porosity and fracturing of the local lithology. Nevertheless, the geological settings in the peninsula are exceptionally variable, which is the result of many karstic processes involved and the existence of the Chicxulub crater.

In the present contribution, groundwater levels were measured in different wells and sinkholes from the coast across the west Yucatán through the Ring of Cenotes (a highly hydrogeological connected area) and its surroundings. We compare the groundwater signals to atmospheric pressure and sea level time series, by performing cross spectral analysis and coherence tests. Sea level measurements were collected from the National Mareograph Service, and the atmospheric pressure was registered by the National Meteorological Service.

The data show a similar response in all the sites: a very clear tidal effect on groundwater levels near the coast (10 km from the beach at Celestún), which is strongly attenuated inland and absent inside the Ring of Cenotes. On the other hand, the cross spectra between groundwater level and barometric pressure, suggests a strong influence at diurnal, semidiurnal (similar frequencies to tidal oscillations) and low frequencies at all sites. In other words, there is a major influence on the groundwater levels in the aquifer produced by the atmospheric variations. These results suggest that the link between the ocean and the groundwater in this area is relevant close to shore, but not as relevant inland as was previously suggested. This opens more inquiries about the complexity of the geological settings, the extension and temporal variability of the seawater intrusion in the zone, and the implications of the atmospheric variations in the groundwater flow pattern.

How to cite: Salas-Barrena, C., Mariño-Tapia, I., Neri-Flores, I., Morales-Casique, E., and Núñez-Fernández, T.: Influence of ocean tides and atmospheric pressure on a coastal karstic aquifer, EGU General Assembly 2026, Vienna, Austria, 3–8 May 2026, EGU26-14580, https://doi.org/10.5194/egusphere-egu26-14580, 2026.

Coastal agriculture is increasingly affected by salinization as sea-level rise, subsidence, river regulation, and water withdrawals combine with more frequent drought and heat extremes. In recent years, a key advance has been the ability to link seawater intrusion (SWI) to crop impacts by integrating satellite observations with targeted field measurements.

At the global scale, cropland distribution and low-elevation coastal metrics reveal a clear mismatch between where impacts are reported and where exposure is likely. Documented hotspots include the Mediterranean, South and South-East Asia, and the Bohai Sea region, while extensive low-lying coastal croplands remain weakly monitored. A screening based on coastal proximity and elevation indicates ~87 Mha of cropland potentially vulnerable to SWI-related salinization (Ghirardelli et al. 2025). This estimate is useful to guide monitoring and prioritization. The global synthesis also highlights recurring combinations of drivers—drought and low flows, pumping, subsidence, and saline surface-water incursions—that promote salt accumulation in soils.

At the regional scale, results from the Po River Delta (Italy) illustrate how drought can trigger rapid salinity increases and measurable crop impacts (Luo et al. 2024). Sentinel-2 time series of vegetation greenness and salinization-sensitive spectral information, interpreted alongside measurements of soil electrical conductivity and moisture, provide spatially explicit identification of vulnerable areas and seasons. This approach supports early warning during extreme dry summers and provides benchmarks to evaluate management actions.

Mitigation is moving from single measures to combined strategies. Current evidence supports integrated portfolios that couple nature-based buffers (e.g., wetlands/mangroves that limit saline intrusion while sustaining ecosystem services) with water and soil management (rainwater harvesting and storage, efficient irrigation including precision and subsurface drip systems, and drainage improvement) and, where needed, salt-tolerant crops enabled by breeding and bioengineering (Tarolli et al. 2024).

Remaining challenges include: (1) AI-enabled prediction for short-term forecasting and early warning, especially during drought and low-discharge periods; (2) process-coupled models that translate seawater intrusion into root-zone salinity, including irrigation water quality, evaporaton-driven salt concentration, capillary rise, and drainage; (3) stronger monitoring with denser networks and higher-frequency data, integrating in situ salinity/EC measurements with remote sensing; (4) a practical management protocol for coastal agriculture linking observations to irrigation, drainage, and water allocation decisions; and (5) progress in salt-tolerant crops (breeding and bioengineering), tested and deployed together with soil–water management under real coastal conditions.

References

  • Ghirardelli et. al. (2025). Environmental Research Letters, doi:10.1088/1748-9326/ad9bcd.
  • Luo et al. (2024). International Soil and Water Conservation Research, doi:10.1016/j.iswcr.2023.09.009.
  • Tarolli et al. (2024). iScience, doi:10.1016/j.isci.2024.108830.

How to cite: Tarolli, P.: Seawater Intrusion and Soil Salinization in Coastal Agriculture: Global Hotspots, Remote-Sensing Evidence, and Mitigation Pathways, EGU General Assembly 2026, Vienna, Austria, 3–8 May 2026, EGU26-14654, https://doi.org/10.5194/egusphere-egu26-14654, 2026.

EGU26-14954 | Posters on site | HS8.2.4

Mitigating groundwater storage depletion and seawater intrusion through treated wastewater reuse and aquifer recharge in a Mediterranean coastal aquifer 

Rudy Rossetto, Giacomo Vescovo, Chiara Cappadonia, Edoardo Rotigliano, Federica Lo Medico, Marcella Perricone, Eustachio Fontana, Roberto Alia, and Antonino Granata

Prolonged droughts combined with intensive groundwater abstraction can lead to severe aquifer depletion and degradation of water quality, especially in coastal settings prone to seawater intrusion. We investigated groundwater storage depletion and salinization in the Marsala–Mazara del Vallo coastal aquifer, southwestern Sicily (Italy), during the recent drought period from January 2024 to May 2025, with a cumulate precipitation of approximately 600 mm, well below long-term average. Furthermore, we evaluated the impact of having in place two managed aquifer recharge schemes infiltrating tertiary treated wastewater during the winter time along with that of using the reclaimed water in the irrigation season.

A density-dependent groundwater flow and solute transport model was developed using the SEAWAT code, integrated within the FREEWAT-Q3 platform. The model couples groundwater flow with chloride transport to simulate seawater intrusion under transient pumping conditions. We calibrated the model using observed groundwater heads and electrical conductivity data (transformed in chloride concentrations). The implemented model includes meteoric recharge, river–aquifer interactions, coastal wetlands, and extensive groundwater abstractions for drinking water and irrigation purposes.

Results show reduced recharge and sustained pumping during drought significantly depleted groundwater storage, reverse hydraulic gradients, and enhance inland migration of saline water, particularly in low-lying sectors of the coastal aquifer. Measured electrical conductivity trends and simulated chloride distributions confirm progressive seawater encroachment, particularly along the coastline and in heavily pumped areas. Conjunctive simulation of tertiary  treated wastewater reuse for irrigation, substituting groundwater, and recharging the aquifer using such reclaimed water, when not used for irrigation, demonstrates non-conventional water resources may alleviate the impact of drought periods.

Overall, our simulation results underline the need for drought-adapted groundwater management strategies, including seasonal pumping regulation, use of non conventional waters, and continuous monitoring of groundwater levels and salinity.

How to cite: Rossetto, R., Vescovo, G., Cappadonia, C., Rotigliano, E., Lo Medico, F., Perricone, M., Fontana, E., Alia, R., and Granata, A.: Mitigating groundwater storage depletion and seawater intrusion through treated wastewater reuse and aquifer recharge in a Mediterranean coastal aquifer, EGU General Assembly 2026, Vienna, Austria, 3–8 May 2026, EGU26-14954, https://doi.org/10.5194/egusphere-egu26-14954, 2026.

EGU26-16171 | Orals | HS8.2.4

Data-Driven Assessment of Seawater Intrusion and Salinization in Coastal Aquifers under Climate and Human Pressures 

Jürgen Mahlknecht, Juan Antonio Torres-Martinez, and Abrahan Mora

Coastal aquifers are critical freshwater resources that are increasingly threatened by seawater intrusion driven by the combined impacts of climate change and intensive human activities. The introduction of harmful substances, rising sea levels and groundwater overextraction increase salinization processes. Coastal Groundwater contamination is a complex environmental challenge that requires robust, scalable tools for reliable assessment and prediction. This talk presents recent advances in data-driven approaches for groundwater contamination analysis, with a particular focus on the application of probabilistic, supervised and unsupervised learning techniques in coastal aquifer systems. Drawing on case studies from arid to semi-arid regions of Mexico and Peru, the presentation demonstrates how Bayesian networks, clustering algorithms and random forest models can be applied to multi-parameter hydrogeological and hydrochemical datasets to identify sources of salinization and improve the characterization of seawater intrusion processes. These approaches have proven effective in handling data scarcity and uncertainty. By incorporating artificial intelligence and probabilistic frameworks into hydrogeological assessments, the proposed methods enhance contaminant source identification, support the development of early-warning tools, and enable more informed decision-making. The talk concludes with recommendations for advancing groundwater sustainability through interdisciplinary, data-driven strategies.

How to cite: Mahlknecht, J., Torres-Martinez, J. A., and Mora, A.: Data-Driven Assessment of Seawater Intrusion and Salinization in Coastal Aquifers under Climate and Human Pressures, EGU General Assembly 2026, Vienna, Austria, 3–8 May 2026, EGU26-16171, https://doi.org/10.5194/egusphere-egu26-16171, 2026.

EGU26-17440 | Orals | HS8.2.4

Effects of sea-level rise on fresh groundwater resources in coastal dune areas – a case-study in the Netherlands 

Gualbert H.P. Oude Essink and Guilherme E.H. Nogueira

Worldwide, sandy coastal dune systems form a substantial part of the global shoreline. Global assessments show that approximately one-third of the world’s ice-free coastline consists of sandy beaches, many of which host coastal dune systems with fresh groundwater lenses that are crucial for drinking water supply and ecosystem functioning. These fresh groundwater resources are increasingly exposed to saltwater intrusion driven by intensified human water use, land subsidence, and sea-level rise and changes in recharge. These processes make them highly relevant case studies for integrated water resources management in coastal aquifers.

In this study, we quantify the response of fresh groundwater lenses in coastal dune systems to sea-level rise and human pressures, using the Netherlands as a well-monitored and modelled example. We apply a high-resolution 3D variable-density groundwater flow and salt transport model (iMOD-WQ which is similar to SEAWAT), calibrated against observed hydraulic heads and salinity distributions, to simulate present and future conditions. Scenario simulations include sea-level rise of 0.5 m and 1.0 m by 2100, and an extreme scenario of 3.0 m by 2150, combined with land subsidence, climate-induced changes in recharge, and ongoing groundwater extractions for domestic use.

The simulations explicitly resolve key seawater intrusion processes such as lateral saline groundwater intrusion, saline upconing under extraction wells, shifts in groundwater divides, and storm-driven saline inundation. Results indicate that under moderate sea-level rise scenarios, fresh groundwater lenses in dune systems remain relatively in a relative sense, largely due to sufficient recharge from managed aquifer recharge (MAR) practices that maintain hydraulic gradients. However, absolute freshwater volumes decline gradually, and localized risks of salinization increase near production wells. Under the extreme sea-level rise scenario of 3.0 m by 2150, several low-lying dune systems show pronounced freshwater volume losses and increased vulnerability to saltwater intrusion.

Our results demonstrate that coastal dune aquifers can be resilient to sea-level rise when supported by integrated management strategies, but also reveal clear thresholds beyond which freshwater availability rapidly deteriorates. We illustrate that high-resolution modelling can inform sustainable management of coastal aquifers worldwide under a changing climate with increasing human pressures.

How to cite: Oude Essink, G. H. P. and Nogueira, G. E. H.: Effects of sea-level rise on fresh groundwater resources in coastal dune areas – a case-study in the Netherlands, EGU General Assembly 2026, Vienna, Austria, 3–8 May 2026, EGU26-17440, https://doi.org/10.5194/egusphere-egu26-17440, 2026.

EGU26-17539 | ECS | Posters on site | HS8.2.4

Drainage management strategies to sustain shallow freshwater resources for crop growth in saline coastal polders 

Fatima-Ezzahra Riakhi, Mark Bakker, Edo Abraham, and Boris M. van Breukelen

Coastal low-lying agricultural areas are threatened by groundwater salinisation due to saline groundwater upconing and seawater intrusion, which can be amplified by climate change-driven sea-level rise and drainage practices. In Dutch coastal polders, such as those on the island of Texel, rainfall is the only source of freshwater for agriculture, forming shallow rainwater lenses that support crop growth. Under conventional freely discharging drainage systems, rainfall-derived freshwater is rapidly removed, reducing freshwater retention in the shallow subsurface and enhancing saline upconing. As ditch water is often brackish and alternative freshwater sources are unavailable, thinning or loss of rainwater lenses poses a serious risk of root-zone salinisation and freshwater stress for crops.

Level-controlled drainage and subsurface irrigation are promising approaches to address these challenges. In this work, we use numerical modelling to evaluate how level-controlled drainage influences freshwater availability for crop growth in comparison to conventional drainage. Level-controlled drainage systems are designed to retain excess rainfall during autumn and winter by limiting outflow, thereby enhancing freshwater storage in the shallow subsurface, while still allowing controlled discharge of surplus water to drainage ditches. During spring and summer, the system can be actively managed to use for subsurface irrigation, providing supplemental water to crops using an external water supply.

The level-controlled drainage concept with subsurface irrigation is evaluated within the framework of the AGRICOAST project, which aims to enhance freshwater availability and promote efficient water use in saline-prone coastal regions. While previous numerical studies primarily focused on saturated flow conditions, this study advances current understanding by explicitly accounting for variably saturated, density-driven groundwater flow and solute transport processes relevant to root-zone conditions. We simulate a hypothetical representative case for the island of Texel, exploring system performance under a range of hydrogeological settings, climatic conditions, and drainage configurations. Crop growth parameters are incorporated to better represent seasonal water demands and root-zone dynamics. Through scenario analysis, we assess the impacts of weather variability and salinity dynamics on freshwater availability and root-zone salinity, and evaluate the effectiveness of level-controlled drainage in mitigating salinization risks. The results demonstrate the potential of level-controlled drainage as a sustainable water management strategy to support freshwater availability for coastal agriculture under changing environmental conditions.

How to cite: Riakhi, F.-E., Bakker, M., Abraham, E., and van Breukelen, B. M.: Drainage management strategies to sustain shallow freshwater resources for crop growth in saline coastal polders, EGU General Assembly 2026, Vienna, Austria, 3–8 May 2026, EGU26-17539, https://doi.org/10.5194/egusphere-egu26-17539, 2026.

EGU26-17728 | ECS | Orals | HS8.2.4

Influence of inland boundary conditions on coastal aquifer response to sea-level rise 

Rajagopal Sadhasivam and Venkatraman Srinivasan

Climate change-induced sea level rise (SLR) is widely perceived as one of the main reasons for increased saltwater intrusion (SWI) in coastal aquifers. However, past research using analytical and numerical models that predict the effects of SLR in coastal aquifers shows contrasting SWI responses depending on the choice of inland freshwater boundary conditions. While simulations employing a head-controlled (HC) freshwater boundary condition show considerable additional SWI, those that use a flux-controlled (FC) freshwater boundary condition show negligible additional SWI. Both confined and unconfined aquifers exhibit this contrasting behaviour; however, the difference is more pronounced in confined aquifers, which show no additional SWI under FC conditions. Past research has identified that FC systems limit additional SWI through a natural ‘head-lift’ effect wherein inland freshwater heads rise in proportion to SLR. The current understanding of the mechanism that explains the enhanced SWI response observed under HC conditions is the decrease in the hydraulic gradient between the two boundaries. However, decrease in the hydraulic gradient will induce a decline in the freshwater flux through the coastal aquifer. The hydrological ramifications of this boundary condition have not been sufficiently explored. Here we perform laboratory-scale physical experiments, and computational numerical simulations using the SEAWAT model to i) show that HC systems enhance SWI through a ‘flux-decline’ effect which reduces upstream freshwater boundary flux in response to SLR. Consequently, regional groundwater fluxes decrease, altering the aquifer system’s overall water balance. On the other hand, FC systems maintain the freshwater boundary fluxes and do not suffer from this effect. However, the head-lift effect in FC systems can lead to flooding in low-lying areas where the aquifer extent is constrained by topography. This study provides a comprehensive assessment of the mechanisms driving SWI and highlights the broader hydrological consequences of selecting different inland boundary conditions when evaluating the impacts of SLR.

How to cite: Sadhasivam, R. and Srinivasan, V.: Influence of inland boundary conditions on coastal aquifer response to sea-level rise, EGU General Assembly 2026, Vienna, Austria, 3–8 May 2026, EGU26-17728, https://doi.org/10.5194/egusphere-egu26-17728, 2026.

EGU26-17937 | Posters on site | HS8.2.4

Seawater Intrusion Mitigation Through Nature-Based Solutions: A Comparative Study of Mazara (Italy) and Cap Bon (Tunisia) Aquifers 

Iolanda Borzì, Chiara Cappadonia, Anis Chekirbane, Stefania Lanza, Khaoula Khemiri, Edoardo Rotigliano, and Giovanni Randazzo

Seawater intrusion threatens coastal aquifers across the Mediterranean, where climate change and human pressures combine to undermine freshwater availability. The Mazara aquifer in Trapani (Sicily) and the Cap Bon coastal aquifer (Tunisia) exemplify this challenge: both experience progressive salinization as a consequence of groundwater overexploitation due to intensive irrigation, urban expansion and sea-level rise, amplified by semi-arid conditions and permeable coastal geology that facilitates saltwater migration inland.

The Sal-ACT project compares these two systems to understand shared drivers and site-specific differences in salinization processes and management responses. We combine field investigations, telemetered monitoring networks and hydrogeochemical modeling to characterize how seawater intrusion evolves spatially and temporally in each aquifer. Variable-density groundwater flow models then simulate different scenarios and test mitigation strategies under current and future climatic conditions.

A key innovation is the focus on nature-based solutions, particularly Managed Aquifer Recharge (MAR), as a sustainable alternative to energy-intensive desalination. MAR uses treated water to artificially replenish aquifers, diluting saline groundwater and increasing storage capacity while minimizing environmental impacts. Our comparative design explicitly addresses hydrogeological feasibility, water quality compatibility and potential risks from emerging contaminants, building on prior regional research on wastewater reuse. At the same time, beyond technical analysis, the project engages water authorities, farmers and local communities through participatory workshops to co-design context-appropriate solutions and strengthen adaptive governance.

This cross-border study is conducted within the Interreg Italy–Tunisia project Sal-ACT "Sea Water Intrusion mitigation in Tunisian and Sicilian coastal aquifers through innovative and green solutions", which aims to improve groundwater availability and quality in Cap Bon and Trapani through integrated monitoring, modeling, stakeholder engagement and nature-based mitigation measures.

How to cite: Borzì, I., Cappadonia, C., Chekirbane, A., Lanza, S., Khemiri, K., Rotigliano, E., and Randazzo, G.: Seawater Intrusion Mitigation Through Nature-Based Solutions: A Comparative Study of Mazara (Italy) and Cap Bon (Tunisia) Aquifers, EGU General Assembly 2026, Vienna, Austria, 3–8 May 2026, EGU26-17937, https://doi.org/10.5194/egusphere-egu26-17937, 2026.

EGU26-19015 | Posters on site | HS8.2.4

Hydrogeological assessment of Soil Aquifer Treatment-MAR: linking vadose zone processes to coastal groundwater recovery 

Anis Chekirbane, Fatma Ezzahra Slimani, Khaoula Khemiri, Jana Glass, Catalin Stefan, Dario Autovino, and Massimo Iovino

Soil Aquifer Treatment-Managed Aquifer Recharge (SAT-MAR) using treated wastewater offers a promising option to enhance groundwater resources in climate-stressed Mediterranean coastal aquifers, yet its performance strongly depends on the poorly known behavior of the vadose zone. This study develops an integrated hydrogeophysical framework to characterize and model SAT-MAR functioning at the Korba coastal site (Chiba watershed, Cap Bon, Tunisia), where secondary treated wastewater is infiltrated through three basins to support a heavily overexploited aquifer threatened by long-term drawdown and seawater intrusion. Electrical Resistivity Tomography (ERT) and Time Domain Electromagnetics (TDEM) were used to image the shallow subsurface, revealing a vertically structured sequence of fine sand overlying more resistive sandstone or coarse sand that controls infiltration pathways, storage, and potential preferential flow. Soil sampling, hydraulic conductivity tests, and laboratory analyses were combined with geophysical results to parameterize an unsaturated flow model (Hydrus) beneath a 50 × 30 m basin, showing that treated wastewater requires on the order of 30 hours to traverse the approximately 20 m thick vadose zone, providing significant residence time for filtration and biogeochemical attenuation before reaching the water table. Regional groundwater responses to different recharge configurations were then evaluated with a MODFLOW model of the shallow aquifer, indicating that increased SAT-MAR recharge at Korba and replicated sites produces measurable recovery of hydraulic heads in depressed areas while contributing to stabilization of the coastal gradient. By explicitly linking geophysically derived vadose zone architecture, unsaturated flow dynamics, and saturated aquifer behavior, this work demonstrates how hydrogeophysical integration improves process understanding and supports the design and scaling of SAT-MAR schemes aimed at coastal groundwater recovery under global change.

How to cite: Chekirbane, A., Slimani, F. E., Khemiri, K., Glass, J., Stefan, C., Autovino, D., and Iovino, M.: Hydrogeological assessment of Soil Aquifer Treatment-MAR: linking vadose zone processes to coastal groundwater recovery, EGU General Assembly 2026, Vienna, Austria, 3–8 May 2026, EGU26-19015, https://doi.org/10.5194/egusphere-egu26-19015, 2026.

EGU26-19056 | Orals | HS8.2.4

Impacts of tropical cyclone induced storm surges on water resources in coastal Bangladesh and implications for population health 

Adrian Butler, ChiSan Tsai, Mohammad Hoque, Aneire Khan, Paolo Vineis, Eurydice Costopoulos, and Kazi Matin Ahmed

Major land reclamation using polders took place along the southern coastal area of Bangladesh during the mid‑20th century. These polders, located in the Ganges–Brahmaputra–Meghna Delta, are protected by earth embankments approximately 2 metres high. While the embankments restrict tidal ingress of saline water, they can be breached or overtopped by storm surges produced by tropical cyclones in the Bay of Bengal. These surges, in turn, cause large volumes of saline water to enter and remain trapped within the polders, adversely affecting both shallow groundwater and surface water sources. Many communities continue to rely on these sources for drinking water despite sodium concentrations exceeding 200 mgNa/L. Epidemiological studies have linked long‑term exposure to such levels with adverse cardiovascular, renal, and pregnancy‑related health outcomes. Enhanced ocean warming due to climate change is expected to result in more frequent and intense tropical cyclones and associated storm surges. Consequently, there is a need for improved understanding of the impacts of, and recovery from, such storm‑surge events to support long‑term adaptation and improved health outcomes. This, however, is challenging due to the combined and interacting nature of surface‑water and groundwater processes.

To address these challenges, the hydrodynamic and salinity responses of a low‑lying coastal aquifer in Dacope, southwestern Bangladesh, were investigated using two‑dimensional (2D) and three‑dimensional (3D) numerical models developed in HydroGeoSphere. Field observations and hydrogeological data were integrated to simulate surface‑water and groundwater responses under ambient and storm‑surge conditions. The 3D simulations revealed interacting mechanisms controlling both the persistence and spatial heterogeneity of storm‑surge‑induced salinization. Comparison with 2D simulations showed that omitting lateral storage and cross‑sectional flow leads to rapid surface drainage and systematic underestimation of near‑surface salt accumulation and recovery timescales. The results provide important insights into the long‑term impacts of storm‑surge inundation, the identification of salinity‑vulnerable zones, and contribute to a large‑scale joint UK–Bangladesh project on multi‑sectoral interventions aimed at improving access to low‑salinity drinking water for health protection in the coastal areas of Bangladesh.

How to cite: Butler, A., Tsai, C., Hoque, M., Khan, A., Vineis, P., Costopoulos, E., and Ahmed, K. M.: Impacts of tropical cyclone induced storm surges on water resources in coastal Bangladesh and implications for population health, EGU General Assembly 2026, Vienna, Austria, 3–8 May 2026, EGU26-19056, https://doi.org/10.5194/egusphere-egu26-19056, 2026.

EGU26-19195 | ECS | Posters on site | HS8.2.4

Scenario-based Analysis of Flood Mitigation and Agricultural Water Security in Estuary Dam Opening: A Case Study of the Geum River 

Chanjin Jeong, Yoon Seo Lee, Sung Jo Kim, and Seung Oh Lee

Estuary dams are vital for freshwater security and flood mitigation, yet rising demands for ecosystem restoration require a quantitative assessment of their opening. This study analyzes the hydrodynamic and hydrological impacts of various opening scenarios of the Geum River Estuary Dam on agricultural water security and flood mitigation. The SCHISM (Semi-implicit Cross-scale Hydroscience Integrated System Model) was configured for the study area and validated against observed data. The model demonstrated high reliability, with Nash-Sutcliffe Efficiency (NSE) values of 0.93–0.96 for tidal levels and 0.78–0.85 for water levels near the dam. Salinity transport was also accurately reproduced, showing a Percent Error (PE) of 0.51–0.66% and a Root Mean Square Error (RMSE) of 0.20–0.23 psu. The study evaluated three categories of scenarios: full opening (Scenario A), continuous partial opening (Scenario B-1), and intermittent opening (Scenarios B-2, C). Agricultural water security was assessed based on critical salinity thresholds for rice growth: 0.45 psu (no damage), 0.64 psu (initial damage), and 1.00 psu (yield reduction). Results indicated that Scenario A caused the most extensive saltwater intrusion, reaching 46.0 km upstream at the 0.45 psu threshold. Notably, while Scenario B-1 exhibited the shortest intrusion distance (15.0 km), it recorded the highest cumulative seawater inflow among the regulated opening scenarios. This discrepancy implies that relying solely on intrusion distance is insufficient for assessing agricultural water withdrawal risks. Consequently, this study suggests that a multi-faceted analytical framework, considering both intrusion distance and total inflow volume, is essential for establishing sustainable operation guidelines that balance flood mitigation with agricultural water standards.


How to cite: Jeong, C., Lee, Y. S., Kim, S. J., and Lee, S. O.: Scenario-based Analysis of Flood Mitigation and Agricultural Water Security in Estuary Dam Opening: A Case Study of the Geum River, EGU General Assembly 2026, Vienna, Austria, 3–8 May 2026, EGU26-19195, https://doi.org/10.5194/egusphere-egu26-19195, 2026.

EGU26-19851 | Orals | HS8.2.4

Factors driving varying salinity of a fresh water lens underneath a coastal barrier island 

Martin Thullner, Fabienne Doll, Maria Wetzel, Stefan Kunz, Karen Hüske, Stefan Broda, Tanja Liesch, and Georg Houben

Groundwater is often the only drinking water resource of many small marine islands. The fresh water lenses underneath these islands are highly restricted in their extent and vulnerable to salt water intrusion caused by groundwater extraction or other factors. An example is the barrier island of Langeoog located off the North German coast. The drinking water supply of this island is exclusively provided by groundwater extracted from its fresh water lens. Since several of the drinking water wells exhibit strong salinity variations, a long-term sustainable drinking water management requires knowledge of the factors driving these variations.

To identify the reasons for the salinity variations in the drinking water wells on Langeoog, long-term data series on chloride concentrations, groundwater and sea water levels, pumping activity, climate data, soil moisture and dune locations were analyzed for the period of 1993-2023.  Measured and from measurements derived data were investigated using time series analysis, multivariant regression and artificial intelligence approaches to determine the relevance of different driving factors for the observed salinity variations and the ability to predict such variations.

The results of the study show that individual drinking water wells differ not only in the magnitude of the salinity variations but also regarding the reasons for these variations. In general, the salinity in individual wells is not driven by the present conditions and their short term variability but reflects the response of the groundwater system to factors integrated over periods of several years. Relevant factors include the water balance of the well field (groundwater recharge vs. extraction) as well as the storm flood frequency and the associated variations in the location of barrier dunes. Without detectable influence on salinity are groundwater levels, sea water levels and the operation intensity of individual wells. A limited prediction of the salinity based on the entire set of collected data is possible for selected wells.

How to cite: Thullner, M., Doll, F., Wetzel, M., Kunz, S., Hüske, K., Broda, S., Liesch, T., and Houben, G.: Factors driving varying salinity of a fresh water lens underneath a coastal barrier island, EGU General Assembly 2026, Vienna, Austria, 3–8 May 2026, EGU26-19851, https://doi.org/10.5194/egusphere-egu26-19851, 2026.

EGU26-480 | ECS | Orals | HS8.2.6

Integrating "Endurance" into Groundwater Resilience: Quantifying the True Buffer Capacity of Aquifer Systems During Droughts 

Akhil Jnanadevan, Ishita Bhatnagar, and Chandrika Thulaseedharan Dhanya

Under escalating impacts of climate change, the frequency and intensity of hydroclimatic extremes, particularly prolonged droughts, pose a severe threat to global groundwater security. As aquifer systems serve as the primary buffer during droughts, accurately quantifying their resilience under unprecedented stress is essential for ensuring sustainable water availability and ecosystem stability. However, existing resilience methodologies are predominantly based on "Engineering Resilience", focusing strictly on the recovery rate of an aquifer after a disturbance. This approach leads to a misleading paradox: fractured, rocky aquifers are often characterised as "highly resilient" simply because they exhibit rapid hydraulic rebound compared to alluvial aquifers, despite their inability to sustain supply during the stress period itself. This recovery-centric view ignores the critical role of "Endurance" (Ecological Resilience), the qualitative capacity of a system to buffer shocks and resist state shifts during active drought events. To bridge this gap, this study proposes the Endurance-Recovery-Resilience (ERR) Framework. Our primary objective is to operationalize "Endurance" as a quantifiable metric alongside recovery, thereby capturing the "True Resilience" or buffer capacity of the aquifer system. The universal applicability of the ERR framework is evaluated through a comparative analysis of heterogeneous aquifer systems across two continental-scale domains: the Ganga River Basin (India) and major US Aquifer Systems. We contrast the drought response of extensive unconsolidated sedimentary basins (Gangetic Plain, High Plains, Central Valley) against fractured crystalline and basaltic aquifers (Bundelkhand/Vindhyan, Columbia Plateau, Piedmont) to test the framework's validity across diverse hydrogeological settings. The results reveal a fundamental divergence in system behavior. While rocky aquifers demonstrate high engineering resilience (rapid recovery), they exhibit critically low endurance, failing rapidly under drought stress. Conversely, alluvial systems demonstrate "True Buffering Capacity" (High Endurance), successfully maintaining hydraulic heads during extreme events, although they are prone to poor recovery trajectories during prolonged droughts. We conclude that resilience cannot be defined by recovery speed alone. By integrating Endurance, the ERR framework corrects the "rocky aquifer paradox," providing a robust tool for decision-makers to identify region-specific vulnerabilities. This highlights that water security strategies must differentiate between protecting the limited buffer of rocky systems and managing long-term depletion in high-endurance alluvial basins.

How to cite: Jnanadevan, A., Bhatnagar, I., and Dhanya, C. T.: Integrating "Endurance" into Groundwater Resilience: Quantifying the True Buffer Capacity of Aquifer Systems During Droughts, EGU General Assembly 2026, Vienna, Austria, 3–8 May 2026, EGU26-480, https://doi.org/10.5194/egusphere-egu26-480, 2026.

EGU26-1171 | ECS | Posters on site | HS8.2.6

Quantifying groundwater recovery after drought: a comparative modelling study in the Emilia-Romagna multi-layered aquifer system 

Ilaria Delfini, Daniel Zamrsky, and Alberto Montanari

Extreme hydroclimatic events are increasingly challenging groundwater security, especially in intensively exploited regions; yet, the recovery dynamics of aquifer systems after prolonged drought events remain poorly quantified. This study investigates the response and recovery times of the multi-layered aquifer system in Emilia-Romagna region (north-eastern Italy), one of the country’s most populated and productive areas. We analyze how climatic stressors and anthropogenic pressures shape groundwater head decline and post-drought rebound, comparing the results provided by a numerical groundwater flow model implemented in MODFLOW 6, and by a random forest algorithm.

Both models are calibrated over the years 2010-2018 to reproduce the historical evolution of groundwater heads across the regional aquifer system. A scenario analysis is then carried out from 2019 to 2050, imposing a set of drought conditions characterized by reductions in precipitation and varied groundwater abstractions. These scenarios represent short- and long- duration low-recharge periods with different levels of stress intensity, enabling a systematic exploration of aquifer system’s behaviour under combined climatic and anthropogenic forcing.

Groundwater recovery is assessed through the analysis of groundwater heads simulated by both modeling approaches. This study provides quantitative insights into the resilience of the regional multi-layered aquifer system to extreme hydroclimatic events and aims at clarifying the respective roles of climate variability and groundwater exploitation in shaping future groundwater security. In particular, the goals are to quantify (i) the mean recovery time following each drought scenario as a function of its duration and intensity, (ii) the relative contribution of abstraction changes to driving groundwater decline and delaying recovery, and (iii) the sensitivity of recovery times to different input variables. Finally, we aim to assess the extent to which the random forest algorithm can replicate the physics-based model under unseen future scenarios, identifying conditions in which data-driven approaches may complement or, in specific context, substitute numerical groundwater models.

Results show that recovery times are strongly dependent on the imposed precipitation reduction and are often markedly influenced by pumping regimes, which can exert a dominant control on the system. The random forest model accurately reproduces system dynamics under conditions similar to the calibration period but shows reduced reliability under extreme scenarios. Overall, the results highlight the need to carefully account for both climatic variability and human-driven pressures when evaluating future groundwater resilience, and underscore the value of integrating complementary modeling approaches to improve groundwater management strategies under increasing hydroclimatic uncertainty.

How to cite: Delfini, I., Zamrsky, D., and Montanari, A.: Quantifying groundwater recovery after drought: a comparative modelling study in the Emilia-Romagna multi-layered aquifer system, EGU General Assembly 2026, Vienna, Austria, 3–8 May 2026, EGU26-1171, https://doi.org/10.5194/egusphere-egu26-1171, 2026.

Given the changes in precipitation and evaporation over the past 60 years and the expectation that the climate will continue to change, it is to be expected that groundwater heads will change in such a way that land use, infrastructure, ecology and water availability will be strongly impacted if the current water management is continued.
In order to assess the impact, the response of the groundwater system to precipitation and evaporation needs to be determined. Challenges are the inclusion of slow responses and capturing extremes. Responses in the order of decades often are not considered in groundwater modelling due to calibration periods shorter than 10 years and the time scale of impacts to be simulated. Capturing the level of high extremes is important for e.g. groundwater flooding. Capturing the level and duration of low extremes is needed for water availability and subsidence.
A case study from the Netherlands will be presented in which predictions until 2100 are made based on the climate scenarios from the Royal Dutch Meteorological Institute (KNMI) in combination with weather data and measured groundwater heads from a polder area in Friesland.

How to cite: Zaadnoordijk, W.: Long term time series modelling of groundwater heads for assessment of climate change impact, EGU General Assembly 2026, Vienna, Austria, 3–8 May 2026, EGU26-1737, https://doi.org/10.5194/egusphere-egu26-1737, 2026.

EGU26-2335 | ECS | Orals | HS8.2.6

Drivers and consequences of changing groundwater dynamics in Arctic coastal systems 

Julia Guimond, Alina Spera, Elizabeth Elmstrom, Jacqueline Hung, Susan Natali, and James McClelland

Arctic hydrosystems are undergoing rapid change, driven by warming temperatures, shifting precipitation regimes, and increasing climate extremes. In Arctic coastal settings, these terrestrial and atmospheric pressures are compounded by ocean-driven change, including storm-surge inundation and saltwater intrusion that can introduce heat and solutes to tundra soils and near-surface aquifers. Despite the strong groundwater-surface water connectivity and pronounced seasonality that characterize cold-climate hydrosystems, we still lack a process-based understanding of how ocean variability interacts with coastal groundwater dynamics and the resulting ecohydrological and biogeochemical feedbacks.

Here we synthesize recent work from the Arctic Coastal Plain of Alaska that quantifies two-way interactions between ocean conditions (event to seasonal scales) and groundwater response, and links these dynamics to hydro-thermal and biogeochemical change. We combine year-round time series of groundwater and surface-water levels with multi-depth soil temperature profiles, electromagnetic surveys of subsurface electrical conductivity, and seasonal measurements of porewater chemistry and thaw depth across tundra environments spanning gradients in inundation frequency. Across sites, elevated porewater salinity and higher subsurface electrical conductivity were associated with vegetation degradation and thicker active layers. A year-long record of soil temperature profiles shows that inundation-driven shifts in vegetation and soil properties alter surface energy balance and increase soil thermal conductivity, yielding summer soil temperatures up to 10°C warmer than at undisturbed sites. These warming patterns cannot be explained by freezing-point depression alone, highlighting the importance of coupled ecological-hydrogeological-thermal feedbacks.

We further show that spatial variability in active layer thickness modifies surface-subsurface connectivity and water exchange, with implications for both saltwater intrusion pathways and the magnitude of coastal groundwater discharge. Our results demonstrate that coastal Arctic groundwater vulnerability emerges from interacting processes across hydrologic, thermal, and ecological domains, and that integrating geophysics, year-round monitoring, and porewater biogeochemistry is essential for anticipating how permafrost-bound coastlines will respond to continued warming and ocean change.

How to cite: Guimond, J., Spera, A., Elmstrom, E., Hung, J., Natali, S., and McClelland, J.: Drivers and consequences of changing groundwater dynamics in Arctic coastal systems, EGU General Assembly 2026, Vienna, Austria, 3–8 May 2026, EGU26-2335, https://doi.org/10.5194/egusphere-egu26-2335, 2026.

EGU26-6978 | ECS | Orals | HS8.2.6

Patterns and drivers of global groundwater drought recovery based on recovery regime classifications 

Sandra Margrit Hauswirth and Niko Wanders

Groundwater resources are under increasing pressure from both human and climatic drivers. Increasing water demands, driven by population growth, urbanisation, and agriculture, are intensifying groundwater abstractions and, at the same time, climate extremes such as prolonged droughts affect groundwater recharge. Given these pressures, it is important to understand if groundwater aquifers are resilient to increasing water demands and whether they can recover from future drought events, or whether they will reach critical tipping points.

Using the global groundwater model GLOBGM1,2, a physically based groundwater model with a 1km spatial resolution, we assess the spatial pattern of global groundwater drought recovery and its potential drivers. We defined drought periods over the entire simulation period 1960-2019 and gathered additional drought characteristics, including the rate of drought development and recovery, drought duration, and drought intensity. Using these characteristics, we assessed spatial groundwater drought recovery patterns worldwide, finding that the average drought recovery rate is highly variable, not only between regions but also within them. Globally, we have identified four groundwater drought recovery regimes: resilient, stable, vulnerable, or unstable. These regimes are then linked to climatological, societal and geophysical drivers that describe the spatial recovery pattern. We observe that, as expected, climatology plays a key role, however on the local scale geophysical parameters are linked to local recovery patterns and highlight differences in recovery behaviour. Locations in the unstable recovery regime (approximately 26%) show a higher number of drought events, where pre- and post- conditions play a strong role relative to the other regimes. Locations within the vulnerable regime (approximately 15%) differ in terms of geophysical parameters, such as topography and groundwater storage characteristics. Furthermore, strong climate signals in these regions affect drought characteristics, including lower drought frequency and longer duration. High numbers of events, combined with faster development and post conditions, as well as higher groundwater conductivities, are standing out for locations within the resilient regime (approximately 57%).

Using this new recovery regime classification and information on drought recovery drivers can help society to potentially improve groundwater resilience to future droughts, as well as identify regions where tipping points are either exceeded or close.

1) Verkaik, J., Sutanudjaja, E. H., Oude Essink, G. H. P., Lin, H. X., and Bierkens, M. F. P. (2024) : GLOBGM v1.0: a parallel implementation of a 30 arcsec PCR-GLOBWB-MODFLOW global-scale groundwater model, Geosci. Model Dev., 17, 275–300, https://doi.org/10.5194/gmd-17-275-2024
2) van Jaarsveld, B., Wanders, N., Otoo, N.G., Sutanudjaja, E.H., Verkaik, J. Zamrsky, D. and Bierkens, M.F.P: Global hyper-resolution groundwater dataset for assessing historical and future groundwater dynamics. Submitted, Preprint, https://doi.org/10.31223/X5QX7W


How to cite: Hauswirth, S. M. and Wanders, N.: Patterns and drivers of global groundwater drought recovery based on recovery regime classifications, EGU General Assembly 2026, Vienna, Austria, 3–8 May 2026, EGU26-6978, https://doi.org/10.5194/egusphere-egu26-6978, 2026.

The Ningnan region, located in the Jinsha River hot-dry valley of southwest China, faces severe groundwater scarcity and declining water levels, threatening local production and daily life. This study investigates the drought characteristics and mechanisms of groundwater resources under the combined impacts of climate change and tunnel construction, addressing the limitation of traditional single-factor assessments.

Field surveys, remote sensing interpretation, hydrochemical and isotopic analyses were conducted to clarify groundwater occurrence, recharge-discharge processes, and karst development. Climate data statistics, NDVI-based vegetation coverage analysis, and analytical calculations were used to quantify the impacts of these factors. A 3D "climate-groundwater-tunnel" coupled seepage model (Visual MODFLOW) was established to simulate the evolution of the seepage field.

Key findings: (1) Groundwater is dominated by carbonate karst water, with atmospheric precipitation as the primary recharge source. (2) Annual precipitation decreased by 46.17% from 2020 to 2023, while vegetation coverage (exceeding 50%) dropped by 16.47% from 2019 to 2024. (3) Water inflow of the tunnel group ranged from 4537.47 to 63051.93 m³/d, with a maximum impact radius of up to 8806.98 m. (4) Numerical simulation showed that natural groundwater levels declined by 0.5–7.5 m due to drought; tunnel construction caused maximum drawdowns of 130 m (Ningnan Tunnel) and 200 m (Ningqiao Tunnel). (5) A survey of 47 typical points indicated that 66% experienced moderate to severe drought, 71.4% of which were jointly affected by tunnel drainage and reduced precipitation.

Conclusion: Groundwater drought within tunnel impact zones results from the combined effects of climate change and human activities, while areas outside the zones are mainly affected by climate change. This study provides a theoretical basis for groundwater protection and restoration in the Ningnan region.

How to cite: Zhang, Q., Wang, W., and Sun, J.: Drought Analysis of Groundwater Resources in the Ningnan Region Under the Combined Effects of Climate Change and Human Activities, EGU General Assembly 2026, Vienna, Austria, 3–8 May 2026, EGU26-7632, https://doi.org/10.5194/egusphere-egu26-7632, 2026.

EGU26-9106 | ECS | Posters on site | HS8.2.6

Effects of topography on soil salinity distribution under freeze-thaw processes 

Yue Li and Xiayang Yu

Soil salinity distribution in cold regions is often affected by freeze-thaw processes, yet the influence of surface topography on salt transport dynamics remains poorly understood. Based on a validated numerical model, we investigate the effects of topography on salinity distribution under freeze-thaw conditions. Results show that freeze-thaw processes on a flat surface induce unstable convective fingering. In contrast, ridge-furrow topography promotes the development of stable salt plumes that preferentially form beneath surface depressions. Compared to the flat surface, ridge-furrow topography significantly accelerates downward salt transport following the thawing phase. Further quantitative analysis reveals that increasing ridge height promotes deeper vertical descent of high-salinity plumes and enhances the downward migration of the centroid of salt mass. These findings provide critical insights for understanding subsurface salinity dynamics and optimizing soil management in cold regions.

How to cite: Li, Y. and Yu, X.: Effects of topography on soil salinity distribution under freeze-thaw processes, EGU General Assembly 2026, Vienna, Austria, 3–8 May 2026, EGU26-9106, https://doi.org/10.5194/egusphere-egu26-9106, 2026.

EGU26-9278 | ECS | Posters on site | HS8.2.6

Freeze-thaw processes influence soil water and salt migration in farmlands 

Huiwen Tian

As global extreme climates intensify, freeze-thaw dynamics in cold-region agricultural farmland have become increasingly complex, directly regulating soil water-heat-salt migration and salinization. While previous studies focused on 1-D vertical dynamics, 2-D processes remain unclear. Freezing induces water-salt movement from ditches to farmland, and the downward migration of meltwater elevates the groundwater table, thereby inducing drainage from farmland to ditches. Such asymmetric water-salt exchange, characterized by delayed responses to surface temperature, affects salt exclusion efficiency.This study used the SUTRA-MS-FT model to simulate freeze-thaw-affected farmland-ditch systems in salinized areas, exploring 2-D dynamics. Different desalination measures (varying salinity irrigation leaching and subsurface pipe drainage) were tested to analyze their sensitivity. The findings provide scientific support for water-salt regulation in cold-region farmlands.

How to cite: Tian, H.: Freeze-thaw processes influence soil water and salt migration in farmlands, EGU General Assembly 2026, Vienna, Austria, 3–8 May 2026, EGU26-9278, https://doi.org/10.5194/egusphere-egu26-9278, 2026.

Groundwater is a resilient resource that is vital for local water supplies and maintaining baseflow in rivers and streams, particularly during low flow periods. Due to global climate change, the occurrence of meteorological drought is increasing in both frequency and severity, causing or amplifying water scarcity events even in areas considered water rich, like Scotland. While groundwater is generally more resilient to drought than surface water sources, the specific impacts on the resilience of the resource is influenced by local hydrogeology, geography, and climate. To evaluate differences in groundwater response between sites and assess vulnerability and resilience at varying timescales, it is important have standardised parameters to evaluate.

The Standardised Groundwater Index (SGI) is a normalisation procedure that can be applied to groundwater level data from observation boreholes to compare drought response more easily between locations. To standardise groundwater data, typical methods use a specific probability distribution which is unlikely to represent variability over large, diverse regions across different seasons or empirical probabilities requiring large sample sizes. Here, in the transformation to standardised units, probability distributions are optimised using Akaike Information Criterion (AIC) to select the most appropriate distribution for each season at each location. Incorporating model fit statistics for each time and site reduces uncertainty in calculations, particularly at the tails of the distribution which is vital for drought studies.

Groundwater storage and memory is evaluated across 33 sites in Scotland through the autocorrelation function of the SGI time series and correlated with Standardised Precipitation Evapotranspiration Index (SPEI) to evaluate the time scale of groundwater drought propagation at each location and better characterise storage properties for aquifers of different lithologies and dominant flow types (e.g. intergranular, fractured). Autocorrelation lengths of less than 5 months are common in the fractured flow systems compared to lag periods of 9 months or greater in more highly transmissive aquifers likely dominated by intergranular flow.

Hierarchical cluster analysis of the SGI time series provides an added line of evidence to the differential response between hydrogeological units and to identify areas where local changes in geology, structure, or surface water connections could be influencing groundwater response. Characterisation of the groundwater drought response can reveal areas of greater groundwater resilience and provide water managers better metrics to assess the spatiotemporal controls of groundwater drought propagation, along with modelling the timing and magnitude of seasonal groundwater minima. 

How to cite: Johnson, B., Comte, J.-C., MacDonald, A., Soulsby, C., and Helliwell, R.: Characterising groundwater drought: Using standard indices and cluster analysis to quantify drought response and propagation across aquifer typology and identify areas of resilience, EGU General Assembly 2026, Vienna, Austria, 3–8 May 2026, EGU26-10286, https://doi.org/10.5194/egusphere-egu26-10286, 2026.

EGU26-10590 | ECS | Posters on site | HS8.2.6

Identifying controls on shallow groundwater levels in a lowland urban catchment: a scenario-based approach 

Jon Gulfeldt, Jacob Kidmose, and Torben Sonnenborg

Shallow groundwater levels in lowland catchments are highly sensitive to geological heterogeneity, climate variability and human activities. The town of Bylderup-Bov (southern Jutland, Denmark) is characterized by persistently high groundwater tables, especially in winter months, resulting in recurrent basement inundation and excessive inflow of groundwater into the wastewater system. After a major renovation of the sewer system in 2014-2016, groundwater intrusion into the sewer system remains substantial, leading to wastewater volumes up to five times higher than expected. 

This study investigates the controls on shallow groundwater dynamics in and around Bylderup-Bov using a catchment scale hydrological modelling approach evaluating the effects of different hydrogeological and anthropogenic factors. To do this, a suite of scenario simulations was used to quantify the effects of (i) local stream geometry, levels and resistance, (ii) drainage efficiency and depth, (iii) changes in groundwater recharge related to urban development, (iv) groundwater abstraction, (v) restoration of surrounding lowland peat areas, and (vi) projected climate change.

Model results show that drainage depth and drainage efficiency are the most influential parameters controlling groundwater levels within the urban area of Bylderup-Bov, lowering the groundwater table by up to 50 to 75 cm during critical winter periods. Stream depths affect groundwater levels by lowering levels up to 10 to -30 cm over large parts of the town, indicating strong lateral groundwater surface–water connectivity controlled by geological layering. In contrast, climate change scenarios based on three regional climate models indicate only modest increase in mean groundwater levels (+0 to +10 cm by 2071–2100), suggesting that recent groundwater rise is unlikely to be primarily climate-driven. Scenarios introducing enhanced groundwater recharge through local infiltration measures further exacerbate high groundwater conditions during already critical wet winter periods.

The findings demonstrate that shallow groundwater dynamics in the study area, are governed primarily by anthropogenic drainage and subsurface connectivity rather than climate change alone. Detailed urban hydrological modelling provides valuable insights for identifying effective mitigation strategies, avoid maladaptation, and supporting groundwater management under future climatic and land-use change.

How to cite: Gulfeldt, J., Kidmose, J., and Sonnenborg, T.: Identifying controls on shallow groundwater levels in a lowland urban catchment: a scenario-based approach, EGU General Assembly 2026, Vienna, Austria, 3–8 May 2026, EGU26-10590, https://doi.org/10.5194/egusphere-egu26-10590, 2026.

EGU26-11050 | ECS | Posters on site | HS8.2.6

Assessing 20th Century Climate Change Impacts on Surface–Groundwater Interactions in Southern Estonia, Northeastern Europe 

Annabel Eensoo, Marlen Hunt, and Joonas Pärn

Recent years have highlighted Europe’s increasing vulnerability to climate change through the rising frequency and severity of extreme hydrological events, such as droughts and floods. In addition, winter warming and gradual decline in snow cover depth and duration have occurred in northern Europe since the middle of the 20th century. These changes not only affect surface waters directly but also alter groundwater recharge patterns and disrupt the balance between surface and subsurface hydrological systems.

To support effective water resource management under future climate conditions, it is essential to understand how projected climatic changes will influence surface–groundwater interactions. However, predictions of future dynamics are not possible without first analysing how past and ongoing climate changes have already affected key components of the hydrological regime, including groundwater recharge, runoff generation, and their relative contributions to total flow.

In Estonia, this need is being addressed through the development of coupled surface–groundwater models in five pilot areas across the country, as part of the LIFE-SIP AdaptEST project. The overarching goal is to increase the readiness and adaptive capacity of regional and local authorities in Estonia to respond to the impacts of climate change.

The objective of this study was to assess the impact of climate change during the 20th century on surface–groundwater interactions in Southern Estonia. A hydrological model, PRMS (Precipitation-Runoff Modeling System), was applied to a small pilot catchment in Southern Estonia characterized by a high baseflow component and pronounced surface–groundwater interaction. The model was calibrated and validated for the period 1952–2017 using measured hydro-meteorological data. Model performance, evaluated using the Kling–Gupta efficiency, ranged between 0.56 and 0.77, indicating a satisfactory representation of hydrological processes and surface–groundwater interactions. The interpretation of the model results shows how changes in climatic parameters (air temperature, precipitation amounts) in the past have brought about parallel changes in river runoff regime (e.g. timing of low-flow and high-flow periods) as well as in baseflow and groundwater recharge. The results indicate that the applied surface water modelling approach provides a suitable basis for coupling with groundwater models and for future climate change impact assessments in Estonia.

This study has been funded by the project LIFE21-IPC-EE-LIFE-SIP AdaptEST/101069566 "Implementation of national climate change adaptation activities in Estonia”.

How to cite: Eensoo, A., Hunt, M., and Pärn, J.: Assessing 20th Century Climate Change Impacts on Surface–Groundwater Interactions in Southern Estonia, Northeastern Europe, EGU General Assembly 2026, Vienna, Austria, 3–8 May 2026, EGU26-11050, https://doi.org/10.5194/egusphere-egu26-11050, 2026.

EGU26-12152 | ECS | Orals | HS8.2.6

Climate Change Impacts on Groundwater Recharge in a Low-Mountain Area, Eskasoni First Nation, Nova Scotia, Canada. 

Julia Gillette, Ronald B. Strong, Allison McIsaac, Fred Baechler, Barret Kurylyk, and Lauren Somers

In cold regions, snowmelt is an important source of groundwater recharge and spring streamflow. However, in a warming climate the factors governing snowmelt recharge dynamics are expected to change. The amount and timing of groundwater recharge may be altered through changes in air temperature and soil ice content, and the shift from less snow towards more winter rain. While declining snowpacks have been linked to reduced summertime low flows, the impact of a precipitation phase shift on groundwater resources is not well understood. This study investigates whether snowmelt is more effective than rainfall at recharging groundwater under future climate conditions in the Christmas Brook watershed of Eskasoni First Nation, Nova Scotia, Canada (45°57′45″N,60°34′59″W), where the local community relies on groundwater as a potable water source.

We monitored hourly precipitation, snow depth, groundwater level, soil moisture and temperature, and streamflow across three landscape types at differing topographic positions. We used field observations to calibrate the Simultaneous Heat and Water (SHAW) model, a one-dimensional critical zone model that simulates coupled heat, water, and solute transport through canopy, snow, residue, and soil as well as the consideration of freeze-thaw processes. Simulations were run over historical, mid-century, and end-of-century periods to quantify differences in recharge between rain versus snow recharge events under climate change.

Preliminary results indicate snowmelt historically makes up a significant proportion of groundwater recharge. However, the region experiences recharge events year-round from a combination of snowmelt and rainfall. By the year 2100, the simulated snowpack depth declined 40% on average from historical observations. Additionally, the annual number of days with snow cover reduced to around one third of the historical count. Overall, evolutions in snow cover and melt patterns, as well as soil ice content, shifted recharge dynamics in the watershed. The results illustrate the complex mechanisms controlling groundwater recharge in cold regions and the utility of modelling to understand how decreases in snow and increases in rain will impact groundwater resources.

How to cite: Gillette, J., Strong, R. B., McIsaac, A., Baechler, F., Kurylyk, B., and Somers, L.: Climate Change Impacts on Groundwater Recharge in a Low-Mountain Area, Eskasoni First Nation, Nova Scotia, Canada., EGU General Assembly 2026, Vienna, Austria, 3–8 May 2026, EGU26-12152, https://doi.org/10.5194/egusphere-egu26-12152, 2026.

EGU26-15737 | Orals | HS8.2.6

Modeling Solute and Contaminant Transport in Permafrost Regions 

Jeffrey McKenzie, Ruta Basijokaite, Aaron Mohammed, and Selsey Stribling

Subarctic and Arctic regions are experiencing rapid warming that is accelerating permafrost thaw and altering groundwater systems, with implications for the transport of solutes, including contaminants. Simulating these processes requires numerical tools that couple water, energy, and solute transport under dynamic freeze–thaw and variably saturated conditions. We present SUTRA-solice, a new version of the USGS SUTRA code developed to simulate variably saturated groundwater flow, advective–conductive heat transport with phase change, and reactive transport of multiple solute species. SUTRA-solice integrates the multi-species solute transport capabilities of SUTRA-MS with the phase-change energy transport framework of SUTRA 4.0, and adds functionality to represent temperature- and saturation-dependent reaction rates. We illustrate the application of SUTRA-solice by exploring contaminant transport in a continuous permafrost setting under warming conditions. Results show that increased seasonal thaw depth and duration enhance groundwater flow and increase solute mobility and transformation, particularly for weakly sorbing species. These results demonstrate the flexibility of SUTRA-solice for investigating solute dynamics in cryohydrogeologic systems. Continued development and testing of the model against field data will lead to improved understanding of climate-driven feedbacks and inform water management in permafrost  environments.

How to cite: McKenzie, J., Basijokaite, R., Mohammed, A., and Stribling, S.: Modeling Solute and Contaminant Transport in Permafrost Regions, EGU General Assembly 2026, Vienna, Austria, 3–8 May 2026, EGU26-15737, https://doi.org/10.5194/egusphere-egu26-15737, 2026.

EGU26-15791 | Orals | HS8.2.6

Groundwater flow and solute transport in a permafrost hillslope under seasonal thaw and climate warming 

Andrew Frampton, Alexandra Hamm, Erik Schytt Mannerfelt, Aaron A. Mohammed, Scott L. Painter, and Ethan T. Coon

Groundwater flow in hillslopes in permafrost environments is strongly controlled by seasonal freeze-thaw dynamics. The seasonally thawed active layer acts as a transient groundwater system perched above permafrost, where coupled thermal and hydrological processes control subsurface connectivity, solute residence times and export to surface water recipients. Understanding these processes is critical for predicting hydrological responses to climate warming in permafrost regions.

Here we investigate groundwater flow and solute transport in a high-Arctic hillslope setting in Endalen Valley, Svalbard, underlain by continuous permafrost, using a physics-based numerical thermal-hydrological flow model with solute transport. Breakthrough curves are obtained for tracers released at different depths in the subsurface under present-day climatic conditions and under a set of warming scenarios. Results show that solute transport behaves very differently depending on release depth. Solutes originating near the ground surface are transported slowly, reflecting predominantly unsaturated flow conditions with seasonal thaw, producing long residence times. In contrast, solutes released at depth, near the permafrost table, experience rapid lateral groundwater transport following thaw, driven by water saturated conditions and the development of laterally connected subsurface flow paths above the permafrost.

Furthermore, solute mobilisation from newly thawed permafrost under climate warming is highly sensitive to the rate and mode of warming. Gradual warming promotes limited annual mobilisation dominated by vertical transport through percolation and cryosuction, whereas abrupt thaw associated with anomalously warm years leads to more rapid lateral transport comparable to that observed within the active layer.

Finally, we demonstrate how groundwater saturation and temperature conditions influence in situ solute transformation, showing that rapid transport under highly saturated conditions coincides with low potential mineralisation prior to export. These results highlight the central role of seasonal groundwater flow regimes in controlling subsurface transport in permafrost hillslopes and their response to climate change.

How to cite: Frampton, A., Hamm, A., Schytt Mannerfelt, E., Mohammed, A. A., Painter, S. L., and Coon, E. T.: Groundwater flow and solute transport in a permafrost hillslope under seasonal thaw and climate warming, EGU General Assembly 2026, Vienna, Austria, 3–8 May 2026, EGU26-15791, https://doi.org/10.5194/egusphere-egu26-15791, 2026.

Coastal aquifers are hydraulically connected to the sea, making them highly sensitive to storm-induced disturbances; however, the impacts of tropical cyclones on surface water-groundwater (SW–GW) interactions remain poorly understood. This study has investigated the impact of short-term climate extremes specifically cyclone-induced storm surges on coastal aquifer systems along India’s eastern coastal regions in Nizampatnam Andhra Pradesh (Tropical cyclone Dana, May 2024) and in Sundarbans of Ganges delta front (Tropical cyclone Bulbul, November 2019) adjoining to Bay of Bengal. The study has incorporated a field-laboratory, isotopic, and multivariate statistical observations-based approaches to assess and compare the influence of storm-driven impacts on groundwater level (GWL) and displacement of toxic solutes in porewater which eventually hampered the SW-GW interaction processes across the regions. Results revealed a positive relationship between cyclonic translation speed, rainfall intensity, and GWL response, especially in lithologically conductive aquifers. In Sundarbans, the storm surge was associated with increased GWL, enhanced salinity, and the downward transport of surface-derived contaminants into groundwater. In addition, wave surges produced instantaneous, rapid, and synchronous GWL fluctuations across all aquifer depths in Sundarbans. Whereas in Nizampatnam, cyclone-induced atmospheric pressure decline and storm surge caused transient offshore displacement of the SW–GW interface, enhancing fresh groundwater discharge, as indicated by depleted δ¹⁸O elevated ²²²Rn, and reduced salinity. The duration of SW–GW system re-stabilization varies widely from weeks to several years and is strongly controlled by local hydrogeological conditions and storm intensity. Therefore, the findings highlight the growing vulnerability of coastal groundwater resources under increasing storm frequency and intensity, emphasizing the need for proactive management strategies to ensure freshwater sustainability to achieve SDG-6 in a changing climate.

Keywords: Coastal aquifer; Groundwater Level; Porewater; Tropical Cyclone; SW-GW Interaction; SDG-6

How to cite: Das, K.: Influence of Short-Term Climate Extremes on Surface Water-Groundwater Interaction: A Regional Perspective on Drinking Water Vulnerability, EGU General Assembly 2026, Vienna, Austria, 3–8 May 2026, EGU26-16368, https://doi.org/10.5194/egusphere-egu26-16368, 2026.

EGU26-17148 | ECS | Orals | HS8.2.6

Climate change effects on the annual cycle in shallow subarctic groundwater over 50 years 

Pietari Pöykkö, Mira Tammelin, Anna-Kaisa Ronkanen, Lauri Ahopelto, and Pekka Rossi

Groundwater-level seasonality (regime) is shifting under climate change, with direct implications for drought and flood risks, water supply reliability, agriculture, and ecosystem functioning. These shifts are accentuated in shallow, fast-responding aquifers, particularly in boreal settings where the recharge- and evapotranspiration-constrained freezing winters are changing. To characterize subarctic groundwater regimes and assess their past development, we analyzed 50-year groundwater level records from 53 monitoring stations across Finland (covering >300,000 km²). After method evaluation, we classified regimes using partitioning around medoids (PAM) clustering based on Pearson correlation distances, supported by principal component analysis (PCA) of normalized monthly groundwater levels to summarize seasonal variability.

The clustering identified four groundwater regimes that align primarily with a southwest–northeast gradient of frost-season intensity. Comparing two periods (1975–1999 vs. 2000–2024) revealed the regimes to have migrated northeastward, toward colder regions. This is locally seen as higher winter groundwater levels, lower summer levels, earlier spring recharge peak, and prolonged summer low season. Regime expression also varied with aquifer size: within the 0.01–70 km² range, larger aquifers exhibited lagged seasonal responses, consistent with longer flow paths and greater storage. The results implicate that the selected approach effectively displays the spatially evolving groundwater dynamics, and highlight the importance of long-term environmental monitoring for effective decision-making and preparedness for shortages in water availability in the changing climate.

How to cite: Pöykkö, P., Tammelin, M., Ronkanen, A.-K., Ahopelto, L., and Rossi, P.: Climate change effects on the annual cycle in shallow subarctic groundwater over 50 years, EGU General Assembly 2026, Vienna, Austria, 3–8 May 2026, EGU26-17148, https://doi.org/10.5194/egusphere-egu26-17148, 2026.

Submarine groundwater discharge (SGD) plays a crucial role in material transport and environmental variability in coastal regions. However, its spatial distribution is highly heterogeneous, making direct observation difficult and regional identification using remote sensing a persistent challenge. Since SGD often causes localized cooling in coastal waters, variations in sea surface temperature (SST) can serve as an initial indicator of potential discharge zones.

This study evaluates the feasibility of using SST data alone as an initial indicator of SGD along the coast of Taiwan. MODIS 8-day composite SST data are used to construct a long-term seasonal baseline. Temperature anomalies relative to this baseline are then analyzed to identify the spatiotemporal distribution patterns of coastal anomaly events.

The spatial characteristics of these anomaly events are examined across different seasons and compared with potential SGD zones reported in previous studies. This analysis explores whether SST, without integrating additional oceanic parameters, can provide reliable preliminary information for identifying SGD discharge zones and serve as a foundation for future multi-parameter integrated studies.

How to cite: Hou, T.-T. and Lin, Y.-C.: Using Sea Surface Temperature as an Initial Indicator for Identifying Potential Submarine Groundwater Discharge Zones along the Coast of Taiwan, EGU General Assembly 2026, Vienna, Austria, 3–8 May 2026, EGU26-3719, https://doi.org/10.5194/egusphere-egu26-3719, 2026.

EGU26-7387 | ECS | Orals | HS8.2.8

Dynamic Mechanisms of Flow and Transport in Coastal Aquifer-Aquitard Systems 

Jiaxu Zhang and Chunhui Lu

Alternating deposition of marine and terrestrial sediments commonly produces multi-layered aquifer-aquitard systems in coastal zones. Under the influence of vertical hydraulic gradients, hydraulic connections may develop between adjacent aquifers, leading to the formation of interlayer leakage. However, the extent to which the vertical leakage influences groundwater flow and freshwater-saltwater mixing processes in coastal aquifers remains poorly understood. Moreover, submarine groundwater discharge (SGD) and salinity dynamics vary across daily, monthly, and annual timescales in response to tidal, spring-neap and seasonal forcings. To date, no study has systematically compared the cross-timescale dynamics of salinity distribution and submarine groundwater discharge (SGD) in unconfined and semi-confined aquifers under leakage conditions. To address these knowledge gaps, this study combines laboratory experiments and numerical simulations to investigate the dynamic mechanisms of flow and transport in coastal aquifer-aquitard systems. The results demonstrate that upward leakage induces unstable freshwater fingering within the saltwater wedge of the unconfined aquifer, promoting the extension of the mixing zone from the wedge margin into its interior. Compared with steady-state conditions, tidal fluctuations reduce upward leakage from the semi-confined aquifer to the unconfined aquifer, thereby increasing horizontal freshwater discharge from the semi-confined aquifer to the sea and further alleviating seawater intrusion within it. When seasonal inland recharge is considered, both saltwater wedges and SGD in the unconfined and semi-confined aquifers exhibit pronounced periodic variations; however, leakage-affected saltwater wedges and internal saltwater circulation display irregular interannual variability. Relative to non-tidal conditions, tidal forcing reduces the amplitude of saltwater-wedge fluctuations in the unconfined aquifer driven by seasonal inland input, while amplifying the corresponding variability in the semi-confined aquifer. Furthermore, the combined effects of spring-neap tides and inland input variability result in dual monthly and quarterly fluctuations in SGD from both aquifers, whereas saltwater-wedge dynamics in the semi-confined aquifer respond to this coupling primarily at the quarterly timescale.

How to cite: Zhang, J. and Lu, C.: Dynamic Mechanisms of Flow and Transport in Coastal Aquifer-Aquitard Systems, EGU General Assembly 2026, Vienna, Austria, 3–8 May 2026, EGU26-7387, https://doi.org/10.5194/egusphere-egu26-7387, 2026.

EGU26-7547 | Posters on site | HS8.2.8

Offshore freshened groundwater (OFG) systems – results and implications from two continental margins 

Christian Hensen, Chong Sheng, Thomas H. Müller, Ariel T. Thomas, Aaron Micallef, and Mark Schmidt

Offshore freshened groundwater (OFG) represents a significant but underexplored global water resource. Although OFG systems are strongly influenced by paleo sea-level fluctuations, the specific hydrological controls governing present-day salinity distributions remain difficult to constrain due to limited data availability and uncertainties in model parameterization.

We present our latest results from two OFG systems: (1) offshore New Jersey, USA, and (2) Canterbury Bight, New Zealand. Both studies integrate available data such as high-resolution seismic profiles, borehole constraints, geochemical and isotopic data, and paleo-hydrogeological modeling. Offshore New Jersey, OFG was primarily emplaced during sea-level lowstands over the past ~100 kyr, when large portions of the continental shelf were exposed to the atmosphere. Subsequent marine transgression led to partial salinization through diffusive and density-driven mixing with seawater. However, the duration of interglacial submergence has been insufficient to fully salinize the OFG, allowing relic freshwater from pre–Last Glacial Maximum and earlier interglacials to persist. In Canterbury Bight, simulations indicate that modern onshore recharge contributes only a limited fraction of the OFG. The majority of seaward OFG has a mean groundwater age of less than ~40 kyr, suggesting a dominant origin from local meteoric recharge during late-Pleistocene sea-level lowstands. In addition to diffusion and compaction-driven flow, topographically driven lateral flow across the continental shelf played a key role in OFG emplacement. OFG volumes and paleo-submarine groundwater discharge along the continental shelf have varied periodically with glacial–interglacial sea-level changes. Similar to New Jersey, the current OFG system in Canterbury Bight is at non-steady state and becomes gradually salinized by overlying seawater.

Overall, this study sheds light on the effect of changing paleo-hydrological conditions in shaping continental-shelf groundwater systems and provides a framework for assessing the occurrence, evolution, and vulnerability of OFG along passive continental margins.

How to cite: Hensen, C., Sheng, C., Müller, T. H., Thomas, A. T., Micallef, A., and Schmidt, M.: Offshore freshened groundwater (OFG) systems – results and implications from two continental margins, EGU General Assembly 2026, Vienna, Austria, 3–8 May 2026, EGU26-7547, https://doi.org/10.5194/egusphere-egu26-7547, 2026.

EGU26-9290 | Orals | HS8.2.8

Variable impact of submarine groundwater discharge on the patchiness of seafloor biogeochemical conditions 

Joonas Virtasalo, Wei-Li Hong, Beata Szymczycha, Sten Suuroja, Albert Folch, Itay Reznik, Renata Majamäki, Joonas Wasiljeff, Marc Diego Feliu, Roi Ram, Ronja Lanndér, Eero Asmala, Lotta Purkamo, and Samrit Luoma

Submarine groundwater discharge (SGD) can be a significant source of nutrients, carbon and other substances to coastal seas, with detrimental effects on the marine ecosystem, such as eutrophication and acidification. In Hanko, in the northern Baltic Sea off Finland, SGD occurs through several small depressions (pockmarks, <25 m wide, <2.5 m deep) on a sandy seafloor slope ca. 200 m from the shoreline at water depths of ca. 11 m. Sediment porewater profiles of Cl, δ2H and δ18O sampled in September 2019 documented a wide range of discharge rates from the pockmarks – from consistent and relatively strong (0.31 cm/day) to moderate (0.02 cm/day) to cessated discharge. Reactive transport modeling showed that groundwater advection in consistent flow-dominated pockmarks forced the key biogeochemical processes and microbial activity (sulphate reduction, methane production) into a few centimetres thick zone below the sediment surface (Purkamo et al., 2022, Geochim. Cosmochim. Acta).

Here we present results from our extensive revisit to the Hanko pockmarks and onshore groundwater observation wells in June 2025. Pockmark sediment samples were collected for bulk geochemical and grain size analyses. Pockmark porewater, overlying water column and groundwater samples from nearby wells were collected for the analysis of a wide range of parameters such as δ2H, δ18O, δ13CDIC, major nutrients and ions. Water column and groundwater samples were also analysed for Ra and Rn activity, and groundwater samples were analysed for stable and radioactive noble gases. Preliminary results show significant temporal variability in discharge rates and biogeochemical conditions in the pockmarks.

The authors would like to thank the European Commission and the Research Council of Finland, Swedish Research Council FORMAS, Polish Research Council NCBR, Estonian Research Council ETAG (Mobilitas 3.0 programme), Spanish Research Council AEI, and the Israeli Ministry of Energy and Infrastructure for funding in the frame of the collaborative international consortium SecuCoast financed under the 2023 Joint call of the European Partnership 101060874 — Water4All.

How to cite: Virtasalo, J., Hong, W.-L., Szymczycha, B., Suuroja, S., Folch, A., Reznik, I., Majamäki, R., Wasiljeff, J., Diego Feliu, M., Ram, R., Lanndér, R., Asmala, E., Purkamo, L., and Luoma, S.: Variable impact of submarine groundwater discharge on the patchiness of seafloor biogeochemical conditions, EGU General Assembly 2026, Vienna, Austria, 3–8 May 2026, EGU26-9290, https://doi.org/10.5194/egusphere-egu26-9290, 2026.

EGU26-10660 | ECS | Orals | HS8.2.8

Insights into Groundwater-Seawater Interaction using Magnetic and Electromagnetic Data along the Western Coast of India 

Shreya Maurya, Kuldeep Sarkar, Ajak John Ateng, and Anand Singh

Coastal basaltic aquifers are inherently heterogeneous, making the identification of groundwater-seawater interactions and submarine groundwater discharge (SGD) zones challenging using conventional hydrogeological approaches. SGD represents a critical pathway for nutrient transport, contaminant dispersion, and freshwater flux into coastal environments. Limited subsurface exposure and complex fracture-controlled flow systems further increase uncertainty in delineating these zones along basaltic coastlines. To address these challenges, this study integrates Very Low Frequency Electromagnetic (VLF-EM), Transient Electromagnetic (TEM), and magnetic methods to characterize groundwater–seawater interactions along Western Coast Beach in the Raigad district, Maharashtra, India. The study area lies within the Deccan Traps, the largest basaltic lava province in India. VLF-EM and TEM surveys were employed to identify conductive structures associated with coastal aquifers and saline water intrusion, while ground magnetic data were analyzed to delineate structural controls and zones of reduced magnetic susceptibility. These integrated geophysical interpretation reveals preferential groundwater flow pathways connecting onshore aquifers to the coastal zone, indicating areas of active groundwater–seawater exchange. The study demonstrates that the combined use of electromagnetic and magnetic methods effectively reduces uncertainty in coastal groundwater investigations and provides a robust framework for identifying SGD zones, thereby supporting sustainable coastal groundwater management.

How to cite: Maurya, S., Sarkar, K., John Ateng, A., and Singh, A.: Insights into Groundwater-Seawater Interaction using Magnetic and Electromagnetic Data along the Western Coast of India, EGU General Assembly 2026, Vienna, Austria, 3–8 May 2026, EGU26-10660, https://doi.org/10.5194/egusphere-egu26-10660, 2026.

EGU26-13190 | ECS | Orals | HS8.2.8

Geochemical investigation of a subterranean estuary influenced by tides on the east coast of India 

Cátia Milene Ehlert von Ahn, Soumya Kanta Nayak, Naveen Gupta, Murugan Ramasamy, Nandimandalam Janardhana Raju, and Nils Moosdorf

Submarine groundwater discharge (SGD) is an important transport pathway between land and ocean. The term SGD covers a wide range of processes, compositions and origins, including not only the direct discharge of fresh groundwater, but also diffuse and brackish fluxes through permeable sediments. The mixing zone between fresh groundwater and seawater in the coastal sediments forms a subterranean estuary (STE) where chemical elements undergo biogeochemical transformations before reaching the ocean. However, biogeochemical processes within STEs along tidally influences tropical coastlines, particularly under strong monsoonal rainfall, remain poorly constrained. This study evaluates these processes along tidally influenced section of the Odisha coast, India, which receives annual rainfall of about 1550 mm. Sampling was conducted during the pre-monsoon (May 2024) and post-monsoon (October 2024) seasons. Seawater, groundwater and sediment porewater (down to 125 cm) were collected along intertidal-zone transects parallel to the coastline. Samples were analyzed for the measurement of several parameters including nutrients, major and trace elements and carbon species. The surface seawater and pore waters along the shoreline showed a large difference in salinity values between the two seasons: during the pre-monsoon, salinities reached up to 36 PSU, while after the monsoon, the salinities decreased to a maximum of 30 PSU. During the post-monsoon season, more number and lower salinity spots were detected along the coastline, suggesting that SGD is an important phenomenon in the region causing the formation of an STE. Salinity values were positively correlated with the elevation of the beach, and a seepage line indicating the presence of diffuse SGD was found at about 2m above the sea level. The concentration of nutrients in the different systems suggests that STE plays a role in the transport of nutrients towards the sea. Further studies will continue to better understand the final subterranean element fluxes to the coastal waters of this interesting location.

How to cite: Ehlert von Ahn, C. M., Nayak, S. K., Gupta, N., Ramasamy, M., Raju, N. J., and Moosdorf, N.: Geochemical investigation of a subterranean estuary influenced by tides on the east coast of India, EGU General Assembly 2026, Vienna, Austria, 3–8 May 2026, EGU26-13190, https://doi.org/10.5194/egusphere-egu26-13190, 2026.

EGU26-13990 | ECS | Posters on site | HS8.2.8

Offshore freshened groundwater in the Northern Adriatic Basin: Insights from integrated 3D modelling and hydrochemistry 

Cristina Corradin, Michela Giustiniani, Angelo Camerlenghi, Luca Zini, Claudia Bertoni, Ariel T. Thomas, Aaron Micallef, Daniel Zamrsky, Benedetta Surian, and Nicolò Barago

Offshore freshened groundwater (OFG) is increasingly recognised as a potentially significant, yet still poorly constrained, freshwater resource stored on continental shelves. In the northern Adriatic Basin, OFG presence is supported by low salinity interstitial water (< 1 g/L) in a few hydrocarbon exploration-related drilling sites. Building on these observations,  assessing whether OFG is widespread across the basin, and constraining its distribution, characteristics, emplacement mechanisms, water quality, and resource potential, requires a multifaceted investigation. Here, we synthesise the current state of knowledge for the Northern Adriatic Basin system, based on results obtained to date from integrated 3D modelling and regional monitoring datasets.
Onshore-offshore connectivity of high-permeability layers is supported by 3D geological geostatistical modelling. We built a 3D geological model of upper Plio–Quaternary sediments and simulated permeable facies distributions using Sequential Indicator Simulation, capturing depositional anisotropy consistent with mixed fluvial-coastal processes. The model supports laterally extensive, southward-dipping permeable units that extend offshore and remain connected across the coastline, providing a physical basis for OFG occurrence and storage. Active flow interaction is further supported by groundwater flow modelling. A transient groundwater flow model was developed and calibrated; simulated coastal exchange indicates that the Northern Adriatic Basin is hydraulically active but characterised by a very small offshore-directed freshwater flux, implying minimal present-day active recharge.  Finally, regional onshore hydrochemical analysis suggests that OFG quality has not been substantially affected by anthropogenic inputs, although its potential for utilisation must be evaluated carefully. Hydrochemical results from coastal confined aquifers (multi-decadal monitoring combined with new sampling) delineate distinct groundwater families and age characteristics. Near the coast (and consistently offshore), the most chemically evolved end-member is characterised by strongly reducing conditions (elevated NH₄⁺ and redox-sensitive metals) and is consistent with emplacement during the Last Glacial Maximum (LGM) sea-level lowstand. Together, these findings support the presence of offshore permeable reservoirs saturated with freshwater that was likely emplaced during or before LGM, with minimal subsequent contribution, and currently under strongly reducing conditions, implying potential potability limitations.

How to cite: Corradin, C., Giustiniani, M., Camerlenghi, A., Zini, L., Bertoni, C., Thomas, A. T., Micallef, A., Zamrsky, D., Surian, B., and Barago, N.: Offshore freshened groundwater in the Northern Adriatic Basin: Insights from integrated 3D modelling and hydrochemistry, EGU General Assembly 2026, Vienna, Austria, 3–8 May 2026, EGU26-13990, https://doi.org/10.5194/egusphere-egu26-13990, 2026.

EGU26-14257 | ECS | Posters on site | HS8.2.8

Predicting Offshore Freshened Groundwater via Machine Learning and Surrogate Modelling 

Ariel Thomas, Daniel Zamrsky, Aaron Micallef, and Sebastiano D'Amico

Coastal regions worldwide face increasing water stress, making unconventional resources like Offshore Freshened Groundwater (OFG) critically important. However, characterizing these vast subterranean reservoirs is hindered by the scarcity of direct subsurface data, and current predictive methods are either too coarse for local assessment or qualitative in nature. This study introduces a novel quantitative methodology to predict OFG distribution using machine learning (ML) trained on a synthetic dataset derived from geologically realistic surrogate models. The workflow involves generating numerous surrogate models of continental shelves based on globally available geomorphological data. We then run numerical simulations of variable-density groundwater flow on these models, forced by glacial-interglacial sea-level cycles, to create a robust training dataset linking geological geometry to OFG system characteristics. This study details the parameterization of surrogate continental shelf models from 8 distinct global regions into numerical feature vectors suitable for ML. Initial results indicate that key geometric parameters, such as the offshore extent of the primary aquifer and the inland topographic gradient, are first-order controls on the volume and distribution of emplaced OFG. This proof-of-concept validates that the surrogate modelling framework can effectively capture the sensitivity of OFG systems to geological controls. Ultimately, this methodology highlights a potential pathway to overcoming the data-scarcity challenge, enabling the development of a predictive tool for rapid, quantitative assessment of OFG resources on continental margins worldwide.

How to cite: Thomas, A., Zamrsky, D., Micallef, A., and D'Amico, S.: Predicting Offshore Freshened Groundwater via Machine Learning and Surrogate Modelling, EGU General Assembly 2026, Vienna, Austria, 3–8 May 2026, EGU26-14257, https://doi.org/10.5194/egusphere-egu26-14257, 2026.

EGU26-14724 | Posters on site | HS8.2.8

Fluid sources and water–rock interactions of cryosphere-associated offshore fossil groundwater in high-latitude regions 

Wei-Li Hong, Sophie ten Hietbrink, Nai-Chen Chen, Ji-Hoon Kim, Sarath Pullyottum Kavil, Beata Szymczycha, Aivo Lepland, Jochen Knies, Arunima Sen, Virtasalo Joonas, Sten Suuroja, Martin Liira, Nina kirchner, and Martin Jakobsson

Groundwater is an important, though highly system-dependent, regulator of cryosphere mobility and stability. However, current understanding of these processes is constrained by a scarcity of direct observations due to logistical challenges. Much of the evidence for groundwater–cryosphere coupling therefore derives from numerical modeling and conceptual frameworks. The occurence of offshore groundwater systems along present/past glaciated continental shelves & slopes provides a unique opportunity to constrain the boundary conditions governing the coupling between groundwater and cryospheric processes. This is because the recharge of these offshore groundwater bodies, located several tens to hundreds of meters below seafloor, requires steep hydraulic gradients allowing for robust attribution of flow drivers to changes in cryospheric conditions. In addition, offshore groundwater systems are generally located far from their fluid sources, and thus may respond the first when fluid recharge—for example, ice-sheet basal melt—weakens.

Six high-latitude offshore groundwater sites were investigated for sediment and fluid geochemistry: three sites proximal to past glaciation (Lofoten–Vesterålen from the Norwegian Sea, Fifång Bay close to the Stockholm archipelago, and the Gulf of Finland) and three others in the vincinity of modern glaciers/ice caps, submarine permafrost, or mud volcanoes (Tempelfjorden and Hornsund fjords in Svalbard, Victoria and Petermann fjords in northwest Greenland, and Beaufort Sea shelf and slope). Radiocarbon dating of the offshore groundwater suggest recharge events from early Holocene to pre-Holocene. The mixing of other radiocarbon sources in the sediments, such as carbon derived from degradation of particulate organic matter and dissolution of carbonates, complicates the interpretation of the groundwater signal. By comparing radiocarbon results from overlying seawater, organic matter, carbonate, and adjacent meteoric fluid sources (rivers and glacial ice) at these six locations, we discuss the limitations and potential for constraining the residence time of cryosphere-associated offshore groundwater.

How to cite: Hong, W.-L., ten Hietbrink, S., Chen, N.-C., Kim, J.-H., Pullyottum Kavil, S., Szymczycha, B., Lepland, A., Knies, J., Sen, A., Joonas, V., Suuroja, S., Liira, M., kirchner, N., and Jakobsson, M.: Fluid sources and water–rock interactions of cryosphere-associated offshore fossil groundwater in high-latitude regions, EGU General Assembly 2026, Vienna, Austria, 3–8 May 2026, EGU26-14724, https://doi.org/10.5194/egusphere-egu26-14724, 2026.

Submarine groundwater discharge (SGD) significantly influences ocean chemistry, yet quantifying solute fluxes remains challenging due to the complex interplay of freshwater and saltwater within coastal aquifers operating at different temporal and spatial scales. The key lies in differentiating distinct saltwater flux components and characterizing their end-member compositions.

We developed a novel geochemical approach to isolate and quantify long-term density-driven seawater circulation in coastal aquifers. By compiling an extensive global dataset of coastal groundwater chemistry from onshore wells, we identified systematic deviations from conservative mixing models: enrichment in Ca and Sr and depletion in Na and K. These signatures reflect water-rock interactions occurring over multi-year timescales during mostly density-driven circulation, distinct from rapid tidal/wave-driven exchanges that show conservative mixing. Our novel approach quantifies the long-term SGD component by comparing major element enrichment and depletion in subterranean estuary samples (collected from seepage meters and piezometers) against an end-member composition derived from our global compilation of onshore well data.

To validate our methodology, we applied our mass balance approach to Indian River Bay, Delaware. Based on Ca and Sr enrichment (12 and 0.24 meq/L, respectively) and K depletion (5 meq/L), we calculated long-term circulation at 9±4% of total saline SGD. After correcting for wave-driven circulation, both fresh SGD and long-term circulation represent ~1% of total SGD, consistent with global estimates and extrapolating to 1.2-3.6×10³ km³/y globally. Sr-based flow field mapping further constrains circulation patterns within the coastal aquifer.

This study demonstrates that geochemical tracers can effectively partition SGD components across spatial scales, providing a framework for quantifying long-term seawater circulation impacts on coastal and ocean biogeochemistry.

How to cite: Kiro, Y., Duque, C., and Michael, H.: Quantifying Long-Term Seawater Circulation in Coastal Aquifers: A  Novel Geochemical Approach Validated at Indian River Bay, Delaware, EGU General Assembly 2026, Vienna, Austria, 3–8 May 2026, EGU26-16486, https://doi.org/10.5194/egusphere-egu26-16486, 2026.

EGU26-18084 | Posters on site | HS8.2.8

Rapid and large-scale reservoir modelling for offshore freshened groundwater applications: The North Sea story 

Jordan J. J. Phethean, Zhenghong Li, Claudia Bertoni, and Cristina Corradin

With extreme climatic events and increasing populations, water stress in regions of Europe is becoming critical. Offshore Freshened Groundwater (OFG) is increasingly being identified within continental margin sedimentary sequences worldwide, and has potential to be used as an industrial, agricultural, or domestic/potable resource, especially as a mitigation to drought during extreme climatic events. As part of an international effort under the Horizon Europe Water4All project RESCUE (RESources in Coastal groundwater Under hydroclimatic Extremes), we have used extensive subsurface petrophysical and geophysical datasets, alongside machine learning approaches, to generate detailed static reservoir models for a region of the Southern North Sea. Neutron, density and sonic porosities from well log data are used to train the spatially aware EMBER machine learning algorithm against acoustic impedance data, which is derived from 3D seismic reflection and well data. We demonstrate a strong predictive capacity of the trained algorithm to predict porosity from acoustic impedance for the interpreted formations by blind well testing. Permeability is also derived from well logs using the Timur and Holmes-Buckle relationships, before also training EMBER for permeability prediction. Our results provide a detailed, strongly data based, and fully spatially constrained determination of the porosity and permeability distribution for an area of the Southern North Sea, which can be used for dynamic modelling of OFG emplacement during sea level lowstands associated with the last glacial maximum.

How to cite: Phethean, J. J. J., Li, Z., Bertoni, C., and Corradin, C.: Rapid and large-scale reservoir modelling for offshore freshened groundwater applications: The North Sea story, EGU General Assembly 2026, Vienna, Austria, 3–8 May 2026, EGU26-18084, https://doi.org/10.5194/egusphere-egu26-18084, 2026.

EGU26-19272 | Orals | HS8.2.8 | Highlight

IODP3-NSF Expedition 501: Offshore Freshened Groundwater in the New England Continental Shelf 

Erwan Le Ber, Brandon Dugan, Rebecca S. Robinson, and Jeremy D. Everest and the IODP3-NSF Expedition 501 Scientists

IODP3-NSF Expedition 501 drilled three sites along a 45 km-long, NNW-SSE transect on the New England continental shelf offshore Nantucket and Martha’s Vineyard to characterise an extensive offshore freshened groundwater (OFG) system. Site M0112 (41 m water depth; 338 m below seafloor [mbsf]) is nearest to shore, Site M0111 (42 m water depth; 393 mbsf) is the middle site, and Site M0113 (54 m water depth; 325 mbsf) is farthest offshore. Each site was investigated with drilling, coring, wireline logging (including formation conductivity and nuclear magnetic resonance), and groundwater pumping. Long-term observatories were also lowered in holes at  Sites M0112 and M0113 to collect formation temperature and pressure data. The expedition was operationally successful, with 71% core recovery; 10,500 litres of water sampled through pump tests for post-cruise analyses; and the use of temporary PVC casing for wireline logging. Offshore (May-July 2025) and onshore (Bremen, Marum Onshore Operations, January- February 2026) analyses document an unconsolidated sedimentary package consisting predominantly of alternating layers of sand and mud; however, some coarser interbeds were observed at Site M0112. Beds were generally thicker in the shallow section and thinner at depth. Additional shore-based analyses will provide more detailed lithostratigraphic characterisation, sedimentary age, and stratigraphic ties between sites. Interstitial water and pumped groundwater from Sites M0111 and M0112 document a transition from seawater salinity to less than 10% of seawater salinity within the upper 125 mbsf, and salinity remains low until it increases at depths greater than 300 mbsf. At Site M0113 two freshened zones with salinity that is 50-60% of seawater salinity exist above 300 mbsf. Preliminary interpretations suggest that aquifers and confining units have similar salinity in the freshened zones. These freshening patterns are consistent with interpretations of marine-based electromagnetic surveys previously collected along the drilling transect. Compared to salinity, interstitial water alkalinity demonstrates more nuanced patterns, with similar values in sands layers but variable values in mud layers. In addition to shipboard analyses, numerous sediment, water, gas, and microbiological samples were collected for post-expedition research to understand freshwater emplacement mechanisms, timing of emplacement, and volumes of this extensive OFG system. This integrated research program not only elucidates the freshened system beneath the southern New England shelf, but also has implications for other OFGs worldwide.

How to cite: Le Ber, E., Dugan, B., Robinson, R. S., and Everest, J. D. and the IODP3-NSF Expedition 501 Scientists: IODP3-NSF Expedition 501: Offshore Freshened Groundwater in the New England Continental Shelf, EGU General Assembly 2026, Vienna, Austria, 3–8 May 2026, EGU26-19272, https://doi.org/10.5194/egusphere-egu26-19272, 2026.

EGU26-23046 | ECS | Orals | HS8.2.8

Coastal fresh groundwater extending deep offshore from southern Sicily (Italy): assessment of the Ragusa Aquifer via petrophysical and 3D hydrogeological modelling 

Damiano Chiacchieri, Lorenzo Lipparini, Elizabeth Quiroga Jordan, Roberto Bencini, and Aaron Micallef

Sicily (Italy) is among the regions most vulnerable to drought, with conditions expected to worsen under climate change, underscoring the need for sustainable water management and the exploration of unconventional water resources. This study investigates the Ragusa Oligo-Miocene Formation, a karstified and fractured carbonate aquifer with medium to high porosity, which outcrops across the Hyblean Plateau in southern Sicily. The primary objective was to assess and quantify the potential presence of fresh groundwater in the deeper and offshore extension of this carbonate aquifer along the southeastern coast of Sicily, where it is sealed beneath more recent deposits. To reconstruct its subsurface structure, data from 90 deep oil and gas wells, both onshore and offshore, were analysed. Geophysical logs were examined using advanced petrophysical methods, while hydrogeological data from onshore wells were integrated to refine the understanding of the regional aquifer system. The results provide clear evidence of freshened groundwater within the Ragusa regional aquifer, extending deeper than previously known, onshore and continuing offshore up to 10 km from the coastline. A preliminary, conservative volumetric estimate suggests approximately 3 km3 of fresh groundwater preserved in the offshore region of the study area, at depths between 500 and 1200 m below sea level. This discovery demonstrates the untapped potential of unconventional groundwater in both the deep onshore and offshore areas of southeastern Sicily, offering an additional solution to water shortage problems, and has significant implications for other countries along Mediterranean coastlines.

How to cite: Chiacchieri, D., Lipparini, L., Quiroga Jordan, E., Bencini, R., and Micallef, A.: Coastal fresh groundwater extending deep offshore from southern Sicily (Italy): assessment of the Ragusa Aquifer via petrophysical and 3D hydrogeological modelling, EGU General Assembly 2026, Vienna, Austria, 3–8 May 2026, EGU26-23046, https://doi.org/10.5194/egusphere-egu26-23046, 2026.

EGU26-210 | ECS | Posters on site | HS8.2.10

Integrated AMT and VES investigation of the transboundary Continental Intercalaire aquifer in the Sebaa Basin, southern Algeria 

Zoubida Nemer, Zakaria Boukhalfa, Walid Boukhlouf, Youcef Boutadara, Ahmed Seddik Kasdi, Abderrezak Bouzid, and Mohamed Hamoudi

Groundwater resources in arid and semi-arid regions of the global south are increasingly under pressure due to agricultural intensification, population growth, climate variability, and limited monitoring. On the other hand, effective management of these resources requires a detailed understanding of subsurface, flow dynamics, and water quality at scales relevant to decision-making. In Algeria, the Sebaa Basin of the Adrar Province represents a critical area where groundwater, supplied by the transboundary Continental Intercalaire (CI) aquifer, supports rapidly expanding agricultural activities. Despite its socio-economic importance, this hydrogeological system remains poorly characterized due to sparse observational data and limited subsurface information.

To address these challenges, we implemented an integrated hydrogeophysical and hydrochemical study combining Audio-Magnetotelluric (AMT) surveys, Vertical Electrical Sounding (VES), piezometric measurements, and hydrochemical analyses. Fourteen AMT stations were deployed along a 3 km east–west profile with a spacing of approximately 200 meters to achieve high-resolution imaging of the subsurface. AMT was selected to capture the overall structure and geometry of the aquifer system, revealing depth, thickness, lateral continuity, and structural heterogeneities of the CI aquifer that are not apparent from surface geological observations alone. In parallel, 50 VES soundings were conducted to track variations in piezometric levels, providing insight into localized drawdown effects. Piezometric measurements from existing wells were used to validate the VES interpretations and to map spatial variations in hydraulic head across the study area.

Hydrochemical sampling and analysis were integrated to characterize water quality, assess spatial variability, and identify potential mixing between fresh, slightly mineralized, and more saline groundwater. Major ions and salinity indicators were analyzed to provide additional constraints on aquifer connectivity and flow dynamics. The combined interpretation of AMT, VES, piezometric, and hydrochemical data allowed the development of a comprehensive conceptual model linking subsurface structure to observed hydraulic behavior and water quality patterns. Low-resistivity zones observed in AMT and VES inversions were interpreted as potential groundwater pathways and preferential recharge areas, while high-resistivity anomalies corresponded to consolidated formations or structural highs that limit flow.

This integrated approach demonstrates how coupled geophysical, hydrological, and geochemical methods can overcome limitations associated with sparse data in arid regions. By providing a detailed understanding of both the geometry of the aquifer and the spatial variability of groundwater levels, this study supports sustainable management of a critical transboundary water resource. The results highlight the importance of aligning hydrogeophysical investigations with field-based monitoring and chemical analyses to generate actionable insights for groundwater management.

How to cite: Nemer, Z., Boukhalfa, Z., Boukhlouf, W., Boutadara, Y., Kasdi, A. S., Bouzid, A., and Hamoudi, M.: Integrated AMT and VES investigation of the transboundary Continental Intercalaire aquifer in the Sebaa Basin, southern Algeria, EGU General Assembly 2026, Vienna, Austria, 3–8 May 2026, EGU26-210, https://doi.org/10.5194/egusphere-egu26-210, 2026.

EGU26-733 | ECS | Posters on site | HS8.2.10

Sequential estimation of aquifer parameters to assess groundwater pumping in data scarce regions 

ankush kaundal and sekhar muddu

Accurate estimation of groundwater abstraction remains challenging in data-scarce regions where pumping records are rarely available and groundwater models are commonly calibrated using only limited parameter information (e.g., specific yield), while others are adopted from literature. This practice can propagate bias and uncertainty into model predictions. We hypothesize that groundwater abstraction can be estimated more reliably when aquifer and pumping parameters are identified sequentially, rather than simultaneously, through iterative conditioning of the parameter space.

To evaluate this concept, we applied a simplified three-parameter groundwater model and generated 20 synthetic groundwater time series, each with unique pumping inputs. When all parameters were estimated simultaneously, strong parameter correlations produced large uncertainties in pumping estimates, with errors ranging from –26% to +185%. To overcome this, we implemented a sequential GLUE (Generalized Likelihood Uncertainty Estimation) framework, performing 100,000 Monte Carlo simulations per well per iteration. In each iteration, parameters that showed clear convergence—indicated by narrowing behavioural ranges and reduced coefficients of variation—were fixed before proceeding to the next iteration. This sequential reduction of the feasible parameter space substantially improved parameter identifiability and reduced pumping-estimation uncertainty, yielding abstraction estimates within ±10% of the prescribed synthetic values.

The framework was subsequently applied to 75 observed groundwater time series from field wells (2,600 observations), demonstrating that the sequential approach improves recovery of aquifer parameters and produces realistic estimates of pumping even where no pumping data exist. The results highlight the ability of sequential parameter estimation to mitigate equifinality, expose model structural errors (e.g., when pumping is omitted), and enhance the use of simple groundwater models in data-poor regions.

Overall, this study demonstrates that iterative/sequential parameter identification offers a practical and efficient pathway for estimating aquifer parameters, supporting the development of more complex 2-D and 3-D numerical models, and enabling realistic estimation of groundwater abstraction and aquifer properties in regions with limited hydrological information.

How to cite: kaundal, A. and muddu, S.: Sequential estimation of aquifer parameters to assess groundwater pumping in data scarce regions, EGU General Assembly 2026, Vienna, Austria, 3–8 May 2026, EGU26-733, https://doi.org/10.5194/egusphere-egu26-733, 2026.

EGU26-1268 | ECS | Posters on site | HS8.2.10

 Integrated Strategies for Managing Saltwater Intrusion: A Case Study of the Sebikotane Aquifer in Dakar, Senegal 

Axel Laurel Tcheheumeni Djanni, Ndiouck Diop, Nimna Deme, Jean Andre Ndiaye, Waly Sene, and Serigne Faye

Groundwater resources in the Global South are increasingly at risk due to overextraction, contamination, and the impacts of climate variability. These threats are most critical in rapidly growing urban areas, where limited data and inadequate monitoring infrastructure hinder effective resource management. In Dakar, Senegal, the Sebikotane aquifer, a vital freshwater source for the city’s population, has faced severe saltwater intrusion (SWI) caused by decades of overexploitation. Currently, water withdrawals from the aquifer are three times greater than its natural recharge capacity, leading to freshwater wells being increasingly contaminated by saline water.

To address this urgent issue, we present an integrated approach that combines innovative geophysical methods, numerical groundwater modeling, and targeted infrastructure rehabilitation. Advanced techniques such as Electrical Resistivity Tomography (ERT) and Time-Domain Electromagnetic (TEM) surveys are used to delineate the freshwater-saltwater interface and identify key subsurface features influencing aquifer behavior. These geophysical datasets are paired with process-based numerical models (e.g., MODFLOW coupled with MT3DMS) to simulate aquifer flow dynamics, track the movement of freshwater and saline fronts, and assess optimal recharge scenarios. Such simulations are critical to predicting how interventions can combat SWI over time and restore aquifer functionality.

A key structural intervention is the reconstruction of the Panthior Dam, originally built to enhance aquifer recharge but rendered ineffective due to repeated structural failures. The dam is proposed to function as a Managed Aquifer Recharge (MAR) system, channeling surface water into the aquifer through natural infiltration. Additionally, a real-time network of piezometers and water quality sensors will be established to monitor chloride concentrations, aquifer levels, and the progress of recharge efforts. This monitoring infrastructure plays a central role in enabling adaptive management by providing actionable insights into both localized and aquifer-wide conditions.

Our approach showcases the necessity of combining geophysical surveys, hydrological modeling, and engineering solutions to develop robust, data-driven strategies for managing saltwater intrusion and securing freshwater supplies. While the focus of this study is on Dakar, the methodology and findings have broader relevance for other vulnerable coastal aquifers in the Global South experiencing similar groundwater challenges. By integrating scientific tools and infrastructure improvements, this work provides a pathway toward more sustainable, climate-resilient groundwater management for regions where limited resources and data scarcity have historically hindered effective action.

How to cite: Tcheheumeni Djanni, A. L., Diop, N., Deme, N., Ndiaye, J. A., Sene, W., and Faye, S.:  Integrated Strategies for Managing Saltwater Intrusion: A Case Study of the Sebikotane Aquifer in Dakar, Senegal, EGU General Assembly 2026, Vienna, Austria, 3–8 May 2026, EGU26-1268, https://doi.org/10.5194/egusphere-egu26-1268, 2026.

EGU26-12343 | ECS | Posters on site | HS8.2.10

Assessment of soil salinity using inverse modeling of multi-orientation and multi-elevation EMI data: a case of study from Tunisia 

Dorsaf Allagui, Julien Guillemoteau, and Mohamed Hachicha

The intensification of irrigation practices often leads to groundwater overexploitation, resulting in soil salinization in the short term and promoting deeper aquifer salinization in the long term. We consider a case study from Kairouan, central Tunisia, a region characterized by a semi-arid climate and severe water scarcity, to assess soil salinity dynamics under irrigated agriculture.

Soil salinity was monitored by combining two mono-channel frequency domain electromagnetic induction (EMI) sensors (EM31 and EM38) and operating them at different heights and orientations along profiles of 50  m length. The resulting multi-configuration FD-EMI profiles were inverted using pseudo-2D inversion approach based on laterally constrained 1D inversion (1D LCI).

The results reveal clear patterns about salinity distribution associated with different irrigation practices using brackish water, both in the short and long term. A systematic transfer of salinity from surface layers to greater depths was observed. However, salinity levels varied among crops, depending on irrigation frequency, applied water volumes and irrigation type (drip versus sprinkler). Seasonal conditions (wet versus dry periods) also show a strong control on salt redistribution.

This study demonstrates that the combined use of two EMI sensors provides an efficient and non-invasive tool for monitoring soil salinity in irrigated agricultural areas. Moreover, the inverse modeling of the EMI data enables a more accurate and quantitative assessment of soil salinity dynamics at different depths under contrasting irrigation systems.

 Keywords: Soil salinity, hydrogeophysics, electromagnetic induction, inverse modeling.

How to cite: Allagui, D., Guillemoteau, J., and Hachicha, M.: Assessment of soil salinity using inverse modeling of multi-orientation and multi-elevation EMI data: a case of study from Tunisia, EGU General Assembly 2026, Vienna, Austria, 3–8 May 2026, EGU26-12343, https://doi.org/10.5194/egusphere-egu26-12343, 2026.

EGU26-13164 | ECS | Posters on site | HS8.2.10

Electrical resistivity tomography for the characterization of basement aquifers in a humid tropical environment: the start of the pilot site of the University of Yaoundé I (Cameroon) 

Mohamed Moustapha Ndam Njikam, Lionel Mbida Yem, Fabrice Jouffray, Florence Bigot-Cormier, Benoît Viguier, Alessandra Ribodetti, Boris Marcaillou, Benoit Landry Messende, Marie Rose Koh Minfele, and Julien Balestra

Crystalline basement aquifers in tropical environments represent a strategic groundwater resource for rapidly growing urban areas. However, their functioning and vulnerability to contamination remain difficult to assess because deep weathering and inherited structures strongly modify the geometry and compartmentalization of saprolite and fractured horizons. This study presents first hydrogeophysical results from the pilot site of the University of Yaoundé I (UY1-PS) in Cameroon, located within Pan-African gneisses of the Yaoundé domain near the Sanaga Shear Zone. Shallow saprolite wells are widespread but often affected by sewage contamination, whereas springs and deep fractured-basement boreholes provide drinking water for users not connected to the distribution network. To assess long-term groundwater behavior, the monitoring of groundwater levels and hydrochemistry, spring discharges, and hydro-meteorological parameters at three stations was initiated in 2025 at UY1-PS.

High-resolution electrical resistivity tomography (ERT) surveys were acquired between 13 July and 13 August 2025 across the campus using a 4point light 10W resistivity meter in a Wenner–Schlumberger configuration. Inter-electrode spacing ranged from 5 to 10 m, and the spatial distribution of the profiles was constrained by campus infrastructure, including buildings, roads, and buried utilities. A total of thirteen 2-D ERT profiles were collected and inverted using RES2DINV. Most inversions yielded RMS misfits below 10% ; a limited number of profiles located in electrically noisy urban sectors displayed RMS values between 10% and 15%, acceptable for hydrogeological interpretation.

ERT images resolve a stratified weathering profile composed of a conductive saprolite horizon (about 20–200 Ω·m), a transition or saprock zone (approximately 200–800 Ω·m), and a more resistive fractured basement at depth (generally 250–1500 Ω·m), locally juxtaposed with fresh basement blocks exceeding 1800-2000 Ω·m. Sharp lateral resistivity contrasts may delineate vertical to sub-vertical fractured corridors of high transmissivity consistent with inherited tectonic control on aquifer compartmentalization .

These results constrain the internal organization of a tropical urban basement aquifer and support transferable hydrogeophysical workflows applicable to crystalline aquifer systems in humid tropical environment.

Keywords: Hydrogeophysics; Electrical resistivity tomography (ERT); hard rock aquifers; humid tropical environments; tropical urban areas, saprolite.

Acknowledgements

This work was supported by the IRD through the JEAI DELO project https://share.google/8qBqLFSOuMVO4yBIe. The corresponding author was supported by the Make Our Planet Great Again (MOPGA) postdoctoral program funded by Campus France. The authors acknowledge Geoazur (Université Côte d’Azur, CNRS, IRD) and the University of Yaoundé I for their scientific and logistical support.

How to cite: Ndam Njikam, M. M., Mbida Yem, L., Jouffray, F., Bigot-Cormier, F., Viguier, B., Ribodetti, A., Marcaillou, B., Messende, B. L., Koh Minfele, M. R., and Balestra, J.: Electrical resistivity tomography for the characterization of basement aquifers in a humid tropical environment: the start of the pilot site of the University of Yaoundé I (Cameroon), EGU General Assembly 2026, Vienna, Austria, 3–8 May 2026, EGU26-13164, https://doi.org/10.5194/egusphere-egu26-13164, 2026.

The successful implementation of Carbon Capture, Utilization, and Storage (CCUS) technologies relies on the rigorous characterization of geological formations to ensure long-term geomechanical stability and containment integrity. In regions governed by complex hydrogeological dynamics, establishing a robust geomechanical baseline is paramount for effective early-stage site selection. While conventional site assessment typically depends on localized, high-cost geophysical surveys, regional-scale screening requires a more cost-effective methodology for evaluating baseline crustal deformation. This study evaluates the pre-feasibility of CCUS within the Bogotá and Middle Magdalena Valley basins in Colombia, utilizing an evaluation framework that integrates multiscale remote sensing with a systematic review of secondary hydrogeological and geophysical datasets.

To address the requirement for a regional monitoring framework, this investigation employs Sentinel-1 InSAR time-series (processed via MintPy) to identify millimeter-scale surface displacements. These observations are correlated with GRACE and GRACE-FO terrestrial water storage anomalies, which were statistically downscaled through a Random Forest regression—utilizing FLDAS and land-cover predictors—to achieve spatial alignment with the displacement grid resolution. To enhance the interpretation of these signals, the study incorporates a preliminary review of secondary well-log records and pressure data, specifically targeting the identification of pore pressure anomalies and reservoir overexploitation zones that could compromise storage security.

To systematically organize these diverse datasets, an exploratory assisted learning framework was implemented to categorize regional suitability based on stability proxies and hydrogeological response. Preliminary findings from the Bogotá basin, substantiated by Mann-Kendall trend analysis, indicate pronounced subsidence rates reaching up to 9 cm/year in critical sectors. Quantitative analysis demonstrates a spatial consistency exceeding 70% between groundwater level drawdown and InSAR-measured deformation trends, supported by high statistical significance (p-value < 0.05). The identification of these consistent patterns facilitates the effective filtration of seasonal hydrological noise, thereby establishing a baseline to differentiate between elastic soil responses and long-term subsidence risks. These findings establish a structured and robust workflow for the initial pre-feasibility of CCUS projects in geologically complex sedimentary environments where primary data is inherently limited.

How to cite: Romero, P. and Piña, A.: Use of satellite information and application of assisted learning algorithms for CO2 injection and storage and its implications for groundwater in Colombia, EGU General Assembly 2026, Vienna, Austria, 3–8 May 2026, EGU26-16179, https://doi.org/10.5194/egusphere-egu26-16179, 2026.

EGU26-16208 | ECS | Posters on site | HS8.2.10

Data-driven Groundwater Assessment in a Human–Wildlife shared Landscape of Nepal’s Terai 

Mayuri Phukan, Paul Schot, and Jasper Griffioen

The Terai Arc Landscape of Nepal is increasingly affected by land use modification, water diversion upstream, settlement expansion and changes in seasonal rainfall.  These anthropogenic activities and climatic changes impact surface water availability and increases pressure on groundwater resources for supporting human consumption and ecological requirements. This study aims to quantify spatio-temporal changes in groundwater in and around a protected nature area of western Nepal, where wildlife such as tigers, leopards and rhinos and human beings share water resources. The study area encompasses part of the Bardia National Park, located south of the Siwalik hills and partly underlain by the Karnali fluvial fan. Three ephemeral rivers, the Kauriala, Gerua and Babai transcends north to south in the area. Lack of groundwater data and insufficient information on aquifer characteristics are some of the challenges which hinders sustainable groundwater management. A network on 18 groundwater monitoring wells were dug and installed with 18 pressure sensors and 2 barometers, within the framework of "Save the Tiger" project. Statistical methods and time series analysis were used to quantify groundwater heads changes in response to monsoon rainfall and river stage fluctuation, as a function of distance from the rivers. The monitored data established the hydraulic gradient from northeast to southwest, with average annual groundwater heads ranging between 187 – 143 m above sea level. An annual cycle with declining heads in the hot and dry pre-monsoon, a sharp rise in monsoon followed by gradual decline through winter was observed. Wells closer to the Gerua river along the western border of the National Park had rising heads at start of monsoon, reflecting strong hydraulic connectivity. While wells located further away showed slightly delayed rise of head indicating groundwater abstraction effects on recharge. In the agricultural areas of the Karnali fan between Kauriala and Gerua rivers, south of the National Park, a plateau effect was observed between monsoon rise and winter decline. This suggested a temporary buffering effect due to monsoon recharge against pumping. These insights improve understanding of recharge-discharge dynamics in the ecologically sensitive region. Further work includes developing a groundwater flow model for supporting groundwater management in the area.

How to cite: Phukan, M., Schot, P., and Griffioen, J.: Data-driven Groundwater Assessment in a Human–Wildlife shared Landscape of Nepal’s Terai, EGU General Assembly 2026, Vienna, Austria, 3–8 May 2026, EGU26-16208, https://doi.org/10.5194/egusphere-egu26-16208, 2026.

EGU26-17635 | Posters on site | HS8.2.10

Exploring a trilateral transboundary water resource: The Yarmouk Basin. From geochemistry to numerical modelling 

Christian Siebert, Tino Roediger, Eyal Shalev, Hallel Lutzky, Sireen Naoum, and Elias Salameh

The Yarmouk River and its drainage basin are shared by the three riparian states of Jordan, Israel, and Syria. In this semiarid region, the relatively high rainfall makes the basin a crucial water resource for Jordan and an important one for Israel and Syria as well. Within the Lower Yarmouk Gorge, ancient thermal springs discharge, and deep boreholes produce large volumes of artesian groundwater that supply substantial parts of northwestern Jordan.
Based on geochemical and isotopic evidence, a conceptual flow model was developed indicating that these groundwaters are entirely artesian, were recharged more than 10,000 years ago, and originate from distinctly different recharge areas. Large-scale subsurface flow paths extend from the Golan Heights and the Syrian Hauran Plain, while other components are recharged in the Jordanian Ajloun Highlands.
To verify this concept, a numerical flow model was constructed based on a complex, multi-layer hydrogeological framework. The model was calibrated using scarce observation data from Syria, Jordan, and Israel and was subsequently driven by a distributed hydrological model that provided groundwater recharge time series for more than 50 years. In addition, abstraction rates from known well fields were implemented, although these values are conservatively low due to the large number of undocumented pumping activities throughout the basin.
The final transient model, for the first time, encompasses the entire subsurface catchment across national borders and provides new insights into groundwater flow dynamics and the development of extensive depression cones in response to intensive abstraction. The simulated water tables closely match observations, first confirming the conceptual model and second indicating that the resource is approaching its critical limit.
The artesian conditions are expected to diminish in the near future, and the vital contribution of groundwater discharge to the Lower Yarmouk River may cease, with serious consequences for water supply in Jordan and for transboundary water-sharing agreements among the riparian countries.

How to cite: Siebert, C., Roediger, T., Shalev, E., Lutzky, H., Naoum, S., and Salameh, E.: Exploring a trilateral transboundary water resource: The Yarmouk Basin. From geochemistry to numerical modelling, EGU General Assembly 2026, Vienna, Austria, 3–8 May 2026, EGU26-17635, https://doi.org/10.5194/egusphere-egu26-17635, 2026.

EGU26-21343 | Posters on site | HS8.2.10

Integrated Groundwater Modeling to Support Sustainable and Equitable Water Management in a Data-Scarce Volcanic Aquifer, Central Mexico 

Febe Ortiz, Yijiang Xie, Janice Cabeza, Michael McClain, Yangxiao Zhou, and Shreedhar Maskey

Groundwater resources in the Global South are increasingly stressed by rapid urbanization, agricultural expansion, and climate variability, yet effective management is often constrained by limited monitoring infrastructure and fragmented datasets. This study presents an integrated groundwater resource assessment of the Toluca Valley aquifer (central Mexico), a complex, multilayer volcanic system that supplies water to municipal, industrial, and agricultural users while also supporting inter-basin transfers to Mexico City.

A multilayer numerical groundwater flow model was developed using MODFLOW and implemented in the Groundwater Modeling System (GMS) to simulate aquifer dynamics from 1981 to 2017. The model integrates heterogeneous geological and hydrogeological information, long-term groundwater-level observations from multi-piezometer networks, climate-driven recharge estimates, and spatially distributed abstraction data. Monthly transient simulations were calibrated using a combination of manual and automated parameter estimation, explicitly addressing parameter uncertainty arising from sparse subsurface data. Model validation was strengthened through comparison of MODFLOW-simulated river leakage with independently derived SWAT baseflow estimates, providing cross-model consistency for surface–groundwater interactions.

Results indicate a progressive transition from near-balanced groundwater conditions in the 1980s to persistent storage deficits exceeding 70 million m³/year by 2017, driven primarily by increased abstraction that outpaces recharge. The strongest groundwater declines occur in high-elevation recharge zones, highlighting inequities in resource depletion between recharge areas and demand centers.

By combining accessible public datasets, integrated modeling, and uncertainty-aware calibration, this work demonstrates an inclusive and transferable approach to groundwater characterization in data-scarce regions. The results support evidence-based, locally grounded strategies for sustainable and climate-resilient groundwater governance.

How to cite: Ortiz, F., Xie, Y., Cabeza, J., McClain, M., Zhou, Y., and Maskey, S.: Integrated Groundwater Modeling to Support Sustainable and Equitable Water Management in a Data-Scarce Volcanic Aquifer, Central Mexico, EGU General Assembly 2026, Vienna, Austria, 3–8 May 2026, EGU26-21343, https://doi.org/10.5194/egusphere-egu26-21343, 2026.

EGU26-21789 | Posters on site | HS8.2.10

Integrated hydrogeophysics, geochemistry, and monitoring for characterization of groundwater resources in Eastern Senegal 

Paul McLachlan, Axel Tcheheumeni, Sebastian Uhlemann, and Denys Grombacher

Groundwater in southeastern Senegal faces pressures from climate variability, overabstraction, and geogenic contamination. As part of a Geoscientists Without Borders initiative, we conducted an integrated geoscientific investigation in Saraya, Eastern Senegal, to map groundwater potential, assess water quality, and build local capacity. Transient electromagnetic (TEM) soundings and electrical resistivity tomography (ERT) profiles were acquired, supported by targeted geological mapping and groundwater sampling.

Geophysical imaging identified fractures and deep regolith as the main water-bearing units, though highly variable in extent. The town of Badioula shows promising aquifer continuity with generally good water quality, while Saraya was characterized by poorer water quality.

To complement the geophysical surveys, real-time monitoring was piloted using a LoRa-based network with water level and electrical conductivity sensors linked to a weather station. The system captured rainfall-driven recharge responses and conductivity fluctuations, providing a blueprint for cost-effective monitoring in remote regions.

This integrated approach underscores the value of combining TEM, ERT, geochemistry, and low-cost monitoring to guide sustainable groundwater abstraction in crystalline basement terrains. Beyond technical outcomes, the project strengthened local expertise through MSc training, outreach, and workshops, highlighting hydrogeophysics as a tool for water security.

How to cite: McLachlan, P., Tcheheumeni, A., Uhlemann, S., and Grombacher, D.: Integrated hydrogeophysics, geochemistry, and monitoring for characterization of groundwater resources in Eastern Senegal, EGU General Assembly 2026, Vienna, Austria, 3–8 May 2026, EGU26-21789, https://doi.org/10.5194/egusphere-egu26-21789, 2026.

EGU26-763 | Orals | HS8.2.11

Event-Based Analysis of Recharge Dynamics in a Heterogeneous Hard-Rock Catchment using Hydrogeophysical Techniques 

Abdul Khalique, Akarsh Singh, Vidhi Singh, and Kumar Gaurav

Understanding recharge processes in heterogeneous hard-rock terrains is essential for sustainable groundwater management. This study examines the spatiotemporal recharge dynamics of a 2 km² experimental micro-catchment in Rajasthan, India, using integrated hydrometeorological observations, Direct Current resistivity and Induced Polarization (DC–IP) imaging, Normalized Difference Vegetation Index (NDVI) time series, and aquifer tests. NDVI provided seasonal moisture variability, while ten DC–IP profiles delineated subsurface architecture and structural controls on flow.

Geophysical sections reveal a highly heterogeneous system dominated by massive high-resistivity sandstone blocks (>200 Ω·m) intersected by vertical to sub-vertical low-resistivity fracture zones (<50 Ω·m). Low to moderate chargeability (<10 mV/V) within these conductive features indicates groundwater-bearing fractures rather than shale layers. The fracture networks near Wells S1 and S2 are structurally isolated, despite being separated by only ~30 m. Slug tests indicate low hydraulic conductivities in both wells (Ks₁ = 2.42×10⁻⁸ m/s; Ks₂ = 1.06×10⁻⁸ m/s), with S1 being slightly more conductive.

Event-based analysis of 25 monsoon rainfall–recharge events shows contrasting well responses due to their structural positions. Well S1, located 5 m from an intermittent stream bank, exhibits a flashy early-season bank-storage response with high Specific Water Level Rise (SWLR), later transitioning to rapid recession and reduced efficiency as water levels exceed the streambed. In contrast, Well S2 (35 m from the stream bank) shows delayed but consistent responses, with stable SWLR and recession rates, characteristic of a structurally confined storage zone. Cross-correlation analysis confirms strong coupling in peak responses but moderate similarity in lag and recession behaviour.

These findings show that rapid water-level rises in hard-rock terrains often reflect transient drainage pathways rather than sustainable storage. Managed Aquifer Recharge strategies should therefore target structurally controlled, high-retention fractured zones (e.g., S2) instead of stream-connected fracture corridors (e.g., S1).

How to cite: Khalique, A., Singh, A., Singh, V., and Gaurav, K.: Event-Based Analysis of Recharge Dynamics in a Heterogeneous Hard-Rock Catchment using Hydrogeophysical Techniques, EGU General Assembly 2026, Vienna, Austria, 3–8 May 2026, EGU26-763, https://doi.org/10.5194/egusphere-egu26-763, 2026.

In arid regions such as the Eastern Bahira Basin (Morocco), groundwater represents the primary resource for drinking water supply and irrigation. The sustainable management of these resources requires a detailed understanding of aquifer geometry, deep structural controls, and the identification of the most favorable zones for groundwater exploitation. However, this remains a major challenge in the Eastern Bahira Basin, directly affecting the effectiveness of regional water supply and irrigation programs.

This study adopts an integrated geophysical approach combining newly acquired Electrical Resistivity Tomography (ERT) data with the compilation and reinterpretation of legacy gravity, seismic reflection, and vertical electrical sounding (VES) datasets. Gravity data were reprocessed using advanced techniques, including residual anomaly analysis and horizontal gradient maxima, to delineate major subsurface structural lineaments. Seismic reflection data were reinterpreted to improve the characterization of the basin’s deep structure, incorporating recent borehole information. The interpretations derived from gravity and seismic analyses were further constrained and validated by VES and ERT results acquired across key sectors of the basin.

The integrated interpretation reveals the dominant structural framework controlling aquifer geometry and groundwater distribution in the Eastern Bahira Basin and identifies the most promising hydrogeological targets. These results provide new insights into the deep structural organization of the basin and contribute to improving groundwater exploration strategies and the sustainability of ongoing drinking water supply and irrigation projects in this arid region.

How to cite: Charbaoui, A., Kchikach, A., and Jaffal, M.: Deep Structural Control on Groundwater Systems in the Eastern Bahira Basin (Morocco) Revealed by Integrated Gravity, Seismic, and Electrical Resistivity Data, EGU General Assembly 2026, Vienna, Austria, 3–8 May 2026, EGU26-1644, https://doi.org/10.5194/egusphere-egu26-1644, 2026.

EGU26-4223 | Orals | HS8.2.11

Flood‑Induced Changes in Riverbed Salinity Observed Using Instream Hydrogeophysics in a Semi‑Arid River System 

Eddie W. Banks, Mike Hatch, Saskia Noorduijn, and Todd Wallace

River regulation has contributed to increased soil and groundwater salinity across many floodplains in semi-arid Australia. Floodplain inundation has the potential to flush salt from the soil profile and reduce groundwater salinity in shallow aquifers. However, the effectiveness of flood events in removing accumulated floodplain salt remains poorly constrained. This uncertainty reflects the long-term legacy of salt accumulation, spatial variability in groundwater depth, and changes in the capillary transport zone. Salt movement within floodplains is influenced by multiple interacting factors, including river geomorphology, shallow aquifer properties, remnant paleochannels, and hydraulic gradients between surface water and groundwater. To assess the impact of flooding on salt redistribution at the river–floodplain aquifer interface, instream hydrogeophysics surveys (transient electromagnetic-TEM) were conducted along Katarapko Creek and the River Murray at Bookpurnong, South Australia, following the major 2022–2023 River Murray flood event. These surveys mapped spatial variations in riverbed electrical conductivity and identified potential zones of saline groundwater inflow. Comparisons with surveys undertaken in 2015 and 2019 reveal substantial post-flood changes in riverbed conductivity, including an overall reduction in conductivity. A follow-up survey in 2024 confirmed that the spatial distribution of conductivity features remained consistent across all survey periods. Despite the general decrease in riverbed conductivity following the flood, several discrete zones continue to act as preferential pathways for saline groundwater discharge from the floodplain to the river. The persistence of these salinity hotspots indicates that considerable salt stores remain within the floodplain system. These findings suggest that while large flood events can reduce near-surface salinity, targeted adjustments to river regulation may be required to restore key hydrological processes and support long-term ecological recovery of the river system.

How to cite: Banks, E. W., Hatch, M., Noorduijn, S., and Wallace, T.: Flood‑Induced Changes in Riverbed Salinity Observed Using Instream Hydrogeophysics in a Semi‑Arid River System, EGU General Assembly 2026, Vienna, Austria, 3–8 May 2026, EGU26-4223, https://doi.org/10.5194/egusphere-egu26-4223, 2026.

EGU26-7101 | ECS | Orals | HS8.2.11

Hydrogeological Characterization of Fine-Grained Floodplain Aquifers Using Integrated Geophysical and Rock-Physics Approaches 

Mauricio Arboleda-Zapata, Konstantin Drach, Carsten Leven, Peter Dietrich, and Olaf A. Cirpka

Floodplains in low-energy depositional environments often feature fine-grained facies with relatively low hydraulic conductivities (< 1 × 10⁻⁵ m s⁻¹). In such systems, the most hydraulically conductive zones are often associated with calcareous-rich deposits, which consist of freshwater unlithified tufa, but also include organic-rich layers. This study examines the spatial distribution and hydrogeological significance of calcareous-rich units under fully-saturated conditions at two contrasting floodplain sites in Southwestern Germany. Site 1 is located within a relatively wide floodplain (~800 m wide), where these calcareous units can reach a thickness of up to 7 m. In contrast, site 2 is located within a narrower floodplain (~100 m wide), where these units reach a thickness of up to 3 m.

At site 1, we acquired 2-D geoelectrical and borehole nuclear magnetic resonance data, which were used within a rock-physics framework combining Archie’s law and the Kozeny-Carman model to estimate the hydraulic properties of calcareous-rich units. Collocated pumping test, which indicate hydraulic conductivities of 1 × 10⁻⁶ to 1 × 10⁻⁵ m s⁻¹, were used as ground truth to calibrate the site-specific parameters of the rock-physics models. Such calibrated models may subsequently be applied at other field sites with similar characteristics where only resistivity data are available.

At field site 2, we collected geoelectrical and seismic data (P- and S-waves) to identify the spatial distribution of the calcareous-rich units. The resulting resistivity and S-wave velocity models delineated these units in agreement with collocated borehole data. In contrast, the P-wave velocity model did not clearly resolve them but provided useful constraints on the depth to bedrock. At this site, rock-physics approaches similar to those applied at field site 1 will be used to support planned hydrogeological modeling and enable direct comparison between the two sites.

Our preliminary results demonstrate the potential of integrated geophysical and rock-physics approaches to identify and characterize hydraulically relevant units within fine-grained–dominated aquifer systems.

How to cite: Arboleda-Zapata, M., Drach, K., Leven, C., Dietrich, P., and Cirpka, O. A.: Hydrogeological Characterization of Fine-Grained Floodplain Aquifers Using Integrated Geophysical and Rock-Physics Approaches, EGU General Assembly 2026, Vienna, Austria, 3–8 May 2026, EGU26-7101, https://doi.org/10.5194/egusphere-egu26-7101, 2026.

EGU26-7679 | ECS | Orals | HS8.2.11

Exploring soil heterogeneity across scales in a Chianti vineyard (Italy) using EMI, multi-resolution ERT and plant-scale time-lapse imaging 

Matteo Censini, Luca Peruzzo, Mirko Pavoni, Viola Cioffi, Francesca Sofia Manca Di Villahermosa, and Giorgio Cassiani

Understanding water dynamics in the root zone is crucial for improving eco-hydrological modelling and sustainable agricultural practices. However, soil processes in agricultural environments are strongly affected by spatial heterogeneity, and observations often depend on the measurement scale and on the sampled support volume. Here we present a multi-scale hydrogeophysical investigation carried out in a vineyard in the Chianti area (Tuscany, Italy), designed to connect field-scale characterization with high-resolution imaging at the plant scale. The study combines electromagnetic induction (EMI) surveys using a multi-coil CMD Mini Explorer to map near-surface variability across the vineyard, and electrical resistivity tomography (ERT) profiles acquired with different electrode spacings (1 m, 0.5 m and 0.25 m) to progressively increase spatial resolution in the first meters of the subsurface, with a specific focus on the first meter. To further explore root-zone dynamics at the finest scale, we performed a high-resolution 3D time-lapse ERT experiment around a single grapevine. A dense micro-ERT array was installed around the plant and repeated measurements were acquired every two hours. The experiment was repeated in two contrasting periods (October and July), and each monitoring campaign included two controlled irrigation phases to trigger transient hydrological responses. In parallel, the vineyard hosts additional monitoring activities (e.g. Cosmic Ray Neutron Sensing), which provide broader hydrological context. Overall, this dataset illustrates how combining EMI, multi-resolution ERT and plant-scale 3D time-lapse imaging can help quantify soil heterogeneity across scales and improve the interpretation of near-surface processes relevant to infiltration and root-zone dynamics in precision viticulture.

How to cite: Censini, M., Peruzzo, L., Pavoni, M., Cioffi, V., Manca Di Villahermosa, F. S., and Cassiani, G.: Exploring soil heterogeneity across scales in a Chianti vineyard (Italy) using EMI, multi-resolution ERT and plant-scale time-lapse imaging, EGU General Assembly 2026, Vienna, Austria, 3–8 May 2026, EGU26-7679, https://doi.org/10.5194/egusphere-egu26-7679, 2026.

EGU26-8159 | ECS | Orals | HS8.2.11

Laboratory experiments to determine the hydraulic heterogeneity of sediments with SIP 

Robert Herold and Frank Börner

The investigation of preferential flow paths in the subsurface is necessary e.g., for the prediction of contaminant transport. Usually, hydraulic methods are applied for that, however, the geophysical method Spectral Induced Polarization (SIP) offers a different approach. As it can be applied from the earth’s surface, the groundwater state does not get disturbed and it is capable of continuous imaging. As hydraulic heterogeneity is a key factor that causes preferential flow paths, it was our aim to describe hydraulic anisotropy and heterogeneity in a series of laboratory experiments electrically and hydraulically.

The experimental set up consists of a sample holder that can contain samples of 18 cubic decimeters in size. Electric and hydraulic measurements can be carried out without disturbing the sample. In two measurement series we investigated a combination of two different sands and a combination of sand and sandstone. The samples were investigated under pressurized groundwater conditions. In the measurement series we varied the volume share of the two components of the sample and the orientation of the layer boundaries relative to the direction of flow.

The results indicate that the electrical parameters like imaginary part of conductivity, phase shift and chargeability are dependent on the sample orientation, but only if there is a significant contrast in the conductivity amplitude of the two components. Otherwise, only the volume share of both components can be determined. The results can be useful for an improved interpretation of field measurements. Future work could be aimed at validating these findings in further measurement series with different material and field measurements.

How to cite: Herold, R. and Börner, F.: Laboratory experiments to determine the hydraulic heterogeneity of sediments with SIP, EGU General Assembly 2026, Vienna, Austria, 3–8 May 2026, EGU26-8159, https://doi.org/10.5194/egusphere-egu26-8159, 2026.

Abstract. Dynamic changes in soil water content (SWC) are a crucial controlling factor for ecosystem function, agricultural productivity, and geotechnical stability against settlement and seepage failures. Real-time and accurate monitoring is essential for understanding hydrological processes and their response to climate change. Estimates of relative velocity variations (dv/v) from ambient seismic noise measurements have emerged as a highly sensitive and non-invasive geophysical tool for long-term surveillance of near-surface property changes. However, during non-frozen periods, dv/v signals are jointly affected by changes in both subsurface temperature and SWC. Inadequate corrections of temperature effects are indeed emerging as a key limitation for the quantitative interpretation of dv/v measurements for changes in SWC. To date, most temperature correction schemes approximate the subsurface thermal state using surface temperature, thus, overlooking the depth-dependent attenuation of thermal diffusion, which, in turn, biases the estimations of soil water content changes (SWCC). We propose a frequency-depth thermal correction framework that links the depth sensitivity of dv/v at different frequencies with the subsurface temperature profile. By establishing a quantitative relationship between frequency and depth, the temperature profile is transformed into frequency-dependent equivalent temperatures. This allows to correct dv/v estimates in each frequency band using the corresponding equivalent temperature rather than the surface temperature, thereby capturing the true depth-dependent thermal state governed by heat diffusion. Using temperature-corrected dv/v estimates and rock physics models combining Hertz–Mindlin contact theory and Gassmann’s fluid substitution, we retrieve dynamic changes in surficial SWC. Tests on both synthetic and field data ground-trothed by time-domain reflectivity (TDR) measurements demonstrate that the proposed FDTC method effectively suppresses temperature-induced artifacts in relating dv/v estimates to changes in SWC. The proposed method thus provides a robust temperature correction for ambient-noise-based SWC monitoring during non-frozen periods.

Acknowledgements. This project was funded by the National Key Laboratory of Jilin Province (Discipline Category) Major Project (Research and Development of Geophysical Imaging and Equipment for Freeze-Thaw Hydrological Processes in Black Soil in High-Latitude Regions, No. SKL202502020JC).

How to cite: Hu, R., Li, J., and Liu, H.: A depth-sensitive thermal correction method allowing for quantitative monitoring of changes in soil water content from ambient noise measurements, EGU General Assembly 2026, Vienna, Austria, 3–8 May 2026, EGU26-9397, https://doi.org/10.5194/egusphere-egu26-9397, 2026.

Electrical resistivity tomography (ERT) is a non-destructive geophysical method that provides images of the soil electrical resistivity. In particular, this study focuses on small-scale soil subsurface areas (up to 1 m deep). Soil resistivity depends on several factors, particularly soil water content. Consequently, ERT has proven to be effective in detecting water flow pathways during infiltration tests. ERT has already been used for hydroecological and hydrogeological applications, but its use still requires further investigation and new developments, particularly for specific processes such as preferential flows. Indeed, water infiltration into the soil is all but homogeneous with the occurrence of preferential flows due to several factors (lithological heterogeneity, macropores, cracks, macrofauna galleries, and root channels). The presence of these preferential flows promotes the downward movement of water and solutes to deeper soil horizons. Thus, the detection of these flows using geophysical methods, such as ERT, should provide a better understanding of the dynamics of preferential flows. However, conventional ERT inversion methods have proven unable to provide insight into the processes at adequate scales (e.g., the macropore scale) and have shown difficulties in detecting sharp variations because of smoothing constraints. Information from apparent resistivity may be lost because of these constraints.

To overcome these limitations, an inversion method based on Convolutional Neural Networks (CNNs) is proposed to detect small-scale resistivity heterogeneities. For the training step, we designed a specific generator to produce synthetic resistivity data for various 2D random electrical resistivity distributions mimicking different types of soil heterogeneity (earthworm and root induced macropore, layering, etc.) and for typical protocols for ERT acquisition. For each case, our database associates the true resistivity field with the apparent resistivity. This database contains a large number of training pairs that allow machine learning.

The preliminary results show that while some predictions were able to predict properly the soil heterogeneities (shape and size), the values of the estimated true resistivity were far from the target values. To avoid unrealistic estimates, we added physical constraints during the training process. An additional forward calculation was performed based on the true resistivities predicted by the neural network, then the apparent resistivities corresponding to the predicted resistivities were compared to the apparent resistivities corresponding to the targeted true resistivities and a supplementary loss function was added to the initial loss function. At this stage, the neural networks were trained on heterogeneous resistivity distributions in the soil with neither time evolution nor link to hydrological processes. In the future, the resistivity generator will be coupled with hydrological models to simulate water infiltration dynamics and changes in soil water content over time. This perspective is essential for applying the proposed method to detect flow pathways during infiltration tests.

How to cite: Florent, G., Rémi, C., and Laurent, L.: Detection of macropore-sacle soil heterogeneities related to water preferential flows at meter depth by using Electrical Resistivity Tomography (ERT) and machine learning 2D inversion, EGU General Assembly 2026, Vienna, Austria, 3–8 May 2026, EGU26-9402, https://doi.org/10.5194/egusphere-egu26-9402, 2026.

EGU26-12558 | Posters on site | HS8.2.11

Contribution of Geophysics to the Study of Urban Soils Amended with Biochar 

Frédéric Delarue, Sylvain Pasquet, Julien Thiesson, Alicia Laden, Nils Dubois, Audrey Burzawa, Emmanuel Aubry, Elise Prothery, and Ludovic Bodet

By 2050, climate changed-induced extreme heat waves and urban heat island phenomenon will lead to severe soil drought, which can affect trees health and sustainability of green spaces. By-product of the pyrolysis of biomass, biochar incorporation can favor soil water retention and can be seen as a potential tool to mitigate future soil drought. In order to test the ability of biochar incorporation into soil to improve water retention, experimentations are necessary to evaluate its efficiency. To do so, experimental tests involving monitoring would require destructive, costly and sparse spot measurements that are not representative of the heterogeneous nature of studied technosols. This work explores how geophysics can overcome such limitations, by enabling spatialized, non-invasive monitoring of soils at the scale of experimental plots. Control and biochar-amended plots (n > 3) were monitored over time with spectral induced polarization (SIP) and active seismic methods. Initial results suggest that SIP can distinguish the presence of biochar through marked contrasts in resistivity and phase, which evolve with time suggesting a potential monitoring of biochar aging (e.g. fragmentation, migration and oxidation). At the same time, seismic surface-wave velocity measurements show sensitivity to seasonal variations, as well as a quasi-systematic decrease in velocities in amended soils, which could reflect changes in porosity and/or water content. This approach serves as a proof of concept for highlighting the potential of geophysics as an in situ diagnostic tool, capable of monitoring the effect of biochar by providing reliable and integrative indicators of water content in heterogenous urban soils.

How to cite: Delarue, F., Pasquet, S., Thiesson, J., Laden, A., Dubois, N., Burzawa, A., Aubry, E., Prothery, E., and Bodet, L.: Contribution of Geophysics to the Study of Urban Soils Amended with Biochar, EGU General Assembly 2026, Vienna, Austria, 3–8 May 2026, EGU26-12558, https://doi.org/10.5194/egusphere-egu26-12558, 2026.

EGU26-12656 | ECS | Posters on site | HS8.2.11

Constraining hydrological models by combining ground-based gravimetry and magnetic resonance sounding 

Isabelle Schmidt, Christian Freier, Bastian Leykauf, Vladimir Schkolnik, Gregor Willkommen, and Costabel Stephan

Hydrological models, which simulate natural processes, are prone to uncertainty due to shortcomings such as data being insufficient or incomplete, limited to point scale or the equifinality of the model itself. Using varying data sources to constrain the model can help to overcome these issues and to create more reliable models. As variations in subsurface water storage are equivalent to mass redistributions that are proven to be measurable using modern gravimetry equipment, gravity measurements can advance hydrological modelling. Magnetic resonance soundings (MRS) probe the 1H spin magnetization of subsurface water molecules and provide vertical water content distributions covering both the saturated and unsaturated zone. The use of gravity and MRS data to improve hydrological modelling is explored in this project. An integrated hydrological model is built, which simulates surface and subsurface flows, and its output is converted into the corresponding changes in gravity on the one hand, and in the MRS response on the other. These numerical results are then compared with real measurements of a high-precision quantum absolute gravimeter as well as of an MRS device with reduced instrumental dead time optimized to provide water content information from the unsaturated zone with increased accuracy. Whereas MRS measurements are point information similar to borehole data, yet non-invasive and thus cheaper than hydrogeological drillings, gravity measurements are beneficial, as they provide integrated information over extended areas. However, they also capture other processes causing mass redistributions, which is why they can produce significant noise. Thus, it is expected that processes in the unsaturated zone, although contributing to the signal, might be difficult to detect by the quantum gravimeter despite of its improved resolution properties. This is why we expect the combination with the additional MRS data might be superior to the usage of hydrogravimetry alone.  

How to cite: Schmidt, I., Freier, C., Leykauf, B., Schkolnik, V., Willkommen, G., and Stephan, C.: Constraining hydrological models by combining ground-based gravimetry and magnetic resonance sounding, EGU General Assembly 2026, Vienna, Austria, 3–8 May 2026, EGU26-12656, https://doi.org/10.5194/egusphere-egu26-12656, 2026.

Urban development in central Saudi Arabia is frequently challenged by subsurface cavities formed through dissolution and weathering of limestone formations. These hidden features pose significant geotechnical risks, including differential settlement and structural instability. This research presents the results of a high-resolution three-dimensional Electrical Resistivity Tomography (ERT) investigation conducted at a construction site in Riyadh to detect and delineate subsurface cavities and weak zones prior to foundation construction.

The survey covered a 30 m × 40 m site excavated to basement level and was performed using an AGI SuperSting R8 system with a total of 111 electrodes deployed at 1 m spacing along three sides of the plot. A mixed dipole-gradient array configuration was adopted to optimize lateral resolution and depth penetration. Approximately 7,600 data points were acquired and processed using AGI EarthImager 3D software, with rigorous quality control applied prior to inversion. The resulting 3D resistivity model imaged subsurface conditions down to 10 m depth.

The inversion results reveal a heterogeneous limestone subsurface characterized by high-resistivity zones corresponding to competent, massive limestone and distinct low-resistivity anomalies interpreted as cavities, fractured zones, or weathered limestone. Three major weak zones were identified at the southwestern, southeastern, and northeastern portions of the site, extending to depths of 5-7 m. Borehole data confirmed the presence of cavities in two of these zones, validating the ERT interpretation. This research demonstrates the effectiveness of 3D ERT as a non-invasive tool for detecting subsurface cavities in karst-prone limestone environments and highlights its value in guiding targeted ground improvement and foundation design in urban construction projects.

How to cite: Jadoon, K. Z. and Shahzad, S.: Detection of Subsurface Cavities in Limestone Terrain Using 3D Electrical Resistivity Tomography (ERT): A Case Study from Riyadh, Saudi Arabia, EGU General Assembly 2026, Vienna, Austria, 3–8 May 2026, EGU26-15729, https://doi.org/10.5194/egusphere-egu26-15729, 2026.

EGU26-19740 | ECS | Posters on site | HS8.2.11

Uncertainty Quantification of the Fresh-Saltwater Interface from Time-Domain Electromagnetic Data 

Arsalan Ahmed, Thomas Hermans, David Dudal, and Wouter Deleersnyder

Geophysical methods provide a cost-effective way to characterize the subsurface for hydrogeological projects, but they rely on solving an inverse problem. Traditionally, deterministic approaches are used, which face challenges related to non-uniqueness of the solution. In contrast, stochastic methods offer uncertainty quantification but generally require higher computational resources. Bayesian Evidential Learning (BEL) has been proven as a reliable alternative to solve the inverse problem stochastically. BEL bypasses full stochastic inversion by learning a direct relationship between data and model parameters, allowing to approximate the posterior distribution at a lower computational cost. However, as with most Monte Carlo techniques, BEL efficiency depends on the number of inversion parameters.

In this contribution, we show that incorporating prior physical knowledge about the imaged processes into the parameterization of model parameters efficiently reduces the number of unknowns, and subsequently the computational burden of BEL. Using time-domain electromagnetic data (TEM), we characterize the fresh - saltwater transition zone in the Flemish coastal aquifer. This transition can be sharp, gradual or very smooth depending on the local hydrogeological context.  Conventional  blocky or smooth deterministic inversions then often misrepresent this transition zone as too sharp or too gradual. To address this, we explicitly incorporate the transition zone in the parameterization, with two variables: its depth and its thickness, assuming a linear increase of conductivity within this thickness. The transition zone is underlying a freshwater zone with constant conductivity and overlying a saline zone, also with constant conductivity. This retains the compactness of blocky or layered inversion while allowing sharp or gradual interfaces like voxel-based methods.

To assess the reliability and robustness of the method, we invert these parameters stochastically using BEL with Thresholding (BEL1D-T). Results indicate this approach effectively captures uncertainty for synthetic and field data. The transition zone remains largely uncertain due to the limited sensitivity of the TEM set-up to the relatively shallow transition observed in the Belgian coastal area. Yet, our probabilistic method achieves this without the heavy computational cost of traditional stochastic approaches. The result also shows that the uncertainty can be efficiently reduced when prior information on the presence of confining layer (e.g., clay layer) is further introduced in the parameterization.

Keywords: time-domain electromagnetics, inverse problem, uncertainty quantification, fresh-saltwater interface (FSI)

How to cite: Ahmed, A., Hermans, T., Dudal, D., and Deleersnyder, W.: Uncertainty Quantification of the Fresh-Saltwater Interface from Time-Domain Electromagnetic Data, EGU General Assembly 2026, Vienna, Austria, 3–8 May 2026, EGU26-19740, https://doi.org/10.5194/egusphere-egu26-19740, 2026.

EGU26-19766 | ECS | Orals | HS8.2.11

Optimising the Design of a Laboratory Column for Evaluating ERT Detectability of Changes in Landfill Gas Production 

Saheed Opeyemi Adebunmi, Helen Kristine French, Esther Bloem, and Remi Clement

Electrical Resistivity Tomography (ERT) is a widely used method for characterizing subsurface structures and monitoring time‑lapse processes. Its versatility across scales has enabled laboratory investigations of solute and gas dynamics in rocks and sediments. ERT has also been applied to assess landfill interiors, where electrical conductivity variations reflect differences in moisture content and waste chemistry. Landfill gas, mainly consisting of CO₂ and CH₄ produced during the degradation of organic waste may influence these electrical signatures. However, monitoring landfill gas release with ERT remains challenging due to the complex and dynamic nature of landfills. To examine how ERT responds to gas presence and movement under controlled landfill‑relevant conditions, we constructed a laboratory‑scale cylindrical ERT column system. Here, we present the first stage of the experiment, focusing on the design, optimization, and validation of the ERT column. By combining forward modeling and preliminary laboratory tests, we identified the limitations of the laboratory column in terms of spatial resolution, measurement sensitivity patterns, and errors related to measurement and both forward and inverse modeling. Beyond demonstrating the importance of pre-optimizing an ERT system before implementation, this study provides guidelines for designing laboratory columns for similar research. Most previous studies have only provided a brief documentation of this process.

How to cite: Adebunmi, S. O., French, H. K., Bloem, E., and Clement, R.: Optimising the Design of a Laboratory Column for Evaluating ERT Detectability of Changes in Landfill Gas Production, EGU General Assembly 2026, Vienna, Austria, 3–8 May 2026, EGU26-19766, https://doi.org/10.5194/egusphere-egu26-19766, 2026.

Geophysical methods offer substantial potential to support the characterization, monitoring, and remediation of contaminated soil and groundwater systems. Their ability to provide spatially continuous information through non- or minimally invasive techniques has motivated a wide range of applications in heterogeneous subsurface environments. Over the past decades, this has resulted in numerous case studies and several review papers. Nevertheless, insights reported in the literature remain difficult to relate across contamination types, subsurface conditions, spatial scales, and the timing of geophysical use.

This contribution presents a work-in-progress synthesis of recent peer-reviewed literature (approximately the last five years) on geophysical methods in soil and groundwater contamination studies. The synthesis covers studies ranging from controlled experimental settings to pilot-scale setups and full-scale field investigations. It provides an overview of the contaminants addressed, the geophysical techniques applied – individually and in combination – and their associated spatial scale, coverage, and resolution.

A specific point of attention is how geophysical data are interpreted, calibrated, or validated in relation to contaminant distribution, fate, and transport, as reported in the literature. For field-based studies, the synthesis also considers contextual aspects such as historic and present land use, the timing of geophysical application relative to investigation and remediation activities, and the level of detail and transparency in data reporting.

By structuring recent applications reported in the literature, this synthesis provides an updated overview of current practices and recurring challenges. By relating reported studies to different stages of the contaminated site investigation and remediation value chain, it aims to be relevant to both the scientific community and users in professional practice.


How to cite: Van De Vijver, E. and Orta, D.: Geophysical methods in soil and groundwater contamination studies: recent applications and developments, EGU General Assembly 2026, Vienna, Austria, 3–8 May 2026, EGU26-20687, https://doi.org/10.5194/egusphere-egu26-20687, 2026.

EGU26-20792 | Orals | HS8.2.11

Geophysical monitoring for quantifying changes in soil saturation and salinity along coastal interfaces during flooding 

Kennedy O. Doro, Efemena D. Emmanuel, Xingyuan Chen, Rod A. Kenton, J. Patrick Megonigal, Peter Regier, Nicholas D. Ward, and Vanessa L. Bailey

Hydrological disturbances, including intense precipitation and sea level rise along coastal interfaces, lead to freshwater flooding and saline water overwash that changes the soil saturation and salinity and, in turn, alters subsurface biogeochemical reactions and soil-plant-atmosphere exchanges. The extents of these state changes are not well known, limiting their accurate representation in earth system models. In this study, we combined the spatial-temporal parameter measurements advantage of geophysical imaging with discrete in-situ and laboratory measurements and petrophysical relationships to quantify changes in soil moisture and salinity at an improved spatial scale. 

We simulated a concurrent freshwater and estuarine water flooding at two adjacent 2,000 m2 forested plots by inundating them with 265 m3 of freshwater and estuarine water with salinities of 0.06 and 8.1 practical salinity units (PSUs), respectively. The flooding experiment was conducted over a single 10-hour cycle for year 1 and for two and three flooding cycles for years 2 and 3, respectively, with a 14-hour pause between each cycle. During each flooding experiment, repeated electrical resistivity and induced polarization measurements were used to image the water and solute infiltration fronts along two 100 m and 42 m transects while soil moisture, temperature, and electrical conductivity were monitored every 15 minutes with soil sensors installed at 5, 15 and 30 cm depths and co-located with the geophysical transects. Petrophysical models derived from laboratory multi-salinity electrical measurements were used to estimate changes in soil moisture and fluid salinity from field measurements of real and imaginary conductivity during the flooding experiment. 

During flooding, the real electrical conductivity increased by ~100% in the freshwater plot and ~570% in the estuarine water plot. The change in imaginary conductivity in the freshwater plot was < 1 mS/m, whereas that of the estuarine water plot was ~5 mS/m. The real conductivity shows a dependence on soil moisture content with a coefficient of determination (R2) >0.7, while the imaginary conductivity shows a dependence on soil salinity with R2 >0.6. Repeated monitoring over 3 years shows >60% change in ambient soil electrical conductivity at the estuarine water plot, indicating an increase in soil salinity over time. 

These results validate the use of electrical resistivity for estimating changes in coastal soils' moisture content in response to flooding. Combining the electrical resistivity with induced polarization measurements provides the possibility to account for changes in pore fluid conductivity. The intermittent geophysical monitoring limits the comparison of geophysical data with in-situ soil parameters measurement to develop a more robust petrophysical model. This study would benefit from the use of continuous automatic electrical resistivity and induced polarization monitoring, which is becoming increasingly popular for ecohydrological studies.

How to cite: Doro, K. O., Emmanuel, E. D., Chen, X., Kenton, R. A., Megonigal, J. P., Regier, P., Ward, N. D., and Bailey, V. L.: Geophysical monitoring for quantifying changes in soil saturation and salinity along coastal interfaces during flooding, EGU General Assembly 2026, Vienna, Austria, 3–8 May 2026, EGU26-20792, https://doi.org/10.5194/egusphere-egu26-20792, 2026.

EGU26-21623 | ECS | Posters on site | HS8.2.11

Hydrogeophysical characterization of the basaltic aquifer of Djibouti. 

Bahdon Elmi Ragueh, julie Albaric, Hélène Celle, Rachid Robleh Ragueh, Mohamed Osman Awaleh, and Jalludin Mohamed

The Republic of Djibouti faces a steadily increasing demand for drinking water due to rapid urbanization and population growth, from 273,974 inhabitants in 1983 to more than 1 million in 2023, with 73% of the population living in the capital. Water supply relies mainly on groundwater abstracted from the coastal hosted in basaltic formations interbedded with paleosols layers, which constitute the geological framework of the study area. Surface water resources are extremely limited, apart from a few reservoirs, and groundwater recharge mainly occurs during episodic flooding of wadis.

Limited recharge, intensive groundwater pumping, and the proximity of the aquifer to the coastline have led to a progressive degradation of groundwater quality over recent decades, particularly through salinization. The Djibouti plain is characterized by heterogeneous relief, intense fracturing, and a complex volcanic geology. Basaltic formations of different ages and origins overlap discordantly and are locally associated with rhyolitic units, while Quaternary marine sedimentary deposits are present in the coastal zone. Despite the strategic importance of this aquifer, the internal structure of the fractured basalt system remains poorly constrained, limiting the understanding of groundwater flow and freshwater-saltwater interactions. In this study we present the results of more than 30electrical resistivity tomography (ERT) profiles, ranging from 600 to 1200 m in length, acquired in the Djibouti plain. These profiles are used to investigate the lateral and vertical variability of subsurface resistivity and to identify structural and lithological heterogeneities within the basaltic formations. The ERT results are interpreted in combination with available hydrogeological data in order to improve the characterization of the aquifer structure and to provide new constraints on groundwater circulation and recharge processes.

How to cite: Elmi Ragueh, B., Albaric, J., Celle, H., Robleh Ragueh, R., Osman Awaleh, M., and Mohamed, J.: Hydrogeophysical characterization of the basaltic aquifer of Djibouti., EGU General Assembly 2026, Vienna, Austria, 3–8 May 2026, EGU26-21623, https://doi.org/10.5194/egusphere-egu26-21623, 2026.

EGU26-645 | ECS | Posters on site | HS8.2.12

Spatio-temporal analysis of groundwater from machine learning based GRACE downscaling in the Moroccan context 

Maryem Mercha, Hicham Bahi, and Anas Sabri

Morocco is among nations facing high to extremely high-water stress in the world under climate change whose impacts include reduced precipitation, higher temperatures, and evapotranspiration. This pressure is exacerbated by changes in land use and cover, such as agricultural extensification and urbanization, which reduces recharge and increases water demand. However, effective management of water resources, particularly groundwater, remains difficult because of the scarcity of in situ measurements and the low quality of the available data. In this regard, our study aims to downscale GRACE satellite-derived Total Water Storage Anomalies (TWSA) from their native coarse resolution (3°) to a finer resolution (0.04°), followed by Groundwater Storage Anomalies (GWSA) extraction. This is achieved by using machine learning models and hydrological variables that are strongly correlated with TWSA, including precipitation, evapotranspiration, soil moisture, and runoff. The performance of four machine learning models in capturing the spatial details of TWSA is then evaluated, namely, Convolutional Neural Network (CNN), Random Forest (RF), XGBoost, and Gated Recurrent Unit (GRU). Then the results generated by the model with the best results are analyzed spatially and temporally to better understand the trends, the availability, and the influence of LULC changes on groundwater resources. RF delivered the best performance by achieving an R² of 0.92 and an RMSE of 0.61 cm. The RF based TWSA estimates showed strong agreement with ground measurements across different spatial and temporal scales. And the analyses highlight the importance of integrating hydrological and land use factors into groundwater modeling and demonstrate that machine-learning-based downscaling can effectively capture groundwater variability and help bridge the gap between satellite observations and local scale sustainable water management.

How to cite: Mercha, M., Bahi, H., and Sabri, A.: Spatio-temporal analysis of groundwater from machine learning based GRACE downscaling in the Moroccan context, EGU General Assembly 2026, Vienna, Austria, 3–8 May 2026, EGU26-645, https://doi.org/10.5194/egusphere-egu26-645, 2026.

The Farfa River is one of the most important tributaries on the left bank of the Tiber River, upstream Rome in Central Italy. Its water has a very high quality and a geochemical composition mainly associated with the calcium-bicarbonate facies, primarily due to the overflow of the Capore karst Spring, which is one of the main two spring supplying the city of Rome. In the final stretch toward the confluence with the Tiber River these geochemical characteristics completely change and according to the Regional Environmental Protection Agency's classification the river water quality status degrades from good to sufficient, suggesting that this may be due to potential pollution or contamination by human-related activities. This new study, using discharge and physico-chemical field measurements over four monitoring campaigns, together with the help of geochemical and multi-isotopic tracers (C, S, O, H) analyzed on water samples collected, reveals that this change is actually natural and related to the river's interaction with a group of springs, whose origin and recharge areas were largely unknown until now. The use of specific isotopes, such as 13C/12C and 34S/32S, has allowed to better understand the groundwater flowpaths, recharge areas and potential interactions with deep fluids upwelling along fault planes present in the study area.

How to cite: De Filippi, F. M., Eusepi, J., Franchini, S., Barbieri, M., and Sappa, G.: Multi-isotopic approach for the assessment of groundwater-surface water interactions in a complex hydrogeological and stratigraphic context: the case study of the middle Farfa River Valley (Rieti, Central Italy), EGU General Assembly 2026, Vienna, Austria, 3–8 May 2026, EGU26-784, https://doi.org/10.5194/egusphere-egu26-784, 2026.

Arsenic (As), a naturally occurring metalloid in the Earth's crust, poses a significant environmental and public health concern due to its mobilization into groundwater. In India, As contamination primarily originates from the Himalayan region, where As is bound to different minerals like pyrite and iron oxy(hydr)oxide. Inorganic As predominantly exists in two forms—arsenite [As(III)] and arsenate [As(V)]—with As(III) being more mobile in a dynamic system. This process leads to elevated arsenic (As) levels in groundwater, particularly in the low-lying Indo-Gangetic delta plains. A seasonal investigation was done in the Laksar region to evaluate geomicrobiological parameters in groundwater. As concentrations frequently increased in all aquifers (3.5-78 µg/L), surpassing the WHO permissible limits. Hydrochemical analysis revealed that the groundwater was predominantly of Ca-HCO₃ type. As concentration showed a significant correlation with Mn and Fe, suggesting their importance in influencing As mobilisation. Arsenite-oxidizing bacteria (AOB) in groundwater play a critical role in the biogeochemical cycling of As by oxidizing As(III) to the less toxic As(V), thereby holding a potential for bioremediation. Out of ~158 bacterial strains isolated, 28 isolates demonstrated the ability to oxidise As(III). These isolates efficiently oxidised ~1.13 mM As(III) in cultured conditions, with biomass-normalised oxidation rates ranging from 0.2 to 1.13 mM As(III) mg⁻¹ d⁻¹. The major isolated bacteria belong to the genera of Acinetobacter, Stenotrophomonas, Brevundimonas, and Pseudomonas.  These strains were further evaluated in a microcosm setup to determine their efficacy in As bioremediation under simulated groundwater conditions. The results highlight the potential of AOB as a sustainable and cost-effective alternative to conventional As remediation methods, which are often expensive and generate secondary waste in groundwater. The application of such bacteria could significantly mitigate As contamination in affected regions, providing a sustainable and eco-friendly solution to a pressing global issue.

How to cite: Ali, S., Basu, S., and Singh, R.: Bioremediation of Arsenic-Contaminated Groundwater Using Arsenite-Oxidizing Bacteria from the Upper Gangetic plains of Laksar region of Haridwar, EGU General Assembly 2026, Vienna, Austria, 3–8 May 2026, EGU26-816, https://doi.org/10.5194/egusphere-egu26-816, 2026.

EGU26-845 | ECS | Posters on site | HS8.2.12

Limited Groundwater Recharge and Long Residence Times in Salinized Endorheic Arid Aquifers: Evidence from Stable Isotopes, Noble Gases, and Radiocarbon Dating 

Ahmed El-Azhari, Yassine Ait Brahim, Florent Barbecot, Oliver Warr, Daniele L. Pinti, and Lhoussaine Bouchaou

Arid endorheic basins are increasingly dependent on deeper groundwater resources, making it essential to assess their renewability and long-term response to climate and pumping pressures. In the Bahira Basin (central Morocco), deep low-salinity groundwater is being exploited as the shallow aquifer has become extremely saline (up to 60,000 µS/cm). To explore the recharge rate and resilience of this deeper resource, a multi-tracer approach was conducted. Major ion chemistry, stable isotopes (δ18O, δ²H, δ13C), noble gases isotopes (He and Ne), and radiocarbon (14C) were analyzed in 19 groundwater samples.  The deeper aquifer shows moderate salinity (500-3,000 µS/cm) and isotopically depleted δ¹⁸O-δ²H values, suggesting recharge from higher elevations and cooler climatic periods. Substantial radiogenic ⁴He enrichment (> 4x10⁻⁶ ccSTP/g) indicates very low recharge rates and long residence times. Radiocarbon analyses further support this interpretation, as most samples have 14C values below the detection limit (<1.12 pMC), corresponding to apparent ages >35 ka. These results suggest that modern recharge is extremely limited across most of the basin. However, a few wells near identified recharge areas show atmospheric He and Ne signatures and measurable 14C (~35 pMC), indicating the presence of a recent recharge mixed with older groundwater. These localized recharge zones illustrate the spatial heterogeneity of groundwater replenishment. Overall, our findings reveal the low renewability on human timescales and limited resilience under increasing abstraction pressures. The integration of geochemical, noble gas, and radiocarbon tracers proves essential for assessing aquifer vulnerability and supporting more informed groundwater governance in arid, data-scarce regions.

How to cite: El-Azhari, A., Ait Brahim, Y., Barbecot, F., Warr, O., Pinti, D. L., and Bouchaou, L.: Limited Groundwater Recharge and Long Residence Times in Salinized Endorheic Arid Aquifers: Evidence from Stable Isotopes, Noble Gases, and Radiocarbon Dating, EGU General Assembly 2026, Vienna, Austria, 3–8 May 2026, EGU26-845, https://doi.org/10.5194/egusphere-egu26-845, 2026.

EGU26-1036 | ECS | Posters on site | HS8.2.12

The Effectiveness of Water Retention in Canals in the Danube-Tisza Interfluve Region, Hungary 

Aldeth Garas, András Berecz, Márk Szijártó, Judit Mádl-Szőnyi, Adrienn Kovács-Baksi, and Szilvia Simon

The Danube-Tisza Interfluve (DTI) region, one of the most arid areas in Hungary, is threatened by the ongoing decline in groundwater levels driven by the combined impacts of climate change and human activities, including improper land use, excessive groundwater abstraction, and the existing drainage canal networks. One of the emerging solutions is the application of Natural Water Retention Measures (NWRM) (i.e., surface water retention techniques), which can utilize abandoned channels, oxbow lakes, and canals originally designed for draining the region. These measures intend to enhance the water resilience of different landscapes. While these measures have been used globally, their impacts on the shallow groundwater systems are rarely monitored. This study aims to evaluate the effectiveness of a canal-based water retention measure in Bátya Municipality, located in the southern part of DTI, by assessing the changes in the groundwater level and hydrochemical parameters in the near-surface aquifer. The research integrates electrical resistivity tomography (ERT) surveys, soil analyses, water chemistry analyses, and water level monitoring through wells to characterize the subsurface conditions and investigate the physical and chemical effects of infiltration. The results provide key insights into the infiltration processes related to canal-based water retention and its spatial influence on the groundwater resources in the study area. Furthermore, the study contributes to the understanding of how NWRMs can enhance groundwater recharge to help buffer the anthropogenic and climate change impacts on shallow groundwater systems. This work is funded by the LIFE LOGOS 4 WATERS project of the European Union and carried out in collaboration with the General Directorate of Water Management (GDWM). The study is also supported by the János Bolyai Research Scholarship of the Hungarian Academy of Sciences.

How to cite: Garas, A., Berecz, A., Szijártó, M., Mádl-Szőnyi, J., Kovács-Baksi, A., and Simon, S.: The Effectiveness of Water Retention in Canals in the Danube-Tisza Interfluve Region, Hungary, EGU General Assembly 2026, Vienna, Austria, 3–8 May 2026, EGU26-1036, https://doi.org/10.5194/egusphere-egu26-1036, 2026.

The Köprüören Basin, located in Kütahya Province (Western Türkiye), hosts long-standing silver mining operations centered in the Gümüşköy area, where a complex geological framework controls groundwater flow and the mobility of contaminants. The region comprises several stratigraphic units, including the Carboniferous–Permian Şahin Formation (phyllite, clay-schist, marble), the Permian–Triassic marbles of the Karaağaç Formation, the Middle–Upper Miocene dacitic–rhyolitic tuffites of the Tavşanlı Volcanics, the Lower Pliocene marls, sandstones, and tuffs of the Çokköy Formation, the Upper Pliocene limestone–dolomite alternations of the Emet Formation, and the Quaternary clastic sediments of the Bozyer Formation (Arık, 2002). Türkiye’s only silver deposit is developed within the basement rocks, Miocene volcanics, and Pliocene units, making the area of high economic importance. Modern mining activities in Gümüşköy began in 1987 with cyanide leaching, producing 122.4 tons of 99.9% pure silver annually, and ore production reached five million tons after 2009 (Sasmaz, 2011). While contributing to regional economic development, mining activities have generated significant environmental challenges in the basin. The collapse of one of the mine waste pools in 2011 caused the contaminated wastes to spread into surface-water systems. Geochemical investigations conducted in 2012 indicated that, in addition to natural geogenic sources, mining activities represented a major anthropogenic source of arsenic and other trace elements (Pb, Sb, Zn) through leakage from waste pools (Arslan & Çelik, 2015; Arslan, 2017). The hydrostratigraphic units of the basin were characterized in a recent study (Mohamed, 2025), analyzing the areal extent, thicknesses and hydraulic properties of the aquifers using data obtained from 68 wells. Accordingly, the most productive aquifer occurs within the limestone–marl alternations of the Upper Pliocene Emet Formation, with a thickness ranging from 12 to 223 m. Groundwater is abstracted from this aquifer for both irrigation and mining operations. Silver production consumes large amounts of water (1,713 m³ per ton of silver; Meißner, 2021), a substantial fraction of which is extracted from groundwater in the Köprüören Basin, further exacerbating pressure on local water resources. Recent declines in groundwater levels indicate that water use in the basin is unsustainable. Field reconnaissance in 2024 confirmed ongoing leakage from mine-waste pools, especially near drainage channels. Local reports of rising colon cancer cases suggest possible long-term exposure to trace elements. These findings highlight the continuing environmental and public-health risks and emphasize the need for monitoring, improved management, and sustainable water use in the Köprüören Basin.

References

Arık, F., 2002. Geochemical Modeling of Gümüşköy (Kütahya) Silver Deposit, PhD Dissertation, Selçuk University, Türkiye.

Arslan, Ş., 2017. Assessment of groundwater and soil quality in Köprüören Basin, J. African Earth Sci., 131, 1–13.

Arslan, Ş., Çelik, M., 2015. Pollutants in soils and surface waters around Gümüşköy mine, Bull. Environ. Contam. Toxicol., 95(4), 499–506.

Meißner, S., 2021. The Impact of Metal Mining on Global Water Stress and Regional Carrying Capacities—A GIS-Based Water Impact Assessment. Resources, 10(12), 120.

Mohamed, A.S., 2025. Characterization of the Köprüören Basin Aquifer System, Master’s Thesis, Ankara University.

Sasmaz, A., 2011. As, Ag, Pb, Sb and Tl Levels in Soil and Plants Around Gümüşköy Mining Area, TÜBİTAK Project CAYDAG-110Y003, Ankara.

How to cite: Arslan, Ş.: Impacts of Long-Term Silver Mining on Water Quality and Groundwater Sustainability in the Kopruoren Basin, Western Turkiye, EGU General Assembly 2026, Vienna, Austria, 3–8 May 2026, EGU26-1205, https://doi.org/10.5194/egusphere-egu26-1205, 2026.

Managed aquifer recharge (MAR) is increasingly recognized as a key strategy to enhance groundwater sustainability, yet the use of stormwater as a recharge source remains limited, particularly in rural and agricultural settings. Key uncertainties persist regarding stormwater quality variability, treatment performance, and potential impacts on groundwater quality.

We present the technical design, operational testing, and hydrogeochemical assessment of a stormwater-based MAR pilot site implemented in November 2024 in Hüll (Hallertau region, Bavaria, Germany), an area characterized by intensive agriculture, recurrent local flooding, and strong groundwater demand for irrigation. The MAR system combines a stormwater retention basin for buffering flash-flood dynamics, treatment units, and recharge via an infiltration well targeting a highly heterogeneous Tertiary aquifer.

Initial results demonstrate robust system performance under variable stormwater conditions. The treatment units effectively reduce suspended solids and pesticide concentrations, enabling controlled recharge while minimizing risks to groundwater quality. Beyond quantitative water resource augmentation, the scheme shows potential qualitative benefits for agricultural groundwater systems.

How to cite: Augustin, L., Schultze, A., and Baumann, T.: Stormwater-based managed aquifer recharge in a rural agricultural catchment: Design, monitoring, and hydrogeochemical impacts from a pilot site in Bavaria, Germany, EGU General Assembly 2026, Vienna, Austria, 3–8 May 2026, EGU26-1948, https://doi.org/10.5194/egusphere-egu26-1948, 2026.

EGU26-2179 | Posters on site | HS8.2.12

Water Resource Diversification through Integrated Management of Groundwater Dams and Bedrock Wells 

Yunhee Kim, Jae Young Seo, Joo-Hyon Kang, Bumjoo Kim, and Sang-Il Lee

The importance of securing stable water resources has become increasingly evident due to growing spatiotemporal uncertainty in precipitation and the more frequent occurrence of prolonged droughts caused by intensifying climate change. In this context, groundwater dams have gained prominence as an alternative water resource with low evaporation losses and high climate resilience. However, the independent operation of groundwater dams may have limitations in ensuring mid- to long-term water supply stability. Therefore, the development of an integrated water resource management system that considers conjunctive use with other water sources―such as surface water, bedrock wells, and artificial recharge facilities―is required.

The objective of this study is to demonstrate core technologies for a networking system linking  groundwater dams and bedrock wells. The Ssangcheon watershed in Sokcho City, Republic of Korea―where two groundwater dams are currently operated for domestic water supply―was selected as the study area. Comprehensive analyses of geological structures, aquifer distributions, and hydrological conditions were carried out. The hydraulic and geological properties along with hydrochemical types of both alluvial and bedrock groundwater were characterized. Water balance analysis was performed to quantify available water resources within the watershed and to assess surface water–groundwater interactions.

To assess water supply stability, we conducted scenario-based simulations of integrated groundwater dam and bedrock well operations, focusing on drought and high-demand conditions. In addition, deep learning models based on Long Short-Term Memory (LSTM) networks for one-step prediction and an encoder–decoder LSTM architecture for multi-step prediction were developed to predict groundwater levels in support of the integrated operation of the Ssangcheon Dam.

The results indicate that integrating groundwater dams with bedrock wells substantially improves both water supply reliability and water quality protection. Moreover, AI-based groundwater level prediction techniques proved to be effective tools for proactive water resource management and the development of smart water management systems. This study offers a practical framework for water resource diversification, providing a foundation for developing sustainable and climate-resilient management strategies.

This work was supported by the Management Technology for Groundwater Dams in Water Supply Vulnerable Areas Program of the Korea Environmental Industry & Technology Institute (KEITI), funded by the Ministry of Environment (MOE) (RS-2025-01842973).

How to cite: Kim, Y., Seo, J. Y., Kang, J.-H., Kim, B., and Lee, S.-I.: Water Resource Diversification through Integrated Management of Groundwater Dams and Bedrock Wells, EGU General Assembly 2026, Vienna, Austria, 3–8 May 2026, EGU26-2179, https://doi.org/10.5194/egusphere-egu26-2179, 2026.

EGU26-2194 | Orals | HS8.2.12 | Highlight

Development of a Field-Applicable Immunofluorescence Chip for Adenovirus Monitoring in Groundwater 

Thomas Vienken, Mobarok Hossain, Nele Hastreiter, Mark Wegmann, Dirk Roggenbuck, and Irina Engelhardt

Bank filtration is widely used for producing drinking water; however, the increasing contamination of surface waters by human-pathogenic viruses, particularly adenoviruses, poses growing challenges to the drinking water supply under climate-driven hydrological extremes. Conventional groundwater quality monitoring primarily focuses on bacterial indicators, while viral surveillance remains limited and is generally not available on-site. Therefore, we developed a novel, field-applicable immunofluorescence chip for the adenovirus monitoring in groundwater within the project VIRUMEX. The antibody-functionalized polymer bead–based virus detection system allows near real-time monitoring either directly in groundwater wells or via an autonomous flow-through setup. Experiments demonstrated full chip functionality under both laboratory and field conditions, which, in the first step, allows for the screening of virus-positive and virus-negative samples at low ng/mL adenovirus protein concentrations. Although subject to further refinement, the results demonstrate that the prototype chip enables reliable, rapid, and qualitative detection of adenoviruses, complementing conventional PCR-based monitoring.

How to cite: Vienken, T., Hossain, M., Hastreiter, N., Wegmann, M., Roggenbuck, D., and Engelhardt, I.: Development of a Field-Applicable Immunofluorescence Chip for Adenovirus Monitoring in Groundwater, EGU General Assembly 2026, Vienna, Austria, 3–8 May 2026, EGU26-2194, https://doi.org/10.5194/egusphere-egu26-2194, 2026.

EGU26-3147 | ECS | Orals | HS8.2.12

Understanding and quantifying the depletion of a mineral water aquifer 

Marlis Hegels and Thomas Baumann

Slowly regenerating groundwater systems must be considered finite resources if withdrawal rates exceed their replenishment rates and changes in their hydrochemical composition and age structure become apparent. Various concepts have evolved to ensure the long-term availability and protection of groundwater resources, including groundwater stress, safe yield, and different definitions of renewable groundwater. Most of these concepts focus on the quantitative availability of groundwater. The most recent concept, "peak groundwater", describes the maximum total withdrawal rate from an aquifer before reductions in withdrawal rates become necessary due to effects of depletion, such as reduced well yields and water quality issues (1). Here, deterioration of groundwater quality is interpreted in terms of contamination. However, for mineral water, deterioration also requires changes to the original hydrochemical characteristics (2), which tightens the evaluation framework.

This study aims to determine the modified peak groundwater withdrawal for a fractured bedrock aquifer that has been used for mineral water production since the mid-1900s, until it ceased in 2020. We have been closely monitoring the system since the 1990s. The recorded data enables us to quantitatively assess the changes due to production, as well as the rates and extent of the recovery. To develop a 4D understanding of the aquifer, we combined the extraction rates from the last 30 years of production with a comprehensive geological model, hydraulic measurements, and hydrochemical analyses (wellhead and depth-resolved) were combined.

The aquifer has been explored by five wells, which are oriented along a fault zone. It exhibits stratification of mineralization, with increasing concentrations of total dissolved solids (TDS) and CO2 with depth. The presence of persistent trace chemicals and the decrease in TDS during production indicate that the mineral water in the upper part of the aquifer is being replenished by freshwater, forming a lens of freshwater on top of the mineral water. This effect is more pronounced at the center of the explored area and correlates with individual withdrawal volumes. Measurements taken after production ceased reveal a trend toward aquifer regeneration. While the aquifer has almost returned to its initial hydraulic state with some wells flowing freely, it is unclear whether the original hydrochemical composition will be re-established or if a new hydrochemical steady state will be reached. The latter would confirm the mining operation of a finite resource, whereas the former would suggest a temporary excess of peak groundwater with no lasting impact on long-term use.

(1) Bhalla, S., Cherry, J. A., Konikow, L. F., Taylor, R. G., & Parker, B. L. (2025). Peak groundwater: Aquifer-scale limits to groundwater withdrawals. Earth's Future, 13. https://doi.org/10.1029/2025EF006221

(2) Dietmaier, A. & Baumann, T. (2023). Assessing sustainable development of deep aquifers. Water Resources Management. https://doi.org/10.1007/s11269-023-03529-6

How to cite: Hegels, M. and Baumann, T.: Understanding and quantifying the depletion of a mineral water aquifer, EGU General Assembly 2026, Vienna, Austria, 3–8 May 2026, EGU26-3147, https://doi.org/10.5194/egusphere-egu26-3147, 2026.

EGU26-3858 | ECS | Orals | HS8.2.12

Modelling the cumulative effects of Late-Holocene anthropogenic activities on phreatic groundwater levels  

Laxmi Chaulagain, Jasper H.J. Candel, Perry de Louw, W. Marijn van der Meij, Annegret Larsen, and Jakob Wallinga

The sandy soil region of northwestern Europe often experiences excess water during winter and water scarcity during summer, causing a compromised hydrological balance. Lowering of groundwater levels by anthropogenic interventions such as intensive drainage and groundwater abstraction threatens land use and biodiversity that are dependent on phreatic groundwater. Current spatial planning hardly considers natural soil-water systems, rendering these landscapes unsustainable for the future. This calls for a paradigm shift in which land use is guided by the potential of natural systems to sustainably support human needs.

Understanding how landscapes function under minimal human influence is crucial for understanding the natural processes, reversing declining trends and developing climate-robust land-use strategies. Therefore, we studied the Chaamse beek catchment (southern Netherlands) to develop a spatially explicit, quantitative understanding of the natural soil-water land use system and to assess the impact of human interventions over the late Holocene (2000 BCE till now) For this, we reconstructed palaeogroundwater levels using a regionally calibrated numerical model, which consists of MODFLOW (saturated zone) and MetaSWAP (unsaturated zone) for the time slices 2000 BCE, 0, 500, 1500 and 1850 CE. Topography, land use, hydrological features, and soils were reconstructed for each time slice and human interventions (e.g., ditches, artificial structures, abstraction wells) were chronologically removed (from present to past) to simulate increasingly natural conditions and evaluate their effects on groundwater dynamics. Model results were evaluated against historical maps.

Results show that removing drainage ditches (simulating conditions prior to 1500 CE) substantially increases areas with shallow groundwater (0-50 cm). These areas become even larger when removing abstraction wells. Notably, the model successfully simulated the presence of swamps at locations where they historically existed, as verified by historical maps from 1850 CE. These findings provide quantitative insights into human-modified hydrological systems and support the development of nature-based solutions, water buffer zones, and adaptive land-use planning for climate-resilient management of sandy catchments. By constraining hydrological models with palaeogroundwater reconstructions, future forecasting and scenario-based water management strategies can be made more robust. 

How to cite: Chaulagain, L., H.J. Candel, J., de Louw, P., van der Meij, W. M., Larsen, A., and Wallinga, J.: Modelling the cumulative effects of Late-Holocene anthropogenic activities on phreatic groundwater levels , EGU General Assembly 2026, Vienna, Austria, 3–8 May 2026, EGU26-3858, https://doi.org/10.5194/egusphere-egu26-3858, 2026.

EGU26-4002 | Posters on site | HS8.2.12

Deep groundwater exploration in an Alpine alluvial plain: first insights for sustainable water and geothermal resource management in the Aosta Valley 

Davide Bertolo, Michel Stra, Marco Paganone, Laura Lodi, Fulvio Simonetto, Federico Tognetto, and Barbara Grappein

The severe drought experienced during the summer of 2022 in the Western Alps brought unprecedented attention to water availability issues in Alpine regions traditionally considered rich in water resources, such as the Aosta Valley (Western Alps, Italy). This event highlighted the vulnerability of mountain groundwater systems to climate-driven extremes and emphasized the need for a deeper and more robust understanding of groundwater availability, particularly in densely populated alluvial plains where water demand is concentrated.

The Aosta alluvial plain represents a strategic hydrogeological system, supporting drinking water supply, ecosystem services, and an increasing interest in low-enthalpy geothermal applications. Despite its importance, the deep structure of the aquifer system and the depth to bedrock beneath the plain remained largely unconstrained until recently, limiting the reliability of conceptual and quantitative groundwater models and the capacity to anticipate future water scarcity scenarios.

Within a regional-scale program (UE-FESR Project: “Geothermalp”) aimed at enhancing sustainable groundwater and geothermal resource management, an integrated deep exploration campaign was carried out, combining advanced geophysical investigations with deep continuous-core drilling. Geophysical surveys were employed to characterize the geometry of Quaternary deposits and to delineate the bedrock surface, providing a framework for the optimal positioning of two deep boreholes. The boreholes reached depths between approximately 300 and 350 m and, for the first time beneath the Aosta plain, intersected the crystalline bedrock, yielding unprecedented direct information on lithostratigraphy, hydrogeological properties, and groundwater occurrence at depth.

The integration of indirect geophysical data and direct borehole observations revealed a hydrogeological structure significantly more complex than previously assumed. Previously unknown deep groundwater bodies were identified, hosted within permeable sedimentary units and in structurally controlled zones near the alluvium–bedrock interface. Based on the first interpretations, these groundwater bodies appear to play a key role in the vertical connectivity of the aquifer system and in the redistribution of groundwater flow at depth, suggesting multi-level circulation patterns rather than a single shallow aquifer system.

The first results have important implications for sustainable groundwater management in Alpine environments. They provide a stronger scientific basis for assessing groundwater availability under increasing climatic stress, protecting deep groundwater resources from overexploitation, and evaluating the compatibility between drinking water supply, geothermal exploitation, and ecosystem preservation. More broadly, the study demonstrates how integrated deep investigations can substantially improve hydrogeological knowledge and support informed decision-making in mountain regions facing emerging water scarcity challenges.

How to cite: Bertolo, D., Stra, M., Paganone, M., Lodi, L., Simonetto, F., Tognetto, F., and Grappein, B.: Deep groundwater exploration in an Alpine alluvial plain: first insights for sustainable water and geothermal resource management in the Aosta Valley, EGU General Assembly 2026, Vienna, Austria, 3–8 May 2026, EGU26-4002, https://doi.org/10.5194/egusphere-egu26-4002, 2026.

EGU26-4771 | Posters on site | HS8.2.12

Construction of a 3D geological model to reduce the vulnerability of groundwater resources to climate change: the case of Gran Canaria (Canary Islands, Spain) 

Carlos Baquedano-Estévez, Jorge Martínez-León, Jon Jiménez, Rodrigo Sariago, Gerardo Meixueiro-Ríos, Juan Carlos Santamarta, and Alejandro García-Gil

Climate change poses a major challenge to sustainable groundwater management, especially in island territories. In this context, the development of innovative tools for characterising aquifers is essential to reduce their vulnerability. Currently, 3D geological modelling allows the geometric properties of geological bodies to be defined, making it possible to infer their structure, volumes and determine the availability of their groundwater resources. These three-dimensional models also form the basis for implementing numerical flow simulations, providing valuable geoscientific information for the proper management of aquifers.

Within the framework of the GENESIS project, this work presents the first 3D geological model of the volcanic island of Gran Canaria (Canary Islands, Spain). The 3D model was created using GeoModeller software, based on the island's Digital Terrain Model, surface geological maps, geological cross-sections and lithological data from boreholes and wells. The geological model obtained covers the entire surface of the island of Gran Canaria and includes a geological sequence of six main formations representing the most important volcanic edifices and geological and hydrogeological structures on the island, including the Caldera Tejeda, the remains of the Roque Nublo stratovolcano and the island's characteristic radial ravine system.

The 3D geological model will serve as the basis for the development of the first hydrogeological model of the island of Gran Canaria. This new information will be key to improving knowledge about the island's aquifer and implementing nature-based solutions (NbS), creating new management strategies to tackle climate change.

How to cite: Baquedano-Estévez, C., Martínez-León, J., Jiménez, J., Sariago, R., Meixueiro-Ríos, G., Santamarta, J. C., and García-Gil, A.: Construction of a 3D geological model to reduce the vulnerability of groundwater resources to climate change: the case of Gran Canaria (Canary Islands, Spain), EGU General Assembly 2026, Vienna, Austria, 3–8 May 2026, EGU26-4771, https://doi.org/10.5194/egusphere-egu26-4771, 2026.

Much of the world's population, as well as sensitive ecosystems, are dependent on groundwater systems recharged from adjacent mountain ranges. Despite this dependency on groundwater, our understanding of the processes controlling groundwater flow, including recharge, discharge, and storage in mountainous areas, is very limited. In addition, while uptake of groundwater by deep-rooted plants is potentially a significant groundwater discharge pathway, this process represents another large gap in our knowledge about groundwater in mountainous areas.

At Springbrook, in the Gold Coast hinterland, Australia, commercial water extraction is occurring next to a UNESCO World Heritage Listed rainforest, and the local community relies on groundwater for domestic supply. Yet, there is very minimal monitoring data that can be used to assess water availability and sustainably manage this resource. To address this data gap, a water monitoring network has been set up in close collaboration with the local community, First Nations representatives and government collaborators. Monitoring at Springbrook has provided insights into interactions between springs, groundwater, local creeks and deep-rooted vegetation. These insights are informing changes in water management policy.

We are now scaling up the water monitoring network to develop an integrated monitoring network which includes climate, soils, water, vegetation and endangered species monitoring over an altitudinal gradient. The monitoring network is currently being used to support environmental science teaching activities. A visualisation platform has been developed to share information about the monitoring more widely and to help support community engagement and science to policy translation. 

How to cite: Reading, L.: Collaborative monitoring for sustainable water management in a Mountainous Region in Australia, EGU General Assembly 2026, Vienna, Austria, 3–8 May 2026, EGU26-4860, https://doi.org/10.5194/egusphere-egu26-4860, 2026.

EGU26-5647 | ECS | Orals | HS8.2.12

Transient response in large groundwater basins: Implications for sustainable management 

Carlos Felipe Marin Rivera, Alexandre Pryet, and Julio Goncalves

Regional confined aquifers are becoming increasingly strategic as water pressures intensify worldwide. These aquifers are often found as part of multi-layer systems within extensive groundwater basins. Long response time scales challenge conventional approaches of sustainable management: hydraulic perturbations might propagate slowly and management decisions must be informed by the timing on which the impacts of climatic or anthropogenic stresses fully materialize.

Using a synthetic numerical model of a multi-layer system, we investigate response times across a wide range of hydraulic diffusivity scenarios spanning the diversity of real-world contexts. In particular, we highlight the critical role of leakage through confining units, an often-overlooked process that strongly governs how the groundwater basin adjusts to a given stress. To connect these dynamics with management decisions, we apply a constrained optimization framework to estimate sustainable yields. Here, we define the sustainable yield as the maximum pumping rate that meets specified drawdown or flow constraints within a given planning horizon.

Our findings show that the vertical diffusivity of confining units exerts an important control on response times of confined aquifers and that, in some cases, analytical solutions may significantly overestimate these times by ignoring leakage processes. In low-diffusivity regional systems, response times can span well beyond typical planning horizons, making them relevant for long-term management decisions. Crucially, the choice of planning horizon becomes a determining factor in defining sustainable abstraction volumes. Our approach explicitly quantifies this relationship, providing an informative basis for sustainable management decision-support. 

This work underscores the need for a paradigm shift away from steady-state notions of groundwater sustainability. Effective management of regional groundwater systems requires adaptive strategies that recognize delayed responses and the long-term consequences of our decisions, which may unfold over decades, centuries, or even longer. What is considered sustainable depends not only on the magnitude of pumping impacts, but also on the timing of those impacts relative to human and management timescales.

How to cite: Marin Rivera, C. F., Pryet, A., and Goncalves, J.: Transient response in large groundwater basins: Implications for sustainable management, EGU General Assembly 2026, Vienna, Austria, 3–8 May 2026, EGU26-5647, https://doi.org/10.5194/egusphere-egu26-5647, 2026.

EGU26-6541 | ECS | Posters on site | HS8.2.12

Significant declining trends of groundwater level and spring discharge and their comparison between two periods (2014-2023 vs 2018-2023) 

Lucia Janečková, Valéria Slivová, Radoslav Kandrík, Róbert Chriašteľ, and Lucia Hagara Pivarčiová

The main task was to assess the existence of significant declining trends at monitoring objects of the state groundwater hydrological network. The evaluated parameters included groundwater levels and spring discharges in Quaternary and Pre-Quaternary groundwater bodies of Slovakia. Two time periods (2014-2023 and 2018-2023) were evaluated and subsequently compared with each other to identify potential differences in trends. Time series of mean annual values as well as mean annual minimum values from a total of 1455 monitoring sites were evaluated (including 1113 boreholes and 342 springs). To identify the presence of a significant declining trend, all time series were tested using the non-parametric Mann-Kendall statistical test. If the dataset followed a normal distribution, the parametric ANOVA method was also applied. For better comparison the results were visualized using map presentation. If there was one significant declining trend found, groundwater quantity status was classified as being at risk. If there were two or more declining trends in one category (average/minima) found, the groundwater body was classified as having a poor quantitative status. Finally, 17 groundwater bodies were classified at risk and five groundwater bodies in poor quantitative status for period 2014 - 2023. However, for shorter period 2018 – 2023 only two groundwater bodies were found in poor quantitative status and four groundwater bodies were classified at risk. There was an improvement in the quantitative status of three groundwater bodies declared in comparison to longer period (from poor to good quantitative status) – SK2000200P (Intergranular groundwater of the western part of the Vienna Basin), SK200220FP (Fractured and intergranular groundwater of the northern Central Slovak Neovolcanic Area), SK200240FK (Fractured and karst-fractured groundwater of the Malá Fatra), SK200290FK (Fractured and karst-fractured groundwater of the southern slopes of the Low Tatras).  In addition, 15 groundwater bodies classified at risk in longer period improved their quantitative status to good quantitative status in short period 2018-2023. Classifications of both periods define the groundwater body SK2002300P (Intergranular Groundwater of the Eastern Part of the Danube Basin and the Ipeľ Basin) in poor quantitative status and two groundwater bodies at risk SK2000400P (Intergranular groundwater of the eastern part of the Vienna Basin) and SK200590FP (Fractured and intergranular groundwater of Neovolcanic rocks).

How to cite: Janečková, L., Slivová, V., Kandrík, R., Chriašteľ, R., and Hagara Pivarčiová, L.: Significant declining trends of groundwater level and spring discharge and their comparison between two periods (2014-2023 vs 2018-2023), EGU General Assembly 2026, Vienna, Austria, 3–8 May 2026, EGU26-6541, https://doi.org/10.5194/egusphere-egu26-6541, 2026.

EGU26-7006 | Posters on site | HS8.2.12

Using Fibre Optic Distributed Temperature Sensing for Detecting Groundwater Plume Thermal Anomalies 

Uwe Schneidewind, Michael Rivett, John Heneghan, Alan Herbert, Lee Haverson, Edward Simcox, and Stefan Krause

Groundwater temperature has been used in the past as an environmental tracer for studying changes to groundwater quality, water flow and ecosystem health. Groundwater thermal plumes originating from subsurface geothermal energy use, urban infrastructure, waste disposal sites or mining activities can significantly impact groundwater systems. As such, continuous monitoring of groundwater temperature can be crucial when the aim is rapid detection of changes to the local thermal groundwater regime early on.

Here we demonstrate the suitability of Fibre Optic Distributed Temperature Sensing (FO-DTS) for tracing the arrival and propagation of heat plume-related temperature signals in steel and plastic-lined steel blind tubes. The use of blind tubes is increasingly being considered when monitoring the subsurface of waste processing and waste management areas including landfills and nuclear waste sites. For our laboratory experiments, plastic tanks filled with saturated sand were equipped with different blind tube configurations and a FO-DTS system (Silixa XT-DTS) and subjected to periodic heating and cooling to monitor dispersive heat transport under various thermal conditions along the blind tube. Laboratory experiments were supported by heat transport modelling.

Experimental results showed that the FO-DTS setup was well suited to detect temperature changes along the blind tube wall as low as 0.1oC at high temporal resolution. Detectability of the thermal signal was not significantly impaired by the plastic-lining where this was present inside the steel tubes. We observed that the lag of the thermal signal through the blind tubes was typically less than two minutes and that only little smearing of the temperature signal along the blind tube walls occurred, which was further confirmed by modelling results. As such, the experimental setup has the potential to be further developed into an effective on-site monitoring system, which will help to support decision making in contaminated site management and ultimately lead to an improved management of groundwater resources.

How to cite: Schneidewind, U., Rivett, M., Heneghan, J., Herbert, A., Haverson, L., Simcox, E., and Krause, S.: Using Fibre Optic Distributed Temperature Sensing for Detecting Groundwater Plume Thermal Anomalies, EGU General Assembly 2026, Vienna, Austria, 3–8 May 2026, EGU26-7006, https://doi.org/10.5194/egusphere-egu26-7006, 2026.

EGU26-7046 | Posters on site | HS8.2.12

Exploring Wavelet–Based Approaches to Characterize Piezometric Variability in the Doñana Aquifer 

Carolina Guardiola-Albert, Héctor Aguilera, Nuria Naranjo-Fernández, Fernando Ruiz-Bermudo, José Antonio Serrano-Reina, and José Manuel Gómez-Fontalva

Understanding the relative contribution of climatic recharge and groundwater abstraction to piezometric variability is essential for managing the stressed Doñana/Almonte-Marismas aquifer system. Traditional correlation-based approaches (Pearson, Spearman, cross-correlation) have shown limited ability to represent the intuitive differences observed among piezometric series. This work proposes the use of wavelet analysis to characterize the temporal–frequency relationships between rainfall and piezometry and to explore if these results can qualitatively separate climatic and pumping influences.

We analyze long-term piezometric records (1999-2025) together with monthly rainfall data. This time window was chosen because agricultural groundwater exploitation intensified markedly from the late 1990s, defining the modern hydrodynamic behavior of the aquifer. Time series are standardized and detrended, and raw rainfall is used to exploit the ability of wavelets to isolate frequency-dependent relationships. Selected piezometers represent contrasting hydrogeological conditions, including recharge-dominated areas or zones affected by stable intensive pumping.

Two wavelet-based metrics are computed: (i) wavelet coherence, which measures the shared variance between rainfall and groundwater levels across time and scale; and (ii) contribution, defined as the percentage of piezometric signal energy attributable to rainfall within selected temporal bands (1 year, 1–5 years, > 5 years).

Future work includes calculating contributions across all long series in the aquifer and evaluating the feasibility of spatializing these metrics for both the unconfined and confined sectors. By quantifying rainfall-driven variability across scales, wavelet analysis provides a robust framework to distinguish natural recharge signals from non-natural dynamics (e.g., pumping effects) in complex, non-stationary aquifer systems.

How to cite: Guardiola-Albert, C., Aguilera, H., Naranjo-Fernández, N., Ruiz-Bermudo, F., Serrano-Reina, J. A., and Gómez-Fontalva, J. M.: Exploring Wavelet–Based Approaches to Characterize Piezometric Variability in the Doñana Aquifer, EGU General Assembly 2026, Vienna, Austria, 3–8 May 2026, EGU26-7046, https://doi.org/10.5194/egusphere-egu26-7046, 2026.

Understanding how groundwater flow influences river networks is essential for sustainable management of water resources and associated ecosystems, particularly in humid regions where baseflow sustains low-flow conditions and ecological habitats. Continental statistical analysis of river networks suggest that groundwater may exert a distinct control on channel morphology and bifurcation angles. However, direct process-based evidence for these controls remains limited, constraining our ability to predict groundwater availability and the response of fluvial systems to climate and anthropogenic change. To address this gap, we conducted a series of controlled sandbox experiments in which representative bifurcated channels were pre-constructed in a uniform sediment layer. Channel upward evolution under constant and uniform groundwater seepage was monitored. Meanwhile, a planar groundwater flow model and a coupled fluid-solid mechanical model were developed and parameterized based on the experimental conditions to simulate subsurface flow fields and assess stability. The results show that groundwater seepage can systematically modify initial bifurcation angles and thus reorganize channel branches. For symmetric bifurcations, new developed channel trajectories follow equipotential lines, with outward divergence at 30°, near-axial extension at 72°, and pronounced inward deflection at 120°. In asymmetric bifurcations, the branch aligned with the dominant subsurface flow persistently captures more discharge and stabilizes a robust drainage structure. Steeper hydraulic gradients promote wider and more symmetrically developed channels. These findings provide quantitative support that persistent groundwater flow can override initial geometric control and actively shape drainage architecture. They are helpful for predicting zones of focused groundwater discharge and the changes in river network structure caused by climate change, and for improving process-based models used in sustainable groundwater management.

How to cite: Tang, Y., Liang, X., and Yin, Z.: Controls of Groundwater Seepage on Channel Bifurcation Evolution: Implications for Groundwater–Surface Water Interactions and Sustainable Drainage Management, EGU General Assembly 2026, Vienna, Austria, 3–8 May 2026, EGU26-7479, https://doi.org/10.5194/egusphere-egu26-7479, 2026.

Agricultural intensification has led to persistent nitrate (NO₃) accumulation in the vadose zone (VZ)–groundwater system, yet the long-term fate of this NO₃ remains insufficiently understood. This study develops a high-resolution coupled modeling framework that integrates a multiple-column VZ model (MCM) with a MODFLOW-MT3D groundwater model. The framework reconstructs NO₃ dynamics over four decades (1982–2022) in China’s Guanzhong Plain, captures the complete transport chain from agricultural inputs and VZ processes to riverine discharge, and has been validated against multi-source observations. The results show that the mean NO₃ leaching fluxes increased sharply after 1987. Correspondingly, the VZ NO₃ storage increased nearly tenfold, from 670 kt in 1982 to 7,631 kt in 2022. Pronounced spatial heterogeneity was observed, with VZ NO₃ residence times exceeding 100 years in peripheral thick-loess areas, but only 10–27 years in central thin-loess zones. Groundwater NO₃ concentrations exhibited a spatial pattern closely consistent with leaching distributions, while groundwater NO₃ storage showed a turning point around 1988, decreasing to 3,190 kt before increasing to 3,328 kt by 2022. This pattern reflects the delayed but direct transmission of NO₃ from the VZ to groundwater. Over the study period, the average groundwater discharge to the Yellow River was 4.2 × 10⁸ m³ yr⁻¹, while the NO₃ export via this discharge decreased from 77 kt to 12.7 kt. When combined with irrigation return flows, this reduction forms a “closed N cycle” that enhances subsurface NO₃ accumulation. This coupled framework provides a transferable approach for quantifying NO₃ storage, residence times, and release dynamics in intensively cultivated regions. It provides critical insights into legacy N risks and facilitates the development of long-term groundwater protection strategies.

How to cite: Gong, Y., Niu, L., and Jia, X.: Long-term nitrate legacy in the vadose zone–groundwater system: Integrated modeling of intensive agriculture impacts, EGU General Assembly 2026, Vienna, Austria, 3–8 May 2026, EGU26-7711, https://doi.org/10.5194/egusphere-egu26-7711, 2026.

EGU26-8005 | ECS | Posters on site | HS8.2.12

Integrating isotope hydrology and hydrogeochemistry to assess recharge processes and vulnerability of drinking water springs: the case of Capannori (Tuscany, central Italy) 

Stefano Natali, Brunella Raco, Gian Luca Bucci, Antonio Delgado Huertas, Martina Ferrari, Caterina Giorgi, Francesca Pasquetti, Gianmarco Stasi, and Giovanni Zanchetta

Ongoing climate change and increasing anthropogenic pressures are intensifying the challenges associated with the sustainable management of groundwater resources, particularly in Mediterranean regions characterized by pronounced climatic seasonality and recognized as climate change hot spots. Groundwater springs often represent a critical resource for local communities, serving both as a source of high-quality drinking water and as a key component of socio-ecological systems. Understanding the functioning, vulnerability, and resilience of the groundwater systems feeding these springs is therefore essential for effective and sustainable water management.

This study presents the first results of an ongoing investigation in the Municipality of Capannori (Lucca, Tuscany, central Italy), where publicly accessible springs are widely used for domestic water supply and have become the focus of increasing conservation efforts by local authorities. The collection of water from local springs represents a shared practice in this region that fosters a strong sense of community and reinforces the concept of water as a common good. Ensuring the sustainable management of these resources, therefore, requires a comprehensive understanding of groundwater systems, achievable through multidisciplinary approaches integrating isotopic fingerprinting with geochemical and hydrogeological tools.

A two-year monitoring programme started in April 2024 and involves 19 groundwater springs distributed across three hydrogeological sectors. Groundwater samples were collected for chemical and isotopic analysis (δ18O and δ2H), while temperature, pH, electrical conductivity and redox potential were measured in the field. Tritium and δ34S-δ18O-SO4 were determined on selected samples, and compositional data analysis (CoDA) was applied to the chemical dataset. In addition, a rain sampler was installed in February 2024 to collect monthly precipitation samples for isotopic analysis.

The results highlight pronounced chemical and isotopic heterogeneity among springs across the three hydrogeological sectors, reflecting the complexity of the groundwater systems involved. This heterogeneity points to distinct flow paths, water-rock interaction processes, and recharge dynamics, and suggests potentially different sensitivities of individual springs to hydroclimatic variability and anthropogenic pressures. From a management perspective, these differences imply that springs commonly perceived as part of a single resource may in fact exhibit contrasting levels of vulnerability under ongoing and future environmental change.

Stable water isotope data, together with deuterium excess, provide robust constraints on the recharge elevations of the aquifers feeding the springs, allowing the identification of recharge areas and the possible extent of recharge catchments. At the same time, part of the observed isotopic variability may reflect a climatic signal related to recharge seasonality rather than elevation alone. However, seasonal isotopic shifts were negligible across all springs, indicating well-mixed recharge systems and relatively slow groundwater circulation that dampens the pronounced isotopic variability of precipitation. Consistently, tritium values show no significant differences among springs (2.5-2.9 TU), indicating young groundwater with residence times not exceeding 5-10 years.

Overall, this study demonstrates how integrated isotopic and geochemical approaches can provide process-based insights that are directly relevant for groundwater protection and management under changing hydroclimatic conditions.

How to cite: Natali, S., Raco, B., Bucci, G. L., Delgado Huertas, A., Ferrari, M., Giorgi, C., Pasquetti, F., Stasi, G., and Zanchetta, G.: Integrating isotope hydrology and hydrogeochemistry to assess recharge processes and vulnerability of drinking water springs: the case of Capannori (Tuscany, central Italy), EGU General Assembly 2026, Vienna, Austria, 3–8 May 2026, EGU26-8005, https://doi.org/10.5194/egusphere-egu26-8005, 2026.

EGU26-8265 | ECS | Orals | HS8.2.12

Detection and characterization and risk of microplastic in groundwater in the Eastern Province of Saudi Arabia 

Idriss Isa, Mohammed Benaafi, and Husam Musa Baalousha

Abstract

Microplastics have become an emerging contaminant found in groundwater. Microplastics is a concern in areas where aquifers are the main source of drinking water. This study assessed the presence, characteristics and potential risk of microplastics in shallow coastal aquifers of Al-Qatif, Eastern Province of Saudi Arabia. Groundwater was collected from ten shallow wells (SW1–SW10), prepared and processed through density separation, oxidative digestion, stereomicroscopy, and Raman spectroscopy to isolate, characterize and identify microplastics. Eight polymer types were found: polyethylene terephthalate (PET), polyethylene (PE), polyamide (PA), polystyrene (PS), polyvinyl chloride (PVC), polypropylene (PP), polycarbonate (PC) and an acrylonitrile–butadiene–styrene polyethylene blend (ABS–PE). Total Microplastics concentrations ranged from 5 to 16 particles L⁻¹, with a mean of 8.6 particles L⁻¹. PE and PC are the most abundant polymers (2.0 and 1.5 particles L⁻¹, respectively), followed by PET, PA and PP. PS, PVC and ABS–PE were present at lower average concentrations but still contributed to the overall polymer mixture. Most MPs occurred as fibers and fragments with sizes between 25 and 520 µm.
To evaluate potential ecological risk, Contamination Factor (CF), Polymer Hazard Index (H) and Pollution Risk Index (PRI) were evaluated. Polymer Hazard index values were found to range from 21.4 to 985.9, and PRI values vary between 25.7 and 1384.2. Four wells (SW6–SW9) falls into the high-risk category (PRI ≥ 200), mostly because of the presence of highly risk hazardous polymers such as ABS–PE and PVC. SW3 and SW10 had a moderate risk while the other wells were assigned low risk. SEM and FE-SEM analyses indicated that microplastics had rough and porous surfaces which meant there were some inorganic elements associated with the MPs. Therefore, it could be suggested that the MPs may serve as a means of transport for other contaminants. The findings represent the first mapping of the extent of MP contamination in the groundwater of Al-Qatif and point out the necessity of continuous monitoring as well as proper handling of plastic waste and wastewater in arid and semi-arid areas.

Keywords: Groundwater; Al-Qatif; Microplastic; Saudi Arabia; Shallow well.

How to cite: Isa, I., Benaafi, M., and Baalousha, H. M.: Detection and characterization and risk of microplastic in groundwater in the Eastern Province of Saudi Arabia, EGU General Assembly 2026, Vienna, Austria, 3–8 May 2026, EGU26-8265, https://doi.org/10.5194/egusphere-egu26-8265, 2026.

EGU26-10091 | Posters on site | HS8.2.12

Occurrence and fate of emerging contaminants in rural endorheic basins: insights from the Gallocanta Lake Basin (Spain) 

Miguel Angel Marazuela, Juan Cruz Carrizo, Silvia Diaz-Cruz, Anna Jurado, Estanislao Pujades, Cristina Pérez-Bielsa, and Jesús Causapé

Endorheic basins with terminal lakes are particularly vulnerable to chemical pollution due to their closed hydrological nature, which promotes the retention and accumulation of contaminants. This study investigates the occurrence, sources, and environmental fate of contaminants of emerging concern (CECs) in the rural endorheic basin of Gallocanta Lake (Spain), one of the largest saline lakes in Europe and a protected Ramsar site. A spatially comprehensive sampling campaign was conducted in September–October 2024 across surface waters, groundwater, treated and untreated wastewater, and terminal water bodies. Non-target screening and semiquantative approaches based on liquid chromatography coupled to high resolution mass spectrometry (LC–HRMS) were applied to characterize complex contaminant mixtures across environmental compartments.

Multivariate analyses revealed clear chemical fingerprints associated with diverse sources, including effluents from rural wastewater treatment plants (WWTPs), untreated wastewater discharges, agricultural runoff, and natural stream waters. Primary-treated WWTP effluents showed variable and often limited removal of CECs, with selective attenuation of some pharmaceuticals but persistence or even enrichment of others, highlighting the limitations of basic treatment in rural settings. Terminal lakes exhibited the highest cumulative contaminant loads, reflecting their role as integrators of upstream pressures.

Particular attention was drawn on the insect repellent N,N-diethyl-meta-toluamide (DEET), due to its exceptional persistence and enrichment in Gallocanta Lake, reaching concentrations (>5,000 ng/L) far exceeding those in inflows (<1,000 ng/L). This pattern, resulting from the combination of compound stability and strong evapoconcentration under semi-arid conditions, will be discussed in detail, illustrating how moderate inputs can lead to disproportionately high accumulation in endorheic lakes.

Overall, the results demonstrate that endorheic basins act as hotspots for the accumulation of persistent CECs and emphasize the need to consider hydrological closure, in-lake processes, and rural wastewater management when assessing contamination risks and designing mitigation strategies.

How to cite: Marazuela, M. A., Carrizo, J. C., Diaz-Cruz, S., Jurado, A., Pujades, E., Pérez-Bielsa, C., and Causapé, J.: Occurrence and fate of emerging contaminants in rural endorheic basins: insights from the Gallocanta Lake Basin (Spain), EGU General Assembly 2026, Vienna, Austria, 3–8 May 2026, EGU26-10091, https://doi.org/10.5194/egusphere-egu26-10091, 2026.

According to European and Czech legislation, the quantitative status of groundwater must be regularly assessed, and a water management balance of groundwater quantities must be carried out. Good quantitative status of groundwater, assessed at the level of groundwater bodies, is defined based on the groundwater level (GWL), where the GWL in a groundwater body ensures that the available capacity of the groundwater resource is not exceeded by the long-term average annual abstraction.

However, the development of GWL in Quaternary hydrogeological zones (HZs), which in the Czech Republic correspond to groundwater bodies, can vary significantly over time depending on their recharge potential and the extent of their use. Groundwater may flow in from slopes, be drained from underlying aquifers, recharge directly from precipitation, or—due to groundwater abstractions (GA)—flow in from rivers. Furthermore, groundwater level development in individual monitoring wells varies depending on local hydrogeological conditions, distance from abstraction sites, proximity to rivers, and other factors. Consequently, neighboring wells within the same HZ may exhibit very different GWL trends. Establishing simple criteria for assessing the quantitative status of long-term and intensively managed Quaternary HZs is therefore challenging.

To address this, all Quaternary HZs were divided into smaller, more manageable units called subzones. The division was based on the presumed extent of influence of large abstraction sites and the arrangement of boundary conditions. For each subzone, a specific general GWL (sGWL) was determined by averaging standardized monthly GWL values from all wells within the subzone. For each subzone, the minimum sGWL (sGWLmin) and the development of GA were assessed for the most significant drought periods. The most severe drought occurred in 2015–2020, closely followed by droughts in 1990–1994 and 2003–2004. In contrast, GA during 1990–1994 was approximately double that of 2015–2020 and likely caused sGWLmin in many subzones to fall below the level observed in 2015–2020. The drought period of 2003–2004 had GA levels between those of 1990–1994 and 2015–2020.

The comparison was carried out under the assumption that during the driest period, 2015–2020, GA were not restricted due to drought. If higher GA in earlier drought periods caused sGWLmin to fall below its level in 2015–2020, GA influenced the quantitative status of the subzone. If, however, higher GA in earlier drought periods did not cause sGWLmin to fall below the level observed in 2015–2020, GA did not affect the quantitative status of the subzone. By comparing minimum sGWLmin during drought periods with varying historical GA magnitudes, volumetric and level-based criteria were established under which the groundwater status of a subzone can be considered good. This methodology was applied to 65 of 75 subzones. For the remaining 10 subzones with insufficient GA and GWL monitoring data, a specific approach was adopted. Based on the assessment of the quantitative status of subzones, the quantitative status of the HZs was subsequently evaluated.

How to cite: Nol, O., Burda, J., Zrzavecky, M., and Zabka, V.: Use of Minimum Groundwater Levels and Groundwater Abstractions for Assessing the Quantitative Status of Quaternary Groundwater Bodies in the Czech Republic, EGU General Assembly 2026, Vienna, Austria, 3–8 May 2026, EGU26-10447, https://doi.org/10.5194/egusphere-egu26-10447, 2026.

EGU26-10864 | ECS | Posters on site | HS8.2.12

Methodological framework for delineating wellhead protection areas for groundwater abstraction wells 

Francisco Iturriaga-Gosen, María-Elena Rodrigo-Clavero, Eduardo Cassiraga, and Javier Rodrigo-Ilarri

Groundwater is a strategic resource whose protection is essential to maintain its quality and prevent contamination processes. Delineating protection perimeters around abstraction points makes it possible to establish zones where potentially polluting activities are restricted, thereby reducing risk to the resource and supporting planning and the sustainable management of water supply.

In this work, the main approaches for determining protection perimeters are analysed and an operational methodology, implemented in a spreadsheet, is proposed to facilitate its application in environmental assessment and management contexts, taking into account the available hydrogeological data. The approach is developed and applied in the province of Valencia, with an emphasis on consistency between the regulatory framework and the definition of protection zones based on groundwater travel times.

The reference framework is established through a review of the applicable European and Spanish legislation for the protection of abstraction points, from the EU Water Framework Directive to basin-specific regulations, enabling the definition of the required zones, the criteria associated with travel times, and the activities subject to restrictions. Building on this basis, both analytical and numerical delineation approaches are examined: the former provide rapid solutions but rely on restrictive assumptions (homogeneous and isotropic media), whereas the latter are based on mathematical models (e.g., MODFLOW) capable of representing pumping-induced flow and estimating travel-time isochrones.

As a result, a replicable and transparent spreadsheet-based procedure is presented, integrating regulatory criteria and hydrogeological principles to support the delineation of protection zones, contributing to more traceable decision-making in contamination prevention and the sustainable management of groundwater resources.

How to cite: Iturriaga-Gosen, F., Rodrigo-Clavero, M.-E., Cassiraga, E., and Rodrigo-Ilarri, J.: Methodological framework for delineating wellhead protection areas for groundwater abstraction wells, EGU General Assembly 2026, Vienna, Austria, 3–8 May 2026, EGU26-10864, https://doi.org/10.5194/egusphere-egu26-10864, 2026.

Groundwater overdraft has been occurring for decades in California’s San Joaquin Valley, an alluvial basin consisting of unconfined, semi-confined and confined aquifers. Excessive pumping of groundwater is exceeding the natural recharge of the aquifers; this is causing land subsidence which has a significant negative economic impact through infrastructure damage. A solution is to supplement natural recharge through managed aquifer recharge, which can be implemented by the spreading of water on the ground surface, or by the injection of water in wells. Because subsidence of the ground surface occurs primarily due to compaction in the confined aquifers, there is a need to prioritize recharge of the confined aquifers. This requires identifying locations where there are permeable pathways that can be accessed by recharge operations to reach the confined aquifers. Recent studies have shown that high resolution interferometric synthetic aperture radar (InSAR) data, when processed to extract seasonal deformation timing and amplitude information, reveal seasonal uplift patterns associated with natural recharge into the confined aquifers.  We find coherent signals in three regions in the InSAR data from the 2017, 2019 and 2023 water years which represent “wet years”, i.e. the years with high volumes of precipitation and surface runoff. For each of the three regions, we used an interpolated 3D sediment-type model derived from airborne electromagnetic data to identify the permeable pathways that enter the confined aquifer. In two of the regions, pathways to the confined aquifer exist at the margins of the Corcoran Clay, the major confining aquitard of the valley. In the third region, the Corcoran Clay is thin and intersected by pathways of coarse material. The ability to utilize satellite imaging to inform the design of recharge operations can contribute significantly to achieving sustainable groundwater management.

How to cite: Zhang, S. and Knight, R.: Satellite imaging to identify pathways for recharge of the confined aquifers in California's San Joaquin Valley, EGU General Assembly 2026, Vienna, Austria, 3–8 May 2026, EGU26-15172, https://doi.org/10.5194/egusphere-egu26-15172, 2026.

Groundwater depletion increases the carbon cost of irrigation through two linked controls: falling water tables raise pumping lift and electricity-related CO₂ per unit of water, and extraction of HCO₃-rich groundwater can add a geochemical CO₂ flux as dissolved inorganic carbon re-equilibrates during use. These mechanisms compound as depletion deepens, making intensively irrigated drylands especially sensitive. Mexico is a compelling Latin American case because it is among the region’s largest agricultural groundwater users, with primary irrigated production concentrated in arid-to-semiarid basins where GRACE indicates substantial storage declines. We quantified national groundwater-related CO₂ emissions for 2012, 2017, and 2021 by integrating GRACE groundwater storage anomalies (referenced to a 2002 baseline) with representative bicarbonate concentrations and electric pumping energy. GRACE anomalies intensified to < −75 cm by 2021 across arid to semi-arid, groundwater-irrigated basins of northern Mexico and the central plateau (major production regions in Chihuahua, Sonora, Zacatecas, Guanajuato, and San Luis Potosíwhere groundwater HCO₃⁻ typically spans ~150–600 mg L¹, consistent with these controls, state hotspots exceeded 3,200 t CO₂e yr¹ for pumping (notably Chihuahua) and 900 t CO₂e yr¹ for bicarbonate-associated emissions (Chihuahua and Sonora). Combined emissions increased from 2012 to 2021, dominated by pumping with a minor bicarbonate-associated component. Hierarchical clustering separated a high-emission irrigated-dryland group from a lower-emission group, indicating that depletion intensity and hydrochemical enrichment jointly structure the national pattern. In the global context, Mexico’s national pumping emissions are far below national inventories such as the USA irrigation estimate (12.6 Mt CO₂e yr¹; 2018) and India’s groundwater-linked estimate (32–132 Mt CO₂ yr¹; 19962016), while hotspot area intensities reported for northern/central Mexico are comparable to the USA per-area irrigation-energy benchmark. These results support integrating groundwater-driven emissions into water–energy planning and prioritizing mitigation that couples lower-carbon electricity for pumping with reductions in irrigation demand and shifts away from high water-demand cropping systems in the most depleted basins.

How to cite: Panday, D. P. and Kumar, M.: Hidden CO₂ from falling aquifers: National-scale pumping emissions and bicarbonate degassing in Mexico, EGU General Assembly 2026, Vienna, Austria, 3–8 May 2026, EGU26-15765, https://doi.org/10.5194/egusphere-egu26-15765, 2026.

EGU26-17040 | Posters on site | HS8.2.12

Integrating hydrogeological and earth observation data for the assessment of aquifers compaction  and storage dynamics under groundwater abstraction 

Cristina Di Salvo, Francesco Pennica, Laura Pedretti, Francesco Zucca, Claudia Mesina, and Federico FIlipponi

Rising rates of groundwater abstraction and associated aquifer depletion are a major global concern, threatening environmental integrity, water availability, and food security for future generations. Overexploitation reduces pore water pressure, increasing effective stress in aquifers. The extracted water coming from the compression of adjacent and intervening clay beds results in aquifer compaction and land subsidence, one of the most severe geotechnical consequences of groundwater withdrawal. This issue is prevalent in densely populated and developed areas, often located in unconsolidated Quaternary basins of alluvial, lacustrine, or shallow marine origin. Despite extensive research on land subsidence from groundwater overexploitation, the combined effects of intensified drought and anthropic pressure on aquifer deformation are still unclear. In Italy, land subsidence due to groundwater abstraction is observed particularly in agricultural areas. Increasing demand for irrigation and uncertain surface water supplies exacerbated by climate change, suggests the issue will persist.

Satellite Earth Observation data can enhance understanding of groundwater dynamics: phenological metrics from time series of biophysical parameters and vegetation indices can be used for crop mapping and irrigation needs, while differential SAR interferometry offers accurate quantitative measurements of surface deformation and land subsidence at high spatial and temporal resolution, serving as a proxy for evaluating groundwater abstraction effects. An ongoing research is here presented, with the aim to investigate the physical mechanism beneath the land subsidence, to identify key hydrologic and geotechnical principles driving land subsidence in target areas, in order to develop a predictive framework to estimate the irreversible volume loss of economically extractable groundwater.  The workflow comprises a preliminary phase involving data collection and storage in a dedicated WebGIS platform, followed by the assessment of geological setting, a land use analysis, the analysis of dinSAR data and the trend analysis of groundwater head and withdrawals. The study was approached in two areas (Po Plain and Pontine Plain, Italy), sensibly differing among each other for both the density of available head and withdrawal data and the geological setting, to preliminary assess the relationship between land subsidence and groundwater withdrawal. The perspective of this research is to provide a scientific basis for authorities to plan effective mitigation and ensure sustainable groundwater management.

How to cite: Di Salvo, C., Pennica, F., Pedretti, L., Zucca, F., Mesina, C., and FIlipponi, F.: Integrating hydrogeological and earth observation data for the assessment of aquifers compaction  and storage dynamics under groundwater abstraction, EGU General Assembly 2026, Vienna, Austria, 3–8 May 2026, EGU26-17040, https://doi.org/10.5194/egusphere-egu26-17040, 2026.

In Mediterranean-type ecosystems, droughts are altering the availability of soil water, forcing vegetation to adjust its water uptake strategies. When soil moisture is depleted, a critical survival mechanism for phreatophytes is the shifting of water uptake from shallow soil layers to groundwater. However, sustainable water resources management often overlooks this mechanism. Consequently, quantifying the evapotranspiration (ET) fluxes due to a direct link between the aquifer and the atmosphere represents an important advancement in hydrological modeling. 

We investigate this vegetation-induced water uptake at two sites with shallow water tables: San Rossore (Pinus pinea) and Castel Porziano (Quercus ilex). Preliminary analysis at these sites indicates a decoupling of ET from soil moisture availability during summer months, suggesting a contribution from deep taproots. To separate the sources of these fluxes, we combine high-frequency Eddy Covariance measurements with stable water isotopes analysis  (𝛿18O, 𝛿2H ) of xylem, soil water, rainfall, and groundwater. 

We propose a framework where isotope-derived ET fractions are used to conceptualise and calibrate unsaturated zone models. This approach not only refines estimates of net groundwater recharge but also improves the representation of vegetation feedback in Earth System Models, ensuring that transpiration from groundwater is accurately represented in climate scenarios for adaptation and water management studies. 

How to cite: Gelsinari, S., Alessandri, A., and Penna, D.: Decoupling ET from soil moisture: Tracing groundwater uptake in Mediterranean forests using stable isotopes to inform land surface models., EGU General Assembly 2026, Vienna, Austria, 3–8 May 2026, EGU26-17454, https://doi.org/10.5194/egusphere-egu26-17454, 2026.

EGU26-18110 | ECS | Posters on site | HS8.2.12

Managed Aquifer Recharge (MAR) using irrigation channels: experiences from the test sites of the SeTe-ALCOTRA project 

Maria Adele Taramasso, Alessia Amendola, Lorenzo Gallia, Nicolò Giordano, Paolo Algarotti, Marino Gandolfo, Bartolomeo Vigna, Adriano Fiorucci, Tiziana Tosco, Rajandrea Sethi, and Alessandro Casasso

Climate change is threatening both the quantity and quality of groundwater resources, as scarcer rainfalls and prolonged droughts reduce natural recharge and increase reliance on groundwater abstraction. In this context, Managed Aquifer Recharge (MAR) is a climate change adaptation measure that, through the intentional recharge of aquifers with excess surface water, provides water underground storage for later use (e.g., irrigation) and may improve groundwater quality (e.g. addressing saltwater intrusion or nitrate pollution).

The SeTe (Sécheresse et Territoires) project, funded by the EU Interreg ALCOTRA programme, involves the feasibility study and demonstration of MAR at three sites – Beinette, Tetti Pesio and Tarantasca – in the Cuneo plain, a large shallow alluvial aquifer in northwestern Italy. In this intensively farmed area, with a large seasonal mismatch between water supply and demand, groundwater use for irrigation is widespread and recent droughts and human pressures have caused severe aquifer depletion. This issue is particularly relevant in the SeTe test sites, where irrigation water is supplied through wells and semi-natural lowland springs (fontanili), drainage trenches excavated since the Middle Ages to reclaim the marshy lands conveying the drained groundwater to irrigation canals. As groundwater levels decline, many wells dry up, or show reduced yields, and fontanili discharge decreases or ceases. Experimental recharge trenches were built within the project to supply the aquifer by infiltrating water from canals when they are not used for irrigation. This water, which would otherwise flow into water courses, is infiltrated upstream the fontanili to raise local groundwater levels and enhance their drainage capacity.

After the geological, hydrological and hydrogeological characterization of the area carried out in the first year of the project, two infiltration trenches were completed in Beinette and Tetti Pesio by spring 2025. Then, the trenches were tested until the start of the irrigation season, while a full infiltration season was planned for winter 2025-2026.
Water levels in monitoring wells, fontanili and recharge trenches, as well as recharge flow rates, are continuously monitored through a monitoring network, also using LoRA-based systems to enable real-time data acquisition. Water chemistry monitoring is carried out to ensure that the infiltrated water is of higher quality than the groundwater, often affected by nitrate contamination.
Meteorological and hydrological data, including rainfall, snowfall and rivers flows, are integrated from the regional monitoring database to understand the overall system behaviour, with a focus on quantifying recharge and its beneficial effects on groundwater levels and fontanili discharge. 

Despite operational challenges, such as clogging, the SeTe ALCOTRA project is demonstrating that with its cost efficiency, simple design and minimal environmental impact, MAR is a suitable strategy for aquifer recharge, supporting ecosystem services and economic activities.
Finally, public engagement, both with authorities and local communities – is a key aspect, as it can facilitate the adoption and dissemination of this type of infrastructure.

How to cite: Taramasso, M. A., Amendola, A., Gallia, L., Giordano, N., Algarotti, P., Gandolfo, M., Vigna, B., Fiorucci, A., Tosco, T., Sethi, R., and Casasso, A.: Managed Aquifer Recharge (MAR) using irrigation channels: experiences from the test sites of the SeTe-ALCOTRA project, EGU General Assembly 2026, Vienna, Austria, 3–8 May 2026, EGU26-18110, https://doi.org/10.5194/egusphere-egu26-18110, 2026.

EGU26-19910 | ECS | Orals | HS8.2.12

Identifying treatment protocols by translating required fluoride thresholds into site-specific removal requirements in community-based defluoridation systems 

Akshay Kashyap, Laura A. Richards, Suzie M. Reichman, Kathryn A. Mumford, and Meenakshi Arora

Abstract

Community-scale defluoridation systems have been widely implemented in fluoride-affected, groundwater-dependent regions to mitigate and/or reduce the risks associated with exposure to excessive geogenic fluoride in drinking water [1, 2]. Performance of these systems is typically assessed by whether treated water meets a desired guideline threshold concentration (e.g., 1.5 mg/L fluoride, as prescribed by the World Health Organization) [3]. However, translating that threshold into practice requires a site-specific metric: the fluoride removal efficiency needed to reach the target from local source-water fluoride concentrations. Because this requirement varies across sites (and potentially seasons), treatment protocols should be set against the required removal rather than applying uniformly across all sites. Here, we quantify site-specific required removal targets and compare them with achieved/actual removal using paired pre- and post-treatment measurements. We applied this framework to 58 community water purification plants (CWPPs) in the Bankura and Purulia districts of West Bengal, India, to quantify required versus achieved removal across sites and identify where operational intensity (e.g., media choice, run time, regeneration frequency) should differ.

Pre-filter fluoride ranged from 1.6 to 8.2 mg/L. To meet the WHO guideline of 1.5 mg/L, required removal efficiencies were 11.8 to 81.7 % in Bankura (median 54.5 %) and 6.3 to 61.5 % in Purulia (median 28.6 %), with an overall median requirement of 33.3 % across both districts. Even for a stricter target of 1.0 mg/L, median required removal largely remained below 70 %. Together, these results show that many community systems do not need near-complete fluoride removal; they require a clearly defined, site-specific removal target that can range from moderate to very high. This spread is operationally consequential; a plant requiring ~30 % removal should not be managed with the same media choice, run time, or regeneration frequency as one requiring ~80 % removal.

Based on the required fluoride removal (derived from source-water fluoride and the selected threshold concentrations) and ideally tracked across seasons, this approach can tailor site-specific operation of the community defluoridation system, guiding adsorbent media choice for different sites, run times, monitoring and regeneration frequency, and maintenance scheduling. In doing so, it will help operators set realistic performance targets, detect underperformance early, and prioritize corrective actions where needed the most.

References

1. Khairnar et al. (2015). doi:10.7860/JCDR/2015/13261.6085

2. Osterwalder et al. (2014). doi:10.1016/j.scitotenv.2013.10.072

3. WHO (2022). Guidelines for drinking-water quality

Acknowledgements

This work was supported by the Australia-India Institute (Grant: 053139) and the Manchester-Melbourne PhD funding (Cookson Scholars) to AK. Additional support included contribution from The University of Manchester, UKRI (MR/Y016327/1) to LAR et al. We thank colleagues at the University of Manchester, IIT Kanpur, IIT Kharagpur, WBPHED staff, and communities in West Bengal for support with the project and field sampling. The views expressed are those of the authors.

How to cite: Kashyap, A., Richards, L. A., Reichman, S. M., Mumford, K. A., and Arora, M.: Identifying treatment protocols by translating required fluoride thresholds into site-specific removal requirements in community-based defluoridation systems, EGU General Assembly 2026, Vienna, Austria, 3–8 May 2026, EGU26-19910, https://doi.org/10.5194/egusphere-egu26-19910, 2026.

EGU26-20039 | ECS | Posters on site | HS8.2.12

Improving local groundwater management in Estonia and Latvia through real-time monitoring and machine learning 

Liina Hints, Magdaleena Männik, Enn Karro, Inga Retiķe, Jānis Bikše, Mārcis Tīrums, and Andris Vīksna

As climate change accelerates, extreme events like droughts and floods are becoming more frequent and severe across Europe, and pollution adds further strain on groundwater resources. Groundwater sustains ecosystems and provides most of the drinking water in Estonia and Latvia, making its sustainable and proactive management more important than ever. In practice, however, that kind of management is difficult to achieve. Current monitoring systems in Estonia and Latvia still operate on slow cycles of data collection and manual analysis, leaving little room for early intervention. Because of this, municipalities often find out about issues with groundwater quality and quantity when they have already escalated – when wells have run dry or contaminants have reached drinking water supplies. Even when data is available, it often requires expert interpretation, making it difficult to act quickly and prevent problems in time.

The cross-border 'HydroScope' project addresses these challenges by developing a groundwater early warning system for two pilot municipalities: Saaremaa (Estonia) and Dienvidkurzeme (Latvia). In these municipalities, telemetry systems tailored to local groundwater conditions are installed in monitoring wells, introducing real-time groundwater monitoring in Estonia for the first time and expanding the network in Latvia. Real-time digital spring systems complement the well monitoring network. 

Machine learning models are developed to automatically detect patterns in real-time groundwater quantity and quality data and to generate short-term predictions. This information feeds into two municipality-specific early warning platforms. These platforms visualize insights from near real-time data in an easily interpretable way, along with recommendations for what actions to take under different scenarios – e.g. reducing water use if a groundwater drought is likely, or identifying potential contamination sources when thresholds are approached.

The ‘HydroScope’ project is a first step toward establishing a real-time groundwater monitoring paradigm in Estonia and Latvia, and also toward making that real-time data directly usable for local decision-making, thus supporting sustainable and proactive groundwater management practices.

The project HydroScope (EE-LV00250) is funded by the European Union through the European Regional Development Fund (ERDF) within the Interreg VI-A Estonia–Latvia Programme 2021–2027.

How to cite: Hints, L., Männik, M., Karro, E., Retiķe, I., Bikše, J., Tīrums, M., and Vīksna, A.: Improving local groundwater management in Estonia and Latvia through real-time monitoring and machine learning, EGU General Assembly 2026, Vienna, Austria, 3–8 May 2026, EGU26-20039, https://doi.org/10.5194/egusphere-egu26-20039, 2026.

Groundwater potential zoning (GWPZ) using multi-criteria decision analysis (MCDA) and data-driven techniques has emerged as a vital tool for sustainable groundwater management, particularly in data-scarce coastal regions where surface water availability is limited and aquifers are vulnerable to overexploitation and seawater intrusion. Coastal aquifer systems are inherently heterogeneous and dynamically influenced by geomorphology, lithology, land use, and climatic conditions, making integrated decision-support frameworks essential for identifying zones with varying groundwater potential. In this context, the present study evaluates and compares six widely used subjective, objective and probabilistic MCDA techniques—Analytic Hierarchy Process (AHP), Fuzzy-AHP (F-AHP), Frequency Ratio (FR), Weight of Evidence (WoE), Entropy, and Multi-Influencing Factor (MIF), for analyzing groundwater prospect in a complex coastal alluvial setting. The study area with an areal extent of 6468.60 km2, comprises the Haldi–Kansabati–Subarnarekha interfluve located along the Bay of Bengal in the southern coastal region of West Bengal, eastern India. The region is characterized by a ‘Tropical Wet-and-Dry’ climate under the Köppen–Geiger classification and exhibits pronounced hydrogeological heterogeneity. The geological framework is dominated by younger alluvium (quaternary sediments) in the floodplains and deltaic tracts, followed by older alluvium (tertiary sediments) inland, coastal alluvium along the shoreline, and lateritic formations in the landward uplands. These formations exert strong control on groundwater occurrence, storage, and movement. Multiple groundwater-conditioning factors such as: ‘runoff coefficient’, ‘land slope %’, ‘drainage density’, ‘geology’, and ‘proximity to surface water bodies’ representing topography, hydrology, geology, land surface characteristics, and recharge conditions were integrated within the ArcGIS pro v3.4.2 environment to generate GWPZ maps using each of the six MCDA techniques. The resulting groundwater potential maps were classified into three categories—‘high’, ‘moderate’, and ‘low’ potential zones—using consistent classification criteria across all methods to enable inter-model comparison. Model validation was performed using observed pumping well yield (discharge) data, which were independently categorized into three classes: ‘low’ (<36 m³/hr), ‘moderate’ (36–90 m³/hr), and ‘high’ (>90 m³/hr). The predictive performance of each GWPZ model was quantitatively evaluated using Pearson’s correlation coefficient (r), and Receiver Operating Characteristic (ROC) curve-derived Area Under the Curve (AUC) statistics generated through the ArcSDM v5.00.22 toolbox in ArcGIS Pro v3.4.2. The validation results demonstrate notable variability in model performance. Among the six MCDA techniques, Fuzzy-AHP (F-AHP) exhibited the highest predictive accuracy with a correlation coefficient (r) of 0.912 and an AUC value of 0.853, followed by AHP (r=0.897; AUC=0.815), WoE (r=0.868; AUC=0.773), FR (r=0.809; AUC=0.724), MIF (r=0.778; AUC=0.702), and Entropy (r=0.727; AUC=0.683). The superior performance of the hybrid Fuzzy-AHP technique highlights its robustness in handling uncertainty and subjectivity while maintaining logical consistency. The F-AHP technique further sustains gradual transitions in factor importance when dealing with complex coastal hydrogeological systems. Overall, the study underscores the robustness of MCDA-based approaches, particularly F-AHP and AHP, for groundwater potential assessment in coastal alluvial environments and provides a comparative framework to support groundwater planning and management in similar vulnerable coastal regions.

How to cite: Naz, A., Ghosh, S., and Jha, M. K.: Comparative Evaluation of Multi-Criteria Decision Analysis Techniques for Groundwater Potential Mapping in a Coastal Alluvial Basin of Eastern India, EGU General Assembly 2026, Vienna, Austria, 3–8 May 2026, EGU26-21167, https://doi.org/10.5194/egusphere-egu26-21167, 2026.

EGU26-21287 | ECS | Orals | HS8.2.12

Using stable isotopes to investigate geochemical processes and hydrogeodiversity in a complex aquifer system  

Andrea Cisternino, Barbara Casentini, Stefano Amalfitano, Marco Melita, Francesca Castorina, and Elisabetta Preziosi

Stable isotopes represent a powerful approach for investigating hydrogeological processes in groundwater. Using δ¹³C-DIC helps tracing carbon sources, quantify microbial activity (respiration), understand water-rock interactions and carbonate weathering, and determine DIC origin (organic matter mineralization, carbon dioxide dissolution, geogenic sources). Further, water-rock interactions can be effectively investigated using the ⁸⁷Sr/⁸⁶Sr isotopic ratio, a method based on the principle that the ⁸⁷Sr/⁸⁶Sr ratio in groundwater reflects the ⁸⁷Sr/⁸⁶Sr ratio of the hosting formation that was inherited at the time of rock formation, hence supporting the appropriate attribution of groundwater samples to a specific geological formation.

It is known that peat-rich fluvio-marsh alluviums promote anoxic conditions that enhance arsenic (As), iron (Fe), and manganese (Mn) release, while volcanic deposits and travertines also play a key role in controlling As in groundwater.

This study aims to elucidate how isotopes ratios can support groundwater quality patterns and biogeochemical processes interpretation in a medium size river basin with diverse lithological complexes, and eventually define hydrogeodiversity across the basin by combining geostratigraphy with hydrogeochemical information.

Between November 2024 and December 2025, more than 90 samples were collected in the Sacco River Valley. The study area has an extensive presence of alluvial and lacustrine deposits locally rich in peat (Pleistocene-Holocene), mainly alkali-potassic volcanic products intercalations from the Middle Latina Valley (Pofi and Ceccano eruptive centers) and the Albani Hill apparatus (Pleistocene), and travertine lenses (Pleistocene) connected to past hydrothermal systems. These lithological complexes host a large water table aquifer fed by local precipitation and by lateral flow from the carbonate mountains on the eastern side. A thick sequence of sandy-marly Flysch (Miocene) separates this groundwater body from a deeper groundwater system circulating in Meso-Cenozoic limestones. The sandy levels host themself a local circulation of groundwater.

Major and trace cations (ICP-OES/ICP-MS), anions (IC and titration for HCO3), and dissolved organic carbon (TOC analyzer) were analyzed at CNR-IRSA laboratories. Stable isotopes (δ¹⁸O, δ²H, δ¹³C-DIC) were determined at ISO4 s.r.l. (Turin, Italy) and ⁸⁷Sr/⁸⁶Sr at CNR-IGAG, at Sapienza University of Rome laboratories.

The collected groundwaters have a calcium-bicarbonate facies with a slight tendency to alkaline-earth facies. Average pH is neutral, though both strongly alkaline (9.57) and acidic (5.52) values were recorded. Encountered reducing samples were largely from alluvial deposits (41%), while oxidizing conditions dominate in volcanic rocks (48%). Higher variability for As (0.2-55 μg/L), Fe (43.4-6138 μg/L), and Mn (1.3-437 μg/L) was observed in reducing conditions.

Less negative/slightly positive δ¹³C-DIC values (-0.62 – 0.67‰) in few samples suggested deep CO₂ interaction and distinguished rainfall-fed waters from deeper circulating systems. Further, they might indicate where organic pollution is currently active. ⁸⁷Sr/⁸⁶Sr results were found generally consistent with the actual stratigraphic sequences observed in the sampled wells or inferred from available cartographic information, confirming its usefulness in the attribution of the samples to the appropriate aquifer (or a mixing among several of them).

Finally, hydrogeodiversity across the basin provides a framework to interpret the spatial variability of groundwater quality and the associated biogeochemical processes and ecosystems, also finalized to management purposes.

How to cite: Cisternino, A., Casentini, B., Amalfitano, S., Melita, M., Castorina, F., and Preziosi, E.: Using stable isotopes to investigate geochemical processes and hydrogeodiversity in a complex aquifer system , EGU General Assembly 2026, Vienna, Austria, 3–8 May 2026, EGU26-21287, https://doi.org/10.5194/egusphere-egu26-21287, 2026.

EGU26-21749 | Orals | HS8.2.12

Groundwater protection in Denmark 

Birgitte Hansen

Groundwater protection has for decades been high on the Danish political agenda with implementation of national environmental action plans since the 1980’ies and a comprehensive groundwater mapping program in 2000 targeting vulnerable areas in need of further protection at a municipally level. Successful effect on improving groundwater quality due to effectful national agricultural nitrogen regulations has been documented with monitoring data in the first two decades until around year 2000. Since then, groundwater protection in Denmark has had negligeable effect e.g. seen in minor improvements on lowering nitrate concentrations in groundwater, and recently on detection of new emergent contaminants in many monitoring and drinking water abstraction wells. In addition, concerning nitrate, new knowledge has questioned the current drinking water standard of 50 mg/l due to increasing evidence of health effects well below this standard.

This talk will give an overview on the state and trends of nitrate in Danish groundwater for evaluation of the effect of protection strategies and present an Innovation Fund Denmark project called PROTECT running from 2025-2029. PROTECT aims to provide tools and knowledge for holistic future protection of groundwater in conjunction with protection of nature, the aquatic environment, climate, and human health by integrating knowledge from geosciences, engineering, medical and social sciences.

How to cite: Hansen, B.: Groundwater protection in Denmark, EGU General Assembly 2026, Vienna, Austria, 3–8 May 2026, EGU26-21749, https://doi.org/10.5194/egusphere-egu26-21749, 2026.

EGU26-22052 | ECS | Orals | HS8.2.12

Drivers of Contaminants of Emerging Concern (CECs)  concentration in aquifers and rivers of the Besòs basin (Catalunya, Spain) 

Luciana Scrinzi, Sergio Santana, Erik Mestanza, Anna Jurado, Estanislao Pujades-Garnes, and Sandra Pérez

Contaminants of emerging concern (CECs) are increasingly detected in European waters, yet they are rarely studied jointly across wastewater, surface water, and groundwater at basin scale, limiting understanding of groundwater vulnerability. CECs comprise a heterogeneous group of mainly anthropogenic compounds, including pharmaceuticals, personal care products, food additives, pesticides, veterinary and industrial chemicals, and their transformation products. Here, we investigated the occurrence of 120 CECs in wastewater treatment plant (WWTP) effluents (n = 10), rivers (n = 27), and groundwater (GW; 42 wells and 6 springs) across the Besòs catchment (NE Spain). We combined non-parametric correlation analysis, principal component analysis (PCA) of major ions and CECs, and grouping strategies to assess shared sources and attenuation mechanisms across basin compartments.
  Domestic and industrial CECs reached higher concentrations than pesticides across all compartments, and compounds ubiquitous in rivers and WWTPs were also detected basin-wide in GW. PCA of major ions showed that most river sites downstream of WWTPs plot between WWTPs and GW along the first two principal components (60–80% of ionic variance per sub-basin), with higher K and PO₄, whereas GW is characterized by higher Ca+Mg relative to Na+K and higher NO₃.
  In most river sites and in 62% of groundwater, total CEC pollution was largely explained by a small group of 16 compounds with high detection frequency in rivers and peak concentrations exceeding 200 ng L⁻¹ in at least one river sample. In these sites, attenuation was primarily inferred to result from mixing between unpolluted waters and WWTP-impacted flows, with additional non-conservative processes. This interpretation is supported by systematic decreases in individual CEC concentrations from rivers to groundwater while maintaining CEC:sucralose ratios comparable to, but lower than, those measured in WWTP effluents. Consistent with PCA results, the ubiquitous occurrence of these compounds in groundwater was not accompanied by major ion shifts in 50–70% of sites per sub-basin, indicating dilutionof small volumes of polluted water with larger volumes of resident groundwater.
  In contrast, 38% of groundwater sites showed total CEC pollution dominated by a larger group of 53 compounds with lower ubiquity and peak concentrations in surface water, including 23 CECs below detection limits in WWTPs and most river sites. Many of these compounds exhibited higher CEC:sucralose ratios in groundwater than in surface waters, suggesting inputs from subsurface sources rather than recent inflow from losing river reaches. At these sites, weaker relationships between CEC concentrations and hydrophilicity (log Dₒw) indicate reduced sorption control and a greater influence of desorption or legacy release from organic matter. PCA of selected CECs further showed co-variation among compounds sharing similar river ubiquity and peak concentration, highlighting common attenuation and release controls at sub-basin scale.
  Overall, mixing, sorption, and degradation emerge as key processes controlling CEC persistence and protecting groundwater quality at basin scale under chronic wastewater pressure.

Acknowledgements: Financial support from MCIU/AEI/10.13039/501100011033, the European Union and NextGenerationEU/PRTR through grants CEX2018-000794-S, PCI2024-153452 (WATER4MED project, PRIMA) and CNS2023-144051. Doctoral fellowship from ”la Caixa” Foundation (ID 100010434), code B006133.

How to cite: Scrinzi, L., Santana, S., Mestanza, E., Jurado, A., Pujades-Garnes, E., and Pérez, S.: Drivers of Contaminants of Emerging Concern (CECs)  concentration in aquifers and rivers of the Besòs basin (Catalunya, Spain), EGU General Assembly 2026, Vienna, Austria, 3–8 May 2026, EGU26-22052, https://doi.org/10.5194/egusphere-egu26-22052, 2026.

EGU26-22580 | Orals | HS8.2.12

Assessment of groundwater storage to estimate water availability for the Metropolitan City of Turin (NW Italy) 

Rajandrea Sethi, Giovanni Pigozzi, Alessia Amendola, Elisa Brussolo, Edoardo Burzio, Alessandro Casasso, Daniele Cocca, Diego Colombano, Domenico De Luca, Elena Egidio, Manuela Lasagna, and Tiziana Tosco

Groundwater resilience is a key factor for water security and climate change adaptation in densely populated regions. This study proposes a robust methodology to estimate gravitational groundwater storage (Sethi and Di Molfetta, 2019) in unconfined and deep aquifers within the plain sector of the Metropolitan City of Turin (2,600 km2). This assessment was performed in response to a recent regulation issued by the Italian National utility authority ARERA, which introduced an extensive set of indicators for evaluating service quality and sustainability at province or larger scale. In this framework, it is necessary to estimate freshwater availability (including both surface and groundwater bodies) and withdrawals at the large scale. If on the one hand the estimation of surface water and some type of withdrawals are relatively straightforward, the evaluation of the overall groundwater availability is challenging, and requires a detailed knowledge of aquifer properties, three-dimensional extent, recharge and discharge fluxes which is in most cases not available. This work proposes a simplified approach to meet this target and its application to the plane of the Metropolitan City of Turin (North-Western Italy).
The methodology involves a high-resolution GIS-based approach (250 × 250 m) and assumes the presence of two main groundwater bodies, namely an unconfined (shallow) aquifer and a confined (deep) aquifer. Two hydrogeological surfaces bound the domain: the water table of unconfined (shallow) aquifer (WTSA) from De Luca et al. (2020) and the interpolated surface of well bottoms (ISBW) drilled in the confined aquifer, derived from 340 active wells operated by the local water utility SMAT. An additional intermediate surface, the base of shallow aquifer (BSA), separates shallow and deep aquifers and was previously derived from an extensive historical set of borehole core analyses.
The groundwater storage is estimated as the volume of gravitational water in the two compartments, accounting for impermeable layers and effective porosity. In particular, permeable volumes are determined using depth-dependent granulometry maps, while gravitational groundwater volume is calculated using effective porosity values reported in regional literature.
Results indicate that gravitational groundwater reserves amount to approximately 7.68 km3 for the shallow aquifer and 17.57 km3 for the deep aquifers, assuming intermediate values of effective porosity. When porosity variability is considered, total estimates range between 10 and 40 km3.
Although subject to epistemic uncertainties related to surface interpolation and the assumption of special uniform porosity, this preliminary assessment provides a solid and transferable methodological foundation for water resource governance and regulatory compliance under European and Italian environmental legislation.

References:

Bove, A., Casaccio, D., Destefanis, E., De Luca, D., Lasagna, M., Masciocco, L., Ossella, L., & Tonussi, M. (2005). Idrogeologia della pianura piemontese. Idrogeologia della pianura piemontese. Regione Piemonte Direzione Pianificazione delle Risorse Idriche, Mariogros Industrie Grafiche S.p.A., Torino.

De Luca, D. A., Lasagna, M., & Debernardi, L. (2020). Hydrogeology of the western Po plain (Piedmont, NW Italy). Journal of Maps, 16(2), 265-273. https://doi.org/10.1080/17445647.2020.1738280

Sethi R., & Di Molfetta A. (2019). Groundwater Engineering: A Technical Approach to Hydrogeology, Contaminant Transport and Groundwater Remediation. Springer International Publishing, Cham

How to cite: Sethi, R., Pigozzi, G., Amendola, A., Brussolo, E., Burzio, E., Casasso, A., Cocca, D., Colombano, D., De Luca, D., Egidio, E., Lasagna, M., and Tosco, T.: Assessment of groundwater storage to estimate water availability for the Metropolitan City of Turin (NW Italy), EGU General Assembly 2026, Vienna, Austria, 3–8 May 2026, EGU26-22580, https://doi.org/10.5194/egusphere-egu26-22580, 2026.

EGU26-22704 | ECS | Posters on site | HS8.2.12

From ground to home: Evidence, extent and potential controls on groundwater sourced household drinking water contamination in Bihar, India 

Ajmal Roshan, David A. Polya, Meenakshi Arora, Arun Kumar, Ashok Ghosh, Anne-Marie Glenny, Majid Sedighi, Suzie M. Reichman, and Laura A. Richards

Groundwater, a major source of available freshwater 1, is central to meeting the drinking water needs globally 2, and in the eastern Indian state of Bihar 3. Groundwater in parts of Bihar however, has elevated levels of geogenic inorganic contaminants 4, with more recent studies also indicating microbial contamination 5 and presence of antimicrobial resistance (AMR) genes 6 in shallow and deeper depth groundwater. However, studies investigating contamination of groundwater-derived household drinking water at the point of consumption (PoC), as compared to the point of source (PoS), are limited in Bihar. Paired water samples (n = 39) were collected from groundwater wells at the PoS, and the corresponding household drinking water containers at the PoC; and tested for arsenic (As), Escherichia coli (E. coli) and extended spectrum beta-lactamase (ESBL) producing E. coli (ESBL-Ec) - as an exemplar of inorganic chemical contaminant, microbial contaminant, and AMR indicator organism, respectively. Results indicate samples exceeding the 10 µg/L WHO provisional guideline value for As to be same (at 5 %) between PoS and PoC. However, presence of E. coli increased from 46 % to 59 % (McNemar’s p = 0.27) while that of ESBL-Ec rose from 10 % to 46 % (McNemar’s p < 0.01) between PoS and PoC samples. 74 % of the households reported collection and storage of water prior to consumption, of which 72 % reported the storage vessels to be covered, and another 69 % reporting cleaning of the container’s multiple times a day. However, more than half of the sampled households owned livestock within premises, had kids under the age of five, and just 13 % reported any kind of treatment (including boiling) being done to the groundwater prior to drinking. No improvement in water quality was observed from PoS to PoC for E. coli. On the contrary, deterioration in water quality from PoS and PoC was indicated based on ESBL-Ec (Wilcoxon signed rank test; p < 0.05). As expected of inorganic contaminants, no significant shift (at the 0.05 level) in overall concentration was observed for As between PoS and PoC. The results call for sustainable management of groundwater sources, and improvements in delivery and treatment of contaminated groundwater prior to consumption so that potable drinking water is ensured at the end-user stage.

References: [1] Weblink: https://portals.iucn.org/library/sites/library/files/documents/2016-039.pdf; [2] DOI: 10.1016/C2018-0-03156-4; [3] Weblink: https://nhm.gov.in/uhc-day/Session%202/NFHS-5%20State%20Factsheet%20Compendium_Phase-I%20%281%29.pdf; [4] DOI: 10.3390/ijerph17072500; [5] Roshan et. al., AGU 2025; [6] 10.1016/j.envpol.2024.124205. This work was supported by MR/Y016327/1 (to LAR et. al.,) and Cookson Scholarship (to AR).

How to cite: Roshan, A., Polya, D. A., Arora, M., Kumar, A., Ghosh, A., Glenny, A.-M., Sedighi, M., Reichman, S. M., and Richards, L. A.: From ground to home: Evidence, extent and potential controls on groundwater sourced household drinking water contamination in Bihar, India, EGU General Assembly 2026, Vienna, Austria, 3–8 May 2026, EGU26-22704, https://doi.org/10.5194/egusphere-egu26-22704, 2026.

EGU26-22950 | Orals | HS8.2.12

Arsenic Speciation as a tool for groundwater quality assessment and sustainable water management: Evidence from the Almopia Basin, Northern Greece 

Despoina Psarraki, Panagiotis Papazotos, Eleni Vasileiou, and Maria Perraki

Arsenic (As) is referred as a potentially toxic element (PTE) and is commonly present in rocks, soils, and water. Bioaccumulation of As poses significant risks to human health. The World Health Organization (WHO) and the European Union have established a maximum guideline value of 10 μg·L−1 for As in drinking water. Elevated As concentrations have been reported in thermal spring- and ground- waters globally. The distribution of arsenic species, specifically trivalent arsenite [As(III)] and pentavalent arsenate [As(V)], in natural waters is primarily influenced by geochemical conditions such as redox and pH [1]. Under oxidizing conditions, such as those found in surface waters, As(V) predominates and is mainly present as oxyanions (H2AsO4, HAsO42−). In mildly reducing environments, As(III) is the dominant species and remains mostly as neutral arsenious acid (H3AsO3) at typical natural water pH levels (<9) [1].

This study examines As speciation in the Almopia Basin, Central Macedonia, Northern Greece, an area known for the Pozar thermal baths. The main geological formations include Quaternary and Neogene sediments (alluvium, marls, conglomerates, sandstones), Cretaceous and Triassic carbonate formations (limestones, dolomites), schists, ultramafic and mafic rocks (serpentinites, peridotites, diabases), Pliocene and Upper Jurassic volcanic rocks (andesites, dacites, trachytes), and pyroclastic rocks (volcanic tuffs and clasts).

Twenty-six surface water and groundwater samples were collected from irrigation and drinking wells (16), natural springs (4), and surface water bodies (6) during the wet period in 2023. All samples were analysed for physical parameters (i.e., pH, EC, Temp, D.O., Eh), major ions (i.e., Ca2+, Mg2+, NO3- etc) and 72 trace elements (i.e., As, B, Cr, Fe, Mn etc) in accordance with all established analytical protocols. For As speciation, an additional sample from each site was filtered in situ using disposable cartridges and analysed for As [2]. Spatial distribution maps were generated using ArcGIS Pro, and descriptive statistics were calculated.

The results show that total concentration of (Astot) in the whole samples range from 8.4 μg·L−1 to 382 μg·L−1, whereas As(III) concentrations, analysed in the filtered samples as Astot range from 0.5 μg·L−1 to 25.2 μg·L−1. Trivalent As in the samples accounts for approximately 1.6% to 17.5% of the Astot. The prevalent presence of As(V) suggests mildly oxidizing hydrogeochemical conditions in the Almopia Basin. Quantifying As(III) and As(V) is essential because As(III) is significantly harder to remove from water, while As(V) responds readily to standard treatments. This research highlights the importance of As speciation analysis in groundwater, as it informs the selection of suitable remediation strategies and determines the necessity for pre-oxidation to convert As(III) to As(V).

[1] Cullen, W. R., & Reimer, K. J. (1989). Arsenic speciation in the environment. Chemical Reviews, 89, 713–764.

[2] Meng X, Wang W. Speciation of arsenic by disposable cartridges. Proceedings of the third International Conference on Arsenic Exposure and Health Effects, San Diego, CA, July 12–15; 1998.

How to cite: Psarraki, D., Papazotos, P., Vasileiou, E., and Perraki, M.: Arsenic Speciation as a tool for groundwater quality assessment and sustainable water management: Evidence from the Almopia Basin, Northern Greece, EGU General Assembly 2026, Vienna, Austria, 3–8 May 2026, EGU26-22950, https://doi.org/10.5194/egusphere-egu26-22950, 2026.

EGU26-1070 | ECS | Orals | HS8.2.13

Integrating Controlled Drainage and Sub-Irrigation demand: Insights from FLUSH simulations in a Nordic agricultural field 

Joy Bhattacharjee, Heidi Salo, Minna Mäkelä, and Harri Koivusalo

Nordic agricultural drainage systems have traditionally been designed for the removal of excess water from spring snowmelt and autumn rainfall; however, as the crops grow, increased evapotranspiration coupled with typical low precipitation in the early growing season can result in moisture shortages. Controlled drainage (CD) offers a more adaptive solution by regulating outflow and maintaining higher water table depths (WTDs), thereby enhancing soil moisture retention and reducing nutrient losses. While the hydrological benefits of CD are well established, its potential to quantify sub-irrigation, the additional water required to maintain optimal root-zone moisture, remains insufficiently explored. In this study, we applied FLUSH, a process-based two-dimensional hydrological model, to assess whether controlled subsurface drainage systems can be used to estimate sub-irrigation demand in a flat agricultural field in northern Finland. Three water-management scenarios were simulated: conventional drainage (CV), CD, and controlled subsurface drainage with sub-irrigation (CD-SI). Multi-year simulations were used to evaluate WTD dynamics, drain discharge, groundwater outflow, and upward water movement under different scenarios. Model results show that elevating drainage control levels increases water retention and can generate upward flow from drains during dry periods, partially meeting crop water demand. Scenario comparisons confirm that the CD-SI (sub-irrigation) scenario introduces a consistent subsurface inflow, while CV and CD present minimal upward fluxes. Evapotranspiration patterns are primarily climate-driven, with only moderate increases under CD and CD-SI due to improved soil moisture availability. Both controlled and sub-irrigated systems reduce cumulative and daily drain discharge, indicating enhanced infiltration and storage within the root zone. These findings also show that CD systems with continuous monitoring can provide valuable information for estimating sub-irrigation demand, especially in soils with high microporosity and hydraulic conductivity. Overall, the study highlights the potential of integrated drainage and sub-irrigation strategies to support climate-responsive water management in Nordic agriculture.

How to cite: Bhattacharjee, J., Salo, H., Mäkelä, M., and Koivusalo, H.: Integrating Controlled Drainage and Sub-Irrigation demand: Insights from FLUSH simulations in a Nordic agricultural field, EGU General Assembly 2026, Vienna, Austria, 3–8 May 2026, EGU26-1070, https://doi.org/10.5194/egusphere-egu26-1070, 2026.

EGU26-1549 | ECS | Orals | HS8.2.13

Spatiotemporal dynamics of groundwater recharge in Bangladesh 

Md Zamil Uddin, Victor Bense, Md Abdul Mojid, and Syed Mustafa

Understanding spatiotemporal groundwater recharge is vital for sustainable water management in Bangladesh, as anthropogenic and climatic factors severely strain available resources. Groundwater recharge in Bangladesh varies widely across its contrasting hydrogeological settings, yet their spatial and temporal dynamics and controlling factors remain insufficiently quantified. This study aims to quantify the spatial and temporal distribution of groundwater recharge across the western hydrogeological zones of Bangladesh and to assess the influence of land use and soil properties on recharge variability. The physically based, spatially distributed water-balance model WetSpass-M was applied to understand the spatial and temporal distribution of groundwater recharge and to examine the influence of geospatial and hydrometeorological parameters on recharge dynamics. Model results reveal a clear upstream–downstream recharge gradient, with persistently low recharge in the clay-dominated Barind uplands and moderate to high recharge in the coastal deltaic plains during the monsoon season. Temporally, recharge is strongly seasonal, occurring predominantly during the monsoon and closely tracking rainfall variability, with negligible dry-season recharge except in irrigated areas. Simulations also indicate declining recharge tendencies in the Barind region, whereas coastal recharge remains comparatively stable. Recharge patterns are strongly controlled by land use and soil properties. Forested and vegetated areas and loam to sandy-loam soils promote recharge, whereas built-up land and clay-rich deposits suppress infiltration. These findings highlight the dominant role of land-surface and subsurface properties in shaping recharge gradients. Future work will extend the analysis temporally and couple WetSpass-M simulated recharge with MODFLOW to support improved groundwater management and site-specific Managed Aquifer Recharge planning in drought- and salinity-prone regions.

How to cite: Uddin, M. Z., Bense, V., Mojid, M. A., and Mustafa, S.: Spatiotemporal dynamics of groundwater recharge in Bangladesh, EGU General Assembly 2026, Vienna, Austria, 3–8 May 2026, EGU26-1549, https://doi.org/10.5194/egusphere-egu26-1549, 2026.

Intercatchment groundwater flow (IGF) quantifies groundwater fluxes across catchment boundaries, enabling the classification of catchments as either groundwater importers (gaining catchments) or exporters (losing catchments). It is a key component of the unclosed water balance equation that cannot be measured directly. The growing availability of large-sample datasets, gridded meteorological data, and satellite products provides an opportunity to develop a data integration framework to gain insights into this elusive hydrological variable.

This study focuses on the quantification of IGF for the European catchments included in the EStreams dataset. Precipitation and streamflow time series are provided in EStreams, while actual evapotranspiration data were gathered from the Global Land Evaporation Amsterdam Model (GLEAM) version 4. To identify the primary drivers of IGF, a random forest model was trained using a selection of catchment attributes as input variables, with IGF as the target variable. Permutation Variable Importance (PVI) was used to assess feature relevance, and the Maximal Information Coefficient (MIC) was calculated as an alternative method to quantify the relationship between catchment attributes and IGF.

Results of this work highlight the potential of a data integration framework to better characterize the unclosed water balance in European catchments and reveal key factors influencing IGF estimates.

ACKNOWLEDGMENTS: This study has been funded by a Humboldt Research Fellowship for Postdoctoral Researcher from the Alexander von Humboldt Foundation.

How to cite: Yeste, P. and Bronstert, A.: Intercatchment groundwater flow and unclosed water balance: a large-sample evaluation across European catchments, EGU General Assembly 2026, Vienna, Austria, 3–8 May 2026, EGU26-1557, https://doi.org/10.5194/egusphere-egu26-1557, 2026.

EGU26-2301 | ECS | Posters on site | HS8.2.13

Assessing Actual Groundwater Recharge under Climate Variability and Irrigation Pressure in the Upper Guadiana Basin (Central Spain) 

Nafiseh Salehi Siavashani, Estanislao Pujades Garnes, and Anna Jurado

Climate variability and intensifying water use are increasingly altering groundwater systems in semi-arid regions, challenging sustainable water resources management at large spatial scales. The Upper Guadiana Basin (UGB), covering an area of approximately 16,000 km² in central Spain, is a representative groundwater-dependent agricultural system, where long-term irrigation-driven abstractions have caused persistent aquifer depletion. In this context, the development of coupled large-scale hydrological–hydrogeological modeling frameworks, where the main objective of the hydrological model is to calculate groundwater recharge, is essential to realistically assess groundwater dynamics under climate and water-use change.

In this study, we assessed basin-scale groundwater recharge using the mesoscale Hydrologic Model (mHM) for the period 2006–2018. The model was forced with gridded precipitation and temperature data, and calibrated by fitting river-flow at several gauging stations. Model results indicated substantially lower groundwater recharge compared to values expected from hydrogeological knowledge of the basin. This discrepancy is interpreted as evidence that, in the absence of explicit groundwater abstraction schemes, mHM implicitly compensates irrigation-induced groundwater losses by reducing simulated recharge, since this is the only way to minimize baseflow and thus fit the observed measurements during dry periods. Consequently, simulated recharge would represent an “actual groundwater recharge” that integrates both climatic controls and groundwater pumping impacts, rather than natural recharge alone.

To demonstrate that the discrepancy between natural recharge and that calculated by the model may be due to the high rates of groundwater extraction for irrigation, we analytically estimated this discrepancy by combining the irrigated areas from CORINE Land Cover (Coordination of Information on the Environment from the European Environment Agency’s Copernicus Land Monitoring Service) and SIGPAC (Sistema de Información Geográfica de Parcelas Agrícolas) datasets, with crop-specific irrigation requirements derived from FAO guidelines.

The results show that the difference between natural recharge and that calculated by the model is equal to the estimate obtained when considering crop water demand. This finding is of paramount importance for the development of large-scale regional models in arid areas where aquifers are severely overexploited and pumping rates are typically unknown, either due to the lack of meters or the presence of hundreds of unlicensed wells. In these cases, the recharge calculated with the hydrological model allows pumping effects to be incorporated indirectly, representing a major methodological advance and substantially improving model representativeness. Moreover, the results enable the characterization of the spatial distribution of pumping, facilitating the identification of the most critically overexploited areas and supporting the implementation of targeted management measures to improve water resources governance.

How to cite: Salehi Siavashani, N., Pujades Garnes, E., and Jurado, A.: Assessing Actual Groundwater Recharge under Climate Variability and Irrigation Pressure in the Upper Guadiana Basin (Central Spain), EGU General Assembly 2026, Vienna, Austria, 3–8 May 2026, EGU26-2301, https://doi.org/10.5194/egusphere-egu26-2301, 2026.

EGU26-3973 | Posters on site | HS8.2.13

Traditional Irrigation in the Po Plain: Inefficient Practice or Key Contributor to Groundwater Recharge?  

Olfa Gharsallah, Sara Cazzaniga, Enrico Antonio Chiaradia, Michele Eugenio D'Amico, Michele Rienzner, and Claudio Gandolfi

Traditional surface irrigation remains the most widespread practice in the Po Plain, supporting one of Italy’s most productive agricultural regions. The system relies on large river withdrawals that are distributed through an extensive network of unlined, often centuries-old canals supplying agricultural fields. Although frequently criticized for inefficiency, surface irrigation generates hydrological effects that extend well beyond direct crop water supply. Indeed, percolation from irrigated soils and seepage from open channels contribute substantially to groundwater recharge, thereby moderating seasonal fluctuations in surface water availability and alleviating drought stress.

Despite its hydrological relevance, irrigation-induced groundwater recharge in the Po Plain remains poorly quantified. The region exhibits a highly complex hydrological system, dominated by strong surface water–groundwater interactions, while detailed data on irrigation practices, water deliveries, land use information and dynamic shallow water table fluctuations are limited. Robust estimates of the contribution of traditional irrigation to aquifer replenishment are therefore essential for sustainable water resources management, particularly in case of relevant climatic variability.

Within the MidAS-Po project, a comprehensive methodological framework was developed to quantify groundwater recharge across the entire Po Plain, accounting for contributions from both percolation from irrigated fields and seepage from unlined irrigation channels. The approach integrates two components. First, the distributed agro-hydrological model IdrAgra was applied to simulate the daily soil water balance and estimate percolation from agricultural soils. Second, recharge associated with canal seepage was assessed using a simplified methodology based on the estimation of the channel distribution efficiency.

The results indicate that recharge of aquifers induced by traditional surface irrigation accounts for between 50% and 65% of total recharge. The lower percentage is obtained when considering the role of the saturated soil zone in limiting percolation flows, and allowing root uptake from the capillary fringe in those areas of the Po Plain, where the aquifer is shallow; the higher percentage reflects the results of a simulation in which free drainage conditions were assumed at the base of the rooted soil volume. Given the considerable limitations in the knowledge of the spatial distribution of the phreatic aquifer depth, it is currently impossible to say which of the two estimates is more accurate.

These findings challenge conventional views on traditional irrigation efficiency, highlighting that water “losses” from irrigated fields and open channels are not merely waste but represent an important source of aquifer recharge. Further refinements are needed to improve these estimates. In particular, shallow water table depth data are currently not sufficiently accurate in terms of spatial resolution and are inadequate for capturing the seasonal and inter-annual fluctuations. Enhanced data on shallow water table depth would strengthen the model performance, improving estimates of crop irrigation requirements and of groundwater recharge.

How to cite: Gharsallah, O., Cazzaniga, S., Chiaradia, E. A., D'Amico, M. E., Rienzner, M., and Gandolfi, C.: Traditional Irrigation in the Po Plain: Inefficient Practice or Key Contributor to Groundwater Recharge? , EGU General Assembly 2026, Vienna, Austria, 3–8 May 2026, EGU26-3973, https://doi.org/10.5194/egusphere-egu26-3973, 2026.

Groundwater recharge in semi-arid hard-rock areas mainly relies on surface water bodies like tanks and small reservoirs. These are key sources of recharge in regions that typically have low recharge rates. In many basins, only a few water bodies provide a significant portion of the total groundwater recharge. However, their actual effectiveness is often measured using surface indicators, such as storage capacity or area, without thoroughly examining how recharge moves through the subsurface. This study aims to fill this gap by assessing recharge efficiency through the identification of the recharge zone of influence (RZOI). The study took place in a 60 km² macro-watershed in a semi-arid area, which includes 14 significant water bodies that together account for nearly 60% of the total groundwater recharge. Understanding how recharge from these water bodies spreads within the aquifer is crucial because of their important role. A three-dimensional groundwater flow model was created using FEFLOW to simulate how the aquifer responds to recharge from the water bodies. The RZOI was defined as the subsurface volume calculated from the difference between groundwater head contours simulated with and without the influence of the water body recharge. Recharge efficiency was calculated as the ratio of the water volume in a water body to the corresponding RZOI volume. The findings reveal considerable differences in both RZOI extent and recharge efficiency throughout the study area. The largest water body, covering about 0.9 km², had a relatively large zone of influence extending over more than 2.5 km². Yet, its recharge efficiency was low, around 17–18%, mainly due to poor infiltration conditions. In contrast, a smaller water body showed the highest recharge efficiency, approximately 38–39%, due to a high infiltration capacity in the vadose zone, around 5–6 mm h⁻¹. Overall, the results suggest that recharge efficiency is mainly influenced by the infiltration capacity and hydraulic conductivity of the vadose zone, with the effect of surface area being relatively minor. The study emphasizes that larger water bodies do not always result in higher recharge efficiency and stresses the importance of assessing aquifers when planning and prioritizing recharge structures in semi-arid hard-rock regions.

How to cite: Narayanamurthi, V.: Recharge zone of influence–based evaluation of groundwater recharge efficiency in a semi-arid hard-rock region, EGU General Assembly 2026, Vienna, Austria, 3–8 May 2026, EGU26-4410, https://doi.org/10.5194/egusphere-egu26-4410, 2026.

EGU26-5263 | ECS | Orals | HS8.2.13

Groundwater recharge estimation using surface modeling and validation with stable water isotopes 

Chaymae El Habbazi, André Chanzy, Anne-Laure Cognard-Plancq, Marina Gillon, Vincent Marc, and Milanka Babic

Accurate estimation of groundwater recharge is of paramount importance to guarantee sustainable groundwater management. However, quantifying recharge in aquifers is a challenge, particularly in irrigated agricultural environments. Indeed, recharge processes are deeply impacted by surface inputs, vegetation dynamics, and vadose zone processes whose effects on both the magnitude and timing of recharge are further influenced by heterogeneous land use and irrigation practices. To handle these complexities, it is highly recommended to adopt sound approaches to minimize uncertainties in recharge estimation.

This study tackles this challenge through the estimation of groundwater recharge in the Crau aquifer in southeastern France. The area is intensively irrigated, and the aquifer is recharged by both precipitation and irrigation water from the Durance River. Groundwater recharge was estimated using a spatially distributed soil water balance model combining three models according to land use. An empirical model was used for bare or sparsely vegetated soils. This model is based on observations measured by a flux tower located on a steppic land representative of the area. For irrigated woody crops and gardening, the recharge was computed using a Kc model that calculates evapotranspiration from the reference ET0 using a Kc crop coefficient. For field crop and irrigated grassland, the STICS crop model was used to depict seasonal variations in the water balance and the impact of agricultural practices on recharge. Implementing such a comprehensive groundwater model requires documenting the parameters of every spatial entity (>100000) by using soil, meteorological land use maps and an assessment of agronomic practices.

The surface model outputs were then validated using a stable isotope mass balance based on measurements of oxygen (δ¹⁸O) and hydrogen (δ²H) isotopes in groundwater, precipitation, and irrigation water. The strong contrast between the isotopic signatures of precipitation and irrigation water is interesting to delineate the different water flows between the surface and the groundwater. By combining surface modeling with isotope-based validation, this approach provides an independent means of validating the modeled recharge components in a context where recharge estimation is highly uncertain and contributes to better groundwater management under increasing climatic and anthropogenic pressures.

How to cite: El Habbazi, C., Chanzy, A., Cognard-Plancq, A.-L., Gillon, M., Marc, V., and Babic, M.: Groundwater recharge estimation using surface modeling and validation with stable water isotopes, EGU General Assembly 2026, Vienna, Austria, 3–8 May 2026, EGU26-5263, https://doi.org/10.5194/egusphere-egu26-5263, 2026.

EGU26-7848 | ECS | Posters on site | HS8.2.13

From rain to recharge: insights into field scale soil moisture and water flux dynamics at the Potsdam Soil Moisture Observatory (PoSMO) 

Lena Scheiffele, Matthias Munz, Till Francke, Maik Heistermann, and Sascha E. Oswald

Brandenburg is one of the driest regions in Germany and is highly dependent on groundwater resources for both drinking water supply and the growing demand for irrigated agriculture. Groundwater levels across the state are declining, and climate change is expected to further exacerbate this trend. The groundwater recharge rate (GWR) is a key parameter for the sustainable management of groundwater resources. However, its quantification it remains challenging, as it cannot be measured directly at spatial scales relevant for hydrological units in a landscape context.

In this study, we use daily data from several cosmic-ray neutron sensors (CRNS), which provide non-invasive measurements of soil moisture in the near-surface root zone at the hectare scale, to calibrate the soil hydrological model HYDRUS-1D. This calibration yields scale-effective soil hydraulic parameters and allows us to derive the downward water flux below the root zone as an approximation of GWR at the field scale.

The analysis is based on a unique six-year data set from the Potsdam Soil Moisture Observatory (PoSMO), a densely instrumented cluster located at and around an agricultural research site. The approximately 10-hectare area comprises multiple agricultural plots and extends along a gentle slope towards a lake. It is situated above a Pleistocene unconfined aquifer, with a groundwater table depth of 1 to 10 meters. At the heart of the instrumentation are eight continuously operated CRNS in combination with more than 25 point-scale soil moisture profiles measuring at depths of up to 1 m. A variety of additional measurements, including soil texture, hydraulic properties, continuous soil moisture measurements at depth, and groundwater level monitoring, provide a solid basis for validating the model and recording the relevant hydrological processes at the site.

In various simulation experiments, we evaluate the added value of using different soil moisture products for model calibration. To analyze long-term trends and fluctuations in GWR, we drive the calibrated model with historical weather data from over 50 years. We investigate changes in GWR under different climatic conditions and discuss the associated uncertainties, particularly in relation to the site's scarce water balance.

How to cite: Scheiffele, L., Munz, M., Francke, T., Heistermann, M., and Oswald, S. E.: From rain to recharge: insights into field scale soil moisture and water flux dynamics at the Potsdam Soil Moisture Observatory (PoSMO), EGU General Assembly 2026, Vienna, Austria, 3–8 May 2026, EGU26-7848, https://doi.org/10.5194/egusphere-egu26-7848, 2026.

EGU26-9330 | Posters on site | HS8.2.13

Groundwater recharge assessment in a data-scarce semi-arid volcanic island using evapotranspiration-constrained process-based modelling  

Rodrigo Sariago, Carlos Baquedano, Alejandro Sánchez-Gómez, Jon Jimenez, Jorge Martínez-León, Almudena de la Losa Roman, Juan Carlos Santamarta, and Alejandro García-Gil
Groundwater recharge estimation in semi-arid volcanic islands is critical to water-management; however, it is often hindered by sparse monitoring networks and the lack of observed records suitable for conventional calibration. Within the GENESIS project, this study presents a transferable workflow to quantify groundwater recharge in data-scarce island settings by combining field-based infiltration information with satellite-derived actual evapotranspiration (AET) constraints to refine the catchment water balance. The workflow is demonstrated on El Hierro (Canary Islands, Spain), a small oceanic volcanic island characterized by steep relief, sharp climatic gradients, heterogeneous land cover, and limited hydrometric infrastructure.
 
Model inputs combine multi-source datasets, including daily observed precipitation and temperature complemented by gridded meteorological variables, and locally soil hydraulic properties derived from infiltration tests to represent effective near-surface hydraulic conductivity at the model support scale. A Sobol global sensitivity analysis is applied to identify the most influential parameters controlling AET and soil–aquifer fluxes, supporting a parsimonious calibration design. Calibration proceeded in two stages, combining soft constraints from previously reported hydrological ratios with a hard calibration against island-mean AET aggregated to island resolution to minimize scale-mismatch artifacts. Groundwater recharge is computed as percolation reaching the shallow aquifer within the Soil and Water Assessment Tool (SWAT), and uncertainty is characterized through post-calibration parameter sampling, reported as ensemble ranges given the absence of independent recharge observations. The workflow is designed to be transferable to other data-scarce basins where stream-based calibration is not feasible, while explicitly documenting key assumptions (e.g., omission of horizontal precipitation due to lack of observations).


How to cite: Sariago, R., Baquedano, C., Sánchez-Gómez, A., Jimenez, J., Martínez-León, J., de la Losa Roman, A., Santamarta, J. C., and García-Gil, A.: Groundwater recharge assessment in a data-scarce semi-arid volcanic island using evapotranspiration-constrained process-based modelling , EGU General Assembly 2026, Vienna, Austria, 3–8 May 2026, EGU26-9330, https://doi.org/10.5194/egusphere-egu26-9330, 2026.

EGU26-9767 | ECS | Orals | HS8.2.13

QGIS‑SWAP‑Paddy: a modelling framework to simulate irrigation and aquifer recharge in lowland rice area. First application to the Lomellina rice district (northern Italy) 

Giulio Luca Cristian Gilardi, Michele Rienzner, Darya Tkachenko, Marco Romani, and Arianna Facchi

Rice‑growing regions underlain by shallow aquifers require irrigation strategies that simultaneously satisfy crop water demand, sustain groundwater recharge, and ensure an appropriate response to the increasingly frequent occurrence of water scarcity in many geographical areas. Traditional approaches, typically based on field‑scale experiments or conceptual water‑balance models, struggle to represent the complex interactions among irrigation practices, soil-water-crop processes, and groundwater dynamics at broader spatial scales.

To address this limitation, we developed QGIS‑SWAP‑Paddy, a novel GIS‑integrated modelling framework for simulating lowland agricultural systems across multiple spatial scales. The framework couples a semi-distributed SWAP (https://www.swap.wur.nl/) based agro‑hydrological model with a channel‑network module embedded within the QGIS environment. Simulations are driven by thematic maps and information stored in a GeoPackage database, including soil data, land use, irrigation management, groundwater depth, and agro‑meteorological conditions. This architecture enables the systematic integration of diverse inputs — maps, time series, field measurements, parameter estimates for soil hydraulic properties, crop development, and alternative irrigation management — into a coherent modelling workflow.

The framework has been applied to the Lomellina region in northern Italy, located in the largest rice‑growing district in Europe. After calibration and validation, initial applications of QGIS-SWAP-Paddy highlight its capacity to support scenario analyses for contrasting irrigation strategies, including wet seeding with continuous flooding, dry seeding with delayed flooding, and Alternate Wetting and Drying (AWD). The system is designed to be integrated with external models — most notably MODFLOW (https://www.usgs.gov/software/modflow-6-usgs-modular-hydrologic-model) — to simulate groundwater flow and quantify the impacts of irrigation management on aquifer dynamics. This coupling, currently being developed within the PROMEDRICE project (https://promedrice.org/; PRIMA-Section2-2022), will enable comprehensive assessments of water‑reuse mechanisms and groundwater sustainability in rice‑based irrigation systems.

QGIS‑SWAP‑Paddy produces both aggregated outputs (e.g., time series of irrigation requirements and deep percolation at domain or sub‑domain scale) and spatially explicit outputs such as maps of first‑aquifer recharge, representing a powerful tool for scientific research and operational decision‑support in lowland irrigated agricultural areas.

How to cite: Gilardi, G. L. C., Rienzner, M., Tkachenko, D., Romani, M., and Facchi, A.: QGIS‑SWAP‑Paddy: a modelling framework to simulate irrigation and aquifer recharge in lowland rice area. First application to the Lomellina rice district (northern Italy), EGU General Assembly 2026, Vienna, Austria, 3–8 May 2026, EGU26-9767, https://doi.org/10.5194/egusphere-egu26-9767, 2026.

EGU26-11015 | ECS | Posters on site | HS8.2.13

Quantifying Irrigation Water Use and Groundwater Dynamics using Earth Observation Data in Combination with Hydrological Modeling 

Jana Brettin, Kai Schröter, and Gerhard Riedel
Irrigation has a significant influence on hydrological and groundwater dynamics through altered evapotranspiration, water abstraction, and return flows.    However, irrigation is often insufficiently represented in hydrological and groundwater models due to limited information on the spatial and temporal variability of irrigation water use. This gap limits the reliable assessment of sustainable groundwater management, particularly in intensively farmed regions.
 

This research proposes a framework that combines satellite-based actual evapotranspiration (ETa) estimates with coupled process-based hydrological and groundwater modeling to quantify irrigation water use and its influence on the landscape water balance in Lower Saxony, Germany. Spatially distributed ETa is derived from the Landsat Provisional ETa Science Product and compared with simulated evapotranspiration from a semi-distributed hydrological model based on natural conditions without irrigation. Net irrigation is estimated as the difference between satellite-based ETa and simulated non-irrigated ETa. The groundwater model is subsequently used to simulate spatial and temporal changes in groundwater levels resulting from irrigation-related withdrawals, and groundwater recharge provided by the hydrological model.

By linking satellite-based evapotranspiration with hydrological and groundwater modeling, the proposed framework provides a method to quantify spatially and temporally varying irrigation water use and to assess its effects on groundwater levels at the landscape scale. While demonstrated for Lower Saxony, Germany, the framework is transferable to other regions where satellite-based evapotranspiration data and hydrological/hydrogeological information are available. It can be applied to analyse irrigation impacts on groundwater systems and to support assessments of groundwater sustainability under increasing agricultural water use and climate variability.

How to cite: Brettin, J., Schröter, K., and Riedel, G.: Quantifying Irrigation Water Use and Groundwater Dynamics using Earth Observation Data in Combination with Hydrological Modeling, EGU General Assembly 2026, Vienna, Austria, 3–8 May 2026, EGU26-11015, https://doi.org/10.5194/egusphere-egu26-11015, 2026.

EGU26-11189 | Orals | HS8.2.13

Seasonality in groundwater recharge - Observational evaluation of Earth System model realism 

Margaret Shanafield, Thorsten Wagener, Sabine Undorf, and Andy Baker

Despite many efforts to estimate both the spatial and temporal dynamics of groundwater recharge, and to predict how these will be altered by climate change, this crucial part of the water balance remains highly uncertain. Meanwhile, many shallow aquifers are experiencing alarming water level declines due to a combination of high anthropogenic withdrawals and altered precipitation patterns. This work combines recent and long-term datasets from locations throughout the continent of Australia to re-examine how shallow recharge dynamics vary across a diversity of climate types. Available data from a drip logger network demonstrate the interannual variability in rainfall recharge thresholds, with seasonality in the number of recharge events and the rainfall recharge threshold. Historical records of rainfall are then examined to understand the historical return interval of these rainfall volumes, both annually and seasonally. Finally, we examine our results against corresponding data in the historical model runs from the Coupled Model Intercomparison Project (CMIP), to evaluate the realism of the models. The results of this combined methodology provide a more nuanced approach to evaluating the resilience of groundwater supplies in a changing climate.    

How to cite: Shanafield, M., Wagener, T., Undorf, S., and Baker, A.: Seasonality in groundwater recharge - Observational evaluation of Earth System model realism, EGU General Assembly 2026, Vienna, Austria, 3–8 May 2026, EGU26-11189, https://doi.org/10.5194/egusphere-egu26-11189, 2026.

EGU26-13724 | Posters on site | HS8.2.13

Improving punctual groundwater recharge estimate modeling by including stable water isotopes 

Juan Carlos Richard-Cerda, Isabelle Schmidt, Paul Koeniger, Brindha Karthikeyan, Michael Schneider, and Stephan Schulz

Groundwater recharge (GWR) is a key parameter for sustainable groundwater management and for predicting future groundwater availability. Its importance is increasing as global environmental and anthropogenic pressures intensify stress on groundwater resources. This study aims to improve point-scale estimates of GWR by constraining unsaturated-zone models at three sites that differ in vegetation and soil cover. Model optimization was performed using volumetric water content (θ) alone and θ in combination with soil water stable isotopes (δ18O and δ2H).

The newly implemented isotope module in HYDRUS-1D, which accounts for isotope fractionation, was successfully applied under semi-arid conditions. Strong monsoon dynamics caused large temporal variations in observed θ, which were challenging for the model to reproduce accurately, whereas vertical profiles of isotope concentrations were simulated more precisely. Estimated recharge rates over a 236-day period ranged from <1 cm to 31 cm for models optimized with θ and isotopes, and from <1 cm to 15 cm for models optimized with θ alone. Despite similar soil classes and short spatial distances, GWR exhibited pronounced heterogeneity across the study area in Tamil Nadu, South India. These findings highlight the use of multiple data types for model calibration, with isotope data providing additional constraints on the simulated recharge rates.

How to cite: Richard-Cerda, J. C., Schmidt, I., Koeniger, P., Karthikeyan, B., Schneider, M., and Schulz, S.: Improving punctual groundwater recharge estimate modeling by including stable water isotopes, EGU General Assembly 2026, Vienna, Austria, 3–8 May 2026, EGU26-13724, https://doi.org/10.5194/egusphere-egu26-13724, 2026.

EGU26-14114 | Orals | HS8.2.13 | Highlight

From minutes to millennia, from plots to planet: A spatiotemporal view on groundwater recharge 

Stephan Schulz, Selina Hillmann, Edinsson Muñoz-Vega, José Zolezzi-López, Juan Carlos Richard-Cerda, Isabelle Schmidt, and Hyekyeng Jung

Groundwater recharge is a key yet highly uncertain component of the hydrological cycle and is characterized by pronounced variability across temporal and spatial scales. Recharge processes are commonly represented using long-term averages and spatially aggregated concepts, by which the episodic, heterogeneous, and scale-dependent nature of recharge is often obscured. In this presentation, a multiscale perspective on groundwater recharge is presented, covering field observations, regional analyses, and global modeling approaches to illustrate how recharge occurs on timescales ranging from minutes to millennia and from local plots to the planetary scale.

The temporal dimension of recharge is illustrated using examples from arid environments, with a focus on Saudi Arabia. Under current climatic conditions, diffuse groundwater recharge in these regions is typically very low. However, rapid and focused recharge can be generated within minutes during intense rainfall events in areas with exposed karst features, where surface runoff is efficiently channeled into the subsurface. But there are also important processes related to groundwater recharge on much longer timescales. In many arid regions, fossil groundwater is a vital resource that was replenished under past climatic conditions. These paleo-groundwater recharge events represent hydraulic impulses that continue to influence today's groundwater levels and flow patterns, resulting in non-stationary groundwater systems.

The spatial variability of groundwater recharge is examined at local and global scales. Based on exemplary case studies from South Asia, recharge is found to be highly heterogeneous and is controlled by climatic gradients, geological conditions, and intensive human water use, including irrigation return flows. At the global level, groundwater recharge is estimated using neurol networks with eXplainable AI, identifying the dominant factors for groundwater recharge for different climate zones and showing that the control and sensitivity of predictors for groundwater recharge are highly region-specific.

Building on these temporal and spatial perspectives, the implications of groundwater recharge for water quality are highlighted. Using the Hessian Ried (Germany) as an example, a control of recharge rates and residence times in the unsaturated zone on reactive solute transport to groundwater is demonstrated, thereby directly linking recharge dynamics to groundwater quality.

Overall, groundwater recharge is shown to be inherently multiscale and dependent on specific environmental conditions, with important implications for the selection of recharge estimation methods, the temporal and spatial aggregation of groundwater models, and sustainable groundwater management under changing climatic and land-use conditions.

How to cite: Schulz, S., Hillmann, S., Muñoz-Vega, E., Zolezzi-López, J., Richard-Cerda, J. C., Schmidt, I., and Jung, H.: From minutes to millennia, from plots to planet: A spatiotemporal view on groundwater recharge, EGU General Assembly 2026, Vienna, Austria, 3–8 May 2026, EGU26-14114, https://doi.org/10.5194/egusphere-egu26-14114, 2026.

EGU26-14358 | Posters on site | HS8.2.13

A Groundwater Recharge Model for the Zagreb Aquifer System (Croatia): Current Status and Proposed Enhancements 

Ozren Larva, Željka Brkić, and Rahela Šanjek

Groundwater of the Zagreb alluvial aquifer in northwestern Croatia represents an extremely important natural resource that supplies drinking and industrial water to the City of Zagreb and its surrounding area. The aquifer system consists of Quaternary sediments, within which an alluvial aquifer of intergranular porosity has developed. The thickness of the aquifer varies from approximately 10 m in the western part of the area to up to 100 m within the eastern structural depression. Hydraulic conductivity is very high and, based on pumping test results, reaches values of up to 3600 m/day in the vicinity of the Sava River. The aquifer is unconfined and is recharged through both infiltration of precipitation and leakage from the Sava River riverbed. Previous studies have estimated groundwater recharge using groundwater balance calculations, which were subsequently verified by a numerical groundwater flow model. For the purposes of numerical modelling, the alluvial aquifer area was divided into three polygons with different groundwater recharge values: (i) areas with a thin or absent semipermeable covering layer at the top of the aquifer, (ii) marginal aquifer areas to the north and south, composed predominantly of fine-grained deposits, and (iii) urban areas. Although the calibration results of the model are decent and the obtained recharge values appear realistic, there is still a need for more accurate and detailed determination of groundwater recharge in both spatial and temporal domains, with respect to both leakage from the Sava River and precipitation percolation. To address these limitations, extensive investigations are planned within the framework of the bilateral Croatian–Slovenian project GWQualityPath2070 (HRZZ: IPS-2024-02-5367). The research program comprises the analysis of the isotopic composition of groundwater, river water, and precipitation, the investigation of surface water and groundwater dynamics, and the integration of the SWAT semi-distributed hydrological model with a numerical groundwater flow model. Expected results of the research activities, in general—and in particular those related to the groundwater recharge model—will provide a solid basis for further research, primarily focused on analyses of climate change impacts on the quantitative status of groundwater, as well as the effects of different agricultural practices and land use on groundwater quality.

How to cite: Larva, O., Brkić, Ž., and Šanjek, R.: A Groundwater Recharge Model for the Zagreb Aquifer System (Croatia): Current Status and Proposed Enhancements, EGU General Assembly 2026, Vienna, Austria, 3–8 May 2026, EGU26-14358, https://doi.org/10.5194/egusphere-egu26-14358, 2026.

EGU26-17207 | ECS | Posters on site | HS8.2.13

Assessing the Ag-MAR potential in a rice-dominated alluvial plain in Northern Italy by combining MODFLOW-6 and QGIS-SWAP-Paddy 

Petra Baják, Giulio Gilardi, Daniele Pedretti, Arianna Facchi, Marco Masetti, Lorenzo Sangalli, Alessandro Sorichetta, Darya Tkachenko, and Michael Valtorta

Agricultural Managed Aquifer Recharge (Ag-MAR) has emerged as a sustainable water management technique that utilizes farmland, particularly during fallow periods, to intentionally flood fields and replenish underground aquifers, thereby storing water for future use. Quantifying the benefits of Ag-MAR and evaluating its cost-effectiveness remains challenging due to strong nonlinear interactions between surface–subsurface processes, which generally require numerical modeling approaches that are still poorly established for Ag-MAR systems. 

This study presents the initial development of a numerical modeling framework to evaluate the effectiveness of different Ag-MAR practices in the Lomellina area (1,250 km2) in Northern Italy, Europe’s largest rice-producing district. In this region, excess surface water is typically available during the winter months (November–February). Although winter flooding of rice fields has been promoted in recent years by the EU Rural Development Programme (CAP) for agronomic and environmental purposes, its hydrological benefits remain largely unquantified. Ag-MAR in the region may occur through deliberate field flooding or infiltration from irrigation canals, yet the relative importance of these pathways and their long-term impacts on groundwater resources are still unknown. 

The proposed framework couples (a) recharge rates calculated using QGIS-SWAP-Paddy, a semi-distributed version of the SWAP model (https://www.swap.alterra.nl/), implementing also the irrigation/drainage network, and (b) groundwater flow rates calculated using the MODFLOW-6 model (https://www.usgs.gov/software/modflow-6-usgs-modular-hydrologic-model). QGIS-SWAP-Paddy provides transient net percolation rates from agricultural fields and the irrigation canal network, accounting for land-use, soil variability, and irrigation practices throughout the year. MODFLOW-6 uses QGIS-SWAP-Paddy’s percolation rates to simulate seasonal and interannual groundwater dynamics across the domain, including interactions with major rivers (Po, Ticino, and Sesia) and minor surface water bodies. 

Due to the characteristics of the hydrogeological system, namely, the flooding of vast rice-growing areas and the presence of very shallow groundwater levels, recharge in QGIS-SWAP-Paddy depends on groundwater levels, while the groundwater level simulated by MODFLOW-6 depends on percolation rates estimated in QGIS-SWAP-Paddy. 

Currently, the two models have been calibrated independently. QGIS-SWAP-Paddy has been calibrated using irrigation discharge data and a reference groundwater level map, interpolated using geostatistical methods, as the lower boundary condition. Conversely, the groundwater flow model, using the recharge rates produced by the QGIS-SWAP-Paddy model as input, was calibrated against observed groundwater levels in various wells from 2018–2020, successfully reproducing observed seasonal fluctuations. 

The next step is to develop a code that allows the two models to be explicitly coupled monthly to improve the estimation of both percolation rates and the groundwater balance. If necessary, the calibration and validation of the integrated model will therefore be repeated, considering the irrigation discharges delivered to the district and the groundwater levels observed during the period 2018–2020. Once this step has been completed, the model will be ready to simulate Ag-MAR scenarios. 

This study was carried out in the context of the PROMEDRICE project (https://promedrice.org/; PRIMA-Section2–2022) funded, for the Italian partners, by MUR (Italian Ministry of University and Research). 

How to cite: Baják, P., Gilardi, G., Pedretti, D., Facchi, A., Masetti, M., Sangalli, L., Sorichetta, A., Tkachenko, D., and Valtorta, M.: Assessing the Ag-MAR potential in a rice-dominated alluvial plain in Northern Italy by combining MODFLOW-6 and QGIS-SWAP-Paddy, EGU General Assembly 2026, Vienna, Austria, 3–8 May 2026, EGU26-17207, https://doi.org/10.5194/egusphere-egu26-17207, 2026.

EGU26-17813 | ECS | Orals | HS8.2.13

Quantifying irrigation-driven groundwater recharge through coupled agro-hydrological and groundwater modelling: an Ag-MAR case study from the MAURICE project 

Rachele Eliana Riva, Paolo Colombo, Enrico Weber, Veronica Piuri, and Claudio Gandolfi

Groundwater recharge estimation remains a key challenge for the design of sustainable irrigation systems operating within complex territorial areas and ecosystem constraints, particularly under climate change, which alters water availability, precipitation regimes, and agro-hydrological dynamics. This study presents a coupled agro-hydrological and groundwater modelling framework specifically developed to quantify irrigation-driven recharge and to assess managed aquifer recharge adaptation measures under climate change scenarios. The framework integrates the agro-hydrological model IdrAgra with the numerical groundwater flow model MODFLOW and is applied to a highly urbanized region near Milan (representing the Italian pilot area of the MAURICE Interreg project - CE0100184). In this area, irrigation contributes to groundwater recharge at magnitudes comparable to or exceeding those of precipitation, as the most spread irrigation methods are surface and flood. Within this pilot action, winter irrigation was tested during two seasons (2023–2024 and 2024–2025) as an agricultural managed aquifer recharge (Ag-MAR) strategy, with the objective of evaluating its feasibility and effectiveness in enhancing groundwater availability during drought periods.

Detailed data on irrigation management, irrigation timing and daily channel discharges were collected both in winter and during the agricultural season and were then used to simulate the daily soil water balance in the vadose zone with the IdrAgra model. The resulting spatially and temporally distributed percolation fluxes were used as recharge inputs for the MODFLOW model, allowing the quantification of groundwater storage variations induced by the adaptation strategy. Both models were implemented on a common 100 m resolution grid covering approximately 326 km².

The project domain includes areas characterized by three distinct water management regimes: (i) non-irrigated areas, where groundwater recharge is driven exclusively by precipitation; (ii) areas managed by the Est Ticino Villoresi Irrigation Consortium, where structured irrigation networks and monitoring data allow irrigation-driven recharge to be quantified at the irrigation sub-district scale; and (iii) areas managed by individual users, where operational data are limited. IdrAgra was applied consistently across the entire domain, ensuring a coherent representation of crop growth, irrigation practices, soil water balance, and resulting groundwater recharge despite heterogeneous data availability.

The modelling framework was used to (i) quantify the effect of winter irrigation on groundwater recharge during the two experimental seasons, and (ii) evaluate it based on three different regional climate model projections (over the period 2026–2050), combined with alternative spatial distributions of winter irrigation.

Experimental results highlight that the percolation fluxes from the winter irrigated fields are relevant and model simulations show that extending this Ag-MAR strategy to sufficiently large areas a significant contribution to groundwater recharge is obtained. This study demonstrates the effectiveness of coupling agro-hydrological and groundwater models to represent irrigation-induced recharge processes, providing robust decision-support tools for the design and evaluation of Ag-MAR strategies under current and future climate conditions.

How to cite: Riva, R. E., Colombo, P., Weber, E., Piuri, V., and Gandolfi, C.: Quantifying irrigation-driven groundwater recharge through coupled agro-hydrological and groundwater modelling: an Ag-MAR case study from the MAURICE project, EGU General Assembly 2026, Vienna, Austria, 3–8 May 2026, EGU26-17813, https://doi.org/10.5194/egusphere-egu26-17813, 2026.

EGU26-19730 | ECS | Posters on site | HS8.2.13

Earth Observation-based Irrigation Dynamics to enhance Integrated Surface–Subsurface Hydrological Models 

Sofia Ortenzi, Beatrice Gatto, Christian Massari, Marta Chiesi, Marco Moriondo, Luca Fibbi, and Matteo Camporese

Sustainable groundwater management in irrigated agricultural regions demands accurate quantification of human-induced water fluxes. In the high Venetian plain (Northeast Italy), irrigation represents both a crucial agricultural input and a significant source of aquifer recharge. However, growing efforts to enhance irrigation efficiency for river ecosystem preservation may inadvertently reduce groundwater replenishment. This study addresses the pressing need to enhance integrated surface–subsurface hydrological models (ISSHMs) by improving the representation of irrigation practices and crop water use.

Our approach integrates detailed spatio-temporally variable irrigation water (IW) flux estimates into the CATHY (CATchment HYdrology) model, constrained by Earth Observation (EO) data. Specifically, the IW fluxes are obtained through a water balance approach that combines daily meteorological and NDVI data at 250-m spatial resolution. They are then used for model forcing, whereas model verification is carried out through comparison with different soil moisture remote sensing products. The aim of this study is to reduce uncertainty in water balance components and better simulate surface–groundwater interactions in agriculturally intensive landscapes.

We demonstrate that the integration of EO-driven irrigation estimates into ISSHMs provides a robust framework for evaluating the trade-offs between irrigation efficiency and aquifer recharge. The resulting models can provide critical insights into water use dynamics under varying regulatory and climatic scenarios, thus supporting more informed water governance strategies across multiple sectors.

How to cite: Ortenzi, S., Gatto, B., Massari, C., Chiesi, M., Moriondo, M., Fibbi, L., and Camporese, M.: Earth Observation-based Irrigation Dynamics to enhance Integrated Surface–Subsurface Hydrological Models, EGU General Assembly 2026, Vienna, Austria, 3–8 May 2026, EGU26-19730, https://doi.org/10.5194/egusphere-egu26-19730, 2026.

Groundwater recharge is a major challenge for the sustainable management of water resources, particularly in territories facing increasing water stress linked to climate change and anthropogenic pressures. Nature-Based Solutions (NbS), particularly Nature Water Retention Measures (NWRM), represent a promising approach to enhance natural infiltration processes, with potential benefits for groundwater quality and the territorial resilience.

This study is part of an exploratory approach aimed at analyzing the potential of NbS to promote groundwater recharge at the scale of a rural watershed, located in southern France and characterized by a Mediterranean climate with recharge predominantly driven by precipitation. The objective is to identify suitable areas for the future implementation of NbS and to assess their effects on groundwater recharge and water quality.

The methodology is founded on a scenario-based hydrological modeling approach at the watershed scale, using the SWAT+ model and relying on the integration of spatial data, including topography, soil properties, vegetal cover type, land use. The watershed is discretized into homogeneous hydrological response units (HRUs) in order to coherently represent the main characteristics and associated hydrological processes. Climatic data are then integrated into the model to represent the meteorological conditions required for hydrological simulations. The model is first calibrated using in situ measured discharge data. Sensitivity analyses will allow to identify the parameters that most strongly influence the hydrological functioning of the watershed.

In a second phase, nature-based land management scenarios focusing on NWRM will be simulated, including in particular the implementation of hedgerows and ditches, as well as infiltration basins, in order to assess their potential to improve groundwater recharge compared to a reference situation.

How to cite: Soukrate, I., Le Gal La Salle, C., Ducros, L., and Khaska, S.: Assessing Nature-Based Infiltration Solutions through hydrological modelling to identify suitable areas for groundwater recharge and potential water quality benefits, EGU General Assembly 2026, Vienna, Austria, 3–8 May 2026, EGU26-19897, https://doi.org/10.5194/egusphere-egu26-19897, 2026.

EGU26-21149 | ECS | Orals | HS8.2.13

Integrating SWAT+ hydrological modelling and remote sensing analysis to estimate surface water balance and groundwater recharge in the High Atlas of Marrakech and the Haouz plain (Morocco) 

Abderrahman El Farchouni, Abdessamad Hadri, Giulio Castelli, Younes Fakir, Elena Bresci, Mohamed Ouarani, and Azzouz Kchikach

Groundwater resources are becoming increasingly vulnerable to human activities and climate change due to high water demand, intensive abstraction, and increased evapotranspiration associated with changes in precipitation amounts and patterns. In semi-arid mountain watersheds, groundwater recharge estimation is affected by substantial uncertainty due to the complexity of hydrological processes and the limitations of individual methods. Process-based models, satellite-derived water balance approaches, and groundwater-level analyses capture different components and scales of recharge, and no single method can fully represent recharge dynamics. To address this, this study applies an integrated framework combining SWAT+ hydrological modelling, remotely sensed water balance components, and the Water Table Fluctuation (WTF) method in the Ourika watershed, originating in the High Atlas of Marrakech and draining into the Haouz plain (Morocco). The dominant land use types of the watershed are grasslands and bare lands. The inputs of the SWAT+ model were prepared using the SRTM 30m digital elevation model (DEM). The improved maps of land use land cover from (ESA CCI LC) products were used to test different scenarios and their impact on the water balance. The soil characteristics are determined from FAO soil maps and the Harmonized World Soil Database and hydraulic characteristics are determined using the SPAW model. Daily rainfall is measured at gauge stations, and the meteorological variables such as daily wind speed, relative humidity, solar radiation, and temperature are collected within the watershed. The model was calibrated using daily stream flow data using Sequential Uncertainty Fitting (SUFI-2), which is one of the programs incorporated into R-SWAT interface. The annual recharge, calculated through the physically-based SWAT+ model, was compared to the estimated one using a remote sensing-based water balance approach. For this latter one, the water balance elements were calculated using satellite-derived datasets from GPM (precipitation), SEBAL (actual evapotranspiration), SMAP (soil moisture storage change), and NRCS-CN (runoff). This method provides spatially distributed estimates of recharge and enables direct comparison with SWAT+ outputs. In addition, the Water Table Fluctuation (WTF) method derived from piezometric time series was used as an independent field-based evaluation of recharge dynamics. The integration of both modeling and remote sensing approaches enhances the understanding of recharge dynamics in semi-arid environments and supports the development of sustainable groundwater management strategies in the Ourika watershed.


How to cite: El Farchouni, A., Hadri, A., Castelli, G., Fakir, Y., Bresci, E., Ouarani, M., and Kchikach, A.: Integrating SWAT+ hydrological modelling and remote sensing analysis to estimate surface water balance and groundwater recharge in the High Atlas of Marrakech and the Haouz plain (Morocco), EGU General Assembly 2026, Vienna, Austria, 3–8 May 2026, EGU26-21149, https://doi.org/10.5194/egusphere-egu26-21149, 2026.

EGU26-2635 | Posters on site | HS8.2.14

Seasonal Coastal Groundwater Dynamics at Lahaina Beaches, Hawaiʻi 

Xiaolong Geng, Edward Lopez, Hope Kanoa, Hong Zhang, Amir Haroon, Henrietta Dulai, and Tao Yan

The August 2023 Lahaina wildfire caused extensive environmental impacts, including the release of untreated wastewater and combustion-derived contaminants such as nutrients and polycyclic aromatic hydrocarbons (PAHs). This study examines seasonal groundwater flow and solute transport dynamics within a post-wildfire beach aquifer. Using field observations and a two-dimensional, density-dependent, variably saturated groundwater model calibrated with year-long data, we simulated groundwater flow and salinity patterns and applied Lagrangian particle tracking to evaluate solute pathways and transit times. Summer conditions are characterized by elevated inland groundwater levels and predominantly seaward flow, resulting in rapid solute discharge to the shoreline. In contrast, enhanced tidal and wave forcing in winter drives greater seawater infiltration, deeper recirculation, and net landward solute transport with longer residence times. Our results highlight the importance of seasonal and tidal variability in controlling post-wildfire contaminant fate and provide insights for time-sensitive coastal management and ecosystem protection.

How to cite: Geng, X., Lopez, E., Kanoa, H., Zhang, H., Haroon, A., Dulai, H., and Yan, T.: Seasonal Coastal Groundwater Dynamics at Lahaina Beaches, Hawaiʻi, EGU General Assembly 2026, Vienna, Austria, 3–8 May 2026, EGU26-2635, https://doi.org/10.5194/egusphere-egu26-2635, 2026.

EGU26-4876 | Orals | HS8.2.14

The present and future of alpine groundwater dynamics: Lessons from the Vallon de Réchy (Switzerland)   

Landon J.S. Halloran, Antoine Carron, Marie Arnoux, Nazanin Mohammadi, Eleanor Berdat, Noam Makkinga, Chloé Magnenat, Ronny Figueroa, and Jeremy Millwater

Relative to lowland systems, alpine hydrological systems face more rapid and impactful changes due to climate change. In this context of altered meteorological patterns, including decreased snow cover and greater variations in precipitation timing, groundwater’s hydrological buffering role is becoming increasingly significant. A multi-method research approach applied in the Vallon de Réchy reserve (Valais Alps, Switzerland) has provided us with new insights into groundwater as a key component of alpine hydrological systems.

The Vallon de Réchy (2182-3149 m.a.s.l., 11 km²) is a non-glaciated, nival-regime alpine headwater catchment with strong elevation gradients and highly heterogeneous geology. Much of our detailed process understanding comes from extensive work in a specific zone, the Tsalet subcatchment (2268-2893 m.a.s.l., 1 km²), where intermittent streams, perennial springs, and extensive unconsolidated sediments have made it a natural laboratory for studying alpine groundwater, developing hydrogeophysical methods, and investigating climate-change sensitivity.

Our hydrological, geochemical, and geophysical investigations reveal a highly heterogeneous system in which unconfined aquifers act as hydrological buffers to ensure year-round streamflow. Geochemical and stable isotope analyses provide us with information on the connectivity of different components of the system, as well as variations of end-member contributions to streamflow. By integrating hydrological observations and electrical resistivity tomography (ERT) measurements into numerical models, we have investigated the impacts of climate change on this hydrological system, finding that the currently perennial stream could eventually become intermittent. The site has also played a key role in the development of time-lapse gravimetry (TLG), a non-invasive geophysical method, as a tool for under-monitored hydrogeological systems in mountain regions. TLG has provided unique, quantitative data on seasonal variations in groundwater storage that would be extremely challenging and costly to obtain through traditional methods. While alpine catchments are undoubtedly highly varied, investigations in the Vallon de Réchy integrate novel monitoring approaches that provide evidence for the importance and finite resilience of groundwater as a vital component of alpine headwater catchments.

How to cite: Halloran, L. J. S., Carron, A., Arnoux, M., Mohammadi, N., Berdat, E., Makkinga, N., Magnenat, C., Figueroa, R., and Millwater, J.: The present and future of alpine groundwater dynamics: Lessons from the Vallon de Réchy (Switzerland)  , EGU General Assembly 2026, Vienna, Austria, 3–8 May 2026, EGU26-4876, https://doi.org/10.5194/egusphere-egu26-4876, 2026.

Hillslope groundwater in the critical zone (CZ) links subsurface water storage, hydrologic connectivity, and chemical export, yet its concentration–discharge (C–Q) relationships remain poorly constrained because internal discharge and chemistry are rarely observed simultaneously. The Poshan drainage tunnel system in Hong Kong consists of two sub-tunnels intersected by dense sub-vertical drains (SVDs), providing a valuable groundwater observation platform for investigating how hydrologic processes control solute concentrations within the volcanic rock hillslope. From April 2023 to April 2025, groundwater was sampled biweekly to monthly at the two tunnel outlets, the high tunnel weir (HTW) and low tunnel weir (LTW), and at four representative SVDs distributed along the tunnels across position and elevation. Concentrations of major ions, dissolved Si, and ²²²Rn were measured, and discharge at each location was monitored or calculated. Power law fitting, hysteresis index, and reactive transport model inversion were used to analyze C–Q relationships and to identify controls on solute export and transport. Hydrologic deconvolution was applied to time series of rainfall, groundwater levels from 9 piezometers, and discharge at the two weirs (HTW and LTW) to obtain residence time distributions, thereby constraining groundwater discharge and hydrologic connectivity. Across the hillslope, C–Q relationships showed strong solute-specific and spatial variability. At the weir scale, upslope groundwater more commonly exhibited enriching or diluting C–Q behaviors, whereas downslope groundwater more often showed chemostatic C–Q relationships. At the SVD scale, an upslope SVD showed significant dilution of Cl⁻ but strong enrichment of ²²²Rn with discharge, whereas a downslope SVD showed dilution of Na⁺, Cl⁻, and NO₃⁻ together with enrichment of K⁺, SO₄²⁻, and Si with discharge. The C–Q relationships of different solutes showed distinct behaviors: Na⁺, Cl⁻, and NO₃⁻ generally showed dilution or near chemostasis. In contrast, K⁺, Mg²⁺, and SO₄²⁻ more frequently enriched at high discharge, consistent with seasonal accumulation in shallow reservoirs followed by storm-driven flushing. Si displayed intermediate behavior, tending toward dilution or weak enrichment depending on location. ²²²Rn showed strong enrichment at specific sites, which may indicate rapid activation of short flow paths and groundwater mobilization. Hysteresis loop direction also varied by solute and location, with more counter-clockwise loops in the upslope area where solute signals lagged behind discharge and followed a seasonal cycle. More clockwise loops were observed for K⁺, Mg²⁺, and SO₄²⁻ in the downslope area, suggesting relatively abundant source reservoirs. Hydrologic deconvolution further indicated shorter mean residence times downslope than upslope, while groundwater near the tunnel could be discharged rapidly. Overall, the spatial and solute-specific C–Q variability within the volcanic CZ reflects the spatial distribution of solute storage and the interplay of thermodynamic limits, reaction kinetics, and residence time, and apparent chemostasis at larger scales may be due to mixing-driven signal averaging along heterogeneous flow paths.

How to cite: Yang, T., Jiao, J. J., and Mao, R.: Solute-specific and spatially variable concentration–discharge relationships in hillslope critical zone groundwater, EGU General Assembly 2026, Vienna, Austria, 3–8 May 2026, EGU26-8609, https://doi.org/10.5194/egusphere-egu26-8609, 2026.

Groundwater is irreplaceable in sustaining populations, maintaining agriculture, and supporting socioeconomic development, especially in arid and semi-arid regions where surface water is limited. However, a comprehensive understanding of groundwater table depth (WTD) changes across China remains constrained, especially following large-scale water management. Here, we present a monthly 0.1° resolution WTD dataset for China from 2005 to 2021, built by random forests using 470,967 monthly measurements from 9,011 stations and 25 predictors across topographic, geological, environmental, and anthropogenic categories. Validation results for nine river basins using testing dataset and compared with the published regional GWD data indicated that the constructed models exhibited reasonable performance, with high R2 (0.85 to 0.95, median 0.89) and low RMSE (2.11 to 13.44, median 3.82). Nationally, WTD is generally shallow in the southeastern regions and deep in the northwest, with a non-significant increasing trend of 3.79×10⁻³ m/year over the study period. Spatially, WTD experienced significant increases in the Huaihe and Yellow River basins, while exhibiting apparent decreases in the Yangtze and Southeast River basins. With the implementation of a series of water management strategies, such as the designation of groundwater extraction prohibited areas, the operation of the South-to-North Water Diversion Project in late 2013, the WTD in North China Plain's cities such as Beijing and Tianjin had decreased significantly, indicating groundwater table recovery. Similarly, through adjustments in planting structure and irrigation practices, cropland WTD in North China Plain decreased significantly from 2014-2021. These findings highlight the positive impact of the enacted series of water management measures on the recovery of WTD in urban and agricultural regions. Our study provides a high spatiotemporal groundwater table depth dataset for China, offering valuable insights for optimizing water management and enhancing groundwater protection strategies.

How to cite: He, X. and He, B.: High-resolution reconstruction of groundwater table depth in China (2005–2021): evidence for recovery under large-scale water management, EGU General Assembly 2026, Vienna, Austria, 3–8 May 2026, EGU26-8779, https://doi.org/10.5194/egusphere-egu26-8779, 2026.

EGU26-9657 | ECS | Posters on site | HS8.2.14

3D near-surface geophysics and geostatistics for heterogeneities characterization and water table monitoring on the Orgeval critical zone observatory 

Maxime Gautier, Sylvain Pasquet, Nicolas Radic, Didier Renard, Roland Martin, Alexandrine Gesret, Romane Nespoulet, Nicolas Loget, Ludovic Bodet, and Agnès Rivière

Groundwater fluxes and interacting zones between groundwater and surface water are crucial for understanding the water dynamics of the critical zone. Groundwater within the critical zone plays a significant role in the ecosystem, biodiversity, and water supply. However, estimating these fluxes remains a key challenge because they are not directly measured in the field. Model calibration involves adjusting key parameters—such as saturated hydraulic conductivity and soil-water retention properties—using observed data like hydraulic head and river discharge, while initial and boundary conditions are prescribed to define the model l setup. That calibration is often done by comparing simulated soil water saturation and water table level to piezometers. Nevertheless, real flows occur in 3D in a complex medium containing heterogeneities with various lithologies, with different hydraulic parameters such as hydraulic conductivity and porosities.

Geophysical methods such as electrical resistivity tomography (ERT), seismic refraction tomography (SRT), and multichannel analysis of surface wave (MASW), which are sensitive to lithology,  content, and nature of fluid, represent helpful tools for hydrogeological modelling, both in terms of model parameterization and physical property characterization. ERT, which is particularly sensitive to lithology, allows us to identify and delineate heterogeneities, while seismic methods, which are sensitive to mechanical properties, will enable us to infer the water saturation and the piezometric surface in the near surface through the P-wave and S-wave velocities ratio (Poisson’s ratio, e.g. ) (Dangeard et al., 2021).

We propose a workflow combining geophysics and geostatistics to reconstruct the heterogeneities and the piezometric surface in an alluvial plain context. We implemented the workflow in a 30 x 30 m area at the Avenelles site of the Orgeval Critical Zone Observatory (CZO), which is part of the French network of CZOs OZCAR. ERT, SRT, and MASW surveys were carried out along 7 profiles to obtain 2D sections of electrical resistivity, P and S wave velocities (6 profiles of 72 electrodes/geophones and one profile of 48 electrodes/geophones, with 0.40 m spacing leading to 12,708 apparent resistivity data, 33,888 first wave arrival picks, and 277 dispersion curves). Geophysics allows us to pass from punctual piezometer data to 2D vertical sections. However, carrying out 3D geophysical acquisition is cumbersome. To overcome these limitations, we then use geostatistics to get a distribution of our geophysical parameters in the 3D volume delineated by the geophysical survey. Once the 3D interpolation is done by kriging methods, we can retrieve a view of the heterogeneities distribution in the near surface as well as the water table position to inform hydrogeological inversion. Furthermore, with the addition of petrophysical relationships, it is possible to estimate saturation and porosity distribution for a future 3D hydrogeological physics-based model run to better characterise groundwater fluxes. Finally, all these workflows, including complementary methods, could be performed on different dates for time-lapse monitoring of the water table.

How to cite: Gautier, M., Pasquet, S., Radic, N., Renard, D., Martin, R., Gesret, A., Nespoulet, R., Loget, N., Bodet, L., and Rivière, A.: 3D near-surface geophysics and geostatistics for heterogeneities characterization and water table monitoring on the Orgeval critical zone observatory, EGU General Assembly 2026, Vienna, Austria, 3–8 May 2026, EGU26-9657, https://doi.org/10.5194/egusphere-egu26-9657, 2026.

EGU26-9931 | ECS | Orals | HS8.2.14

Disentangling urban and hydrogeological influences on groundwater fauna in Halle (Saale)  

Laura Meyer, Christian Griebler, Martina Herrmann, and Peter Bayer

Groundwater fauna play an important role in subterranean aquatic ecosystems. In urban areas, their habitats are shaped not only by hydrogeological conditions but also by stressors such as elevated groundwater temperatures and oxygen depletion. However, the combined effects of urbanisation and geological factors on groundwater fauna remain poorly understood.

To characterise urban influences and contrast them with hydrogeological controls, abiotic and faunal data were collected from 91 groundwater monitoring wells in Halle (Saale) over the course of one year, comprising five measurement campaigns. Both the urban area and the surrounding rural region were investigated. The hydrogeological setting of the city is highly variable due to diverse near-surface geological formations, resulting in multiple aquifer types across several hydrostratigraphic units.

The urban gradient was characterised by elevated temperatures (>12 °C) in the city centre, while differences in dissolved oxygen (DO) and dissolved organic carbon (DOC) reflected both urban and hydrogeological influences. Spatial patterns were evident in the regional variation of faunal community composition. However, these patterns did not clearly correspond to contrasts between urban and rural areas or to specific aquifer types. Instead, fauna in near-surface aquifers were more strongly influenced by hydraulic conductivity and groundwater depth. Crustaceans were primarily found at wells with groundwater levels shallower than 6 m, whereas worms (Oligochaeta, Polychaeta, Platyhelminthes) dominated at wells with deeper groundwater levels.

The abundance of stygofauna and the number of taxonomic groups showed significant, albeit weak, correlations with redox-relevant parameters (DO, Eh, NH₄⁺, NO₃⁻ and DOC), with higher DO concentrations generally being associated with higher abundance and diversity. We also observed a weak negative correlation with temperature, which was particularly pronounced in combination with low DO concentrations.

These findings demonstrate the necessity for an integrative approach to assessing complex urban groundwater ecosystems, taking into account the interactions between abiotic and biotic factors within the context of the respective hydrogeological setting.

How to cite: Meyer, L., Griebler, C., Herrmann, M., and Bayer, P.: Disentangling urban and hydrogeological influences on groundwater fauna in Halle (Saale) , EGU General Assembly 2026, Vienna, Austria, 3–8 May 2026, EGU26-9931, https://doi.org/10.5194/egusphere-egu26-9931, 2026.

EGU26-10002 | ECS | Orals | HS8.2.14

Integrating Transient Hydrogeology Models for Enhanced Interpretation of Geophysical Data in the Vadose Zone 

Nicolas Radic, Agnès Rivière, Ludovic Bodet, Alexandrine Gesret, Maxime Gautier, Sylvain Pasquet, and Roland Martin

Quantifying water and heat fluxes at the interface between surface water (SW), groundwater (GW), and the vadose zone (VZ) is critical for sustainable water and energy resource management under global change. Direct field measurements are challenging because SW–GW exchanges depend on initial and boundary conditions and the spatial distribution of hydrofacies, which are often poorly constrained. Usually, these fluxes are estimated by calibrating models using classical data like hydraulic heads and river discharge. But it is well known that these data did not get enough information to constrain these fluxes. To overcome the lack of direct in situ data, de Marsily et al., (2005) and Schilling et al., (2019) suggested to couple the classical observations with unconventional data such as the geophysical surveys, for instance successfully applied in the context of SW-GW exchanges by Dangeard et al., (2021). Binley et al., (2015), in their comprehensive review, highlighted the robustness of geophysical methods for imaging subsurface structures and estimating saturation profiles, reinforcing their role as essential tools for characterizing vadose zone processes.
This study develops a transient, process-based hydrogeophysical forward model that integrates hydrological and geophysical processes. The geophysical methods used in this study are electrical resistivity tomography (ERT), seismic methods, and heat tracing, applied as complementary approaches to characterize vadose zone dynamics and link hydrological processes to geophysical data. The hydrological model (Rivière et al., 2020) rigorously solves Richards’ equation coupled with heat transport—simulating variably saturated water and thermal fluxes in porous media under transient conditions—and was validated with experimental and field data to explore the variability of saturated flow and heat fluxes. The seismic model, based on Solazzi et al., (2021) uses the Hertz-Mindlin contact theory combined with the Biot-Gassmann model and simulates the influence of capillary suction with a transient method. The electrical model uses the Waxman-Smits petrophysical law to quantify electrical conductivity of the soil. The outputs of the hydrological model are coupled with geophysical forward models to compute synthetic geophysical models (P and S wave velocity, electrical resistivity) and associated data (more particularly surface wave phase velocity, apparent electrical resistivity); as well as heat tracing signals). The synthetic case considered in this study is a 1D soil column, subjected to seasonal variations in precipitation and temperature, to analyze the resulting dynamics and their geophysical data.
Testing this integrated model under typical spring conditions in the Paris Basin demonstrates:

  • The added value of transient modeling for interpreting geophysical data.
  • Sensitivity of seismic and electrical responses to soil saturation and pressure changes, even without water table fluctuations.
  • The influence of past infiltration events on geophysical survey interpretation.

This approach provides new insights into VZ functioning and strengthens the link between hydrological processes and geophysical signatures, paving the way for improved characterization of subsurface dynamics under global changes.

How to cite: Radic, N., Rivière, A., Bodet, L., Gesret, A., Gautier, M., Pasquet, S., and Martin, R.: Integrating Transient Hydrogeology Models for Enhanced Interpretation of Geophysical Data in the Vadose Zone, EGU General Assembly 2026, Vienna, Austria, 3–8 May 2026, EGU26-10002, https://doi.org/10.5194/egusphere-egu26-10002, 2026.

Accurate representation of evapotranspiration (ET) and plant water stress is essential for understanding ecosystem resilience to hydroclimatic variability. However, most land surface and Earth System Models infer vegetation stress primarily from shallow soil moisture, implicitly assuming that declining surface water availability directly translates into physiological limitation. This assumption fails in ecosystems where vegetation can access deeper stored water, such as groundwater, leading to systematic mischaracterization of water stress and ecosystem functioning during dry periods.

Here we present a physics-based ecohydrology model that represents root water uptake as an emergent process governed by soil–plant–atmosphere water potential gradients, allowing plants to dynamically shift water sources between shallow soil and deeper reservoirs. This framework captures how access to groundwater modifies plant hydraulic status and regulates water stress across seasonal, interannual, and long-term drying. Applied to oak savanna ecosystems, the model reveals distinct uptake regimes in which groundwater increasingly contributes to transpiration as surface soils dry, buffering ET during dry seasons when shallow soil moisture alone would predict strong limitation.

Our results show that groundwater access fundamentally alters ecosystem stress trajectories, delaying the onset of hydraulic limitation and reducing ET sensitivity to surface drying. Water table depth emerges as a key control on the degree of buffering, highlighting feedbacks between rooting strategies, subsurface water availability, and ecosystem resilience. We further demonstrate that stress metrics based solely on shallow soil moisture substantially overestimate drought impacts in systems sustained by deeper water sources.

By providing a reduced-order representation of ET that explicitly accounts for both soil moisture and groundwater availability, this work offers a pathway to improve model representations of plant water stress and evapotranspiration in ecosystems sustained by deep water storage under a changing climate.

How to cite: Cerasoli, S. and Terrer, C.: Groundwater access modulates plant water stress and evapotranspiration in water-limited ecosystems , EGU General Assembly 2026, Vienna, Austria, 3–8 May 2026, EGU26-12822, https://doi.org/10.5194/egusphere-egu26-12822, 2026.

EGU26-14308 | ECS | Posters on site | HS8.2.14

Impact of the representation of water transfer in the unsaturated zone on water flux in a ecohydrological critical zone model. 

David Fuseau, Sylvain Kuppel, Agnès Riviere, Sylvain Weill, Jean Marcais, and Isabelle Braud

An increasing number of critical zone models are seeking to capture hydrological dynamics in an integrative fashion, reconciling water dynamics at multiple scales, and capture reciprocal linkage with plant dynamics. EcH2O-iso (Kuppel et al., 2018) is such a numerical tool, where a process based, fully distributed formulation has been balanced with computational efficiency using a simplified formulation of subsurface water dynamics: three layers where top-layer infiltration is described using the Green-Ampt approach, while vertical water travel to deeper layers is gravity-driven, all using a saturation dependent hydraulic conductivity. This approach is sequential within grid cells and along the lateral drainage network, providing a fast, robust, and stable water budget. While this formulation has been successful in capturing ecohydrological dynamics (including that of isotopes tracers) in a variety of critical zone settings, gravity-driven percolation has failed to reproduce finer dynamics in some critical zone observatories displaying arid conditions and thick vadose zone (several tens of meters).

In this work, we add the possibility of considering a vertical dynamical water fluxes exchange between the layers using the Richards equation. The simulations are performed on a single pixel in order to focus on the importance of the subsurface water flux dynamics on the vertical axis only. The implementation of the Richards equation is based on the numerical resolution of Ross (2003). The resolution makes use of the Kirchhoff transform to increase the speed and the stability of the solution. The Brooks and Corey retention curve parameters are used for the resolution as it is in the original EcH2O-iso model. The resolution of Ross (2003) is also usable for heterogeneous soils and provides a solution for the advection-dispersion equation for solute transport. The latter features paves the way for future work, including the tracer module implemented isotopy tracking in EcH2O-iso. The fact that both the original (sequential) and current (dynamical) vertical routines are available as options in the same critical model allows for a direct benchmarking of performances and computing in a flexible comparison of the consequences of such different approaches of the subsurface flux modelling. We first validated the implementation of unsaturated zone representation thanks to standard 1D benchmarks. The impact of the new vertical routing scheme in EcH2O-iso is then evaluated in a deeply weathered profile in a dry tropical forest where a calibration of hydrodynamic parameters had been previously carried out with the sequential routing version of the model. Finally, at the same site, the newly-implement dynamical approach is used to perform a sensitivity analysis and a calibration of the parameters over a large number of simulations, and compared again to the performances of the sequential-base model.

References

Kuppel, S. et al : EcH2O-iso 1.0: water isotopes and age tracking in a process-based, distributed ecohydrological model, Geosci. Model Dev., 2018.

Ross, P. J.: Modeling soil water and solute transport - Fast, simplified numerical solutions, Agronomy Journal, 2003.

How to cite: Fuseau, D., Kuppel, S., Riviere, A., Weill, S., Marcais, J., and Braud, I.: Impact of the representation of water transfer in the unsaturated zone on water flux in a ecohydrological critical zone model., EGU General Assembly 2026, Vienna, Austria, 3–8 May 2026, EGU26-14308, https://doi.org/10.5194/egusphere-egu26-14308, 2026.

EGU26-15005 | Orals | HS8.2.14

Multiple lines of evidence provide a holistic and testable conceptualisation of complex ecosystem-groundwater dynamics at the Doongmabulla Springs Complex, Queensland, Australia  

Richard Cresswell, Anne Gibson, Michael Short, Sopie Pyrke, Emily Bathgate, Miles Yeates, Penn Lloyd, and David Stanton

The Doongmabulla Springs Complex (DSC) in Central Queensland, Australia, consists of over 160 individual springs ranging from vents less than 10 cm across supporting individual tussocks of grass to wetlands over 9 hectares with permanent pools of water. These unique springs are home to a variety of plant species (many endemic) that are specially adapted to the varied physical, chemical and hydraulic conditions of the local environment and the groundwater discharge on which they rely.

We have examined these springs across multiple spatial and temporal scales, using remote and field data acquisition techniques, to develop a detailed understanding of the water, soil and floristic characteristics and dynamics at a selection of these springs, quantifying spring extents and changes over time as well as documenting species zonation and vegetation dynamics related to seasonal and climatic variability and the local physico-chemical conditions. From these targeted studies we can interpolate and extrapolate to the other springs in the complex and identify where additional studies may be required to fill data gaps.

Critically, local multi-spectral and thermal drone imagery has augmented regional satellite imagery to constrain spatial discharge patterns of springs and provides spatial linkages that complement visual images taken at the same time. On-ground surveys have identified new springs in some areas and loss of others and can be linked to regolith variability and sub-surface source aquifer pressure controls. The thermal imagery provides a platform to observe and quantify spring discharge changes season to season. Spot sampling of surface waters and groundwater highlights inter-seasonal variability in water source chemistry, whilst isotopes highlight the changing importance of groundwater for maintenance of groundwater discharge and consequent support of spring health. Notably, water samples taken for chemical and isotopic analysis included run-of-river Radon-222 analysis that helps highlight the groundwater discharge constrains.

Underpinning the local-scale observations, regional groundwater pressures define the dynamics of the source waters, though spatially disparate bore data must be complemented by modelling interpolations. The multi-dimensional conceptualisation thus informs, and is informed by, a regional numerical groundwater model and links the regional observations with local-scale, spring-specific eco-hydrological modelling, which is described in a companion paper (Gibson, et al. these proceedings).  

The DSC conceptualisation must be coherent at all spatial and temporal scales and then it can be used to customise mitigation responses at individual springs based on groundwater impact modelling considering potential changes from climate change and local mining activities.

How to cite: Cresswell, R., Gibson, A., Short, M., Pyrke, S., Bathgate, E., Yeates, M., Lloyd, P., and Stanton, D.: Multiple lines of evidence provide a holistic and testable conceptualisation of complex ecosystem-groundwater dynamics at the Doongmabulla Springs Complex, Queensland, Australia , EGU General Assembly 2026, Vienna, Austria, 3–8 May 2026, EGU26-15005, https://doi.org/10.5194/egusphere-egu26-15005, 2026.

EGU26-15036 | Orals | HS8.2.14

Evaluation of grassland carrying capacity and its constraint of water resources in Mongolia 

Tadanobu Nakayama, Qinxue Wang, and Tomohiro Okadera

In Mongolia, the traditional pastoral system has changed by the overuse and degradation of water resources. Currently, there is a research gap between the socio-economic transition and ecosystem degradation on the existing knowledge. In the present study, a process-based eco-hydrology model, NICE (National Integrated Catchment-based Eco-hydrology) (Nakayama et al., 2021a, 2021b, 2023), was applied to the total of 29 river basins in the entire country to quantify the heterogeneous distribution of livestock water use and its relation to pasture degradation there (Nakayama, 2025). The authors also evaluated the change of grassland carrying capacity and carrying status index during the last few decades (Yan et al., 2023). The result showed that the livestock water use in entire basins was the same order of magnitude as mining and urban water uses and that the estimated total water use was similar to that on constant assumption in the previous study. In addition, the simulation also clarified heterogeneous distributions of water uses of 5 types of typical livestock and higher water use in the central part of the country. However, the carrying status index showed more serious situation of overgrazing in the transitional zone between grassland and the Gobi desert. This means that the excessive use of water resources is indirectly related to the degradation of natural vegetation in grassland. These results also imply that the excessive use of livestock water intake can lead to groundwater decline, grassland degradation, and ultimately a reduction in the amount of water available to each livestock head. This methodology is effective to evaluate the grassland carrying capacity and its constraint of water resources (Lu et al., 2020), and to propose solutions to unsustainable pastoral land use patterns.


References

Lu, H., et al. 2020. Environmental Science and Pollution Research, 27, 10328-10341, doi:10.1007/s11356-019-07559-9.

Nakayama, T., et al. 2021a. Ecological Modelling, 440, 109404, doi:10.1016/j.ecolmodel.2020.109404.

Nakayama, T., et al. 2021b. Ecohydrology & Hydrobiology, 21(3), 490-500, doi:10.1016/j.ecohyd.2021.07.006.

Nakayama, T., et al. 2023. Ecohydrology & Hydrobiology, 23(4), 542-553, doi:10.1016/j.ecohyd.2023.04.006.

Nakayama, T. 2025. Environmental Science and Pollution Research, 32, 13626-13637, doi:10.1007/s11356-025-36083-2.

Yan, N., et al. 2023. Ecological Indicators, 146, 109868, doi:10.1016/j.ecolind.2023.109868.


How to cite: Nakayama, T., Wang, Q., and Okadera, T.: Evaluation of grassland carrying capacity and its constraint of water resources in Mongolia, EGU General Assembly 2026, Vienna, Austria, 3–8 May 2026, EGU26-15036, https://doi.org/10.5194/egusphere-egu26-15036, 2026.

EGU26-22055 | Posters on site | HS8.2.14

A comprehensive bioassessment of karst aquifer flow paths  

Sanda Iepure, Orest Sambor, Daniela Cociuba, Aurel Persoiu, Constantin Marin, Alin Tudorache, Dragos Iulian Coada, Anna Denes, Avar Lehel Denes, Ruxandra Bucur, and Nicolae Scrob

Current challenges in the assessment of groundwater characteristics in karst areas result from the difficulties to effectively identify episodes of high water discharge and flow paths rates. The characteristics of karst aquifers formed by interconnected network of pores, fissures, fractures and conduits, with an alternation of high and low permeability zones and distinct water residence time, makes contamination difficult to be detected and monitored over underground flow paths. Groundwater’s have a high variability in recharge and flow rates, influenced by weather and climate patterns. At high flow, resulting from intense precipitations and/or significant snowmelt, karst groundwater’s moves rapidly through the rock, carrying effectively pollutants in and through the host rock. In contrast, during periods of drought and/or reduced surface inflow, groundwater moves slowly and diffuses more effectively within the primary/secondary pores of the rocks. In karst, the base flow is associated with long-term storage of the groundwater that creates a relatively stable environment for strictly subterranean dwellers organisms. Stable conditions in groundwater creates biodiversity hotspots where temperature, chemical composition highly influenced by lithology and potential contaminants acts together to ensure healthy habitats that supports a suite of associations of organisms indicative for the overall groundwater health. In contrast, a high discharge and a rapid flow path are associated with disturbances of groundwater habitats, associated with a shift in community patterns structure and dynamics. In this presentation, we combine water chemistry monitoring, stable isotope analyses (indicators of water source, recharge patterns and timing), identification of microbial communities (i.e., E. coli, enterococci, enterobacteria) and of groundwater fauna monitoring (indicative of both contamination and as biomarkers for groundwater flowpath) to identify episodes of high and base flow in a karst aquifer in the Padis karst area in NW Romania. We assume that a fine tune evaluation of groundwater communities (microbes and meiofauna biodiversity) can be used to: 1) understand the pattern of water flow variation across seasons, acting as disturbances for groundwater communities; and 2) detect the contaminated groundwater spots and potential degraded habitats. From this perspective, we used the microbes and groundwater fauna as biomarkers models to describe the potential causal linkages among groundwater karst flow and flow-path variation, groundwater habitat diversity/stability and quality, and groundwater community diversity in disturbed/undisturbed habitats.      

How to cite: Iepure, S., Sambor, O., Cociuba, D., Persoiu, A., Marin, C., Tudorache, A., Coada, D. I., Denes, A., Denes, A. L., Bucur, R., and Scrob, N.: A comprehensive bioassessment of karst aquifer flow paths , EGU General Assembly 2026, Vienna, Austria, 3–8 May 2026, EGU26-22055, https://doi.org/10.5194/egusphere-egu26-22055, 2026.

EGU26-22184 | Orals | HS8.2.14

Emerging Tools to Identify and Assess Impacts to Groundwater-Dependent Ecosystems 

John Stella, Melissa Rohde, Albert Ruhi, Jared Williams, Conor McMahon, Christopher Kibler, Rose Mohammadi, Yun Zhao, Rachael Pentico, Adam Lambert, Dar Roberts, Michael Singer, and Kelly Caylor

Groundwater-dependent ecosystems (GDEs) are hotspots of biodiversity and ecosystem functioning, but are increasingly threatened globally from multiple stressors including land conversion, water diversion and climate change. Protecting these valuable and vulnerable ecosystems has been challenging historically because they are difficult to identify and delineate due to their diverse composition and typically small area (e.g., narrow and irregular riparian zones). Recent advances in remote sensing, machine learning and big data statistical methods have greatly improved our ability to detect GDEs, which is a critical step toward protecting and restoring them. In this talk we summarize some emerging approaches, including novel integration of public datasets, phenological image analysis, dendroisotope series, standardized threshold analysis, and cloud computing. These approaches collectively provide a set of tools for mapping GDEs globally and in assessing their impacts from changes in climate and groundwater. We discuss applications of these tools to policy and management challenges, including the Clean Water Act (USA) and the EU Water Framework Directive.

How to cite: Stella, J., Rohde, M., Ruhi, A., Williams, J., McMahon, C., Kibler, C., Mohammadi, R., Zhao, Y., Pentico, R., Lambert, A., Roberts, D., Singer, M., and Caylor, K.: Emerging Tools to Identify and Assess Impacts to Groundwater-Dependent Ecosystems, EGU General Assembly 2026, Vienna, Austria, 3–8 May 2026, EGU26-22184, https://doi.org/10.5194/egusphere-egu26-22184, 2026.

EGU26-22234 | Posters on site | HS8.2.14

Identifying the recharge processes of karst aquifer in Umbria (Central Italy) using long-term monitoring data and Modkarst Model 

Konstantina Katsanou, Francesco De Filippi, Athanasios Maramathas, Giuseppe Sappa, and Nikolaos Lambrakis

Aquifers and karst springs are among the most studied and challenging topics of hydrogeology in recent years. They are difficult to model due to the aquifer's heterogeneity and anisotropy, as well as the difficulties of conventional monitoring. However, they are among the most important groundwater resources, accounting for a significant portion of freshwater intended for human consumption, especially in the EU.

The study area is located in the Umbria Region in central Italy and is characterised by an elongated carbonate ridge formed by a multilayered karstified carbonate succession, locally separated by marly interbeds. Groundwater circulation is controlled by Apennine tectonics, with faults either enhancing or limiting hydraulic connectivity between hydrogeological units. Recharge occurs predominantly through diffuse but also local infiltration over carbonate outcrops and high plains.

This study contributes to the understanding of hydrogeological functioning by integrating long-term monitoring data (more than 20 years) of discharge and rainfall with numerical modelling.

The data reveal that the karst system exhibits highly complex hydrological behaviour, and the distinctive hydrograph shapes observed for certain springs are attributed to direct surface water inputs entering the system through local sinkholes. Modkarst Model that was applied to six major karst springs, allowed the quantification of surface water contribution.

This work highlights that effective management of karst aquifers under increasing climate change effects that usually requires integrated approaches combining geological understanding, continuous monitoring, and modelling.

How to cite: Katsanou, K., De Filippi, F., Maramathas, A., Sappa, G., and Lambrakis, N.: Identifying the recharge processes of karst aquifer in Umbria (Central Italy) using long-term monitoring data and Modkarst Model, EGU General Assembly 2026, Vienna, Austria, 3–8 May 2026, EGU26-22234, https://doi.org/10.5194/egusphere-egu26-22234, 2026.

EGU26-22249 | ECS | Posters on site | HS8.2.14

Filtering and Analysing Distributed Temperature Sensing Data: lessons learnt from the Wüstebach headwater stream, Germany 

Alessandro Cattapan, Gijs Vis, Konstantina Katsanou, Raymond Venneker, Roland Bol, and Jochen Wenninger

The Wüstebach stream is a headwater stream with a 38.5 ha catchment located in the Eifel National Park, Germany, and is part of the TERENO Eifel Lower Rhine Valley Observatory.

Surface water temperature was measured since October 2023 along a 293 m reach of the Wüstebach Stream with a spatial resolution of 25 cm and at 15 min intervals using a Fibre Optic Distributed Temperature Sensing (FO-DTS) connected to a Silixa XT-DTS. In April 2024, the length of the FO was extended to 440 m. The presence of a series of monitoring devices and sharp elevation changes in the stream bed led to the partial exposure of the FO cable to the atmosphere in specific locations. Moreover, the fluctuations of the water level caused intermittent exposure of the cable in a series of locations, which vary in time and space. Atmosphere-exposed sections produce erroneous temperature data, which must be carefully filtered out from the dataset to capture the actual spatial and temporal variability of stream temperature. Moreover, radiative effects from cable sections exposed to the atmosphere can also affect temperature measurements in adjacent points. Manually filtering such a large dataset is not feasible and requires an automated approach.

This work presents a methodology for filtering FO-DTS data in space and time that uses the median daily temperature range as a core metric to identify areas of the FO exposed to the atmosphere. Additionally, screening methodologies such as spectral analysis for the identification of changes in temperature fluctuation due to groundwater contribution are applied and discussed.

How to cite: Cattapan, A., Vis, G., Katsanou, K., Venneker, R., Bol, R., and Wenninger, J.: Filtering and Analysing Distributed Temperature Sensing Data: lessons learnt from the Wüstebach headwater stream, Germany, EGU General Assembly 2026, Vienna, Austria, 3–8 May 2026, EGU26-22249, https://doi.org/10.5194/egusphere-egu26-22249, 2026.

HS8.3 – Subsurface hydrology – Vadose zone hydrology

Reliable soil moisture estimation is challenged by sparse in-situ networks, inconsistencies across satellite products, and structural limitations in simplified land-surface models. This study develops a machine learning assisted calibration framework for pyWBM, a Python implementation of the University of New Hampshire Water Balance Model, to generate improved historical reconstructions and ensemble projections of root-zone soil moisture for counties across Illinois. We integrate in-situ observations from nine Illinois State Water Survey stations with satellite and reanalysis soil moisture estimates from Soil Moisture Active Passive Level 4 Carbon Product Version 7 (SMAP L4C Version 7) and North American Land Data Assimilation System Phase 2 (NLDAS-2) model outputs (VIC, NOAH, MOSAIC). Meteorological forcing is obtained from Gridded Surface Meteorological Dataset (GRIDMET) for calibration and Localized Constructed Analogs Version 2 (LOCA2) for future projections. Calibration targets multiple key parameters that control storage dynamics and partitioning processes including available water capacity, wilting point, drying coefficient, runoff shape factor, and Potential Evapotranspiration (PET) scaling coefficients. Using JAX-based automatic differentiation, we evaluate thirteen loss functions and identify three, Root Mean Square Error (RMSE), Outer 50 Percent Root Mean Square Error (Outer50RMSE), and Kiling-Gupta Efficiency (KGE), as the most informative based on performance over the full record, the driest five days per year, and the wettest five days per year. Parameter comparisons reveal robust differences between calibration sources: wilting point is systematically higher when calibrated with in-situ data, even when the ensemble is expanded across alternative loss functions. In contrast, available water capacity does not show a consistent separation between satellite- and in-situ-based estimates. Residuals exhibit slight seasonality, with the Outer50RMSE trained models showing the largest variance. To assess ensemble coverage, we introduce an ensemble coverage metric defined as the ratio between the intersection of ensemble spread and observed soil moisture relative to the observed range. In 6 of 9 counties, satellite-based calibrations produce higher coverage, indicating that multi-source calibration can better represent the overall distribution of soil moisture despite the limited temporal record of in-situ data. Projection ensembles generated using seven-year versus twenty-year calibration windows exhibit consistent drying signals across counties, and longer calibration periods reduce the spread of extreme projections while stabilizing parameter distributions. Overall, the results show that integrating in-situ, satellite, and reanalysis datasets with machine learning–enabled calibration improves model performance, enhances ensemble robustness, and provides more defensible future projections. However, the model still struggles to capture abrupt soil moisture declines and seasonal transitions, highlighting ongoing limitations in simplified water balance models when confronted with extreme hydrologic variability. The framework developed here offers a scalable pathway for generating county-scale soil moisture projections to support drought monitoring, agricultural decision-making, and climate resilience planning.

How to cite: Alam, T., Avila, T., Lafferty, D., Ford, T., and Sriver, R.: Machine Learning Assisted Calibration of pyWBM Using In-Situ, Satellite, and Reanalysis Soil Moisture Data for High Resolution Soil Moisture Ensemble Projections, EGU General Assembly 2026, Vienna, Austria, 3–8 May 2026, EGU26-357, https://doi.org/10.5194/egusphere-egu26-357, 2026.

Climate change is intensifying soil moisture variability, atmospheric evaporative demand, and salinity intrusion in agricultural landscapes, creating new challenges for sustainable food production. Understanding how soil hydrology and plant physiological stress interact under these conditions is essential for designing resilient irrigation strategies. This study presents a hydro-physiological assessment of wheat and maize grown under controlled combinations of soil salinity and deficit irrigation, and introduces an Artificial Neural Network (ANN) based Crop Water Stress Index (CWSI) model for real-time decision support in semi-arid farming systems of northern India.
Field experiments (2023–2025) were conducted to measure canopy temperature, air temperature, relative humidity, vapor pressure deficit (VPD), and soil moisture under varying salinity (EC levels) and irrigation regimes. These data were used to develop whole-season and stage-specific ANN models capable of capturing non-linear interactions between soil hydrology, crop physiology, and atmospheric demand. The ANN-based CWSI successfully distinguished mild-to-severe stress transitions and detected early-stage water stress acceleration during periods of high VPD, indicating a propensity toward flash drought development under combined salinity–moisture constraints.
Results show that salinity amplifies crop water stress by reducing effective root-zone moisture availability, leading to higher canopy–air temperature gradients and elevated CWSI values even under moderate irrigation. Stage-specific ANN models achieved strong performance (R² = 0.87–0.94), particularly during flowering and grain filling, where hydrological stress most affects yield. The framework demonstrates how data-driven CWSI modeling can translate complex soil–plant–atmosphere interactions into actionable irrigation insights for farmers.
This work highlights a scalable approach to precision irrigation scheduling, enabling reduced water use without compromising crop health in regions vulnerable to hydrological extremes and sociohydrological pressures. By linking soil hydrology, irrigation management, and physiologically informed stress indicators, the study contributes to sustainable food production strategies in a global climate change context.

How to cite: Dandotia, P. K. and Kotnoor Suryanarayanarao, H. P.: Hydro-Physiological Controls of Crop Water Stress Under Salinity and Deficit Irrigation: An ANN-Based Framework for Sustainable Irrigation Management in a Changing Climate, EGU General Assembly 2026, Vienna, Austria, 3–8 May 2026, EGU26-772, https://doi.org/10.5194/egusphere-egu26-772, 2026.

EGU26-1500 | PICO | HS8.3.1

Design and deployment of a multi-platform soil moisture monitoring network 

Felix Thomas, Friedrich Boeing, Julian Schlaak, Solveig Landmark, Rebekka Lange, Daniel Altdorff, Jan Bumberger, Andreas Marx, Peter Dietrich, Falk Böttcher, Rainer Petzold, Kerstin Jäkel, and Martin Schrön

The MOWAX project investigates monitoring- and modelling concepts as a basis for the assessment of the water budget in Saxony. It operates a dense, multi‑platform soil moisture observation network in collaboration with the German Weather Service (DWD), Sachsenforst, TU Dresden and regional authorities.

The network was designed to represent the dominant landscape properties influencing the water budget in Saxony, including land use, natural areas, soil types, and climatic conditions. It combines up to 10 area‑representative Cosmic Ray Neutron Sensing (CRNS) stations and novel mobile platforms, namely Rail-CRNS (continuous measurements from sensors on trains). We describe our standardized sensor deployment and calibration protocols, automated quality control procedures, and methods for integrating our observations into the modelling framework using the new UFZ timeseries infrastructure. After more than one year of effort, we report on advancements and experiences in pursuing our goals. Based on our strong collaboration with existing observatories and data management infrastructures we are maximizing the utility of ongoing CRNS data for our purposes by establishing a new sensor network.

One of the primary objectives is to enhance and validate the mesoscale Hydrologic Model (mHM) for Saxony by providing continuous, quality‑controlled soil moisture time series. Further, we aim to provide a near-real-time visualization of our observations and model outputs and deliver a valuable data basis that can be used by authorities to support management decisions and urgent actions.

MOWAX is funded by the European Regional Development Fund (EFRE) and by tax revenue on the basis of the budget approved by the Saxon state parliament (funding code 100702604).

How to cite: Thomas, F., Boeing, F., Schlaak, J., Landmark, S., Lange, R., Altdorff, D., Bumberger, J., Marx, A., Dietrich, P., Böttcher, F., Petzold, R., Jäkel, K., and Schrön, M.: Design and deployment of a multi-platform soil moisture monitoring network, EGU General Assembly 2026, Vienna, Austria, 3–8 May 2026, EGU26-1500, https://doi.org/10.5194/egusphere-egu26-1500, 2026.

The electrical properties of materials, specifically dielectric permittivity (ε) and electrical conductivity (σ), are of interest in a wide variety of applications (e.g. agriculture). For example, in porous media such as soil, ε is strongly correlated with water content, and dielectric sensors are routinely employed to measure soil moisture. Soil moisture sensing technologies have been available in the market for decades, including Time Domain Reflectometry (TDR), Impedance Sensors, Capacitance and Frequency Domain Reflectometers (FDR). These sensors all measure the apparent dielectric permittivity εa, which is a function of both the imaginary dielectric permittivity (εi) and εr. Sensor technology needs to be developed to measure both εr and εi in order to overcome the impact of salts on water content measurements and take the next technological step forward. A new method, the four-voltmeter method (4VM) is a complex dielectric sensor that determines both the εr and εi by measuring voltage amplitudes at multiple circuit nodes. The 4VM improves dielectric permittivity measurements under saline conditions by combining multiple independent admittance estimates to account for conductivity-induced errors, avoid loss of sensitivity, and maintain accuracy across a wide range of salinities. The goal of this project is to assess the performance of 4VM in a sandy soil across a range of salinities up to 50 dS/m and assess its true performance.  

How to cite: Rivera, L., Fakhouri, S., and Chambers, C.: Measuring soil moisture and dielectric permittivity in saline environments: Exploring the limits of Complex Dielectric Through Intersections Technology, EGU General Assembly 2026, Vienna, Austria, 3–8 May 2026, EGU26-2223, https://doi.org/10.5194/egusphere-egu26-2223, 2026.

EGU26-6582 | PICO | HS8.3.1

Summer drying of soils in Switzerland: Insights from the SwissSMEX network 

Martin Hirschi, Dominik Michel, Dominik L. Schumacher, Wolfgang Preimesberger, and Sonia I. Seneviratne

Notably drier summers and more frequent droughts were reported in Switzerland in the last decades. We analyse these drying trends based on the comprehensive network of in situ soil moisture measurements from the Swiss Soil Moisture Experiment (SwissSMEX), which as of now covers 15 years. We document recent measures that have been taken to secure the SwissSMEX network and to ensure the continuity of its long-term soil moisture timeseries. The analysis focuses on trends in summer and summer half-year anomalies of vertically integrated soil water content and investigates the robustness of the recent drying based on different sets of Swiss Plateau stations. Furthermore, the SwissSMEX-based trends are compared with those from soil moisture of a widely used land reanalysis product (ERA5-Land) and of a merged passive microwave satellite product (European Space Agency Climate Change Initiative ESA CCI).

There is good agreement between the temporal evolution and the drying tendency of SwissSMEX in situ soil moisture based on different sets of Swiss Plateau stations. Comparisons with ERA5-Land and ESA CCI reveal a consistent evolution of soil moisture across the three independent datasets. Summer drying tendencies over the common 2010–2025 period amount to ‑11 mm/decade for ERA5-Land and ESA CCI, and to ‑14 mm/decade for SwissSMEX. While most drying trends are not statistically significant over this short span, ERA5-Land shows significance when extending the analysis period. The findings underscore the need for continued soil moisture monitoring in Switzerland for further investigation of long-term drying trends.

How to cite: Hirschi, M., Michel, D., Schumacher, D. L., Preimesberger, W., and Seneviratne, S. I.: Summer drying of soils in Switzerland: Insights from the SwissSMEX network, EGU General Assembly 2026, Vienna, Austria, 3–8 May 2026, EGU26-6582, https://doi.org/10.5194/egusphere-egu26-6582, 2026.

EGU26-8959 | ECS | PICO | HS8.3.1

From raw measurements to indicators: workflows for quality-controlled soil moisture monitoring in Austria 

Florian Darmann, Verena Jagersberger, Jutta Eybl, Korbinian Breinl, Peter Strauss, and Thomas Weninger

Understanding soil water dynamics is crucial for hydrological assessments in Austria’s intensively used landscapes. Reliable soil moisture observations support the understanding of vadose zone processes and can be used to assess infiltration capacity during heavy rainfall events, as well as to evaluate water availability during dry periods. However, sensor-related uncertainties and data quality issues limit the application of soil moisture monitoring networks in hydrological modelling, despite their long-term operation and broad relevance.

The Austrian Hydrological Service operates a nationwide monitoring network measuring soil water content, matric potential, and soil temperature at multiple depths across diverse climatic and land-use conditions. These long-term observations provide an important basis for climate trend analysis and the development of water management strategies. The sustainable use of such datasets depends on robust data management and quality assurance procedures.

This study focuses on establishing a standardized and reliable workflow for transforming raw soil water measurements into publicly accessible indicators. This includes the development of quality control and data processing procedures for Austria’s soil moisture monitoring network. Automated and semi-automated routines are used to identify measurement errors related to sensor problems, signal drift, and implausible temporal behaviour. These routines are complemented by systematic data correction procedures. The resulting quality-controlled time series form the basis for deriving soil water indicators (e.g. the Soil Water Index) and enable near-real-time visualization within the national hydrological portal eHYD.

The presented workflow improves the consistency, reliability, and accessibility of long-term soil moisture observations by providing a framework for quality control and data processing. This approach is transferable to other soil moisture monitoring systems with similar challenges regarding data quality, long-term maintenance, and operational use.

How to cite: Darmann, F., Jagersberger, V., Eybl, J., Breinl, K., Strauss, P., and Weninger, T.: From raw measurements to indicators: workflows for quality-controlled soil moisture monitoring in Austria, EGU General Assembly 2026, Vienna, Austria, 3–8 May 2026, EGU26-8959, https://doi.org/10.5194/egusphere-egu26-8959, 2026.

Authors: Boquera, Lola ; Janeras, Marc ; Lladós, Agnès ; Portell, Xavier and Vicens, Marc

Institut Cartogràfic i Geològic de Catalunya. Parc de Montjuïc 08038, Barcelona, Spain. https://www.icgc.cat/

  XMS-Cat is a soil moisture observation network implemented by the Cartographic and Geological Institute of Catalonia (ICGC) to characterize climatic conditions and soil moisture throughout Catalonia. Each station in the network measures soil temperature and volumetric water content at several depths (typically 5, 20, 50, and 100 cm), as well as atmospheric variables such as rainfall, air temperature, humidity, and solar radiation. The network currently provides high-quality, open-access data for farmers, land managers, and scientists (Soil monitoring network ICGC website:  https://visors.icgc.cat/mesurasols/#9.67/42.4378/0.7495).

While volumetric water content measured by XMS-Cat sensors is a quantitative measure of soil moisture, shallow landslides triggered by rainfall are more closely related to the soil water energy state, which can be better assessed using water potential sensors. Consequently, in 2023, an experimental phase was initiated in which new XMS-Cat stations were supplemented with both types of sensors.The purpose of this enhancement in addition to deepening knowledge of soil water status is threefold: (1) strengthening soil-related hazard assessment, such as slope stability,(2) improving characterization of the vegetation water stress; and (3)introducing data redundancy to enhance network resilience.

This contribution provides further details of the network reconfiguration and the initial studies conducted.

Keywords: soil moisture, in situ monitoring, network, volumetric water content, water potential, agriculture, vegetation water stress, slope stability, Landslide hazard.

How to cite: Boquera, L.: Enhancing the Catalan Soil Moisture Observation Network  (XMS-Cat): from agricultural and climatic applications to hazard assessment.  , EGU General Assembly 2026, Vienna, Austria, 3–8 May 2026, EGU26-9319, https://doi.org/10.5194/egusphere-egu26-9319, 2026.

EGU26-12085 | ECS | PICO | HS8.3.1

Assessing Spatial Variability of Soil Moisture Across an Erosion-Prone Agricultural Hillslope  

Doğa Yahşi, Svenja Hoffmeister, Mirko Mälicke, Núria Martínez-Carreras, Jean François Iffly, and Erwin Zehe

Soil moisture is a critical state variable in hydrological systems, acting as both an initial and a boundary condition for physically based hydrological models. Its spatial and temporal variability strongly influences the partitioning of rainfall into infiltration, overland flow and subsurface runoff, which regulates the magnitude, timing and threshold behaviour of extreme events such as flash floods and soil degradation. However, the extensive and multiscale variability of soil moisture has challenged hydrological scientists for over two decades. A common approach to address this issue is to perform distributed point sampling of soil moisture and apply geostatistical methods to analyze spatial relationships and patterns, perform interpolations and provide uncertainty estimates for predictions.

In this study, we aim to quantify the spatial variability of soil moisture at the hillslope scale, as this variability is a key factor controlling hydrological responses and erosion dynamics. The research area is an agricultural hillslope in the Attert River Basin, Luxembourg, where severe erosion occurs year-round on agricultural parcels due steep slopes and extreme rainfall events. A nested cluster sampling design was implemented to cover as much area as possible and to represent a wide range of distance classes to perform geostatistical analysis.

Two soil moisture campaigns were conducted under wet and dry conditions. Soil moisture was measured at 110 cluster points using Time Domain Reflectometry (TDR), which records dielectric permittivity and converts it into volumetric water content using general onboard calibration equations, selected according to soil texture. While these factory calibrations are widely used, they can introduce errors when applied to soils with specific hydraulic properties or textures. Therefore, 15 soil samples (3 per cluster) were collected for gravimetric determination of soil moisture to validate the TDR measurements.

During both campaigns, the TDR measurements revealed a negative bias compared to the gravimetric measurements. Empirical variogram models were fitted for both datasets, with and without the data correction for the bias. The wet case, in comparison to the dry case, exhibited a shorter effective range (~145 m) and a higher nugget-to-sill ratio (~0.4), indicating weaker spatial correlation and a larger relative contribution of small-scale variability. In contrast, the dry case showed a longer effective range (~190 m) and a lower nugget-to-sill ratio (~0.3) reflecting stronger spatial organization and more coherent soil moisture patterns. These differences arise because under wet conditions, increased hydraulic connectivity and redistribution promote local-scale variability and reduce large-scale spatial organization. On the other hand, drier conditions enhance the influence of soil texture, rooting depth and evapotranspiration patterns that operate over larger spatial scales.

How to cite: Yahşi, D., Hoffmeister, S., Mälicke, M., Martínez-Carreras, N., Iffly, J. F., and Zehe, E.: Assessing Spatial Variability of Soil Moisture Across an Erosion-Prone Agricultural Hillslope , EGU General Assembly 2026, Vienna, Austria, 3–8 May 2026, EGU26-12085, https://doi.org/10.5194/egusphere-egu26-12085, 2026.

EGU26-13497 | ECS | PICO | HS8.3.1

Low-cost soil moisture monitoring: experiences from a technology transfer project for small farms  

Lorenzo Gallia, Giacomo Tavernelli, Dario Vallauri, Cristina Allisiardi, Franco Tesio, and Alessandro Casasso

The importance of irrigation water management has increased in recent years with the declining summer availability due to climate change, especially for surface waters. The diffusion of pressure irrigation systems has led to higher water efficiency exploiting a demand-based irrigation, overcoming the turn-based limitation of classical flood irrigation. GUARDIANS project (https://guardians-project.eu/), funded by the Horizon Europe program and involving 22 partners from 9 countries, has the goal to transfer this approach shift in the context of small farms, developing and demonstrating IT technologies in several study areas. One of these case studies is the irrigation reservoir of Rivoira (Boves, Piedmont, NW Italy), built in 2017 and having a capacity of 42000 m3. The reservoir is connected to a pressure irrigation network serving about 300 ha of cropfields mainly owned by small farmers.

To improve water management in the study area based on actual soil moisture readings, low-cost sensors were tested for ground-based measurement of volumetric water content (VWC). Their affordability makes them suitable for small farms, while remote data transmission enables continuous monitoring across multiple points within the same field.

These sensors, however, present several challenges. Calibration procedures that balance accuracy and simplicity are essential: for example, the choice is between calibrating each sensor or deriving a calibration formula that applies to all of them, or between calibrating sensors for each soil type or with a formula that works for all types. Furthermore, practical considerations for field installation and reliable long-term data transmission are crucial. Measurement quality must also be carefully evaluated, making sensor redundancy important to compensate for devices that may go offline or produce anomalous readings over time.

This work focuses on operational challenges and solutions adopted during calibration, installation, and data management of low-cost soil moisture sensors in the context of seven small farms. The comparison with meteorological data and recorded irrigation events makes it possible to check the performance of the sensors installed during the previous irrigation season, thereby allowing conclusions to be drawn about the reliability of sensors. In particular, the field monitoring campaign revealed similar dynamic behaviour among sensors, which correctly responded to irrigation and rainfall events; however, significant offsets in their absolute VWC values were observed. These discrepancies may be attributed to spatial heterogeneity in field VWC distribution, as well as to sensor drift over time, and deserve particular consideration.

Overall, low-cost sensors can play an important role in improving irrigation management, but several operational challenges need to be addressed to fully exploit their potential.

This study is carried out within the framework of the GUARDIANS project, funded by the European Union through the Horizon Europe Programme - Farm2Fork (Grant Agreement n. 101084468).

How to cite: Gallia, L., Tavernelli, G., Vallauri, D., Allisiardi, C., Tesio, F., and Casasso, A.: Low-cost soil moisture monitoring: experiences from a technology transfer project for small farms , EGU General Assembly 2026, Vienna, Austria, 3–8 May 2026, EGU26-13497, https://doi.org/10.5194/egusphere-egu26-13497, 2026.

EGU26-13748 | ECS | PICO | HS8.3.1

A long-term soil moisture monitoring network in Twente, the Netherlands: observations, applications, and perspectives 

Franziska Tügel, Paul Vermunt, Murat Ucer, Friso Koop, Filippo Signora, and Christiaan van der Tol

The ITC Faculty at the University of Twente operates a soil moisture monitoring network consisting of approximately 20 stations that continuously measure volumetric soil water content and soil temperature at up to five depths between 5 and 80 cm. The network was originally established in 2009; over time, several stations have been removed, while others have been added. Its initial purpose was to support the calibration and validation of satellite-based soil moisture products. Recent applications use soil moisture and groundwater monitoring to support adapted water management practices, including adjustable weirs and controlled drainage. For this purpose, supplementary soil moisture stations have been installed in smaller clusters within projects conducted in collaboration with local farmers and the regional water authority Vechtstromen. The quality-checked dataset from 2009-2020 has been published by van der Velde et al. (2023) and also added to the International Soil Moisture Network (ISMN). Furthermore, real-time and historical soil moisture data contribute to the Dutch drought portal. Recently, the soil moisture network has been integrated into the development of a larger multi-sensor infrastructure at the ITC, supported by the NWO-funded Sectorplan in Earth and Environmental Sciences.

The collected data will be analyzed to investigate long-term trends, responses to meteorological extremes, and spatial variability in soil moisture across the Twente region. Furthermore, data from soil moisture, meteorological, groundwater, and additional sensors, together with remote sensing observations, will serve as calibration and validation data for an integrated hydrological model. This framework aims to investigate the effects of local agricultural water management practices on water fluxes and water balance components, such as evapotranspiration, groundwater recharge, and surface runoff, and to scale up field-level adaptation measures and their effects to the regional scale. Insights from these investigations are expected to support the identification of sustainable and resilient water management practices from field to regional scales, helping to better cope with increasing water-related challenges such as droughts and flooding.

References: van der Velde, R., Benninga, H.-J. F., Retsios, B., Vermunt, P. C., and Salama, M. S.: Twelve years of profile soil moisture and temperature measurements in Twente, the Netherlands, Earth Syst. Sci. Data, 15, 1889–1910, https://doi.org/10.5194/essd-15-1889-2023, 2023.

How to cite: Tügel, F., Vermunt, P., Ucer, M., Koop, F., Signora, F., and van der Tol, C.: A long-term soil moisture monitoring network in Twente, the Netherlands: observations, applications, and perspectives, EGU General Assembly 2026, Vienna, Austria, 3–8 May 2026, EGU26-13748, https://doi.org/10.5194/egusphere-egu26-13748, 2026.

High-resolution soil moisture data is a critical component for understanding the hydrological cycle and establishing climate adaptation strategies, particularly in the complex mountainous terrains of the Far East Asian region. Recognizing the significance of this data within the southern part of the Korean Peninsula, the Korea Institute of Hydrological Survey operates in-situ soil moisture monitoring networks to provide standardized, high-quality hydrological data. Located in mountainous regions with long-term operational history, these networks are co-located with evapotranspiration and streamflow stations, facilitating efficient and integrated water balance studies.

To ensure high data reliability for global research applications, KIHS implements a multi-stage quality control (QC) framework for its SM datasets. We have developed an automated outlier detection system based on the International Soil Moisture Network (ISMN) protocols to identify and filter physical anomalies such as spike, break and constant values. Furthermore, to provide continuous data, KIHS utilizes a hybrid framework of statistical methods and machine learning algorithms for gap-filling. This framework integrates CDF Matching, Kalman Filter, and SARIMAX with non-linear models like Random Forest and KNN, ensuring robust and continuous time-series data even under challenging field conditions.

These high-quality datasets are shared internationally through ISMN and are highly recommended for the calibration and validation of satellite products such as SMAP and Sentinel, particularly during the non-frozen period from April to November. The objective of this presentation is to present KIHS's soil moisture monitoring networks and QC methodologies and to demonstrate the academic significance of soil moisture observation stations in the Korean Peninsula.

keywords : soil moisture, the Korea Peninsula, mountainous terrain, monitoring networks, long-term operation, QC frameworks

How to cite: Lee, Y. J., Kim, K. Y., and Kim, C. Y.: Enhancing Soil Moisture Data Reliability in South Korea: Advanced Quality Control and Ensemble Gap-filling of the KIHS Network, EGU General Assembly 2026, Vienna, Austria, 3–8 May 2026, EGU26-16168, https://doi.org/10.5194/egusphere-egu26-16168, 2026.

EGU26-18942 | ECS | PICO | HS8.3.1

Establishment of the Israeli Soil Moisture Monitoring Network 

Dotan Perlstein, Ehud Strobach, and Ori Adam

Establishment of the Israeli Soil Moisture Monitoring Network

Dotan Perlstein [a, b], Ehud Strobach [a], Daniel Kurzman [a], Ori Adam [b], Marc Perel [c] 

a Soil, Water and Environmental Sciences, Agricultural Research Organization, Rishon Letzion, Israel

b Institute of Earth Sciences, The Hebrew University, Jerusalem, Israel

c Agrometeorological Division, Israel Ministry of Agriculture

Volumetric water content in unsaturated soil is a complex state variable, highly significant to both agriculture and climate science, but until recently available only in low temporal and spatial resolution. However, recent simplified sensor technologies, advances in digital data logging and telemetry, the emergence of data‑driven analysis methods, together with increasing demand for ground‑truth observations, catalyzed the establishment of soil water monitoring networks worldwide.

Recently, one such network has been established in Israel, through collaboration between the Agricultural Research Organization, Volcani Institute and the Agrometeorological Division of the Israeli Ministry of Agriculture, integrated within the existing infrastructure of above-ground, in-situ meteorological stations. Locations for the soil monitoring stations were selected based on geographic considerations, representing all major soil types and heterogeneous climatic conditions in Israel.

At present, there are 28 operational soil monitoring stations, equipped with TDR‑based soil probes installed at four depths: 10, 30, 70, and 150 cm below ground surface, providing 10‑minute measurements of volumetric soil water content and soil temperature. To minimize disturbance‑induced bias, sensors are installed into undisturbed vertical soil faces exposed by mechanical excavation. Procedures for automated quality control, data validation and user‑interface development are currently underway.

Preliminary results are presented from several stations. For instance, the Mevo Horon station, characterized by a soil profile of mixed carbonate bedrock and rendzina soils, has accumulated more than two years of continuous observations. The data indicate that soil water content at 10 cm depth exhibited more than ten wetting–drying cycles during the 2023–2024 winter season, whereas only a single infiltration event was detectable at 30 and 70 cm depths. At 150 cm depth, soil water content showed no discernible response to the annual hydrological cycle. Diurnal soil temperature signal is clearly observed only at 10 cm depth, with the diurnal thermal wave substantially attenuated even at 30 cm depth, throughout the year.

How to cite: Perlstein, D., Strobach, E., and Adam, O.: Establishment of the Israeli Soil Moisture Monitoring Network, EGU General Assembly 2026, Vienna, Austria, 3–8 May 2026, EGU26-18942, https://doi.org/10.5194/egusphere-egu26-18942, 2026.

EGU26-20609 | ECS | PICO | HS8.3.1

Own the Data, Understand the Land: Citizens as Key Players in Soil Moisture Monitoring? 

Hannah Sachße, Daniel Diehl, Nikolaus Baumgarten, Elgin Hertel, Frederick Büks, and Björn Kluge

Climate change is increasing both the duration of dry periods and the intensity of precipitation events, yet dense, long-term soil moisture records - particularly in rural areas - remain scarce. These records are necessary to understand regional water balances, validate remote sensing data and hydrological models, and provide information for drought-resistant land management. Wassermeisterei is a citizen-led soil moisture monitoring network in the Fläming region around Potsdam and Berlin, Germany. It provides residents with low-cost sensors to continuously measure soil moisture at four depths in the topsoil and subsoil across a growing network of over 70 sites. Participants receive structured education (courses, hands-on-workshops, and online materials) and are supported to install and maintain sensors in their communities (e.g., agricultural land, grassland, gardens, forests).  A real-time LoRaWAN network feeds monitored data into a collaboratively developed, interactive public water map, making soil moisture data accessible and actionable for local communities and stakeholders. Through community building, shared data analysis, and practical resources for replication, the bottom-up citizen science project promotes local responsibility, closes observation gaps in a cost-effective manner, and potentially creates a replicable model for other soils and land use contexts. This presentation examines the integration of citizen science data into formal databases and assesses the scientific value of data from the soil moisture network. Furthermore, the possibility of using this information to improve regional climate resilience by providing data on the water balance of different land use types is explored.

How to cite: Sachße, H., Diehl, D., Baumgarten, N., Hertel, E., Büks, F., and Kluge, B.: Own the Data, Understand the Land: Citizens as Key Players in Soil Moisture Monitoring?, EGU General Assembly 2026, Vienna, Austria, 3–8 May 2026, EGU26-20609, https://doi.org/10.5194/egusphere-egu26-20609, 2026.

EGU26-21379 | ECS | PICO | HS8.3.1

Calibration Of CS655 Soil Moisture Sensors Under Sahelian Conditions: Effects Of Moisture And Temperature 

Mouhamadou Lamine Faye, Mouhamed Diedhiou, and Frédéric Do

Long-term in situ observations of soil moisture are essential to understand eco-hydrological processes, in the vadose zone and to provide ground reference for remote sensing, especially in Sahelian Africa where such datasets are poorly available. Since 2019, a dense network of time domain reflectometry sensors (CS655 model, Campbell Scientific) has been continuously monitoring soil moisture at the “Faidherbia Flux” experimental site in Sob, Senegal. The system records high-resolution data across multiple locations and depths, from 10 cm down to 480 cm.

However, these data face particular quality issues representative of sandy soils in semi-arid agroecosystems. The main challenges stem from (1) the limited accuracy of the standard Topp calibration under a narrow range of soil water content dominated by dry soil conditions (2) the influence of strong diurnal thermal fluctuations on dielectric measurement near the soil surface. High accuracy is particularly required when it is expected to process reliable modelling based on retention curves, very steep in the case of sandy soils.

To address these questions, we designed an experimental protocol combining in situ and laboratory calibrations. In situ calibration was performed during three distinct hydrological periods—dry (June), intermediate (January), and wet (October) to cover the full range of soil water natural conditions. The results revealed a strong correlation between CS655 readings and gravimetric moisture values (R² = 0.97), but also a consistent underestimation of actual soil moisture by CS655 sensor.

In the laboratory, undisturbed soil samples were collected from two depths (20 cm and 80 cm), chosen based on contrasting bulk densities likely to influence sensor response and potentially require distinct correction relationships. These samples were subjected to controlled temperature variations (from 25 °C to 45 °C) and progressive moisture levels (from 17% to 0%).  At a reference temperature of 25 °C, a relationship between the sensor readings and the actual soil moisture was first established, resulting in a correction coefficient for water content. This relationship confirmed the underestimation of soil water content by CS655 observed in the field. Then, for each moisture level, the slope of the sensor response to temperature was calculated. The average of these slopes defined a temperature correction coefficient.

Based on this two-step approach, we developed a three-variable calibration model, linking measured soil moisture, actual soil moisture, and soil temperature variations. Applying these corrections to field data significantly improved the accuracy and robustness of the CS655 readings. The systematic underestimation bias was corrected, and temperature-driven fluctuations were substantially reduced, allowing a more reliable interpretation of daily and seasonal moisture dynamics.

These findings highlight the importance of sensor calibration protocols for long-term soil moisture monitoring in our ecosystem type. Our work contributes to global efforts aimed at improving in situ networks and supporting satellite validation and hydrological modeling in arid and semi-arid regions.

How to cite: Faye, M. L., Diedhiou, M., and Do, F.: Calibration Of CS655 Soil Moisture Sensors Under Sahelian Conditions: Effects Of Moisture And Temperature, EGU General Assembly 2026, Vienna, Austria, 3–8 May 2026, EGU26-21379, https://doi.org/10.5194/egusphere-egu26-21379, 2026.

EGU26-23056 | PICO | HS8.3.1

The International Soil Moisture Network (ISMN): revised flagging strategy and AI assisted quality control 

Wolfgang Korres, Tunde Olarinoye, Dominique Mercier, and Matthias Zink

Soil moisture is a key variable influencing land–atmosphere interactions, hydrological extremes, ecosystem processes, and agricultural productivity. The International Soil Moisture Network (ISMN) provides a global, freely-accessible repository of quality-controlled in situ soil moisture observations to support Earth system science, remote sensing validation, and model development through standardized and traceable data. The ISMN compiles soil moisture time series from a wide range of regional, national, and international monitoring networks. Contributing datasets are harmonized in terms of format, metadata, and temporal resolution and subjected to a uniform, rule-based quality control (QC) procedure to ensure research-ready data.

Each observational data point undergoes thirteen plausibility checks, resulting in flagging data as “good” or “dubious”. These checks fall into three categories: (i) a geophysical range verification, identifying  thresholds exceedances (e.g., soil moisture < 0% Vol); (ii) geophysical consistency checks, comparing observations with ancillary in situ data or NASA’s GLDAS Noah model data (e.g., flagging of soil moisture when soil temperature is below 0°C); and (iii) spectrum-based approaches, using the first and second derivatives of soil moisture timeseries to detect irregular patterns such as spikes, breaks, or plateaus.

In this work, we propose targeted adaptations to the existing QC flagging strategy to reduce false positives, where valid measurements are incorrectly marked as “dubious”. These refinements increase the proportion of data points flagged as “good” by up to 15% for the entire database. Also, we are proposing the revision of several flags which are originally optimized for the validation of remote sensing products to enhance usability across broader scientific applications, while still maintaining their utility for the remote sensing community. Finally, we will introduce an AI based change detection algorithm designed to identify and potentially homogenize structural breaks and impute missing or “dubious” values in soil moisture timeseries, such as those caused by sensor replacements. This would enable the generation of longer, more consistent time series records suitable for statistically robust trend analyses.

How to cite: Korres, W., Olarinoye, T., Mercier, D., and Zink, M.: The International Soil Moisture Network (ISMN): revised flagging strategy and AI assisted quality control, EGU General Assembly 2026, Vienna, Austria, 3–8 May 2026, EGU26-23056, https://doi.org/10.5194/egusphere-egu26-23056, 2026.

EGU26-1244 | ECS | Orals | HS8.3.3

Modeling the effects of soil structure dynamics on soil hydraulic properties.  

Daria Vdovenko, Frederic Leuther, and Efstathios Diamantopoulos

Soil structure is shaped by the dynamic interaction of physical, chemical, and biological processes, functioning across a wide range of spatial and temporal scales. Alterations in soil structure can, in turn, regulate essential soil processes such as the transport and reactivity of solutes, evaporation and water fluxes, microbial activity, etc., ultimately influencing biogeochemistry in soils and ecosystem functioning. However, the majority of modern widely used predictive models do not account for these dynamics and treat soil structure and thus soil hydraulic properties (SHP) as static. Recently, Jarvis et al. introduced the USSF model, a framework designed to integrate dynamic changes in soil structure and the consequent evolution of SHP. In this contribution, we build on the hydrological component of the USSF model to enhance its flexibility and enable a more accurate representation of SHP in both the soil matrix and structural part.

The USSF model simulates soil matrix water flow using the Brooks–Corey formulation, which assumes a non-zero residual water content at oven-dry matric potentials and exhibits physically inconsistent variability in the extremely dry region of the water retention curve. The soil structural domain is represented through an empirical macropore model with fixed boundaries of the structural pore size distribution. We introduce a more flexible and physically consistent description of matrix SHP based on the Brunswick model, coupled with a fracture-domain hydraulic formulation derived from the Tuller-Or model to represent structural pore flow.

The extended model was evaluated for two contrasting agricultural management strategies: direct seeding (DS) and conventional tillage (CT), with both systems initialized using a 10-year conventional tillage warm-up period. For both systems, soil organic matter was the primary driver of long-term porosity dynamics, with the direct seeding system reaching equilibrium within 10 years in the former plough layer, at 0-25 cm depth. The simulated SHP profiles aligned with published data, capturing a transient post-tillage increase in saturated hydraulic conductivity (Ksat) under CT, followed by rapid structural settling. Under DS temporal Ksat variability was lower. The Ksat depth profile within the plough layer remained vertically uniform in CT, whereas DS showed a systematic decline of Ksat with depth. The model enables realistic reconstruction of how agricultural operations will affect structural porosity and SHP. Future development will couple the extended model with a broader soil-crop-atmosphere system model and focus on improving the process description, particularly regarding seasonal dynamics.

How to cite: Vdovenko, D., Leuther, F., and Diamantopoulos, E.: Modeling the effects of soil structure dynamics on soil hydraulic properties. , EGU General Assembly 2026, Vienna, Austria, 3–8 May 2026, EGU26-1244, https://doi.org/10.5194/egusphere-egu26-1244, 2026.

EGU26-1723 | ECS | Orals | HS8.3.3

Modeling PFAS transport through the vadose zone – a comparison of model codes for column and field-scale experiments 

Valerie de Rijk, Stefanie Lutz, and Jasper Griffioen

Predicting transport of per- and polyfluoroalkyl substances (PFAS) through the vadose zone is essential for contamination risk assessment, yet the reliability of available models remains poorly understood. This study compared five available models by exploring their conceptual and technical differences, and assessing the alignment of model capabilities against current theoretical understanding of reactive transport of PFAS. We evaluated predictive performance by forward modeling two column experiments and conducting one virtual field-scale simulation across different PFAS compounds and soil types. While all models agreed well with short-term column experiments (NSE ≥ 0.82), they diverged substantially at field-scale, with mid-point breakthrough times differing by multiple years despite identical parameterization.
Quantification of the air-water interface (AWI) emerged as the primary source of inter-model variability and remains the most disputed aspect in theoretical reactive transport understanding of PFAS transport. Existing approaches compute systematically different AWI values as functions of saturation and soil physical parameters, whilst likely underestimating the interfacial area by neglecting surface roughness of grains and pore-scale complexity.
All examined models employ simplified and empirically-derived solid-phase sorption parameters that do not account for soil-specific behavior, solution chemistry, and soil heterogeneity. Important processes including precursor transformation, competitive sorption, and desorption hysteresis remain largely unimplemented, fundamentally constraining predictive reliability. Hence, comprehensive multi-year field validation datasets across diverse hydrogeological settings are urgently needed to quantify prediction uncertainty and establish robust parameterization strategies.

How to cite: de Rijk, V., Lutz, S., and Griffioen, J.: Modeling PFAS transport through the vadose zone – a comparison of model codes for column and field-scale experiments, EGU General Assembly 2026, Vienna, Austria, 3–8 May 2026, EGU26-1723, https://doi.org/10.5194/egusphere-egu26-1723, 2026.

EGU26-3586 | ECS | Orals | HS8.3.3

Geophysical Monitoring of Oak Trees in a Marsh-Forest Upland Transect 

Donald Pesonen, Raymond Hess, Christopher Terra, Lee Slater, Keryn Gedan, and Holly Michael

Flooding and subsequent saltwater intrusion from rising sea levels pose significant concerns for shore-front areas, particularly agricultural lowlands and coastal forests. Changes in soil salinity, driven by both vertical infiltration from high tides and lateral seawater intrusion from storm surges, are documented to produce ghost forests and render agricultural soils unsuitable for cultivation. This study explores the sensitivity of geophysical methods to the exchange of water between trees and soil in white oak (Quercus alba) trees on the upper Delmarva Peninsula. High-frequency ground-penetrating radar (GPR) was employed to image root structures, identifying the depth of highest root density at approximately 0.3 m. This data provided critical geometry for Hydrus-1D evapotranspiration models. Small-scale 3D time-lapse electrical resistivity tomography (ERT) can be used to image the root zone and base of the trees. Initial work with ERT shows variability in the rainfall infiltration patterns but there are issues regarding sensitivity at the base of the tree. To assess tree physiology, vertical arrays of true self-potential (SP) non-polarizing electrodes were installed on tree trunks; SP measurements are a passive electrical method typically used in soil to measure streaming potential which is voltage values which are generated by the movement of water through porous media or capillary action. There have been attempts to use SP electrodes on trees before but the information has been ambiguous as a result of polarization effects as proper SP electrodes were not used, leading to misinterpreted data. The SP electrodes are deployed alongside more traditional sap flow sensors for validation of the collected data. In instances where in-situ sap flux data were unavailable, transpiration rates modeled using Hydrus-1D were utilized as a proxy of sap flux values. Wavelet analysis of the SP data revealed distinct diurnal cycles with strong 24-hour peaks that correlated with both the available sap flow measurements and the modeled transpiration. These results confirm that SP is a viable proxy for monitoring soil-tree moisture dynamics. This strategy may offer a novel framework for monitoring tree health and verifying subsurface water dynamics in coastal ecosystems threatened by saltwater intrusion.

How to cite: Pesonen, D., Hess, R., Terra, C., Slater, L., Gedan, K., and Michael, H.: Geophysical Monitoring of Oak Trees in a Marsh-Forest Upland Transect, EGU General Assembly 2026, Vienna, Austria, 3–8 May 2026, EGU26-3586, https://doi.org/10.5194/egusphere-egu26-3586, 2026.

The SWIM² framework (Hendrickx et al., 2025) integrates a soil water balance model with in situ sensor data and soil moisture samples through Bayesian inverse modelling. The calibrated model then generates probabilistic 10-day soil moisture forecasts, enabling real-time, site-specific irrigation advice. SWIM² was validated in a real-time setup for 18 vegetable cropping cycles on agricultural fields in Flanders, Belgium, with reliable precipitation data. Although using minimal prior knowledge and despite sensor bias, SWIM² achieves robust soil moisture predictions for a 7-day horizon, with accuracies comparable to sensor measurements. We also assessed the impact of model parameter and weather forecast uncertainty on SM prediction uncertainty, water stress prediction and irrigation advice by integrating the calibrated model ensemble with ensemble-based probabilistic weather forecasts, resulting in high detection rate and accuracy in predicting water stress triggering the irrigation threshold.

Time series of vegetation indices such as NDVI and LAI from Sentinel-2 optical remote sensing as well as LST from Sentinel-3 contain much information on crop growth and crop evapotranspiration. Additionally, the new NISAR mission is promising for high-resolution surface soil moisture observations. We assess relations between in situ measurements and model outputs (crop growth curve, actual ET and SWC), and the remote sensing data, and we discuss opportunities of these data to improve soil moisture and ETa predictions.

Reference: Hendrickx, M.G.A., Vanderborght, J., Janssens, P., Laloy, E., Bombeke, S., Matthyssen, E., Waverijn, A., Diels, J. (2025). Field-scale soil moisture predictions in real time using in situ sensor measurements in an inverse modeling framework: SWIM². Authorea Preprints, doi:10.22541/ESSOAR.175103915.57413983/V1.

How to cite: Hendrickx, M., Vanderborght, J., Janssens, P., and Diels, J.: Probabilistic soil moisture predictions at field scale using in situ data in a Bayesian inverse modelling framework SWIM² and the potential of remote sensing, EGU General Assembly 2026, Vienna, Austria, 3–8 May 2026, EGU26-4996, https://doi.org/10.5194/egusphere-egu26-4996, 2026.

EGU26-5226 | Orals | HS8.3.3

Effect of Surfactants on the Transport and Availability of Plant Growth-Promoting Bacteria in Soil. 

Haileslassie Gebregergs Kiros and Gilboa Arye

Plant growth-promoting bacteria (PGPB) are vital for sustainable agriculture as they mobilize key nutrients, boost stress tolerance, and encourage plant growth. Despite their benefits, delivering PGPB effectively into soil is challenging due to strong bacterial adsorption, limited movement, and variable soil conditions that hinder bacterial mobility and decrease bioavailability in the rhizosphere. Consequently, inoculated bacteria often stay near the application site and struggle to colonize roots effectively. Surfactants have shown potential in improving microbial transport through porous media by altering bacterial–soil and water–soil surface interactions. They lower surface tension and modify electrostatic and hydrophobic forces, reducing bacterial attachment to soil particles and facilitating cell detachment and movement. This research investigates how surfactants (Triton-100, rhamnolipid, and Tween-80) influence the mobility of two model PGPB, Azospirillum brasilense and Bacillus subtilis, in soil columns. It also assesses surfactants toxicity through standardized growth inhibition tests. Toxicity testing revealed that Tween-80 is non-inhibitory. Bacterial transport experiments were conducted in packed soil columns under controlled hydraulic conditions, both with and without surfactant, and bacterial breakthrough curves (BTCs) were generated by continuously monitoring bacterial concentrations in the column influent and effluent as a function of pore volumes to quantify transport behavior. Tween-80 improved bacterial breakthrough and decreased the bacteria deposition rate compared to controls, demonstrating enhanced bacterial transport. These findings suggest that non-toxic surfactants can significantly improve PGPB mobility, offering a promising approach for effective microbial inoculation in sustainable farming. 

How to cite: Kiros, H. G. and Arye, G.: Effect of Surfactants on the Transport and Availability of Plant Growth-Promoting Bacteria in Soil., EGU General Assembly 2026, Vienna, Austria, 3–8 May 2026, EGU26-5226, https://doi.org/10.5194/egusphere-egu26-5226, 2026.

EGU26-5527 | ECS | Orals | HS8.3.3

How soil moisture and flow regime drive microplastic transport in the vadose zone: insight from modelling and column experiments 

Lizeth Cardoza-Pedroza, Laurent Lassabatére, Brice Mourier, and Laurence Volatier

Despite the well-known influence of hydrological conditions within the vadose zone on Micro and nano plastic (MnPs) transport, the effect of soil moisture and flow regime remain poorly understood, since most studies have been conducted under saturated conditions.

In this study, we combined laboratory column experiments with numerical modelling to investigate the MnPs transport in gravel soils under contrasting saturation conditions and two flow regimes (steady vs transient). We used commercial 1µm Polystyrene (PS) fluorescent spherical particles in coarse granular media, under both saturated and unsaturated conditions. The chosen material is representative of some parts (lithofacies) of the glaciofluvial deposits exploited for drinking water supply in the region of Lyon. Unsaturated experiments were conducted at different initial soil moisture contents (from 8% to 52%) and under steady and transient flow regimes to assess the influence of the flow hydrodynamics on the MnPs transport. The PS effluent concentration at the column outlets was determined by using fluorescence spectrophotometry, while conservative tracer experiments were used to constrain flow and transport parameters.

Under saturated conditions, transport was highly reproducible, with an average MnPs recovery of 85%, a maximum relative concentration of 0.11, a peak breakthrough arriving at 0.79 pore volumes (PV). In contrast, unsaturated conditions showed bigger variability, with recovery rates ranging from 44-98%, maximum relative concentrations from 0.07 to 0.25 and peak breakthrough occurring between 0.59 and 1.13 PV, depending on experimental conditions. Numerical models using Hydrus reproduced the observed differences and showed differences in water fractions characterised by the tracer. These finding emphasize the need to account for the vadose zone-specific flows and sorption air-water dynamics when assessing the fate of microplastics and the potential impacts on groundwater quality. This study demonstrates the crucial roles of specific flow conditions and air–water interfacial sorption in controlling microplastic transport within the vadose zone, with important implications for groundwater vulnerability assessments and for interpreting spatiotemporal variations in groundwater microplastic concentrations.


This project has received funding from European Union’s HORIZON EUROPE research and innovation program GA N°101072777-PlasticUnderground HEUR-MSCA-2021-DN-01


How to cite: Cardoza-Pedroza, L., Lassabatére, L., Mourier, B., and Volatier, L.: How soil moisture and flow regime drive microplastic transport in the vadose zone: insight from modelling and column experiments, EGU General Assembly 2026, Vienna, Austria, 3–8 May 2026, EGU26-5527, https://doi.org/10.5194/egusphere-egu26-5527, 2026.

EGU26-6956 | Orals | HS8.3.3

A New Fast in-Situ Soil Hydraulic Characterization Method Combining 2D Soil Water Flow Modelling and Time-Domain Reflectometry 

Antonio Coppola, Shawkat Basel Mostafa Hassan, Giovanna Dragonetti, and Alessandro Comegna

Soil hydraulic behavior is fundamental for determining water flow dynamics within the soil–plant–atmosphere continuum. Soil Hydraulic Properties, SHP, govern essential processes, including soil water storage within the root zone and the entire soil profile, evapotranspiration, plant water and nutrient uptake, runoff generation, deep percolation, groundwater recharge, as well as the transport of solutes and contaminants. There are several laboratory and field methods to characterize SHP. Laboratory measurements are generally more straightforward than field tests. However, their reliability depends on the selection of sample sizes that adequately represent the present heterogeneity in natural soils. In-situ methods for determining SHP are often labor-intensive and time-consuming due to the need for detailed spatial and temporal data. Because SHP exhibit significant spatial variability, many measurements are required to accurately characterize the SHP. This variability highlights the need for faster and more efficient methods to characterize SHP across multiple sites. This study proposes a fast in-situ method for SHP characterization called TDR-2D. It combines Time-Domain Reflectometry (TDR) with soil water modelling in a wetted bulb under a dripper. The TDR-2D method was simultaneously applied to multiple sites across an experimental field to estimate their SHP. The same sites were characterized using the Tension Infiltrometer Method, TIM. The soil hydraulic parameters estimated by TDR-2D were evaluated by comparing them to those obtained by TIM. Parameter correlation matrices were employed to assess uncertainty in parameter estimation. An additional sensitivity analysis was conducted to evaluate the influence of different dripper nominal flow rates (2, 4, and 6 l/h) on parameter estimation. The results indicate that the TDR-2D method reliably estimates soil water retention parameters across all tested flow rates. Estimation of the saturated hydraulic conductivity (K0) was particularly accurate at flow rates of 2 and 4 l/h whereas accuracy declined at 6 l/h. Furthermore, model output sensitivity to soil hydraulic parameters decreased with increasing dripper flow rate. Overall, for the soils investigated, the findings suggest that the TDR-2D method performs optimally at a nominal flow rate of 4 l/h, providing accurate SHP estimates while minimizing parameter uncertainty. Since the TDR-2D and TIM methods yield Russo–Gardner (RG) and van Genuchten–Mualem (vGM) parameters, respectively, direct comparison required conversion between the two parameter sets. The results demonstrate that conversion from vGM to RG parameters is generally feasible, whereas the reverse conversion is less straightforward and should be approached with caution.

How to cite: Coppola, A., Hassan, S. B. M., Dragonetti, G., and Comegna, A.: A New Fast in-Situ Soil Hydraulic Characterization Method Combining 2D Soil Water Flow Modelling and Time-Domain Reflectometry, EGU General Assembly 2026, Vienna, Austria, 3–8 May 2026, EGU26-6956, https://doi.org/10.5194/egusphere-egu26-6956, 2026.

EGU26-7146 | ECS | Posters on site | HS8.3.3

Analytical and Invertible Model for Transient Heat Transport in Layered Subsurface Media 

Vishal Bashist, Ratan Sarmah, and Ickkshaanshu Sonkar

 Abstract

Accurate characterization of transient heat transport in layered subsurface media is fundamental to a wide range of environmental and hydrological applications, including groundwater recharge assessment, land-atmosphere interaction analysis, and climate signal detection in soils. This study presents a fully analytical solution for one-dimensional transient heat transfer in a two-layer soil system subjected to realistic, time-dependent surface temperature forcing associated with diurnal variations. The governing advection-conduction equation is solved using the Generalized Integral Transform Technique, which enables an exact treatment of interlayer thermal interactions while avoiding numerical inversion or interface-matching complexities. The resulting formulation yields a computationally efficient and stable solution that is well suited for both forward simulation and inverse analysis. The analytical solution is rigorously validated through comparison with high-resolution numerical simulations, demonstrating excellent agreement for both homogeneous and stratified soil configurations over a wide range of hydrothermal conditions. The inverse modeling capability of the framework is further demonstrated by coupling the analytical solution with a genetic algorithm to estimate vertical water flux from field-measured temperature data, highlighting its potential for non-invasive hydrological characterization. This work introduces a scalable, computationally efficient, and physically consistent framework for simulating and interpreting transient heat transport in layered subsurface systems. Owing to its generality, the proposed methodology is readily extendable to other diffusion-dominated transport processes, such as solute transport in stratified geological media, thereby enhancing its applicability across a broad range of geoscientific problems.

Keywords: Transient heat transport, Layered subsurface media, Analytical solution, Generalized Integral Transform Technique, Inverse modelling

How to cite: Bashist, V., Sarmah, R., and Sonkar, I.: Analytical and Invertible Model for Transient Heat Transport in Layered Subsurface Media, EGU General Assembly 2026, Vienna, Austria, 3–8 May 2026, EGU26-7146, https://doi.org/10.5194/egusphere-egu26-7146, 2026.

EGU26-7207 | ECS | Orals | HS8.3.3

Influence of Nano biochar on the fate and transport of chlorpyrifos 

Monika and Ickkshaanshu Sonkar

Geochemical aging can alter the chemical structure of biochar (BC), resulting in the release of nano sized BC (ranging from 200 nm to 500 nm).  Although, several studies have revealed the adsorption and immobilization of pesticides on BC, little is known regarding the mobility and retention of pesticides sorbed on nano particles. Thus, column tests were conducted to investigate organophosphate pesticide (chlorpyrifos) transport using nano biochar (NBC) as amended in sand column and use Hydrus 1D model to simulate the result. The findings demonstrated that NBC amended sand increased chlorpyrifos retention by 60% to 70% when nanoparticles were incorporated. Additionally, the chlorpyrifos simulated kd value (sorption coefficient) increased from 1.64 L/g to 2.10 L/g. Also, the proportion of equilibrium adsorption sites (f) decreased from 0.25 to 6.78 ×10⁻⁶ after amendment. This study shows that Nanoparticles maximizes the efficiency of biochar in controlling environmental pollution by improving its adsorption capacities and modulating its ability to prevent pesticide migration to groundwater.

Keywords: Organophosphate transport, HYDRUS-1D, soil column, non-equilibrium equation, adsorption

How to cite: Monika, and Sonkar, I.: Influence of Nano biochar on the fate and transport of chlorpyrifos, EGU General Assembly 2026, Vienna, Austria, 3–8 May 2026, EGU26-7207, https://doi.org/10.5194/egusphere-egu26-7207, 2026.

EGU26-7930 | ECS | Posters on site | HS8.3.3

Impact of irrigation forcing on parameter estimation of 1-D Richards equation 

Anoop Pandey and Richa Ojha

In irrigated agricultural regions, remotely sensed soil moisture and evapotranspiration data are widely used to calibrate unsaturated zone models, specifically those employing the Richards equation and van Genuchten-Mualem (VG) relationships. However, this often leads to a critical forcing-observation mismatch. While remote sensing products capture both rainfall and irrigation signatures, standard meteorological datasets typically include only rainfall. Calibrating models against irrigation-influenced observations without accounting for irrigation as an input flux is likely to introduce significant parameter bias. The present study attempts to analyze this effect for an experimental site at IIT Kanpur during a wheat growing season. Subplot specific leaf area index, root zone depth, irrigation amounts, and rainfall were recorded separately for four subplots. Soil moisture and water retention curves were measured at 10, 25, 50, and 80 cm depths covering root zone of these subplots. Meteorological variables from an onsite automatic weather station were used to estimate crop evapotranspiration. For analysis, two calibration schemes that minimize root zone soil moisture simulation errors were formulated, a) RET: considers rainfall as the input flux (ignoring irrigation) along with evapotranspiration, and b) RIET: considers both rainfall and irrigation fluxes along with evapotranspiration. Four VG-parameters (θs, α, n, and Ks) were calibrated using mean soil moisture (µθ) and evapotranspiration data within a genetic algorithm framework. The analysis was further extended to (µθ-σ) and (µθ+σ) dataset to analyze the performance of the proposed framework in identifying the parameters with drier and wetter soil moisture data, respectively. The RIET scheme yields substantially lower relative errors than RET for Ks (~36% compared to ~66%), n (~4.7% compared to ~5.9%), and θs(~9.2% compared to ~17.7%), whereas both schemes achieve comparable high accuracy for α (~1–2% relative error). Soil moisture estimates obtained using the optimal parameters from the RIET scheme exhibit 2 to 3 times lower RMSE compared to those from the RET scheme. These findings underscore the need for considering irrigation in model forcing during calibration for reliable parameter estimation.

How to cite: Pandey, A. and Ojha, R.: Impact of irrigation forcing on parameter estimation of 1-D Richards equation, EGU General Assembly 2026, Vienna, Austria, 3–8 May 2026, EGU26-7930, https://doi.org/10.5194/egusphere-egu26-7930, 2026.

EGU26-7956 | Posters on site | HS8.3.3

Rethinking Green Infrastructure Performance: PMT removal in GAC-Amended Column Experiments under Extreme Operating Conditions 

Jiaqi Xu, Sergi Badia, Giuseppe Brunetti, Jordi Cama, and Marc Teixido

Rapid urbanization has expanded impervious surfaces, enhancing pollutant buildup and the transport of Persistent Mobile (PMT) substances through stormwater runoff. Green infrastructure, which is designed for flood mitigation and aquifer recharge, can inadvertently transfer polar contaminants into the soil–groundwater systems. As climate change drives more intense storms, measurements of higher-throughput stormwater are necessary.  Understanding their limits in removing dissolved PMTs and metals is essential to improve current mitigation strategies.

To investigate these hydraulic and geochemical performance constraints, we conducted a series of controlled fixed-bed column experiments simulating diverse green infrastructure operating conditions. Different PMT loadings, adsorbent dosage, competitive interactions with co-solutes (dissolved metals and dissolved organic matter, DOM) under three infiltration-rate regimes (4.5 – 25.5 cm·h-1) were tested. Columns were packed with a mixture of sandy-loam soil and granular activated carbon (0.5, 2, and 5 %wt.; (GAC) to evaluate the breakthrough behaviour and adsorption capacity towards 8 representative PMTs with different physicochemical molecular properties. Our preliminary results show that at high flow rates, associated with low residence times, substantially decrease adsorption performance, particularly under high inorganic contaminant loads with DOM. Although the 5% GAC amendment achieved the highest overall removal capacity towards the studied PMTs regardless experimental conditions, it also introduces hydraulic limitations, producing pronounced tailing effect driven by micropore diffusion and extended intra-particle residence times.

To interpret the observations from experiments, HYDRUS will be applied to simulate reactive solute transport, enabling inverse calibration of hydraulic properties and solute transport parameters from column breakthrough data. Subsequently, HYDRUS-derived parameters, together with experimental variables, will be integrated into a machine learning framework to identify key removal predictors, and forecast the removal of challenging PMTs under different stormwater conditions.

How to cite: Xu, J., Badia, S., Brunetti, G., Cama, J., and Teixido, M.: Rethinking Green Infrastructure Performance: PMT removal in GAC-Amended Column Experiments under Extreme Operating Conditions, EGU General Assembly 2026, Vienna, Austria, 3–8 May 2026, EGU26-7956, https://doi.org/10.5194/egusphere-egu26-7956, 2026.

EGU26-8318 | Posters on site | HS8.3.3

Particle tracking in time-dependent two-phase flows 

Tomas Aquino and Gaute Linga

Describing the transport of nutrients and contaminants as well as temperature and other scalars in hydrogeological systems presents both computational and modeling challenges due to the heterogeneity of the media themselves, of the resulting flows, and of the flowing phase distributions. Random walk particle tracking methods involve discretizing transported plumes into point masses that undergo random motion, such that the probability density of particle positions corresponds to the concentration field that typical grid-based Eulerian methods solve for. Particle tracking methods for transport are not affected by the instabilities that Eulerian methods are prone to in advection-dominated systems, and they mitigate numerical dispersion because they do not implicitly homogenize concentrations over an underlying grid.  From a computational standpoint, since particles represent possible physical trajectories, computational power is naturally localized where mass is present, and locally-adaptive time steps can be employed. These reasons mean particle tracking methods are well suited for resolving plume structures for scalar concentration fields that are relatively localized in space but exhibit complex structure.

So far, the application of random walk particle tracking methods to heterogeneous media has been mainly restricted to time-independent conditions. In the presence of more than one fluid phase, such as air and water, if a chemical species is restricted to a specific phase, moving phase configurations lead to moving interfaces that present challenges for particle tracking. We propose an extension of particle tracking methods to fully time-dependent, two-phase flow conditions, where the restriction of a transported species to one of the fluid phases is handled through the application of a chemical potential that takes a lower value in the carrier phase. Particles feel an effective drift near the fluid-fluid interface that is proportional to the potential difference between the two phases, leading to a concentration ratio that follows Henry's law at equilibrium. By increasing this potential difference, the amount of mass that crosses the interface can be made arbitrarily small. This formulation avoid explicit reconstruction of phase boundaries and does not require direct computation of particle reflection at fluid-fluid interfaces. We illustrate the application of the method to the simulation of solute fronts in heterogeneous media under two-phase-flow conditions where the solute is restricted to a single phase, and we discuss the possibility of extending the method to more complex interactions between the transported scalar and the fluid-fluid interface.

How to cite: Aquino, T. and Linga, G.: Particle tracking in time-dependent two-phase flows, EGU General Assembly 2026, Vienna, Austria, 3–8 May 2026, EGU26-8318, https://doi.org/10.5194/egusphere-egu26-8318, 2026.

EGU26-9247 | ECS | Posters on site | HS8.3.3

Effects of Flow Rate and Initial Saturation on Solute Transport and Flow Dynamics in Fractured Chalk 

Hanane Ougazdamou, Ofra Klein-BenDavid, Natalie De Falco, and Noam Weisbrod

Flow and transport in fractured systems are a major challenge in understanding contaminant transport in the vadose zone. Chalk, a carbonate rock, is characterized by a high porosity and very low hydraulic conductivity. However, this rock can be intersected by fractures that may act as highly permeable pathways that dominate the migration of water, solutes, and particulate matter.  Unsaturated conditions further introduce additional complexities, as chalk systems are characterized by heterogeneity, capillary effects, and changes in saturation. Despite significant progress in this field, our understanding of the interaction between transport processes and dynamic flow behavior at different initial water saturation and across different flow rates remains limited. Therefore, this work studies the transport and dynamics of a dyed conservative tracer in a fractured chalk system under two saturation conditions (98% and 40%) and at two flow rates (0.1 and 1.1 mL/min). Laboratory experiments were conducted using a novel system containing a half-cylindrical fractured chalk core, drilled from the Eocene-age Avdat Group (northwestern Negev Desert), with a 5 mm artificial vertical fracture and a transparent wall enabling direct visualization of flow patterns. Time-lapse images of the tracer migration along the fracture surface were acquired using a digital camera, and flow and transport behavior were investigated under controlled laboratory conditions using a combination of traditional breakthrough curves (BTCs) and time-resolved image processing in Python to characterize tracer movement along the fracture surface.

Results show that, under near-saturated conditions, the flow rate has no effect on the mass balance: the recovered mass is similar at both low and high flow rates, with an average of 51%. BTCs obtained under these conditions show early tracer arrival and a higher peak at both flow rates. However, the effect of initial saturation level at low flow rate is observed: the average recovered mass under near-saturated conditions is approximately 2.5 times higher than under unsaturated conditions, where the BTCs show delayed tracer arrival and lower peak concentrations. Image-based analysis indicates that increasing the flow rate from 0.1 mL/min to 1.1 mL/min at near-saturated conditions significantly affects the tracer distribution on the fracture surface. At low rates, narrow channels covering ~20% of the fracture surface developed. However, at higher rates, flow channels covered ~50% of the fracture surface. Under unsaturated conditions (low rate), the flow is characterized by an initial wetting front, followed by the formation of channels that cover up to 20% of the fracture surface.

How to cite: Ougazdamou, H., Klein-BenDavid, O., De Falco, N., and Weisbrod, N.: Effects of Flow Rate and Initial Saturation on Solute Transport and Flow Dynamics in Fractured Chalk, EGU General Assembly 2026, Vienna, Austria, 3–8 May 2026, EGU26-9247, https://doi.org/10.5194/egusphere-egu26-9247, 2026.

EGU26-10088 | Orals | HS8.3.3

Beyond Accuracy: Can Physics-Informed Neural Networks Reproduce Root-Zone Soil Moisture Memory? 

Mehdi Rahmati, Wenxiang Song, Carsten Montzka, Jan Vanderborght, and Harry Vereecken

Soil moisture memory (SMM) is a primary driver of land-atmosphere coupling, hydrological predictability, and the response of ecosystems to climate variability. Although machine learning-based algorithms have recently been shown to predict soil moisture with a high degree of accuracy, it is unclear whether these models can predict SMM and SMR effectively. In this study, we assess whether better state estimation results in enhanced representation of SMM. To achieve this, we use six years (2013–2018) of daily grassland lysimeter observations from Rollesbroich, Germany (50°37'12" N, 6°18'15" E), including multi-depth soil moisture (10, 30, and 50 cm), through which a depth-averaged root-zone soil moisture is calculated (see Figure 1). In addition to the observational data, we also estimated soil moisture at different depths and then computed root zone soil moisture according to the upper and lower boundary fluxes (i.e., precipitation, drainage, and actual evapotranspiration), using two modelling methodologies: (i) a physics-based Richards equation model (HYDRUS-1D, calibrated against observations) and (ii) a physics-informed neural network (PINN), which was trained on the same dataset (see Figure 1). We analyze, then, the SMM structure in the simulated and observed time series using a Linear Integro-Differential Equations (LIDE) framework, which quantifies the accumulation of memory at different timescales, e.g., fast memory (τF), slow memory with short-term (τS), intermediate (τI), and long-term (τL) components, and memory saturation timescale (τ). The results show that the PINN model is much more accurate than the HYDRUS-1D model at simulating observed soil moisture states (root mean square error, RMSE = 0.003 vs 0.018; Nash-Sutcliffe Efficiency, NSE = 0.997 vs 0.881). However, the fast memory timescale (τF) is slightly underpredicted by PINN (with τF ~ 4.5 days) and is slightly better approximated by HYDRUS-1D (with τF ~ 5.9 days) compared to observations (with τF ~ 7.6 days), reflecting stronger physical damping in HYDRUS-1D. While the short-term slow-memory timescale (τS) could not be identified using either measured or modeled data, the intermediate slow-memory timescale (τI) of measured data (with τI ≈ 4 months) could be robustly recovered using either model. The long-term slow-memory timescale (τL) and the saturation timescale (τ) are, respectively, underestimated and overestimated by the PINN (with τL ~ 9 months and τ~ 10.6 years), resulting in weaker persistence and a narrower window for re-emergence compared to the observed values (with τL ~ 9.5 months and τ~ 8.96 years). In contrast, HYDRUS-1D better resolves the long-term memory dynamics (with τL ~ 9.7 months and τ~ 8.26 years). These findings highlight that strong prediction skills for state variables do not necessarily equate to a good representation of their hidden memory structure.  According to these results, we suggest that memory-based diagnostics can probably serve as a complementary indicator to analyze the performance of simulated soil moisture dynamics alongside traditional performance measures and can provide a critical benchmark for evaluating physics-based and machine learning hydrological models.

How to cite: Rahmati, M., Song, W., Montzka, C., Vanderborght, J., and Vereecken, H.: Beyond Accuracy: Can Physics-Informed Neural Networks Reproduce Root-Zone Soil Moisture Memory?, EGU General Assembly 2026, Vienna, Austria, 3–8 May 2026, EGU26-10088, https://doi.org/10.5194/egusphere-egu26-10088, 2026.

EGU26-10216 | Orals | HS8.3.3

It’s time to start tuning for deserts! 

Nurit Agam, Dilia Kool, and Nadav Bekin

Twenty-seven percent of the world’s terrestrial area is classified as arid or hyper-arid, regions that are second only to oceans in the sparsity of measurement sites. Contrary to popular perception, these desert areas are dynamic ecosystems that respond sensitively to changes in water availability, temperature, and carbon dioxide levels. Efforts to understand the dynamics and feedback mechanisms between the main players affecting desert weather and climate can be divided, by-and-large, into two groups: (1) addressing the most pressing knowledge gaps of desert weather and climate systems; and (2) exploring processes that have not previously been considered but are hypothesized to be more important than presumed, representing a realm of "unknown unknowns". One example to the “unknown unknowns” realm is related to non-rainfall water inputs (i.e., fog, dew, and atmospheric water vapor adsorption). Traveling between the Negev, Namib, and Sahara deserts, we will look into this largely overlooked phenomenon. We will point to the similarities between these deserts and ask how widespread this phenomenon may be and why should we care.

How to cite: Agam, N., Kool, D., and Bekin, N.: It’s time to start tuning for deserts!, EGU General Assembly 2026, Vienna, Austria, 3–8 May 2026, EGU26-10216, https://doi.org/10.5194/egusphere-egu26-10216, 2026.

EGU26-10402 | ECS | Posters on site | HS8.3.3

A Regime-Based Framework for Understanding the Dominant Mechanisms of Flow in Heterogeneous Agricultural Soils 

Uma maheswara rao Songa and Richa Ojha

Soil moisture dynamics in unsaturated soils of agricultural fields are driven by the complex interplay of hydraulic heterogeneity, root water uptake (RWU), and atmospheric forcing; however, the specific conditions under which each process becomes dominant are not yet fully understood. We propose a regime-based framework to identify the dominant flow mechanisms in an agricultural field, using the wheat cropping season as a primary case study. For this, 3-D Richard’s equation simulations were performed for silty loam soil, considering crop-specific data and atmospheric conditions from an experimental site at IIT Kanpur. Simulations comparing homogeneous and heterogeneous soil profiles (spatial heterogeneity in van Genuchten parameters, Ks  and α) reveal that near-surface layers (10–25 cm) exhibit higher early-season variability and faster post-irrigation responses than deeper layers (50 cm), with heterogeneity effects diminishing over depth and time. Sensitivity profiles based on the ratio of RWU to vertical flux divergence indicate stronger near surface control, with values close to one during irrigation periods and declining with depth, reflecting reduced influence of vertical flux divergence in deeper soil. Variance-based dominance diagnostics, evaluated against variability in both  and , reveal a distinct transition in governing processes. As the ratio of soil moisture variance to heterogeneity variance decreases from approximately 0.30 near the surface during early growth to below 0.15 at greater depths and later stages, the system shifts from a heterogeneity-dominated behavior to an RWU-dominated regime. Collectively, these diagnostics categorize the subsurface into four distinct regimes: heterogeneity-dominated, RWU-dominated, atmospheric demand-dominated, and transition zones. This classification provides a physically interpretable framework for analyzing process dominance and refining model selection in structured agricultural soils.

How to cite: Songa, U. M. R. and Ojha, R.: A Regime-Based Framework for Understanding the Dominant Mechanisms of Flow in Heterogeneous Agricultural Soils, EGU General Assembly 2026, Vienna, Austria, 3–8 May 2026, EGU26-10402, https://doi.org/10.5194/egusphere-egu26-10402, 2026.

EGU26-11083 | ECS | Orals | HS8.3.3

Can AH-DTS detect wetting front movement in soil columns during rainfall events? First impressions from experimental investigations 

Luis Bertotto, Alan Reis, Elias Neto, Cristina Tsuha, Edson Wendland, and Olivier Bour

Actively heated distributed temperature sensing (AH-DTS) has been widely applied for soil moisture monitoring over distances ranging from a few centimeters to several hundred meters; however, few studies have explored this method for investigating transient soil water behavior during rainfall events.

Here, a soil column (75 cm high and 30 cm in diameter) was constructed in the laboratory, where an active fiber-optic cable was helically wrapped around a central supporting element with a 5-cm bending radius. Repacked sandy clay loam soil filled the column with three compaction levels: loose (1.35 g cm-3, 0–25 cm), medium (1.44 g cm-3, 25–50 cm), and dense (1.51 g cm-3, 50–75 cm). Sprinkler nozzles simulated a rainfall event of 40 mm hr-1 lasting 4 hours in the soil profile, during which the fiber-optic cable was continuously heated with a power input of 5 W m-1. A DTS unit collected temperature data at a vertical sampling resolution of 1.25 cm, while 14 soil moisture sensors regularly distributed throughout the column measured changes in soil water content.

The results showed that wetting front arrival at different soil depths was detected by the fiber-optic as cooling pulses. The magnitude and temporal stability of the cooling were inversely related to soil depth and bulk density. From the moment the front was detected, the superficial soil layer exhibited more pronounced and longer-lasting negative thermal anomalies, whereas anomalies in the deepest layer were smaller in magnitude and less persistent. These findings suggest the dominance of thermal advection in the loose soil layer and thermal conduction in the dense layer, while the medium-density layer exhibited transitional behavior. With respect to instrumentation, good agreement was observed between time of detection of the wetting front arrival obtained from the moisture sensors and the optical fiber (root mean square error of 6.2 minutes).

Overall, the results contributed to the understanding of thermal regimes in unsaturated flow and further shed light on the use of temperature as a tracer for soil water infiltration and percolation processes. Ongoing research aims to investigate soil thermal behavior with AH-DTS across a broader range of rainfall intensities and contrasting soil textures.

How to cite: Bertotto, L., Reis, A., Neto, E., Tsuha, C., Wendland, E., and Bour, O.: Can AH-DTS detect wetting front movement in soil columns during rainfall events? First impressions from experimental investigations, EGU General Assembly 2026, Vienna, Austria, 3–8 May 2026, EGU26-11083, https://doi.org/10.5194/egusphere-egu26-11083, 2026.

EGU26-11746 | ECS | Posters on site | HS8.3.3

Impact of urban trees' rainfall interception on soil water dynamics 

Yusuf Oluwasegun Ogunfolaji, Mark Bryan Alivio, Nejc Golob, Vesna Zupanc, and Nejc Bezak

Vegetation characteristics are among the primary factors that influence soil water storage dynamics. Thus, this study aims to determine the interception capacity of urban trees and how differences in effective rainfall beneath these trees regulate soil water dynamics. To achieve this objective, interception capacity was estimated from measured throughfall. The soil water budget elements (including transpiration, soil evaporation, soil water storage, and deep percolation) were simulated using the HYDRUS-1D model. Model inputs include gross rainfall or effective rainfall (throughfall for under-tree soils), volumetric water content (VWC) of the soil, potential evapotranspiration (PET), leaf area index (LAI), and soil hydraulic parameters.

The study was carried out in a small urban park in the City of Ljubljana, Slovenia, between September 2024 and July 2025. The experimental plot includes various tree species, such as deciduous - birch (Betula pendula) and maple (Acer negundo), and evergreen - black pine (Pinus nigra), white pine (Pinus strobus), and yew (Taxus baccata). A tipping-bucket rain gauge was installed in the open area to measure gross rainfall. Throughfall beneath the birch and pine canopies was measured using a V-shaped steel trough collectors equipped with tipping-bucket flow gauges. Throughfall under other tree types was monitored using the same equipment to record open-area rainfall, but positioned under tree canopies. Each instrument was equipped with an automatic data logger that recorded data every 5 minutes. Additionally, soil VWC was monitored in the open area and beneath tree canopies (e.g., pine and birch) using TEROS 10 sensor probes. The probes were positioned horizontally at three successive depths within the soil profile (i.e., top: 16-20 cm, middle: 51-54 cm, and bottom: 74-76 cm). They were connected to data loggers programmed to record VWC at 5-minute intervals, enabling continuous monitoring of moisture variations across the soil profile. Meteorological variables (wind speed, solar radiation, air humidity, air temperature, rainfall, etc.) required to compute PET were collected from a remote weather monitoring station installed in the open area of the experimental site and recorded at 5-minute intervals. The LAI was measured using an LAI-2200C plant canopy analyzer at least twice per week to capture vegetation dynamics during the study period. The soil hydraulic parameters (saturated and residual VWC, saturated hydraulic conductivity, relative saturation, and shape parameters) under each tree were determined in the laboratory. Simulations were executed at an hourly timestep to capture short-term variations in the various water-balance components.

The calibrated HYDRUS-1D model was subsequently used to simulate soil water balance components across different tree species, using different effective rainfall as model input and employing different soil characteristics. The results show that rainfall interception, which defines effective rainfall beneath tree canopies, differs among trees. Thus, it impacts the various soil water budget parameters and soil water dynamics. The analyses conducted indicate the inter-relationship of rainfall interception processes and soil water dynamics.

Acknowledgment: The work was supported through the Ph.D. grant of the first author, which is financially supported by the Slovenian Research and Innovation Agency (ARIS). This study is also part of ongoing research programme P2-0180.

How to cite: Ogunfolaji, Y. O., Alivio, M. B., Golob, N., Zupanc, V., and Bezak, N.: Impact of urban trees' rainfall interception on soil water dynamics, EGU General Assembly 2026, Vienna, Austria, 3–8 May 2026, EGU26-11746, https://doi.org/10.5194/egusphere-egu26-11746, 2026.

EGU26-12273 | Posters on site | HS8.3.3

Field Lysimeter Experiments for Tracing Microplastics Transport in the Unsaturated Zone 

Nina Mali, Elvira Colmenarejo Calero, and Manca Kovač Viršek

Understanding the transport of microplastics (MPs) in the unsaturated zone (UZ) is essential for assessing their environmental impact, particularly regarding groundwater contamination. MPs are increasingly detected in groundwater systems; however, their transport mechanisms through the UZ remain poorly understood, and field-scale experimental evidence is scarce.

This study presents a field-based methodological approach using lysimeter experiments to investigate MP migration under realistic environmental conditions. Four lysimeters, each designed as a vertical column with a diameter of 0.6 metres, were installed outdoors to closely simulate natural UZ environments. The columns were packed with 16 cm of sand and gravel of known granulometric fractions, incorporating variable grain sizes to represent diverse porous media and hydraulic properties. Comprehensive granulometric analyses and infiltration tests were conducted to characterise the physical properties of the columns. Commercial Polypropylene (PP) MPs of different shapes (fibres, fragments, and spheres) were applied as tracers, alongside deuterium oxide (D₂O) as a conservative tracer for hydraulic characterisation.

This experimental approach provides valuable data on MP transport under controlled yet realistic conditions, reducing uncertainties associated with laboratory-only studies. The experimental design allows for the quantification of retention and breakthrough behaviour of MPs under variable hydraulic regimes. Furthermore, the integration of multiple tracer shape-types facilitates the differentiation between physical transport processes, providing a robust framework for future modelling efforts.  

A comprehensive description of the experimental setup, together with the initial results derived from the lysimeter studies, will be presented.
 
This research is part of the project “Improved methods for determination of transport processes and origin of microplastics in groundwater resources—(GWMicroPlast)” (J1-50030), funded by the Slovenian Research and Innovation Agency (ARIS).


How to cite: Mali, N., Colmenarejo Calero, E., and Kovač Viršek, M.: Field Lysimeter Experiments for Tracing Microplastics Transport in the Unsaturated Zone, EGU General Assembly 2026, Vienna, Austria, 3–8 May 2026, EGU26-12273, https://doi.org/10.5194/egusphere-egu26-12273, 2026.

Direct atmospheric water vapor absorption by structureless soils in coastal deserts has been the subject of various field studies, usually carried out with micro-lysimeters (ML’s). In one of these studies the absorption patterns of loess and sand were studied. Given the larger surface area of the loess soil, it was hypothesized that the loess soil would absorb more water vapor than the sand. The results, when the natural crust present on both soils was removed, were surprisingly similar and contrary to expectation.

We hypothesize that one of the reasons for these results was the different pore size distribution of both substrates, the larger pores of the sand allowing deeper penetration of downwelling eddies, thus directly exposing a thicker soil layer to the atmospheric water vapor concentration and hence to enhanced absorption or desorption.

To test this hypothesis, it is necessary to obtain data on the soil water distribution dynamics within the soil profiles of MLs whose soils have different  pore size distribution.

In the present study we report the response of two aggregate sizes of two substrates (aggregated soil and quartz) to the daily fluctuations of atmospheric conditions.

The field study was carried out at the Wadi Mashash Experimental Farm in the Negev Desert, Israel, using four MLs.   The MLs were instrumented with six temperature and relative humidity (RH) sensors (MX2302A, HOBO) inserted at depths of 0.5, 2, 5, 10, 20 and 45 cm. Water retention curves were obtained using a vapor sorption analyzer (Aqualab, Addium) for the driest part of the curve and standard pressure plate for the wetter parts of the curve. Data from soil and meteorological sensors and scales were recorded every 15 minutes and collected for six successive days during late summer.

The ML with large soil aggregates absorbed significantly more atmospheric water than the one with smaller aggregates, while the opposite trend was observed for the quartz particles. The absorption of both quartz MLs was, however, significantly lower than that of the small aggregate ML.

The temporal changes in soil water content distribution with depth were estimated by using temperature and RH to compute the thermodynamic soil water potential and transforming the latter into water contents via the water retention curves obtained for each soil and size fraction. The computed total water absorption and release patterns of the soil profiles within each of the MLs corresponded very well with the total recorded mass changes.

The depth of eddy penetration was indirectly estimated by comparing the fluctuations of water vapor concentration within the soil at various depths to the one measured simultaneously five cm. above the soil surface.  Penetration depth was larger for the large quartz particles when compared to the small ones, but this effect was not so clear for the soil aggregates.

These results highlight the importance of inter- and intra- pore size distribution in determining water vapor absorption and desorption patterns in bare soils.

How to cite: Berliner, P., Eyni Nezah, H., and Agam, N.: The effect of particle size and mineralogy of soils on the diurnal cycle of atmospheric water absorption , EGU General Assembly 2026, Vienna, Austria, 3–8 May 2026, EGU26-13886, https://doi.org/10.5194/egusphere-egu26-13886, 2026.

EGU26-14361 | ECS | Posters on site | HS8.3.3

Probing the Nutrient Cycle in Forests using the Boron Isotopic Composition of Streams 

Hannah Janecke, Julien Bouchez, Jennifer Druhan, Dimitri Rigoussen, Ivan Osorio-Leon, Pierre-Alain Ayral, Jean-Marc Domergue, Valentin Wendling, and Jérome Gaillardet

Forests are essential for the regulation of Earth’s climate both locally and globally. Their ecosystems are dependent on a number of nutrients from mineral sources, which are derived from the underlying rocks and incorporated into clays and oxides in a process referred to as chemical weathering. Streams are ideal indicators of nutrient cycling at the catchment scale, and by extension an indicator of nutrient provision and stresses. As streams collect water from subsurface pathways including water from the root zone, their geochemical signals can be used to quantify nutrient uptake at the catchment scale.

Non-traditional stable isotopes offer opportunities to enhance our understanding of nutrient cycles in the Critical Zone. Biogeochemical processes cause measurable fractionation between metal isotopes, creating fingerprints for their pathway through the ecosystem. In this regard, the micronutrient boron presents an ideal tracer. At the catchment scale the B isotope signature is controlled by inorganic processes such as chemical weathering, atmospheric deposition and transport as dissolved species, but also by vegetational cycling. This can lead to significant deviation between the B-isotopic composition of Critical Zone compartments, in particular in streams, compared to its mineral sources. However, the understanding of the translation of B isotopic signals from the soil-plant system to streams needs to be further investigated in order to develop them as a catchment-scale proxy of nutrients.

Here we present B-isotopic data from the Quaraze instrumented catchment at the Mt. Lozère Critical Zone Observatory, Southern France, a long-term instrumented site covered by a mixed tree forest, which is experiencing water stress in summer. Stream samples were collected along the river profile from the outlet to the source over the course of four trips in April, June, August and October. Additionally, we collected groundwater from piezometers at 20m depth and solutions in the unsaturated zone from -2 to -10m depth. Generally, the stream displays strongly elevated δ11B compositions between 34.80‰ and 43.54‰, compared to the local groundwater (10.64‰ to 26.21‰) and soil solutions (11.75‰ to 38.41‰). Major changes in δ11B are observed from the stream source to the outlet, with the largest difference in August (43.52‰ at the source, 37.92‰ at the outlet). This behavior is exhibiting a strong seasonal dependency, since notably the source and outlet are identical within the analytical error in the month of October (40.55‰ and 40.39‰).

This dataset demonstrates that the B isotope signature is highly dynamic, both temporally and spatially, and sensitive to variations in source inputs. This in turn implies that nutrient provision is impacted by small changes in the ecosystem. Vegetational cycling might be playing a key role in explaining elevated stream δ11B compositions [Gaillardet and Lemarchand, 2018]. Using these data, a modelling framework will be applied to estimate the relative roles of recycled organic matter vs. chemical weathering as nutrient sources in this catchment.

How to cite: Janecke, H., Bouchez, J., Druhan, J., Rigoussen, D., Osorio-Leon, I., Ayral, P.-A., Domergue, J.-M., Wendling, V., and Gaillardet, J.: Probing the Nutrient Cycle in Forests using the Boron Isotopic Composition of Streams, EGU General Assembly 2026, Vienna, Austria, 3–8 May 2026, EGU26-14361, https://doi.org/10.5194/egusphere-egu26-14361, 2026.

Groundwater, the world’s largest accessible freshwater resource, supports billions of people but is increasingly threatened by excessive abstraction rates that exceed natural groundwater recharge (GWR). Sustainable groundwater management requires establishing an accurate balance between extraction and recharge. Hydrological models are commonly used to estimate GWR; these models are typically calibrated to historical data and then assumed to remain valid for future projections under the notion of stationarity, that is, the assumption that the conditions used for model training will remain representative in the future. However, under projected climate change, this assumption is likely to be violated in many regions. In this study, soil water content observations from the International Soil Moisture Network (ISMN) were used to calibrate both bucket-type and Richards’ equation models for estimating GWR across multiple sites, using the DREAM algorithm. For each location, the most appropriate model structure was selected based on the Akaike Information Criterion (AIC) and Bayesian Information Criterion (BIC). Future climate projections from GCMs under the SSP5–8.5 scenario were then summarized as annual rainfall totals for all sites. Subsequently, site pairs were identified in which historical annual rainfall totals at one location resemble future projected totals at another location, while also exhibiting similar soil hydraulic properties. This framework enables testing whether the model method selected under historical conditions remains valid under future climates. Overall, the proposed approach offers a systematic method for determining the complexity of unsaturated flow models and is expected to reduce uncertainty in GWR estimates.


How to cite: Turkeltaub, T.: Selecting Unsaturated Flow Model Complexity for Groundwater Recharge Estimation Under Climate Change, EGU General Assembly 2026, Vienna, Austria, 3–8 May 2026, EGU26-16297, https://doi.org/10.5194/egusphere-egu26-16297, 2026.

EGU26-16547 | ECS | Orals | HS8.3.3

Advancing Land-Surface Modelling in ecLand Through a Unified Hydro-Thermal Framework 

Rajsekhar Kandala, Anne Verhoef, Surya Gupta, Sinikka Paulus, Souhail Boussetta, Patricia De Rosnay, Christoph Rüdiger, Yijian Zeng, and Emily Black

Land surface models (LSMs) play a central role in simulating land-atmosphere interactions by representing coupled soil, vegetation, and energy-water-carbon processes. In most current LSMs, soil hydraulic and thermal properties are treated independently and are coupled only indirectly through soil moisture content, without an explicit linkage between the underlying parameters that define the shape of the curves characterising hydro-thermal properties. Although several independent studies have demonstrated strong correlations between soil hydraulic properties (SHPs) and soil thermal properties (STPs), these relationships have not yet been incorporated into land surface models to assess their impacts on land-surface states and fluxes.

For the present study, we developed a unified hydro-thermal framework for ecLand that explicitly integrates soil hydraulic and thermal properties, thereby improving the representation of coupled soil moisture and heat transport and associated land–atmosphere interactions. First, the van Genuchten (1980) soil water retention curve (SWRC) was replaced by formulations that explicitly represent adsorbed and capillary water components (e.g. Lu, 2016; Peters-Durner-Iden, 2024), leading to a more physically consistent description of soil hydraulic properties, particularly under dry soil conditions. Second, the thermal conductivity formulation of Peters-Lidard et al. (1998), currently used in ecLand, was replaced by an approach that directly links thermal conductivity to SWRC parameters (Lu & McCartney, 2024), ensuring a consistent coupling between soil hydraulic and thermal properties.

We first quantified the impacts of these developments on soil states (soil moisture and soil temperature at multiple depths) and land-surface fluxes (latent and sensible heat) using a series of controlled sensitivity experiments. These experiments were designed to isolate the response of the coupled hydro-thermal system to variations in soil texture, soil depth and discretization, and climatic regimes with an emphasis on more arid conditions. Through this sensitivity analysis, we examined how the unified hydro-thermal framework influences moisture–temperature feedbacks, vertical heat transport, and surface energy partitioning across contrasting hydro-climatic environments. The performance of the unified framework was then evaluated at selected in situ sites by comparing simulations from the original and updated ecLand configurations against observations of soil moisture, soil temperature, and latent and sensible heat fluxes. We find substantial differences between the two formulations in the simulated surface energy fluxes, particularly for soils with high sand content, where discrepancies in latent and sensible heat reach approximately 40 W m-2 for loamy sand. Future work will focus on implementing this framework in global ecLand simulations to assess impacts on near-surface land states and surface fluxes, and subsequently in fully coupled land-atmosphere simulations within IFS to evaluate potential improvements in near-surface atmospheric variables (e.g. 2 m air temperature and relative humidity) and the reliability of ECMWF’s sub-seasonal to seasonal forecasts.

How to cite: Kandala, R., Verhoef, A., Gupta, S., Paulus, S., Boussetta, S., Rosnay, P. D., Rüdiger, C., Zeng, Y., and Black, E.: Advancing Land-Surface Modelling in ecLand Through a Unified Hydro-Thermal Framework, EGU General Assembly 2026, Vienna, Austria, 3–8 May 2026, EGU26-16547, https://doi.org/10.5194/egusphere-egu26-16547, 2026.

EGU26-17385 | ECS | Orals | HS8.3.3

Field-scale PFAS transport dynamics in a small urban catchment: Insights from Stormwater, Vadose Zone and Groundwater monitoring in a nature-based Infiltration facility. 

Sofia Bouarafa, Somar Khaska, Corinne Le Gal La Salle, Iman Soukrate, Marie Lemoine, and Jean-Marie Côme

The widespread use and extreme persistence of per- and polyfluoroalkyl substances (PFAS) present significant risks to vulnerable hydrologic systems, yet the fate of these compounds originating from diffuse urban runoff remains poorly understood. This study investigates the transport and fate of 25 PFAS compounds within a pilot-scale nature-based infiltration facility, utilizing a multi-parameter in-situ monitoring network to track concentrations across the runoff-soil-groundwater continuum. Through the analysis of three representative rain events across different seasons, results reveal a sharp contrast in PFAS dynamics between environmental compartments. While a pronounced "first flush" effect was observed in surface runoff with peak concentrations of 656 ng/L rapidly decreasing to 5 ng/L the soil matrix acted as a significant geochemical buffer, moderating vadose zone percolate to a narrow range of 26 to 55 ng/L. Interestingly, background PFAS levels in the broader aquifer remained consistently higher (169 - 226 ng/L) than those measured in the vadose zone, suggesting that pre-existing legacy contamination exerts a more dominant influence on groundwater quality than contemporary leaching from the infiltration site. Furthermore, a temporary dilution effect observed in downgradient monitoring wells during rainfall events indicates that urban infiltration practices may locally mitigate groundwater contamination levels. Multivariate analysis identifies low pH and high total organic carbon (TOC) as the primary physicochemical drivers associated with elevated PFAS mobility. Ultimately, this research demonstrates that while urban runoff introduces new PFAS loads, the primary risk at this site stems from background aquifer contamination, providing a strong scientific basis for the promotion of urban infiltration as a sustainable and potentially remedial stormwater management strategy.

How to cite: Bouarafa, S., Khaska, S., Le Gal La Salle, C., Soukrate, I., Lemoine, M., and Côme, J.-M.: Field-scale PFAS transport dynamics in a small urban catchment: Insights from Stormwater, Vadose Zone and Groundwater monitoring in a nature-based Infiltration facility., EGU General Assembly 2026, Vienna, Austria, 3–8 May 2026, EGU26-17385, https://doi.org/10.5194/egusphere-egu26-17385, 2026.

EGU26-17420 | Orals | HS8.3.3

Zero-Tillage Induces Reduced Bio-Efficacy Against Weed Species Amaranthus retroflexus L. Dependent on Atrazine Formulation 

Daniel Wardak, Faheem Padia, Martine DeHeer, Craig Sturrock, and Sacha Mooney

Zero-tillage (ZT) is a conservation soil management approach which relies more heavily on herbicide application for weed control than in ploughed soil. Changes in soil management can influence the structure and organisation of pore space in soil, which drives changes in the transport of particulates and dissolved substances. Formulation of pesticides can be used to change the delivery of active ingredients to soil; however, it is currently unknown how changing the formulation of an herbicide can influence the transport properties between ZT vs. ploughing. We investigated the bioefficacy of two formulations of the herbicide atrazine, a pre- and post-emergence herbicide that inhibits photosystem II. Bioefficacy was assessed using physical measures and survival analysis of an early photosynthesis-dependent weed species, Amaranthus retroflexus L., over time, and soil pore network structure was assessed by analysing three-dimensional images produced by X-ray Computed Tomography. Increasing the herbicide application rate generally improved bioefficacy, though it was reduced in soils managed under ZT. Under herbicide-treated ZT samples, survival time was higher, ranging from 13.4 to 18.2 days compared with 12.6 to 15.4 days in ploughed samples, the mean dry plant mass was higher, ranging from 0.5 to 2.5 mg compared with 0.05 to 0.68 mg in ploughed samples, and the mean total plant length was higher, ranging from 1.73 to 12.1 mm compared with 0.2 to 5.45 mm in ploughed samples. Changes in the soil pore network previously demonstrated to be indicators of preferential transport were correlated with measures of bioefficacy, including pore thickness and connectivity density. Reduced atrazine efficacy under ZT is problematic considering the inherent reliance on chemical methods for weed control, we suggest that pursuing formulation strategies to alleviate potential risks of loss via preferential transport may be fruitful.

How to cite: Wardak, D., Padia, F., DeHeer, M., Sturrock, C., and Mooney, S.: Zero-Tillage Induces Reduced Bio-Efficacy Against Weed Species Amaranthus retroflexus L. Dependent on Atrazine Formulation, EGU General Assembly 2026, Vienna, Austria, 3–8 May 2026, EGU26-17420, https://doi.org/10.5194/egusphere-egu26-17420, 2026.

EGU26-17667 | ECS | Posters on site | HS8.3.3

Enhancing above-belowground coupling for predictive modelling of tree water stress under deep soil water depletion 

Louis Graup, Fabian Bernhard, Richard Peters, Andrea Carminati, and Katrin Meusburger

An unseen threat of increasing drought stress in forests emerges from below ground: the lack of deep soil water storage refilling between seasons. However, the reliance of trees on deep soil water is not well understood. Depth-dependent root water uptake (RWU) can be estimated with stable water isotopes, though these estimates are prone to uncertainty and the measurements are typically sparse and labor-intensive to collect. Additionally, soil water potential sensors can provide estimates of tree water stress but are also limited in vertical resolution. Soil-vegetation-atmosphere-transfer (SVAT) models can fill this gap and provide a mechanistic link between soil water availability and tree stress. Currently, SVAT models are limited in their ability to describe plant-level water status through leaf water potential or stem water storage. In this project, we enhance an existing SVAT model (LWFBrook90.jl) with plant water capacity and capacitance to simulate diurnal and seasonal variation in plant water pools. These sub-daily cycles of stem shrinkage and refilling are effectively captured by high-precision, point dendrometers, which measure micrometer-scale stem radius variations, and derived through tree water deficit (TWD) which can serve as a drought stress proxy. By comparing modelled plant water storage to TWD, we benefit from a simple, integrated measure of tree water stress that allows the partitioning of root water uptake into transpiration and refilling plant stores. We apply the updated model to a field site in Valais, Switzerland, located within a dry inner-alpine valley, where a long-term irrigation experiment has been ongoing in the Pfynwald, a 100-year-old Scots pine forest. Multiple field campaigns have collected a suite of observational data for model calibration, including soil water content and potential, soil and xylem isotopes, sap flow, and tree water deficit. Model results indicate that peak transpiration is sourced from an average of 50 cm depth, while deeper water sources are unable to compensate for late-summer water demand, contributing minimally to RWU. Irrigation considerably modified the ecosystem water balance and shifted root water uptake to shallow layers in the top 20 cm, while the legacy effects of irrigation after it was stopped show an alleviation of stress that allows more efficient RWU from deep soils, consistent with sustained root investment developed under long-term irrigation.

How to cite: Graup, L., Bernhard, F., Peters, R., Carminati, A., and Meusburger, K.: Enhancing above-belowground coupling for predictive modelling of tree water stress under deep soil water depletion, EGU General Assembly 2026, Vienna, Austria, 3–8 May 2026, EGU26-17667, https://doi.org/10.5194/egusphere-egu26-17667, 2026.

EGU26-17845 | ECS | Orals | HS8.3.3

Evaluation of Water–Salt Regulation and Economic Performance of Sand-Column–Assisted Subsurface Pipe Drainage in Saline–Alkali Soils Containing Low-Permeability Layers 

Mingrui Jin, Zhanbo Meng, Yuan Tao, Shaoli Wang, Xiaoyan Guan, Yunshi Niu, and Hairuo Liu

Soil salinization is a major constraint on the sustainable development of global agriculture. As an effective technique for reclaiming saline soils, subsurface pipe drainage often exhibits limited drainage and salt removal efficiency under complex soil conditions characterized by low-permeability layers. To enhance drainage and salt removal efficiency, this study proposes a sand-column–assisted subsurface pipe drainage system, in which sand columns are installed directly above subsurface pipes and between adjacent pipes to establish stable vertical percolation pathways. Based on two years of field experiments and HYDRUS-3D numerical simulations, the regulatory effects of sand-column–assisted subsurface pipe drainage on the spatiotemporal variation of profile salinity, drainage and salt removal capacity, and groundwater dynamics were systematically evaluated, and comparisons were conducted with conventional subsurface pipe drainage under fixed-quota and fixed-time irrigation schemes focusing on drainage capacity, desalination efficiency, and economic benefits. The results indicated that over the two-year experimental period, soil salinity in the 0-40 cm plough layer of plots with sand-column-assisted subsurface pipe drainage declined from 15.48 g/kg to 8.53 g/kg, achieving a desalination rate of 44.85%, and no salt accumulation was observed in deeper soil layers. Under both fixed-quota and fixed-time irrigation conditions, sand-column–assisted subsurface pipe drainage exhibited superior groundwater control performance compared with conventional subsurface pipe drainage. Under the same irrigation amount, sand-column–assisted subsurface pipe drainage was more suitable for rapidly reducing surface soil salinity in the plough layer, whereas conventional subsurface pipe drainage showed more pronounced advantages in total salt removal and sustained salt discharge capacity. The average salt removal rate of sand-column–assisted subsurface pipe drainage was 49.23% higher than that of conventional subsurface pipe drainage at 1.5 d, whereas the cumulative salt removal of conventional subsurface pipe drainage was on average 16.19% higher than that of sand-column–assisted subsurface pipe drainage at 15 d. Under identical irrigation durations, the cumulative salt discharge of sand-column–assisted subsurface pipe drainage was generally higher than that of conventional subsurface pipe drainage. At a pipe spacing of 10 m, the per-hectare infiltrated water volumes for conventional subsurface pipe drainage and sand-column–assisted subsurface pipe drainage were 1399.95 m³ and 2128.05 m³, respectively, with salt removal by sand-column–assisted subsurface pipe drainage being 9.40% higher than that under conventional subsurface pipe drainage. Comprehensive economic evaluations under the two operating scenarios indicated that under fixed-quota irrigation leaching conditions, sand-column–assisted subsurface pipe drainage system with sand columns installed only above subsurface pipes showed overall economic advantages in terms of EIRR, ENPV, EBCR, and payback period. Under fixed-time irrigation leaching conditions, conventional subsurface pipe drainage exhibited superior overall economic benefits compared with sand-column–assisted subsurface pipe drainage with sand column uniformly installed both above the pipes and between adjacent pipes, whereas sand-column–assisted subsurface pipe drainage with sand columns installed only above the pipes exhibited better economic performance than conventional subsurface pipe drainage.

How to cite: Jin, M., Meng, Z., Tao, Y., Wang, S., Guan, X., Niu, Y., and Liu, H.: Evaluation of Water–Salt Regulation and Economic Performance of Sand-Column–Assisted Subsurface Pipe Drainage in Saline–Alkali Soils Containing Low-Permeability Layers, EGU General Assembly 2026, Vienna, Austria, 3–8 May 2026, EGU26-17845, https://doi.org/10.5194/egusphere-egu26-17845, 2026.

EGU26-18333 | ECS | Orals | HS8.3.3

Disentangling hydrological responses of forest ecosystems to impulses of precipitation, VPD and solar radiation 

Stefano Martinetti, Peter Molnar, James W. Kirchner, and Marius G. Floriancic

Water fluxes in the critical zone are driven by various environmental variables. For example, soil water is rapidly replenished during precipitation events and is slowly emptied during periods of transpiration at rates which are mainly driven by diurnal solar radiation and vapor pressure deficit. Precipitation, solar radiation and vapor pressure deficit correlate, which complicates proper disentanglement of their individual effects on tree physiology and tree-mediated water fluxes. Here, we use Ensemble Rainfall-Runoff Analysis (ERRA) to disentangle how different environmental variables contribute to ecosystem water fluxes (net soil water and tree water recharge and sapflow) measured at the ‘WaldLab Forest Experimental Site’ in Zurich. The methodology is data‐driven and relies on non-linear and non-stationary deconvolution of time series to infer impulse-response functions. These impulse-response functions quantify the intensity and the time lag in the responses of tree-mediated water fluxes to precipitation, solar radiation and vapor pressure deficit, and account for any covariation effects among these drivers. The results are based on five years of sub-daily sapflow and dendrometer measurements on three beech and spruce trees, respectively, and show the immediate response of tree water fluxes at the field site. Notably, the response of sapflow and tree water recharge towards solar radiation is more pronounced then the response towards vapor pressure deficit, reflecting the higher importance of radiation (a physiological necessity) compared to vapor pressure deficit (a hydraulic boundary condition) in driving transpiration. Beech and spruce trees differ in the duration of the response, with spruce trees showing responses lasting longer then beech, reflecting the higher hydraulic capacitance of spruce trees. Our study highlights how this novel impulse-response approach helps identifying soil-plant-atmosphere relations that complement our understanding of how forest ecosystems work.

How to cite: Martinetti, S., Molnar, P., Kirchner, J. W., and Floriancic, M. G.: Disentangling hydrological responses of forest ecosystems to impulses of precipitation, VPD and solar radiation, EGU General Assembly 2026, Vienna, Austria, 3–8 May 2026, EGU26-18333, https://doi.org/10.5194/egusphere-egu26-18333, 2026.

EGU26-21575 | ECS | Orals | HS8.3.3

Antecedent state and the temporal organization of soil moisture response to episodic rainfall  

Guilin Luo, Liling Chang, David M Hannah, and Stefan Krause

Standard ecohydrological analyses typically frame soil moisture dynamics as direct responses to discrete rainfall episodes. However, this “forcing-first” perspective implicitly assumes that subsurface response timescales are synchronized with atmospheric intermittency—an assumption that breaks down when soil moisture dynamics bridge multiple storms or when storage depletion occurs within shorter timescales.  Here, we demonstrate that relying on meteorological event definitions leads to a fundamental mischaracterization of the temporal organization of soil storage. By applying an anomaly-based signal analysis to multi-year, profile-resolved field observations, we decoupled subsurface storage dynamics from rainfall timing to isolate observable patterns of soil response.  The analysis reveals two critical dynamics that event-based logic obscures. First, antecedent wetness is associated with a distinct regime-dependent transition in response structure: broadly distributed, multi-day storage anomalies in dry conditions contract into rapid, sub-day drainage pulses in wet conditions. This effectively decouples the subsurface response duration from the rainfall duration. Second, soil moisture dynamics frequently integrate multiple distinct precipitation episodes into single, coherent observed storage trajectories, particularly in deeper layers. These findings show that the temporal organization of soil moisture is governed by the interplay of forcing and antecedent state, not merely by rainfall timing. We conclude that forcing-based definitions are insufficient for capturing effective system memory, and that accurately characterizing ecohydrological function requires defining events by their subsurface response rather than their atmospheric input. 

How to cite: Luo, G., Chang, L., Hannah, D. M., and Krause, S.: Antecedent state and the temporal organization of soil moisture response to episodic rainfall , EGU General Assembly 2026, Vienna, Austria, 3–8 May 2026, EGU26-21575, https://doi.org/10.5194/egusphere-egu26-21575, 2026.

EGU26-102 | Orals | HS8.3.4

Mechanisms of facilitation of water transport in the rhizosphere 

Lionel Dupuy, Andrew Mair, Beatriz Mezza Manzaneque, Emma Gomez Preal, Iker Martín Sanchez, Gloria de las Heras Martínez, Natalia Natalia Elguezabal Vega, Anke Lindner, Eric Clement, Nicola Stanley-Wall, and Mariya Ptashnyk

Biological activity in soil is very diverse and around plant roots it affects water transport. Root growth displaces soil particles and alters soil porosity, by creating biopores that conduct water. The secretions of plants and microbes modify surface tension, viscosity, absorption and retention of water. Microbial motility may also contribute to water transport, but such effects have not been demonstrated in soil to date. To elucidate how these factors influence root water uptake, we combined dye tracing experiments [1,2], live microscopy and physical characterization of root exudates of winter wheat, along with analyses of cell suspensions and secretions of the bacterium Bacillus subtilis. Using this dataset, we coupled a modified Richards’ equation [3] with the model of Šimůnek and Hopmans [4] to investigate how the combined effects of these processes influence water availability to crops over a complete wet–dry–wet cycle. Results showed that both microbes and plants’ secretions act as facilitators of water infiltration of dry and mildly repellent soil layers. In arid environments, under light and sporadic rainfall events, this effect tends to benefit more deeper-rooted or mature crops. Results also show that microbial motility alone may be inducing an active stress of few Pascals which also contributes to enhance water infiltration. These results have important implications for the management of irrigation in cropping systems.  


References

[1] Liu et al 2025, Biosystems Engineering, https://doi.org/10.1016/j.biosystemseng.2025.02.006

[2] Gómez et al 2025, Plant Cell Environment, https://doi.org/10.1111/pce.70240

[3] Mair et al 2025, Vadose Zone Journal, https://doi.org/10.1101/2025.03.28.645940

[4] Šimůnek and Hopmans 2009, Ecological Modelling, 220(4), 505–521


How to cite: Dupuy, L., Mair, A., Mezza Manzaneque, B., Gomez Preal, E., Martín Sanchez, I., de las Heras Martínez, G., Natalia Elguezabal Vega, N., Lindner, A., Clement, E., Stanley-Wall, N., and Ptashnyk, M.: Mechanisms of facilitation of water transport in the rhizosphere, EGU General Assembly 2026, Vienna, Austria, 3–8 May 2026, EGU26-102, https://doi.org/10.5194/egusphere-egu26-102, 2026.

EGU26-1234 | ECS | Posters on site | HS8.3.4

Drought-induced shifts in water uptake in winter cereals: Insights from multi-scale measurements across two contrasting years 

Gökben Demir, Anas Emad, Christian Markwitz, David Dubbert, Alexander Knohl, and Maren Dubbert

Croplands are among the systems most vulnerable to shifts in precipitation regimes and prolonged droughts particularly in temperate climates. Although irrigation may increase agricultural productivity, it can’t offer a sustainable long-term solution to compound droughts due to intensified pressure on freshwater resources. Thus, characterizing root water uptake patterns is essential to understand how crops maintain function while sustaining transpiration during drought. We investigated water uptake patterns of winter cereals (wheat, barley) across two contrasting growing seasons (2024, 2025). The research site is in central Germany, it exhibits a suboceanic/subcontinental climate and has a shallow groundwater level (ca. 1.5 m). In the footprint of an eddy covariance (EC) tower, we sampled plant leaves, soil water, precipitation, river water, and groundwater to trace stable water isotopes. We monitored leaf area index (LAI) and installed soil moisture sensors (5–100 cm). Using soil moisture time series and dual-isotope mixing models, we quantified variation in water uptake depth throughout the growing seasons (March-July). In 2024, soil layers were wetted by regular rains in April with only short rain-free periods occurring. On the contrary, frequent and longer dry spells occurred in 2025, totalling 18 days in April and 15 days in May. Moreover, in 2024, ETsoil ranged from 1.2 mm day⁻¹ to over 7 mm day⁻¹ at peak LAI, while ETEC-tower for the same period exceeded 5 mm day⁻¹. In 2025, despite high transpiration demand, ET did not exceed 5 mm day⁻¹ consistently in both methods. Soil water isotope patterns showed expected fluctuations, with deeper layers being depleted in δ²H and δ¹⁸O. We used the Craig–Gordon equation to determine xylem water isotope signatures, followed by mixing models to quantify water sources for transpiration. Xylem and soil water isotope time series suggest that despite more frequent rain events, winter wheat continued to draw water from stable, deeper sources rather than relying on enriched shallow soil layers (5–15 cm). During summer 2024 (June–July), δ²H and δ¹⁸O values in the topsoil enriched through higher soil evaporation, yet water uptake shifted to deeper layers, which agrees with ETsoil variations. Precipitation events in late spring 2024 enabled winter wheat to access deeper soil water sources (≥50 cm) to sustain high transpiration demand. During the drier conditions, barley altered water uptake depths yet transpiration demand was mainly sustained from water sources within 10–40 cm, and contribution from deeper layers was limited. Both species showed similar responses to dry spells, yet the timing of the drought shaped root plasticity and access to stable water sources. Our results demonstrate that water uptake strategies and water use efficiency are tightly linked to the timing and intensity of drought in annual crops, even when deeper water sources remain stable.

How to cite: Demir, G., Emad, A., Markwitz, C., Dubbert, D., Knohl, A., and Dubbert, M.: Drought-induced shifts in water uptake in winter cereals: Insights from multi-scale measurements across two contrasting years, EGU General Assembly 2026, Vienna, Austria, 3–8 May 2026, EGU26-1234, https://doi.org/10.5194/egusphere-egu26-1234, 2026.

Plant water regulation plays a critical role in land–atmosphere coupling and ecosystem responses to climate extremes. Isohydricity is widely used to characterize how plants regulate water loss under water stress, yet its behavior under interacting drought and salinity remains poorly understood. Here, we investigated maize (Zea mays L.) water-use strategies under combined water and salinity constraints using a controlled pot experiment. Maize plants were exposed to two water availability regimes (well-watered and drought conditions) and irrigated with either fresh or saline water. Isohydric behavior was assessed using three complementary hydraulic relationships: (i) transpiration rate (normalized by leaf area) versus soil water potential, (ii) leaf water potential versus soil water potential, and (iii) stomatal conductance versus leaf water potential. In addition, the vulnerability of soil–plant hydraulic conductance was also examined.

Under drought or salinity applied separately, maize tended to exhibit more anisohydric behavior, characterized by relatively weak reductions in transpiration and stomatal conductance with declining water potential and a broader range of leaf water potential variation. In contrast, when drought and salinity occurred simultaneously, maize shifted toward a more isohydric mode of regulation, clearly differing from responses under single stress conditions. Moreover, under drought conditions, isohydricity inferred from the leaf–soil water potential relationship tended toward a more isohydric behavior under saline treatment, whereas isohydricity inferred from transpiration- and stomatal conductance–based relationships under salinity indicated a more anisohydric behavior. This discrepancy highlights the influence of evaluation methods on isohydricity characterization. Furthermore, we conclude that maize isohydricity is closely linked to the vulnerability of soil–plant hydraulic conductance. Under drought or salinity conditions, maize tends to exhibit more anisohydric behavior, which is associated with enhanced resistance of the soil–plant hydraulic system to the loss of hydraulic conductance. These findings advance our understanding of crop water relations under combined water and salinity stress and support integrated irrigation and salinity management strategies to improve water use efficiency and sustain yields in salt-affected regions.

How to cite: Shao, X. and Lei, G.: Interacting drought and salinity reshape maize isohydric behavior through soil–plant hydraulic constraints, EGU General Assembly 2026, Vienna, Austria, 3–8 May 2026, EGU26-2178, https://doi.org/10.5194/egusphere-egu26-2178, 2026.

EGU26-2609 | Posters on site | HS8.3.4

Transforming excavation waste into functional soil: Effects of compost ratios and plant diversity on initial pedogenesis 

Maha Deeb, Cédric Deluz, Patrice Prunier, Fabienne Morch, Pierre-André Frossard, and Pascal Boivin

Soil engineering is gaining increasing attention due to its potential to address soil scarcity while promoting waste recycling. However, functional soils do not arise from simply mixing waste materials. Instead, fundamental pedogenetic processes must be activated and supported, alongside the stabilization of organic carbon through complexation with mineral surfaces. Evidence suggests that interactions between plants and minerals could accelerate these early pedogenic processes—including carbon fixation and mineral–organic associations—while limiting carbon mineralization. This study reports the results of a field experiment conducted in Geneva to investigate these effects.

Excavated geological layers (DSH) from Geneva’s fluvio-glacial deposits were mixed with six levels of green waste compost (GWC) (10–90 %). Each plot was sown with a standardized indigenous plant mixture of 44 species, and plant diversity was maximized under the assumption that higher diversity would enhance the formation of a soil-like structure in the parent material. Treatments were replicated four times and monitored monthly for the first six months, with a final assessment at 12 months. Organic carbon forms were analyzed using Rock Eval® pyrolysis, and soil hydrostructural properties were evaluated through soil shrinkage analysis.

Results showed that a 25 % compost ratio promoted carbon stabilization, while the 10 % mixture demonstrated potential for carbon fixation and mineral–organic associations after 12 months, likely due to slower plant establishment in dry grassland. The 50 % compost mixture supported higher plant species richness, including ruderal and dry grassland species. Additionally, adding 10 % DSH to a 90 % GWC mixture reduced carbon mineralization compared with 100 % GWC, indicating potential for soilless applications. Overall, these findings suggest that pedogenic processes in engineered soils can be optimized by carefully selecting parent material-to-organic carbon ratios and plant combinations.

How to cite: Deeb, M., Deluz, C., Prunier, P., Morch, F., Frossard, P.-A., and Boivin, P.: Transforming excavation waste into functional soil: Effects of compost ratios and plant diversity on initial pedogenesis, EGU General Assembly 2026, Vienna, Austria, 3–8 May 2026, EGU26-2609, https://doi.org/10.5194/egusphere-egu26-2609, 2026.

EGU26-2974 | ECS | Posters on site | HS8.3.4

Quantifying Drivers of Root Depth and Distribution in European Forests: Species, Soil, and Climate Effects 

Dennis Günther Ried, Andrea Carminati, Richard L. Peters, Marco Lehmann, Louis Graup, Lorenz Walthert, Peter Waldner, Ivano Brunner, Fabian Bernhard, and Katrin Meusburger

Deep rooting is a critical trait for drought tolerance, yet quantitative knowledge of root distributions across tree species and soil properties remains limited [1, 2]. This study characterises fine-root distribution patterns and maximum rooting depths in mono and mixed species forests based on ~2,000 soil profiles from Switzerland and it is intended to extend the study to the continental scale with root, tree and soil data from ICP Forests’ Level I and II plots.
Root presence was recorded semi-quantitatively along soil profiles together with maximum rooting depths and associated soil and stand properties. Species specific traits and soil properties were analysed, and root distribution curves (beta curves: Y=1-βd) were modelled to derive species- and soil-specific rooting patterns [3]. Trait-specific beta curves were then compared and analysed for site, stand, and soil properties, such as for topographic, and climate data, focusing on profiles only deeper than 1m soil depth, to avoid skewed beta calculations.
In monospecific stands (dominant species >50% canopy cover), linear models (LMs) explained 29.7% of beta variance across profiles. Tree species identity and soil density were the strongest contributors, while mean annual precipitation exhibited pronounced non-linear effects. Model parsimony improved strongly when tree species identity was aggregated into angiosperms and gymnosperms, although explanatory power decreased slightly to 27.4% of explained beta variance. On average, angiosperms showed a more homogenous fine-root distribution pattern (median β = 0.933) than gymnosperms (median β = 0.888).
In contrast, in mixed species stands, LMs explained 22.1% of beta variance. Tree species identity and soil type emerged as the primary drivers. In comparison, mixed species stands were more difficult to analyse and interpret than monospecific stands due to their higher structural and ecological complexity. Notably, strong collinearity was observed among soil type, hydromorphic condition, and soil density in both monospecific and mixed species stands.
Subsequently, we plan to integrate data from ICP Forests sites to test whether these relationships hold across broader climatic and edaphic gradients. With these results we aim to improve mechanistic modelling of soil water availability, root water uptake, and forest development under current and future climate conditions.

References

[1] Meusburger, K., Trotsiuk, V., Schmidt-Walter, P., Baltensweiler, A., Brun, P., Bernhard, F., Gharun, M., Habel, R., Hagedorn, F., Köchli, R., Psomas, A., Puhlmann, H., Thimonier, A., Waldner, P., Zimmermann, S., & Walthert, L. (2022). Soil–plant interactions modulated water availability of Swiss forests during the 2015 and 2018 droughts. Global Change Biology, 28, 5928–5944. DOI: 10.1111/gcb.16332.

[2] Pietig, K., Kotowska, M., Coners, H., Mundry, R., & Leuschner, C. (2026). Deep rooting revisited: Comparing the rooting patterns of European beech, Sessile oak, Scots pine, and Douglas fir in sandy soil to 3.8 m depth. Forest Ecology and Management, 600, 123288. DOI: 10.1016/j.foreco.2025.123288

[3] Gale, M. R. & Grigal, D. F. (1987). Vertical root distributions of northern tree species in relation to successional status. Can. J. For. Res. 17: 829-834.

How to cite: Ried, D. G., Carminati, A., Peters, R. L., Lehmann, M., Graup, L., Walthert, L., Waldner, P., Brunner, I., Bernhard, F., and Meusburger, K.: Quantifying Drivers of Root Depth and Distribution in European Forests: Species, Soil, and Climate Effects, EGU General Assembly 2026, Vienna, Austria, 3–8 May 2026, EGU26-2974, https://doi.org/10.5194/egusphere-egu26-2974, 2026.

Soil-moisture memory (SMM) regulates the evolution of drought, hydrological predictability, and land–atmosphere coupling, yet many conventional diagnostic metrics simplify this complex phenomenon into a sole memory timescale. In this paper, we introduce a unified observation-driven framework—a scale-aware Linear Integro-Differential Equation (LIDE) for root zone soil moisture—to infer the complete distributed memory kernel that effectively models soil-moisture dynamics. When applied to multi-year in situ observations from energy-limited, water-limited, and intermediate hydro-climatic regimes, LIDE reveals a rich hierarchy of memory structures that conventional e-folding autocorrelation or hybrid deterministic-stochastic metrics are unable to capture. Application of LIDE in examined sites revealed a fast-memory timescale from ∼3–32 days, a short-term slow-memory timescale from 13 to 39 days, an intermediate slow-memory from ∼115–127 days, a long-term slow-memory from ∼218–541 days, and a theoretical saturation timescale from ~9 to 15 years. LIDE also provides additional quantitative information about memory strength, as assessed by actual memory capacity (Q), which is not available through conventional persistence analyses, with Q being relatively constant over the examined sites (1.12–1.24 days⁻²) despite large hydro-climatic contrasts among sites. Applying LIDE on hourly, daily, and monthly data reveals that high-frequency data provides information on sub-daily fast memory timescales (~6 hours at the intermediate site, namely Schöneseiffen in Germany), as well as an additional very short slow-memory timescale (~14 hours at Schöneseiffen) that is not observable in daily or monthly data. The integrated kernel also accounts for the oscillatory saturation dynamics associated with soil-moisture reemergence, making it possible to retrieve this process from observations for the first time. Collectively, these results place LIDE as a state-of-the-art and state-of-the-practice approach in diagnosing multiscale memory of the soil moisture that is physically interpretable and scalable and can greatly advance drought sciences, ecohydrology, and land-surface modeling.

How to cite: Rahmati, M.: A Memory-Based, non-Markovian, Linear Integro-Differential Equation for Root-Zone Soil Moisture, EGU General Assembly 2026, Vienna, Austria, 3–8 May 2026, EGU26-3805, https://doi.org/10.5194/egusphere-egu26-3805, 2026.

EGU26-4133 | Orals | HS8.3.4

Uncovering critical thresholds of root-zone soil moisture for plant water stress in terrestrial ecosystems 

Bin Chen, Zheng Fu, Yuanyuan Huang, Shaoqiang Wang, and Zhihui Chen

The critical root-zone soil moisture (SM) threshold is a fundamental parameter that marks the transition from energy-limited to soil-moisture-limited evapotranspiration (ET) regimes, yet regional and global studies often rely on near-surface SM and its associated threshold as a proxy. This study presents a global, measurement-based evaluation of critical root-zone SM threshold by analyzing 666 dry-down events across 34 eddy covariance flux tower sites equipped with multi-layered SM sensors reaching depths of at least 1 meter. The results demonstrate that critical thresholds derived from near-surface and root-zone SM are significantly inconsistent, with an overall root mean square error (RMSE) of 0.11 m³ m⁻³. This discrepancy is primarily driven by the vertical SM gradient and the decoupling of near-surface and root-zone layers during drydown periods, which leads to substantial errors in identifying the onset and duration of plant water stress. For instance, at a forest site (US-Me2), using the critical threshold derived from near-surface SM delayed the detected onset of moisture stress by 27 days and underestimated the duration of the moisture-limited regime by 36 days. Across the diverse biomes and climate types studied, the global mean  was 0.12 ± 0.11 m³ m⁻³. These findings provide a critical observational benchmark for the evaporative fraction-root zone soil moisture relationship, highlighting that transitioning from near-surface to root-zone-based assessments is essential for accurate land-surface model evaluation and the quantification of ecosystem vulnerability to drought.

How to cite: Chen, B., Fu, Z., Huang, Y., Wang, S., and Chen, Z.: Uncovering critical thresholds of root-zone soil moisture for plant water stress in terrestrial ecosystems, EGU General Assembly 2026, Vienna, Austria, 3–8 May 2026, EGU26-4133, https://doi.org/10.5194/egusphere-egu26-4133, 2026.

Understanding the water use patterns of artificially revegetated plants in arid and semi-arid desert regions with shallow groundwater is crucial for sustainable water resource management and effective vegetation restoration strategies. Despite extensive vegetation rehabilitation in China’s Mu Us Sandy Land, the interspecific and seasonal variations in plant water sources under similar groundwater conditions remain unclear. We conducted isotopic analysis of hydrogen and oxygen in main sand-fixing plants—Pinus sylvestris var. mongolica, Amygdalus pcdunculata Pall, and Artemisia desertorum Spreng—alongside potential water sources during the three growing seasons. Our aim was to elucidate seasonal changes in plant water uptake patterns by correcting isotopic offsets in xylem water using the MixSIAR model. Results indicated that A. desertorum predominantly utilized water from the 0–150 cm soil layer (67.52±14.44 %) throughout all seasons. Conversely, P. sylvestris and A. pedunculata shifted their primary water sources from the 60–240 cm soil layer during the dry season (55.20±2.12 and 57.96±1.45 %, respectively) to the 0–150 cm soil layer during the rainy season (68.44±4.46 and 66.19±1.68 %, respectively), suggesting greater water uptake adaptability in trees and shrubs compared to grasses. Groundwater contribution to plant water uptake showed no significant interspecies difference during the rainy season (P > 0.05). However, P. sylvestris and A. pedunculata significantly increased groundwater absorption during the dry season compared to the rainy season (P < 0.05). Correcting δ2H offsets in xylem water revealed an underestimation of groundwater contributions by 16.06±9.09 % in the dry season and 4.25±0.55 % in the rainy season. Given these interspecific and seasonal variations in water uptake patterns among sand-fixing plants, and the imperative for sustainable groundwater use, tailored water management strategies are essential to prevent the degradation of restored ecosystems in this water-limited desert region.


How to cite: Huang, L.: Adaptive water use strategies of artificially revegetated plants in a groundwater dependent ecosystem: Implications for sustainable ecological restoration, EGU General Assembly 2026, Vienna, Austria, 3–8 May 2026, EGU26-4457, https://doi.org/10.5194/egusphere-egu26-4457, 2026.

EGU26-5037 | ECS | Posters on site | HS8.3.4

Maintaining root–soil contact in drying soils: the role of mucilage and root hairs 

Sara Di Bert and Andrea Carminati

The rhizosphere plays a key role in regulating plant water uptake during soil drying, yet it is often represented in soil–plant models as hydraulically and mechanically equivalent to bulk soil. While the influence of root mucilage and extracellular polymeric substances (EPS) on rhizosphere water retention is well recognized, their mechanical role—together with that of root hairs—in controlling root–soil contact and soil structural dynamics remains insufficiently explored.

Recent biomechanical insights into drying liquid bridges reveal that polymer-rich solutions behave fundamentally differently from water. Whereas capillary water bridges weaken and fail during drying—particularly in coarse-textured soils such as sand—mucilage can form viscoelastic filaments that persist during drying and generate increasing tensile forces as the polymer network is stretched. As a result, the mechanical contribution of mucilage on maintaining root-soil contact is negligible in fine-textured soils where capillary forces are already strong but is particularly relevant in sandy soils where water bridges alone provide little mechanical adhesion.

These biomechanical properties have important consequences for root–soil contact dynamics and rhizosphere structure. Elastic polymer bridges, in combination with root hairs that increase contact area and provide additional anchoring points, offer a mechanism by which plants can maintain physical contact with the surrounding soil as roots shrink during drying. This mechanical reinforcement may delay both hydraulic disconnection and associated mechanical loss of contact of roots from the soil, preserving water uptake at water potentials where capillary connectivity alone would already be limiting.

At the same time, tensile forces generated by drying polymeric gels promote aggregation of soil particles, contributing to the formation of a mechanically coherent rhizosphere with altered pore geometry and connectivity. Such aggregation reinforces the distinction between rhizosphere and bulk soil properties and may further modulate local water distribution and hydraulic conductivity near the root surface.

This perspective highlights the need to move beyond purely hydraulic descriptions of the rhizosphere and to incorporate the mechanical effects of mucilage, EPS, and root hairs into conceptual and numerical models of root water uptake, particularly under drought conditions.

How to cite: Di Bert, S. and Carminati, A.: Maintaining root–soil contact in drying soils: the role of mucilage and root hairs, EGU General Assembly 2026, Vienna, Austria, 3–8 May 2026, EGU26-5037, https://doi.org/10.5194/egusphere-egu26-5037, 2026.

EGU26-5060 | Orals | HS8.3.4

The resilience of barley to drought in a changing climate is determined by its lateral root diameter 

Bo Fang, Johannes Postma, and Christian Kuppe

Climate change is intensifying droughts and threatening food security. Roots are the plants’ organ for water uptake and are crucial for their adaptation, with their structure being a decisive factor. In barley (Hordeum vulgare), lateral roots form~60% of the total root length and are important for water uptake. Hydraulic conductance scales strongly with root diameter: thicker laterals conduct more water per unit length but demand higher carbon for construction and maintenance. During soil drying, this creates a potential carbon-water trade-off. We test whether such a trade-off exists and whether it shapes drought resilience across environments by comparing the diameter that optimizes the trade-off with that maximizing shoot dry mass (SDM).

We used a functional–structural plant model (OpenSimRoot) to simulate barley growth across five climatically and pedologically contrasting global sites, representing different drought regimes. Simulations covered 50 growing seasons (2000–2049) using projected climate data and site-specific soils. Five lateral root diameter classes were evaluated, and outputs included shoot dry mass, root carbon allocation, and root hydraulic conductance. Drought performance was assessed by jointly considering productivity and efficiency-based metrics related to carbon investment and water transport capacity.

Across all environments, barley performance showed a clear dependence on lateral root diameter, with intermediate diameters generally balancing water uptake capacity and carbon costs. SDW and trade-off analyses converged on to the same diameter, reflecting a general trend. However, site-specific analyses revealed substantial divergence, reflecting differences in climate variability, soil properties, and drought characteristics. In several environments, finer lateral roots did not consistently confer advantages in either hydraulic efficiency or biomass production, challenging the notion of a universally optimal “cheap-root” strategy under drought.

A robust carbon–water trade-off underlies lateral root diameter; the diameter that performs best depends on the environment (climate and soil) and the objective (e.g., maximizing SDW versus efficiency/resilience). When data are pooled across all sites, SDM- and trade-off–based optima coincide, but site-level results differ; therefore, breeding for drought resilience should target site- and objective-specific trait values rather than a single fixed optimum.

How to cite: Fang, B., Postma, J., and Kuppe, C.: The resilience of barley to drought in a changing climate is determined by its lateral root diameter, EGU General Assembly 2026, Vienna, Austria, 3–8 May 2026, EGU26-5060, https://doi.org/10.5194/egusphere-egu26-5060, 2026.

Land-atmosphere exchange shifts from energy-limited to water-limited regime at a critical soil moisture, which marks a fundamental transition in the Earth system. Estimates of the critical threshold vary a lot across studies despite its importance for the mechanistic understanding of soil moisture limitation on transpiration and plant productivity.

We introduce a novel, model-based diagnostic approach — the Normalized Transpiration Deficit (NTD) method — and demonstrate that it yields results highly consistent with observational methods such as finding breakpoints in the evaporative fraction. Using a hydraulically-enabled version of the CABLE-POP land surface model, we conducted a factorial experiment across various soil textures, climate regimes, and plant hydraulic parameters. It suggests that the critical threshold occurs at a broadly similar soil matric potential (ψcrit) across soil types, resulting in a quasi-linear relationship between the critical volumetric soil moisture (θcrit) and sand content, as observed in earlier studies. The dependency of θcrit on soil type vanished when it was normalised by field capacity, which yielded hence also a universal threshold of relative extractible water REWcrit, as found empirically for forest ecosystems.

Most of the variance of θcrit, 86%, came from soil texture in the factorial experiment, while the variances of ψcrit and REWcrit were largely explained by plant hydraulic traits, accounting for 87% and 77% of total variance, respectively. Within the plant hydraulic traits, the P50-values of stomatal conductance (ψ50,l) and of xylem conductance (ψ50,x) showed the strongest correlations with the critical thresholds, indicating that vulnerability to hydraulic dysfunction plays a key role in shaping plant responses to soil drying. There was, however, no direct effect of climate on any of the critical thresholds, i.e. the thresholds remained invariant across climates for given soil and vegetation types. This suggests that apparent climate dependencies reported in observational studies may be artifacts due to limited soil moisture ranges at each observational site, or they represent biological adaptation and acclimation that is currently not captured in our static model parameters.

These findings highlight the necessity of incorporating ecosystem-scale hydraulic regulation in biosphere models to reconcile divergent estimates of critical thresholds and to improve predictions of drought impacts on water and carbon fluxes.

How to cite: Lu, Z. and Cuntz, M.: The soil matric potential where ecosystems get water-limited is independent of soil type and climate, EGU General Assembly 2026, Vienna, Austria, 3–8 May 2026, EGU26-5068, https://doi.org/10.5194/egusphere-egu26-5068, 2026.

EGU26-5961 | Orals | HS8.3.4

Plants as Engineers: Carbon Investment and Hydraulic Control in the Rhizosphere 

Mohsen Zare, Bahareh Hosseini, Ruth Adamczewski, and Samantha Spinoso Sosa

Plants actively modify the physical and chemical properties of the rhizosphere to regulate water and nutrient supply, particularly under soil drying conditions. Root mucilage has emerged as a key mediator of these interactions, yet quantitative, mechanistic evidence for how its hydraulic function depends on soil texture and moisture remains scarce. Here we synthesize results from a series of complementary experiments that together demonstrate that rhizosphere hydraulic regulation is an active, texture-dependent process driven by targeted carbon investment belowground.
We combined controlled rhizosphere model systems, isotope tracing, and neutron radiography to disentangle how mucilage alters water retention, unsaturated hydraulic conductivity, and solute diffusion across contrasting soil textures. Using mucilage extracted from maize seedlings, we quantified its effects in sand, sandy loam, and loam under varying moisture conditions. In parallel, we employed 14C pulse labelling and neutron imaging to directly link plant carbon allocation patterns to rhizosphere hydraulic outcomes under contrasting soil texture and water availability.
Across experiments, mucilage effects on rhizosphere hydraulics were strongly texture dependent. In coarse-textured soils, relatively high mucilage concentrations were required to increase water-holding capacity, whereas in finer-textured soils even small additions substantially enhanced retention. Mucilage reduced calcium diffusion in sandy soils across moisture levels, reflecting increased liquid-phase viscosity, while in fine-textured soils it prevented the sharp decline in diffusion during drying by maintaining liquid connectivity. Neutron radiography revealed consistently wetter rhizosphere zones compared to bulk soil, with the strongest hydration gradients occurring in sandy soils, precisely where hydraulic continuity is otherwise most fragile.
Carbon tracing further showed that plants actively adjust their belowground investment in response to soil physical constraints. In sandy soils, particularly under dry conditions, seminal, lateral, and crown roots exhibited elevated 14C allocation to the rhizosphere, indicating enhanced exudation. This sustained carbon investment coincided with root system architectures that maintained access to hydraulically buffered zones near the root surface. Together, these observations demonstrate that plants deploy more, and hydraulically more effective, mucilage where soil texture imposes the strongest physical limitations on water flow.

Taken together, these findings establish a mechanistic link between soil texture, carbon allocation to root exudation, and rhizosphere hydraulic regulation. They reposition mucilage from a passive by-product of root growth to a central component of plant drought strategy and highlight rhizosphere engineering as a key process shaping plant water relations across soils. This perspective opens new avenues for incorporating soil physical context into models of plant drought response and for developing soil- and crop-specific strategies to improve root-zone water availability under increasing climate extremes.

How to cite: Zare, M., Hosseini, B., Adamczewski, R., and Spinoso Sosa, S.: Plants as Engineers: Carbon Investment and Hydraulic Control in the Rhizosphere, EGU General Assembly 2026, Vienna, Austria, 3–8 May 2026, EGU26-5961, https://doi.org/10.5194/egusphere-egu26-5961, 2026.

EGU26-6379 | ECS | Posters on site | HS8.3.4

From Rhizotron Experiments to Functional–Structural Models: Quantifying Root Plasticity Under Soil Water Heterogeneity 

Erfan Nouri, Xavier Draye, and Mathieu Javaux

                         From Rhizotron Experiments to Functional–Structural Models: Quantifying Root Plasticity Under Soil Water Heterogeneity
                                                                                              Erfan Nouri, Xavier Draye, Mathieu Javaux
                                                                                                                         Abstract
Understanding root water uptake under heterogeneous soil moisture conditions is a central objective of this PhD, which aims to improve the mechanistic representation of root–soil interactions under climate-driven drought. Achieving this requires accurate, spatially resolved information on soil water availability at the scales experienced by individual roots rather than whole root systems. However, experimental approaches capable of quantifying soil moisture heterogeneity non-destructively and under controlled hydraulic conditions remain limited.

Within the HYDRA-MAIZE project, we developed a compartmentalized rhizotron platform designed to monitor root growth and soil moisture simultaneously under controlled soil water potential patterns. The system imposes stable, user-defined soil water potentials across
hydraulically isolated compartments while enabling optical measurements of soil moisture via light-transmission imaging.

We established a calibration framework that combines image-based light-transmission measurements with independent determination of soil water retention. Normalized light intensity is used to account for structural heterogeneity unrelated to water content, enabling
assessment of relationships between transmitted light, volumetric water content, and imposed suction. This provides a basis for evaluating theoretical and empirical formulations linking optical signals to soil moisture state.

The platform further enables quantification of spatial resolution and uncertainty in light-transmission-based water content estimation, both horizontally and vertically within rhizotron compartments. By resolving soil water availability at scales relevant to individual root segments, this setup will allow linking local and systemic morphological and hydraulic responses to soil water heterogeneity at high spatial and temporal resolution without
disturbing the plant or substrate. The platform will also support coupling rhizotron data with functional-structural plant models (FSPM) for quantitative analyses of root–soil interactions.

How to cite: Nouri, E., Draye, X., and Javaux, M.: From Rhizotron Experiments to Functional–Structural Models: Quantifying Root Plasticity Under Soil Water Heterogeneity, EGU General Assembly 2026, Vienna, Austria, 3–8 May 2026, EGU26-6379, https://doi.org/10.5194/egusphere-egu26-6379, 2026.

EGU26-7769 | ECS | Orals | HS8.3.4

Root-to-shoot surface ratio adaptation to soil hydraulic constraints: linking experiments to a soil-plant hydraulics model 

Basile Delvoie, Andrea Cecere, Sébastien Fauconnier, Andrea Carminati, and Mathieu Javaux

Climate change is associated with rising temperatures and an increased frequency of drought events. Plants growing in water-limited environments must develop strategies to adapt to soil water availability. In the short term, stomatal regulation enables the control of transpiration and maintenance of plant water status during drought. Under prolonged water deficit, plants are expected to adjust their shoot-root allocation to sustain growth and survival. Although these adaptive responses are conceptually intuitive, the underlying processes and controlling factors remain poorly understood. Understanding short- and long-term plant responses to drought is crucial for investigating plant adaptation to climate changes.

In this work, we hypothesize that soil properties and climatic demand are key factors affecting plant stomatal conductance in the short term and root-to-shoot surface ratio (RSSR) over the longer term. Indeed, results of a simplified soil-plant hydraulic model demonstrated that the regulation of stomatal conductance and of RSSR should be texture dependent. We investigate these relationships through experiments conducted under controlled environmental conditions. Specifically, we assess how soil water content and soil type influence the RSSR of an isohydric species (maize) and an anisohydric species (sunflower). The experimental findings are subsequently analysed using a simplified soil-plant hydraulic model.

The experiment was conducted in a growth chamber controlling photoperiod, temperature, relative humidity, PAR, and VPD. Maize and sunflower were grown in pots using two contrasting substrates, sand and loam, whose hydraulic properties were characterized using the Hyprop system. Two irrigation regimes were imposed to maintain soil water content within predefined target ranges. Each of the 8 species × substrate × treatment combinations included 10 replicates.

Root and shoot biomass and surface were measured at 3 collects to capture plant growth dynamics. Soil water content was monitored by gravimetric measurements before and after each irrigation, with irrigation volumes adjusted to maintain the target moisture range. In addition, stomatal conductance and leaf water potential were punctually measured to characterize plant functioning.

We used a simplified soil-plant hydraulic model representing the system as three resistances in series (soil, roots, xylem), driven by soil-to-leaf water potential gradients (Carminati & Javaux, 2020). This model was employed to predict the optimal RSSR maximizing carbon assimilation while minimizing the risk of embolism.

Our results show that, despite differences in leaf and root surfaces, RSSRs remain within a similar range for both species. RSSR adaptation to soil texture is lower in maize (isohydric) than in sunflower (anisohydric). In addition, RSSR strongly depends on soil water potential (ψsoil), with a stronger response in sunflower. This relationship is further constrained by soil texture through its hydraulic conductivity. For a given RSSR, plants grown in loam are able to sustain at lower ψsoil compared with those grown in sand. To survive at similar ψsoil in a sandy soil, plants would require a substantial increase in RSSR. However, root active surface depends on soil types and modulates the RSSR-ψsoil relationship. Model predictive potential could be further improved by including additional information on active root surface.

How to cite: Delvoie, B., Cecere, A., Fauconnier, S., Carminati, A., and Javaux, M.: Root-to-shoot surface ratio adaptation to soil hydraulic constraints: linking experiments to a soil-plant hydraulics model, EGU General Assembly 2026, Vienna, Austria, 3–8 May 2026, EGU26-7769, https://doi.org/10.5194/egusphere-egu26-7769, 2026.

Cadmium (Cd), a non-essential and toxic heavy metal, severely disrupts plant physiological and biochemical processes by inducing programmed cell death (PCD). Nitric oxide (NO) and hydrogen sulfide (H₂S) are key signaling molecules involved in plant stress responses, but the molecular mechanisms underlying their crosstalk in Cd-induced PCD remain elusive. Here, we first demonstrated that Cd-triggered PCD is accompanied by NO bursts, where NO dynamically modulates PCD progression—exacerbating cell death when depleted and alleviating it when present. Proteomic analysis of S-nitrosylated proteins revealed that differential S-nitrosylation targets in Cd-induced vs. NO-alleviated PCD are enriched in carbohydrate metabolism and amino acid metabolism, with unique targets in cofactor/vitamin metabolism and lipid metabolism. Additionally, S-nitrosylation of proteins involved in porphyrin/chlorophyll metabolism and starch/sucrose metabolism contributes to Cd-induced leaf chlorosis, while in vivo S-nitrosylation of SEC23 (protein transport), ubiquitinyl hydrolase 1, and pathogenesis-related protein 1 was confirmed, with their expressions upregulated in Cd-induced PCD but downregulated by NO treatment (consistently observed in tomato seedlings with elevated S-nitrosylation levels). Building on this foundation, further investigation using GSNOR (S-nitrosoglutathione reductase, a key regulator of NO homeostasis) and LCD (L-cysteine desulfhydrase, a core enzyme for H₂S biosynthesis) knockout and overexpressing transgenic tomato (Solanum lycopersicum L.) demonstrated that both GSNOR and LCD inhibit Cd²⁺-induced PCD. GSNOR and LCD knockout plants exhibited increased Cd sensitivity and enhanced cell death compared to wild-type controls. Mechanistically, S-nitrosylation of GSNOR at Cys47 and LCD at Cys225 altered their subcellular localization, reduced their enzymatic activities, promoted Cd²⁺ uptake, and thereby accelerated PCD. Notably, S-nitrosylation attenuated the interaction between GSNOR and LCD during PCD progression. Collectively, our findings establish that NO modulates Cd-induced PCD via protein S-nitrosylation, and GSNOR-LCD interactions, together with their post-translational S-nitrosylation, constitute a critical regulatory node integrating NO and H₂S signaling in plant responses to Cd stress. These results provide novel insights into the molecular network underlying heavy metal-induced PCD and the regulatory roles of S-nitrosylation in NO-H₂S crosstalk.

How to cite: Huang, D., Chai, Q., and Liao, W.: S-Nitrosylation of GSNOR and LCD integrates NO and H2S signaling to regulate cadmium-induced programmed cell death in tomato, EGU General Assembly 2026, Vienna, Austria, 3–8 May 2026, EGU26-7782, https://doi.org/10.5194/egusphere-egu26-7782, 2026.

EGU26-8245 | Orals | HS8.3.4

Divide or expand? Implications of root growth physiology for soil carbon inputs 

Tino Colombi, Anke Herrmann, Jonathan Atkinson, Rahul Bhosale, Sacha Mooney, Craig Sturrock, and Sofie Sjögersten

Plants and their ability to capture atmospheric CO2 are indispensable for the buildup of soil organic matter, underscoring their crucial role in terrestrial carbon cycling. Yet, the plant physiological processes regulating soil carbon inputs and their environmental controls remain severely underrepresented in soil carbon research, which limits our understanding of soil carbon sequestration potential across biomes and land uses. Root biomass constitutes a major input of organic matter to soil that is particularly difficult to estimate. Here, we outline a framework for the explicit integration of root growth physiology into soil carbon dynamics. Using data acquired in rice (Oryza sativa, L.), we provide mechanistic evidence that the expansion of cortical cells in growing roots is a key process determining the fate of the carbon plants allocate to their root system. We combined measurements of carbon partitioning between biomass formation and respiration in growing roots with three-dimensional quantifications of root cortical cell size using high resolution (1.8 μm) X-ray Computed Tomography. With increasing cortical cell size, indicating greater contribution of cell expansion over cell division to root growth, more carbon was allocated to root biomass formation and less to root respiration (R2 = 0.83). We then integrated our experimental findings with data obtained from the literature covering different land use types to highlight the fundamental importance of including root physiological processes in estimating soil carbon inputs. The established structural-functional relationships between root cortical cell size and carbon partitioning point out the paramount role of root physiology in improving our understanding and prediction of carbon fluxes and retention in plant-soil systems. We therefore propose that measurements of root cortical anatomy be included when assessing global change impacts on soil carbon inputs and the potential of soils to sequester carbon.

How to cite: Colombi, T., Herrmann, A., Atkinson, J., Bhosale, R., Mooney, S., Sturrock, C., and Sjögersten, S.: Divide or expand? Implications of root growth physiology for soil carbon inputs, EGU General Assembly 2026, Vienna, Austria, 3–8 May 2026, EGU26-8245, https://doi.org/10.5194/egusphere-egu26-8245, 2026.

Canopy water use efficiency (WUEc) is an important indicator for understanding the coupling between water and carbon processes in agroecosystems. In arid irrigation districts with shallow groundwater which is an important source of evapotranspiration (ET), previous studies have demonstrated that groundwater table depth (WTD) influences the crop water use efficiency. The dynamic response of water use efficiency at the maize canopy scale to WTD remains unclear, particularly regarding the physiological differences across growth stages, which is critical for understanding plant water-use regulation within the soil-plant-atmosphere continuum under shallow groundwater conditions. Based on eddy covariance observations from 2017 to 2019, along with ET partitioning and statistical modeling, this study systematically analyzed the variations in WUEc and its environmental drivers, with a focus on the stage-dependent responses of photosynthesis and transpiration to WTD. The results showed that average T/ET was 85.7% over the three growing seasons, while groundwater contribution to ET was 38.2%, 37.3%, and 29.9% in 2017, 2018, and 2019, corresponding to mean groundwater depths of 1.60 m, 1.76 m, and 1.81 m, respectively. Mean WUEc was 2.28 ± 0.75, 2.22 ± 1.14, and 3.43 ± 1.01 g C kg⁻¹ H₂O in the three years. The fluctuations in WTD significantly affected WUEc, especially in years with relatively low surface water input. The standardized WUEc (WUEz), which excluded the effects of crop development and atmospheric evaporative demand, decreased with deepening WTD during the vegetative growth stage but increased during the reproductive stage. This shift stemmed from the differential sensitivity of canopy photosynthesis and transpiration to WTD at each stage. During the vegetative stage, a deepening WTD caused the standardized photosynthesis (NEPz) to decline more sharply than transpiration (Tz), reducing WUEz. In contrast, during the reproductive stage, both NEPz and Tz increased in response to a deeper WTD, but the greater increase in NEPz led to an overall rise in WUEz. This study reveals a previously unreported, stage-dependent pattern in how crop water-carbon coupling responds to variations in groundwater depth. Our findings provide critical empirical evidence for refining the representation of plant water use regulation under soil water stress in ecohydrological models.

How to cite: Wu, P. and Huo, Z.: Stage-dependent response of maize canopy water use efficiency to groundwater depth: insights from ecosystem flux observations, EGU General Assembly 2026, Vienna, Austria, 3–8 May 2026, EGU26-9393, https://doi.org/10.5194/egusphere-egu26-9393, 2026.

EGU26-11319 | ECS | Orals | HS8.3.4

Earthworm and Plant Root Bioturbation Succession in Compacted Soil Revealed by 2D Rhizobox and X-ray CT Imaging 

Oliver Clark-Hattingh, Conor Wright, Ehsan Nazemi, Fernando Alvarez Borges, Chris Sandom, Tiina Roose, Daniel McKay Fletcher, Katherine A Williams, and Siul Ruiz

Soil structure plays a vital role in ecosystem functioning. Earthworms and plant roots are key bioturbation agents crucial to building and maintaining soil structure suitable for agriculture. However, following soil compaction, the succession of biophysical activity between these agents remains unclear and understanding this dynamic is critical for sustainable soil management.  This study utilised imaging techniques to assess how compaction affects bioturbation by endogeic earthworms and barley roots and their impact on soil functionality (e.g. hydraulic conductivity, water retention, etc.). To this end, two experimental systems were established: (i) rhizoboxes for 2D imaging, photographed regularly over a six-weeks, and (ii) PVC cylinders for X-ray computed tomography (XCT), scanned at trial end. Each system included compacted and uncompacted treatments, with earthworms and barley co-incubated. Compacted systems were surface loaded at 150kPa. Rhizobox imaging tracked biopore formation and interactions between bioturbation agents, while XCT provided high resolution 3D structural data subsequent to bioturbation. Image analysis involved segmenting biopores using thresholding and filtering techniques, such as median and Gaussian for the 2D images and non-local means for 3D XCT images. These methods enabled us to compare the structural characteristics of the biopore systems (i.e. number of biopores, branches, thickness, branch length, etc.). Both image types were skeletonised and combined with local thickness maps to extract the structural metrics assessed.  Results showed compaction reduced mean trends in earthworm bioturbation activity, while root activity largely stayed the same. The results from the XCT data showed that hydraulic conductivity increased markedly after bioturbation, increasing two orders of magnitude in uncompacted and three orders of magnitude in compacted soil. We concluded that for soil restoration, this suggests a sequential approach, with initial cover crop planting to alleviate compaction stress, enabling earthworms to proliferate and create the structure needed to maintain healthy soil functioning and productivity.

How to cite: Clark-Hattingh, O., Wright, C., Nazemi, E., Alvarez Borges, F., Sandom, C., Roose, T., McKay Fletcher, D., Williams, K. A., and Ruiz, S.: Earthworm and Plant Root Bioturbation Succession in Compacted Soil Revealed by 2D Rhizobox and X-ray CT Imaging, EGU General Assembly 2026, Vienna, Austria, 3–8 May 2026, EGU26-11319, https://doi.org/10.5194/egusphere-egu26-11319, 2026.

EGU26-11437 | ECS | Orals | HS8.3.4

Impact of heavy rainfall and liquid fertilizers on microbial communities and leachate in compost-amended soil 

Helena Vukosavljevic, Xin-Yuan Li, Miriam Monschein, Wisnu Adi Wicaksono, Josef Schneider, Gabriele Berg, and Samuel Bickel

Climate change is increasing risks to agriculture and soil stability, with soil erosion and flooding being significant global threats that reduce crop yields and degrade soil quality. Tightly correlated with the soil’s response to these changes are the impactful and diverse soil microbiota. As primary drivers of organic matter decomposition, microorganisms convert plant inputs into humus and cell residues. This enhances soil’s physical structure, improves pore formation, and consequently, water-retention and infiltration capacity.

To identify and model the effects of agricultural practices, the CARA project [1] is implementing bacterial traits to improve soil resilience under current and future rainfall conditions. This was achieved using a carefully designated rainfall simulator, capable of precisely regulating droplet size and precipitation intensity while maintaining natural terminal velocity, thereby enabling the recreation of various rainfall scenarios. Two scenarios were selected and tested on artificial soil columns with varying content of compost-based organic matter: a current scenario, relating to the precipitation events in Austria, and a future scenario, anticipating increased rainfall intensity and longer dry periods. Furthermore, certain soil columns were supplemented with animal- and plant-based liquid fertilizers to enhance microbial activity.

The aim was to assess the influence of microbial activity on soil structure and its capacity for water retention. We identified that the precipitation scenarios exhibited distinct microbiomes across the treatments and over time, with rainfall intensity influencing soil microbial communities by washing out specific taxa, such as Bacilli and Limnochordia, which were subsequently detected within the leachate. Validation experiments in microcosms confirm the observed evaporation reduction and the treatments with liquid fertilizer showed the highest water retention. Our findings offer a basis for evaluating microbiome-based strategies to enhance soil resilience under climate-driven changes in rainfall patterns.


[1] Climate change adaptation through flood-reducing agriculture (CARA): https://projekte.ffg.at/projekt/4754252


How to cite: Vukosavljevic, H., Li, X.-Y., Monschein, M., Wicaksono, W. A., Schneider, J., Berg, G., and Bickel, S.: Impact of heavy rainfall and liquid fertilizers on microbial communities and leachate in compost-amended soil, EGU General Assembly 2026, Vienna, Austria, 3–8 May 2026, EGU26-11437, https://doi.org/10.5194/egusphere-egu26-11437, 2026.

Plant roots draw soil water locally, increasing the moisture heterogeneity in the soil at the onset of drought. The resulting heterogeneity presents a major challenge for linking observed flux rates to measured soil moisture values using process-based models. As such, soil moisture heterogeneity is a key remaining hurdle to robust, mechanistic predictions of forest canopy fluxes under water limitation and a stubborn source of uncertainty in predictions of the future terrestrial carbon cycle.

Several recent theoretical advances in describing soil-root water flow at plant or larger scale despite heterogeneous moisture distributions (e.g., Hildebrandt et al., 2016; Vanderborght et al., 2021) share one potentially central feature: the conductance- or flux- weighting of water potential at the soil-root interface. Flux-weighted water potential may be a key concept capable of characterising the hydrodynamic state of the soil-plant system in a single value regardless of its instantaneous heterogeneity.

Given the apparent theoretical promise of this concept, we should ask whether we can infer its values from field observations and, if so, what and how to measure. The challenges of directly measuring plant water potential over time are already daunting aboveground. Maintaining a dense network of probes for soil water content and water potential at substantial cost and effort may not yield relevant values, since the potential drop toward the root is nonlinear and largest over the final millimetres of soil. One potentially promising avenue for field observations is afforded by recent advances in optical methods both above and below ground. Separately, key parameters arising from the process-based models will need to be constrained in lab-based experiments. Collaborators within the ongoing HydroScale project aim to develop a complex approach combining traditional and innovative techniques sufficient to infer flux-weighted potentials from field data.

How to cite: Bouda, M.: Can we observe flow-weighted water potential at the root-soil interface in heterogeneously moist soils?, EGU General Assembly 2026, Vienna, Austria, 3–8 May 2026, EGU26-12198, https://doi.org/10.5194/egusphere-egu26-12198, 2026.

EGU26-12447 | ECS | Orals | HS8.3.4

Root Hairs as an Integral Buffer in Stomatal Control of Plant Water Status 

Florian Stoll, Patrick Duddek, and Andrea Carminati

Root hairs are assumed to enhance plant water uptake by increasing root surface area and effective root radius, thereby reducing dissipation of soil water potential in the rhizosphere and increasing transpiration. However, recent field observations indicate that their dominant hydraulic role emerges at short time scales through dynamic regulation of the soil–plant system rather than through steady-state flux enhancement.

Field measurements show that transpiration rates scale with soil texture, with plants in coarse-textured soils transpiring at lower rates than those in finer soils. This reduction reflects longer-term structural and physiological adjustment of the plant (e.g. shoot–root allocation), rather than short-term stomatal control. In contrast, steady-state transpiration has little sensitivity to the presence or absence of root hairs. Instead, plants lacking root hairs exhibit rapid and pronounced dissipation and oscillations of leaf water potential during periods of high atmospheric vapor pressure deficit, particularly in coarse-textured soils. These fluctuations occur on time scales of minutes to tens of minutes, overlapping with typical stomatal response times. In contrast, plants with root hairs showed smooth, non-oscillatory leaf water potential dynamics.

We propose that the most prominent hydraulic effect of root hairs is to buffer excessive oscillations in leaf water potential that are too fast compared to stomatal response kinetics. Root hairs introduce a physical buffering component by increasing the volume of water that can be extracted from the rhizosphere. In this way root hairs integrate short-term fluctuations in transpiration demand and damp rapid water potential changes. In the absence of root hairs, this buffering term is missing, leaving the system vulnerable to high-frequency disturbances that outpace stomatal adjustment.

To investigate this mechanism, we develop a mechanistic soil–plant hydraulic model that explicitly represents rhizosphere processes associated with root hairs and couples them with a dynamic stomatal response model. The model resolves transient water flow and storage and is used to quantify how root hairs modify system capacitance, damping, and stability across soil textures and atmospheric demand.

By focusing on transient dynamics rather than steady-state fluxes, this modelling study advances fundamental understanding of root water uptake regulation and highlights the rhizosphere as a key hydraulic bottleneck which affects the whole plant hydraulic system.

How to cite: Stoll, F., Duddek, P., and Carminati, A.: Root Hairs as an Integral Buffer in Stomatal Control of Plant Water Status, EGU General Assembly 2026, Vienna, Austria, 3–8 May 2026, EGU26-12447, https://doi.org/10.5194/egusphere-egu26-12447, 2026.

EGU26-13463 | ECS | Orals | HS8.3.4 | Highlight

The Timing of Soil Hydraulic Constraints Shapes Plant Drought Responses 

Saniv Gupta, Andreas J. Wild, Alica Heid, Jessica Thiel, Jonas Humpert, Martin Wiesmeier, Tillmann Lueders, Johanna Pausch, Benjamin Hafner, and Mohsen Zare

As soils dry, soil hydraulic conductivity (Ks) declines nonlinearly and can become a dominant bottleneck to root water uptake, constraining plant gas exchange. Although drought regulation involves both physiological and structural mechanisms, it remains unclear how these mechanisms differ between plants exposed to drought during early development versus at later developmental stage, and how soil texture and its hydraulic behavior shape regulation of soil–plant water relations. The objective of this study was to resolve how the timing of drought exposure reorganizes regulation of the soil–plant–atmosphere continuum (SPAC). Specifically, we aimed to (i) compare drought imposed from early vs at late developmental stage in terms of their reliance on physiological versus structural mechanisms of water-use regulation, and (ii) assess how soil texture and hydraulic trajectories condition these mechanisms.

We addressed these objectives using a controlled phenotyping experiment with six maize genotypes (three landraces and three hybrids) grown in contrasting soil textures (sandy loam and silt loam). Drought was imposed either continuously from the onset of growth or at later stage of plant development. Whole-plant transpiration, plant and soil water potentials, and above- and belowground structural traits were quantified to resolve SPAC regulation under contrasting drought timings.

Across soils and genotypes, transpiration declined to comparable fractions of its maximum within a narrow range of Ks, despite large differences in soil water content (θ) and matric potential (Ψsoil) between sandy loam and silt loam, this identifies Ks rather than θ or Ψsoil as the dominant physical control governing transpiration downregulation. Additionally, SPAC regulation differed strongly with drought timing. Under drought, imposed from early development, plants primarily reduced whole-plant water use through structural downscaling, characterized by reduced shoot area and increased root-to-shoot ratios, while maintaining relatively high transpiration rates per unit leaf area. In contrast, plants exposed to drought at later stage retained larger shoot area but reduced transpiration predominantly through strong stomatal regulation, resulting in lower transpiration rates per unit leaf area at comparable Ks and xylem water potential.

Belowground responses mirrored these contrasting strategies. Drought from onset promoted coordinated structural adjustment, including higher total root length, finer mean root diameters, and enhanced rhizosheath formation relative to late drought. These traits increased effective uptake surface area and were associated with higher soil–plant hydraulic conductance under low Ks. Across soils, high-performing plants converged on a common belowground trait syndrome, characterized by high total root length, fine roots, and enhanced rhizosheath formation, although the genotypes expressing this syndrome differed between soil textures.

Overall, our findings show that drought responsiveness emerges from the interaction between the soil’s hydraulic limit and its timing during development. Accounting for the temporal dynamics of hydraulic constraint, rather than treating drought as a static stress, providing a mechanistic framework to link soil texture, plant traits, and genotypic performance, with implications for targeted breeding and improved crop resilience under increasing climate extremes.

How to cite: Gupta, S., Wild, A. J., Heid, A., Thiel, J., Humpert, J., Wiesmeier, M., Lueders, T., Pausch, J., Hafner, B., and Zare, M.: The Timing of Soil Hydraulic Constraints Shapes Plant Drought Responses, EGU General Assembly 2026, Vienna, Austria, 3–8 May 2026, EGU26-13463, https://doi.org/10.5194/egusphere-egu26-13463, 2026.

EGU26-14102 | ECS | Posters on site | HS8.3.4

Relations of salinity and soil physico-chemical and hydraulic properties in the Salar del Huasco, Chile 

Carolina Giraldo, Cristina P. Contreras, Sara E. Acevedo, Sarah Leray, Amanda Peña, and Francisco Suárez

High-Andean wetlands in northern Chile are fragile arid ecosystems that sustain biodiversity, water resources, and cultural heritage. These systems are increasingly threatened by climate change, water scarcity, and mining activities. Despite their ecological relevance, soil properties and their spatial variability in these environments remain poorly characterized. This study investigates the relationship between soil salinity and physical, chemical, and hydraulic properties in the Salar del Huasco salt flat. A combined field and laboratory approach was employed. In-situ measurements were conducted during the dry season and included soil moisture, soil temperature, electrical conductivity, and saturated hydraulic conductivity at a depth of 5 cm. Laboratory analyses compromised pH, organic matter content, cation exchange capacity, soluble cations, and aggregate stability. Field results showed that, in general, soil water content and electrical conductivity were higher in areas closer to water bodies, while soil temperature was lower. In the eastern and western zones, located very close to water bodies, soil water content reached 0.17 and 0.23 m³ m⁻³, electrical conductivity values were 1,435.05 and 1,429.42 µS cm⁻¹, and soil temperatures were 16.72 and 15.86 °C, respectively. In contrast, the northern zone exhibited lower soil water content (0.14 m³ m⁻³) and electrical conductivity (444 µS cm⁻¹). Regarding hydraulic properties, the northern zone showed the highest saturated hydraulic conductivity (0.0043 cm s⁻¹), whereas the southern zone exhibited the lowest value (0.0002 cm s⁻¹). Laboratory results indicated predominantly saline soils, characterized by a mean pH of 9.73 (± 0.59) and an average electrical conductivity of 1,167.84 (± 1,288.72) µS cm-1. Among soluble cations, sodium was the dominant species, exhibiting the highest mean concentration (330.17 ± 208.27 meq L⁻¹), followed by potassium (67.65 ± 75.30 meq L⁻¹). In contrast, calcium and magnesium showed comparatively lower mean concentrations of 19.72 ± 15.15 meq L⁻¹ and 11.15 ± 13.44 meq L⁻¹, respectively. Regarding anions, chloride and sulfate were the most abundant, with mean concentrations of 203.51 ± 169.18 meq L⁻¹ and 214.46 ± 155.65 meq L⁻¹, respectively, whereas bicarbonate concentrations were markedly lower (9.23 ± 6.15 meq L⁻¹). Aggregate stability ranged from low to moderate, with an average value of 50 ± 17 %. Marked spatial differences were observed across the salt flat. The northern zone exhibits higher aggregate stability (72%), sand content (71%). In contrast, the southern zone showed higher electrical conductivity (10,486 µS cm-1), silt content (49%), and higher concentrations of soluble calcium (37 meq/L), magnesium (35.42 meq/L), sodium (425.67 meq/L), bicarbonates (11.2 meq/L), and chlorides (356.57 meq/L). The western zone presented the highest pH (10.06), while the eastern zone displayed intermediate values for most variables. These results revealed pronounced spatial heterogeneity in soil properties within the Salar del Huasco salt flat, suggesting differentiated hydro-saline dynamics at the sub-basin scale. Accounting for this variability is essential to support conservation strategies and the sustainable management of high-Andean wetlands under increasing environmental pressure.

How to cite: Giraldo, C., Contreras, C. P., Acevedo, S. E., Leray, S., Peña, A., and Suárez, F.: Relations of salinity and soil physico-chemical and hydraulic properties in the Salar del Huasco, Chile, EGU General Assembly 2026, Vienna, Austria, 3–8 May 2026, EGU26-14102, https://doi.org/10.5194/egusphere-egu26-14102, 2026.

EGU26-14212 | Orals | HS8.3.4

Ecotones as biological outcomes: spatial variation in tree water use across a boundary of a fog forest. 

Aurora Gaxiola, Víctor García, Álvaro Gutiérrez, and Adrian Rocha

Semi-arid coastal basins where fog sustains fragmented forest patches provide a powerful natural laboratory for examining how vegetation–microclimate feedbacks shape ecotone position and stability. Yet most studies of woodland–open vegetation transitions treat ecotones as passive boundaries imposed by climate or soil conditions, rather than as zones where plant water-use strategies may actively reinforce or relax those boundaries. Here, a coastal Chilean fog forest–shrub ecotone is used to evaluate whether tree water can biologically promote ecotone persistence.

We studied fog-fed relict forests of the endemic temperate tree species Aextoxicon punctatum found on mountain tips of the semiarid coast of central Chile. We quantified sap flux and microclimatic conditions along a transect spanning forest edge to interior, using long-term sap flow measurements from 13 trees of A. punctatum, the dominant tree species in these forest patches, combined with continuous records of temperature, humidity, and vapor pressure deficit (VPD). This design allowed us to assess how tree water use responds to contrasting microclimatic environments across the ecotone.

We found strong edge-to-interior gradients in microclimate, with forest edges experiencing higher temperatures, higher VPD, and greater microclimatic variability than the forest interior. Correspondingly, tree water use differed systematically with tree position along the edge-to-interior gradient. Edge trees exhibited distinct seasonal dynamics and greater sensitivity to atmospheric conditions compared to interior individuals, particularly during periods of higher water availability. Contrary to expectations for a strictly water-limited temperate system, tree water use peaked during cool, foggy autumn and winter months, and contrasts between edge and interior trees were strongest during periods of high water availability, when trees used water most liberally. These patterns indicate that trees occupying different positions within the ecotone persist under contrasting physiological constraints and capacities.

Together, these results support the idea that forest–shrub ecotones are not merely passive boundaries imposed by climate, but may be biologically reinforced by spatial variation in tree water-use strategies. We further suggest that tolerance to edge microclimates, potentially coupled with the ability to exploit non-rain water inputs, may contribute to the persistence and resilience of fog-inundated forest patches. This perspective highlights ecotones as dynamic zones where individual-level physiological performance shapes vegetation boundaries, with implications for predicting coastal dry–humid transitions under climate change.

How to cite: Gaxiola, A., García, V., Gutiérrez, Á., and Rocha, A.: Ecotones as biological outcomes: spatial variation in tree water use across a boundary of a fog forest., EGU General Assembly 2026, Vienna, Austria, 3–8 May 2026, EGU26-14212, https://doi.org/10.5194/egusphere-egu26-14212, 2026.

EGU26-15088 | ECS | Orals | HS8.3.4

Rooted in reciprocity: interactions and feedbacks in the soil-plant hydraulic continuum 

Zishu Tang, Manon Sabot, Ana García Leher, Anke Hildebrandt, Antonia Pachmann, Anne Verhoef, Enrico Weber, and Max Wittig

Soils play a critical role in regulating plant water availability, with characteristics like bulk density, porosity, and texture determining soil hydraulic properties, that is, properties that affect the soil water retention and water transport. Together with mycorrhizal activity, which influences the conductance of water between the soil and the roots, soil hydraulic properties affect the ease with which plants can access soil water. In turn, root growth also modifies soil structures and mycorrhizal communities, influencing soil water retention and soil hydraulics. Despite a good theoretical understanding of the dynamic interactions between soils and plants, limited information is available on: (i) how much soil texture affects plant hydraulic properties across plant species; and (ii) how much plant roots affect soil hydraulic properties across soil textures. To assess the extent of the feedback loop between soil and plant hydraulics, we transplanted 4-year-old Quercus robur (N=12) and Quercus cerris (N=12) saplings into either a loam or a clay loam, in equal numbers for each species. Following an acclimation period of three to five months, a total of 28 soil water retention curves were measured from soil cores collected at depths of 7-12 cm, 25-30 cm, and 55-60 cm in the vicinity of the trees (i.e., likely to contain root fragments, mycorrhiza, etc.). We measured a further eight water retention curves in the absence of trees, allowing the determination of a baseline of soil hydraulic characteristics. Finally, after the soil sample collection, we established two hydraulic vulnerability curves per tree. Preliminary results show no indication of plant hydraulic acclimation to soil under well-watered conditions. The presence of tree roots affected soil bulk density at depth in the loam, as well as hydraulic properties like the field capacity at -33 kPa and the permanent wilting point, but not in the clay loam. Whether these effects are the same after longer acclimation periods or under water-stress conditions remains to be determined.

How to cite: Tang, Z., Sabot, M., García Leher, A., Hildebrandt, A., Pachmann, A., Verhoef, A., Weber, E., and Wittig, M.: Rooted in reciprocity: interactions and feedbacks in the soil-plant hydraulic continuum, EGU General Assembly 2026, Vienna, Austria, 3–8 May 2026, EGU26-15088, https://doi.org/10.5194/egusphere-egu26-15088, 2026.

EGU26-15727 | Orals | HS8.3.4

Soil Structure under No-Tillage Enhances Soybean Root Growth and Access to Subsoil Water 

Moacir Tuzzin de Moraes, Luiz Henrique Quecine Grande, John Kennedy dos Santos, Matheus Batista Neri Pereira, Renato Paiva de Lima, Alvadi Antonio Balbinot Junior, and Henrique Debiasi

Soil structure can mitigate both mechanical impedance and water stress, thereby modulating root elongation and access to deep soil water. Although process-based root growth models represent soil–root interactions, they rarely account explicitly for structural conditions and their consequences for the combined effects of water and mechanical stresses on root growth. We quantify how soil structure under no-tillage influences soybean root elongation, effective rooting depth, and water-deficit mitigation, and we parameterize these effects in a biophysical root-growth model. A long-term field experiment established in 2016 compared three cropping systems preceding soybean (Glycine max): ruzigrass (Urochloa ruziziensis), maize (Zea mays), and fallow. Soybean root length density and soil physical attributes were measured in nine layers down to 210 cm. Effective rooting depth was defined as the depth containing 95% of total root length. Plant-available water was computed from soil water retention between −60 and −15,000 hPa, and readily available water was assumed as 50% of plant-available water within the rooted zone. Grain yield was determined at harvest. In addition, soybean root elongation rate was measured in the laboratory using core from field and repacked samples across gradients of degree of saturation and soil penetration resistance. The structural effect was incorporated as a parameter in a biophysical model that combines water and mechanical limitations to root elongation. Increasing soil penetration resistance from 1.0 to 3.5 MPa reduced relative root elongation by 46% in preserved structure, whereas reductions reached 76% in repacked soil. At 0.5 MPa and 60% degree of saturation, elongation in repacked soil was 29% higher than in preserved structure, but both structural conditions converged as soil penetration resistance increased to 1.0 MPa. Under 90% degree of saturation, elongation in preserved structure was nearly threefold that in repacked soil. In the field, effective soybean rooting depth (in a trench of 210 cm depth) differed among previous cropping systems, with ruzigrass promoting substantially deeper roots (154.7 cm at 95% cumulative distribution) compared with maize (127.9 cm) and fallow (121.0 cm). Root length density in the 0 to 10 cm layer was highest after ruzigrass (4.72 cm cm-3), followed by maize (3.33 cm cm-3) and fallow (2.48 cm cm-3). Cumulative root length in the soil profile from 0 to 210 cm reached 202.2 cm cm-2 after ruzigrass, compared with 128.4 cm cm-2 after maize and 94.3 cm cm-2 after fallow. Soybean yield was 2.9 (after ruzigrass), 2.6 (after maize), and 2.1 Mg ha-1 (after fallow). Plant-available water in the soybean root zone was 175 mm after ruzigrass, compared with 145 mm after maize and 140 mm after fallow, indicating a 25% increase relative to fallow. Assuming evapotranspiration of 7 mm d-1, this represents approximately 15 days of water supply after ruzigrass versus 12 days after fallow. Preserved soil structure improved soybean root performance under strong physical constraints and increased deep water access. Explicitly representing soil structural conditions in simulation models can improve predictions of rooting depth and drought mitigation under no-tillage.

Acknowledgements: AGRISUS Foundation [PA 3534/23], CNPq [409621/2023-4] and FAPESP [23/10427-3 and 23/11945-8].

How to cite: Tuzzin de Moraes, M., Quecine Grande, L. H., dos Santos, J. K., Batista Neri Pereira, M., Paiva de Lima, R., Balbinot Junior, A. A., and Debiasi, H.: Soil Structure under No-Tillage Enhances Soybean Root Growth and Access to Subsoil Water, EGU General Assembly 2026, Vienna, Austria, 3–8 May 2026, EGU26-15727, https://doi.org/10.5194/egusphere-egu26-15727, 2026.

EGU26-15862 | ECS | Posters on site | HS8.3.4

Interactive Effects of Plant Growth-Promoting Rhizobacteria and CO2 levels on Prince Ginseng Health and Quality 

Wen Hui Yan and Charles Wang Wai Ng

The cultivation of medicinal plants focuses not only on biomass yield, but also on the health and quality of medicinal organs with therapeutic effects. Threatened by soil-borne pathogenic fungi Fusarium, the health and quality of Prince Ginseng Pseudostellaria heterophylla (P. heterophylla) is severely reduced. Plant growth-promoting rhizobacteria (PGPR), as a promising sustainable alternative, have demonstrated potential for biocontrol and soil fertilisation. However, PGPR efficacy is significantly influenced by abiotic factors, such as atmospheric CO2 concentration, which govern plant growth. To investigate the interactive effects of PGPR (Bacillus subtilis and Pseudomonas fluorescens) and CO2 levels (425 ppm and 1000 ppm) on P. heterophylla tuber health and quality, greenhouse experiments were conducted. Results show that Pseudomonas fluorescens, coupled with elevated CO2, synergistically decreases tuber disease incidence by 73% and increases the content of active ingredient polysaccharide by 253%. These improvements can be attributed to the suppressed abundance of Fusarium oxysporum and enhanced root development. Biocontrol bacteria, including Actinobacteria and Proteobacteria, are recruited, especially the genera Bradyrhizobium and Rhodanobacter. The reshaping of the rhizosphere microbiome is accompanied by the upregulation of biological pathways related to metabolite biosynthesis in the rhizosphere. Furthermore, increased indole-3-acetic acid production by PGPR under elevated CO2 signficantly promote root growth. Together, PGPR, particularly Pseudomonas, synergistically interact with elevated CO2 to enhance the health and quality of Prince Ginseng. This study sheds light on how PGPR interacts with abiotic factors influencing plant growth, providing a strategic framework for the sustainable cultivation of high-quality medicinal plants. 


The authors would like to acknowledge the financial support provided by the State Key Laboratory of Climate Resilience for Coastal Cities (ITC-SKLCRCC26EG01) and the Research Grants Council of HKSAR (C5033-23G).

How to cite: Yan, W. H. and Ng, C. W. W.: Interactive Effects of Plant Growth-Promoting Rhizobacteria and CO2 levels on Prince Ginseng Health and Quality, EGU General Assembly 2026, Vienna, Austria, 3–8 May 2026, EGU26-15862, https://doi.org/10.5194/egusphere-egu26-15862, 2026.

EGU26-15878 | ECS | Posters on site | HS8.3.4

Effects of Fertiliser Placement on Soil Osmotic Suction and Growth of Pseudostellaria heterophylla 

Lingga Ekaputra Lucky Suryajaya, Wen Hui Yan, and Charles Wang Wai Ng

Pseudostellaria heterophylla (P. heterophylla) is a widely used Traditional Chinese Medicine plant for human healthcare due to the enriched bioactive compounds in its tubers. Sustained market demand has led to large-scale artificial cultivation of P. heterophylla, where soil nutrient use efficiency is one of the essential factors affecting plant growth. However, how fertiliser placements influence plant growth by altering soil water potential in the root zone remains mechanistically unclear, particularly with respect to osmotic effects. This study aims to investigate the effects of two fertiliser placements, i.e., broadcast and banded treatments, on the growth of P. heterophylla. Fertiliser-induced soil osmotic suction will be monitored, and soil nutrient use efficiency will be analysed during plant growth. By analysing soil osmotic suction and plant characteristics, this work will elucidate how fertiliser placement affects plant growth by altering soil osmotic suction in the root zone. The outcomes of this study are expected to provide practical guidance on fertiliser placements for the artificial cultivation of medicinal plants and insights into soil–plant interactions governed by soil osmotic conditions.


The authors would like to acknowledge the financial support provided by the State Key Laboratory of Climate Resilience for Coastal Cities (ITC-SKLCRCC26EG01) and the Research Grants Council of HKSAR (C5033-23G).

How to cite: Suryajaya, L. E. L., Yan, W. H., and Ng, C. W. W.: Effects of Fertiliser Placement on Soil Osmotic Suction and Growth of Pseudostellaria heterophylla, EGU General Assembly 2026, Vienna, Austria, 3–8 May 2026, EGU26-15878, https://doi.org/10.5194/egusphere-egu26-15878, 2026.

EGU26-16718 | ECS | Orals | HS8.3.4

Disentangling hyphal- and root-derived contributions to dissolved organic carbon in mixed tree systems 

Ramona Werner, Marc Goebel, Andre Kessler, and Taryn Bauerle

Soils represent the largest terrestrial reservoir of organic carbon, with dissolved organic matter (DOM) acting as its most mobile and reactive fraction and the immediate precursor to mineral-associated organic matter, the dominant long-term carbon pool. While DOM dynamics have been extensively studied in bulk soil and the rhizosphere, the hyphosphere—soil influenced by fungal hyphae—remains comparatively understudied, despite the extraordinary spatial reach, rapid turnover, and mineral surface interactions of mycorrhizal fungi. Disentangling root- versus hyphal-derived dissolved organic carbon (DOC) inputs is therefore critical for understanding how recent plant carbon is redistributed and stabilized in soils.

Here, we applied a nested ingrowth core system to experimentally separate rhizosphere and hyphosphere DOC pools under semi-controlled greenhouse conditions. The system consisted of an outer mesh core permitting root and hyphal access and an inner fine-mesh core allowing hyphal ingrowth only, both filled with inert sand. Ingrowth cores were installed in pots containing native tree species planted in monocultures and mixtures. At harvest, distinct sand fractions representing bulk sand, rhizosphere, and hyphosphere subsets were recovered and extracted for total organic carbon (TOC) analysis; samples are being further characterized using untargeted metabolomics.

Preliminary results indicate clear differences in TOC concentrations among compartments, with highest values in rhizosphere samples, intermediate values in the hyphosphere, and lowest concentrations in bulk sand. Species composition exerted a strong influence on total TOC concentrations, and root ingrowth into the outer cores varied markedly among species. Metabolomic analyses are currently in progress and will be used to further assess compositional differences between rhizosphere- and hyphosphere-derived DOC.

Together, this work highlights the hyphosphere as a distinct and experimentally accessible domain of DOC production and underscores the need to explicitly consider fungal pathways when linking fresh carbon inputs to persistent soil organic matter formation.

How to cite: Werner, R., Goebel, M., Kessler, A., and Bauerle, T.: Disentangling hyphal- and root-derived contributions to dissolved organic carbon in mixed tree systems, EGU General Assembly 2026, Vienna, Austria, 3–8 May 2026, EGU26-16718, https://doi.org/10.5194/egusphere-egu26-16718, 2026.

EGU26-16759 | Posters on site | HS8.3.4

Experimental Assessment of the Effects of a Lignin-Based Hydrogel on Saturated Hydraulic Conductivity in Soils with Different Textures 

Justína Vitková, Peter Šurda, Monica S. Chandramohan, Katarzyna Grygorczuk-Płaneta, and Katarzyna Szewczuk-Karpisz

Climate change represents a major environmental challenge that adversely affects soil hydrological regimes and water availability for plants. The increasing frequency and intensity of drought events lead to reduced soil moisture, limited infiltration, and deterioration of soil hydrophysical properties, thereby directly constraining crop growth, development, and yield potential. Insufficient soil water availability disrupts key physiological processes in plants, restricts nutrient uptake, and increases vulnerability to abiotic stress.

One promising adaptation strategy to mitigate the adverse effects of drought is the application of hydrogels in agricultural systems. Hydrogels are polymeric materials capable of absorbing and retaining large amounts of water within their structure and subsequently releasing it gradually into the surrounding soil environment. When incorporated into soil, hydrogels can improve soil water regimes and potentially enhance soil hydrophysical properties.

In this study, two soils differing in texture (sandy clay and sandy loam) and a lignin-based hydrogel at 2% application rate were investigated under laboratory conditions. Four incubation periods were established to evaluate the temporal effects of hydrogel application: 1 day, 1 month, 3 months, and 6 months. Saturated hydraulic conductivity was determined using the falling head method.

The results demonstrated that, in sandy clay soil, increasing incubation duration resulted in a statistically significant increase in saturated hydraulic conductivity, ranging from 400 to 800%. In contrast, sandy loam soil exhibited a statistically non-significant decrease (3–10%) during the initial incubation stages, followed by a statistically significant increase of approximately 60% after 6 months. These findings indicate that hydrogel incubation time in combination with soil texture is a key determinant of both the direction and magnitude of hydrogel effects on soil hydrophysical properties.

Overall, the application of lignin-based hydrogels may represent an innovative approach to enhancing agroecosystem resilience to climate change and drought, while supporting sustainable soil and water management at the landscape scale.


Keywords: hydrogel, saturated hydraulic conductivity, drought, climate change


Acknowledgement: The authors would like to thank the National Agency of Academic Exchange for the financial support (NAWA, Strategic Partnerships, BNI/PST/2023/1/00108) and the Scientific Grant Agency (VEGA 2/0065/24).

How to cite: Vitková, J., Šurda, P., S. Chandramohan, M., Grygorczuk-Płaneta, K., and Szewczuk-Karpisz, K.: Experimental Assessment of the Effects of a Lignin-Based Hydrogel on Saturated Hydraulic Conductivity in Soils with Different Textures, EGU General Assembly 2026, Vienna, Austria, 3–8 May 2026, EGU26-16759, https://doi.org/10.5194/egusphere-egu26-16759, 2026.

EGU26-16789 | ECS | Posters on site | HS8.3.4

Observing invisible bridges: Non-invasive imaging of arbuscular mycorrhizal fungal structures in soil pore space 

Henri Braunmiller, Nicolai Koebernick, Michael Bitterlich, Eva Jacob, Anna Heck, Andrea Schnepf, Johanna Pausch, Jan Jansa, and Mutez Ahmed

Arbuscular Mycorrhizal Fungi (AMF) are plant symbionts that colonize the root cortex, but also extend their extraradical hyphal networks deep into the soil. These networks increase root-soil contact, modify soil structure and facilitate water- and nutrient transport towards the root. The fine, almost “invisible” bridges formed by these networks may gain relevance when soil becomes dry and water and nutrient resources scarce. Their pore-bridging function may connect the roots to soil patches containing water and nutrient resources, potentially preventing root shrinkage while maintaining transport.

Only recently, a high-resolution non-invasive imaging tool became available that now allows us to study the fine, delicate AMF structures in pore space in situ. Here we are presenting a workflow based on synchrotron-based X-ray computed microtomography  imaging. We have developed setups to cultivate AMF at different levels of biotic complexity and subsequently image and analyze AMF hyphosphere and rhizosphere structures quantitatively and non-invasively. This approach has been successfully applied to two AMF species in contrasting soil textures, namely sand and loam. We present the 3D results of key architectural and morphological traits of AMF spores, hyphae and intraradical structures. These include structure counts, total hyphal length, branching frequency, volume, and surface area. Moreover, this study measured a set of novel parameters: (i) the AMF-soil and AMF-root interface areas, and (ii) the AMF pore space occupancy. These data can be linked to hyphal length densities measured destructively, as well as to the plant-scale data such as shoot biomass, C-, N- and P-contents in the leaves, and stomatal conductance.

How to cite: Braunmiller, H., Koebernick, N., Bitterlich, M., Jacob, E., Heck, A., Schnepf, A., Pausch, J., Jansa, J., and Ahmed, M.: Observing invisible bridges: Non-invasive imaging of arbuscular mycorrhizal fungal structures in soil pore space, EGU General Assembly 2026, Vienna, Austria, 3–8 May 2026, EGU26-16789, https://doi.org/10.5194/egusphere-egu26-16789, 2026.

EGU26-16810 | ECS | Posters on site | HS8.3.4

Impact of lignin-based hydrogel on wheat growth on different soil types 

Katarzyna Szewczuk-Karpisz, Sylwia Kukowska, Marina Kyrychenko-Babko, and Olena Siryk

The application of hydrogels in soils is intended to enhance water-holding capacity, improve nutrient accessibility, and strengthen soil structure, thereby supporting plant growth and long-term soil sustainability. Therefore, we examined the impact of lignin-based hydrogel on the water evapotranspiration and wheat growth on four Polish soils: two forest soils (collected from Lasy Janowskie and Maziarnia) and two agricultural soil (from Grodzisko Górne and Lublin), as well as its degradation degree. Evapotranspiration measurements were conducted for 21 days, whereas wheat growth and hydrogel degradation were monitored at 1 day, 1 month, 3 months, and 6 months. Wheat growth experiment was conducted in a phytotron, under drought conditions.

Hydrogel degradation studies showed variability depending on soil type. The most pronounced increase in mass loss over time occurred in the soils collected from Lasy Janowskie and Maziarnia sites, while the soils from Grodzisko Górne and Felin-Lublin showed comparatively limited changes, indicating higher durability of hydrogel in agricultural soils. Evapotranspiration measurements showed that hydrogel reduced water loss over time in all soils. This phenomenon translated into increased height and dry mass of wheat shoots, especially in agricultural soils. For example, above-ground part of wheat grown in the soil from Felin-Lublin was 15.6 cm after incubation with hydrogel for 6 months, compared to the 10.5 cm in the not amended soil. On the other hand, a significant decrease of the height was observed for plants grown in the amended soil from Maziarnia (12.8 cm in the control, compared to 8.5 cm in amended soil).

Overall, the obtained results suggested that the lignin-based hydrogel can reduce water evapotranspiration from the soil, which in turn improves wheat growth on the selected soils types.


The research was founded by Polish National Agency for Academic Exchanges under Strategic Partnerships Program (BNI/PST/2023/1/00108).

How to cite: Szewczuk-Karpisz, K., Kukowska, S., Kyrychenko-Babko, M., and Siryk, O.: Impact of lignin-based hydrogel on wheat growth on different soil types, EGU General Assembly 2026, Vienna, Austria, 3–8 May 2026, EGU26-16810, https://doi.org/10.5194/egusphere-egu26-16810, 2026.

EGU26-17300 | Posters on site | HS8.3.4

Preferential rhizosphere rewetting in water repellent sandy soil 

Pascal Benard, Rong Jia, Sara Di Bert, Birgit Wassermann, Samuel Bickel, Anders Kaestner, Huadong Zang, and Andrea Carminati

In a large field trial on sandy loam, Lama et al. (2022)1- albeit involuntary - tested the effect of drought on the performance of 300 genotypes during two contrasting years: 2017 (cool and wet) and 2018 (hot and dry). Remarkably, some genotypes achieved yields under drought conditions (2018) comparable to established high-yielding varieties. The reason for this remains unclear.

One possible explanation is that this positive effect is linked to modifications of rhizosphere wettability. Sandy soils are known to be susceptible to water repellency upon drying, and several crops, such as maize, barley, and wheat, can modify soil wettability through root exudation2. However, it is still uncertain whether rhizosphere water repellency in sandy soils is an advantage, as it can delay rewetting and thereby reduce biological activity and potentially limit root water uptake.

In this study, we investigated the effect of rhizosphere-induced wettability modifications on water dynamics in naturally water-repellent sandy soil. Using time-series neutron radiography, we quantified rewetting dynamics following a dry-down experiment. While the bulk soil exhibited reduced rewetting, preferential rewetting was observed in the rhizosphere of maize. This finding may help to explain why certain plants benefit from reduced precipitation in sandy soils. Firstly, rewetting occurs preferentially in the rhizosphere, where it can directly support microbial activity and root water uptake. Secondly, localized rewetting may reduce nutrient leaching and promote nutrient retention and turnover through localized enzyme activity.


References

1. Lama, S., Vallenback, P., Hall, S. A., Kuzmenkova, M. & Kuktaite, R. Prolonged heat and drought versus cool climate on the Swedish spring wheat breeding lines: Impact on the gluten protein quality and grain microstructure. Food Energy Secur. 11, e376 (2022).

2. Naveed, M. et al. Surface tension, rheology and hydrophobicity of rhizodeposits and seed mucilage influence soil water retention and hysteresis. Plant Soil 437, 65–81 (2019).

How to cite: Benard, P., Jia, R., Di Bert, S., Wassermann, B., Bickel, S., Kaestner, A., Zang, H., and Carminati, A.: Preferential rhizosphere rewetting in water repellent sandy soil, EGU General Assembly 2026, Vienna, Austria, 3–8 May 2026, EGU26-17300, https://doi.org/10.5194/egusphere-egu26-17300, 2026.

EGU26-18106 | ECS | Posters on site | HS8.3.4

Mathematical Modelling of the Root-Mycorrhiza-Soil System System 

Anna Sophia Heck, Daniel Leitner, Henri Michael Braunmiller, Johanna Pausch, Mutez Ali Ahmed, Michael Bitterlich, Holger Pagel, and Andrea Schnepf

Arbuscular mycorrhizal fungi (AMF) are widespread symbiotic partners of most terrestrial plants and form close associations with their roots. While their role in enhancing nutrient uptake, particularly phosphorus, has been well studied, their effects on and of soil structure, and plant water uptake have not been investigated as broadly.

The complexity of interactions between plants, fungi, and soil under varying environmental conditions is difficult to disentangle experimentally. In-silico investigations offer an alternative means to explore these effects. We developed a 3D-model describing AMF colonization of a growing root structure and the growth of extraradical mycelium. We used the model to simulate how extraradical hyphae extend from colonized roots into the soil volume. The model is being implemented as an extension of CPlantBox, a functional-structural model for water and carbon processes at the whole-plant level.

Model parameterization is based on experimental and additional literature data. This includes information on root architecture, AMF colonization rates and locations, and nutrient transport and water flow in tomato plants and their associated hyphal networks. The plants were grown in sandy and loamy soils under both drought and well-watered conditions.

The 3D AMF colonization model explicitly represents hyphal extension rates, branching angles, and the spatial propagation of the extraradical mycelium from infection points along the root system. Key components of the model are the representation of the dynamics of root growth, growth of the intraradical and extraradical mycelium, anastomosis, and the ability of AMF hyphae to fuse and form complex networks.

The model is used to assess, visualize, and quantify how AMF networks develop, branch, and interconnect, providing mechanistic insight into their contribution to plant nutrition and drought tolerance.

How to cite: Heck, A. S., Leitner, D., Braunmiller, H. M., Pausch, J., Ahmed, M. A., Bitterlich, M., Pagel, H., and Schnepf, A.: Mathematical Modelling of the Root-Mycorrhiza-Soil System System, EGU General Assembly 2026, Vienna, Austria, 3–8 May 2026, EGU26-18106, https://doi.org/10.5194/egusphere-egu26-18106, 2026.

EGU26-18935 | ECS | Posters on site | HS8.3.4

Motile bacteria act as pump to move water through soil matrices 

Beatriz Meza-Manzaneque, Emma Gomez, Gloria de las Heras, Iker Martin Sanchez, Nicola Stanley Wall, Anke Lindner, Eric Clement, Natalia Elguezabal, and Lionel X. Dupuy

Rhizosphere microbiomes are known to enhance plants’ resistance to drought, and this effect has been mainly accredited to fungi and their capacity to transport and uptake water. Here, we studied how mechanical energy from motile bacteria can also contribute to water transport in soil, a mechanism we termed microbial pumps. We ran a series of microcosm and apparent surface tension experiments using different motility mutant strains of Bacillus subtilis, and characterised water transport in the pore space. Results confirmed that flagellar-based motility enhances the movements of water in soil reducing the apparent surface tension of the fluid and promotes the rewetting of dry hydrophobic regions of the soil. The effect was confirmed to be biomechanical because it was dependent on cell density and swimming speed. Collectively, these results highlight the potential of motile microorganisms to enhance water availability for crops.

How to cite: Meza-Manzaneque, B., Gomez, E., de las Heras, G., Martin Sanchez, I., Stanley Wall, N., Lindner, A., Clement, E., Elguezabal, N., and X. Dupuy, L.: Motile bacteria act as pump to move water through soil matrices, EGU General Assembly 2026, Vienna, Austria, 3–8 May 2026, EGU26-18935, https://doi.org/10.5194/egusphere-egu26-18935, 2026.

Seed Priming with Silver Ions Decreased Cadmium Absorption by Wheat Grains via Reactive Oxygen Species Generation
Chenghao Ge1, Yixuan Wang1, Dongmei Zhou1*,
1 State Key Laboratory of Pollution Control and Resource Reuse, School of the Environment, Nanjing University, Nanjing 210023, P.R. China
Contact Email: gech@nju.edu.cn
Tel: 13011701863

Abstract: Cadmium (Cd) contamination in wheat grains poses a serious threat to human health, making the development of low-cost and environmentally friendly strategies to reduce Cd accumulation in wheat a critical need. In this study, we demonstrate that priming wheat seeds with silver ions (Ag⁺) leads to the in-situ formation of silver nanoparticles (AgNPs), which function as ROS-generating nanoparticles to improve tolerance to Cd stress across seed, seedling, and mature plant stages. Seeds treated with 0.11 mg L⁻¹ Ag⁺ showed the highest hydrogen peroxide (H₂O₂) levels and the lowest tissue Cd concentrations during seedling growth. The application of diphenyleneiodonium chloride (DPI) during Ag⁺ priming suppressed H₂O₂ production and resulted in increased Cd uptake in seedlings. Notably, elevated H₂O₂ levels were maintained even during the grain-filling period in Ag⁺-primed plants. Transcriptomic analysis revealed that Ag⁺ priming induces extensive transcriptional reprogramming in wheat. KEGG pathway enrichment combined with quantitative real-time PCR indicated activation of stress-signaling and metal-absorption-related pathways, including plant hormone signal transduction and the MAPK signaling pathway. Furthermore, Ag⁺ priming modulated the expression of key Cd-related genes, downregulating the Cd transporter gene TaABCB11, while upregulating vacuolar sequestration genes (TaABCC9 and TaHMA3) and the cellular Cd export gene TaTM20. These changes suggest that Ag⁺ priming triggers a ROS-mediated stress response, establishing a “stress memory” that persists throughout the growth cycle, enhances Cd tolerance, and ultimately reduces grain Cd accumulation by 39.5% in pot trials and 26.4% in field experiments.

Keywords: Seed priming, stress memory, cadmium, sustainable agriculture
Chenghao Ge, postdoctor of Nanjing University, School of the Environment. His research topics are focused on the safe production in heavy metal-contaminated farmland.


How to cite: Ge, C.: Seed Priming with Silver Ions Decreased Cadmium Absorption by Wheat Grains via Reactive Oxygen Species Generation, EGU General Assembly 2026, Vienna, Austria, 3–8 May 2026, EGU26-18957, https://doi.org/10.5194/egusphere-egu26-18957, 2026.

EGU26-20137 | Orals | HS8.3.4

Root mucilage alters stomatal responses to soil and atmospheric drought 

Asegidew Akale, Gaochao Cai, Efstathios Diamantopoulos, Frederic Leuther, Lara Kersting, Scott McAdam, Shurong Liu, and Mutez A. Ahmed

Plants respond to soil and atmospheric water deficits through strategies such as stomatal regulation and belowground adaptations. Root mucilage buffers erratic fluctuations in the rhizosphere water content, yet its influence on soil hydraulic properties, especially unsaturated hydraulic conductivity, and stomatal regulation remains unknown. We hypothesized that mucilage facilitates water uptake by attenuating the drop in matric potential at the root–soil interface during soil and atmospheric drying. We measured the impact of various maize (Zea mays) mucilage contents (0.0%, 0.05%, 0.2%, and 0.4%) on the water retention and hydraulic conductivity of a loamy soil. Leveraging a soil–plant hydraulic model, we investigated the effects of mucilage contents on transpiration and stomatal responses under soil drying and increased vapor pressure deficit (VPD). Higher mucilage contents prevented sharp declines in unsaturated hydraulic conductivity as soils dried. Simulations revealed that higher mucilage contents delayed the onset of hydraulic stress (the threshold transpiration rate beyond which a small increase in transpiration would result in a disproportionate decline in leaf water potential), broadened the hydroscape zone, and shifted stomatal behavior from isohydric to more anisohydric regulation, enabling plants to sustain stable transpiration and lower midday leaf water potentials under drought. The buffering effects on soil–plant hydraulics persisted across varying degrees of VPD, although high mucilage contents accelerated soil drying, indicating a trade-off between improved water uptake and faster moisture depletion during prolonged drought. Our findings underscore the important role of mucilage in modulating soil–plant water relations and stomatal regulation, offering insights into strategies for improving plant responses to soil and atmospheric drought.

How to cite: Akale, A., Cai, G., Diamantopoulos, E., Leuther, F., Kersting, L., McAdam, S., Liu, S., and Ahmed, M. A.: Root mucilage alters stomatal responses to soil and atmospheric drought, EGU General Assembly 2026, Vienna, Austria, 3–8 May 2026, EGU26-20137, https://doi.org/10.5194/egusphere-egu26-20137, 2026.

EGU26-20260 | ECS | Posters on site | HS8.3.4

Do soil microbes maximize their growth? 

Vani Chaturvedi, Thomas Wutzler, and Axel Kleidon

Soil organic matter (SOM) forms the foundation of microbial life in the soil and its processes. However, what drives the organization of organic matter turnover and microbial communities into growth remains unclear. In particular, we ask whether physical conditions in the soil—such as the quantity or quality of litter inputs—exist to which soil microbial processes adapt in order to maximize microbial growth as a proxy for power. We address this question in the frame of the German priority program 2322  by building on the maximum power principle. The principle suggests that biological systems tend to maximize the flux of energy into useful power under given constraints. We study a minimal model of SOM dynamics at steady state. In the model, litter inputs add to the organic matter pool, which is decomposed by microbial enzymes into compounds available for microbial uptake. The flux of Gibbs free energy provided with litter is used to build biomass while dissipating it during cycling, and the microbial decay returns as dead microbial biomass to the soil pool. We explore how different model structures, feedbacks, and parameterizations might lead to a maximum in the flux of free energy to microbial biomass, thereby providing insights into the conditions under which microbial growth is energetically optimized in soils.

How to cite: Chaturvedi, V., Wutzler, T., and Kleidon, A.: Do soil microbes maximize their growth?, EGU General Assembly 2026, Vienna, Austria, 3–8 May 2026, EGU26-20260, https://doi.org/10.5194/egusphere-egu26-20260, 2026.

EGU26-21264 | ECS | Posters on site | HS8.3.4

Simulation of Soil Moisture Dynamics Using Root Water Uptake Models under Stage-Specific Stress Conditions 

Deep Chandra Joshi, Pragna Dasgupta, and Bhabani S. Das

Accurate representation of root water uptake processes is critical for simulating soil water dynamics under crop water stress, particularly when stress coincides with variable rainfall events. HYDRUS provide a useful framework for evaluating plant–soil interactions under contrasting moisture conditions by simulating different modes of root water uptake, such as compensated and non-compensated uptake.

An experimental study was conducted to examine soil–plant water dynamics under water stress occurring at different crop growth stages. The study focused on three distinct stress scenarios: (a) no water stress, (b) water stress during the vegetative phase, and (c) water stress during the flowering stage. Field measurements included soil water potential at 10 cm depth and root traits, specifically root length and root biomass, to characterize plant water availability and rooting behavior under contrasting moisture conditions.

The HYDRUS-1D model was applied to simulate soil water content dynamics using both compensated and non-compensated root water uptake formulations. Root length and biomass data were used to define root distribution functions in the model. Simulated soil water potential patterns were compared qualitatively across growth stages and root water uptake approaches. The results indicated that the compensated root water uptake model better represented soil moisture depletion and redistribution patterns under stress conditions, particularly when rainfall events occurred during flowering and grain filling stages. Overall, the study highlights the importance of incorporating compensation mechanisms in root water uptake models to improve the simulation of soil water dynamics under stage-specific crop water stress.

How to cite: Joshi, D. C., Dasgupta, P., and Das, B. S.: Simulation of Soil Moisture Dynamics Using Root Water Uptake Models under Stage-Specific Stress Conditions, EGU General Assembly 2026, Vienna, Austria, 3–8 May 2026, EGU26-21264, https://doi.org/10.5194/egusphere-egu26-21264, 2026.

EGU26-21300 | ECS | Orals | HS8.3.4

A novel rhizotron platform for studying root–soil hydraulic interactions in heterogeneous environments 

Tian-Jiao Wei, Xavier Draye, and Mathieu Javaux

The objective of this study is to investigate experimentally how plants adjust their structural and functional properties when facing soil water heterogeneity from the plant down to the organ scales. We developed a novel rhizotron platform, each rhizotron equipped with 9 hydraulically isolated compartments, wherein constant spatial patterns of local soil water potential can be imposed while monitoring water consumption and root development. In the validation experiment, maize plants (cv. B104) were grown under constant and homogeneous water potential in this rhizotron platform for four weeks, before entering a fifth week in which different levels of water potential were imposed. The desired local soil water potentials were successfully applied and adjusted. The local water consumption and root morphological trails were monitored in real time, indicating that root water uptake and root elongation correlate with root age and local soil moisture. At the whole-plant scale, more negative soil water potentials resulted in a lower cumulative water uptake, while at the local scale, cumulative water uptake within individual compartments increased more rapidly as root length within the same compartment increased, indicating a direct coupling between local root development and local water extraction. These observations highlight a strong spatial-temporal linkage between root trails and soil water conditions. Together, the validated rhizotron platform enables root plasticity studies by establish a quantitative and dynamic measurements for soil–root hydraulic interactions at the plant and organ scale, providing a promising platform for future studies exploring how maize plants respond to spatial and temporal heterogeneity in soil water environments. 

How to cite: Wei, T.-J., Draye, X., and Javaux, M.: A novel rhizotron platform for studying root–soil hydraulic interactions in heterogeneous environments, EGU General Assembly 2026, Vienna, Austria, 3–8 May 2026, EGU26-21300, https://doi.org/10.5194/egusphere-egu26-21300, 2026.

Polyphosphates (poly-P), consisting of two or more phosphate residues, are not directly available to plants and must first be hydrolyzed to orthophosphate (ortho-P). Although microbial polyphosphatase activity is well established, there is currently no evidence for extracellular poly-P-hydrolyzing enzymes produced by plants in the rhizosphere. This study investigated the capacity of plants to hydrolyze and utilize long-chain and cyclic poly-P forms and sought to identify extracellular poly-P hydrolytic activity of plant origin.

Six plant species were cultivated under sterile conditions with either cyclic poly-P or ortho-P as the sole phosphorus source. Pronounced interspecific differences were observed in poly-P utilization. Lettuce exhibited limited growth on poly-P, whereas pepper achieved biomass levels comparable to those supplied with ortho-P, providing direct evidence of rhizospheric poly-P hydrolysis. Enzymatic assays using intact plant tissues revealed significantly higher hydrolytic activity in pepper roots than in lettuce, while leaves showed minimal activity in both species.

Protein extracts from pepper roots were further analyzed to characterize the enzymatic activity. Poly-P hydrolysis was abolished by heat treatment, confirming enzymatic involvement. Fractionation by fast protein liquid chromatography (FPLC) led to the isolation of an approximately 20 kDa protein displaying strong poly-P hydrolytic activity, exceeding that of known plant phosphatases. The enzyme preferentially hydrolyzed shorter poly-P chains, with activity declining as chain length increased.

These findings provide the first evidence for a polyphosphatase-like enzyme in vascular plants. The identification of an extracellular, root-derived enzyme capable of hydrolyzing long-chain poly-P challenges the prevailing paradigm that plants rely exclusively on soil microorganisms for the conversion of complex polyphosphates into bioavailable forms.

How to cite: Toren, N. and Erel, R.: Evidence for a Polyphosphatase-Like Enzyme Catalyzing the Hydrolysis of Long-Chain Polyphosphates in the Rhizosphere, EGU General Assembly 2026, Vienna, Austria, 3–8 May 2026, EGU26-21534, https://doi.org/10.5194/egusphere-egu26-21534, 2026.

The subsoil contains valuable nutrient and water resources for crop production, but high penetration resistance impedes root growth and therefore resource access. Large-sized biopores formed by deep-rooting perennial taprooted crop species such as chicory and lucerne can provide pathways through compacted subsoil layers. Different field and mesocosm experiments have shown that colonization by anecic earthworms modifies physical and biochemical properties of biopore networks and pore walls, further increasing attractivity of biopores for crop roots. The intensity of biopore exploration by crop roots and resulting nitrogen uptake from biopore walls as assessed with a combination of classical root-length density determination, in-situ endoscopy and 15N-labelling varies across different crop species and seems to be largely determined by root architecture. Long-term field observations show that benefits of precrops forming large-sized biopores for following crops in terms of water and nutrient uptake as well as grain yield generally in dry years and particularly pronounced for spring-sown cereals.

How to cite: Athmann, M.: Root-soil interactions in biopores and their role in climate adaptation of cropping systems, EGU General Assembly 2026, Vienna, Austria, 3–8 May 2026, EGU26-22888, https://doi.org/10.5194/egusphere-egu26-22888, 2026.

Since the Quaternary Pleistocene, the estuary region of the Yangtze River in China has undergone extensive sedimentation due to the combined effects of tectonic movements, ancient river systems, paleo-marine environments, and other geological factors, resulting in a thick sequence of Quaternary deposits exceeding hundreds of meters in depth. In engineering practice, the complex interaction between groundwater conditions and soil has led to incidents of foundation pit instability. Previous research on ensuring the safety of foundation pit construction under such geotechnical conditions has primarily focused on catastrophic phenomena such as soil piping and boiling; however, these studies often fail to adequately explain certain accidents that occur without evident signs of such failures. This study investigates the micro-scale migration and structural reorganization of soil particles induced by groundwater seepage, using the foundation pit project of Nantong Metro as a case study. A combination of physical model testing and discrete element method (DEM) simulations is employed to analyze the underlying mechanisms. The results indicate that soil settlement resulting from pore water pressure dissipation due to groundwater level fluctuations is significantly smaller than the differential settlement caused by seepage forces. The formation of a "sand-clay" dual structure in the soil is attributed to the combined influence of marine and fluvial sedimentation processes. The loss of clay particles induces compression of the sand skeleton, which constitutes the primary mechanism responsible for macroscopic soil mass settlement. Specifically, localized leakage at weak zones of the waterproof curtain can trigger fine particle loss and progressive weakening of the silt layer structure, leading to uneven settlement, lateral displacement, or even instability of the retaining system—posing significant risks to foundation pit safety. 

How to cite: Zou, P. and Deng, Y.: Environmental effects of dewatering procedure when subway's deep excavation in marine continental sedimentary soil, EGU General Assembly 2026, Vienna, Austria, 3–8 May 2026, EGU26-7139, https://doi.org/10.5194/egusphere-egu26-7139, 2026.

EGU26-10807 | Posters on site | HS8.3.5

Impact of Overflow Weirs on Unsaturated Soil Water Dynamics in Agricultural Farmland 

Saadeddine El Hajjar, Niklas Keßel, Karl Broich, Markus Disse, and Nicole Tatjana Scherer

Agricultural farmland requires a delicate balance between providing sufficient water to crops and draining away excess moisture. This drainage is normally achieved through digging trenches that run through farming areas, allowing surplus water to flow away as surface runoff, contributing to river networks downstream. This drainage is soil-dependent and mostly uncontrolled, resulting in excessive water losses at critical points throughout the year, especially during dry periods.  This water might have contributed to plant growth otherwise.

To address this issue, the Wasserwirtschaftsamt Ansbach is leading a pilot project that aims to retain part of this excess water before it is lost as runoff. By installing overflow weirs along agricultural trenches, water can be temporarily stored and allowed to infiltrate back into the soil when moisture levels are low.

The project “Grüne Gräben” aims to investigate the effects of these weirs on both local and regional scales. Using numerical models, it is possible to quantify how much water is retained and subsequently re-infiltrated into the soil system. To achieve this, the project utilizes HydroGeoSphere (HGS), an integrated, physically based hydrological model that simulates interactions between surface water, unsaturated soil, and groundwater. Unlike simplified conceptual models, HGS numerically solves the Richards equation for variably saturated flow in the porous medium together with the diffusion wave equation for overland flow. This coupling allows for a detailed understanding of the interaction between the stored surface water and resultant infiltration into the unsaturated zone over space and time.

The meteorological, soil moisture, and soil textural data collected from field excursions are used to calibrate and validate the models. Parameters such as hydraulic conductivity, porosity, and soil-water retention characteristics allow for an assessment from a physically based approach. Additionally, vegetation and root growth provide a realistic representation of the evapotranspiration resulting from crop growth and harvesting. This, along with the infiltration resulting from the presence of the weir, helps determine the extent of evapotranspiration enhancement from the newly available soil moisture.

By modelling scenarios with and without overflow weirs, Hydrogeosphere provides data on the net benefit of installing such land management practices. The outcomes of these studies help in gauging whether this practice is worth scaling to other farms around Bavaria with similar soil characteristics.

How to cite: El Hajjar, S., Keßel, N., Broich, K., Disse, M., and Scherer, N. T.: Impact of Overflow Weirs on Unsaturated Soil Water Dynamics in Agricultural Farmland, EGU General Assembly 2026, Vienna, Austria, 3–8 May 2026, EGU26-10807, https://doi.org/10.5194/egusphere-egu26-10807, 2026.

EGU26-12089 | ECS | Posters on site | HS8.3.5

Modeling Unsaturated Soil Water Transport Based on Loss-attentional Physics-informed Neural Networks 

Jiaxian Li, Yanjie Song, Pengcheng Zhou, Junping Ren, Amirul Khan, and Xiaohui Chen

Physics-informed neural networks (PINNs) have recently attracted increasing attention as a data-efficient framework for solving partial differential equations governing complex subsurface flow processes. PINNs provide a promising alternative to conventional numerical methods for modeling unsaturated soil water flow, which is typically described by highly nonlinear governing equations. However, when applied to complex infiltration problems, conventional PINNs often suffer from imbalanced loss terms associated with initial conditions, boundary conditions, and governing equation residuals, leading to slow convergence and suboptimal accuracy.

In this study, a Loss-Attention Physics-Informed Neural Network (LAPINN) framework is employed to simulate unsaturated infiltration processes under both steady-state and transient conditions. The employed framework incorporates a loss-attention mechanism that adaptively reweights individual loss components during training, enabling the network to dynamically focus on regions and constraints that are more difficult to satisfy. This adaptive strategy effectively alleviates loss imbalance and enhances training stability without requiring manual tuning of loss weights.

The performance of LAPINN is systematically evaluated using three representative benchmark problems: (1) one-dimensional steady-state unsaturated infiltration, (2) one-dimensional transient unsaturated infiltration, including an inverse problem for hydraulic parameter identification, and (3) two-dimensional transient unsaturated infiltration with a prescribed Dirichlet boundary condition at the soil surface. Both forward and inverse modeling capabilities of the proposed framework are investigated.

The results demonstrate that LAPINN consistently outperforms standard PINNs in terms of prediction accuracy and convergence efficiency across all benchmark cases. In addition, the proposed method enables reliable inversion of hydraulic parameters using limited observational data. These results indicate that LAPINN provides a robust and efficient computational framework for modeling unsaturated soil water flow and offers strong potential for data-scarce hydrological and geotechnical applications.

How to cite: Li, J., Song, Y., Zhou, P., Ren, J., Khan, A., and Chen, X.: Modeling Unsaturated Soil Water Transport Based on Loss-attentional Physics-informed Neural Networks, EGU General Assembly 2026, Vienna, Austria, 3–8 May 2026, EGU26-12089, https://doi.org/10.5194/egusphere-egu26-12089, 2026.

The van Genuchten-parameterization (vG) of the soil water retention curve (SWRC) has been very popular for over four decades, but it has some physical inconsistencies at the dry and the wet end. The recently introduced Rossi–Ippisch–Adaptation (RIA) of vG resolves these by introducing an air-entry value and eliminating the residual water content. Unlike any other parameterization of the SWRC, RIA can transition smoothly from a sigmoidal vG-type curve to a power-law Brooks-Corey curve. We elucidate how α determines the existence and location of an inflection point, which determines if the resulting curve is sigmoidal or not. We also present a criterion to determine the limit at which the RIA curve converges to the more parsimonious Brooks–Corey power-law form. As a preparation for future work, we explored if a hysteric version of RIA is feasible. Expressions for its main drying and wetting curves are provided, showing that hysteresis in RIA necessarily induces hysteresis in the shape parameters α and n. A practical closed-form relation is proposed to estimate a hysteretic parameter set for the main wetting curve when measurements are only available for the main drying curve.

How to cite: de Rooij, G. H. and Nambiar, A.: A soil water retention curve that can transition between Brooks-Corey and van Genuchten can be made hysteric in principle., EGU General Assembly 2026, Vienna, Austria, 3–8 May 2026, EGU26-12092, https://doi.org/10.5194/egusphere-egu26-12092, 2026.

EGU26-13228 | ECS | Posters on site | HS8.3.5

Modelling Interflow in Seasonally Frozen Soils: A Comparison of Hydraulic Parameterisations 

Anne Hermann, Reinhard Drews, and Olaf Cirpka

Interflow in seasonally frozen soils plays a key role in winter runoff generation and groundwater recharge. Uncertainty in the physical processes governing soil freezing has resulted in a wide range of parameterisations to capture ice-induced changes in pore-space connectivity. Although several numerical models for partially frozen soils have implemented these parameterisations, their impact on interflow development has not been systematically assessed.

In this work, we investigate how different hydraulic parameterisations of frozen soils influence interflow dynamics in sloping terrain. We compare three published parameterisations: (i) a capillary-bundle model following Watanabe and Flury (2008), (ii) an impedance-factor-based reduction of hydraulic conductivity, and (iii) a drying assumption in which ice formation reduces liquid water availability. To compare them, we developed a two-dimensional finite volume solver for coupled heat and water transport. This unified framework, implemented in JAX to enable high-performance computing in Python, allows us to isolate parameterisation effects from numerical artefacts. We conduct two-dimensional simulations to analyse the dynamics of interflow during freezing and thawing periods. The results show substantial differences in both the timing and intensity of interflow among the parameterisations.  

Our findings demonstrate that the choice of frozen-soil hydraulic parameterisation can strongly affect simulated runoff and infiltration partitioning. These results underscore the importance of parameterisation choice for hydrological modelling in cold regions with increasingly frequent midwinter melt events.


Watanabe K., Flury M. Capillary bundle model of hydraulic conductivity for frozen soil. Water Resour. Res., 44(12), 2008. doi:10.1029/2008WR007012.

How to cite: Hermann, A., Drews, R., and Cirpka, O.: Modelling Interflow in Seasonally Frozen Soils: A Comparison of Hydraulic Parameterisations, EGU General Assembly 2026, Vienna, Austria, 3–8 May 2026, EGU26-13228, https://doi.org/10.5194/egusphere-egu26-13228, 2026.

EGU26-17566 | ECS | Posters on site | HS8.3.5

Numerical Modelling of Noordbergum Effect Using Coupled Poromechanics Approach 

Himanshu Srivastava and Anirban Dhar

The soil-water constitutive relationship was first introduced by Terzaghi for pore fluid pressure driven one-dimensional consolidation [1]. M. A. Biot later established a three-dimensional constitutive relationship for pore-saturated soil system [2]. The interaction between porous media and fluid is a complex coupled phenomenon governed by the intricate relationship between the soil matrix and the pore-occupying fluid. Closed form solutions of this poroelastic model can only be obtained for highly simplified cases. Numerical modelling is widely accepted method for simulating the poromechanical scenarios. An Open-Source based model, satBiotFoam, is developed over the Finite-Volume (FV) based framework of OpenFOAM® for solving coupled poromechanical problems. The proposed model employs an iterative approach based on mathematical operator splitting to eliminate non-physical oscillations. The presented model is capable of accurately capturing coupled interaction validated against widely accepted benchmark solutions. This coupled constitutive relationship is characterized by a non-monotonic pressure variation in deforming porous media or pumped aquifer systems. This phenomenon was first reported from the well fields of Noordbergum village in the Netherlands by Verruijt [3].  Noordbergum and Reverse Noordbergum Effects are such poromechanical phenomena which can be captured using the proposed model. The present works aims to characterize these phenomena under various homogeneous and heterogeneous domains, demonstrating the applicability of the model for poromechanical applications near pumping and recharging wells. A variety of two- and three-dimensional problems are presented related to soil deformation and pumping in aquifer-aquitard systems with physically consistent solutions. Findings of the proposed work aims to understand the critical physical relationship among pore fluid and heterogenous/homogeneous soil systems under aquifer pumping or recharging scenarios.

References:

[1] Terzaghi, C., 1925. Principles of soil mechanics: V-physical differences between sand and clay. Eng. News Rec. 96, 912–915.

[2] Biot, M. A. (1941). General Theory of Three‐Dimensional Consolidation. Journal of applied physics, 12(2), 155-164.

[3] Verruijt, A., 1969. Elastic storage of aquifers. In: Flow Through Porous Media, vol. 1. San Diego, California, pp. 331–376.

How to cite: Srivastava, H. and Dhar, A.: Numerical Modelling of Noordbergum Effect Using Coupled Poromechanics Approach, EGU General Assembly 2026, Vienna, Austria, 3–8 May 2026, EGU26-17566, https://doi.org/10.5194/egusphere-egu26-17566, 2026.

EGU26-19624 | Posters on site | HS8.3.5

Simulating agricultural water management strategies using an integrated surface subsurface hydrological model under future climatic extremes 

Jelte de Bruin, Martine van der Ploeg, Nikola Rakonjac, Ruud Bartholomeus, Janine de Wit, and Syed Mustafa

Farmers face increasingly more uncertainty with regards to crop production of due to a changing climate. Temperature and precipitation patterns change, with prolonged periods of heats and droughts. This affects the crop growth season in terms of overall duration and increases the uncertainty of the crop growth conditions. Especially crop water availability is of importance to generate a good yield. Various management strategies can help to manage the water availability, such as drainage, irrigation infrastructures or a combination of both. Within the EU FARMWISE project, various water management strategies are evaluated that could help farmers mitigate future extreme weather conditions. The goal is to determine how various irrigation strategies perform under future climatic conditions.

The management strategies under investigation are traditional sprinkler irrigation, subirrigation and a combination of controlled subirrigation with tile drainage. Utilising HydroGeoSphere (HGS), a 3D physics-based integrated surface-subsurface model was setup of an experimental field in the Netherlands. At the field site, an irrigation system, comprising of a controlled drainage with subirrigation is being monitored. The HGS model was calibrated using the field data to simulate the natural groundwater fluctuations, as well as the controlled drainage and subirrigation.

To determine the effectiveness of the water management scenarios under various climatic scenarios, the water management scenarios were implemented into the calibrated model. The hydraulic head response and soil moisture content were the parameters of interest. To represent the future climate scenarios, precipitation and evapotranspiration from the SSP1-2.6, SSP2-4.5 and SSP5-8.5 scenarios over three time horizons were used. All model results in terms of hydraulic head and soil moisture response are currently being analysed to determine the effectiveness of the various management strategies under different climates.

How to cite: de Bruin, J., van der Ploeg, M., Rakonjac, N., Bartholomeus, R., de Wit, J., and Mustafa, S.: Simulating agricultural water management strategies using an integrated surface subsurface hydrological model under future climatic extremes, EGU General Assembly 2026, Vienna, Austria, 3–8 May 2026, EGU26-19624, https://doi.org/10.5194/egusphere-egu26-19624, 2026.

EGU26-20211 | Posters on site | HS8.3.5

From teaching the hydrological functions of healthy soils to CBPR through a replica of Charles and Horace Darwin’s observations on the action of worms 

Stefano Barontini, Anna Camplani, Elena Curti, Mario Ferrari, Giovanna Grossi, Matteo Marra, Marco Peli, and Paolo Vitale

In this memory we report about aims, methods and present findings of the WormEx II experiment. The WormEx II experiment is a 4-years lasting educational experiment and a citizen-based participatory research (CBPR) performed in high-school classes, in view of attracting students’ attention on the hydrological role of healthy soils, through the observation and quantification of earthworm digging activity and of its hydrological role.

The core of the experiment consists in replicating Charles and Horace Darwin’s famous observations on the sinking of stones, published in 1881 and 1901 respectively. We reproduced a couple of wormstones (inspired by that positioned by Horace Darwin at Down House), and we placed them in the garden of the Liceo Copernico high-school in Brescia in March 2022. Since then many sinking measurements and infiltration tests (with different earthworm activity) were performed with the participation of high-school and university students, teachers and faculty staff.

The analysis of the experiment is multi-faceted and deserves intriguing interpretative keys. Firstly students meet Charles and Horace Darwin’s original works on the matter, thus (partially or integrally) reading them, under the guidance of the teachers. They go in depth with the text analysis and through their data, recognizing both Charles’ rigorous epistemological approach based on ample data collection and Horace’s attitude at designing a replicable experiment to obtain controlled and good quality data. This introduces them to the dialectics between data collection and experiment design and replicability, standing at the basis of modern Hydrology and of many natural sciences. Contextually they deal with the scientific relevance of patient practice and long lasting series. According to Charles Darwin’s definition of «minima», students appreciate how meaningful changes in Nature are mostly given by the continue and reiterated superimposition of minimal ones. They observe aspects of earthworm ecology, regarding their digging activity into relationship with the antecedent meteorological conditions and recognize the soil attitute at behaving as a low-pass filter of the meteorological variability.

Finally, by means of managing the datasets of the sinking and of the micrometeorological measures, and interpreting the infiltration tests, they qualitatively and quantitatively compare their findings with ancient ones, and approach the issue of quantitative treatment of data and of scientific reporting, thus attempting to overcome the mainly qualitative approach of most CBPR activities.

How to cite: Barontini, S., Camplani, A., Curti, E., Ferrari, M., Grossi, G., Marra, M., Peli, M., and Vitale, P.: From teaching the hydrological functions of healthy soils to CBPR through a replica of Charles and Horace Darwin’s observations on the action of worms, EGU General Assembly 2026, Vienna, Austria, 3–8 May 2026, EGU26-20211, https://doi.org/10.5194/egusphere-egu26-20211, 2026.

HS9 – Erosion, sedimentation & river processes

EGU26-5 | Orals | HS9.2

Sediment Erosion around Seabed Structures and Flow-Induced Forces on Subsea Cables 

Nadim Zgheib, Irvin Velazquez, Kalivelampatti Arumugam Krishnaprasad, Claire Mcghee, Cai Ferguson, David Hoyal, and Sivaramakrishnan Balachandar

We perform high-fidelity, two-way coupled simulations to examine sediment transport and flow interactions around a periodic array of seabed-mounted monopiles subjected to oscillatory forcing. The unsteady turbulent flow is resolved by solving the incompressible Navier–Stokes equations, while the evolving sediment bed is modeled using the Exner equation, considering bedload transport as the sole sediment transport mechanism. Bedload fluxes are estimated through empirical correlations calibrated against laboratory experiments and particle-scale simulations. The simulations encompass a range of idealized tidal conditions, including symmetric and asymmetric oscillatory flows and various Shields stress values. Results show that scour evolution is strongly affected by the initial bed topography, flow characteristics, and spatial configuration of the computational domain. Even under symmetric forcing, the sediment bed develops persistent asymmetries and localized deposition near the monopile’s equatorial regions. To enhance predictions of sediment entrainment, we implement a modified erosion-rate model based on a dimensionless shear parameter. The resulting erosion patterns reveal a circular high-entrainment zone around each monopile, consistent with observations from experimental and numerical studies, thereby confirming the model’s physical fidelity and its capability to capture vortex-induced sediment mobilization. In addition, we introduce a post-processing framework to assess hydrodynamic forces on subsea cables. By sampling velocity and pressure fields along hypothetical cable trajectories, this approach enables efficient estimation of force magnitudes and directions for multiple orientations without requiring additional flow simulations.

How to cite: Zgheib, N., Velazquez, I., Krishnaprasad, K. A., Mcghee, C., Ferguson, C., Hoyal, D., and Balachandar, S.: Sediment Erosion around Seabed Structures and Flow-Induced Forces on Subsea Cables, EGU General Assembly 2026, Vienna, Austria, 3–8 May 2026, EGU26-5, https://doi.org/10.5194/egusphere-egu26-5, 2026.

EGU26-1593 | ECS | Orals | HS9.2

Evaluation of Mechanical and Physical Characteristics of Aquatic Muds by Geotechnical Methods, for Assessment of Methane Bubble Descriptor 

Xiaoran Geng, Regina Katsman, Semion Zhutovsky, Yaron Be'eri-Shlevin, Ernst Uzhansky, and Boris Katsnelson

The physical and mechanical characteristics of gas-free aquatic muds govern methane bubble descriptors such as size, shape, and orientation. Here, we quantify these mud characteristics in Lake Kinneret (Israel) using four gravity cores (A, B, C, and D: 1.5 to 2.45 m length, taken along few hundred meters at NW transect from 27.5 to 38 m water depth). Depth-dependent undrained shear strength was measured using a pocket shear vane and was also estimated numerically, both showing an increasing trend with depth, with maximum values of 1.8 kPa (A at 1.55 m), 1.6 kPa (B at 1.75 m), 4.7 kPa (C at 2.33 m), and 2.7 kPa (D at 2.15 m). The suspension–sediment interface corresponded to density transitions at ρ = 1.28 g/cm³ at 0.675 m (A), ρ = 1.27 g/cm³ at 0.775 m (B), ρ = 1.20 g/cm³ at 0.625 m (C), and ρ = 1.11 g/cm³ at 0.525 m (D). Basic geotechnical index properties indicate water-rich, highly porous muds: water contents decrease with depth (including within suspension zone) from 329% to 122% (A), 311–109% (B), 372–112% (C), and 461–116% (D); porosity falls from ~90 near the top of the cores  to ~76% at 1.75 m (A) and 1.55 m (B), and from >85–90% at the tops of cores C and D to ~70–75% at their bases. Atterberg limits are nearly constant, with LL ≈ 67% and PL ≈ 37% in cores A and B, and LL ≈ 75%, PL ≈ 32%, and an average PI ≈ 43 in cores C and D, consistent with high-plasticity silty clays. Dynamic Young’s modulus, evaluated from ultrasonic P-wave velocities, yielded irregular profiles in intact cores (ranging between ~500 m/s and ~1490m/s), which we attribute to presence of cracks and voids (from which methane gas escaped at the core retrieval), whereas remolded muds where the voids were eliminated, exhibited a monotonic increase in sound speed with depth, in the range from 1462m/s to 1492m/s. Further, Young’s modulus, small-strain shear modulus, and Mode I fracture toughness were derived from the Atterberg limits, while fracture toughness was inferred from empirical correlations with shear strength. Overall, our results demonstrate that Atterberg limits and basic geotechnical indices provide an effective framework for predicting small-strain stiffness and fracture properties of the aquatic muds, offering essential input for improved quantification of methane bubble descriptors in acoustic models.

How to cite: Geng, X., Katsman, R., Zhutovsky, S., Be'eri-Shlevin, Y., Uzhansky, E., and Katsnelson, B.: Evaluation of Mechanical and Physical Characteristics of Aquatic Muds by Geotechnical Methods, for Assessment of Methane Bubble Descriptor, EGU General Assembly 2026, Vienna, Austria, 3–8 May 2026, EGU26-1593, https://doi.org/10.5194/egusphere-egu26-1593, 2026.

EGU26-2368 | ECS | Posters on site | HS9.2

A physics-informed computer vision framework for graded erosion processes of hydraulic concrete under submerged  sediment-laden jets 

Mengzhe Cai, Haoran Wang, Kang Liu, Yongcan Chen, and Zhaowei Liu

Erosion of hydraulic concrete induced by submerged sediment-laden jets constitutes a representative surface damage problem that is strongly governed by physical processes while exhibiting limited textural contrast, representing a multiphase sediment-structure interaction process relevant to sediment management and operation-maintenance of hydropower infrastructure. Its spatial heterogeneity and graded erosion patterns arise from the coupled effects of sediment momentum transfer and erosion evolution. Conventional erosion assessments predominantly rely on integral metrics such as mass or volume loss, which are insufficient to describe the two-dimensional spatial structure and graded characteristics of erosion damage. These erosion patterns represent a localized surface-morphological response of hydraulic concrete surfaces in sediment-laden jet environments. Although computer vision techniques have recently been applied to erosion detection, existing approaches remain largely texture-driven and data-centric, typically focusing on binary segmentation between damaged and undamaged regions. Such models are therefore inadequate for resolving multiple erosion grades and lack explicit incorporation of erosion mechanisms, leading to limited robustness and interpretability across varying hydraulic and sediment conditions. In this work, a physics-informed computer vision (PICV) framework is developed for intelligent segmentation of hydraulic concrete erosion, bridging mechanism-based sediment action modelling with data-driven image segmentation. The framework is built upon a structured physical-visual representation that explicitly links erosion morphology with sediment-induced physical actions. Controlled submerged sediment-laden jet experiments are conducted under systematically varied jet velocities, impingement angles, sediment concentrations, particle sizes, and exposure durations to acquire high-resolution erosion surface images. Based on particle impact and cutting mechanisms, spatially distributed sediment-phase momentum fields, including normal and tangential components, are derived to characterize the intensity of particle-wall interactions, serving as modelling-informed multiphase sediment action descriptors. These momentum fields are spatially registered to the corresponding erosion images, forming a coupled two-dimensional representation in which erosion surface images serve as the visual carrier and are associated with aligned physical descriptors. This representation provides a physics-vision integrated dataset suitable for mechanism-aware visual learning. On the basis of this coupled representation, a PICV-oriented multi-modal segmentation framework is established, in which erosion images and sediment momentum fields are jointly exploited to enable concurrent learning of textural features and physically meaningful action intensity. Furthermore, a dimensionless erosion intensity indicator derived from experimentally measured mass loss rates is incorporated into the loss function as a soft-consistency regularization term, providing sample-wise adaptive guidance during model optimization. Rather than imposing strict physical constraints on the solution space, physical information is used to guide the learning process toward physically plausible spatial patterns. Compared with image-only baselines (U-Net and DeepLab), the proposed PICV model improves multi-class graded-segmentation performance (Pixel-wise precision: +10-15 percentage points) and notably reduces grade confusion in transition regions. Under cross-condition evaluation, PICV demonstrates enhanced stability and interpretability, linking predicted grade distributions to aligned momentum patterns. This framework provides a transferable pathway for robust, mechanism-aware erosion assessment under complex submerged sediment-laden jet environments, supporting erosion-risk evaluation and sediment-management decision-making for hydraulic infrastructure.

How to cite: Cai, M., Wang, H., Liu, K., Chen, Y., and Liu, Z.: A physics-informed computer vision framework for graded erosion processes of hydraulic concrete under submerged  sediment-laden jets, EGU General Assembly 2026, Vienna, Austria, 3–8 May 2026, EGU26-2368, https://doi.org/10.5194/egusphere-egu26-2368, 2026.

EGU26-2546 | ECS | Orals | HS9.2

Classifying Foliated Ecohydraulics via Three-Dimensional Modelling 

Rufus Dickinson, Timothy Marjoribanks, and Christopher Keylock

In rivers, marshes, and mangroves, dense vegetation is a ubiquitous, but complex, obstruction to flow, demanding special consideration of its effect on hydromorphological processes. The last twenty-five years have seen a range of studies on different aspects of flow-vegetation interaction, but to properly understand the impact of foliated, heterogeneous, and branching plants, it is necessary to adopt three-dimensional structural modelling techniques to quantify their hydrodynamic interactions. We apply the recently developed Elastically Articulated Body Method (EABM), which describes the three-dimensional dynamics of complex plant morphologies to investigate the flow-induced reconfiguration of leafy plants (such as Ceratophyllum, Suaeda, and Spartina). Our results show that the dynamics and hydraulic effects of different plant species, for instance those that can be used as nature-based solutions for coastal protection, can be classified using a new dimensionless parameter “Isoanemeity”. This parameter is a descriptor of the ability of leaves to flexibly streamline, compared to that of the whole plant, and as such predicts the predominant mechanism of plant reconfiguration, and the role of foliage in creating drag. This classification can benefit those modelling drag and turbulence in large hydrological systems with a variety of species of vegetation.

How to cite: Dickinson, R., Marjoribanks, T., and Keylock, C.: Classifying Foliated Ecohydraulics via Three-Dimensional Modelling, EGU General Assembly 2026, Vienna, Austria, 3–8 May 2026, EGU26-2546, https://doi.org/10.5194/egusphere-egu26-2546, 2026.

EGU26-3239 | ECS | Posters on site | HS9.2

Size-Dependent Measurement Variability in LISST-200X–Derived Suspended Sediment Particle Size Distributions 

Geunsoo Son, Sunghyun Kwak, and Youngsin Roh
Suspended sediment concentration and particle size distribution in rivers are fundamental variables for understanding sediment transport processes, riverbed changes, and hydrological, hydromorphological, and ecological phenomena. The LISST-200X, a field measurement device utilizing laser diffraction principles, offers the advantage of simultaneously observing suspended sediment concentration and particle size distribution at high resolution. However, inherent assumptions in its measurement principle and optical limitations still introduce uncertainty in data interpretation. In particular, the potential for measurement variability to systematically differ across particle size intervals has been identified as a significant issue for the quantitative utilization of LISST data. This study analyzed size-dependent measurement variability in suspended sediment particle size distribution data by simultaneously deploying three LISST-200X units with identical specifications at the same cross-section within a full-scale flume test environment. The experiment was conducted under constant flow conditions. Quartz sand and loess slurries with contrasting particle size characteristics were injected upstream, and temporal changes in suspended sediment concentration and particle size distribution were continuously measured at a downstream measurement section. Particle size distributions were derived using both the spherical model and random shape model provided by the manufacturer to examine the influence of particle shape assumptions on the measurement results. The analysis showed that the three instruments generally exhibited similar temporal variation patterns. However, pronounced variability between instruments persisted in the fine particle size range. Under high-concentration, fine-dominated conditions, optical transmittance decreased substantially, and increased variability was observed not only in the fine size range but also concurrently in some medium size ranges. In addition, significant differences in derived particle size distributions and representative particle sizes were observed depending on the selected inversion model, particularly under fine particle-dominant conditions. These results indicate that LISST-200X–based suspended sediment particle size data can exhibit varying reliability depending on particle size range and measurement conditions, underscoring the need for careful interpretation of laser diffraction–based measurements.
 
This work was supported by Korea Environment Industry & Technology Institute (KEITI) through Research and development on the technology for securing the water resources stability in response to future change Program, funded by Ministry of Climate, Energy, Environment (MCEE) (RS-2024-00397970).
 

How to cite: Son, G., Kwak, S., and Roh, Y.: Size-Dependent Measurement Variability in LISST-200X–Derived Suspended Sediment Particle Size Distributions, EGU General Assembly 2026, Vienna, Austria, 3–8 May 2026, EGU26-3239, https://doi.org/10.5194/egusphere-egu26-3239, 2026.

EGU26-3248 | Orals | HS9.2

Continuous Measurement of River Sediment Load Using Acoustic Parameters of H-ADCP 

Youngsin Roh, Geunsoo Son, and Dongsu Kim

The Horizontal Acoustic Doppler Current Profiler (H-ADCP), widely used for real-time discharge monitoring, measures flow velocity through the Doppler shift of acoustic pulses. Furthermore, the attenuation and scattering of acoustic waves in water enable the estimation of suspended sediment concentration (SSC), extending its utility from hydrodynamic to sediment monitoring. In Korea, 66 gauging stations equipped with H-ADCPs are currently in operation. By applying sediment estimation techniques based on acoustic backscatters, these systems are expected to enable the simultaneous measurement of both discharge and sediment load. SSC estimation using H-ADCP is based on the linear relationship between SCB(sediment Corrected Backscatters) and individually sampled SSC. Recent studies have attempted to improve the accuracy of SSC estimation by including additional hydraulic and acoustic parameters. In particular, multiple regression models that include water level along with SCB, as well as the attenuation–backscatter ratio (ABR), which jointly accounts for both attenuation and scattering effects, have demonstrated enhanced predictive capability. This study analyzed data from 5 H-ADCP gauging stations to examine the relationships between sediment-related (sediment attenuation coefficient, SCB and ABR) and hydraulic variables (water level, velocity and discharge) using machine learning, aiming to improve accuracy of SSC estimation. The testbeds were equipped with Channel Master H-ADCPs operating at frequencies of 300, 600, and 1200 kHz, and SSC sampling was obtained during the 2024 flood seasons using the D-74 sampler. Using H-ADCPs data and individually measured SSC from the testbeds, both a simple linear regression between SCB and SSC, and a multiple regression including water level were developed and compared against measured SSC. In addition, SSC estimates derived from machine learning models that integrate both hydraulic and acoustic variables were also evaluated for comparison. Application to the testbeds showed that multiple regression including water level improved accuracy compared with simple SCB–SSC linear regression. Furthermore, when machine learning was applied with optimal variable model using diverse variables, the estimation achieved over 85% accuracy relative to individually measured values.

Keywords: SSC, SCB, ABR, water level, H-ADCP

Acknowledgements

This work was supported by Korea Environment Industry & Technology Institute (KEITI) through Research and development on the technology for securing the water resources stability in response to future change Program, funded by Ministry of Climate, Energy, Environment (MCEE) (RS-2024-00397970).

How to cite: Roh, Y., Son, G., and Kim, D.: Continuous Measurement of River Sediment Load Using Acoustic Parameters of H-ADCP, EGU General Assembly 2026, Vienna, Austria, 3–8 May 2026, EGU26-3248, https://doi.org/10.5194/egusphere-egu26-3248, 2026.

EGU26-3260 | Posters on site | HS9.2

Field Evaluation of a Pumping-Based Automated Sampler for Suspended-Sediment Monitoring in Small to Medium Rivers 

Sunghyun Kwak, Geunsoo Son, and Youngsin Roh

Suspended sediment data are essential for hydrological and water resource management, including predicting riverbed changes, estimating reservoir sedimentation, calculating sediment yield, and supporting river management planning. Suspended sediment also causes turbidity, which complicates water treatment and negatively impacts aquatic ecosystems. These issues highlight the need for precise and continuous monitoring. Although long-term monitoring and research on sediment transport have been conducted worldwide for decades, Korea still lacks sufficient systematic, long-term datasets and technological development, resulting in a shortage of usable information. Conventional samplers such as the D-74 and P-61 face limitations in field application due to the need for multiple personnel, high costs, safety risks, and accessibility constraints. Moreover, indirect methods such as ADCP backscatter and LISST diffraction still require further validation with ground truth data.

To address these limitations, we developed a pumping-based automated sampling system and evaluated its field applicability in a small- to medium-sized river in Korea. The system was installed at a field site in Yeoju, Korea, across three cross-sections, with a total of 16 intake ports distributed at 5–6 depths per cross-section to enable automated multi-depth sampling under varying stage conditions. A joint field campaign, conducted alongside ADCP, LISST, conventional samplers, and surface grab sampling, provided comparative measurements for suspended-sediment characterization and sediment-load estimation. The system operated stably over water-level fluctuations and produced reproducible samples, indicating strong potential for safer and more efficient long-term monitoring.

In conclusion, this study demonstrates that the pumping-based automatic sampler can serve as a practical alternative to conventional suspended sediment measurement methods. The system reduces safety risks, labor, and costs while enabling multi-depth and multi-cross-sectional sampling, thereby providing more accurate suspended sediment distribution and total load estimation. Beyond its application in small- and medium-sized rivers, this approach has the potential to be extended to larger rivers and diverse hydrological conditions, offering a robust technical foundation for advancing suspended-sediment monitoring programs.

This work was supported by Korea Environment Industry & Technology Institute (KEITI) through Research and development on the technology for securing the water resources stability in response to future change Program, funded by Ministry of Climate, Energy, Environment (MCEE) (RS-2024-00397970).

How to cite: Kwak, S., Son, G., and Roh, Y.: Field Evaluation of a Pumping-Based Automated Sampler for Suspended-Sediment Monitoring in Small to Medium Rivers, EGU General Assembly 2026, Vienna, Austria, 3–8 May 2026, EGU26-3260, https://doi.org/10.5194/egusphere-egu26-3260, 2026.

EGU26-3406 | Posters on site | HS9.2

Resolving Debris-Flow Avulsion Using Sub-Second Laboratory Topographic Time Series 

I-Wei Tsai and Tzu-Yin Kasha Chen

Debris-flow avulsion controls the shifting of active flow pathways across an alluvial fan and strongly influences fan construction. In turn, fan morphology and its evolution are major factors governing where avulsion occurs. Yet the avulsion process exhibits strong uncertainty and stochastic behavior that remains poorly resolved in field records. Most existing datasets are restricted to event- or annual-scale observations and therefore lack the temporal resolution needed to quantify how channels relocate during an event.

This study introduces a laboratory framework that directly resolves debris-flow avulsion using high-frequency topographic data. Debris flows built an alluvial fan within a 60 × 90 cm basin while eight synchronized 2K industrial cameras captured continuous multi-view imagery for Structure-from-Motion reconstruction. Spatial targets and an automated workflow yielded sequential point clouds, orthophotos, and DEMs in a fixed coordinate system, resolving fan-surface evolution at 0.1-s intervals and capturing rapid adjustments associated with avulsion.

We also obtain a consistent space–time record of channel traces during fan building, allowing relocation to be tracked at sub-second intervals. This record is derived by applying short-window long-exposure stacking to successive image frames, where locally disturbed areas reveal instantaneous channel footprints.

The resulting database captures sub-event-scale coupling between avulsion and fan morphology, clarifying how avulsion both responds to and reorganizes the fan surface. It also enables direct quantification of avulsion geometry, recurrence, and lateral displacement. Building on the empirical constraints provided by these measurements, the study aims to formulate a stochastic framework based on Gamma-subordinated OU processes to represent the episodic and bounded properties of debris-flow avulsion and to assess their implications for long-term fan morphology.

Figure. High-frequency SfM measurements of alluvial-fan evolution.
Top row: DEMs; middle row: orthophotos; bottom row: channel footprints extracted by short-window long-exposure stacking, revealing debris-flow avulsion.

How to cite: Tsai, I.-W. and Chen, T.-Y. K.: Resolving Debris-Flow Avulsion Using Sub-Second Laboratory Topographic Time Series, EGU General Assembly 2026, Vienna, Austria, 3–8 May 2026, EGU26-3406, https://doi.org/10.5194/egusphere-egu26-3406, 2026.

EGU26-3481 | ECS | Orals | HS9.2

Adaptation of an overflow flume to study the sediment bedload threshold using image correlation 

Yolane Abid, Elias Daich, Armelle Jarno, Ahmed Benamar, and Francois Marin

The bedload threshold of two fine sands S1 and S2 (D50 = 328 and 210 µm) were investigated in two different flumes: a recirculating flume (CH1) and an overflow flume (CH2) (Figure 1). Table 1 summarizes the characteristics of both flumes. In CH1, the sandy layer has a thickness of δ = 0.02 m and is placed on the fixed bottom. In CH2, the sediments were deposited in a pit extending over a 1.0 m length with a thickness of δ = 0.05 m. The bed thickness and the slopes (1:3) are consistent with the study of Van Rijn et al, (2019). For both flumes, the sediment bed is located in a fully developed flow area, and the water depth was maintained at d = 0.15 m. The main objective of this study was to configure CH2 to enable to study the threshold of motion of sediment particles using the image correlation method developed at the LOMC laboratory by Vah et al. (2020). This non-intrusive technique provides a highly sensitive and objective measurement compared to traditional techniques.

The image correlation method identifies the bedload threshold (Ubl) by analyzing the decorrelation between a reference initial image of the sediment bed at rest and a sequence of images captured during a slow linear flow acceleration (1.3 mm.s-2). As grains begin to move, the correlation drops linearly. Beyond the threshold, the slope of the decorrelation curve diminishes despite the increasing sediment motion. This observation is interpreted as a decorrelation saturation effect. As the bed surface undergoes important restructuring, the image loses its statistical similarity to the reference frame, reaching a correlation floor where further displacements no longer yield a linear decrease in the coefficient.

Generally, overflow flumes are tilted to analyze sediment motion. In this study, the flume slope was kept constant because the image correlation method requires a constant water depth. Consequently, an overflow flume (CH2) was adapted to allow the comparison of thresholds in two different setups. In CH1, the channel is filled until the target water depth is reached. Thus, no additional device is required to control the water height.

The filling process for CH2 differs significantly: it must be progressively filled over 15 minutes before each test to reach the desired water height (Figure 2a). This filling must be performed slowly to prevent premature sediment motion. Therefore, the spillway in CH2 was automated via LabView software to ensure slow filling and to maintain a constant water height. 

The main results are summarized below:

  • For both S1 and S2, the Ubl values detected in CH2 are lower than those in CH1 (Figure 3). This finding is attributed to step 1 in CH1 which excites the sediment particles and triggers an earlier threshold of motion.
  • An overflow flume can be effectively used to determine the threshold motion of sediment particles.


How to cite: Abid, Y., Daich, E., Jarno, A., Benamar, A., and Marin, F.: Adaptation of an overflow flume to study the sediment bedload threshold using image correlation, EGU General Assembly 2026, Vienna, Austria, 3–8 May 2026, EGU26-3481, https://doi.org/10.5194/egusphere-egu26-3481, 2026.

EGU26-3496 | Orals | HS9.2

Highly-resolved simualtions of hindered settling of porous particles 

Bernhard Vowinckel and Alexander Metelkin

Suspended sediment transport in natural and engineered aquatic systems is often governed by the settling behavior of porous and permeable particles such as flocs, aggregates, and organic-rich sediments. Understanding how particle permeability influences hindered settling is therefore essential for predicting sediment residence times, vertical fluxes, and deposition rates in rivers, lakes, and reservoirs. We investigate the settling dynamics of suspensions of highly porous and permeable particles using particle-resolved direct numerical simulations in the viscously dominated regime. The simulations employ a coupled Euler–Lagrange framework that explicitly accounts for particle permeability, allowing us to systematically quantify bulk settling velocities as a function of particle permeability and particle volume fraction. Our results show that the bulk settling velocity follows the classical Richardson–Zaki power-law scaling with volume fraction, but that particle permeability significantly modifies hindered settling. Suspensions composed of more permeable particles settle substantially faster at increasing concentrations: at a particle volume fraction of 30%, the bulk settling velocity differs by up to 116% between the least and most permeable particles considered. This enhanced settling is explained by permeability-dependent modifications of the fluid counterflows induced by particle displacement. Quantitative analysis of the mean vertical fluid velocity demonstrates that more permeable particles generate weaker upward counterflows, thereby reducing hydrodynamic resistance to settling. We further examine how velocity fluctuations, particle self-diffusivity, and suspension microstructure depend on particle permeability and concentration. Velocity fluctuations increase systematically with particle volume fraction and are strongest for the least permeable particles. Analysis of Voronoï tessellation and pairwise particle distributions reveals pronounced permeability-dependent microstructural differences, with stronger clustering and broader Voronoï cell volume distributions at low permeability, attributed to enhanced lubrication forces. In contrast, higher permeability leads to a greater likelihood of close particle proximity due to weakened interparticle pressure effects. These findings highlight particle permeability as a key control on hindered settling and suspension structure, with direct implications for process-based numerical models of sediment transport and deposition in open water environments.

How to cite: Vowinckel, B. and Metelkin, A.: Highly-resolved simualtions of hindered settling of porous particles, EGU General Assembly 2026, Vienna, Austria, 3–8 May 2026, EGU26-3496, https://doi.org/10.5194/egusphere-egu26-3496, 2026.

EGU26-4178 | ECS | Posters on site | HS9.2

Cyclic steps and hydraulic jumps along the topsets of experimental deltas 

Bao-Zhen Jenny Liao, Chiun-Chau Su, Wei-Jay Ni, and Hervé Capart

We report laboratory experiments devoted to the morphodynamics of fluvial deltas. Along the topsets of the prograding deltas, we observe the formation and upstream migration of cyclic steps and hydraulic jumps. The hydraulic jumps exert key controls on the cyclic step morphology, curtailing bed erosion by decelerating the flow and also delaying redeposition by mixing the suspended sediment throughout the flow depth. To characterize the associated water flow, sediment transport, and bed evolution, we image the backlit channel through its transparent sidewalls. A wide-angle camera records the cyclic steps and hydraulic jumps at regular time intervals, yielding repeat measurements of the slowly evolving sediment bed and free surface profiles (Fig. 1). In parallel, a high-speed camera records the rapid flow of suspended sediment particles through the jump (Fig. 2). Velocity and sediment concentration profiles are extracted, to characterize the mixing processes and energy dissipation that occur in the jump region. To complement the experimental measurements, the results of preliminary modeling attempts will also be reported.

Keywords: delta long profile evolution; cyclic steps; hydraulic jumps over erodible beds.

Fig. 1 Side view of the constant-width experimental channel, showing the formation of cyclic steps along the delta topset.

Fig. 2 High-speed visualization of the toe of the hydraulic jump: (a) Raw image frame; (b) Measured velocity field, with velocity profiles (orange) and sediment bed (red), zero horizontal velocity (green), and water free surface profiles (blue).

How to cite: Liao, B.-Z. J., Su, C.-C., Ni, W.-J., and Capart, H.: Cyclic steps and hydraulic jumps along the topsets of experimental deltas, EGU General Assembly 2026, Vienna, Austria, 3–8 May 2026, EGU26-4178, https://doi.org/10.5194/egusphere-egu26-4178, 2026.

EGU26-4231 | ECS | Posters on site | HS9.2

Multi-camera measurements of free surface topography and velocity for water flows past sediment deposits 

Eren Da-Xuan Zhou, Tzu-Hsun Lavender Chiu, Wei-Jay Ni, and Hervé Capart

We describe the development of a multi-camera system tailored for small-scale hydrodynamic and morphodynamic experiments. The system includes four precisely synchronized stationary cameras, together with a laser scan traverse. Prior to water flow, this allows precise camera calibration and topography measurements. The calibrated cameras are then used to acquire stereo views of the flow free surface (Fig.1), seeded with fluorescent particles (to avoid light reflection). The 3D positions of the particles are determined to sub-millimeter accuracy, and their trajectories obtained by particle tracking (Fig.2). This allows measurements of channel topography, surface topography and surface velocity to be acquired in a common frame of reference. The methods are validated using pure water flows over 3D-printed topography, then applied to experiments involving flows past live sediment beds, including debris fans and slackwater deposits. In addition to measurements, preliminary comparisons with hydrodynamic model results will also be reported.

Keywords: multi-camera imaging; stereo imaging; three-dimensional topography and velocity measurements.

Fig.1 Flood flow past a debris flow fan in a small-scale laboratory channel, stereoscopic views.

Fig.2 Flood flow past a debris flow fan in a small-scale laboratory channel. Top: surface velocity map (up to 60 cm/s); bottom: particle trajectories.

How to cite: Zhou, E. D.-X., Chiu, T.-H. L., Ni, W.-J., and Capart, H.: Multi-camera measurements of free surface topography and velocity for water flows past sediment deposits, EGU General Assembly 2026, Vienna, Austria, 3–8 May 2026, EGU26-4231, https://doi.org/10.5194/egusphere-egu26-4231, 2026.

EGU26-7066 | ECS | Orals | HS9.2

Global Patterns, Trends, and Drivers of Fluvial Suspended Sediment Fluxes from 1985 to 2024 

Haowei Zhou, Julian Leyland, Stephen Darby, Christopher Tomsett, Thomas Gernon, Thea Hincks, and Daniel Parsons

Fluvial suspended sediment is fundamental to channel morphology, delta formation, water quality, biogeochemical cycles and ecosystems. The Earth is currently experiencing unprecedented human impacts and climate change, which are profoundly altering suspended sediment dynamics in river systems. However, fluvial suspended sediment flux (SSF) remains poorly constrained at the global scale, and its response to environmental change is still not well understood. Here, we develop a machine-learning model (XGBoost) to estimate fluvial SSF using in situ observations from 445 gauging stations worldwide, combined with spectral bands and river widths derived from Landsat imagery, river slope from SWOT River Database (SWORD), and bankfull discharge from the Global River Bankfull Discharge (GQBF) dataset (Liu et al., 2024). The trained model is applied to estimate global monthly SSF from 1985 to 2024 for river segments wider than 90 m, covering a total river length of 1.08 × 10⁶ km extracted from the Global River Topology (GRIT) dataset (Wortmann et al., 2024). Independent validation indicates that the model achieves a relative error of 0.12 compared with in situ SSF observations. Our results show that the global average annual SSF is 112.8 kg s⁻¹, with a total sediment delivery from land to ocean of 3705.1 Mt yr⁻¹. From 1985 to 2024, global average annual SSF exhibits a significant decreasing trend (-0.81 kg s⁻¹ yr⁻¹), with an abrupt shift around 2005 from a non-significant to a significant decline (-0.83 kg s⁻¹ yr⁻¹). Despite this global decrease, a larger proportion of river segments show increasing SSF (32%) than decreasing SSF (26%). This apparent contradiction arises because river segments with decreasing SSF typically have higher fluxes (SSF > 50 kg s⁻¹), whereas increasing trends are concentrated in rivers with lower SSF (SSF < 50 kg s⁻¹). Finally, we investigate the dominant drivers and their compounded effects on global fluvial SSF dynamics using a Bayesian network framework. This study provides new insights into global patterns, trends, and controls of fluvial suspended sediment fluxes under ongoing environmental change.

Liu, Y., Wortmann, M., & Slater, L. (2024). Global River BankFull Discharge (GQBF) (0.1) [Data set]. Zenodo. https://doi.org/10.5281/zenodo.13855371

Wortmann, M., Slater, L., Hawker, L., Liu, Y., & Neal, J. (2024). Global River Topology (GRIT) vector datasets (0.6) [Data set]. Zenodo. https://doi.org/10.5281/zenodo.11219313

How to cite: Zhou, H., Leyland, J., Darby, S., Tomsett, C., Gernon, T., Hincks, T., and Parsons, D.: Global Patterns, Trends, and Drivers of Fluvial Suspended Sediment Fluxes from 1985 to 2024, EGU General Assembly 2026, Vienna, Austria, 3–8 May 2026, EGU26-7066, https://doi.org/10.5194/egusphere-egu26-7066, 2026.

EGU26-7466 | ECS | Posters on site | HS9.2

Validation of ADCP Velocity Measurements in Open-Channel Flow Using PIV and CFD 

Mohammd Tanvir Haque Tuhin, Marc Ladwig, Mudassar Razzaq, Florian B. Zirngibl, Daniel P. Gradzki, Marcel Gurris, Ralph Lindken, Reinhard Hinkelmann, and Christoph Mudersbach

Accurate experimental characterization of velocity profiles in open-channel flows is essential for hydraulic research and field-scale monitoring; however, the performance of Acoustic Doppler Current Profilers (ADCPs) near flow boundaries remains insufficiently constrained due to acoustic blind zones and instrument-induced biases. This contribution presents a comprehensive multi-method validation framework combining laboratory-scale Particle Image Velocimetry (PIV), ADCP measurements, and Computational Fluid Dynamics (CFD) simulations to quantify ADCP accuracy and limitations under controlled conditions.

Initial experiments were conducted in a straight rectangular flume under six steady flow conditions spanning Reynolds numbers from 6.5 × 10⁴ to 1.76 × 10⁵. High-resolution 2D2C-PIV provided near-wall velocity measurements with millimeter-scale spatial resolution and served as the primary experimental reference. ADCP measurements were obtained using a 3 MHz profiler (RS5). Validated CFD simulations reproduced the mean velocity profiles across the full flow depth and were used to complement regions inaccessible to acoustic measurements.

Results show that ADCP-derived mean velocities agree well with both PIV and CFD in the core flow region, with typical deviations within ±3–5%. Larger discrepancies occur in the lower and upper parts of the water column, where ADCP velocities exhibit depth-dependent measurement bias of up to 25–30% at low Reynolds numbers, associated with blanking distance, reduced signal correlation, and side-lobe interference. A tendency toward reduced velocity discrepancies with increasing Reynolds number is observed in the lower part of the water column, although the trend is not strictly monotonic across all flow cases. Consistent agreement between PIV and CFD confirms that the observed deviations primarily arise from instrumental limitations rather than flow physics. Building on these validated results, ongoing work focuses on optimizing ADCP configuration parameters, developing CFD- and PIV-assisted blind-zone reconstruction strategies, and extending the framework toward instrument-aware CFD and field-scale applications. The study establishes a reproducible benchmark for ADCP validation and provides practical guidance for interpreting acoustic velocity measurements in laboratory and natural open-channel flows.

How to cite: Tuhin, M. T. H., Ladwig, M., Razzaq, M., Zirngibl, F. B., Gradzki, D. P., Gurris, M., Lindken, R., Hinkelmann, R., and Mudersbach, C.: Validation of ADCP Velocity Measurements in Open-Channel Flow Using PIV and CFD, EGU General Assembly 2026, Vienna, Austria, 3–8 May 2026, EGU26-7466, https://doi.org/10.5194/egusphere-egu26-7466, 2026.

Mixing processes at the edge of mangrove forests primarily control the exchange of momentum and suspended materials between adjacent channels and the vegetated interior. When a mangrove forest is blocked by sea dikes and fish farms, known as squeeze conditions, the extent of this exchange can change due to stronger velocity gradients and less space for shear-layer development. However, our quantitative understanding of mixing under these squeeze conditions is limited. In this study, particle image velocimetry (PIV) observations and a 2DH model were used to explore mixing at the edge of a squeezed mangrove forest. The goal is to investigate near-edge flow structures that drive lateral exchange and to integrate these processes into eddy viscosity parameters for practical 2DH simulations. A physical experiment in the Delft laboratory flume was performed to examine velocity fields and mixing dynamics at the mangrove edge. PIV was used to measure instantaneous free-surface velocities along the interface, using 2 mm floating tracer particles at 10 Hz for 300 seconds. Results reveal that large horizontal coherent structures (LHCSs), which propagate along the forest edge with cycloidal-like motions, create alternating sweep and ejection events, along with stagnation and reverse-flow phenomena. To simulate the coastal squeeze, the width of the vegetated floodplain (forest) was gradually reduced. PIV data show that LHCSs can influence a larger area inside the vegetation (about 0.40 m) than the mean mixing-layer penetration (about 0.1 m). Reducing the mangrove forest width from 50 cm to 10 cm prevents the mean streamwise velocity from reaching transverse equilibrium, causes peaks in edge Reynolds stress, and shifts dominant quasi 2D structures toward higher-frequency, smaller, and less regular LHCSs (reducing the period from 11.5 to 8.5 seconds and normalised energy from roughly 80% to 65%). These changes hinder lateral exchange and limit conditions for sediment deposition within the forest. Additionally, a depth-averaged 2DH numerical model was created in Delft3D-FLOW to replicate the physical experiment. The simulations successfully captured vortex structures and demonstrated that LHCSs, along with sweep, ejection, stagnation, and reverse-flow events, can be modelled effectively. However, matching the observed magnitude of lateral momentum exchange required employing a hybrid eddy-viscosity model that enhances edge-intensified mixing, which conventional models do not capture. These findings suggest that constructing continuous shore-parallel breakwaters to fully enclose eroding and squeezed mangrove patches in estuarine and open-coast areas could suppress edge-flow events and coherent structures responsible for lateral exchange. This would impede mixing processes essential for mangrove survival and growth.

How to cite: Truong, S. H. and Uijttewaal, W. S. J.: Mixing Processes at the Mangrove Forest Edge under Coastal Squeeze: Insights from PIV and 2DH Modelling for Nature-Based Restoration , EGU General Assembly 2026, Vienna, Austria, 3–8 May 2026, EGU26-8780, https://doi.org/10.5194/egusphere-egu26-8780, 2026.

Floating debris accumulation in rivers is a critical hydraulic and geomorphological concern, especially during floods when large volumes of debris are mobilized and conveyed downstream (Pace et al., 2024). Debris accumulation at hydraulic structures (e.g., bridges and weirs) can markedly increase flow resistance, intensify local acceleration and turbulence, and impose excessive hydrodynamic loads, thereby threatening structural integrity and flood safety (Diehl, 1997; Ruiz-Villanueva et al., 2016). Despite numerous flood-related failures associated with floating debris , the three-dimensional processes governing debris accumulation and its interaction with complex flow fields remain insufficiently understood, limiting robust prediction and risk assessment (Braudrick and Grant, 2000; Manners et al., 2007). This study develops an open-source, three-dimensional numerical model(OpenFOAM) informed by flume experiments and elucidates the hydraulic mechanisms underlying floating debris accumulation through quantitative validation against laboratory observations.

The model incorporates experimentally observed debris-accumulation configurations and hydraulic responses (Kim, 2021; Müller et al., 2022), and reproduces debris transport pathways and accumulation processes based on controlled debris-feeding experiments (Toé et al., 2025). Model performance is evaluated across multiple accumulation scenarios through quantitative comparisons of key hydraulic variables, including water surface elevation, velocity fields, and Froude number, enabling assessment of backwater effects, local flow acceleration, and flow-regime transitions. In addition, the stability and failure of debris carpets reported by Toé et al. (2025) are numerically reproduced to examine accumulation–flow feedbacks under increasing discharge. The results demonstrate that the proposed model successfully captures the fundamental hydraulic processes governing floating debris accumulation and provides a robust framework for analyzing debris–flow interactions at hydraulic structures.
 Numerical predictions agree closely with experimental measurements, demonstrating that the model captures fundamental hydraulic mechanisms controlling debris accumulation at structures. The simulations reproduce preferential accumulation zones and temporal growth rates, resolving the coupling between three-dimensional flow structures and debris transport. Results further show that accumulation-induced flow contraction and associated near-bed shear stress amplification intensify localized turbulence and modify the near-bed flow regime, which in turn governs accumulation stability. Importantly, the spatial distribution and magnitude of bed shear stress emerge as primary determinants of transitions from stable accumulation to instability (e.g., squeezing) and eventual failure.
The proposed, experimentally validated, physics-informed model provides a reference framework for simulating floating debris transport, accumulation dynamics, and interactions with hydraulic structures. It supports quantitative assessment of debris-induced head losses and hydraulic loads, thereby informing flood-risk evaluation and the design and management of debris-prone structures.

”This work is financially supported by Korea Ministry of Climate, Energy, Environment (MCEE) as 「Research and Development on the Technology for Securing the Water Resources Stability in Response to Future Change (RS-2024-00332494)」.”

How to cite: Kim, J. and Kang, H.: Three-Dimensional OpenFOAM-Based Simulation of Floating debris Transport and Accumulation at Hydraulic Structures, EGU General Assembly 2026, Vienna, Austria, 3–8 May 2026, EGU26-8837, https://doi.org/10.5194/egusphere-egu26-8837, 2026.

EGU26-10947 | ECS | Posters on site | HS9.2

Modeling the Transport of Biodeposits in the Vicinity of a Mussel Raft 

Martín Riveira Varela and Mohsen Shabani

Semi-enclosed coastal systems such as the Ría de Arousa sustain high biological productivity and host aquaculture activities of major ecological and economic relevance. In this region, mussel farming (Mytilus galloprovincialis) on rafts dominates, making it the most productive area in Europe. The scale of this activity introduces additional pressures on the ecosystem, among which the production of biodeposits and their influence on the benthos are key aspects for the sustainable management of the industry.

From this perspective, Lagrangian particle transport modelling offers a valuable tool for quantifying and anticipating the dispersion and fate of these
biodeposits. In this work, we employ the MOHID-Lagrangian model, extended with new modules specifically designed to represent the behaviour of particles denser than seawater. In particular, we implement a resuspension scheme and propose a parameterisation for biodeposit degradation, thus extending capabilities traditionally applied to neutrally buoyant particles into a fully three-dimensional context.

The aim is to characterise biodeposit dispersal in the vicinity of a mussel raft and evaluate the model’s sensitivity to the newly introduced parameterisations, with the ultimate goal of advancing towards a more realistic and predictive representation of biodeposit fate in intensive aquaculture systems.

How to cite: Riveira Varela, M. and Shabani, M.: Modeling the Transport of Biodeposits in the Vicinity of a Mussel Raft, EGU General Assembly 2026, Vienna, Austria, 3–8 May 2026, EGU26-10947, https://doi.org/10.5194/egusphere-egu26-10947, 2026.

EGU26-11709 | ECS | Orals | HS9.2

Ice‐covered river hydraulics and bedload transport: Insights from three-dimensional modelling 

Can Ding, Omid Saberi, Tuure Takala, Juha-Matti Välimäki, Erik de Goede, Bert Jagers, Erik Mosselman, and Eliisa Lotsari

In cold regions, river sediment transport during mid-winter periods is strongly influenced by the presence of ice cover. However, the effects of ice cover on bed shear stress, sediment mobility, and the longer-term evolution of fluvial geomorphology remain insufficiently understood due to the complexity of the physical mechanisms and the scarcity of relevant field measurements. To address this gap, the present study investigates mid-winter bedload transport processes in a sub-arctic river under ice-covered conditions using the Delft3D Flexible Mesh (Delft3D FM) software. The modelling approach employs a novel integration of three-dimensional (3D) hydrodynamics, sediment transport and ice to resolve interactions between hydraulics, ice-induced resistance, and sediment mobility. The Pulmankijoki River in northern Finland was selected as the study site owing to its typical sub-arctic hydrological regime and seasonal ice cover. Comprehensive field measurements, including river topography, flow discharge, water level, sediment diameters, bedload transport rate, and ice thickness, were conducted during 22–29 February 2022, 21–28 February 2023, and 17–24 February 2024.

Based on the numerical results, firstly, comparison with field measurements shows that the 3D model is more accurate than the depth-averaged (2D) approach, demonstrating its advantage in bedload transport simulations under ice-covered conditions. This highlights the importance of resolving vertical velocity gradients. Secondly, sensitivity experiments on the ice-cover roughness coefficient indicate that ice roughness has only a minor influence on bed shear stress and therefore does not significantly modify bedload transport rates. Thirdly, by mapping the ratio of local bed shear stress to critical shear stress, spatial patterns of sediment transport potential during the three mid-winter seasons were clarified, illustrating how sediment mobility persists beneath ice. This study demonstrates that Delft3D FM is an effective modelling tool for resolving sediment transport under ice-covered conditions in sub-arctic rivers. The findings contribute to an improved process-based understanding of winter river dynamics and provide insights for sediment management strategies in cold-region environments.

How to cite: Ding, C., Saberi, O., Takala, T., Välimäki, J.-M., de Goede, E., Jagers, B., Mosselman, E., and Lotsari, E.: Ice‐covered river hydraulics and bedload transport: Insights from three-dimensional modelling, EGU General Assembly 2026, Vienna, Austria, 3–8 May 2026, EGU26-11709, https://doi.org/10.5194/egusphere-egu26-11709, 2026.

EGU26-13816 | ECS | Orals | HS9.2

Modelling the Morphodynamic Response To Flow Regulation In An Artificial Reservoir 

Luca Cortese, Mark Behn, Anthony Edgington, Sydney Crisanti, Travis Dahl, Christopher Sheehan, Danielle Tarpley, Amanda Tritinger, and Noah Snyder

Reservoir sedimentation is the gradual deposition of sediment transported by inflowing rivers in artificial lakes. Monitoring this accumulation is essential to preserve storage volume and protect infrastructure, such as turbine components. Numerical models are powerful tools to address this goal, as they can simulate morphodynamic processes across both temporal and spatial scales. In this study, we developed a Delft3D-FM model of Lake Seminole (USA) to answer two questions: (1) how does deposition change between regular flow and flood conditions? and (2) what is the impact of upstream flow regulation on sediment deposition?

Created in 1954 with the construction of the Jim Woodruff Dam, Lake Seminole sits at the confluence of the Chattahoochee and Flint rivers. This location is an ideal site because the reservoir is divided into two distinct arms:

  • The Chattahoochee arm, which is fed by the heavily regulated Chattahoochee River and experiences strong daily discharge fluctuations due to hydropeaking.
  • The Flint arm, which is fed by the minimally regulated Flint River and exhibits a natural flow regime.

Here we develop a morphodynamic Delft3D-FM model coupled with the Real-Time Control (RTC) module. Time-variable discharge inputs from USGS gauges define the upstream boundary conditions, while water levels at the dam define the downstream boundary. The hydrodynamic model is calibrated using OpenDA by adjusting Manning’s roughness coefficients based on Signature 1000 ADCP velocity measurements. The sediment transport model is calibrated using suspended sediment concentrations collected via Teledyne ISCO water samplers.

Model results show that regular flow conditions lead to net deposition, while flood conditions generate temporary and deep scouring, resulting in net erosion. Additionally, in the Chattahoochee arm, daily discharge fluctuations driven by hydropower redistribute fine sediments throughout the reservoir during peak flows. As discharge drops, sediments settle but are quickly remobilized by the subsequent peak flows. Overall, this study illustrates how hydraulic conditions drive morphological change in Lake Seminole and underscores the significant impact of river regulation on reservoir sedimentation.

How to cite: Cortese, L., Behn, M., Edgington, A., Crisanti, S., Dahl, T., Sheehan, C., Tarpley, D., Tritinger, A., and Snyder, N.: Modelling the Morphodynamic Response To Flow Regulation In An Artificial Reservoir, EGU General Assembly 2026, Vienna, Austria, 3–8 May 2026, EGU26-13816, https://doi.org/10.5194/egusphere-egu26-13816, 2026.

EGU26-14471 | Orals | HS9.2

Modelling the Impact of Soil Water Repellency on Catchment-Scale Soil Erosion 

Marco Van De Wiel and Tina Fallah

Soil erosion is a significant environmental issue with far-reaching consequences for both agriculture and the natural ecosystem. Soil water repellency (SWR) impacts erosion through a dual mechanism. Hydrologically, SWR reduces infiltration and enhances overland flow, intensifying erosion. Mechanically, it affects soil cohesion, potentially decreasing resistance to detachment. While the hydrological effects are well studied, the mechanical impacts of SWR remain less explored. Previous studies have reported mixed impacts of SWR on soil erosion, with SWR sometimes increasing soil erosion and, in other cases, reducing it. To address this apparent ambiguity, we use catchment-scale simulations with the LISEM model to systematically isolate and test SWR’s hydrological effects (via reduced infiltration) and mechanical effects (via altered soil cohesion) on erosion. Two types of configurations are considered: spatially homogeneous (uniform land cover and soil type) and heterogeneous (spatially varied SWR, based on land cover or soil type). All configurations are run under two regimes: low- and high-excess rainfall. Considering only the hydrological impacts was found to consistently increase erosion in all configurations. In homogeneous setups, changes in soil cohesion produce texture-dependent responses: increased soil cohesion mitigates erosion increases in finer soils but has a limited impact in coarse-textured soils. This effect is much more pronounced under high-excess rainfall than low-excess rainfall. The heterogeneous configuration exhibits distinct spatial patterns: land cover–based heterogeneity follows vegetation-slope interactions, whereas soil-based heterogeneity is shaped by intrinsic soil hydraulic–-mechanical properties. Overall, the net erosional impacts of SWR are shown to depend on the balance between its hydrological and mechanical effects on erosion. This research implies that preventing and mitigating the erosional impacts of SWR requires a management approach adapted to the prevailing land-use and soil conditions.

How to cite: Van De Wiel, M. and Fallah, T.: Modelling the Impact of Soil Water Repellency on Catchment-Scale Soil Erosion, EGU General Assembly 2026, Vienna, Austria, 3–8 May 2026, EGU26-14471, https://doi.org/10.5194/egusphere-egu26-14471, 2026.

EGU26-14789 | ECS | Orals | HS9.2

Impact of acceleration and deceleration rates on the entrainment and settling thresholds of a sandy bed 

Elias Daïch, Yolane Abid, Armelle Jarno, and François Marin

Understanding the impact of flow transients is critical for predicting sediment dynamics in environments characterized by high unsteady currents, such as macro-tidal systems and estuaries. In such contexts, the acceleration and deceleration rates investigated in this study (1.3 to 10.4 mm/s²) provide new insights into how flow unsteadiness affects the sediment transport cycle. The estimation of the threshold motion is very important for the evaluation of sediment transport. The image correlation method developed by Vah et al. (2022) for the detection of threshold motion in laboratory flume is considered. Two thresholds are detected with this method : the bedload (Ubl) and bedform (Ubf) thresholds. They were measured for the sand S328 (D50 = 328 µm) with different acceleration and deceleration ramps.

The stability observed in the threshold of motion for the studied sand can be attributed to an initial triggering of grain movement driven by the instantaneous local drag force. Furthermore, while the bedload threshold remains constant (0.31 m/s) for acceleration rates ranging from 1.3 to 10.4 mm/s², the settling threshold exhibits a strong dependence on flow deceleration. Specifically, at higher deceleration rates, grains maintain motion until reaching lower flow velocities (0.21 m/s), suggesting a significant hysteretic effect driven by particle inertia. Finally, the earlier onset of ripples under high acceleration—occurring at 0.32 m/s compared to 0.36 m/s at lower rates—suggests that fluid acceleration promotes morphological instability, thereby shortening the transition from a flat bed to bedform development.

Reference

Vah, M., Khoury, A., Jarno, A., & Marin, F. (2022). A visual method for threshold detection of sediment motion in a flume experiment without human interference. Earth Surface Processes and Landforms, 47(7), 1778-1789.


How to cite: Daïch, E., Abid, Y., Jarno, A., and Marin, F.: Impact of acceleration and deceleration rates on the entrainment and settling thresholds of a sandy bed, EGU General Assembly 2026, Vienna, Austria, 3–8 May 2026, EGU26-14789, https://doi.org/10.5194/egusphere-egu26-14789, 2026.

Hydromorphological processes are fundamental in shaping water bodies, however, predicting erosion, sediment transport and deposition, and their impacts, becomes particularly challenging under extreme conditions. High-magnitude events of anthropogenic or natural origin can trigger the release of massive sediment concentrations into riverine systems, disrupting their equilibrium and driving significant morphological changes on local, regional, short, and long-term scales. Notable examples include debris flows, mass movements, extreme floods, outburst floods, and dam breaks. Among these, tailings dam failures are particularly relevant due to the severe environmental risks they pose in mining regions and the amount of sediment they release. It is evidenced by recent catastrophic events worldwide (Mount Polley in 2014, in Canada in; Mariana in 2015 and Brumadinho in 2019, in Brazil), that caused severe and long-lasting damage to ecosystems, river systems, and communities. In this context, a significant scientific gap remains in understanding how numerical sediment transport models perform under such conditions. Most sediment transport equations are empirical and were originally developed for natural river ecosystems. They were not built for the hyper-concentrated flows associated with catastrophic flood events, like extreme floods and tailings dam breaks. Consequently, assessing the efficacy and sensitivity of hydrodynamic models coupled with sediment transport for extreme events becomes an important step to evaluate viable tools for impact assessment and prognostic evaluations. In this study, we evaluated a physically-based 2D hydrodynamic model (HEC-RAS 2D) to simulate the sediment dynamics of the 2019 Brumadinho dam break in Brazil. During this event, approximately 9.8 Mm³ of material was released in just 5 minutes. The tailings wave, consisting of 45% sediment particles, propagated downstream in a small subcatchment (Ferro-Carvão stream) for 20 km over approximately 1.5 hours until reaching a major river. It is estimated that nearly half of the released volume was retained in the Ferro-Carvão floodplain through depositional processes, flooding 2.7 km² and significantly reshaping the local morphology. A global sensitivity analysis was performed using a Monte Carlo framework, generating 630 model runs that varied four key sediment-related input parameters: total sediment load, grain size distribution, sediment specific gravity, and model adaptation length. The methodology integrated validation with observed field data, sediment mass balance, and non-parametric statistical tests (Kruskal–Wallis) to assess parameter significance across outputs such as bed change, sediment mass outflow, and volume in the model’s domain. Results show that sediment load strongly influenced all outputs (bed change, sediment outflow, and volume outflow), while specific gravity and adaptation length had moderate effects, particularly on depositional patterns. Grain size showed unexpectedly low sensitivity. Validation results demonstrated model reliability in simulating the case study, with relative errors ranging from 8.1% to 10.1% and accuracy rates of 90–92% for bed change, sediment outflow, and volume outflow. The simulation effectively reproduced spatial sediment dynamics, with depositional zones matching field observations. However, localized overestimations of deposition highlighted limitations in capturing specific erosional processes. These findings underscore the importance of sensitivity analysis for robust calibration and provide critical insights into the uncertainties of simulating morphological changes driven by extreme events.

How to cite: Mello, C. and Eleutério, J.: Capability of hydrodynamic model to achieve sediment transport and deposition dynamics for large flood events: a parameter sensitivity analysis for a tailings dam break real event, EGU General Assembly 2026, Vienna, Austria, 3–8 May 2026, EGU26-14817, https://doi.org/10.5194/egusphere-egu26-14817, 2026.

This study investigates the propagation and attenuation of short and long waves within mangrove forests by combining physical experiments at the experimental scale with 1D and 2D numerical wave models at the field scale along the Mekong Delta coast. Physical experiments were conducted in a wave flume at TU Delft laboratory to examine the transformation of short and long waves under different mangrove forest configurations. The separation of incident and reflected waves, as well as short- and long-wave components, was performed to quantify the relative contribution of different wave processes to overall wave attenuation. In parallel, numerical wave-flume models were constructed using XBeach and SWASH to mimic the experimental setup. Comparisons between measured and simulated wave parameters indicate a good model performance and support the scaling of experimental findings to real world conditions.

Building on these controlled investigations, the analysis was extended to the Mekong Delta by constructing detailed 1D and 2D numerical models of mangrove forests along the delta's Eastern coast. In addition to real bathymetry, idealised concave and convex cross-shore profiles with varying degrees of curvature were introduced to explore the effect of coastal squeeze and erosion processes on wave transformation. This unified modelling framework enables a systematic comparison of wave behaviour from the laboratory to the field scale. The results demonstrate relatively consistent trends in wave attenuation between physical experiments and numerical models, while also highlighting a strong sensitivity of wave-height transformation to cross-shore profile geometry, mangrove width, and the relative positions of the fish farms. These sensitivities are particularly evident in relation to the location of fish farms and sea dikes situated landward of the mangrove system. Results indicate that a concave profile offers more favorable natural conditions for mangrove development, particularly in terms of wave energy absorption and sediment accumulation, whereas convex profiles are more prone to wave reflection and exhibit lower attenuation efficiency.

The width of the mangrove forest and the location of fish farms or sea dikes landward of the system significantly affect wave-height behaviour both in front of and within the forest. A reduction in mangrove width, together with the landward structures being pushed closer to the shoreline, increases reflected wave energy and return currents at the mangrove edge. Consequently, it is hypothesised that mangrove removal and seaward expansion of fish farms enhance reflected wave heights and return-flow velocities near the forest edge, thereby promoting erosion in this zone. Such processes may induce a transition from convex to concave cross-shore profiles, thereby further accelerating erosion. The results highlight the importance of maintaining sufficient mangrove width and carefully positioning sea dikes and aquaculture infrastructure relative to the mangrove edge, particularly where cross-shore profiles evolve from concave to convex forms that increase wave reflection and reduce attenuation efficiency.

How to cite: Phan, L. K., Vu, A. M., and Stive, M. J. F.: From Physical Experiments to 1D and 2D Numerical Models of Wave Propagation in Mangrove Forests: Implications for Nature-Based Solutions in the Mekong Delta, EGU General Assembly 2026, Vienna, Austria, 3–8 May 2026, EGU26-16090, https://doi.org/10.5194/egusphere-egu26-16090, 2026.

EGU26-16300 | ECS | Orals | HS9.2

Numerical Modeling of Gradual Sand Extraction from an Active Alluvial Channel 

Ravi Kumar Mishra, Bandita Barman, and Tinesh Pathania

The increasing demand for river sediments to meet the needs of rapid urbanization, industrial development, and economic growth has posed significant challenges to several major river systems (Bendixen et al., 2019). Studies have shown that unregulated mining of sand and gravel from rivers can have negative impacts on the morphology, environment, and hydraulic structures located nearby (Rentier and Cammeraat, 2022). The formation of a pit after the extraction of sediment from the river bed is known to influence the local flow and sediment transport processes. These alterations in the hydro-morphodynamic characteristics result in the migration of the mining pit and bed degradation downstream. The advancements in instrumentation and computational modeling techniques have allowed researchers and practitioners to better understand the flow and sediment dynamics near mining locations (Mishra et al., 2024). The literature suggests that the approach used to model mining activities in previous studies generally involved changes to the bed corresponding to the extracted sediment volume at the initial stage. However, in scenarios with in-channel sediment mining activity occurring along with flow over a certain time period, pit formation is gradual (Nguyen et al., 2025). Therefore, in this study, we used the TELEMAC-2D hydrodynamic solver coupled with the GAIA sediment transport model to simulate the impact of gradual mining activity on the hydro-morphodynamics. The results provide insight into sediment transport and bed evolution in the vicinity of the gradual sand extraction site.


References

Bendixen, M., Best, J., Hackney, C., & Iversen, L. L. (2019). Time is running out for sand. Nature, 571(7763), 29-31.

Mishra, R. K., Barman, B., & Pathania, T. (2024). Three-dimensional modeling of hydro-morphodynamic characteristics of mining affected alluvial channel using TELEMAC and GAIA. Physics of Fluids, 36(10).

Nguyen, B. Q., Kantoush, S. A., & Sumi, T. (2025). Assessing the multidimensional impacts of riverbed sand mining on geomorphological change and water transfer rate: A comprehensive investigation of Central Vietnam’s Vu Gia Thu Bon River system. Journal of Hydrology, 654, 132853.

Rentier, E. S., & Cammeraat, L. H. (2022). The environmental impacts of river sand mining. Science of the Total environment, 838, 155877.

How to cite: Mishra, R. K., Barman, B., and Pathania, T.: Numerical Modeling of Gradual Sand Extraction from an Active Alluvial Channel, EGU General Assembly 2026, Vienna, Austria, 3–8 May 2026, EGU26-16300, https://doi.org/10.5194/egusphere-egu26-16300, 2026.

EGU26-16533 | ECS | Posters on site | HS9.2

Sensitivity of HEC-RAS 2D Predictions to Vegetation-Related Manning’s n in Patchy Vegetated Channels 

Laily Fadhilah Sabilal Haque, Eunkyung Jang, and Un Ji

Vegetation can substantially alter flow behavior in streams by increasing hydraulic resistance, modifying momentum exchange, and generating localized flow structures. In two-dimensional flow modeling, representing vegetation effects remains challenging because model setups typically require estimating multiple spatially distributed resistance parameters from vegetation patterns and parameterizing heterogeneous vegetation traits. Among these, the flow-resistance coefficient for the vegetated section is the most sensitive yet uncertain parameter, and it is frequently simplified or assigned empirically. Therefore, this study investigates the sensitivity of two-dimensional model predictions of water-surface elevation and velocity to the flow-resistance coefficient in a vegetated channel.
Numerical simulations were performed using HEC-RAS 2D and calibrated against a large-scale flume experiment conducted in a straight channel with evenly spaced willow patches along the centerline. Channel topography was reconstructed from high-density point-cloud data and resampled into digital elevation model datasets at a 1 mm grid resolution. The vegetated channel was simulated under both high- and low-flow conditions using three vegetation patch configurations: group-dense, single-dense, and single-sparse. Flow resistance within the vegetated areas was represented by spatially distributed Manning’s n values in the HEC-RAS 2D model. Model results obtained using Manning’s n values derived from a momentum-based model were compared with those obtained using manually calibrated Manning’s n values.
The results show that, for the group-dense configuration, applying Manning’s n values estimated by the momentum-based model led to overestimation of both water-surface elevation and flow velocity relative to the large-scale experiment data. Manning’s n values manually calibrated to match the experimental observations were lower than those estimated by the momentum-based model. For the single-patch configurations, both dense and sparse cases consistently underestimated water-surface elevation, whereas flow velocities were overestimated across all tested Manning’s n values. Overall, the study shows that the performance of vegetation-related Manning’s n in two-dimensional hydraulic models varies with vegetation density and patch configuration. The observed differences between group and single-patch vegetation highlight potential limitations in representing vegetation resistance solely through a Manning’s n parameter under spatially heterogeneous conditions.

Acknowledgement: This research was funded by the Korea Environment Industry & Technology Institute (KEITI) through the Smart Water-supply Service Research Program, funded by the Korea Ministry of Climate, Energy, Environment (MCEE)(RS-2022-KE002091).

How to cite: Haque, L. F. S., Jang, E., and Ji, U.: Sensitivity of HEC-RAS 2D Predictions to Vegetation-Related Manning’s n in Patchy Vegetated Channels, EGU General Assembly 2026, Vienna, Austria, 3–8 May 2026, EGU26-16533, https://doi.org/10.5194/egusphere-egu26-16533, 2026.

EGU26-17107 | ECS | Orals | HS9.2

Bending or swaying: adaptive strategy of submerged flexible vegetation in the shallow streams 

Jiahao Fu, Guojian He, and Hongwei Fang

The dynamic motion of submerged flexible vegetation under flow conditions is ubiquitous in aquatic ecosystems. This motion alters flow resistance and affects plant growth, reproduction and evolution. While two-dimensional bending surrogates (e.g., seagrass blades) have been widely used to replicate natural plant motion, vegetation in shallow streams such as ceratophyllum often exhibits complex three-dimensional coherent swaying. Typically growing in gentle, shallow unidirectional flows, such plants rely more on buoyancy than rigidity as an adaptive response—they sway with the flow rather than bend against it.

To testify this hypothesis, we propose a novel non-uniform surrogate conceptualizing such stream vegetation. Laboratory experiments reproduced the three-dimensional coherent swaying behaviour observed in the shallow streams. Results reveal a counterintuitive drag non-increase of the collective coherent swaying in the canopy. A theoretical framework integrates hydrodynamic interactions among flexible plants, sheltering effects, and vortex optimization to explain the observed drag non-increase. Optimal tissue buoyancy, canopy spatial configuration and submergence ratio are derived for the benefit of evolution. The adaptive strategy provides new insights into the trade-offs between rigidity and buoyancy in aquatic vegetation and their implications for canopy function and connectivity.

How to cite: Fu, J., He, G., and Fang, H.: Bending or swaying: adaptive strategy of submerged flexible vegetation in the shallow streams, EGU General Assembly 2026, Vienna, Austria, 3–8 May 2026, EGU26-17107, https://doi.org/10.5194/egusphere-egu26-17107, 2026.

EGU26-17138 | ECS | Posters on site | HS9.2

Grain size controls on turbidity-based suspended sediment estimation 

Klaudija Lebar, Simon Rusjan, and Tamara Kuzmanić

Two different optical sensors were used to investigate the relationship between the grain size of suspended sediment and turbidity readings. Turbidity measurements are frequently used in practice to assess sediment transport in water bodies. If the influence of grain size on turbidity sensor readings is ignored or insufficiently addressed, the estimated sediment concentrations and, consequently, sediment amounts can be biased. This contribution presents laboratory results from an experiment on the dependence of turbidity readings on different grain size and concentration regimes. The importance of grain size is demonstrated using three wide grain-size range sediment suspensions and seven narrow grain-size sediment suspensions. Additionally, the findings were applied to a real-life example to illustrate how misleading “simplified” sediment rating curves can be when assessing sediment load.

How to cite: Lebar, K., Rusjan, S., and Kuzmanić, T.: Grain size controls on turbidity-based suspended sediment estimation, EGU General Assembly 2026, Vienna, Austria, 3–8 May 2026, EGU26-17138, https://doi.org/10.5194/egusphere-egu26-17138, 2026.

EGU26-18596 | ECS | Posters on site | HS9.2

Stereo-PIV-based assessment of ADCP performance in turbulent open-channel flow 

Florian B. Zirngibl, Marc Ladwig, Mohammd Tanvir Haque Tuhin, Daniel P. Gradzki, Christoph Mudersbach, and Ralph Lindken

The objective of this contribution is to assess the applicability of an Acoustic Doppler Current Profilers (ADCP) system for open-channel velocity measurements through validation against Stereoscopic Particle Image Velocimetry (Stereo-PIV) data. Stereo-PIV provides high spatial resolution and detailed insight into flow structures in laboratory open-channel hydraulics, delivering three-dimensional velocity components. ADCPs are widely used for velocity and discharge measurements, offering robust data collection even in sediment-laden and optically challenging environments. Their performance depends on acoustic frequency, flow conditions, and the size and concentration of suspended particles. To evaluate both systems under identical conditions, we conducted simultaneous Stereo-PIV and ADCP measurements in a laboratory flume, with emphasis on acoustically challenging regions.

In this contribution, we present results from measurements conducted in a 16 m open-channel flume with a rectangular cross-section at the Laboratory for Hydraulic Engineering and Hydromechanics at Bochum University of Applied Sciences. The experiments covered Reynolds numbers between Re = 4.6 × 10⁴ and 1.6 × 10⁵ and Froude numbers between Fr = 0.04 and 0.1. The stereoscopic PIV setup consists of two CMOS double-frame cameras with macro lenses and Scheimpflug adapters. Polyamide (PA12) particles with a mean size of 20 µm were used as tracers and were illuminated by a Nd:YAG double-pulse laser. Stereo-PIV measurements were performed in a cross-sectional plane oriented orthogonal to the side walls. Measurements at multiple streamwise positions were obtained by translating the plane in several equidistant increments, enabling the assessment of spatial variations along a defined channel segment. For the ADCP measurements a Sontek RS5 profiler was used under clear-water conditions to capture velocity profiles in the fully developed flow region. The analysis accounts for near-boundary limitations by focusing on ADCP blanking zones and their impact on mean velocities and turbulence proxies.

Results show a high accuracy of the Stereo-PIV and ADCP measurement in the core region of the channel flow with slight  deviations in the measurement results and to theory. Closer to the boundaries the ADCP results deviate stronger from the Stereo-PIV results, indicating the need to optimize the ADCP evaluation methods for near-boundary applications.

How to cite: Zirngibl, F. B., Ladwig, M., Tuhin, M. T. H., Gradzki, D. P., Mudersbach, C., and Lindken, R.: Stereo-PIV-based assessment of ADCP performance in turbulent open-channel flow, EGU General Assembly 2026, Vienna, Austria, 3–8 May 2026, EGU26-18596, https://doi.org/10.5194/egusphere-egu26-18596, 2026.

Suspended sediment concentration (SSC) plays a central role in sediment transport, river morphodynamics, ecosystem functioning, and the impact of human activities on fluvial systems. Despite its importance, long-term and spatially distributed SSC monitoring remains limited. Most operational monitoring approaches rely on turbidity as a proxy for SSC, which requires frequent site-specific calibration and often performs poorly when sediment properties vary in time or between catchments. This limits the comparability of measurements across river networks and hydrological conditions.

Here, we present a new approach to in situ SSC monitoring that combines improved optical sensing with a distributed sensor network and embedded data-driven modelling. The monitoring network comprises approximately 20–30 autonomous sensors deployed in Swiss rivers across a range of climatic and geomorphic settings, operated in close collaboration with scientific partners. While the embedded model focuses on improving SSC estimation at the sensor level, the network design enables early network-scale observation of suspended sediment dynamics relevant for morphodynamic analyses.

We introduce an improved optical suspended sediment sensor designed for long-term field deployment. Compared to earlier sensor versions, the instrument shows increased signal stability and sensitivity under variable flow and concentration conditions. A key design feature is access to raw optical measurement signals rather than internally processed turbidity outputs, enabling SSC estimation approaches that are not constrained by traditional turbidity-based assumptions and extending the effective measurement range up to 20 g/L.

Building on this capability, we develop a lightweight embedded machine learning model that estimates SSC directly from raw sensor signals. Instead of using turbidity as an intermediate proxy, the model exploits multi-dimensional signal characteristics that better represent catchment sediment properties. The model is trained and evaluated using paired in situ measurements and reference samples collected across multiple deployment sites.

We assess model performance at selected field sites spanning contrasting hydrological regimes and sediment sources. Results show improved agreement with reference SSC measurements compared to conventional turbidity-based estimates, particularly during periods of rapidly changing sediment concentrations. The approach shows reduced sensitivity to short-term signal variability and sensor drift.

While the network is still at an early stage, these results demonstrate how improved SSC estimation at the sensor level, combined with distributed sensing, can support more transferable observations of sediment dynamics across river systems. The presented framework has implications for sediment transport studies, morphodynamic model calibration and validation, and the design of scalable monitoring networks.

How to cite: Droujko, J.: Beyond turbidity: embedded modelling of suspended sediment concentration and distributed sensing for morphodynamic observation, EGU General Assembly 2026, Vienna, Austria, 3–8 May 2026, EGU26-18817, https://doi.org/10.5194/egusphere-egu26-18817, 2026.

EGU26-19319 | ECS | Orals | HS9.2

Austrian Slot Samplers in Alpine Streams and Gravel Bed-Rivers: Methodological Synthesis, Technical Development, and Operational Limits 

Rolf Rindler, Lukas Unger, Sabrina Schwarz, Dorian Shire-Peterlechner, Andrea Lammer, and Helmut Habersack

The transportation of bed load is an integral component of the morphology and functionality of river systems. This phenomenon is of paramount importance for the morphological appearance and availability of habitats. However, the process of recording this phenomenon has proven to be challenging. This article synthesizes two decades of Austrian experience with slot samplers for direct bedload measurement in alpine rivers and steep streams, providing a consolidated design overview and practical guidance for future installations and showing already known limits and challenges of this direct measuring method. A comprehensive description is provided of all configurations that have been deployed over the years, ranging from early shaft slot samplers to hydraulically liftable systems with optimized sealing and flushing mechanisms. Preliminary field observations indicate that, despite the availability of ample storage capacity, extreme events can impede measurement duration due to rapid filling. Maintaining watertightness and preventing sediment ingress in narrow, morphodynamically active channels continue to be pivotal challenges. Methodologically, slot samplers facilitate uninterrupted mass increase during flood events and grain-size characterization. However, their applicability is constrained by capacity, maintenance demands, and an upper grain-size limit. This limitation can be mitigated through appropriate design and complementary surrogates. Recent generations have enhanced deployment options during flood events through remote opening mechanisms and improved sample representativeness through the implementation of lifting mechanisms, lids with circumferential surfaces ("shoebox" lids), and flushing techniques. The integrated monitoring stations under consideration in this study couple direct slot samplers with geophone- and acoustic-based surrogates. These monitoring stations are site-calibrated to resolve event dynamics, hysteresis, and seasonal trends. In Austria, three torrents and two alpine gravel-bed rivers have been equipped with these systems; the first system was installed in 2006, and the latest liftable slot sampler (2.0) was completed in 2025. The following key findings from monitoring were identified: i) Event-long, complete grain-size distributions; ii) Continuous quantification of transport via weighing; iii) Detection and monitoring of selective transport; and iv) Successful sampling and calibration during floods with return periods up to 30 years.

How to cite: Rindler, R., Unger, L., Schwarz, S., Shire-Peterlechner, D., Lammer, A., and Habersack, H.: Austrian Slot Samplers in Alpine Streams and Gravel Bed-Rivers: Methodological Synthesis, Technical Development, and Operational Limits, EGU General Assembly 2026, Vienna, Austria, 3–8 May 2026, EGU26-19319, https://doi.org/10.5194/egusphere-egu26-19319, 2026.

EGU26-19504 | ECS | Orals | HS9.2

Hydroacoustic insights into bedload and suspended sediment dynamics in Nepal's Himalayan rivers  

Eliana Toro Paz, Hugh Sinclair, Mark Naylor, and Matthew Gervais

Coarse sediment transport in Himalayan rivers exerts a first-order control on river morphology, flood hazard, and the longevity of hydropower infrastructure. Variations in gravel or sand export from the mountain front govern downstream channel incision and aggradation rates, directly modifying channel conveyance capacity and flood risk on the Gangetic Plains. These highly mobile gravel-bed rivers draining the Himalayas are prone to abrupt channel switching driven by the mobility of coarse bedload, exacerbating flood hazard. Despite their importance, current flood models and hydropower development plans remain limited by uncertainties in bedload flux estimates. 

To understand the controls on sediment yield from the mountain front, we monitor both suspended sediment load through direct sampling, and bedload through acoustic and seismic monitoring at the mountain front of the Karnali and West Rapti Rivers in Nepal. Two Aquarian hydrophones connected to AudioMoth data loggers are installed at each site to monitor bedload transport for the duration of an entire monsoon season. This acoustic dataset is combined with seismic data from a DiGOS geophone at each site, water level data from the Department of Hydrology and Meteorology in Nepal, and manual suspended sediment concentration sampling. These complementary approaches independently approximate the sand and gravel fractions respectively, allowing us to evaluate the accuracy of current approximation methods for bedload in Himalayan rivers.  

The results indicate that suspended sediment loads are primarily supply-limited, showing a pronounced seasonal hysteresis in suspended sediment concentration with peaks that record local events such as landslides and storms in the catchment. In contrast, the bedload flux appears to be transport-limited, closely tracking the river discharge. Acoustic data show initial bedload movement at lower discharges, with an abrupt increase in bedload transport signal at a threshold discharge. At higher discharges there is a saturation of the signal, which may reflect boundary conditions of bedload transport or data clipping. These contrasting signals indicate independent transport mechanisms for suspended load and bedload, with a high degree of variability in suspended load relative to a much more predictable bedload flux. Seasonal fluctuations in this bedload-to-suspended-load ratio demonstrate that bedload estimates based on suspended sediment measurements can substantially misrepresent total sediment fluxes, with major implications for flood early warning systems and urban planning. 

How to cite: Toro Paz, E., Sinclair, H., Naylor, M., and Gervais, M.: Hydroacoustic insights into bedload and suspended sediment dynamics in Nepal's Himalayan rivers , EGU General Assembly 2026, Vienna, Austria, 3–8 May 2026, EGU26-19504, https://doi.org/10.5194/egusphere-egu26-19504, 2026.

EGU26-20439 | ECS | Orals | HS9.2

Sediment Transport In Shallow Overland flow 

Marziye Ramezani Lashkariani and Graham Sander

Understanding the size distribution of soil particles is very important for predicting how both sediment and agricultural chemicals move through the environment. However, most erosion models are limited because they only use a few broad size groups. While the Hairsine-Rose (HR) model can handle many different sizes, there is a trade-off between having a large number of size classes for accuracy, versus a smaller number for computational efficiency.  There is very little, if any, discussion in the literature about how many size classes are needed, or how fall velocities should be chosen to reliably represent the corresponding size class ranges.

We address both these questions through developing a model for a continuous, rather than the commonly used discrete settling velocity distribution. By integrating over discrete ranges of the settling velocity distribution, an equivalent discrete model can be obtained. This then provides conditions on how the discrete settling velocities need to be chosen in order to minimise the associated error in representing the overall distribution.  We then show how this error varies under both steady and unsteady flow conditions.

How to cite: Ramezani Lashkariani, M. and Sander, G.: Sediment Transport In Shallow Overland flow, EGU General Assembly 2026, Vienna, Austria, 3–8 May 2026, EGU26-20439, https://doi.org/10.5194/egusphere-egu26-20439, 2026.

EGU26-20860 | ECS | Posters on site | HS9.2

Hydraulic hotspots vs. erosion reality - a GAM approach to quantifying bank erosion using HEC-RAS and LiDAR difference images 

Alexandra Arnold, Jan Philip Hofmann, Anna Malka, Felix Hettwer, and Frieder Enzmann

Hydrological models such as HEC-RAS are widely used for flood hazard mapping, but translating these hydraulic outputs into spatially explicit bank erosion risk maps remains challenging. This difficulty arises primarily from the lack of sedimentological data and the highly localized nature of bank erosion during flash floods. Machine learning (ML) offers a powerful tool to uncover complex, non-linear relationships between hydraulic parameters and observed erosion patterns. This study aims to develop and validate a logistic Generalized Additive Model (GAM) that predicts the probability of bank erosion using hydraulic parameters derived from HEC-RAS simulations (e.g., flow velocity, bed shear stress). The model is calibrated and validated using erosion maps derived from high-resolution LiDAR-based elevation change detection. To assess real-world applicability, we validate model predictions against field survey data from the 2021 Ahr flood, providing ground-truthed erosion locations for independent evaluation beyond LiDAR-based mapping.

To quantify the spatial relationship between hydraulic conditions and observed bank erosion, we implemented a two-step workflow combining hydraulic modeling and remote sensing-based erosion mapping. First, we performed a 2D hydrodynamic simulation of the Ahr catchment using HEC-RAS v6.6, driven by a high-resolution 5-m digital elevation model (DEM) and precipitation input derived from the RADOLAN dataset for the extreme July 2021 flood event. The simulation yielded spatially distributed hydraulic parameters: including flow velocity, shear stress and flow depth. Second, we derived a high-resolution erosion map using LiDAR-based change detection. Pre-event (2019) and post-event (2021) 1-m DEMs were differenced to compute elevation changes along the river corridor. Areas exhibiting a depth loss exceeding 0.5 m were classified as “significant erosion” and used as the binary response variable (erosion/no erosion) in subsequent modeling. Finally, we developed a GAM to predict erosion probability as a function of the HEC-RAS-derived hydraulic variables. Our logistic GAM achieved AUC-ROC of 0.8 through non-linear s-terms and physically meaningful te-interactions (shear×depth, velocity×depth). Comparison with field survey results confirmed that the model reliably identifies zone prone to bank erosion. This approach successfully bridges the gap between hydraulic modeling and observed erosion patterns, revealing non-linear, spatially variable relationships that simple thresholds miss. The proposed methodology provides a robust, data-driven framework for translating HEC-RAS outputs into high-resolution erosion risk maps. Future research should integrate spatially explicit sediment characteristics to quantifiy the local mobilisation potential and test the model across a range of geomorphological and lithological settings to further improve its transferability and predictive accuracy.

This research forms part of the MABEIS III project ("Mass Movement Information System for Rhineland-Palatinate"), funded by the Rhineland-Palatinate´s State Office for Mobility (LBM) and the State Authority for Geology and Mining (LGB).

How to cite: Arnold, A., Hofmann, J. P., Malka, A., Hettwer, F., and Enzmann, F.: Hydraulic hotspots vs. erosion reality - a GAM approach to quantifying bank erosion using HEC-RAS and LiDAR difference images, EGU General Assembly 2026, Vienna, Austria, 3–8 May 2026, EGU26-20860, https://doi.org/10.5194/egusphere-egu26-20860, 2026.

EGU26-797 | ECS | Posters on site | HS9.6

Tracing Sediment Pathways in the Siang Basin: A Multi-Proxy Provenance Approach Using Petrography, Zircon Geochronology, and Sr–Nd Isotopes 

Sandeep Panda, Anil Kumar, Sourabh Singhal, and Pradeep Srivastava

Understanding sediment provenance is crucial for reconstructing past environmental conditions and deciphering erosion patterns in rapidly evolving mountain belts such as the Himalaya. The Yarlung–Tsangpo–Brahmaputra system, one of the world’s most dynamic sediment-routing networks, provides a key setting to examine how extreme hydrological events mobilize material from distinct source terranes. In this study, we analyse five well-dated paleoflood deposits from the Siang River using an integrated suite of provenance tools—sand petrography, U–Pb zircon geochronology, and Sr–Nd isotope geochemistry—to evaluate their relative strengths and interpretive limitations.

Petrographic data show quartz–feldspar-rich compositions and heavy-mineral assemblages pointing to contributions from the Higher Himalayan Crystallines (HHC) and Tethyan Sedimentary Sequence (TSS), although long-distance transport, weathering, and hydraulic sorting obscure lithologic specificity. Zircon age spectra reveal diverse age populations sourced from the Namche Barwa syntaxis, Tibetan Plateau, and Lhasa Terrane; however, zircon recycling and overlapping age groups introduce ambiguity in resolving discrete source areas. Sr–Nd isotopic signatures provide a more integrated and transport-insensitive signal, indicating dominant TSS influence with enhanced erosion of the Namche Barwa region during high-magnitude flood events. Together, these proxies demonstrate that each method captures a different scale of sediment input—petrography reflecting local lithologic contributions, zircon ages tracing distal and recycled sources, and Sr–Nd isotopes integrating basin-scale signatures. The multi-proxy approach underscores the need to combine complementary datasets to accurately reconstruct sediment routing, identify erosional hotspots, and comprehend megaflood-driven landscape evolution in the eastern Himalayas.

How to cite: Panda, S., Kumar, A., Singhal, S., and Srivastava, P.: Tracing Sediment Pathways in the Siang Basin: A Multi-Proxy Provenance Approach Using Petrography, Zircon Geochronology, and Sr–Nd Isotopes, EGU General Assembly 2026, Vienna, Austria, 3–8 May 2026, EGU26-797, https://doi.org/10.5194/egusphere-egu26-797, 2026.

EGU26-1774 | Posters on site | HS9.6

Potential use of fallout radionuclides as tracers of environmental processes after wildfires in Tohoku Region, Japan 

Olivier Evrard, Naoya Takahashi, Thomas Chalaux-Clergue, Anthony Foucher, and Pierre-Alexis Chaboche

Following the Fukushima nuclear accident in March 2011, significant deposition of radiocesium, including 134Cs and 137Cs, occurred across vast regions of Northeastern Japan, in the Tohoku Region. However, as most studies have focused on fallout in the Fukushima Prefecture, there is much less information available on the situation in other parts of the Tohoku region of Japan further north. Against this backdrop, the present study examined the presence of fallout radionuclides (including the natural radionuclide 210Pb and the artificial radionuclides 134Cs and 137Cs) in both burned and unburned soil profiles, as well as in various surface soil and sediment samples collected in the Kamaishi region (Iwate Prefecture, Tohoku Region, Japan), which was affected by extensive wildfires in 2017.  The results show that 210Pb and 137Cs can be used to trace sediment sources in landscapes affected by wildfires in this region. Furthermore, analysis of the soil profiles demonstrated that all analysed fallout radionuclides were enriched in the burned versus unburned profiles due to radionuclides being trapped by vegetation and incorporated into the ash after the fire. Detecting 134Cs in the uppermost 0–5 cm layer of all soil profiles investigated also demonstrated significant Fukushima fallout of 134Cs and 137Cs in this region, roughly equivalent to the fallout associated with nuclear atmospheric tests in the 1960s. In future, both sources of fallout should be considered when interpreting radionuclide data found in environmental samples collected in vast regions of north-eastern Japan. Analysis of 134Cs should also be encouraged in order to document fallout sources in these regions for as long as this short-lived radionuclide remains detectable (i.e. until around 2031).

How to cite: Evrard, O., Takahashi, N., Chalaux-Clergue, T., Foucher, A., and Chaboche, P.-A.: Potential use of fallout radionuclides as tracers of environmental processes after wildfires in Tohoku Region, Japan, EGU General Assembly 2026, Vienna, Austria, 3–8 May 2026, EGU26-1774, https://doi.org/10.5194/egusphere-egu26-1774, 2026.

EGU26-2798 | ECS | Posters on site | HS9.6

Which benefits of fluvial annex sediment analysis for quantifying and tracing industrial pollution along the Saône River?  

Augustine Écorse, André-Marie Dendievel, Brice Mourier, Alexandra Coynel, Élie Dhivert, Frédéric Paran, Steve Peuble, Thierry Winiarski, and Jean-Philippe Bedell

In the context of river ecological restoration in Europe and in order to achieve a “good” ecological and chemical status in watercourses, it is essential to quantify the volumes of contaminated sediment accumulated in fluvial annexes, which may be remobilized during floods or human interventions. These assessments not only allow the evaluation of ecotoxicological risks, but also help to assess the ecological functions associated with reconnection to the main channel. The Saône River (France), the main tributary of the Rhône River in terms of hydro-sedimentary contributions, has been little studied from this perspective, despite numerous developments (dykes) that have profoundly altered the lateral connectivity of its main channel. A more in-depth knowledge of the Saône River is therefore clearly needed  to guide effective and safe ecological restoration actions.

The volumes of sediments accumulated in three fluvial annexes distributed along the Saône River were estimated by combining ground-penetrating radar (GPR) transects with sediment cores sampling. These sediment archives were characterized (grain-size, organic matter content, trace metal content) to reconstruct the temporal trends of metal accumulation, based on ¹³⁷Cs and ²¹⁰Pb dating. Depending on the site, these sediment sequences provide six to eight decades of records, extending back to the 1940s for the longest. These data allow quantification of contaminants stocks (trace metals) and estimation of the annual load of contaminated suspended matters by the river in each site.

The study sites exhibit contrasting morphologies and varying levels of lateral connectivity with the main channel. These differences influence the sediment storage volumes within the fluvial annexes, ranging from 8,000 m³ to 100,000 m³. These results reveal metal enrichment since the 1940s, with a clear and well-documented increase in Cd, Cu, Pb and Zn during the post‑World War II economic expansion (1950s), reaching maximum concentrations during the 1970s. Their concentrations subsequently declined in the 1990-2000s before stabilizing at lower plateau values.

A specific feature concerns the contamination history of Ag, most likely driven by the photographic industry, which presented a three-phase pattern: (i) regular increase in the 1970s and 1980s, (ii) successive peaks between 1986 and 1994, and (iii) a marked decline in the late 1990s-2000s, with the decline of silver. This typical signal was observed at all studied sites along the river, despite hydrological connectivity differences. These sedimentary record complement monitoring data, especially for trace metals that were difficult to quantify in the past. This study highlights the major influence of historical contamination sources that released polluted sediments at the basin scale over several decades. This reconstruction also has national-scale implications and complements records obtained by other research works (such as on the Seine or Garonne rivers), highlighting the extent and persistence of pollution linked with photographic product manufacturing in Western Europe before 2000. Together, these results provide an integrated understanding of sediment dynamics and contamination, offering key insights for future river management and restoration strategies.

How to cite: Écorse, A., Dendievel, A.-M., Mourier, B., Coynel, A., Dhivert, É., Paran, F., Peuble, S., Winiarski, T., and Bedell, J.-P.: Which benefits of fluvial annex sediment analysis for quantifying and tracing industrial pollution along the Saône River? , EGU General Assembly 2026, Vienna, Austria, 3–8 May 2026, EGU26-2798, https://doi.org/10.5194/egusphere-egu26-2798, 2026.

EGU26-3575 | Posters on site | HS9.6

Deciphering dilution, grain size, and provenance in sediment geochemistry 

Tomas Matys Grygar, Hans von Suchodoletz, Ivana Pavlů, and Christian Zeeden

A considerable number of geochemical and granulometric datasets from various sediment sequences was gathered during the recent decades in the context of palaeoenvironmental and palaeoclimate reconstructions, assessment of human impacts on earth surface processes, and provenance tracing in fluvial environments. Although the large importance of grain-size control on sediment geochemistry has been known for many years and was explicitly declared in some review papers on geochemical provenance tracing, it still forms a challenge for current research. The problem is that provenance, grain-size, and weathering (post-depositional alterations) jointly control the resulting chemical composition of paleosol-loess sequences or floodplain deposits, and need hence to be distinguished from each other. However, in several recent studies data processing was simplified and the results were presented in an unequivocal manner, although interpretation of sediment composition is always rather equivocal. This was especially the case when geochemical datasets were subjected to automated data processing by software routines, instead of an expert-based examination of the individual datasets and a correct qualitative distinguishing of the individual controlling factors.

Data assessment should always start from understanding the major geochemical and sedimentological factors and processes behind data variability. This phase cannot be automated, and should mandatorily precede the selection of appropriate data processing routines. On the one hand geochemical compositions may be mainly controlled by varying percentages of ‘diluting’ components such as quartz (usually sand) or (detritic or autochthonous) carbonate, that can be corrected for by rationally chosen element ratios. Numerous complex mathematical approaches have been designed to address that issue, however, they do not always produce interpretable results and therefore need empirical (expert-based) verification. One the other hand, ‘dilution’ effects can interfere with grain-size control, that can be revealed by scatterplots of element ratios or the visualisation of element ratios and grain size classes. Furthermore, the recently established Bayes space methodology for modelling and analysing continuous distributive data can visualise the grain size control of element ratios for entire granulometric curves. Combined with regression modelling this allows statistically sound conclusions about grain size effects on the element ratios desired for interpretation. For example, varying grain-size preferences of feldspars or zircons can point to distinct source rocks and thus qualitatively reveal provenance changes. Provenance changes can only be quantified after deciphering and considering ‘dilution’ and grain-size effects, and only if the sediment sources have really distinct geochemistry. The provenance tracing cannot be automated or based only on the formal performance of statistical tools such as low values of RMSE.

Concluding, provenance tracing should be based on geochemically interpretable element concentration ratios after cross-checking for ‘dilution’ and grain-size control, best done ‘manually’ by assessing a series of (old-fashioned) scatterplots, preferably with the granulometry information implemented using the Bayes space methodology. To obtain sound conclusions it is also essential to phrase clear and testable research questions before any research, acquire suitable data really representing variability in studied sediment sequences and potential provenance areas, and use statistical methods respecting real data complexity.

How to cite: Matys Grygar, T., von Suchodoletz, H., Pavlů, I., and Zeeden, C.: Deciphering dilution, grain size, and provenance in sediment geochemistry, EGU General Assembly 2026, Vienna, Austria, 3–8 May 2026, EGU26-3575, https://doi.org/10.5194/egusphere-egu26-3575, 2026.

EGU26-3609 | ECS | Orals | HS9.6

The Effectiveness of Check Dams on Post-fire Erosion Control - The Significance of Timely Construction 

Aristeidis Kastridis and Marios Sapountzis

This study investigates the effectiveness of torrential erosion control structures (concrete check dams) in reducing post-fire sediment transport in the Seich Sou Forest close to Thessaloniki, Greece. The July 1997 wildfire destroyed 68% of the forest vegetation, posing an urgent risk of severe erosion and floods in Thessaloniki's urban complex.

The responsible agencies decided to construct erosion control structures inside the streambeds of the watersheds that drain the Seich Sou Forest. This work was critical in watersheds where the lowland segment of the stream runs through communities, and the transportation of sediments and debris might endanger property, infrastructure, and even human life. Most of the concrete check dams were built in 2001, four years after the fire. This study included a complete documentation of the constructed check dams as well as a measurement of the sediments that gathered 21 years after the fire.

This study assessed the efficiency of constructed check dams in capturing sediments after a fire, as well as the influence of construction time, in two typical catchments (Eleonas and Panteleimon). In addition, the hypothesis "What would the effectiveness of check dams be if they were constructed immediately after the fire?" was examined. The innovative part of this study was the detailed recording of all check dams and the volume of trapped sediments, while the fact that most dams were not completely filled allowed us to compute soil erosion rates in detail.

In 2022, our team carried out field investigations to assess the size, effective storage capacity, and siltation of 40 check dams. The results showed that the dams in the Eleonas and Panteleimon catchments stored 14.36% and 18.81% of their maximal effective capacity, respectively. In the first three years following the fire, the potential maximum annual retention capacity of the check dams in the Eleonas watershed was 6.17 t/ha/year, while in the Panteleimon basin, it was 7.08 t/ha/year. The delayed construction of the check dams resulted in the failure to trap the eroded soil, which means that in the first three post-fire years, all the soil was lost to the sea.

Previous investigations have determined the precise values of post-fire erosion in the study region to be 7.76 t/ha/year and 3.39 t/ha/year for the first and second post-fire years, respectively. The annual post-fire erosion values mentioned above fall within the estimated maximum retention capacity of the check dams constructed in the research catchments. As a result, the timely (immediately following the fire) and appropriate construction of check dams can effectively manage the greatly increased post-fire erosion rates. Although check dams are extremely successful in stabilizing disrupted fire environments, their full advantage can only be realized if they are built on time and efficiently. To decrease soil loss and improve landscape resilience, future studies should focus on the timely construction of post-wildfire erosion control structures.

How to cite: Kastridis, A. and Sapountzis, M.: The Effectiveness of Check Dams on Post-fire Erosion Control - The Significance of Timely Construction, EGU General Assembly 2026, Vienna, Austria, 3–8 May 2026, EGU26-3609, https://doi.org/10.5194/egusphere-egu26-3609, 2026.

EGU26-4157 | ECS | Posters on site | HS9.6

Suspended Sediment Fluxes and Decadal Trends in the Humid Tropics: Machine Learning Reconstruction and Coupled Modelling in Upper Blue Nile Tributaries 

Kindie B.Worku, Fasikaw A. Zimale, Till Francke, Morteza Zargar, and Axel Bronstert

Sediment-laden runoff in Ethiopia’s Upper Blue Nile Basin (UBNB) threatens the ecological health of Lake Tana and the operational efficiency of the Grand Ethiopian Renaissance Dam (GERD). Limited event-based sediment sampling hinders the accurate estimation of fluxes and process-based modeling in this data-scarce region. This study reconstructs continuous daily sedigraphs (1990–2020) for the Gilgel Abay (1,664 km²) and Gumara (1,394 km²) watersheds using machine-Learning (ML) methods, including Gradient Boosting (GB), Random Forest (RF), and Quantile Regression Forests (QRF), along with traditional techniques, using discharge, rainfall, temperature, and evapotranspiration as predictors.

QRF achieved the highest validation accuracy at the daily scale (R² = 0.62–0.72), capturing non‑linear sediment dynamics and providing uncertainty‑quantified yields (90% CI: 17.15–54.37 t/ha/yr for Gilgel Abay; 21.15–40.61 t/ha/yr for Gumara). Mean annual sediment yields were 27.5 ± 7.2 t/ha/yr (Gilgel Abay) and 23.8 ± 10.7 t/ha/yr (Gumara), with 93–95% of transport occurring during the monsoon season (June–October), emphasizing strong rainfall control.

The reconstructed records enabled the first successful calibration and validation of the WASA-SED model for coupled daily streamflow and suspended-sediment dynamics in the Ethiopian Highlands. Monthly simulations showed strong performance (NSE 0.66–0.86; R² 0.72–0.87). Flow- and sediment-duration curves indicated excellent skill during high-flow events, which dominate sediment export, with underestimation in mid- and low-sediment ranges.

Decadal analyses revealed contrasting watershed trajectories. In Gilgel Abay, rainfall intensified (from 136.9 mm/month in the 1990s to 208 mm/month in the 2020s), streamflow increased by 78% (55 to 98 m³/s), and sediment loads peaked mid‑period before declining. In Gumara, rainfall remained stable, but streamflow rose 54% (35 to 54 m³/s), and sediment loads increased 61% (8.2 to 13.2 × 10³ t/day), influenced by wetland loss (−63%) and rapid urban expansion.

This integrated ML–process modelling framework bridges sediment data gaps, advances hydro-sediment process understanding, and supports targeted erosion mitigation for the sustainable management of the UBNB. The approach is transferable to other humid tropical basins facing similar data limitations.


Keywords: sediment reconstruction, QRF, WASA‑SED, decadal trends, Upper Blue Nile, humid tropics, data‑scarce modelling


How to cite: B.Worku, K., A. Zimale, F., Francke, T., Zargar, M., and Bronstert, A.: Suspended Sediment Fluxes and Decadal Trends in the Humid Tropics: Machine Learning Reconstruction and Coupled Modelling in Upper Blue Nile Tributaries, EGU General Assembly 2026, Vienna, Austria, 3–8 May 2026, EGU26-4157, https://doi.org/10.5194/egusphere-egu26-4157, 2026.

EGU26-4192 | ECS | Orals | HS9.6

Time-scale-dependent Sediment–Discharge Coupling across Fourteen Catchments Using Wavelet Analysis 

Fahimeh Mirchooli, Nuria Martínez-Carreras, and Julian Klaus

Suspended sediment dynamics exhibit strong temporal variability and nonlinear behavior, making it challenging to characterize their relationship with streamflow using traditional statistical or machine-learning approaches. In this study, we addressed the following questions: how does the coupling between suspended sediment concentration (SSC) and discharge change across temporal scales, and which hydrological, morphological, climatic, and land-use factors control these changes? To investigate this, we examine the time-scale-dependent and non-stationary coupling between SSC and discharge across fourteen catchments (0.94-2846 km2) spanning diverse climatic and geomorphic settings. We applied wavelet coherence (WTC) and partial wavelet coherence (PWTC) analyses to quantify both the total and precipitation-independent SSC-discharge coupling across time scales ranging from 2 to 512 days. The analysis is performed continuously in time and interpreted within short (2-32 days), intermediate (32-128 days), and long (128-512 days) temporal bands. We used Spearman correlation to explore links between coherence and catchment characteristics, including physiography, morphology, climate, hydrology, and land use. Across all catchments, SSC-discharge generally exhibits strong coupling, although the strength of this coupling can be weak and fragmented at some time scales, indicating a non-stationary sediment response to discharge variations. After removing the influence of precipitation, much of this coherence weakens or becomes more fragmented across time scales, demonstrating that a substantial part of the SSC-discharge relationship reflects their shared hydrological forcing by precipitation. Nevertheless, a part of coherent patterns persists in all catchments, implying that catchment characteristics also sustain SSC-discharge coupling beyond direct precipitation effects. At short time scales, coupling is primarily controlled by slope and maximum length of the catchment; at intermediate scales, by moisture accumulation, land use, and aspect; and at long time scales, by moisture, slope aspect, and pasture cover. Using data from fourteen catchments, this study moves beyond single-catchment analyses and shows that wavelet-based approaches can disentangle precipitation-driven sediment dynamics from those controlled by catchment characteristics, providing new insight into how intrinsic catchment properties regulate SSC-discharge interactions across multiple temporal scales.

Key words: Catchment characteristics, Hydro-sediment dynamics, Partial wavelet coherence (PWTC), Suspended sediment concentration, Wavelet coherence (WTC)

How to cite: Mirchooli, F., Martínez-Carreras, N., and Klaus, J.: Time-scale-dependent Sediment–Discharge Coupling across Fourteen Catchments Using Wavelet Analysis, EGU General Assembly 2026, Vienna, Austria, 3–8 May 2026, EGU26-4192, https://doi.org/10.5194/egusphere-egu26-4192, 2026.

EGU26-5762 | Posters on site | HS9.6

Joint practices to support the torrent control structures management in geo-hydrological risk mitigation across borders 

Federico Cazorzi, Luka Žvokelj, Vesna Zupanc, Nejc Bezak, Mojca Fabbro, Adrien Clerbois, Andrea Ziraldo, Fabio di Bernardo, Eleonora Maset, Alberto Beinat, Elisa Arnone, Maria Eliana Poli, Christian Orlando, and Sara Cucchiaro

Geo-hydrological risk mitigation exceeds administrative borders and needs shared and coordinated actions to address climate change effects across borders. In vulnerable areas, such as North-Eastern Italy and Slovenia where torrents and rivers cross national boundaries, joint strategies are essential to improve watershed management, infrastructure safety, and human protection. This requires integrating diverse expertise through cooperation among cross-border authorities, stakeholders, and researchers to develop a shared management solution and a response to common challenges. Torrent control works have been strategically used for several decades to regulate sediment dynamics in mountain catchments, but few research studied how structures interact with erosion and deposition processes. Nowadays, multi-temporal High-Resolution Topography (HRT) and GIS technologies enable efficient analysis of sediment dynamics in fluvial systems and their evolving interactions with watershed control structures. To improve watershed management and prioritise maintenance, the Interreg ITA-SLO “TORRENT” project aims to define shared international standards for monitoring torrent control systems and evaluating their long-term performance. The results highlight how a shared database complemented by common tools such as the Maintenance Priority Index, advanced technology and standardised data collection protocols, strengthens watershed management challenges in Slovenia and Italy and provides a transferable strategic approach for other basins in neighbouring countries.

Acknowledgments

The TORRENT project is co-funded by the European Union under the Interreg VI-A Italy-Slovenia Programme.

How to cite: Cazorzi, F., Žvokelj, L., Zupanc, V., Bezak, N., Fabbro, M., Clerbois, A., Ziraldo, A., di Bernardo, F., Maset, E., Beinat, A., Arnone, E., Poli, M. E., Orlando, C., and Cucchiaro, S.: Joint practices to support the torrent control structures management in geo-hydrological risk mitigation across borders, EGU General Assembly 2026, Vienna, Austria, 3–8 May 2026, EGU26-5762, https://doi.org/10.5194/egusphere-egu26-5762, 2026.

EGU26-7778 | ECS | Orals | HS9.6

Innovative and robust approach to trace the origin of suspended particulate matter (SPM): application to the Saône watershed 

Claveau Maeva, Masson Matthieu, Gruat Alexandra, Dherret Lysiane, and Dabrin Aymeric

Identifying the sources of suspended particulate matter (SPM) at the watershed scale remains a major challenge for sediment management, particularly in large river basins. Several approaches are used to trace particle origins, such as the implementation of a SPM fluxes monitoring network, sedimentary modelling or by combining geochemical fingerprinting method with mixing models. Significant progress over the past decade has strengthened their robustness, particularly in the selection of tracers, resolution algorithms, source-term representation, and validation procedures. However, most sediment fingerprinting studies rely on discrete surface source-sediment sampling, which may not adequately reflect the spatial and temporal variability of sediment sources.

Particle traps (PTs) provide an effective alternative for suspended particulate matter sampling, offering an integrative approach that better captures temporal variability in SPM properties over a defined deployment period (typically one week to one month). However, their use raises a number of methodological locks, which could call into question the robustness of their use in fingerprinting approaches. PTs tend to preferentially collect coarser particles and may be affected by redox processes during deployment, which may induce trace metal release or redistribution and reducing their reliability as conservative tracers. To assess the representativeness of sediment traps, we implemented a dual sampling strategy combining monthly integrative sampling using PTs with discrete SPM grab samples. This comparison enables us to (i) quantify biases associated with PT sampling and (ii) assess the robustness of these integrative tools in an organic-rich, hydrogeologically dynamic environment.

To overcome these biogeochemical processes in the PT, we applied a recently developed analytical approach, targeting trace metals bound to the non-reactive fraction of SPM and enabling their use as conservative tracers unaffected by these processes. Therefore, combining PT sampling with tracers derived from the conservative fraction of SPM, we propose a highly promising method to track SPM origin.

This innovative tracing approach is being applied in the Saône basin (about one-third of the Rhône basin - 30,000 km²). The sediments of the Saône are the second most contaminated along the Rhône. Their downstream continuity to the Mediterranean Sea highlights the need to identify and quantify SPM sources to better manage their impacts on aquatic systems. The experimental design spans the 2024 - 2025 hydrological year and includes instrumentation of five major tributaries (Upper Saône, Ognon, Ouche, Doubs and Seille) as well as the basin outlet at Lyon. Particle traps were installed at each site and sampled monthly, supplemented by monthly spot sampling of reference SPM sampling. Mixing model outputs are presented as a function of sampling strategy (PTs versus spot sampling) and the tracers analysed in the residual / conservative fraction. For the first time, a preliminary estimate of the relative contributions of tributaries to the SPM flow at the scale of the Saône basin can be proposed, highlighting the strengths and limitations of the different fingerprint approaches used.

How to cite: Maeva, C., Matthieu, M., Alexandra, G., Lysiane, D., and Aymeric, D.: Innovative and robust approach to trace the origin of suspended particulate matter (SPM): application to the Saône watershed, EGU General Assembly 2026, Vienna, Austria, 3–8 May 2026, EGU26-7778, https://doi.org/10.5194/egusphere-egu26-7778, 2026.

EGU26-10161 | Posters on site | HS9.6

Global assessment of CSSI land use fingerprints of long-chain fatty acids in soils 

Axel Birkholz, Olivier Evrard, Anthony Foucher, Miriam Glendell, Ji-Hyung Park, Rafael Ramon, Sebastien Salvador-Blanes, Tales Tiecher, and Christine Alewell

The 2025 "State of Food and Agriculture" (SOFA) report published by the Food and Agriculture Organization of the United Nations (FAO) reiterates the significant threat posed by soil erosion and land degradation to agricultural productivity, food security, and the resilience of ecosystems. The FAO estimates that around 1.7 billion individuals globally reside in regions facing yield gaps associated with human-induced land degradation (FAO, 2025).

Numerous scientists across the globe, including our research team in Basel, have utilized and assessed d13C compound-specific stable isotopes (CSSI) derived from long-chain fatty acids across various land uses as tracers. This methodology has been employed to monitor and identify erosion stemming from different land uses to river or lake sediments (Alewell et al., 2016; Upadhayay et al., 2022), as well as to depositional sites (Mabit et al., 2018), and to investigate land use changes within soil chronosequences (Swales and Gibbs, 2020). This analytical tool can act as a significant asset for global decision-makers, aiding in the protection of soil and water resources both in a general context and in relation to specific United Nations Sustainable Development Goals (SDGs): 2 – Zero Hunger, 6 – Clean Water and Sanitation, 12 – Responsible Consumption and Production, 13 – Climate Action, 14 – Life Below Water, and 15 – Life On Land.

We present data of isotopes collected over several years from different land use in various regions including Europe (Switzerland, France, England, Scotland), South Korea, and Brazil. The isotopic values transition from being more depleted in temperate Europe to more enriched in the semi-humid Brazilian savannah, with South Korea exhibiting intermediate values. Furthermore, additional data from over 40 internationally published studies have been compiled to enhance our findings.

This is the first presentation of such a data collection, which can be continuously updated with the latest research findings, functioning as both an archive and a foundational data resource for sediment source attribution to ascertain the origins and potential causes of soil erosion. Additionally, a CSSI land use database encompassing numerous regions globally could significantly lessen the burden of costly and labor-intensive source soil sampling, particularly when time and resources are constrained.


References:

Alewell, C., Birkholz, A., Meusburger, K., Schindler Wildhaber, Y., and Mabit, L.: Quantitative sediment source attribution with compound-specific isotope analysis in a C3 plant-dominated catchment (central Switzerland), Biogeosciences, 13, 1587–1596, https://doi.org/10.5194/bg-13-1587-2016, 2016.

FAO. 2025. The State of Food and Agriculture 2025 – Addressing land degradation across landholding scales. Rome.

Mabit, L., Gibbs, M., Mbaye, M., Meusburger, K., Toloza, A., Resch, C., Klik, A., Swales, A., Alewell, C.,: Novel application of Compound Specific Stable Isotope (CSSI) techniques to investigate on-site sediment origins across arable fields, Geoderma, Volume 316, 2018.

Swales, A. & Gibbs, M.: Transition in the isotopic signatures of fatty-acid soil biomarkers under changing land use: Insights from a multi-decadal chronosequence, Science of The Total Environment, Volume 722, 2020.

Upadhayay, H.R., Granger, S.J. & Collins, A.L. Comparison of sediment biomarker signatures generated using time-integrated and discrete suspended sediment samples.Environ Sci Pollut Res 31, 22431–22440 (2024). 


How to cite: Birkholz, A., Evrard, O., Foucher, A., Glendell, M., Park, J.-H., Ramon, R., Salvador-Blanes, S., Tiecher, T., and Alewell, C.: Global assessment of CSSI land use fingerprints of long-chain fatty acids in soils, EGU General Assembly 2026, Vienna, Austria, 3–8 May 2026, EGU26-10161, https://doi.org/10.5194/egusphere-egu26-10161, 2026.

EGU26-10772 | ECS | Posters on site | HS9.6

Evaluation of Large Wood Accumulation Processes at a Retention Structure in the Rindbach Alpine Torrent (Austria): A Numerical Study 

Sophie Kienesberger, Isabella Schalko, Virginia Ruiz-Villaneva, and Christian Scheidl

In alpine torrents, the transport of large wood plays a significant role in the development of multi-hazard chains, while also contributing to channel complexity, sediment regulation, and the ecological functioning of mountain stream ecosystems, its mobilization during extreme events increases the risk of damage for infrastructures. The interaction between large wood, sediment and infrastructure such as engineering structures can lead to hazards, due to the formation of wood jams, related backwater effects, overtopping and unexpected morphological changes. Therefore, understanding the transport dynamics of large wood is fundamental for the design of resilient torrent control measures.

The Rindbach catchment in Ebensee close to the Traunsee (Austria) serves as a representative case study area for these processes. This torrent has a history of high wood recruitment driven by deforestation and avalanches such as the Häuseleckgraben avalanche in 2009 which delivered about 1,000 m3 of wood into the channel. A wood retention rack was built as part of a project by the Austrian Service for Torrent and Avalanche Control (WLV), after the flood event in 2013 that demonstrated the vulnerability of local settlements to wood-laden floods.

To analyze the potential formation of wood jams at the retention structure, the 2D numerical model IberWood is used. The methodology focuses on the interaction between channel morphology, hydraulic flow conditions and the variable transport pattern of large wood. To analyze the systematic response of the torrent to varying wood loads, historical high-flow conditions like the event in 2013 are used as a reference framework. The focus lies on identifying the amount of wood needed to clog the retention structure and affect its discharge capacity. The aims of this study are to provide valuable insights into the optimization of technical wood retention in torrential catchments and to contribute to the development of more resilient hazard mitigation measures in the Alps.

How to cite: Kienesberger, S., Schalko, I., Ruiz-Villaneva, V., and Scheidl, C.: Evaluation of Large Wood Accumulation Processes at a Retention Structure in the Rindbach Alpine Torrent (Austria): A Numerical Study, EGU General Assembly 2026, Vienna, Austria, 3–8 May 2026, EGU26-10772, https://doi.org/10.5194/egusphere-egu26-10772, 2026.

EGU26-11642 | ECS | Orals | HS9.6

Linking sediment connectivity with direct protection forest management: the case study of Lombardy Region  

Irene Vercellino, Gaia Mascetti, Giorgio Vacchiano, Gian Battista Bischetti, and Alessio Cislaghi

Direct protection forests (DPFs) play a key role in mitigating natural hazards by reducing their impacts on exposed elements such as buildings, infrastructure, and transportation networks. By definition, a DPF requires the simultaneous presence of three components: (i) a potentially damaging natural hazard, (ii) people or assets exposed to this hazard, and (iii) a forest capable of preventing or mitigating the resulting damage, thereby providing a protective function. Despite the conceptual clarity of this definition and the importance of DPFs for land-use planning, their delineation at the regional scale remains challenging. This is because the protective role of forests varies with the type of natural hazard and is often constrained by limited or heterogeneous data availability.

This study proposes an integrated, spatially explicit methodology for delineating DPFs based on the overlay of multiple geospatial information layers: (i) natural hazard maps describing the spatial distribution of susceptibility (or probability of occurrence) to shallow landslides, rockfalls, debris flows, and avalanches; (ii) a forest cover map providing both forest extent and canopy cover classes; (iii) elements at risk derived from regional authority databases; and (iv) a connectivity map used to identify sediment linkage areas between potential hazard source zones and exposed elements. A key component of this last layer is the Sediment Connectivity Index, which provides spatially explicit estimates of sediment connectivity and allows the identification of forest patches that perform a direct protective function for the selected elements at risk.

The methodology was applied to the Lombardy Region in northern Italy, whose territory extends over 23,860 km², including large portions of Italian Alps and Pre-Alps, and is characterized by a forests cover of approximately 6,259 km² (26% of the entire regional area). The results indicate that DPFs extend over 992 km², accounting for the 16% of the forested area. Based on this delineation, spatially distributed indices were developed to assess forest protection predisposition and the priority of silvicultural interventions. Overall, the proposed approach provides an effective decision-support tool for forest management, improving mapping consistency and supporting targeted strategies aimed at enhancing the long-term protective function and resilience of forests under increasing natural hazard pressure.

How to cite: Vercellino, I., Mascetti, G., Vacchiano, G., Bischetti, G. B., and Cislaghi, A.: Linking sediment connectivity with direct protection forest management: the case study of Lombardy Region , EGU General Assembly 2026, Vienna, Austria, 3–8 May 2026, EGU26-11642, https://doi.org/10.5194/egusphere-egu26-11642, 2026.

EGU26-11837 | Orals | HS9.6

An integrated framework for evaluating large wood recruitment from hillslopes to channel network in forested mountain catchments 

Alessio Cislaghi, Silvio Oggioni, Francesco Bassi, Giorgio Vacchiano, and Gian Battista Bischetti

Large wood (LW) is a key factor influencing the physical, chemical, environmental, and biological characteristics of low-order mountain stream systems. LW recruitment is controlled by several physical processes, including debris flows, shallow landslides, streambank erosion, and windthrow, and it can significantly increase hazards to downstream populations and infrastructure during extreme events. Quantifying LW recruitment is particularly challenging due to the diversity of potential source areas and mobilization processes. 

Accurate quantification requires an integrated approach that accounts for LW recruitment from hillslopes mobilized by shallow landslides, from headwater hollows affected by debris flows, along the channel network through streambank failures, and during downstream transport. This study combines a physically based and probabilistic slope stability analysis, several empirical relationships for debris-flow initiation/propagation, a spatially distributed sediment connectivity index, and a simplified one-dimensional hydraulic model to simulate channel widening and downstream LW transport. Input parameters were derived from analyses of forest stand characteristics, soil and lithological properties, intensity–duration–frequency curves, and digital elevation model.

The proposed approach identifies critical channel stretches and crossing infrastructures that are most prone to obstruction by floating recruited LW. The model was applied to a small mountainous headwater catchment in the Northern Apennines, characterized by a dense forest cover and a high susceptibility to shallow landslides and debris flows, particularly in late spring and early autumn. Results indicate that the estimated LW volumes are comparable to those measured through field surveys, demonstrating the robustness of the proposed methodology. Because the approach relies on commonly available data, it represents a valuable tool for forest planning and management, for assessing the impacts of natural and anthropogenic forest disturbances (e.g., diseases, fires, clear-cutting, or clearing), and for supporting the optimal placement of in-channel wood retention structures.

How to cite: Cislaghi, A., Oggioni, S., Bassi, F., Vacchiano, G., and Bischetti, G. B.: An integrated framework for evaluating large wood recruitment from hillslopes to channel network in forested mountain catchments, EGU General Assembly 2026, Vienna, Austria, 3–8 May 2026, EGU26-11837, https://doi.org/10.5194/egusphere-egu26-11837, 2026.

EGU26-12086 | Posters on site | HS9.6

Global acceleration of sediment fluxes under post-1950 agricultural intensification 

Anthony Foucher, Olivier Evrard, Olivier Cerdan, and Sébastien Salvador-Blanes

Since the mid-20th century, agricultural intensification and expansion have profoundly altered sediment fluxes from cultivated landscapes to freshwater systems. However, the long-term (>70 years) regional and global imprint of these changes remains poorly quantified. Here, we present a global synthesis of sediment accumulation records from 812 lakes and reservoirs draining agricultural catchments affected by land use worldwide.

By compiling sediment accumulation rates (SAR), mass accumulation rates (MAR) and associated geochemical proxies constrained by robust age–depth models, we reconstruct multi-decadal sediment flux trajectories from 1900 to 2010 at global and regional scales, and compared them with global land use statistics. These trajectories provide an integrated proxy for long-term land degradation. Our results reveal a pronounced and sustained post-1950 increase in sediment fluxes, with global MAR and SAR rising by approximately 500% and 350%, respectively. This acceleration is observed across all regions of the world, although its timing and relationship with land-use change differ markedly. In Europe and North America, sediment fluxes increased earlier (1950s–1960s; ≈140%) despite declining agricultural land area, suggesting an anticorrelation with land extent but a strong link to the intensification of agricultural practices. In contrast, Africa, Asia and Latin America exhibited later accelerations (1980s–2000s) that are positively correlated with the agricultural expansion.

Together, these findings demonstrate that lakes and reservoirs in agricultural regions worldwide record a coherent sedimentary response to post-1950 agricultural changes, while highlighting regional contrasts in the mechanisms linking land use, land management and sediment delivery. This synthesis provides a long-term reference for evaluating the impact of agricultural intensification on soil degradation and freshwater systems during the Anthropocene.

How to cite: Foucher, A., Evrard, O., Cerdan, O., and Salvador-Blanes, S.: Global acceleration of sediment fluxes under post-1950 agricultural intensification, EGU General Assembly 2026, Vienna, Austria, 3–8 May 2026, EGU26-12086, https://doi.org/10.5194/egusphere-egu26-12086, 2026.

EGU26-13048 | ECS | Posters on site | HS9.6

Disrupted Connectivity: The Impact of Check Dams on Bedload Transport and Sediment Storage in the Gürbe Catchment 

Chantal Schmidt, David Mair, Brian McArdell, and Fritz Schlunegger

Check dams are widely implemented in Alpine torrents to mitigate natural hazards and regulate sediment fluxes, yet their influence on sediment transfer and connectivity remains poorly constrained. In particular, it is still unclear how a series of check dams can modify sediment connectivity, specifically the erosion, and deposition patterns along the sediment cascade. We address this gap in the 12 km² Gürbe catchment at the northern margin of the Swiss Alps, where a steep, geomorphologically active channel reach has been engineered by approximately 100 check dams. The Gürbe torrent originates in low-erodibility Mesozoic limestones and transitions downstream into highly erodible Flysch, Molasse, and glacial till. A glacially conditioned knickzone at ~1200 m a.s.l. marks the onset of strong channel incision and enhanced hillslope–channel coupling (Schmidt et al. 2026). Downstream of this knickzone, the channel steepens by about 3°, traverses a landslide-prone corridor, and finally reaches the alluvial fan, forming a reach that is almost entirely controlled by check-dam structures.

We investigated the impact of check dams on bedload transport using repeated uncrewed aerial vehicle (UAV) - based photogrammetric surveys, which allowed us to quantify volumetric changes of the channel bed and to track erosion and deposition patterns through time (seasonal to annual and decadal). Our results show that bedload transport within the engineered reach is highly discontinuous, particularly during frequent low- to moderate-magnitude flow events. Check dams interrupt sediment continuity and create a succession of closely spaced erosion and deposition zones, leading to pronounced spatial variability in sediment dynamics over short distances. Even during moderate floods, gravel-bar re-working differs markedly between adjacent dam sections. Sediment inputs strongly control these dynamics. Material delivered from upstream is repeatedly reworked as it passes through successive check-dam compartments, alternating between reaches dominated by deposition and by erosion. In contrast, lateral sediment inputs, especially from landslides, promote net deposition and progressive accumulation of stored bedload material that is only mobilized during larger, less frequent flood events. Further downstream segments with lateral input of sediment derived from tributaries as well as non-regulated channel reaches are characterized by enhanced sedimentary dynamics, leading to abundant channel reorganization.

Overall, the check-dam system exhibits a tendency toward net deposition and sediment storage on decadal timescales, with dams acting as temporary buffers that trap bedload. These accumulated sediments form a latent sediment stock that is episodically released during major events, when channel erosion intensifies and stored material is excavated and transferred downstream. Our findings demonstrate that check dams fundamentally shift bedload transport from a relatively continuous process toward a pulsed, event-driven regime characterized by persistent reworking, long-term accumulation, and episodic phases of intensified erosion and transport.

Schmidt, C., Mair, D., Akçar, N., Christl, M., Haghipour, N., Vockenhuber, C., Gautschi, P., McArdell, B., and Schlunegger, F.: Quantifying erosion in a pre-Alpine catchment at high resolution with concentrations of cosmogenic 10Be, 26Al, and 14C, Earth Surf. Dynam., 14, 33–53, https://doi.org/10.5194/esurf-14-33-2026, 2026.

How to cite: Schmidt, C., Mair, D., McArdell, B., and Schlunegger, F.: Disrupted Connectivity: The Impact of Check Dams on Bedload Transport and Sediment Storage in the Gürbe Catchment, EGU General Assembly 2026, Vienna, Austria, 3–8 May 2026, EGU26-13048, https://doi.org/10.5194/egusphere-egu26-13048, 2026.

EGU26-13341 | ECS | Orals | HS9.6

Discharge–Sediment Regimes in Peninsular Malaysia: A Multi–Scale Analysis Based on National Datasets 

Jiachun Huang, Edward Park, Ming Fai Chow, Xianfeng Wang, and Adam Douglas Switzer

Tropical monsoon rivers can export a disproportionate share of sediment during short–lived high–flow events, yet humid, low–relief regions remain underrepresented in global discharge–sediment syntheses. Here we compile national daily discharge (Q) and suspended–sediment discharge (Qs) records from Peninsular Malaysia and quantify fluxes, yields, and discharge–sediment coupling across 12 river basins from seasonal to interannual scales. Across catchment outlets (n = 30), runoff export is comparatively buffered (water yield, WY ≈ 240–7691 mm yr-1), whereas sediment export is highly uneven and episodic (sediment yield, SY ≈ 46–985 t km-2 yr-1), with a small number of rivers contributing most monitored sediment flux. Basin attributes define a dominant relief–to–lowland regional gradient, but this structure explains only a modest share of SY variability (R2 ≈ 0.15), , suggesting that sediment yield is strongly modulated by basin-scale processes beyond regional structure. Across outlets, SY scales with WY as a power law (SY = 1893.5WY0.68; R2 = 0.30, p = 0.002), but the coupling differs by coast (West: R2 = 0.49, p = 0.008; East/South: R2 = 0.21, p = 0.082), implying systematic regional contrasts in sediment yield at comparable runoff. Seasonality is strongly monsoon–driven, and sediment export forms the sharper pulse. The wettest three–month period typically carries ~32–68% of annual discharge but ~38–88% of annual sediment. Interannually, discharge varies within a modest range, while sediment export commonly changes several–fold, so moderately wetter years can dominate long–term sediment budgets. Regulation further modifies these dynamics without a single consistent direction, indicating that post–dam sediment delivery depends on basin–specific sediment supply, storage, and connectivity rather than trapping alone.

How to cite: Huang, J., Park, E., Chow, M. F., Wang, X., and Switzer, A. D.: Discharge–Sediment Regimes in Peninsular Malaysia: A Multi–Scale Analysis Based on National Datasets, EGU General Assembly 2026, Vienna, Austria, 3–8 May 2026, EGU26-13341, https://doi.org/10.5194/egusphere-egu26-13341, 2026.

EGU26-14490 | Orals | HS9.6

Employing lipid biomarkers to constrain environmental controls on the export of plant, soil and -derived organic matter. 

Cindy De Jonge, Pien Anjewierden, Francien Peterse, Chantal Freymond, Hannah Gies, Melissa Schwab, and Timothy Eglinton

River systems transport and transform organic carbon (OC) from the terrestrial realm, before delivering this organic matter to deposition centers. Organic carbon with different ages, such as i) modern organic matter, ii) pre-aged organic matter from surface soils or riparian zones or iii) petrogenic or rock-derived organic matter, is transported under different environmental conditions. Using a 30-month high-resolution time series study of the organic matter content of the suspended load in the subalpine Sihl River watershed (Switzerland), the impact of hydrology and seasonality on the amount and source of organic matter was determined.

Previous work on the distribution and amount of suspended bulk OM and vegetation derived lipid biomarkers (long chain fatty acids and n-alkanes) revealed that hydrology and seasonality determine their fluxes (i.e. Schwab et al., 2025). Specifically, storms are interpreted to promote the mobilization of both contemporary plant detritus and surface soils. Because plant waxes are sourced from both modern vegetation and pre-aged soils, the unique contribution of pre-aged soil material was not targeted. Now, the analysis of branched GDGTs, bacterial membrane-spanning lipids produced in high abundance in soils, allows to track this specific C pool. Furthermore, these three lipid classes are expected to show a different recalcitrance to degradations (fatty acids>GDGTs>n-alkanes), which allows to determine the effect of age and degradation on the composition of suspended organic matter.

Across the sampling period, the export of branched GDGTs closely follows the hydrograph. High discharge conditions (>12.7 m3 s−1), typified by a high suspended sediment load, result in a high brGDGT export flux. The distribution of brGDGTs in these conditions points towards a higher altitude source of brGDGTs during winter, compared with summer. This is distinct from the lower altitude source derived from plant wax distributions (Schwab et al., 2023). Changes in relative contribution of the three biomarker classes indicate the presence of three end-members, i) an end-member of recently produced fresh organic matter, dominated by long-chain fatty acids, ii) an end-member with strongly degraded organic matter (n-alkane Carbon Preference Index < 2), dominated by n-alkanes and iii) a poorly defined end-member with increased n-alkane and GDGT concentrations, interpreted as an input of soils. Remarkably, the content of the radio-active isotope 14C (F14C), is not uniform for given end-member mixtures, indicating that age alone does not determine the relative abundance of the lipid classes.

In low discharge conditions, the low contribution of soil-derived GDGTs is overwritten by GDGTs produced in the aquatic system. As GDGT distributions reflect their production environment (soil versus aquatic), the use of GDGT ratios to quantify soil-derived versus aquatic bacterial biomass is evaluated. The direct effect of temperature on GDGTs produced in low discharge conditions, however, results in large ranges of their ratio values, complicating their proposed interpretation as a tracer for the provenance of aquatic biomass in river systems.

References:
Schwab, M. S., Haghipour, N. & Eglinton, T. I. Geochimica et Cosmochimica Acta 391, 31–48 (2025).

How to cite: De Jonge, C., Anjewierden, P., Peterse, F., Freymond, C., Gies, H., Schwab, M., and Eglinton, T.: Employing lipid biomarkers to constrain environmental controls on the export of plant, soil and -derived organic matter., EGU General Assembly 2026, Vienna, Austria, 3–8 May 2026, EGU26-14490, https://doi.org/10.5194/egusphere-egu26-14490, 2026.

EGU26-16353 | ECS | Orals | HS9.6

Combining elemental fractions as novel tracers with hysteresis analysis to improve the quantification of sediment sources during large storm events in (sub)tropical catchments 

Maarten Wynants, Nic Doriean, Cornelis Verboom, Ivan Lizaga, John Spencer, Will Bennett, Andrew Brooks, and Pascal Boeckx

Sediment pollution in (sub)tropical rivers and lakes of Queensland and East Africa is rapidly increasing, largely driven by subsurface erosion of deep alluvial and volcanic soils. These regions experience strong rainfall variability and flooding linked to climate and topographic controls, resulting in highly episodic soil loss and sediment transport. However, monitoring sediment sources during extreme events in remote (sub)tropical catchments remains challenging, meaning current understanding is often based on low temporal resolution data or visually dominant erosion features. In addition, the current set of sediment tracing approaches struggle to discriminate sources in deep tropical and alluvial soils or behave non-conservative in these environments.

This study addresses these methodological limitations to improve quantification of dominant sediment sources and soil loss processes in (sub)tropical catchments. We combine multiple water and suspended sediment monitoring tools, including low-cost automatic samplers, to capture the fluxes and variability of suspended sediment. We subsequently developed a novel sediment fingerprinting approach based on sequential extraction of elemental soil fractions. This tracer framework enables discrimination not only between catchment zones but also among multiple subsurface soil layers in deep alluvial and volcanic profiles. The tracer data are integrated into mixing models and event-scale sediment hysteresis analyses to construct dynamic sediment budgets and capture non-linear sediment responses to extreme rainfall.

Our results reveal the critical role of downwearing and chemical dissolution processes in large alluvial gullies of northern Queensland. These processes are largely neglected in current catchment models and gully analyses because they are not evident from repeat imagery assessments of gullies that demonstrate headcut retreat and bank collapse. In the Albert River (Southeast Queensland), we show that flooding associated with tropical Cyclone Alfred contributed approximately 60% of annual sediment export, dominated by erosion of subsurface soils from recent urban developments. This contrasts with earlier assessments in which radionuclide tracers provided only a binary subsurface signal, which together with visually evident bank collapse from aerial imagery led to attribution of sediment sources to alluvial bank erosion. Overall, our approach demonstrates how sediment source contributions and gully erosion processes shift dynamically during storm events, offering improved process understanding and more targeted management options under increasing climate extremes.

How to cite: Wynants, M., Doriean, N., Verboom, C., Lizaga, I., Spencer, J., Bennett, W., Brooks, A., and Boeckx, P.: Combining elemental fractions as novel tracers with hysteresis analysis to improve the quantification of sediment sources during large storm events in (sub)tropical catchments, EGU General Assembly 2026, Vienna, Austria, 3–8 May 2026, EGU26-16353, https://doi.org/10.5194/egusphere-egu26-16353, 2026.

EGU26-17224 | Posters on site | HS9.6

Event-based sediment loads from Austrian torrent catchments related to process and catchment characteristics 

Roland Kaitna, Maximilian Ender, Georg Nagl, Markus Moser, and Johannes Kammerlander

In engineering practice, the export of sediment loads during so-called “torrent events”, i.e. fluvial events or debris-flow events in steep headwater catchment, is of interest for short-term hazard assessment and longer-term sediment management in alpine regions. Several empirical models already exist for this purpose, each with varying degrees of complexity and uncertainty. In this study, a total of 3,642 torrent events in Austria, where information on the associated sediment load is available, were analyzed and related to geomorphological, geological, and hydro-meteorological boundary conditions. Despite of substantial scatter, we find that the type of event – fluvial flows or debris flows – as well as geology and geomorphology have the strongest control on sediment loads, while, interestingly, triggering precipitation show only limited correlations. Based on these results, we derive simple empirical equations to provide a data-driven assessment tool to estimate value ranges for future event sediment loads in torrent catchments in the Austrian Alps.

How to cite: Kaitna, R., Ender, M., Nagl, G., Moser, M., and Kammerlander, J.: Event-based sediment loads from Austrian torrent catchments related to process and catchment characteristics, EGU General Assembly 2026, Vienna, Austria, 3–8 May 2026, EGU26-17224, https://doi.org/10.5194/egusphere-egu26-17224, 2026.

EGU26-18366 | Orals | HS9.6

Escaping the black box: Addressing the mathematical blindness of sediment fingerprinting models 

Borja Latorre, Leticia Gaspar, and Ana Navas

In the last decade, sediment fingerprinting has evolved from a specialised geochemical technique to a widely used numerical tool for catchment management. However, as models become more complex (from Frequentist to Bayesian or Machine Learning approaches), a fundamental question arises: is the uncertainty in our results a product of environmental complexity or a consequence of the mathematical structures we use? This work advocates for a synergistic approach where mathematical rigor and field expertise are not just compatible, but inseparable.
Drawing on extensive research using virtual experiments and artificial laboratory mixtures, we demonstrate that unmixing models are inherently "blind" to any process not explicitly included in their underlying hypotheses. We show how common issues, such as high source variability, non-contributing sources, or particle size effects, often manifest as "model bias" when, in fact, they represent mathematical inconsistencies between the tracer signal and the model's assumptions.
We present the Consistent Tracer Selection (CTS) and the Linear Variability Propagation (LVP) methods as essential bridges between these two worlds. These tools allow researchers to test the mathematical consistency of their datasets before running any unmixing algorithm. Our findings, derived from comparing multiple model structures (including FingerPro, MixSIAR, and others), reveal a crucial reality: when tracers are selected following strict physical and mathematical criteria, the choice of the model becomes secondary.
The results show that different algorithms tend to converge on the same solution when the input data is consistent. Therefore, we argue that the future of sediment fingerprinting lies not in a "model war," but in a shift toward rigorous tracer validation. We conclude that understanding the mathematics behind the mixing process, such as the Conservative Balance (CB), is what allows us to interpret whether a model’s output represents a physical reality or merely a mathematical artifact.

How to cite: Latorre, B., Gaspar, L., and Navas, A.: Escaping the black box: Addressing the mathematical blindness of sediment fingerprinting models, EGU General Assembly 2026, Vienna, Austria, 3–8 May 2026, EGU26-18366, https://doi.org/10.5194/egusphere-egu26-18366, 2026.

EGU26-18921 | ECS | Posters on site | HS9.6

Experimental Investigation of Water-Flow Impact on Slit Dams with Varying Slit Widths 

Jianqiang Fan, Jinn-Chyi Chen, and Fengbin Li

Slit dams, a common type of check dam, are engineered to retain coarse sediment while allowing finer particles to pass through. During the interception of granular flows, a separation of water and sediment typically occurs, beginning with the initial impact and continuing through subsequent deposition stages. To fundamentally understand the mechanisms by which slit dams separate solid-liquid mixtures, it is essential to first isolate and examine the hydrodynamic impact of water on the dam structure in detail.

In the design of slit dams, the width of the slits between piers and the dam height are critical parameters. To investigate the effect of different slit widths, experiments were conducted in a rectangular transparent flume with a length of 1.58 m set at a fixed slope of 15°. Three slit configurations, labeled A4, A5, and A6 (representing arrangements with 4, 5, and 6 piers respectively), were tested in the flume. During the experiments, miniature pressure sensors were used to sample pressure fluctuations, and a high-speed camera operating at 400 fps was employed to capture the flow behavior. This setup allowed the detailed process of flow impacting the slit dams to be fully recorded for statistical analysis. The results indicate that the impact process can be divided into three stages: turbulent, stable, and decay. The maximum average impact force and overflow depth showed no significant difference across the different slit widths. The hydrograph for the A5 configuration, which exhibited high turbulence, demonstrated a longer duration and slower pressure decay, followed by A6 and then A4.

How to cite: Fan, J., Chen, J.-C., and Li, F.: Experimental Investigation of Water-Flow Impact on Slit Dams with Varying Slit Widths, EGU General Assembly 2026, Vienna, Austria, 3–8 May 2026, EGU26-18921, https://doi.org/10.5194/egusphere-egu26-18921, 2026.

EGU26-20411 | Posters on site | HS9.6

Assessing Erosion Mitigation Effectiveness of Nature-Based Solutions Using InVEST®SDR Modeling: Application to the Carapelle Basin 

Ossama Mohamed Mahmoud Abdelwahab, Giovanni Francesco Ricci, Addolorata Maria Netti, Annunziata Fiore, Serine Mohammedi, Anna Maria De Girolamo, and Francesco Gentile

Mediterranean agricultural landscapes face significant challenges from soil degradation and erosion processes that compromise both productive capacity and downstream water resources, creating an urgent need for implementing sustainable conservation strategies through Nature-Based Solutions (NBSs). This research employed the InVEST Sediment Delivery Ratio (SDR) modeling framework to examine erosional dynamics and quantify the potential benefits of various NBS interventions within the 506 km² Carapelle catchment. Model calibration and validation procedures utilized empirical sediment yield observations from the 2007-2008 monitoring period, achieving optimal parameter adjustment with only 4.3% variance from field measurements. A 20-year measured weather data were used to run the InVEST SDR model. The investigation examined four distinct NBS implementation strategies: contour-based cultivation techniques (CF), conservation tillage practices (NT), vegetative cover establishment (CCs), and integrated management approaches (Comb). Annual soil displacement rates under baseline conditions ranged between 2.43 and 3.88 t ha⁻¹ yr⁻¹ across the study years, with corresponding downstream sediment delivery of 0.86-1.30 t ha⁻¹ yr⁻¹. Conservation tillage emerged as the most effective single intervention, achieving an average 72.2% reduction in sediment transport. The integrated strategy combining conservation tillage with cover crop establishment delivered optimal results, yielding 75.9% and 70.5% reductions in sediment export and soil displacement, respectively. Geospatial evaluation demonstrated that forested and shrubland areas exhibited the highest natural retention capacity, while cultivated landscapes presented the greatest opportunities for NBSs deployment. The findings confirm that NBSs substantially improve sediment retention ecosystem services within Mediterranean agricultural watersheds. The InVEST SDR modeling approach demonstrates robust capabilities for catchment-scale erosion assessment. These outcomes offer practical insights for developing evidence-based land stewardship policies and conservation strategies in erosion-vulnerable Mediterranean regions.

How to cite: Abdelwahab, O. M. M., Ricci, G. F., Netti, A. M., Fiore, A., Mohammedi, S., De Girolamo, A. M., and Gentile, F.: Assessing Erosion Mitigation Effectiveness of Nature-Based Solutions Using InVEST®SDR Modeling: Application to the Carapelle Basin, EGU General Assembly 2026, Vienna, Austria, 3–8 May 2026, EGU26-20411, https://doi.org/10.5194/egusphere-egu26-20411, 2026.

EGU26-20802 | Posters on site | HS9.6

Sediment availability and connectivity: a geomorphological framework for debris-flow hazard assessment 

Marco Cavalli, Stefano Crema, Jacopo Rocca, Angelo Ballaera, Antonella Barizza, Giulio Gaigher, Elena Ioriatti, Lorenzo Marchi, Marco Piantini, Alessandro Sarretta, Margherita Agostini, Federica Bianchi, Marta Martinengo, and Tommaso Simonelli

The occurrence and magnitude of debris flows largely depend on the amount of sediment stored within a catchment and the effectiveness of its connection to the channel network. Quantifying both sediment availability and its connectivity is therefore a critical requirement for constraining numerical simulations used to delineate debris-flow inundation areas. To support more reliable hazard assessments in alpine regions, an integrated geomorphological framework was developed and implemented in the Camonica Valley (Italian Alps) to characterise potential debris flow behaviour. The approach places particular emphasis on sediment connectivity as a key link between sediment sources and downstream propagation, reinforcing the role of geomorphological and geomorphometric analyses as a foundation for numerical modelling. Field observations, historical records of past events, and morphometric indicators are jointly used to discriminate between dominant flow processes and to estimate the volumes of sediment that may be mobilised during extreme events. The workflow combines GIS-based regional screening of debris-flow susceptibility along the drainage network with the identification of sediment source areas derived from orthophotos and terrain analysis, followed by an explicit evaluation of sediment connectivity and field-based verification of sediment thickness. Overall, the methodology provides a coherent and transferable basis for debris-flow hazard zonation and land-use planning in mountain environments, with sediment connectivity explicitly embedded in the assessment process.

How to cite: Cavalli, M., Crema, S., Rocca, J., Ballaera, A., Barizza, A., Gaigher, G., Ioriatti, E., Marchi, L., Piantini, M., Sarretta, A., Agostini, M., Bianchi, F., Martinengo, M., and Simonelli, T.: Sediment availability and connectivity: a geomorphological framework for debris-flow hazard assessment, EGU General Assembly 2026, Vienna, Austria, 3–8 May 2026, EGU26-20802, https://doi.org/10.5194/egusphere-egu26-20802, 2026.

EGU26-21024 | Posters on site | HS9.6

Tracing hillslope sediment contributions to a lake shore using geochemical and fallout radionuclide fingerprints 

Leticia Gaspar, Borja Latorre, and Ana Navas

Soil erosion and sediment redistribution in Mediterranean agroforestry landscapes are strongly influenced by land use and substrate variability, affecting sediment delivery to downstream sinks. Identifying the relative contributions of hillslope sediment sources to depositional environments is essential for understanding sediment transfer processes and source–sink connectivity. In this study, sediment fingerprinting techniques were applied to quantify hillslope sediment contributions recorded in a lake shore sediment core within the endorheic Estaña catchment (NE Spain). The closed hydrological setting and the presence of a lake acting as a natural sediment trap provide favourable conditions for tracing sediment provenance from adjacent slopes. A sediment core collected at the lower part of the hillslope in a lake shore, was analysed and compared with potential sediment sources representing different land uses and lithological units. Potential source materials and sediment core samples, analysed as a sequence of 5 cm depth intervals from the surface to depth, were characterised using a suite of geochemical elements (Mg, K, Na, Pb, Ba, Zn, Sr, Li, Mn, Co, Ni, Cu, Cr, Fe, Al and Ca) and fallout radionuclides (137Cs and excess 210Pb). The unmixing model FingerPro 2.0 was used to identify and estimate the relative contributions of the potential sources to the lake shore sediment core, allowing uncertainty to be explicitly assessed. Preliminary results reveal marked spatial variability in sediment source contributions linked to land use and lithology on the contributing hillslope, demonstrating the potential of combining geochemical and fallout radionuclide tracers to improve the robustness of sediment fingerprinting in small Mediterranean catchments. This approach provides valuable insights into hillslope to lake shore sediment connectivity and contributes to a better understanding of sediment source dynamics and temporal shifts in dominant sediment sources under changing environmental conditions.

How to cite: Gaspar, L., Latorre, B., and Navas, A.: Tracing hillslope sediment contributions to a lake shore using geochemical and fallout radionuclide fingerprints, EGU General Assembly 2026, Vienna, Austria, 3–8 May 2026, EGU26-21024, https://doi.org/10.5194/egusphere-egu26-21024, 2026.

EGU26-21094 | Posters on site | HS9.6

Water Demand for Sediment Transport in Rivers: Conceptualization and Computational Approaches 

Maohua Le, Chuansheng Guo, and Zijing zhou

Sediment transport water demand provides the critical theoretical foundation for effective watershed management, optimized reservoir operation, and sustaining river ecosystem health. This demand refers to the clear or sediment-laden water volume needed for transporting a specified amount of sediment to a downstream location within a given period, under defined flow-sediment and channel boundary conditions, while preserving a target erosion-deposition balance. This demand is governed by the sediment‑carrying capacity and channel‑forming processes of the river and is modulated by channel geometry, sediment supply dynamics, grain‑size distribution, target erosion‑deposition levels, and temporal scale. It manifests through multi‑factor coupling, spatiotemporal variability, scale dependency, and functional orientation. A range of methods have been developed to calculate this demand, including the definition method, the equilibrium sediment transport method, data‑based analysis, erosion‑deposition correction, energy balance, and non‑equilibrium sediment transport approaches. Drawing on case studies from the Ningxia-Inner Mongolia reach and the lower Yellow River, this paper examines the key characteristics of sediment transport water demand and compares the applicability of prevailing calculation methods.

How to cite: Le, M., Guo, C., and zhou, Z.: Water Demand for Sediment Transport in Rivers: Conceptualization and Computational Approaches, EGU General Assembly 2026, Vienna, Austria, 3–8 May 2026, EGU26-21094, https://doi.org/10.5194/egusphere-egu26-21094, 2026.

EGU26-21560 | ECS | Orals | HS9.6

Hydraulic modeling of Natural Water Retention Measures for flood risk mitigation in Sicily 

Anna Giulia Cosete Sangiorgi, Martina Stagnitti, Mariano Sanfilippo, Luca Cavallaro, Enrico Foti, and Rosaria Ester Musumeci

Flood events show a worrying growth trend, in severity and frequency, compared to the past, in particular in the Mediterranean countries. In accordance with the recent Natural Restoration Law (2024), Natural Water Retention Measures (NWRMs) are configured as tools capable of integrating engineering interventions with nature-based approaches to mitigate flood risks. To the authors’ knowledge, there is a lack of studies on the quantitative assessment of the effectiveness of NWRMs. In this context, the present study proposes a methodology based on hydraulic modeling for the evaluation of the effects of some NWRM at catchment area scale for flood risk mitigation, considering two case studies in Sicily, i.e. the catchment areas of the Eleuterio and Belice rivers. Starting from the study of the land use and the lithology of the considered Sicilian catchments, the most appropriate NWRM proposals are defined, which are reforestation in uncultivated land and low- and no-till practices in agricultural areas. Multiple intervention scenarios are proposed to identify the most effective measures for the case studies: i) reforestation, assumed on increasing percentages of the areas allocated to such intervention, i.e. 25%, 55%, 85% and 100%, considering both the initial and final state of growth of planted tree species; ii) conservation agriculture techniques (low-till and no-till practices) in fields intended for arable and similar crops or/and in orchards, vineyards and olive groves; iii) the combination of the above mentioned interventions. By using a rainfall-runoff model based on the Curve Number method, four hydrographs at the river mouth are obtained for each scenario and for the no intervention case, corresponding to the return periods of 5, 50,100 and 300 years. The implementation of the considered NWRMs produces the reduction of the peak flow rates with respect to the no intervention case. The obtained hydrographs are then used as inputs for the 2D hydraulic model developed in HEC-RAS,  and flood maps are obtained. As expected, for both case studies, the best performances are obtained with the combination of reforestation and conservation agriculture techniques, with reduction in the water depth of flooded areas up to 34.52% for a return period of 5 years and 16.12% for a return period of 300 years, and in the extension of flooded areas up to 52.74% for a return period of 5 years and 8.35% for a return period of 300 years. Moreover, reforestation appears to provide the larger contribution to flood risk reduction.

How to cite: Sangiorgi, A. G. C., Stagnitti, M., Sanfilippo, M., Cavallaro, L., Foti, E., and Musumeci, R. E.: Hydraulic modeling of Natural Water Retention Measures for flood risk mitigation in Sicily, EGU General Assembly 2026, Vienna, Austria, 3–8 May 2026, EGU26-21560, https://doi.org/10.5194/egusphere-egu26-21560, 2026.

Enhancing soil structure is essential for maintaining soil functions and overall soil health, and its development is strongly influenced by climate, land use, and soil type. This study evaluated near-saturation water retention—an indicator of structural condition—in soils from four climatic regions under long-term land use (>20 years) and compared these effects with a one-time application of anionic polyacrylamide (PAM). Soils from humid (USA: crop CT–conservation tillage, crop NT–no till, grass, forest), temperate (Ethiopia: crop CT, grass, bush, forest), semi-arid (Turkey: crop CT, grass, forest), and arid (Israel: crop CT, orchard, virgin) regions were analyzed (272 samples ranging from sandy loam to clay). In each region, three crop CT soils with contrasting textures were treated with PAM at 0, 25, 50, 100, and 200 mg L⁻¹ (60 samples).
Structural effects were assessed using the high-energy moisture characteristic (HEMC, 0–50 hPa). Water-retention curves were described using modified van Genuchten parameters (α and n), and structural stability was quantified as SI. Treatments produced distinct curve shapes (α = 0.036–0.099 hPa⁻¹; n = 7.1–20.6), reflecting changes in macropore domains (>250, 125–250, 60–125 μm) associated with large and small macroaggregate stability (SI = 0.002–0.060 hPa⁻¹).
Higher soil organic carbon (SOC) contents (crop CT < crop NT < grass/bush/orchard < forest/virgin) and increasing PAM rates improved α (0.054–0.096 hPa⁻¹) and SI (0.004–0.059 hPa⁻¹), while reducing n (16.0–6.3). However, the magnitude of these effects depended on soil type, texture, and climatic region. SI correlated strongly with SOC or SOC/Clay ratio in humid and temperate regions, and with SOC and clay content in arid and semi-arid regions.
Crop CT soils had the lowest SI, typically 2–4 times lower than other land-use types. Applying PAM at 25–50 mg L⁻¹ increased SI (0.007–0.033 hPa⁻¹) to levels comparable to crop NT, grass, bush, or orchard soils (0.009–0.032 hPa⁻¹). Higher PAM rates (100–200 mg L⁻¹) raised SI (0.014–0.042 hPa⁻¹) to values up to twice those of NT, grass, and orchard soils, and in some cases similar to forest or virgin soils (0.014–0.059 hPa⁻¹). PAM and SOC effects were strongest in medium- and clay-textured soils; notably, a single PAM application often improved SI more effectively than SOC, particularly in drier regions.
Across all climates, long-term NT or grass soils with SOC ≥ 2 g g⁻¹ and soils treated with 25 mg L⁻¹ PAM produced similar SI values, indicating a useful threshold for evaluating structural quality (SI ≥ 0.010–0.020 hPa⁻¹). Exponential relationships between SI and α or n (α: R² = 0.85; n: R² = 0.64, p < 0.001) can guide (I) the assessment of soil structural stability, macroporosity, and SOC; (II) the interpretation of land-use impacts on pore and aggregate-size distributions; and (III)the determination of optimal PAM rates within conservation agriculture. These relationships support the development of resilient soil structure, accelerated SOC accumulation, and site-specific management practices—particularly valuable for weakly structured, degraded soils.


How to cite: Mamedov, A. I., Levy, G. J., and Norton, D. L.: Structural stability and near-saturated water retention of soils from four climatic regions under long-term land use versus one-time polyacrylamide treatment, EGU General Assembly 2026, Vienna, Austria, 3–8 May 2026, EGU26-473, https://doi.org/10.5194/egusphere-egu26-473, 2026.

EGU26-476 | ECS | PICO | HS9.7

Topographic Signature of Soil Loss 

Saba Shakeel Raina, Ravi Raj, and Basudev Biswal

The ever-evolving earth’s topography reflects the complex interaction of several geomorphic processes. These processes play a central role in how soil is detached, transported, and ultimately lost from a landscape. This raises a fundamental question: how does topography influence soil loss? To explore this, we introduced a geomorphic metric, ridge density (Rd), defined as the density of topographic ridges within a landscape. This metric provides a simple description of how rugged or smooth the terrain is. Our analysis shows a strong negative relationship between Rd  and soil loss. Landscapes with high Rd  experience lower soil loss. This is expected because highly dissected terrain contains steep but short slopes. Short slopes limit the distance over which runoff can gain energy and transport sediment, which reduces the overall erosion potential. The components of RUSLE further support this pattern. The LS-factor decreases as ridge density increases, suggesting that closely spaced ridges shorten the effective slope length, reducing the potential for runoff to accelerate and erode soil. In contrast, the K-factor increases with Rd, showing that areas with rugged terrain may contain soils that are more erodible. Even with a higher K-factor, the strong reduction in LS dominates, which explains why total soil loss still decreases in rugged terrain. Overall, the results show that Rd effectively captures the topographic influence on soil loss.

How to cite: Raina, S. S., Raj, R., and Biswal, B.: Topographic Signature of Soil Loss, EGU General Assembly 2026, Vienna, Austria, 3–8 May 2026, EGU26-476, https://doi.org/10.5194/egusphere-egu26-476, 2026.

EGU26-732 | ECS | PICO | HS9.7

Sorption characteristics of the selected pesticides on the river sediments in the Mid-Himalayan region.   

Deeksha Kumari, Harshad Kulkarni, and Anand Giri

The extensive use of pesticides has resulted in their persistence in several environmental compartments, including soil, water, and air. The majority of pesticides remain confined inside soil and sediment, limiting their dispersion to other parts of the ecosystem. In Himachal Pradesh, an agriculturally and horticulturally rich state of the Indian Himalayas, the regular usage of chemical pesticides poses significant risks to the pristine Himalayan ecosystem. Pesticides applied to crops cultivated on the valley slopes, such as apples, are thought to accumulate in the soil and are then transported to adjacent rivers during the monsoon season by surface runoff. The behaviour and movement of these pesticides mostly depend on their adsorption on soils and river sediments. Therefore, this study aims to examine the adsorption capacities of sediment fractions (coarse, medium, and fine sand and silt-clay) collected from the Beas riverbed, one of the major rivers in the Kullu valley of Himachal Pradesh. Fungicides like carbendazim and thiophanate methyl that are commonly used in this region were selected for adsorption experiments along with coarse, medium and fine sands, and silt-clay fractions separated from the Beas River sediments. One gram of each sediment type was spiked with the pesticide mixture containing 100 mg/L of each fungicide and allowed to adsorb for 24 hours. Following that, the spiked sediments were eluted with deionized water to simulate rainwater flushing in the real conditions. The extracts were analysed using HPLC-DAD to measure the concentration of fungicides eluted with water. The findings indicated that sediment type significantly influenced the desorption of carbendazim and thiophanate-methyl. Approximately 6.2% of thiophanate-methyl and 90.2% of carbendazim were eluted from coarse sand. The elution percentages for carbendazim and thiophanate-methyl using medium sand were 87.21% and 4.5%, respectively. Fine sand exhibited increased elution, with 26.4% thiophanate-methyl and 92.2% carbendazim released. Silt-clay sediments released 37.7% of thiophanate-methyl and 89.7% of carbendazim. The findings indicate that sediment retention of pesticides is contingent upon particle size, affecting the quantity of pesticide that may be released into the water. Additional work on adsorption and desorption of captan (organochloride) along with these two pesticides using the batch equilibrium procedures is underway.


How to cite: Kumari, D., Kulkarni, H., and Giri, A.: Sorption characteristics of the selected pesticides on the river sediments in the Mid-Himalayan region.  , EGU General Assembly 2026, Vienna, Austria, 3–8 May 2026, EGU26-732, https://doi.org/10.5194/egusphere-egu26-732, 2026.

EGU26-934 | ECS | PICO | HS9.7

Hybrid SWAT-ANN Modeling of Climate-Driven Changes in Streamflow and Sediment Yield: Manjira River Basin, India 

Sachin Kumar, Mahendra kumar Choudhary, and Thomas Thomas

Accurate prediction of sediment yield and streamflow is essential for effective watershed management and climate change adaptation planning. This study develops and validates an innovative SWAT-ANN hybrid model that integrates the physically based Soil and Water Assessment Tool (SWAT) with Artificial Neural Networks (ANN) to improve hydrological predictions in the monsoon-dominated Manjira River Sub-Basin (MRSB), India.

The SWAT model was calibrated and validated using daily streamflow and sediment observations from three Central Water Commission gauging stations (1998-2019). Multi-site calibration achieved satisfactory performance with NSE = 0.75 and R² = 0.79 for streamflow, while sediment yield modeling yielded NSE = 0.56 and R² = 0.60. Building on these simulations, an ANN model was trained using SWAT-generated outputs combined with meteorological variables to capture nonlinear sediment transport relationships. The SWAT-ANN hybrid model demonstrated significant improvements, with streamflow predictions achieving NSE = 0.95 and R² = 0.98, compared to standalone SWAT. For sediment yield, the hybrid approach improved NSE from 0.56 to 0.72 and R² from 0.60 to 0.75, showcasing the complementary strengths of physics-based and data-driven modeling.

Climate change impact assessment was conducted using 13 CMIP6 models under SSP245 (moderate mitigation) and SSP585 (high emissions) scenarios. Under SSP245, ensemble mean streamflow increased by 47.5% (2015-2045), 68.5% (2046-2070), and 123.9% (2071-2100) relative to baseline (1998-2014). SSP585 projections were more severe, with streamflow increases of 41.3%, 137.4%, and 269.4% for the respective periods. Sediment yield responses were equally dramatic: SSP245 scenarios projected increases of 61.3% (near-future), 81.9% (mid-future), and 146.6% (far-future), while SSP585 showed 48.3%, 166.4%, and 331.9% increases. The most aggressive model (CanESM5) projected sediment yield increases exceeding 1,900% by 2100 under SSP585, while conservative models (INM-CM5-0) showed minimal changes.

The SWAT-ANN model successfully captured temporal variability in both streamflow and sediment responses across all climate scenarios. These projections indicate that the basin will experience unprecedented hydrological changes, with sediment yields rising 2.5-4.3 times baseline by 2100 depending on emission pathways. The developed hybrid methodology provides a powerful tool for water resource managers to quantify climate-driven changes in streamflow and sediment dynamics, enabling adaptive management strategies and sustainable planning in data-limited monsoon-dominated basins. The transferable methodology addresses critical gaps in sediment yield prediction for similar South Asian river systems.

How to cite: Kumar, S., Choudhary, M. K., and Thomas, T.: Hybrid SWAT-ANN Modeling of Climate-Driven Changes in Streamflow and Sediment Yield: Manjira River Basin, India, EGU General Assembly 2026, Vienna, Austria, 3–8 May 2026, EGU26-934, https://doi.org/10.5194/egusphere-egu26-934, 2026.

EGU26-2711 | ECS | PICO | HS9.7

Centennial-scale sedimentation dynamics and their controlling factors in a human-modified mountainous catchment, Korea 

Yeawon Kim, Minseok Kim, Shinwoo Ki, Young Shin Lim, Chanjoo Lee, and Jin Kwan Kim

Sedimentary archives preserved in fluvial and wetland environments offer valuable insights into how watershed systems respond to hydrological variability and human disturbance. Here, we reconstruct centennial-scale changes in sedimentation rates along the Sijeon Stream, which traverses the Sajapyeong wetlands in Korea, using 210Pb dating of sediment cores obtained from slackwater deposits. The resulting chronology spans the period from 1912 to 2019 and enables an assessment of the principal watershed controls on sediment accumulation. The reconstructed record reveals three successive intervals that are statistically distinguishable in terms of sedimentation rates: Period 1 (1912–1963), Period 2 (1964–2000), and Period 3 (2001–2019). These intervals correspond closely with distinct phases of land-use history identified from aerial photographs and satellite imagery, including a quasi-natural phase until the early 1960s, a phase of intensive agricultural activity from the mid-1960s to the mid-1990s, and a period marked by multiple forms of anthropogenic intervention beginning in the early 2000s. Across all periods, sedimentation rates exhibit clear associations with precipitation variability. A particularly pronounced and sustained rise in sediment accumulation after 2015, during the late part of Period 3, coincides with the implementation of artificial channel modifications and the occurrence of earthquakes. This pattern indicates that land-use change governs long-term trends in sedimentation, whereas precipitation extremes, channel alterations, and seismic events primarily exert short-lived influences. Furthermore, when these drivers act concurrently, their combined effects can substantially amplify sedimentation rates. The findings improve the understanding of the temporal effects of interacting watershed factors on sediment transport and emphasize the importance of considering these interactions in developing strategies for sustainable reservoir and wetland management.

How to cite: Kim, Y., Kim, M., Ki, S., Lim, Y. S., Lee, C., and Kim, J. K.: Centennial-scale sedimentation dynamics and their controlling factors in a human-modified mountainous catchment, Korea, EGU General Assembly 2026, Vienna, Austria, 3–8 May 2026, EGU26-2711, https://doi.org/10.5194/egusphere-egu26-2711, 2026.

EGU26-4427 | ECS | PICO | HS9.7

Flood‑Driven Remobilisation of Legacy Metal Contaminants in Slovenian River Basins 

Nejc Golob, Martin Gaberšek, Mateja Gosar, and Vesna Zupanc

The August 2023 floods in Slovenia exposed how extreme hydrological events can transform industrial and mining legacies into acute public health and agricultural crises. Heavy rainfall triggered mass wasting and river overflows across 183 municipalities - an area of approximately 17,203 km² ‑ resulting in roughly €9.9 billion in losses.

Slovenia’s rich mineral deposits historically fueled industrial development but left enduring environmental burdens. Beyond the physical devastation, these floods remobilized toxic sediments from historical hotspots, including the Mežica Pb–Zn mine, the Celje zinc smelter, and the Idrija mercury mine. Our study uses field measurements, geochemical analyses, and a comprehensive GIS framework to examine how flood deposits contaminate farmland and influence human exposure pathways across the nation’s river basins.

We conducted a GIS-based analysis that integrated national geochemical surveys, environmental monitoring data, hydrological records, historical & modern land-use maps, and flood-hazard assessments. This enabled us to identify zones where contamination sources overlap with flood-prone areas across four major river basins: Sava, Drava, Mura, and Soča. By overlaying these layers with current land use, we delineated agricultural and urban parcels most at risk of metal contamination.

Analyses reveal pronounced contamination gradients and significant overlap between polluted zones and cultivated floodplains. In the Sava basin, multiple hotspots (Celje, Jesenice, and Litija) coincide with intensively farmed floodplain terraces. Overbank sediments here show metal concentrations tens to hundreds of times above background levels; specifically, Celje’s topsoils contain Zn up to 8,600 mg kg⁻¹ and Cd often exceeding critical thresholds. GIS overlays indicate that a substantial portion of this farmland lies within high-hazard flood zones. In the Drava basin, spatial analysis highlights a narrow corridor where the Meža plume passes through cropland; floodplain soils downstream remain laden with Pb, Zn, and Cd from legacy mining. By contrast, the Mura basin, while largely agricultural, shows minimal overlap between contaminated zones and flood-prone areas, reflecting its predominantly geogenic background and lower industrial impact. In the Soča basin, we observed moderate overlap: heavy Hg contamination from Idrija (sediment averages 603 mg kg⁻¹ and floodplain soils 157.7–294.8 mg kg⁻¹) is largely confined to specific terraces, yet downstream agricultural parcels remain at risk.

Our findings show that Slovenian floodplains are disproportionately burdened by legacy pollutants that re-enter the environment during extreme events. As climate projections indicate more frequent and intense flooding in Alpine and Pannonian regions, it is urgent to integrate flood risk management with soil remediation, agricultural planning, and public health strategies to safeguard food security and human well-being.

How to cite: Golob, N., Gaberšek, M., Gosar, M., and Zupanc, V.: Flood‑Driven Remobilisation of Legacy Metal Contaminants in Slovenian River Basins, EGU General Assembly 2026, Vienna, Austria, 3–8 May 2026, EGU26-4427, https://doi.org/10.5194/egusphere-egu26-4427, 2026.

EGU26-5234 | ECS | PICO | HS9.7

Structure-Induced Enhancement of Oxygen Penetration in Coarsened Sediment Beds: Insights from Large-Eddy Simulations 

Jiangchao Liu, Yifan Zhu, Yucheng Jiang, Zihan Geng, and Yan Liu

This study employed large-eddy simulations (LES) to investigate how local bed coarsening influence near-bed vertical velocity perturbations and scalar transport. Six cases were configured with varying degrees of sediment coarsening at a fixed Reynolds number of 10,000. Coarsening was quantified by the coverage ratio (Ac/At) of coarse particles (Ac) on the bed surface (At), ranging from 0% to 100%. To isolate the effects of heterogeneous permeability, the crest elevations of both non-coarsened (d) and coarsened particles (D, where d = 0.5D) were kept equal, effectively eliminating variations in bed elevation.

Results show that Ac/At = 64% induced the strongest perturbations: (i) Sediment coarsening enhances near-bed vertical velocity and turbulence, with increases of 10.0 and 3.0 times at 64%, and 3.5 and 1.5 times under full coarsening, relative to the non‑coarsened case. (ii) Bed coarsening strengthens downward advective and turbulent fluxes, peaking at 14.1 and 1.7 times the non‑coarsened values at 64%, and remaining elevated at 11.6 and 1.4 times under full coarsening; (iii) Coarsening increases scalar penetration, shortens residence time (RT), and enhances transfer coefficients on both water and sediment sides. Under non- and fully coarsened beds, penetration depths are limited to d and D, respectively, while partial coarsening (Ac/At = 16–64%) allows penetration to the bed bottom. RT drops from 4.49 s at 0% to 4.21 s at 64%, then slightly rises to 4.24 s under full coarsening. At Ac/At = 64%, transfer coefficients rise to 2.4 times (water side) and 1.8 times (sediment side) those of the non-coarsened case, and to 1.6 and 1.4 times under full coarsening.

The primary mechanism driving the intensification of vertical scalar transport is the enhancement of vertical instantaneous velocities, which subsequently leads to increased advective and turbulent fluxes. Consequently, near-bed scalar concentrations increased by 37.1% at Ac/At = 64% and by 65.4% under full coarsening compared to the non-coarsened case. The results offer new insights into how bed heterogeneity influences hyporheic exchange, biogeochemical coupling, and solute retention in permeable sediments.

How to cite: Liu, J., Zhu, Y., Jiang, Y., Geng, Z., and Liu, Y.: Structure-Induced Enhancement of Oxygen Penetration in Coarsened Sediment Beds: Insights from Large-Eddy Simulations, EGU General Assembly 2026, Vienna, Austria, 3–8 May 2026, EGU26-5234, https://doi.org/10.5194/egusphere-egu26-5234, 2026.

EGU26-5440 | PICO | HS9.7

Quantification of Humic Substances in Caustobiolites and Commercial Products Using a New Standardization Method 

Vojtech Enev, Kristyna Mullerova, Leona Kubikova, Jakub Ciz, Katerina Liskova, Martina Klucakova, and Miloslav Pekar

Nowadays, environmentally friendly agriculture contributed to a significant interest in the production of fertilizers based on water-soluble humic substances such as humates and lignohumate. These commercial products are dark brown powders and/or concentrated alkaline solutions, containing mixture of humic substances, lingo-humic acids, and smaller proportion of lightly hydrolyzing organic compounds. Their root and foliar application increase growth of roots and leaves, chlorophyll content, and activity of plant enzymes, etc. All of this has generated intense interest for an accurate and reliable method to quantify humic substances in caustobiolites and commercial products.

The aim of this work was to determine the content of humic substances in raw caustobiolites (i.e. lignite, leonardite, and alginite) and commercial humate products. Humic substances (HA and FA) were isolated from following samples: South Moravian lignite (the northern part of the Vienna basin, Mír mine near Mikulčice in the Czech Republic); leonardite (Afşin, Kahramanmaraş, Turkey); alginite (Pinciná in the Slovakia Republic); lignohumate MAX (Amagro, Prague in Czech Republic); and HumiKey (Xi´an, TBio Crop Science Co., Ltd., China). The humic substances were extracted using a new standardized method for quantification of humic substances (Lamar et al., 2014) recommended by the International Humic Substances Society. The content of humic substances was obtained by gravimetric analysis. The wt.% HA and FA contents were corrected for moisture and ash content. Furthermore, the humic substances were used in solid powder form and characterized by thermal techniques (i.e. elemental and thermogravimetric analysis), UV/Vis spectroscopy, and FTIR spectroscopy.

The determining factor influencing the yield of humic substances from raw caustobiolites and commercial products is their origin and method of extraction. The greatest content of HA (54.22 ± 1.76%) was obtained for sample isolated from Turkey leonardite. In contrast, the lowest contents were determined for HAs extracted from alginite and lignohumate MAX. It is obvious that these samples are characterized by significant content of FK and lightly hydrolyzing organic compounds. Extremely high ash content was determined for alginate. Caustobiolites (e.g. alginite) with high ash and low contents of humic substances appear to be less suitable as sources of HS for agricultural purposes.

All examined HAs isolated from caustobiolites were generally characterized by the complex and heterogeneous molecular structure with high average molecular weight and high degree of aromaticity. On the other hand, FAs, especially those isolated from commercial products, were predominantly aliphatic, with a smaller content of nitrogen and low degree of aromaticity and greater amount of oxygen-containing functional groups (e.g. carboxylic and phenolic).

This standardized method and studies on the physicochemical properties of HS can be helpful in predicting the behavior of such fertilizer components in the environment.

Reference

Lamar, R.T., Olk, D.C., Mayhew, L., Bloom, P.R., 2014. A New Standardized Method for Quantification of Humic and Fulvic Acids in Humic Ores and Commercial Products. J. AOAC Int. 97, 721-730. https://doi.org/10.5740/jaoacint.13-393.

Acknowledgement

This work was supported by The NATO Science for Peace and Security Programme, project Nr. G6296. https://land-security.org/.

How to cite: Enev, V., Mullerova, K., Kubikova, L., Ciz, J., Liskova, K., Klucakova, M., and Pekar, M.: Quantification of Humic Substances in Caustobiolites and Commercial Products Using a New Standardization Method, EGU General Assembly 2026, Vienna, Austria, 3–8 May 2026, EGU26-5440, https://doi.org/10.5194/egusphere-egu26-5440, 2026.

EGU26-6446 | ECS | PICO | HS9.7

Dynamics of sediment and associated pesticide transfers in cultivated southernmost Brazil since 1982 

Amaury Bardelle, Renaldo Gastineau, Tales Tiecher, Guillermo Chalar, Mirel Cabrera, Marcos Tassano, Jean Paolo Gomes Minella, Alberto Vasconcellos Inda, Nathalie Cottin, Pierre Sabatier, Anthony Foucher, Olivier Cerdan, Christine Alewell, and Olivier Evrard

Since the 1980s, South America has emerged as one of the world’s leading agricultural producers, resulting in significant environmental pressures, including land and water degradation.

The consequences of this agricultural development, both past and present, are still poorly documented in this region, particularly in the Pampa biome. Retrospective analysis using sediment archive can provide valuable insights for the characterisation of the long-term environmental degradation.

In this study, we analysed a sediment core collected in the Salto Grande dam constructed in 1982 on the Uruguay river, draining a 266,000 km2 catchment. We established an age model and characterised the sediment properties, using gamma spectrometry, high-resolution geochemical content analysis (XRF), pesticides, magnetic susceptibility measurements over time (1982-2022). This multi-proxy analysis of a sediment archive from the Salto Grande reservoir enabled the first long-term reconstruction of land degradation and pesticide fluxes in the very large Uruguay river transnational basin (comprising Brazil, Argentina and Uruguay) since 1982.

The results indicate that sediment fluxes have decreased significantly since 2000 and sediment provenance has shifted toward the southern part of the basin after this period. These changes coincide with the construction of dams in the upstream part of the catchment, the expansion of agriculture in the south and the widespread adoption of no-tillage practices. This change in farming practices induced an increase in pesticide fluxes, thereby posing potential ecological risks.


In this context, trade deals such as those between the European Union and the European Free Trade Association and Mercosur, combined with the anticipated increase in the area dedicated to soybean and cellulose production, should be considered in light of the potential consequences in terms of agriculture expansion and related environmental threats.

How to cite: Bardelle, A., Gastineau, R., Tiecher, T., Chalar, G., Cabrera, M., Tassano, M., Paolo Gomes Minella, J., Vasconcellos Inda, A., Cottin, N., Sabatier, P., Foucher, A., Cerdan, O., Alewell, C., and Evrard, O.: Dynamics of sediment and associated pesticide transfers in cultivated southernmost Brazil since 1982, EGU General Assembly 2026, Vienna, Austria, 3–8 May 2026, EGU26-6446, https://doi.org/10.5194/egusphere-egu26-6446, 2026.

EGU26-7670 | ECS | PICO | HS9.7

Establishment of baseline values for fluvial sediments in the Paraopeba river basin (Brazil), prior to the Brumadinho dam failure 

Lucas Leão, Fernando Pacheco, Luís Filipe Fernandes, Raphael Vicq, Fernando Laureano, Eduardo Marques, and Teresa Valente

The establishment of standardized procedures for defining geochemical reference values is critical to ensure consistency, robustness, and reliability in environmental assessments, particularly in mining-affected regions where natural geochemical backgrounds commonly overlap with anthropogenic inputs. In these settings, the determination of reliable baseline values is essential for differentiating natural variability from contamination and for supporting informed environmental management and regulatory decisions. This study provides a detailed characterization of the geochemical composition of fluvial sediments from the upper and middle sectors of the Paraopeba River Basin (PRB), southeastern Brazil, with the aim of defining representative baseline values for potentially toxic elements (PTEs). The basin has been subject to prolonged environmental pressures associated with mining, culminating in the failure of the B1 tailings dam in Brumadinho. Notably, the sediment dataset used in this investigation was obtained prior to the dam collapse, allowing the characterization of pre-disturbance geochemical conditions. A total of 717 fluvial sediment samples were collected and analyzed using inductively coupled plasma mass spectrometry (ICP-MS). Given the pronounced lithological diversity of the PRB, baseline were determined separately for each lithotype using multiple statistical techniques, including TIF, mMAD, and percentile-based approaches (75th and 98th percentiles). The results reveal a dominant geogenic control on the spatial distribution of several elements, particularly Ni, Cr, Co, Cu, and V, which are strongly linked to mafic and ultramafic lithologies of the Rio das Velhas Supergroup and the Santo Antônio do Pirapetinga Complex. Conversely, Fe and Mn show higher concentrations in areas associated with iron formations of the Minas Supergroup. Spatial mapping and multivariate analyses further indicate the combined effects of lithological controls and anthropogenic activities especially mining on sediment geochemistry. In some instances, the established baseline exceeds average upper continental crust concentrations and those reported for other mining-impacted river basins worldwide, underscoring the distinctive geochemical character of the Paraopeba River Basin. In summary, this study establishes the first regional geochemical reference framework for fluvial sediments in the Paraopeba River Basin, providing a robust scientific basis for environmental monitoring, contamination assessment, and the formulation of management and remediation strategies in watersheds influenced by mining activities.

How to cite: Leão, L., Pacheco, F., Fernandes, L. F., Vicq, R., Laureano, F., Marques, E., and Valente, T.: Establishment of baseline values for fluvial sediments in the Paraopeba river basin (Brazil), prior to the Brumadinho dam failure, EGU General Assembly 2026, Vienna, Austria, 3–8 May 2026, EGU26-7670, https://doi.org/10.5194/egusphere-egu26-7670, 2026.

EGU26-7729 | ECS | PICO | HS9.7

Development of self-dynamic desanding measures through physical model experiments 

Dominik Worf, Sophie Humenberger, Peter Flödl, Christine Sindelar, and Christoph Hauer

Sediment surplus in rivers of the Bohemian Massif is a problem for habitats of freshwater pearl mussels (Margaritifera margaritifera). These relatively fine sediments get remobilized already at mean discharge conditions, leading to mechanical stress on the mussels. Further, this increases flood risk in certain river stretches. Thus, removal of the sediment is a necessity. Due to economic and ecological reasons, riverbed dredging should be avoided. In present work, a nature-based solution for self-dynamic desanding (SDD) was investigated with physical model experiments. Through SDD, sediment shall be deposited on the floodplain during high-flow conditions, where it can be removed cheaply without in-stream work.

The physical experiments were based on a stretch of the Malše River at the Austrian/Czech border in 1:20 scale and conducted in three stages. At first, in-stream measures were investigated to optimize the transport of sediment from the main channel onto a lowered floodplain. Secondly, measures on the lowered floodplain were developed to optimize deposition. Finally, these measures were tested in a quasi-unsteady flow scenario based on a one-year flood wave. Through these experiments, SDD was improved and the descending branch of the flood wave was established to be a decisive factor on the efficiency of the proposed measures, as deposited material was washed back into the main channel. Modifications of the developed measures mitigated this issue, leading to a slightly lower deposition than in the steady case. In the end, the model showed a capacity (in nature scale) of up to 14.6 m³ of deposited sand on an area of about 120 m² .

How to cite: Worf, D., Humenberger, S., Flödl, P., Sindelar, C., and Hauer, C.: Development of self-dynamic desanding measures through physical model experiments, EGU General Assembly 2026, Vienna, Austria, 3–8 May 2026, EGU26-7729, https://doi.org/10.5194/egusphere-egu26-7729, 2026.

EGU26-8899 | PICO | HS9.7

Development and Field Application of a Pumping-Based Automatic and Remote Suspended Sediment Sampling System 

ChanJae Lee, Jaehyuk Lee, Kwangtae Choi, Hokun Chung, Sanguk Woo, and Youngsin Roh

Suspended sediment concentration (SSC) in rivers is commonly measured using depth-integrated sampling with a D-74 sampler. Although this method provides reliable reference data, it requires manual operation from bridges using winches, which involves considerable manpower and cost and poses significant safety risks, particularly during flood events. Due to these operational constraints, SSC measurements in Korea are conducted at only a limited number of stations each year despite the existence of a nationwide sediment monitoring network. To address this limitation, recent studies have actively explored indirect SSC estimation techniques based on acoustic backscatter intensity measured by horizontal acoustic Doppler current profilers (H-ADCPs). However, the application of such techniques critically depends on the availability of in situ SSC samples for calibration and validation. In this study, a pumping-based automatic and remote suspended sediment sampling system was developed to overcome the limitations of conventional manual sampling methods and to enable continuous and safe sampling during flood events and night time conditions.


The developed system consists of a sampling unit, a pumping unit, a control unit based on a remote terminal unit (RTU), and power supply and communication units. The sampling unit was designed with a multi-channel structure to sequentially fill multiple sample bottles in a single operation, and a strain-gauge-based load cell was applied to control the sampled mass with a resolution of 10 g. The pumping unit was designed to ensure stable water intake under high-turbidity and high-flow conditions. The control unit was configured based on a remote terminal unit (RTU) to integrate pump operation, sampling sequence control, sampled mass monitoring, and system status diagnostics. The control program supports both manual operation and automatic scheduling, and implements time-based and event-triggered sampling control schemes to enable unattended operation.


The system was deployed at a natural river site and operated under various flow conditions. Field application results showed that SSC samples collected by the automatic system exhibited similar concentration trends compared to those obtained by conventional manual sampling. Furthermore, continuous and unattended sampling was successfully achieved during flood conditions without on-site human intervention. The results indicate that the proposed system effectively improves operational safety and efficiency in suspended sediment sampling and can serve as a practical infrastructure for enhancing sediment monitoring networks.

 
This work was supported by the Ministry of Climate, Energy, and Environment (MCEE), Republic of Korea (Grant No. RS-2024-00397970).

How to cite: Lee, C., Lee, J., Choi, K., Chung, H., Woo, S., and Roh, Y.: Development and Field Application of a Pumping-Based Automatic and Remote Suspended Sediment Sampling System, EGU General Assembly 2026, Vienna, Austria, 3–8 May 2026, EGU26-8899, https://doi.org/10.5194/egusphere-egu26-8899, 2026.

Most sediments in the Loess Plateau of Yellow River basin originate from the gullied-hilly loess terrain, with approximately 50% deriving from gully systems which is the dominant geomorphological features. Accurately simulating the water and sediment processes in this area remains challenging due to the intricate sediment generation mechanisms within the slope-gully-river cascading systems. This study presents an enhanced version of the physically-based distributed hydrological model WEP-SED to reflect the influence of topographic slope variations on sediment production and transport processes.

The WEP-SED employs a three-tiered hierarchical structure (slope-gully-river continuum) to simulate coupled water-sediment dynamics (Fig. 1), which includes splash erosion, runoff & overland flow erosion, conflux & erosion in slope-gully, gravity erosion, conflux & sediment transport, and conflux & sediment transport.In the new model, the contour band in the sub-watershed is changed to upper-middle-down slope band, which is designed to better resolve slope-dependent erosion dynamics. This spatial discretization methodology accounts for both hydrological flow paths and local slope gradients, enabling more precise representation of erosion processes across varying topographic conditions, especially the mechanism of seriously soil erosion in the steep slope terrain and sedimentation in the valley floor of the gully. The refined sediment transport mechanisms within each slope band are schematically depicted in Figure 2. The breakpoint for the three slope band is 10°, one is the first one from top to bottom, the other is the first one from bottom to top, where the slope is just change over 10°. In the upper gentle slope band, the splash erosion and runoff & overland flow erosion is considered; in the middle steep slope band, splash erosion, runoff & overland flow erosion, conflux & erosion in slope-gully, gravity erosion is considered; in the down gentle slope band, splash erosion, runoff & overland flow erosion, gravity erosion, conflux & sediment transport in gully and river is considered.

The enhanced model was implemented in the Nanxiaohe sub-watersheds to investigate erosion-sediment dynamics during seven flood events in August 2009. It indicates that the model performs a relatively good fitness in simulating the water and sediment processes, and reflects the erosion difference in seven flood events. According to the model simulation results, the middle steep slope band constituted the dominant sediment source (70%), followed sequentially by down gentle slope band (27%) and the Upper gentle slope band has the smallest contribution. Thus, the enhance model could reflect the slope impact on sediment erosion and transport in Loess Plateau, which could be used for the benefit evaluation of soil and water conservation engineering projects.

Fig 1. A schematic illustration of the model structs and principle of the WEP-SED model.

Fig.2 Schematic diagram of geomorphic unit division


How to cite: Liu, J., Wang, K., and Zhou, Z.: Study on water and sand simulation in Loess Plateau considering slope difference of land surface, EGU General Assembly 2026, Vienna, Austria, 3–8 May 2026, EGU26-9370, https://doi.org/10.5194/egusphere-egu26-9370, 2026.

A major concern of the scientific community working on deep lakes is the progressive isolation and consequent de-oxygenation that have been observed in the last decades. The distribution of the dissolved substances in a deep lake, such as oxygen and nutrients, is controlled by the action of wind-induced stresses, penetrative convection by surface cooling and density-driven plumes. The extent of deep circulation is thus the outcome of the competition between density stratification and the drivers of mixing, acting at the surface and at the boundary of the lakes.

Lake Iseo is a large (61 km²) and deep (256m) Italian subalpine lake, fed by two main tributaries with an overall average annual inflow of 55 m3/s. The first detailed scientific analysis documents a monomictic lake, characterized by deep water with 70% oxygen saturation. However, since the second half of the 1980ies the deep-water recirculation has been insufficient. The monimolimnion has become depleted of oxygen, has become enriched with solutes and had gradually warmed with rates that could be estimated approximately ~0.05°C/year.

In this contribution, we discuss the role of the chemical stratification of lake Iseo, induced by a gradient in calcium, bicarbonate and sulphate ions, in reducing the deep-water oxygenation.  At this purpose, we computed the stability of the lake, by coupling a site–specific density equation to the high-resolution time series of lake’s ware temperature and conductivity data, and we quantified the external forcings from high-resolution wind, discharge and tributaries’ temperature data. We thus estimated the time series of the resistance by the chemical stability to wind upwelling and to rivers’ underflows. We finally showed that the progressive deep-water warming that followed the isolation of the monimolimnion has strongly decreased the lake’s thermal stability, counteracting the chemical stratification in the last 8 years. We finally concluded that it does not seem that chemically stratified deep lakes are necessarily doomed to anoxia, but on the contrary to periods of longer isolation alternated by sporadic deep oxygenation triggered by deep warming.

How to cite: Valerio, G. and Pilotti, M.: Reduced effectiveness of wind and tributaries in the deep oxygenation of a chemically stratified lake. , EGU General Assembly 2026, Vienna, Austria, 3–8 May 2026, EGU26-9682, https://doi.org/10.5194/egusphere-egu26-9682, 2026.

EGU26-12430 | ECS | PICO | HS9.7

Suspended Sediment Capture and Buffering by a Tropical Wetland Complex from Satellite Observations 

Lukas WinklerPrins, Jorge Salgado, and Fernando Jaramillo

The Magdalena River, Colombia, has the highest sediment yield of any major South American river. This high natural level and recent land cover change in the watershed have exacerbated the sediment load and deposition in the river's lowland floodplains. Excess sediment delivery has led to concerns regarding the ecological integrity of its floodplains and lakes, coral reef burial at the river mouth, and increased dredging needs. The largest floodplain system of the river, the Momposina Depression–a vast wetlandscape formed by > 100  interconnected wetlands, lakes, and floodplains where the Magdalena and Cauca rivers meet, including two Ramsar-designated sites–is accumulating and potentially buffering a large portion of this excess sediment load. However, mechanistic descriptions and seasonal-to-decadal variability of these processes are poorly understood. To fill this gap, we use MODIS and Sentinel-1 imagery at monthly timescales to investigate the spread of turbid water across the system and build a conceptual model for how sediment is captured and remobilized. We find that flooding in the early wet season can have turbidities as large as the highest-discharge periods, but turbidity can vary +/- 40% and flow is generally constrained to the main channels, thus leading to lower consistent floodplain sedimentation delivery. Later in the seasonal flood pulse, overbanking river water inundates areas up to 146% area more than typical dry seasons and, and the highest average sediment loads (>20,000 mg/L) in September–often more than twice that in the dry season–suggest that this late-season pulse drives most wetland sedimentation, before water levels recede for the incoming dry season. This seasonal-scale sediment capture also depends on ENSO cycles, local precipitation, and modifications to the hydrology by hydropower infrastructure, but despite higher in-channel turbidities during wet La Niña cycles, it is not clear if sediment associated with these cycles reaches off-channel wetlands. Our findings suggest the wetlandscape provides critical sediment retention, an overlooked ecosystem service with implications across the lower river reaches and estuary, but with high degrees of spatial and temporal variability. To reduce excessive sedimentation in this wetlandscape and downstream–including a degraded Ramsar-designated wetland and coral reefs at risk of burial–management and research initiatives should recognize the role of floodplain wetlands in sediment capture and flux buffering. 

How to cite: WinklerPrins, L., Salgado, J., and Jaramillo, F.: Suspended Sediment Capture and Buffering by a Tropical Wetland Complex from Satellite Observations, EGU General Assembly 2026, Vienna, Austria, 3–8 May 2026, EGU26-12430, https://doi.org/10.5194/egusphere-egu26-12430, 2026.

EGU26-13389 | PICO | HS9.7 | Highlight

Sediment transport assessment and dynamics during and after the largest dam removal in U.S. history on the Klamath River, Oregon and California, USA 

Liam Schenk, Scott Wright, Patrick Haluska, Grant Johnson, Joshua Cahill, Jennifer Curtis, and Amy East

In many regions worldwide, dam removal is being considered as a means to restore rivers and to remove hazards and liabilities associated with aging infrastructure. The pace and scale of dam removals has increased exponentially in the past two decades, providing a rapidly growing knowledge base with which to evaluate the consequences and effectiveness of breaching and removing dams. The largest dam removal in U.S. history on the mainstem Klamath River in Oregon and California, USA, has presented novel suspended-sediment transport conditions by giving the river access to sediment accumulating in the reservoirs since 1918.  Three large dams were removed simultaneously in 2024, and one low-head dam was removed in 2023. Turbidity monitoring and suspended-sediment concentration (SSC) sampling were conducted before, during, and after the dam removals as part of an inter-agency collaborative effort that included the dam removal entity (Klamath River Renewal Corporation), private consultants, the Karuk and Yurok indigenous tribes in California, and the U.S. Geological Survey (USGS).  These data were used to generate ordinary-least-squares regression models to compute time series of SSC and suspended-sediment loads at six mainstem USGS streamgages spanning 300 river kilometers downstream of the former dam sites.  The reservoir drawdowns prior to dam removal introduced large amounts of fine-grained sediment into the coarse-grained river corridor causing elevated turbidity and peak SSC of approximately 30,000 mg/L.  Multiple stages of the dam removal process, including reservoir drawdown, geomorphic flows for sediment mobilization, and the breach of historic cofferdams, resulted in dynamic sediment-transport conditions.  This work provides insight into differences between fine-sediment transport related to dam removal and natural sediment transport events in this large 40,000 km2 basin.

How to cite: Schenk, L., Wright, S., Haluska, P., Johnson, G., Cahill, J., Curtis, J., and East, A.: Sediment transport assessment and dynamics during and after the largest dam removal in U.S. history on the Klamath River, Oregon and California, USA, EGU General Assembly 2026, Vienna, Austria, 3–8 May 2026, EGU26-13389, https://doi.org/10.5194/egusphere-egu26-13389, 2026.

EGU26-13393 | ECS | PICO | HS9.7

Hydrodynamic effects on sulfamethoxazole adsorption on river sediments: Insights from bench-scale and flume experiments 

Mengyun Wang, Mario Morales-Hernández, Pilar Brufau, Pilar García-Navarro, Rita Fernandes de Carvalho, Rui Martins, Eva Domingues, and Pedro Dinis

River sediments play a crucial role in controlling the adsorption of contaminants in aquatic environments and act as major sinks for a wide range of organic pollutants, thereby significantly influencing the environmental fate of contaminants. In natural river systems, contaminant-sediment interactions occur under dynamic hydrodynamic conditions, which can alter mass transfer and adsorption processes. However, most existing studies rely on static batch experiments and therefore fail to capture flow-induced effects on contaminant adsorption by sediments. This limitation restricts the understanding of adsorption behavior under realistic flow conditions. In this study, sulfamethoxazole (SMX) is selected as a representative emerging contaminant to investigate how sediment properties and flow regimes jointly regulate adsorption behavior by integrating bench-scale tests with flume experiments.

Bench-scale results revealed a discrepancy between predicted and observed adsorption effectiveness among four sediments (Rebolim, Figueira da Foz, Doñana, and Mira). Mineralogical assessments suggested superior performance of sediments rich in reactive minerals (e.g., smectites), particularly those from Figueira da Foz. However, experimental results identified the sediments from Rebolim as the most effective adsorbent. This discrepancy indicates that the presence and accessibility of organic matter (OM), rather than mineral abundance alone, can govern adsorption performance. Notably, the removal of OM significantly reduced adsorption capacity, confirming its dominant role in SMX uptake. Furthermore, the results highlight a distinction between adsorption kinetics and ultimate capacity, as some sediments exhibited rapid initial uptake but limited long-term adsorption potential.

Flume experiments further demonstrated that hydrodynamic conditions fundamentally reshape the spatiotemporal distribution of SMX. In low-flow regimes, transport follows a classical advective-dispersive model with clear longitudinal gradients. Conversely, high-flow regimes induce intense turbulence, leading to near-instantaneous vertical and longitudinal homogenization. Crucially, a non-monotonic relationship was observed between flow velocity and SMX attenuation: moderate turbulence enhances adsorption by increasing contact frequency at the sediment-water interface, whereas high velocities inhibit net adsorption due to hydrodynamic flushing and reduced residence time.

These findings provide a more comprehensive framework for understanding the transport and adsorption fate of emerging contaminants in riverine systems. Future work will extend the current steady-state flow conditions to unsteady flow regimes to better understand the adsorption behavior under dynamic hydraulic conditions.

How to cite: Wang, M., Morales-Hernández, M., Brufau, P., García-Navarro, P., Fernandes de Carvalho, R., Martins, R., Domingues, E., and Dinis, P.: Hydrodynamic effects on sulfamethoxazole adsorption on river sediments: Insights from bench-scale and flume experiments, EGU General Assembly 2026, Vienna, Austria, 3–8 May 2026, EGU26-13393, https://doi.org/10.5194/egusphere-egu26-13393, 2026.

EGU26-14865 | PICO | HS9.7

Assessment of Heavy Metal Mobilization in Zinc Hydrometallurgy Residues and Their Environmental Impact 

Carmen Pérez-Sirvent, Maria Jose Martínez Sanchez, Carmen Hernandez Perez, Manuel Hernandez Cordoba, and Antonia Solano


This study analyzes the natural and induced mobilization of lead (Pb), cadmium (Cd), and arsenic (As) present in residues generated during zinc hydrometallurgy, aiming to evaluate their environmental impact and associated risks under uncontrolled conditions. Differential X-ray diffraction was employed to characterize mineralogical and amorphous phases under simulated environmental scenarios. Results indicate that all samples exhibit high susceptibility to releasing potentially toxic elements (PTEs) depending on environmental conditions.

Chemical characterization of residues and runoff waters from affected areas was performed, determining pH, electrical conductivity, salt content, and total and soluble concentrations of Zn, Pb, Cd, and As. Subsequently, toxicity bioassays (Microtox®, Ostracods, Gammarus, and Phytotest) were applied to leachates and contaminated waters. Mineralogical analysis identified previous industrial processes that influence physicochemical properties and PTE mobility.

The most critical scenarios correspond to: (i) natural mobilization of Cd and Zn due to rainfall, and (ii) changes in redox conditions in anoxic environments (flooding or incorporation of organic matter), that promote the reduction of  As (V) to As (III) . High concentrations of soluble salts increase hazard potential, generating ecotoxicological risks and potential carcinogenic effects through oral ingestion

Results confirm elevated levels of heavy metals and significant toxic effects in residues and associated waters, highlighting the need to implement preventive measures and management strategies to minimize environmental and health impacts.

How to cite: Pérez-Sirvent, C., Martínez Sanchez, M. J., Hernandez Perez, C., Hernandez Cordoba, M., and Solano, A.: Assessment of Heavy Metal Mobilization in Zinc Hydrometallurgy Residues and Their Environmental Impact, EGU General Assembly 2026, Vienna, Austria, 3–8 May 2026, EGU26-14865, https://doi.org/10.5194/egusphere-egu26-14865, 2026.

EGU26-15314 | ECS | PICO | HS9.7

A Century of Trace Metal Accumulation Recorded in Lake Maninjau Sediments, Indonesia 

Sharon Inyangala, Yael Kiro, and Nicolas Waldmann

Toxic trace elements preserved in lacustrine sediments provide valuable archives of long term environmental change yet their historical accumulation remains poorly constrained in rapidly developing regions. We investigate century scale trace metal variability using a well dated sediment core retrieved from the depocenter of Lake Maninjau, Indonesia. Sediment chronology was established using 210Pb dating and a high resolution multiproxy geochemical analysis of trace and major elements (ICP-MS, XRF) including total organic carbon (TOC). Cu, Zn, Pb, and Cd show a gradual increase from the early to mid-20th century followed by a pronounced enrichment in the early 2000s. This recent intensification is most evident for Cd which remains relatively stable earlier in the record before increasing sharply in the last two decades. In contrast Pb exhibits a decline in concentrations during the most recent period. These geochemical changes coincide with a marked increase in TOC beginning around the mid-20th century and a transition from detrital dominated sediments to diatom enriched facies indicating a shift in Lake Maninjau’s depositional regime. The pronounced metal enrichment in the last two decades temporally coincides with the period of intensified aquaculture activity in the lake. The co-variation between TOC and trace metal enrichment suggests that increased organic loading associated with aquaculture expansion enhanced trace metal accumulation under changing depositional conditions. This study demonstrates a clear intensification of trace metal accumulation and organic matter deposition in Lake Maninjau over the last century highlighting the value of sediment records for assessing long term pollution trajectories and environmental changes in tropical lake systems.

How to cite: Inyangala, S., Kiro, Y., and Waldmann, N.: A Century of Trace Metal Accumulation Recorded in Lake Maninjau Sediments, Indonesia, EGU General Assembly 2026, Vienna, Austria, 3–8 May 2026, EGU26-15314, https://doi.org/10.5194/egusphere-egu26-15314, 2026.

EGU26-15619 | ECS | PICO | HS9.7

Under-ice Thermal and Oxygen Dynamics in Saline Lakes from the Tibetan Plateau 

Jinlei Kai, Junbo Wang, Jianting Ju, Hua Wang, and Liping Zhu

Dissolved oxygen (DO) is crucial for aquatic ecological and biogeochemical processes in lakes, yet under-ice thermo- and DO dynamics, particularly in saline alpine lakes, remain poorly understood. This study examines DO, temperature, and salinity in three brackish lakes (Selin Co, Nam Co, Bamu Co) on the central Tibetan Plateau. The results reveal that solutes redistribution after ice-on strongly shaped under-ice thermal structures and DO regimes. Early ice-on period, all lakes exhibited unusual hypolimnetic DO ventilation, which was triggered by benthic solutes accumulation in snowy winter and penetrative heating in snow-free conditions. In more salt lakes (Selin Co and Bamu Co with average salinity of 11.42 ± 0.04 and 12.16 ± 0.05 g L-1, respectively), as high salinity lowered the temperature of maximum density (Tmax, 1.20 and 1.35 °C for Bamu Co and Selin Co) and enhanced solute gradients, the atypical under-ice warm stratification formed approximately two weeks before ice-off. In Bamu Co, along with the warm stratification, the dissolved oxygen showed a abrupt increased to supersaturated from the surface to ~23.2 m below the surface, suggesting abundant biological productions. Subsequently, combined warm thermal and chemical stratification inhibited DO ventilation after ice break-up, except during some instantaneous mixing events. These findings highlight the critical role of salinity gradients in shaping thermal dynamics and oxygen transport in ice-covered saline lakes, offering mechanistic insights into global limnological responses to warming and brine rejection.

How to cite: Kai, J., Wang, J., Ju, J., Wang, H., and Zhu, L.: Under-ice Thermal and Oxygen Dynamics in Saline Lakes from the Tibetan Plateau, EGU General Assembly 2026, Vienna, Austria, 3–8 May 2026, EGU26-15619, https://doi.org/10.5194/egusphere-egu26-15619, 2026.

Particulate bioavailable phosphorus (PBAP) plays a critical role in biogeochemical cycling and primary productivity in aquatic ecosystems, particularly in ecologically vulnerable alpine regions such as the Yarlung Tsangpo River. However, the understanding of PBAP dynamics remains limited due to the complex interaction and transport processes. To address this gap, we developed a mathematical model that integrated hydrodynamics, sediment transport, and the dynamics of dissolved and particulate phosphorus to investigate PBAP transport with sediment.  PBAP bound to sediment was represented by coupling sediment mineral properties and environmental factors. Lateral inputs of water, sediment, and phosphorus from the watershed were incorporated using the Soil and Water Assessment Tool (SWAT). The model was applied to the Yarlung Tsangpo River and successfully reproduced PBAP distributions, with spatiotemporal concentrations ranging from 0.20 to 0.38 mg g−1, consistent with field measurements. The estimated annual PBAP flux was 2.77 Gg yr−1, partitioned as 46.0% Ex‑P, 37.7% Fe‑P, and 16.3% Al‑P, which exceeded the flux of dissolved phosphorus (~0.80 Gg yr−1). Furthermore, over 95% of annual PBAP flux occurred between June and September, indicating strong temporal variability in PBAP dynamics within monsoonal alpine basins. This model advances process-based quantifications of PBAP dynamics and has far-reaching implications for water resources research and management.

How to cite: Zhou, Y., Fang, H., and Huang, L.: Mathematical modeling for interactions and transport of particulate bioavailable phosphorus with sediment in the Yarlung Tsangpo River, EGU General Assembly 2026, Vienna, Austria, 3–8 May 2026, EGU26-15671, https://doi.org/10.5194/egusphere-egu26-15671, 2026.

EGU26-15891 | ECS | PICO | HS9.7

BCR fractionation of mine-affected sediments as a basis for NbS design and implementation 

Erika Yessenia Cuida López, Hana Fajković, Sanda Rončević, Yulia Mun, Sabina Palinka, and Anca Iulia Stoica

Acid mine drainage (AMD) poses a persistent threat to freshwater ecosystems by causing acidification and mobilizing heavy metals that have adverse effects on aquatic biota. Especially in Arctic regions, these impacts are amplified by the changing redox conditions due to the low temperatures and seasonal ice cover. Nature-based solutions (NBS), including constructed wetlands, offer an ecologically friendly option to remediate the water quality under various environmental conditions, including AMD. Before developing an NbS to mitigate AMD, we analyze sediment composition in the target area to understand heavy metal behavior, including water–sediment transfer and their potential (bio) availability. Langvatnet Lake, located in northern Norway, functions as the main receiving water body and the lowest point within the historic Sulitjelma mining district, where extensive metal mining activities (primarily copper and zinc extraction) occurred for more than a century (Davids, 2018). These long-standing operations have resulted in highly acidic inflows originating from abandoned mine workings that, despite being closed, continue to leak acidic water and generate small drainage streams that flow into the lake. This ongoing discharge transports elevated concentrations of dissolved metals, contaminating both the water column and lake sediments. While the overarching aim of this research is to develop and evaluate NbS strategies to improve the water quality of the inlet streams, our first step is to quantify how mine-derived contaminants accumulate, persist, and potentially remobilize within lake sediments. Therefore, we use the Community Bureau of Reference (BCR) sequential extraction procedure to quantify the heavy metal concentration in different geochemical fractions of the sediments (Rauret et al., 1999). The inlet samples are compared with a range of sediment samples from the lake’s surrounding areas. This approach enables us to assess their potential release under varying environmental conditions. By identifying the dominant binding fractions, this contributes to designing the best suitable NbS for the investigated area. Our findings provide a basis for understanding the local sediment geochemistry in relation to the targeted remediation strategy. In this context, improved understanding of sediment-water interactions supports the development of resilient, passive NBS to enhance water quality, promote ecosystem recovery, and ensure long-term sustainability in AMD-impacted Arctic Lake systems.


References:

Davids, C. (2018). Mapping of abandoned mine tailings and acid mine drainage using in situ hyperspectral measurements and WorldView-3 satellite imagery (Case Study Report No. 20/2018). Northern Research Institute.

Rauret, G., López-Sánchez, J. F., Sahuquillo, A., Rubio, R., Davidson, C., Ure, A., & Quevauviller, Ph. (1999). Improvement of the BCR three step sequential extraction procedure prior to the certification of new sediment and soil reference materials. Journal of Environmental Monitoring, 1(1), 57–61. https://doi.org/10.1039/a807854h

How to cite: Cuida López, E. Y., Fajković, H., Rončević, S., Mun, Y., Palinka, S., and Stoica, A. I.: BCR fractionation of mine-affected sediments as a basis for NbS design and implementation, EGU General Assembly 2026, Vienna, Austria, 3–8 May 2026, EGU26-15891, https://doi.org/10.5194/egusphere-egu26-15891, 2026.

The Mekong–Tonle Sap Lake–Delta system supports highly productive floodplain ecosystems and regional food security, in part through the delivery of nutrient-rich suspended sediment. However, this sediment pathway is strongly modulated by the flood-pulse–driven “reverse flow” at the Mekong–Tonle Sap confluence: during the wet season, high Mekong stages drive net inflow from the mainstream into Tonle Sap Lake, whereas during the dry season the lake releases stored water back to the mainstream and onward to the delta. How this bidirectional exchange reshapes sediment delivery—specifically whether Tonle Sap acts as a net sink or a net source of suspended sediment for the downstream Mekong—remains poorly quantified. Most existing assessments approximate delta sediment supply using upstream stations and do not resolve the river–lake exchange, largely because near-confluence discharge and continuous sediment observations are limited.

Here we develop an integrated modelling framework that couples a physically based, spatially distributed hydrological model with Delft3D-Flow hydrodynamics to reconstruct daily discharge and river–lake exchange over the last ~35 years, including the reversal period. We then estimate suspended sediment fluxes using seasonally stratified, hysteresis-aware rating curves that account for distinct sediment–discharge relationships on rising versus falling limbs of the hydrograph. Combining daily exchange discharge with the corresponding rating-curve sediment concentrations enables a bidirectional suspended-sediment budget across the Tonle Sap River, separating wet-season import to the lake from dry-season export back to the mainstream.

During the historical baseline (1980–2000), we estimate that the Mekong mainstream delivers ~4 Mt yr⁻¹ of suspended sediment into the lake on average, and a comparable magnitude is returned to the mainstream during the dry season, indicating that Tonle Sap primarily acts as a transient store rather than a sustained additional sediment source to the downstream system. In the mega-dam period (2010–2025), despite substantially reduced upstream sediment supply, the river–lake exchange continues to route similar volumes of water into the lake, but the suspended-sediment contribution released from the lake does not compensate for the mainstream deficit. These results suggest that reverse-flow dynamics alone do not sustain suspended-sediment delivery to the Mekong Delta under contemporary sediment scarcity, with implications for nutrient replenishment, recession agriculture, and floodplain productivity.

How to cite: Morovati, K. and Tian, F.: Reverse flow control on suspended-sediment exchange between Tonle Sap Lake and the Mekong River under historical and mega-dam regimes, EGU General Assembly 2026, Vienna, Austria, 3–8 May 2026, EGU26-16157, https://doi.org/10.5194/egusphere-egu26-16157, 2026.

Phosphorus is an essential nutrient in aquatic ecosystems. Its concentration in surface waters regulates primary productivity, whereas excessive loading promotes eutrophication and associated water-quality degradation. Rivers are major conduits for phosphorus transport from land to downstream lakes, reservoirs, estuaries and coastal waters, with both water and sediment acting as primary carriers of phosphorus in river systems. Human activities and climate change have substantially altered water and sediment regimes in rivers worldwide. However, the resulting changes in the patterns and statistical characteristics of riverine phosphorus transport remain insufficiently quantified, despite their importance for managing aquatic ecosystem health.

Using the Mississippi River basin as a case study, we compiled long-term observations of river discharge, suspended sediment concentration and total phosphorus concentration from 1970 to 2020, and statistically analysed the patterns of riverine phosphorus transport and its relationships with water and sediment. To account for changes in water-quality and environmental policies within the basin, we further divided the record into two sub-periods (1971–1990 and 2001–2020) and considered the full period 1970–2020 for comparison. We developed a multiple linear regression framework to quantify interactions between phosphorus export, discharge and suspended sediment concentration, and to assess how watershed characteristics influence phosphorus transport under different flow conditions. This framework was used to characterise the temporal and spatial variability of phosphorus transport across the Mississippi River basin and to disentangle the effects of human activities and climate variability.

We find that phosphorus transport is source limited and negatively correlated with basin area under low-flow conditions. Human activities are strongly associated with phosphorus transport, with population density influencing total phosphorus concentrations both directly and indirectly through the TP–discharge and TP–suspended sediment concentration relationships. The interception effect of reservoirs on total phosphorus export increases with their regulation capacity, while trends in total phosphorus concentration are positively related to changes in precipitation and predominantly negatively related to vegetation cover. Our study provides a basin-scale perspective on source-to-sink fluvial phosphorus transport, offering critical insights for sustainable phosphorus management and for the integrated management of riverine and coastal ecosystems.

How to cite: Xu, J.: Riverine phosphorus transport and its statistical coupling with discharge and suspended sediment, EGU General Assembly 2026, Vienna, Austria, 3–8 May 2026, EGU26-16285, https://doi.org/10.5194/egusphere-egu26-16285, 2026.

Pharmaceuticals and personal care products (PPCPs) from wastewater discharge are increasingly detected in urban river systems; however, their subsurface fate and transport remain poorly understood at the field scale. Here, we investigate the vertical migration and subsurface distribution of emerging organic contaminants (EOCs) at three anthropogenically impacted sites in the Yamuna River basin, Delhi, India: the Yamuna Riverbank, a major urban drain that discharges directly into the river, and an artificial lake that receives treated wastewater effluent. Target compounds included antibiotics, endocrine-disrupting compounds, prescription and over-the-counter pharmaceuticals, sewage-associated tracers, and an artificial sweetener.

Soil samples spanning the vadose and saturated zones were collected down to 30 m below ground level using standard penetration testing and the bailer (“Boki”) method. Nested piezometers enabled the spatiotemporal monitoring of surface water and groundwater in shallow, intermediate, and deep layers over a one-year period.

Deep penetration of PPCPs was observed at all three sites, with at least ten target compounds quantified in both soils and groundwater down to a depth of 30 m. Estrone exhibited the highest concentrations in soils, while non-steroidal anti-inflammatory drugs were the most frequently detected compound class across sites. Seven compounds showed detection frequencies exceeding 90% in soils at all three sites. Multivariate statistical analyses linked compound-specific distribution patterns to soil chemistry and subsurface hydrogeology. Stable isotope analysis (δ¹⁸O, δ²H) and fluorescence dissolved organic matter (fDOM) characterisation were applied to elucidate surface water–groundwater interactions. Soil mineralogy and elemental composition were characterised using X-ray diffraction (XRD) and X-ray fluorescence (XRF) to assess geochemical controls on contaminant retention and mobility.

In addition to targeted monitoring of 27 compounds, suspect and non-target screening was conducted on surface and groundwater samples to identify transformation products and to assess the influence of redox and geochemical conditions on subsurface transformation processes. Laboratory-scale batch sorption and biodegradation experiments conducted at environmentally relevant concentrations were used to support the interpretation of field-scale observations.

These results demonstrate that PPCPs can migrate vertically through soils and persist across both the vadose and saturated zones, with significant implications for groundwater quality, particularly in regions where rivers serve as both wastewater receivers and aquifer recharge zones.

How to cite: Gupta, S., Singh, D., Vellanki, B. P., and Boving, T.: From Surface Water to Deep Groundwater: Field Evidence of Fate and Transport of Pharmaceuticals and Personal Care Products (PPCPs) in Urban Alluvial Systems of Delhi, India, EGU General Assembly 2026, Vienna, Austria, 3–8 May 2026, EGU26-16820, https://doi.org/10.5194/egusphere-egu26-16820, 2026.

Soil erosion and sediment transport pose major challenges for river basin management in India, where
intense monsoon rainfall, diverse physiography, and rapid land-use change generate high and spatially
variable sediment fluxes causing significant challenges like reservoir siltation, soil degradation, and
downstream coastal impacts. However, sediment quantification through modeling at national and basin
scales in India is often constrained by data availability, input data selection and other uncertainties
associated with the choice of empirical options in the models. This study aims to explicitly quantify and
assess input data source–induced uncertainty in the InVEST Sediment Delivery Ratio (SDR) model driven
at 1km resolution for major Indian River basins (viz. Sabarmati, Narmada, Baitarani, and Tapi) for the
period 2005–2019. The adopted multi-input modeling framework utilized several datasets, including
topography from the HydroSHEDS digital elevation model, land use and land cover from HILDA+, rainfall
erosivity (R factor) derived from ERA5 hourly precipitation data using the EI60 formulation,
Furthermore, the rainfall erosivity was computed using five empirical kinetic energy relationships
(Wischmeier & Smith; Brown & Foster; McGregor et al.; Van Dijk et al.; Meshesha et al.) to capture
methodological uncertainty in rainfall intensity representation. Four soil erodibility (K factor)
combinations were generated based on two data sources and two estimation methods: (1) HWSD–EPIC,
(2) HWSD–Nomograph, (3) SoilGrids–EPIC, and (4) SoilGrids–Nomograph . In total, 20 rainfall
erosivity–soil erodibility input combinations were created by systematically varying the erosivity and
erodibility datasets and estimation methods within the InVEST SDR model, using its default
configuration settings. Results indicate strong basin-specific sensitivity to input data selection, with
rainfall erosivity emerging as the dominant control on sediment export, followed by soil erodibility and
then topographic controls (LS factor). Sediment export estimates showed comparatively lower
uncertainty for the Sabarmati and Narmada basins, followed by Baitarani and Tapi. The study highlights
that input data choice represents a major source of uncertainty in large-scale sediment modelling in
India river basins and underscores the need for transparent evaluation of data-driven variability prior to
calibration.

How to cite: Shah, M., Kumar, R., and Remesan, R.: Quantification and evaluation of input data source induced uncertainty in the InVEST sediment exportmodelling framework for major Indian River basins, EGU General Assembly 2026, Vienna, Austria, 3–8 May 2026, EGU26-17714, https://doi.org/10.5194/egusphere-egu26-17714, 2026.

EGU26-17893 | PICO | HS9.7

Stochastic hydro‑sedimentary modelling of arsenic mobilisation and downstream propagation in a coupled slope–channel–lake system 

María Sánchez-Canales, Fernando Barrio Parra, Irene Berbel, Lucía Álvarez-Mejías, Humberto Serrano Garcia, Jaime Montalvo-Piñeiro, Miguel Izquierdo-Diaz, and Eduardo De Miguel

The transfer of sediment‑bound contaminants from unstable hillslopes into fluvial and lacustrine environments is governed by the interaction between geomorphic processes, hydrological connectivity and sediment transport dynamics. This study develops a quantitative modelling framework to assess the mobilisation of arsenic (As) from a contaminated slope and its potential downstream propagation through an integrated slope–channel–lake system.

High‑resolution terrain data were used to parameterise slope geometry and derive section‑scale morphometric attributes relevant to sediment detachment and mass‑failure susceptibility (slope gradient, contributing area, profile curvature and cross-sectional geometry). Spatially distributed As concentration measurements were incorporated into a stochastic Monte Carlo model, which simulated 10,000 realisations of contaminant mass for each slope section using distribution-specific sampling to represent data variability. Mobilizable sediment volumes were estimated using geometrically constrained maximum‑failure envelopes, enabling derivation of event‑scale sediment yields.

Hydrological and sediment connectivity were conceptualised through a simplified source–pathway–receptor model. Collapse scenarios representing 10%, 20%, 30%, 50% and 100% slope mobilisation were propagated downstream assuming full sediment transfer efficiency and no attenuation processes such as channel storage, hyporheic exchange, settling velocity effects or precipitation–adsorption dynamics. This approach represents an upper-bound transfer model suitable for preliminary contaminant‑risk assessment.

Total As mass stored in the slope was estimated at approximately 458 kg. Model outputs indicate that even under complete slope failure, the resulting concentration in the receiving lake remains marginally below the commonly adopted 0.010 mg/L threshold for potable water, whereas partial‑failure scenarios yield concentrations an order of magnitude lower. Sensitivity analyses demonstrate that predictions are strongly influenced by bulk density assumptions, connectivity ratios and sediment pulse magnitudes, highlighting the importance of probabilistic approaches for representing parameter uncertainty.

These findings underscore the need to integrate hydro‑sedimentary modelling, geomorphic characterisation and stochastic uncertainty quantification when assessing contaminant transport in catchment‑scale systems. The methodology presented provides a transferable framework for evaluating contaminant propagation where legacy mining residues persist in erosion‑prone, hydrologically connected terrain.

How to cite: Sánchez-Canales, M., Barrio Parra, F., Berbel, I., Álvarez-Mejías, L., Serrano Garcia, H., Montalvo-Piñeiro, J., Izquierdo-Diaz, M., and De Miguel, E.: Stochastic hydro‑sedimentary modelling of arsenic mobilisation and downstream propagation in a coupled slope–channel–lake system, EGU General Assembly 2026, Vienna, Austria, 3–8 May 2026, EGU26-17893, https://doi.org/10.5194/egusphere-egu26-17893, 2026.

EGU26-19085 | ECS | PICO | HS9.7

Benthic fauna-mediated bed load sediment transport dynamics 

Zonghong Chen

Benthic fauna plays a critical role in mediating bed load sediment transport, an essential process influencing wetland restoration, water quality, coastal protection, and nutrient cycling. However, predictive models quantifying this biological mediation remain absent due to limited mechanistic understanding. Here, we develop a high-fidelity computational model coupling fluid flow, sediment dynamics, and benthic activity to quantify benthic fauna-mediated bed load transport. We show that benthic presence can reduce transport rates by up to 50%, primarily through two mechanisms: bioroughness-induced effective shear stress reduction and bioturbulence-driven wake zone expansion. Building on these insights, we propose two predictive formulas that align well with field data. These findings offer the first quantitative framework for bed load prediction in benthos-dominated environments and sheds light on sediment dynamics central to benthic morphodynamics.

How to cite: Chen, Z.: Benthic fauna-mediated bed load sediment transport dynamics, EGU General Assembly 2026, Vienna, Austria, 3–8 May 2026, EGU26-19085, https://doi.org/10.5194/egusphere-egu26-19085, 2026.

EGU26-19124 | PICO | HS9.7

Mobilization of particulate matter in intermittent and forested headwater streams 

Núria Martínez-Carreras, Laurent Gourdol, and Jean François Iffly

Headwater streams extend and retract both seasonally and in response to individual rainfall events. Stream network extension is typically accompanied by an increase in stream water velocity and water depth, which may overcome mobilization thresholds of particulate matter that may have accumulated in previously dried-out streams. Although this process is commonly conjectured, data documenting the pacing and mechanisms leading to the transfer of particulate matter from terrestrial to aquatic environments remains scarce. An improved mechanistic understanding of these processes in forested headwater streams is particularly needed because they are reportedly highly sensitive to the changes in timing, magnitude and duration of precipitation expected under a changing climate. In Luxembourg, the health of forest ecosystems has also declined severely over the past two decades. Together, these changes might ultimately affect flow persistence, alter the transport and transformation of water, energy, dissolved and suspended materials, and impact organisms throughout the river network. The potentially considerable consequences of these changes on our water resources, aquatic ecosystems and bio-geochemical cycles remain largely unknown. In this study, we investigate the relationship between catchment storage, water flow paths, stream network extension and particulate matter mobilization. During rainfall events, water might flow overland in previously dry streams if a shallow, perched, transient water table builds up and generates runoff, or if a deeper water table rises to the upper transmissive soil horizons. The former mechanism is more likely to occur when antecedent catchment storage is low, whereas the latter is expected when storage is high. Despite it has never been demonstrated with observations, these two processes leading to overland flow might be associated to different sediment mobilization mechanisms. To test these hypothesis, we designed a field study to gather unprecedented datasets on (i) stream network dynamics (i.e., network extension/retraction and intermittency) documented using time-lapse cameras, (ii) suspended sediment fluxes measured at the catchment outlet, and (iii) catchment storage estimated from an extensive, high-resolution hydrometric time series collected in the Weierbach Experimental Catchment (WEC; 0.45 km2; north-western Luxembourg). Our results show that stream extension during rainfall events drives particulate matter mobilization during single peak hydrographs in the WEC, when water rapidly reaches the stream network during precipitation pulses and catchment storage is low. In contrast, double peak hydrographs occur when catchment storage is high, resulting in limited stream network extension and low particulate matter mobilization. Building on these newly gained datasets, we aim to develop a novel conceptual framework linking particulate matter mobilization to its subsequent controlling factors, including rainfall characteristics, catchment storage, regolith structure, land cover and topography.

How to cite: Martínez-Carreras, N., Gourdol, L., and Iffly, J. F.: Mobilization of particulate matter in intermittent and forested headwater streams, EGU General Assembly 2026, Vienna, Austria, 3–8 May 2026, EGU26-19124, https://doi.org/10.5194/egusphere-egu26-19124, 2026.

EGU26-20152 | ECS | PICO | HS9.7

Comparative soil health dynamics and crop morphological responses in natural and conventional agroecosystems 

Rohit Thakur, Ranjeet Kumar Jha, and Rohit Thakur

Nutrient management and cropping system strategies are so different between natural and conventional agroecosystems that soil health generally follows very different trajectories, thereby affecting crop growth, functioning, and system sustainability. To examine these effects, a field experiment was conducted during the rainy season in the humid subtropical region of the north-western Himalayas, India, to evaluate seasonal soil physicochemical changes under natural farming inputs, conventional chemical fertilizer applications, and okra-cowpea intercropping, and to establish their relationships with crop growth and yield Soil samples were collected from the experimental field before sowing to establish baseline soil conditions. Write all measurements you did and what analyses you performed Two-way ANOVA indicated that soil pH was affected by treatment (p = 0.00011 < 0.05) and season (p = 2.05 × 10⁻²⁹<0.05) with a significant interaction of treatment x season (p = 0.0329 < 0.05). Soil EC was strongly affected by season (p=5.19× 10⁻⁶⁵<0.05), whereas treatment (p=0.502) and interaction effects (p = 0.204>0.05) were not significant. Organic matter content was significantly influenced by treatment (p= 1.37 × 10⁻⁵<0.05) and season (p = 3.34 × 10⁻¹⁵<0.05), while the interaction effect was marginally non-significant (p= 0.060>0.05). Dry density exhibited a strong seasonal effect (p=4.00 × 10⁻²⁶), with no significant treatment influence (p=0.298). Treatments with higher post-harvest organic matter (up to 3.12%) and reduced dry density as low as 1.31g cm⁻³ recorded greater plant growth, higher leaf area index (up to 1.58), and increased stem diameter. One-way ANOVA revealed that stem diameter (p=0.0306) and okra yield (p=1.50×10⁻⁵<0.05) were significantly affected by treatments, whereas plant height (p=0.176>0.05) and total biomass(p=0.396>0.05) were not. The correlation analysis using Pearson's correlation was strongly negative between post-harvest soil pH and Okra yield (r = -0.61), while organic matter was moderate in correlation (r = -0.31). Principal component analysis explained a cumulative percentage of 66.9% in total variance, in which soil pH, organic matter, and dry density were strongly associated in PC1. Soil Quality, derived from PCA, varied between 0.10 and 0.51, which was higher in natural farming practices and intercropping. Land equivalent ratio in intercropping was significantly improved in all cases, ranging between 1.24 and 1.73, which proved that it was significantly better compared to mono cropping in both natural farming practices and conventional inorganic nutrient management. The results demonstrate that natural nutrient management combined with intercropping offers a viable, low-input strategy for farmers to improve soil quality, reduce dependency on external fertilizers, and thereby strengthen farm-level economic and ecological resilience.


How to cite: Thakur, R., Jha, R. K., and Thakur, R.: Comparative soil health dynamics and crop morphological responses in natural and conventional agroecosystems, EGU General Assembly 2026, Vienna, Austria, 3–8 May 2026, EGU26-20152, https://doi.org/10.5194/egusphere-egu26-20152, 2026.

Recurring monsoon floods in the Kosi River Basin pose a critical threat to agricultural productivity, sediment deposition, and disruption of cultivable flood plains in Bihar, India. Severe seasonal rainfall combined with steep Himalayan topography generates high runoff and sediment fluxes in the Kosi River system. These hydrological conditions drive frequent channel instability, abrupt shifts in the river course, and widespread flood inundation leading to extensive deposition of sandy soil over fertile agricultural lands. Such recurring flood-driven erosion and sedimentation processes necessitate a quantitative assessment of their impacts on crop productivity, land-use dynamics, and sediment redistribution. Therefore, this study aims to provide a basin-scale quantification of flood-induced soil erosion and crop productivity losses in the Kosi River Basin using integrated remote sensing and hydrological modeling approaches. The Soil and Water Assessment Tool Plus (SWAT+) was employed to simulate basin-scale hydrological processes, sediment transport, and nutrient dynamics. Model parameterization utilized high-resolution topographic data derived from the Shuttle Radar Topography Mission (SRTM) digital elevation model and land use/land cover maps generated from Sentinel-2 satellite imagery. Climatic inputs, including rainfall and temperature, were obtained from the NASA POWER climate data archive, supplemented with observed rainfall records from the Indian Meteorological Department (IMD). Observed streamflow data from the Central Water Commission (CWC), India, were used for model calibration and validation. Spatial data processing and analyses were performed using Python-based workflows within QGIS and ArcGIS environments. We also examine the historical LULC trend from satellite data to understand the spatio-temporal changes in agricultural land and floodplain. We then run future climate scenarios: bias-corrected CMIP6 projections (SSP2-4.5, SSP5-8.5) are used to drive SWAT+ simulations of future flood extent, sediment yield, and land productivity. The final results of this research activity will be presented at the Conference.

Keywords: SWAT+, soil erosion, flood modeling, Kosi River, CMIP6, LULC, sedimentation.

How to cite: Kumar, A. and Jha, R. K.: Assessment of Flood-Induced Soil Erosion and Agricultural Yield Loss in the Kosi Basin Integrating Remote Sensing and Hydrological Modeling, EGU General Assembly 2026, Vienna, Austria, 3–8 May 2026, EGU26-20242, https://doi.org/10.5194/egusphere-egu26-20242, 2026.

Soil erosion and sediment connectivity play a crucial role in shaping river basin health, especially in monsoon-dominated regions where both natural processes and human interventions strongly influence sediment dynamics. This study investigates soil erosion patterns and sediment connectivity across two contrasting sub-basins of the Godavari River—Sabari, representing a near-natural system, and Manjira, a highly human-modified basin. Using multi-temporal land-use and land-cover data from 1985 to 2022, along with probabilistic indices such as sediment transport potential (STP) and the soil erosion and transport index (SETI), the study evaluates how geomorphic conditions, hydrological processes, and anthropogenic activities jointly control sediment generation and delivery. Six land-use classes were analysed to capture long-term landscape transformations, revealing rapid agricultural expansion and urban growth in Manjira, while Sabari remained largely forest-dominated. The combined STP–SETI analysis highlights distinct sediment hotspots, particularly in north–northwestern Manjira and central–southeastern Sabari, where steep slopes, reduced vegetation cover, and altered connectivity increase erosion risk. Major reservoirs, including Nizamsagar, Donkarayi, Singur, and Balimela, emerge as key regulators by disrupting sediment pathways and creating upstream sediment storage zones. The novelty of this work lies in integrating static erosion indicators with dynamic land-use changes using a probabilistic framework to identify spatially explicit sediment regimes. The findings emphasize the need for basin-specific management strategies, advocating vegetation restoration in Sabari and integrated sediment–reservoir management in Manjira to promote sustainable sediment governance.

How to cite: Singh, A. and Swarnkar, S.: Integrating Soil Erosion and Sediment Connectivity Indices to Identify Sediment Hotspots in the Godavari River Basin, EGU General Assembly 2026, Vienna, Austria, 3–8 May 2026, EGU26-20519, https://doi.org/10.5194/egusphere-egu26-20519, 2026.

HS10 – Ecohydrology and Limnology

EGU26-666 | ECS | Orals | HS10.1

Metabolic-Based Assessment of Restoration Strategies in Terminal Hypersaline Lakes 

Mahdieh Goli and Ammar Safaie

Lake Urmia has experienced rapid hydrogeochemical transitions and ecological disruption in recent years despite extensive restoration efforts. The Urmia Lake Restoration Program (ULRP) identifies a water level of 1274.1 m a.s.l. as an ecological threshold intended to preserve its keystone species, Artemia urmiana (AU), based solely on empirical relationships linking water level, salinity, and ecological integrity. However, this threshold does not incorporate the mechanistic physiological sensitivities of AU, whose survival, growth, and reproduction respond sharply to changes in habitat salinity. As the lake’s sole grazer of primary producers and a critical food source for migratory birds, AU plays an essential role in sustaining the vulnerable ecosystem of this region. Therefore, a more process-based understanding of how salinity affects AU is necessary to evaluate whether this empirically derived threshold can truly support the species and the broader ecosystem. In this study, we employed a species-specific Dynamic Energy Budget (DEB) model to quantify how increasing salinity affects energy allocation and life-history traits of AU. Then, these physiological outputs were integrated into a population model to evaluate salinity impacts at the population scale. As the salinity of Lake Urmia is locally variable, we combined these results with two-dimensional salinity fields derived from hydrodynamic simulations of the lake to identify suitable areas where AU can thrive. This approach offers a process-based quantitative framework for assessing restoration scenarios and guiding management strategies to avert continued ecological decline and reinforce the resilience and functionality of hypersaline lake ecosystems.

How to cite: Goli, M. and Safaie, A.: Metabolic-Based Assessment of Restoration Strategies in Terminal Hypersaline Lakes, EGU General Assembly 2026, Vienna, Austria, 3–8 May 2026, EGU26-666, https://doi.org/10.5194/egusphere-egu26-666, 2026.

Consuming freshwater beyond regional carrying capacity—the maximum volume of water that can be sustainably used by human activities—creates ecological water deficits that pose critical threats to aquatic biodiversity and ecosystem integrity. Quantifying the impacts of such deficits is therefore essential for guiding sustainable water use and assessing environmental impacts along global value chains. These impacts are commonly assessed using Life Cycle Impact Assessment (LCIA) frameworks that develop spatially explicit characterization factors for freshwater ecosystems; however, most existing approaches treat water use as an undifferentiated pressure, without distinguishing sustainable freshwater consumption from overconsumption that leads to ecological water deficits. Here, we assess the global impacts of freshwater overconsumption and associated ecological water deficits on freshwater fish species richness using WaterGAP 2.2e data for approximately 11,000 watersheds worldwide. Regional carrying capacity was quantified as available freshwater resources minus environmental water requirements needed to sustain aquatic ecosystems, with ecological water deficits identified where human consumption exceeded this capacity (i.e., freshwater overconsumption). Biodiversity responses were evaluated using a global model linking freshwater fish species richness to river discharge and other covariates (elevation, basin area, and climate zone). Based on this model, two species–discharge relationships (SDRs) were derived to distinguish watersheds experiencing ecological water deficits from those operating within sustainable limits. These SDRs were then used to develop characterization factors quantifying the impacts of human freshwater consumption on freshwater fish biodiversity. Our analysis revealed higher characterization factors in watersheds affected by ecological water deficits, indicating stronger biodiversity impacts under freshwater overconsumption conditions. Explicitly accounting for ecological water deficits in LCIA water-impact assessment can enhance the ecological relevance and accuracy of global characterization factors for freshwater systems and aquatic ecosystems. This, in turn, can support more targeted freshwater management strategies aligned with biodiversity conservation goals.

How to cite: Mtibaa, S., Islam, K., and Motoshita, M.: Assessing the potential impacts of freshwater overconsumption beyond regional carrying capacity on riverine fish species richness, EGU General Assembly 2026, Vienna, Austria, 3–8 May 2026, EGU26-1922, https://doi.org/10.5194/egusphere-egu26-1922, 2026.

Adaptation of ecosystems’ root zones to climate change critically affects drought resilience and vegetation productivity. However, a global quantitative assessment of this mechanism is missing. In this study, we applied the mass curve technique (MCT) based on water balance to estimate the global root zone water storage capacity (SR) using high-quality observation-based data. Our results show that the global average SR increased by 11%, from 182 to 202 mm in 1982–2020. The total increase of SR equals to 1652 billion m3 over the past four decades. SR increased in 9 out of 12 land cover types, while three relatively dry types experienced decreasing trends, potentially suggesting the crossing of ecosystems’ tipping points. Our results underscore the importance of accounting for root zone dynamics under climate change to assess drought impacts.

How to cite: Xi, Q. and Gao, H.: Terrestrial ecosystems enhanced root zone water storage capacity in response to climate change over the past four decades, EGU General Assembly 2026, Vienna, Austria, 3–8 May 2026, EGU26-2124, https://doi.org/10.5194/egusphere-egu26-2124, 2026.

EGU26-2936 | Orals | HS10.1

Integrating an InVEST-OPGD Framework to Decouple the Spatiotemporal Dynamics and Drivers of Water Conservation in the Tabu Agropastoral Ecotone 

Jing Jin, Zilong Liao, Tiejun Liu, Zihe Wang, Mingxin Wang, and Jing Zhang

Water conservation (WC) is a critical regulating ecosystem service in agropastoral ecotones, yet its spatiotemporal dynamics and driving mechanisms in these vulnerable ecotones remain inadequately understood, hindering sustainable water resource management and ecosystem security. In this study, a novel framework is proposed that coupled the Integrated Valuation of Ecosystem Services and Tradeoffs (InVEST) model with an optimal parameter geodetector (OPGD) to assess the spatiotemporal heterogeneity in WC and its driving mechanism in the Tabu agropastoral ecotone from 2000–2022. Results revealed a pronounced south-to-north decreasing gradient in WC, with an insignificant increase of 0.04 mm/yr. The WC capacities across land use types ranked as follows: high-fractional vegetation cover (FVC) grassland > shrubland > medium-FVC grassland > low-FVC grassland > farmland > bare land > construction land. Hotspots were clustered in the southwest, whereas cold spots were clustered in the north. The areas of the two spots both decreased during 2000–2022, with cold spots disappearing entirely by 2022. Compared with anthropogenic factors (e.g., gross domestic product (GDP), population and the human footprint), natural factors (e.g., precipitation, elevation, temperature and evaporation) had greater influence on WC. Interactions between drivers predominantly exhibited bivariate enhancement, with the interaction between land use and land cover (LULC) and precipitation being the most significant (qi: 0.33–0.67). A dual-pronged spatial strategy considering the optimization of the LULC layout and enhanced interaction is suggested in the ecological planning framework. This research provides critical support for water resource management and the maintenance of ecological security in ecotones. Moreover, it provides a transferable methodological tool for performing ecohydrological evaluations in other regions, particularly in the context of climate change and evolving land use trajectories.

How to cite: Jin, J., Liao, Z., Liu, T., Wang, Z., Wang, M., and Zhang, J.: Integrating an InVEST-OPGD Framework to Decouple the Spatiotemporal Dynamics and Drivers of Water Conservation in the Tabu Agropastoral Ecotone, EGU General Assembly 2026, Vienna, Austria, 3–8 May 2026, EGU26-2936, https://doi.org/10.5194/egusphere-egu26-2936, 2026.

EGU26-3592 | ECS | Orals | HS10.1

A geomorphology-based framework for identifying water conservation priorities in the Brazilian Cerrado savanna 

Iporã Possantti, Rafael Barbedo, Guilherme Marques, Lucas Lira, and Yuri Salmona

The Brazilian Cerrado is the largest tropical savanna in South America and contains extensive headwater plateaus that play a central role in aquifer recharge and in sustaining baseflows of regional rivers. With annual precipitation around 1500 mm, a seasonal rainfall regime, and deep tropical soils, water provision under natural vegetation depends strongly on geomorphology, which controls riparian wetlands and favors saturation-excess runoff. The biome exhibits a naturally unfavorable water balance, with high evaporative demand (nearly 70%), a condition aggravated by climate change–driven reductions in drought streamflow. Rapid agricultural expansion further intensifies water stress by reducing infiltration and increasing surface temperatures, highlighting the need for spatially explicit frameworks to guide conservation actions in headwater regions. We analyzed eight medium-sized catchments that are climatically and geologically similar, distributed along a conservation gradient ranging from 16% to 98% native vegetation cover. Based on public data, this quasi-paired dataset allows the hydrological effects of vegetation to be isolated. More preserved catchments exhibited consistently higher drought flows, producing two to four times more water during the dry season, even in years with comparable mean flows. In contrast, agricultural catchments showed faster rainfall responses and lower dry-season runoff coefficients, reflecting limited infiltration and higher evapotranspiration losses. The primary geomorphological descriptor was the Height Above the Nearest Drainage (HAND), used to represent the potential for soil saturation and, complementarily, infiltration. Event-scale analyses of dry-season runoff coefficients revealed a strong dependence of hydrological response on the fraction of the catchment located below specific HAND thresholds. From this calibration, an operational threshold of approximately 11.5 m was identified, consistently discriminating areas prone to saturation from those remaining available for infiltration throughout the year. These empirical results were generalized into a multi-scale decision-support framework. The analysis mapped areas with high natural infiltration potential, concentrated mainly on plateaus associated with highly productive aquifers, such as the Urucuia Aquifer. HAND proved effective in identifying these elevated compartments, where low drainage density and high subsurface storage capacity promote infiltration and baseflow maintenance. Based on this information, a classification of priority areas for water conservation was developed, distinguishing zones where native vegetation preservation is critical from those requiring restoration and soil-management actions. The resulting priority map provides a spatially explicit basis to support land-use and watershed policies in the Cerrado biome.

How to cite: Possantti, I., Barbedo, R., Marques, G., Lira, L., and Salmona, Y.: A geomorphology-based framework for identifying water conservation priorities in the Brazilian Cerrado savanna, EGU General Assembly 2026, Vienna, Austria, 3–8 May 2026, EGU26-3592, https://doi.org/10.5194/egusphere-egu26-3592, 2026.

EGU26-5062 | ECS | Posters on site | HS10.1

Inverse modelling to estimate plant hydraulic traits and water use strategies in a Costa Rican tropical dry forest 

Mohammad Shokrollahi, Gregor Rickert, Sascha Iden, Matthias Beyer, Alberto Iraheta, Nicolas Martin-StPaul, Julian Klaus, and Ilhan Özgen-Xian

This study aims to understand water uptake depths and dynamics of tropical dry forest trees, namely RonRon (Astronium graveolens), Guacimo (Guazuma ulmifolia), Guapinol (Hymenaea courbaril) and Caoba (Swietenia macrophylla), at Estación Experimental Forestal Horizontes, an intensively monitored research site in northwestern Costa Rica. The climate of this region is driven by the El Niño–Southern Oscillation, which results in distinct wet (June to December) and dry seasons (December to May). We combine field measurements of sap flow and soil moisture, collected between December 2020 to December 2021, to estimate plant hydraulic traits through inverse modelling with a differential evolution approach using the mechanistic plant hydraulic model SurEau-Ecos. This allowed the estimate of 12 plant hydraulic parameters for each of these four species. We compare these inversely estimated traits across species and link them to observed soil moisture and sap flow dynamics. Our results show distinct hydraulic strategies for each plant, which feedback into the spatiotemporal dynamics of soil moisture. Caoba and Guacimo conserve water through early stomatal closure to inhibit transpiration during the dry season, while RonRon and Guapinol keep their stomata open and sustain a relatively higher transpiration rate even with limited soil moisture. Overall, clear differences in drought-response strategies among species, including general isohydric and anisohydric behavior, are shown both in estimated plant hydraulic traits and in ecohydrological signatures. A limitation of this study is that interspecies interactions have been neglected. Nevertheless, fair agreement between model results and field observations has been achieved. Our findings contribute to the mechanistic understanding of hydraulic strategies of tropical dry forests, which are currently understudied ecosystems.

How to cite: Shokrollahi, M., Rickert, G., Iden, S., Beyer, M., Iraheta, A., Martin-StPaul, N., Klaus, J., and Özgen-Xian, I.: Inverse modelling to estimate plant hydraulic traits and water use strategies in a Costa Rican tropical dry forest, EGU General Assembly 2026, Vienna, Austria, 3–8 May 2026, EGU26-5062, https://doi.org/10.5194/egusphere-egu26-5062, 2026.

EGU26-6665 | Orals | HS10.1

Growing significance of vegetation succession following glacier retreat on high-mountain hydrological cycle  

Fuxiao Jiang, Simone Fatichi, Athanasios Paschalis, and Nadav Peleg

Climate-driven glacier retreat exposes newly ice-free terrain that is progressively colonized by plants, driving ecological succession and altering hydrological and biogeochemical processes in high-mountain ecosystems. Although hydrological impacts of glacier shrinkage have been widely explored, the effects of post-retreat vegetation succession remain poorly quantified. In this study, we apply a mechanistic ecohydrological model (T&C) that explicitly simulates plant migration and species range dynamics to assess hydrological responses to glacier retreat and vegetation succession from 1981 to 2099 under multiple climate change scenarios in a deglaciating ecosystem in the Swiss Alps. The results show that glaciers exert a first-order control on the hydrological cycle, particularly on runoff. Vegetation succession following glacier retreat plays a relatively minor role in hydrological processes initially, but its importance increases over time as glacier cover declines. The combined interactions among glaciers, vegetation and climate significantly modify hydrological regimes, with important implication for projecting future water resources, including changes in terms of magnitude and intra-annual (seasonal) variability, and water quality in high-mountain regions under continued global warming.   

How to cite: Jiang, F., Fatichi, S., Paschalis, A., and Peleg, N.: Growing significance of vegetation succession following glacier retreat on high-mountain hydrological cycle , EGU General Assembly 2026, Vienna, Austria, 3–8 May 2026, EGU26-6665, https://doi.org/10.5194/egusphere-egu26-6665, 2026.

EGU26-8256 | ECS | Posters on site | HS10.1

Problem of the illegal dumping sitesin the Białka Valley, Carpathian Mountains 

Wiktoria Suwalska, Oktawia Kaflińska, Michał Jakiel, Michalina Kurzac, Justyna Staniek, Katarzyna Świerczek, Wiktoria Zaremba, Aleksandra Ziarnik, and Mirosław Żelazny

Białka River Valley (Natura 2000 site, PLH120024) is one of the most important natural areas in the Polish part of the Carpathians. It serves as a key ecological corridor and provides important habitats for many animal species. The primary objective of this area is the protection of the river’s natural character. During field surveys conducted in 2023, almost 300 waste dumping sites were mapped within an area of 716 hectares. Dominant type of waste was plastic (mainly plastic bags – 46% and PET bottles – 45.7%). Other identified waste fractions included construction waste (26.3%), metal (24.7%) and glass (22.3%). With regard to dump size, 21.7% of the sites were classified as large (e.g. equivalent to a dump truck load of waste, while 22.7% were classified as medium (e.g. equivalent to a wheelbarrow load). The presence of environmentally hazardous waste (such as batteries, accumulators, grease, oils) was also mapped. This may affect the ionic composition of the water, increasing conductivity and creating a real threat to the environment (including water pollution or fire). Additionally, waste materials may be transported downstream by river flow, exposing other places to environmental hazards. A total of 63% of all dumping sites were visually exposed, which negatively affects the landscape in mountainous regions. The dominant land-cover types within the study area were forest (35.7%), grasslands (33.3%) and shrubs (24%). Approximately 32% of the identified waste consisted of recyclable materials, which could be effectively eliminated under appropriate waste management practices. In 2026, repeat field mapping will be carried out to enable comparative analysis and to assess changes from ecological, hydrological perspectives.

How to cite: Suwalska, W., Kaflińska, O., Jakiel, M., Kurzac, M., Staniek, J., Świerczek, K., Zaremba, W., Ziarnik, A., and Żelazny, M.: Problem of the illegal dumping sitesin the Białka Valley, Carpathian Mountains, EGU General Assembly 2026, Vienna, Austria, 3–8 May 2026, EGU26-8256, https://doi.org/10.5194/egusphere-egu26-8256, 2026.

EGU26-8369 | Orals | HS10.1

Hydrological conditions that directly impact terrestrial wildlife and people in and around Bardia National Park (Nepal) 

Jasper Griffioen, Kshitiz Gautam, Indushree Banerjee, Jitse Bijlmakers, Gijs Vellekoop, Astrid Blom, Maurits Ertsen, Thom Bogaard, Ajit Tumbahangphe, Rachana Shah, and Naresh Subedi

It is increasingly realised that hydrological conditions are not only an abiotic factor for plant communities but also for animals on land including megafauna. Acknowledging the hydrological conditions is of major importance as anthropogenic activities as well as natural processes may change these conditions. Here, we investigate the hydrological conditions and their changes that directly affect terrestrial wildlife in Bardia National Park and the people that live adjacent to this nature reserve. Bardia NP is situated in the flat Terai Arc Landscape at the foot of the Himalayas and hosts the One-Horned Rhinoceros, the Bengal Tiger and the Asian Elephant amongst others.
Bardia NP is bordered in the west by the Geruwa branch of the Karnali River, which is draining the Himalayas in Western Nepal and one of the major tributaries of the Ganges River. Extensive floodplains are associated with the Geruwa branch. High densities of rhinoceros and tigers have been found here thanks to the existing natural water pools as drinking water and cooling facility, dense grassland-forest mosaics providing forage for the rhinoceros and the deer (being prey for the tigers) and also shelter for the tigers. Flow in the Geruwa branch has gradually declined since the intense, double-peaked 2009 Monsoon, which deposited very coarse sediment (boulders) over the Geruwa’s upstream end, contributing to the gradually reducing flow since. The Geruwa branch has been drying up since that time. This has two major implications for wildlife and also human-wildlife conflicts. First, about half of the rhinoceros population has moved to the Indian nature reserve further south in recent years assumed to do so in search for water pools. Second, the Geruwa branch has become a less vivid river for which it is easier for wildlife to cross during wet periods. Strikingly, this area has also been most vulnerable for human – wildlife conflicts in recent years (Paudel et al., 2024, Ecology and Evolution, 2024; 14:e70395).
Another hydrological condition is posed by the artificial water holes at Bardia NP. There are c. 180 artificial water holes around the natore reserve that are essential for drinking water to wildlife. Not all of them are permanent and several rely on groundwater pumping using solar energy. The migration behaviour of the tigers is influenced by their presence as indicated by agent-based modelling of tiger behaviour, and supported by field observations (Thapa et al., Species 2023; 24: e91s1619).
Finally, small irrigation canals are present in the rural area between Bardia NP and the Nepalese – Indian border. It is currently hypothesized that maintenance activities to reduce leakage of these canals have also diminished groundwater recharge. Upon consequence, the groundwater table may have dropped along these canals to depths that are outside the pumping range of hand pumps. These hand pumps are the main drinking water supply for the local communities and the impression is that there is an increasing trend for hand pumps to run dry. This should be further investigated by interviews and hydrological monitoring.

How to cite: Griffioen, J., Gautam, K., Banerjee, I., Bijlmakers, J., Vellekoop, G., Blom, A., Ertsen, M., Bogaard, T., Tumbahangphe, A., Shah, R., and Subedi, N.: Hydrological conditions that directly impact terrestrial wildlife and people in and around Bardia National Park (Nepal), EGU General Assembly 2026, Vienna, Austria, 3–8 May 2026, EGU26-8369, https://doi.org/10.5194/egusphere-egu26-8369, 2026.

The Inner Mongolia Plateau is a significant implementation area of the Three-North Shelter Forest Program in China and a critical zone for climate, hydrology, and ecology. The current pattern of artificial forest and grassland vegetation construction based on precipitation has overlooked the soil water and groundwater carrying capacity. Balancing the effective and sustainable supply capacity of water resources and maintaining the ecological stability of vegetation is a challenge in the governance of desertified and degraded land. This study developed an integrated framework to analyze the spatiotemporal matching degree between vegetation patterns and blue and green water resources, and to evaluate the relationship between vegetation coverage changes and water sources, water balance, and hydrological thresholds. The results show that the green water resource carrying capacity in the Three-North Shelter Forest Program implementation area of the Inner Mongolia Plateau has been underestimated. In contrast, the blue water resource carrying capacity has been overestimated. The water resource demand for forest and grassland vegetation construction is approximately 470 ± 5 million cubic meters, while the available blue water resource is only 178 ± 7 million cubic meters. The areas with increased vegetation coverage are mainly concentrated in basins where blue water resources are declining, and the areas with decreasing groundwater levels are increasing. Increasing vegetation coverage by consuming groundwater for irrigation is not a sustainable path. Under the same precipitation conditions, the spatio-temporal matching degree between vegetation patterns and blue and green water varies significantly. In areas where precipitation is converted into green water resources, vegetation coverage is relatively low, with NDVI values ranging from 0.23 to 0.41; however, the stability of the vegetation ecosystem is relatively strong. In areas where precipitation is converted into blue water resources, the vegetation coverage and its interannual variation trend tend to be stable only when the groundwater depth is between 3 and 12 meters. The research results can provide a scientific basis for ecological restoration and sustainable utilization of water resources in the critical zone of climate-hydrology-ecology.

How to cite: Liao, Z. and Jin, J.: Evaluation of the Spatio-temporal Matching between the Forest and Grassland Vegetation Pattern and Blue-green Water Resources in the Inner Mongolia Plateau, EGU General Assembly 2026, Vienna, Austria, 3–8 May 2026, EGU26-8448, https://doi.org/10.5194/egusphere-egu26-8448, 2026.

EGU26-8809 | ECS | Posters on site | HS10.1

Energetic and behavioural metrics for evaluating multi-slot fishway performance 

Kumar Daksh, Gopi Chand Malasani, Venu Chandra, and Castro-Santos Theodore

Fishways are structures built across dams to restore river connectivity and allow fish to pass through. Their effectiveness depends strongly on fish swimming behaviour and interaction with the flow hydrodynamics within the fishway. However, most fish-passage efficiency is still measured by counting the number of fish that successfully pass the structure. This metric alone does not capture the behavioural difficulty or the energetic cost experienced by individual fish. Therefore, in this study, we investigated the effort required for fish to pass a multi-slot fishway (MSF) using fish-tracking experiments. Ten Labeo rohita (rohu) were tested in a multi-slot fishway operated at two discharges (15 and 25 L/s). Individual fish trajectories were used to quantify passage success, the number of attempts, and swimming speed. Passage efficiency was similar at both discharges; however, the effort required to pass through the fishway differed. Fish at 15 L/s made more repeated approaches before passing, whereas fish at 25 L/s typically passed in fewer attempts. To quantify energetic cost, we calculated an effort index based on the swimming speed, representing the mechanical power used during passage. This index was higher at 15 L/s, indicating greater energy use due to repeated searching and failed approaches. Fish trajectory showed that fish at lower discharge spent more time in low-velocity and recirculating flow regions, while higher discharge produced a clearer attraction flow that guided fish directly to the slot. This study introduces a behavioural and energetic metric that complements traditional passage efficiency and provides a more informative measure of fishway performance. These results suggest an important role for hydraulic conditions in promoting guidance and movement, and highlight the importance of including behavioural and energetic considerations when evaluating passage performance.

Keywords: Fish passage, Fish behaviour, multi-slot fishway, swimming energetics, river connectivity

How to cite: Daksh, K., Malasani, G. C., Chandra, V., and Theodore, C.-S.: Energetic and behavioural metrics for evaluating multi-slot fishway performance, EGU General Assembly 2026, Vienna, Austria, 3–8 May 2026, EGU26-8809, https://doi.org/10.5194/egusphere-egu26-8809, 2026.

EGU26-8839 | ECS | Posters on site | HS10.1

Contributions of different throughfall types to the soil moisture responses under the trees 

Mark Bryan Alivio, Mojca Šraj, and Nejc Bezak

Throughfall represents the primary pathway by which rainfall reaches the ground beneath any vegetation canopies through free throughfall (FR), splash throughfall (SP), and canopy drip (CD). This partitioning of throughfall fundamentally influences subsurface hydrological processes, particularly soil moisture responses under trees. This study examines the contributions of FR, SP, and CD to soil moisture responses under the birch (Betula pendula Roth.) and pine (Pinus nigra Arnold) trees. To quantify the relative proportions of FR, SP, and CD under each tree, simultaneous drop size data of gross rainfall and throughfall were measured using an OTT Parsivel disdrometer. The volumetric soil water content (VWC) under both trees was monitored using TEROS 10 sensors installed at three different depth profiles (16–20, 51–54, 74–76 cm). Findings demonstrate that a higher fraction of FR delivers unimpeded, rapid water inputs below the birch, which elicit faster upper soil moisture responses. Whereas, CD dominates throughfall volume under the pine, which provides a more gradual delivery of water inputs, resulting in a more delayed soil moisture response compared to birch. Statistical analysis further reveals a significant positive trend in Spearman correlation coefficients between throughfall types and lagged soil moisture at 16 cm depth under both trees. Correlations of SP and FR with soil moisture were consistently higher under the birch than the pine, suggesting more direct and rapid responses of VWC to these components beneath the birch. Under the pine, responses were more delayed, reflecting lower FR frequency due to higher interception and CD dominance in throughfall delivery. This implies the slower release of water from pine's needle-like foliage, resulting in a prolonged moisture response. Event-based analysis also shows that the increase in VWC under the birch corresponds more closely with periods of increased FR contribution. Although SP contributes to overall throughfall, the more direct, less diffuse nature of FR may be more effective in delivering water to the soil surface, triggering rapid soil moisture responses at 16 cm. Conversely, the VWC under the pine doesn't strongly correspond with peaks in FR or SP alone. Instead, gradual VWC increases at 16 cm correspond to sustained CD, punctuated by minor increments during concurrent FR and SP inputs. These findings elucidate how the different components of throughfall differentially drive event‑scale soil moisture responses beneath tree canopies, thus improving the understanding of small‑scale pathways by which canopy rainfall redistribution governs infiltration, storage, and percolation.


Acknowledgment: This work was supported by the P2-0180 research program through the Ph.D. grant to the first author, which is financially supported by the Slovenian Research and Innovation Agency (ARIS). Moreover, this study was also carried out within the scope of the ongoing research projects J6-4628, J2-4489, and N2-0313 supported by the ARIS and SpongeScapes project (Grant Agreement ID No. 101112738), which is supported by the European Union’s Horizon Europe research and innovation programme.

How to cite: Alivio, M. B., Šraj, M., and Bezak, N.: Contributions of different throughfall types to the soil moisture responses under the trees, EGU General Assembly 2026, Vienna, Austria, 3–8 May 2026, EGU26-8839, https://doi.org/10.5194/egusphere-egu26-8839, 2026.

EGU26-9193 | Posters on site | HS10.1

Multi-Sensor Assessment and Uncertainty Quantification of Integrated Hydrological Components in a Tropical Experimental Catchment. 

Aurelie Bironne, Zuzana Drillet, Amelie Chaput, Marius Floriancic, Valeriy Y. Ivanov, Seng Keat Ooi, Vladan Babovic, and Simone Fatichi

Comprehensive in-situ hydrological measurements in tropical environments face significant data challenges. Multi-sensor deployments often result in incomplete temporal coverage due to installations in phases, sensor malfunctions, and maintenance requirements. These data gaps, combined with sensor-specific calibration uncertainties and measurement noise, introduce substantial uncertainties that are rarely quantified, particularly in the tropics where such datasets are scarce.

Data quality control and uncertainty quantification become critical when integrating measurements from diverse sensor types that measure different areas and have different types of errors. Raw sensor data require cleaning protocols to identify and address outliers and systematic biases. Furthermore, translating single-point measurements into catchment-scale estimates introduces scaling challenges that add to the existing uncertainties of each sensor.

This study looks at these challenges using data from 2022–2025 in the Kent Ridge experimental catchment in Singapore characterized by different land types (grass, forest, built-up areas). Our integrated sensor network combines pressure transducers for surface water level (used to derive flow rates) and groundwater table monitoring, drainage lysimeters, plant physiological sensors (sap flow meters, dendrometers, leaf wetness sensors), multi-depth soil moisture monitoring, soil temperature sensors, PAR sensors (Photosynthetically Active Radiation), and weather data including rainfall, wind speed and direction, air temperature, vapor pressure deficit, and solar radiation.

We apply data cleaning procedures and employ different uncertainty quantification methods to interpret sensor-specific outputs and evaluate how data gaps affect the overall measurement uncertainty. Results quantify typical measurement errors in urban tropical catchment and demonstrate practical approaches for handling imperfect multi-sensor datasets in real world environments.

How to cite: Bironne, A., Drillet, Z., Chaput, A., Floriancic, M., Ivanov, V. Y., Ooi, S. K., Babovic, V., and Fatichi, S.: Multi-Sensor Assessment and Uncertainty Quantification of Integrated Hydrological Components in a Tropical Experimental Catchment., EGU General Assembly 2026, Vienna, Austria, 3–8 May 2026, EGU26-9193, https://doi.org/10.5194/egusphere-egu26-9193, 2026.

EGU26-9679 | Orals | HS10.1

Plant Hydrological Responses to Dust: A Case Study from a Citrus Orchard in Cyprus 

Marinos Eliades, Constantinos Panagiotou, Eleni Neofytou, and Stelios Neophytides

Dust influences plant hydrological functioning in several ways. Dust (or particulate matter) can block or reduce stomatal activity, which regulates gas exchange between the plant and the atmosphere, thereby affecting both transpiration and stomatal conductance. In addition, during dust events, the reduction in solar radiation reaching the plant surface directly influences transpiration rates.
This study aims to examine the effects of dust on plant hydrological responses through systematic monitoring of stomatal conductance and transpiration (using sap flow methods). Two neighbouring plots (east and west) of Citrus (Mandora) trees, located in the Fasouri area (Limassol, Cyprus), were selected for monitoring. In each plot, three representative trees were chosen. Sap flow sensors were installed on each tree, and soil moisture sensors were placed at different depths around the selected trees. Furthermore, weekly measurements of stomatal resistance were taken from six leaves per tree. At the east plot, additional stomatal resistance measurements were obtained from six extra leaves per tree after removing dust from their surface using a microfibre cloth. Meteorological conditions were recorded by a meteorological station within the farm, while particulate matter (PM) data were provided by an air quality station managed by the Department of Labour Inspection of Cyprus. The experiment began in April 2025 and is ongoing. 
Preliminary results show similar average stomatal resistance between untreated leaves in the east plot (311 s m⁻¹) and the west plot (303 s m⁻¹). However, treated (dust-free) leaves in the east plot exhibited 19% lower stomatal resistance (255 s m⁻¹) compared to untreated leaves in the same plot, indicating a clear effect of dust on stomatal functioning. Periods during which stomatal resistance was similar between treated and untreated leaves were observed following rainfall events, highlighting the importance of rainfall in maintaining healthy plant hydrological functioning.

How to cite: Eliades, M., Panagiotou, C., Neofytou, E., and Neophytides, S.: Plant Hydrological Responses to Dust: A Case Study from a Citrus Orchard in Cyprus, EGU General Assembly 2026, Vienna, Austria, 3–8 May 2026, EGU26-9679, https://doi.org/10.5194/egusphere-egu26-9679, 2026.

EGU26-10377 | ECS | Posters on site | HS10.1

Disentangling controls on drought stress in urban trees in a Central European city 

Ilhan Özgen-Xian, Vera Hörmann, Mohammad Shokrollahi, Gregor Rickert, Malkin Gerchow, Matthias Beyer, Sascha Iden, Nicolas Martin-StPaul, and Michael Strohbach

Highly urbanised areas are tough environments for trees, often compared to arid lands. Drought stress detection and prediction in urban trees is of utmost importance for the sustainable management of the urban forest. The high heterogeneity of the urban fabric presents a major challenge for identifying the hierarchy of controls on tree drought stress. In this contribution, we combine field observations of soil moisture and sap flow measurements with mechanistic plant hydraulic modelling to disentangle this hierarchy in the city of Braunschweig, Germany. We use a modified version of the plant hydraulic model SurEau-Ecos for inverse hydraulic trait estimation of different tree species at sites spanning a gradient of surface sealing. The investigated species are cypress oak (Quercus robur 'Fastigiata'), Turkish hazel (Corylus colurna), and littleleaf linden (Tilia cordata). Anthropogenic structures such as drainage pipes and other elements of the urban karst significantly affect both soil and plant water dynamics, driving high intra-species trait variation across sites. This suggests co-adaptation of tree hydraulic traits and micro-environmental conditions at the patch scale. Our results indicate that intra-species hydraulic trait plasticity and soil moisture availability are the main factors controlling drought stress in urban trees.

How to cite: Özgen-Xian, I., Hörmann, V., Shokrollahi, M., Rickert, G., Gerchow, M., Beyer, M., Iden, S., Martin-StPaul, N., and Strohbach, M.: Disentangling controls on drought stress in urban trees in a Central European city, EGU General Assembly 2026, Vienna, Austria, 3–8 May 2026, EGU26-10377, https://doi.org/10.5194/egusphere-egu26-10377, 2026.

Terrestrial ecosystem atmosphere exchanges are governed by soil plant hydraulic processes that link soil water availability to transpiration and surface energy fluxes. Physically based soil hydrology models that resolve vertical soil moisture and matric potential gradients using the Richards equation provide the most complete representation of these processes, but their computational cost and parameter demands limit their use in long-term and multi-site applications. As a result, simplified bucket-type soil moisture models remain widely employed despite their coarse treatment of vertical soil water dynamics. Here, we quantify the level of vertical soil hydrologic complexity required for bucket-based models to reproduce the key soil–plant hydraulic behavior of Richards equation models. Using a unified framework, we couple the Penman–Monteith formulation with (i) a single-bucket model, (ii) a hierarchy of multi-bucket configurations with increasing vertical resolution within a fixed soil column, and (iii) a Richards equation model discretized over the same depth. All configurations share a consistent big-leaf canopy representation and explicitly track soil, root, and leaf water potentials and their effects on transpiration and energy fluxes. Model performance is evaluated using soil moisture and latent heat flux observations from diverse AmeriFlux sites spanning grasslands, shrublands, croplands, and forests. We show that similar soil moisture states can produce markedly different transpiration responses due to differences in soil matric potential. The vertical resolution required for bucket models to emulate Richards-based behavior is strongly ecosystem dependent, reflecting contrasts in rooting depth and plant hydraulic strategies. Our results demonstrate that plant-informed, ecosystem-specific soil discretization provides a computationally efficient pathway to improve the representation of soil plant water coupling in land surface models.

How to cite: Sarkar, A. and Dutta, D.: Ecosystem controls on the vertical soil hydrologic complexity required to represent soil-plant-water interactions, EGU General Assembly 2026, Vienna, Austria, 3–8 May 2026, EGU26-10648, https://doi.org/10.5194/egusphere-egu26-10648, 2026.

EGU26-11700 | Posters on site | HS10.1

“From energy to water limitation: projecting carbon and water cycling in mediterranean beech forests under climate change” 

Daniela Dalmonech, Christian Massari, Alessandro Anav, Elia Vangi, Francesco Avanzi, and Alessio Collalti

European beech (Fagus sylvatica) is among the most ecologically and economically important tree species in Europe. Climate change impacts on beech forests are already measurable in large parts of its distribution range, with climate-driven growth decline expected across large areas in the near future. Many regions are anticipated to shift from energy- to water- limited functioning, altering in turn forest ecosystem functions. However, previous studies have mostly focused on dendrochronological analyses, while the behavior of beech forests under climate change must be understood as a coupled carbon-water problem, requiring integrated ecosystem scale approaches. This study aims to provide process-based understanding of how and to what extent the carbon and water cycles in beech forests will be affected in the coming decades, analyzing the impact of climate and atmospheric CO2 on the carbon use efficiency CUE, i.e. the ratio between net and gross primary productivity, and water use efficiency WUE, i.e. the ratio between gross primary productivity and evapotranspiration, as key-indicators of the ecosystem functioning. Therefore, we used a mechanistic, state-of-the-art forest ecosystem model, namely 3D-CMCC-FEM, to simulate carbon and water cycles in ~500 beech stands located across the Italian territory, from the pre-alpine zone to the southernmost region. The sites span thus broad latitudinal and altitudinal gradients, capturing diverse climatic conditions. Additionally, the selected forest stands show different structural characteristics resulting from varying site histories and legacy effects.

Model simulations are carried under current climate conditions and three climate change scenarios from downscaled CMIP6 climate projections, covering the years 2005-2100. Structural data to initialize the model in 2005 are built on measurement of key structural variables from the second Italian Forest Inventory. Taking advantage of in situ measurements and remote-sensing based observations, we evaluate and constrain the ecosystem model processes. We finally analyze how CUE and WUE trajectories covary across the climate space under different climate scenarios taking in to account the role of forest structure, aiming at identifying potential carbon-water trade-offs as forests face changing climatic conditions.

How to cite: Dalmonech, D., Massari, C., Anav, A., Vangi, E., Avanzi, F., and Collalti, A.: “From energy to water limitation: projecting carbon and water cycling in mediterranean beech forests under climate change”, EGU General Assembly 2026, Vienna, Austria, 3–8 May 2026, EGU26-11700, https://doi.org/10.5194/egusphere-egu26-11700, 2026.

EGU26-13149 | ECS | Orals | HS10.1

Relating flood characteristics to vegetation dynamics in the Geruwa floodplain in the Terai Arc Landscape, Nepal 

Kshitiz Gautam, Jitse Bijlmakers, Xiao Feng, Astrid Blom, and Thom Bogaard

Floods significantly influence land cover such as vegetation in a floodplain. Land cover changes with change in flood characteristics such as frequency, duration, extent, flow depth, and flow velocity. Riparian vegetation type, distribution, and patterns provide habitat for many species. The Geruwa River is a bifurcate of the Karnali River emerging out of the Himalayan foothills in the Terai Arc Landscape. The Geruwa River is part of the Bardiya National Park in western Nepal, which is one of the most important and biodiverse nature reserves in Nepal. Its channel-floodplain system provides, for example, habitat for endangered Gangetic dolphins (Platanista gangetica), bare riverbanks for crocodiles, and riverine grassland-forest mosaics for elephants and tigers. Since the intense monsoon season in 2009, the Geruwa discharge has reduced gradually, initiated by the deposition of coarse sediment over the upstream end of the branch during this monsoon season. The Geruwa branch, which used to be the dominant branch before 2009, now receives only about 20 percent of the Karnali river discharge during the peak flows and about 5 percent during low flows.

Understanding how changing flood characteristics influence the dynamics of floodplain vegetation can help us better manage this important wildlife habitat. Our objective is to quantify the relationship between flood characteristics and vegetation cover in the Geruwa floodplain. We fit a multinomial logistic regression model, where the response is land cover (Forest, Grassland, Agriculture, Bare sediment, and Water) class derived from remote sensing and predictors are flood characteristics derived from hydrodynamic simulations. Model performance is evaluated using spatially stratified cross-validation to reduce bias from spatial autocorrelation. The fitted model will be used to extrapolate vegetation cover under future flood regimes influenced by climate change or anthropogenic activity. To support this analysis, we compiled and constrained flood discharge and duration over the last 63 years. We have developed a two-dimensional flow model to simulate similar floods to derive spatially distributed flood characteristics. We extract vegetation cover over the last 15 years using remote sensing (after channel switch). Preliminary analysis indicates that the decreased flood discharge in Geruwa is followed by an increase in vegetation cover (grassland and forest) in general in the Geruwa floodplain after 2009. Reduced floods in future may increase the succession of grasslands into forests.

How to cite: Gautam, K., Bijlmakers, J., Feng, X., Blom, A., and Bogaard, T.: Relating flood characteristics to vegetation dynamics in the Geruwa floodplain in the Terai Arc Landscape, Nepal, EGU General Assembly 2026, Vienna, Austria, 3–8 May 2026, EGU26-13149, https://doi.org/10.5194/egusphere-egu26-13149, 2026.

EGU26-14319 | ECS | Orals | HS10.1

SERGHEI-SurEau: Coupling surface–subsurface hydrodynamics with plant hydraulics 

Gregor Rickert, Nicolas Martin-StPaul, Miquel de Cáceres, Mario Morales-Hernández, Daniel Caviedes-Voullième, and Ilhan Özgen-Xian

Accurately describing forest ecosystem responses to varying climatic conditions—particularly water availability—requires a robust representation of the soil–plant–atmosphere continuum. Recent advances have produced high-fidelity models for both surface–subsurface hydrology and plant hydraulics.  Although these model domains partially overlap in the processes they consider, their implementation is often inadequate compared with their counterparts. To address this limitation, we present a coupled version of two established models: the integrated surface–subsurface flow model SERGHEI-SWE-RE and the plant hydraulics model SurEau-Ecos.
SERGHEI-SWE-RE is a performance-portable, high-performance parallel computing model that solves the fully dynamic two-dimensional shallow-water equations for surface flow and the three-dimensional Richards equation for subsurface flow. SurEau-Ecos is a mechanistic, trait-based plant hydraulics model that provides a detailed physiological description of plant water status beyond stomatal closure up to the point of hydraulic failure. The core strengths of both models are coupled through a clean separation at the soil–root interface: SERGHEI-SWE-RE supplies spatially distributed soil water potential fields, while SurEau-Ecos provides the resulting root water uptake. Leveraging the high-performance computing capabilities of SERGHEI-SWE-RE, instances of SurEau-Ecos can be mapped to each node  of the surface mesh and the corresponding vertical soil column. This coupled model—spatially distributed and operating at high temporal resolution—captures hydrodynamic processes in complex geometries, such as lateral subsurface flow, exfiltration, ponding, and deep water reserves, while simultaneously enabling the assessment of forest ecosystem responses, such as drought stress and tree dieback.
We present a proof-of-concept version of the coupled model using a transect along an idealised vegetated hillslope, where lateral subsurface fluxes are a key process. The effects of subsurface flow concentration toward the valley on plant-available water are shown and the resulting duration over which trees can sustain drought conditions are analysed.

How to cite: Rickert, G., Martin-StPaul, N., de Cáceres, M., Morales-Hernández, M., Caviedes-Voullième, D., and Özgen-Xian, I.: SERGHEI-SurEau: Coupling surface–subsurface hydrodynamics with plant hydraulics, EGU General Assembly 2026, Vienna, Austria, 3–8 May 2026, EGU26-14319, https://doi.org/10.5194/egusphere-egu26-14319, 2026.

Quarrying causes extensive degradation of soils, vegetation, and ecosystems, and these effects are further exacerbated by severe weather events and climate change. Consequently, abandoned quarries are some of the most difficult environments to rehabilitate due to the loss of critical ecological functions. Soft engineering solutions, such as vetiver grass (Chrysopogon zizanioides), have been widely used to control erosion, however its potential for water uptake, and application for companion planting in a rehabilitation setting is yet to be explored. Existing literature suggests that vetiver will not only be highly resilient to the harsh environment in abandoned quarries, but it may also improve the hydraulic and microclimatological conditions to aid tree survival and reestablishment. Furthermore, rehabilitation of degraded lands through the extensive root networks of grasses also offers opportunities for enhanced carbon sequestration. 

This study aims to determine the ecohydrological potential of vetiver grass to improve the growth rate and survival of forest saplings in abandoned quarries at two study locations. Soil moisture probes were installed at depths of 10, 20, and 40 cm throughout hedgerows with and without vetiver of varying ages. Soil temperature, air temperature, relative humidity, and rainfall were recorded, and plant, soil, stream, and rainfall samples were collected for stable isotope analysis. Results show that show that vetiver significantly influenced soil moisture, and vapor pressure deficit (VPD) with effects varying by season and site (p <0.05; a = 0.05). While there was some improvement in soil chemical and physical properties within the shallow rooting zone (p <0.05; a = 0.05), there was no improvement to sapling survival at either site. Stable water isotope analyses show that saplings and Vetiver relied on the same shallow 0–20 cm water sources, indicating competition likely driven by limited rooting depth. Nonetheless, if integrated thoughtfully, vetiver can support biodiversity and increase rooting complexity, improving water and nutrient cycling.

These findings highlight vetiver’s capacity to modify microclimatic and shallow soil conditions but also reveal some constraints for its use as a companion species in early forest restoration. Future work should examine soil amendments or pre-rehabilitation treatments to enhance rooting depth and reduce competition before implementing vetiver-based interventions.

How to cite: Farrick, K. and Lee, V.: The ecohydrological potential of Vetiver Grass (Chrysopogon zizanioides) for Forest Rehabilitation in abandoned quarries, EGU General Assembly 2026, Vienna, Austria, 3–8 May 2026, EGU26-14854, https://doi.org/10.5194/egusphere-egu26-14854, 2026.

EGU26-15292 | ECS | Orals | HS10.1

A warmer, more CO2-rich climate amplifies hydrological disconnections within soil water 

Jesse Radolinski, Matevz Vremec, James Kirchner, Steffen Birk, Christiane Werner, Ansgar Kahmen, Nicolas Brüggemann, Christine Stumpp, Daniel Nelson, Markus Herndl, Andreas Schaumberge, Maud Tissink, Herbert Wachter, and Michael Bahn

Shallow subsurface soil water storage is conventionally depicted as a well-mixed reservoir whereby newly fallen precipitation displaces or mixes with existing storage en route to streams—linking transpiration and rootzone storage to streams. Contrary to this core mixing assumption, mounting evidence suggests separations can arise in vadose (unsaturated) zone pore space or flow paths, yet the mechanisms remain poorly constrained. Here, we discuss recent studies from a climate manipulation experiment which use isotopic tracer and numerical techniques to understand the ecohydrological impact of future climactic conditions (elevated atmospheric CO2 and air temperature) on soil water transit and cycling in a temperate grassland. Whereas soil water in this ecosystem typically remained well-mixed, sustained exposure to future climate triggered separations across pore space and between soil horizons—exacerbated by experimental drought. Further, under this future drought scenario the grassland conserved water by restricting evapotranspiration at lower atmospheric water demand than drought exposure in ambient climate. Our results suggest that future climatic conditions may amplify subsurface disconnections in soil water, constraining grassland water use and altering the ecohydrological trajectory of these ecosystems.

How to cite: Radolinski, J., Vremec, M., Kirchner, J., Birk, S., Werner, C., Kahmen, A., Brüggemann, N., Stumpp, C., Nelson, D., Herndl, M., Schaumberge, A., Tissink, M., Wachter, H., and Bahn, M.: A warmer, more CO2-rich climate amplifies hydrological disconnections within soil water, EGU General Assembly 2026, Vienna, Austria, 3–8 May 2026, EGU26-15292, https://doi.org/10.5194/egusphere-egu26-15292, 2026.

EGU26-15399 | Orals | HS10.1 | Highlight | Henry Darcy Medal Lecture

Ecohydrological Adaptation to Climate Change - from Gondwana to the Globe 

Sally Thompson

The south west corner of Australia holds a level of plant diversity unmatched outside tropical rainforests; fostered through millions of years of isolation and relative tectonic and climatic stability.  Across deep time, pressures of pollinator scarcity, severe nutrient limitation in an ancient, highly weathered Critical Zone, and fire disturbance have produced what might be the most specialised flora in the world.  Southwest Western Australia (SWWA) is also on the bleeding edge of climatic heating and drying, in a trend that has been apparent since the 1960s.  Water resources management in response to these trends has made the cities of SWWA global leaders in conservation and water technologies – but as the drying continues, groundwater recharge is dropping, phreatophytic plants are dying, and more severe summer heatwaves and droughts are impacting key ecosystems over huge areas.  In this Darcy Oration, I hope to introduce you to the often forgotten, but exceptional set of ecosystems, catchments and Critical Zones of SWWA, and ask how can ecohydrology as a discipline support meaningful adaptation to such climatic changes in this megabiodiverse, hyper-endemic area?  I will present a potential hierarchy of actions and research gaps to consider, and suggest that research in support of making decisions about where and how to adapt is a key challenge for our community.  Finally, I will spend a little time reflecting on my personal experiences as a caregiver to special needs children, and how those caregiving responsibilities impact a career in hydrological science.

How to cite: Thompson, S.: Ecohydrological Adaptation to Climate Change - from Gondwana to the Globe, EGU General Assembly 2026, Vienna, Austria, 3–8 May 2026, EGU26-15399, https://doi.org/10.5194/egusphere-egu26-15399, 2026.

In the western US, intensifying wildfire regimes imply that an increasing fraction of land will exist in a post-fire recovery state at any given time. While much prior work has focused on how forest fires can lead to temporarily suppressed evapotranspiration (ET), few studies have focused on how fire changes the water balance in the shrublands that dominate the arid interior of the western US. There, changes to the water balance are especially important because nearly all precipitation is lost to terrestrial ET, and thus reductions in ET may have especially large effects on streamflow and groundwater recharge. In this presentation, I will show results from a field study in which energy-balance stations in paired post-fire and control plots were used to estimate the relative reduction in ET in the decade following shrubland wildfires; mid-summer ET was often >30% lower in the post-fire plots. I will also show results from a similar analysis at a much greater spatial extent that uses ET values estimated from products developed through NASA’s ECOSTRESS mission; again, these data show reduced ET persisting after wildfires for decades. I will use these findings to discuss the large-scale implications of wildfire on the water balance of the Great Basin region of the western US.

How to cite: Allen, S. T.: Effects of Wildfire on the Water Balance of the Arid Shrublands in the Western United States, EGU General Assembly 2026, Vienna, Austria, 3–8 May 2026, EGU26-15797, https://doi.org/10.5194/egusphere-egu26-15797, 2026.

EGU26-16660 | ECS | Orals | HS10.1

Riverine ecosystem metabolism drivers and functioning across environmental and anthropogenic gradients 

Giulia Grandi, Oriana Llanos Paez, Lukas Hallberg, Jingyi Hou, Matteo Tolosano, Nicola Deluigi, and Tom I. Battin

River and stream networks receive and transport carbon from terrestrial ecosystems to inland waters and ultimately to the oceans, while hosting a suite of biogeochemical processes that result in carbon dioxide (CO2) emissions to the atmosphere. These fluxes are shaped by riverine ecosystem metabolism, defined by the interplay between gross primary production (GPP) and ecosystem respiration (ER). Advances in dissolved oxygen (O2) sensor technology have enabled widespread estimation of daily GPP and ER from high‑frequency O2 dynamics. However, the robust quantification of these metabolic rates remains challenging. In physically dominated, high‑energy environments such as steep channels and step‑riffle systems, continuous gas exchange between the water surface and the atmosphere complicates the estimation of gas transfer velocities and, consequently, metabolism. In addition, GPP is highly sensitive to short‑term variability in light availability, turbidity, and nutrient supply, factors that can fluctuate rapidly in response to hydrological disturbances and land use-land cover change.

Understanding how fluvial metabolism varies across environmental contexts and responds to hydrological and biogeochemical stressors is essential for assessing ecosystem functioning, resilience, and vulnerability. In this study, conducted within the BREATHE Water4All and C-NET projects, we monitored high-frequency O₂ dynamics across three sharply contrasting fluvial environments: (i) a high-mountain glacier-fed stream network, (ii) an agricultural drainage ditch, and (iii) a partially restored urban river. Continuous O2 measurements were combined with ancillary variables, including CO2, water temperature, solar radiation, water level, electrical conductivity, turbidity, nutrients, and colored dissolved organic matter (CDOM). This multi-sensor approach enabled detailed characterization of diel metabolic patterns and identification of the dominant physical and biogeochemical drivers shaping them. The selected case studies span strong gradients in hydrology, geomorphology, nutrient availability, and anthropogenic influence, providing a unique framework to compare site-specific metabolic regimes and ecosystem functioning. Preliminary results indicate marked differences in daily GPP and ER estimates across systems, reflecting the combined effects of nutrient availability, light limitation, hydrologic disturbance, and physically driven gas exchange. 

How to cite: Grandi, G., Llanos Paez, O., Hallberg, L., Hou, J., Tolosano, M., Deluigi, N., and Battin, T. I.: Riverine ecosystem metabolism drivers and functioning across environmental and anthropogenic gradients, EGU General Assembly 2026, Vienna, Austria, 3–8 May 2026, EGU26-16660, https://doi.org/10.5194/egusphere-egu26-16660, 2026.

EGU26-16978 | ECS | Posters on site | HS10.1

Hydropower 2.0 Powering green transition in a more sustainable way: Project RE-HYDRO 

Epari Ritesh Patro, Jani Ahonen, Christine Kaggwa Nakigudde, Marco Cunico, Patrik Andreasson, Gunnar Hellström, Anders Andersson, Anu Soikkeli, Ali Torabi Haghighi, and Navinder J. Singh

Modernizing hydropower is increasingly recognized as a key strategy for restoring the biodiversity of rivers. However, factors beyond ecological benefits often influence decisions regarding hydropower operations and management. Historically, the needs of local populations and environmental considerations have not been prioritized. Modernising hydropower is inherently transdisciplinary, requiring a balance of multiple objectives. In RE-HYDRO project, we developed an integrated framework to address these complex challenges for case studies in Finland and Sweden. This work involves not only hydrological and hydraulic modelling of regulated rivers but also a) assessing the faunistic biodiversity in the riparian zones affected by hydropower and b) examining the effects of hydropower on local identity and the cultural environment. This comprehensive approach would allow us to evaluate the biodiversity dynamics and explore the potential for habitat restoration in these regulated rivers while updating the hydropower management with climate change.

How to cite: Patro, E. R., Ahonen, J., Kaggwa Nakigudde, C., Cunico, M., Andreasson, P., Hellström, G., Andersson, A., Soikkeli, A., Haghighi, A. T., and Singh, N. J.: Hydropower 2.0 Powering green transition in a more sustainable way: Project RE-HYDRO, EGU General Assembly 2026, Vienna, Austria, 3–8 May 2026, EGU26-16978, https://doi.org/10.5194/egusphere-egu26-16978, 2026.

EGU26-19593 | ECS | Orals | HS10.1

High resolution projections of shifts in freshwater biodiversity habitats under global climate change  

Jennie C. Steyaert, Jaime Marquez, Sami Domisch, Michael Brechbühler, Marc F. P. Bierkens, and Niko Wanders

Changes in streamflow regimes and water temperature impact water quality and freshwater biodiversity. Yet the impact of these changes on aquatic biodiversity, especially at fine spatial scale, may vary regionally and often remains unknown. Climate-change impact assessments on freshwater biodiversity are typically done at coarse spatial resolution (>5km), due to a lack of fine scale hydrological information. In this work, we link a hyper resolution global hydrological model (PCR-GLOBWB, 1km) with a species distribution model (SDM). We use this to assess the suitability of current and potential future freshwater habitats for fish species, in the Rhine Basin as a case study. In addition to the high resolution streamflow simulations, we also provide 1km water temperature estimates derived from the  DynQual water temperature model.

The results demonstrate that increases in anthropogenic water demands under SSP3 decrease habitat suitability across the entire Rhine basin. We also find that low flows are a higher predictor of freshwater fish suitability compared to water temperatures which is potentially due to the smaller temperature changes in the Rhine basin. Additionally, migratory fish and fish with a larger range of suitable habitats do not see large decreases in their suitabilities due to the larger range of acceptable locations. This work provides the first framework for hyper resolution climate change impact assessments that could be implemented globally and bridges hydrological and biodiversity modelling.

How to cite: Steyaert, J. C., Marquez, J., Domisch, S., Brechbühler, M., Bierkens, M. F. P., and Wanders, N.: High resolution projections of shifts in freshwater biodiversity habitats under global climate change , EGU General Assembly 2026, Vienna, Austria, 3–8 May 2026, EGU26-19593, https://doi.org/10.5194/egusphere-egu26-19593, 2026.

EGU26-20691 | ECS | Posters on site | HS10.1

Linking river discharge and macroinvertebrate communities under climate change in a glacier-fed stream 

Alicia Madleen Knauft, Gísli Már Gíslason, Martin Reiss, Jón S. Ólafsson, Iris Hansen, Ragnhildur Þ. Magnúsdóttir, and Peter Chifflard

Glacier retreat driven by climate change is expected to alter hydrological and chemical conditions in glacier-fed streams, with consequences for macroinvertebrate community structure and function. To assess long-term community responses to changing runoff regimes, we revisited the glacier-fed Vestari-Jökulsá River in Iceland, originally studied in 1996/97, and compared historical data with new measurements collected in 2022.

Macroinvertebrate species richness, Shannon diversity, and evenness declined at several sites, while total organism density remained relatively stable. Analyses of community composition based on Bray-Curtis dissimilarities revealed higher similarity among sites in 2022 compared to 1996/97, suggesting increasing homogenization of assemblages with glacial retreat. As runoff regime has been identified as a key driver of future community change, we examine hydrological dynamics in the catchment in relation to observed ecological changes and predicted runoff scenarios. Ongoing analyses focus on trends in annual discharge and seasonal dynamics, including the timing of melt onset and potential changes in winter and summer runoff.

By integrating long-term ecological, hydrological, and chemical perspectives, this study enhances understanding of climate-driven changes in glacier-fed stream ecosystems.

How to cite: Knauft, A. M., Gíslason, G. M., Reiss, M., Ólafsson, J. S., Hansen, I., Magnúsdóttir, R. Þ., and Chifflard, P.: Linking river discharge and macroinvertebrate communities under climate change in a glacier-fed stream, EGU General Assembly 2026, Vienna, Austria, 3–8 May 2026, EGU26-20691, https://doi.org/10.5194/egusphere-egu26-20691, 2026.

Despite the growing recognition that ecohydrological processes underpin water-related ecosystem services, conceptual integration between ecology, hydrology, and landscape ecology remains fragmented. The study analyzed 1,855 articles published between 1974 and 2020 in Scopus, using co-occurrence networks, thematic evolution mapping, and multiple correspondence analysis to uncover knowledge gaps and disciplinary boundaries in ecohydrology. Results revealed that while publications grew at 12.16% annually—with marked increases following UNESCO's formalization of ecohydrology (1995) and the adoption of the SDGs (2015)—conceptual distance persists between "ecosystem services" and specific hydrological variables. Surface runoff was consistently linked to land-use changes, while evapotranspiration, a major component of the hydrological cycle, was underrepresented.

To address these gaps, a multiscale ecohydrological conceptual model is proposed, positioning evapotranspiration as a central integrating variable connecting ecosystem structure with water service provision. The model identifies four structural control variables—leaf area index, root depth, canopy structure, and soil properties—as modifiable attributes influencing the biophysical limits within which ecohydrological processes operate. The model also acknowledges scale dependence: microscale processes are influenced by species-soil-water interactions, mesoscale dynamics are determined by hydrological connectivity, and macroscale responses involve atmospheric moisture recycling. This framework complements integrated water resource management by incorporating ecohydrological variables as ecosystem service indicators, highlighting nonlinear thresholds of change, and emphasizing feedbacks between anthropogenic landscape modifications and hydrological cycle alterations.

How to cite: Zamora, D. and Donado, L. D.: An Integrative Ecohydrological Framework Linking Variables and Water Ecosystem Services Derived from Bibliometric Analysis, EGU General Assembly 2026, Vienna, Austria, 3–8 May 2026, EGU26-21853, https://doi.org/10.5194/egusphere-egu26-21853, 2026.

EGU26-2090 | ECS | Orals | HS10.2

Effects of litter layer water retention along an elevation gradient 

Marius Floriancic, Yaning Chen, and Peter Molnar

Forest floor litter layers can temporarily store and evaporate substantial fractions of annual precipitation, thereby reducing the amount of water that infiltrates into soils and becomes available for plant uptake. Yet litter retention and evaporation are commonly omitted from forest water-balance assessments. Here we synthesize evidence for these litter-layer effects across elevation gradients and contrasting climates using two complementary datasets: (i) long-term observations from Waldlabor Zürich and (ii) a pan-Alpine sampling campaign (>400 plots) combined with laboratory measurements of litter water storage and drying dynamics. Climate-chamber drying experiments indicated mean litter water retention times of ~6 days for broadleaf litter and ~10 days for needle litter, consistent with field observations across the European Alps. We used these experiments to parameterize sensitivity tests (half-life storage decay) and to drive a simple daily bucket model. Across the Alps, the litter layer temporarily stored roughly ~10-20% of annual precipitation, while litter evaporation accounted for ~15-25% of annual evapotranspiration, with magnitudes varying by elevation and litter type. Together, these results show that the litter layer is a small but hydrologically relevant reservoir that shifts the timing and partitioning of water fluxes in mountain forests.

How to cite: Floriancic, M., Chen, Y., and Molnar, P.: Effects of litter layer water retention along an elevation gradient, EGU General Assembly 2026, Vienna, Austria, 3–8 May 2026, EGU26-2090, https://doi.org/10.5194/egusphere-egu26-2090, 2026.

EGU26-4064 | ECS | Orals | HS10.2

Modelling fine root distribution and its role to increase tree resilience to drought in two Mediterranean forests 

Lucas Mondon, Nicolas Martin-StPaul, Gregor Rickert, Arsène Druel, Ilhan Özgen, Hervé Cochard, Quentin Chaffaut, Marc Pessel, Damien Jougnot, and Simon Carrière

The role and importance of deep roots for tree survival during drought is an intuitive expectation. Numerous studies have examined root distribution, rooting depth, and the use of deep water resources. However, the impact of deep roots systems on the amount of deep water uptake and their contribution to tree survival during drought is still understudied.

In this study, we first measured predawn leaf water potential and the isotopic signatures of sap water and potential water sources. These isotopic measurements allowed us to estimate the proportion of deep water contributing to the total volume of water transpired by trees. Measurements were conducted on three tree species (Quercus ilex, Fagus Sylvatica and Abies alba) over two summer seasons (2014 and 2015) at two study sites in Mediterranean regions of France. We then used the plant hydraulic model SurEau-Ecos to infer the mobilisation of deep water reserves by trees, fitting the model to observed leaf water potential . We used ecophysiological trait databases for initial model parameterisation. Finally, we adjusted a single parameter defining root distribution to fit the model to the observations.

We obtained a root distribution that satisfactorily reproduced both leaf water potential and deep water use. This allowed us to quantify temporal variations in deep water use for each species. During periods of water stress, trees uptaked 102 mm of water from the deep soil reservoir. Without this resource, trees would likely have experienced hydraulic failure. Over the study period, deep water contributed on average between 8.5 and 37 % of total tree water use, depending on species.

To further investigate the role of fine root distribution in survival under extreme drought, we analysed the model sensitivity to the root development parameter and to deep-water reserves in terms of hydraulic failure risk. These analyses showed that survival time could vary by up to 100 days depending on the proportion of the root system located in deep soil. We also identified an optimal degree of deep root development that maximised tree survival. Overall, the methodology we developed will help better quantify the role of deep water uptake. They appear essential for both groundwater recharge assessments and vegetation drought response analyses.

How to cite: Mondon, L., Martin-StPaul, N., Rickert, G., Druel, A., Özgen, I., Cochard, H., Chaffaut, Q., Pessel, M., Jougnot, D., and Carrière, S.: Modelling fine root distribution and its role to increase tree resilience to drought in two Mediterranean forests, EGU General Assembly 2026, Vienna, Austria, 3–8 May 2026, EGU26-4064, https://doi.org/10.5194/egusphere-egu26-4064, 2026.

Assessing rainfall interception (IR) is a critical yet uncertain aspect in hydrological cycle, particularly the quantification of relative contributions from leaves and woody components (e.g., branches, stems, and trunks) to IR. Nevertheless, the role of woody components in IR estimation remains largely unexplored and thereby has been constantly overlooked. This study addressed this challenge and refined the widely-used Gash model to distinguish woody interception (IW) from leaf interception (IL). We incorporated the spatial variability of vegetation traits alongside satellite data in 2019 into the refined model, and spanned China’s major forest types. The refined model showed a strong agreement with field observations in estimating IR (r=0.83, p<0.01) and the fraction of rainfall interception to precipitation (IR/P) (r=0.77, p<0.01). The average IR was 112.4 ± 32.1 mm (with IR/P of 14.7 ± 8.2%) in 2019, of which IL accounted for 77.9% and IW contributed the rest 22.1%. Among different forest types, IW/IR exhibited the highest values in deciduous needle-leaf forests (DNF, mean: 51.9%) but lowest values in evergreen broad-leaf (EBF, mean: 14.3%). In addition, IW/IR was larger in the non-growing season than that of growing season in some forest types, such as exceeding 60% in winter for DNF, indicating that more rainwater was intercepted by woody components than by leaves. Our study underscores the substantial role of woody components in IR,particularly in needle-leaf forests, that are prevalent globally, a finding that can provide novel methods and valuable parameters for global hydrological models to improve the accuracy of model predictions.

How to cite: Jiang, Z., He, W., and Chen, Z.: Substantial Contribution of Woody Components to Rainfall Interception in Chinese Forests: Insights from a Refined Analytical Model, EGU General Assembly 2026, Vienna, Austria, 3–8 May 2026, EGU26-4246, https://doi.org/10.5194/egusphere-egu26-4246, 2026.

EGU26-5106 | ECS | Posters on site | HS10.2

Linking sap flow dynamics of birch tree to atmospheric and rainfall conditions 

Lana Radulović, Katarina Zabret, and Mojca Šraj

Sap flow is one of the best direct indicators of transpiration at the tree level, which is a major component of the water balance. Understanding daily sap flow variability is essential for interpreting tree water consumption and its response to environmental conditions. This study aimed to classify days according to the behaviour of daily sap flow and determine whether the resulting categories differ in terms of meteorological and precipitation conditions. We used sap flow measurements from a birch tree located in a small urban park in Ljubljana, Slovenia. Along with meteorological variables such as solar radiation (SR), air temperature (T), vapor pressure deficit (VPD), wind speed (WS), and amount of precipitation, we analyzed the shape of daily sap flow curves for the fully leafed birch tree in 2025. For each day, we smoothed the daily sap flow curves and analyzed them using principal component analysis (PCA) and obtained daily PC1-PC3 values to compactly describe the curve shape. Based on these values, we grouped the curves and selected the number of clusters using information criteria (BIC). We tested for differences between clusters using nonparametric tests and interpreted the clusters in terms of meteorological conditions and precipitation amount. Five characteristic clusters of daily sap flow curves were defined, differing in curve shape, peak time and magnitude, and midday depression intensity. The clusters differed most significantly in terms of SR, while cluster 4 stood out from the others in terms of precipitation. This is also reflected in the greater variability of daily curve shapes within cluster 4. Despite the known positive correlation between VPD and sap flow, the days in cluster 5 showed a weak negative correlation, which is consistent with their pronounced midday depression. In contrast, cluster 1, which is characterized by the lowest values of SR, T, and VPD, exhibits the flattest average daily sap flow curve and is the only cluster without a pronounced midday depression. This is consistent with the known physiological regulation of transpiration at higher VPD values, when plants limit water flow by closing their stomata.

Acknowledgment: This work was supported by the research program P2-0180 through the Ph.D. grant of the first author that is financed by the Slovenian Research and Innovation Agency (ARIS). It is also part of the ongoing research project entitled “Evaluation of the impact of rainfall interception on soil erosion” supported by the Slovenian Research and Innovation Agency (J2-4489) and the Austrian Science Fund (FWF) I 6254-N.

How to cite: Radulović, L., Zabret, K., and Šraj, M.: Linking sap flow dynamics of birch tree to atmospheric and rainfall conditions, EGU General Assembly 2026, Vienna, Austria, 3–8 May 2026, EGU26-5106, https://doi.org/10.5194/egusphere-egu26-5106, 2026.

EGU26-5141 | Posters on site | HS10.2

Contrasting Forest Structure Shapes Rainfall Interception in a Mediterranean Mountain Catchment 

Silvia Barbetta, Marco Dionigi, Paolo Filippucci, Domenico De Santis, Daniele Penna, Matteo Verdone, Marco Donnini, Diego G. Miralles, Thomas Holmes, and Christian Massari

Interception by forest canopies constitutes an important control on ecosystem water fluxes, with direct effects on soil moisture and water availability. In Mediterranean environments, high variability in precipitation across space and time complicates the estimation of interception and net precipitation. Field-based observations across contrasting forest canopies are therefore required to disentangle species-specific interception processes.

Precipitation partitioning within the forest canopy was analyzed using throughfall and stemflow observations in Quercus robur (oak) and Fagus sylvatica (European beech) stands over nearly three years in a 44 km² mountainous catchment in central Italy. Four plots were monitored during more than 200 precipitation events, capturing seasonal and species-specific variability.

Observed interception losses differed between species at closely located plots under comparable rainfall conditions, reflecting the combined effects of canopy structure and local meteorological conditions. Relative interception, defined as the fraction of gross precipitation evaporated before reaching the forest floor, averaged about 39% for oak and 31% for beech during moderate rainfall events. Although beech stands exhibited higher leaf area index (LAI) and canopy cover, oak consistently showed greater interception during both the growing (42% vs. 33%) and dormant (33% vs. 26%) seasons, highlighting that canopy architecture, rather than LAI alone, governs interception dynamics.

We tested a LAI-based Gash model against observed interception loss. The model underestimated the flux, indicating that simplified descriptors, such as LAI, do not adequately represent species-specific canopy architecture. This suggests that accurate representation of canopy traits, including branching patterns, leaf distribution, and canopy roughness, is essential for reliable predictions of intercepted precipitation, particularly in heterogeneous Mediterranean forests.

Overall, this study demonstrates that interception in broadleaf Mediterranean forests is influenced by a complex interaction between canopy structure and local environmental conditions. Incorporating these factors into interception models is essential to resolve precipitation partitioning and to evaluate ecohydrological responses to climate variability and forest management. The findings further highlight the relevance of species-specific field data to improve model parameterizations and hydrological predictions in ungauged forest ecosystems with contrasting canopy structures. 

Keywords: canopy interception, precipitation partitioning, Mediterranean forest, throughfall, stemflow, forest canopy structure, interception modelling.

How to cite: Barbetta, S., Dionigi, M., Filippucci, P., De Santis, D., Penna, D., Verdone, M., Donnini, M., Miralles, D. G., Holmes, T., and Massari, C.: Contrasting Forest Structure Shapes Rainfall Interception in a Mediterranean Mountain Catchment, EGU General Assembly 2026, Vienna, Austria, 3–8 May 2026, EGU26-5141, https://doi.org/10.5194/egusphere-egu26-5141, 2026.

EGU26-8426 | Orals | HS10.2

Forest Structure Controls on Snowpack Dynamics in Two Contrasting Forest Ecosystems 

Salli Dymond, Haley Farwell, Mariel Jones, Joel Biederman, Xue Feng, Jake Kurzweil, Stephen Sebestyen, and Andrew Sanchez Meador

Forest canopies exert strong and complex controls over snow accumulation and melt dynamics, particularly in snow-dominated environments. Given the importance of snow for recharging soil and groundwater and for runoff generation, furthering the process-based understanding of the interplay between forests and snowpack is critical across a range of snow-dominated ecosystems. Here, we compare results from two complementary field-based studies at sites with contrasting forest and snow dynamics – the Marcell Experimental Forest in northern Minnesota, USA, and the Chicken Creek Snowtography Study in southern Colorado, USA. We found that forest canopies exerted significant control over snow depth and SWE at the two sites, but with differing directionality. Snow depth was measured at both field sites in water years 2023 and 2024, while measurements at Chicken Creek, which began in water year 2022, also included snow-water equivalent. Forest structure metrics varied for the sites, but included quantifications for typical two-dimensional measurements (e.g., basal area, tree height, leaf-area-index), and three-dimensional complexity (e.g., canopy overlap, structural diversity, canopy light attenuation, etc.). Results from both studies demonstrate that 3-D canopy metrics are better predictors of snow depth and SWE than 2-D metrics, which are typically measured by field practitioners. At the ponderosa pine-dominated Chicken Creek site, which typically has a warmer and ephemeral snowpack, snow depth and SWE decreased as the canopy vertical complexity increased. At the sub-boreal Marcell site, which is colder and has a seasonal snowpack, peak snow depth increased with increasing canopy overlap. Our results demonstrate the importance of incorporating canopy metrics over basal areas in understanding forest-snow dynamics. The contrasting directionality in canopy complexity over snow metrics further shows that forest-snow interactions vary across ecosystems and climate gradients. Field-based studies across a range of forests, elevations, topographies, and latitudes are needed to inform forest management practices to preserve snowpack water storage in snow-dominated ecosystems.

How to cite: Dymond, S., Farwell, H., Jones, M., Biederman, J., Feng, X., Kurzweil, J., Sebestyen, S., and Sanchez Meador, A.: Forest Structure Controls on Snowpack Dynamics in Two Contrasting Forest Ecosystems, EGU General Assembly 2026, Vienna, Austria, 3–8 May 2026, EGU26-8426, https://doi.org/10.5194/egusphere-egu26-8426, 2026.

EGU26-8587 | ECS | Orals | HS10.2

Ecohydrology of a Freshwater Coastal Forest Under Fluctuating Lake Levels 

Eric Kastelic and Steven P. Loheide II

Coastal forests of the North American Great Lakes have long provided ecological, economic, and cultural resources. However, extensive logging and shoreline development have greatly reduced the number of well-preserved coastal forests, leaving ridge-and-swale complexes among the most intact examples remaining in the region. These freshwater coastal landscapes formed from ancient beaches, creating sandy, tree-covered ridges separated by low-lying interdunal swales that commonly support wetlands. Ridge-and-swale complexes serve as the transition between upland ecosystems and the Great Lakes along which interaction with groundwater directly controls vegetation composition and function. They are an excellent natural setting to study forest-groundwater interactions as variation in groundwater depth impacts water available to plants. In these systems, groundwater hydrology reflects the combined influence of upland derived regional groundwater flow, local hydrologic inputs (precipitation) and outputs (evapotranspiration), and variability in Great Lakes Water Levels (GLWL). As environmental conditions and GLWLs continue to shift the trajectory of these tightly coupled groundwater-ecosystems interaction remains uncertain.

The goal of this work is to document modern spatial and temporal variation in forest-groundwater interactions, establish the influence of depth to groundwater on historical tree growth, and map forest susceptibility to groundwater conditions in a ridge-and-swale complex at the Ridges Sanctuary in Bailey’s Harbor, WI (45.075163, -87.108379). To investigate modern forest water use and groundwater dynamics, we instrumented a ridge-and-swale complex situated along Lake Michigan with shallow groundwater wells. Over 18 months, analysis of daily fluctuations in groundwater revealed that evapotranspiration from groundwater differs in timing and magnitude between stands of trees. Throughout the ridge-and-swale complex groundwater levels respond differently throughout the year and especially during extended dry periods. This indicates a limit of tree water use based on depth to groundwater and differing influence of regional groundwater and GLWL sources. To investigate historical tree growth, we evaluated tree-ring metrics (basal area increment (BAI), ring widths, earlywood, and latewood) from Pinus strobes and Pinus resinosa to quantify tree growth variability across the ridge-and-swale complex. Chronologies for 120 trees were established with a majority spanning over 125 years from throughout the ridge-and-swale complex with limited trees documenting growth starting in the late 1700s. Comparison of BAI and relative elevation have revealed both tree species experience differing levels of anoxia and water stress based on position in the landscape and depth to groundwater, indicating that annual variability in groundwater is recorded in tree growth. To map future susceptibility to groundwater conditions, we used our established chronologies to decipher where trees showed resilience to the influence of GLWLs. Preliminary analyses suggest that stands situated in areas supported by regional groundwater flow have historically experienced optimal tree growth throughout the period of record. Conversely, the influence of GLWL supporting or hindering tree growth depends on position relative to the coast and the stage of Lake Michigan at the time. These findings not only shed light upon the previously unknown historical influence of GLWL on coastal ridge-and-swale ecosystems but help shape future management for coastal aquifers and forests.

How to cite: Kastelic, E. and Loheide II, S. P.: Ecohydrology of a Freshwater Coastal Forest Under Fluctuating Lake Levels, EGU General Assembly 2026, Vienna, Austria, 3–8 May 2026, EGU26-8587, https://doi.org/10.5194/egusphere-egu26-8587, 2026.

EGU26-8695 | Posters on site | HS10.2

Rainfall partitioning dynamics in xerophytic shrubs: Interplays between self-organization and meteorological drivers 

Chuan Yuan, Yinghao Gao, Yafeng Zhang, Yanting Hu, Li Guo, Zhiyun Jiang, Sheng Wang, and Cong Wang

Rainfall partitioning is a critical process shaping local hydrological cycles by governing canopy interception and subsequent soil water recharge. While canopy structure and meteorology are fundamental regulators, the role of plant self-organization and its interaction with meteorological drivers (non-precipitation variables in particular) remains underexplored. Here, this study investigated rainfall partitioning components, including the amount, intensity, efficiency, and temporal dynamics of throughfall and stemflow, in clumped versus scattered Vitex negundo shrubs in the Yangjuangou catchment of the Chinese Loess Plateau during the 2021–2022 rainy seasons. Despite comparable net precipitation (clumped: 83.5% vs. scattered: 84.2% of incident rains), divergent rainfall partitioning strategies emerged. Clumped V. negundo produced significantly higher stemflow (8.6% vs. 5.2%) with greater intensity, efficiency and favorable temporal dynamics, whereas scattered shrubs favored throughfall generation (79.0% vs. 74.9%). While rainfall amount remains the primary control, an integrated machine learning and variance decomposition analysis revealed that antecedent canopy wetness and wind speed thresholds (e.g., low wind vs. gusts) critically regulate partitioning efficiency and temporal dynamics. These findings advance the mechanistic understanding of the interplay between plant self-organization and hydrological processes, demonstrating how morphological adaptations in V. negundo optimize water harvesting in semi-arid ecosystems. Our results underscore the necessity of incorporating the dynamic interplay between plant structure (specifically, self-organized patterns) and meteorological factors (particularly non-precipitation variables) into ecohydrological models to improve predictions in water-limited regions.

How to cite: Yuan, C., Gao, Y., Zhang, Y., Hu, Y., Guo, L., Jiang, Z., Wang, S., and Wang, C.: Rainfall partitioning dynamics in xerophytic shrubs: Interplays between self-organization and meteorological drivers, EGU General Assembly 2026, Vienna, Austria, 3–8 May 2026, EGU26-8695, https://doi.org/10.5194/egusphere-egu26-8695, 2026.

EGU26-10872 | ECS | Orals | HS10.2

Climate-dependent coupling and decoupling between canopy height and root-zone water storage in global forests  

Maryam Khorami, Patrick Lane, Gary Sheridan, and Keirnan Fowler

Forests govern exchanges of water, energy, and carbon between the land surface and atmosphere through interactions between aboveground structure and subsurface access to stored water. Canopy height and root-zone water storage capacity are therefore key controls on ecosystem function, yet they have rarely been assessed together at the global scale. Classical ecohydrological theory posits coordinated investment above and below ground, whereby enhanced access to deep water supports taller and more structurally complex canopies. However, it remains unclear whether such coordination holds across diverse climatic conditions. Here, we integrate global GEDI-derived canopy height observations, independent estimates of root-zone water storage capacity, and an integrated climatic gradient capturing water availability, atmospheric demand, and seasonality to evaluate this long-standing hypothesis at the global scale. By quantifying how above- and belowground traits co-vary across hydroclimatic regimes, we assess how access to deep water influences forest structure and identify where empirical patterns diverge from theoretical expectations. Our results reveal that the relationship between canopy height and root-zone water storage capacity is far more variable than classical theory suggests, with clear decoupling in both humid and strongly seasonal regions. These findings advance our understanding of vegetation–water interactions, highlight limitations of simplified assumptions about hydraulic constraints and structural investment, and provide a data-driven foundation for improving the representation of vegetation processes in land–atmosphere and Earth system models.

How to cite: Khorami, M., Lane, P., Sheridan, G., and Fowler, K.: Climate-dependent coupling and decoupling between canopy height and root-zone water storage in global forests , EGU General Assembly 2026, Vienna, Austria, 3–8 May 2026, EGU26-10872, https://doi.org/10.5194/egusphere-egu26-10872, 2026.

EGU26-10909 | Orals | HS10.2

Belowground responses to soil and atmospheric drought imaged with time-lapse geoelectrics 

Alexis Shakas, Katrin Meusburger, Arthur Gessler, and Cédric Schmelzbach

Forests are experiencing increasing stress from the combined effect of atmospheric warming and the air's capacity to hold more moisture. Vapour pressure deficit (VPD), a key measure of atmospheric moisture demand, increases with warming due to the nonlinear rise in saturation vapour pressure, amplifying transpiration demand and drought stress and increasing mortality risk. VPD may cause large-scale physiological stress in trees and can lead to forest die-backs. The Pfynwald Research platform (Southern Switzerland) is located in a natural forest reserve dominated by (> 100-year-old) Scots pines growing on shallow soils with low water-holding capacity. The region has experienced pronounced drought stress and tree mortality in recent decades, making it a natural laboratory to investigate drought impacts on tree physiology, ecosystem functioning, and resilience. The Pfynwald research team, led by WSL, has initiated a long-term irrigation study in 2003 to quantify ecosystem responses to alleviation of chronic drought stress. A more recent experiment, inaugurated in 2024, studies the effect of soil and atmospheric drought by a unique setup that (1) intercepts rainfall through a throughfall exclusion and (2) manipulates atmospheric VPD by regulating air humidity in the forest canopy. In this contribution, we focus on the belowground by showcasing a time-lapse quasi-3D geoelectric experiment that we started in May 2025 including daily repeated subsurface electrical resistivity surveys to track belowground moisture variations in time and space. Our setup allows us to investigate deeper belowground effects of aboveground manipulations, namely the VPD, irrigation, and drought treatments. We present a multi-disciplinary investigation that integrates our geophysical findings with the dense, aboveground observations of the site. Our work stresses the importance of distributed and continuous monitoring of belowground states in natural manipulation experiments, for a holistic understanding of how climate change will affect forest ecosystems.

How to cite: Shakas, A., Meusburger, K., Gessler, A., and Schmelzbach, C.: Belowground responses to soil and atmospheric drought imaged with time-lapse geoelectrics, EGU General Assembly 2026, Vienna, Austria, 3–8 May 2026, EGU26-10909, https://doi.org/10.5194/egusphere-egu26-10909, 2026.

EGU26-11986 | ECS | Orals | HS10.2

Tree water-use strategies and growth performance along a hillslope transect in a diverse Central European Forest 

Clara Rohde, Alberto Iraheta, Matthias Beyer, John D. Marshall, Gökben Demir, and Maren Dubbert

Consecutive dry periods (e.g., 2014–2016, 2018–2019, 2022) led to persistent long-term impairments in maintaining tree functions such as growth and canopy structure thereby exacerbating drought stress and mortality in temperate forests. Despite growing attention to compound drought impacts on forest ecosystems, the role of deep-water sources at varying positions on hillslopes remains unclear.

In this study, we investigated how hillslope position influences growth dynamics and water-use strategies of co-occurring tree species in an unmanaged, structurally diverse forest stand in Lower Saxony, Germany. The stand is composed of the broadleaf deciduous tree species Fagus sylvatica (L.), Carpinus betulus (L.), Fraxinus excelsior (L.), and Quercus robur (L.) which differ in their root structure, stomatal regulation and growth strategies. Over the three years (2023-2025) we employed continuous point-dendrometer, sap flow and soil moisture measurements to monitor growth, soil and stand water use and water potential. Further destructive samples for verifying water potential and stable carbon isotopes of phloem sap were measured.

We found that growth patterns were strongly species-specific and closely aligned with contrasting tree water-use strategies. Despite similar climatic conditions in 2023 and 2024, pronounced interannual differences in growth were observed. These differences suggest a delayed recovery from previous long-term drought events (2018-2022), particularly for the shallow-rooted species F. sylvatica, C. betulus and F. excelsior, compared to deep-rooted Q. robur, highlighting long-term effects of compound droughts on productivity. It was notable that the species were able to adapt their strategies according to their position. Additionally, we observed in F. excelsior and Q. robur that high growth rates can be supported by using water storage (e.g., via deep roots and access to deep water sources or via stem water use) or by maintaining high transpiration rates during drought at the risk of cavitation. In conclusion, we postulate that drought mitigation strategies not only depend on species traits, but also on tree positioning and climatic conditions.

How to cite: Rohde, C., Iraheta, A., Beyer, M., Marshall, J. D., Demir, G., and Dubbert, M.: Tree water-use strategies and growth performance along a hillslope transect in a diverse Central European Forest, EGU General Assembly 2026, Vienna, Austria, 3–8 May 2026, EGU26-11986, https://doi.org/10.5194/egusphere-egu26-11986, 2026.

EGU26-14609 | Posters on site | HS10.2

Waterlogging Effects on Soil and Vegetation in Mediterranean Forests Used for Runoff Attenuation 

Yonatan Ganot, Eliyahu Valdman, and Doreen Dahdal Turk

One proposed approach for reducing downstream flood hazards is the implementation of runoff attenuation facilities upstream. These facilities are often based on natural floodplains and may be located adjacent to agricultural lands, natural reserves, and forests. While their hydrologic benefits are evident, the effects of flooding frequency and duration on soils and vegetation are more difficult to predict and may be either beneficial or detrimental, depending on climate, soil properties, and land use. Our case study site is in Horshim Forest, a small Mediterranean forest intersected by Wadi Qana, a tributary of the Yarkon River, which flows through the densely populated Tel Aviv metropolitan area, Israel. The site is part of a planned network of upstream runoff attenuation facilities designed to mitigate downstream flood risk. To examine the impacts of waterlogging on soils and vegetation during active attenuation, we conducted a controlled flooding experiment in a forest plot dominated by 35-year-old Aleppo pine trees (Pinus halepensis). Mature pine trees were selected due to their abundance and the limited data on their flood tolerance. Flooded and control plots were continuously monitored using soil sensors measuring water content, oxygen concentration, and redox potential, along with tree sensors measuring stem diameter changes (dendrometers) and sap flow. Flooding events lasting 48–72 hours were applied during winter in the flooded plot, while the control plot remained under natural conditions. Plant performance indicators, including stem girth, needle length, and greenness index, were measured monthly. Waterlogging led to declines in soil oxygen and redox potential, in some depths reaching anoxic conditions, with responses dependent on flood duration and antecedent soil moisture. In contrast, the control plot remained under oxic to suboxic conditions. Tree responses were variable and appeared to depend on pre-flood soil water availability and the timing of flooding during the winter season. Our study demonstrates how short-term flooding alters soil aeration conditions and tree responses, with implications for the ecohydrologic design of runoff attenuation facilities.

How to cite: Ganot, Y., Valdman, E., and Dahdal Turk, D.: Waterlogging Effects on Soil and Vegetation in Mediterranean Forests Used for Runoff Attenuation, EGU General Assembly 2026, Vienna, Austria, 3–8 May 2026, EGU26-14609, https://doi.org/10.5194/egusphere-egu26-14609, 2026.

EGU26-16150 | Posters on site | HS10.2

Predicting post-fire changes to streamflow using forest self-thinning parameters 

Gary Sheridan, Secret Fischer, Patrick Lane, Assaf Inbar, Richard Benyon, Christopher Lyell, Molly Harrison, and Raphael Trouve

Stand-replacing wildfire in Eucalyptus forested catchments alters streamflow, however these changes can be highly variable, ranging from moderate increases through to large reductions (greater than to 50%) over decades with serious consequences for the water supplies of dependent communities.  Predicting change has proven difficult, with the most widespread models relying on time- based proxies for hydrologic changes caused by post-fire tree mortality and regrowth dynamics (e.g. Kuczera 1987).  The aim of this research is to replace these time-based proxies, which have been found to be sometimes inconsitent with more recent catchment data, with a forest-stand self-thinning model of post-fire forest dynamics, such that streamflow is an explicit function of forest density, tree size, and growth rates, which are in turn functions of the initial condition of the stand (early regeneration), and the site conditions the stand is exposed to (i.e. climate and soil conditions). This presentation will; i) use a 42 year streamflow timeseries across 18 fire-affected catchments to illustrate the limitations of time-based proxies (Benyon et al 2023), ii) outline our initial analytic work to couple the forest self-thinning model with a hydrologic model (Inbar et al 2022), iii) present the results of forest inventories with age ranges from 1 to 80 years to quantify suitable self-thinning line parameter values (Harrison 2024), and lastly, iv) present the results from studies to identify abiotic and biotic (inter-species competition with Acacia) controls on self-thinning dynamics that could plausibly explain the large variation in post-fire streamflow responses.  It is hoped that this research will enable the earliest possible identification of expected decadal-scale post-fire streamflow reductions so that water supply policy makers can respond appropriately and minimize water supply disruptions to dependent communities.

References

Kuczera, G. (1987). Prediction of water yield reductions following a bushfire in ash-mixed species eucalypt forest. Journal of Hydrology, 94(3-4), 215-236.

Inbar, A., Trouvé, R., Benyon, R. G., Lane, P. N., & Sheridan, G. J. (2022). Long-term hydrological response emerges from forest self-thinning behaviour and tree
sapwood allometry. Science of the Total Environment, 852, 158410.

Benyon, R. G., Inbar, A., Sheridan, G. J., Lyell, C. S., & Lane, P. N. (2023). Variable self-thinning explains hydrological responses to stand replacement in even-aged forests. Journal of Hydrology, 618, 129157.

Harrison, M., 2024. Could Eucalyptus regnans stocking density explain post-fire streamflow responses in Melbourne’s water catchments? (Master of Environmental Science). The University of Melbourne, Melbourne, Australia.

How to cite: Sheridan, G., Fischer, S., Lane, P., Inbar, A., Benyon, R., Lyell, C., Harrison, M., and Trouve, R.: Predicting post-fire changes to streamflow using forest self-thinning parameters, EGU General Assembly 2026, Vienna, Austria, 3–8 May 2026, EGU26-16150, https://doi.org/10.5194/egusphere-egu26-16150, 2026.

EGU26-18947 | ECS | Orals | HS10.2

Vertical Soil Water Dynamics and Drought-Response are Affected by Stand density In a Mediterranean Dryland Forest 

Hussein Muklada, Yosef Moshe, Ze’ev Cohen, and Yagil Osem

Abstract:
Mediterranean dryland forests are critically dependent on rainfall regimes and are increasingly exposed to prolonged droughts that disrupt soil–water–vegetation interactions and elevate the risk of tree mortality. Continuous monitoring of inter-depth soil moisture dynamics offers real-time insight into these processes, yet such data is very scarce. Based on long-term ecohydrological monitoring in HaKedoshim Pinus halepensis Forest, Israel, we quantified how drought alters soil moisture dynamics, water availability, and vegetation responses on shallow soil, hard rock (lime) terrains with contrasting canopy structures: dense forest plots (~550 trees hectare⁻¹) and thinned plots (~100 trees hectare⁻¹), where thinning was implemented 15 years earlier.

Volumetric water content (VWC) was continuously monitored using time-domain reflectometry (TDR) sensors at 0.5, 1.0, and 1.5 m depths during two consecutive hydrological years: HY23-24 (normal, ~561 mm year-1 of rainfall) and HY24-25 (drought, ~251 mm year-1). We derived seasonal soil-water subsidy metrics as the area under the excess VWC curve above the summer baseline (AUC_excess). We analyzed drought impacts using vertically aligned sensor sequences.

Despite greater understory development in the thinned plots over the years (55% cover vs. 35% in the dense forest), thinning significantly reduced tree mortality rate (six-fold). Annual evapotranspiration (ET) was also affected, with dense plots exhibiting 1.5 times greater ET compared to thinned ones.

In the thinned plots, higher volumetric soil moisture was measured in the upper soil layer (0.5 m) than in the dense plots, due to reduced rainfall interception and  water consumption by the forest vegetation. In contrast, in the deep soil (1.5 m), two interesting phenomena were observed: moisture in the dense plots was higher than in the thinned plots and, the deep layers in the dense forest responded earlier than the shallow layers to rainfall inputs.

Extreme drought (-55% rainfall) caused substantial reductions in soil water subsidy across depths. Dense plots experienced greater losses (-73% overall; -79% in topsoil) compared to thinned ones (-56% overall; -37% in topsoil). These moisture declines were associated with prolonged periods of limited water availability.

Our results show that canopy structure regulates not only interception and evapotranspiration but also the vertical coherence of soil moisture recharge, with dense forests promoting preferential deep flow and root-induced bypass flow via interception, stemflow and root flow while thinning enhances infiltration and shallow soil storage.

These findings demonstrate that 15 years after thinning, forest structure exerts a lasting control on water availability through depth-dependent hydrological pathways, providing mechanistic insight into drought-driven forest mortality under climate change.

Keywords: Drought, Soil moisture, Ecohydrology, Bypass flow, Thinning

How to cite: Muklada, H., Moshe, Y., Cohen, Z., and Osem, Y.: Vertical Soil Water Dynamics and Drought-Response are Affected by Stand density In a Mediterranean Dryland Forest, EGU General Assembly 2026, Vienna, Austria, 3–8 May 2026, EGU26-18947, https://doi.org/10.5194/egusphere-egu26-18947, 2026.

EGU26-19163 | ECS | Orals | HS10.2

Spatial-temporal redistribution of seasonal precipitation and stable water isotopes in a boreal coniferous forest 

Jiayuan Li, Pertti Ala-Aho, Hannu Marttila, Riku Paavola, and Zuosinan Chen

Boreal forest hydrological processes can be strongly influenced by the pronounced seasonality of precipitation, yet the spatiotemporal redistribution of rainfall and snowfall within forest canopies remains insufficiently understood. We investigate precipitation redistribution in a northern boreal Scots pine forest at the Oulanka station, Finland, with a focus on characterizing and quantifying seasonal variability and the spatial distribution of water inputs at the forest level and stable water isotope characterization of forest and open-area precipitation. We monitored throughfall, stemflow, snowmelt, and snowpack dynamics within the forest stand from July 2024 to April 2025. This integrated forest observational framework allows us to assess how canopy interception, rain-snow redistribution, and snowpack processes jointly regulate water inputs and its isotope composition to the forest floor across seasons. Preliminary analyses reveal strong seasonal differences in precipitation redistribution. Initial isotope observations suggest limited modification of precipitation isotopic signatures by canopy processes, indicating that physical redistribution rather than isotopic fractionation plays a dominant role in canopy-precipitation interactions in this forest. Our study provides new insights into the seasonal water inputs of boreal forest ecohydrology and contributes to improving process-based representations of forest ecohydrology in cold-regions and tracer-aided models, with potential benefits for local water resource management and the forestry sector.

How to cite: Li, J., Ala-Aho, P., Marttila, H., Paavola, R., and Chen, Z.: Spatial-temporal redistribution of seasonal precipitation and stable water isotopes in a boreal coniferous forest, EGU General Assembly 2026, Vienna, Austria, 3–8 May 2026, EGU26-19163, https://doi.org/10.5194/egusphere-egu26-19163, 2026.

EGU26-20559 | ECS | Posters on site | HS10.2

A multi-method approach to quantify hydraulic redistribution 

Ramona Riedel, Alberto Iraheta, Malkin Gerchow, Clara Rohde, Johannes Hoppenbrock, Aljoscha Gildemeister, Maren Dubbert, Matthias Bückner, and Matthias Beyer

Hydraulic redistribution (HR) occurs in temperate ecosystems and may increase forest resilience to drought. However, its magnitude and influence on the stand-level water budget remain poorly understood. One major challenge in field studies is to distinguish HR from other processes that lead to real or apparent increases in soil water content at night. In this study, we aimed to identify and quantify upward water fluxes due to HR by combining multiple methodological approaches in a mixed broad-leaved forest in Germany. During three consecutive growing seasons, we monitored soil water dynamics using continuous soil water content and soil water potential sensors installed at multiple locations in the tree stand and in root-exclusion control plots, where roots were cut to prevent HR. Additionally, several infiltration events were performed by inducing 200–800 L of deuterium-enriched water at 1.8–3.5 m depth, and its movement was traced with continuous in situ and destructive isotope analyses plus geoelectrical monitoring. We hypothesized that (1) nocturnal increases in soil water content and soil water potential would be larger in the stand plots than in the control plots due to HR, and (2) we would detect the tracer in upper soil layers if water moved from the irrigation depth to the topsoil through HR. Our multi-method analysis confirmed the occurrence of HR in this temperate forest, although its magnitude was low. Initial results showed that nocturnal increases in soil water potential were more frequent in the stand plots than in the controls, but the associated changes in water content remained below 1 vol. %. The tracer rarely appeared in observed trees and was not detectable in the topsoil. Geophysical monitoring results showed the injected tracer was rapidly distributed (approximately 10 m within only a few hours) along preferential flow paths below 2 m depth. The reason no tracer uptake was observed in the trees could be that they either primarily rely on shallower water sources, or that the clayey soil prevented the infiltrated water from reaching more distant trees during our observation windows. Future spatially and temporally high-resolution geoelectrical monitoring experiments are planned to noninvasively map and upscale these HR fluxes, link them to nutrient and carbon cycling, and improve predictions of forest resilience to drought.

How to cite: Riedel, R., Iraheta, A., Gerchow, M., Rohde, C., Hoppenbrock, J., Gildemeister, A., Dubbert, M., Bückner, M., and Beyer, M.: A multi-method approach to quantify hydraulic redistribution, EGU General Assembly 2026, Vienna, Austria, 3–8 May 2026, EGU26-20559, https://doi.org/10.5194/egusphere-egu26-20559, 2026.

EGU26-20808 | Posters on site | HS10.2

Seasonal and diel variations of electrical resistivity in a beech tree stem using time-lapse electrical resistivity imaging 

Arnaud Watlet, Laurent Gourdol, Stanislaus Schymanski, Christophe Hissler, Andrea Costantini, Cyrille Tailliez, Jean-François Iffly, and Richard Keim

Trees are thought to use internal water stored within the stem as a key buffer against short-term drought. Together with deep root water uptake and stomatal regulation, this mechanism helps trees to maintain critical physiological functions alive. Stem moisture content and water potential is generally observed using electrical conductivity (EC), moisture sensors, or microtensiometers installed in the sap wood of living trees. While these sensors offer precise information at the point scale, applying imaging techniques such as Electrical Resistivity Tomography (ERT) can help the investigation of spatial patterns and internal changes in electrical conductivity across larger portions of the trunk. Although ERT monitoring was mainly developed for hydrogeological applications to track soil moisture or groundwater dynamics at scales of tens to hundreds of meters, it has more recently been adopted in forest ecohydrological research for smaller-scale applications. ERT imaging of tree stems has proven its ability to inform on internal structures of trunks, while time-lapse ERT has shown promise to inform on stem water content variations.

Here, we present results from a field experiment conducted on a mature beech tree (Fagus sylvatica L.) at the Weierbach Experimental Catchment (WEC) in Luxembourg. The tree has been equipped with 4 rings of 30 stainless-steel screw electrodes each, with 5 cm electrode spacing and 50 cm vertical spacing between rings. ERT data was acquired during the growing season, from March to November, at a 4-hour temporal resolution. Additional tree sensors installed on the same tree, including sap flux, radial growth, moisture, water potential and temperature, provide complementary measurements for comparison with the ERT results.

At the seasonal scale, observations indicate spatially consistent changes in resistivity, with progressive resistivity decrease in the sap wood during the growing season. At the diel scale, pronounced daily variations in electrical resistivity are also observed, which seem to follow physiological processes also picked up by sap flow sensors and dendrometers. We will discuss challenges linked with the downscaling of the time-lapse ERT technique, both in time and space. These include: (i) accounting for strong temperature effects within the stem that influence reconstructed resistivity models and require advanced correction methods, and (ii) accurately determining electrode geometry at high resolution, including electrode orientation and seasonal changes in stem diameter. Finally, we address the interpretation of resistivity changes in terms of wood moisture dynamics and potential variations in sapwood chemical composition.

How to cite: Watlet, A., Gourdol, L., Schymanski, S., Hissler, C., Costantini, A., Tailliez, C., Iffly, J.-F., and Keim, R.: Seasonal and diel variations of electrical resistivity in a beech tree stem using time-lapse electrical resistivity imaging, EGU General Assembly 2026, Vienna, Austria, 3–8 May 2026, EGU26-20808, https://doi.org/10.5194/egusphere-egu26-20808, 2026.

EGU26-21257 | Orals | HS10.2

Signatures of plant water stress in the near surface air: How is the diurnal temperature range related to ecosystem drought response at a broadleaved forest site?  

Anke Hildebrandt, Flavio Bastos Campos, Felix Pohl, Emily Solly, Corinna Rebmann, Axel Kleidon, Tejasvi Chauhan, and Sarosh Alam Ghausi

Water stress shifts the partitioning of turbulent heat fluxes towards sensible heat and therefore leaves an imprint of higher temperatures in the near surface atmosphere during the day (Ghausi et al., 2025), specifically the diurnal temperature range and in relative humidity. This temperature range therefore carries the information of soil water stress, as has been confirmed in global analyses with eddy covarince data (Chauhan et al., in review). Here we investigate how the diurnal temperature range in turn relates to ecosystem indicators of soil water stress at the daily, seasonal and annual time scale at the temperate broadleaved forest site Hohes Holz in the ICOS network (DE-HoH). For this, we apply the same method as described byChauhan et al. and Ghausi et al. 2025, and derive a soil water limitation factor based on the difference between observedand theoretical (non-water limited) diurnal temperature range. We compare this atmospherically-derived soil water limitation factor to the observed ecosystem variables indicating short-term reaction to water stress (reduction in GPP) and long-term integrated water stress (tree growth, δ13C).

How to cite: Hildebrandt, A., Bastos Campos, F., Pohl, F., Solly, E., Rebmann, C., Kleidon, A., Chauhan, T., and Ghausi, S. A.: Signatures of plant water stress in the near surface air: How is the diurnal temperature range related to ecosystem drought response at a broadleaved forest site? , EGU General Assembly 2026, Vienna, Austria, 3–8 May 2026, EGU26-21257, https://doi.org/10.5194/egusphere-egu26-21257, 2026.

EGU26-21565 | Posters on site | HS10.2

Forest Diversity Assessment through the Integration of PRISMA Spectral Metrics and BIOMASS P-band SAR Structural Information 

Zahra Dabiri, Elizaveta Avoiani, Yu Dong, and Mary Wangari Muthee

This study explores the potential of integrating structural information from the European Space Agency (ESA) BIOMASS P-band Synthetic Aperture Radar (SAR) mission with spectral information from PRISMA hyperspectral imagery to assess forest diversity in the Amazon. The study area was defined based on the spatial and temporal overlap of available PRISMA and BIOMASS acquisitions.

Forest structural diversity was derived from BIOMASS data acquired on 6 June 2025 using polarisation variability, polarimetric SAR (PolSAR) metrics, polarimetric interferometric SAR (PolInSAR), and texture measures of above-ground biomass to characterise variations in vertical structure and stand complexity. In particular, the cross-polarised backscattering coefficient (HV/VH), which is sensitive to volume scattering, was used to capture differences in forest height and canopy structure.

Spectral diversity was estimated from PRISMA Level-2D surface reflectance data acquired on 29 July 2025 (234 bands spanning 406–2497 nm). Principal Component Analysis (PCA) was applied, and several vegetation indices were derived. In addition, spectral diversity indicators—including Rao’s Q, spectral variance, and clustering-based “spectral species”—were computed to describe variability in canopy composition and biochemical properties associated with species and functional diversity.

The analysis examines relationships between radar-derived structural diversity and hyperspectral spectral diversity to evaluate how forest structural heterogeneity corresponds to compositional variability across different forest environments. Available LiDAR canopy height data and, where feasible, field-based observations of species composition and functional traits are used as supporting reference information. Correlation and multivariate analyses are applied to assess the consistency, complementarity, and added value of the combined indicators.

This multi-sensor Earth observation approach contributes to advancing satellite-based monitoring of forest biodiversity in tropical ecosystems and demonstrates the potential of the ESA BIOMASS mission for biodiversity-oriented forest applications.

How to cite: Dabiri, Z., Avoiani, E., Dong, Y., and Muthee, M. W.: Forest Diversity Assessment through the Integration of PRISMA Spectral Metrics and BIOMASS P-band SAR Structural Information, EGU General Assembly 2026, Vienna, Austria, 3–8 May 2026, EGU26-21565, https://doi.org/10.5194/egusphere-egu26-21565, 2026.

EGU26-4090 | ECS | Orals | HS10.3

Peat depth as a control on peatland ecohydrological resilience 

Owen Sutton, Alex Furukawa, Kyra Simone, Greg Verkaik, Paul Moore, Alexandra Clark, Rachel Fallas, Maia Moore, Emma Sherwood, Rosanne Broyd, Brandon Van Huizen, Paul Morris, and James Michael Waddington

Shallow peatlands (average peat depth <40 cm) exhibit differences in key structural and hydrophysical characteristics from their deeper counterparts. They generally exhibit higher bulk density, lower organic matter content, lower hydraulic conductivity, greater tree density and height, and lower microtopographic complexity. These differences mediate the strength of ecohydrological feedback mechanisms, generally resulting in weaker mechanisms with a regulatory function (negative feedbacks) and stronger mechanisms that have a destabilizing function (positive feedbacks). Ultimately, these differences in peatland form and function result in systems that have a profound contrast in ecohydrological behaviour, exhibiting more frequent water table fluctuations, longer periods when the water table is both above and below the optimum depth, and shorter periods where the surface soil water tension is in equilibrium with the water table. We hypothesize that this leads to greater decomposition, lower productivity, and thus a smaller net carbon sequestration. As a consequence, these shallow peatlands are disproportionately more vulnerable to disturbances, such as drought and wildfire. This can perpetuate a cycle of vulnerability, which prevents shallow systems from obtaining the depth associated with greater resilience. By studying these vulnerable systems we can learn what environmental conditions herald a regime shift associated with a loss of resilience and a degrading peat carbon stock.

How to cite: Sutton, O., Furukawa, A., Simone, K., Verkaik, G., Moore, P., Clark, A., Fallas, R., Moore, M., Sherwood, E., Broyd, R., Van Huizen, B., Morris, P., and Waddington, J. M.: Peat depth as a control on peatland ecohydrological resilience, EGU General Assembly 2026, Vienna, Austria, 3–8 May 2026, EGU26-4090, https://doi.org/10.5194/egusphere-egu26-4090, 2026.

EGU26-4194 | ECS | Orals | HS10.3

Spatiotemporal Groundwater Responses to Peatland Restoration: A Fully Integrated Surface–Subsurface Modelling Study on a Boreal Fen 

Omar Nimr, Hannu Marttila, Okke Batelaan, Daniel Partington, and Pertti Ala-Aho

Peatland restoration, through drainage suppression, is widely implemented to recover ecological function, yet the driving hydrological mechanisms controlling groundwater responses across spatial and temporal scales remain poorly quantified. Here, we use calibrated, fully integrated 3D physics-based modeling to explicitly resolve how rewetting interventions, including ditch infilling and damming, restructure catchment-scale groundwater dynamics across a boreal fen. Simulated restoration actions elevated water tables by ~23 cm, with comparable gains in nominally undisturbed areas, demonstrating far-field impacts of drainage legacy and the re-establishment of lateral hydrological connectivity. Variogram analysis revealed that hundreds of meters of previously fragmented, drainage-controlled peatlands were transformed into hydraulically coherent systems, enhancing spatial correlation and damping extreme drawdowns. Additionally, findings revealed that lateral propagation of groundwater recovery depended on structure type and hydraulic properties, with low-permeability peat infillings produced strong local responses with steep exponential decay (~70% within ~40 m), whereas dams generated broader plateauing effects (~100 m radius). Geomorphic context further modulated outcomes, where groundwater recovery also followed exponential growth away from peat–mineral margins, with intermediate-thickness peatlands defining a tipping-point regime that maximizes recovery magnitude and variability. Seasonal dynamics amplified restoration efficiency, with wet periods nearly doubling groundwater rise relative to dry winters, yet elevated efficiency persisted during dry intervals between spring melts and autumn rains. Collectively, these findings reveal how restoration effects propagate laterally, interact with seasonal hydroclimatic forcing, and are shaped by geomorphic context, providing a transferable, mechanistic framework for prioritizing and designing restoration plans that maximize peatland hydrological recovery.

How to cite: Nimr, O., Marttila, H., Batelaan, O., Partington, D., and Ala-Aho, P.: Spatiotemporal Groundwater Responses to Peatland Restoration: A Fully Integrated Surface–Subsurface Modelling Study on a Boreal Fen, EGU General Assembly 2026, Vienna, Austria, 3–8 May 2026, EGU26-4194, https://doi.org/10.5194/egusphere-egu26-4194, 2026.

EGU26-4974 | ECS | Posters on site | HS10.3

Hydrological and geochemical responses of a maritime peatland to fire disturbance: preliminary multi-proxy results from eastern Canada 

Agnieszka Halaś, Michał Słowiński, Milena Obremska, Harry Roberts, Daniel Magnone, and Michelle Garneau

Peatland hydrology strongly regulates ecosystem functioning, carbon storage, and vulnerability to disturbance. Although maritime peatlands along the Gulf of Saint Lawrence (eastern Canada) are generally considered fire-resilient due to high atmospheric moisture, recent severe fire seasons in surrounding boreal forests highlight the need to better understand how fire influences peatland hydrological and biogeochemical dynamics. Such understanding is essential for interpreting long-term palaeoecological records and assessing peatland sensitivity to ongoing climate warming.

In this multi-proxy study, we combine traditional palaeoecological proxies (testate amoebae, charcoal, pollen, and plant macrofossils), with geochemical analyses (XRF and FTIR) to evaluate the impacts of local and regional fires on a maritime raised bog near Baie-Johan-Beetz (Québec). We present preliminary high-resolution results from a short peat monolith (BJB-03) covering the last ~1100 years. The record captures distinct ecological and geochemical shifts, including lichen-Sphagnum transitions, changes in peat accumulation rates, and intervals of increased presence of macrocharcoal particles associated with variations in elemental composition, carbon content, and peat decomposition. Using FTIR, a novel method in peatland fire studies, we aim to detect highly oxidised, presumed pyrogenic carbon and to quantify the relative redox state of peat, linking these signals to disturbance events recorded in the sequence.

The monolith provides a detailed archive of environmental change during the last millennium, including the period surrounding the well-documented 2013 regional fire event. These preliminary results constitute the first stage of a broader project reconstructing fire–hydrology interactions over the past 7500 years in this region of Canada.

The study was supported by the National Science Center of Poland (no. 2024/35/O/ST10/02903).

How to cite: Halaś, A., Słowiński, M., Obremska, M., Roberts, H., Magnone, D., and Garneau, M.: Hydrological and geochemical responses of a maritime peatland to fire disturbance: preliminary multi-proxy results from eastern Canada, EGU General Assembly 2026, Vienna, Austria, 3–8 May 2026, EGU26-4974, https://doi.org/10.5194/egusphere-egu26-4974, 2026.

EGU26-6076 | ECS | Posters on site | HS10.3 | Highlight

Where there's fire, there's smoke: estimating smoke emissions from Hudson Bay Lowland mining 

Emma Wegener, Paul Moore, Owen Sutton, Mike Waddington, and Catherine Dieleman

Recent Canadian wildfires have generated daily mean PM2.5 values nearly 10 times the World Health Organization recommended limits in urban centers. Northern peatlands present a unique risk to air quality conditions as they: (i) store globally significant quantities of belowground carbon (C) in peat, which may fuel multiyear fires; and (ii) are prone to smouldering combustion, an inefficient low-temperature reaction that produces more smoke with increased particulate matter than flaming combustion. The same mechanisms that allow C to accumulate also support the accumulation of other deposited elements, including arsenic, mercury, lead, and nickel. Historically, northern peatlands have been resistant to burning due to the high near-surface water content and low bulk density of peat; however, water table drawdown alters these ecological protections, rendering peatlands susceptible to increased wildfire frequency, severity, and areal extent.

The Hudson Bay Lowlands (HBL) of Ontario, Canada, represent one of the largest intact peatland complexes remaining on Earth, yet ~5,000 km2 has been claimed for mining of critical minerals. Dewatering practices required to facilitate mine development and operations can reduce the water table in surrounding peatlands by up to 75 cm. Drying at the soil surface and along the peat profile increases risk for wildfire ignition and subsequent smouldering combustion, potentially forming an additional potent source for smoke emissions and particulate matter while threatening HBL C stores. Therefore, the objective of this study was to estimate the impact of several mine dewatering scenarios on potential smoke emissions from the peatlands of HBL. We simulated the potential effect of mine dewatering on soil moisture profiles using Hydrus 1D with hydrophysical properties derived from HBL peat profiles. Hydrus 1D simulations were used to assess susceptibility to combustion and, consequently, estimates of smoke emissions based on antecedent weather conditions measured prior to wildfires in the study region.

Preliminary results suggest that wildfire vulnerability will increase, which will lead to greater smoke emissions as a direct result of drying from mining and infrastructure development. Furthermore, due to increased human activity, ignition sources will also increase, leading to peatlands that are both more vulnerable to severe burning and an increased risk of fires igniting.

Although the focus of this study has been on the HBL, this work can be applied to other peatland systems that may undergo drying scenarios in the future, be it from mining, climate change, or drainage. Northern landscapes that have traditionally been resistant to wildfire may not necessarily remain as such, and the implications for human health may be far-reaching, with potentially compounding effects of smoke and the additional toxic elements that may be released as a result of burning.

How to cite: Wegener, E., Moore, P., Sutton, O., Waddington, M., and Dieleman, C.: Where there's fire, there's smoke: estimating smoke emissions from Hudson Bay Lowland mining, EGU General Assembly 2026, Vienna, Austria, 3–8 May 2026, EGU26-6076, https://doi.org/10.5194/egusphere-egu26-6076, 2026.

Peatlands are essential for biodiversity conservation in wetland ecosystems and for mitigating global warming through carbon storage. Given the importance of peatlands, conservation and restoration efforts have been undertaken worldwide. This study examined the Kushiro Mire in Hokkaido, Japan, where river channel straightening in the 1980s led to wetland degradation, including the conversion of the mire to alder stands and the loss of the wetland landscape. In the 2010s, a nature restoration project was implemented to restore the river meander of the Kushiro River. In this study, tree-ring core samples were collected from alder trees growing around the restored river meander area. They were used to estimate tree age from the number of tree rings and annual growth from the ring width. The effects of river restoration on alder growth were then assessed based on changes in growth. Eight alder tree-ring surveys were conducted at sites where tree-ring conditions were expected to differ. At each site, five to six trees exhibiting typical growth conditions were surveyed. Tree-ring analysis revealed that the average tree ages at the eight sites were roughly divided into two groups: 25 and 35 years, with a difference of approximately 10 years. Both groups had entered and expanded within the mire following the 1984 river channel straightening, but before the river meander restoration was completed in 2011. At survey points near the restored meandering river channel, there was a statistically significant decrease in tree-ring growth following restoration relative to pre-restoration conditions. Conversely, at survey points near the former straight river channel, there was a significant increase in tree-ring growth following restoration. Flood inundation simulations with pre- and post-restoration of the river meander implied an increase in sediment thickness after restoration at survey points near the former straight river channel. Meanwhile, at survey points downstream of the restored meandering river channel, flood-induced sediment deposition was implied to decrease. The simulation results indicate that flood-induced sediment inflow into the mire could alter nutrient distribution, contributing to alder growth.

How to cite: Miyamoto, H., Nemoto, Y., and Oishi, T.: Tree-ring analysis on the alder tree growth in a river meandering restoration site of the Kushiro Mire, Hokkaido, Japan, EGU General Assembly 2026, Vienna, Austria, 3–8 May 2026, EGU26-6932, https://doi.org/10.5194/egusphere-egu26-6932, 2026.

EGU26-6976 | ECS | Orals | HS10.3

The influence of local hydrology and seasonality on microbially-mediated methane emissions from a sloping alpine peatland 

Sigrid van Grinsven, Sophie Kunz, Florian Jueterbock, Olaf Cirpka, Reinhard Drews, Yvonne Oelmann, Isabel Monte, Kyle Mason-Jones, Christiane Zarfl, E. Marie Muehe, Thilo Streck, and Andreas Kappler

Recent findings revealed that alpine peatlands are more spatially extensive than previously assumed, reinforcing their importance for carbon storage in alpine ecosystems. Alpine peatlands share certain characteristics with northern peatlands: they have a short growing season, strong seasonality, and are snow-covered for 6 - 9 months per year. While arctic and boreal peatlands are known to emit large amounts of greenhouse gases (GHG), it is still largely unknown to which extent alpine peatlands show different GHG dynamics under climate change and how this links to abiotic and biotic differences like in radiation, soil properties, hydrology and plant community composition.  

In a multidisciplinary study, covering geohydrology, biogeochemistry, microbial ecology, and plant science, we investigate an alpine peatland in Vorarlberg, Austria located at 1670 m a.s.l. altitude on a slight slope of a plain surrounded by mountains up to 2416 m a.s.l. Methane flux measurements with static chambers showed a strong seasonal variation with a surprising switch from methane uptake in certain locations in spring to methane emissions in summer, potentially indicating a large variation in redox conditions with the seasons due to changes in the hydrology. In winter, when the area is covered by >1 m of snow, the sampled alpine peatland remains partly uncovered due to the continuous input of 5°C spring water. This creates a unique environment in which microbial carbon cycling continues at a higher rate than at nearby sites and leads to ongoing methane emissions throughout winter. The strong methane emissions in summer depended strongly on day (high) and night (lower) and short-term weather in the days before/during the measurements, with higher emissions during hot, dry periods compared to colder, rainy periods. In addition, we observed a very large spatial variation, even within the 1 m2 scale. This large spatial variation in GHG emissions is supported by a large variation in soil organic carbon and total nitrogen content between locations within the peatland site, as well as variations in the plant community, and seems to be linked to groundwater flows which will be further analysed in upcoming field campaigns.

How to cite: van Grinsven, S., Kunz, S., Jueterbock, F., Cirpka, O., Drews, R., Oelmann, Y., Monte, I., Mason-Jones, K., Zarfl, C., Muehe, E. M., Streck, T., and Kappler, A.: The influence of local hydrology and seasonality on microbially-mediated methane emissions from a sloping alpine peatland, EGU General Assembly 2026, Vienna, Austria, 3–8 May 2026, EGU26-6976, https://doi.org/10.5194/egusphere-egu26-6976, 2026.

EGU26-7270 | Posters on site | HS10.3

Identifying Ecohydrological Early Warning Signals of Peatland Destabilization 

Mike Waddington, Laurel Larsen, and Owen Sutton

Peatlands are globally important long-term sinks of carbon, however climate change-mediated drought is expected to threaten the integrity of their carbon sequestration function due to enhanced decomposition and moss moisture stress. Furthermore, the intensification of drought (or drainage) will also increase peat combustion loss during wildfire leading to peatland degradation and a potential ecosystem regime shift. Despite research developments on identifying ecohydrological early warning signals (EWS) of tipping points in other ecosystems (e.g., forests, grasslands), research on peatland EWS is lacking. There is an urgent need to identify EWS metrics to adequately represent the potential positive feedback between peatland carbon loss and climate change within Earth Systems Models. By establishing a suite of simple EWS metrics that can summarize an impending or ongoing regime shift, the uncertainty associated with climate change-mediated degradation can be reduced and the trajectory of the global peatland carbon stock more accurately projected.

In this poster presentation we aim to gain more insight into peatland ecosystem behaviour and the early warning signals that may be found in these systems. We present ideas on how to measure ecohydrological tipping points and explore simple metrics that may reveal when these tipping points have been exceeded and the implications this has for carbon storage and fluxes. Moreover, we review how alternate stable state and resilience theory can be applied to peatlands and we explore how ecohydrological modelling and water table time series analysis can be used to identify what environmental conditions herald a peatland regime shift.

How to cite: Waddington, M., Larsen, L., and Sutton, O.: Identifying Ecohydrological Early Warning Signals of Peatland Destabilization, EGU General Assembly 2026, Vienna, Austria, 3–8 May 2026, EGU26-7270, https://doi.org/10.5194/egusphere-egu26-7270, 2026.

EGU26-7455 | ECS | Orals | HS10.3

Mapping Subsurface Stratigraphy Controlling Groundwater-Surface Water Interactions and Estimating Associated Subsurface Gas Content in a Degraded Fen 

Henry Moore, Theresa Blume, Christian Wille, Torsten Sachs, Raymond Hess, Josefina Maceiro, and Sebastian Uhlemann

Rewetting efforts to restore anthropogenically degraded peatlands across Germany aim to curb the rapid release of carbon gases onset from peat desaturation. To monitor peat saturation across remediation efforts aimed to stabilize carbon-cycling, it is paramount to understand the hydrology controlling flow through these systems. Underlying mineral sediment stratigraphy controls peatland water levels, with more permeable structures altering flowpaths and sourcing minerogenous groundwater. In this study we examined the Zarnekow wetland, a degraded fen in northeast Germany, using a suite of electrical geophysical methods to map the stratigraphic interfaces between the peat and underlying mineral sediments. Rought terrain ground-penetrating radar (GPR) and towed transient electromagnetic induction surveys were deployed to characterize the mineral sediment interface across the fen. Variability in the mineral sediment interface was then compared to hydrological temperature signals indicative of groundwater upwelling, allowing for inferences about the stratigraphic controls on groundwater flow. An extended transect within the survey area was selected for targeted GPR surveys using both common offset and common midpoint geometries. These additional data allowed for estimates of the subsurface gas content. Time-domain induced polarization was deployed over the same transect to examine contrasts between the real and imaginary components of the complex conductivity. Initial results from the focused electrical surveys provide robust spatial insight into the gas distribution within the Zarnekow wetland. This study bolsters the use of electrical geophysics for seasonal monitoring of gas migration in the subsurface, informing ongoing peatland remediation efforts.

How to cite: Moore, H., Blume, T., Wille, C., Sachs, T., Hess, R., Maceiro, J., and Uhlemann, S.: Mapping Subsurface Stratigraphy Controlling Groundwater-Surface Water Interactions and Estimating Associated Subsurface Gas Content in a Degraded Fen, EGU General Assembly 2026, Vienna, Austria, 3–8 May 2026, EGU26-7455, https://doi.org/10.5194/egusphere-egu26-7455, 2026.

Montane peatlands are highly sensitive to climate change and disturbance, and their hydrological functioning strongly controls the transport of dissolved substances. Electrical conductivity (EC) serves as an integrative tracer of runoff generation processes and source contributions. This study analyzes long-term changes in EC-discharge (EC-Q) dynamics in response to climate warming and a multi-year drought in the Rokytka peatland, Central Šumava Mountains (Czechia) in response to climate warming and a multi-year drought. The drought is treated as a stress-test period that reveals the sensitivity and dominant response pathways of the system, indicating the likely direction of change as heat and drought intensify under climate warming.

We use a unique 20-year dataset of 10-minute measurements of discharge, EC, and meteorological variables. Runoff events were classified by antecedent wetness and event structure, and water circulation patterns were analyzed using event-scale EC-Q hysteresis loops characterized by loop direction and morphology. Events were further compared across seasons and major climatic and management phases.

Results show a pronounced shift after the onset of the warm and dry period in 2015–2018. Discharge regimes exhibit higher variability, more frequent extremes, and lower baseflow. Hydrographs became steeper, with shorter response times, faster rising and falling limbs, smaller event runoff volumes, and more asymmetric shapes. EC dynamics changed consistently: maximum EC values decreased, event-scale EC contrasts weakened, and EC returned more rapidly to baseline after events.

EC-Q hysteresis loops also changed markedly. Hysteresis indices decreased and separation between rising and falling limbs weakened, indicating reduced event-scale contrasts in solute sources and more uniform mixing. Loop direction shifted toward more frequent clockwise patterns after 2015, consistent with earlier flushing followed by dilution. Together, these changes point to faster runoff generation and altered solute mobilization under warmer and drier conditions.

The study demonstrates that long-term high-frequency EC monitoring provides a sensitive indicator of climate- and management-driven changes in peatland hydrology. EC-Q hysteresis analysis offers a powerful tool for diagnosing shifts in runoff generation, storage, and solute transport, and for evaluating the effectiveness of peatland restoration under a changing climate.

How to cite: Langhammer, J. and Bernsteinová, J.: Electrical conductivity as a tracer of changing peatland catchment response to climate warming, EGU General Assembly 2026, Vienna, Austria, 3–8 May 2026, EGU26-8112, https://doi.org/10.5194/egusphere-egu26-8112, 2026.

EGU26-8873 | ECS | Posters on site | HS10.3

In situ soil moisture sensing in organic soils: what works? 

Annelie Säurich, Ullrich Dettmann, and Bärbel Tiemeyer

Soil moisture is a key regulator of greenhouse gas emission and other biogeochemical processes as well as of land management options in peatlands and other organic soils. Water table depth is often used as a proxy for soil moisture in these systems. However, it shows no consistent relationship with volumetric water content (VWC) or water-filled pore space (WFPS).

Non-destructive measurements of soil moisture with a high temporal resolution can be obtained using an electromagnetic sensor to determine the relative dielectric permittivity (ε), which is then converted to VWC through calibration functions. As the relationship between ε and soil moisture is exponential, precise measurements of ε are essential, particularly for peat-specific calibrations where VWC may exceed 80%. While the accurate determination of ε has been extensively studied within the range typical of mineral soils (< 40), sensor performance at high ε values (> 40), which are characteristic of organic soils, has hardly been investigated. Reliable soil moisture sensors are, however, crucial for accurately quantifying the effects of VWC and WFPS on greenhouse gas exchange, as well as for assessing the trafficability of organic soils.

Our investigation aimed to examine the suitability of various commercially available soil moisture probes with five different measurement methods across the entire ε range. To this end, we tested 14 different probes, each with three sensor replicates. The experiment was conducted under laboratory conditions using different reference solutions with defined values between 1 < ε < 80. No soil was used here. In addition, the influence of different electrical conductivities (0 to 800 μS cm-1) on the measurement accuracy of the sensors was also investigated.

Although the 14 probes operated with different measurement methods, no differences in overall sensor performance could be attributed to this. The results showed that four of the sensors tested measure very reliably and accurately between 40 > ε < 80 and are therefore recommended for use in organic soils. Five further sensors are conditionally usable, and the rest are not suitable for accurately measuring soil moisture in organic soils. Intersensory variability was found to be highest for the latter probes. Additionally, about half of the 14 sensors tested showed increasing uncertainties at elevated electrical conductivities up to 800 μS cm-1. Soil-specific calibrations are still required to ensure reliable measurements. However, our results offer guidance for evaluating sensors based on their accuracy and performance and to choose suitable sensors for soil-specific calibration.

How to cite: Säurich, A., Dettmann, U., and Tiemeyer, B.: In situ soil moisture sensing in organic soils: what works?, EGU General Assembly 2026, Vienna, Austria, 3–8 May 2026, EGU26-8873, https://doi.org/10.5194/egusphere-egu26-8873, 2026.

EGU26-9171 | ECS | Orals | HS10.3

Quantifying water fluxes and storage in a degraded peatland using a fully integrated hydrological model 

Nariman Mahmoodi, Ottfried Dietrich, Jürgen Pickert, and Christoph Merz

Peatland rewetting is an important measure for climate-change mitigation in northern Europe, but its effectiveness and plausibility require a detailed understanding of hydrological processes in degraded systems. To address this need, this study employs a fully integrated HydroGeoSphere (HGS) model of a drained fen peatland in Brandenburg, Germany, using nine years (2015–2023) of field measurements including groundwater (GW) dynamics, ditch water levels, eddy-covariance evapotranspiration (ET), and in-situ vegetation (LAI) observations. The model represents three-dimensional surface–subsurface flow, spatially distributed vegetation and management units, and a vertically heterogeneous peat profile. Evapotranspiration is parameterized using site-specific eddy-covariance data and in-situ measurements of seasonal leaf area index and management practices. Model performance was evaluated against GW levels and ET using a multi-metric approach for calibration (2016–2020) and validation (2021–2023) periods. Simulated GW dynamics and ET are in agreement with observations (GW: NSE = 0.83–0.86, KGE = 0.80–0.85; ET: RMSE ≈ 1.0 mm d⁻¹). Results show pronounced seasonal reversals in hydraulic gradients with evapotranspiration-driven groundwater drawdown leads to lateral inflow from ditches and the surrounding aquifer during summer, and recharge-driven outflow and surface inundation in winter conditions. Seasonal and interannual water-storage analysis shows that wet years (e.g., 2017, 2023) generate positive storage, whereas consecutive drought years (2018–2020) produce cumulative deficits, highlighting the vulnerability of degraded peat to climatic water imbalance. The presented modeling framework provides a robust basis for assessing peatland vulnerability to climate extremes and for evaluating rewetting and water-management strategies aimed at enhancing water retention and reducing CO₂ emissions from drained fen peatlands.

How to cite: Mahmoodi, N., Dietrich, O., Pickert, J., and Merz, C.: Quantifying water fluxes and storage in a degraded peatland using a fully integrated hydrological model, EGU General Assembly 2026, Vienna, Austria, 3–8 May 2026, EGU26-9171, https://doi.org/10.5194/egusphere-egu26-9171, 2026.

EGU26-9264 | ECS | Posters on site | HS10.3

Peatland–Aquifer Connectivity: Insights from a Raised Bog Resilience to Mining-Induced Drainage 

Raul Paat, Marko Kohv, and Argo Jõeleht

Peatlands are groundwater-dependent ecosystems, even when they overlie less conductive glacial sediments. Their resilience relies on stable groundwater regimes, yet deep drainage from underground mining can disrupt these systems and amplify the changes in the climate. Selisoo bog (NE Estonia), a Natura 2000 raised bog, has been monitored since 2010 to track hydrological responses to adjacent underground oil-shale mining. The monitoring network spans from the bog margins to its centre and includes measurements of piezometric heads in peat, the underlying glacial sediments, and bedrock beneath the peatland. Analyses have revealed statistically significant declines in piezometric heads in peat at the bog margins and in surrounding drained peatland forests, driven by increased vertical hydraulic gradients and seasonal fluctuations, while the central part of the bog remained largely unaffected.

In 2021, restoration measures were introduced by damming forestry ditches along the eastern side of the bog to reduce lateral outflow. The second phase of the restoration was carried out in 2024. Here, we present data from the start of monitoring through the end of 2025, including the restoration works carried out and an “unusually” humid summer in 2025.

Our findings underline the need for an integrated monitoring of peatland–aquifer connectivity when issuing mining permits and designing restoration strategies for peatlands adjacent to mining areas. They also highlight how growing climatic variability interacts with human-induced drainage, affecting the hydrological regime of a raised bog in such hydrogeological settings. The continued long-term monitoring also enables us to assess the effectiveness of restoration and evaluate whether these measures can mitigate the effects of declining groundwater levels and rising vertical gradients.

How to cite: Paat, R., Kohv, M., and Jõeleht, A.: Peatland–Aquifer Connectivity: Insights from a Raised Bog Resilience to Mining-Induced Drainage, EGU General Assembly 2026, Vienna, Austria, 3–8 May 2026, EGU26-9264, https://doi.org/10.5194/egusphere-egu26-9264, 2026.

EGU26-9708 | ECS | Posters on site | HS10.3

Progression of Drought in the Mor–Peat Profile of Transformed Drained Peatlands—a Modelling Study 

Ella Rantalainen, Marjo Palviainen, Harri Koivusalo, Juuli Suominen, Heli Koponen, and Annamari Laurén

Drained peatland forests cover a substantial fraction of boreal landscapes and are increasingly exposed to drought under a warming climate. After drainage, a mor humus layer has gradually developed on top of the peat—these sites are called transformed drained peatlands. This transformation fundamentally alters soil hydraulic properties and may increase drought sensitivity by weakening hydraulic connectivity between soil layers. However, the hydrological role of the mor layer and its impact on rootzone moisture availability remains poorly represented in current peatland ecohydrological models.

This study investigates how the mor layer regulates soil moisture and water table dynamics during dry periods. We compare the soil moisture and water table dynamics of a mor–peat profile using three different hydrological modelling approaches: i) a hydrostatic equilibrium model for the whole profile, ii) a mor-layer bucket model coupled to peat in hydrostatic equilibrium, and iii) a full 1D numerical solution of the Richards equation.

Preliminary results indicate that the mor layer can substantially modify near-surface soil moisture during drying events by limiting upward capillary flow from deeper peat layers. This hydraulic decoupling leads to faster topsoil drying and altered soil moisture profiles compared to simulations with an assumption of hydrostatic equilibrium. On the other hand, the drying mor layer rapidly starts to restrict evapotranspiration and protects water storage in the underlying peat. These effects are most pronounced during prolonged summer droughts, when evapotranspiration demand is high and capillary upflux becomes critical for sustaining root-zone moisture.

The proposed improvements to the description of hydrological interactions within the mor–peat profile advance process-based simulation of drought responses in transformed peatland forests. The results contribute to a better mechanistic understanding of soil moisture dynamics under meteorological extremes and provide a foundation for assessing drought risk and adaptive water management strategies in peatland forestry.

How to cite: Rantalainen, E., Palviainen, M., Koivusalo, H., Suominen, J., Koponen, H., and Laurén, A.: Progression of Drought in the Mor–Peat Profile of Transformed Drained Peatlands—a Modelling Study, EGU General Assembly 2026, Vienna, Austria, 3–8 May 2026, EGU26-9708, https://doi.org/10.5194/egusphere-egu26-9708, 2026.

EGU26-10883 | ECS | Orals | HS10.3

Benchmarking a long short-term memory model against a process-based model for peatland water level dynamics 

Hugo Van Nieuwenhove, Michel Bechtold, Stef Lhermitte, Ankur Desai, and Gabrielle De Lannoy

Peatlands play a critical role in the global carbon cycle, with water level dynamics strongly controlling their function as carbon sinks or sources. While process-based models are commonly used to simulate peatland hydrology, the potential of data-driven approaches remains largely unexplored at large spatial scales.

Here, we assess the capability of a Long Short-Term Memory (LSTM) model to simulate daily water level in natural northern peatlands (40°N–75°N), trained on a diverse set of in situ water level observations. Model performance is evaluated against the same in situ water level observations using a strict block-wise cross-testing scheme. Furthermore, model performance is benchmarked against simulations from NASA’s Catchment Land Surface Model with peatland modules (PEATCLSM).

The LSTM model demonstrates improved agreement with in situ water level observations compared to PEATCLSM in terms of root mean square difference and bias, while the PEATCLSM exhibits higher spatial and temporal correlation with the in situ observations. Feature importance analysis indicates that the LSTM model captures key hydrological controls on water level dynamics, with precipitation and reference evapotranspiration emerging as dominant drivers, followed by leaf area index and snow water equivalent.

The lack of sufficient in situ water level observations for model training, both in terms of record length and spatial coverage across peatland sites, restricts the development of a model with additional input variables that could enhance performance. Despite these limitations, the LSTM model shows spatial patterns consistent with the process-based model, supporting its reliability. These findings highlight the potential of deep learning approaches such as LSTM-based modeling to complement traditional process-based modeling of peatland hydrology. Future improvements will depend on collaborative data sharing to enhance training datasets and support informed climate and environmental decisions.


How to cite: Van Nieuwenhove, H., Bechtold, M., Lhermitte, S., Desai, A., and De Lannoy, G.: Benchmarking a long short-term memory model against a process-based model for peatland water level dynamics, EGU General Assembly 2026, Vienna, Austria, 3–8 May 2026, EGU26-10883, https://doi.org/10.5194/egusphere-egu26-10883, 2026.

EGU26-13208 | Posters on site | HS10.3

Geospatial Assessment of Groundwater Influence at Finland’s National Monitoring Network for Restored Peatlands 

Elina Lindsberg, Lauri Ikkala, Kirsti Korkka-Niemi, Lassi Päkkilä, Hannu Marttila, Santtu Kareksela, and Liisa Maanavilja

In peatland restoration, successful restoration of hydrology is the main prerequisite for restoring the targeted plant community and ecosystem functioning. In peatlands, groundwater influence may enhance restoration success by providing a stable water supply.  Moreover, groundwater often supports habitat types of high floristic value.

The objective of this study was to assess the potential groundwater influence within the Finland’s national monitoring network for restored peatlands. The work is a part of the ECO-WADE project (Enhanced Understanding of Carbon and Groundwater Dynamics in European Peatlands and Their Related Ecosystem Services), funded by the Research Council of Finland and the EU Water4All partnership.

Potential groundwater influence was first identified using open-access geospatial datasets. The study utilized geological data such as information on glaciofluvial formations, which can be significant sources of groundwater for downstream peatlands. Mapped groundwater discharge locations, such as springs, and catchment areas and surface-water flow paths delineated using digital elevation models were used to study the potential connections. Groundwater influence was also examined using open satellite datasets. During the warm summer season, groundwater discharge areas appear cooler than their surroundings in thermal imagery. In winter, under snow-covered conditions, these areas may appear as patches with reduced or absent snow cover.

The geospatial and remote sensing analyses were compared with porewater temperature and water quality parameters (e.g., electrical conductivity, pH) collected from monitoring sites to determine whether these indicators also reflect groundwater influence.

The results showed the monitoring sites potentially fed by groundwater. Information derived from open geospatial and remote sensing datasets can support and guide the assessment of hydrological restoration success and help identify restoration sites with the potential to sustain valuable habitat types.

How to cite: Lindsberg, E., Ikkala, L., Korkka-Niemi, K., Päkkilä, L., Marttila, H., Kareksela, S., and Maanavilja, L.: Geospatial Assessment of Groundwater Influence at Finland’s National Monitoring Network for Restored Peatlands, EGU General Assembly 2026, Vienna, Austria, 3–8 May 2026, EGU26-13208, https://doi.org/10.5194/egusphere-egu26-13208, 2026.

EGU26-13359 | ECS | Orals | HS10.3

Estimates of biogenic gas dynamics in a northern raised bog inferred from hydrogeophysics 

Raymond Hess, Henry Moore, Brittni Bertolet, Xavier Comas, Andrew Reeve, Dimitrios Ntarlagiannis, and Lee Slater

While patterned pools along the crest of northern raised bogs are surface features, their underlying geologic structure has been shown to influence local hydrology and, by extension, biogeochemistry. Beneath these pools, pore spaces accumulate biogenic gases, for which production depends on the availability of labile carbon. Some of these gases are released via ebullition, a bubble-transport mechanism by which gases migrate through the peat column and into the atmosphere. Our team targeted open-water pools in Caribou Bog, Maine (U.S.A.), to capture differences in ebullition and identify contrasts in dissolved methane and carbon dioxide. Distinct sites were selected for comparison: [1] on-esker sites, underlain by permeable glacial deposits, that locally form near-surface ridges, and [2] off-esker sites, underlain by a hydraulically confining glaciomarine clay, that blankets much of the peatland basin. Ebullition recorded in custom-built floating gas traps showed a fivefold increase in collection at the on-esker site. Gas chromatography analysis of sampled ebullition revealed methane concentrations ≥4000 ppm at sites proximal and distal to the esker transect. At both locations, headspace-equilibrated concentrations of dissolved methane in pools surged by two orders of magnitude, coinciding with drops in atmospheric pressure below 101.25 kPa. This suggests that falling surface pressure triggers discrete pulses of gas migration from over-pressured pore spaces. Further, dissolved concentrations of methane in water from nested wells confirm active methanogenesis in the catotelm, down to nine meters depth. Within the peat column, gas accumulation and migration were investigated over a 12-day period in August using repeated common-midpoint ground-penetrating radar (GPR) surveys. Coupling electromagnetic wave velocities with the complex refractive index model, 1D models of gas content were produced for off- and on-esker locations. These gas content estimates indicate that biogenic accumulation is, on average, 5–7% greater at sites along the beaded esker transect. Combined, these results suggest that underlying esker structures act as localized hot spots for biogenic gas production, storage, and enhanced ebullition.

How to cite: Hess, R., Moore, H., Bertolet, B., Comas, X., Reeve, A., Ntarlagiannis, D., and Slater, L.: Estimates of biogenic gas dynamics in a northern raised bog inferred from hydrogeophysics, EGU General Assembly 2026, Vienna, Austria, 3–8 May 2026, EGU26-13359, https://doi.org/10.5194/egusphere-egu26-13359, 2026.

EGU26-13675 | ECS | Orals | HS10.3

Peatland hydrology shapes dissolved silicon dynamics across peat profiles 

Louis-Marie Le Fer, Jean-Sébastien Moquet, Christophe Guimbaud, Nicolas Freslon, Nicolas Deschamps, and Julien Bouchez

Hydrology plays a fundamental role in peatland functioning and controls the silicon (Si) cycle in these ecosystems. Most peatlands are groundwater-dependent systems, where interactions between aquifers, peat layers, and surface waters regulate solute transport and nutrient cycling, including dissolved silicon (DSi). DSi is a key nutrient for primary producers in freshwater and marine ecosystems and contributes critically in regulating carbon cycle both at local (watershed) and global scale (land-ocean-atmosphere continuum). Hydrological processes, including groundwater fluxes and water circulation between surface and deep peat layers strongly influence silicon dynamics. Understanding local peatland hydrology is therefore essential to assess the role of peatlands as filters controling continental Si exports. Despite this central function, groundwater-peatland interactions remain poorly understood, limiting our ability to quantify peatlands’ contribution to global Si fluxes.

In this context, this study investigates how peatland hydrology, and particularly aquifer-peatland connectivity, shapes the dynamics of dissolved silicon within a temperate peatland system.

We implemented an integrated field-based approach, relying on long-term hydrological data collected hourly since 2008 and monthly hydrochemical measurements acquired since 2014, providing a robust framework to investigate peatland control on dissolved silicon fluxes. This was conducted at La Guette peatland, a lowland temperate peatland in the Sologne region (France) and part of the SNO Tourbières long-term observatory network. Paired surface and deep piezometers were installed both upstream and downstream of the peatland allowing for investigation of vertical, lateral and temporal variability in water and solute dynamics. Hydrological analyses based on water balance calculations are combined with a multi-tracer geochemical approach to assess groundwater contribution. Silicon dynamics are further examined using concentration-isotope ratio (DSi-δ³⁰Si) relationships to disentangle biological and hydrological controls.

Preliminary results indicate the presence of groundwater inputs originating from the surrounding sandy aquifer, supporting the characterization of the La Guette peatland as a groundwater-dependent ecosystem. The data reveal vertical and lateral gradients, as well as temporal variability in both DSi concentrations and δ³⁰Si signatures. Concentration-isotope ratio relationships suggest a seasonal shift in dominant controls, with biologically influenced silicon dynamics during spring and summer and hydrologically driven processes during autumn and winter. Together, these observations provide new insights into the links between peatland hydrology and silicon dynamics and highlight the need to further investigate groundwater-peatland interactions when assessing peatland contributions to continental biogeochemical fluxes.

How to cite: Le Fer, L.-M., Moquet, J.-S., Guimbaud, C., Freslon, N., Deschamps, N., and Bouchez, J.: Peatland hydrology shapes dissolved silicon dynamics across peat profiles, EGU General Assembly 2026, Vienna, Austria, 3–8 May 2026, EGU26-13675, https://doi.org/10.5194/egusphere-egu26-13675, 2026.

EGU26-13850 | ECS | Orals | HS10.3

Testate amoeba as a palaeohydrological indicator in mountain peatlands in the south of Norway  

Christian Quintana, Anne Bjune, Alistair Seddon, and Hanna Lee

The use of testate amoeba as a palaeohydrological indicator in Norwegian wetlands is very limited and mainly focused on salt marshes with non-existent studies in this field in boreal, Atlantic, and mountain peatlands. This study could be the basis for additional future work on understanding past hydrological dynamics in Norwegian mountain peatlands by qualitatively or quantitatively approaches of reconstruction. The study areas included: 1) a more ombrotrophic bog located in Upsete at around 800 m.a.s.l facing a more Atlantic climate and near the treeline, and 2) a poor fen in Øynan, located at a higher elevation site (1100 m.a.s.l) in the low alpine region with a more continental climate in the southern mountain area of the country. To isolate the testate amoebas, we followed a water-based method and under the microscope, we counted a minimum of 150 testates in around 30 samples per peat profile for each of the two sites. Among the species of Testate amoebae that indicated wetter conditions, we found Archerella flavum, Centropyxis discoides, Hyalosphenia papillo and Heleopera petricola as the most representatives. There are two marked periods at Upsete, where wetter indicator species appear: between 9500 and 10500 yrs BP and between 3000 and 4500 BP. Similarly, at the Øynan site, the periods that indicated wetter conditions correspond to 8000 – 9000 yrs BP and 3500 – 5000 yrs BP. At the same time, the wetter periods indicated by testate amoebae analyses also match the periods of higher carbon accumulation that was also recorded in the laboratory.

How to cite: Quintana, C., Bjune, A., Seddon, A., and Lee, H.: Testate amoeba as a palaeohydrological indicator in mountain peatlands in the south of Norway , EGU General Assembly 2026, Vienna, Austria, 3–8 May 2026, EGU26-13850, https://doi.org/10.5194/egusphere-egu26-13850, 2026.

EGU26-14313 | Orals | HS10.3

Imaging peatland hydrogeological structure using electrical impedance tomography 

Adrian Flores Orozco, Katarina Akalovic, Lena Steiner, Sophie Francis, Clemens Moser, Mathias Hopfinger, and Bernhard Salcher

Peatland management, conservation, and restoration rely on a thorough understanding of peatland hydrogeology and carbon dynamics. To date, most of the information about peatland subsurface properties is derived from laboratory analyses of borehole samples, which allow direct measurement of hydrogeological and geochemical parameters but provide only point-wise information. Here, we present the use of the low-frequency electrical impedance tomography (EIT) to investigate hydrogeological properties and carbon dynamics in alpine peatlands in an imaging framework. In particular, we aim to map biogeochemical hotspots and to delineate flow paths controlling surface-groundwater interactions and nutrient cycles. The EIT method is an extension of the widely-used electrical resistivity tomography (ERT), which deploy electrodes (placed on the ground) to inject current to resolve the conductive (conductivity) and capacitive (polarization) properties of the subsurface along 2D planes or 3D volumes. While the electrical conductivity (due to migration of charges in the pore space) has been commonly used to investigate variations in saturation, porosity and fluid electrical conductivity (EC); the polarization (i.e., capacitive effect, resulting from accumulation and polarization of charges in the fluid-grain interface), provides a unique opportunity to gain information about changes in pore-space geometry, cations exchange capacity and soil organic carbon (SOC). To resolve the frequency-dependence of the electrical properties, imaging measurements were collected in the range between 0.1 and 75 Hz, while vertical soundings were conducted between 0.1 and 1000 Hz. This information is needed to discriminate between SOC and clay content and quantify changes in hydraulic properties. The geophysical investigations are supported by the analysis of material extracted from boreholes.  

The EIT surveys were conducted across six alpine peatlands in Austria to characterize the variability in electrical properties at both local (site-specific) and regional (inter-site) scales. The investigated peatlands mainly originated through terrestrialisation of lakes that had formed in glacially eroded depressions at the end of the Last Glacial Maximum. Accordingly, substratum is dominated by lacustrine fines in direct proximity to glacial sediments and various types of alpine bedrock.

Our results reveal that the electrical conductivity and polarization are consistent for data collected across the different peatlands, supporting the relevance of the EIT method for peatlands investigations. We demonstrate that incorporating polarization as an additional parameter alongside electrical conductivity improves the resolution of peat thickness compared to interpretations based solely on electrical conductivity. Moreover, the polarization response reveals clear spatial variations related to geochemical variations in the organic soil. While the electrical properties are consistent, important changes in the polarization response can be observed in degraded peatlands, demonstrating the potential of the EIT method for the design of remediation and conservation strategies. Ongoing tracer experiments aim to validate petrophysical models connecting electrical and hydraulic properties in an imaging framework.

How to cite: Flores Orozco, A., Akalovic, K., Steiner, L., Francis, S., Moser, C., Hopfinger, M., and Salcher, B.: Imaging peatland hydrogeological structure using electrical impedance tomography, EGU General Assembly 2026, Vienna, Austria, 3–8 May 2026, EGU26-14313, https://doi.org/10.5194/egusphere-egu26-14313, 2026.

EGU26-14498 | ECS | Posters on site | HS10.3

Experimental Study of Geochemical changes in a Degraded Fen Peatland during Rewetting 

Jovel Johnson, Felix Ortmeyer, and Andre Banning

Organic soils such as peatlands, which form through many years of accumulation of organic matter under waterlogged conditions provide many ecological benefits such as storing ca. 30 % of the global soil carbon, acting as a sink for many nutrients and pollutants, playing a crucial role in the water cycle, and hosting numerous species of plants and animals. Drainage of many peatlands for agriculture and other activities have contribute to approximately 7 % of the total anthropogenic greenhouse gas emissions in the European Union. The conservation and management of the peatland require in depth knowledge of the hydrological processes, water chemistry, and other controlling factors. This study focuses on the geochemical changes encountered while rewetting a fen peatland located in the northeastern part of Germany that is planned for installation of photovoltaic elements, aiming to make the rewetting both ecologically and economically viable. Rewetting of peatland that has undergone years of drainage-induced degradation can result in the aqueous release and transport of trace elements and nutrients, thereby deteriorating the quality of downstream groundwater. We conducted rewetting column experiments aiming to understand the geochemical processes and reaction pathways that can be encountered while rewetting degraded peat bodies. As part of this experiment, three highly degraded peat samples and one moderately degraded peat sample of 30 cm thickness were collected from the study site that represent three different water level situations and are simulated to undergo rewetting using peat pore water obtained from the field. The columns were supplied with circulating water at a flow rate of 8.3*10-5L*s-1, at 10 °C, representing groundwater temperature, for a period of 100 days. Regular sampling of peat water from the column reservoir for major and trace element analyses as well as in-situ parameters measurements have contributed to understanding hydrogeochemical mechanisms and evolution. In addition, microbial analysis of the peat water and soil, before and after the rewetting experiment, will contribute insights into the influence of bacteria on the geochemical processes taking place under anoxic conditions. Analysis of the peat column after the rewetting experiments will provide crucial information on the changes of the peat geochemistry and element mobility. The experimental approach combined with geochemical modelling will enhance the understanding of the alterations in the peat water chemistry and estimate the potential impacts on downstream water resources quality.

How to cite: Johnson, J., Ortmeyer, F., and Banning, A.: Experimental Study of Geochemical changes in a Degraded Fen Peatland during Rewetting, EGU General Assembly 2026, Vienna, Austria, 3–8 May 2026, EGU26-14498, https://doi.org/10.5194/egusphere-egu26-14498, 2026.

EGU26-15064 | ECS | Orals | HS10.3

Advancing tropical peatland hydrology in the Noah-MP land surface model 

Arijit Chakraborty, Patrick Willems, Gabriëlle J. M. De Lannoy, David M. Mocko, Sujay V. Kumar, Cenlin He, Landry Nkaba, Bart Crezee, Raphael M. Tshimanga, and Michel Bechtold

Tropical peatlands, which cover 13–15% of the global peatland area, play a vital role in the global carbon storage, yet their key hydrological processes influencing carbon dynamics are not well accounted for in most land surface models. The Cuvette Centrale wetland of the Congo Basin is the world’s largest continuous tropical peatland area, which is governed by a complex hydrology. It is partly driven by river-peatland interactions and a spatially variable bimodal annual precipitation pattern across the Congo Basin, as well as by an unknown influence of deeper groundwater on the phreatic water levels (WL) in the peatlands. Accurate estimation of water and carbon dynamics for peatlands necessitates advancements in land surface models by incorporating peatland-specific modules to simulate key hydrological processes. In this study, we enhance the Noah-Multiparameterization (Noah-MP) land surface model to incorporate peatland hydrological processes, by including peat soil hydraulic parameters, microtopographic integration, and new runoff and evapotranspiration schemes. The peatland-specific scheme and the default TOPMODEL scheme of Noah-MP (further called “reference”) are applied across the Cuvette Centrale domain using two different meteorological forcing datasets, MERRA-2 and MERRA-2 with CHIRPS precipitation. The simulations were evaluated using in-situ WL observations and terrestrial water storage anomaly (TWSA) observations from the GRACE and GRACE-FO missions. Preliminary evaluation with in-situ WL observations shows overall improvement for peatland-specific simulations compared to the reference. Especially for the experiment with CHIRPS precipitation, which generally showed the better skill metrics, the new peatland scheme shows 5.79% increase in correlation and 86% reduction in RMSE compared to the reference driven by the same forcing. The terrestrial water storage anomalies simulated by the peatland-specific model in conjunction with altimetry-based river water storage estimates, also show an increased anomaly correlation with GRACE mascon-derived water storage anomalies. By more realistically representing the peatland hydrology, this work lays the groundwork for improved predictions of tropical peatland carbon–water interactions, with future scope for coupling with a river-routing model to better understand the peatland-river interactions for the Congo peatlands.

How to cite: Chakraborty, A., Willems, P., De Lannoy, G. J. M., Mocko, D. M., Kumar, S. V., He, C., Nkaba, L., Crezee, B., Tshimanga, R. M., and Bechtold, M.: Advancing tropical peatland hydrology in the Noah-MP land surface model, EGU General Assembly 2026, Vienna, Austria, 3–8 May 2026, EGU26-15064, https://doi.org/10.5194/egusphere-egu26-15064, 2026.

EGU26-17181 | ECS | Orals | HS10.3

Exploring oxygen intrusion as explanation for observed emission differences in Dutch peatlands. 

Pepijn van Elderen and Ype van der Velde

Many countries in the world are trying to reduce their carbon emissions to minimize climate change, as described in the Paris Agreement of 2015. Alongside well-known, worldwide sectors contributing to emissions such as transport, industry and mining, drained peatlands can substantially contribute to national emission such as in The Netherlands. The organic matter in peat is susceptible to decomposition; the breakdown of organic tissue and transformation into carbon dioxide, methane and N2O gas by microbes. Oxic decomposition with oxygen from the air occurs above the groundwater table, while anoxic decomposition occurs in the absence of oxygen above and below the groundwater table. Oxic decomposition is the more optimal method of organic matter breakdown, resulting in faster decomposition rates and higher emissions. To evaluate if yearly emission reduction targets are achieved, models are used to estimate the amount of carbon emissions originating from peat meadow areas. Although many types of models with a wide range of complexities are used, a key element is usually that the groundwater level determines the boundary between the oxic and anoxic decomposition zones. Therefore, a thicker oxic zone will result in more emissions if the other conditions remain stable as more organic matter is exposed to oxygen. However, oxygen intrudes the soil by diffusion and advection. The oxygen intrusion takes time and is limited by pore connectivity and temperature, which vary with depth. Thus, oxygen intrusion on a yearly timescale is likely not linear with the yearly average groundwater level, but depends on the peat type, peat profile and temperature conditions. The model used to estimate the Dutch national carbon emissions applies a continuous linear increase of carbon emissions with decreasing groundwater levels that fits with the Dutch observed emissions. However, countries like Germany, and Denmark favor an S-shaped relationship that describes maximum emissions below a certain groundwater depth.


This research uses a dedicated process model to further investigate this relationship between groundwater level and emissions. Specifically, we look at the relationship between oxygen intrusion into the peat soil and carbon emissions. We use a model that is calibrated for a drained peatland under intensive agricultural use. We calibrated on observed CO2 emissions and soil redox conditions. Subsequently, we vary the oxygen diffusion coefficient in the model, which is likely to depend on decomposition degree, clay fraction and peat compaction. We find that in simulations with limited oxygen intrusion deeper summer groundwater tables do not result in equally more oxygen in the soil. Oxygen intrusion trails the groundwater depth, and this intrusion delay is explained by diffusion limitations and oxygen consumption by microbes near the surface. This limits the potential for decomposition at larger depths during deep groundwater tables. Consequently, we find that the increase of emissions with decreasing yearly average groundwater levels follows the well-known S-curve for peatland with a low oxygen diffusion into the soil or deep groundwater levels. This result is an important step in our understanding of observed emissions for different peat types and groundwater management strategies.

How to cite: van Elderen, P. and van der Velde, Y.: Exploring oxygen intrusion as explanation for observed emission differences in Dutch peatlands., EGU General Assembly 2026, Vienna, Austria, 3–8 May 2026, EGU26-17181, https://doi.org/10.5194/egusphere-egu26-17181, 2026.

EGU26-18195 | ECS | Orals | HS10.3

Exploring the potential of using low-energy cosmic-ray neutrons to monitor soil moisture dynamics in wetlands 

Daniel Rasche, Torsten Sachs, Aram Kalhori, Markus Morgner, Andreas Güntner, and Theresa Blume

In past two decades, Cosmic-Ray Neutron Sensing (CRNS) has evolved to a useful and promising approach to monitor soil moisture as well as snow water equivalents and biomass non-invasively at the hectometre-scale. Its large integration radius and average sensitive measurement depth of 20 to 30 cm allows for overcoming small-scale heterogeneities and for estimating soil moisture at spatio-temporal scales to e.g., inform environmental models or validate soil moisture products from remote sensing data.

CRNS relies on the inverse relationship between environmental hydrogen e.g., stored in soil moisture and the intensity of naturally occurring low-energy cosmic-ray neutrons. The relationship between soil moisture and neutron intensity is strongly non-linear which leads to larger uncertainties when the soil moisture is high. At the same time, neutron-to-soil moisture conversion functions have been developed for homogeneous soil moisture distributions which leads to larger uncertainties in soil moisture estimates for strongly heterogeneous conditions. Therefore, CRNS is expected to provide most accurate soil moisture estimates at monitoring sites with generally drier soils and homogeneous soil moisture distributions while knowledge gaps remain with respect to wet and heterogenous observation sites e.g., due to partial water cover.

Against this background, we investigate the signal dynamics of observed low-energy cosmic-ray neutron intensities at a wetland site in north-eastern Germany in order to gain understanding of the local background neutron flux and the potential to estimate soil moisture in water-free areas of wetland sites. Therefore, we monitor neutron intensities at two locations in the wetland with different partial water cover in the sensitive measurement radius of the individual neutron detectors, apply Monte-Carlo based neutron transport simulations and use field measurements of soil moisture to test and adjust existing neutron-to-soil moisture conversion functions to the specific conditions of the observation site.

Our analyses underline the potential of non-invasive CRNS for monitoring soil moisture dynamics in water-free areas of wetland sites which are generally considered unfavourable for the CRNS technique but also shed light on limitations at these observation sites.

How to cite: Rasche, D., Sachs, T., Kalhori, A., Morgner, M., Güntner, A., and Blume, T.: Exploring the potential of using low-energy cosmic-ray neutrons to monitor soil moisture dynamics in wetlands, EGU General Assembly 2026, Vienna, Austria, 3–8 May 2026, EGU26-18195, https://doi.org/10.5194/egusphere-egu26-18195, 2026.

EGU26-19121 | Posters on site | HS10.3

Stochastic Modelling of Seepage through Peat Bunds used to Rewet Cutaway Raised Bogs in Ireland 

Sajjad Ahmad, David Igoe, and Shane Regan

Peatland restoration using cell bunding relies on low peat embankments to retain target water levels, yet seepage through such peat bunds is difficult to predict because hydraulic conductivity varies over orders of magnitude and is strongly spatially structured. This study quantifies steady-state seepage uncertainty for a representative two-layer bund system at All Saints Bog (Ireland) using a random finite element framework. Layer-specific conductivity statistics were obtained from laboratory tests on undisturbed peat cores and represented as lognormal in physical space. Spatial heterogeneity was modelled using anisotropic Gaussian random fields generated by the spectral representation method within a 3 × 3 factorial design, spanning three variance levels and three correlation-scale settings for both bund and base layers. For each group, ten independent realisations were mapped element-wise in a PLAXIS 2D seepage model and solved under realistic operational heads from 0.00 to 0.35 m. Discharge was extracted at multiple vertical control sections and at the downstream toe, and analysed using ensemble seepage rate – head (Q–H) relationships, local sensitivity, variance decomposition, and exceedance statistics. Seepage rate increased nonlinearly with head, and uncertainty amplified towards the seepage face toe, where coefficients of variation at H=0.35 m ranged from 8% to 36% across groups (compared with 6% to 21% mid-bund). Upper-tail behaviour strengthened with increasing variance and longer correlation scales; at the toe, Q95​ and Q99​ at H=0.35 m reached 8.60×10⁻⁴ and 1.07×10⁻³ Ls−1m−1, respectively. The results show that exceedance-based seepage quantiles provide more decision-relevant estimates than mean values alone and offer a practical basis for reliability-informed bund design. These results can also be used to help modelling the overall performance of such peatland bund network used in the restoration of raised bogs.

How to cite: Ahmad, S., Igoe, D., and Regan, S.: Stochastic Modelling of Seepage through Peat Bunds used to Rewet Cutaway Raised Bogs in Ireland, EGU General Assembly 2026, Vienna, Austria, 3–8 May 2026, EGU26-19121, https://doi.org/10.5194/egusphere-egu26-19121, 2026.

EGU26-19747 | Posters on site | HS10.3

High resolution automated water table mapping using UAV LiDAR terrain data and near real time water logger measurements 

Timothy Husting, Görres Grenzdörffer, Henriette Rossa, Tom Ahlgrimm, Milan Bergheim, Gerald Jurasinski, and Daniel L. Pönisch

The water table depth (WTD) is one of the main drivers for greenhouse gas (GHG) emissions in peatlands. Peatlands act as long term carbon sinks when the water table remains close to the soil surface, whereas drainage typically leads to substantial GHG emissions. Hence, detailed spatial water table information with high temporal resolution is a crucial requirement for evaluating restoration success and supporting practical management decisions. Combining continuous in situ WTD measurements with remote sensing approaches can open an innovative way of deriving hydrological information for applied peatland management und restoration. However, few studies combine near real time in situ loggers with remote sensing to generate spatially continuous and frequently updated water table products for operational monitoring.

Here we present an end-to-end workflow for automated water table mapping, that couples continuously transmitted in situ water level measurements and high-resolution terrain information by UAV LiDAR with immediate data processing. A network of water level loggers transmits measurements every 30 minutes automatically to a central database using the public cellular network. Additionally, UAV LiDAR point clouds are acquired twice a year using a Zenmuse L2 sensor, suitable for the use in densely vegetated areas. Ground points are classified using the cloth simulation filter to minimize residual canopy artefacts to generate a 0.25 m Digital Terrain Model (DTM) to capture peatland microrelief. The generated DTM ist then validated against RTK GNSS ground truth points to quantify the vertical accuracy and ensure the reliability of the LiDAR data. The WTD is computed by referencing gauge water levels to the DTM. Spatially continuous water level maps are produced using a regression kriging approach that exploits the strong dependence of water level on relative surface elevation. Model performance is evaluated by using leave-one-out cross-validation across the gauge network, allowing a direct comparison of LiDAR based against public DTM based WTD and quantifying uncertainty in derived water level maps.

Initial results suggest that the LiDAR based DTM reduces elevation bias compared to public DTMs and yields more consistent interpolated WTD dynamics, especially in heterogeneous areas. Furthermore, by linking near real time logger data with high resolution DTMs, the workflow enables a reproducible, automated delivery of regularly updated WTD maps for operational use to support water management, restoration planning and the establishment of paludiculture. In addition, these products provide hydrological inputs for proxy based GHG emission assessment, e.g. supporting GEST (Greenhouse Gas Emission Site Types) approach for baseline emission estimates in strongly drained areas and for tracking changes during the transition after rewetting. The output can contribute to monitoring, reporting and verification of workflows, supporting certification schemes such as voluntary carbon crediting.

How to cite: Husting, T., Grenzdörffer, G., Rossa, H., Ahlgrimm, T., Bergheim, M., Jurasinski, G., and Pönisch, D. L.: High resolution automated water table mapping using UAV LiDAR terrain data and near real time water logger measurements, EGU General Assembly 2026, Vienna, Austria, 3–8 May 2026, EGU26-19747, https://doi.org/10.5194/egusphere-egu26-19747, 2026.

EGU26-19920 | Orals | HS10.3

Unprecedented sensor network in rewetted fens in northeastern Germany reveals high variability of hydrological conditions 

Anke Günther, Martin Aleksandrov, Florian Jansen, Dipendra Yadav, Kristina Yordanova, and Jürgen Kreyling

We established a sensor network to monitor basic environmental state variables in rewetted temperate fens at an unprecedented scale as part of the TRR 410 WETSCAPES2.0 project (funded by DFG, Project-ID 531801029). Monitoring locations were selected from a pool of all peatland rewetting projects in the federal state of Mecklenburg-Vorpommern in northeastern Germany using a standardized, remote-sensing-based procedure to obtain the most representative homogeneous area in each site. At each location, we installed sensors that measure groundwater table, soil moisture, and soil/air temperature and transmit their data live via LoRaWAN.

Over the last months, more than 80 sites have been set up in coastal and freshwater fens. Despite all sites being considered “rewetted”, they cover a wide hydrological gradient: In the first few months after setup, the average water levels in fall and winter ranged from more than 50 cm below ground surface up to almost 70 cm above ground. Also, already the first months of data indicate large differences in water level amplitude per site, ranging from less than 3 cm to more than 60 cm. No relationship between mean water level and amplitude of water level fluctuations could be observed. Several sites consistently showed soil water content in the upper layer less than 75%.

As the data set continues to grow, our data will help to enhance functional understanding of spatio-temporal implications of peatland rewetting, as well as serve in practical planning of future rewetting projects.

How to cite: Günther, A., Aleksandrov, M., Jansen, F., Yadav, D., Yordanova, K., and Kreyling, J.: Unprecedented sensor network in rewetted fens in northeastern Germany reveals high variability of hydrological conditions, EGU General Assembly 2026, Vienna, Austria, 3–8 May 2026, EGU26-19920, https://doi.org/10.5194/egusphere-egu26-19920, 2026.

EGU26-20351 | Posters on site | HS10.3

CYGNSS based Mapping of Inundation Dynamics in Congo Peatlands Using Machine Learning 

Yulin Pan, Michel Bechtold, Alexander Cobb, Arijit Chakraborty, Jiarong Ma, Landry Nkaba, Raphael Tshimanga, Frieke Van Coillie, and Sébastien Lambot

Peatlands store approximately one-third of the world’s soil carbon, making accurate mapping of surface water dynamics essential for understanding their role in the global carbon cycle. Global Navigation Satellite System - Reflectometry (GNSS-R) provides an effective means for long-term, large-scale monitoring of surface water, particularly in densely vegetated tropical peatlands due to the strong penetration capability of L-band signals.

In this study, we map inundation over the Congo Basin using data from the CYGNSS mission. The training, validation and testing data consist of 559 temporally sparse inundation fraction samples (March 2017-August 2021) derived from water table depth observations at four in-situ stations combined with information on spatial variability of ground elevation. Multiple features are extracted from CYGNSS delay–doppler maps and their retrieved reflectivity, including signal-to-noise ratio (SNR), statistical moments (mean, variance), and waveform-based indicators such as leading-edge slope (LES) and trailing-edge slope (TES). These GNSS-R features are combined with auxiliary variables including NDVI and precipitation and are used to train machine learning models (Random Forest) for estimating inundation fraction.

Model performance is evaluated using a leave-one-spatial-cluster-out cross-validation strategy to ensure spatial independence between training and testing data. The results demonstrate that models based on multiple CYGNSS features significantly outperform those using single features alone. At high inundation level, models based solely on CYGNSS tend to underestimate surface water coverage, whereas the inclusion of precipitation significantly reduces this bias and improves R² during highly saturated conditions. These findings highlight the strong potential of GNSS-R combined with machine learning for large-scale tropical peatland hydrological monitoring.

How to cite: Pan, Y., Bechtold, M., Cobb, A., Chakraborty, A., Ma, J., Nkaba, L., Tshimanga, R., Van Coillie, F., and Lambot, S.: CYGNSS based Mapping of Inundation Dynamics in Congo Peatlands Using Machine Learning, EGU General Assembly 2026, Vienna, Austria, 3–8 May 2026, EGU26-20351, https://doi.org/10.5194/egusphere-egu26-20351, 2026.

EGU26-20978 | Orals | HS10.3

The effects of drought on Sphagnum moss species and the implications for peatland carbon cycling in a changing climate 

James Benjamin Keane, Gareth D Clay, Nina Overtoom, Jonathan P Ritson, Martin G Evans, Angela Harris, and Adam Johnston

Peatlands store more carbon (C) than any other terrestrial ecosystem and as a C sink they are vital to mitigating climate change. The keystone of many peatland ecosystems is Sphagnum, a bryophyte genus of ca. 350 species found on every continent except Antarctica. With climate change, many peatlands face increasing frequency and severity of drought. How Sphagnum responds to, and recovers from, drought will be key to sustaining peatlands over the coming decades.

Through a combination of microcosm and field experiments we investigate how different Sphagnum species will respond to short- and long-term drought periods.  We detail the effects of drought on Sphagnum C cycling and biochemistry, including photosynthesis, growth, respiration and methane (CH4) fluxes. We show that there are species-specific limits to the ability of Sphagnum to withstand drought and that these align with the adaptations associated with the hummock-hollow microtopography of peatlands. Through this work we identify drought resilience, including a hysteresis between Sphagnum moisture content and C uptake which is delineated by pre-drought and rewetting. We discuss tipping points and determine C sink-source thresholds in Sphagnum which will have vital implications for future peatland C cycling.

How to cite: Keane, J. B., Clay, G. D., Overtoom, N., Ritson, J. P., Evans, M. G., Harris, A., and Johnston, A.: The effects of drought on Sphagnum moss species and the implications for peatland carbon cycling in a changing climate, EGU General Assembly 2026, Vienna, Austria, 3–8 May 2026, EGU26-20978, https://doi.org/10.5194/egusphere-egu26-20978, 2026.

EGU26-21139 | Posters on site | HS10.3

Monitoring peatlands with novel geophysical methods 

Amy Gilligan, Karen Lythgoe, Daniel Murray, Thomas Parker, Rebekka Atrz, and Mark Naylor

Understanding the subsurface structure and dynamics of peatlands, is key to understanding their role in ecosystem services and processes. Many existing methods are limited to capturing information about small surface areas, over limited time periods, and are labour intensive. Geophysical approaches have the potential to overcome some of these limitations.

We present the preliminary results of a project aiming to develop novel geophysical methods to image peat bogs in 3-dimensions and to monitor peatland health over time. We use seismic nodes for low-cost, non-invasive, continuous monitoring. A network of seven nodes has so far been deployed on an un-restored upland peatland setting in North East Scotland, with in situ waterloggers already established. Using ambient background noise (‘seismic interferometry’), we investigate how the seismic velocity changes over time as a proxy for groundwater changes, an important measure of peatland health. We further conduct an active seismic survey to assess peat thickness by combining surface wave dispersion with the natural ground resonance frequency, obtaining peat thicknesses of ~3.5m, comparable to depths measured using conventional peat probing. We also investigate the utility of other geophysical techniques to image peat structure and saturation, including Ground Penetrating Radar and Electrical Resistivity Tomography.

How to cite: Gilligan, A., Lythgoe, K., Murray, D., Parker, T., Atrz, R., and Naylor, M.: Monitoring peatlands with novel geophysical methods, EGU General Assembly 2026, Vienna, Austria, 3–8 May 2026, EGU26-21139, https://doi.org/10.5194/egusphere-egu26-21139, 2026.

EGU26-21609 | Orals | HS10.3

Hydrogeochemical Signature of Groundwater-Influenced Sloping Fen in the Calcareous Rich Northern Boreal Environment, Finland 

Kirsti Korkka-Niemi, Suvi Erhovaara, Seija Kultti, Niina Kuosmanen, and Annika Åberg

Groundwater-influenced, nutrient-rich sloping fens are characteristic of northeastern Finland, where they are affected by both groundwater discharge and surface water inputs, including spring floods. This study examines the geochemical composition of peat pore water in Puukkosuo, a sloping fen underlain by carbonate bedrock, with two objectives: (1) to evaluate the influence of groundwater discharge on peat hydrogeochemistry, and (2) to compare hydrochemical and geochemical signatures with those of northern boreal peatlands underlain by different bedrock types.

The 3D structure of the peatland was modeled to understand flow paths within the Peatland basin (Åberg et al. 2025). Four peat cores were collected to characterize peat composition, humification, and geochemistry, alongside pore water samples from the same locations (Erhovaara 2023). Porewater samples from three locations from different depths were analyzed for trace elements, major ion composition, pH, EC, TOC, TC, IC, NO3+NO2, NH4, Tot N, Tot P, stable isotopic composition of water and δ13C (DIC ) to assess groundwater and bedrock influence. Additional surface and groundwater samples were analysed for trace elements and majos ion composition, pH and EC as a reference.  

High Ca and Mg concentrations, as well as high pH and EC in pore water indicate strong groundwater input, while elevated nutrient levels observed at the western edge of Puukkosuo primarily reflect surface runoff. Although the broader catchment lacks extensive carbonate deposits, the presence of carbonate bedrock beneath Puukkosuo, combined with its sloping morphology, demonstrates that groundwater flow paths significantly shape the hydrogeochemical conditions of the fen.

Erhovaara, S., 2023. Carbon accumulation and peat geochemistry in the Puukkosuo fen during the Holocene. MSc. thesis, University of Helsinki. 45 p.

Åberg, A., Nurmilaukas, O., Korkka-Niemi, K. & Kultti, S., 2025. Kuusamossa sijaitsevan Puukkosuon maatutkaluotaukseen perustuva 3D-mallinnus. Geological Survey of Finland. GTK Open File Work Report 40/2025. 24 p. 

How to cite: Korkka-Niemi, K., Erhovaara, S., Kultti, S., Kuosmanen, N., and Åberg, A.: Hydrogeochemical Signature of Groundwater-Influenced Sloping Fen in the Calcareous Rich Northern Boreal Environment, Finland, EGU General Assembly 2026, Vienna, Austria, 3–8 May 2026, EGU26-21609, https://doi.org/10.5194/egusphere-egu26-21609, 2026.

EGU26-22034 | Orals | HS10.3

Views of a restored peatland from the past, underground, and future cedar swamp 

Christine Hatch, C. Lyn Watts, and Dana MacDonald

The Hydrologic Understory is an integrated research and extension project that explores groundwater flowpaths, surface water mixing, underground thermal regimes and soil moisture monitoring to map out the interconnected web of hydrology and ecology beneath the surface ultimately helping guide management of wetlands, including attracting desirable native species, creating and maintaining habitat for rare and endangered species including Atlantic White Cedar, cold water fishes and optimal water quality. 

In this cranberry-bog-turned-restored-freshwater-wetland, the largest in Massachusetts, we are exploring first principles measurements of hydrologic parameters to help guide restoration practices and management of this former peatland. One of the most basic, defining metrics of a wetland is, as the name implies, its wetness. We explore time series of temperature and water elevation data at a restoration site from retired farm, through restoration, and wetland development. While single measurements can indicate the groundwater table elevation below the ground surface at one time (a useful delineation metric), long time series can indicate how the site responds to storm flows, droughts, and other conditions; and how those responses are changed by restoration practice. Coupled with streamflow data, net water balance can be calculated as well as water residence time.  Temperature data serves as an indicator of thermal buffering capacity, the potential for development of thermal refugia for wildlife, and a tracer to locate influxes of groundwater. We use thermal imagery from UAS before and after restoration to map the surface expression of groundwater, and document the arc of change as the site rewilds. Distributed temperature sensing (DTS) buried at 10, 20 and 30 cm depths across the site allow for estimates of groundwater upwelling and soil moisture through time without creating additional subsurface disturbance.

Understanding long-term ecosystem dynamics in southeastern Massachusetts is achieved through a pollen and charcoal analysis of deep sediment cores spanning 9,140 years. This fire history record provides critical context for current restoration efforts of Atlantic White Cedar swamps, a rare and threatened ecosystem type in New England. Efforts are underway to co-steward these swamps together with local indigenous groups for whom they are critically important.

While the cranberry farming industry is in decline owing to competition from less expensive land and more productive varietals in other locations, everything under historic cranberry farms is ripe for resilient wetland restoration projects.  These low-lying water-rich areas are underlain by glacial geology (peats and clays) that are ideal for holding water, possess large accumulations of organic and hydric soils, and are currently sought-after by a statewide restoration program that aims to create a self-sustaining, resilient freshwater wetlands - promising hydrologic metrics are the first indicator of that success.

How to cite: Hatch, C., Watts, C. L., and MacDonald, D.: Views of a restored peatland from the past, underground, and future cedar swamp, EGU General Assembly 2026, Vienna, Austria, 3–8 May 2026, EGU26-22034, https://doi.org/10.5194/egusphere-egu26-22034, 2026.

EGU26-903 | ECS | PICO | HS10.5

Temporal changes in Ecosystem Resistance and Resilience to Compound Drought and Heat Extremes 

Amitesh Gupta and Karthikeyan Lanka

In recent decades, compound drought and heat-extreme (CDHE) events have garnered attention due to their amplified impacts on the food-energy-water nexus. In comparison to individual extremes, these short-duration compound events severely impede the terrestrial ecosystem, leading to perpetual damage, yield loss, and mortalities. During these events, plants experience xylem embolism, resulting in a reduced water transport capacity. Alongside, elevated heating intensifies the hydric stress resulting from soil dryness through cascading land-atmosphere interactions. This results in rising leaf-level evaporative demand and canopy temperature, driving stomatal closure, which in turn reduces carbon uptake and increases desiccation. However, the impact of these extreme events varies across plant-functional-types (PFTs), primarily due to differences in hydraulic and carbon-economy traits. On the other hand, plants can adjust their thermal tolerance, structure, and stomatal sensitivity by experiencing frequent perturbances; such acclimation alters their later responses. Therefore, there is not only a need to understand how terrestrial ecosystems varyingly respond to CDHE events, but it is also essential to investigate whether there are any temporal changes in their response.

In this study, we use rootzone soil moisture from GLEAM and near-surface air temperature from ERA-5 to identify CDHE events that persist for at least 5 consecutive days during the growing season during 2001-2021 globally. Then, we estimate the resistance and resilience of four distinct PFTs in the context of CDHE. These are: forests (woody), shrublands (non-forest-woody), grasslands (non-woody and natural), and croplands (non-woody and managed). We estimated resistance as the ratio between normalised loss (maximum perturbation in vegetation) and tolerance period (the time taken to reach maximum perturbation from its onset). Resilience is articulated as the recovery rate up to the pre-drought level following the tolerance period. For this purpose, we have acquired daily gridded datasets of gross primary productivity (GPP) and evapotranspiration (ET) from X-BASE and estimated the ecosystem water-use efficiency (WUE). It represents the coupled carbon-water exchange of vegetation at ecosystem-level. Since it is a flux ratio rather than a structural or radiometric index, it captures changes in plant function under environmental stress in ways that greenness metrics cannot. Under drought or heatwaves, ET declines faster than GPP in water-limited regions, resulting in momentary increases in WUE, followed by sharp decline as stress continues to increase. This bidirectional sensitivity is beneficial for analysing stomatal behaviour. Earlier studies have reported that WUE spontaneously responds to stomatal regulation and is also able to capture stress signals across woody and non-woody vegetation.

Outcomes of this study exhibit significant changes in ecosystem resistance and resilience during the last two decades; however, the magnitude of alterations varies across PFTs. During the period of tolerance and recovery, changes in WUE can result from physiological adjustments that alter photosynthesis per unit water loss, and changes in surface partitioning that alter the fraction of ET attributable to plants. Thus, we also evaluate the contribution of physiological coupling and hydrological partitioning (between vegetation and non-vegetative evaporation) in WUE alterations during tolerance and recovery periods, and found that these contributions also exhibit significant temporal changes.

How to cite: Gupta, A. and Lanka, K.: Temporal changes in Ecosystem Resistance and Resilience to Compound Drought and Heat Extremes, EGU General Assembly 2026, Vienna, Austria, 3–8 May 2026, EGU26-903, https://doi.org/10.5194/egusphere-egu26-903, 2026.

EGU26-3487 | ECS | PICO | HS10.5

Thermodynamic controls on vapor pressure deficit during droughts 

Sarosh Ghausi, Tejasvi Chauhan, and Axel Kleidon


Vapor pressure deficit (VPD) is widely used as a measure of atmospheric dryness and evaporative demand in drought studies, yet its interpretation as an independent drought driver remains unclear because of its close coupling to soil-moisture and radiation. Disentangling the atmospheric forcing from land-surface controls on VPD is essential for correctly diagnosing the drought responses, attributing ecohydrological impacts, and interpreting land–atmosphere feedbacks under water-limited conditions. Here, we present an analytical thermodynamic framework that mechanistically describes VPD as a function of observed radiative and surface-evaporative conditions, requiring no additional parameters. This formulation links VPD to variations in lower-atmospheric heat storage reflected in diurnal air temperature range (DTR) and  saturation vapor pressure. The resulting analytical expression is decomposable and helps to disentangle the atmospheric and land-surface drivers of VPD. When applied over global land, the approach reproduces observed spatial and temporal variability in VPD with R2 of 0.9 and 0.8 respectively. It captures observed responses of VPD to solar radiation, clouds, and evapotranspiration across diverse climate and moisture regimes. Our results demonstrate that much of the variability in VPD during dry periods emerges as a thermodynamic response to surface water limitation rather than purely atmospheric forcing. This coupling provides a mechanistic basis for interpreting VPD as both a driver and an indicator of ecohydrological drought responses, with important implications for diagnosing drought stress, understanding land–atmosphere feedbacks, and improving projections of ecosystem vulnerability under climate change.

How to cite: Ghausi, S., Chauhan, T., and Kleidon, A.: Thermodynamic controls on vapor pressure deficit during droughts, EGU General Assembly 2026, Vienna, Austria, 3–8 May 2026, EGU26-3487, https://doi.org/10.5194/egusphere-egu26-3487, 2026.

EGU26-4388 | PICO | HS10.5

Quantifying Eco-hydrological risks in the Yellow River Basin, China 

Yue-Ping Xu, Lu wang, Xiwei Chen, and Changmin Du

The Yellow River Basin (YRB) is an important ecological corridor in northern China, which has undergone substantial changes in multiple eco-hydrological processes. Such changes may decouple carbon, water and energy within ecosystem and cause substantial eco-hydrological risks. In this study, changes in key eco-hydrological variables are investigated and general associtions of evolution trends are revealed by correlation-based networks. Causal networks are then used with physical constraints, to quantitatively portray the directions and magnitudes of eco-hydrological feedbacks. A new index called the Standardized Compound Drought-Vegetation Loss Index (SCDVI) is proposed and used to quantify EHS risk based on stability (derived from resistance and resilience). The results show that the upper reaches of the basin, particularly the source and nearby subregion, show synergistic evolutions between ecological and hydrological subsystems while in the middle and lower reaches eco- and hydro-subsystems show poor synergistic changes. EHS stability was relatively low in the southeastern YRB, where the risk of experiencing compound drought and vegetation loss event (CDVE) was high. The study also found that regions with high vegetation productivity were more prone to a high resistance–low resilience trade-off, while areas with low vegetation productivity exhibited the opposite trade-off. 

How to cite: Xu, Y.-P., wang, L., Chen, X., and Du, C.: Quantifying Eco-hydrological risks in the Yellow River Basin, China, EGU General Assembly 2026, Vienna, Austria, 3–8 May 2026, EGU26-4388, https://doi.org/10.5194/egusphere-egu26-4388, 2026.

EGU26-4391 | ECS | PICO | HS10.5

Dissecting reverse sap flow in desert shrubs: effects of event timing, rainfall thresholds and species 

Zi'xuan Yuan, Yiben Cheng, and Lixia Chu

In arid regions, precipitation is scarce and predominantly occurs as pulsed rainfall events. These events alter both atmospheric and soil moisture conditions, thereby obscuring the dominant controls on plant water transport and making their role in replenishing vegetation water use unclear. We isolated the direct atmospheric pathway by excluding infiltration beneath canopies and quantified organ-level sap flow responses of Haloxylon ammodendron and Tamarix ramosissima to controlled rainfall applied in the morning, afternoon and at night (2, 6 and 10 mm) in the Ulan Buh Desert (June–August). Sap flow of primary branches, main trunks and root system was measured with heat-balance sensors and analysed against meteorological drivers using partial correlations and random-forest models. Responses were strongly time dependent: nighttime rainfall events most readily induced reverse flow, with larger magnitudes in H. ammodendron (e.g. −29.7 g·h-1 in stems; −5.2 g·h-1 in roots). Optimum rainfall amount differed by species: by day, reversals required ≈6 mm in H. ammodendron but ≈10 mm in T. ramosissima; at night, ≈2 mm versus ≈6 mm, respectively. Aboveground organs of T. ramosissima responded sooner (trunk 19 min; branch 21 min) than those of H. ammodendron (≈23 min), whereas root system of H. ammodendron responded earlier (38 min vs. 43 min). Photosynthetically active radiation was the dominant meteorological driver of sap flow in both species and exerted a stronger overall effect in T. ramosissima. Our results demonstrate that small, well-timed nighttime pulses can transiently reverse xylem flow via the atmospheric pathway, with species-specific optimum rainfall amount. This insight carries practical implications for the scheduling of restoration efforts in desert oases, particularly when incorporating considerations of water resource carrying capacity and planting density.

How to cite: Yuan, Z., Cheng, Y., and Chu, L.: Dissecting reverse sap flow in desert shrubs: effects of event timing, rainfall thresholds and species, EGU General Assembly 2026, Vienna, Austria, 3–8 May 2026, EGU26-4391, https://doi.org/10.5194/egusphere-egu26-4391, 2026.

EGU26-4805 | PICO | HS10.5

Vegetation Response to Meteorological and Agricultural Drought and Drought Propagation Characteristics in the Sub-Humid and Semi-Arid Regions of Northern China 

Jiayin Liu, Pei Wang, Renjie Guo, Zifan Zhang, Wenyang Cao, Yiran Liu, and Yuan Yuan

The response mechanisms of vegetation to drought vary significantly depending on both drought and vegetation types. Clarifying the propagation process from meteorological drought (MD) to agricultural drought (AD) and its impact on vegetation is of great significance for ecological barrier protection in China. Focusing on the sub-humid and semi-arid regions of Northern China, this study analyzes the time effect and driving factors of vegetation response to MD and AD, while quantifying the drought propagation time (DPT) during 1982–2020. The results indicate that: (1) Across the study area, MD response follows a "short lag-short cum" pattern, while AD exhibits "long lag-short cum" pattern. Compared to sub-humid regions, all vegetation types and forest sub-types in semi-arid regions show a "high sensitivity-high tolerance" pattern toward MD, while exhibiting a "delayed response-low tolerance" pattern toward AD. (2) Regarding MD, shrubland is the most sensitive, while grassland exhibits the highest tolerance; additionally, the drought tolerance of needleleaf forests exceeds that of broadleaf forests. Regarding AD, forests show the highest sensitivity and the strongest tolerance, with broadleaf forests responding more rapidly than needleleaf forests. (3) Significant soil hydrological buffering exists, with 51.8% of vegetation and 53.4% of forest regions exhibiting an 8–9 month DPT. Semi-arid response patterns align with the whole study area (grassland < forest < cropland < shrubland). Broadleaf is consistently shorter than needleleaf across the entire study area, as well as in sub-humid and semi-arid regions. (4) Among the driving factors of vegetation response to drought, temperature (TMP), precipitation (PRE), potential evapotranspiration (PET), and vapor pressure deficit (VPD) rank as the top three in importance. TMP dominates the lagged effects of vegetation response to both MD and AD, whereas PRE determines the cumulative effects for both drought types.

How to cite: Liu, J., Wang, P., Guo, R., Zhang, Z., Cao, W., Liu, Y., and Yuan, Y.: Vegetation Response to Meteorological and Agricultural Drought and Drought Propagation Characteristics in the Sub-Humid and Semi-Arid Regions of Northern China, EGU General Assembly 2026, Vienna, Austria, 3–8 May 2026, EGU26-4805, https://doi.org/10.5194/egusphere-egu26-4805, 2026.

EGU26-5253 | ECS | PICO | HS10.5

Linking Drought Stress to Vegetation Stability and Recovery at the Global River-Basin Scale 

Faisal Baig and Muhammad Abrar Faiz

Vegetation responses to drought play a central role in regulating land–atmosphere interactions, carbon cycling, and ecosystem stability, yet large-scale differences in vegetation resilience across river basins and climate regimes remain insufficiently characterized. This study examines drought-driven changes in vegetation stability and recovery at the global river-basin scale, combining historical observations from 2000–2023 with future projections for 2024–2099 under two climate scenarios (SSP245 and SSP585). Vegetation dynamics are assessed using satellite-derived leaf area index as an indicator of ecosystem condition, while meteorological drought, irrigation, and environmental controls are evaluated within a regression-based attribution framework. Results indicate that many major river basins exhibit weak precipitation control on vegetation dynamics, increasing exposure to drought stress, particularly in arid and semi-arid regions. Irrigation emerges as a key buffering mechanism, contributing between roughly one-fifth and one-half of vegetation resilience during pre-drought and drought phases. Short-term drought projections using machine-learning regression highlight pronounced sensitivity in evergreen and deciduous needleleaf forests, with wetlands and grasslands also showing elevated vulnerability under increasing water limitations. Differences in vegetation response are strongly ecosystem-dependent, reflecting contrasting elasticities to both climatic forcing and human water management.  The findings reveal substantial spatial heterogeneity in vegetation resilience across global river basins and emphasize the growing importance of irrigation in moderating drought impacts under future climate conditions. These results offer new insights into ecosystem-specific drought responses and provide a basin-scale perspective relevant for climate adaptation, water management, and ecosystem sustainability assessments.

How to cite: Baig, F. and Faiz, M. A.: Linking Drought Stress to Vegetation Stability and Recovery at the Global River-Basin Scale, EGU General Assembly 2026, Vienna, Austria, 3–8 May 2026, EGU26-5253, https://doi.org/10.5194/egusphere-egu26-5253, 2026.

EGU26-6872 | ECS | PICO | HS10.5

Quantify the impact of hydrological droughts on carbon dioxide emission from the Yangtze River networks 

Zhendan Wang, Dunxian She, and Shaoda Liu

Rivers, as an important source of CO2 emissions, release substantial amounts of CO2 into the atmosphere through gas exchange at the water-air interface, profoundly influencing the global carbon cycle. In recent years, frequent drought events driven by global climate change have markedly impacted aquatic ecosystems. Hydrological drought, identified by prolonged low river discharge, can disrupt the transport and decomposition of organic matter, leading to pronounced effects on riverine CO2 emissions. Nonetheless, the magnitude of this drought-induced alteration in CO2 emission fluxes is still not fully understood. In this study, we investigated riverine CO2 emissions in the Yangtze River networks, China, from 1979 to 2019 using the boundary layer method. We quantified the impact of hydrological droughts on riverine CO2 emissions from the perspective of river classification. Results showed that hydrological droughts reduced CO2 evasion by approximately 33% compared to non-drought periods. Specifically, CO2 emission flux declined by 18.91%, 25.06%, 31.43%, and 43.22% under mild, moderate, severe, and extreme drought, respectively. River width contraction was identified as the dominant mechanism driving drought-induced reductions in CO2 emissions. Our results showed that lower-order rivers exhibited larger CO2 emission declines, while higher-order rivers showed smaller reductions. This study contributes to a more comprehensive understanding of the impact of hydrological droughts on riverine CO2 emissions, while also providing useful insights for riverine carbon flux dynamics.

How to cite: Wang, Z., She, D., and Liu, S.: Quantify the impact of hydrological droughts on carbon dioxide emission from the Yangtze River networks, EGU General Assembly 2026, Vienna, Austria, 3–8 May 2026, EGU26-6872, https://doi.org/10.5194/egusphere-egu26-6872, 2026.

Compound heat and drought events pose severe challenges to crop growth and development through antagonistic and additive effects. In the Huang-Huai-Hai Plain, summer maize specifically encounters "dual water-heat stress" as its growing season overlaps with peak hazard periods. However, while the spatial patterns of compound events are evolving, existing studies predominantly adopt a static perspective and rely on meteorological indices, thereby overlooking direct root-zone water constraints and lacking the analysis of dynamic migration trajectories over long-term sequences. To address this, our study focuses on the core summer maize production region of China—the Huang-Huai-Hai Plain. Based on daily root-zone soil moisture and air temperature data during the growing seasons from 1980 to 2020, we constructed a Compound Heat and Drought Event (CHDE) index by substituting traditional meteorological indices with the Soil Moisture Deficit Index (SMDI)—which better reflects root-zone water stress—combined with the Temperature Condition Index (TCI).  This study targets daily-scale compound events and analyzes their spatiotemporal characteristics. Building upon static analysis, we introduced a Barycenter Migration to establish a dynamic spatiotemporal analysis framework, tracking evolutionary trajectories across three dimensions: Frequency, Duration, and Severity. Results indicate that the negative correlation between root-zone soil moisture and high temperature follows a "weak-strong-weak" evolution throughout the growing season; the jointing-tasseling (V6-VT) stage exhibits the strongest negative correlation, highest hazard severity, and most frequent occurrence, thus being identified as the critical phenological stage. Spatially, hazard hotspots demonstrate a distinct "central-to-south" migration during crop development, shifting from the central plains during the vegetative growth stage to the southern regions during the reproductive growth stage, with the timing of occurrence expanding toward earlier growth stages. The exposure to compound events experienced a trough in the 1990s, reversed from a decreasing to an increasing trend around 2000, and underwent a abrupt change in 2011–2012. Notably, approximately 60% of the region showed an increase in frequency over the last two decades, exhibiting a distinct spatial asymmetry: increases were primarily concentrated in the southern plains (e.g., Henan, northern Anhui), whereas the northern regions (e.g., Hebei, northern Shandong) were characterized mainly by decreases or stability .Through the spatiotemporal analysis of compound events, this study reveals the evolutionary patterns and regional heterogeneity of compound stress during the summer maize growing stage in the Huang-Huai-Hai Plain, providing a scientific basis for formulating maize irrigation strategies.

How to cite: Mi, L., Zhang, C., and Huo, Z.: Spatiotemporal Evolution and Migration of Compound Heat and Drought Events during the Summer Maize Growing Season in the Huang-Huai-Hai Plain, EGU General Assembly 2026, Vienna, Austria, 3–8 May 2026, EGU26-8633, https://doi.org/10.5194/egusphere-egu26-8633, 2026.

Drought is one of the most widespread and complex natural hazards, with the potential to inflict significant socioeconomic damage. However, current research still falls short in addressing catastrophic droughts, particularly in predicting the socioeconomic consequences of extreme drought scenarios. This study developed a socioeconomic drought classification model based on drought-affected population during extreme drought events, integrating both natural climatic factors and human activity factors to systematically evaluate the spatial patterns and driving mechanisms of socioeconomic drought. The results demonstrate the model exhibits excellent predictive performance (0.85±0.015) for different levels of socioeconomic disaster events. Additionally, SHAP-based feature importance analysis revealed that precipitation, spatial distribution of water sources, and human water consumption constitute the three key driving factors of socioeconomic drought, with the first two factors showing particularly prominent contributions. Notably, the impact of human water consumption on socioeconomic drought exhibits a significant time-lag effect (approximately 4-9months), indicating that longer temporal scales should be considered when assessing anthropogenic influences on drought. These findings highlight the necessity of incorporating both climatic variability and anthropogenic factors in future drought impact assessments, offering new insights for adaptive water resource management under changing environments.

How to cite: Cao, Y.: Understanding Driving Mechanisms and Socioeconomic Impacts during Extreme Drought Events, EGU General Assembly 2026, Vienna, Austria, 3–8 May 2026, EGU26-8970, https://doi.org/10.5194/egusphere-egu26-8970, 2026.

 Saline lakes on the Qinghai–Tibet Plateau (QTP) affect the regional climate and water cycle through water loss (E, evaporation under ice–free and sublimation under ice–covered conditions). Due to the observation difficulty over lakes, E and its underlying driving forces are seldom studied targeting saline lakes on the QTP, particularly during the ice–covered periods (ICP). In this study, The E of Qinghai Lake (QHL) and its influencing factors during the ice–free periods (IFP) and ICP were first quantified based on six years of observations. Subsequently, three models were calibrated and compared in simulating E during the IFP and ICP from 2003 to 2017. The annual E sum of QHL is 768.58 ± 28.73 mm, and the E sum during the ICP reaches 175.22 ± 45.98 mm, accounting for 23% of the annual E sum. E is mainly controlled by the wind speed, vapor pressure difference, and air pressure during the IFP, but is driven by the net radiation, the difference between the air and lake surface temperatures, wind speed, and ice coverage during the ICP. The mass transfer model simulates lake E well during the IFP, and the model based on energy achieves a good simulation during the ICP. Moreover, wind speed weakening resulted in an 7.56% decrease in E during the ICP of 2003~2017. Our results highlight the importance of E in ICP, provide new insights into saline lake E in alpine regions, and can be used as a reference to further improve hydrological models of alpine lakes. 

How to cite: Shi, F.: Evaporation and sublimation measurement and modelling of an alpine saline lake influenced by freeze–thaw on the Qinghai–Tibet Plateau, EGU General Assembly 2026, Vienna, Austria, 3–8 May 2026, EGU26-10423, https://doi.org/10.5194/egusphere-egu26-10423, 2026.

The central Chilean Andes present a unique and precious habitat for vegetation and animal species. However, that habitat is perceived to be under threat from both pastoral grazing and climate change. High-altitude summer grazing is a common pastoral management practice in the region. At the same time Central Chile has experienced a prolonged drought since 2010, with winter precipitation down by approximately 40% over the preceding decade, while average monthly temperatures have increased by about 1°C over the last 20 years.

This study investigates the temporal evolution of vegetation cover, over the period 2003-2022, in three neighbouring Andean catchments in Central Chile. The three catchments have experienced different pastoral grazing regimes during this period, which allows an assessment of the impact of pastoral grazing. Vegetation cover is analysed through a sequence of annual NDVI snapshots (MODIS imagery) over the period 2003-2022, taken towards the end of the grazing period in late summer. Data is represented as annual spatial maps, and as time-series of catchment vegetation cover.

Results indicate that all three study sites experienced a continual long-term decline in vegetation cover. Since the decline is similar in all three catchments, it cannot be unequivocally attributed to the pastoral grazing. Instead, the results suggest a strong correlation between temporal trends in key climate indicators (temperature, rainfall, evaporation soil moisture) and the declining NDVI, especially for seasonally-averaged temperature (R = - 0.75) and soil moisture (R = 0.76). The projected continuation of recent climatic trends suggests that the region’s high-altitude vegetation cover will continue to deteriorate in the coming years.

How to cite: Van De Wiel, M. and Larraín, R.: Impacts of pastoral grazing and climate change on vegetation cover in the central Chilean Andes, EGU General Assembly 2026, Vienna, Austria, 3–8 May 2026, EGU26-12072, https://doi.org/10.5194/egusphere-egu26-12072, 2026.

EGU26-12460 | ECS | PICO | HS10.5

Drivers of propagation and impacts of meteorological and agricultural droughts across Europe 

Christian Poppe Terán, Bibi S. Naz, Alexandre Belleflamme, Pallav K. Shrestha, Mehdi Rahmati, Harry Vereecken, and Harrie-Jan Hendricks-Franssen

Droughts are Europe’s costliest natural disasters, with damages estimated at 621 million Euros per event. Changing precipitation patterns and rising atmospheric water demand are increasingly affecting terrestrial ecosystem functioning in Europe, with profound implications for sustainable water resources management and ecosystem carbon uptake. However, responses are driven not only by drought type and severity but also by diverse land surface properties, including soil texture and vegetation functional traits. A clear understanding of how water deficits propagate to inhibit ecosystem functioning is needed to assess drought risk for specific ecosystems under a warming climate. This study uses Community Land Model v5 (CLM5) simulations over Europe from 1960 to 2024 to identify drought events as spatiotemporal clusters and to systematically determine their propagation across hydrological compartments (e.g., from precipitation to root-zone soil moisture) and their impacts on gross primary production (GPP) and transpiration (T). We find that precipitation droughts often propagate into soil moisture droughts, especially during large-scale droughts, such as in the years 1995, 2003, and 2018. However, soil moisture droughts can also emerge even when precipitation deficits are not typically classified as drought events, for example, when vapor pressure droughts increase evaporation over a prolonged period. Further, we compare trends of drought characteristics and show increasing dynamics in the propagation of vapor pressure droughts and increasing severity of soil moisture droughts. These anomalies interact across multiple time scales to drive a wide, though predominantly negative, range of GPP and T responses: Short-term anomalies can already cause significant impacts on dry ecosystems and grasslands, while having only minor effects in humid ecosystems. These results are essential for understanding ecosystem-specific impacts during discrete drought events and for identifying ecosystems whose functioning is under increased risk as drought frequency and severity increase under climate change in Europe, essentially supporting EU Adaptation Strategy and the Water Framework Directive.

How to cite: Poppe Terán, C., Naz, B. S., Belleflamme, A., Shrestha, P. K., Rahmati, M., Vereecken, H., and Hendricks-Franssen, H.-J.: Drivers of propagation and impacts of meteorological and agricultural droughts across Europe, EGU General Assembly 2026, Vienna, Austria, 3–8 May 2026, EGU26-12460, https://doi.org/10.5194/egusphere-egu26-12460, 2026.

EGU26-15686 | ECS | PICO | HS10.5

Vegetation change impact on the actual Evapotranspiration in China 

Congcong Li and Yongqiang Zhang

Evapotranspiration (ET) is a key variable in both the global carbon and water cycles, and its response to land use and land cover change (LUCC) remains a critical issue for climate modeling and sustainable water resource management. Existing studies have largely focused on the combined impacts of vegetation parameters—such as leaf area index (LAI), land cover type, reflectance, and emissivity—on ET, while the independent contributions of individual vegetation structural and physiological parameters have received limited attention. In this study, we employed a scenario-controlled experiment using the coupled carbon–water process model PML-V2 to disentangle and quantify the effects of different vegetation parameters on interannual ET variability across China from 2001 to 2020. Results demonstrate that PML-V2 effectively captures the independent driving effects of vegetation parameters on ET dynamics. Among these, LAI emerged as the dominant biophysical driver, increasing ET at a national average rate of 0.68 mm yr⁻¹, whereas land cover type changes exerted a minor negative effect (-0.04 mm yr⁻¹). Spatially, LAI-driven increases in ET were pronounced in northern China but slightly declined in the south. Other vegetation parameters exhibited negligible effects. In terms of contributions to ET variability, LAI explained the largest fraction (36%), followed by climate forcing (35%) and atmospheric CO₂ concentration (26%). These findings underscore the importance of accounting for the differentiated roles of vegetation parameters in future LUCC and ecological restoration strategies, particularly in water-limited northern China, to achieve a balance between ecological restoration and long-term water sustainability.

How to cite: Li, C. and Zhang, Y.: Vegetation change impact on the actual Evapotranspiration in China, EGU General Assembly 2026, Vienna, Austria, 3–8 May 2026, EGU26-15686, https://doi.org/10.5194/egusphere-egu26-15686, 2026.

EGU26-15920 | ECS | PICO | HS10.5 | Highlight

Flash droughts threaten global managed forests 

Hang Xu, Zhiqiang Zhang, Yang Xu, and Jianzhuang Pang

Flash droughts, characterized by rapid onset and increasing frequency, pose significant threats to ecosystem stability and function. However, there remains no global consensus regarding forest responses to flash droughts. Here, using a reconstructed global high spatiotemporal resolution Standardized Precipitation-Evapotranspiration Index dataset and an interpretable machine learning framework, we find that global forests have experienced increasingly rapid, intense, and prolonged flash droughts over the past four decades. Managed forests are more prone to browning from flash droughts than intact forests due to their limited capacity to acclimate to rapid drought stress driven by extreme heat. Notably, our meta-analysis confirms that current forest management practices, designed to maximize ecosystem services, exacerbate the vulnerability of managed forests to flash droughts globally. Our findings highlight the escalating risks posed by increasingly frequent and prolonged flash droughts to managed forests, underscoring the urgent need to integrate resistance and resilience to extreme climatic events into forest management strategies.

How to cite: Xu, H., Zhang, Z., Xu, Y., and Pang, J.: Flash droughts threaten global managed forests, EGU General Assembly 2026, Vienna, Austria, 3–8 May 2026, EGU26-15920, https://doi.org/10.5194/egusphere-egu26-15920, 2026.

EGU26-15928 | ECS | PICO | HS10.5

Impact of Time-Varying Soil and Vegetation Parameters on Passive Microwave Soil Moisture Retrieval 

Zhiguo Pang, Xiangdong Qin, Wei Jiang, and Jingxuan Lu

Soil moisture is a key variable in land surface water and energy cycles, and passive microwave remote sensing inversion is one of the primary approaches for large-scale soil moisture monitoring. Although physically based models for passive microwave soil moisture retrieval have been well established, the inversion process still faces challenges due to the large number of model parameters, some of which are difficult to obtain. In particular, soil surface roughness and vegetation single-scattering albedo, which characterize soil and vegetation effects, cannot be directly measured. As a result, most existing retrieval methods adopt empirically fixed parameter values, neglecting their temporal variability. In this study, a simulated brightness temperature dataset combined with a probability density approach is used to estimate monthly soil roughness and vegetation single-scattering albedo over the Shandian River Basin based on multi-temporal brightness temperature observations. These time-varying parameters are then incorporated into passive microwave soil moisture retrieval and evaluated against in situ soil moisture measurements and the MCCA soil moisture product. The results indicate that (1) soil roughness and vegetation single-scattering albedo exhibit pronounced intra-annual variability; (2) when the temporal variability of these parameters is considered, the overall accuracy of the retrieved soil moisture is comparable to that of the MCCA product, with good agreement in summer and improved stability in winter, and the temporal variations are more consistent with ground-based observations; and (3) introducing time-varying parameters reduces the intra-annual differences in monthly mean soil moisture, primarily because part of the brightness temperature variability is explained by parameter changes rather than being entirely attributed to soil moisture variations. Overall, incorporating the time-varying characteristics of soil and vegetation parameters enhances the temporal performance of passive microwave soil moisture retrieval, and furnishes new insights for the refinement of associated inversion methods.

How to cite: Pang, Z., Qin, X., Jiang, W., and Lu, J.: Impact of Time-Varying Soil and Vegetation Parameters on Passive Microwave Soil Moisture Retrieval, EGU General Assembly 2026, Vienna, Austria, 3–8 May 2026, EGU26-15928, https://doi.org/10.5194/egusphere-egu26-15928, 2026.

EGU26-15961 | ECS | PICO | HS10.5

Hydroclimate-driven soil moisture declines during the North American megadrought 

Jie Hu, Mallory Barnes, Rubaya Pervin, and Steven Kannenberg

The recent megadrought in the southwestern U.S. is the most severe in over a millennium, intensifying pressure on water resources and compromising ecosystem function. However, this megadrought is often diagnosed using indirect methods such as tree-ring reconstructions, which can be spatially biased and imperfect proxies of climatic conditions.  Direct measurements of soil moisture provide quantitative records of soil water storage in the land surfacebut it is only recently that the spatial and temporal scopes of these measurements have become large enough to diagnose the megadrought. By leveraging a dense network of in situ soil moisture measurements across depths, we quantified the trends in soil moisture during the megadrought and assessed its underlying drivers. The southwestern U.S. exhibited a pervasive drying trend of soil moisture during the megadrought, though there was significant spatial heterogeneity across basins. Reductions in mid-to-late season precipitation, along with widespread increases in VPD – vapor pressure deficit, were associated with long-term declines in soil moisture across all depths. Hydroclimate teleconnections were associated with soil moisture trends at larger spatiotemporal scales. Observed declines in soil moisture were not captured by a common microwave-based product but were better captured by gravimetry-based measurements. Our study highlights the importance of cool-season water inputs in the southwestern U.S., along with the future risks to water resources caused by rising VPD.

How to cite: Hu, J., Barnes, M., Pervin, R., and Kannenberg, S.: Hydroclimate-driven soil moisture declines during the North American megadrought, EGU General Assembly 2026, Vienna, Austria, 3–8 May 2026, EGU26-15961, https://doi.org/10.5194/egusphere-egu26-15961, 2026.

EGU26-16585 | ECS | PICO | HS10.5

Opposite shifts in drought-season evapotranspiration controls across hydroclimatic regimes in China 

Chen Zhang, Zhou Shi, Sheng Wang, and Zhonghua Zheng

Drought depletes water resources and can trigger substantial productivity losses and plant mortality. However, predicting drought impacts on water resources and ecosystem functioning remains difficult because evapotranspiration (ET) responses are highly uncertain. The sign and magnitude of drought-induced ET anomalies affect not only the water balance, but also land-atmosphere interactions and drought progression. Atmospheric drying (high vapor pressure deficit, VPD) can enhance ET, whereas soil moisture (SM) depletion suppresses soil evaporation and plant transpiration via stomatal regulation. Therefore, drought ET responses emerge from competing constraints imposed by atmospheric demand and moisture supply. Here we quantify how VPD and SM jointly control growing-season drought ET anomalies across hydroclimatic regimes in China using satellite remote sensing, physics-constrained machine learning ET estimations, and hydro-meteorological reanalysis data. ET is derived by coupling the Penman–Monteith framework with machine learning, yielding estimates that have been extensively validated and shown to perform robustly under data-limited conditions and during drought events. We then characterize the sign and magnitude of ET anomalies during drought by jointly considering meteorological, hydrological, and ecological drought metrics. Then, we disentangle the contribution of atmospheric demand and moisture supply constraints on ET anomalies based on the percentile binning method (assuming weak VPD and SM dependence in their short intervals), thereby distinguishing water demand-limited from water supply-limited regimes. The enhancement driven by atmospheric drying dominates in water demand-limited regions, while the suppression driven by soil moisture deficit prevails in water supply-limited regions, and both vary along dry-wet gradients. Finally, using an explainable machine learning approach (SHAP), we diagnose multiyear changes in these controls. We find regime-dependent trends with opposite signs: the positive VPD effect on drought ET anomalies declines in demand-limited regions, whereas the negative SM effect becomes less negative in supply-limited regions. These opposite-sign trends are primarily associated with evolving air-temperature and soil-moisture anomaly patterns, highlighting non-stationary drought controls on ET across China’s hydroclimatic regimes.

How to cite: Zhang, C., Shi, Z., Wang, S., and Zheng, Z.: Opposite shifts in drought-season evapotranspiration controls across hydroclimatic regimes in China, EGU General Assembly 2026, Vienna, Austria, 3–8 May 2026, EGU26-16585, https://doi.org/10.5194/egusphere-egu26-16585, 2026.

Soil-atmosphere compound drought, characterized by concurrent low soil moisture (SM) and high vapor pressure deficit (VPD), poses an increasingly severe threat to terrestrial carbon sinks. Although vegetation can tolerate mild drought through physiological responses, extreme drought could still cause irreversible damage, leading to significant declines in ecological functions. However, the critical tipping points triggering ecosystem transitions from resistance to vulnerability remain poorly quantified. Here, we developed a data-driven framework to identify nonlinear response thresholds of vegetation to compound drought across China and assessed associated impacts on gross primary production (GPP) under CMIP6 scenarios. Using observations from 2001 to 2020, we found that vegetation response was not linearly related to drought occurrence; instead, a distinct drought threshold exists (mean compound drought index percentile of approximately 14.1%). Dropping below this threshold triggers a transition from resistance to vulnerability (termed ecological drought), causing a precipitous collapse in photosynthetic function where average GPP anomalies plummeted from -0.84 to -4.57 gC m⁻² mon⁻¹. Future projections (2081–2100) confirm that this threshold-driven vulnerability persists, with ecological droughts projected to occur more frequently across over 56% and 61% of vegetated areas under the two respective emission scenarios. Critically, our cross-scenario comparison reveals that the magnitude of GPP losses is governed by drought intensity rather than frequency alone. Under the high-emission SSP5-8.5 scenario, drought intensity dominates in 55.9% of the vegetated area, accelerating at a relative rate 2.32 times that of frequency. This rapid intensification drives greater average GPP losses (-28.17 ± 23.48 gC m⁻² mon⁻¹) compared to the lower-emission path (-24.59 ± 18.23 gC m⁻² mon⁻¹), resulting in higher total GPP losses (-236.53 ± 198.56 versus -199.05 ± 162.59 gC m⁻²). These findings demonstrate that drought intensity overrides frequency as the primary driver constraining terrestrial carbon uptake.

How to cite: Cheng, Y. and Liu, L.: Soil-atmosphere compound drought intensity overrides frequency in constraining future carbon uptake across China, EGU General Assembly 2026, Vienna, Austria, 3–8 May 2026, EGU26-17713, https://doi.org/10.5194/egusphere-egu26-17713, 2026.

EGU26-18809 | ECS | PICO | HS10.5

Seasonal Sap Flow Dynamics Under Variable Water Stress in a Himalayan Chir Pine (Pinus roxburghii) Forest 

Kriti Bohra, Priyanka Lohani, and Sandipan Mukherjee

The Himalayan region is experiencing rapid hydroclimatic shifts, yet the physiological resilience of its dominant forest species remains poorly understood. Although Pinus roxburghii (Chir pine), one of the dominant species of the central Himalaya, covers 16% of the forest area, our understanding of its water-use strategies under compounding stress conditions such as low soil moisture (SM) and high vapor pressure deficit (VPD) is limited. Here, we investigated the hydro-physiological response of a Chir pine-dominated forest in the Kumaun Himalayas (Almora, India) using continuous Thermal Dissipation Probe (TDP) measurements over 304 days. By integrating sap-flux-derived transpiration with daily environmental data, we quantified tree water regulation across dormant and growing seasons. Efforts are also made to enhance our knowledge of the behavior of Chir-pine under water stress conditions, which was quantified by isolating 50th percentile thresholds (SM < 0.13 m³ m⁻³; VPD > 0.76 kPa) of the stress conditions. Our analysis reveals a significant seasonal variation in hydraulic sensitivity. During the growing season, mean sap flow (812.4 cm³ h⁻¹) was notably higher than during the dormant season (513.9 cm³ h⁻¹) driven by peak photosynthetic demand. We also found that SM emerged as the key determinant of Himalayan Chir-pine transpiration, while VPD did not have any such signatures. However, trees maintained high flux under isolated atmospheric drought (high VPD, high SM); the transition to combined stress triggered a sharp, non-linear decline in sap flow. This indicates an isohydric strategy of Chir-pine, where strong stomatal regulation prioritizes the prevention of xylem embolism over carbon gain during the environmental stress. This study provides the first mechanistic baseline for scaling tree-level hydraulics to forest-stand water balances in the Central Himalayas, offering critical insights for predicting regional forest water security under a changing climate.

How to cite: Bohra, K., Lohani, P., and Mukherjee, S.: Seasonal Sap Flow Dynamics Under Variable Water Stress in a Himalayan Chir Pine (Pinus roxburghii) Forest, EGU General Assembly 2026, Vienna, Austria, 3–8 May 2026, EGU26-18809, https://doi.org/10.5194/egusphere-egu26-18809, 2026.

EGU26-1019 | ECS | Posters on site | HS10.7

Tangential water transport facilitates crown water supply in mature Norway spruce 

Kyohsuke Hikino, Miriam Kreher, Bruno Hartwig, Ferdinand Renner, and Natalie Orlowski

Global forests are increasingly impacted by repeated and long-term drought events. The survival of trees under such conditions critically depends on their ability to regulate water use and maintain transpiration even when soil water availability is limited. Internal water storage and distribution within tree stems may hereby play a key role in supporting these processes. However, the mechanisms governing water transport and distribution within mature tree stems remain poorly understood.

To investigate internal water transport, we injected deuterated and dyed water as tracers into three mature Picea abies (Norway spruce) trees located in Tharandt (Germany) on one side of the stem at 50 cm height. Deuterated water movement was monitored by repeated daily sampling of xylem water vapor at 1 m and 3 m above the injection point, from the sapwood on the injection side, the opposite side, and the central heartwood. Water vapor samples were hereby collected by drilling a 10 cm deep, 1 cm diameter hole, which was fitted with inlet and outlet tubes. Dry air was pumped into the hole through the inlet, and the air equilibrated with xylem water was collected from the outlet into glass vials. Water vapor samples were subsequentially analyzed in the lab for their water isotopic composition (2H, 18O) via cavity ring-down spectroscopy (Picarro 2130-i). Two weeks after injection, the trees were harvested, and stem discs were collected every 2–4 m along the stem to visualize dyed water distribution using image analysis. Additional xylem water samples were extracted from increment cores taken from each disc in the four cardinal directions for isotope analysis. This experimental setup enabled the examination of water transport dynamics along axial, radial, and tangential pathways within the stem.

We found that injected water remained on the side of the injection within the lower 5 m of the stem (detected via water isotope tracing) but started circulating around the stem higher up, completing approximately 1-1.5 helical turns along the trunk (detected via dye-tracing), likely reflecting the spiral growth pattern of spruce wood. Below the crown base, water movement was predominantly axial, whereas above the crown base, tangential distribution became more pronounced, allowing all upper sun crown branches across the four cardinal directions to receive the tracer water.

These findings highlight that tangential water mixing within the stem plays a critical role in supplying water to the entire crown of mature spruce trees. This may become even more important under drought conditions.

How to cite: Hikino, K., Kreher, M., Hartwig, B., Renner, F., and Orlowski, N.: Tangential water transport facilitates crown water supply in mature Norway spruce, EGU General Assembly 2026, Vienna, Austria, 3–8 May 2026, EGU26-1019, https://doi.org/10.5194/egusphere-egu26-1019, 2026.

EGU26-4361 | ECS | Orals | HS10.7

Self-organization shapes divergent water use strategies among co-occurring shrubs for drought resilience in drylands 

Lei Wang, Guangyao Gao, Ying Ma, and Max Rietkerk

Differentiation in water use strategies is essential for the function and resilience of dryland ecosystems. Under prolonged drought, dominant shrubs self-organize into two spatial configurations: scattered and clumped. However, the mechanisms by which root–leaf trait coordination drives these divergent water use strategies remain poorly understood. In this study, the soil moisture, morphological and root traits, leaf-level physiological traits, and stable isotope (δ2H, δ18O, and δ13C) of scattered and clumped Vitex negundo were observed during the 2022–2024 growing seasons in the semi-arid Loess Plateau, to elucidate the water use strategies and physiological responses of self‑organized shrubs. Our findings indicate that scattered shrubs primarily utilized middle and deep soil water (69.4±7.8%), facilitated by isolated canopies that promote precipitation infiltration and recharge deeper soil layers. In contrast, clumped shrubs predominantly relied on shallow and middle soil water (82.0±6.5%), supported by their aggregated canopies and root systems. Scattered shrubs adopted a conservative strategy, exhibiting higher intrinsic water use efficiency (iWUE) and stable midday water potential during dry seasons, due to lower specific leaf area and moderate stomatal conductance. Conversely, clumped shrubs exhibited an opportunistic strategy, characterized by larger specific leaf area and higher stomatal conductance, enabling rapid photosynthetic accumulation and peak iWUE during rainy seasons. However, under drought, clumped shrubs accelerated the depletion of shallow soil water, leading to depressed midday water potential and constrained photosynthesis. These shrub types illustrate complementary mechanisms for drought adaptation: scattered shrubs enhance  resilience, while clumped shrubs improve precipitation capture efficiency, collectively promoting the stability of dryland ecosystems.

How to cite: Wang, L., Gao, G., Ma, Y., and Rietkerk, M.: Self-organization shapes divergent water use strategies among co-occurring shrubs for drought resilience in drylands, EGU General Assembly 2026, Vienna, Austria, 3–8 May 2026, EGU26-4361, https://doi.org/10.5194/egusphere-egu26-4361, 2026.

EGU26-5434 | ECS | Posters on site | HS10.7

PAUL: A Novel Autosampler for High-Resolution Isotopic Monitoring in Catchment Hydrology 

Jonas Pyschik and Markus Weiler

Understanding how streamflow is generated is essential for managing water quantity, quality, aquatic ecosystems and drinking water resources. Stable water isotopes are widely used to separate streamflow into event and pre-event water, offering valuable insights into catchment storage dynamics, water ages and transit times of water. Typically, precipitation or stream water for isotope analysis are sampled using autosamplers to reduce effort and ensure an adequate temporal resolution.

However, hydrograph separation using stable isotopes is often limited by reliance on single-point rainfall sampling, which therefore assumes that precipitation inputs are spatially uniform across the catchment. This can introduce substantial errors, as spatial variability in the isotopic composition of precipitation—even within small catchments—may lead to misestimations of event water endmember contributions. Also, the various transit time models may experience biases due to an incorrect precipitation input time series of stable isotopes. Furthermore, typical autosamplers are susceptible to evaporative losses from the stored water samples, resulting in isotopic fractionation and compromised data integrity.
To solve these difficulties, we have developed and deployed the low-cost, evaporation-proof Portable Autosampler for Liquids (PAUL). Nine PAUL units were distributed across the 1.5 km² Krummenbach sub-catchment of the Brugga watershed, a mountainous headwater catchment located in the Black Forest, Germany. Eight units measured precipitation and one sampled streamflow, with biweekly collection over the course of one month.

Our findings show that spatially distributed, evaporation-secure sampling significantly improves the characterization of event water inputs and reduces uncertainty in hydrograph separation. The PAUL system provides a robust and accessible solution for high-resolution, catchment-scale isotope monitoring, providing spatial and temporal coverage that was previously unfeasible with standard autosamplers. This approach advances process-based hydrology by increasing the accuracy and reliability of isotope-based precipitation and streamflow analyses.

How to cite: Pyschik, J. and Weiler, M.: PAUL: A Novel Autosampler for High-Resolution Isotopic Monitoring in Catchment Hydrology, EGU General Assembly 2026, Vienna, Austria, 3–8 May 2026, EGU26-5434, https://doi.org/10.5194/egusphere-egu26-5434, 2026.

EGU26-6149 | ECS | Posters on site | HS10.7

Stable isotopes as tracers of the effects of vineyard management practices 

Itxaso Ruiz, Luitgard Schwendenmann, Adrià Barbeta, Marco M. Lehmann, Roberto Pérez-Parmo, and Ana Aizpurua

Soil water management in Mediterranean vineyards is increasingly critical under increasing aridity. Soil management practices such as cover crops are promoted for improving soil structure, reducing erosion, and enhancing ecosystem services. However, grapevine production is often reduced under cover crops, and their effects on vine water use are still not fully understood. Here, we investigated the impact of soil management, i.e. conventional tillage vs. spontaneous cover crop, on the soil–plant–atmosphere continuum of a rainfed vineyard in Rioja Alavesa during veraison, with the aim of contributing to the ongoing discussion on soil management effects on vine water use.

Determining root water uptake depth using water isotopes (δ¹⁸O and δ²H) revealed contrasting uptake strategies between conventional tillage and spontaneous cover crop. Building on that, we focused on aboveground responses by combining measurements of vine water status (midday leaf water potential, Ψₘ) with stable isotopes of carbon, oxygen, and nitrogen (δ¹³C, δ¹⁸O, and δ¹⁵N) in leaves and berries. The Ψₘ values showed a clear management effect, with vines under cover crop exhibiting improved water status compared to vines under tillage (Ψₘ= -0.62 and -0.83 MPa respectively, p < 0.01). Leaf δ¹⁵N also differed between treatments, indicating changes in nitrogen availability or uptake associated with soil management (mean leaf δ¹⁵N under cover crop = 2.14‰ and tillage = 0.15‰, p < 0.01). In contrast, leaf δ¹⁸O and berry δ¹³C showed substantial plant-to-plant variability with no consistent treatment effect (p = 0.22 and 0.51, respectively).

Taken together, our results show that cover crops can enhance vine hydraulic status (Ψₘ) and modify nitrogen dynamics (δ¹⁵N), without altering long-term carbon assimilation efficiency (δ¹³C and δ¹⁸O). They also demonstrate that soil management effects are strongly dependent on the temporal scale of observation, as instantaneous indicators (Ψₘ) revealed treatment differences that were not captured by seasonally integrated isotopic signals (δ¹³C and δ¹⁸O). Overall, our study highlights the value of combining hydraulic measurements with multiple stable isotopes to improve the assessment of sustainable soil and water management strategies in vineyards.

How to cite: Ruiz, I., Schwendenmann, L., Barbeta, A., Lehmann, M. M., Pérez-Parmo, R., and Aizpurua, A.: Stable isotopes as tracers of the effects of vineyard management practices, EGU General Assembly 2026, Vienna, Austria, 3–8 May 2026, EGU26-6149, https://doi.org/10.5194/egusphere-egu26-6149, 2026.

EGU26-7698 | ECS | Orals | HS10.7

Rethinking isotope-based plant water uptake tracing in viticulture: alternative sampling approaches 

Mirco Peschiutta, Marco M. Lehmann, Gemma Bonet Caballol, Paolo Benettin, Daniele Penna, Mauro Masiol, Barbara Stenni, and Adrià Barbeta

Up to date, isotopic techniques in ecohydrology have been rarely applied in viticulture, despite their potential to identify plant water uptake sources and resolve their temporal dynamics, largely because traditional approaches for sampling grapevine xylem sap are destructive and often impractical in productive agroecosystems such as commercial vineyards, particularly when a high number of replicates is required. Moreover, recent evidence indicates that cryogenic vacuum distillation (CVD), commonly used to extract xylem water, can induce a methodological bias, yielding water that is artificially depleted in δ²H relative to the original xylem water.

These limitations have stimulated interest in alternative, non-destructive approaches. Recent studies have shown that transpired water can be collected by enclosing grapevine branches in plastic bags and sampling condensed water. Nevertheless, it remains unclear whether the isotopic composition of transpired water can be reliably used to infer plant water sources when the true isotopic signature of xylem water is unknown.

Here, we tested whether transpired water condensation can be used to retrieve the isotopic composition of plant water sources. We conducted a controlled experiment on potted grapevine plants irrigated with water of known isotopic composition, under contrasting water availability and different atmospheric conditions.

Multiple plant water sampling techniques were applied to detect isotopic changes along the soil–plant–atmosphere hydraulic continuum and to evaluate the validity of using transpired water to infer plant water uptake sources. In particular, we employed a vacuum pump–based sap extraction method designed to retrieve flowing xylem sap water and expected to closely reflect source water isotopic composition. Xylem bulk water, leaf bulk water, and bulk soil water were extracted using CVD.

The isotopic composition of vacuum-extracted sap water and of CVD-extracted waters were compared with transpired water and the original source of water (irrigation). Vacuum-extracted sap water closely reflected the isotopic composition of source water. Interestingly, transpired water collected in plastic bags also showed potential to be used as a proxy to infer the source water; however, its interpretation is less straightforward, requiring many replicates and explicit consideration of atmospheric conditions.

Overall, our results provide a methodological framework for evaluating non-destructive approaches to trace plant water sources and contribute to a better understanding of isotopic fractionation processes along the soil–plant–atmosphere continuum, with implications extending beyond viticulture to ecohydrological studies in managed and natural ecosystems.

How to cite: Peschiutta, M., Lehmann, M. M., Bonet Caballol, G., Benettin, P., Penna, D., Masiol, M., Stenni, B., and Barbeta, A.: Rethinking isotope-based plant water uptake tracing in viticulture: alternative sampling approaches, EGU General Assembly 2026, Vienna, Austria, 3–8 May 2026, EGU26-7698, https://doi.org/10.5194/egusphere-egu26-7698, 2026.

EGU26-10134 | Orals | HS10.7

Constraints of using in-situ water vapour stable isotope analysis for estimating groundwater recharge in a beech forest  

Megan Asanza-Grabenbauer, Christine Stumpp, and Michael Stockinger

As temperatures rise, heat waves, droughts, and intense rainfall are expected to become more common and severe, posing significant risks to forest ecosystems. More frequent droughts make forests progressively vulnerable, leading to increased tree mortality particularly among drought-sensitive species like European beech (Fagus sylvatica S.). Understanding the interactions between forests and the water cycle is crucial to predict how forest ecosystems will respond to climate change and to develop adapted management strategies accordingly. By analysing the stable isotopes of water (δ2H, δ18O) which act as a natural fingerprint, we elucidate how beech trees cope with climate extremes and quantify water fluxes across the soil-plant-atmosphere continuum. Among these fluxes, groundwater recharge is essential for replenishing groundwater storage and sustaining stream baseflow. Here, we focus on estimating groundwater recharge under natural rainfall conditions, drought, and after extreme rainfall using HYDRUS-1D.

This study is conducted in a mature beech stand in the Rosalia forest located in the alpine forelands of Austria. The elevation at the study site is 650 m with an average slope of 16°. The mean annual precipitation is 790 mm, 60% of which falls between May to October, and the mean annual temperature is 8.2 °C. The soil is predominantly Cambisol, exhibits strong heterogeneity, and consists of 41% sand, 46% silt and 13% clay.

Climate change scenarios are simulated with rain‑out shelters (6x6 m) that induce drought stress in two trees and the surrounding soil. Sprinklers simulate extreme rainfall (75 mm per event) at two‑month intervals during the growing season, while two other trees serve as references under natural rainfall conditions. Soil water isotope profiles are collected via two complementary approaches: first, 100 cm soil cores are subdivided into 10 cm increments and analysed in the laboratory using the direct liquid-vapour equilibration method every three weeks. Second, since July 2025, in-situ soil water vapour is sampled within the rooting zone of one drought-treated and one reference tree at 10, 20, 30 and 60 cm, and analysed with an isotope ratio spectrometer (Picarro L2130-i) for daily measurements. These isotope data are supported by meteorological data including isotopic composition of precipitation, soil moisture, and matric potential.

Results showed that the soil exhibits strong heterogeneity in both isotopic composition and physical properties, with three to four soil horizons identified within the top 100 cm. Following irrigation, the isotope profile was largely replaced by the irrigation water isotope ratio within 100 cm, indicating preferential flow and rapid infiltration. We found strong temporal heterogeneity in soil water isotope profiles, and the isotopic profiles from in-situ vapour sampling and soil cores were only partly comparable, likely reflecting differences in isotopic composition of bulk water (core samples) and mobile water fractions (in-situ analysis), soil heterogeneity, and possibly method-specific biases. These discrepancies currently prevent robust estimates of groundwater recharge estimation with different approaches, underscoring the difficulty in applying these methods in strongly heterogeneous environments. Ongoing work includes system refinements and experimental redesign, alongside evaluation of more suitable methods to enable groundwater recharge quantification.

How to cite: Asanza-Grabenbauer, M., Stumpp, C., and Stockinger, M.: Constraints of using in-situ water vapour stable isotope analysis for estimating groundwater recharge in a beech forest , EGU General Assembly 2026, Vienna, Austria, 3–8 May 2026, EGU26-10134, https://doi.org/10.5194/egusphere-egu26-10134, 2026.

Identifying and quantifying sources and cycling of nitrogen is important for understanding not only aquatic ecosystems but also planning water resource management, mitigating urban and agricultural pollution, and optimizing government policy. Stable isotopes of dissolved nitrate and nitrite (δ15N, δ18O and δ17O) have been useful in distinguishing between the diverse nitrogen sources and sinks and help understand large scale global ocean processes as well as revealing major changes in agricultural land use and urbanization.

Despite the strength of dissolved nitrate and nitrite stable isotope analysis, the strong barrier for uptake using the favored contemporary methods (bacterial denitrifier and Cd-azide reaction) due to the laborious multi-step methods, maintenance of anerobic bacterial cultures and use of highly toxic chemicals has limited the analysis to highly specialized laboratories. We evaluate the performance of the Elementar EnvirovisION using the new Titanium (III) reduction method (Altabet et al., 2019) for one step conversion of nitrate into N2O for IRMS analysis.

The EnvirovisION has been developed for high performance analysis of CO2, N2O and CH4 and dissolved nitrate. The system has the capacity to be rapidly customized for specific needs with options for dual GC columns supporting the Weigand ‘heart-cut’ N2O method (Weigand et al., 2016) and sequential N2 and N2O analysis from a single atmospheric sample.

How to cite: Barker, S., Preece, C., Seed, M., and Berstan, R.: Analysis of dissolved nitrate stable isotopes using the one-step Ti (III) reduction method and Elementar EnvirovisION System, EGU General Assembly 2026, Vienna, Austria, 3–8 May 2026, EGU26-11255, https://doi.org/10.5194/egusphere-egu26-11255, 2026.

EGU26-11615 | ECS | Posters on site | HS10.7

Partitioning of Evapotranspiration at hourly resolution in a temperate grassland using a mobile water isotope laboratory 

Daniel Schulz, Matthias Claß, Nicolas Brüggemann, and Youri Rothfuss

Quantifying and partitioning the evapotranspiration (ET) of agricultural ecosystems in various environmental settings allows the study of the determinants of field site-specific plant water use and water stress conditions. ET flux, as determined from eddy covariance measurements, was partitioned into its component fluxes, soil evaporation (E) and plant transpiration (T), with a range of independent methods, i.e. with water stable isotope analysis (δ2H and δ18O), using lysimeter data, by applying the water use efficiency concept, and from process-based numerical modelling with the Community Land Model (CLM) 5.0. Data was collected with a mobile water stable isotope laboratory (IsoMobile) in the vicinity of the ICOS DE-RuR climate station (Rollesbroich, Germany) in an intensively managed temperate grassland ecosystem between May 5 and September 24, 2025. Isotopic partitioning was calculated at sub-daily resolution from mass balance on basis of ET, E, and T isotopic compositions (δET, δE, and δT, respectively). δET was determined statistically with the Keeling-plot approach and non-destructive measurements of atmospheric water vapor inside and above the plant canopy. δE was calculated from the isotopic composition of the atmospheric water vapor and that of soil water, which was either determined destructively and a posteriori in the laboratory or non-destructively and in situ using gas-permeable tubing placed in the soil. Finally, δT was estimated destructively from stem water extracted from composite grass samples (Alopecurus pratensis, Lolium perenne, Poa trivialis, Rumex acetosa) and under the assumption of isotopic steady state transpiration. The collected standardized ICOS data was used additionally to set up both the water use efficiency partitioning approach and the CLM. All partitioning results were confronted with time series of environmental variables measured by the local weather station. Sub-daily T/ET responded to daily and seasonal changes of environmental conditions, as well as farming practices applied to the grassland. T/ET decreased significantly after the plants were cut, followed by an increase during the subsequent period of plant regrowth. T/ET estimates range between 21 to 98 % for δ18O over the course of the seasons, δ2H-based partitioning shows similar temporal developments as δ18O, while overestimating T/ET by ~13 %. Water stress was not detected during the campaign period, as ET did not decrease while T/ET remained high, even during the dryest and hottest period in summer. From a technical view, non-destructive soil water vapor sampling was found to be a good alternative to destructive soil water sampling for the purpose of ET partitioning. It provides similar δE estimations while reducing the need for fieldwork, laboratory time and resources. In conclusion the high-resolution partitioning results presented in this study provide an opportunity to investigate field scale water fluxes in a variety of environments and can aid in improving water flux estimations embedded in large-scale environmental models.

How to cite: Schulz, D., Claß, M., Brüggemann, N., and Rothfuss, Y.: Partitioning of Evapotranspiration at hourly resolution in a temperate grassland using a mobile water isotope laboratory, EGU General Assembly 2026, Vienna, Austria, 3–8 May 2026, EGU26-11615, https://doi.org/10.5194/egusphere-egu26-11615, 2026.

EGU26-13738 | ECS | Posters on site | HS10.7

Double buffering of transpiration: Soil and stem water storage regulate transpiration water ages in boreal forests 

Magali F. Nehemy and Julia L. A. Knapp

Transpiration dominates terrestrial water fluxes and plays a critical role in ecosystem productivity and climate regulation, yet the travel time of water within vegetation and the contribution of internal plant water storage to transpiration remain poorly constrained. While decades of tracer studies have revealed that streamflow is sustained by older subsurface storage and responds dynamically to wetness conditions, comparable insights for transpiration are lacking. Here we present the first integrated field-based assessment of transpiration water age in boreal forests, continuously tracking transit times from the onset to the end of the growing season. Using isotope sampling of xylem, soil water, and precipitation, combined with hydrometric measurements at boreal sites dominated by Picea mariana and Pinus banksiana, we quantified mean travel times and the contribution of new versus old water to transpiration. Our results reveal that transpiration is sustained primarily by water older than one week, with newer precipitation contributing only 20–40% to transpiration fluxes. Growing-season travel times were faster than spring-only estimates but consistent with peak-summer sap-flow measurements. These findings demonstrate a "double-buffering" effect: soil water storage dampens and delays isotopic signals from new precipitation, while stem water storage further attenuates the response, particularly in drier periods. This dual buffering mechanism regulates transpiration age dynamics in response to changing wetness conditions, with storage contributions varying throughout the growing season. Our study provides critical empirical constraints on vegetation water use and transit times, essential for improving ecohydrological models and predicting ecosystem responses to water availability under changing climates.

How to cite: Nehemy, M. F. and Knapp, J. L. A.: Double buffering of transpiration: Soil and stem water storage regulate transpiration water ages in boreal forests, EGU General Assembly 2026, Vienna, Austria, 3–8 May 2026, EGU26-13738, https://doi.org/10.5194/egusphere-egu26-13738, 2026.

EGU26-14267 | ECS | Orals | HS10.7

Spatiotemporal contribution of soil water sources to total tree water uptake in a Mediterranean Scots pine forest 

Paula Cara-Abad, Adrià Barbeta, Pilar Llorens, Jérôme Latron, J Ariel Castro-López, Han Fu, Emilia Gutiérrez, and Elisabet Martínez-Sancho

Shifts in tree water sources are important for understanding the spatiotemporal dynamics of ecosystem water fluxes. However, our understanding of tree water uptake remains limited, constraining reliable predictions of local and global hydrological processes under ongoing climate change. The isotopic composition of water (δ2H and δ18O) is a powerful tracer of the Earth’s water cycle, as isotopic differences among water reservoirs, together with mixing and fractionation processes, allow water movements to be traced across the hydraulic continuum.

This study aims to characterize the tree water sources of Scots pine (Pinus sylvestris L.) in a Mediterranean forest (Pyrenees, NE Spain) during the 2024 growing season. To do so, the isotopic composition of water in several ecohydrological compartments was measured. Precipitation, soil water pools at multiple depths (10, 20, 30, 40, and 60 cm), and xylem water from four individuals were sampled biweekly. Bulk soil water was extracted using cryogenic vacuum distillation, whereas xylem water was obtained using a flow-rotor centrifuge (cavitron). The cavitron enables access to mobile xylem water (e.g., sap) and is not affected by the well-known methodological artifacts associated with cryogenic extraction. Bayesian isotope mixing models were applied to quantify the relative contributions of distinct water pools to xylem water and their temporal evolution. Dynamics of total water uptake were estimated from transpiration data.

Our results show that Scots pine predominantly relied on shallow soil water (10 cm) during most of the growing season, with xylem water closely reflecting the isotopic signature of recent precipitation. A decoupling between the isotopic signature of precipitation and xylem water emerged as seasonal drying progressed. Under dry conditions, tree water uptake was low, and tree water sources shifted towards deeper soil layers (40-60 cm). Overall, these patterns indicate a strong coupling between rainfall inputs and tree water use during periods of high transpiration demand, suggesting that the contribution of deeper soil water reserves represent only a very small fraction of tree total water use during a growing season. These findings underscore the ecological importance of shallow soil water and recent precipitation in sustaining forest function and highlight the role of vegetation water use in regulating atmospheric water fluxes.

How to cite: Cara-Abad, P., Barbeta, A., Llorens, P., Latron, J., Castro-López, J. A., Fu, H., Gutiérrez, E., and Martínez-Sancho, E.: Spatiotemporal contribution of soil water sources to total tree water uptake in a Mediterranean Scots pine forest, EGU General Assembly 2026, Vienna, Austria, 3–8 May 2026, EGU26-14267, https://doi.org/10.5194/egusphere-egu26-14267, 2026.

Saltwater intrusion (SWI) alters water movement and redox-sensitive biogeochemical processes in tidal marshes.  It remains challenging to distinguish conservative freshwater–seawater mixing from process-driven effects such as evaporation, residence time, and redox reactions.  Electrical conductivity (EC) is commonly used to trace mixing but provides limited insight into how these processes modify porewater chemistry across space and time.  Here, we evaluate whether stable water isotopes and an Evaporative Enrichment Index (EEI) improve the interpretation of porewater mixing and redox-sensitive responses along a marsh transect experiencing SWI.  

Porewater was sampled along a forest–marsh transect at the St. Jones Reserve (Delaware, USA) across seasons, depths, and tidal settings. Mixing was quantified using stable water isotopes (δ²H, δ¹⁸O, δ¹⁷O), EC, and end-member mixing analysis (EMMA).  Results from isotope-only and isotope+EC EMMA were compared, and EEI was applied to isolate non-conservative isotopic modification associated with evaporation, transpiration, and prolonged residence time.  Mixing metrics were related to redox-sensitive variables, including redox potential, nitrate, iron, and manganese. 

Mixing fractions calculated from isotopes and EC both captured the freshwater–seawater gradient but diverged most strongly in the marsh transition zone.  Isotope-only EMMA preserved seasonal and tidal variability that was dampened when EC was included.  EEI exhibited strong seasonal structure and was negatively correlated with redox potential, indicating that isotopic enrichment coincides with more reducing conditions.  Near-channel sites showed conservative mixing and consistent nitrate decline with increasing seawater fraction, whereas the transition zone exhibited enhanced nitrate loss and

depth-dependent, nonlinear iron and manganese responses associated with extended inundation and residence time. 

These results demonstrate that isotope tracers, when combined with EEI, provide process-level insight beyond EC by resolving evaporative modification and hydrologic isolation.  EEI helps identify when and under what hydrologic conditions redox-sensitive nutrient and metal transformations occur during saltwater intrusion.

How to cite: Bradach, S., Liu, Y., and Jin, Y.: Stable Water Isotopes Reveal Non-Conservative Mixing and Redox Dynamics During Saltwater Intrusion in Tidal Marshes, EGU General Assembly 2026, Vienna, Austria, 3–8 May 2026, EGU26-14383, https://doi.org/10.5194/egusphere-egu26-14383, 2026.

EGU26-15061 | ECS | Orals | HS10.7

Tracing water and nitrogen uptake in mature forests using stable isotopes 

Christina A. Hackmann, Klara Mrak, Sharath S. Paligi, Ruth-Kristina Magh, John D. Marshall, Martina Mund, and Christian Ammer

Trees are powerful mediators within ecosystem water and nutrient cycles. Through their roots, they take up these essential resources from the soil, distributing them in the system and upward into the canopy to maintain transpiration and photosynthesis.

However, understanding and predicting real-world dynamics remains challenging: tree species identity, species mixture, site and soil conditions may shape tree water and nutrient uptake fundamentally, particularly in mature forests. Moreover, in the face of climate change, access to resources in deeper, less drought-prone soil layers is crucial for buffering drought impacts and maintaining forest functioning. Studies targeting tree resource uptake in mature forests are still scarce; but they are emerging, with stable isotopes as a central tool.

We investigated root water uptake depth and subsoil water and nitrogen uptake in mature temperate forests of north-western Germany, using 2H, 18O and 15N as tracers. Native European beech, non-native Douglas fir, and native but drought-sensitive Norway spruce were studied, revealing tree species-specific uptake strategies and influences of species mixture. Furthermore, we found consistent site effects: on well-drained, sandy soils, the trees integrated more resources from deeper layers than on loamy soils. Notably, transit times from soil to canopy were slower for nitrogen than for water, highlighting the biotic and abiotic interactions that decouple nitrogen from water.

We conclude that species-specific traits in interaction with soil characteristics are crucial for understanding and predicting water and nutrient fluxes in forests. Our findings underscore the importance of belowground processes when assessing forest functioning and resilience.

How to cite: Hackmann, C. A., Mrak, K., Paligi, S. S., Magh, R.-K., Marshall, J. D., Mund, M., and Ammer, C.: Tracing water and nitrogen uptake in mature forests using stable isotopes, EGU General Assembly 2026, Vienna, Austria, 3–8 May 2026, EGU26-15061, https://doi.org/10.5194/egusphere-egu26-15061, 2026.

EGU26-17355 | Posters on site | HS10.7

Role of summer precipitation in plant water uptake in a pre-Alpine catchment 

Giulia Zuecco, Diego Todini-Zicavo, Chiara Marchina, Stefano Brighenti, Daniele Penna, and Marco Borga

Understanding the spatial and temporal origins of water used by plants for transpiration is crucial for improving forest and water resource management under future drought conditions. However, the impact of local factors such as wetness conditions and topography on the temporal origin of soil and plant waters remains largely unexplored.

In this study, we utilized a 6-year isotopic dataset to investigate i) the seasonal origin of water sources in a small headwater catchment in the Italian pre-Alps, ii) the seasonal origin of soil and plant water under different wetness conditions (based on soil moisture data), iii) the influence of topography (riparian zone vs. hillslope) and wetness conditions on water uptake by beech and chestnut trees.

The sampling campaigns were carried out in the Ressi catchment, which has a 2.4-ha area, steep hillslopes and a narrow riparian zone. The climate is humid and temperate, and the catchment is mostly covered by a forest mainly composed of beech, chestnut, maple and hazel trees. Water samples for isotopic analysis (δ2H and δ18O) were taken from precipitation, stream water, shallow groundwater, soil, and twigs from beech and chestnut trees. Samples were taken approximately bi-weekly during the growing season, whereas precipitation, stream water and shallow groundwater were collected monthly from October to May. Bulk soil water and plant water were extracted by cryogenic vacuum distillation before the isotopic analysis.

Our results, based on the estimation of the seasonal origin index (SOI), showed distinct temporal variability for all water sources, except groundwater. The rapid turnover of water in the catchment indicates that precipitation quickly replenishes the soil, becomes available for plant water uptake, and contributes to stream runoff. Interestingly, we found that both beech and chestnut trees primarily use water derived from summer precipitation, with minimal differences in water uptake between riparian and hillslope trees. The seasonality of water fluxes (i.e., precipitation and evapotranspiration) and isotopes in precipitation have a more significant impact on SOI values of soil water and plant water compared to soil moisture.

These findings suggest that in the Ressi catchment, during the growing season, trees and the stream primarily utilize young waters, even during dry years. This research contributes to our understanding of plant water use strategies and their implications for forest and water resource management under changing climate conditions.

How to cite: Zuecco, G., Todini-Zicavo, D., Marchina, C., Brighenti, S., Penna, D., and Borga, M.: Role of summer precipitation in plant water uptake in a pre-Alpine catchment, EGU General Assembly 2026, Vienna, Austria, 3–8 May 2026, EGU26-17355, https://doi.org/10.5194/egusphere-egu26-17355, 2026.

EGU26-19865 | Posters on site | HS10.7

Tracer-aided ecohydrological modelling to quantify hydrologic partitioning and investigate partitioning processes 

Dillon Mungle, Marius Floriancic, Celia Rouvenaz, Peter Molnar, and Harsh Beria

Hydrological partitioning, the separation of precipitation into different hydrological fluxes, remains poorly constrained in forested prealpine catchments. Here, we apply EcH2O-iso, a distributed process-based tracer-aided ecohydrological model, to investigate hydrological partitioning in the WaldLab forest research site in Zurich, Switzerland. EcH2O-iso simulates water and energy fluxes while tracking stable water isotopes across all compartments of the critical zone. EcH2O-iso was calibrated and validated with five years of hydrometric measurements, along with high-frequency observations of stable water isotope ratios in precipitation, streams, groundwater, xylem, and bulk and mobile soil water. Our results highlight the importance of explicitly representing dual-porosity soil water storage dynamics in models, providing insights into how mobile and immobile soil water storages are partitioned differently. These results were compared with previous findings at the WaldLab, particularly the seasonal dynamics of interception, infiltration, and plant water uptake. Future work will use these results alongside simulations in other snow-dominated alpine and boreal catchments to contrast ecohydrological processes between snow- vs rain-dominated ecosystems.

How to cite: Mungle, D., Floriancic, M., Rouvenaz, C., Molnar, P., and Beria, H.: Tracer-aided ecohydrological modelling to quantify hydrologic partitioning and investigate partitioning processes, EGU General Assembly 2026, Vienna, Austria, 3–8 May 2026, EGU26-19865, https://doi.org/10.5194/egusphere-egu26-19865, 2026.

EGU26-21902 | Orals | HS10.7

Exploring root water uptake of beech and spruce trees across Europe 

Marco Lehmann, Josie Geris, Daniele Penna, Youri Rothfuss, Ilja van Meerveld, and Katrin Meusburger

Ecohydrological studies aiming to understand patterns in root water uptake by trees based on plant and soil water isotope data are often confined to one or a few nearby locations. In this study, we took advantage of a recently established pan-European hydrogen (δ2H) and oxygen (δ18O) isotope dataset (10.16904/envidat.542) to assess root water uptake depth for beech and spruce trees across Europe. For a subset of sites, δ17O data were available as well.

Our analysis revealed consistent isotopic enrichment in xylem water of spruce trees compared to beech trees across all mixed-species sites (N=13), suggesting that spruce predominantly used shallower soil water regardless of environmental conditions. Additionally, we observed isotopic enrichment in stem xylem water from spring to summer at most beech and spruce sites (N=32), suggesting both species relied on isotopically enriched summer precipitation. Interestingly, for a subset of sites (N=8), there was an inverse pattern, with isotopic depletion in summer, implying shifts to deeper soil water sources or uptake of shallow soil water that was isotopically depleted in summer compared to spring conditions.

To further explore these findings, we will visually and statistically examine them using isotope data from the soil (10–90 cm depth). We will analyze the role of climate (using gridded data), alongside site-, soil-, and tree-specific metadata to better understand the factors influencing the variation in root water uptake at the continental scale. Additionally, we will explore the potential of oxygen-17 excess to provide further insights into root water uptake dynamics.

Lehmann et al., 2025. Soil and stem xylem water isotope data from two pan-European sampling campaigns. Earth System Science Data, 17, 6129–6147, https://doi.org/10.5194/essd-17-6129-2025


How to cite: Lehmann, M., Geris, J., Penna, D., Rothfuss, Y., van Meerveld, I., and Meusburger, K.: Exploring root water uptake of beech and spruce trees across Europe, EGU General Assembly 2026, Vienna, Austria, 3–8 May 2026, EGU26-21902, https://doi.org/10.5194/egusphere-egu26-21902, 2026.

EGU26-22892 | ECS | Orals | HS10.7

In-situ measurements of dissolved gases in tree xylem sap as tracers for plant physiology 

Capucine Marion, Roman Zweifel, Nina Buchmann, Matthias Brennwald, and Rolf Kipfer

Common hydrogeological methods make use of natural gases as tracers to better understand the spatial and temporal evolution of groundwater flow, to constrain water residence time, and to reconstruct environmental conditions at recharge [1-3]. Noble gases can be used as complement of the stable water isotope tracers for understanding complex hydrological systems [4,5,6].

We adapted these methods to in-situ measurements of gases in tree xylem sap to better understand the plant-mediated water and gas flux between the hydrosphere, the biosphere, and the atmosphere.

Using a “miniRuedi” portable mass-spectrometer [7] and tailored semi-permeable membrane probes, the partial pressures of He, Ar, Kr, N2, O2, CO2, and CH4 were continuously monitored in-situ in the soil, the tree, and the atmosphere. Diurnal variations of CO2 and O2 were observed that reflected the tree physiological activities [8].

Since transpiration by plants is a major component of the hydrological cycle, such measurement techniques offer new opportunities to better understand plant water and CO₂ dynamics, within the soil-plant-atmosphere continuum.

[1] Kipfer et al. (2002), Reviews in Mineralogy and Geochemistry, 47, 615–700; [2] Brennwald et al. (2013), Advances in Isotope Geochemistry – The Noble Gases as Geochemical Tracers, 123-153; [3] Brennwald et al. (2022), Frontiers in Water, 4, 107-115; [4] Althaus et al. (2009), Journal of Hydrology, 370, 64-72. [5] Schilling et al. (2019), Reviews of Geophysics, 57, 146-182. [6] Xu et al. (2017). Hydrogeology Journal, 25(7), 2015–2029; [7] Brennwald et al. (2016), ES&T, 50, 13455-1346; [8] Marion et al. (2024), Tree Physiology, tpae062.


How to cite: Marion, C., Zweifel, R., Buchmann, N., Brennwald, M., and Kipfer, R.: In-situ measurements of dissolved gases in tree xylem sap as tracers for plant physiology, EGU General Assembly 2026, Vienna, Austria, 3–8 May 2026, EGU26-22892, https://doi.org/10.5194/egusphere-egu26-22892, 2026.

EGU26-23111 | Posters on site | HS10.7

Regulation of soil water consumption of Robinia pseudoacacia in different stand ages 

Yali Zhao, Yunqiang Wang, Li Zimin, and Marius G. Floriancic

Large-scale afforestation in China has resulted in widespread soil water deficits. Yet the effects of root water uptake on soil water decline, and how it differs between dry and wet seasons and across different stand ages remain largely unstudied. Using stable water isotopes (δ18O and δ2H), we investigated water uptake patterns across five Robinia pseudoacacia stand ages (~6, 16, 20, 35, and 45 years) and explored the interactions between soil drying and water-use strategies during the pre-rain and rainy season across two years.  R. pseudoacacia exhibited clear seasonal and age-related differences in water uptake, with contrasting water-use strategies under dry versus normal years. Overall, R. pseudoacacia predominantly relied on shallow soil water (0.67 ± 0.15) during the pre-rain season and shifted to deep soil water uptake (0.73 ± 0.14) in the rainy season. In the drier year of the 2-year observation period, all stands showed similar seasonal water uptake patterns, with a predominant reliance on deeper soil water, whereas in the typical year, water-use strategies differed markedly among stand ages. While middle-aged and old stands (16 to 45 years) accessed water from all soil layers, the younger individuals (6 years) primarily utilized soil water from intermediate and deep layers. Combining information from stable water isotopes and actual evapotranspiration we calculated soil water decline rates for all stands and found that soil water was declining between 14.0% to 24.7% in the 0–60 cm soil layer, 5.2% to 6.9% in the 60–200 cm soil layer, and 3.3% to 4.8% in the 200–500 cm soil layer. During the pre-rain season the deeper soil layers were substantially depleted, especially for young stands and in the drier year, and soil water decline rates were related to age-related differences in soil water content and soil drying patterns. This study presents the first isotope-based quantification of soil water decline across different R. pseudoacacia stand ages, highlighting the starkly different soil drying dynamics.

How to cite: Zhao, Y., Wang, Y., Zimin, L., and Floriancic, M. G.: Regulation of soil water consumption of Robinia pseudoacacia in different stand ages, EGU General Assembly 2026, Vienna, Austria, 3–8 May 2026, EGU26-23111, https://doi.org/10.5194/egusphere-egu26-23111, 2026.

EGU26-2295 | ECS | Posters on site | HS10.8

Small Weirs Reshape the Hyporheic Zone: Cumulative Thermal Responses across Seasonal operation cycle 

Ha-Yeong Seok, Ji-Young Baek, Dugin Kaown, Seong-Sun Lee, and Kang-Kun Lee

Small weirs are ubiquitous in agricultural watersheds, yet how their repeated seasonal operation reshapes groundwater–surface water interactions (GSI) remains poorly understood. This study explores the hydraulic, thermal, and geochemical responses to cyclic opening and closure of a small intake weir throughout the monitoring period along a 2.5-km reach of the Hyogyo Stream, South Korea. High-frequency monitoring of water level and electrical conductivity, together with multi-depth subsurface temperature observations, was conducted at three locations upstream of the weir within the study reach under both open and closed conditions. These continuous observations were complemented by four discrete δ¹⁸O–δD isotope surveys. Water level, electrical conductivity, isotope values, and subsurface temperature all captured individual weir-opening and -closure events. These event-scale responses included water-level rise, channel inundation, and transient flooding of streambanks and were accompanied by electrical-conductivity and isotope shifts indicative of enhanced surface water–subsurface water mixing. During the initial closure, diurnal thermal signals penetrated to depths of 3.5–4.0 m, indicating an expanded hyporheic exchange zone. Unlike other parameters, thermal signals at depth (3.5–4.0 m) progressively converged to a stable temperature with repeated weir opening and closure, implying contraction and reorganization of the active exchange zone despite comparable hydraulic forcing. These cumulative thermal responses may induce long-term restructuring of the hyporheic thermal regime. Our findings highlight the need to consider small weirs in integrated water management, particularly by emphasizing long-term thermal monitoring in agricultural watersheds.

Acknowledgement: This work was supported by the National Research Foundation of Korea (NRF) grant funded by the Korea government (MSIP) (No. 2022R1A2C1006696). This work was supported by the National Research Foundation of Korea (NRF) grant funded by the Korea government (MSIT)(No.RS-2022-NR070842). This work was supported by a grant from the National Institute of Environmental Research (NIER), funded by the Ministry of Environment (ME) of the Republic of Korea (NIER-2025-04-02-051).

How to cite: Seok, H.-Y., Baek, J.-Y., Kaown, D., Lee, S.-S., and Lee, K.-K.: Small Weirs Reshape the Hyporheic Zone: Cumulative Thermal Responses across Seasonal operation cycle, EGU General Assembly 2026, Vienna, Austria, 3–8 May 2026, EGU26-2295, https://doi.org/10.5194/egusphere-egu26-2295, 2026.

Seepage across a streambed is typically expressed by Darcy's law, q = Kc · ΔH / wc, where Kc and wc are the hydraulic conductivity and thickness of the bed, respectively, and ΔH is the hydraulic head gradient. When the stream is “disconnected” – i.e., an unsaturated zone exists beneath it – the suction at the lower bed interface no longer follows the groundwater head. Capturing this effect requires solving a nonlinear equation that incorporates the unsaturated hydraulic conductivity (UHC) relationship of the underlying aquifer (most commonly described by van Genuchten–Mualem or Brooks‑Corey–Burdine parametrizations). Because of the added computational burden, many modelling packages (e.g., MODFLOW) simplify the problem by assuming zero suction, which leads to systematic underestimation of seepage.
In this study we analyse the governing nonlinear equation using a generic UHC function that exhibits a power‑law behaviour in the dry limit. First, we examine the zero‑stage (h = 0) case and demonstrate that three distinct asymptotic solutions arise, depending on the relative magnitude of the dimensionless groups (Ka/Kc)1+1/b and B1/b wcKa/hgKc, where Ka is the aquifer hydraulic conductivity. Here b and B are shape parameters that depend on the chosen parameterisation (for example, for Van Genuchten–Mualem, b = (5n − 1)/2 and B = (1 − 1/n)2) and hg is the associated scale parameter. From these asymptotes we identify two clogging regimes. For hard clogging, seepage becomes independent of aquifer properties; in this regime the MODFLOW simplification is exact. For soft clogging, zero-stage seepage converges to q0 = Ka · (wcKa/hgKc)-b/(1+b).
We then derive an analytical approximation that smoothly bridges the asymptotic limits. Validation against the exact numerical solution shows that the new expression provides a rapid yet more accurate alternative to the conventional MODFLOW formulation. Finally, we argue that a positive stage simply adds a linear term to the flux, yielding q  ≈  q0  +  wc/Kc · h. Based on this insight, we propose a novel method for assessing surface water - groundwater disconnection.

How to cite: Paccolat, J.: Analytical description of seepage from disconnected surface water: improved approximate solution and insights for disconnection assessment, EGU General Assembly 2026, Vienna, Austria, 3–8 May 2026, EGU26-3724, https://doi.org/10.5194/egusphere-egu26-3724, 2026.

Lacustrine groundwater discharge (LGD) and its associated nitrogen (N) and phosphorus (P) inputs are increasingly recognized as the critical drivers of lake eutrophication. However, the intermonthly variability in LGD and its influence on lake nutrient dynamics remain poorly understood. In this study, high-frequency monitoring and hydrochemical analyses were conducted over a full hydrological year to investigate LGD-related nutrient fluxes and their effects in a typical oxbow lake in the central Yangtze Basin. Water level data and 222Rn tracing revealed a seasonal LGD pattern characterized by an increase from summer to winter, followed by a decline from winter to spring, with LGD rates ranging from 35.36 to 51.71 mm·d-1. This pattern was regulated by monthly net precipitation, which controlled the lake level fluctuations and LGD rates. The corresponding N and P loads varied synchronously with LGD and showed seasonal synchrony with lake N and P concentrations. Moreover, variations in the N/P ratio carried by LGD regulate the lake water N/P ratio, thereby influencing its relationship with the dynamic changes in chlorophyll-a. From a global perspective, in closed lakes, LGD is typically governed by climatic factors such as precipitation and evaporation, thereby serving as a key process regulating the lake’s trophic status. This study provides the first evidence that groundwater-driven nutrient loading influences lake nutrient status on an intermonthly scale offering new insights and management strategies for eutrophication control in shallow, closed lake systems worldwide.

How to cite: Sun, X.: Seasonal dynamics of closed lakes nutrient status controlled by lacustrine groundwater discharge, EGU General Assembly 2026, Vienna, Austria, 3–8 May 2026, EGU26-6479, https://doi.org/10.5194/egusphere-egu26-6479, 2026.

EGU26-7203 | ECS | Orals | HS10.8

Reactive Transport in Pore-Scale Biofilms: Model-Based Interpretation of a Microfluidic Experiment 

Malik Dawi, Giulia Ceriotti, Aronne Dell’Oca, Giovanni Porta, and Martina Siena

Quantifying solute transport in biofilm-colonized porous media is essential for predicting microbially mediated processes in the hyporheic zone, especially in the presence of anoxic niches. However, our understanding of how pore-scale biofilm structure governs local transport remains limited, posing a significant challenge in developing accurate large-scale reactive transport models. The inherent structural heterogeneity of biofilms makes direct characterization of internal mass transfer technically difficult and complicates the interpretation of experimental observations.

In this study, we combine a high-resolution microfluidic experiment with pore-scale reactive transport modelling to investigate dissolved oxygen transport in biofilm-colonized pore spaces. Transparent planar optical sensors integrated into the microfluidic platform enabled non-invasive imaging of oxygen concentration fields at high spatial resolution, providing direct insight into intra-biofilm transport behaviour. To interpret these observations, we employed a pore-scale micro-continuum modelling framework in which the biofilm is represented as a fluid-filled microporous medium characterized by microscale transport properties, including permeability and effective diffusivity. The numerical model was calibrated against experimental datasets using an optimization-based approach, allowing for the simultaneous estimation of the permeability of the biofilm, effective diffusivity, and metabolic kinetic parameters. Results show strong agreement between simulated and measured oxygen distributions, supporting the suitability of the modelling framework to resolve complex mass transfer mechanisms at the fluid–biofilm interface. Analysis of the inferred parameters suggests that diffusive transport dominates within the biofilm matrix, while biofilm permeability is found to be relatively low. Furthermore, the resolved oxygen consumption rates were found to be significantly lower than those observed in batch reactors, highlighting the role of pore-scale environmental limitations on metabolic activity. This work establishes a robust framework for further exploring the relationship between biofilm morphology and reactive transport, providing a basis for more accurate upscaling in complex porous environments.

How to cite: Dawi, M., Ceriotti, G., Dell’Oca, A., Porta, G., and Siena, M.: Reactive Transport in Pore-Scale Biofilms: Model-Based Interpretation of a Microfluidic Experiment, EGU General Assembly 2026, Vienna, Austria, 3–8 May 2026, EGU26-7203, https://doi.org/10.5194/egusphere-egu26-7203, 2026.

EGU26-7416 | ECS | Posters on site | HS10.8

Solute mixing in the hyporheic zone: impact of dispersion, upwelling and heterogeneity. 

Daniele Fistolera and Aronne Dell'Oca

The hyporheic zone is a key interface where surface water and groundwater interact, triggering a wide range of biogeochemical reactions. This interaction is governed by mixing processes whose dynamics remain poorly understood in hyporheic environments. Here we investigate hyporheic mixing using numerical simulations of Darcy-scale flow and solute transport beneath river bedforms in heterogeneous porous media. We consider a range of conditions that vary solute advection and dispersion, groundwater upwelling intensity, and the ratio between the heterogeneity correlation length and bedform size. Mixing is quantified through the scalar dissipation rate and by assessing the emergence of ergodic behavior in hyporheic transport. Finally, we interpret the resulting mixing dynamics within a lamellar framework, in which the stretching and elongation of material elements traveling through the hyporheic zone control the efficiency of mixing.

How to cite: Fistolera, D. and Dell'Oca, A.: Solute mixing in the hyporheic zone: impact of dispersion, upwelling and heterogeneity., EGU General Assembly 2026, Vienna, Austria, 3–8 May 2026, EGU26-7416, https://doi.org/10.5194/egusphere-egu26-7416, 2026.

EGU26-7674 | Orals | HS10.8

Surface Water–Groundwater Interactions and Flow Variability in the Everglades: Implications for Freshwater Delivery to Florida Bay 

Assefa Melesse, Ethiopia Zeleke, Alemayehu Shanko, Tania Islam, and Rene Price

Surface Water–Groundwater Interactions and Flow Variability in the Everglades: Implications for Freshwater Delivery to Florida Bay

Assefa Melesse, Ethiopia Zeleke, Alemayehu Shanko, Tania, Islam, Rene Price

Department of Earth and Environment, Institute of Environment

Florida International University, Miami, USA

Abstract
The dynamic exchange between surface water and groundwater is critical for impacting the functions of the Everglades ecosystem. The spatiotemporal variability of freshwater exchanges related to freshwater delivery to Florida Bay is not adequately characterized or understood. This study focuses on the results of a comprehensive data analysis to examine the flow variability and surface–groundwater interactions, with a particular focus on freshwater delivery through Taylor sloughs to Florida Bay. Field observations and historical long-term monitoring data were used in the analysis to estimate the spatiotemporal patterns and trends of surface–groundwater interactions under varying climatic and water management conditions. Statistical approaches were applied to identify dominant controls on flow variability and exchange processes. The spatial heterogeneity of interactions was significant, indicating that freshwater exchange rates vary across different hydrogeologic settings in relation to seasonal water variations and rainfall volumes. This analysis reveals how water delivery through Taylor slough to Florida Bay is highly inter-annual and seasonal mainly driven by climatic as well as water management decisions. Given the sensitivity of the salinity regime of Florida Bay to freshwater inflow, the findings of this analysis have important implications for ecosystem restoration. This analysis provides insights into the coupled surface‒subsurface hydrological processes that govern water movement in this unique wetland system, contributing to the improved understanding necessary for effective water management and ecosystem restoration in the greater Everglades landscape.


Keywords: Everglades, Surface–groundwater interactions, Florida Bay, Taylor slough, Flow variability

How to cite: Melesse, A., Zeleke, E., Shanko, A., Islam, T., and Price, R.: Surface Water–Groundwater Interactions and Flow Variability in the Everglades: Implications for Freshwater Delivery to Florida Bay, EGU General Assembly 2026, Vienna, Austria, 3–8 May 2026, EGU26-7674, https://doi.org/10.5194/egusphere-egu26-7674, 2026.

EGU26-8070 | Orals | HS10.8

How hyporheic pumping and bedform migration redistribute microplastic burial in sand-bed rivers 

Alessandra Marzadri, Daniele Tonina, and Nerea Karmele Portillo de Arbeloa

The hyporheic zone plays a key role in controlling stream water quality by regulating the transport and transformation of nutrients and contaminants. Recently, growing attention has focused on hyporheic exchange as a driver of microplastic (MP) burial and resuspension, because of its ubiquity, persistence and their documented ecological impacts. Here, we investigate how MPs enter, become trapped, buried and released from sand-bed rivers with mobile dunes. We developed a semi-analytical solution of the flow field to delineate the MP trajectories considering the coupled effect of pumping (due to pressure variation at the water-sediment interface) and turnover (due to bedform migration). Along each exchange path, we then solved an advection–dispersion-reaction equation (ADRE) analytically. To represent progressive resistance/clogging effects, we incorporate spatially varying velocity, dispersion, retardation and first order removal coefficients.

Results show MP retention within the hyporheic zone is dictated by the interplay between stream hydro-morphology (dune geometry, migration speed and alluvial depth) and along-path retention processes. The transport formulation induces an exponential decay of MP concentration with both trajectory length and residence time, meaning that, beyond a certain point, longer subsurface travel does not necessarily equate to higher retention efficiency. Importantly, bedform migration does not simply increase or decrease MP burial uniformly but instead redistributes retention between near-surface and deeper sediment layers by enhancing shallow recirculation while intermittently disrupting long, deep pathways. The proposed framework shows how bedform dynamics influence the transport and persistence of microplastics with direct implications for ecosystem health and risk assessment at the watershed scale.

How to cite: Marzadri, A., Tonina, D., and Portillo de Arbeloa, N. K.: How hyporheic pumping and bedform migration redistribute microplastic burial in sand-bed rivers, EGU General Assembly 2026, Vienna, Austria, 3–8 May 2026, EGU26-8070, https://doi.org/10.5194/egusphere-egu26-8070, 2026.

Excess phosphorus inputs to surface waters are a major driver of freshwater eutrophication. Although groundwater can be an important source of phosphorus to surface waters in some settings, its contribution remains poorly quantified.  Quantifying phosphorus loads to surface waters is particularly challenging due to heterogeneous groundwater flow pathways and concentrations, combined with the high reactivity of phosphorus with subsurface materials and dynamic biological uptake and release processes. This presentation will synthesize lessons learned from multi-scale studies we have conducted that aimed to quantify groundwater phosphorus inputs to streams and lakes and identify the factors that drive hot spots and hot moments of phosphorus release from groundwater to surface waters. The synthesis draws on studies spanning i) regional-scale longitudinal stream surveys using radon-222 and phosphorus measurements,  ii) year-round groundwater sampling in a riparian zone, and iii) high resolution measurements of streambed phosphorus and groundwater-surface water exchange. Collectively these studies highlight the importance of accounting for dynamic processes that control phosphorus delivery to surface waters and underscore the need for caution when upscaling localized groundwater measurements that do not capture spatial variability in phosphorus concentrations.  

How to cite: Robinson, C. and Roy, J.: Assessing Phosphorus Loading to Surface Waters from Groundwater: Challenges and Lessons Learnt, EGU General Assembly 2026, Vienna, Austria, 3–8 May 2026, EGU26-8311, https://doi.org/10.5194/egusphere-egu26-8311, 2026.

EGU26-8535 | Posters on site | HS10.8

The impact of atmospheric oxygen supply on the nitrogen cycle during hyporheic exchange in the river bank aquifer 

Yiming Li, Dan Ouyang, Man Tong, Zhang Wen, and Qi Zhu

Hyporheic exchange between surface water and groundwater governs the biogeochemical cycling of groundwater in riparian zones and plays a crucial role in the spatiotemporal dynamics of watershed aquatic environments. The spatiotemporal dynamics of oxygen during this exchange determine the redox zonation of groundwater, thereby controlling the activity of reactions such as aerobic respiration, nitrification, and denitrification. However, most current studies assume that oxygen-rich river water is the sole source of oxygen in riparian aquifers, overlooking the significant oxygen supply process via atmospheric diffusion and dissolution into the unsaturated zone. Therefore, this study developed a numerical model of gas–liquid two-phase flow and reactive solute transport in the phreatic aquifer of a riparian zone to investigate nitrogen migration and transformation processes under the influence of atmospheric oxygen diffusion and dissolution. By comparing the classical model with an oxygen diffusion model under varying hydraulic conductivities, river stage fluctuation amplitudes, and rainfall infiltration rates, we found that: (1) Oxygen diffusion from the atmosphere increases dissolved oxygen (DO) concentrations in the aquifer by over 200%, leading to a 220% increase in nitrification rates and a 40% increase in denitrification rates; (2) The influence of oxygen diffusion on nitrogen cycling in riparian zones is positively correlated with hydraulic conductivity. oxygen is more readily supplied under high-permeability conditions, and then accelerating nitrogen cycling reactions; (3) Although oxygen-rich rainfall infiltration provides a direct DO input, it weakens the dissolution–diffusion process of oxygen. Under the “competitive supply” of these two processes, the DO flux into the riparian zone is positively correlated with infiltration rate. These results highlight the critical role of atmospheric oxygen diffusion in shaping subsurface redox conditions and nitrogen dynamics, underscoring the need to incorporate unsaturated zone processes into future riparian biogeochemical models.

How to cite: Li, Y., Ouyang, D., Tong, M., Wen, Z., and Zhu, Q.: The impact of atmospheric oxygen supply on the nitrogen cycle during hyporheic exchange in the river bank aquifer, EGU General Assembly 2026, Vienna, Austria, 3–8 May 2026, EGU26-8535, https://doi.org/10.5194/egusphere-egu26-8535, 2026.

EGU26-8806 | ECS | Orals | HS10.8

Groundwater-Driven Greenhouse Gas Fluxes in a Headwater Stream 

Zeinabbano AhaniAmineh, Martin Andersen, Helen Rutlidge, William Glamore, Rita Henderson, Mahmood Sadat-Noori, and Alec Davie

Streams are integral components of the global carbon cycle, functioning not only as conduits for terrestrial carbon transport to the ocean but also as active sites of carbon transformation, storage, and greenhouse gas (GHG) evasion. Despite their importance, estimates of stream CO₂ and CH₄ emissions remain highly uncertain, particularly in headwater systems where groundwater inputs may represent a dominant yet poorly quantified source.

In this study, we quantified the role of groundwater discharge in regulating dissolved carbon dynamics and GHG evasion within an urban headwater stream (Manly Creek, Sydney, Australia). Groundwater discharge zones were identified using radon (²²²Rn) as a natural tracer, and groundwater inflows were quantified using a steady-state radon mass-balance approach. Dissolved CO₂ and CH₄ concentrations were measured in surface water and groundwater to assess groundwater-derived gas inputs and their influence on stream-atmosphere exchange.

Groundwater exhibited substantially elevated radon, CO₂, and CH₄ concentrations relative to surface water, confirming strong subsurface accumulation before discharge. A distinct mid-reach groundwater discharge zone was identified, where stream CO₂ and CH₄ concentrations were approximately five-fold and more than two-hundred-fold higher, respectively, than in adjacent surface-water-dominated reaches. Within this groundwater-influenced reach, water–air evasion fluxes ranged from 1037–1959 mmol m⁻² d⁻¹ for CO₂ and 271–511 mmol m⁻² d⁻¹ for CH₄, indicating intense, spatially focused GHG emissions associated with groundwater discharge. Radon mass-balance results showed that advective groundwater inputs overwhelmingly dominated over sediment diffusion and radioactive decay, indicating that groundwater discharge is the primary mechanism sustaining elevated dissolved gas concentrations and evasion fluxes in this reach.

By explicitly linking groundwater discharge to localized but disproportionately high stream GHG emissions, this study demonstrates how unresolved groundwater-surface water interactions can lead to systematic underestimation of inland-water emissions in bottom-up carbon budgets. Incorporating such spatially focused groundwater-driven fluxes provides a pathway toward reconciling bottom-up stream emission estimates with top-down atmospheric constraints, thereby improving assessments of inland-water contributions to climate-relevant carbon cycling.

How to cite: AhaniAmineh, Z., Andersen, M., Rutlidge, H., Glamore, W., Henderson, R., Sadat-Noori, M., and Davie, A.: Groundwater-Driven Greenhouse Gas Fluxes in a Headwater Stream, EGU General Assembly 2026, Vienna, Austria, 3–8 May 2026, EGU26-8806, https://doi.org/10.5194/egusphere-egu26-8806, 2026.

EGU26-8955 | ECS | Posters on site | HS10.8

Earth Observation Based Functional Characterization of Riparian Interfaces across Climatic Zones 

Srija Roy, Shivam Singh, and Manish Kumar Goyal

Riparian zones are dynamic eco-hydrological interfaces regulating groundwater-surface water (GW-SW) exchange by controlling vertical and lateral fluxes of water, heat, sediments, and biogeochemical constituents along river corridors. Most Earth Observation (EO) studies, however, treat them as static land-cover units rather than functional exchange domains, limiting insights into subsurface connectivity and hydrological processes. To address this gap, this study develops a process oriented EO framework to delineate functional riparian zones based on hydrological connectivity and climatic sensitivity. Multi-decadal EO datasets were integrated with hydro-climatic indicators of spectral vegetation indices, inundation frequency, surface moisture proxies, and land surface temperature metrics to distinguish permanent and seasonal riparian interfaces and were interpreted as proxies for GW-SW exchange intensity, residence time, and flow directionality. The framework was applied across climatically heterogeneous river corridors spanning multiple Köppen-Geiger climate classes across India, representing distinct precipitation-temperature regimes. The results indicate that Permanent riparian interfaces occupy only 18-27% of the geomorphic floodplain area but account for >55% of persistent surface-subsurface connectivity. Contrastingly, seasonal riparian zones expand by up to 2.6 times during monsoon or high-precipitation periods. This further highlights the climate-driven activation of transient GW-SW pathways. Humid climatic regions exhibit stable vegetation persistence and low thermal variability and are indicative of sustained gaining conditions and shallow groundwater tables. Semi-arid reaches show high seasonal variability, episodic losing conditions, and rapid contraction of active interfaces. Climatic transition zones display the highest temporal instability from bidirectional GW-SW fluxes governed by threshold-controlled switching between hydrological states. Moreover, trend and non-parametric breakpoint analysis of extreme climate indices indicate regime shifts in 32-41% of seasonal riparian interfaces across the varying climatic zones across India after the early 2000s. Further, rainfall dominated basins show the strongest response due to weak hydrological memory and event-driven processes. Thus, Riparian zones emerge as transient control volumes regulating GW-SW coupling under changing climatic forcing. This approach advances riparian analysis from spatial mapping to functional characterisation and supports scalable, process-based riparian management focused on buffering capacity, resilience, and subsurface connectivity.

How to cite: Roy, S., Singh, S., and Goyal, M. K.: Earth Observation Based Functional Characterization of Riparian Interfaces across Climatic Zones, EGU General Assembly 2026, Vienna, Austria, 3–8 May 2026, EGU26-8955, https://doi.org/10.5194/egusphere-egu26-8955, 2026.

EGU26-10319 | Posters on site | HS10.8

Key findings from 15 years of research on attenuation of trace organic compounds in the River Erpe 

Jörg Lewandowski, Josephina Neumann, Malte Posselt, Christoph J. Reith, Jonas L. Schaper, M. Aleja Villa Arroyave, Shai Arnon, Anke Putschew, and Stephanie Spahr

Trace organic compounds (TrOCs) in water bodies worldwide are a major concern. In addition to reducing the loads and improving the understanding of the ecotoxicological effects of TrOC cocktails, it is important to gain a better understanding of the pathways and fate of this large group of compounds in the environment. The lowland River Erpe in Berlin/Brandenburg, Germany, which receives treated wastewater from an urban wastewater treatment plant, is an excellent site for such research. The exceptionally high TrOC concentrations in the River Erpe enable reliable process studies with minimal analytical effort, as prior enrichment steps aren’t required. The river system also offers a variety of reaches that differ in terms of hydrology and streambed morphology, enabling different types of investigation. Over the past 15 years, more than 100 researchers have conducted several large-scale and numerous smaller studies on the River Erpe. Topics have included the role of hyporheic zones in the self-purification capacity of streams with respect to TrOCs; seasonal changes in instream processes; interactions between easily degradable organic matter and TrOC attenuation; the importance of identifying flow paths to understand biogeochemical processes; the effects of management actions, such as the removal of macrophytes, on the fate of TrOCs; the effects of losing conditions on TrOC input to aquifers and bank filtration systems; the effects of discharging treated effluents from a large, new industrial site on the composition of the river water; and identifying microbial key players associated with TrOC removal. Current research topics include bioremediation, the impact of migrating bedforms on TrOC fate, as well as the seasonal development of loads. Research highlights and future directions are presented.

How to cite: Lewandowski, J., Neumann, J., Posselt, M., Reith, C. J., Schaper, J. L., Villa Arroyave, M. A., Arnon, S., Putschew, A., and Spahr, S.: Key findings from 15 years of research on attenuation of trace organic compounds in the River Erpe, EGU General Assembly 2026, Vienna, Austria, 3–8 May 2026, EGU26-10319, https://doi.org/10.5194/egusphere-egu26-10319, 2026.

EGU26-13915 | ECS | Orals | HS10.8

Groundwater–surface water interactions in an anthropized Mediterranean braided river: insights from combined UAV-based thermal imagery and electrical resistivity tomography 

Fanny Picourlat, Sebastián Granados-Bolaños, Youness Ouassanouan, Salah Ouhamdouch, Maurin Vidal, Romain Besso, Thomas Lebourg, Félix Billaud, Paguedame Game, Jérémy Targosz, Nicolas Fantino, Séverine Altschuler, Benoît Viguier, and Morgan Abily

Although the interaction between groundwater (GW) and surface water (SW) has been the subject of numerous studies, few of them have focused on braided river environments. Yet these environments form essential freshwater resources and unique ecosystems. This work analyses GW-SW interactions in the Var River alluvial plain (30 km²), which is located in south-east France. The alluvial aquifer of the Var River is a crucial resource for the nearby, densely populated coastal area of the French Riviera. The objective is therefore twofold: i) to improve the conceptual understanding of GW-SW exchanges in an anthropized Mediterranean braided river, and ii) to support the operational management of the water resource. In order to achieve a multi-scale understanding of the different processes involved in GW-SW interactions, a multidisciplinary approach is being implemented in the Var alluvial plain. It incorporates methods from hydrometry, hydrogeophysics, geochemistry, aerial and satellite imaging, hydrosedimentology and numerical modelling. Here, we show results obtained by combining two methods: unmanned aerial vehicle (UAV)-based infrared thermal imagery and electrical resistivity tomography (ERT). Thermal infrared imaging of the Var riverbed was carried out in July 2025 (when piezometric levels began to decrease) using a light-weight UAV, and ERT was performed at four study sites along the river between September and November 2025 (when piezometric levels were at their lowest). The results obtained led to a new conceptualization of the connectivity and interactions between the river and the aquifer. This conceptualization is intended to be further enriched by combining more results from the multidisciplinary approach, particularly from a fully integrated modelling of surface and subsurface flows.

How to cite: Picourlat, F., Granados-Bolaños, S., Ouassanouan, Y., Ouhamdouch, S., Vidal, M., Besso, R., Lebourg, T., Billaud, F., Game, P., Targosz, J., Fantino, N., Altschuler, S., Viguier, B., and Abily, M.: Groundwater–surface water interactions in an anthropized Mediterranean braided river: insights from combined UAV-based thermal imagery and electrical resistivity tomography, EGU General Assembly 2026, Vienna, Austria, 3–8 May 2026, EGU26-13915, https://doi.org/10.5194/egusphere-egu26-13915, 2026.

In the arid plains of Northwest China, intensive agricultural activities and extreme climatic conditions have profoundly reshaped regional hydrological cycles. This study integrates hydrochemical analysis with multi-isotope tracing, including stable water isotopes (δ²H and δ¹⁸O) and nitrate isotopes (δ¹⁵N and δ¹⁸O), to quantify the complex interactions between surface water (SW) and groundwater (GW). Our findings demonstrate that large-scale agricultural irrigation serves as the primary physical driver enhancing the intensity and frequency of SW–GW exchanges. Isotopic signatures reveal that persistent irrigation return flows have strengthened the hydraulic connectivity between surface water bodies and shallow aquifers. This physical interaction further triggers significant biogeochemical responses. The irrigation-induced leaching of soil salts, coupled with intensive evaporation, is identified as the core factor governing groundwater salinization and quality deterioration, with Total Dissolved Solids (TDS) values ranging from 516 to 2684 mg/L. Hydrochemical modeling confirms that anthropogenic intervention, specifically cropland expansion and groundwater overexploitation, has superseded natural rock-water interactions in controlling the hydrochemical facies. To maintain water–ecology–agriculture security in arid regions, we propose that optimizing irrigation quotas and enhancing floodwater utilization are essential for sustainable groundwater management. This research provides critical insights into the mechanism of water quality evolution under the dual pressure of climate change and human interference.

How to cite: Wang, W.: Agricultural Irrigation as a Dominant Driver of Surface Water–Groundwater Interactions and Hydrochemical Evolution in Arid Northwest China, EGU General Assembly 2026, Vienna, Austria, 3–8 May 2026, EGU26-15021, https://doi.org/10.5194/egusphere-egu26-15021, 2026.

EGU26-15049 | ECS | Posters on site | HS10.8

Hydrochemical and isotopic evidence of groundwater contribution to wetlands in a coastal plain aquifer, southern Brazil 

Luísa Collischonn, Francesco Ronchetti, Maria Luiza Correa da Camara Rosa, and Roberto Eduardo Kirchheim

The Coxilha das Lombas Aquifer System is located in the coastal plain of the Pelotas Basin, southern Brazil. Associated with Pleistocene eolian deposits, it is considered the most productive aquifer system in the Porto Alegre Metropolitan Region, capital of the state of Rio Grande do Sul. Despite its strategic importance and the pressure related to its use, the system still lacks a more comprehensive understanding of its groundwater flow and hydrochemical characteristics. This aquifer system constitutes a groundwater recharge area extending approximately 70 km in length (NE–SW direction) and about 10 km in width. Its topographic highs coincide with a regional groundwater divide, characterized by divergent flow paths. According to several authors, groundwater discharge contributes to lagoons, wetlands, and watercourses that drain toward the Lagoa dos Patos to the southeast—the world’s largest choked coastal lagoon—and toward the Gravataí River basin to the northwest. In this context, a hydrochemical study of the Coxilha das Lombas Aquifer System was carried out, integrating pre-existing data with new field data obtained from the collection and analysis of 85 groundwater samples along the aquifer extent, encompassing different depths and well types. The analyzed parameters included pH, electrical conductivity, total dissolved solids, and the major anions and cations. The results indicate predominantly sodium–chloride hydrochemical facies, with a median pH of 5.3, characterizing acidic waters, likely of meteoric origin. Low values of total dissolved solids, electrical conductivity, and alkalinity were observed (TDS = 36 mg/L, EC = 46 μS/cm, and alkalinity = 4.83 mg/L), reflecting the low degree of mineralization of the aquifer waters, probably related to a short groundwater residence time. Additionally, 21 groundwater and surface water samples were collected for oxygen and hydrogen isotope analyses. These results will be evaluated using precipitation data from the Global Network of Isotopes in Precipitation (GNIP-POA) station in Porto Alegre, operated by the Geological Survey of Brazil, and are expected to provide insights into water origin and groundwater contribution to wetlands and surface watercourses in the region through groundwater-surface water mixing relationships.


This work is part of the project “Geological evolution and hydrostratigraphy of Coxilha das Lombas, northwestern coastal plain of Rio Grande do Sul” (no. 407572/2023-6), supported by the Conselho Nacional de Desenvolvimento Científico e Tecnológico (CNPq).

How to cite: Collischonn, L., Ronchetti, F., Correa da Camara Rosa, M. L., and Kirchheim, R. E.: Hydrochemical and isotopic evidence of groundwater contribution to wetlands in a coastal plain aquifer, southern Brazil, EGU General Assembly 2026, Vienna, Austria, 3–8 May 2026, EGU26-15049, https://doi.org/10.5194/egusphere-egu26-15049, 2026.

EGU26-15170 | Orals | HS10.8

Groundwater-surface water exchange processes in alluvial rivers 

Scott Wilson and Thomas Wöhling

Recent research on braided rivers in New Zealand has revealed how groundwater is recharged from braided rivers, and alluvial rivers in general. A defining feature of alluvial rivers is the development of a thin (2-5m thick) high permeability braidplain aquifer/ bed reservoir. This feature forms through the process of sediment mobilisation during flood events. Field observations in braided rivers reveal that water is freely exchanged between river channels and the bed reservoir, which accommodates parafluvial flow. The river channels and associated reservoir together constitute a river system (Wilson et al. 2024). Exchange between the river system and regional aquifer is controlled by the water level in the bed reservoir rather than river stage. This has important implications for how groundwater-surface water exchange occurs in alluvial systems.

Firstly, flow exchange between channels and the bed reservoir is preferentially lateral via the banks rather than vertically via the bed. In isotropic sediments, Darcy’s Law predicts that flow exchange will occur vertically through the river bed, and that flux will vary with river stage. However, alluvial sediments are strongly anisotropic, with lateral hydraulic conductivities magnitudes greater than the vertical. Groundwater temperature observations show that specific discharge adjacent to the bed reservoir is much greater than that beneath the bed reservoir. The flux beneath the river system is stable, with variations in flux only occurring along the river margins.  

Secondly, exchange between the river system and adjacent aquifer is primarily controlled by transmissivity rather than hydraulic gradient. It is commonly considered that groundwater recharge is controlled by the head difference between the river system and adjacent regional aquifer. Under this scenario, we would expect river losses to increase when groundwater levels in the regional aquifer become very low due to an increased hydraulic gradient. However, in the Wairau system we observe the opposite, and that river flows are sustained during periods of low groundwater level. Because the river bed reservoir is very thin, changes in hydraulic gradient are small compared to changes in reservoir saturation. When groundwater levels are low, the transmissivity along the bed reservoir margin is lower, resulting in lower exchange rates. 

Wilson, S. R., Hoyle, J., Measures, R., di Ciacca, A., Morgan, L. K., Banks, E. W., Robb, L., & Wöhling, T. (2024). Conceptualising surface water–groundwater exchange in braided river systems. Hydrology and Earth System Sciences, 28(12), 2721–2743. https://doi.org/10.5194/hess-28-2721-2024

How to cite: Wilson, S. and Wöhling, T.: Groundwater-surface water exchange processes in alluvial rivers, EGU General Assembly 2026, Vienna, Austria, 3–8 May 2026, EGU26-15170, https://doi.org/10.5194/egusphere-egu26-15170, 2026.

EGU26-17313 | Posters on site | HS10.8

Transient storage model: the impact of temporally varying reaction rate 

Aronne Dell Oca, Tomas Aquino, and Kevin Roche

The transient storage model (TSM) has been widely used to interpret solute transport in river corridors. Its key components are a mobile domain, representing the main channel, and an immobile domain, accounting for solute storage within the hyporheic zone, where biogeochemical transformations are known to occur. In this study, we consider a reactive immobile compartment characterized by a linear reaction whose rate fluctuates over time. We systematically explore combinations of characteristic storage times, reaction-rate fluctuation periods, and the relative importance of advection and dispersion in the mobile domain to identify the regimes in which temporal fluctuations exert a significant control on solute dynamics. Furthermore, we derive a semi-analytical expression for the effective reactivity of the river corridor, highlighting deviations from the classical scenario assuming a time-invariant reaction rate in the immobile domain.

How to cite: Dell Oca, A., Aquino, T., and Roche, K.: Transient storage model: the impact of temporally varying reaction rate, EGU General Assembly 2026, Vienna, Austria, 3–8 May 2026, EGU26-17313, https://doi.org/10.5194/egusphere-egu26-17313, 2026.

EGU26-18620 | ECS | Posters on site | HS10.8

Soil structure strongly controls vertical microplastic transport in floodplain soils 

Lennart Echstenkämper, Markus Rolf, Rizwan Khaleel, Hannes Laermanns, Florian Pohl, and Christina Bogner

Floodplains are highly dynamic systems and can accumulate large quantities of microplastics (MPs), yet the mechanisms controlling their vertical redistribution after deposition remain poorly constrained. We investigate MP infiltration and transport in undisturbed Rhine floodplain soils using intact 0–20 cm cores subjected to a controlled flooding scenario. A particle mix of polypropylene (PP), polystyrene (PS), and polyethylene terephthalate (PET) (20–75 µm), cryomilled and pre-incubated in Rhine water to allow biofilm formation, was applied to the soil surface prior to flooding. Particles were labelled with Rhodamine-B and metal oxides to enable complementary optical and elemental tracing. Water flow and tracer transport were monitored using D₂O breakthrough curves and continuous gravimetric measurements.

After freezing, soil columns were sectioned into 2 cm layers, and MPs were quantified by fluorescence microscopy, µ-XRF, and AI-assisted particle recognition. Results indicate rapid MP infiltration and vertical transport within the soil. MP breakthrough was observed in all columns, although breakthrough timing and concentrations varied among replicates.  Vertical transport was strongly governed by spatial heterogeneity and preferential flow paths, particularly biogenic macropores, whereas saturated hydraulic conductivity alone did not reliably predict MP movement. These findings highlight the dominant role of soil structural controls in floodplain MP transport and challenge the use of bulk hydraulic parameters for predicting MP redistribution during flooding events.

How to cite: Echstenkämper, L., Rolf, M., Khaleel, R., Laermanns, H., Pohl, F., and Bogner, C.: Soil structure strongly controls vertical microplastic transport in floodplain soils, EGU General Assembly 2026, Vienna, Austria, 3–8 May 2026, EGU26-18620, https://doi.org/10.5194/egusphere-egu26-18620, 2026.

EGU26-19134 | Orals | HS10.8

Modular approach to calibration of supra-regional scale integrated surface-groundwater models 

Alberto Guadagnini, Leonardo Sandoval, Laura Condon, and Monica Riva

This study presents a theoretically sound operational framework for calibrating large-scale, high-fidelity integrated surface water-groundwater models to improve their reliability for water resources management. The approach combines ParFlow-CLM simulations of three-dimensional variably saturated flow with local sensitivity analysis and Gaussian Process Regression surrogates to enable efficient multi-stage calibration against water table depth and river discharge observations. The framework is applied to the entire system associated with the Po River District (87,000 km2) in northern Italy, resulting in the first robustly calibrated high-fidelity model at this spatial scale. Calibrated model parameters include hydraulic conductivities of the main subsurface geomaterials and Manning roughness coefficients of major rivers in the area. Our results show that clay hydraulic conductivity is a primary driver for groundwater table dynamics, while channel roughness dominates river discharge. Overall, the proposed strategy provides a robust computational framework for scenario analysis and sustainable water management under climate and anthropogenic pressures.

How to cite: Guadagnini, A., Sandoval, L., Condon, L., and Riva, M.: Modular approach to calibration of supra-regional scale integrated surface-groundwater models, EGU General Assembly 2026, Vienna, Austria, 3–8 May 2026, EGU26-19134, https://doi.org/10.5194/egusphere-egu26-19134, 2026.

EGU26-19139 | ECS | Orals | HS10.8

Assessing the fate of emerging organic contaminants in a coupled surface water-groundwater system 

Selina Hillmann, Edinsson Muñoz-Vega, Juan Carlos Richard-Cerda, and Stephan Schulz

For decades, wastewater containing significant amounts of emerging organic contaminants (EOCs) has been discharged into the aquatic environment. The introduction of EOCs into aquifers due to losing conditions of polluted rivers poses a serious risk for groundwater quality, which is particularly concerning in catchments with drinking water production facilities. Thus, understanding EOCs’ reactive transport processes in connected groundwater-surface water (GW-SW) systems are crucial for assessing their impact on water resources.

The present study investigates the GW-SW interaction at the Landgraben stream which is located within the Hessian Ried, Germany. Treated municipal and industrial wastewaters have been discharged into the Landgraben for decades, introducing a wide range of EOCs into the aquatic environment. To monitor the GW-SW interaction, we installed a complex monitoring system within and along a transect next to the Landgraben stream. The aims of our study are (i) to improve the understanding of the behaviour and fate of EOCs within the GW-SW interface and (ii) to link EOCs behaviour to the hydraulic responses of the seasonally varying stream. For this, we analysed 22 EOCs, as well as major ions, trace elements, dissolved organic carbon, rare earth elements and water stable isotopes over 16 months comprising two summers. Water samples were collected from the river, the hyporheic zone and the nearby groundwater at three different distances and at three depths at intervals ranging from biweekly to monthly.

Results show that the infiltration dynamics were strongly influenced by seasonal groundwater fluctuations, with influent conditions during summer and predominantly effluent conditions during winter. The second summer was characterized by a pronounced infiltration of river water into the aquifer driven by the preceding winter precipitation deficit.

The hydrochemical analysis showed a wide concentration range of EOCs in the river water samples. Of the compounds analysed, only Atenolol and Ciprofloxacin were not detected across the 29 sampling campaigns. Concentrations of the remaining 20 EOCs ranged from a few ng L⁻¹, for example Fluconazole (median = 52 ng L⁻¹), to several µg L⁻¹, such as Oxipurinol (median = 1957 ng L⁻¹). Overall, the detected EOCs cover a broad spectrum of chemical speciation and polarity, implying substantially different transport and attenuation behaviours along the SW-GW pathway. This variability is reflected in the sampled groundwater, where some compounds are no longer detected (eg., Sitagliptin, Venlafaxine), whereas others persist and even exhibit higher concentrations than those found in the stream during the sampling period (eg., Candesartan, Carbamazepine). Thus, this study highlights the significance of GW-SW interactions in the transport and attenuation of EOCs, providing insights into their differing fates within aquatic systems and how these relate to physicochemical properties.

How to cite: Hillmann, S., Muñoz-Vega, E., Richard-Cerda, J. C., and Schulz, S.: Assessing the fate of emerging organic contaminants in a coupled surface water-groundwater system, EGU General Assembly 2026, Vienna, Austria, 3–8 May 2026, EGU26-19139, https://doi.org/10.5194/egusphere-egu26-19139, 2026.

EGU26-19520 | Posters on site | HS10.8

Groundwater – surface water interactions revisited 

Jan Fleckenstein

Interactions between groundwater (GW) and surface water (SW) have been a focus of hydrologic research for some time. Seminal early work by J. Toth (1963) and later T. Winter (1999) had shown the existence of nested GW flow systems and stressed that surface water bodies are integral parts of these flow systems. Despite this early, integral perspective, a simpler perception of GW and SW as two distinct compartments, which interact via some often loosely defined transfer mechanisms, still prevails. This perception can be found in many hydrologic models, but can be misleading, as it implies the existence to two clearly separable compartments, while in fact GW and SW are part of a hydrologic continuum (as a part of the terrestrial hydrologic cycle), in which water dynamically transitions back and forth between surface water bodies (rivers, lakes, wetlands) and shallow aquifers. For example, shallow riparian groundwater may become stream water in one moment and return back to the alluvial aquifer in the next with implications for water and solute exchange and biogeochemical turnover. While simplified conceptualizations of the GW-SW hydrologic continuum may be acceptable for the simulation of catchment streamflow response, they usually fall short, when trying to represent fluxes and dynamics of nutrients and other solutes, which are typically controlled by hydrological and biogeochemical processes in the transition zone between GW and SW. I argue that in our quest to understand coupled hydrological and biogeochemical processes and GW dependent ecosystems at the catchment and landscape scales, we needed to revisit the perception of GW and SW as a hydrologic continuum. I will use the example of dissolved organic carbon (DOC) export from a headwater catchment to stress this point and illustrate how rich field data and an integral numerical model can help to refine and improve a simplified conceptual model for catchment-scale DOC export.


Toth, J. (1963) A Theoretical Analysis of Groundwater Flow in Small Drainage Basins, Journal of Geophysical Research, 68(16)

Winter, T. (1999) Relation of streams, lakes, and wetlands to groundwater flow systems, Hydrogeology Journal, 7:28-45

How to cite: Fleckenstein, J.: Groundwater – surface water interactions revisited, EGU General Assembly 2026, Vienna, Austria, 3–8 May 2026, EGU26-19520, https://doi.org/10.5194/egusphere-egu26-19520, 2026.

EGU26-19635 | ECS | Orals | HS10.8

Estimating Hydraulic Diffusivity and Streambed Resistance Using Surface Water-Groundwater Interactions under Hydropeaking Conditions 

Klara Höbenreich, Gabriele Chiogna, and Mónica Basilio-Hazas

Generating hydropower alters the streamflow dynamics of rivers, especially in the river reaches downstream of  hydroelectric plants. This causes hydropeaking, i.e. sudden and frequent fluctuations in river discharge. If a river is hydraulically connected with the adjacent aquifer, these fluctuations can be observed in the groundwater, depending on the distance from the river. In this study, we used this interaction to estimate the hydraulic diffusivity of the aquifer and the streambed resistance of two rivers located in the Adige valley (Northern Italy) by applying an analytical solution. We compared our model results with the observations of several piezometers located near the Noce and Adige rivers. While seasonal streamflow variability is significantly reduced and short term (sub-daily and weekly) fluctuations are increased in the Noce river, hydropeaking is less pronounced in the Adige. We compared the optimal model results of six different time windows, including low flow, medium and high flow events. Our results allowed for the estimation of the hydraulic diffusivity and revealed high spatial and temporal variability in the streambed resistance. The use of an analytical solution enables a rapid estimation of theses parameters, which can assist in calibrating numerical groundwater models. However, we highlight the importance of satisfying the necessary conditions required to apply this analytical approach; we demonstrate that while these conditions may be met under normal flow, they are not necessarily maintained under extreme conditions (i.e., floods and droughts).

How to cite: Höbenreich, K., Chiogna, G., and Basilio-Hazas, M.: Estimating Hydraulic Diffusivity and Streambed Resistance Using Surface Water-Groundwater Interactions under Hydropeaking Conditions, EGU General Assembly 2026, Vienna, Austria, 3–8 May 2026, EGU26-19635, https://doi.org/10.5194/egusphere-egu26-19635, 2026.

Lake Kinneret, Israel’s primary surface freshwater reservoir, faces ongoing salinization driven by a complex interplay of geological structures and deep saline groundwater sources. While the western and northern onshore and offshore saline spring systems thought to be the major lake salinization sources, 70% of the salts entering the lake come from disperse seepeges from the shores around the lake. The southeastern “Haon” shoreline is a potential location for major salinization of the lake due to high groundwater salinity below the lake (~25,000 mg/L of total dissolved solids) and higher hydraulic head compared to the lake level. There is a need to research potential actions to try and mitigate the salt discharge into the lake. This study investigates the use of pumping wells for extraction of the underlying brine to mitigate saline lacustrine groundwater discharge. We used continuous monitoring of two shallow wells with data from two other deeper wells at Haon beach, to construct a 2D cross-sectional stratigraphy for building a flow and solute transport numerical model. The model was developed using the FEFLOW code and was calibrated to the data from the monitoring wells. Building on this calibrated framework, simulation tests were conducted using an active pumping well to quantify subsurface dynamics and salt fluxes under stress. Results show that pumping the brine below the lake lowers the groundwater hydraulic head and potentially mitigate salt discharge. Furthermore, these results provide critical data regarding the feasibility of the recent plan to use the extracted saline groundwater in Lake Kinneret nearshore aquifers for desalination purposes, offering a scientific basis for water management strategies aimed at mitigating lake salinization.


How to cite: Meidan, T., Stein, S., and Zohar, I.: The effect of shallow saline groundwater pumping on the salt discharge into Lake Kinneret (Sea of Galilee) and its salinization potential, EGU General Assembly 2026, Vienna, Austria, 3–8 May 2026, EGU26-20565, https://doi.org/10.5194/egusphere-egu26-20565, 2026.

EGU26-21043 | Orals | HS10.8

Quantifying the Extent of the Hyporheic Zone Using Pore-Resolved DNS of Turbulent Flow over a Random Sphere Packing 

Philip Ott, Michael Manhart, Simon v. Wenczowski, and Yoshiyuki Sakai

The vertical extent of exchange between surface flow and sediment pore water is a key control on ecological functioning in fluvial systems. Across the diverse disciplines engaged in hyporheic-zone research, however, this exchange depth is characterized using different criteria and definitions. From a hydrodynamic and transport perspective, this raises the question of how far interface-driven scalar transport mechanisms penetrate into a porous sediment bed beneath turbulent open-channel flow.

Using pore-resolved Direct Numerical Simulation (DNS), we investigate scalar transport near the sediment--water interface within the framework of effective diffusivity. The porous medium is represented by a random sphere packing overlain by a turbulent open-channel flow characterized by a friction Reynolds number of Reτ = 180 and a permeability Reynolds number of ReK = 1.8. Scalar transport is modeled by solving the advection-diffusion equation for a passive scalar at Schmidt number Sc = 1, subject to a prescribed vertical concentration gradient driving bed-normal transport.

To obtain statistically representative descriptions of the strongly three-dimensional flow and transport fields, double averaging, in time and over horizontal planes, is employed. Within this framework, the effective diffusivity model relates the plane-averaged scalar concentration to the vertical scalar flux, enabling a quantitative decomposition into turbulent transport, dispersive transport, and molecular diffusion. Revisiting the theory of horizontal averaging, we discuss the implications of different formulations of effective diffusivity and show that seemingly minor differences become significant in regions of rapidly varying porosity, such as the sediment--water interface.

In a systematic pre-study, we assess the influence of grid resolution, sampling duration, and sediment-bed depth on the resulting transport statistics. Based on this analysis, simulations are conducted at a constant flow-depth-to-sphere-diameter ratio of hf / D = 3, combined with three sediment-bed depths corresponding to hb / D ∈ [2, 5, 9]. To isolate interface-induced transport processes, simulations with overlying turbulent flow are compared to reference cases of scalar transport in the porous medium without free flow.

This comparison enables a clear distinction between transport mechanisms intrinsic to the porous medium and those induced by the sediment--water interface. The effective diffusivity associated with interface-driven transport decays exponentially with increasing depth below the sediment surface. Turbulent scalar transport is confined to the uppermost sediment layer, penetrating only to depths of approximately z / D ≅ 1 - 2. In contrast, dispersive transport induced by pressure fluctuations at the sediment crest dominates scalar exchange within the sediment bed. Beyond z / D ≅ 5, dispersive transport becomes negligible and scalar transport is governed predominantly by molecular diffusion, indicating the onset of a Darcy-type transport regime. Within the effective diffusivity framework, cases with hb / D = 5 and 9 show indistinguishable behavior, whereas the shallow bed case hb / D = 2 exhibits a pronounced attenuation of dispersive transport.

These results provide a quantitative, transport-based definition of the effective depth of interface-driven hyporheic exchange. The exponential decay of effective diffusivity, isolated from background porous-medium transport, offers a promising basis for improving reduced-order models of scalar transport in the hyporheic zone.

How to cite: Ott, P., Manhart, M., v. Wenczowski, S., and Sakai, Y.: Quantifying the Extent of the Hyporheic Zone Using Pore-Resolved DNS of Turbulent Flow over a Random Sphere Packing, EGU General Assembly 2026, Vienna, Austria, 3–8 May 2026, EGU26-21043, https://doi.org/10.5194/egusphere-egu26-21043, 2026.

Growing environmental challenges are forcing hydrogeologists to create
increasingly accurate models that faithfully reflect the complex
groundwater-surface water interactions in the hydrological cycle.
However, the construction of complex, monolithic models is often faced
barriers such as lack of detailed input data and time-consuming
calculations. An alternative is to couple dedicated domain models, which
allow existing resources to be leveraged and increase the accuracy of
simulations.

This paper presents a custom approach to coupling the SWAT+ catchment
model (representing surface and soil processes) with the MODFLOW 6
groundwater model. The integration was performed using Python scripts,
which ensured flexibility in data exchange. The study utilizes the SWAT
model developed in QSWAT and a hydrogeological model which was migrated
from the older MODFLOW 96 engine to the latest version of MODFLOW 6 with
using the DIS grid.

The study area is an agricultural catchment of approximately 250 km² in
south-central Poland. The key methodological challenge addressed in this
paper is the issue of spatial scaling, i.e. upscaling and mapping the
irregular hydrological response units (HRUs) from the SWAT model to the
regular computational grid of the MODFLOW model. The algorithm developed
in Python enables bidirectional exchange of fluxes (groundwater
recharge, river flow), which represents the dynamic interaction between
surface water and saturated zone. Preliminary results indicate that the
presented approach improves consistency of the water balance at the
interface.

Acknowledgements. The work was carried out as part of WATERLINE project
(2020/02/Y/ST10/00065), under the CHISTERA IV programme of the EU
Horizon 2020 (grant no. 857925) funded by National Science Centre,
Poland and a partially by AGH University of Krakow, Faculty of Geology,
Geophysics and Environmental Protection (grant no. 16.16.140.315).

How to cite: Nikiel, M. and Żurek, A. J.: Coupling SWAT+ and MODFLOW 6 using Python: A flexibleapproach to representing groundwater-surface water interactions in anagricultural catchment, EGU General Assembly 2026, Vienna, Austria, 3–8 May 2026, EGU26-22367, https://doi.org/10.5194/egusphere-egu26-22367, 2026.

EGU26-22990 | ECS | Orals | HS10.8

Direct numerical simulation of open-channel flow over a rough wall covered with benthic algae 

Xiong Zeng, Lei Huang, and Hongwei Fang

Filamentous benthic algae grow ubiquitously on the sediment-water interface (SWI) in streams, rivers, and lakes. They support fluvial food webs, engage in nutrient cycling, attenuate flow structures, and affect bed stability, thereby modifying the aquatic habitat. In this contribution, we are going to present some preliminary results of the direct numerical simulation (DNS) of turbulent open-channel flow over a layer of spherical sediment particles covered with benthic algae canopy in the transitionally rough regime. The flow motion is governed by Navier-Stokes equations and solved with a standard fractional-step method. The filamentous benthic algae are modeled as elastic rods and solved by an efficient and physically accurate finite difference scheme. Both the rods and particles are fully resolved and coupled with the flow using the direct-forcing immersed boundary technique. The flow structures and turbulence statistics in both the roughness sublayer and logarithmic region will be thoroughly analyzed and compared to previous studies on rough wall open-channel flow in order to investigate how benthic algae affect the flow field. The results presented here may provide physical insights and implications into sediment incipient motion and mass/momentum transfer across the sediment-water interface in natural rivers where benthic algae play dominant role and will serve as a first step for better understanding and modeling of the dynamics in hyporheic/benthic zone and entire river ecosystems.

How to cite: Zeng, X., Huang, L., and Fang, H.: Direct numerical simulation of open-channel flow over a rough wall covered with benthic algae, EGU General Assembly 2026, Vienna, Austria, 3–8 May 2026, EGU26-22990, https://doi.org/10.5194/egusphere-egu26-22990, 2026.

EGU26-444 | Orals | HS10.10

A health check of Swedish mountain lakes: greenhouse gases, nanoplastics, enzymes and water chemistry 

Michael Peacock, Dan Aberg, Adrian Bass, Scott Davidson, Simon Dickinson, Liam Heffernan, Dolly Kothawala, Dušan Materić, Marcus Wallin, and Martyn Futter

Mountain lakes are vulnerable to global change; particularly the dual threat of climatic warming and atmospheric deposition. These changes can increase greenhouse gas (GHG) emissions, and lead to the accumulation of emerging contaminants such as toxic nanoplastics. In Sweden, the majority of lake GHG research has been on lakes within forest and mire environments, and nanoplastics have only been measured in one lowland catchment. Thus, the biogeochemistry of mountain lakes remains largely an unknown. Here, we report the results of a summer sampling campaign from two mountain regions in Central Sweden: Fulufjället and Jämtland. The regions face different pressures; in Jämtland, reindeer grazing is widespread whilst Fulufjället is ungrazed but closer to central European urban areas, which are a plausible source of long-range dispersal of nanoplastics. Within each region we sampled 16 mountain lakes and 4 lower altitude forest lakes as comparators. We measured dissolved GHGs (CH4, CO2, N2O), carbon isotopes (δ13C-CH4 δ13C-CO2), nanoplastics, DOM composition (via fluorescence) and reactivity, extracellular enzymes and an array of water chemistry (including organic and inorganic C, N, P).

Preliminary findings show the presence of nanoplastics (polymers PE, PP, and PET), low concentrations of inorganic N and P, low DOM reactivity, and relatively low concentrations of CH4 and N2O in mountain lakes. Here, we present more detailed analyses, including comparisons between mountain and forest lakes, and between the two regions. Together, our data provide the first integrated assessment of GHGs, nanoplastics, and biogeochemistry in Swedish mountain lakes; and, to our knowledge, the first such study globally. This “health check” highlights the vulnerability of mountain lakes to ongoing environmental change and provides a baseline by which to monitor future anthropogenic changes. 

How to cite: Peacock, M., Aberg, D., Bass, A., Davidson, S., Dickinson, S., Heffernan, L., Kothawala, D., Materić, D., Wallin, M., and Futter, M.: A health check of Swedish mountain lakes: greenhouse gases, nanoplastics, enzymes and water chemistry, EGU General Assembly 2026, Vienna, Austria, 3–8 May 2026, EGU26-444, https://doi.org/10.5194/egusphere-egu26-444, 2026.

EGU26-588 | ECS | Posters on site | HS10.10

Integrating Satellite-Derived Parameters to Advance Ecohydrological Modeling of Forested Areas 

Aashi Agarwal and Vamsi Krishna Vema

The accurate representation of vegetation and its dynamics plays a crucial role in the modelling of hydrological cycle. Vegetation regulates the movement of water and energy fluxes within an ecosystem. Process based models such as Soil and Water Assessment Tool Carbon (SWAT–C) are widely used to model different water balance components such as streamflow, evapotranspiration, soil moisture and sediment yield. However, their accuracy in simulating vegetation dynamics particularly, forest growth is limited for tropical and sub-tropical regions as the original model was developed for temperate regions. The unrealistic representation of forest phenology poses a limitation in estimating the Leaf area index (LAI), evapotranspiration and sediment accurately. This study adopted a climate triggered start of season for initiating the forest growth in a dry deciduous forest in sub-tropical region rather than a fixed calendar date for each year of simulation. Remote sensing data of Moderate Resolution Imaging Spectroradiometer (MODIS) LAI was utilised to derive the various growth parameters governing the shape of the ideal plant growth cycle. Different SWAT-C configurations were tested to evaluate the effects of parameterization and dormancy adjustments. While the default model simulated streamflow accurately, the forest dynamics was captured poorly leading to inaccurate LAI estimation, overestimation of evapotranspiration and sediment yield. Overall, the results revealed that the improved model would advance ecohydrological simulation accuracy by capturing vegetation-water interactions.

Keywords: Forest dynamics, Ecohydrology, LAI, Remote-sensing.

How to cite: Agarwal, A. and Vema, V. K.: Integrating Satellite-Derived Parameters to Advance Ecohydrological Modeling of Forested Areas, EGU General Assembly 2026, Vienna, Austria, 3–8 May 2026, EGU26-588, https://doi.org/10.5194/egusphere-egu26-588, 2026.

EGU26-882 | ECS | Orals | HS10.10

Integrating Hydrology and Plant Physiology in Forest Carbon Accumulation Modeling 

Jisoo Lee and Kyungrock Paik

Forests serve as a major carbon storage in the Earth system, and accumulated biomass represents the net result of continuous carbon exchange through photosynthesis and respiration. Conventional yield-based inventory methods, operating at annual or multi-year temporal scales, are limited to capture underlying physiological processes. In this light, we develop a process-based model that simulates carbon uptake, respiratory losses, mortality, biomass growth, and evapotranspiration at daily temporal resolution. Photosynthetic and respiratory fluxes are dynamically regulated by temperature, solar radiation, vapor pressure deficit, and soil water availability, where the latter is computed from a rainfall–runoff model representing catchment-scale soil storage and water balance. Rather than prescribing evapotranspiration, the model allows it to adjust with vegetation growth, such that increasing biomass expands transpiration capacity under prevailing environmental conditions. In parallel, biomass accumulation reflects the portion of carbon retained by vegetation following atmosphere–biosphere carbon exchange, completing the coupled representation of carbon–water–vegetation interactions. Taking a forested catchment in South Korea as an example, a 100-year simulation reproduces expected patterns of forest development, from rapid carbon accumulation in early stages to reduced net carbon gain in mature forests due to physiological aging. Although generally consistent with inventory estimates, the model additionally reveals hydrologic and climatic controls in plant growth, particularly moisture limitation, which annual inventory approaches cannot diagnose. The framework enables physically grounded and continuous prediction of forest carbon accumulation, supporting more realistic carbon accounting, ecosystem monitoring, and climate policy evaluation.

How to cite: Lee, J. and Paik, K.: Integrating Hydrology and Plant Physiology in Forest Carbon Accumulation Modeling, EGU General Assembly 2026, Vienna, Austria, 3–8 May 2026, EGU26-882, https://doi.org/10.5194/egusphere-egu26-882, 2026.

EGU26-2607 | ECS | Orals | HS10.10

Watershed boundaries and human-amplified environmental gradients shape ostracod metacommunities in Yunnan, China, a biodiversity hotspot  

Qianwei Wang, Dayou Zhai, Xiaolu Fang, Ping Jiang, Caixia Zhang, and Peter Frenzel

Disentangling the multi-scale processes that generate and maintain biodiversity is a central challenge in ecology, particularly within global biodiversity hotspots where conservation stakes are highest. Metacommunity theory provides a framework for this endeavor, but empirical tests in topographically complex landscapes remain scarce for microorganisms. Here, we investigate the hierarchical drivers of ostracod (Crustacea) metacommunity assembly in the mountains of southwestern China, a global biodiversity hotspot. We employed a multi-faceted analytical approach, combining community-level multivariate statistics (PERMANOVA, RDA/CCA) with species-level machine learning (ML). At the regional scale, PERMANOVA revealed highly significant differentiation in community composition among the Nu, Lancang, and Yuan river basins, confirming that watershed boundaries act as primary biogeographical filters. Within these basins, both constrained ordination and the ML ensemble consistently identified a powerful hydro-ionic gradient, defined by electrical conductivity, temperature, and altitude, as the dominant local environmental filter. Crucially, our analyses reveal that this natural gradient is significantly amplified by anthropogenic pressures; agricultural and urban land use systematically favors tolerant, generalist species by increasing turbidity and altering water chemistry, leading to the decline of sensitive specialists. Synthesizing these findings, we propose a hierarchical framework integrating regional hydrological connectivity with local environmental filtering. This research provides a clear empirical validation of metacommunity theory within complex river networks and offers a scientific foundation for a more robust, spatially explicit bioassessment strategy for freshwater ecosystem conservation.

How to cite: Wang, Q., Zhai, D., Fang, X., Jiang, P., Zhang, C., and Frenzel, P.: Watershed boundaries and human-amplified environmental gradients shape ostracod metacommunities in Yunnan, China, a biodiversity hotspot , EGU General Assembly 2026, Vienna, Austria, 3–8 May 2026, EGU26-2607, https://doi.org/10.5194/egusphere-egu26-2607, 2026.

EGU26-3106 | ECS | Orals | HS10.10 | Highlight

Inorganic carbon budget for two headwater stream networks with contrasting climatic and geomorphic controls 

Francesco Presotto, Alfonso Senatore, Nicola Durighetto, Alessio C. Perri, Gianluca Botter, and Enrico Bertuzzo

Accurately quantifying inorganic carbon dynamics in stream networks is essential for constraining estimates of catchment-scale carbon dioxide (CO₂) outgassing, identifying its sources (autochthonous vs. allochthonous), and assessing sensitivity to hydrological and geomorphological controls. However, most existing approaches rely on single-station measurements or simplified reach-scale models, neglecting transport processes, upstream–downstream connectivity, network topology, and spatial heterogeneity of lateral inputs. Here, we present a network-based sampling design coupled with a Bayesian modelling framework to estimate network-scale balances of dissolved inorganic carbon (DIC), alkalinity, pH, and dissolved oxygen (O₂).

We applied this framework to two headwater catchments with contrasting geology, climate, land cover, and hydrological regimes: Valfredda (5.3 km², north-eastern Italian Alps, Alpine climate) and Turbolo (6.9 km², southern Italy, Mediterranean climate). In both catchments, we conducted spatially distributed sampling of approximately 15 sites per network within a single day, measuring total alkalinity, dissolved CO₂, O₂, water temperature, pH, and discharge. Sampling was timed during periods of negligible gross primary production to minimize diel variability. This assumption was verified using continuous monitoring stations providing diel cycles of O₂, CO₂, and pH.

The framework models pixel-scale mass balances of DIC, O₂, and alkalinity by accounting for upstream and lateral inputs, in-stream production, atmospheric exchange, and downstream export. Instantaneous carbonate equilibrium is assumed to derive pH and CO₂ from alkalinity and DIC, allowing direct comparison with observations. Reaeration coefficients are estimated using empirical relationships based on hydraulic properties. The model enables the mapping of longitudinal biogeochemical patterns across entire stream networks and the derivation of network-scale carbon budgets.

The two catchments exhibit contrasting spatial dynamics. In the alpine Valfredda network, high headwater alkalinity associated with dolomitic lithology produces elevated initial DIC concentrations, while high turbulence promotes intense degassing, driving dissolved CO₂ concentrations toward atmospheric equilibrium downstream. In contrast, the Turbolo network is characterized by heterogeneous lithology and dense vegetation, generating diffuse, carbon-rich lateral inputs that sustain elevated CO₂ concentrations even in downstream reaches. In both systems, the model successfully reproduces observed spatial patterns, highlighting the importance of lateral inflows and network structure in shaping catchment-scale CO₂ dynamics.

At the network scale, carbon flux magnitudes and dominant pathways differ markedly between catchments. Despite similar wetted channel areas (~7000 m² in Turbolo and ~8300 m² in Valfredda), Valfredda releases more than four times more CO₂ per unit stream surface area (~1.45 vs. ~0.36 mol m⁻² d⁻¹), corresponding to total fluxes of ~12 000 and ~2500 mol d⁻¹, respectively. In Valfredda, CO₂ evasion is sustained almost equally by lateral inputs and in-stream respiration, whereas in Turbolo it is dominated by lateral fluxes. Higher gas exchange rates and lower alkalinity in Valfredda favor rapid atmospheric CO₂ release, while lower turbulence and higher alkalinity in Turbolo promote downstream DIC transport.

Overall, our results demonstrate that reliable estimates of riverine CO₂ emissions require explicit representation of spatial structure, hydrological connectivity, and coupled biogeochemical processes across stream networks, providing a generalizable approach for scaling carbon fluxes from point measurements to entire catchments.

How to cite: Presotto, F., Senatore, A., Durighetto, N., Perri, A. C., Botter, G., and Bertuzzo, E.: Inorganic carbon budget for two headwater stream networks with contrasting climatic and geomorphic controls, EGU General Assembly 2026, Vienna, Austria, 3–8 May 2026, EGU26-3106, https://doi.org/10.5194/egusphere-egu26-3106, 2026.

EGU26-5007 | ECS | Posters on site | HS10.10

A generalized resource-constrained framework for quantifying coupled ecosystem water and carbon fluxes 

Shuai Wang, Lu Zhang, Yingping Wang, Lei Cheng, Kaijie Zou, Xuxin Lei, Weibo Liu, Yafei Wang, and Pan Liu

Photosynthesis, quantified as gross primary productivity (GPP), and evapotranspiration (ET) are two fundamental processes in coupled water and carbon cycles. The strong regulation of ecosystem on carbon and water fluxes by stomata is well understood at the leaf level. However, the coupling is complex at regional or ecosystem scales. The objective of this study is to understand key environmental factors that control both water and carbon fluxes at regional scales and develop a robust resource-constrained framework (RCF) for estimating climatology of coupled ecosystem carbon and water fluxes. Water balance data from 1927 catchments were obtained to parameterize the model and independent observations from 107 flux stations were used to validate the method. Results demonstrated robust model performance with Nash–Sutcliffe efficiency (NSE) of 0.65 for GPP and NSE of 0.55 for ET against independent flux observations. The RCF approach estimated global mean GPP and ET at 1141 g C m⁻² a⁻¹ and 530 mm a⁻¹, respectively, corresponding to an annual terrestrial carbon uptake of 142.4 Pg C a⁻¹. Further analysis identified the ecosystem energy and water limited regimes, with about 40% land areas energy-limited, 40% water limited, and 20% co-limited for both GPP and ET across globe. This study reveals consist estimates of GPP and ET by disentangling the spatial interplay of energy and water constraints. The RCF approach provides a transparent and scalable approach to jointly estimate and attribute carbon and water fluxes, offering new insights into ecosystem functioning and a pathway to improve coupled ecosystem modeling.

How to cite: Wang, S., Zhang, L., Wang, Y., Cheng, L., Zou, K., Lei, X., Liu, W., Wang, Y., and Liu, P.: A generalized resource-constrained framework for quantifying coupled ecosystem water and carbon fluxes, EGU General Assembly 2026, Vienna, Austria, 3–8 May 2026, EGU26-5007, https://doi.org/10.5194/egusphere-egu26-5007, 2026.

EGU26-5376 | ECS | Orals | HS10.10

Advancing distributed ecohydrological modeling of catchment-scale carbon and nutrient fluxes 

Taiqi Lian, Ziyan Zhang, Simone Fatichi, Athanasios Paschalis, and Sara Bonetti

Spatial heterogeneity in water and energy fluxes drives patterns of vegetation productivity and soil carbon and nutrient cycling across landscapes. However, most ecohydrological models either neglect lateral transfers or treat biogeochemical processes in a spatially decoupled manner, limiting their ability to reproduce observed catchment-scale patterns. We address this gap by extending the mechanistic ecohydrological model Tethys–Chloris–Biogeochemistry (T&C-BG) to a fully distributed configuration (T&C-BG-2D) that explicitly represents lateral routing of soil carbon and nutrients. The model is evaluated against long-term hydrological and biogeochemical observations from the Hafren catchment (UK) and the Erlenbach catchment (Swiss pre-Alps), where it successfully reproduces observed dynamics of several river solutes, including dissolved organic carbon, ammonia, and nitrate. To overcome the computational bottleneck of distributed model initialization, we further introduce a hybrid spin-up framework combining flux-tracking one-dimensional simulations with a random forest–based spatial extrapolation. This approach efficiently generates spatially heterogeneous and topography-informed initial conditions while reducing computational costs by up to 90%. Together, these advances enable efficient, spatially explicit ecohydrological–biogeochemical modeling across complex landscapes.

How to cite: Lian, T., Zhang, Z., Fatichi, S., Paschalis, A., and Bonetti, S.: Advancing distributed ecohydrological modeling of catchment-scale carbon and nutrient fluxes, EGU General Assembly 2026, Vienna, Austria, 3–8 May 2026, EGU26-5376, https://doi.org/10.5194/egusphere-egu26-5376, 2026.

EGU26-5826 | ECS | Orals | HS10.10

Estimating Gross Primary Production in Mediterranean catchments using isotopic mass balance: A multi-source ecohydrological approach applied to Corsica (France) 

Lucas Bouché, Émilie Garel, Pierre-Alain Guisiano, Sébastien Santoni, Andrew Watson, and Frédéric Huneau

Mediterranean catchments are strongly constrained by water availability, with pronounced seasonal contrasts that tightly couple hydrological processes and ecosystem functioning. Understanding how water fluxes regulate carbon uptake through Gross Primary Production (GPP) remains a key challenge in ecohydrology, particularly in Mediterranean regions where direct carbon flux measurements are scarce.

The aim of this study is to assess GPP at the catchment scale using a water-balance approach constrained by stable water isotopes (δ¹⁸O, δ²H). The method relies on the ecohydrological coupling between plant transpiration and carbon assimilation, quantified through water-use efficiency (WUE). Isotope-based partitioning of evapotranspiration is combined with WUE to derive basin-scale GPP.

The approach is applied to 11 Mediterranean catchments in Corsica (France), covering a wide range of spatial scales (15–950 km²), elevation gradients (sea level up to 2700 m), climatic conditions, and geological contexts (dominated by fractured granitic and metamorphic schists bedrock in the mountains and detrital sedimentary formations in downstream lowland areas). These catchments offer contrasted hydrological regimes, from perennial mountain rivers to strongly water-limited lowland coastal systems, making them a natural laboratory to investigate water–carbon interactions.

The methodology framework is based on one year of monitoring of rainfall and river water stable isotopes (δ¹⁸O and δ²H). Rainfall isotope data collected at 20 stations were used to generate isotope precipitation isoscapes, while river isotopes were monitored at 11 sites (one per catchment). These isotope datasets were combined with ERA5-Land climate data and CORINE Land Cover (CLC) vegetation information.

Monthly GPP calculated results reveal strong seasonal and spatial contrasts across the 11 Corsican catchments. GPP shows a pronounced Mediterranean pattern, with very low values during summer drought (often <20 gC.m⁻²) followed by a sharp recovery in autumn and peak values exceeding 200 gC.m⁻² during late autumn and early winter. The seasonal amplitude exceeds one order of magnitude, highlighting the dominant control of water availability on carbon uptake. Low-elevation and coastal catchments exhibit stronger summer GPP reductions than higher-altitude mountain and/or larger catchments, suggesting a buffering effect of elevation, groundwater storage capacity and geological context on ecohydrological functioning. However, some limitations remain regarding the difficulty to assess evaporation and thus transpiration values.

To better constrain the temporal dynamics of water fluxes underlying these patterns, an isotope-enabled hydrological model based on the J2000-iso framework is being developed. By improving the partitioning of hydrological fluxes, particularly evaporation and transpiration, this approach is expected to reduce uncertainties in GPP estimates and help to better link hydrological processes with ecosystem productivity.

Overall, this study provides one of the first basin-scale applications of isotope-based GPP estimation in Mediterranean environments at the regional scale and illustrates the potential of ecohydrological approaches to better quantify water–carbon coupling under ongoing climate change.

How to cite: Bouché, L., Garel, É., Guisiano, P.-A., Santoni, S., Watson, A., and Huneau, F.: Estimating Gross Primary Production in Mediterranean catchments using isotopic mass balance: A multi-source ecohydrological approach applied to Corsica (France), EGU General Assembly 2026, Vienna, Austria, 3–8 May 2026, EGU26-5826, https://doi.org/10.5194/egusphere-egu26-5826, 2026.

Urban flooding is a significant challenge in most cities worldwide, largely due to intensified rainfall extremes and unplanned urban development. Dense settlements have resulted in limited scope for augmenting or retrofitting existing stormwater management structures. Low Impact Development (LID) can restore the hydrology of urban areas by using decentralised stormwater control and transforming it into its natural state. It's critical to understand the extent to which a city can employ a LID, often known as its flood adaptive capacity.

While several studies have attempted to quantify urban adaptive capacity for LID implementation, much of this work focuses on broad vulnerability or resilience indicators rather than the realistic placement of LIDs. This creates a gap between high-level assessments and the practical realities of placing LID measures in specific urban contexts.  In practice, LID effectiveness is highly condition-dependent and requires high-resolution spatial information like land use, available space, slope, and surface characteristics. However, most cities lack the high-resolution spatial information and systematic assessment frameworks needed to determine where different LID measures can be realistically implemented. To address this limitation, we have developed a framework that derives those data and assesses the adaptive capacity of a city for implementing LIDs.

As part of this approach, the framework requires high-resolution urban land use/land cover (LULC) data, which we have generated through a multi-stage mapping framework that integrates SegFormer (Vision Transformer) based semantic segmentation with OpenStreetMap (OSM) geometric refinement. The model combines the Sentinel-1 SAR backscatter with Sentinel-2 optical composites to create a multi feature stack which is then used by SegFormer-B0/B1 model. From this refined LULC, key hydrologic indicators were derived, including percent imperviousness, runoff coefficients and available rooftop/pervious area for LIDs.

Further to derive the adaptive capacity an Analytical Hierarchy Process (AHP) in combination with entropy and fuzzy method of based weighted overlay is applied to compute suitability maps for major LIDs using historical flood extent, slope, impervious surface ratio, soil infiltration characteristics (HSG), groundwater depth, derived LULC map, road width and traffic intensity. These suitability maps were converted into an adaptability metric by estimating the fraction of locations that remain feasible for implementation after applying LID-specific constraints.

The result highlights that in highly urbanized cities like Delhi where there’re is no place for Nature Based LIDs, implementing decentralized Rain barrels with only 37mm capacity per household can reduce the flood by 75%. Overall, the proposed framework provides a pathway from LULC mapping to city scale LID adaptability assessment and enables evidence-based decision making for sustainable decentralised stormwater management.

How to cite: Aryal, A. and An, R.: An Integrated Framework for Assessing the Adaptive Capacity of Cities to Implement LIDs Using LULC Mapping, EGU General Assembly 2026, Vienna, Austria, 3–8 May 2026, EGU26-6283, https://doi.org/10.5194/egusphere-egu26-6283, 2026.

EGU26-6413 | ECS | Posters on site | HS10.10

Parsimonious Mechanistic Modelling of Dam Effects on Coupled River Algae-Nutrient Dynamics 

Hannah Joo and Soohyun Yang

Algae play a core role in sustaining river ecosystem health as primary producers, but excessive nutrient inputs can trigger uncontrolled growth and algal blooms, posing serious ecological risks. Hence, identifying vulnerable river segments is of importance to assess eutrophication risk and prioritize management actions, which in turn requires representing algal spatial distribution across entire river networks rather than isolated reaches. Nonetheless, achieving such network-scale characterization is particularly challenging in regulated river systems, where hydraulic structures modify flow regimes, disrupt longitudinal connectivity, and alter nutrient transport, thereby reshaping spatial patterns of algal communities. To address this challenge, we develop a parsimonious mechanistic model that explicitly reflects dam-induced hydrological alterations while retaining a minimal set of state variables and parameters. The model builds upon the Coupled Complex Algal–Nutrient Dynamics (CnANDY) model, a parsimonious process-based model that simulates interactions between pelagic and benthic algae competing for a single limiting nutrient and light along river networks. We extend the original CnANDY model by incorporating additional modules describing the physical effects of dams and associated reservoir characteristics, resulting in the CnANDY-dam model, which enables prediction of algal dynamics under hydraulic regulation at the river-network scale. As a baseline validation step, the original model is first applied to the Gyeongan River watershed (~506 km²), an unregulated sub-basin of the Han River, the largest river basin in South Korea, to evaluate model behavior under flow conditions unaffected by upstream regulation. River network structure, including Horton–Strahler stream order and hydraulic geometry, is derived from geomorphic observations. To approximate steady-state conditions, monthly mean runoff (March-November) and phosphorus (P) inputs are estimated using observations from 2017-2022, with non-point source P loads derived from land-use data and point source P loads obtained from wastewater treatment plant records. The original model reproduces stream-order-dependent patterns of algal dominance, with benthic algae prevailing in low-order streams and pelagic algae dominating in higher-order reaches, driven by differences in hydraulic geometry features and nutrient uptake. Building on this validated model, the extended CnANDY-dam model is applied to a regulated sub-basin of the Han River to demonstrate its workability under hydraulic regulation. The application of the CnANDY-dam model is expected to confirm its capacity to represent algal–nutrient dynamics under hydraulic regulation at the river-network scale.

Acknowledgements
This work was supported by the Creative-Pioneering Researchers Program through Seoul National University and by the National Research Foundation of Korea (NRF) grant funded by the Korean government (MSIT) (No. RS-2025-00523350). 

How to cite: Joo, H. and Yang, S.: Parsimonious Mechanistic Modelling of Dam Effects on Coupled River Algae-Nutrient Dynamics, EGU General Assembly 2026, Vienna, Austria, 3–8 May 2026, EGU26-6413, https://doi.org/10.5194/egusphere-egu26-6413, 2026.

EGU26-6415 | Posters on site | HS10.10

Assessing the Effects of Ground Sill Height on Fish Habitat Diversity: A Case Study of Tengqiao Creek 

Ching-Nuo Chen, Kun-Ting Chen, Chih-Tsung Huang, Chen-Min Kuo, and Chih-Heng Tsai

Wild Streams in Taiwan are characterized by steep channel slopes, rapid flow velocities, short channel lengths, and small watershed areas. These streams are highly susceptible to severe compound flood and sediment disasters triggered by typhoons and intense rainfall. To safeguard human life and property in surrounding areas, river management has historically emphasized engineering safety and disaster mitigation. Consequently, ground sills were widely installed to stabilize riverbeds and reduce channel erosion, while the potential ecological impacts of such engineering measures were largely overlooked, often resulting in severe degradation of river ecosystems. With the extensive installation of ground sills, river environments have become increasingly homogenized. The height configuration of the structures can alter hydraulic conditions and longitudinal connectivity, as well as modify the natural diversity of flow types (e.g., shallow flow, riffles, runs, and deep pools), leading to a decline in biodiversity. As a result, aquatic ecosystems and fish habitats have been significantly disturbed, causing degradation of river ecological functions. This has prompted efforts to restore and rehabilitate rivers whose ecological functions have been degraded by human interventions.

The object of investigation in this study was the Tengqiao Creek and the Two-Dimensional Habitat Diversity Construction Model was applied to simulate and investigate changes in fish habitat types and the spatial distribution under different discharges and varying heights of ground sills. Habitat diversity was quantified using the Shannon index as the Habitat Diversity Index (HDI). The results indicate that, under all discharge conditions and ground sill heights, habitat types 1(shallow pool) and 2 (medium pool) account for the largest proportion of habitat area within the study reach. When discharge is lower than 0.04 cms and the ground sill height is below 0.5 m, habitat type 3 (deep pool) does not occur; the area of habitat type 3 increases with increasing structure height. The area proportions of habitat types 4 (slow riffle), 5 (fast riffle), and 6 (run) are considerably smaller than those of types 1 and 2, with type 4 occupying a relatively larger area than types 5 and 6. When the ground sill height exceeds 0.75 m, the areas of habitat types 4, 5, and 6 are significantly smaller than those observed under structure heights below 0.75 m. Across all flow conditions, the habitat diversity index increases with increasing discharge but exhibits a decreasing trend as the height of ground sills increases. The findings of this study provide valuable references for future river restoration and ground sill design.

How to cite: Chen, C.-N., Chen, K.-T., Huang, C.-T., Kuo, C.-M., and Tsai, C.-H.: Assessing the Effects of Ground Sill Height on Fish Habitat Diversity: A Case Study of Tengqiao Creek, EGU General Assembly 2026, Vienna, Austria, 3–8 May 2026, EGU26-6415, https://doi.org/10.5194/egusphere-egu26-6415, 2026.

EGU26-6425 | ECS | Posters on site | HS10.10

Coupled temporal trends in river discharge and water quality across South Korea 

Hyoungseok Kang and Soohyun Yang

Contemporary freshwater resource management seeks to simultaneously secure sufficient quantity and adequate quality for domestic, agricultural, livestock, and industrial uses, as well as to mitigate water-related risks. While river discharge and water level magnitudes have been extensively gauged worldwide, monitoring river water quality remains sparse in both spatial coverage and temporal resolution, largely due to substantial manpower and financial investment required. These limitations are further compounded by the frequent misalignment between hydrological watershed boundaries and administrative units, which complicates the direct integration of water quality measurements with corresponding river discharge records. Consequently, previous studies have typically been confined to a limited number of subbasins when investigating temporal trends and concentration-discharge (C-Q) relationships. Overcoming these limitations requires a coupled temporal perspective, in which the co-evolution of discharge and water quality can be systematically examined to understand watershed responses to changing climate conditions and to track the effectiveness of water management actions. In this study, we leverage 11 years (2014–2024) of hourly and daily observations from an automated national water quality monitoring network in South Korea, encompassing temperature, pH, total nitrogen, total phosphorus, and total organic carbon. This unique dataset enables coupled temporal analyses of river water quantity and quality trends across river networks spanning the country’s four major basins. Mann-Kendall test shows increasing trends in discharge at most gauging stations, contrasting with the largely insignificant trends reported during the 20th century. However, four homogeneity tests (Pettitt, Buishand, von Neumann, and standard normal homogeneity test) indicate that these increases are attributable to distinct change points rather than gradual monotonic trends. Although homogeneity tests are traditionally applied to identify artificial discontinuities caused by station relocations or changes in data-quality control procedures, the found change points here appear to reflect hydrological responses to climatic forcing. By jointly applying trend and homogeneity analyses to both discharge and water quality variables, we examine how abrupt hydrological shifts propagate through physiochemical, nutrient and organic carbon dynamics at the national scale. Understanding whether water quality responses to discharge regime changes are concurrent, lagged, or threshold-driven provides pivotal insight for total maximum daily load management and for assessing eutrophication risk under a changing climate.

Acknowledgements

This work was supported by the Creative-Pioneering Researchers Program through Seoul National University and by the National Research Foundation of Korea (NRF) grant funded by the Korean government (MSIT) (No. RS-2025-00523350).

How to cite: Kang, H. and Yang, S.: Coupled temporal trends in river discharge and water quality across South Korea, EGU General Assembly 2026, Vienna, Austria, 3–8 May 2026, EGU26-6425, https://doi.org/10.5194/egusphere-egu26-6425, 2026.

Water from precipitation and constituents from multiple sources are integrated along river networks and exported at catchment outlets after undergoing hydrological and biogeochemical processes. Accordingly, stream water quantity and quality exhibit emergent behaviors rather than reflecting a simple sum of inputs, typically expressed as power-law relationships between discharge (Q) and concentration (C) which distinguish water quality parameter’s export behavior (C–Q pattern), and as temporal persistence (memory) in riverine output. How catchments generate these characteristics has long been of interest. Previous studies have shown that source availability governs which C–Q pattern emerges, and that catchment filtering of stochastic inputs can generate legacy sources that produce memory. These findings naturally raise core follow-up questions: (1) Even when the same C–Q pattern emerges, what controls variations in its intensity?; (2) Does catchment filtering invariably lead to the formation of legacy sources?; and (3) given that both C–Q patterns and memory arise from catchment filtering, do they share common underlying physical drivers? To address these questions, we aim to examine how catchment characteristics affect C–Q patterns and temporal memory formation, and whether systematic linkages exist between them. Across 24 catchments in South Korea, we analyze daily precipitation and discharge data along with 8 water quality parameters (pH, EC, DO, TOC, TN, TP, Turbidity, and Chlorophyll-a). To investigate catchment spatial characteristics that account for source availability and existence of legacy sources, we employ 14 explanatory variables representing catchment geography, land use, social indicators, and water-use characteristics. The C–Q pattern analyses report that, for some nutrients, the pattern in which concentrations increase with discharge due to unlimited non-point sources is consistent across all catchments, but the increasing magnitude gets sharper in natural catchments. This indicates that the relative contributions of point and non-point sources act as a key factor that shapes C–Q patterns. Temporal memory is examined using power spectrum analysis. Our results show that under natural cover conditions - where legacy sources are more likely to form – river discharge tends to exhibit long-term memory; however, for some ionic parameters, short-term memory gets strengthened. This suggests that persistent input signals from anthropogenic sources are disrupted during the catchment filtering process. Finally, for discharge-flushed water quality parameters, we identify a decreasing power-law relationship between C–Q patterns and memory, suggesting that surface-runoff-dominated export of water quality parameters represents a stochastic input signal that is not buffered through soils, and therefore its intrinsically memoryless signal is preserved. These findings corroborate a process-based understanding of catchment filtering mechanisms and provide a scientific basis for integrated monitoring and management of water quantity and water quality at the catchment scale.

Acknowledgements

This work was supported by the Creative-Pioneering Researchers Program through Seoul National University and by the National Research Foundation of Korea (NRF) grant funded by the Korean government (Ministry of Science and ICT) (No. RS-2025-00523350).

How to cite: Lee, E. and Yang, S.: Deciphering catchment filtering effects on export regimes and temporal memory of river water quantity and quality, EGU General Assembly 2026, Vienna, Austria, 3–8 May 2026, EGU26-6429, https://doi.org/10.5194/egusphere-egu26-6429, 2026.

EGU26-6939 | Posters on site | HS10.10

Quantifying Sectoral Water Stress under future Projections: Insights from a Coupled SWAT-WEAP Analysis 

Kulamulla Parambath Sudheer, Sinan Nizar, Silpa Senan, Shyama Sivan, Jobin Thomas, Vamsi Krishna Vema, and Pallippadan Johny Jainet

To formulate resilient water management strategies, policymakers require tools that can simultaneously simulate hydrological variability and dynamic sectoral demands. This research introduces a coupled modeling framework that links the Soil and Water Assessment Tool (SWAT) with the Water Evaluation and Planning (WEAP) model to quantify future water stress. We applied this integrated approach to the Chaliyar River Basin (CRB), driving the models with bias-corrected climate projections from 13 CMIP6 General Circulation Models. Hydrological simulations indicate a marked rise in peak flows driven by intensifying extreme rainfall events, although low flow conditions remain relatively stable. On the demand side, agriculture remains the primary consumer, driving total annual water requirements from a baseline of 1,143.2 MCM (2015) to projected levels of 1,289 MCM under SSP2-4.5 and 1,245 MCM under SSP3-7.0 by the century's end. Notably, the assessment identifies counter-intuitive vulnerability patterns: the intermediate SSP2-4.5 scenario results in higher overall unmet demand compared to the high-emission SSP3-7.0 scenario. Specifically, the agricultural sector faces critical shortages, with unmet demand reaching 26.5% under SSP2-4.5 versus only 5.3% under SSP3-7.0. These results validate the proposed coupled framework as a transferable solution for assessing sectoral water security in climatologically comparable river basins.

How to cite: Sudheer, K. P., Nizar, S., Senan, S., Sivan, S., Thomas, J., Vema, V. K., and Jainet, P. J.: Quantifying Sectoral Water Stress under future Projections: Insights from a Coupled SWAT-WEAP Analysis, EGU General Assembly 2026, Vienna, Austria, 3–8 May 2026, EGU26-6939, https://doi.org/10.5194/egusphere-egu26-6939, 2026.

EGU26-7992 | ECS | Posters on site | HS10.10

Automating Water Balance Closure in Lake Hydrodynamic Models: a Machine Learning Approach 

Mustafa Onur Onen, Charles Rougé, Isabel Douterelo Soler, and Geoff Darch

Physics-based lake hydrodynamic models require high-resolution forcing data to simulate thermal structures accurately. However, many lakes lack complete inflow/outflow measurements. In natural lakes, outlet hydrodynamics can correct outflows to artificially close the water balance, but this option is generally not available in managed reservoirs. This forces modelers to rely on backward water balance calculations based on changes in observed lake storage to determine a fixed time series for missing flows. This approach often fails during model calibration. Indeed, evaporation in these models is calculated using model parameters that may be adjusted during the calibration, leading to cumulative errors in the simulated storage or the need for frequent, time-consuming model warm restarts. In addition, unmeasured flows needed for balance closure are often attributable to various processes, which leads to ambiguity regarding where in the lake they happen, and about the water quality (e.g., temperature and nutrients) in these flows. Both affect vertical processes.

To address this, we develop a Machine Learning emulator that maps hydrodynamic model parameters directly to the unmeasured flow required for water balance closure. Using the General Lake Model (GLM), a state-of-the-art vertical 1D hydrodynamic model, and a water supply reservoir in England as a case study, we follow a four-stage methodology: (1)  Sensitivity Analysis for dimensionality reduction using the Method of Morris; (2) an optimization routine to define target unmeasured flows over a 10-year period; (3) emulator training using Random Forest Regression (RFR) and (4) validation on the reservoir storage.

The RFR emulator achieves very high predictive accuracy (R2 = 0.99) while estimating the optimised unmeasured flows. In addition, it identifies water treatment losses – which recirculate to the reservoir – as the primary unmeasured flow. This finding corroborates operator evidence and accounts for a crucial uncertainty in the calibration. While long-term stability remains sensitive to secondary parameters and the training data size, the emulator using RFR significantly reduces cumulative storage errors compared to the traditional approach that uses fixed unmeasured flows, minimising the need for frequent model restarts and substantially decreasing total calibration time.

How to cite: Onen, M. O., Rougé, C., Douterelo Soler, I., and Darch, G.: Automating Water Balance Closure in Lake Hydrodynamic Models: a Machine Learning Approach, EGU General Assembly 2026, Vienna, Austria, 3–8 May 2026, EGU26-7992, https://doi.org/10.5194/egusphere-egu26-7992, 2026.

EGU26-8182 | ECS | Orals | HS10.10

Mapping Fog Frequency: A Machine Learning Approach 

Ioannis Lolos and Tyson Terry

Fog is an important yet often-overlooked non-rainfall water source for many coastal, mountainous, and arid-to-semi-arid regions worldwide. From the limited ecological and agricultural studies conducted to date, we know that fog is particularly beneficial for plants during dry spells. Specifically, fog events support plant hydration and growth via foliar water uptake, enhance water- and light-use efficiency by reducing evapotranspiration and increasing light scattering, and contribute water and nitrogen inputs to soils. Currently, a major limitation in further assessing the effects of fog on vegetation, as well as changes in fog patterns under ongoing climate warming, is the scarcity of fog data with broad spatiotemporal coverage. To address this gap, we built three ensemble decision-tree machine learning models—Random Forest, LightGBM, and XGBoost—to predict fine-scale monthly fog frequency using ERA5-Land data and physiographic and temporal parameters. Hourly fog observations from 136 ASOS weather stations in California were used as ground truth, and spatial and temporal holdout strategies were applied to ensure generalization. Overall, the models effectively rank and classify monthly fog frequency across seasons, with the strongest performance during July and August, when dry spells are most prevalent in California. Our methodology demonstrates how large-scale climatic data can be paired with physiographic and temporal information to map fog frequency, with models that are agnostic to fog-formation mechanisms and transferable for use in other regions. Beyond frequency mapping, this work provides insights into the drivers of fog formation through Shapley Additive exPlanations (SHAP) analysis. Dewpoint depression was found to be the most influential predictor, making it a good candidate for informing projections of future shifts in fog patterns. While climate-change studies have focused on important climatic variables such as temperature and precipitation, little do we understand about how fog patterns have changed in the recent past, or will shift in the future. Our approach can serve as the basis for assessing both.

How to cite: Lolos, I. and Terry, T.: Mapping Fog Frequency: A Machine Learning Approach, EGU General Assembly 2026, Vienna, Austria, 3–8 May 2026, EGU26-8182, https://doi.org/10.5194/egusphere-egu26-8182, 2026.

EGU26-8257 | ECS | Orals | HS10.10

Propagating effects of permafrost thaw slumps on microbial communities throughout Arctic stream networks 

Marina Taskovic, Brian Lanoil, and Suzanne Tank

Permafrost thaw in northwestern Canada has accelerated in recent decades due to rapid warming and increased precipitation. The degradation of ice-rich permafrost transforms landscapes, triggering widespread mass-wasting features known as thaw slumps. Across the Peel Plateau in the Northwest Territories (Canada), these thaw slumps mobilize substantial volumes of materials rich in organic matter, nutrients, and other solutes. The lateral transport and deposition of thawed materials into streams shift hydrological, sedimentary, and geochemical regimes, with cascading effects on biogeochemical cycles, food webs, and water quality. Microorganisms play a pivotal role in mediating the processes that regulate ecosystem structure and function. Yet, the responses of microbial communities within slump-affected stream networks remain poorly understood.  


To address this knowledge gap, we conducted a two-year (2022-2023) catchment-scale investigation in the 1,100 km2 Stony Creek watershed on the Peel Plateau. Our study tracked microbial community responses along the slump-stream continuum, including rill water runoff from seven thaw slumps, impacted headwaters, major tributaries, and a transect along the Stony Creek mainstem. We characterized microbial communities using 16S rRNA amplicon sequencing and combined these data with stream physicochemical properties, dissolved (DOC) and particulate organic carbon (POC) composition, and landscape metrics to identify drivers of microbial community response. We also assessed microbial functional potential and biomass production using marker gene-based functional predictions (PICRUSt2) and tritiated leucine incorporation experiments. 


Connectivity between thaw slumps and streams produced pronounced shifts in microbial community composition. The extent of community divergence downstream of rill water inflow covaried strongly with the change in sediment loading and associated particulate organic matter. With stronger slump influence, microbial communities became progressively more associated with anoxic conditions and a reduced, low-energy carbon pool, reflecting a transition to a system dominated by POC. Further downstream, microbial community patterns in major tributaries and along the mainstem became increasingly mixed, suggesting that as larger areas of the catchment were integrated and in-stream processes became more complex in higher-order stream segments, the direct disturbance signal from thaw slumps became less dominant in shaping community structure. Despite this, biomass production was strongly correlated with DOC throughout the mainstem transect, even though DOC represented a small fraction of the total carbon pool relative to POC.  


Through this work, we aim to document how microbial communities transform as thaw slump materials are transported through fluvial networks. Establishing these patterns is critical for understanding biogeochemical cycling in thermokarst-affected landscapes, where terrestrial-aquatic connectivity is pronounced. Collectively, our findings provide a baseline for microbial community dynamics in this region and complement comprehensive geochemical and carbon cycling data. As climate change and permafrost thaw intensify in Arctic ecosystems, understanding the role of microbial communities becomes increasingly important. By characterizing stream microbial diversity, predicting functional profiles, and microbial activity, we advance our understanding of the mechanisms driving biogeochemical changes and their broader impacts on food webs, water quality, and greenhouse gas exchange. 

How to cite: Taskovic, M., Lanoil, B., and Tank, S.: Propagating effects of permafrost thaw slumps on microbial communities throughout Arctic stream networks, EGU General Assembly 2026, Vienna, Austria, 3–8 May 2026, EGU26-8257, https://doi.org/10.5194/egusphere-egu26-8257, 2026.

EGU26-8672 | Posters on site | HS10.10

Opposing evapotranspiration responses to rising vapor pressure deficit in mainland Southeast Asia 

Jianning Ren, Zhaoyang Luo, Xiangzhong Luo, Valeriy Y. Ivanov, Athanasios Paschalis, Stefano Galelli, Shanti Shwarup Mahto, Dung Trung Vu, and Simone Fatichi

Vapor pressure deficit (VPD) is projected to strongly increase over land areas under future global warming due to rising air temperature and declining relative humidity. Understanding the impacts of VPD on the water cycle, particularly evapotranspiration (ET), is therefore critical for delineating better water management strategies. It is commonly assumed that higher VPD enhances the atmospheric demand for water and increases ET – especially in non-water-limited regions. However, this assumption disregards plant physiological and biophysical controls that can override atmospheric demand for water. Elevated VPD can lead to stomatal closure and a decrease in transpiration and thus ET. Moreover, higher VPD always co-occurs with warmer temperatures, which may exacerbate plant water stress or inhibit enzyme activity, further suppressing plant growth and reducing ET. When plant controls dominate over atmospheric demands, ET may decrease with increasing VPD at the annual scale. Here, we tested this hypothesis across mainland Southeast Asia using a mechanistic model (T&C) and remote sensing products. After a model testing with available flux tower data, we run T&C at very high resolution (1km2) over a domain of 2.93 million of km2 for a period of 13 years (1998-2010). We found that around 30% of mainland Southeast Asia exhibits decreasing ET with higher VPD. Specifically, when the background VPD (mean annual) exceeds ~1150 Pa, ET starts decreasing and decreases faster with higher VPD. Under future global warming and rising VPD, such ET reductions may lead to diminished land-atmosphere moisture exchange, potentially amplifying local atmospheric dryness. These findings provide a new perspective on the nonlinear responses of ET to VPD and improve our understanding of hydrological response under future climate change over a large and understudied area such as Southeast Asia.  

How to cite: Ren, J., Luo, Z., Luo, X., Ivanov, V. Y., Paschalis, A., Galelli, S., Mahto, S. S., Vu, D. T., and Fatichi, S.: Opposing evapotranspiration responses to rising vapor pressure deficit in mainland Southeast Asia, EGU General Assembly 2026, Vienna, Austria, 3–8 May 2026, EGU26-8672, https://doi.org/10.5194/egusphere-egu26-8672, 2026.

Turbidity and fine sediment are widely recognized as key stressors in river ecosystems; however, most ecological assessments rely on short-term concentration metrics that fail to capture the cumulative and time-lagged nature of turbidity impacts. This study proposes an integrated framework to quantify and predict biological responses to cumulative turbidity exposure using sensitivity-based indices and generalized additive models (GAMs).

Long-term suspended sediment (SS) exposure was quantified as cumulative dose (time-integrated SS concentration, mg·hour/L) over multiple antecedent periods (1, 3, and 6 months), including threshold-exceedance metrics describing the duration and magnitude of exceedance above ecologically relevant SS levels. Based on species-specific correlations with cumulative turbidity exposure, a novel Turbidity Sensitivity Index for benthic macroinvertebrates (TSI-BM) was developed by weighting taxa according to sensitivity classes derived from monotonic response patterns of Ephemeroptera, Plecoptera, and Trichoptera (EPT) assemblages. The index was applied to 22 monitoring sites in the upper North Han River Basin, Korea.

Results showed that TSI-BM exhibited a strong and consistent negative correlation with six-month cumulative turbidity exposure (Spearman’s ρ = −0.46, p < 0.001), outperforming conventional indices. GAM-based models further revealed nonlinear main effects and interactions among cumulative turbidity, hydraulic conditions (water depth and velocity), and nutrient concentrations on benthic community sensitivity, with site-wise cross-validated coefficients of determination (R²) ranging from 0.40 to 0.72.

Overall, this study demonstrates that cumulative turbidity exposure, combined with sensitivity-weighted biological indices and flexible nonlinear modeling, provides a robust approach for diagnosing and predicting ecological degradation under sediment stress. The proposed framework offers a transferable tool for river monitoring, impact assessment, and adaptive sediment management under increasing hydrologic variability.

This work was supported by the Korea Environmental Industry and Technology Institute (KEITI) through Aquatic Ecosystem Conservation Research Program, funded by Korea Ministry of Environment (MOE) (RS-2021-KE001374).


How to cite: Choi, M. and Ahn, J.: Quantifying Cumulative Turbidity Stress on Riverine Biota Using Sensitivity-Based Indices and Generalized Additive Models, EGU General Assembly 2026, Vienna, Austria, 3–8 May 2026, EGU26-8836, https://doi.org/10.5194/egusphere-egu26-8836, 2026.

EGU26-9864 | Orals | HS10.10

Ecohydrological effects of photovoltaic plants in Kubuqi Desert based on ecohydrological modeling and field observation 

Zhentao Cong, Zifu Zhang, Yangbin Huang, Sihan Li, Huimin Lei, and Dawen Yang

Photovoltaic (PV) power generation has attracted significant attention not only for its substantial carbon reduction potential but also as an emerging research focus regarding its ecological impacts, particularly in arid and semi-arid regions. The extensive construction of utility-scale PV plants on the desert areas alters near-surface microclimates, exerting non-negligible influences on ecosystems. While utility-scale PV plants significantly alter near-surface microclimates, traditional models often fail to capture the intricate feedback mechanisms between PV panels and the underlying surface. To address this gap, this study developed a novel ecohydrological model that explicitly integrates a physically-based PV canopy module into an existing ecohydrological model. Unlike conventional approaches, this model treats PV panels as a distinct canopy layer, allowing for the simultaneous resolution of energy and hydrological fluxes across the panel, vegetation, and soil interfaces. Validated at the Kubuqi PV power plant, located in the arid region of Northern China, the model demonstrated satisfactory performance. Results reveal significant ecological benefits at the Kubuqi PV power plant: gross primary productivity (GPP) increased by 110 gC·m-2 during the growing season compared to the natural scenario, accompanied by a carbon sink enhancement of 58 gC·m-2. This improvement is primarily attributed to a marked increase in water use efficiency (rising from 0.55 gC·m-2·mm-1 in the natural scenario to 1.12 gC·m-2·mm-1 in the PV scenario). Crucially, while the inter-panel areas functioned as a net annual carbon sink, areas directly under the panels acted as a carbon source. Although vegetation growth under the panels was suppressed by hydrothermal constraints, it exhibited higher water use efficiency, indicating enhanced resource utilization under limiting conditions. This research advances the understanding of PV effects on ecohydrological processes in arid and semi-arid areas and establishes a novel modeling framework integrating PV canopy influences for arid ecosystems.

How to cite: Cong, Z., Zhang, Z., Huang, Y., Li, S., Lei, H., and Yang, D.: Ecohydrological effects of photovoltaic plants in Kubuqi Desert based on ecohydrological modeling and field observation, EGU General Assembly 2026, Vienna, Austria, 3–8 May 2026, EGU26-9864, https://doi.org/10.5194/egusphere-egu26-9864, 2026.

EGU26-11543 | Orals | HS10.10

A semi-distributed ecohydrological modelling framework for catchment hydrology and river chemistry  

Athanasios Paschalis, Ziyan Zhang, Taiqi Lian, Ruiqi Gu, and Sara Bonetti

Climate and land use changes can significantly impact ecosystem water quantity as well as quality. To understand the corresponding physical processes within a catchment, an ecohydrological-biogeochemical model that can simulate water, nutrients and vegetation dynamics simultaneously is therefore required. The recently developed spatially distributed model T&C‐BG‐2D has enabled the simulation of coupled vegetation, hydrological, and soil biogeochemical dynamics within catchments. However, its potential in exploring the impacts of different scenarios and interventions on ecosystems can be limited by computational costs due to grid representations. In this work, we present a semi-distributed abstraction framework for T&C-BG-2D to simulate hourly river discharge and chemistry (C, N, P, K, Ca, Si, Mg) at the (sub)catchment outlet with minimal computational costs. Leveraging recent available remote sensing and reanalysis datasets, an algorithm was developed to enable a novel calibration procedure for all key model parameters (e.g., soil properties, land cover, and vegetation traits) within the catchment across representative hydrological response units. The newly developed semi-distributed version T&C-BG-SD was benchmarked against the fully distributed T&C-BG-2D model in the Hafren (Wales, UK) and the Erlenbach (Swiss pre‐Alps) catchments. To further evaluate the suitability of the framework in representing different catchment characteristics, the performance of the model was then examined across multiple catchments in the US and UK spanning diverse climatic conditions and land covers. 

How to cite: Paschalis, A., Zhang, Z., Lian, T., Gu, R., and Bonetti, S.: A semi-distributed ecohydrological modelling framework for catchment hydrology and river chemistry , EGU General Assembly 2026, Vienna, Austria, 3–8 May 2026, EGU26-11543, https://doi.org/10.5194/egusphere-egu26-11543, 2026.

Stratification strongly influences lake circulation, oxygenation, and biogeochemical exchange. In stably stratified lakes, deep and surface waters can differ markedly in chemical composition. Changes in mixing intensity or overturn events can therefore alter oxygen levels and water quality by redistributing reduced or nutrient-rich deep water.

Accurate modelling of circulation and air-water oxygen exchange in deep, low-salinity lakes requires thermobaric effects, i.e. the pressure-temperature dependence of water density. In such systems, density differences at depth can be small enough that thermobaricity becomes a primary driver of vertical exchange and renewal.

We investigate thermobaricity-driven circulation in a simplified setting using a 2D Boussinesq Navier-Stokes framework in which the buoyancy term is derived from the approximate equation of state for freshwater by Farmer and Carmack (1981). To assess deep water renewal and stratification persistence, we introduce a passive “water age” tracer. We first compute a time-periodic solution for the flow and temperature fields, and then transport the age tracer over many cycles using this periodic state. This approach enables efficient long-term estimates of water renewal time scales and their sensitivity to thermobaric forcing, providing a simplified assessment of physical stability in deep-lake stratification.

How to cite: Irmscher, J. and Richter, T.: A simplified 2D model for thermobaricity-driven circulation and water renewal in deep, low-salinity lakes, EGU General Assembly 2026, Vienna, Austria, 3–8 May 2026, EGU26-12521, https://doi.org/10.5194/egusphere-egu26-12521, 2026.

EGU26-14465 | ECS | Posters on site | HS10.10

 Investigating Algal Primary Productivity and In Situ Production of Aquatic Fluorescent Organic Matter in a Simulated Freshwater System  

Matthew Coombs, Connie Tulloch, Rosie Perrett, Robin M.S. Thorn, John W. Attridge Attridge, and Darren M. Reynolds

Freshwater systems play a disproportionately important role in global carbon cycling, yet the contribution of algal primary productivity to the production and transformation of dissolved organic matter (DOM) remains poorly researched, particularly with respect to fluorescent dissolved organic matter (FDOM). While protein-like fluorescence is widely associated with autochthonous microbial activity, humic-like fluorescence has traditionally been attributed to terrestrial inputs, despite emerging evidence for its in-situ microbial production. This study investigates the role of freshwater algae in the production, composition and temporal dynamics of protein-like and humic-like FDOM under controlled laboratory conditions. A previously developed simulated freshwater (SFW) model, free from external dissolved organic carbon inputs was optimised for algal growth and monitored for algal-derived fluorescence signatures using bench top fluorescence spectroscopy. Monoculture and mixed algal communities were grown under defined nutrient regimes, spanning low to elevated concentrations representative of nutrient enrichment and bloom conditions. We quantify algal primary productivity using single-turnover active fluorometry (STAF), providing high-resolution insight into photosystem II efficiency and productivity dynamics. Excitation–emission matrix spectroscopy is applied throughout algal growth phases to characterise changes in FDOM intensity, composition and persistence, with particular focus on protein-like and humic-like components.  

Findings show a coupling of primary productivity measurements with algae derived fluorescence signatures.  This research aims to investigate the dynamics between algal metabolism, nutrient availability and FDOM production. The findings will improve understanding of algal contributions to the cycling of DOM in freshwater systems and identify the role and usefulness of fluorescence-based monitoring tools, particularly in environments experiencing nutrient enrichment and increasing algal biomass. 

How to cite: Coombs, M., Tulloch, C., Perrett, R., Thorn, R. M. S., Attridge, J. W. A., and Reynolds, D. M.:  Investigating Algal Primary Productivity and In Situ Production of Aquatic Fluorescent Organic Matter in a Simulated Freshwater System , EGU General Assembly 2026, Vienna, Austria, 3–8 May 2026, EGU26-14465, https://doi.org/10.5194/egusphere-egu26-14465, 2026.

With climate change, extreme rainfall events are expected to occur more frequently, leading to more landslides triggered by climate incidents. Landslide processes in a dynamic environment in Taiwan play a crucial role in driving physical erosion and chemical weathering, facilitating the water-rock interaction and the transport of terrestrial dissolved and particulate materials through river systems, thereby affecting elemental chemistry and carbon cycling. This relationship between physical erosion and the resultant weathering affects the sequestering of carbon dioxide through silicate weathering and further links between erosion in the landslide-active catchment area and climate change. However, our knowledge of the effects of landslide weathering on river water chemistry, weathering processes, and the relationship with carbon cycling remains limited, and the absence of reliable chemical indicators to evaluate these processes necessitates further study. Here, we address the effects of landslide-related weathering on water chemistry (elements and isotopes) and carbon cycling in Taiwan. Major and trace elements, related isotopes, and carbon concentration were analyzed in the water samples from the river water beside landslides and leakage from landslide deposits. This study aims to characterize variations in river chemistry associated with landslide-affected settings and explore potential chemical and isotopic indicators to evaluate landslide-related weathering processes. The preliminary results show that the waters influenced by landslides can show distinct chemical characteristics relative to nearby river water. Silicate weathering dominates the dissolved load (>80%), while sulfate appears to co-vary with the total dissolved solids, suggesting an additional sulfate-linked control on hydrochemical variability.  Dissolved uranium isotopes reflect the degree of physical erosion, and show a negative correlation with the silicate chemical weathering, which reflects a weathering limited condition in our study area. This study will help refine chemical indicators for assessing landslide weathering signals and improve understanding of the mechanism of landslide-weathering-river chemistry linkages, as well as the carbon export in mountainous rivers under a changing climate.

How to cite: Wang, R.-M. and Huang, K.-F.: Variations in river chemistry in Taiwan’s mountainous rivers: Influences of landslides and weathering, EGU General Assembly 2026, Vienna, Austria, 3–8 May 2026, EGU26-15424, https://doi.org/10.5194/egusphere-egu26-15424, 2026.

The effects of climate change on ecosystems were particularly pronounced in alpine regions. Most studies on alpine river ecosystems were conducted in the temperate and Arctic regions, primarily focusing on the effects of meltwater runoff variation, with limited attention on the subtropical regions, e.g., the Qinghai-Tibetan Plateau (QTP). Rivers on the QTP are experiencing significant environmental shifts due to both hydrological and hydrodynamic changes, which are altering the ecosystem characteristics of these highland rivers. However, understanding gaps still remain in the biodiversity, community composition and structure stability of these ecosystems, as well as their key ecological driving force. Using macroinvertebrates as indicator species, we characterized biodiversity, community structures and food web stability within river networks of the middle-lower Yarlung Tsangpo Basin, a typical alpine river basin along QTP’s margin. The mainstem (Yarlung) and two tributaries, i.e., Nyang River and Parlung Tsangpo River, exhibited increasing gradients of hydrodynamic intensity and meltwater runoff. We found that taxonomic structures of macroinvertebrates were different across spatial and temporal scales, with hydrodynamic intensity, rather than water temperature reported in the temperate and arctic regions, as the primary factor driving taxonomic composition. Biodiversity showed consistent unimodal response patterns to hydrodynamic intensity across scales. Specifically, γ diversity, representing the regional biodiversity, was highest in Nyang River, which was characterized by moderate hydrodynamic intensity among rivers. Within each river basin, α diversity also peaked at the moderate hydrodynamic intensity on the basin’s range. Regarding food web structure, we observed similar functional feeding groups’ composition but variable complexity and stability across rivers, and found that the effect of hydrodynamic intensity on the structure stability surpassed that of basal food sources. As hydrodynamic intensity increased, structural complexity also increased, while stability followed a unimodal response, with the food web being most stable at moderate hydrodynamic intensity. These findings highlight hydrodynamic conditions as the most critical ecological driver in subtropical alpine rivers. It is suggested that moderating hydrodynamic intensity may be an effective strategy to maintain high biodiversity, functional complexity, and food web stability, offering a promising approach for ecological optimization in high-altitude alpine rivers affected by ongoing climate change and anthropogenic activities.

How to cite: Luo, Y., Xu, M., and Zhou, X.: Modifying hydrodynamics offers a pathway to enhance ecosystem function of the Qinghai-Tibet Plateau rivers, EGU General Assembly 2026, Vienna, Austria, 3–8 May 2026, EGU26-15559, https://doi.org/10.5194/egusphere-egu26-15559, 2026.

EGU26-16238 | ECS | Orals | HS10.10

Comprehensive Assessment of Ecological Water Replenishment Effects from Inter-basin Water Transfer in Arid Inland River Basins 

Lei Yu, Benyou Jia, Shiqiang Wu, Xiufeng Wu, and Luchen Zhang

Inter-basin water transfer is a crucial measure for improving ecological environments in arid regions, yet comprehensive quantitative assessments of its ecological water replenishment effects remain insufficient. Therefore, this study examines the inter-basin ecological water replenishment from the Yellow River Basin to the Shiyang River inland basin via the Jingtai Electric Irrigation Project. An evaluation system with eight indicators—water transfer volume, groundwater depth, groundwater storage change, ecological replenishment volume, water area, replenishment efficiency, population growth rate, and urbanization rate—was constructed from the "water resources-water ecology-society" perspective. The entropy weight method was used to determine indicator weights, and comprehensive effects from 2011 to 2024 were systematically assessed. Results show that over the 14-year period, cumulative water transfer reached 1.527 billion m³, groundwater depth recovered by 0.45 m, and the water area of Qingtu Lake, a terminal lake, expanded by 17.65 km² with an increase of 176.5%. The comprehensive evaluation index increased by 140.8%, rising from 0.30 in 2011 to 0.72 in 2024, demonstrating significant achievements in ecological restoration, groundwater recharge, and human settlement improvement. Although ecological water replenishment efficiency is constrained by conveyance losses and regional population continues to decline, systematic improvements in core indicators such as water transfer volume, groundwater, and water area have driven a leapfrog enhancement of comprehensive benefits. The research findings fully validate the comprehensive benefits and sustainability of inter-basin ecological water replenishment, providing scientific basis for safeguarding the ecological security of key lakes in arid basins.

How to cite: Yu, L., Jia, B., Wu, S., Wu, X., and Zhang, L.: Comprehensive Assessment of Ecological Water Replenishment Effects from Inter-basin Water Transfer in Arid Inland River Basins, EGU General Assembly 2026, Vienna, Austria, 3–8 May 2026, EGU26-16238, https://doi.org/10.5194/egusphere-egu26-16238, 2026.

The ecological integrity of riverine ecosystems in semi-arid areas is largely affected by variations in the natural flow regime as these flows are increasingly disturbed by anthropogenic activities, particularly the construction of dams, diversion weirs and storage structures. The current study examines the basins of the Malaprabha and Ghataprabha rivers, which are two primary tributaries of the Krishna River in southern India. The water management in these rivers is significantly influenced by the Hidkal and Navilatirtha dams, which serve as large reservoirs for storage. The study's goal is to delve beyond the antiquated concept of "minimum flow" and to develop a comprehensive assessment of Environmental Flow (EF) requirements based on long-term data trends.

            The methodology adopted a comprehensive trend analysis of hydrological and ecological data collected from multiple gauging stations, namely, Bagalkot, Gokak Falls, Cholachaguda, Mudhol, and Navalgund. The daily discharge data from the Central Water Commission (CWC) and Water Resources Department (WRD) of Karnataka are analysed using the Mann-Kendall test and Sen’s slope estimator for monotonic shifts in flow patterns. To measure the extent of the changes, the study applied the Indicators of Hydrologic Alteration (IHA) and the Range of Variability Approach (RVA) for determining 33 ecologically relevant parameters, including the magnitude, frequency, and duration of flow events.

            To understand the notable differences between pre-dam (natural) and post-dam (controlled) situations, a preliminary assessment of the hydrological data is being carried out. These patterns are expected to show a significant dampening of natural flow frequency and magnitude, enabling the data-driven basis required to precisely forecast EF thresholds for the basins.

            The study highlights the need to integrate hydrological data from multiple stations to understand the cumulative effects of interventions at the basin level. The study establishes the thresholds necessary to support native aquatic species and maintain the overall ecological health of these river systems by identifying variations in flow magnitude, frequency, and duration.


Keywords: Environmental Flows, IHA/RVA, Mann-Kendall Trend Analysis, Hydrological Alteration, Multi-station Analysis.

How to cite: Patil, R., Kv, J., and Desai, V. R.: Multi-Station Trend Analysis for Assessing Hydrological Alterations and Environmental Flow Requirements in the Malaprabha and Ghataprabha River Basins, India, EGU General Assembly 2026, Vienna, Austria, 3–8 May 2026, EGU26-16502, https://doi.org/10.5194/egusphere-egu26-16502, 2026.

EGU26-16752 | Orals | HS10.10

Acceleration of Weathering of Trace Metals and Rare Earth Elements in Alpine Watersheds in the Colorado Mineral Belt 

Diane McKnight, Thomas Marchitto, Athena Bolin, and Adam Odorosio

Many mountain watersheds in the Rocky Mountains in Colorado, USA, are impacted by natural acid rock drainage (ARD) and acid mine drainage (AMD), which mobilize trace metals and rare earth elements (REEs) into surface waters. Analysis of long-term water quality records for alpine tributaries receiving ARD in the Colorado Mineral Belt indicates that warmer summer conditions have been driving increases in the concentrations of sulfate, trace metals and rare earth elements (REEs). One example of these climate-change impacts is the Lincoln Creek Watershed, where a highly mineralized tributary contributes a substantial ARD loading into the headwaters, with an additional AMD contribution from a nearby abandoned mine, the Ruby Mine. We evaluated the transport, mixing, and attenuation of major solutes, trace metals and REEs across the snowmelt to fall period. Water samples from six main sites along a 7-km reach of Lincoln Creek below the ARD and AMD inflows were analyzed by Inductively-Coupled Plasma Mass Spectrometry (ICP-MS) and Ion Chromatography (IC) methods. The results were explored through transport calculations employing sulfate as a conservative natural tracer. Water chemistry in Lincoln Creek reveals distinct geochemical fingerprints for the Ruby Mine (enriched in Ca, Mg, Mn, and Cd) and the Mineralized Tributary (enriched in SO4, Fe, Al, and Cu). REE fractionation patterns and Ce anomalies further distinguish source contributions and processes, with the Mineralized Tributary displaying MREE enrichment from natural pyrite weathering and the Ruby Mine exhibiting HREE enrichment tied to mine derived flows. Most solutes exhibited conservative transport during mid-summer when the pH values were low, in the range of pH 4-4.5. During the higher flows associated with snowmelt instream losses of some trace metals and REEs was observed, which was also the case in the fall. These results indicate that both source composition, instream pH-dependent reactivity and hydrologic processes interact to control the downstream water quality impacts associated with these high mountain sources of ARD and AMD.   

How to cite: McKnight, D., Marchitto, T., Bolin, A., and Odorosio, A.: Acceleration of Weathering of Trace Metals and Rare Earth Elements in Alpine Watersheds in the Colorado Mineral Belt, EGU General Assembly 2026, Vienna, Austria, 3–8 May 2026, EGU26-16752, https://doi.org/10.5194/egusphere-egu26-16752, 2026.

EGU26-20867 | Orals | HS10.10

Contrasting Export of Iron and Manganese between High Arctic and Sub-Arctic Glacierized Watersheds 

Lukasz Stachnik, Mateusz Telążka, Jon Hawkings, Jacob C. Yde, Jack Geary Murphy, Hanna Raczyk, Michał Łopuch, Aleksandra Proch, Jędrzej Proch, and Przemysław Niedzielski

Rapid warming in polar and alpine regions is accelerating glacier retreat, producing vast quantities of meltwater and sediments that are delivered to downstream ecosystems. Glacial meltwaters contain essential micronutrients, such as iron (Fe) and manganese (Mn), which may stimulate primary production in freshwater and marine ecosystems, potentially influencing carbon cycling. While dissolved Fe and Mn cycling are relatively well studied, the role of sediment-bound species remains poorly constrained despite their high potential bioavailability.

Here we present data on sediment-bound and dissolved Fe and Mn concentrations and flux, and associated chemical weathering processes, along source-to-sink transects in glacierized catchments of the High Arctic (Svalbard Archipelago) and Sub-Arctic regions (Jostedalsbreen ice cap and Jotunheimen mountain range, Norway). We analyzed meltwaters from 20 glacierized catchments spanning diverse lithologies with glacial coverage ranging from 3% to 62%, including metamorphic, sedimentary, carbonate, and plutonic substrates. Dissolved trace elements (<0.45 μm) were measured using ICP-MS/MS, while sediment-bound fractions were extracted with ascorbic acid (labile phases) and dithionite (crystalline phases) and analysed by ICP-OES.

Our results reveal striking contrasts between regions. Svalbard glacial streams exhibited sediment-bound Fe and Mn concentrations  at least one order of magnitude higher than dissolved concentrations, whereas Norwegian glacial streams showed only few-fold higher particulate Fe  relative to dissolved. Conversely, dissolved Fe was up to three times higher in Norwegian streams compared to Svalbard, whereas dissolved Mn was lower. Suspended particulate matter concentrations were also markedly different, with Svalbard streams showing concentrations near an order of magnitude higher than Norwegian streams.

Major ion chemistry indicates contrasting geochemical weathering processes. Major ion concentrations were generally higher in High Arctic streams compared to Sub-Arctic streams. Additionally, pH values were typically neutral to slightly alkaline in the High Arctic, while streams in Sub-Arctic catchments were more acidic. These patterns suggest regional differences in chemical weathering rate, buffering capacity, and glacio-fluvial erosion rates between regions. Stronger glacier recession and thinning, and biological expansion in proglacial zones of Norwegian glaciers compared to Svalbard may further contribute to these differences.

Our findings underscore the importance of sediment-bound element export and association with chemical weathering signatures and highlight regional differences in biogeochemical pathways during deglaciation. These insights are critical for predicting nutrient delivery to aquatic ecosystems in a warming world from glacierized regions.

How to cite: Stachnik, L., Telążka, M., Hawkings, J., Yde, J. C., Murphy, J. G., Raczyk, H., Łopuch, M., Proch, A., Proch, J., and Niedzielski, P.: Contrasting Export of Iron and Manganese between High Arctic and Sub-Arctic Glacierized Watersheds, EGU General Assembly 2026, Vienna, Austria, 3–8 May 2026, EGU26-20867, https://doi.org/10.5194/egusphere-egu26-20867, 2026.

High-mountain lakes are sentinels of climate change, yet their carbon cycling mechanisms remain poorly understood due to extreme conditions and data scarcity. This study investigates the air-water CO2 exchange and its driving mechanisms in Taro Co (4566 m a.s.l.), a large, freshwater, and dimictic lake on the central Tibetan Plateau. In 2023, an eddy covariance observation station was established on an island in the lake, yielding a 21-month continuous observation record of the air-water CO2 exchange flux at the lake surface.

The results illustrate that the lake acts as a carbon sink year-round. CO2 absorption is at its lowest during the summer and increases during the overturning periods in autumn and winter. The results also reveal a sudden change consistent with the formation of the lake ice sheet. The increased CO2 absorption during the overturning period is partially driven by enhanced primary productivity due to strong solar radiation in this low-latitude, high-altitude region, as evidenced by increased chlorophyll concentrations observed via satellite imagery.

How to cite: Huang, L., Hu, Z., Yang, H., Wu, X., Lu, H., and Zhu, L.: Seasonal Variability of CO2 Exchange in a High-Altitude, Freshwater Lake on the Tibetan Plateau: Insights from Eddy Covariance-based Observations, EGU General Assembly 2026, Vienna, Austria, 3–8 May 2026, EGU26-21111, https://doi.org/10.5194/egusphere-egu26-21111, 2026.

EGU26-22388 | ECS | Orals | HS10.10

Hydrological Non-stationarity in SWAT+ model Simulations under Changing Climate and Land Use Cover 

Sreeraj Sreenivas, Pavizham Athira, and Jens Kiesel

Hydrological models are widely used for water resources planning and management under changing environmental conditions. Therefore, it is important to assess the capability of these models to capture non-stationarity arising from climate variability and land-use change. The primary objective of this study is to evaluate the ability of the Soil and Water Assessment Tool (SWAT+) model to capture hydrological non-stationarities in the rainfall–runoff (r–r) mechanism caused by long-term fluctuations in precipitation, temperature, and Land Use/Land Cover (LULC) in Sugar Creek at Milford, Illinois (IL), USA. The analysis begins with the identification and characterization of non-stationarities in long-term hydroclimatic variables (1951–2020) using statistical change-point detection techniques. Temporal variations in the r–r relationship are examined using Analysis of Covariance (ANCOVA), which provides a formal statistical framework to test the linear dependence of the r–r mechanism on its driving variables. However, as hydrological responses are often nonlinear and governed by interacting drivers, ANCOVA alone is insufficient to fully explain how the relative influence of multiple dynamic variables evolves over time. To address this limitation, a machine-learning-based SHAP (Shapley Additive Explanations) analysis is employed to quantify the time-varying contributions of precipitation, temperature, and LULC fractions to streamflow observation, enabling an interpretable decomposition of the changing drivers. Complementing these data-driven analyses, SWAT+ simulations under dynamically varying climate and LULC conditions are analyzed to evaluate the model’s ability to capture hydrological non-stationarity. To examine model structural sensitivity, controlled perturbations of precipitation (±20%), temperature, and LULC are applied, and the resulting changes in major hydrological components are quantified using precipitation elasticity, temperature sensitivity, and LULC sensitivity indices. These diagnostics reveal shifts in process dominance—such as infiltration, percolation, evapotranspiration, and streamflow generation—under altered climatic and land-use regimes. Model calibration is conducted separately for pre-change and post-change periods to assess whether SWAT+ maintains parameter stability across different hydroclimatic states. Variations in optimal parameter values across climate and LULC scenarios are analyzed to quantify parameter uncertainty under non-stationary conditions. Overall, the results reveal substantial temporal variability in parameter sensitivity and demonstrate that fluctuations in precipitation, temperature, and LULC induce nonlinear hydrological responses that challenge the stationarity assumptions embedded in the SWAT+ model structure. The findings underscore the need for dynamic parameterization strategies to more accurately represent evolving watershed processes under changing climate and land-surface conditions.

How to cite: Sreenivas, S., Athira, P., and Kiesel, J.: Hydrological Non-stationarity in SWAT+ model Simulations under Changing Climate and Land Use Cover, EGU General Assembly 2026, Vienna, Austria, 3–8 May 2026, EGU26-22388, https://doi.org/10.5194/egusphere-egu26-22388, 2026.

EGU26-194 | Posters on site | HS10.12

Redox and carbon cycling in mine lakes of the Upper Harz Mountains (Germany) 

Elke Bozau, Tanja Schäfer, and Tobias Licha

The Harz Mountains, situated in the north of Germany, are about 120 km long and about 40 km wide. Their highest moun­tain is Mount Brocken (1,141 m a.s.l.). The mountain range is known for ancient silver and base metal mining. Today the Harz Mountains are an impor­tant drinking water supply region for north­ern Germany.

About 70 lakes are situated around the town of Clausthal-Zellerfeld in the Western Harz Mountains. These lakes were constructed to save a continuous water supply to the ore mines about 200 – 500 years ago. The water depths range from about 3 to 15 m, the storage volume from about 10,000 to 600,000 m3. The lakes are an important part of the UNESCO World Heritage Site "Oberharzer Wasserregal". Most of the lakes are oligotrophic with pH values of about 7 and SEC values below 200 µS/cm (Bozau et al., 2015). Some of the lakes are used for the drinking water supply of nearby communities and are still important for the protection of floods.

From 2023 – 2025, the water column of selected mine lakes was investigated. Samples of the water column were analysed for major ions, trace metals and stable isotopes. In summer, the formation of a deep anoxic layer (hypolimnion) was observed in some lakes. The intensity of anoxic conditions depends on the summer temperatures, precipitation rates and wind conditions. There is a typical chemical stratification of the water column for every single lake. Shallow lakes showed stronger redox reactions than deeper lakes. Colder weather periods with high precipitation rates during the summer time can minimise the extent of the hypolimnion. SEC, bicarbonate, Fe and Mn are enriched in the anoxic layer leading to problems in the traditional treatment of drinking water. Nitrate and sulphate are depleted due the chemical reactions under anoxic conditions. The ratio Mn/Fe proved to be a very sensitive indicator for the formation of the hypolimnion. The δ18O and δ2H values in the water column of mine lakes also reflect the seasonal stratification. Due to evaporation effects at the water surface the highest δ18O and δ2H changes are found in mine lakes during summer time. The δ13C values in the the water column range between -24 … -13 ‰. The lowest δ13C values are found in the anoxic hypolimnion during summer time. Due to warmer and longer spring, summer and autumn seasons the formation of hypolimnia increased in the last years and the treatment of drinking water was adapted.


Bozau E, Licha T, Stärk HJ, Strauch G, Voss I, Wiegand B, 2015. Hydrogeochemische Studien im Harzer Einzugsgebiet der Innerste. Clausthaler Geowissenschaften 10, 35-46.

How to cite: Bozau, E., Schäfer, T., and Licha, T.: Redox and carbon cycling in mine lakes of the Upper Harz Mountains (Germany), EGU General Assembly 2026, Vienna, Austria, 3–8 May 2026, EGU26-194, https://doi.org/10.5194/egusphere-egu26-194, 2026.

EGU26-1338 | Orals | HS10.12

The Ecohydrology of Coastal Ghost Forests 

Sergio Fagherazzi, Giovanna Nordio, Jacopo Boaga, Giorgio Cassiani, Holly Michael, Dannielle Pratt, Tyler Messerschmidt, Matthew Kirwan, and Stephanie Stotts

Sea level rise and storm surges affect coastal forests along low-lying shorelines. Salinization and flooding kill trees and favour the encroachment of salt-tolerant marsh vegetation. The hydrology of this ecological transition is complex and requires a multidisciplinary approach. Sea level rise (press) and storms (pulses) act on different timescales, affecting the forest vegetation in different ways. Salinization can occur either by vertical infiltration during flooding or from the aquifer driven by tides and sea level rise. Here, we detail the ecohydrological processes acting in the critical zone of retreating coastal forests. An increase in sea level has a three-pronged effect on flooding and salinization: It raises the maximum elevation of storm surges, shifts the freshwater-saltwater interface inland, and elevates the water table, leading to surface flooding from below. Trees can modify their root systems and local soil hydrology to better withstand salinization. Hydrological stress from intermittent storm surges inhibits tree
growth, as evidenced by tree ring analysis. Tree rings also reveal a lag between the time when tree growth significantly slows and when the tree ultimately dies. Tree dieback reduces transpiration, retaining more water in the soil and creating conditions more favourable for flooding. Sedimentation from storm waters combined to organic matter decomposition can change the landscape, affecting flooding and runoff. Our results indicate that only a multidisciplinary approach can fully capture the ecohydrology of retreating forests in a period of accelerated sea level rise.

How to cite: Fagherazzi, S., Nordio, G., Boaga, J., Cassiani, G., Michael, H., Pratt, D., Messerschmidt, T., Kirwan, M., and Stotts, S.: The Ecohydrology of Coastal Ghost Forests, EGU General Assembly 2026, Vienna, Austria, 3–8 May 2026, EGU26-1338, https://doi.org/10.5194/egusphere-egu26-1338, 2026.

EGU26-6023 | ECS | Posters on site | HS10.12

Tidal Wetlands and Environmental Drivers in Species Recovery: Suisun Marsh, CA (USA) 

Kimberly Evans and John Durand

Suisun Marsh is the largest tidal wetland on the west coast of North America, existing at the interface of the Sacramento-San Joaquin (SSJ) Delta and the San Francisco Bay in California. This dynamic landscape acts as a model system for observing the impacts of environmental changes; as a result, long-term monitoring efforts have been consistently deemed as a priority to evaluate the efficacy of restoration projects. We analyze the trends in fishes and water quality variables in Suisun Marsh from 1995-2024, specifically honing in on the recovery of an obligate floodplain-spawning fish (Sacramento Splittail) and contextualize what may have influenced its increases in abundance. We use the Normalized Difference Water Index as a proxy for floodplain availability compared to abundance data within Suisun Marsh, collected monthly at 25 sites. We additionally delve into distributions of fishes in Suisun Marsh and where they occur spatially, with respect to environmental conditions. Water quality samples were taken at each of the sites alongside biotic surveys once a month, including salinity, dissolved oxygen, turbidity, depth, and temperature, which were additionally compared to calculations of Delta Outflow (a metric representing the approximate quantity of freshwater entering the system). We hypothesize that the recovery of Sacramento Splittail population was ‘unintended’ as a result of nearby restoration efforts to wetland habitat targeting a different species. Once listed as a threatened species, the increases in floodplain availability then seem to represent a marked growth in abundances of Splittail. Larger implications of this project includes the evaluation of the single-species management approach common in the USA as well as the implications for nonnative species management.

How to cite: Evans, K. and Durand, J.: Tidal Wetlands and Environmental Drivers in Species Recovery: Suisun Marsh, CA (USA), EGU General Assembly 2026, Vienna, Austria, 3–8 May 2026, EGU26-6023, https://doi.org/10.5194/egusphere-egu26-6023, 2026.

EGU26-8176 | ECS | Orals | HS10.12

Effects of Land-Use Change and Hydrology on Soil Carbon Composition and Thermal Stability in a Tropical Freshwater Wetland: Insights from Yala, Kenya 

Christine Owino, Lucy Ngatia, Nzula Kitaka, Julius Kipkemboi, Risper Ondiek, Glynnis Bugna, and Sean Holmes

Wetlands are vital for mitigating climate change, but widespread conversion to agricultural land has disrupted their functioning in terms of soil carbon (C) and nitrogen (N) dynamics. This study examined the impact of land-use/cover change on soil N, C, their thermal stability, and C composition in Yala Wetland. Using a stratified random approach, soil samples were collected from permanently flooded, seasonally flooded, sugarcane, maize, and vegetable farms, across depths of 0-50 cm. Multi-Element Scanning Thermal Analysis (MESTA) was used to quantify C and N thermal stability, while solid-state 13C NMR spectroscopy characterized C composition. Results showed significant differences (P < 0.05) in SOC, nitrogen, and C:N ratios across land uses. Vegetable farms had highest SOC (117.83 ± 16.54 g kg-1) and N (7.34 ± 1.07 g kg-1), while sugarcane fields had the lowest (SOC: 13.58 ± 0.97 g kg-1; N: 1.07 ± 0.04 g kg-1). Seasonally flooded wetlands stored more SOC (98.51 ± 20.55 g kg-1) and N (5.31 ± 1.12 g kg-1) than permanently flooded wetlands, suggesting that alternate wet-dry cycles enhance humification and organic matter (OM) stabilization.  Data showed dominance of thermally labile C (C < 400 °C) over thermally stable C (C> 400 °C). This was highlighted by high R400 in all land uses, (0.73-0.82). Carbon composition results indicated dominance of O-alkyl C in all land-use types. This was consistent with dominance of low-thermally stable C and a High R400 index. Overall, findings show that both wetland conversion and hydrological conditions strongly influenced OM quality and stability in the Yala wetland.

How to cite: Owino, C., Ngatia, L., Kitaka, N., Kipkemboi, J., Ondiek, R., Bugna, G., and Holmes, S.: Effects of Land-Use Change and Hydrology on Soil Carbon Composition and Thermal Stability in a Tropical Freshwater Wetland: Insights from Yala, Kenya, EGU General Assembly 2026, Vienna, Austria, 3–8 May 2026, EGU26-8176, https://doi.org/10.5194/egusphere-egu26-8176, 2026.

EGU26-8655 | ECS | Posters on site | HS10.12

Chinese ice-lake line shifts under climate change 

Weijia Wang, Iestyn Woolway, Kun Shi, and Yunlin Zhang
Lake ice is a sensitive indicator of climate warming, yet a spatially explicit metric for where lakes freeze across China remains limited. Here we propose an ice lake line, defined as the lowest latitudinal connection of frozen lakes within each longitude band, to delineate the boundary below which lakes cease to freeze. We define the ice season as at least 10 consecutive days with lake surface water temperature below 1 °C and analyse 1,705 lakes that experienced ice cover during 1980 to 2021.
 
We found that the ice lake line for normally frozen lakes shifted north from 32.10° N in the 1980s to 32.42° N in the 2010s, equivalent to 0.32° or about 36 km over four decades. The boundary occurs at lower latitudes in western China and higher latitudes in the east, consistent with strong elevation control. Over the same period, ice on was delayed by 9.7 days, ice off advanced by 12.7 days, and ice duration shortened by 20.7 days as median changes, while about 39 lakes ceased to freeze by the 2010s. By 2090 to 2099, projections indicate 3, 77, 226 and 393 fewer winter freezing lakes than in the 2020s under SSP1-2.6, SSP2-4.5, SSP3-7.0 and SSP5-8.5, respectively, with the ice lake line moving to 33.97° N, 34.72° N, 35.30° N and 35.75° N. The faster northward shift for completely frozen lakes indicates a growing prevalence of partially frozen conditions. These results establish the ice lake line as an intuitive indicator of rapid warming and show that emissions mitigation can markedly slow the reorganization of China’s lake ice regime.

How to cite: Wang, W., Woolway, I., Shi, K., and Zhang, Y.: Chinese ice-lake line shifts under climate change, EGU General Assembly 2026, Vienna, Austria, 3–8 May 2026, EGU26-8655, https://doi.org/10.5194/egusphere-egu26-8655, 2026.

EGU26-8957 | ECS | Posters on site | HS10.12

Future winter shipping opportunities in the Great Lakes–St. Lawrence Seaway 

Haoran Shi, Pengfei Xue, Mingzhen Liu, Chenfu Huang, Miraj B. Kayastha, Sapna Sharma, Haodong Yang, Weijia Wang, Di Long, Lian Feng, Yuanzhe Liu, Christina W. Y. Wong, Kee-hung Lai, and R. Iestyn Woolway

The St Lawrence River and the Laurentian Great Lakes form one of the longest deep draft navigation systems in the world. However, this golden inland waterway is typically closed during winter due to ice cover on the river and lakes. As the Great Lakes basin is projected to become warmer and less ice-covered, climate warming is expected to stimulate new opportunities for winter shipping activities in this region.

This study analyses the projected ice data in the Great Lakes basin over the 21st century from a two-way coupled climate-lake model (GLARM-v2). We proposed a safe navigation criterion for winter shipping in the lakes based on projected ice conditions, saying ice coverage smaller than 0.7~0.8 and ice thickness smaller than 15 cm. With this criterion, we found that under the high-emissions Representative Concentration Pathway (RCP) 8.5 scenario, 68% of the Great Lakes region is projected to be navigable year-round by late-century (2080–2099).

Based on historical real-world shipping activity records, we identified 65 established navigation routes in this region. Under RCP 8.5, the annual ice-blocked duration for these navigation routes is projected to shorten by 78% by late-century (2080–2099) relative to the historical baseline (2000–2019), which means a two-month extension of annual shipping season. These changes have the potential to shift winter cargo transportation from land-based modes like railway and heavy truck to the shipping industry. Such a shift can potentially save billions in transportation costs and reduce substantial greenhouse gas emissions from the transport sector.

How to cite: Shi, H., Xue, P., Liu, M., Huang, C., Kayastha, M. B., Sharma, S., Yang, H., Wang, W., Long, D., Feng, L., Liu, Y., Wong, C. W. Y., Lai, K., and Woolway, R. I.: Future winter shipping opportunities in the Great Lakes–St. Lawrence Seaway, EGU General Assembly 2026, Vienna, Austria, 3–8 May 2026, EGU26-8957, https://doi.org/10.5194/egusphere-egu26-8957, 2026.

EGU26-11303 | Posters on site | HS10.12

Interaction of CO2 Fluxes in the Hydrological Dynamics of Mountain Basins in the Semiarid Andes – Central Chile 

Yohann Videla-Giering, Dany Novoa-Cortez, Patricia Ibaceta-Guerrero, Jacson Aravena-Perez, Tania Lucero-Salazar, Juan Pablo Rubilar-Donoso, Fernando Novoa-Cortez, and Manuel Contreras-Leiva

High Andean vegas constitute ecologically and functionally critical wetlands, representing some of the most fragile ecosystems within the mountainous environments of the Andes. These systems sustain high levels of biological diversity and endemism, providing habitat for numerous plant and animal species that exhibit strong sensitivity to hydrological and climatic variability. In addition, they fulfill essential ecosystem functions, including regulation of water balance, provision of ecosystem services, and freshwater supply—upon which approximately 12.4 million people in central Chile depend. 

A comprehensive understanding of the physical conditions that govern the synchronization of the snowpack in its solid and liquid phases—closely linked to the magnitude of seasonal water storage—and its interaction with periods of carbon sequestration is fundamental for interpreting the dominant processes that regulate the functioning of these ecosystems. To this end, we conducted extensive field measurements between 2023 and 2025, integrating data from automated weather stations (AWS) with gas exchange observations obtained through an IRGASON eddy covariance system. Furthermore, we calibrated and validated two physically based models, CRHM (Pomeroy et al., 2007) and LASSLOP (Lasslop et al., 2010), using unprecedented snow–hydrometeorological and gas exchange datasets from the Subtropical Andes of Chile. This approach enabled us to characterize CO fluxes, water vapor exchange, and the dynamics of surface energy balance with high resolution and reliability. 

The primary objective of this study is to elucidate the functioning of high Andean vegas, with particular emphasis on the energy fluxes that regulate carbon and water cycle mass balances and their linkages to biodiversity structure and dynamics. The results are intended to provide a robust scientific basis for evidencedriven management of these ecosystems and to inform the design of conservation and functional restoration strategies in the context of ongoing degradation and biodiversity loss. 

Our analyses demonstrate that, under favorable hydrological conditions—characterized by sustained snowmelt inputs, subsurface inflows, and prolonged soil saturation—high Andean vegas operate predominantly as carbon sinks, with an estimated annual sequestration rate of 1.28 × 10⁻⁴ Ton Eq CO2 m-2. In addition, they store subsurface water volumes of up to 250 L s-1, with extended residence times that maintain streamflow during the dry season. Conversely, perturbations to the hydrological regime—including persistent groundwater declines associated with prolonged drought, diminished snow–glacial contributions, and increasing air and soil temperatures—combined with anthropogenic pressures such as overgrazing, vehicular traffic, soil compaction, and channelization for agricultural purposes, can trigger severe and potentially irreversible losses of ecosystem functionality. These impacts manifest as sharp declines in biodiversity and a net release of CO2 to the atmosphere. 

This functional duality highlights the critical role of high Andean vegas in biodiversity conservation, climate change mitigation, and hydrological regulation within mountain basins. The balance between carbon sequestration and carbon emission is tightly coupled to hydrological status, vegetation condition, and the degree of ecosystem disturbance. In this context, timely, sciencebased management interventions are essential to mitigate biodiversity loss at local and regional scales, particularly given the role of these wetlands as strategic biological corridors across the Andes. 

How to cite: Videla-Giering, Y., Novoa-Cortez, D., Ibaceta-Guerrero, P., Aravena-Perez, J., Lucero-Salazar, T., Rubilar-Donoso, J. P., Novoa-Cortez, F., and Contreras-Leiva, M.: Interaction of CO2 Fluxes in the Hydrological Dynamics of Mountain Basins in the Semiarid Andes – Central Chile, EGU General Assembly 2026, Vienna, Austria, 3–8 May 2026, EGU26-11303, https://doi.org/10.5194/egusphere-egu26-11303, 2026.

EGU26-11830 | ECS | Orals | HS10.12

Wetland Classification and Revitalisation Monitoring by Using Drone Data 

Aneta Alexandra Ozvat, Maria Sibikova, Jozef Sibik, Jakub Sigmund, Juraj Papco, Michal Kollar, and Karol Mikula

Wetlands are essential ecosystems increasingly threatened by human activities and climate change. This study presents a method for classifying and monitoring wetland habitats in the Čiližská Radvaň protected area using RGB drone imagery and the Natural Numerical Network (NatNet), a mathematically based supervised deep learning approach. The primary aim was to evaluate the effectiveness of NatNet in identifying target habitat types and to assess the impact of ongoing revitalisation efforts. Habitat types were classified using RGB drone imagery and ground-truth training polygons representing the dominant vegetation communities in the Čiližská Radvaň wetland. The NatNet achieved a training classification success rate exceeding 97%, allowing the creation of relevancy maps that successfully identify spatial habitat distribution. Relevancy maps verified in the field achieved a classification accuracy of 0.88 and an F1 score of 0.90 across all habitats. Results showed observable shifts in habitat extent and structure after one year of restoration, confirming the method’s suitability for detecting ecological changes in wetland environments.

How to cite: Ozvat, A. A., Sibikova, M., Sibik, J., Sigmund, J., Papco, J., Kollar, M., and Mikula, K.: Wetland Classification and Revitalisation Monitoring by Using Drone Data, EGU General Assembly 2026, Vienna, Austria, 3–8 May 2026, EGU26-11830, https://doi.org/10.5194/egusphere-egu26-11830, 2026.

EGU26-12035 | ECS | Posters on site | HS10.12

Declining Predictions of Net Ecosystem Production in US Rivers and Streams Throughout the 21st Century 

Qi Guan, Kun Shi, R. Iestyn Woolway, Boqiang Qin, Yunlin Zhang, and Lishan Ran

Metabolism is an essential component of carbon cycling in river ecosystems, and understanding its response to climate change on a broad scale is imperative. Here we employ deep-learning models trained on an extensive data set to reconstruct daily metabolism in a total of 293 rivers and streams across the continental US from 1980 to 2020. Three key variables, gross primary production (GPP), ecosystem respiration (ER), and net ecosystem production (NEP), are examined to unveil longterm trends. Our analysis reveals that continental US rivers and streams experience an increase of 0.045 g O2 m−2 day−1 decade−1 in GPP from 1980 to 2020, largely driven by alterations in runoff and insolation, while ER declines more strongly at a rate of 0.078 g O2 m−2 day−1 decade−1 , primarily attributed to the combined effects of discharge, thermal conditions, and temperature changes. Such changes have caused a slight decrease in the NEP over the past four decades. Moreover, our well-trained models project that NEP continues to decline at a rate of 0.017 ± 0.008 g O2 m−2 day−1 decade−1 under future climate scenarios, resulting from asymmetric and converse trends between GPP and ER. Such persistent net heterotrophy shifts would threaten aquatic biodiversity and weaken ecological resilience of ffowing waters to climate change.

How to cite: Guan, Q., Shi, K., Woolway, R. I., Qin, B., Zhang, Y., and Ran, L.: Declining Predictions of Net Ecosystem Production in US Rivers and Streams Throughout the 21st Century, EGU General Assembly 2026, Vienna, Austria, 3–8 May 2026, EGU26-12035, https://doi.org/10.5194/egusphere-egu26-12035, 2026.

EGU26-12055 | ECS | Orals | HS10.12

Browning Lakes in a Greening Arctic: A Sediment- and Satellite-Based Circum-Arctic Synthesis 

Ludwig Strötz, Tarmo Virtanen, Kaarina Weckström, Maija Heikkilä, and Jan Weckström

Climate change is amplified in the Arctic, which is warming four times faster than the globe. Lakes are abundant across Arctic landscapes, integral to hydrological cycles and associated ecosystem functions and services, and act as sentinels of environmental change in the region. 
Across the terrestrial Arctic, widespread but spatially heterogeneous greening trends have been documented through remote sensing, linked to field-observed increases in vegetation growth, range expansion, and altered community composition. Concurrently, increases in terrestrial organic matter loading have been reported in some Arctic lakes, associated with browning, while other lakes are greening, linked to enhanced algal growth under shifting nutrient and thermal conditions.
While the theoretical basis for recent catchment vegetation and lake-water quality shifts is clear, circum-Arctic evidence linking the two phenomena remains scarce. 
Here, we assess coupled greening and browning trends of terrestrial vegetation and aquatic indicators (total organic carbon, TOC; chlorophyll-a, ChlA) in ~100 circum-Arctic lake-catchment systems across Alaska, Canada, Greenland, Fennoscandia, and Russia. TOC and ChlA are reconstructed from sediment records using visible–near infrared spectroscopy (VNIRS)-based inference. Catchment vegetation change is quantified based on annual peak greenness and growing-season length, using spectral vegetation indices (NDVI, EVI2, and NIRv) from Landsat, AVHRR, and MODIS satellites over 1984–2025. Patterns in vegetation trends are described and analyzed using a custom land-cover reclassification, aboveground biomass, and vegetation height datasets. 
Our remote-sensing results indicate widespread greening of catchments since the 1980s, at heterogeneous rates across Arctic regions and vegetation zones. Early sediment-based reconstructions indicate TOC increases in numerous lakes over the same period; ChlA is generally increasing but not consistently coupled to TOC. The greening-browning relationship will be evaluated through multivariate association analyses, accounting for physiographic and bioclimatic setting (e.g., latitude, topography, temperature/precipitation, vegetation type, hydrological connectivity). Our presentation will summarize catchment vegetation and lake-water TOC and ChlA trajectories across the Arctic, and identify the conditions under which they are linked most strongly.

How to cite: Strötz, L., Virtanen, T., Weckström, K., Heikkilä, M., and Weckström, J.: Browning Lakes in a Greening Arctic: A Sediment- and Satellite-Based Circum-Arctic Synthesis, EGU General Assembly 2026, Vienna, Austria, 3–8 May 2026, EGU26-12055, https://doi.org/10.5194/egusphere-egu26-12055, 2026.

EGU26-12214 | ECS | Orals | HS10.12

Reversible Bio-Sorption and Solute Transport in Floating Vegetated Wetlands 

Sourav Hossain and Christina W. Tsai

Floating vegetated wetlands play a vital role in improving water quality by filtering pollutants and mitigating eutrophication in lakes, rivers, and wastewater systems. Within these systems, solute transport is strongly influenced by the interaction between hydrodynamics, vegetation structure, and reactive processes such as biosorption; however, the mechanisms governing such interactions remain poorly understood. This study develops a novel mathematical model to elucidate the dispersion of reactive solutes in flows containing floating vegetation, incorporating reversible adsorption–desorption dynamics at the vegetation–water interface. The governing equations are upscaled using Mei’s homogenization technique to derive an effective dispersion coefficient that accounts for multiscale interactions between flow and reaction processes. Three key dimensionless parameters, namely the vegetation factor (α), partition coefficient (θ), and Damköhler number (Da), are identified as primary controls on the effective dispersion behavior. Results indicate that vegetation density modulates flow heterogeneity and mechanical dispersion, with sparse vegetation (α < 1) promoting molecular diffusion-dominated transport, while dense vegetation (α > 1) induces recirculation zones that suppress dispersion. Additionally, increasing Da enhances solute localization via faster reactions, whereas higher θ intensifies retention within the biofilm phase. The interplay among α, θ, and Da defines distinct transport regimes, revealing optimal combinations that balance mixing and reaction for efficient contaminant removal. These findings provide a mechanistic framework for designing and optimizing floating vegetated wetlands, enabling improved control of solute fate under varying hydrodynamic and biochemical conditions.

How to cite: Hossain, S. and W. Tsai, C.: Reversible Bio-Sorption and Solute Transport in Floating Vegetated Wetlands, EGU General Assembly 2026, Vienna, Austria, 3–8 May 2026, EGU26-12214, https://doi.org/10.5194/egusphere-egu26-12214, 2026.

EGU26-12221 | ECS | Orals | HS10.12

Beyond Expectations: Unusual Water and Salt Chemistry in the Okavango Delta (Botswana) 

Valentin Challier, Marc Jolivet, Nashaat Mazrui, Aline Dia, Mélanie Davranche, Olivier Dauteuil, Maxime Pattier, Patrice Petitjean, and Lionel Dutruch

Wetlands developing in semi-arid regions are increasingly affected by salinisation and trace element enrichment; processes that should increase in time with climate changes and anthropic activities. The Okavango Delta (Botswana) provides a rare example of a pristine wetland that nevertheless shows evidence of trace element contamination. This alluvial fan located in the SW termination of the East African Rift System is in the heart of an endoreic drainage network taking its source in Angola and having its outlet in the Makgadikgadi pans. Annual floods enter the Delta, creating permanent and seasonal swamps that isolate thousands of islands of various sizes and shapes. Subsurface (2 to 3 m deep) groundwaters in the Delta are known to be largely alkaline with pH values up to 9, dissolved inorganic carbon values up to 4400 ppm and elevated concentrations of dissolved metals and metalloids, some of which are toxic (arsenic up to 6 ppm, uranium up to 12 ppm, vanadium up to 4 ppm, etc.). A first model explained the formation of the saline groundwater through evapotranspiration of the fresh water brought by the annual flood followed by infiltration through the tree belts surrounding the many islands emerging from the wetlands. However, our recent trace-element geochemical studies of groundwater and sediment in the central part of the Delta, showed that groundwater composition could not result from a simple evapotranspiration of surface water, leading to the proposition of a two-aquifer model. In this model, the two aquifers are hydrologically and chemically separated by a clay-rich layer. The surface aquifer contains circumneutral pH fresh water while the subsurface aquifer is seal-capped by the clay layer and contains alkaline water. Following this initial result, the present study addresses the nature, composition and origin of salt deposits that have been described on several of these islands of the Delta, especially in its eastern, more humid region. For the first time, we provide a complete major and trace elements geochemical description of these salts and compare them to evaporites from the Makgadikgadi pans. We demonstrate that the composition of the Delta salts (essentially trona) is very different from that of the Makgadikgadi evaporites (mostly halite) but, in some points, similar to that of the alkaline groundwater previously described. Our main hypothesis is that surface water could represent a source for the salt deposits through a coupling of mechanisms involving evaporation and biotic/abiotic (bio)geochemical processes. Here alkaline groundwater could represent a testimony of past similar processes trapped under a clay-rich layer. The concentrations of trace elements in the Delta salts (As: up to 110 ppm, U: up to 12 ppm, V: up to 14 ppm) and potential toxicity to the environment and local populations will be discussed.

How to cite: Challier, V., Jolivet, M., Mazrui, N., Dia, A., Davranche, M., Dauteuil, O., Pattier, M., Petitjean, P., and Dutruch, L.: Beyond Expectations: Unusual Water and Salt Chemistry in the Okavango Delta (Botswana), EGU General Assembly 2026, Vienna, Austria, 3–8 May 2026, EGU26-12221, https://doi.org/10.5194/egusphere-egu26-12221, 2026.

EGU26-12530 | Orals | HS10.12

WISE-Wetland: A spatially-explicit carbon cycling model for wetland watersheds 

Junzhi Liu, Dawei Xiao, and Jiaojiao Liu

Wetlands play a critical role in the global carbon cycle, functioning as major carbon sinks while also serving as important sources of greenhouse gas emissions. Yet, in most watershed-scale carbon cycling models, wetlands are either highly simplified or omitted altogether, limiting our ability to represent wetland hydrological connectivity and associated carbon dynamics. To address this gap, we developed WISE-Wetland, a spatially explicit watershed-scale carbon cycling model.

We first proposed an improved discretization framework that explicitly represents wetlands as independent hydrological units within a watershed and constructs a wetland routing network. Using this wetland-unit routing network and delineated wetland catchments, we quantified and analyzed key wetland attributes, including area, hydrological connectivity, and routing characteristics. Building on this framework, we integrated a wetland carbon cycling module into WISE (Watershed-based Integrated Simulator for the Environment) that explicitly accounts for wetland routing processes—water retention, water-level dynamics, and wetland carbon transformation, transport, and emission.

WISE-Wetland has been implemented across diverse catchments. Simulations for the northern Krycklan watershed show that explicitly incorporating wetland routing networks substantially reconfigures organic carbon transport pathways and fluxes, leading to a marked improvement in model performance. We also simulated wetland carbon emissions in the Cottonwood watershed, demonstrating that the model can resolve spatial gradients and heterogeneity in wetland CH₄ fluxes, providing a more robust basis for quantifying wetland methane emissions and characterizing their spatial variability. Because watersheds are fundamental units of water and material redistribution, explicitly simulating wetland carbon cycling at the watershed scale offers critical insights into how future, climate-driven hydrological changes may regulate wetland carbon source–sink dynamics. Overall, WISE-Wetland provides a novel framework for advancing quantitative assessments of wetland contributions to regional and global carbon balances.

How to cite: Liu, J., Xiao, D., and Liu, J.: WISE-Wetland: A spatially-explicit carbon cycling model for wetland watersheds, EGU General Assembly 2026, Vienna, Austria, 3–8 May 2026, EGU26-12530, https://doi.org/10.5194/egusphere-egu26-12530, 2026.

EGU26-12751 | Posters on site | HS10.12

Land-water-atmosphere interaction over a deep large high-altitude lake: generation of mesoscale cyclones (limnocanes)  over Lake Hovsgol (Mongolia) 

Alexei V. Kouraev, Florian Pantillon, Nicolas Maury, Elena Zakharova, Andrey Kostianoy, Nicholas Hall, Patrick Marchesiello, and Andrey Suknev

Lake Hovsgol in Mongolia is a large deep mountainous lake. This lake is located in continental climate conditions and is ice-covered every year between December and June. In winter large water volume lead to significant heat inertia, late ice cover formation and strong temperature contrast between air over the lake and over land. 

We first discuss a mesoscale cyclone that has been formed over the lake in December 2023. There are extratropical mesoscale cyclones which take their energy from the large-scale baroclinic instability, such as most cyclones in the Mediterranean sea. However, some cyclones such as Medicanes (“Mediterranean hurricanes”) and polar lows develop from both baroclinic instability (like extratropical cyclones) and surface exchanges over the relatively warm sea (like tropical cyclones). There were also cases when cyclones were observed over lakes, such as Great Lakes, or Lake Victoria, but in most cases these cyclones developed elsewhere and their size was several hundreds of kilometers - much larger than the lakes themselves.

We analyse the generation, evolution and dissipation of a cyclone over lake Hovsgol in 2023 using various satellite imagery in the visible, thermal and microwave ranges, as well as meteorological data. Rapid decrease of air temperature from –8 to –30°C led to wind oriented from the coast to the lake, creation of several convergence lines and ultimately formation of a cyclone with outer radius of about 35 km. This cyclone has been generated over the lake itself (and not advected from some other regions) and its size was limited by the lake size which itself is 130x35 km. The cyclone was short lived (about 24 hours) but had a well-developed cloud-free eye with diameter of 3.5 km, comma head and outflow cirrus shield. Heavy snowfall was observed at that time by local populations. Two days after cyclone dissipation most of the lake was ice covered.

We present data on cyclone position and displacement, estimate speed and direction of wind-driven ice drift during the cyclone presence and based on this assess potential speed of surface wind. We also estimate height and temperature of cloud cover. We discuss the potential structure of the cyclone, its influence on surface water currents and ice formation.

We also present several other cases when such cyclones have been observed over lake Hovsgol in other years. These examples confirm that such events are a repeatable feature over deep and large lakes, and we propose to call them Limnocanes (by analogy with Medicanes).

This research was supported by the CNES TOSCA LAKEDDIES-II, TRISHNA and SWIRL projects. A.G. Kostianoy was supported in the framework of the Shirshov Institute of Oceanology RAS budgetary financing (Project N FMWE--2024-0016). 

How to cite: Kouraev, A. V., Pantillon, F., Maury, N., Zakharova, E., Kostianoy, A., Hall, N., Marchesiello, P., and Suknev, A.: Land-water-atmosphere interaction over a deep large high-altitude lake: generation of mesoscale cyclones (limnocanes)  over Lake Hovsgol (Mongolia), EGU General Assembly 2026, Vienna, Austria, 3–8 May 2026, EGU26-12751, https://doi.org/10.5194/egusphere-egu26-12751, 2026.

EGU26-13554 | Orals | HS10.12

PanLake: A Transferable Framework for Monitoring Trophic Dynamics in Shallow Lakes 

huan li, Boglárka Somogyi, Viktor R. Tóth, Hongtao Duan, Juhua Luo, and R. Iestyn Woolway

Shallow lakes (89% of global lakes) face escalating pressures from eutrophication and climate change, yet comprehensive monitoring of chlorophyll-a (Chl-a) spatiotemporal dynamics remains challenging due to high costs and logistical constraints of traditional sampling. Developing transferable satellite-based frameworks is essential for scaling lake management from individual systems to regional assessments, particularly as climate warming intensifies phytoplankton bloom dynamics globally.

We developed an integrated remote sensing framework using four decades (1984-2023) of Landsat observations (30 m Chl-a). The framework integrates: machine learning-validated retrieval algorithms, exponential modelling for nutrient-driven spatial patterns, statistical phenological analysis, and zone-specific (littoral vs. pelagic) dynamics quantification. Trend detection employs Mann-Kendall tests with Sen's slope and bootstrap uncertainty estimates. Analysis of Lake Balaton (Central Europe, 596 km², 3.7 m depth) revealed: (1) robust exponential Chl-a decay from the primary nutrient source (k=0.04-0.06 km⁻¹) consistent across four decades and varying trophic conditions; (2) pronounced spatial heterogeneity with littoral zones maintaining 1.3-2.8× higher Chl-a than pelagic zones due to integrated signals from phytoplankton, benthic algae, and macrophytes; (3) climate-driven phenological advancement of 20 days in peak timing and 10 days in growing season onset, coupled with 0.7°C/decade surface warming; (4) 68% algal biomass reduction following nutrient management, demonstrating effective restoration despite concurrent climate pressures. The methodology is currently being extending to Lake Taihu (China, 2,338 km², 1.9 m depth) through international collaboration, testing framework performance across contrasting geographic, climatic, and trophic contexts. We will present comparative results examining the generalizability of spatial decay parameters, littoral-pelagic ratios, phenological response patterns, and climate sensitivity across these systems.

The transferable principles enable scaling from intensive single-lake studies to regional assessments, supporting evidence-based management for thousands of shallow lakes globally facing dual pressures of eutrophication and climate change.

How to cite: li, H., Somogyi, B., Tóth, V. R., Duan, H., Luo, J., and Woolway, R. I.: PanLake: A Transferable Framework for Monitoring Trophic Dynamics in Shallow Lakes, EGU General Assembly 2026, Vienna, Austria, 3–8 May 2026, EGU26-13554, https://doi.org/10.5194/egusphere-egu26-13554, 2026.

EGU26-14595 | Orals | HS10.12

Understanding Cultural Ecosystem Services of Wetlandscapes: Insights from Central Italy 

Elena Bresci, Giulio Castelli, Luigi Piemontese, Niccolò Renzi, Enrico Lucca, Lorenzo Villani, Noemi Mannucci, Tommaso Pacetti, Enrica Caporali, Anna Scaini, and Fernando Jaramillo

Wetlandscapes are fundamental social-ecological systems that provide a wide range of provisioning, regulating, cultural, and supporting ecosystem services. While the ecosystem services of provisioning and regulation of hydrological and biological functions have been the main focus of scientific investigation, wetlandscape cultural ecosystem services (WCES) are comparatively underexplored, despite their central role in shaping human–wetland(scapes) relationships, collective memory, and long-term conservation commitment. Understanding how wetlandscapes are perceived and valued by local communities is essential to reveal the societal foundations of stewardship and sustainable socio-ecological relations.

This contribution presents a participatory approach to the assessment of WCES developed within the wetlandscape composed of the Padule di Fucecchio, the largest inland wetland in Italy, and Lake Sibolla, one of the southernmost peatlands in the world, both located in Tuscany, involving stakeholders from the municipality, recreational centers, farms, the private sector, etc.

We develop a framework to elicit a shared, community-based vision of the wetlandscape, integrating place-based values, narratives, and relational dimensions with more conventional eco-hydrological representations. We find that although hydrologically and ecologically connected, these wetlands are characterized by complex histories, functions, and cultural meanings. They demonstrate how connectivity and integration can support both ecological and social benefits, providing a unique opportunity to explore how diverse social perceptions and values coexist within a single wetlandscape. This approach allows us  to expand the conceptual boundaries of wetlandscapes beyond purely biophysical definitions, framing them as dynamic socio-ecological systems shaped by reciprocal interactions between water, ecosystems, and society with implications for wetland management and conservation.

Acknowledgements

The project DOWES has received funding from The Swedish Research Council for Environment, Agricultural Sciences and Spatial Planning (Sweden), the Agence Nationale de la Recherche (France), Engineering and Physical Sciences Research Council (United Kingdom), Ministero dell'Università e della Ricerca (Italy), Fundação de Amparo à Pesquisa do Estado do Amazonas (FAPEAM/Brazil), Secretaria de Estado de Desenvolvimento Econômico, Ciência, Tecnologia e Inovação (SEDECTI/Brazil) and the Amazonas State Government (Brazil)— call N. 026/2023 WATER4ALL 2023, and the European Union’s Horizon Europe Programme under the 2023 Joint Transnational Call of the European Partnership Water4All (Grant Agreement n°101060874).

How to cite: Bresci, E., Castelli, G., Piemontese, L., Renzi, N., Lucca, E., Villani, L., Mannucci, N., Pacetti, T., Caporali, E., Scaini, A., and Jaramillo, F.: Understanding Cultural Ecosystem Services of Wetlandscapes: Insights from Central Italy, EGU General Assembly 2026, Vienna, Austria, 3–8 May 2026, EGU26-14595, https://doi.org/10.5194/egusphere-egu26-14595, 2026.

EGU26-15390 | Orals | HS10.12

Reducing the structural uncertainty of global lake evaporation rate projection 

Wei Wang, Zhiwen Wen, Zhonghua Zheng, Taikan Oki, and Xuhui Lee

Evaporation is a key component of freshwater loss of lakes. Policy makers need reliable evaporation projection for adaptive allocation of water resources. However, large uncertainty exists in global lake evaporation rate (E) projection. When scenario is fixed, the uncertainty is mainly arisen from climate model uncertainty, that is the choice of Earth system model (ESM) outputs to drive lake model. However, the relative contribution of ESMs structural uncertainty is still unclear. Furthermore, there is no physics-informed method to reduce structural uncertainty. A primary reason is that multi-model ensemble projections of lake E in online mode are still absent. To address the shortcoming, we firstly combined Community Earth System Model 2 (CESM2), the only one with lake E projections under SSP370 in CMIP6, with automatic machine learning algorithm to establish a global lake E emulator. The emulator “solves” the lake E statistically with high efficiency instead of numerically. The dynamic interactions between lake and atmosphere are also preserved in the emulator by training with the CESM2 Large Ensemble (LENS2). The emulator can produce global online multi-model projections of lake E under SSP370 scenario with 30 ESM atmospheric forcing variables. Then, the structural uncertainty is calculated as standard deviation among multiple ESMs. At last, the emergent constraints for lake E structural uncertainty were established in different climate zones and at the global scale. The results show that structural uncertainty is the largest for tropical lakes. VPD is an optimal variable used for emergent constraints. After emergent constraints, Lake E in tropical climate will increase a little faster with reduced uncertainty (~23%). This study can provide theory support for enhancing credibility of future lake water storage projection, also show the direction for improving lake processes simulation in next generation of ESMs.

How to cite: Wang, W., Wen, Z., Zheng, Z., Oki, T., and Lee, X.: Reducing the structural uncertainty of global lake evaporation rate projection, EGU General Assembly 2026, Vienna, Austria, 3–8 May 2026, EGU26-15390, https://doi.org/10.5194/egusphere-egu26-15390, 2026.

Comprehensive long-term insights into lake thermal dynamics—spanning both historical evolution and future trajectories—are critical for assessing climate change impacts on freshwater ecosystems. Unlike gridded surface temperature products that average over land and water, lake-specific datasets like GLAST offer superior precision by resolving thermal dynamics for 92,245 individual lakes worldwide. However, the previous version (v1.0, https://zenodo.org/records/8322038) was constrained by a historical record ending in 2020 and reliance on older CMIP5-based forcing. Here, we introduce GLAST v2.0, which overcomes these limitations by extending the historical reconstruction and integrating latest-generation projections. Using the FLake model calibrated against satellite observations, we extended historical simulations (driven by ERA5-Land) to 1981–2025, thereby capturing recent extreme warming events. Future projections (2015–2100) were upgraded to the ISIMIP3b (CMIP6) protocol under SSP1-2.6, SSP3-7.0, and SSP5-8.5 scenarios. Acknowledging the inherent differences between reanalysis and ESM forcing, we intentionally retain the 2015–2025 overlap period to allow users to quantify discontinuities and apply tailored bias corrections. Extensive validation against independent observations confirms the dataset's robust performance in capturing interannual variability and recent warming trends. GLAST v2.0 provides a vital, high-resolution resource for assessing lake thermal evolution under the latest climate narratives.

How to cite: Tong, Y., Feng, L., and Woolway, R. I.: GLAST v2.0: A lake-specific daily surface water temperature dataset (1981–2100) integrating recent extremes and CMIP6 projections, EGU General Assembly 2026, Vienna, Austria, 3–8 May 2026, EGU26-16744, https://doi.org/10.5194/egusphere-egu26-16744, 2026.

EGU26-17179 | ECS | Orals | HS10.12

Hydrological thresholds govern methane flux variability across wetland-cropland transition landscapes 

Stella Nevermann, Esteban Jobbagy, Marcelo D. Nosetto, Javier Houspanossian, Francisco Diez, Juan I. Whitworth-Hulse, Marcos J. Niborski, Mariana Rufino, and Mohsen Zarebanadkouki

Hydrological variability is a key regulator of greenhouse gas (GHG) fluxes across wetland-cropland transitions in cultivated landscapes, acting directly through water table dynamics and indirectly via land-use change, yet the balance of these effects is poorly understood. In these landscapes, rapid shifts in soil moisture which may extend to fully saturated conditions, can trigger highly dynamic methane (CH₄) and carbon dioxide (CO₂) responses, particularly within transition zones. In very flat and highly cultivated regions such as the Argentinian Pampas, widespread flooding and land-use reversion to wetlands have been associated with hydrological changes linked to the historical expansion of croplands. The effects of this large-scale ecohydrological transformation on biogeochemical functioning are still unclear.

We measured CH₄ and CO₂ fluxes across wetland-cropland transitions spanning multiple land uses and moisture regimes using in situ GHG monitoring combined with a broad suite of soil physical and chemical parameters across multiple field campaigns. This approach captured a wide range of water table positions and trends and allowed assessment of hydrology-, soil-, and carbon-related drivers of flux variability.

Across the landscape, water table depth was the dominant control on CH4 fluxes, with wetlands exhibiting the highest values. CH₄ fluxes displayed a clear nonlinear response to hydrological conditions, with sharp increases once the water table approached the soil surface (-24 cm), indicating a strong threshold behaviour. While accounting for water table position reduced apparent differences among land uses, CH₄ fluxes remained systematically higher in wetlands and transitional zones than in croplands and pastures, demonstrating additional modulation by land-use–specific soil properties. Moreover, the sensitivity of CH₄ emissions to water table changes differed among land uses, with transitional zones and wetlands showing the strongest responses, highlighting their vulnerability to small hydrological shifts.

In contrast, CO₂ fluxes were primarily controlled by temperature and dissolved organic carbon availability and showed a comparatively weaker and more gradual response to moisture gradients, without clear threshold behaviour.

Overall, our results show that water table dynamics are the primary control on CH₄ flux variability at the landscape scale, while land use determines how strongly soils respond to hydrological change. These findings emphasize the importance of accounting for both hydrological variability and land-use transitions when assessing GHG emissions from ecosystems.

How to cite: Nevermann, S., Jobbagy, E., Nosetto, M. D., Houspanossian, J., Diez, F., Whitworth-Hulse, J. I., Niborski, M. J., Rufino, M., and Zarebanadkouki, M.: Hydrological thresholds govern methane flux variability across wetland-cropland transition landscapes, EGU General Assembly 2026, Vienna, Austria, 3–8 May 2026, EGU26-17179, https://doi.org/10.5194/egusphere-egu26-17179, 2026.

EGU26-17949 | ECS | Posters on site | HS10.12

Declining lake ice thickness and its implications for community travel in northern regions: a modeling study (1981–2025)  

Jipeng Shan, Yan Tong, R. Iestyn Woolway, Ishfaq Hussain Malik, and James D. Ford

Northern regions are experiencing warming rates that significantly exceed the global average, triggering rapid and profound changes in freshwater ice dynamics. These changes manifest as delayed freeze-up, earlier break-up, and, critically, a reduction in ice thickness that threatens the safety of traditional travel routes. Addressing the scarcity of lake-specific ice thickness data in northern communities, this study employs the FLake numerical model to estimate ice thickness variations from 1981 to 2025 for 161 lakes identified along community winter travel routes. By integrating these simulations with safety thresholds derived from local community surveys, we quantify the reduction in days of safe access. Results indicate a significant thinning trend, with annual mean and maximum ice thickness decreasing at rates of 1.42 cm/decade and 1.43 cm/decade, respectively. Consequently, the duration of safe access has declined by a cumulative total of 11.8 days over the 45-year period (a rate of 2.67 days/decade). This study elucidates how accelerated regional warming is compromising essential winter mobility, providing a scientific basis for developing adaptation strategies to mitigate risks for ice-dependent communities across northern latitudes.

How to cite: Shan, J., Tong, Y., Woolway, R. I., Malik, I. H., and Ford, J. D.: Declining lake ice thickness and its implications for community travel in northern regions: a modeling study (1981–2025) , EGU General Assembly 2026, Vienna, Austria, 3–8 May 2026, EGU26-17949, https://doi.org/10.5194/egusphere-egu26-17949, 2026.

EGU26-19072 | Posters on site | HS10.12

Climate-driven controls on greenhouse gas emissions from global reservoirs inferred from satellite observations and machine learning 

Manu Seth, Maria Ubierna Aparicio, Cristina Diez Santos, and Faye Outram

Reservoirs are increasingly recognised as dynamic components of the global carbon cycle. Yet, their greenhouse gas (GHG) emissions are still poorly understood due to strong spatiotemporal variations, seasonality and the scarcity of in-situ measurements. Climate-driven variability in thermal conditions, hydrodynamics and reservoir morphology is expected to control both the magnitude and temporal variability of carbon dioxide (CO₂) as well as methane (CH₄) emissions. However, these controls remain poorly understood at the global scale.

Here, we combine satellite observations and machine-learning models to examine climate-related patterns in reservoir GHG emissions across more than 21,000 reservoirs globally from 2020 to 2024. Average CO₂ and CH₄ emissions on a monthly scale are obtained by combining GHG concentration-based observation from the Greenhouse Gases Observing Satellite (GOSAT) with climate reanalysis data (ERA5) and relevant reservoir information such as surface area or catchment area. We employ tree-based ensembles of models to estimate monthly emissions and explore how emissions vary with season, location and reservoir characteristics among different hydroclimatic regions.

The resulting emission estimates exhibit clear global seasonal variations and show a strong seasonal phasing, with most emissions peaking during local seasonal extremes. Seasonal emissions show less variation in larger reservoirs while the smaller reservoirs show greater seasonal changes because they are strongly influenced by climate forcing and have less ability to moderate variability. Spatial aggregation reveals strong zonal differences and nonlinear relationships with thermal regimes, highlighting the complex interplay between climate variability and physical characteristics of the reservoir on GHG emissions regulation.

Together, these findings show that machine learning models using satellite-derived information can reveal physically consistent spatiotemporal patterns in reservoir GHG emissions at global scales. While comprehensive site-scale validation remains limited at the global scale, the observed consistency across temporal, spatial and physical characteristics reconfirms that satellite-enabled modelling could be useful to assess climate-driven variability in inland-water carbon emissions at larger scales and guide focused future observational efforts.


How to cite: Seth, M., Ubierna Aparicio, M., Diez Santos, C., and Outram, F.: Climate-driven controls on greenhouse gas emissions from global reservoirs inferred from satellite observations and machine learning, EGU General Assembly 2026, Vienna, Austria, 3–8 May 2026, EGU26-19072, https://doi.org/10.5194/egusphere-egu26-19072, 2026.

EGU26-19693 | ECS | Orals | HS10.12

Tidal branching wetlands morphology and its role on water-carbon budget cycles  

Filippo Miele, Benjamin Kargere, Meret Aeppli, and Sara Bonetti

Coastal wetlands represent invaluable “carbon banks”, as they naturally capture and store atmospheric carbon under water-logged conditions, where dead plant material decomposes very slowly, and organic layers build up in the soil. However, when drained or perturbed, wetlands can switch from carbon sinks to major sources, making monitoring and restoring degraded wetlands a worldwide environmental priority. Water table level plays a key role in regulating carbon exchange, but uncontrolled rewetting works do not suffice in restoring their optimal status. The reason is that forecasting beneficial effects of wetlands restoration is often challenged by the complexity of coupled water-soil-vegetation dynamics that both regulate soil respiration rate and shape micro-scale morphological features in the short and long terms. As a result, a significant number of studies have reported unexpected and significant failure outcomes in restoration works. Existing modeling frameworks generally neglect the spatial heterogeneity of wetland morphology and rely on heavy implementations of empirical functions, which limits model predictions to be site-specific. In this work, we adapt a landscape evolution model to explicitly simulate spatial wetlands morphology, accounting for coupled water, sediment, and vegetation dynamics. Carbon fluxes are then evaluated in a spatially explicit manner accounting for the high-resolution simulated heterogeneity of water table level, sediment elevation, and vegetation density. The modelled surface morphology is first compared, through standard river network metrics, with satellite images of tidal wetlands that exhibit different levels of river channeling. The simulated spatially-distributed carbon fluxes suggest that highly branched morphologies promote optimal water distribution and enhance carbon sequestration. These trends are confirmed by comparing simulated ecosystem fluxes with flux-tower eddy covariance measurements in several tidal wetlands.

How to cite: Miele, F., Kargere, B., Aeppli, M., and Bonetti, S.: Tidal branching wetlands morphology and its role on water-carbon budget cycles , EGU General Assembly 2026, Vienna, Austria, 3–8 May 2026, EGU26-19693, https://doi.org/10.5194/egusphere-egu26-19693, 2026.

Harmful algal blooms (HABs) increasingly threaten freshwater ecosystems under intensifying anthropogenic and climatic pressures. Accurate short-term forecasting of HABs remains challenging, particularly in shallow lakes where phytoplankton dynamics are strongly influenced by meteorological variability through its effects on mixing intensity, thermal structure, and light availability. These rapid, non-stationary processes play a critical role in the development and decay of algal blooms, yet they remain poorly resolved by conventional low-frequency monitoring and are often oversimplified in predictive models relying on temporal persistence alone.

In this study, we investigate seasonal algal dynamics in Lake Taihu, a large shallow lake in China, using high-frequency vertical profiling data acquired by an autonomous monitoring system, providing a high-resolution dataset comprising 3 to 5 readings per second, and moving 2–3 cm per dataset, including observations of water temperature, conductivity, dissolved oxygen, pH, colored dissolved organic matter, chlorophyll-a, phycocyanin, and underwater photosynthetically active radiation, together with concurrent meteorological forcing including wind, air temperature, atmospheric pressure, and precipitation. This unique combination enables the explicit characterization of diel to seasonal variability in vertical water-column structure under changing meteorological conditions.

To extract spatiotemporal patterns from these heterogeneous observations, we apply a hybrid deep learning framework that integrates convolutional, recurrent, and attention-based components to predict short-term vertical chlorophyll-a dynamics. Rather than relying purely on autoregressive persistence of biomass, the process-guided model (Phytoformer) is designed to learn the influence of physical drivers associated with wind-driven mixing, stratification, and light attenuation, thereby enhancing ecological interpretability and physical consistency. High short-term predictive skill based on biomass persistence does not necessarily imply an understanding of the environmental drivers that govern bloom intensification or decay. Feature relevance analyses further indicate that physical controls modulate phytoplankton dynamics beyond short-term state persistence, with distinct seasonal patterns.

Our work demonstrates the potential of integrating high-resolution vertical sensing with interpretable deep learning to improve short-term prediction and early warning of HABs across seasons. Ongoing work extends this hybrid modeling framework to deep stratified Wahnbach Reservoir in Germany, where HABs can bloom in specific depth layers under contrasting water quality regimes. This cross-system application aims to explore model generalizability and to identify how dominant physical drivers differ between shallow and deep lake environments.

How to cite: Wei, G. and Norra, S.: Short-term prediction of algal dynamics in freshwater under meteorological variability: insights from high-frequency vertical observations and hybrid modeling , EGU General Assembly 2026, Vienna, Austria, 3–8 May 2026, EGU26-20947, https://doi.org/10.5194/egusphere-egu26-20947, 2026.

EGU26-21681 | ECS | Orals | HS10.12

Climate and human-driven shifts in groundwater–lake interactions in a semi-arid maar lake 

Raúl Silva-Aguilera, Oscar Escolero, Javier Alcocer, Eric Morales-Casique, Selene Olea-Olea, Gloria Vilaclara, Socorro Lozano-García, and Alex Correa-Metrio

Inland waters in semi-arid regions respond rapidly to both climate variability and human pressure, but the mechanisms linking external forcing to groundwater–surface water connectivity are still poorly understood, particularly in tropical lakes. Maar lakes are specially well suited to explore these processes because they are directly embedded in regional groundwater flow systems. We examine these interactions in Lake Alchichica (central Mexico), a semi-arid maar lake that has undergone a persistent decline in water level over recent decades. We developed a conceptual model based on a multiproxy approach combining effective precipitation, regional hydrogeochemistry, isotopic and physicochemical lake data, and groundwater level dynamics. Hydrogeochemical and isotopic patterns indicate a tight coupling between regional groundwater flow and lake water, with progressive chemical evolution along the flow path and increasing ion concentrations driven by intense evaporation. Between 2017 and 2021, groundwater levels dropped by ~38 cm, pointing to a reduction in subsurface inflows and a direct impact on the lake water balance. This decline cannot be explained by meteorological variability alone and instead suggests system-scale changes, likely associated with regional groundwater exploitation and long-term climate variations. Although groundwater chemistry has remained relatively stable, reported shifts in lake temperature and composition indicate emerging pressures on ecosystem functioning. Together, these results show how climatic and anthropogenic forcing can reshape groundwater–lake connectivity threatening lake's habitat. 

How to cite: Silva-Aguilera, R., Escolero, O., Alcocer, J., Morales-Casique, E., Olea-Olea, S., Vilaclara, G., Lozano-García, S., and Correa-Metrio, A.: Climate and human-driven shifts in groundwater–lake interactions in a semi-arid maar lake, EGU General Assembly 2026, Vienna, Austria, 3–8 May 2026, EGU26-21681, https://doi.org/10.5194/egusphere-egu26-21681, 2026.

Wetlands play a crucial role in the global carbon cycle, both by sequestering large amounts of carbon in their soils and acting as a major natural source of atmospheric methane. Methane emissions depend strongly on soil temperature, substrate availability, and the depth of the water table relative to the soil surface, reflecting a balance between production, oxidation, and transport. Here we develop a simple mathematical model that captures how production and oxidation interact to control emissions. We condense these processes into a single ordinary differential equation, parameterised by water-table depth, soil temperature, and vegetation-derived carbon inputs, to mechanistically explore how these factors interact to control wetland methane emissions. Using emission data from six mid-latitude wetlands in the Prairie Pothole Region, we show that the model can reproduce seasonal and inter-annual variation in fluxes. Having established this agreement, we employ the model to investigate the conditions under which emissions are maximised. Peak fluxes consistently occur at or just above the soil surface and are strongly modulated by wetland-specific parameters, with oxidation acting as a significant sink in some systems. Importantly, we find that the temperature sensitivity of oxidation is a key determinant of both the magnitude and location of peak emissions. These results highlight how warming may shift emission dynamics, emphasising the need for site-specific and adaptive wetland management and restoration strategies.

How to cite: McNicol, G., Layton, A., and Basu, N.: Understanding the balance between methane production and oxidation from wetlands using a minimalistic emissions model, EGU General Assembly 2026, Vienna, Austria, 3–8 May 2026, EGU26-22857, https://doi.org/10.5194/egusphere-egu26-22857, 2026.

EGU26-23188 | ECS | Orals | HS10.12

The Critical Role of Wetland Conservation and Restoration in Mitigating Nitrogen Pollution Across European River Basins 

Leonardo Enrico Bertassello, Nandita Basu, Joachim Maes, Bruna Grizzetti, A La Notte, and Luc Feyen

Excessive nitrogen (N) inputs from agricultural intensification, wastewater, and atmospheric deposition pose a severe threat to European ecosystems and public health, with N levels in over 57% of freshwater monitoring stations exceeding thresholds for good ecological status. While traditional management practices focus on reducing inputs, nature-based solutions (NBSs) like wetlands offer powerful, cost-effective filtration by facilitating denitrification in their carbon-rich, anoxic soils. This study presents a novel, pan-European modeling framework that combines high-resolution N surplus data, historical wetland distribution, and projected land-use changes to quantify the current and potential N-removal capacity of wetlands across the EU27 and neighboring countries.

The analysis estimates that existing European wetlands currently remove approximately 1,000 kt of nitrogen per year, a service that prevents riverine N loads to the sea from being 25% higher than they are today. Despite this contribution, Europe remains a hotspot for wetland loss, having drained roughly 70% (~78 Mha) of its historical wetland area, primarily for agricultural expansion.

To address current pollution gaps, the study evaluates three restoration scenarios designed to meet water quality targets while balancing agricultural productivity. The most ambitious Restoration scenario - restoring 27% of wetlands historically drained for agriculture (3.2% of total land area) - could reduce N loads to the sea by 36%. However, the study identifies a more efficient strategy, which targets restoration on lands projected to be abandoned by 2040. This approach yields a 22% reduction in total N loads and enables major rivers like the Rhine, Elbe, and Vistula to meet water quality targets with minimal impact on agricultural output.

Cost-benefit analysis indicates that while restoration costs are significant - ranging from €55-358 billion per year for the full scenario - the co-benefits of ecosystem services, such as carbon sequestration and flood regulation, often outweigh these expenses. Ultimately, the findings highlight that spatially targeted wetland restoration is a vital, policy-relevant tool for achieving the European Green Deal’s goals for water quality, biodiversity, and climate sustainability. However, the study concludes that in the most heavily polluted basins, wetland restoration must be paired with continued reductions in diffuse N sources to reach good ecological status.

How to cite: Bertassello, L. E., Basu, N., Maes, J., Grizzetti, B., Notte, A. L., and Feyen, L.: The Critical Role of Wetland Conservation and Restoration in Mitigating Nitrogen Pollution Across European River Basins, EGU General Assembly 2026, Vienna, Austria, 3–8 May 2026, EGU26-23188, https://doi.org/10.5194/egusphere-egu26-23188, 2026.

EGU26-23248 | ECS | Posters on site | HS10.12

Assessing and projecting lake health in a changing world using a coupled physical–biogeochemical model: a case study of Windermere 

Yufei Xue, Eleanor Mackay, Xiangzhen Kong, Yiran Zhang, and Iestyn Woolway

Lake ecosystems are increasingly exposed to multiple stressors arising from the combined effects of climate change and human activities, leading to a range of lake health issues, including oxygen depletion, eutrophication, algal blooms, and even regime shifts. These interacting stressors complicate the diagnosis of lake health and underscore the need for integrative, process-based approaches that explicitly link physical and biogeochemical processes. In this study, we apply a process-based lake ecosystem model (GOTM-WET) to assess and project the ecosystem health of Windermere (South Basin) in the Lake District National Park, UK, a deep, dimictic lake with extensive long-term observations. The model integrates meteorological forcing with in situ measurements of water temperature and dissolved oxygen (DO) to explicitly resolve physical mixing, thermal stratification, and biogeochemical oxygen dynamics. Model calibration is conducted in a stepwise and hierarchical manner, first constraining physical processes and subsequently ecosystem processes, thereby ensuring a robust representation of the coupled physical–biogeochemical lake system. Using the well-calibrated model, we derive a suite of process-based lake health indicators that capture both physical and ecological dimensions of lake functioning. These include stratification characteristics, vertical mixing efficiency, and seasonal hypolimnetic DO depletion rates, which together reflect the capacity of the lake to sustain oxygenated habitats and maintain resilient biogeochemical cycles. Model results demonstrate that variations in physical mixing regimes exert a dominant control on deep-water oxygen dynamics, with important implications for ecosystem stability and habitat quality. By linking observable lake health indicators to underlying ecosystem processes, this study demonstrates the value of process-based modelling for comprehensive lake health assessment. Unlike purely empirical or index-based approaches, the GOTM–WET enables scenario-based simulations and mechanistic interpretation, providing a powerful tool for evaluating lake ecosystem responses under multiple stressors. The approach and evaluation framework developed here is transferable to other lake systems and offers a foundation for scaling lake health assessments from individual lakes to broader regional applications.

How to cite: Xue, Y., Mackay, E., Kong, X., Zhang, Y., and Woolway, I.: Assessing and projecting lake health in a changing world using a coupled physical–biogeochemical model: a case study of Windermere, EGU General Assembly 2026, Vienna, Austria, 3–8 May 2026, EGU26-23248, https://doi.org/10.5194/egusphere-egu26-23248, 2026.

HS11 – Short Courses of specific interest to Hydrological Sciences

HS12 – Inter- and transdisciplinary sessions (ITS) related to Hydrological Sciences

EGU26-1119 | ECS | Orals | ITS3.14/HS12.4

From Monitoring to Action: A New Sampling Strategy and Retention Modules for Plastics in Floodplains – Tested at the Vjosa River 

Pauline Seidel, Xhoen Gjashta, Möser Johannes, Selinger Sabrina, Beqiraj Sajmir, Schneider Danilo, Gano Clara Rosa, Cierjacks Arne, and Harre Kathrin

Plastic pollution in soils and floodplains is a critical but understudied issue, with scarce field data on abundance, transport and remediation. Rivers are key pathways transporting plastics of all sizes, yet long-term and large-scale monitoring data remain scarce. To preserve and restore the ecosystem services floodplains provide, they must be protected from plastic pollution and its negative consequences for humans and nature.

We conducted a large-scale monitoring campaign along the entire course of one of Europe’s last undammed rivers (Vjosa, Albania). Its course is little anthropogenically influenced and allows unique insights into macro- and microplastic hotspots in floodplain. At these hotspots, novel retention modules developed at the HTWD can be deployed as nature-based solution to prevent plastic pollution in floodplains.

We tested a novel transect-based sampling/monitoring approach for macro- and microplastics to gain insights on plastic transport and accumulation along the Vjosa River.  We considered vegetation succession zones and geomorphology, both representing flood dynamics. Data collection included vegetation species and distribution, high-resolution digital elevation models through photogrammetric drone flights to resolve floodplain topography and infer associated flood dynamics, macroplastic and sediment sampling for microplastic analysis. We analysed macroplastics with a portable FTIR as well as ATR-FTIR. We processed sediments with a validated in-house protocol consisting of density separation (CaCl2, density: 1.45 g/cm³), and Fenton oxidation to extract microplastics, followed by DSC (Differential Scanning Calorimetry) and TED-GC/MS (Thermal Extraction-Desorption GC/MS) for mass-based microplastic analysis. Preliminary results show macroplastic accumulation in floodplain depressions and the standing woody succession zones, likely liked to vegetation structure. We expect similar trends for microplastics and overall higher abundances from upstream to downstream, where sedimentation in general increases.

In parallel, we tested novel wooden retention modules (30x30x10 cm) as a nature-based solution filled with different substrates and vegetation densities of willows and grass species. Laboratory flooding experiments with microplastic spiked water (low-density polyethylene and polyamide, 500 – 800 µm) demonstrated polymer type-specific retentions with higher rates for PA (mean: 91.4 %) than LDPE (mean: 18.4 %). The vegetation density and diversity proved to be one of the major factors in retention efficiency. Therefore, the retention modules are a promising solution to minimize microplastic input in floodplain soils.

Our study delivers one of the first comprehensive datasets on plastic pollution in a near-natural European river system, integrating vegetation, geomorphology and high-resolution elevation models. By combining large-scale monitoring with mitigation testing, we advance reliable approaches to assess and reduce plastic pollution across the geosphere. This not only directly supports conservation and management of the Vjosa River National Park and UNESCO Biosphere Reserve, and contributes rare field data to the global database of plastic pollution, but also highlights the ecosystem services of natural floodplains in plastic pollution retention, fosters their preservation, and demonstrates pathways to substitute their functions through retention modules where they are degraded. In doing so, our approach provides a concrete, nature-based solution that can be scaled to other river systems, thereby contributing to tackling the global plastic crisis.

How to cite: Seidel, P., Gjashta, X., Johannes, M., Sabrina, S., Sajmir, B., Danilo, S., Clara Rosa, G., Arne, C., and Kathrin, H.: From Monitoring to Action: A New Sampling Strategy and Retention Modules for Plastics in Floodplains – Tested at the Vjosa River, EGU General Assembly 2026, Vienna, Austria, 3–8 May 2026, EGU26-1119, https://doi.org/10.5194/egusphere-egu26-1119, 2026.

The definition of assessment methods for determining the good environmental status of beaches with respect to marine litter is an essential requirement for the implementation of the European Marine Strategy Framework Directive. Government monitoring programmes, citizen-science initiatives, and the scientific community are generating large amounts of data on marine-litter abundance, particularly on macrolitter and especially on beaches. Interestingly, these litter counts are reported in a specific and detailed manner by item categories, enabling the exploration of potential pollution sources. However, most existing assessments rely on the total count of litter categories, without considering their heterogeneity or origin. This approach limits the development of effective, source-focused management strategies.

The present study introduces an assessment based on a set of seven indicators related to marine-litter sources, accounting for both the potential origins and size classes of different litter categories. We refer to this integrated approach as the Beach Litter Footprint. This multidimensional analysis leads a more comprehensive assessment, as it allows impacts to be weighted according to the typology and origin of the litter found at each location.
The applicability of the Beach Litter Footprint was examined through a large-scale analysis along the coastline of the Iberian Peninsula and its surrounding environment, namely the North African continent, the Azores, Madeira, and the Canary Islands in the Atlantic Ocean, and the Balearic Islands in the Mediterranean Sea. The choice of this region of interest (ROI) for the proof of concept was based on two factors. First, the availability of data in this area, especially from citizen-science activities; and second, the wide environmental diversity of the region, comprising two distinct water masses (the Atlantic Ocean and the Mediterranean Sea), two continents with relevant socioeconomic differences, abundant archipelagos, and major coastal cities and rivers.

The Beach Litter Footprint clearly identified contamination hotspots and well-preserved areas, revealing previously unreported patterns regarding the origin and distribution of litter at both local and regional scales. Our analysis also highlighted the remarkable value of citizen science for this type of assessment. The Beach Litter Footprint provides a comprehensive and easily replicable diagnostic tool based on routine beach-litter monitoring data. Unlike other indicators, it provides a detailed view of both the mass and the origin of beach-litter pollution, helping decision-makers to design source-targeted mitigation strategies.

How to cite: Ceballo, J. and Cozar, A.: A Methodological Framework for Defining Beach Litter Footprints: Application in the Iberian Peninsula, Macaronesia, and the Balearic Islands, EGU General Assembly 2026, Vienna, Austria, 3–8 May 2026, EGU26-1193, https://doi.org/10.5194/egusphere-egu26-1193, 2026.

EGU26-1258 | ECS | Posters on site | ITS3.14/HS12.4

Optimisation of Small Microplastic Extraction and Quantification from Marine Tissues 

Mary Carolin Kurisingal Cleetus, Ludovico Pontoni, Massimiliano Fabbricino, and Annamaria Locascio

Microplastics are plastic particles that are generally explained as being between 1μm and 5mm. They can be manufactured as micron-sized which are the primary microplastics, and can be formed by the breakdown of macroplastics, which are the secondary microplastics. Once in the marine environment, they are readily available for organisms to consume and accumulate. To date, they are identified from the water column, sediments, and marine biota. Despite the dramatic increase in microplastic studies observed in the last decades, their extraction and quantification from marine organisms remain hindered by several factors, including the lack of standardised protocols and technical limitations, especially for extracting microplastics smaller than 5 μm. 

This work addresses key methodological gaps identified through a comprehensive review of existing studies that aimed to develop or optimise methods for microplastics extraction. We optimised key experimental parameters from existing extraction protocols to achieve complete digestion of the target tissue and efficient recovery of 1 µm microplastics, using Mytilus galloprovincialis as the model organism. Specifically, we refined the tissue-to-reagent ratio to ensure thorough digestion, followed by filtration and microplastic quantification using scanning electron microscopy. We also evaluated the addition of a catalyst during the chemical digestion phase, which improved digestion efficiency. Our results also highlight a tissue-specific digestion for the tested digestion agents. Preliminary results have shown promising recovery rates of microplastics. Its outcome will implement the plan outlined in the Marine Strategy Framework Directive 2008/56 by developing innovative solutions, such as enhanced analytical methods and technologies for detecting and measuring microplastics in biological tissues and the marine environment, to facilitate effective sea monitoring.

How to cite: Kurisingal Cleetus, M. C., Pontoni, L., Fabbricino, M., and Locascio, A.: Optimisation of Small Microplastic Extraction and Quantification from Marine Tissues, EGU General Assembly 2026, Vienna, Austria, 3–8 May 2026, EGU26-1258, https://doi.org/10.5194/egusphere-egu26-1258, 2026.

EGU26-1748 | ECS | Posters on site | ITS3.14/HS12.4

Understanding acoustic backscatters from underwater plastic items in controlled and semi-controlled environments 

Naddi Liese, Tim H.M. van Emmerik, Kryss Waldschläger, Maeve Daugharty, Nick Wallerstein, Paul Vriend, Thomas Mani, Frans Buschman, and Ton Hoitink

The ever-increasing production of plastics, including single use items, has led to enormous amounts of pollution, threatening ecosystems, livelihoods, safety and human health. Rivers are important pathways for transporting plastic waste to the oceans.

Recent studies show that a substantial proportion of plastics is transported and retained below the water surface. Despite advances in monitoring technologies, current approaches focus mainly on counting or removing floating and deposited plastics, using visual counts, citizen science, drones, cameras, or GPS trackers. Leading to costly, labor-intensive, and environmentally invasive work.

Quantifying the full plastic transport behavior in the water column remains challenging, resulting in a lack of information on cross-sectional plastic flux. Our project aims to detect underwater riverine macroplastic pollution (>5 mm) using a multifrequency Acoustic Doppler Current Profiler (ADCP). While acoustic measurements show promise for plastic detection (Boon et al., 2023), a comprehensive understanding of how backscatter varies with item characteristics (size, shape, composition, and orientation) under different environmental conditions is still missing.

In this poster presentation, we will discuss the first results of using an echo sounder to detect plastics (PET, PP, PS) and other materials (e.g. paper, organic material and aluminum) in controlled and semi-controlled environments. We will present the first backscatter signatures from different polymer types and outline future approaches.

We anticipate that our results have the potential to provide continuous and cross-sectional estimates of underwater plastic transport in rivers. By providing insights into the impact of plastic pollution interventions and enabling accurate identification of underwater plastic behavior, this approach could support more effective mitigation and remediation efforts.

How to cite: Liese, N., van Emmerik, T. H. M., Waldschläger, K., Daugharty, M., Wallerstein, N., Vriend, P., Mani, T., Buschman, F., and Hoitink, T.: Understanding acoustic backscatters from underwater plastic items in controlled and semi-controlled environments, EGU General Assembly 2026, Vienna, Austria, 3–8 May 2026, EGU26-1748, https://doi.org/10.5194/egusphere-egu26-1748, 2026.

EGU26-1899 | ECS | Posters on site | ITS3.14/HS12.4

Exploring plastic detectability on riverbanks using remote sensing 

Milou Maathuis, Marc Rußwurm, Mathias Bochow, and Tim van Emmerik

Plastic pollution is an emerging environmental challenge, threatening terrestrial, freshwater and marine ecosystems. Rivers are major pathways and storage systems, and large-scale plastic monitoring is necessary to effectively reduce plastic pollution. This presentation is about a study in which the detectability of plastics on riverbanks is investigated across spatial scales, ranging from in-situ hand-held spectrometers to large-scale satellites. We designed an experiment using two artificial plastic targets placed on the riverbanks of the Nederrijn, the Netherlands. The first target was a white polyester sheet of four different sizes (0.5x30 m2, 1x30 m2, 2x30 m2, 3x30 m2), and the second target consisted of transparent PET bottles with two different sizes and surface concentrations (3x30 m2 with 4 items/m2, 15x30 m2 with 8 items/m2). Data were collected with several sensors, covering a range of spatial, spectral, and temporal resolutions: the ASD Handheld 2 Spectroradiometer, the MAIA S2 multispectral camera, Sentinel-2, PlanetScope SuperDove, and EnMAP. We analyzed the reflectance spectra, developed a new index (SI-13), and applied a Naïve Bayes detection model to test the detectability of the plastic targets. Sentinel-2 images were successfully used to detect the three largest polyester targets. The PET targets were however not detected. In addition, we found high correlations (-0.93) between polyester target size and several spectral indices. Our results suggest that plastic detection satellite remote sensing is limited by both spatial resolution and plastic concentration. This paper serves as a proof of concept to show that plastic detection in riverbank environments using satellite and camera imagery is feasible and should be investigated further.

How to cite: Maathuis, M., Rußwurm, M., Bochow, M., and van Emmerik, T.: Exploring plastic detectability on riverbanks using remote sensing, EGU General Assembly 2026, Vienna, Austria, 3–8 May 2026, EGU26-1899, https://doi.org/10.5194/egusphere-egu26-1899, 2026.

EGU26-3849 | ECS | Posters on site | ITS3.14/HS12.4

Coastal landfills as sources of plastic and microplastic pollution: a multi-scale monitoring approach 

Victor Lieunard, Julien Bailleul, Sébastien Rohais, Maria-Fernanda Romero Sarmiento, Hélène Roussel, and Benjamin Rabaud

Plastic pollution monitoring remains challenging in complex and dynamic environments such as coastal landfills. These anthroposystems contain multiple plastic sources, transport pathways, and fragmentation processes that coexist and interact. Due to their proximity to the shoreline and their vulnerability to erosion, they represent a significant potential source of plastics and microplastics (MPs) into the environment. However, this environmental compartment is often overlooked and understudied in terms of its role in releasing plastics and MPs. While substantial research focuses on plastic transport and presence in marine environments, few studies consider nearshore landfills as a source of plastics and MPs. Moreover, the similarities between sediment and plastic transport processes have been little investigated. The same applies to the relationship between coastal cliff erosion and the fragmentation of plastics into MPs.

This study proposes a multi-scale analytical approach combined with field-based observations. To this end, macroplastic exports were monitored using an adapted OSPAR protocol, which enabled the identification, quantification, and temporal tracking of plastic debris from coastal landfills and other sources. MP contamination in sediments was investigated using a combined approach of micro-Fourier Transform Infrared Spectroscopy (µ-FTIR) and the thermal Rock-Eval® method. The integration of these methods allows for precise polymer identification and abundance measurement via µ-FTIR, alongside mass-based quantification with the Rock-Eval® device. Those approaches were applied to two contrasting coastal landfill sites: Dollemard (Normandy, France) and Sant’Agata (Calabria, Italy).

Results from macroplastic monitoring highlight spatial variations in the origins of macroplastics around both coastal landfill sites. Along transects located in the direct axis of the landfills, landfill discharge represents, on average, ~65% of the collected items, confirming these sites as active local sources of plastic pollution. In contrast, transects outside the landfill axis display highly variable compositions. At the Dollemard site, for transects downstream of the longshore drift, ~75% of plastics are attributed to beached marine litter. Additionally, across all transects, approximately 25% of the collected plastics consist of highly fragmented debris whose precise origin is difficult to determine. Furthermore, temporal variations in plastic abundance and origin were observed across all transects, reflecting the influence of storm events and short-term remobilization processes. Field observations also highlight the role of cliff erosion, gravity-driven processes, and sediment remobilization in controlling the release, transport, and fragmentation of plastics from macro- to MPs.  Sediment analysis reveals high levels of plastic impregnation in both coastal landfill deposits, with MP abundances reaching up to 24,816 MPs/kg for Dollemard and 110,970 MPs/kg for Sant’Agatha. Estimations of mass-concentrations were also made using µ-FTIR and compared with Rock Eval® analysis results. These comparisons show a significant disparity in results depending on the MP abundance and nature of each sample.

Consequently, this study tries to demonstrate that coastal landfills should be considered key monitoring targets for plastic pollution across the geosphere. With the multi-scale proposed approaches, long-term monitoring strategies could be implemented to better understand plastic fluxes from coastal landfills and from other sources.

How to cite: Lieunard, V., Bailleul, J., Rohais, S., Romero Sarmiento, M.-F., Roussel, H., and Rabaud, B.: Coastal landfills as sources of plastic and microplastic pollution: a multi-scale monitoring approach, EGU General Assembly 2026, Vienna, Austria, 3–8 May 2026, EGU26-3849, https://doi.org/10.5194/egusphere-egu26-3849, 2026.

EGU26-5679 | ECS | Orals | ITS3.14/HS12.4

Reducing measurement error in riverbank litter sampling 

Paul Vriend, Martina Vijver, Willem van Loon, Frank Collas, Sylvia Drok, Nadieh Kamp, and Thijs Bosker

Rivers play a key role in the global distribution of anthropogenic litter. Accurate and reliable monitoring data are essential to design effective litter reduction and mitigation strategies. One common approach used to monitor macro- and mesolitter (>0.5 cm) in rivers is through visual riverbank litter sampling, in which observers manually collect, count and categorize items deposited on riverbanks. While monitoring efforts are scaling up to meet growing demand for data, it is key to quantify and understand uncertainties in these data, as these insights can be used to design improved monitoring strategies. Such quantitative analysis has not yet been undertaken for visual riverbank litter sampling methods to date.

We conducted a series of experiments to quantify the measurement error of visual riverbank litter sampling. Our findings demonstrate that inter-observer variability can be substantial with a mean coefficient of variation of 22.4%. Statistical analysis indicates no significant effect of the assessed litter concentration, total item count, or sampling area size. In contrast, we did find that both size and colour significantly affect the item detectability by observers. Smaller items, especially those that are transparent or black, showed substantially lower recovery rates (below 50% for items <2.5 cm). Furthermore, we show that repeated observations of the same sampling area can significantly reduce uncertainty, with the largest improvement occurring with an increase from one to two observers (mean recovery rates increasing from 67.4% to 86.5%).

These findings reveal that measurement error is a key factor to be considered in visual riverbank litter sampling, especially for items smaller than 2.5 cm. Based on our results, we suggest two ways to reduce these uncertainties and improve reliability in monitoring protocols: 1) to observe the sampling area twice, and 2) to mitigate the lower recovery rates for smaller items through adding a step to the protocol with a more detailed measurement, or by correcting for the lower recovery rates during post processing. Incorporating these suggestions can contribute to reducing measurement error, improving long-term litter assessments and enhancing evidence-based decision-making in litter pollution management.

How to cite: Vriend, P., Vijver, M., van Loon, W., Collas, F., Drok, S., Kamp, N., and Bosker, T.: Reducing measurement error in riverbank litter sampling, EGU General Assembly 2026, Vienna, Austria, 3–8 May 2026, EGU26-5679, https://doi.org/10.5194/egusphere-egu26-5679, 2026.

EGU26-7641 | Posters on site | ITS3.14/HS12.4

Comparing apples and oranges: Using the MPsizeBase and power law size distribution to extrapolate and inter-compare microplastic concentrations 

Jeroen Sonke, Theo Segur, Ian Hough, Nela Dobiasova, Didier Voisin, Camille Richon, Jennie Thomas, and Helene Angot

Studies reporting environmental MP concentration rarely cover the full MP size range of 1 to 5000 µm due to sampling and analytical limitations. However, microplastic (MP) number concentration in the environment increases exponentially with decreasing particle size. This leads to difficulties in the intercomparison of studies, which is critical for environmental and human health risk assessment. Indeed, for the same MP sample, a study observing the small MP fraction (1-300 µm for ex.) will report a higher number concentration than another study observing the large MP fraction (300-5000 µm) of the same sample.

In this presentation, we summarize the current understanding of the MP particle size distribution (PSD), based on the power law model (Segur et al., 2025). We confront the power law model with 90 published MP PSD observations from the literature, compiled in the new MPsizeBase open access database (Sonke et al., 2025). We show that the MP PSD power law slope is influenced by particle shape (fragments, fibers), but does not vary significantly between environmental compartment studied (surface ocean, deep ocean and atmosphere).

We propose simple equations to extrapolate MP concentrations for the limited observed size range to the full MP size range (1 to 5000 µm), or any other sub-size range, for both MP number and mass concentrations. By comparting the observed MP concentrations to the corrected full size range MP concentration, we show that the 90 published studies underestimated MP number concentrations.

The MP number PSD is dominated by small fragments: in the surface ocean, we estimate that 70% of MP particles have a diameter between 1 and 2 µm. Conversely, we also show that the MP mass PSD is dominated by large particles and estimate that, for surface ocean MP, common plankton nets (mesh size 300 - 330 µm) only catch 0.003% of all MP particles (in number), but 94% of MP mass. This indicates the need to express results both in term of numeric and mass concentration. To do so, we provide simple equations to convert a numeric PSD to mass PSD.  

References

Segur, T., Hough, I., Dobiasova, N., Voisin, D., Richon, C., Angot, H., Thomas, J. L., and Sonke, J. E.: Using the power law size distribution to extrapolate and compare microplastic number and mass concentrations in environmental media, Research Square preprint, https://www.researchsquare.com/article/rs-8524083/v1, 2025.

Sonke, J. E., Segur, T., Hough, I., Dobiasova, N., Voisin, D., Yakovenko, N., Margenat, H., Hagelskjaer, O., Abbasi, S., Bucci, S., Richon, C., Angot, H., Thomas, J. L., and Le Roux, G.: MPsizeBase: a database for particle size distributed environmental microplastic data, EarthArXiv, preprint, https://eartharxiv.org/repository/view/10605/, 2025.

How to cite: Sonke, J., Segur, T., Hough, I., Dobiasova, N., Voisin, D., Richon, C., Thomas, J., and Angot, H.: Comparing apples and oranges: Using the MPsizeBase and power law size distribution to extrapolate and inter-compare microplastic concentrations, EGU General Assembly 2026, Vienna, Austria, 3–8 May 2026, EGU26-7641, https://doi.org/10.5194/egusphere-egu26-7641, 2026.

EGU26-8130 | ECS | Orals | ITS3.14/HS12.4

Size- and Polymer-Specific Assessment of Micro- and Nanoplastics in a European Wastewater Treatment System 

Neha Parashar, Daniel Kolb, Jennifer Heinle, and Dušan Materić

The unchecked littering and mismanagement of plastics, coupled with their rising production and usage, have escalated them into one of the most pressing environmental pollutants. Among them, microplastics (<5 mm) and nanoplastics (<1 µm) have emerged as critical contaminants, with micro-and nanoplastics (MNPs) posing the greatest risks due to their ability to penetrate and contaminate water sources. While MPs are globally found to contaminate every freshwater ecosystem, it is reasonable to expect NPs to be similarly widespread as a result of MPs degradation with impacts still unknown. Importantly, land-based sources (wastewater systems) release MNPs into rivers ultimately contribute to the growing plastic pollution load in oceans, linking inland sources directly to marine contamination. Globally, numerous studies have examined the abundance, pathways, and removal efficiencies of MPs in wastewater treatment plants (WWTPs); however, systematic assessments of NPs remain scarce. Despite growing awareness of plastic pollution in European aquatic environments, size- and polymer-resolved data on MNPs in wastewater treatment systems and their subsequent release into receiving rivers remain scarce. To address this knowledge gap, the present study investigated the occurrence, size distribution, and polymer composition of MNPs across different treatment stages of a WWTP. Raw influent and treated effluent samples were collected from multiple treatment units and analysed using thermal desorption–proton transfer reaction–mass spectrometry (TD-PTR-MS). MNPs digestion and extraction followed a validated cascade filtration protocol employing membranes with pore sizes of 2700 nm (glass fibre), 1200 nm (silver), 200 nm (Anodisc), and 20 nm (Anodisc), enabling size-resolved characterization from the micro- to nanoscale. A diverse range of polymer types was detected, including polystyrene (PS), polyethylene (PE), polypropylene (PP), and polyvinyl chloride (PVC), with tyre wear particles representing a notable non-conventional plastic fraction. To minimize potential contamination during field sampling and laboratory analyses, appropriate field, procedural, and system blanks were included. Significant variations in polymer composition and size classes were observed across treatment stages, allowing quantification of treatment-specific, size fraction, and polymer-specific MNPs removal efficiencies of the studied WWTP. This study provides a comprehensive dataset of MNPs accumulation within a European wastewater treatment system and their subsequent discharge into receiving aquatic environments.

How to cite: Parashar, N., Kolb, D., Heinle, J., and Materić, D.: Size- and Polymer-Specific Assessment of Micro- and Nanoplastics in a European Wastewater Treatment System, EGU General Assembly 2026, Vienna, Austria, 3–8 May 2026, EGU26-8130, https://doi.org/10.5194/egusphere-egu26-8130, 2026.

EGU26-8285 | ECS | Orals | ITS3.14/HS12.4

Vision-Language Models for Floating Litter Detection 

Chuyue Zhang, Tianlong Jia, Mário J. Franca, James Lofty, Daniel Rebai, and Uwe Ehret

Deep learning-based computer vision methods are widely used to detect and quantify floating macroplastic litter in rivers, enabling accurate assessments of plastic pollution by automatically processing images and videos. However, these methods typically rely on large amounts of annotated data for supervised learning (SL), and the manual labeling work is costly and time-consuming. This hinders broad model generalization, a key requirement for robust computer vision systems for long-term and large-scale litter monitoring.

To overcome this challenge, we propose a Vision-Language Model (VLM)-based method for detecting floating litter, without labeled images for model training. Recent advances in Generative AI, particularly VLMs, have revolutionized artificial intelligence by enabling rich semantic understanding across modalities. Pre-trained on millions to billions of image-text pairs, VLMs effectively learn visual representations from the natural language supervision, thereby enabling robust cross-modal understanding and generalization. This broad pre-training also allows VLMs to achieve remarkable zero-shot generalization performances in many domain-specific applications, even without domain-specific labeled images for SL.

We demonstrate the effectiveness of our methodology using multiple VLMs (e.g., DeepSeek-VL2 and OpenCLIP) on images collected from canals and waterways in the Netherlands and South East Asia. We conduct a comprehensive comparison with conventional SL approaches using multiple deep learning architectures (e.g., Vision Transformer, ResNet, and DenseNet). The results indicate that our method achieves robust zero-shot generalization performance.

Based on these results, we suggest stakeholders (e.g., researchers, consultants and governmental organizations) to consider VLM-based methods to develop robust systems for targeted long-term floating litter monitoring, while minimizing the cost of collecting labeled data.

How to cite: Zhang, C., Jia, T., J. Franca, M., Lofty, J., Rebai, D., and Ehret, U.: Vision-Language Models for Floating Litter Detection, EGU General Assembly 2026, Vienna, Austria, 3–8 May 2026, EGU26-8285, https://doi.org/10.5194/egusphere-egu26-8285, 2026.

Microplastics (MPs) are widely recognized as emerging contaminants that threaten aquatic ecosystems and human health. Stormwater runoff serves as a major transport pathway, mobilizing MPs accumulated on urban surfaces into receiving waters; however, quantitative information on rainfall-driven MP mobilization remains limited.

This study quantified the emission characteristics and loads of MPs discharged during a 14-mm rainfall event at Samhocheon, a coastal urban creek connected to Masan Bay, South Korea.

Time-weighted stormwater sampling was conducted, and mass-based MP concentrations were determined using pyrolysis–gas chromatography/mass spectrometry (Py-GC/MS) following organic matter removal and density separation. The baseline MP concentration prior to rainfall was 6.13 μg/L. Concentrations increased sharply during the initial runoff phase, peaking approximately 1.5 hours after runoff onset, and gradually declined with decreasing rainfall intensity. The event mean concentration (EMC) was 11.93 μg/L. Polypropylene, polyethylene, and polyvinyl chloride were the dominant polymers, accounting for 60–80% of MPs.

Tire wear particles (TWPs), quantified using styrene–butadiene rubber as a proxy, contributed 20–68% of the total MP load. The total MP (>20 μm) load discharged to Masan Bay during the event was 100.3 g based on Py-GC/MS data, with 84% (84.5 g) mobilized during the first 20% of the runoff duration. This estimate was comparable to the FTIR-based load (62.32 g) calculated from particle dimensions.

Overall, the findings demonstrate the utility of Py-GC/MS as a complementary technique to FTIR for MP monitoring and highlight early-stage stormwater runoff as a critical period for MP mobilization. These results emphasize the need for targeted urban watershed management strategies to reduce MP emissions to aquatic environments.

How to cite: Ha, S. Y., Cho, Y., Han, G. M., and Hong, S. H.: Quantifying Microplastic Loads from Urban Stormwater Runoff Using Pyrolysis-GC/MS: Insights from a Coastal Creek in South Korea, EGU General Assembly 2026, Vienna, Austria, 3–8 May 2026, EGU26-8471, https://doi.org/10.5194/egusphere-egu26-8471, 2026.

EGU26-10445 | Orals | ITS3.14/HS12.4

Floating Macrolitter Monitoring: From initial harmonization to a Global Reporting Tool 

Daniel González-Fernández, Luis F. Ruiz-Orejón, and Georg Hanke

Quantifying floating macrolitter in rivers and seas contributes to designing effective mitigation strategies and evaluating environmental policies. This field has undergone a significant transformation over the last years, transitioning from fragmented local studies to large scale harmonized monitoring. This evolution is rooted in the first systematic effort to quantify riverine litter inputs, which established visual observation and the use of a mobile App as a robust and accessible method (González-Fernández & Hanke, 2017).

Building upon these foundations, the monitoring landscape has been further refined through scientific publications and the development of European and international guidelines. Such guidelines provide the scientific and methodological basis to ensure that data collected across different regions and basins are comparable and representative. Here we review data available in the literature and the use of the existing guidelines at global level.

In 2025, the European Commission has launched the new JRC Floating Litter Monitoring App. This digital tool integrates the official Joint List of Litter Categories and allows for real-time, geo-referenced data acquisition in both riverine and marine environments. Beyond its technical capabilities, the app is designed to be an effective tool for facilitating standardized reporting and data management. By bridging the gap between field observations and global databases, it enables a consistent evaluation of pollution levels at a global scale. This presentation will highlight how the integration of harmonized protocols and user-friendly technology can empower a global network of observers, providing the reliable data needed to support international environmental regulations and the fight against plastic pollution.

How to cite: González-Fernández, D., Ruiz-Orejón, L. F., and Hanke, G.: Floating Macrolitter Monitoring: From initial harmonization to a Global Reporting Tool, EGU General Assembly 2026, Vienna, Austria, 3–8 May 2026, EGU26-10445, https://doi.org/10.5194/egusphere-egu26-10445, 2026.

EGU26-15138 | ECS | Posters on site | ITS3.14/HS12.4

Quantifying Tourism-Derived Litter Accumulation on a Southern California Pocket Beach Using Citizen Science 

Matthew Brand, Matthew Weirich, Hannah Rothman, and Gloria Harwood

Coastal plastic pollution monitoring efforts are frequently focused on riverine and offshore inputs and production. While these inputs are the majority of plastics to the coastal environment in many regions, Mediterranean regions with limited precipitation and relatively small, undisturbed watersheds may have limited fluvial inputs of plastics. However, the beaches of these regions are heavily utilized by the tourism industry, and littering due to beach visitation is an understudied, but potentially significant source of plastic pollution.

In this study, we document a citizen-science led effort to quantify tourism-derived litter production on a pocket beach in a Mediterranean environment, Laguna Beach, California. This study trained community volunteers consisting of concerned citizens + local high school students in litter sampling and categorization. Field surveys from the summer of 2025 found over 1,300 items of trash, including 700 plastics, on a 100x20 meter pocket beach. We then tested the effectiveness of enhanced signage as an policy intervention for reducing tourism derived litter. Statistical analysis found no difference between trash loading pre vs post enhanced signage.

Further analysis of the data found that a significant amount of trash production occurred during just a few holiday weekends. Future work will test a range of policy interventions from enhanced ranger patrols, to offering free parking to visitors who collect trash. 

How to cite: Brand, M., Weirich, M., Rothman, H., and Harwood, G.: Quantifying Tourism-Derived Litter Accumulation on a Southern California Pocket Beach Using Citizen Science, EGU General Assembly 2026, Vienna, Austria, 3–8 May 2026, EGU26-15138, https://doi.org/10.5194/egusphere-egu26-15138, 2026.

EGU26-16067 | Posters on site | ITS3.14/HS12.4

Evaluating the Applicability of RiSIM for AI-Based River Plastic Monitoring to an urban river in Indonesia 

Kenji Sasaki, Tomoya Kataoka, Muhammad Reza Cordova, Daisuke Aoki, and Shino Tetsusaki

Monitoring floating plastic transport in rivers is essential for quantifying plastic flux and guiding pollution mitigation strategies. While traditional approaches relied on manual collection or visual observation, recent advancements have increasingly adopted image-based methods that integrate deep learning with remote sensing technologies, including satellite imagery, UAVs, and fixed-point cameras. Although visual observation remains widely used for global-scale assessment, it is constrained by high labor demands, observer subjectivity, and safety risks during flood events.

To address these limitations, Kataoka et al. (2025) developed RiSIM (River Surface Image Monitoring software), which utilizes fixed river cameras and deep learning models for plastic detection, classification, and object tracking for floating debris. RiSIM demonstrated high reliability in Japanese river systems (r = 0.91 for quantity; r = 0.80 for mass). However, its performance has so far been evaluated exclusively within Japan.

As described in Kataoka et al. (2025), a cloud-based monitoring platform, PRIMOS, has been released to facilitate the application of RiSIM. Operating through a standard web browser with server-side computation, PRIMOS eliminates technical barriers such as local environment setup and high-performance hardware requirements. By integrating the fine-tuning capabilities examined in this study, the platform aims to support researchers and monitoring projects in conducting plastic transport analyses across diverse river systems worldwide.

This study evaluates the global applicability of RiSIM using nadir-view video data collected from Saluran Cideng (a tributary of Kali Cideng) in Jakarta, Indonesia—a first step toward assessing its transferability to Southeast Asian rivers. Using the PRIMOS platform, we evaluate the detection performance of the AI model integrated into RiSIM at Saluran Cideng. Furthermore, we examine methodology for fine-tuning and retraining to enhance the system's applicability to the local environment. The broader applicability of the framework and practical considerations for deployment will be discussed.

The monitoring data for this RiSIM evaluation was collected under the “Project on Inventory Development Methodology for a Plastic Leakage into the Environment, Including the Marine Environment”, commissioned by the Ministry of the Environment, Japan.

How to cite: Sasaki, K., Kataoka, T., Cordova, M. R., Aoki, D., and Tetsusaki, S.: Evaluating the Applicability of RiSIM for AI-Based River Plastic Monitoring to an urban river in Indonesia, EGU General Assembly 2026, Vienna, Austria, 3–8 May 2026, EGU26-16067, https://doi.org/10.5194/egusphere-egu26-16067, 2026.

EGU26-16904 | ECS | Posters on site | ITS3.14/HS12.4

Composting of anaerobically treated bioplastic-containing organic waste: behavior of polylactic acid (PLA) and poly(butylene 2,5-furanoate) (PBF) and quality of final compost 

Nicolò Montegiove, Nadia Lotti, Debora Puglia, Roberto Maria Pellegrino, and Daniela Pezzolla

The increasing use of bioplastics in food packaging and consumer goods requires a clear understanding of their fate within real waste management systems in order to avoid environmental pollution. This study investigated the composting process of digestates obtained from the anaerobic digestion (AD) of polylactic acid (PLA) and poly(butylene 2,5-furanoate) (PBF) co-treated with the organic fraction of municipal solid waste (OFMSW), focusing on polymer transformation, compost quality, and environmental implications. After mesophilic AD, the residual digestates containing degraded PLA and nearly intact PBF fragments were subjected to controlled aerobic composting for 90 days under simulated full-scale conditions. Temperature and aeration were monitored to ensure the proper succession of mesophilic, thermophilic, cooling, and maturation phases. The resulting composts were characterized for physicochemical parameters, including C/N ratio, total organic C, total Kjeldahl N, NH4+-N, water-extractable organic C (WEOC), and water-extractable N (WEN), while residual polymer fragments were examined using FTIR-ATR spectroscopy and optical microscopy. Germination tests were performed to assess phytotoxicity and agronomic suitability. Results showed that the sequential AD-composting process ensured complete mineralization of PLA, with no detectable residues already at the end of the AD stage. The compost derived from PLA-containing digestate exhibited stable organic matter, showing a C/N ratio of about 22, a WEOC/WEN ratio around 10, and low NH4+-N. Conversely, PBF displayed strong recalcitrance, persisting as visible fragments even after composting. FTIR-ATR analysis revealed only minor surface modifications, suggesting that aerobic treatment did not significantly alter the polymer's molecular structure. Nevertheless, the compost obtained from the PBF-containing digestate showed good stabilization, displaying a C/N ratio of approximately 21, a WEOC/WEN ratio of about 10, along with limited NH4+-N content. Germination assays revealed noticeable phytotoxicity at compost concentrations above 25%, whereas at 25% dilution the germination index reached 73% and 57% for the PLA- and PBF-derived composts, respectively. These results indicate that composts from PLA-containing digestates may be suitable for agricultural application after adequate dilution or blending with mature compost, whereas those derived from PBF require careful management due to the persistence of undegraded residues. From a sustainability perspective, the integrated AD-composting approach supports energy recovery from OFMSW while generating partially stabilized composts. However, the resistance of PBF to both anaerobic and aerobic degradation highlights the need for polymer redesign or tailored end-of-life strategies to prevent long-term environmental accumulation. Overall, this study underscores the value of combining physicochemical and agronomic evaluations to accurately assess the biodegradability and environmental fate of emerging bioplastics within circular organic waste management systems.


This work has been funded by the European Union – NextGenerationEU under the Italian Ministry of University and Research (MUR) National Innovation Ecosystem grant ECS00000041 - VITALITY - CUP J97G22000170005.

How to cite: Montegiove, N., Lotti, N., Puglia, D., Pellegrino, R. M., and Pezzolla, D.: Composting of anaerobically treated bioplastic-containing organic waste: behavior of polylactic acid (PLA) and poly(butylene 2,5-furanoate) (PBF) and quality of final compost, EGU General Assembly 2026, Vienna, Austria, 3–8 May 2026, EGU26-16904, https://doi.org/10.5194/egusphere-egu26-16904, 2026.

EGU26-17738 | Posters on site | ITS3.14/HS12.4

Nanoplastics in Loch Ness and surrounding rivers and channels 

Dušan Materić, Mike Peacock, and Stuart Gibb

Nanoplastics (NPs) are an emerging class of pollutants that remain challenging to accurately quantify in environmental matrices. Increasing evidence suggests their potential for long-range atmospheric and aquatic transport, contributing to their global distribution [1,2]. Understanding NP occurrence in remote environments is therefore essential for identifying sources, transport pathways, and baseline background levels.

In this study, we analyzed water samples from Loch Ness and surrounding rivers and channels in the Scottish Highlands to assess the presence and composition of nanoplastics using Thermal Desorption – Proton Transfer Reaction – Mass Spectrometry (TD-PTR-MS) [3]. This represents one of the first reports of nanoplastics in UK inland waters.

The dominant polymer types detected were polyethylene terephthalate (PET), polyethylene (PE), and tire-wear particles (TWP). Nanoplastics were present even at depths exceeding 100 m in Loch Ness. Subsurface NP concentrations in lakes were influenced by the proximity of local sources, while among the rivers, the Ness River showed the highest levels near urban areas, with some tributaries exhibiting no detectable NPs.

Spatial patterns suggest a mix of local and long-range inputs. Elevated NP concentrations near populated and industrial areas point to local emissions, while consistent background levels of PET across remote sites indicate atmospheric or diffuse sources. These findings demonstrate  nanoplastics to be pervasive even in isolated freshwater systems, and underline the need for integrated monitoring approaches to better understand their transport and fate.


References

[1]        D. Materić, M. Peacock, J. Dean, M. Futter, T. Maximov, F. Moldan, T. Röckmann, R. Holzinger, Presence of nanoplastics in rural and remote surface waters, Environ. Res. Lett. 17 (2022) 054036. https://doi.org/10.1088/1748-9326/ac68f7.

[2]        D. Allen, S. Allen, S. Abbasi, A. Baker, M. Bergmann, J. Brahney, T. Butler, R.A. Duce, S. Eckhardt, N. Evangeliou, T. Jickells, M. Kanakidou, P. Kershaw, P. Laj, J. Levermore, D. Li, P. Liss, K. Liu, N. Mahowald, P. Masque, D. Materić, A.G. Mayes, P. McGinnity, I. Osvath, K.A. Prather, J.M. Prospero, L.E. Revell, S.G. Sander, W.J. Shim, J. Slade, A. Stein, O. Tarasova, S. Wright, Microplastics and nanoplastics in the marine-atmosphere environment, Nat. Rev. Earth Environ. (2022) 1–13. https://doi.org/10.1038/s43017-022-00292-x.

[3]        D. Materić, A. Kasper-Giebl, D. Kau, M. Anten, M. Greilinger, E. Ludewig, E. van Sebille, T. Röckmann, R. Holzinger, Micro- and Nanoplastics in Alpine Snow: A New Method for Chemical Identification and (Semi)Quantification in the Nanogram Range, Environ. Sci. Technol. 54 (2020) 2353–2359. https://doi.org/10.1021/acs.est.9b07540.

How to cite: Materić, D., Peacock, M., and Gibb, S.: Nanoplastics in Loch Ness and surrounding rivers and channels, EGU General Assembly 2026, Vienna, Austria, 3–8 May 2026, EGU26-17738, https://doi.org/10.5194/egusphere-egu26-17738, 2026.

EGU26-19038 | Orals | ITS3.14/HS12.4

Isokinetic pump sampling – first application results and contribution of smallest microplastic fractions to riverine transport 

Marcel Liedermann, Elisabeth Mayerhofer, Michael Krapesch, Philipp Gmeiner, and Sebastian Pessenlehner

Building on the methodological development carried out within the “Alplast” project, a newly developed isokinetic pump was successfully applied in combination with established net-based sampling methodology at several riverine measurement sites. This integrated approach allows for a comprehensive assessment of microplastic transport across a wide range of particle sizes, including the finest fractions that cannot be captured by net-based methods.

The combined application of net sampling and isokinetic pump sampling has proven to be robust and operational under varying field conditions form small streams to large rivers. While net sampling continues to effectively target coarser microplastic particles and enables the filtration of large water volumes, the isokinetic pump has delivered reliable results for the smallest size fractions. First experiences with laboratory analysis and data evaluation indicate that these fine particles represent a significant proportion of the total microplastic mass, hence they contribute substantially to overall microplastic transport, also due to their high mobility and widespread spatial distribution within the flow. The isokinetic sampling principle ensured that flow conditions at the intake were representative of the ambient river velocity, thereby minimizing sampling bias and enabling direct weighting of transport across the cross-section. This proved especially advantageous for capturing the variability in microplastic concentrations while keeping the number of required samples manageable.

Overall, the results confirm that the combination of net-based sampling and pump sampling with the isokinetic pump significantly enhances the representativeness of microplastic transport assessments in rivers. The methodology provides a sound basis for future studies aiming to quantify the role of fine microplastic fractions and contribute to standardized monitoring approaches.

How to cite: Liedermann, M., Mayerhofer, E., Krapesch, M., Gmeiner, P., and Pessenlehner, S.: Isokinetic pump sampling – first application results and contribution of smallest microplastic fractions to riverine transport, EGU General Assembly 2026, Vienna, Austria, 3–8 May 2026, EGU26-19038, https://doi.org/10.5194/egusphere-egu26-19038, 2026.

This study is inspired by the Plastic Cup’s unique “bottle mail” collection, an extensive archive of marked bottles gathered over more than a decade of river cleanups. These personal messages, carried by rivers across years and borders, motivated us to rely on public engagement to better understand the dynamics of plastic pollution in freshwater systems. In response to this environmental challenge, our research combines citizen science, advanced tracking technologies, and long-term datasets to study both short- and long-term plastic bottle mobility in rivers of the Danube Basin. The bottle-tagging citizen science programme engages schools, NGOs, and local communities through a catch-and-release methodology. Following the long-standing tradition of the “message-in-a-bottle” approach, plastic bottles collected from the environment are fitted with unique identifiers then reintroduced into the wild. As of the submission of this abstract, 184 bottles have been tagged in 7 Danube countries, with 7 confirmed re-captures. To compensate for the inherent limitations of citizen science, a professional component was added to the methodology through GPS-based tracking. Plastic bottles equipped with GPS transmitters are deployed to monitor riverine transport in near real-time, enabling high-resolution mapping of movement and accumulation patterns over days and weeks. These datasets offer insights into flow-dependent transport, hydrological event impacts, and potential hotspot areas requiring intervention. Integrating citizen-generated and GPS-based data supports a more comprehensive understanding of short- versus long-term transport dynamics. As an ongoing initiative, data collection is not complete yet. Hereby we present partial results with the intention to inspire the scientific community as well as to increase participation in citizen science efforts while contributing to a multidimensional understanding of plastic transport in rivers. 

How to cite: Molnar, A. D. and Gyalai Korpos, M.: Messages in Bottles – Short and Long-Term Tracking of Plastic Bottles in Riverine Systems with a Multidisciplinary Approach, EGU General Assembly 2026, Vienna, Austria, 3–8 May 2026, EGU26-22014, https://doi.org/10.5194/egusphere-egu26-22014, 2026.

EGU26-22963 | ECS | Posters on site | ITS3.14/HS12.4 | Highlight

How Rivers Export Plastic: Insights from Three Contrasting Global Systems 

Thomas Mani, Ronja Ebner, Stijn Pinson, Ratchanon Piemjaiswang, Alexandra Marie Murray, Markus Svensson, Tim H.M. van Emmerik, Suchana Chavanich, Cristina Trois, Carlos Sanlley, and Laurent Lebreton

Rivers are key pathways for transporting plastic pollution to the ocean, yet global estimates of riverine plastic export remain highly uncertain due to catchment diversity and the complexity of transport processes. To better understand dynamics at the river–ocean interface, we analyzed a comparative dataset from three rivers in the Caribbean, Southern Africa, and Southeast Asia, each characterized by distinct hydrometeorological and tidal regimes. We tracked 196 GPS drifters and monitored surface transport using forty-one cameras deployed across six river locations over multiple seasons. These observations informed simulations of three years of plastic transport (2020–2022). We find that rivers flush 50% of their floating plastics downstream within only 7–12% of the time. Annual average mass fluxes for the three rivers were 34–98% lower than previously reported by global models. Our results highlight that rivers act as long-term sinks for plastic pollution, and that estuarine transport is more limited than often assumed. This study provides critical observational and modelling insights to refine river‑to‑ocean plastic flux estimates and emphasizes the heterogeneity of emission dynamics across diverse river systems.

How to cite: Mani, T., Ebner, R., Pinson, S., Piemjaiswang, R., Murray, A. M., Svensson, M., van Emmerik, T. H. M., Chavanich, S., Trois, C., Sanlley, C., and Lebreton, L.: How Rivers Export Plastic: Insights from Three Contrasting Global Systems, EGU General Assembly 2026, Vienna, Austria, 3–8 May 2026, EGU26-22963, https://doi.org/10.5194/egusphere-egu26-22963, 2026.

EGU26-23246 | ECS | Orals | ITS3.14/HS12.4

Mapping the Impact of River Plastic Interception Across River–Coast Systems 

Elena Novikova, Helen Wolter, Laurent Lebreton, and Thomas Mani

Rivers are major pathways for transporting land-based plastic pollution to the ocean, with much of this material accumulating along nearby coastlines. To address this issue, The Ocean Cleanup deploys river interception systems worldwide to halt plastics before they reach the sea. However, the extent to which river interception reduces coastal pollution has not yet been empirically demonstrated. In this study, we introduce a standardized impact‑mapping approach that integrates (i) baseline assessments of beached plastic composition, (ii) quarterly beach monitoring, and (iii) biannual characterization of intercepted riverine plastics following the deployment of interception technologies. Using the first year of data from two pilot locations – the Motagua River (Guatemala) and the Klang River (Malaysia) – we show that plastic composition exhibits substantial spatial and temporal variability in both riverine and coastal environments. Moreover, periods of elevated riverine plastic flux correspond to increased concentrations of beached plastics. Item‑level characteristics – including country of origin, age, and degradation state – provide additional insight into whether stranded plastics stem predominantly from local terrestrial inputs or from longer‑residence marine sources. As we expand this program to several further global locations, these results will support improved calibration of river‑to‑coast transport models and strengthen our ability to quantify and evaluate the coastal pollution impact of The Ocean Cleanup’s river interception technologies.

How to cite: Novikova, E., Wolter, H., Lebreton, L., and Mani, T.: Mapping the Impact of River Plastic Interception Across River–Coast Systems, EGU General Assembly 2026, Vienna, Austria, 3–8 May 2026, EGU26-23246, https://doi.org/10.5194/egusphere-egu26-23246, 2026.

EGU26-162 | Orals | ITS4.9/HS12.5

Harnessing Nature-Based Solutions for Industrial Wastewater Remediation: Optimizing Constructed Wetlands for Treating Oil Sands Wastewater 

Dani Degenhardt, Amy‐lynne Balaberda, Ian Vander Meulen, Jason Ahad, John Headley, and Joanne Parrott

The management of industrial wastewaters represents a global water quality challenge that requires sustainable, low-energy solutions capable of restoring ecological function while reducing contaminant loads. In Alberta, Canada, bitumen extraction from the Athabasca oil sands, one of the largest hydrocarbon reserves in the world, has generated over 1.4 billion m³ of liquid tailings and 400 million m³ of oil sands process-affected water (OSPW), currently stored in large on-site tailings ponds. OSPW exhibits acute and chronic toxicity to aquatic organisms and contains salts, metals, and complex organic contaminants, including naphthenic acids (NAs), a persistent and toxic group derived from bitumen extraction. Given the immense volume of OSPW requiring treatment, scalable and cost-effective remediation strategies are urgently needed. Constructed wetland treatment systems (CWTS) offer a promising, nature-based solution that harnesses plant–microbe–substrate interactions to degrade, transform, and sequester contaminants. Optimizing CWTS for OSPW treatment requires a detailed understanding of their functional mechanisms.

The Genomics Research for Optimization of Constructed Treatment Wetlands for Water Remediation (GROW) project is a multi-stakeholder collaboration among academia, government, and industry that advances both the scientific foundation and applied design of CWTS for OSPW remediation. Using mesocosm and pilot-scale wetland systems, the project integrates insights from molecular biology, wetland ecology, and engineering to elucidate treatment processes and enhance system performance. Here, we present results from a mesocosm-scale experiment evaluating the influence of plant species and system complexity on NA attenuation. Treatments included water-only (OSPW) controls, unplanted substrate systems, and planted systems with Carex aquatilis, Typha latifolia, or a combination of both plants, enabling isolation of plant-mediated, microbial, and abiotic processes. All planted mesocosms showed high survival and robust growth, achieving 46-48% NA removal over 87 days, compared to 19% in unplanted and 6% in water-only controls. Isotopic analyses confirmed preferential removal of bitumen-derived NAs and indicated active biological and biogeochemical processing. Fathead minnow embryo assays generally corroborated chemical analyses, showing the highest toxicity reduction in planted treatments, though some decreases occurred in water-only systems despite the insignificant NA removal. 

These results provide a holistic view of CWTS function, integrating plant physiology, chemical fate, isotopic evidence, and ecotoxicology. The findings demonstrate the potential of CWTS to substantially reduce OSPW toxicity and inform design and management strategies. Beyond efficacy, the GROW project establishes a framework for integrating nature-based solutions to address large-scale water quality challenges. The principles and tools developed have broad applicability to other industrial and municipal wastewater contexts, supporting sustainable water management worldwide.

How to cite: Degenhardt, D., Balaberda, A., Vander Meulen, I., Ahad, J., Headley, J., and Parrott, J.: Harnessing Nature-Based Solutions for Industrial Wastewater Remediation: Optimizing Constructed Wetlands for Treating Oil Sands Wastewater, EGU General Assembly 2026, Vienna, Austria, 3–8 May 2026, EGU26-162, https://doi.org/10.5194/egusphere-egu26-162, 2026.

EGU26-553 | ECS | Posters on site | ITS4.9/HS12.5

Evaluating Natural Flood Management Effectiveness Across Fast-Responding Catchments Using High-Resolution Monitoring 

Mehdi Bagheri Gavkosh, Alan Puttock, Diego Panici, Gale Alexander, and Richard E. Brazier

Flooding remains the most frequent and damaging natural hazard globally, causing significant loss of life and socio-economic disruption each year. In response, flood risk management policies have increasingly embraced nature-based solutions, particularly Natural Flood Management strategies (NFMs), which seek to preserve, restore, or mimic natural hydrological and geomorphological processes across catchments as interconnected systems. While growing evidence supports the hydrological implications of individual NFM interventions (Bagheri et al., 2025), comparative assessments of multiple NFM strategies in rapid-response catchments remain limited. This study, led by Devon County Council in partnership with 19 organisations and aiming to enhance community flood resilience through NFMs, evaluates the hydrological effectiveness of multi-intervention NFM approaches across five fast-responding catchments in Devon, UK. Utilising a robust Before-After-Control-Impact (BACI) experimental design, we collected high-resolution hydrological data at five-minute intervals using water level loggers, rain gauges, soil moisture probes, and time-lapse cameras. 545 flood events were identified and analysed. Preliminary results from the completed catchments confirm that NFMs collectively contribute to reductions in flood peak magnitude and increases in flow travel time, with the magnitude of effect varying by intervention type and catchment characteristics.

Reference

Bagheri‐Gavkosh, M., Panici, D., Puttock, A., Dauben, T., & Brazier, R. E. (2025). Hydrological Analysis and Impacts of Natural Flood Management Strategies: A Systematic Review. Journal of Flood Risk Management18(3), e70112.

How to cite: Bagheri Gavkosh, M., Puttock, A., Panici, D., Alexander, G., and E. Brazier, R.: Evaluating Natural Flood Management Effectiveness Across Fast-Responding Catchments Using High-Resolution Monitoring, EGU General Assembly 2026, Vienna, Austria, 3–8 May 2026, EGU26-553, https://doi.org/10.5194/egusphere-egu26-553, 2026.

EGU26-615 | ECS | Posters on site | ITS4.9/HS12.5

Urban and Peri-Urban Agriculture as a Nature-Based Solution: A Conceptual Framework for the implementation in Latin America and the Caribbean 

Ana Maria Bertolini, Gabriela Di Giulio, and Matilda van den Bosch

Climate change is intensifying the exposure of cities in Latin America and the Caribbean (LAC) to extreme events and risks, increasing the need for effective adaptation strategies. Nature-based Solutions (NbS) are recognized as key instruments to cope with climate impacts. Among them, urban and peri-urban agriculture (UPA) stands out for its multifunctionality, providing economic, social, health, and environmental co-benefits such as urban cooling, heat mitigation, improved nutrition, and enhanced well-being. However, the explicit inclusion of UPA within the NbS framework is still recent, and its implementation remains limited, often overlooking interactions among co-benefits and underexploring its contribution to climate adaptation. In this sense, we developed a conceptual framework for implementing UPA as a NbS in LAC, recognizing the importance of doing so in the context of accelerating climate change and the growing need for urban adaptation and resilience. The proposed framework provides guidance for policymakers to integrate UPA into urban planning, supporting more resilient, healthy and adapted cities. The methodology combines a literature review on NbS design and case studies of UPA in LAC cities, ensuring both conceptual understanding and practical application. This approach also allows the identification of challenges, opportunities, and enabling conditions for integrating UPA into urban climate adaptation strategies. The framework highlights the key components of UPA implementation and the interactions between them and is structured in three complementary phases: (i) pre-implementation, focused on planning, stakeholder engagement, and enabling conditions; (ii) implementation, which underpins UPA practices and enhances health, social, economic, and ecological dimensions via multifunctional benefits and co-benefits; and (iii) post-implementation, in which, through a network, the environmental, social, and economic benefits and co-benefits may collectively enhance climate adaptation and urban resilience. Governance and stakeholder engagement are crucial across all stages. Our analysis of UPA initiatives in LAC demonstrates that these practices are highly multifunctional, providing interconnected social, economic, environmental, and health co-benefits. Case studies reveal that, although many projects were initially implemented to address immediate needs such as food security and income generation, they often evolve over time, producing additional benefits including urban cooling, biodiversity enhancement, and community engagement. The proposed conceptual framework captures these dynamics, emphasizing the importance of planning, stakeholder engagement, and enabling conditions during pre-implementation, the delivery of multifunctional benefits during implementation, and long-term monitoring and adaptive management in the post-implementation phase. By integrating UPA into urban planning, the framework highlights how multifunctional NbS can strengthen climate adaptation, enhance urban resilience, and provide cost-effective alternatives to grey infrastructure. This approach also identifies key challenges and opportunities for scaling up UPA in LAC cities, underscoring the need for governance structures, context-specific indicators, and participatory processes to ensure sustainable and equitable outcomes. 

How to cite: Bertolini, A. M., Di Giulio, G., and van den Bosch, M.: Urban and Peri-Urban Agriculture as a Nature-Based Solution: A Conceptual Framework for the implementation in Latin America and the Caribbean, EGU General Assembly 2026, Vienna, Austria, 3–8 May 2026, EGU26-615, https://doi.org/10.5194/egusphere-egu26-615, 2026.

Diffuse non-point source pollution from fertilizers, pesticides and soil erosion poses a significant threat to the water quality of agro-urban lands, driven by intensive farming and urban growth. In this context, buffer strips are widely recognized as an effective nature-based adaptation measure to mitigate the spreading of diffuse pollution. Although the EU Common Agricultural Policy (CAP) promotes their adoption through eco-schemes and incentives, real-world implementation remains often limited and this is largely due to farmers reluctance to allocate productive land for buffers as well as the lack of comprehensive cost-benefit assessments demonstrating their economic viability. To address these gaps this study applies an integrated framework to quantitatively evaluate riparian buffer strip implementation and its potential benefits in Mediterranean agricultural basin regions that are highly vulnerable to climate-change impacts. In this extent, as a real-world case study, we select the Rio Santa Marina basin, a headwater tributary of the Sarno River (Campania, Italy) that is a severely polluted watercourse characterized by intensive agricultural activity principally in the upper part of the watershed. This integrated framework combines data on the topography, irrigation channel networks, land use and land cover, crop types and agricultural productivity to quantify the implications of buffer strip installation. This analysis supports the optimization of buffer placement while accounting for potential reductions in farmer’s income. In parallel, a cost-benefit analysis will evaluate financial feasibility and farmer’s willingness to adopt CAP-supported buffer designs. The study will support policymakers and water managers by providing: (i) a high-resolution spatial assessment of land suitable for buffer strip implementation (ii) a scenario-based buffer strip designs that maximize diffuse pollution reduction while minimizing the land subtracted from agriculture and (iii) a policy-oriented cost-benefit analysis to strengthen adoption under EU CAP eco-schemes. Ultimately, the project will offer a validated, scalable decision-support system to improve water quality in accordance with EU Water Framework Directive across agro-urban basins in Europe.

How to cite: Bashir, R., Merola, M., Lama, G. F. C., Tropeano, R., and Peruzzi, C.: An integrated framework to assess the optimal implementation of buffer strips in Mediterranean agricultural regions: Insights from the real-world case study of Rio Santa Marina watershed (Southern Italy), EGU General Assembly 2026, Vienna, Austria, 3–8 May 2026, EGU26-1238, https://doi.org/10.5194/egusphere-egu26-1238, 2026.

EGU26-1637 | ECS | Orals | ITS4.9/HS12.5

Assessing the Role of Nature-Based Solutions in Mitigating Cascading Infrastructure Failures in Urban Flood Scenarios 

Marlon Vieira Passos, Jung-Ching Kan, Georgia Destouni, Karina Barquet, Luigia Brandimarte, and Zahra Kalantari

Climate-induced hazards, such as extreme flooding, pose a systemic risk to urban areas by triggering cascading failures across interdependent critical infrastructures. While the direct damages of flooding are well-studied, the indirect consequences from disruptions to power, water, and emergency services can be uncertain and require more research. This study presents a modeling framework to quantify these cascading impacts and to assess the effectiveness of Nature-based Solutions (NBS) in enhancing systemic resilience.

Using the city of Malmö, Sweden, as a case study, we developed an integrated infrastructure model simulating the electricity, water, and emergency service networks. We subjected the city’s infrastructure model to three distinct, high-impact flood scenarios projected for the year 2125: extreme rainfall, extreme sea level, and a combination of mean high water level with heavy rain. The model first quantifies the propagation of failures, identifying critical vulnerabilities and estimating the population affected by service losses. Subsequently, we implemented five large-scale NBS scenarios based on a previous study to measure their potential to mitigate these cascading effects. The solutions include green roofs, street trees, parking area de-sealing, and enhanced park vegetation.

Our local results demonstrate that different flood types trigger unique failure pathways. Extreme rainfall would cause the most severe disruptions to municipal services. The analysis shows that NBS can substantially reduce the number of residents impacted by service disruptions. Comprehensive strategies combining multiple NBS interventions yielded the most significant benefits across all scenarios. This study provides a data-driven framework for policymakers and urban planners that translates the improved hydrological performance of NBS into tangible metrics of urban resilience, supporting the design of climate-resilient landscapes.

How to cite: Vieira Passos, M., Kan, J.-C., Destouni, G., Barquet, K., Brandimarte, L., and Kalantari, Z.: Assessing the Role of Nature-Based Solutions in Mitigating Cascading Infrastructure Failures in Urban Flood Scenarios, EGU General Assembly 2026, Vienna, Austria, 3–8 May 2026, EGU26-1637, https://doi.org/10.5194/egusphere-egu26-1637, 2026.

EGU26-2456 | Posters on site | ITS4.9/HS12.5

Nature-based solutions as a missing link in climate-resilient lowland hydrology: evidence from the Middle Banat drainage system 

Milica Vranešević, Đorđe Petrić, and Maja Meseldžija

Lowland agricultural landscapes are increasingly exposed to climate-driven hydrological instability manifested through intensified rainfall extremes, prolonged droughts, rising temperatures, and altered groundwater–surface water interactions. In flat regions such as the Middle Banat drainage system in Serbia, hydrological functioning is controlled by slow system response, high groundwater sensitivity, and strong dependence on recipient water stages, making these landscapes particularly vulnerable to climate non-stationarity. Traditionally, flood protection and drainage in such systems have relied almost exclusively on grey infrastructure, while the regulatory role of Nature-based Solutions (NbS) within canal networks and drainage corridors has remained largely underestimated. In this study, long-term time series (2003-2023) of precipitation, groundwater levels, and recipient water stages were analyzed using a combined deterministic–stochastic hydrological framework, while future temperature and precipitation dynamics were projected using CMIP6 climate scenarios. Deterministic analysis was applied to interpret physical processes of infiltration, percolation, baseflow generation, and surface runoff propagation, while stochastic methods were used to detect trends, seasonality, system memory, and correlation structures under increasing climatic uncertainty. The results reveal persistent positive coupling between precipitation, groundwater levels, and recipient stages, confirming the storage-controlled behavior typical of flat lowland drainage systems. A statistically significant increase in mean air temperature and a strong rise in the number of extreme dry days were detected, while annual precipitation shows a slight long-term decline combined with pronounced intra-annual irregularity. Climate projections further indicate increased evapotranspiration demand, enhanced drought probability, and growing pressure on both natural groundwater recharge and conventional drainage capacity. Within this hydro-climatic context, NbS implemented directly along canals and within agricultural drainage corridors emerge as a critical missing link between scientific diagnostics and practical climate adaptation. Vegetated buffer strips and riparian strips along canals reduce flow velocity, enhance sediment and nutrient retention, promote bank stability, and improve thermal and ecological regulation of drained waters. Constructed wetlands and vegetated detention zones within the canal network increase temporary flood storage, attenuate peak flows, and enhance groundwater recharge under high-water conditions. Soil-focused NbS, including organic matter enhancement, cover crops, and micro-retention in fields, further strengthen infiltration capacity and drought buffering. The integration of deterministic–stochastic hydrological analysis with spatial NbS planning enables the identification of where, when, and at what scale such measures provide maximum hydro-climatic benefit within drainage systems. Beyond their engineering function, these NbS measures directly support SDG 13 by strengthening climate-change adaptation, reducing flood and drought risks, and increasing system resilience under non-stationary conditions, while simultaneously contributing to SDG 15 through the restoration of riparian habitats, enhancement of biodiversity corridors, improvement of soil functions, and reduction of diffuse agricultural pressures on aquatic ecosystems. The Middle Banat case demonstrates that climate-resilient lowland hydrology cannot rely solely on structural drainage control, but must embed NbS as functional components of canal networks, capable of simultaneously stabilizing groundwater regimes, mitigating hydrological extremes, restoring ecosystem services, and supporting integrated water, climate, and biodiversity policies. The presented framework provides a transferable scientific basis for bridging hydrological science, NbS practice, and sustainability-oriented policy implementation in large lowland agricultural regions facing climate-driven water instability.

How to cite: Vranešević, M., Petrić, Đ., and Meseldžija, M.: Nature-based solutions as a missing link in climate-resilient lowland hydrology: evidence from the Middle Banat drainage system, EGU General Assembly 2026, Vienna, Austria, 3–8 May 2026, EGU26-2456, https://doi.org/10.5194/egusphere-egu26-2456, 2026.

EGU26-3273 | ECS | Posters on site | ITS4.9/HS12.5

Quantifying the post-installation impact of offline ponds in Coatham Beck, Stockton, NE England 

Medha, Vassilis Glenis, Claire Walsh, Michael Pollock, Nathaniel Revell, Alex Nicholson, and David Hetherington

Flooding is one of the major risks in the UK, which is increasing due to climate change and increased urbanisation. The Environment Agency in the UK has predicted that 1 in 4 properties will be affected by flood risk due to river, sea or surface water flooding by 2050.  Traditional flood defences built to protect the receptors such as infrastructure and people in floodplain are facing more intense and frequent floods. Natural Flood Management (NFM) aims to reduce flood risk to downstream communities by implementing upland measures that slow and store runoff, complementing traditional flood defences. Field-based evidence of the effectiveness of different types of NFM features are limited. This research develops a field-based method to quantify the performance of offline runoff attenuation ponds. A dense hydrometric network comprising of 12 pressure transducers, 2 ultrasound flow probes, and a tipping-bucket rain gauge has been installed across the site Coatham Beck, NE England (April 2024–present). The study quantifies pond storage and evaluates reduction or delay in downstream peak flows. This study addresses the wider challenge of lack of empirical quantification on NFM features. Findings will inform the design consideration for building better offline ponds allowing the replicability of such measures of flood in wider scale mitigating the impact of future flood risk.

How to cite: Medha, , Glenis, V., Walsh, C., Pollock, M., Revell, N., Nicholson, A., and Hetherington, D.: Quantifying the post-installation impact of offline ponds in Coatham Beck, Stockton, NE England, EGU General Assembly 2026, Vienna, Austria, 3–8 May 2026, EGU26-3273, https://doi.org/10.5194/egusphere-egu26-3273, 2026.

EGU26-3943 | Posters on site | ITS4.9/HS12.5

Enhancing flood resilience in large regulated rivers. fighting flood with flood     

Eduardo Murillo Peñacoba, David Gargantilla Cañero, Samuel Chopo Prieto, Carolina García Suikanen, Luis Sanz Azcarate, Eva Zaragueta Arrizabalaga, Mª José Clavijo Izquierdo, Ana María Montero García, María Pilar Royo Naya, Francisco Palú Aramburu, Enrique Arrachea Veramendi, María Paniagua Rodriguez, Francisco Javier Fernández Irizar, and Tatiana Garza Merino

Large regulated rivers across Europe have progressively lost floodplain connectivity due to channelization and longitudinal levees. This has led to increased flood risk, higher flow velocities, and recurrent economic damage in agricultural areas. In the middle reach of the Ebro River (NE Spain), decades of river confinement have resulted in frequent levee overtopping and failures during medium-magnitude floods, despite extensive structural defences.

This contribution presents the implementation of Lateral Flow Buffering Zones (ZAFL, Spanish acronym), developed within the LIFE Ebro Resilience project, as an adaptive flood risk management measure for non-urban floodplains. The approach combines setback levees, controlled overflow sections, and compartmentalized agricultural areas that allow pre-inundation and temporary water storage, reducing flow velocities and erosive forces during flood events.

Two-dimensional hydraulic modelling was applied to evaluate multiple design scenarios under a 10-year return period flood (Q ≈ 2,300 m³/s). Results show that the selected configuration—covering approximately 630 ha and subdivided into 14 buffering units—delays the onset of overtopping, increases the conveyance capacity of the main channel by more than 200 m³/s in constricted sections, and significantly reduces flow velocities over cultivated land. Additionally, the system stabilizes levees by balancing hydraulic pressures and enables rapid, controlled drainage after flood recession.

Beyond flood risk reduction, the intervention promotes river–floodplain reconnection, supports riparian habitat restoration, and aligns with the objectives of the EU Habitats and Floods Directives by applying Nature-Based Solutions. The Ebro River case demonstrates how adaptive floodplain management can provide a resilient, multifunctional alternative to traditional flood defences in large regulated rivers under climate change pressures.

How to cite: Murillo Peñacoba, E., Gargantilla Cañero, D., Chopo Prieto, S., García Suikanen, C., Sanz Azcarate, L., Zaragueta Arrizabalaga, E., Clavijo Izquierdo, M. J., Montero García, A. M., Royo Naya, M. P., Palú Aramburu, F., Arrachea Veramendi, E., Paniagua Rodriguez, M., Fernández Irizar, F. J., and Garza Merino, T.: Enhancing flood resilience in large regulated rivers. fighting flood with flood    , EGU General Assembly 2026, Vienna, Austria, 3–8 May 2026, EGU26-3943, https://doi.org/10.5194/egusphere-egu26-3943, 2026.

EGU26-4059 | Posters on site | ITS4.9/HS12.5

Effective design of peatland restoration: insights from studying how hillslope lengths change with drainage network structure 

Stefano Basso, Francesco Casarotto, and Gianluca Botter

The restoration of peatlands taking place worldwide is a remarkable case of implementation of nature-based solutions at large spatial scales. It is often suggested that peatland restoration may contribute to climate adaptation goals by attenuating the hazard of floods and improving water quality. However, approaches to evaluate such benefits beyond single case studies and account for them in the planning of restoration are lacking.

Peatland restoration is often realized by filling in or damming drainage ditches, thereby increasing the distance of land parcels to the drainage network. In this work we leverage recent advances in the relationship between drainage network structure and the mean distance to the nearest drainage (i.e., the mean hillslope length, a key metric for ecosystem services like flood mitigation and solute degradation) in the context of peatland restoration. We analyze how this metric changes with different ways of realizing peatland restoration (i.e., by intervening on all ditches - as it is mostly done now - or only on some of them) in four catchments located across Norway.

We find that effects comparable to those obtained by erasing all ditches can be achieved by only erasing some of them. This means that peatland restoration may be realized at lower costs, while obtaining similar results for the ecosystem services mentioned above.

Results indicate that the contributing area of a ditch is the fundamental criterion determining the benefit of its removal, and ditches with larger contributing areas should therefore be prioritized in restoration. When the restoration goal is to achieve a target mean hillslope length and the related ecosystem services, implementing restoration from down to upstream consistently minimizes ditch removal, making it the most economically convenient option.

The proposed approach can support effective planning of nature-based solutions such as peatland restoration, thus reducing costs linked to their large scale implementation.

How to cite: Basso, S., Casarotto, F., and Botter, G.: Effective design of peatland restoration: insights from studying how hillslope lengths change with drainage network structure, EGU General Assembly 2026, Vienna, Austria, 3–8 May 2026, EGU26-4059, https://doi.org/10.5194/egusphere-egu26-4059, 2026.

EGU26-4227 | ECS | Posters on site | ITS4.9/HS12.5

Spatial Multi-Objective Optimisation of Catchment-Scale Nature-based Solutions Strategies 

Henry Rong, Richard Dawson, and Caspar Hewett
The UK has ambitions to face a host of challenges exacerbated by a changing climate. This includes managing growing drought and flood risk, abating carbon emissions to meet legal obligations, and tackling its biodiversity decline. In the past two decades, research and uptake of Nature-based Solutions (NbS) have intensified. These interventions are designed to enhance and restore the capacity of landscape features to provide multiple co-benefits, such as slowing storm runoff, intercepting pollutants, and creating habitat. There is a recognition that incorporating local knowledge and empowering community leadership is crucial to the delivery and long-term success of these schemes. This co-design principle should be tied into new projects to achieve transformative adaptation to climate change, but it also introduces more objectives and preferences, which complicates the challenge of identifying appropriate NbS designs.

Whilst there is an ever-growing evidence base, much guidance remains qualitative and further upscaling of schemes from the plot scale to the catchment scale is hindered by funding and uncertainty in performance. A key area of uncertainty is the interplay between different NbS interventions and whether they may have positive or negative feedback on each other. This has motivated further research into modelling and systematically exploring trade-offs across a large design space of different intervention options, and evaluating their effectiveness against multiple stakeholder objectives.

Even for a small catchment, evaluating all possible combinations is intractable, so the model is incorporated into a multi-objective optimisation framework for decision support. This research uses a genetic algorithm to explore intervention parameters and placement, and then simulates the performance for different intervention arrangements with a physically-based hydrological model to capture vertical as well as lateral surface flows. This seeks to form the basis for a catchment-scale planning tool which allows catchment stakeholders to interrogate the details between alternative strategies and evaluate if high-level needs are being met. A case study in the Wansbeck catchment will be presented, quantifying trade-offs between attenuating peak flow, habitat creation, carbon sequestration, and the cost of implementation.

How to cite: Rong, H., Dawson, R., and Hewett, C.: Spatial Multi-Objective Optimisation of Catchment-Scale Nature-based Solutions Strategies, EGU General Assembly 2026, Vienna, Austria, 3–8 May 2026, EGU26-4227, https://doi.org/10.5194/egusphere-egu26-4227, 2026.

Crop diversity underpins the stability of food supply and the sustainability of agriculture, yet limited understanding of its variability and underlying drivers constrains effective management. Drawing on data from 211 countries over six decades (1961–2020), we show that global crop diversity has generally increased, although one-third of countries experienced declines, and crop evenness decreased in nearly half of the countries. Differences across nations are primarily shaped by farm size, multiple cropping intensity, farmers’ crop income, and crop consumption patterns. Farm size emerges as the dominant factor, reducing global crop diversity by approximately 4%–8% annually from 1961 to 2020 and amplifying global inequalities in crop diversity distribution. Projections indicate a further 3%–10% decline by 2050 relative to 2020 levels. However, this trajectory can be reversed, with effective farm size management yielding a 6%–17% increase in global crop diversity while narrowing inter-country disparities. Such progress is critical to strengthen agricultural stability and advance multiple UN Sustainable Development Goals, including zero hunger, reduced inequality, and responsible consumption and production.

How to cite: Gong, X.: Managing farm size as a nature-based solution to restore global crop diversity and reduce inequality, EGU General Assembly 2026, Vienna, Austria, 3–8 May 2026, EGU26-4779, https://doi.org/10.5194/egusphere-egu26-4779, 2026.

EGU26-4838 | Orals | ITS4.9/HS12.5

Multidisciplinary evaluation of flood mitigation measures integrating hydrological effectiveness, public perception, economic evaluation and funding opportunities analysis 

Nejc Bezak, Pavel Raška, Jan Macháč, Jiří Louda, Vesna Zupanc, Lenka Slavíková, and Mark Bryan Alivio

Climate‑driven changes in flood frequency and magnitude are intensifying the need for robust and efficient flood mitigation strategies that, at the same time, provide ecological co-benefits and are accepted by the public and other relevant stakeholders. A wide spectrum of measures, ranging from conventional grey-structural infrastructure to nature‑based solutions (NbS) and hybrid approaches, is nowadays being considered to reduce hydrometeorological risks. While NbS are increasingly promoted in European and international policy frameworks, their implementation is often hindered by uncertainties regarding effectiveness, feasibility, public acceptance, and funding structures. This contribution provides a brief overview of some recent studies dealing with hydrological modelling, economic evaluation, public perception analysis, and review of funding and conceptual frameworks related to the implementation and design of NbS and other flood mitigation measures.

Public perception study conducted in Slovenia, Czechia, and the Netherlands revealed statistically significant differences in perceived effectiveness, feasibility, and acceptability of green, grey, and hybrid measures. Respondents generally view grey measures such as dams as more effective and acceptable, though more difficult to implement and less feasible, while perceptions varied with country context, age, and income. Additionally, perception of multiple stakeholders was also investigated in Slovenia indicating that researchers tend to rate green measures more favourably compared to engineers and agricultural advisors. For selected measures (dams, retention polders and wetlands) hydrological simulations were conducted in the Gradaščica River catchment in Slovenia. It was shown that wetlands, although offering diverse ecological and other co‑benefits, reduced flood peaks by only few percentages whereas retention polders and dams achieved substantially higher peak flow reductions at reference downstream river cross-sections. Consequently, economic analyses indicated that grey measures outperform green measures in cost‑effectiveness. In contrast, some recently conducted studies showed that other NbS solutions like urban greenery can provide a notable reduction in runoff for low and medium magnitude rainfall events.

A complementary analysis of 53 European funding calls and 342 global projects highlighted how the current NbS policy discourse increasingly shapes funding opportunities and supports framing of interventions as NbS. This framing can facilitate access to resources and significantly enhance the research related to the NbS implementation. However, at the same time, too generic NbS framing can introduce additional uncertainty in assessments of NbS effectiveness and potentially exclude other viable flood mitigation measures from consideration and implementation. Therefore, it is recommended that coherence between the stated NbS and the indicators capturing effectiveness of actual set of measures is critical for gaining evidence from monitoring of hydrometeorological risk reduction projects.

In summary, while NbS and related measures are being promoted by different stakeholders, their public perception, hydrological effects, and economic viability continues to diverge across geographical and institutional settings. The research community, in turn, increasingly labels different types of measures as NbS in order ensure funding, potentially limiting research insights needed for more transparent and effective implementation of NbS.


Acknowledgment: The research was conducted within the project J6-4628 (22-04520L) co-funded by Slovenian Research and Innovation Agency (ARIS) and Czech Science Foundation and was additionally supported by ARIS P2-0180 grant. 

How to cite: Bezak, N., Raška, P., Macháč, J., Louda, J., Zupanc, V., Slavíková, L., and Alivio, M. B.: Multidisciplinary evaluation of flood mitigation measures integrating hydrological effectiveness, public perception, economic evaluation and funding opportunities analysis, EGU General Assembly 2026, Vienna, Austria, 3–8 May 2026, EGU26-4838, https://doi.org/10.5194/egusphere-egu26-4838, 2026.

Mountainous regions inhabited by Indigenous communities are increasingly exposed to coupled geomorphic and hydrological disturbances under climate change, including intensified rainfall, altered sediment dynamics, and shifting hydrological regimes. Nature-based Solutions (NbS) are widely promoted as adaptive responses in such settings; however, their implementation in complex sloping environments often lacks clear operationalization, particularly under conditions of climatic uncertainty and hydrological non-stationarity.

Here, the gap is addressed by introducing Participatory Resilience Monitoring (PRM), a framework that integrates community-based knowledge with scientific environmental monitoring to support the design, evaluation, and adaptive management of NbS in sloping environments. The core challenge for NbS in such contexts lies not in their conceptual validity, but in the absence of mechanisms linking place-based knowledge, monitoring indicators, and decision-making processes over time.

This study combines ecosystem services assessments, interviews with Indigenous and local stakeholders, and field surveys in the Maolin District, Taiwan. The analysis identifies community priorities, culturally valued landscapes, and zones of geomorphic sensitivity. Riparian corridors, slope–valley ecotones, and habitat-supporting areas emerge as key locations where potential NbS interventions and resilience monitoring overlap. These areas represent both high environmental sensitivity and strong social relevance. PRM integrates three interconnected pillars: (1) place-based knowledge, (2) resilience indicators and monitoring, and (3) adaptive decision-making and learning. Environmental data analysis and modeling provide decision support within PRM while maintaining participatory processes at the core. By operationalizing NbS through participatory monitoring, PRM enables interventions to be context-specific, testable, and adaptable under ongoing climate change, offering a transferable framework for NbS implementation in mountainous regions characterized by social-ecological dynamics.

How to cite: Harrison, J. and Wang, H.-W.: Participatory resilience monitoring to guide nature-based solutions in sloping environments under climate change, EGU General Assembly 2026, Vienna, Austria, 3–8 May 2026, EGU26-5172, https://doi.org/10.5194/egusphere-egu26-5172, 2026.

EGU26-5474 | Orals | ITS4.9/HS12.5

An Earth Observation–Based Workflow for Flood Monitoring at Nature-Based Solution Sites 

Amulya Chevuturi, Vasilis Myrgiotis, Burak Bulut, Neeraj Sah, James Blake, and Alejandro Dussaillant

Nature-based solutions (NBS) for flood mitigation requires robust, scalable, and transferable monitoring approaches to assess their effectiveness across spatial and temporal scales. Here, we present an open-access, satellite-based Earth observation (EO) monitoring tool designed to quantify surface water dynamics and water retention associated with NBS implementation. The tool integrates multi-sensor satellite data, including Sentinel-1 synthetic aperture radar (SAR) and Sentinel-2 optical imagery, within a flexible, automated workflow capable of near–real-time monitoring at high spatial (<10 m) and temporal resolution.

The workflow addresses key challenges in NBS monitoring, including small site extents, rapid hydrological responses, and the need for efficient, reproducible methods. It integrates complementary Earth observation indicators for surface water detection, combining optical indices (e.g. Normalised Difference Water Index) with SAR backscatter metrics sensitive to open water and flooded vegetation to enable continuous, all-weather monitoring. The framework is flexible and site-adaptive, allowing threshold calibration using local ground knowledge, historical flood information, and ancillary datasets, thereby improving reliability beyond globally fixed thresholds. Data are structured into spatio-temporal data cubes, supporting pixel-level analysis, aggregation over user-defined regions of interest, and integration of ancillary open datasets for contextual interpretation and future extension toward soil moisture and drought indicators.

The tool is demonstrated using a UK catchment with established NBS interventions, where EO-derived surface water patterns during recent storm events indicate preferential inundation of upstream retention features and limited flooding in downstream vulnerable areas. The monitoring system is implemented as a modular, open-source framework that automatically retrieves, processes, and structures EO and ancillary datasets into spatio-temporal data cubes, enabling both scripted analyses and interactive visualisation through dashboards.

This EO-based tool provides a transferable, transparent, and scalable approach for evaluating NBS performance in data-sparse environments. Designed for long-term use beyond project lifetimes, the workflow is fully open-source, computationally efficient, and adaptable across diverse European contexts, with the potential for integration into broader multidimensional monitoring and decision-support frameworks for flood risk management.

How to cite: Chevuturi, A., Myrgiotis, V., Bulut, B., Sah, N., Blake, J., and Dussaillant, A.: An Earth Observation–Based Workflow for Flood Monitoring at Nature-Based Solution Sites, EGU General Assembly 2026, Vienna, Austria, 3–8 May 2026, EGU26-5474, https://doi.org/10.5194/egusphere-egu26-5474, 2026.

Nature-based solutions (NBS) such as wetlands are increasingly promoted as multifunctional measures for flood mitigation, water quality improvement, and ecosystem service enhancement under climate change. However, their effectiveness strongly depends on where they are implemented within the landscape, and uncertainties in spatial targeting continue to limit their performance and large-scale uptake. This study presents an integrated, catchment-scale framework for strategic NBS placement that bridges process-based hydrological science with participatory decision support.

The framework combines structural and functional landscape connectivity modelling with hydrological assessments and stakeholder-informed multi-criteria decision analysis. Sediment and hydrological connectivity are quantified using a connectivity index that integrates topography, land cover, soil properties, runoff potential, and soil moisture to identify areas of high transport activity and retention potential. Potential wetland locations are identified through high-resolution depression analysis and evaluated based on upstream-downstream interactions, storage capacity, and land-use context. Stakeholder priorities are incorporated using an analytic hierarchy process and multi-criteria decision analysis to explicitly account for governance constraints, feasibility, and desired ecosystem services.

The approach is demonstrated in two contrasting lowland catchments in central Sweden draining into Lake Mälaren, characterized by different land-use patterns, soil compositions, and hydrological responses. Results show that high-priority NBS locations consistently emerge where hydrological and geomorphological connectivity converge, highlighting the importance of targeting intervention points that influence catchment-scale processes rather than isolated sites. The multi-objective analysis reveals clear trade-offs and synergies among flood regulation, sediment and nutrient retention, water storage, and biodiversity, supporting transparent decision-making across competing objectives.

By integrating connectivity-based modelling with participatory prioritization, the framework links scientific understanding of landscape processes with practical implementation needs and policy-relevant decision support. The methodology is scalable, transferable, and suitable for application across different climatic and socio-economic contexts. It provides a robust basis for advancing climate-resilient landscape planning and supports the mainstreaming of NBS in water and land management strategies aligned with climate adaptation and sustainability goals.

How to cite: Rezvani, A. and Kalantari, Z.: A catchment-scale framework for nature-based solution placement using hydrological connectivity and participatory decision support, EGU General Assembly 2026, Vienna, Austria, 3–8 May 2026, EGU26-5590, https://doi.org/10.5194/egusphere-egu26-5590, 2026.

Nature-based solutions (NbS) are key to climate adaptation policy, yet upscaling across diverse landscapes remains challenging. Within the HEU-NBRACER project, we developed a process framework to up- and outscale NbS. This framework is applied to the Province of West-Flanders, Belgium, where climate adaptation strategies have been co-designed by integrating evidence-based science with participatory governance.

First, we assessed risk at detailed spatial scales by combining available current and future spatial multi-hazard mapping with local vulnerability and exposure indicators. These risk maps informed stakeholder dialogues to prioritize risks and co-define a shared vision for climate resilience.

At the same time, concrete NbS-actions were co-designed and demonstrated with municipal actors and stakeholders. This process captured perceived co-benefits, barriers, and enablers, ensuring context-specific feasibility and alignment with policy and planning.

Next, solutions were identified and organized into a portfolio of process-based strategies (e.g., sponge landscape for water storage and retention; evapotranspiration-driven cooling for urban heat mitigation). Using a hotspot mapping approach, we identify where specific NbS are most effective by jointly considering biophysical effectivity (e.g., infiltration potential, connectivity) and risk reduction needs (e.g., locations with high flood or drought risk and vulnerable population):

NbS hotspot score=hazard score ×vulnerability score ×effectivity score

The hotspot approach applied in this framework aligns with the methodology used by the Flemish climate portal (Klimaatportaal), ensuring consistency with governmental tools and facilitating integration into policy processes.

For each strategy, we provide an overall score for climate benefits (drought and flood mitigation, soil erosion control, water quality improvements) and ecosystem services (food production, carbon sequestration and biodiversity enhancement) using multi-criteria scoring informed by expert interviews and literature study. During a co-design process informed by the NbS hotspot scores, local stakeholders finally identified actionable pathways to also implement those NbS. This is done for a specific subregion in West-Flanders, as part of the Landscape Park Zwinstreek.

Results deliver a portfolios of strategies, NbS hotspot maps, and actionable pathways to support decision-making and implementation. The framework bridges science, practice, and policy, enabling transparent prioritization, stakeholder ownership, and scalable NbS deployment for climate adaptation.

How to cite: Notebaert, B., Brosens, L., and Haesen, L.: From Risk Maps to Nature-Based Solutions Hotspots: Evidence-Based Upscaling for Climate Adaptation in West-Flanders (BE) , EGU General Assembly 2026, Vienna, Austria, 3–8 May 2026, EGU26-5860, https://doi.org/10.5194/egusphere-egu26-5860, 2026.

EGU26-7010 | ECS | Posters on site | ITS4.9/HS12.5

Enhanced Flood Detection through Innovative Integration of PolSAR, Metaheuristic Optimization, and Deep Learning-Based Segmentation 

Solmaz Khazaei Moughani, Zahra Kalantari, Liangchao Zou, Fernando Jaramillo, Carla Sofia Santos Ferreira, and Khabat Khosravi

Flood is the most common natural disaster in the world, and can have catastrophic impacts on human society and the environment, including infrastructure damage, agricultural losses, and casualties, resulting in widespread economic and social disruptions. In early studies, water body detection relied on on-the-spot investigation, hydrological models and common remote sensing techniques that face issues like slow processing and real-time delays. By addressing this challenges we propose a novel hybrid PoLSAR-metaheuristic-DL models and high-resolution remote sensing data to generate accurate and rapid flood mapping for one of the huge recent flood in France. Compared with standard synthetic aperture radars (SAR), polarimetric synthetic aperture radar (PolSAR) is an advanced technique of SAR remote sensing. So, by using polarimetric decomposition methods, features were extracted and feature selection problem, one of the most challenging, was solved by using metaheuristic techniques. The selected features fed into three deep learning-based segmentation models- U_Net_V3, Nested_UNet and Efficient_UNet. The reliability of the generated flood maps was evaluated using Accuracy, precision and recall metrics. Our experimental results indicate that Nested_UNet integrate with optimized PolSAR data achieves the highest segmentation performance, with an accuracy of 0.910, precision of 0.914, and recall of 0.909. These findings underscore the capability of Nested_UNet, demonstrates superior feature extraction abilities, making it a promising choice for real-time flood segmentation applications. Moreover, detecting the knowledge of flooded areas, officials can actively adopt steps to reduce the potential impact of flood, ensure the sustainable management of natural resources and mitigate flood impacts.


Keywords: Flood Segmentation, U_Net_V3, Nested_UNet, Efficient_UNet, PolSAR, Methaheuristis algorithms, France

How to cite: Khazaei Moughani, S., Kalantari, Z., Zou, L., Jaramillo, F., Santos Ferreira, C. S., and Khosravi, K.: Enhanced Flood Detection through Innovative Integration of PolSAR, Metaheuristic Optimization, and Deep Learning-Based Segmentation, EGU General Assembly 2026, Vienna, Austria, 3–8 May 2026, EGU26-7010, https://doi.org/10.5194/egusphere-egu26-7010, 2026.

Climate change and the current biodiversity crisis are challenging the sustainability of human societies. Nature Based Solutions (NbS) strategically deployed in the landscapes could help reducing the impact of climate risks and help restoring and preserving biodiversity. The NBRACER Horizon Europe project has recently developed a new conceptual framework that connects regional climate risk assessments to the design of scalable networks of blue and green solutions. This framework synthesizes five core components:

  • Climate Risk Impact Chains: Mapping hazard-to-risk propagation through environmental and social vulnerabilities, identifying critical intervention points where NbS can reduce exposure and enhance resilience.
  • Landscape Functional Units & Archetypes: Decomposing regions into functional units reflecting hydrological, ecological, and socio-economic processes, organized as recurring landscape archetypes. This approach links localized ecosystem functions to broader multi‑risk patterns.
  • Meta–Ecosystem Perspective: Viewing interconnected ecosystems across spatial scales, enabling the evaluation of Blue Green Infrastructure (B–GI) networks that deliver cumulative ecosystem services across functional units.
  • Ecosystem Service and Hazard Regulation Linkages: Demonstrating how targeted NbS interventions mediate water, energy, and material flows to attenuate hazard impacts and provide co–benefits.
  • Network and Scaling Strategy: Moving beyond stand–alone projects that are functionally not linked, our framework supports systemic network solutions aligned with regional adaptation pathways, ensuring replicability and transferability across contexts.

By integrating these elements, the developed conceptual framework guides practitioners and policymakers from risk–mapping to the strategic design of interconnected B–GI networks. It supports the identification of optimal intervention locations, the selection of NbS types suited to specific landscapes, and the assembly of strategies that build long–term resilience. The framework’s logic underpins subsequent developments focused on spatial mapping, scenario quantification, monitoring, and NbS implementation.

This conceptual foundation paves the way for evidence–based, scalable NbS deployment, contributing to regional adaptation pathways and compliance with the EU Adaptation to Climate Change Mission objectives.

How to cite: Barquín Ortiz, J. and the NBRACER - WP5 Team: From Climate Risk Assessment to the Design of Blue and Green Infrastructure Networks: A Conceptual Framework, EGU General Assembly 2026, Vienna, Austria, 3–8 May 2026, EGU26-8403, https://doi.org/10.5194/egusphere-egu26-8403, 2026.

EGU26-8524 | ECS | Posters on site | ITS4.9/HS12.5

Community Gardens as Small-Scale Nature-Based Solutions in Upgraded Informal Settlements: Spatial Typologies and Decision-Support Insights from Bangkok 

Atmaja Gohain Baruah, Sammie Ng, Boonanan Natakun, Perrine Hamel, and Maurits Arif Fathoni Lubis

Nature-based solutions (NbS) are widely recognised for their potential to deliver ecological and socio-economic benefits across diverse urban contexts. However, the spatial design and long-term governance of NbS in dense, land-constrained environments remain underexplored. This paper examines community gardens (CGs) and everyday greening practices as small-scale NbS within such settings, focusing on three upgraded informal settlements in Bangkok, Thailand, developed under the Baan Mankong (“secure housing”) participatory social housing programme.

The study adopts a comparative lens to examine how CGs operate as adaptable and socially embedded NbS in contexts where land scarcity and competing priorities constrain urban greening. Using an exploratory mixed-methods design, we combine (1) spatial typology analysis to identify constraints and opportunities for greening; (2) NDVI time-series analysis (2018–2025) derived from PlanetScope imagery to monitor vegetation patterns over time; (3) household surveys capturing ecosystem service aspirations, perceived benefits, and disservices; and (4) semi-structured interviews with community leaders, long-term gardeners, and technical partners. Together, these methods form an analytical framework for evaluating existing CGs and informing future small-NbS design in upgraded informal settlements.

The findings show that while urban CGs are frequently celebrated for their multifunctionality, their form and social benefits are strongly shaped by spatial configuration, institutional arrangements, and modes of community stewardship within which they are placed. Across the three settlements – characterised by clustered, linear canal-edge, and grid-like high-connectivity spatial forms – CGs exhibit distinct patterns of accessibility, participation, and stewardship among community members. These spatial differences further influence perceived benefits and disservices, as well as patterns of land use, labour burdens, and leadership dynamics. Collectively, the findings illuminate the functionality and dynamics of CGs as small-scale NbS and contribute to the development of a decision-support framework for the design and assessment of small-scale NbS in dense, land-constrained urban environments.

How to cite: Gohain Baruah, A., Ng, S., Natakun, B., Hamel, P., and Arif Fathoni Lubis, M.: Community Gardens as Small-Scale Nature-Based Solutions in Upgraded Informal Settlements: Spatial Typologies and Decision-Support Insights from Bangkok, EGU General Assembly 2026, Vienna, Austria, 3–8 May 2026, EGU26-8524, https://doi.org/10.5194/egusphere-egu26-8524, 2026.

EGU26-9872 | ECS | Posters on site | ITS4.9/HS12.5

Optimising Gully Blocks to Reduce Flood Discharge 

Sarah Lauren Drummond, David Milledge, and Caspar Hewett

Flooding is the most frequent and socially disruptive natural hazard observed worldwide and is expected to increase in severity under climate change and due to urban expansion. This has prompted research in upland natural flood management (NFM) strategies and in using gully blocks as leaky barriers. Gully blocking is often implemented into degrading peatlands, primarily for restoration through water table recovery, erosion control, and soil restoration. However, they are not designed for flow attenuation and there have been relatively few attempts to test their capabilities to attenuate discharge peaks and reduce downstream flood risk. Past efforts to model gully block hydraulics are limited and those that exist have typically applied simple ‘weir’ and ‘orifice’ equations, sometimes tested against field observations of stage and discharge but never (to our knowledge) tested against detailed laboratory observations.

We collected 465 measurements through a series of 20 flume experiments in a 1 x 1 x 12.5 m flume under the range of discharges expected for timber gully blocks in UK gullies (i.e. 10 - 220 L/s). We examined the stage-discharge relationship under steady discharge for a timber barrier with a single configurable full channel width slot, 0.2 m above the bed and with slot height 10 - 100 mm. Mathematical modelling suggests that this design has the potential to considerably improve discharge attenuation relative to traditional gully block designs, but this has not been tested in the laboratory. This design functions in three phases, dependant on upstream pond height: 1) the slot functions as a weir from the point at which it overtops until the free surface reaches to the top of the slot; 2) thereafter it functions as an orifice with this as the only outflow point; until 3) the pond overtops the barrier when this is supplemented by weir flow over the top of the barrier. We find that the first phase weir flow is not well approximated by the classical weir equation, the more complete form accounting for upstream velocity improves the relationship, but resultant stage-discharge curves remain a poor fit to observations. However, both models (with and without upstream velocity) are a good fit to observations for phase 3, where the upstream pond depth is > 565.5 mm for a 10 mm slot barrier configuration. Taken together, these results suggest that weir equations are not appropriate for the shallow upstream depths associated with phase 1 but are appropriate for phase 3. The good news is that phase 1 will be short-lived in storms (early on the rising limb) thus the resulting error will have limited influence on modelling their hydraulic behaviour. In phase 2, orifice equations prove a good model, with both large and small orifice equations providing a good fit to observations and the large orifice equation providing a better fit at smaller upstream pond depths. These preliminary results are an encouraging step forward in pursuit of simple models for gully blocks to inform design optimisation and placement.

How to cite: Drummond, S. L., Milledge, D., and Hewett, C.: Optimising Gully Blocks to Reduce Flood Discharge, EGU General Assembly 2026, Vienna, Austria, 3–8 May 2026, EGU26-9872, https://doi.org/10.5194/egusphere-egu26-9872, 2026.

EGU26-9999 | Orals | ITS4.9/HS12.5

Tradeoffs and synergies in nutrient retention and greenhouse gas production in constructed agricultural wetlands 

Martyn Futter, Joachim Audet, Faruk Djodjic, Emma Lannergård, Michael Peacock, and Pia Granmayeh

Perceived tradeoffs between ecosystem services (ES) delivered by nature-based solutions (NBS) may limit their widespread use as a tool for environmental management. Small artificial waterbodies (constructed ponds and free surface wetlands) are one type of NBS that can help mitigate the downstream eutrophying effects of agricultural nutrient runoff and contribute to carbon (C) storage. However, these waterbodies can also be significant greenhouse gas (GHG) sources. Here, we report on water chemistry, dissolved GHG concentrations and sediment properties measured over three years at 40 Swedish constructed agricultural wetlands. We measured inlet and outlet water chemistry, water column dissolved GHG concentrations and sediment C and phosphorus (P) levels. All waterbodies were supersaturated with carbon dioxide (CO2) and most were also supersaturated with nitrous oxide (N2O). There were large temporal variations in inlet water chemistry, highlighting the importance of seasonality and land management. Inlet P concentrations were positively correlated with water column dissolved methane (CH4) and sediment P concentrations; a clear tradeoff in nutrient retention vs. climate regulation. Inlet nitrogen (N) concentrations were positively correlated with N2O concentrations, but these waterbodies were also more likely to mitigate downstream dissolved N levels as suggested by lower outflow N concentrations. Sediment C concentrations were unrelated to any measured parameters, suggesting that it would be difficult to purposefully design ponds and wetlands to sequester large amounts of carbon. Although there are tradeoffs between mitigating downstream eutrophication and climate impacts, this should not preclude the use of constructed wetlands and other types of NBS as tools for ES delivery in agricultural landscapes.

How to cite: Futter, M., Audet, J., Djodjic, F., Lannergård, E., Peacock, M., and Granmayeh, P.: Tradeoffs and synergies in nutrient retention and greenhouse gas production in constructed agricultural wetlands, EGU General Assembly 2026, Vienna, Austria, 3–8 May 2026, EGU26-9999, https://doi.org/10.5194/egusphere-egu26-9999, 2026.

EGU26-10138 | ECS | Posters on site | ITS4.9/HS12.5

Quantifying the protective capacity of Nature-based Solutions: A Scalable Framework based on multi-decadal data at the Gschliefgraben landslide (Austria) 

Peter Tisch, Michael Obriejetan, Erik Kuschel, Johannes Hübl, and Rosemarie Stangl

For decades, alpine hazard management has relied on “grey” infrastructure such as protective structures and retaining walls to provide immediate safety. However, these major construction interventions and investments require regular maintenance, renovation or even replacement. This often involves significant financial efforts and management obligations, entailing open discussions on alternative management approaches.

Nature-based Solutions (NbS) have emerged as a sustainable alternative or complementation to conventional grey interventions within natural hazard management. The various forms of NbS have been serving as a toolkit to complement the hitherto, mainly structure-based protection approach, and they hold potential for a more comprehensive application instead of replacing outdated structures. NBS provide protection over long periods of time, with the biological component being strengthened during maturation and eventually taking over and entirely maintaining the protective function. The greatest advantage is that NbS may provide protection against certain natural hazards types for decades without significant maintenance costs.

Evaluating NbS structures, their effects and performances is currently under scientific focus, however methods for NbS evaluation in a quantifiable manner especially on a large scale, has remained a challenge. In many cases, the benefit of the NbS is evident, but measurability is often lacking. This study evaluates NbS implemented during the last two decades to stabilise the Gschliefgraben landslide area in Upper Austria, as part of the Horizon NatureDEMO project. We combine high-resolution UAV data with on-site inspections to assess the functionality and physical condition of the NbS interventions. These two approaches, when combined, should offer a way to monitor NBS projects on a larger scale more easily.

Furthermore, the study introduces a guideline to quantify the impact and benefits of NbS on basis of figures and parameters. In addition, emphasis is placed on dynamic protection performance to better reflect the time course and biological components of NbS methods. The methodology is linked to measurable variables and is developed in line with Eurocode 2. The ongoing pilot study aims to provide empirical data to build a theoretical framework towards integrating NbS into the Eurocode System.

How to cite: Tisch, P., Obriejetan, M., Kuschel, E., Hübl, J., and Stangl, R.: Quantifying the protective capacity of Nature-based Solutions: A Scalable Framework based on multi-decadal data at the Gschliefgraben landslide (Austria), EGU General Assembly 2026, Vienna, Austria, 3–8 May 2026, EGU26-10138, https://doi.org/10.5194/egusphere-egu26-10138, 2026.

EGU26-10364 | Posters on site | ITS4.9/HS12.5

FLOODtool – mapping water storage potential and evaluating institutional barriers 

Pia Geranmayeh, Faruk Djodjic, Emma Lannergård, Dennis Collentine, and Martyn Futter

Recent extreme drought and floods demonstrates society’s immediate need for climate adaptation and increased water storage capacity higher up in the landscape through the use of natural flood retention measures. Here, we present FLOODtool, a mapping tool that helps landowners, managers and catchment officers to estimate above and below ground water storage potential in the landscape. With the tool, we are able to investigate if detention ponds and restored wetlands in upstream forest areas can protect downstream arable fields (ensure food production), cities and waterways (improve water quality). In FLOODtool, we use soil distribution maps, high-resolution digital elevation data, land use maps and distributed modelling to quantify water storage potential and possible phosphorus reductions. We have applied the new tool in multiple watersheds with different land cover and water holding potential. In collaboration with different stakeholders, we have used FLOODtool modelling results to find cost-effective locations to rewet or implement new water retention measures depending on their criteria. Our modelling is complemented by empirical work in which we will use high-frequency sensors to quantify the ability of detention ponds ability to store water, prevent flooding, reduce erosion and phosphorus losses and study the drought mitigation potential. In co-creation with stakeholders, we followed the implementation process to evaluate possible barriers and goal conflicts. For example, if farmers and landowners can be compensated to protect downstream areas (prevent economic losses linked to infrastructure/housing) this would promote uptake of upstream flood retention measures. However, there may be obstacles in current legislation.

How to cite: Geranmayeh, P., Djodjic, F., Lannergård, E., Collentine, D., and Futter, M.: FLOODtool – mapping water storage potential and evaluating institutional barriers, EGU General Assembly 2026, Vienna, Austria, 3–8 May 2026, EGU26-10364, https://doi.org/10.5194/egusphere-egu26-10364, 2026.

Leaky dams are an in-channel nature-based solution and a natural flood management intervention constructed in headwater streams to reduce runoff rates and attenuate flood peaks. Despite their widespread implementation, their hydraulic performance under high-flow conditions remains poorly constrained due to a lack of high-resolution observations when dams are actively storing floodwater. This lack of detailed performance characterisation is a barrier to uptake, particularly among the engineering community that designs flood mitigation schemes. This study presents the first application of Space-Time Image Velocimetry (STIV) to quantify surface flow velocities upstream and downstream of channel-spanning (≥4 m wide) leaky dams under controlled, repeatable high-flow conditions. Experiments were conducted along a 170 m white water rafting course, providing an intermediary setting between laboratory flumes and natural catchments that enables controlled flows. Three channel-spanning leaky dams were installed in sequence and tested using both natural (pine log) and engineered (pre-cut commercial timber) designs with systematically varied degrees of leakiness. Drone-based imagery was analysed using STIV to derive spatially distributed surface velocities, which were coupled with a maximum entropy method to estimate discharge.

Results demonstrate that dam leakiness is the dominant control on both upstream and downstream flow velocities. Velocities upstream of the dams decreased linearly with reduced leakiness (R² up to 0.97), while velocities downstream of the dams increased due to flow acceleration through dam gaps, revealing a clear trade-off between upstream flow attenuation and downstream jet strength. When arranged in sequence, leaky dams produced a cumulative reach-scale effect, with mean upstream velocities decreasing by approximately 0.15 m s⁻¹ per dam along the experimental reach. A full-scale partial dam failure was also captured, showing a rapid increase in downstream velocity and highlighting the transient residual flood risk associated with structural compromise.

These findings provide new empirical insights into the hydraulic functioning, cumulative effects, and failure behaviour of leaky dams, while demonstrating the value of STIV as a non-invasive tool for monitoring these interventions under high-flow conditions.

How to cite: Jones, A., Knapp, J., and Reaney, S.: Using Space-Time Image Velocimetry to assess characteristics of flow through full-scale leaky dams for flood hazard reduction, EGU General Assembly 2026, Vienna, Austria, 3–8 May 2026, EGU26-10434, https://doi.org/10.5194/egusphere-egu26-10434, 2026.

EGU26-11865 | ECS | Posters on site | ITS4.9/HS12.5

Stakeholder-Driven Prioritisation of Nature-Based Solutions in a Volcanic Lake Basin 

Chiara Iavarone, Raffaele Pelorosso, Giulia Mancini, Perla Rivadeneyra, Federico Cornacchia, Sebastian Raimondo, Alessio Patriarca, Fabio Recanatesi, Carlo Giupponi, and Maria Nicolina Ripa

Soil erosion, surface runoff, and nutrient losses are critical processes linking environmental degradation with social and economic pressures, particularly in multifunctional landscapes where agricultural production, ecosystem conservation, and local livelihoods coexist. In such contexts, the effectiveness of Nature-Based Solutions (NBS) depends not only on biophysical performance but also on their social feasibility and acceptance. This study explores how structured science–society interaction can support participatory planning of NBS in an erosion-prone socio-ecological system.

The research is developed within the Horizon Europe EUROLakes project and focuses on the Lake Vico volcanic basin (Central Italy), a unique landscape where high natural value, hazelnut cultivation, and strong cultural, recreational, and identity-related ties to the lake coexist. Increasing erosion-driven runoff and nutrient transport are contributing to declining water quality and eutrophication, highlighting the urgent need to balance human pressures and ecosystem functioning to avoid further degradation of the lake’s water ecosystem.

Environmental analyses of erosion processes and nutrient pathways were used as a shared knowledge base to support dialogue with local actors. Stakeholder mapping, workshops, and focus groups were adopted as key methodological steps to identify feasible management interventions and alternative scenarios aimed at improving water quality and erosion issues, while preserving community identity and agricultural productivity. Building on this process, a participatory workshop was conducted using a digital Participatory Multicriteria Analysis (PMCA), implemented through a tailored version of the consolidated MULINO Decision Support System (mDSS), and structured around the 4 Returns Framework to jointly evaluate NBS-oriented options across natural, social, financial, and inspirational returns.

Preliminary results from the participatory assessment contributed to the identification of priority intervention themes and informed the evaluation of alternative management options within the EUROLakes project. By integrating scientific indicators with experiential and place-based knowledge within a single decision-support process, the approach makes trade-offs explicit and fosters collective learning. The study contributes to interdisciplinary debates by demonstrating how environmental and social sciences can jointly support the co-design of context-sensitive NBS in sensitive lake landscapes

How to cite: Iavarone, C., Pelorosso, R., Mancini, G., Rivadeneyra, P., Cornacchia, F., Raimondo, S., Patriarca, A., Recanatesi, F., Giupponi, C., and Ripa, M. N.: Stakeholder-Driven Prioritisation of Nature-Based Solutions in a Volcanic Lake Basin, EGU General Assembly 2026, Vienna, Austria, 3–8 May 2026, EGU26-11865, https://doi.org/10.5194/egusphere-egu26-11865, 2026.

EGU26-12082 | ECS | Orals | ITS4.9/HS12.5

Exploring spatial effectiveness of NBS measures for flood mitigation with OpenLISEM 

Meindert Commelin, Jantiene Baartman, Reynold Chow, and Victor Jetten

Nature based solutions (NBS) are often considered as one of the potential measures to improve the flood resilience of landscapes. In the Geul catchment, located in eastern Belgium and the south of the Netherlands, the severe flooding event of summer 2021 significantly increased attention on the potential for NBS. Although many stakeholders and institutes see potential value of implementing NBS in the catchment, many uncertainties about their effectiveness hamper fast action and decision making. Applying a spatially distributed model to explore the potential of NBS on local and regional scales, can provide valuable answers to the question of which NBS, and in which spatial configuration can minimize flood risk.


Within the LandEX project, funded by Water4All, the aim is to study how the spatial distribution of NBS can improve the resilience of landscapes against hydroclimatic extremes. One of the case study areas in this project is the Geul catchment. We applied the OpenLISEM model to multiple sub catchments of the Geul river to quantify the effectiveness of multiple NBS for flood risk reduction, which were selected based on a participatory workshop. The study investigates how the catchment characteristics like land use, slope steepness and management, as well as the spatial placement and configuration of NBS influence the effectiveness to reduce flood risks. A secondary result of this study is the further exploration of approaches to parametrize NBS in a process-based model. The results of this application of OpenLISEM can be used to further understand the processes influenced by NBS and how to include these in modelling and scenario analyses. In addition, local stakeholders and decision makers can use the modelling results as a basis for the spatial implementation of NBS.

How to cite: Commelin, M., Baartman, J., Chow, R., and Jetten, V.: Exploring spatial effectiveness of NBS measures for flood mitigation with OpenLISEM, EGU General Assembly 2026, Vienna, Austria, 3–8 May 2026, EGU26-12082, https://doi.org/10.5194/egusphere-egu26-12082, 2026.

EGU26-12520 | ECS | Orals | ITS4.9/HS12.5

The many roles of nature in carbon-neutral cities 

Jessica Page and Amir Rezvani

Cities are home to an increasing majority of the world’s growing population, and are responsible for more than half of global greenhouse gas (GHG) emissions (IPCC, 2023). Cities will need to make use of carbon sinks in order to achieve net-zero emissions according to the timelines of their various climate action commitments, as laid out in e.g. the Paris Agreement (United Nations, 2023). Even cities which have made significant progress towards ambitious climate goals, such as Stockholm, Sweden, will need to focus on maintaining and growing carbon sequestration capacity in addition to further reducing emissions if they are to meet their goals (Page et al., 2025, 2021).

Nature-based solutions (NBS) can help cities to take action for both climate change adaptation and mitigation, while also improving the health and wellbeing of their residents (Chiabai et al., 2018, Kalantari et al., 2018). Our research finds that NBS can play a significant role in reducing emissions in cities, and that they have the potential to help accelerate the transition towards net-zero in many cities (Cong et al., 2023; Pan et al., 2023).

Using modelling, we investigate how NBS can be combined with other urban planning and policy actions, seeking to understand i) how to design city-wide NBS implementations which maximise both climate change mitigation and adaptation benefits, and ii) how best to integrate NBS into existing climate action plans for accelerated net-zero transitions.

References:

Chiabai, A., Quiroga, S., Martinez-Juarez, P., Higgins, S., Taylor, T., 2018. The nexus between climate change, ecosystem services and human health: Towards a conceptual framework. Science of The Total Environment 635, 1191–1204. https://doi.org/10.1016/j.scitotenv.2018.03.323

Cong, C., Pan, H., Page, J., Barthel, S., Kalantari, Z., 2023. Modeling place-based nature-based solutions to promote urban carbon neutrality. Ambio 52, 1297–1313. https://doi.org/10.1007/s13280-023-01872-x

IPCC, 2023. Climate Change 2023: Synthesis Report. Contribution of Working Groups I, II and III to the Sixth Assessment Report of the Intergovernmental Panel on Climate Change. IPCC, Geneva, Switzerland.

Kalantari, Z., Ferreira, C.S.S., Keesstra, S., Destouni, G., 2018. Nature-based solutions for flood-drought risk mitigation in vulnerable urbanizing parts of East-Africa. Current Opinion in Environmental Science & Health, Sustainable soil management and land restoration 5, 73–78. https://doi.org/10.1016/j.coesh.2018.06.003

Page, J., Kareflod, V., Kåresdotter, E., 2025. Chapter 1.1 - Forests for climate change mitigation: Temporal dynamics of carbon sequestration in the forests of Stockholm County, in: Pan, H., Kalantari, Z., Ferreira, C., Cong, C. (Eds.), Nature-Based Solutions in Supporting Sustainable Development Goals. Elsevier, pp. 3–24. https://doi.org/10.1016/B978-0-443-21782-1.00001-4

Page, J., Kåresdotter, E., Destouni, G., Pan, H., Kalantari, Z., 2021. A more complete accounting of greenhouse gas emissions and sequestration in urban landscapes. Anthropocene 34, 100296. https://doi.org/10.1016/j.ancene.2021.100296

Pan, H., Page, J., Shi, R., Cong, C., Cai, Z., Barthel, S., Thollander, P., Colding, J., Kalantari, Z., 2023. Potential contribution of prioritized spatial allocation of nature-based solutions to climate neutrality in major EU cities. [Manuscript]. https://doi.org/10.21203/rs.3.rs-2399348/v1

United Nations, 2023. The Paris Agreement [WWW Document]. United Nations Climate Change. URL https://unfccc.int/process-and-meetings/the-paris-agreement (accessed 9.20.23).

How to cite: Page, J. and Rezvani, A.: The many roles of nature in carbon-neutral cities, EGU General Assembly 2026, Vienna, Austria, 3–8 May 2026, EGU26-12520, https://doi.org/10.5194/egusphere-egu26-12520, 2026.

EGU26-13402 | ECS | Posters on site | ITS4.9/HS12.5

What drives landowners to adopt nature-based retention in a fragile Mediterranean landscape? 

Margherita Dagnino and Michele Pezzagno

As climate change intensifies hydro-meteorological extremes across Europe, nature-based solutions (NBS) are increasingly promoted as effective tools for flood risk reduction while delivering multiple environmental co-benefits. Most NBS, however, are implemented through small, locally driven interventions rather than large-scale programmes, and their role in fragmented landscapes depends strongly on who owns and manages the land. While public authorities have expanded their engagement through policy frameworks and funding schemes, flood-relevant NBS on private land remain largely shaped by individual landowner decisions.

This research presents comparative case studies from the Liguria region (north-western Italy), where steep slopes, dense drainage networks and widespread land abandonment have increased runoff, erosion and flood risk. In this context, private landowners are often the main actors maintaining or restoring landscape features such as terraces, dry-stone walls, small drainage systems and vegetated retention structures that influence local water retention and flow pathways.

Based on semi-structured interviews with private landowners who have realised such interventions, the study analyses the background for their decisions, through the following aspects: (i) landowners’ relationships with their land (productive, recreational or mixed); (ii) the motivations driving their engagement in nature-based water and land management; (iii) the role of financial, technical and social support in enabling implementation; and (iv) the environmental and socio-economic effects perceived after the interventions. The analysis follows an established framework for understanding private initiatives in natural water retention under different institutional and territorial conditions.

The work provides empirical examples of how nature-based solutions are initiated and implemented by private actors in a specific, hydro-geologically fragile landscape. By documenting motivations, enabling conditions and perceived outcomes, the study contributes to the growing research field on NBS by offering grounded evidence from local practice, supporting the design of more effective policies and incentive schemes for wider uptake.

How to cite: Dagnino, M. and Pezzagno, M.: What drives landowners to adopt nature-based retention in a fragile Mediterranean landscape?, EGU General Assembly 2026, Vienna, Austria, 3–8 May 2026, EGU26-13402, https://doi.org/10.5194/egusphere-egu26-13402, 2026.

EGU26-13804 | ECS | Orals | ITS4.9/HS12.5

Barriers to and opportunities for natural capital accounting: Lessons from Ireland 

Darren Clarke, Jimmy O'Keeffe, Felix Sinnott, Niamh Cullen, Valerie McCarthy, Maya Clinton, and Mary Bourke

Like many European countries, Ireland faces numerous threats from climate change and environmental degradation, including biodiversity loss, falling water quality, and property damage due to extreme weather events. Ireland is also one of the EU’s highest emitters of greenhouse gases per capita, and almost a third of its EU-protected species and 85% of its EU-protected habitats are in unfavourable status. Whilst natural resources are under threat, they can also offer solutions to these environmental challenges. Properly managed land can provide large-scale nature-based solutions to challenges including carbon sequestration, flood risk, biodiversity enhancement, and water quality. With agricultural land comprising 68% of Ireland’s land area, the agriculture sector is central to environmental improvements nationally. Natural Capital Accounting (NCA) has been identified as a key tool to measure and track natural resource stocks vital for life, including those resources provided on agricultural land. Major EU policies and legislation, including the European Green Deal, Biodiversity Strategy for 2030 and the Nature Restoration Law promote NCA as a critical tool for EU Member States achieving EU environmental policy commitments. Mandatory NCA reporting at an EU level is also expected imminently. Despite this urgency, uptake of NCA in policy and practice remains poor both in Ireland and elsewhere across the EU. FARM-NC, an Irish Environmental Protection Agency funded project, aims to promote NCA as a critical tool in policy and practice through evidence-based monitoring and evaluation of ecosystem services at farm-level. Drawing on interviews with key agricultural stakeholders in Ireland (n=30), including policymakers, industry representatives, researchers, sustainability practitioners and farmers in 2025-2026, we present preliminary insights on the barriers that currently constrain uptake of NCA in policy and practice and identify recommendations to overcome these barriers. The results show that barriers are centred around three key aspects: (i) digital and technical feasibility challenges related to data capture, data quality, accuracy and trust, training and expertise; (ii) the internal design of NCA, including how complexity, simplification, and comparability are handled within the accounting framework itself, which makes it difficult for policymakers and practitioners to define the parameters to base natural capital accounts on, and; (iii) weak regulations, incentives and political leadership to demonstrate benefits of NCA to diverse stakeholders. We identify several recommendations to overcome these barriers in policy and practice, which have relevance beyond Ireland, particularly given the aforementioned EU policy and legislative direction aiming to mandate NCA reporting to improve environmental outcomes. Our findings and recommendations could greatly support these efforts.

How to cite: Clarke, D., O'Keeffe, J., Sinnott, F., Cullen, N., McCarthy, V., Clinton, M., and Bourke, M.: Barriers to and opportunities for natural capital accounting: Lessons from Ireland, EGU General Assembly 2026, Vienna, Austria, 3–8 May 2026, EGU26-13804, https://doi.org/10.5194/egusphere-egu26-13804, 2026.

EGU26-15927 | ECS | Posters on site | ITS4.9/HS12.5

Effective land use policy to protect wetlands as nature-based solutions: the Ontario’s Greenbelt study case 

Jullian Sone, Iban Ortuzar, Roy Brouwer, and Leila Eamen

Wetlands can serve as nature-based solutions for flood control, carbon sequestration, and biodiversity support but have faced increasing pressure from urban growth. This has led to the development of land protection policies such as the Greenbelt, which was designed to protect wetlands and prime farmland from the expansion of the Greater Toronto Area in Southern Ontario, Canada. This region is home to over a third of the Canadian population and one of the most productive soils in the country, fact that exacerbate competition for land between these two uses. Furthermore, urban land has substantially expanded over ecologically and socially valuable wetlands, raising questions about transition drivers and how effective the three Greenbelt designations are: Niagara Escarpment, Oak Ridges Moraine, and Protected Countryside.

This study thus investigates the role played by the three different Greenbelt designations in preventing further wetland conversion in Southern Ontario between 2000 and 2020 by estimating a land-use shares spatial model. We used remote-sense-based land use and cover maps, aggregated over 241 Ontario’s census subdivisions, and explanatory variables representing socioeconomic drivers and biophysical characteristics such as population density, farm income, temperature, precipitation, and soil suitability for agriculture.

As expected, population density, farm income, and mainly household income are major socioeconomic drivers of wetlands conversion to urban land and cropland. In terms of wetlands being converted to cropland areas, temperature and precipitation are also important drivers, although with much smaller coefficients’ magnitude compared to the socioeconomic drivers. This underscores the potential impacts of a warming climate on future conversion of wetlands and peatlands in Northern Ontario, where most of the Canadian Peatlands are located. Turning to the policy barriers to further wetland loss, both Niagara escarpment and the Oak Ridges Moraine has been effective in preventing further conversion of wetlands to urban areas, but they are not statistically significant for transitions between wetlands and croplands. These two Greenbelt designations were designed to protect the natural landscape of the Niagara Escarpment, fauna and headwaters. The protected countryside was specifically created to protect not only wetlands but also agricultural lands, and we observed that this designation did not show up statistically significant for urban expansion over cropland areas. Wetland areas have yet increased in areas within this policy area domain.

Southern Ontario is one of the most rapidly growing regions in Canada, surpassing the national average growth rate. This rate is expected to further increase as the province population is projected to grow by more than 40% in the coming three decades. Our results reveal the urgent need for continuous monitoring of land use policies aimed to protect nature-based solutions such as wetlands, especially peatlands due to their ability to act as a sink of greenhouse gases and, therefore, potential for mitigating climate change. With a warming climate, the conflict over land allocation for urban and agricultural development may push agricultural uses to the Northern part of the province, triggering unprecedented wetland and peatland disturbance and conversion.

How to cite: Sone, J., Ortuzar, I., Brouwer, R., and Eamen, L.: Effective land use policy to protect wetlands as nature-based solutions: the Ontario’s Greenbelt study case, EGU General Assembly 2026, Vienna, Austria, 3–8 May 2026, EGU26-15927, https://doi.org/10.5194/egusphere-egu26-15927, 2026.

Globally, Urban Parks are key infrastructure for climate adaptation. Many studies report that urban parks have positive effects and advantages, for example by absorbing carbon, cooling urban areas, reducing air pollution and reducing stormwater runoff. However, there is still a gap between research and practice. Research often relies on specific assumptions and controlled conditions, and results are sometimes criticized as difficult to apply in real design and construction settings. These limitations make it challenging to translate scientific findings into practical landscape-design solutions. In the Republic of Korea, the government-owned Korea Land and Housing Corporation (LH) which commissions and manages large public development projects has been working to strengthen design approaches that better connect research and on the ground practice. In this background, this study proposes method and tool for public institutions (including organizations like LH) to assess landscape design’s potential functions of adapting climate changes.

This study addresses three key adaptation functions in urban parks, such as carbon uptake, temperature reduction, and runoff reduction. Our approach has two parts. First, we identify design factors to enhance both park’s functions and designer’s understanding. Second, we develop simple assessment methods that can estimate each function based on those design factors. So, we describe the mechanisms behind each function, define conditions that make the assessment easier to apply, and refine the framework through expert input.

Importantly, we focused on practical applicability. We have maintained ongoing communication with LH and design professionals throughout the process. As a result, the proposed method can support real-world decision-making in public projects and may also be transferable to other countries. We present this study as a meaningful step toward narrowing the gap between theory and practice in climate-adaptive landscape design.

How to cite: Choi, J., Kim, Y., and Park, C.: Development tool to assess urban Park design for climate adaptation in public institutions of managing landscape-architecture, EGU General Assembly 2026, Vienna, Austria, 3–8 May 2026, EGU26-16054, https://doi.org/10.5194/egusphere-egu26-16054, 2026.

EGU26-16323 | ECS | Posters on site | ITS4.9/HS12.5

Co-creating strategies to implement nature-based solutions for flood and drought risk: insights from the Geul Basin, the Netherlands 

Shahana Bilalova, Marije Schaafsma, and Laurine de Wolf

Nature-based solutions (NbS) are increasingly promoted to address climate change while delivering multiple benefits. In the Geul Basin in the south of the Netherlands, interest in NbS has increased notably following the 2021 flood. This has led to a growing number of initiatives by both governmental and non-governmental actors. Despite this interest, uncertainties remain regarding which NbS options should be prioritized, accounting for not only their disaster risk reduction benefits but also their co-benefits and stakeholder preferences, and how these measures can be combined and sequenced over time. This study presents the outcomes of a workshop conducted with a diverse group of stakeholders from different sectors in the Geul Basin, combining multi-criteria analysis (MCA) with the adaptation pathway approach. Workshop participants jointly assessed NbS options using agreed and weighted socio-economic and ecological criteria. The MCA results informed the co-development of adaptation pathways, exploring how preferred NbS options can be sequenced under changing climate conditions and identifying enabling conditions, such as governance, financing, and land-use arrangements, required for their implementation.

Results show that participants prioritised flood protection and highlighted the importance of sustainable financial models to support measures in the long term. Based on the ranking of measures, forest-based and wetland measures, such as (food) forests, alluvial forests, and wetlands, emerged as the top solutions. In the pathway exercise, these measures are sequenced later in the timeline, while the enabling conditions necessary for their implementation are already underway at an early stage. Finally, the pathway exercise revealed the importance of combining different measures and upscaling them, given the limitations of a single NbS measure in fully addressing flood and drought extremes. At the same time, land use and financing remained the key conditions for the successful implementation of the pathway.

How to cite: Bilalova, S., Schaafsma, M., and de Wolf, L.: Co-creating strategies to implement nature-based solutions for flood and drought risk: insights from the Geul Basin, the Netherlands, EGU General Assembly 2026, Vienna, Austria, 3–8 May 2026, EGU26-16323, https://doi.org/10.5194/egusphere-egu26-16323, 2026.

EGU26-16430 | Posters on site | ITS4.9/HS12.5

Deep Learning–Based Vegetation Feature Detection for UAV-Derived Geomorphic Change Monitoring 

Wen-Ping Tsai, Chieh-Kai Yang, and Hsiao-Wen Wang

This study presents a data-driven framework that integrates deep learning and UAV-based remote sensing for geomorphic change detection. A Mask R-CNN model is trained to identify specific plant species from high-resolution orthoimagery, treating vegetation as spatially persistent surface features. The detected plant locations are georeferenced and represented as coordinate-based point datasets, enabling quantitative analysis of surface displacement through multi-temporal comparisons. The framework is demonstrated in the Guanziling region of southern Taiwan, a tectonically active area influenced by the Chukou Fault. Results indicate that temporal changes in the spatial distribution of detected vegetation effectively capture subtle surface deformation patterns that are difficult to observe using conventional image-based approaches. Compared with LiDAR surveys, the proposed method significantly reduces data acquisition costs while preserving essential spatial information for geomorphic analysis. Beyond monitoring applications, the resulting vegetation-based spatial datasets provide new opportunities for integration with physics-based geomorphic and geotechnical models, supporting data-driven model calibration, validation, and predictive assessment. Overall, this study highlights the potential of deep learning–enabled feature detection to advance scalable, cost-effective, and interpretable geomorphic monitoring in complex natural environments.

How to cite: Tsai, W.-P., Yang, C.-K., and Wang, H.-W.: Deep Learning–Based Vegetation Feature Detection for UAV-Derived Geomorphic Change Monitoring, EGU General Assembly 2026, Vienna, Austria, 3–8 May 2026, EGU26-16430, https://doi.org/10.5194/egusphere-egu26-16430, 2026.

EGU26-17073 | Orals | ITS4.9/HS12.5

Systems Oriented Design to facilitate participatory approaches for selecting nature-based solutions to reduce flooding and landslides – experiences from two Norwegian municipalities 

Amy Oen, Anders Solheim, Amanda Di Biagio, Vittoria Capobianco, Ingar Steinholt, and Francoise Bigillon

Nature‑based solutions (NbS) act as a catalyst for large‑scale transformations in vulnerable landscapes, enhancing climate adaptation by reducing exposure to climate‑related hazards and strengthening ecosystem resilience. In doing so, they also deliver valuable co‑benefits, including richer biodiversity and more robust, functional ecosystems. Addressing the complexity to fully mainstream NbS for climate adaptation requires the capacity to manage cross‑sectoral problems and to foster collaboration across multiple levels of governance, networks, and partnerships. Although interdisciplinary work which promotes mutual understanding is widely recognised as essential for effective climate action, achieving it in practice remains challenging.

To address this challenge, a Systems Oriented Design (SOD) approach was employed to operationalise interdisciplinarity in the design and implementation of participatory processes. This approach supported a shared understanding of local needs related to the placement and selection of specific NbS interventions in two Norwegian municipalities, each facing distinct landscape hazards based on the local contexts. The two case study sites include the Hølenselva watershed in Vestby municipality, which is representative of the south‑eastern region of Norway. The area faces challenges such as landslides in sensitive marine clays, poor water quality in the catchment due to agriculture and landscape modifications that have increased the risk of flooding. The second case study site is in Aurland municipality and reflects the country’s west coast fjord landscapes. The area consists of fjords and mountains, with small settlements concentrated in the lower river valleys. The steep mountainsides make the area prone to landslides and snow avalanches, and the narrow valleys are experiencing frequent flooding, intensified by climate change in recent years.

A SOD framework was developed to map complexity and gain insight into the case study sites. Working with a multidisciplinary team spanning social science, natural science, landscape architecture, and design, the system maps were analysed using a ZIPP approach to identify Zoom points, Ideas for interventions, as well as Problems and Potentials. These findings provided the basis for identifying leverage points for potential interventions in the system. After this preliminary mapping was completed, the maps and background documentation were presented to local stakeholders through two workshops conducted at each case study site to validate the system understanding, prioritise stakeholder needs, and introduce potential NbS options for their main concerns regarding natural hazards.

The presentation will illustrate the application of SOD as a basis for stakeholder involvement at the two case study sites, showing how stakeholders understood system complexity and helped identify potential NbS to reduce flooding and landslide risk. It will also highlight challenges and positive experiences and provide examples of how stakeholder input informed the modelling and monitoring of selected NbS interventions that are not yet implemented and may be taken forward in future planning.

How to cite: Oen, A., Solheim, A., Di Biagio, A., Capobianco, V., Steinholt, I., and Bigillon, F.: Systems Oriented Design to facilitate participatory approaches for selecting nature-based solutions to reduce flooding and landslides – experiences from two Norwegian municipalities, EGU General Assembly 2026, Vienna, Austria, 3–8 May 2026, EGU26-17073, https://doi.org/10.5194/egusphere-egu26-17073, 2026.

EGU26-17161 | Orals | ITS4.9/HS12.5

Nature-based solutions for climate-resilient landscapes: governance and policy pathways for Nature Infrastructure implementation 

Tijana Nikolić-Lugonja, Nikola Obrenovic, Maria Kireeva, Sanja Brdar, and Maja Knezevic

Nature-based solutions (NbS) are central to achieving climate-resilient landscapes under the European Green Deal, the Sustainable Use Regulation (SUR), and the Nature Restoration Law (NRL). While scientific evidence demonstrates their ecological and hydrological benefits, large-scale uptake of NbS remains constrained by governance fragmentation, limited institutional capacity, and weak integration across land, water, and agricultural policies—particularly in southeastern Europe.

This contribution examines how Nature Infrastructure (NI) can function as a policy-operational framework for NbS implementation in agricultural landscapes, drawing on insights from the EU-funded Twinning Green Deal SONATA project in Serbia. NI encompasses natural and semi-natural landscape features that deliver multiple ecosystem services, including water regulation, biodiversity support, and climate adaptation. SONATA applies a Modelling, Mapping, and Monitoring (3M NI) approach to generate spatially explicit evidence that supports policy design, prioritization, and performance assessment of NbS. SONATA’s spatial tool enables single- and multi-objective spatial optimization in raster-based GIS environments, supporting evidence-based prioritization and scenario testing of NbS at the landscape and local scale.

A central focus is the role of the participatory framework (e.g., Living Labs) from the outset as governance instruments that bridge science, practice, and policy. By engaging farmers, water managers, conservation authorities, and policymakers in co-creation processes, Living Labs help align NbS interventions with local needs while strengthening institutional learning and policy coherence. The project highlights how participatory governance can reduce implementation barriers, enhance legitimacy, and support the mainstreaming of NbS within existing regulatory and funding frameworks.

The results underline the importance of integrated governance arrangements, spatial decision-support tools, and long-term monitoring systems for translating NbS from policy ambition into effective landscape-scale action. The NI framework offers a transferable pathway for embedding NbS into climate adaptation strategies, agri-environmental schemes, and land-use planning, contributing to more resilient and multifunctional landscapes across Europe.

How to cite: Nikolić-Lugonja, T., Obrenovic, N., Kireeva, M., Brdar, S., and Knezevic, M.: Nature-based solutions for climate-resilient landscapes: governance and policy pathways for Nature Infrastructure implementation, EGU General Assembly 2026, Vienna, Austria, 3–8 May 2026, EGU26-17161, https://doi.org/10.5194/egusphere-egu26-17161, 2026.

In response to the degradation of ecosystems caused by human activities and climate change, In order to protect the alpine ecosystems of the Tibetan Plateau, a number of major ecological projects have been carried out in the region since the end of the twentieth century, including the return of farmland to forests, the return of pasture to grassland, the protection of natural forests, and the construction of the Three Rivers Reserve. We integrates the United Nations' 2030 Sustainable Development Goals (SDGs) assessment framework and focuses on the ecosystem services and the SDGs as the two core indicators, to comprehensively assess the impacts on ecosystem services and sustainability of the Tibetan Plateau since the ecological projects have been implemented. The impacts of the ecological project on ecosystem services and sustainable development on the Tibetan Plateau since its implementation were comprehensively assessed, and the distribution of the key implementation areas of the ecological project under future climate and land use scenarios were explored.

As a result, since the implementation of the ecological project, the NDVI of the Qinghai-Tibet Plateau region shows an overall increasing trend, in which the areas with significant increase are concentrated in the northern and southeastern regions of the plateau, occupying 21.80% of the total area of the plateau; And the relationships among the three major groups of ecosystem provisioning services, regulating services and supporting services have maintained an overall synergistic relationship, so we suggest that the reference threshold for future implementation of ecological projects aiming at optimal provisioning of ecosystem services should be an NDVI of 0.7; Furthermore, Based on the ecosystem services contribution to SDGs (ESSDG) calculated in the framework of ‘ecosystem services-SDGs’, we found that the average ESSDG score of Qinghai-Tibet Plateau counties has increased from 40.32 to 42.42 and the spatial distribution has been higher in the southeast and higher in the northwest, and the spatial distribution has been higher in the south-east and higher in the north-west, which generally indicates that the level of development of the SDGs process on the Qinghai-Tibet Plateau is gradually higher than the level of ecosystem services provision; We also simulate four scenarios of future land use changes and three SSPs scenarios varied greatly among four climate scenarios on the Qinghai-Tibet Plateau. We draw a conclusion about the priority areas for future ecological project implementation under the different scenarios were mainly distributed in the southern and southeastern parts of the plateau.

How to cite: Dai, E.: Dynamic assessment of ecosystem service response and sustainable development on the Qinghai-Tibet Plateau in the context of ecological engineering, EGU General Assembly 2026, Vienna, Austria, 3–8 May 2026, EGU26-17993, https://doi.org/10.5194/egusphere-egu26-17993, 2026.

EGU26-18163 | Posters on site | ITS4.9/HS12.5

The development of a Whole-Farm Natural Capital (NC) Accounting Framework to support farm level decision making and sustainable land use practices. 

Jimmy O'Keeffe, Mary Bourke, Niamh Cullen, Valerie McCarthy, Darren Clarke, Maya Clinton, and Felix Sinnott

The environmental impacts of modern agricultural systems are well documented, with intensification contributing to declining water quality, increased greenhouse gas emissions, and significant biodiversity loss. In Ireland, these challenges are particularly acute: agricultural land accounts for approximately 68% of national land cover, meaning that solutions to the climate, biodiversity, water quality and flood risk crises are unattainable without meaningful engagement from the farming community. At the same time, Ireland’s farm structure is dominated by small holdings, with 36% of farms classified as small, generating less than €8,000 per annum. This highlights the need for approaches that support environmental outcomes while maintaining farm viability and the right to farm.


While farmers are increasingly recognised as central actors in delivering national climate and biodiversity commitments, many require practical tools and incentives to enable this transition. Natural capital accounting (NCA) has been identified by the State as a promising mechanism to support sustainable land management, implementation of nature based solutions and to potentially underpin payment for ecosystem services (PES) schemes that reward farmers for delivering public goods such as carbon sequestration, flood mitigation, improved water quality and biodiversity enhancement. However, NCA remains poorly integrated into farm-level decision-making, particularly for small and medium-sized farms.


The Irish EPA funded FARM-NC (Farming Resilience and Management through Natural Capital) project addresses this gap by developing a transferable and adaptable whole-farm natural capital accounting framework. The project is implemented across three representative small to medium-sized Irish case study farms containing diverse natural capital assets and ecosystem service potentials. Using a participatory, systems-based approach, farmers and other decision-makers are embedded throughout the framework design process. Farm-level natural capital is mapped, measured and monitored using a combination of uncrewed aerial vehicle (UAV) surveys, rapid ecological assessments and targeted water level monitoring in flood-prone areas. These data inform the development of whole-farm natural capital accounts, alongside a methodological guide to support wider uptake. The framework explicitly links environmental performance to livlihood outcomes by quantifying the benefits of natural capital management and developing practical sustainability metrics. Project outputs are translated into policy-relevant insights through direct engagement with policymakers, demonstrating how farm-scale NCA can support agri-environmental policy, PES schemes and nature-based solutions that enhance both environmental sustainability and farm resilience.

How to cite: O'Keeffe, J., Bourke, M., Cullen, N., McCarthy, V., Clarke, D., Clinton, M., and Sinnott, F.: The development of a Whole-Farm Natural Capital (NC) Accounting Framework to support farm level decision making and sustainable land use practices., EGU General Assembly 2026, Vienna, Austria, 3–8 May 2026, EGU26-18163, https://doi.org/10.5194/egusphere-egu26-18163, 2026.

The Upper Severn catchment on the border of England and Wales has been subject to regular floods over the past two decades with severe events recorded in 2020, 2021 and 2022. Coupled with updated climate change projections, these events have heightened the urgency of flood risk management among strategic and policy stakeholders. In this context, Natural Flood Management (NFM) has emerged as a promising approach to mitigate downstream flood impacts. Unlike conventional flood defences, which are usually centrally instigated and maintained, natural flood management requires buy-in from a wider range of stakeholders, including landowners and local communities.

Despite the potential benefits of NFM approaches, there are still some significant challenges to widespread implementation. Approaches to identifying opportunities are generally limited to traditional ground surveys, which typically require landowner buy-in from the outset, or large-scale opportunity mapping drawing on relatively coarse datasets. Furthermore, while pilot projects have demonstrated initial success, empirical evidence on the long-term effectiveness of NFM remains limited. This lack of robust data constrains stakeholder confidence and hinders broader adoption.

This paper will outline a demonstrator project, currently being delivered as part of the Environment Agency-funded Severn Valley Water Management Scheme in Shropshire, UK, which is investigating the potential of high-resolution satellite imagery, drone-based LiDAR survey, and real-time sensor data to improve the quantification of the impacts of NFM measures as well as high-resolution mapping of future opportunities. In parallel, the study examines strategies for effective stakeholder engagement, focusing on optimizing data visualization and communication to support informed decision-making and community participation. By combining advanced geospatial technologies with participatory approaches, the project aims to strengthen evidence-based implementation of NFM and contribute to resilient flood management in the Upper Severn catchment.

Keywords: Natural Flood Management (NFM), High-Resolution Remote Sensing, Drone-Based LiDAR, Stakeholder Engagement, Flood Resilience, Opportunity Mapping

How to cite: Mis, N. B. and Miles, A.: Opportunities, validation, and engagement: Application of Geospatial Technology and Realtime Sensors to Enhance Natural Flood Management , EGU General Assembly 2026, Vienna, Austria, 3–8 May 2026, EGU26-18962, https://doi.org/10.5194/egusphere-egu26-18962, 2026.

EGU26-19278 | Posters on site | ITS4.9/HS12.5

Catchment-scale assessment of small retention ponds as nature-based solutions in a Norwegian agricultural catchment using SWAT+ 

Mojtaba Shafiei, Csilla Farkas, Eva Skarbøvik, and Katrin Bieger

Small retention ponds are increasingly recognised as effective nature-based solutions for managing hydrological extremes in Norway’s agricultural catchments. Typically located in upper catchment areas or at the forest–agriculture interface, these ponds temporarily store runoff during intense rainfall events and snowmelt. In addition to flood mitigation, they provide important co-benefits by reducing soil erosion and sediment transport and by protecting agricultural drainage systems from erosion and overflow during extreme events, thereby supporting long-term soil productivity. Although individual storage volumes are limited, their cumulative impact at the catchment scale can be substantial when retention ponds are strategically distributed across the landscape. 

This study investigates the potential effects of small retention ponds using process-based hydrological modelling with SWAT+ to support catchment-scale climate adaptation planning in a Norwegian agricultural catchment. SWAT+ enables an improved representation of hydrological connectivity between managed landscapes and the stream network through its flexible spatial structure and rule-based management algorithms. The model is calibrated using a constraint-based approach that integrates both soft and hard data to represent streamflow and sediment dynamics in the Lierelva catchment. Multiple retention ponds are implemented to assess their cumulative effects on streamflow and sediment transport. Finally, the study discusses key challenges associated with modelling catchment–NBS interactions using SWAT+.

How to cite: Shafiei, M., Farkas, C., Skarbøvik, E., and Bieger, K.: Catchment-scale assessment of small retention ponds as nature-based solutions in a Norwegian agricultural catchment using SWAT+, EGU General Assembly 2026, Vienna, Austria, 3–8 May 2026, EGU26-19278, https://doi.org/10.5194/egusphere-egu26-19278, 2026.

Climate change, with increasingly severe impacts such as droughts and floods, necessitates rapid efforts toward cross-sectoral adaptation strategies, while administrative and practical collaboration for integrated landscape management remains at an early stage. Obstacles that keep the climate change adaptation gap widely open – both at local and regional scales – include, for example, the insufficient implementation of geoscientific four-dimensional (4D) thinking in spatial planning, nature conservation, etc. With our concept of “Landscape Pleofunctionality” (from Greek pleōn: "more, beyond") that incorporates the functional and interactional diversity of above- and belowground landscape elements, we undertake a double paradigm shift. First, the two-dimensional “map view” of landscapes is replaced by a natural 4D perspective that explicitly accounts for subsurface geodiversity (Aehnelt and Totsche, 2025; Lehmann et al., 2025) and the contribution and interlinkage of the subsurface space to landscape element functions such as water retention and purification. One key aspect is the recognition of the role of the thick aeration zone (sensu Lehmann et al., 2026; Lehmann and Totsche, 2020) beneath topographic highs (groundwater recharge areas). This neglected yet pivotal subsurface domain is particularly exposed to climate change yet provides considerable functions that can be leveraged to support numerous adaptation goals, with a focus on nature-based solutions. Second, the strict land-use benefit-oriented perspective (“maximation approach”) in practical planning and theory is replaced by a requirement to optimize the services of the pleofunctional landscape elements (“optimization approach”) and their multi-sectoral demands. Utilizing our holistic approach, we enable a deeper, cross-sectoral, and transferable understanding of surface–subsurface landscape functioning, provide a framework for the effective deployment of nature-based solutions (NBS) through appropriate site selection and monitoring, and promote the integration of science, practice, and policy. We’ll present practical examples of how the concept enables addressing local and subregional issues and nature-based solutions, for example, for water suppliers in Hesse and Thuringia in promoting landscape water storage, groundwater recharge, and explaining contamination pathways.


References:

Aehnelt, M., Totsche, K.U. (2025). From rock to soil: Saprock genesis and its legacy for subsoil structure and micro-aggregate formation during pedogenesis. Geoderma 459, 117356, https://doi.org/10.1016/j.geoderma.2025.117356

Lehmann, K., Arachchige, D. E., Lehmann, R., Overholt, W. A., Küsel, K., Totsche, K. U. (2026). Neglected but pivotal: Complex matter dynamics in the aeration zone contribute to groundwater quality evolution. Water Research: 125287. https://doi.org/10.1016/j.watres.2025.125287

Lehmann, R., Totsche, K. U. (2020). Multi-directional flow dynamics shape groundwater quality in sloping bedrock strata. Journal of Hydrology 580: 124291. https://doi.org/10.1016/j.jhydrol.2019.124291

How to cite: Lehmann, R. and Totsche, K. U.: Landscape Pleofunctionality: an integrated surface–subsurface perspective for advancing transformative change and climate-change adaptation, EGU General Assembly 2026, Vienna, Austria, 3–8 May 2026, EGU26-20003, https://doi.org/10.5194/egusphere-egu26-20003, 2026.

EGU26-20235 | ECS | Posters on site | ITS4.9/HS12.5

Integrating Natural Capital Accounting to Evaluate Nature-Based Solutions in Agricultural Landscapes 

Maya Clinton, Jimmy O'Keeffe, Mary Bourke, Darren Clarke, Niamh Cullen, Valerie McCarthy, and Felix Sinnott

Nature-based solutions (NbS) are increasingly recognised as effective and multifunctional approaches for addressing an array of environmental concerns in agricultural landscapes. However, their wider adoption remains constrained by limited integration of evidence at farm scale, and by the absence of transferable frameworks that support systematic assessment and decision making.

This contribution presents an integrated whole farm natural capital accounting framework for evaluating NbS performance in agricultural systems, developed within the EPA-funded FARM-NC (Farm-level Natural Capital) programme in Ireland. The framework combines high resolution spatial data, ecological field surveys, and water monitoring with spatial analysis and systems based modelling to quantify ecosystem services related to water regulation, flood and runoff attenuation, carbon storage, and habitat provision. Natural capital accounts are structured in alignment with international standards, including the System of Environmental-Economic Accounting – Ecosystem Accounting (SEEA-EA) and State-and-Transition models, enabling consistency, comparability, and scalability across sites.

The approach is applied across three small to medium sized farms representing diverse land use configurations and natural capital assets. Initial analyses focus on identifying NbS opportunities for enhancing hydrological resilience, including the role of semi-natural habitats, riparian features, and land-cover heterogeneity in influencing flow pathways and water retention.

By integrating biophysical assessment with economic and governance relevant metrics, this work advances the scientific basis for evaluating NbS at farm scale and supports their targeted placement and monitoring in agricultural landscapes. The framework provides a transferable foundation for informing agri-environmental policy, incentive mechanisms, and resilience planning, contributing to more sustainable land and water management under changing climatic conditions.

How to cite: Clinton, M., O'Keeffe, J., Bourke, M., Clarke, D., Cullen, N., McCarthy, V., and Sinnott, F.: Integrating Natural Capital Accounting to Evaluate Nature-Based Solutions in Agricultural Landscapes, EGU General Assembly 2026, Vienna, Austria, 3–8 May 2026, EGU26-20235, https://doi.org/10.5194/egusphere-egu26-20235, 2026.

EGU26-20280 | Orals | ITS4.9/HS12.5

Wetlands as Nature-Based Solutions for Flood Mitigation: Insights from the Timiș River, Romania 

Carla S. S. Ferreira, Aart van Harten, Rares Halbac-Cotoara-Zamfir, and Zahra Kalantari

As flood risks intensify across Europe, nature-based solutions (NBS) such as wetlands are gaining increasing attention for their potential to mitigate flooding while delivering multiple co-benefits. However, decision-making authorities often lack robust, site-specific scientific evidence to support the implementation of such measures. Flooding along Romania’s upper Timiș River poses recurrent risks to rural communities and agricultural land, prompting the Romanian public water management authority (ABA Banat), within the European LAND4CLIMATE project, to seek scientific support for evaluating NBS-based flood mitigation options.

This study assesses the extent to which a network of constructed wetlands could reduce flood risk in the Upper Timiș catchment (2,750 km²). A GIS-based multi-criteria analysis incorporating slope, soil permeability, and land-use constraints identified thirteen potential wetland sites—six side-channel wetlands, three main-channel wetlands, and four abandoned gravel pits converted into wetlands—covering approximately 0.8% of the catchment area. Using the semi-distributed SWAT+ hydrological model, four wetland implementation scenarios were developed and simulated for the 2015–2016 period, reflecting stable land-use conditions: (1) side-channel wetlands only, (2) main-channel wetlands only, (3) gravel-pit reconnection, and (4) a combined scenario including all wetland types. Model calibration (from 01-01-2012 until 31-12-2014) and validation (from 01-01-2015 until 31-12-2017) of daily discharge dynamics showed satisfactory performance (Kling–Gupta Efficiency = 0.69 vs 0.65, Nash–Sutcliffe Efficiency = 0.43 vs 0.34, Percent Bias = +13% vs +20%, respectively), supporting the use of the model for scenario analysis. Results indicate that the combined scenario achieved the strongest flow attenuation at the catchment outlet, reducing above-90th-percentile peak flows by an average of 3.1%. Individual configurations yielded more limited reductions (0.4–0.7%), although side-channel wetlands reduced tributary peak flows by up to 11%. Sensitivity analyses further revealed diminishing marginal gains from increased wetland storage unless wetland area approaches 5–10% of the catchment.

Overall, the findings suggest that under current land-use constraints, wetlands alone are insufficient to deliver substantial catchment-scale flood mitigation in the Upper Timiș. Nevertheless, they provide meaningful local attenuation and important co-benefits, including habitat creation and improved water quality. Achieving larger-scale flood risk reduction will require a significant expansion of wetland area, integration with complementary NBS (e.g. riparian reforestation), or the adoption of hybrid green–grey flood management strategies.

How to cite: Ferreira, C. S. S., van Harten, A., Halbac-Cotoara-Zamfir, R., and Kalantari, Z.: Wetlands as Nature-Based Solutions for Flood Mitigation: Insights from the Timiș River, Romania, EGU General Assembly 2026, Vienna, Austria, 3–8 May 2026, EGU26-20280, https://doi.org/10.5194/egusphere-egu26-20280, 2026.

EGU26-20783 | Posters on site | ITS4.9/HS12.5

Sponge Measures for Natural Flood Management in Agricultural Landscapes: Water Retention Effectiveness, Co/Dis-Benefits, and Hydro-Geomorphic Change in Nature-based Solutions in the Upper Thames, UK 

Alejandro Dussaillant, Neeraj Sah, James Blake, Ponnambalam Rameshwaran, James Bishop, John Robotham, Charles George, Cedric Laize, Nick Everard, Peter Scarlett, Manuel-Ángel Dueñas-López, and Gareth Old

Floods and droughts pose significant threats to both human communities and natural landscapes. The EU Horizon SpongeScapes project (www.spongescapes.eu 2023-2027) aims to enhance landscape resilience against these hydrometeorological extremes by exploring "landscape sponge functions" – the natural ability of landscapes to absorb, store, and gradually release water. This project includes research in various “sponge measures” (i.e., Nature-based Solutions (NbS) and/or hybrid interventions) across European sites with varying climates, geographies, and soil conditions, to address three main research questions: (1) what is the longer-term effectiveness of sponge measures (and what indicators/metrics are more adequate to monitor change); (2) what is the overall effect of all sponge measures in a catchment (i.e. of sponge strategies); and (3) what are the main co-benefits and tradeoffs of sponge measures and strategies?

Here we will present findings from one of the SpongeScapes sites, in an agricultural sub-catchment of the Thames basin where research has been ongoing since 2017. The Littlestock Brook Natural Flood Management (NFM) site includes several NbS measures including woody leaky dams connecting floodplain and field corner bund storage areas, and regenerative agriculture practices, that provide resilience to hydro-climatic extremes of floods and droughts to soil and fluvial systems.

Results are based on baseline and ongoing field monitoring, including analyses based on hydrological (surface water levels and soil hydraulic properties) and survey data (airborne Lidar and ground topo-bathymetric campaigns) for the agricultural fields, floodplain and storage areas. Longevity of interventions will be discussed. Since installed over 5 years ago, several surface water storage measures have been colonised by vegetation providing co-benefits (plant and macroinvertebrate recent re-survey results will be presented). While also gradually infilled by fluvial and/or agricultural field sediment (geomorphic change results will be presented), or degraded, such as some woody leaky dams.

We will discuss longer-term water retention effectiveness, monitoring/maintenance needs and potential co-benefits, dis-benefits/tradeoffs or unintended consequences. We will frame these findings in the context of a recently developed sponge measure monitoring framework, and identify research priorities within the wider project towards achieving more climate resilient landscapes.

How to cite: Dussaillant, A., Sah, N., Blake, J., Rameshwaran, P., Bishop, J., Robotham, J., George, C., Laize, C., Everard, N., Scarlett, P., Dueñas-López, M.-Á., and Old, G.: Sponge Measures for Natural Flood Management in Agricultural Landscapes: Water Retention Effectiveness, Co/Dis-Benefits, and Hydro-Geomorphic Change in Nature-based Solutions in the Upper Thames, UK, EGU General Assembly 2026, Vienna, Austria, 3–8 May 2026, EGU26-20783, https://doi.org/10.5194/egusphere-egu26-20783, 2026.

Living laboratories are increasingly recognized as effective instruments to test and implement Nature-based Solutions (NbS) for climate change adaptation while bridging science, society, and policy. In these Labs, concrete measures are being implemented. This paper presents the case of the agriculturally shaped Wagram region in Lower Austria. There, nine municipalities work hand-in-hand with local actors across municipal and sectoral boundaries to address climate mitigation and adaptation challenges, notably drought and flooding.

In the Wagram Lab, the Lower Austrian Agricultural District Authority (ABB) is closely working with representatives of the region and advocacy groups as well as landowners and farmers to mainstream adaption to climate change with NBS using agricultural land-use planning. The goal here is to develop an optimal overall concept for the defined area, which considers current and future economic and ecological requirements. Within this framework, ABB also promotes multi-purpose hedgerows (MNH, from the German term Mehrnutzenhecken) as effective NbS. MNH offer an array of ecosystem services, including soil erosion reduction, biodiversity enhancement through biotope networks, carbon sequestration, amenity provision, and economic benefits for landowners, who can take advantage of (wild) orchards and herbs growing in a surface that remains cropland.

From the Wagram Lab, some important findings have emerged. First and foremost: although every meter of hedge has significant effect on the immediate environment, MNH can only achieve large-scale impact when conceived and developed within the framework of the existing planning tools, including land-use plans. A series of recurrent and systemic challenges to upscaling has been identified, which need to be addressed from the early project phases. These challenges include (1) increasing the acceptance degree among farmers and other landowners, (2) enhancing public outreach, (3) dispelling misconceptions, and (4) integrating MNH knowledge into agricultural education schemes. Likewise, land-use planning programs should be strengthened to increase effectiveness and awareness. Priority should be given to measures that can be implemented directly by municipalities and/or farmers themselves. Top-down technical advice and support from policy makers is therefore crucial, including visualizations, checklists, maintenance plans and long-term financing for the proposed solutions. Early participatory involvement and the consideration of farmers’ interests—such as ease of management, erosion control, humus conservation, or, where appropriate, compensation for the use of their land for the provision of public ecosystem services—as well as follow-up support in cases of delayed implementation make a substantial contribution to further improving the effectiveness of both land-use planning and MNH.

This work showcases the effectiveness of Living Laboratories to bridge governance, policy, and financial mechanisms that enable successful NbS implementation and upscaling by operationalizing them at local and regional scales through concrete planning instruments. As part of a broader EU project (ARCADIA), this Lab benefited from cooperation and partnership with other European regions as well as knowledge from transdisciplinary scientific partners in sociology, psychology, engineering, and economics.

How to cite: Sancho-Reinoso, A., Deim, K., and Szlezak, E.: Bringing nature-based solutions down to earth. The case of agricultural land-use planning and multi-purpose hedgerows in Lower Austria (AT)., EGU General Assembly 2026, Vienna, Austria, 3–8 May 2026, EGU26-20889, https://doi.org/10.5194/egusphere-egu26-20889, 2026.

EGU26-21548 | ECS | Orals | ITS4.9/HS12.5

Adapting Mediterranean Landscapes to Hydrological Extremes 

Miguel Rodrigues, Luís Filipe Dias, João Pedro Carvalho Nunes, and Cristina Antunes

In the Mediterranean region, changes in the hydrological cycle are evident, either due to increased drought intensity and frequency or the occurrence of extreme precipitation events. The impacts of these phenomena challenge the resilience of socio-ecological systems, posing a threat to the region's sustainability. In an effort to address this, the LandEX project aims to enhance the resilience of landscapes by spatially optimising a suite of synergistic measures that leverage the multiple benefits of Nature-based Solutions. In this work, we calibrated a SWAT+ eco-hydrological model to assess the impact of adaptation strategies on hydrological processes under a baseline scenario (2004-2010). Adaptation strategies, co-created in collaboration with regional stakeholders, were modelled in the Gilão catchment (Southern Portugal), a semi-arid area highly vulnerable to hydrological extremes. We evaluated the effectiveness of measures against a set of predefined Flood and Drought indicators. Preliminary results, testing the individual effect of each measure, suggest that structural NbS, such as check dams, contribute to reducing peak-flow more effectively than non-structural NbS (e.g., agroforestry, conservation agriculture, or riparian vegetation) during extreme precipitation events. Contrastingly, non-structural NbS demonstrated improved resilience towards hydrological drought by limiting evapotranspiration. Upcoming work will assess the overall effect of the adaptation strategies combining multiple NbS on flow regulation and drought mitigation under different climate change scenarios. Identifying the most effective adaptation strategies to mitigate the impacts of hydrological extremes will enable decision-makers and field practitioners to enhance the resilience of socio-ecological systems in the region.

How to cite: Rodrigues, M., Dias, L. F., Carvalho Nunes, J. P., and Antunes, C.: Adapting Mediterranean Landscapes to Hydrological Extremes, EGU General Assembly 2026, Vienna, Austria, 3–8 May 2026, EGU26-21548, https://doi.org/10.5194/egusphere-egu26-21548, 2026.

Cattle feedlot wastewater contains high organic and nutrient loads along with residual veterinary antibiotics, posing risks to downstream soil and groundwater quality. This study evaluates Macrophyte-Assisted Vermifiltration (MaVF) as a sustainable, low-energy, nature-based treatment system for such antibiotic-rich wastewater. A comparative assessment was conducted using two macrophyte species, Canna indica and Saccharum spontaneum, integrated into vermifiltration units and monitored for 126 days. Weekly analyses included COD, nutrients (TN, TP, NH₄⁺–N, PO₄³⁻–P), and commonly occurring antibiotics. MaVF–Canna demonstrated the highest treatment efficiency, achieving 56.1 ± 1.6 % COD removal, 43.4 ± 1.7 % TN removal, and 50 ± 5.4 % TP removal. Antibiotic removal across the MaVF systems ranged from 36–54 % for most compounds, with Canna indica consistently outperforming Saccharum spontaneum. MaVF–Canna exhibited superior performance compared to MaVF–Saccharum, which can be attributed to the higher root density, faster growth rate, and greater rhizosphere oxygenation capacity of Canna indica. These traits enhance plant–microbe–earthworm interactions, leading to improved degradation of organics, nutrients, and antibiotics. Ampicillin showed limited removal (2–4 %) across all systems, reflecting its known recalcitrance. A life cycle cost (LCC) assessment revealed that MaVF provides an economically viable and resource-efficient alternative to conventional systems, with a total treatment cost of 261 ₹ m⁻³. The low operational energy demand and use of locally available materials further support its suitability for decentralized rural applications. Overall, the findings underscore the potential of MaVF particularly with Canna indica as a climate-resilient, cost-effective, and environmentally sound nature-based solution for mitigating antibiotics and co-occurring pollutants in livestock wastewater.

How to cite: Singh, S., Singh, R., and Yadav, B. K.: Comparative Performance of Canna indica and Saccharum spontaneum in nature-based Systems for treatment of antibiotic-laden wastewater, EGU General Assembly 2026, Vienna, Austria, 3–8 May 2026, EGU26-296, https://doi.org/10.5194/egusphere-egu26-296, 2026.

Extreme heat has become one of the deadliest climate risks worldwide, responsible for more annual fatalities than any other weather-related hazard (WHO; IPCC AR6). In rapidly urbanizing regions, urban heat island intensification can elevate local temperatures by 3–7°C, amplifying heat stress for millions of residents who depend on public transport for daily mobility. Cities in South Asia are projected to experience up to 75 days per year of “dangerous heat” (>40°C) by 2030, disproportionately increasing exposure for commuters who spend repeated periods in high radiation, confined, and paved microenvironments within transit infrastructure. Ahmedabad, one of the densely populated city of the world, exemplifies this rising risk, with 162 BRTS stations serving over 150,000 commuters every day—a population segment that is highly exposed yet poorly protected from escalating heat extremes. Assessing and improving the thermal safety of such public transport environments is therefore critical for advancing climate-resilient mobility, especially in Global South cities witnessing accelerated warming.

With this background, this study evaluates high-footfall transit nodes as priority urban adaptation sites, where Nature-Based Solutions (NBS) can simultaneously improve commuter health, support modal shift, and enhance sustainability outcomes. Using ENVI-met microclimate modelling, the thermal-comfort performance of 12 NBS strategies—including green roofs, green walls, hedges, and trees—was assessed individually and in synergy under peak summer boundary conditions. Results demonstrate that standalone elements offer limited reductions in ambient temperature (≤0.55°C) and smaller cooling footprints (~1,650–1,959 m²), whereas hybrid strategies achieve up to 1.93°C cooling with expanded influence areas exceeding 4,180–4,191 m². These spatial and temporal cooling gains translate into substantial reductions in hours of strong and very strong heat stress (UTCI), directly benefitting pedestrian-level comfort and heat-health protection.

Beyond climatic advantages, better shade and vegetation maintain optimum airflow conditions, suggesting decreased pollutant stagnation risk, hence enabling healthier waiting environments. NBS-integrated BRT stations can boost ridership, decrease heat-driven out-migration to private cars, and ultimately reduce transport-sector emissions by improving passenger comfort, so strengthening climate mitigation. Preliminary economic reasoning reveals great cost–benefit potential: relatively low-investment green aspects generate long-term benefits through decreased health burdens, reduced cooling energy demands in surrounding structures, improved fare revenues, and avoided infrastructure retrofits. This research offers a quantitative urban-climate decision-support system that lets municipal officials pick BRT stations for targeted NbS deployment based on microclimate exposure, cooling efficacy, and human heat-risk reduction. The method improves urban climate services for public transport planning in rapid warming areas by incorporating modeling outputs into practical station-design methods. The results provide scalable insights to encourage modal transitions, improve commuter resilience, and direct policy for climate-resilient transportation networks throughout megacities in the Global South.         

Keywords: Nature-based Solutions, ENVI-met, micro-climate Modelling, Urban heat mitigation

How to cite: Kela, S., Kandya, A., and Patel, V.: Assessing the impact of Multifunctional Nature-Based Solutions for Climate-Resilient Bus Rapid Transit Systems in the Ahmedabad city, India, EGU General Assembly 2026, Vienna, Austria, 3–8 May 2026, EGU26-1254, https://doi.org/10.5194/egusphere-egu26-1254, 2026.

A substantial body of literature documents the benefits of nature-based solutions in urban areas, while local authorities often struggle to translate these insights into practice. This gap persists because governance arrangements remain fragmented, responsibilities are distributed across multiple institutions, and decision-making is frequently constrained by short-term planning and limited long-term empirical evidence. While nature-based solutions are increasingly promoted as effective adaptive measures, it remains insufficiently understood how specific local governance conditions enable or hinder their sustained and institutionalised implementation. The aim of this paper is to examine just how governance structures operate in a specific context to shed light on the performance of water-related nature-based solutions in coastal cities and to improve knowledge regarding specific adjustments in the institutional setup or decision-making process, which could be capable of supporting the uptake of nature-based solutions in the urban context. The research draws on a set of semi-structured interviews with key stakeholders from the coastal city of Piran, Slovenia, representing diverse expertise and responsibilities in municipal spatial planning, water and wastewater management, environmental and cultural heritage protection, and civil society. The paper synthesises how participants understand governance barriers, how coordination occurs across institutional levels, and how knowledge from past projects informs current decisions. These empirical, locally grounded insights are compared with barriers widely discussed in the literature to assess the relevance of literature to the real-world case study and offer insights into making the literature more actionable. Preliminary findings show that strengthening communication between municipal departments, public utilities and external actors is essential for maintaining continuity beyond project-based cycles and for embedding nature-based solutions into local practice, but that the preference for nature-based solutions is often tied to the personal views rather than an institutional mandate. By providing fine-grained empirical insight into how governance barriers operate in practice, this study contributes to advancing more durable, learning-oriented water governance pathways for nature-based solutions in coastal cities. This research, part of the ongoing consortium-based European project, seeks to generate new granular insights on the operation of nature-based solutions in practice with the view of developing a more durable water governance pathway.

How to cite: Jamsek, J. and Penca, J.: Beyond single drops: How local authorities can improve the uptake of nature-based solutions for water governance?, EGU General Assembly 2026, Vienna, Austria, 3–8 May 2026, EGU26-2538, https://doi.org/10.5194/egusphere-egu26-2538, 2026.

High-density coastal cities face increasing pluvial flooding risk as extreme rainfall intensifies, sea level influences grow, and urban areas continue to densify. Nature-based solutions, including blue-green infrastructure, are widely promoted for stormwater management and the delivery of broader ecosystem services, yet most modeling studies still design these systems for a single, static land use state. As a result, the combined influence of planning sequence and drainage decentralization on the long-term performance and trade-offs of hybrid blue-green-grey infrastructure remains poorly quantified. This study develops an integrated modeling framework to evaluate multifunctional stormwater solutions in a rapidly urbanizing coastal district. Focusing on the Qianwan district in Shenzhen, China, we couple an SWMM-based hydrologic and hydraulic model with a genetic algorithm and multi-criteria decision analysis. Forward and backward multistage planning pathways are compared under several drainage decentralizations. For each pathway, hybrid layouts that combine pipes, permeable pavements, bioretention cells, and blue roofs are optimized and evaluated in terms of life cycle cost, technical and operational reliability, and resilience under extreme rainfall and pipe failure scenarios. Results show that planning direction is as influential as drainage decentralization in shaping long-term adaptation outcomes. Backward planning with decentralized layouts achieves the most robust balance among cost, reliability, and resilience, whereas forward planning provides greater adaptability in the early development stage by deploying more extensive blue-green infrastructure on a lighter grey backbone. Overall, increasing decentralization systematically shortens flow paths, reduces surcharge, and enhances recovery after shocks. The framework demonstrates how integrated modeling can quantify co-benefits and trade-offs of nature-based solutions across development stages and provides transferable decision support for climate-resilient sponge cities and urban adaptation strategies.

How to cite: Liu, K., Wang, M., and Sun, C.: Multi-stage planning pathways and decentralized blue-green-grey networks for climate-resilient urban flood adaptation, EGU General Assembly 2026, Vienna, Austria, 3–8 May 2026, EGU26-2758, https://doi.org/10.5194/egusphere-egu26-2758, 2026.

Green and Blue Infrastructure (GBI) and Nature-Based Solutions (NBS) are becoming increasingly important for sustainable water management and climate change adaptation, especially in urban areas facing greater hydrological pressures. This study uses a literature-based comparative analysis, based on a critical review of scientific publications, technical reports, and design documents. The analysis focuses on two European case studies: the proposed GBI/NBS project in Grundarfjörður, Iceland, and the completed intervention at the Scalo intermodale di Milano–Segrate.
The analysis shows that the Grundarfjörður project mainly tackles heavy rainfall and rapid surface runoff by adopting sustainable urban drainage systems combined with microclimatic adaptation strategies. This takes place within a setting of high climatic variability and intricate geopedological conditions. Conversely, the Milan–Segrate case, evaluated solely through published project documents and monitoring records, concentrates on reducing hydraulic risk, environmental regeneration of a key infrastructural zone, and the multifunctional role of open spaces as vital links between hydraulic systems, landscape, and urban areas.
The comparison based on the documentary highlights notable differences in bioclimatic conditions, design approaches, and the importance of environmental monitoring for the long-term assessment of GBI/NBS performance. These results underline the need for a unified methodological framework that combines urban hydrology, ecology, and spatial planning to enhance solution transferability and strengthen the reliability of long-term effectiveness evaluations.

How to cite: Sgalippa, N.: Urban Hydrological Adaptation Through GBI and NBS: A Comparative Study of European Case Studies., EGU General Assembly 2026, Vienna, Austria, 3–8 May 2026, EGU26-3034, https://doi.org/10.5194/egusphere-egu26-3034, 2026.

With the acceleration of urbanization, the building density and pollution emission sources have increased, and the problem of urban tropospheric ozone has become increasingly severe. Traditional pollution control strategies have focused on source reduction. However, emission reductions have reached their limits, making substantial further reductions difficult to achieve while maintaining socio-economic stability. Moreover, ozone is a secondary pollutant whose formation exhibits a non-linear relationship with its precursors (VOC and NOx). Addressing the issue solely through source reduction of these precursors proves insufficient. Consequently, there is an urgent need for atmospheric ozone self-purification technologies to tackle air pollution. By applying catalytic materials to building facades, atmospheric ozone pollution can be self-purified at low cost and with zero energy consumption. Under ambient temperature and pressure, alongside typical wind speeds and sunlight conditions, these catalytic materials decompose ozone into oxygen.

Application experiments have been conducted under real meteorological conditions in a park. Results indicate that coating park perimeter walls with catalytic materials can reduce nearby ozone concentrations by 5%-20%, with effects extending up to 18 m. Moreover, the higher the temperature, the greater the wind speed and the higher the relative humidity, the overall level of ozone will also increase. These results further confirm that wall catalysis significantly reduces ozone in a small near-wall range, but on a larger spatial scale, the distribution of ozone is still controlled by the atmospheric background and flow field. Therefore, numerical simulations at the urban block scale are required to evaluate the effectiveness of self-purification materials in ozone removal.

The study selected a real building complex in Nanchang as the computing domain, with a horizontal range of approximately 1000 m × 600 m, and constructed a three-dimensional physical model through the urban building outline. In this model, we first examined the impact of varying inflow wind speeds (1 m/s, 3 m/s, and 6 m/s) on ozone distribution. The results show that higher wind speeds correlate with overall elevated ozone concentrations, indicating that atmospheric background transport plays a dominant role. We have paid particular attention to several typical street canyon configurations. These include combinations with aspect ratios of 0.75 and 1.0, as well as scenarios where the canyon is parallel to the wind direction or forms a 40° angle with it. Ozone concentration profiles reveal that different combinations of aspect ratio and wind direction significantly alter vortex structures, thereby influencing ventilation within the canyon and pollutant residence times. Preliminary findings indicate that deep street canyons with larger aspect ratios and those aligned parallel to the prevailing wind are more prone to forming high ozone exposure zones, where ozone catalytic effects are enhanced. Conversely, canyons with wider openings or those angled relative to the wind direction exhibit superior ventilation, resulting in ozone concentrations closer to background levels. In summary, this study confirms the effectiveness of applying ozone-catalysing materials to building facades for urban ozone control.

How to cite: Luo, Q. and Hang, J.: The influence of catalytic coating walls on O3 in urban street canyon based on CFD simulation, EGU General Assembly 2026, Vienna, Austria, 3–8 May 2026, EGU26-4461, https://doi.org/10.5194/egusphere-egu26-4461, 2026.

Urban waterfronts are important parts of the city. These spaces improve social life, regulate the microclimate, and strengthen place identity. They often remain inaccessible, underused, and degraded. This study explores how blue–green infrastructure can revitalise neglected waterfronts and transform them into public spaces that are open to everyone and resilient to climate change. The research focuses on two European capitals – Podgorica (Montenegro) and Reykjavík (Iceland). Two contrasting cultural and climatic contexts of the Nordic and Balkan regions are examined. The aim of the study is to identify, through these two case studies, different relationships between water and urban space.

In Podgorica, the banks of the Morača River are occupied by logistics and storage facilities. These physical and visual barriers limit the city’s connection with the riverfront. The development of public spaces along the river is therefore restricted. This is particularly important given the role of the river as a cooling corridor in a city that faces extremely high summer temperatures and is ranked among the warmest European capitals. In Reykjavík, the transformation of industrial zones into residential areas has improved land-use efficiency along the waterfront. However, due to insufficient integration of blue–green infrastructure and unfavourable microclimatic conditions, the waterfront remains insufficiently socially activated.

The study uses a mixed-method approach. On-site work and qualitative methods are focused on space users. GIS analysis is used to define the location of built structures, their relationship with water, and the public accessibility of the waterfront. Fieldwork includes walking diaries and recording patterns of how people use waterfront areas. Surveys are used to assess frequency of use and functional integration of waterfront spaces. In both cases, the results indicate insufficient use of these areas. This is directly related to microclimatic constraints and spatial barriers. The findings confirm the importance of climate-responsive revitalisation. Blue–green infrastructure is presented as a key element for enabling urban waterfronts to function as accessible and socially meaningful public spaces, contributing to long-term urban resilience.

How to cite: Medenica, B., Finger, D., and Mašanović, N.: Revitalisation of Neglected Urban Waterfronts through Blue-Green Infrastructure:A Comparative Study of Reykjavík, Iceland, and Podgorica, Montenegro, EGU General Assembly 2026, Vienna, Austria, 3–8 May 2026, EGU26-6098, https://doi.org/10.5194/egusphere-egu26-6098, 2026.

EGU26-6249 | ECS | Posters on site | ITS4.14/HS12.7

Redefining Urban Flood Resilience: A Systematic Framework for the Synergistic Integration of Hybrid Nature-based Solutions 

Mihika Ashraf, Eungyeol Heo, Shilong Li, and Jeryang Park

As climate extremes intensify, Nature-based Solutions (NbS) are increasingly integrated with traditional infrastructure to enhance urban flood resilience. However, current design paradigms often treat NbS and grey infrastructure as separate, additive components, failing to capture the complex hydraulic interactions required to withstand unprecedented flood events. Based on a systematic review of literature from 2015 to 2025, this study critically analyzes the engineering limits of hybrid systems and proposes a conceptual framework to operationalize true resilience. The review reveals a critical gap: while NbS is widely praised for its sustainability, its capacity to prevent the brittle failure of conventional systems remains under-quantified. Existing studies predominantly focus on volume reduction, overlooking how NbS can modulate hydraulic loading rates and provide functional redundancy during extreme events. We argue that urban flood resilience is not merely about increasing total retention capacity but about optimizing the synergistic coupling between the saturation characteristics of NbS and the discharge limits of grey infrastructure. To address this, we introduce an integrated resilience assessment framework that moves beyond static capacity analysis. This approach quantifies how NbS acts as a "resilience buffer," delaying system failure and extending the operational range of drainage networks. By shifting the focus from additive performance to synergistic interaction, this study provides a robust pathway for designing hybrid NbS that remains functional under deep uncertainty, offering a strategic guide for future urban flood management.

Acknowledgement
This work was supported by National Research Foundation of Korea(NRF) grant funded by the Ministry of Science and Technology (RS-2024-00356786) and Korea Environmental Industry & Technology Institute grant funded by the Ministry of Environment (RS-2023-00218973).

How to cite: Ashraf, M., Heo, E., Li, S., and Park, J.: Redefining Urban Flood Resilience: A Systematic Framework for the Synergistic Integration of Hybrid Nature-based Solutions, EGU General Assembly 2026, Vienna, Austria, 3–8 May 2026, EGU26-6249, https://doi.org/10.5194/egusphere-egu26-6249, 2026.

EGU26-8755 | Orals | ITS4.14/HS12.7

Urban Heatwave Resilience as a Social-Ecological System: Diagnosing Incremental and Transformative Policy Pathways in High-Density Cities 

Sujeong Kang, Hye In Chung, SeongWoo Jeon, Luis R. Carrasco, and Junga Lee

Intensifying urban heatwaves pose escalating risks to public health, ecosystem stability, and urban livability, yet existing urban heatwave policies continue to produce limited and short-lived outcomes (Siyu Yu et al., 2024). These recurring policy failures suggest not a lack of interventions, but structural mismatches between dominant policy logics and the underlying social–ecological dynamics that generate heat risk (Chen et al., 2024).

This study aims to explain why urban heatwave response policies repeatedly stall in many high-density inner-city contexts and examines in a smaller set of cities, by focusing on high-density inner urban areas as a representative urban type, thereby identifying where policy interventions must be directed to enable a transition toward long-term, transformative urban heatwave resilience. The study analyzes urban heatwave resilience as a social–ecological system, classifies dominant policy approaches based on their system intervention points, and derives key leverage points associated with Blue–Green Infrastructure (BGI).

A systems-based analytical framework grounded in the Social–Ecological System (SES) approach and Causal Loop Diagramming (CLD) was applied. Comparative policy analyses were conducted across high-density cities where heatwave policies have remained largely incremental—Seoul (South Korea), Tokyo (Japan), Hong Kong (China), and Paris (France)—and contrasted with cities exhibiting relatively different policy trajectories, including Singapore and Melbourne (Australia).Core reinforcing and balancing feedback loops shaping heatwave risk were identified, and dominant policy logics were mapped onto these loops to diagnose structural limitations. Meadows’ leverage points framework and concepts of transformative resilience were then applied to interpret system-level intervention pathways.

The analysis revealed that in most high-density cities heatwave policies primarily intervened in downstream outcome variables, leaving reinforcing feedback related to land use, governance fragmentation, and social vulnerability largely intact. In contrast, cities exhibiting more adaptive trajectories showed consistent interventions at higher leverage points, including planning rules, institutional coordination, information flows linking climate data to decision-making, and mechanisms of social self-organization. While no city fully resolved urban heat risk, these higher-level interventions enabled partial systemic shifts, notably in the feedback structures governing BGI integration and urban heat exposure mitigation. The contrast across cases demonstrates that differences in policy effectiveness are better explained by intervention location within the system than by policy intensity or quantity.

This study provides a structural explanation for divergent urban heatwave policy trajectories in high-density cities and reframes BGI as a transformative lever embedded within urban social–ecological systems rather than a supplementary adaptation measure. The findings offer policy-relevant insights for redirecting heatwave governance from incremental, outcome-oriented responses toward system-level interventions that support long-term, equitable urban resilience.


Acknowledgement: This work was supported by Korea Environment Industry &Technology Institute (KEITI) through "Climate Change R&D Project for New Climate Regime.", funded by Korea Ministry of Environment (MOE) (RS-2022-KE002123). 

How to cite: Kang, S., Chung, H. I., Jeon, S., Carrasco, L. R., and Lee, J.: Urban Heatwave Resilience as a Social-Ecological System: Diagnosing Incremental and Transformative Policy Pathways in High-Density Cities, EGU General Assembly 2026, Vienna, Austria, 3–8 May 2026, EGU26-8755, https://doi.org/10.5194/egusphere-egu26-8755, 2026.

EGU26-10301 | Orals | ITS4.14/HS12.7

Towards Robust Design Criteria for Urban Infiltration Ponds: Insights from Long‑Term Simulations 

Antonio Zarlenga, Edoardo Guida, Irene Pomarico, Christy Mathew Damascene, and Aldo Fiori

Green infrastructure and nature based solutions are increasingly recognized as essential components of sustainable urban water management, particularly under climate crisis and anthropogenic pressure. At the European scale, policy frameworks actively promote the deployment of nature-based solutions to restore ecosystem, enhance biodiversity, and strengthen climate resilience. Nevertheless, the regulatory landscape remains fragmented, lacking harmonized metrics for evaluating long term infiltration performance, water quality improvements, and the operational reliability of infiltration based systems. These gaps limit the widespread and effective implementation of such structures in urban environments.

This study contributes to this discussion by presenting long term numerical simulations of the drainage system of the New Rome Technopole district, where an infiltration pond is integrated as a key nature based intervention. A continuous simulation extending over more than 30 years captures the full variability of the hydrological and hydraulic system behaviour. This long term perspective allows for a robust quantitative comparison between the infiltration enhanced configuration and a conventional drainage system, highlighting the benefits and operational dynamics of the pond under a wide range of meteorologic conditions.

The modelling framework is based on the widely adopted SWMM platform widely used among both practitioners and researchers. To complement the system scale analysis, detailed three dimensional simulations of the infiltration pond were performed using HYDRUS 3D, providing refined insights into subsurface flow pathways, infiltration processes and solute travel time.

The results provide a comprehensive assessment of the long term performance of infiltration ponds in urban environments and offer scientifically grounded insights that can inform more robust design criteria and support the wider adoption of nature based solutions in urban water management.

How to cite: Zarlenga, A., Guida, E., Pomarico, I., Mathew Damascene, C., and Fiori, A.: Towards Robust Design Criteria for Urban Infiltration Ponds: Insights from Long‑Term Simulations, EGU General Assembly 2026, Vienna, Austria, 3–8 May 2026, EGU26-10301, https://doi.org/10.5194/egusphere-egu26-10301, 2026.

EGU26-12045 | ECS | Posters on site | ITS4.14/HS12.7

Influence of organic stimulation on plant-microbe interactions in tree trenches exposed to urban runoff contaminants 

Karolin Seiferth, Mia C. Schumacher, Carsten Vogt, Dietmar Schlosser, Steffen Kümmel, and E. Marie Muehe

Urban runoff transports diverse organic pollutants that threaten urban waters and soils. Blue-green infrastructures such as tree trenches may help to mitigate these impacts. Tree trenches are increasingly implemented in cities to manage urban runoff. While the hydraulic and physical retention functions of tree trenches are well studied, their potential to perform biological cleaning processes is less understood.

This study explores whether organic carbon amendments can stimulate the microbial transformation of organic pollutants in tree trench systems. We hypothesize that stimulation with low molecular weight organic carbon increases microbial activity and promotes co-metabolic degradation pathways in the tree rhizosphere. This would support active pollutant removal rather than passive retention.

To test this hypothesis, an outdoor mesocosm experiment was established that simulates a real tree trench in Leipzig, Germany. Linden trees (Tilia cordata) were planted in 1000 L containers filled with the volcanic substrate used in Leipzig, which has rapid permeability to ensure better infiltration. The systems received 60 L of water within two hours to simulate a rainfall event. The water contained a mix of fuel spills, fuel additives, and tire wear pollutants commonly found in urban runoff waters (naphthalene, methyl tert-butyl ether, and 1,3-diphenylguanidine). The common industrial by-products molasses and whey were applied as organic stimulants of microbial metabolism. The system’s response was investigated from a plant, geochemical, and soil microbial perspective.

Following the rainfall event, all tree trenches remained oxygen-depleted during incubation, which was evident from a consistently low redox potential of -40 mV in the percolating soil water. In the plant-available porewater of the linden trees, the redox potential further decreased to -60 mV over time across treatments, indicating microbial fueling through plant exudation. A minor increase in bulk and rhizosphere pH from 7.8 to 8.0 across 4 weeks in trenches amended with and without contaminants and/or organic stimulants indicated a well-buffering trench substrate and allowed comparison of biogeochemical data. An accompanying laboratory study confirmed the mineralization of 13C-labeled naphthalene and, furthermore, that organic stimulants enhanced this process. Overall, organic stimulants seemed to increase biological activity in the rhizosphere as indicated by changing nitrogen speciation and a decrease in dissolved organic carbon. Besides monitoring porewater geochemistry shifts, genes coding for key enzymes of degradation pathways specific to each contaminant were quantified. They were correlated with shifts in microbial community composition and activity by assessing the abundances of 16S rRNA genes and transcripts in the bulk and rhizosphere soil of the trench system. Together, these patterns demonstrate that stimulation with organic compounds can activate biological processes relevant for pollutant transformation, even under complex and heterogeneous tree trench conditions.

This work aimed to evaluate biological stimulation as a design principle for tree trenches in urban water management. By promoting active cleaning rather than passive retention, blue-green infrastructures could become more effective tools for sustainable water runoff treatment, thereby strengthening the role of nature-based solutions in sustainable urban water management.

How to cite: Seiferth, K., Schumacher, M. C., Vogt, C., Schlosser, D., Kümmel, S., and Muehe, E. M.: Influence of organic stimulation on plant-microbe interactions in tree trenches exposed to urban runoff contaminants, EGU General Assembly 2026, Vienna, Austria, 3–8 May 2026, EGU26-12045, https://doi.org/10.5194/egusphere-egu26-12045, 2026.

EGU26-12672 | Posters on site | ITS4.14/HS12.7

Performance of Azolla-Based Floating Wetland for Domestic Wastewater Remediation 

Ioannis Manariotis, Sofia Vereniki Polyzou, and Styliani Biliani

Nature-based wastewater treatment systems offer sustainable alternatives to conventional infrastructure due to lower operational costs and high environmental adaptability. This study investigates the efficiency of a laboratory-scale floating wetland (FW) utilizing plants of the genus Azolla to treat domestic wastewater under varying operating conditions. The experimental setup consisted of two 9-L reactors with different initial Azolla biomass loads of 20 g and 40 g, operated in batch mode. System performance was evaluated by the systematic characterization of chemical oxygen demand (COD), ammonia nitrogen, phosphorus, pH, dissolved oxygen, and alkalinity. The experimental period was divided into three phases: an initial acclimation period comparing reactors exposed to constant artificial light and natural light, an active monitoring phase, and a nutrient removal kinetic phase to assess daily pollutant removal rates, both conducted under natural light conditions.

The comparative analysis, during the first phase, demonstrated that light regime significantly affected FW performance, with natural light yielding higher removal efficiencies for both organic matter and ammonia nitrogen. COD removal was 90 and 96% in artificial and natural light, respectively, while the corresponding ammonia nitrogen removal was 18 and 40%. Furthermore, in the second phase, a higher initial biomass concentration (40 g) led to an 8% increase in phosphorus removal. During the nutrient removal kinetic phase, in the 4th week of operation, the first-order removal constants were 0.1 and 0.26 d-1 for COD, 0.2 and 0.36 d-1 for ammonia nitrogen, and 0.43 and 0.4 d-1 for phosphorus, for the 20 and 40 g FW, respectively. However, biomass yield was higher in the 20-g culture, compared to the 40-g during the entire operation period. These findings indicate that although Azolla-based FW are inherently robust, optimizing initial biomass concentration and light exposure is essential for achieving specific effluent quality targets.

How to cite: Manariotis, I., Polyzou, S. V., and Biliani, S.: Performance of Azolla-Based Floating Wetland for Domestic Wastewater Remediation, EGU General Assembly 2026, Vienna, Austria, 3–8 May 2026, EGU26-12672, https://doi.org/10.5194/egusphere-egu26-12672, 2026.

EGU26-13037 | Posters on site | ITS4.14/HS12.7

Sustainable Zero-Cement Repairing Agent for Climate-Resilient Infrastructure 

Sulaem Musaddiq Laskar, Parasram Pandit, and Athar Hussain

To support global decarbonization and climate resilient infrastructure targets, this study experimentally investigates the bond performance of a sustainable, economic zero-cement alkali activated system produced from industrial and agricultural byproducts. The proposed alkli activated system utilizes blast furnace slag and rice husk ash, thereby reducing reliance on carbon intensive Portland cement while promoting circular use of waste materials and lowering environmental footprints.

The effectiveness of alkali activated system as a concrete repairing agent for ageing and climate exposed infrastructure is governed primarily by both strength of the repairing agent and its bonding behaviour with existing concrete. The bonding behaviour plays a critical role in the long term performance of repaired systems under sustained load, moisture ingress, and thermal variability associated with climate change. Accordingly, a comprehensive experimental program has been prepared to evaluate bonding behaviour under various stress states, including pure tension, pure shear, and combined shear and compression.

The combined contribution of blast furnace slag and rice husk ash for development of interfacial strength and cracking pattern of the alkali activated system has been investigated through controlled laboratory testing and compared with that of conventional Portland cement based concrete. The results demonstrate that the blast furnace slag and rice husk ash based alkali activated system exhibits superior bonding performance compared with conventional cement based repair mortars, indicating improved resistance to debonding, cracking and moisture induced deterioration.

By enabling durable, low carbon repair solutions that extend the service life of existing structures while reducing raw material consumption and greenhouse gas emissions, this study highlights how material technologies that are aligned with Nature-based Solutions can contribute to sustainable and resilient adaptation of the built environment under a changing climate.


How to cite: Laskar, S. M., Pandit, P., and Hussain, A.: Sustainable Zero-Cement Repairing Agent for Climate-Resilient Infrastructure, EGU General Assembly 2026, Vienna, Austria, 3–8 May 2026, EGU26-13037, https://doi.org/10.5194/egusphere-egu26-13037, 2026.

It is evident that both NBS and green and blue infrastructure represent innovative strategies for addressing environmental challenges in urban areas, especially in the context of climate change. These approaches have the potential to not only mitigate the effects of climate change, but also contribute to enhancing the quality of urban life.

NBS is predicated on the utilisation of solutions that are inspired by, or based on, natural ecosystems. These solutions have utility in addressing contemporary issues such as water management, pollution reduction and biodiversity conservation.

Urban areas are especially susceptible to the repercussions of climate change, including rising temperatures, amplified heat islands, extreme weather events, and flooding. It is evident that NBS and green and blue infrastructure have the capacity to play a pivotal role in the mitigation or adaptation to these phenomena. For instance, green spaces such as parks assist in mitigating the urban heat island effect by providing shade and cooler temperatures, while green-blue infrastructure facilitates more efficient stormwater management, thereby reducing the risk of flooding.

It is an established fact that NBS and green and blue infrastructure provide a range of essential ecosystem services. NBS and green and blue infrastructure provide a range of essential ecosystem services. For instance, climate regulation is achieved through the absorption of carbon dioxide by plants, thereby reducing the impact of greenhouse gases. Furthermore, the purification of air and water is facilitated by ecosystems, which act as filters for pollutants and thereby enhance water quality. Additionally, biodiversity is promoted through the creation of habitats, which serve as refuges for various animal and plant species, thereby fostering urban biodiversity.

In urban areas, which are increasingly vulnerable to climate change, the integration of nature-based solutions and green and blue infrastructure is imperative. These approaches have been demonstrated to assist in the mitigation of the risks associated with extreme weather events, whilst concomitantly offering opportunities to enhance urban quality of life and promote sustainability. Investment in such strategies is considered a prudent decision for the cities of the future, as it will contribute to the creation of more resilient and liveable environments.

The present contribution offers a series of case studies drawn from Italy, focusing on the implementation of NBS and green and blue infrastructure within urban contexts in Lombardy, with a particular emphasis on the city of Milan.

How to cite: Vagge, I. and Gibelli, M. G.: Enhancing Ecosystem Services and Climate Change Adaptation through Nature-Based Solutions and Green and Blue Infrastructure: Design and Planning Case Studies from Urban Areas in Lombardy region, Italy., EGU General Assembly 2026, Vienna, Austria, 3–8 May 2026, EGU26-14464, https://doi.org/10.5194/egusphere-egu26-14464, 2026.

EGU26-14989 | ECS | Posters on site | ITS4.14/HS12.7

Hydrological Recovery and Gas‑Phase Memory Across Green Roof Substrates: Evidence from Auckland, New Zealand 

Aung Naing Soe, Sihui Dong, Asaad Y. Shamseldin, Kilisimasi Latu, Conrad Zorn, Eunice Attafuah, and Rachel Devine

Living roofs are commonly evaluated using event-scale runoff metrics, while gas-phase dynamics are rarely considered in relation to rainfall timing. This study investigates how storm sequencing and hydrological memory jointly influence runoff response and near-surface CO₂ concentration in living roof systems.

Rainfall, runoff, and near‑surface CO₂ concentration were monitored on five experimental roof trays in Auckland, New Zealand, representing three substrate configurations of equal depth: an unvegetated stone ballast reference and two vegetated substrates (Daltons living roof mix and eco‑pillows). We analysed a six‑month winter‑to‑spring period (1 June–30 November 2025) with variable inter‑event dry durations. Rainfall events were classified by inter‑event dry duration to distinguish closely spaced and isolated storms. Runoff response was quantified using runoff coefficients and peak discharge metrics normalized by rainfall forcing, while CO₂ dynamics were assessed during rainfall and inter‑event periods and expressed as anomalies relative to the stone reference (ΔCO₂).

Closely spaced storms generally produced higher runoff coefficients and reduced peak attenuation compared with isolated events, consistent with incomplete hydrological recovery. However, isolated events associated with exceptionally large or intense rainfall like the one in July 2025, with a depth of 82.8 mm and an intensity of 4.17 mm/hr, can produce high peak discharges, indicating that storm characteristics may override memory effects under extreme conditions. CO₂ concentrations increased during rainfall and remained elevated between closely spaced events, indicating a gas‑phase “memory” associated with rainfall‑driven state changes. Substrate type strongly modulated the CO₂ signal: Daltons showed persistent CO₂ drawdown relative to stone (mean ΔCO₂ ≈ −8.9 ppm), whereas eco‑pillows exhibited net enrichment (mean ΔCO₂ ≈ +11.8 ppm, increasing in spring). These results highlight non‑stationary coupled hydrological and gas‑phase behaviour in living roofs, while noting that concentration‑based metrics capture near‑surface signals rather than CO₂ fluxes.

How to cite: Soe, A. N., Dong, S., Shamseldin, A. Y., Latu, K., Zorn, C., Attafuah, E., and Devine, R.: Hydrological Recovery and Gas‑Phase Memory Across Green Roof Substrates: Evidence from Auckland, New Zealand, EGU General Assembly 2026, Vienna, Austria, 3–8 May 2026, EGU26-14989, https://doi.org/10.5194/egusphere-egu26-14989, 2026.

EGU26-16190 | ECS | Posters on site | ITS4.14/HS12.7

Blue–green infrastructure of Urban Ponds: nature-based algal harvesting for greenhouse gas mitigation and bioenergy recovery 

Amit Singh, Sanjeev Kumar Prajapati, and Attila Bai

ABSTRACT

Urban ponds are widely recognised as high-emission hotspots of greenhouse gases (GHGs), mainly in the form of methane. Whereas hyper-eutrophication also simultaneously presents an opportunity to harness algal biomass for substantial energy recovery. The present study addresses this dual challenge and opportunity by studying Hauz Khas Pond, a 15-acre hyper-eutrophic urban pond in South Delhi, India. This pond receives a continuous inflow of treated effluent to maintain water levels in the pond.

Comprehensive long-term monitoring of nutrient dynamics, water quality, and biomass generation revealed persistent hyper-eutrophic conditions with TSI of 197.6 ± 10.7 with minor seasonal fluctuations. Continuous nutrient loading ((PO₄³⁻: 4–8 mg L⁻¹, NO₃-N: 1.9-3.13 mg/L),and shallow depth (1-2.5m), is causing high algal productivity and benthic methanogenesis leading to high methane emissions (~1.7 times freshwater systems). Although biomass assessment revealed average standing algal biomass in pond of approximately 183 tonnes and 43% of which is excess eutrophic biomass (approx. 80 tonnes) and can be harnessed for energy recovery without affecting ecological health of aquatic life in pond. The harvested algal biomass was characterized using biochemical methane potential assays, which demonstrated competitive methane yields under anaerobic digestion. This recoverable fraction alone holds methane generation potential of about 20000 m3 equivalent 0.37 m3m-2. This finding indicates the possibility of an in situ energy recovery system. Since India has sufficient solar energy availability Power-to-Gas technology is further being proposed to enhance the methane percentage upto 95%.This technology involves injecting renewable hydrogen into the anaerobic digestion process, which upgrades the biogas produced to pipeline- grade methane.

By combining nutrient management, continuous harvesting, and integrating renewable energy, this nature-based algal harvesting approach can achieve controlled emissions while enhancing urban water quality. Our research redefines eutrophic urban lakes as multifunctional blue-green infrastructure that seamlessly integrate sustainable water management, climate mitigation, and circular bioenergy recovery in rapidly urbanizing regions.

Keywords: Bioenergy recovery; Blue–green infrastructure; Circular bioeconomy; Nature-based solutions; Urban eutrophic lakes; Methane emissions; Algal biomass harvesting; Anaerobic digestion

How to cite: Singh, A., Prajapati, S. K., and Bai, A.: Blue–green infrastructure of Urban Ponds: nature-based algal harvesting for greenhouse gas mitigation and bioenergy recovery, EGU General Assembly 2026, Vienna, Austria, 3–8 May 2026, EGU26-16190, https://doi.org/10.5194/egusphere-egu26-16190, 2026.

EGU26-16259 | Orals | ITS4.14/HS12.7

Cost-effectiveness of blue-green infrastructure strategies for urban heat mitigation  

Yuxin Yin, Gabriele Manoli, and Lauren Cook

Urban heat stress is intensifying under climate change, challenging cities to identify mitigation strategies that are not only effective but also economically viable over long planning periods. Blue Green Infrastructures (BGI), such as trees, bioretention cells, porous pavement, ponds, have been increasingly promoted as a key measure to mitigate heat stress. While some studies have assessed the cooling potential of individual BGI interventions, the effects of combining these elements and their long-term cost-effectiveness under future climates have not yet been thoroughly evaluated. The goal of this study is to evaluate which urban heat mitigation strategies provide the greatest thermal benefits per unit cost over their lifetime.

To do so, we used a microclimate model (UT&C) to simulate Universal Thermal Climatic Index (UTCI) within 3 standardized urban canyons across three Swiss cities (Zurich, Geneva, and Lugano). Simulations are conducted for three decadal periods corresponding to present-day conditions (2015–2025, observations), mid-century (2050), and late-century (2080) climates, derived from the convection-permitting COSMO-CLM regional climate model and bias-corrected to the station scale. Across four baseline scenarios characterized by different vegetation quantity and quality, we implement a set of single and combined BGI and management scenarios that vary tree coverage, ground vegetation coverage, vegetation species selection, bioretention cells, porous pavements, ponds, and irrigation strategies. Model outputs of thermal comfort are integrated with cost data from the literature to compute cost-effectiveness metrics.

Preliminary results for Zurich indicate that eight individual interventions reduce the median UTCI by -0.1–1.2 °C across the baseline scenarios under current climate conditions. Increased tree coverage consistently shows the strongest cooling performance, particularly under low-vegetation baseline conditions. Future work will assess combined intervention scenarios and their lifetime cost-effectiveness. Overall, this work provides insights for prioritizing urban heat mitigation strategies by jointly considering thermal performance and economic efficiency under climate change.

How to cite: Yin, Y., Manoli, G., and Cook, L.: Cost-effectiveness of blue-green infrastructure strategies for urban heat mitigation , EGU General Assembly 2026, Vienna, Austria, 3–8 May 2026, EGU26-16259, https://doi.org/10.5194/egusphere-egu26-16259, 2026.

EGU26-17917 | ECS | Orals | ITS4.14/HS12.7

A composite index for integrated assessment of urban green space exposure 

Niccolò Martini, Francesca Despini, Tommaso Filippini, Marco Vinceti, Sergio Teggi, Jessica Mandrioli, and Sofia Costanzini

Urban green areas contribute to healthier cities by improving air quality, promoting physical activity and social cohesion, and mitigating the urban heat island effect. Despite this, exposure to green areas is often estimated using metrics that focus on different dimensions of greenery, leading to heterogeneous exposure estimates. In this study, we compared traditional green space indices and developed a composite Green Exposure Index (GEI) that integrates vegetation cover, density, and accessibility within a single quantitative framework to improve exposure assessment. We applied these indices to a population-based amyotrophic lateral sclerosis (ALS) case-control dataset from a Northern Italy community. We computed the index values for all residential locations across an 8400 km² urban-peri-urban domain from 1985 to 2020, using high-resolution remote sensing and land cover data. Comparisons between traditional indices showed high agreement between NDVI and Tasseled Cap Greenness (r ≥ 0.94), and exposure estimates derived from 100 m and 200 m buffers also remained strongly correlated (r = 0.94 - 0.96). Seasonal NDVI better captured vegetation patterns than annual values (r = 0.77 - 0.99), and spatial aggregation restricted to vegetated areas reduced the overestimation observed with circular buffers, improving classification accuracy while maintaining strong correlations (r > 0.80). The GEI consists of three components: seasonal NDVI, the Green Coverage Ratio (GCR), and an accessibility index defined for this application. Accessibility was calculated by assigning a value to each green area based on its type, with values decreasing with a logarithmic function as distance from the green area increased, reaching zero for distances beyond 1200 m. This threshold corresponds to the average distance traveled within a 15-minute walk, in line with the 15-minute city planning approach. The GEI was evaluated under three weighting scenarios, which produced substantial differences in exposure classification and confirmed that metric choice strongly influences results. The GCR alone classified 61.7% of the population as Not Exposed, whereas accessibility alone classified 86.1% as Exposed or Highly Exposed. The equally weighted GEI3 placed 79.7% of the population in the intermediate Mildly Exposed and Exposed categories, resulting in a balanced distribution. Analysis of the GEI time series revealed green space changes over the 36-year study period, reliably identifying areas affected by urbanization or green redevelopment. Findings from this case study demonstrate the added value of composite indices such as the GEI for characterizing green space exposure, enabling more comprehensive and robust assessments of the benefits and effects of green infrastructure, with applications in public health policy and urban planning.

How to cite: Martini, N., Despini, F., Filippini, T., Vinceti, M., Teggi, S., Mandrioli, J., and Costanzini, S.: A composite index for integrated assessment of urban green space exposure, EGU General Assembly 2026, Vienna, Austria, 3–8 May 2026, EGU26-17917, https://doi.org/10.5194/egusphere-egu26-17917, 2026.

EGU26-18082 | ECS | Orals | ITS4.14/HS12.7

Assessing the Climate and Hydrological Effects of Blue-Green Infrastructure in Urban Brownfield Regeneration 

Giulia Donatelli, Francesca Despini, and Daniele la Cecilia

The rapid human population growth is driving profound transformations in urban development. Expansions driven by land revenues and inadequate land use policies are driving the increase in frequency and intensity of the urban heat island (UHI) effect and urban flooding. These detrimental consequences are exacerbated by the climate change, that is causing more frequent and more intense extreme weather events. The installation of blue-green infrastructures (BGI) is a promising strategy to achieve sustainable development, promote inclusivity, decrease inequalities, combat climate change and halt biodiversity loss.

Scientists have developed numerical models capable of simulating sustainable stormwater management and the temperature response to the given land covers. Only recently has their combination been explored and it is essential to evaluate co-benefits as well as trade-offs. In this study, we integrate in one framework, with a one-way feedback, the inputs and outputs of two globally used BGI planning-support modeling tools (i.e., SWMM and TARGET). Importantly, we refined TARGET so that remote sensing data can be exploited. In practice, we introduce the possibility to account for the spatial variability of land cover properties (e.g., albedo values) for more accurate modelling and of Land Surface Temperatures, for validation purposes. The framework allows us to understand how hydraulic elements and land use change affect stormwater quantity management as well as urban temperatures.

We apply this framework to a mixed industrial/residential neighborhood in the Municipality of Modena, a city with about 180,000 inhabitants located in the northern part of Italy, in the Po Valley. The area is particularly suited for the study given the precedent sprawling of industrial buildings in the historical rural area, which nowadays has been incorporated in the city and surrounded by residential areas.

The analysis compares the current urban configuration with alternative scenarios involving the retrofit of industries and conversion of abandoned industrial brownfields into BGI. The results demonstrate that brownfield regeneration through BGI can deliver measurable co-benefits for urban drainage and microclimate at the city scale. These findings support multi-objective BGI planning as a viable strategy for climate change mitigation and adaptation in medium-sized cities.

How to cite: Donatelli, G., Despini, F., and la Cecilia, D.: Assessing the Climate and Hydrological Effects of Blue-Green Infrastructure in Urban Brownfield Regeneration, EGU General Assembly 2026, Vienna, Austria, 3–8 May 2026, EGU26-18082, https://doi.org/10.5194/egusphere-egu26-18082, 2026.

EGU26-18701 | ECS | Posters on site | ITS4.14/HS12.7

Estimating Future Irrigation Requirements of Urban Green Infrastructure under Climate Change 

Anika Stelzl, Franziska Sarah Kudaya, Josip Rajic, Udo Buttinger, Ulrike Pitha, Bernhard Pucher, Eva Schwab, and Daniela Fuchs-Hanusch

Climate change poses an increasing challenge to the sustainable management of urban green infrastructure. Rising air temperatures, changing precipitation patterns and an increasing frequency and intensity of droughts lead to greater water stress for urban vegetation and consequently a higher demand for irrigation. Urban green infrastructure can only provide its multifunctional ecosystem services, such as cooling, when sufficient water is available. This highlights the importance of reliably assessing future irrigation requirements. This work presents a methodological framework for the spatial and temporal estimation of irrigation requirements for urban green infrastructure under current and future climatic conditions.

The presented approach is based on a quantitative assessment of irrigation deficit, which is defined as the difference between the water demand of the vegetation and the amount of effective precipitation. The methodological framework integrates evapotranspiration-based, vegetation-ecological and hydrological components, following established scientific approaches [1]. Reference evapotranspiration is calculated using the Hargreaves equation. Additionally, the study systematically assesses scenario-based changes in irrigation demand resulting from alternative urban green infrastructure development pathways.

Vegetation-specific water demand is estimated using the landscape coefficient approach. For this purpose, specific landscape coefficients were derived for typical types of urban green infrastructure, integrating the effects of vegetation type, planting density, and water stress into a multiplicative coefficient. This enables a differentiated representation of the variety of vegetation structures and management strategies found in urban green spaces. Natural water supply is accounted for by estimating effective precipitation using the NRCS Curve Number method, which characterizes runoff and retention processes in urban areas and quantifies the proportion of precipitation available within the root zone.

The spatial implementation is carried out within a grid-based framework with a spatial resolution of 100 m × 100 m across three case studies. Within each grid cell, the proportions of different vegetation types, the associated normalized difference vegetation index (NDVI), land use information, and soil parameters are compiled. Area-weighted vegetation coefficients and hydrological parameters are then aggregated to the grid areas, which serve as the basis for irrigation calculations.

Analyses are performed for a historical reference period (1991–2020) and a future period (2031–2060) under different climate change scenarios (RCP2.6, RCP4.5, and RCP8.5). This allows a systematic evaluation of climate-driven changes in irrigation requirements. The results are evaluated monthly and visualized using box plots to illustrate changes in irrigation requirements and associated uncertainties. The results show a potential increase in irrigation demand in the case studies, with scenario-specific differences. In addition, the influence of different developments in green infrastructure on irrigation requirements is highlighted.

Overall, the developed methodology provides a scalable, integrated, and scientifically robust tool for assessing the irrigation requirements of urban green infrastructure.

Acknowledgements: The presented research is funded by the Federal Ministry for Agriculture and Forestry, Climate and Environmental Protection, Regions and Water Management Republic of Austria

References:

  • Cheng, H.; Park, C.Y.; Cho, M.; Park, C. Water Requirement of Urban Green Infrastructure under Climate Change. Science of The Total Environment 2023, 893, 164887, doi:10.1016/j.scitotenv.2023.164887.

How to cite: Stelzl, A., Kudaya, F. S., Rajic, J., Buttinger, U., Pitha, U., Pucher, B., Schwab, E., and Fuchs-Hanusch, D.: Estimating Future Irrigation Requirements of Urban Green Infrastructure under Climate Change, EGU General Assembly 2026, Vienna, Austria, 3–8 May 2026, EGU26-18701, https://doi.org/10.5194/egusphere-egu26-18701, 2026.

EGU26-19247 | ECS | Posters on site | ITS4.14/HS12.7

Neighbourhood scale Urban Heat Island modelling in the West Midlands, UK Using ADMS-Urban Temperature and Humidity model 

Yanzhi Lu, Jian Zhong, Jenny Stocker, Victoria Hamilton, and Kate Johnson

Urban heat island (UHI) effects can result in numerous negative impacts on the health and well-being of urban residents. Modelling UHI intensity is essential for characterising its spatiotemporal dynamics, assessing urban heat exposure risks, and projecting future changes under urbanisation and climate change. This study adopts the ADMS-Urban Temperature and Humidity model to simulate the interannual variation and spatial distribution of UHI intensity in the West Midlands, UK. This model has been validated in a previous, smaller-scale study conducted in Birmingham city. The model inputs include the spatial distributions of three thermal attribute parameters (i.e. thermal admittance, surface resistance to evaporation, and albedo) as derived from land-cover datasets and rasterised to a 100 m resolution, upwind meteorological data, urban canopy, terrain, and anthropogenic heat. The model outputs include the long-term variation of temperature and its perturbations at selected locations for receptor runs and high-resolution short-term contour maps for the contour runs. The preliminary output of this study will be a baseline in the year 2023. In this baseline, we output the UHI intensity of the West Midlands, including temporal variation on receptors and instantaneous spatial distributions. This baseline could be the basis for modelling scenarios in the future. Based on changes in land cover caused by urbanisation, in the next step, we could simulate the changes in UHI intensity relative to the baseline due to land-cover change, such as the expansion of green spaces, and the replacement of natural surfaces in rural areas by urban built-up areas. Future scenarios could also include patterns of temperature and perturbation changes under new upwind meteorological conditions induced by climate change, as well as changes in UHI driven by increased anthropogenic heat emissions. These results can be used to test the effectiveness of strategies for mitigating the UHI through urban and green space planning, thus providing data support for the planning of climate-resilient cities.

How to cite: Lu, Y., Zhong, J., Stocker, J., Hamilton, V., and Johnson, K.: Neighbourhood scale Urban Heat Island modelling in the West Midlands, UK Using ADMS-Urban Temperature and Humidity model, EGU General Assembly 2026, Vienna, Austria, 3–8 May 2026, EGU26-19247, https://doi.org/10.5194/egusphere-egu26-19247, 2026.

EGU26-19255 | Posters on site | ITS4.14/HS12.7

Dual-Benefit Digital Twins: Modeling Water Retention and Urban Heat Mitigation in Arid Cities 

Gijs van den Dool, Allen Jiang, and Mireille Elhajj

Rapid urbanisation in Oman’s extreme climate is intensifying water stress and expanding Urban Heat Islands (UHI), which directly threaten population health, economic productivity, and municipal budgets. Urban planners must optimise resource allocation and capital investments while maintaining urban livability. This study presents a Digital Twin (DT) framework, grounded in the Astra Terra architecture, to model the dual benefits of Nature-based Solutions (NbS) for UHI mitigation and hydrological resilience. In contrast to traditional models that focus exclusively on vegetation, this approach incorporates "wetness" as a primary variable in regulating the urban microclimate.

The methodology integrates a federated data ecosystem, utilising the Copernicus Climate Data Store (CDS) for baseline indicators and Landsat 8 thermal imagery for hotspot identification. A Data Fusion Core merges satellite Earth Observation data with three-dimensional urban morphology. The framework follows FAIR data principles and high-performance computing (HPC) standards, ensuring scalability and policy-driven simulation capabilities compatible with the Destination Earth (DestinE) platform.

As a proof-of-concept demonstrator, this framework explores the theoretical ability to simulate urban responses to varying 'wetness' levels. This initial iteration focuses on modeling 'wet infrastructure' to establish the basic principles of hydro-thermal feedback in arid environments. By mapping existing wadis and topographical depressions, the framework simulates Blue-Green Infiltration Basins and water-retention zones. These scenarios are used to evaluate two critical environmental and economic responses:

  • Hydrological Resilience and Financial Optimisation: Zones are modeled as Managed Aquifer Recharge (MAR) sites. The Digital Twin simulates how infiltration rates stabilize local aquifers, thereby reducing the long-term costs associated with water scarcity management. Incorporating native species such as Acacia and Date palm, the model demonstrates ecological balance with minimal maintenance requirements.
  • Thermal Cooling and Public Health: The framework quantifies the thermal response to increased soil moisture. Simulations indicate that higher thermal inertia and latent heat dissipation can reduce surface temperatures by 3–5°C near critical infrastructure. This temperature reduction is directly associated with improved population mobility and reduced heat-related health risks, both of which are essential for sustaining economic activity and resident well-being.
  • Eco-Hydrological Feedback: "Greenness" serves as a biological indicator of subsurface water availability. The Digital Twin models the feedback loop in which urban vegetation protects water resources from evaporation, thereby supporting the longevity of urban investments.

Impact and Decision Support: Through advanced analytics, the Digital Twin provides actionable insights to help planners prioritise multifunctional spaces. By demonstrating that interventions are both thermally effective and economically viable, this approach offers a practical roadmap for reducing complexity in urban planning and enhancing the climate resilience of heat-stressed arid cities.

How to cite: van den Dool, G., Jiang, A., and Elhajj, M.: Dual-Benefit Digital Twins: Modeling Water Retention and Urban Heat Mitigation in Arid Cities, EGU General Assembly 2026, Vienna, Austria, 3–8 May 2026, EGU26-19255, https://doi.org/10.5194/egusphere-egu26-19255, 2026.

In recent decades, Blue and Green Infrastructure (BGI) has gained prominence in urban planning due to its numerous benefits. Sustainable Drainage Systems (SuDS) like infiltration swales or trenches enhance groundwater recharge while reducing combined sewer discharge. However, in densely populated areas, space is often a limiting factor. Implementing BGI in developed areas is particularly challenging.   

This study aims to investigate the effects and potential locations of the above-mentioned SuDS in the metropolitan area of Frankfurt am Main (Germany), using an analysis of geodata, land use projections and the WABILA water balance model (Henrichs et al., 2016). First, we delimited and classified urban sub-areas based on land use and building composition. Surfaces were segmented into roof, impervious, and green areas using vector files for building and plot perimeters, as well as various raster data (e.g., impervious degree). A SuDS implementation degree was assigned to each sub-area type based on space availability. For example, disperse urban areas could proportionally implement more swales, as more space is available. Else, infiltration trenches were assigned, as they require less space. SuDS were not assigned where a) needed space was unavailable, b) soil permeability was too low, c) a water protection area was present, or d) the groundwater level was too high. Then, we gave the surface types and areas as input for WABILA, a tool for evaluating urban rainwater management measures, integrating also georeferenced climate and geological data. By varying surface configurations, we assessed the effects of increased adoption of SuDS on groundwater recharge, accounting for space limitations within the properties and guidelines for rainwater infiltration.

According to our analysis, a total of 31 million m3 per year could be infiltrated by 2050. This corresponds to a 30% reduction in the total urban rainwater runoff. This potential can roughly be evenly distributed among compact, disperse and industrial settlements or areas. Infiltration swales were assigned the most, followed by combined swale-trench elements and infiltration trenches. The total annual costs of such an implementation range between 15 to 30 million euros. The overall economic benefits were not quantified in this study.

Despite the limitations of the method (e.g., necessary simplification of water quality risks), the results could serve as reference for sustainable urban water management. Many cities in Germany (including Frankfurt) have already begun with intensive programs promoting BGI and SuDS. The presented method can be transferred to other places in Germany, as the used georeferenced data is publicly available and the used software is open source. 

How to cite: Sanchez, R. and Greiwe, J.: The potential role of decentralized rainwater infiltration in the Frankfurt Rhein-Main area: A case study, EGU General Assembly 2026, Vienna, Austria, 3–8 May 2026, EGU26-20045, https://doi.org/10.5194/egusphere-egu26-20045, 2026.

EGU26-22610 | Orals | ITS4.14/HS12.7

From theory to practice: Integrated Multi-Scale Geomatic and Artificial Intelligence Modeling of Urban Heat Islands for Climate Adaptation in Latin American Cities 

Fabiola D. Yépez Rincón, Laurent Polidori, Andrés Velástegui Montoya, Jean-Louis Roujean, and Nelly L. Ramírez-Serrato

Latin America is among the most urbanized regions in the world, where rapid and often unplanned urban growth has intensified climate-related challenges, particularly the Urban Heat Island (UHI) effect. Increasing thermal stress in cities affects public health, energy consumption, and environmental sustainability, underscoring the need for integrated modeling approaches that support urban climate adaptation. In this context, the Latin American Society of Remote Sensing and Spatial Information Systems (SELPER), in collaboration with researchers from the International Society for Photogrammetry and Remote Sensing (ISPRS), promotes the use of Earth Observation (EO), remote sensing, and geospatial technologies to improve the understanding of climate-driven urban processes.

So far, the first collaborative stage has analyzed thousands of 30 m resolution Landsat 5 and Landsat 8 images covering 16 large Latin American megacities in six countries, home to approximately 73 million inhabitants. The results reveal common patterns among these cities that include: diffuse urban development models, spatially and temporally heterogeneous behavior, progressive degradation and fragmentation of forested green areas, which impacts blue-green infrastructures, marked variability in construction materials and cover, land use, and urban morphology that influence surface thermal responses, including the formation of heat islands or urban cooling islands. The findings highlight the limitations of analyses at single scales and underscore the need to improve analysis methodologies through integrative frameworks across multiple scales.

Based on this new regional knowledge, this study proposes an integrated modelling framework based on geomatics and artificial intelligence (AI) for urban climate adaptation. Geomatics, which integrates geographic information systems (GIS), remote sensing, and spatial analysis, provides a comprehensive approach to examining UHI dynamics at the spatial scale.

Our research is now going to take on two new branches. First, we must continue to demonstrate the applicability and importance of GeoAI intelligence and machine learning techniques to support the efficient processing and integration of EO into decision-making. By linking observation, analysis, and exploratory predictive modeling, the proposed framework improves understanding of urban heat dynamics. It supports evidence-based climate adaptation strategies, including blue-green infrastructure enhancement and climate-resilient urban planning in Latin American cities. 

How to cite: Yépez Rincón, F. D., Polidori, L., Velástegui Montoya, A., Roujean, J.-L., and Ramírez-Serrato, N. L.: From theory to practice: Integrated Multi-Scale Geomatic and Artificial Intelligence Modeling of Urban Heat Islands for Climate Adaptation in Latin American Cities, EGU General Assembly 2026, Vienna, Austria, 3–8 May 2026, EGU26-22610, https://doi.org/10.5194/egusphere-egu26-22610, 2026.

EGU26-3271 | Posters on site | ITS4.22/HS12.9

Does flood early warning performance affect flood damage? Evidence from the 2018 Japan Floods 

Hitomu Kotani, Wataru Ogawa, and Kakuya Matsushima

Flood early warning systems are vital for mitigating flood damage, yet limitations in forecasting technologies lead to false alarms and missed events. Repeated occurrences of these issues may cause people to hesitate to take appropriate action (e.g., evacuating or moving assets to safer places) during subsequent warnings, potentially exacerbating flood damage, including both human and economic losses. However, the impact of warning performance on flood damage in Japan has not been examined in the context of actual flood events.

This study empirically examined these effects by applying Bayesian regression analyses to open data on the 2018 Japan Floods in 127 municipalities in four prefectures (i.e., Okayama, Hiroshima, Ehime, and Fukuoka) for which data were available on the real-time flood warning map (Kouzui Kikikuru in Japanese) during the 2018 Japan Floods, which provides limited open data on warning performance. Based on these data, the false alarm ratio (FAR) and missed event ratio (MER) for each municipality before the 2018 Japan Floods were calculated and used as explanatory variables. The outcome variables were (1) fatalities, (2) injuries, (3) economic losses to general assets, and (4) economic losses to crops during the floods.

The results indicate that a higher FAR was associated with an increase in fatalities, injuries, and economic losses to general assets. By contrast, no prominent positive effect of MER was found for any outcome variable. These findings provide valuable insights for improving warning systems and guiding future research.

This presentation is based on our recent publication in Journal of the Meteorological Society of Japan. Ser. II (DOI: 10.2151/jmsj.2025-025).

How to cite: Kotani, H., Ogawa, W., and Matsushima, K.: Does flood early warning performance affect flood damage? Evidence from the 2018 Japan Floods, EGU General Assembly 2026, Vienna, Austria, 3–8 May 2026, EGU26-3271, https://doi.org/10.5194/egusphere-egu26-3271, 2026.

EGU26-4615 | ECS | Posters on site | ITS4.22/HS12.9

Identification of Citizen Preferences for Ecological and Spatial Features of Stream Waterfronts 

Taeyong Shim, Hee Won Jee, and Seung Bom Seo

Public demand for ecologically healthy rivers and water-friendly spaces has grown over time, increasing the need for planning and application at the regional scale. Accordingly, incorporating citizens’ needs into management plans has become increasingly important. This study aimed to identify citizens’ preferences for the ecological and spatial features of stream waterfronts. We conducted a survey using 30 images of stream waterfronts that are open access, asking respondents to rate each image on a 7-point scale (1 = very low to 7 = very high). A total of 235 responses were collected. The evaluation features were selected based on findings from previous monitoring studies. In addition, generative AI (ChatGPT 5.2) was used to generate representative stream waterfront images reflecting the observed feature preferences (e.g., best case vs. worst case). Further studies for enhancing the training process by revising the criteria and adding more images are required. The results are expected to support stream waterfront design and discharge management by linking these preferences with holistic planning approaches.

How to cite: Shim, T., Jee, H. W., and Seo, S. B.: Identification of Citizen Preferences for Ecological and Spatial Features of Stream Waterfronts, EGU General Assembly 2026, Vienna, Austria, 3–8 May 2026, EGU26-4615, https://doi.org/10.5194/egusphere-egu26-4615, 2026.

EGU26-6248 | ECS | Orals | ITS4.22/HS12.9

Uncertainties in modelling global groundwater availability 

Robert Reinecke

As global water demand is projected to increase, it remains unclear how and where this demand will be met, or whether it will create new water-crisis hotspots. Projections of meteorological and hydrological droughts already suggest the emergence of new zero-day events. Yet groundwater, a vital buffer for meeting water needs and, at times, the only available freshwater resource, remains underrepresented in current assessments and global models. Groundwater faces substantial threats from overextraction, changes in recharge, and salinization caused by sea-level rise. Unfortunately, models that account for groundwater face significant uncertainties in simulating water table depth, interactions with surface waters, groundwater withdrawals, and groundwater recharge, and are challenging to evaluate. At the same time, these models are not yet capable of simulating water quality processes that may increase water scarcity and are only beginning to represent megacities. In this talk, I will address current uncertainties in global water modeling, examine the implications for water scarcity assessments and risk projections, and outline ideas for further model improvements. Specifically, I will highlight how community approaches to developing a groundwater sector within a model intercomparison project can enhance models and datasets, resulting in improved predictions of future water scarcity hotspots.

How to cite: Reinecke, R.: Uncertainties in modelling global groundwater availability, EGU General Assembly 2026, Vienna, Austria, 3–8 May 2026, EGU26-6248, https://doi.org/10.5194/egusphere-egu26-6248, 2026.

EGU26-6657 | ECS | Orals | ITS4.22/HS12.9

Assessing the resilience of the terrestrial water cycle 

Romi Lotcheris, Nielja Knecht, Lan Wang-Erlandsson, and Juan Rocha

 The green water components of the terrestrial water cycle - transpiration, surface soil moisture, and land precipitation - are critical for Earth system stability and ecosystem productivity. However, complex and accelerating human pressures are altering the land surface and water cycle at vast spatial scales. Changes to the terrestrial water cycle can have wide-reaching impacts on ecological (e.g., affecting biodiversity, ecosystem structure and function), and social systems (e.g., affecting crop yields). Despite evidence of considerable and widespread change globally, the resilience of green water variables, or their ability to absorb and recover from disturbances, is not yet well understood. Here, we assess green water resilience using early warning signals (EWS) applied to global satellite-derived time series of green water variables. We map where and how green water resilience is changing, and empirically evaluate these estimates against past abrupt changes to understand where and when EWS are effective.

We show that EWS provide limited but non-negligible additional skill in anticipating abrupt transitions when combined with environmental context. We also find that a wider portfolio of context-appropriate EWS is needed to capture heterogeneous water-vegetation dynamics across eco-hydrological systems. For example, Critical Slowing Down suggests transpiration resilience loss in arid to sub-humid ecosystems, while signals of Critical Speeding Up and flickering are more common in high-latitude and sub-humid systems. Our results highlight emerging risks to terrestrial water cycle dynamics under ongoing anthropogenic pressures.

How to cite: Lotcheris, R., Knecht, N., Wang-Erlandsson, L., and Rocha, J.: Assessing the resilience of the terrestrial water cycle, EGU General Assembly 2026, Vienna, Austria, 3–8 May 2026, EGU26-6657, https://doi.org/10.5194/egusphere-egu26-6657, 2026.

EGU26-7553 | Orals | ITS4.22/HS12.9

Drivers of Historical Irrigation Expansion in Peru and its Exposure to Climate Change 

Gustavo De la Cruz Montalvo and Yadu Pokhrel

Irrigation expansion in Peru represents a complex coupled human-water system where political and economic decisions have reshaped the hydrological landscape. While crucial for food security, this expansion has concentrated water demand in the hyper-arid Pacific coast, creating a path dependency that is increasingly vulnerable to climate variability. This study bridges socio-hydrology and hydro-climatic risk modelling to assess how historically expanded irrigation areas are exposed to future climate change scenarios. We first reconstruct the spatial evolution of irrigated areas from 1950 to 2015, attributing growth to three distinct phases: early global market demands, state-led hydraulic megaprojects (1960–1990), and the recent neoliberal agro-export boom. This historical analysis reveals a strong coastal bias, where infrastructure was developed to conquer the desert for high-value crops. We then assess the future exposure of these established zones using bias-adjusted CMIP6 climate projections (SSP5-8.5) and hydrological simulations from the ISIMIP3b ensemble for the mid-century period (2036–2065). Results reveal a complex seasonal trade-off that heightens the exposure of irrigated systems. While the wet season (NDJFM) is projected to experience increased precipitation and river discharge, particularly in northern regions with increases up to 30%, the dry season (MJJAS) shows a robust drying trend. Of a particular concern, the central and southern coastal valleys, which host the most capital-intensive export agriculture, are identified as "High Drying Exposure" zones, with projected discharge reductions exceeding 20% during peak demand months. This spatial mismatch highlights a severe socio-meteorological risk: the infrastructure built during the historical expansion is now spatially locked into regions facing imminent hydrological scarcity. We conclude that adaptation strategies must urgently pivot from supply-side expansion to demand management to mitigate the collision between anthropogenic water dependency and projected hydro-climatic drying.

How to cite: De la Cruz Montalvo, G. and Pokhrel, Y.: Drivers of Historical Irrigation Expansion in Peru and its Exposure to Climate Change, EGU General Assembly 2026, Vienna, Austria, 3–8 May 2026, EGU26-7553, https://doi.org/10.5194/egusphere-egu26-7553, 2026.

EGU26-8981 | ECS | Posters on site | ITS4.22/HS12.9

Assessing resilience of water security in global megadeltas 

Qinzi Cheng

Global mega-river deltas host a disproportionate share of the world’s population and economic activity, yet they are increasingly exposed to compounded water security risks arising from climate change, upstream regulation, and rapid socioeconomic transformation. Despite their global importance, a consistent and comparative assessment of water security sustainability across deltas remains limited.

Here, we develop an integrated assessment framework to evaluate the sustainable water security of major global river deltas by jointly considering hydrological availability, climate extremes, water demand, and socioeconomic pressure. Using multi-source datasets on river discharge, precipitation and temperature, population distribution, economic activity, and land use, we quantify spatial and temporal patterns of water stress across representative deltas in Asia, Africa, Europe, and North America. Trend analysis and attribution methods are applied to disentangle the relative contributions of climatic variability and human drivers to observed changes in water security.

Our results reveal pronounced regional heterogeneity. Many Asian and African deltas exhibit increasing water insecurity driven by the combined effects of declining upstream inflows, intensifying drought extremes, and rapidly growing domestic water demand. In contrast, deltas in developed regions show relatively stable water availability but remain vulnerable due to high exposure and dependence on engineered water systems. The analysis further highlights critical hotspots where climate change amplifies existing socioeconomic pressures, posing challenges to long-term sustainability.

This study provides a global, delta-scale perspective on water security sustainability and identifies priority regions for adaptive management. The framework offers a transferable tool to support policy-relevant assessments and inform integrated water governance strategies for vulnerable delta systems under future change.

How to cite: Cheng, Q.: Assessing resilience of water security in global megadeltas, EGU General Assembly 2026, Vienna, Austria, 3–8 May 2026, EGU26-8981, https://doi.org/10.5194/egusphere-egu26-8981, 2026.

EGU26-10697 | ECS | Orals | ITS4.22/HS12.9

Severe water crisis in southern Spain under expanding irrigated agriculture: A multidimensional drought analysis and ontological & epistemological reflections  

Victoria Junquera, Daniel I. Rubenstein, Simon A. Levin, José I. Hormaza, Iñaki Vadillo Pérez, and Pablo Jiménez Gavilán

The Axarquía region in southern Spain is a hotspot of avocado and mango production in Europe. The region underwent a severe water crisis in 2019-2024 that caused the near-depletion of its large reservoir, a drop of groundwater to sea-level in many parts of the main aquifer, and large socio-economic impacts. Our work examines the causes of this crisis and contrasts the dynamics and management lessons in Axarquía with other regions facing similar challenges. We also reflect on the process and challenges associated with conducting multidisciplinary research on droughts.

Central to our analysis was the examination of water use, demand, availability, accuracy of official estimates, and water management during normal vs. drought periods. We analyzed hydro-meteorological time series (dam inflows and outflows, reservoir and groundwater levels, pluviometry) to identify the duration and intensity of droughts in 1996–2024 and trends and temporal relations between variables. We conducted an in-depth review of drought management plans, land-use regulations, and all water management plans since 1998, verifying the water balance with own estimates based on irrigated area and water permits.

We show that the Axarquía water crisis was caused by a confluence of shorter and long-term dynamics. An unusually severe multi-year meteorological drought directly impacted reservoir and aquifer levels. At the same time, water demand for irrigation has steadily increased over the last two decades because of expanding irrigated avocado and mango plantations, diminishing the resilience to meteorological drought and exacerbating drought propagation.  We present evidence of significant management shortcomings, including large uncertainties around water use and availability, lack of extraction metering, permit overallocation, and likely significant irregular freshwater extraction.

We conclude that water management must go beyond traditional supply-side (increase water availability) and demand-side (increase efficiency) measures and impose stricter limits on demand (e.g., caps on irrigated area) combined with a more accurate assessment of water availability (improved models and monitoring) and use (real-time metering at all extraction points), flexible permits based on available water resources, and effective enforcement. These measures combined would reduce the likelihood of future crises under meteorological drought conditions.

Water crises and other extreme events (e.g. floods, wildfires, famines) are almost always the combined result of human–environment interactions and responses. This makes it important to analyze them from a multidisciplinary perspective. In our work, we adopted an explanation-oriented methodology that entails constructing causal histories of interrelated social and biophysical events through abductive reasoning, which seeks to identify the best or most plausible explanations (e.g., Walters & Vayda, 2020).

The challenge of such an analysis is that it is difficult to know a priori what variables are relevant among the many processes involved. Data gathering and analysis were iterative processes, as new insights generated new lines of investigation. Another challenge is that the resulting work does not fit neatly in existing disciplines and journals’ ontological stances. We argue that a causal explanation of the “why” and “how” of social-ecological crises necessarily must adopt a historical and systemic perspective such as a causal-history methodology.

How to cite: Junquera, V., Rubenstein, D. I., Levin, S. A., Hormaza, J. I., Vadillo Pérez, I., and Jiménez Gavilán, P.: Severe water crisis in southern Spain under expanding irrigated agriculture: A multidimensional drought analysis and ontological & epistemological reflections , EGU General Assembly 2026, Vienna, Austria, 3–8 May 2026, EGU26-10697, https://doi.org/10.5194/egusphere-egu26-10697, 2026.

EGU26-11467 | ECS | Orals | ITS4.22/HS12.9

Development of a building-scale integrated flood damage quantifying framework using a hydrodynamic model and multisource geospatial data 

Wei Jiang, Zhiguo pang, Gan Luo, Denghua Yan, Akiyuki Kawasaki, and BinBin Wu

Building damage is the primary component of economic damage resulting from flood disasters. Understanding flood damage enables effective disaster risk reduction strategies and community resilience planning. In this study, a comprehensive framework for quantifying flood-induced damage to individual building properties (structural and content) is developed. This methodology combines geospatial data with machine learning and hydrodynamic modeling, as demonstrated through the 2023 flood event in the Dongdian flood storage and detention area (FSDA), Hebei Province, China. The main findings are as follows: (1) building-type classification using random forest algorithms achieved 98.4% accuracy in distinguishing residential, commercial, and industrial structures; (2) two-dimensional hydrodynamic simulations revealed maximum inundation depths predominantly ranging from 1.5 to 2.5 m, with structural damage ratios of 0.2–0.3 and interior property damage ratios of 0.9–1.0; (3) total direct economic damage to building properties in the Dongdian FSDA reached CNY 10.00–11.91 billion (approximately USD 1.42–1.69 billion), with industrial buildings accounting for 68.74% of damage, representing the dominant damage category. This framework delivers a precise flood damage assessment of building properties, transcends traditional survey limitations and offers a globally transferable approach for enhancing disaster resilience and reducing property risks in flood-vulnerable regions, subject to appropriate data availability and parameter adaptation.

How to cite: Jiang, W., pang, Z., Luo, G., Yan, D., Kawasaki, A., and Wu, B.: Development of a building-scale integrated flood damage quantifying framework using a hydrodynamic model and multisource geospatial data, EGU General Assembly 2026, Vienna, Austria, 3–8 May 2026, EGU26-11467, https://doi.org/10.5194/egusphere-egu26-11467, 2026.

EGU26-13881 | ECS | Orals | ITS4.22/HS12.9

From Local Knowledge to Decision Support: A Causal Top-Down Bayesian Network for Drinking-Water Intake Risk Assessment 

Reza Mofidi Neyestani, Prasad Adhav, Maxence Collado, Raja Kammoun, Natasha McQuaid, Jie He, Jean-Baptiste Burnet, and Sarah Dorner

Source water protection is one of the most critical barriers in the multi-barrier approach to ensure safe drinking water. However, identifying and prioritizing upstream hazards are still significant challenges for utilities. Several methods, including machine learning, deep learning, and process-based models, have been applied to risk assessment. These approaches are typically developed using numerical scientific measurements. Despite their high analytical precision, traditional monitoring programs are often expensive and difficult to implement in remote regions. They also frequently miss short-term pollution events such as Combined Sewer Overflows (CSOs). Given the uncertainty this discrepancy creates in risk assessment, independent sources of evidence are required to verify assessment results. In such cases, observations from residents and local users of a water body could represent a valuable data source for water quality monitoring and offer essential reference data to validate models where scientific records are limited. To make these qualitative observations comparable with quantitative scientific data, a structured modeling framework is required. Bayesian Networks can address this challenge by quantifying uncertainty and by integrating non-scientific inputs, such as local knowledge, into a structured risk assessment framework.

Using scientific datasets, including municipal CSO records, meteorological observations, and water quality measurements, together with local knowledge from surveys of watercourse users, this study develops a causal top-down Bayesian Network. In this approach, the network structure is constructed a priori based on theoretical causal mechanisms and expert knowledge rather than being learned computationally from data, ensuring physical interpretability. A fuzzy algorithm was used to quantify subjective expert knowledge into the numerical probabilities required for conditional probability tables. The proposed framework compares the capabilities of these distinct data sources in assessing microbial risk levels at selected drinking-water intakes in southern Quebec, Canada. This research investigates the assessment capacity of non-scientific data sources for microbial risk level estimation at drinking-water intakes, comparing their reliability relative to available scientific monitoring records. Compared with findings from previous studies and reports in the same area, this study shows that information reported by water body users can produce realistic and rational estimates of microbial risk levels. The proposed approach offers a lower-cost data source suitable for remote areas and capturing event-based pollution episodes.

How to cite: Mofidi Neyestani, R., Adhav, P., Collado, M., Kammoun, R., McQuaid, N., He, J., Burnet, J.-B., and Dorner, S.: From Local Knowledge to Decision Support: A Causal Top-Down Bayesian Network for Drinking-Water Intake Risk Assessment, EGU General Assembly 2026, Vienna, Austria, 3–8 May 2026, EGU26-13881, https://doi.org/10.5194/egusphere-egu26-13881, 2026.

EGU26-14509 | ECS | Orals | ITS4.22/HS12.9

Understanding Heterogeneity in Household Adaptation to Intermittent Water Supply: From data to model. 

Shreyas Gadge, Elisabeth Krueger, Vítor Vasconcelos, and André de Roos

More than a billion people around the world experience intermittence in their water supply, where water is delivered for only a few hours per day or a few days per week.  This prompts water users to adapt by installing storage tanks or accessing alternative water services to balance service deficits. Adaptation and its resulting costs and impacts are unequally distributed across urban households and have shown to be largely unaccounted for by local water managers. Most studies on household adaptation to intermittent water supply (IWS), which are typically conducted through survey or interview methods, assume income-based heterogeneity to determine adaptive behaviours and do not account for the multiple factors that influence household adaptation. However, our recent research has demonstrated the multiple factors that shape various household responses to IWS in Amman, Jordan, using hierarchical clustering analysis (HCA). Different clusters of households are distinguished by a set of characteristics, including income, water social network, supply duration, relocation, and water quality problems, and related group-specific adaptive strategies such as contacting the water utility or relying on private water services. 

 Building on this work, we develop a computational model that reproduces piped water use and deficits over time across representative agents from each cluster. We test the model across scenarios of increasing intermittence and population growth, while reproducing trajectories across parameters of pressure and total water availability, giving insights into the inequality and parameters of the system, creating different regimes of water deficit caused by the municipal water supply regime across clusters. We then add the adaptive behaviours of households as recorded in the empirical survey data, to show how adaptation changes water supply resilience across heterogeneous households. 

This forms a crucial step towards an equitable and resilience-oriented water management as it reduces several epistemic uncertainties within the system by strengthening the feedback between household adaptation efforts and local water management.  

How to cite: Gadge, S., Krueger, E., Vasconcelos, V., and de Roos, A.: Understanding Heterogeneity in Household Adaptation to Intermittent Water Supply: From data to model., EGU General Assembly 2026, Vienna, Austria, 3–8 May 2026, EGU26-14509, https://doi.org/10.5194/egusphere-egu26-14509, 2026.

EGU26-14882 | ECS | Orals | ITS4.22/HS12.9

Multicropping increases water scarcity and irrigation demand in Brazilian croplands 

Sophie Ruehr, Andrea Citrini, Edson Wendland, Jeffrey S. Dukes, and Lorenzo Rosa

Agricultural areas are expected to experience more intense rainfall variability in the coming decades, with critical implications for global food production and climate resilience. In Brazil, the world's largest producer of soybean, more than 90% of cropland is rain-fed, making the nation susceptible to shortening rainy seasons, drought and intensifying climate extremes. The Brazilian government plans to expand irrigation to mitigate these risks to its large agricultural sector. Simultaneously, Brazil is incentivizing farmers to grow multiple crops per year in the same tract (multicropping) to ostensibly increase national agricultural output without additional land conversion or deforestation.

Here, we use remote sensing and a crop water model to evaluate how these land-use changes affect evapotranspiration (ET), green water scarcity (an imbalance between rainfall-derived water availability and crop water demand ), and blue water requirements (BWR, the additional water required via irrigation to fulfill crop water requirements not met rainfall) across Brazilian soybean-safrinha maize systems. We find that increasing cropping intensity substantially increases annual ET and irrigation requirements relative to single-cropped, rain-fed systems. As a result, precipitation alone is increasingly insufficient to meet crop water demand, particularly under intensified production and future climate change. We further identify regions where irrigation is most frequently needed and evaluate water resource sustainability under CMIP6 climate projections by estimating monthly blue water scarcity (when human consumption exceeds renewable blue water availability after accounting for environmental flow requirements). The largest increases in BWR and BWS occur in MATOPIBA, an agricultural frontier where agricultural conversion is resulting in rapid biodiversity loss, which may be exaggerated by unsustainable irrigation practices.

Our results highlight a fundamental trade-off between intensification-driven productivity gains and growing pressure on regional water resources. Quantifying these interactions is essential for evaluating the sustainability of irrigation expansion and multicropping as climate adaptation strategies in Brazil’s major agricultural regions.

How to cite: Ruehr, S., Citrini, A., Wendland, E., Dukes, J. S., and Rosa, L.: Multicropping increases water scarcity and irrigation demand in Brazilian croplands, EGU General Assembly 2026, Vienna, Austria, 3–8 May 2026, EGU26-14882, https://doi.org/10.5194/egusphere-egu26-14882, 2026.

EGU26-15044 | ECS | Posters on site | ITS4.22/HS12.9

Mapping spatio-temporal expansion and ecological impacts of Artisanal and Small-Scale Gold Mining in River Catchments Using Multi-Temporal Satellite Imagery and field data 

Docia Agyapong, Elisabeth Krueger, Erik Cammeraat, Boris Jansen, and Lies Jacobs

Artisanal and small-scale gold mining (ASGM) has become a major driver of land degradation and river system disturbance in Ghana, yet its spatial dynamics remain poorly quantified. In our study, we assessed the spatio-temporal dynamics of ASGM and associated land use and land cover (LULC) changes in the Pra (23,202 km2), Ankobra (8,442 km2), and Tano (21,465 km2) river catchments in Ghana, with emphasis on ASGM encroachment into riparian zones. We performed a supervised object based image analysis (OBIA) on sentinel-2 images for the catchments for 2020, 2022, and 2024 using a Random Forest classifier trained on four LULC classes (mining, built-up, water, vegetation). Results indicate consistent ASGM expansion across all catchments, resulting in substantial vegetation loss and increase in surface water, likely reflecting the formation of mine-pit ponds. The Pra catchment experienced the most expansion in ASGM (1,155 km²), followed by the Ankobra (347.8 km²) and Tano (192.3 km²) catchments, alongside increasing encroachment into a100m buffer riparian zones of these river channels, where ASGM increased from 72.65 to 133.97 km² in the Pra (299 km2), from 51.36 to 70.57 km² in the Ankobra (114 km2), and from 25.75 to 44.43 km² in the Tano (292 km2) river channels within this period. To complement these findings, field data collection is currently ongoing to assess the impacts of ASGM expansion on ecosystem health. The findings of this study demonstrate intensifying ASGM pressure on Ghana’s river systems and associated ecosystems, highlighting the need for targeted riparian zone protection and catchment-scale management interventions.

How to cite: Agyapong, D., Krueger, E., Cammeraat, E., Jansen, B., and Jacobs, L.: Mapping spatio-temporal expansion and ecological impacts of Artisanal and Small-Scale Gold Mining in River Catchments Using Multi-Temporal Satellite Imagery and field data, EGU General Assembly 2026, Vienna, Austria, 3–8 May 2026, EGU26-15044, https://doi.org/10.5194/egusphere-egu26-15044, 2026.

EGU26-19765 | Orals | ITS4.22/HS12.9 | Highlight

Nexus approaches to freshwater resilience: an overview from the IPBES Nexus assessment water chapter 

Maria J Santos and the IPBES Nexus Assessment Water team

In the published IPBES Nexus Assessment on the interactions and interlinkages between biodiversity, water, food, health and climate, a set of water response options that deliver solutions to water system challenges were reviewed. Yet this selection emerged from a stepwise procedure that identified 136 response options, globally that deliver across ten water challenges: (i) water and ecosystems, (ii) water and climate, (iii) water quantity, (iv) water quality, (v) water supply and sanitation, (vi) water and culture, (vii) water and equity, (viii) water and governance, (ix) marine, and (x) cross-cutting. Across these water challenges, a minority of response options focused on water alone (n=32), while a large fraction focused on interactions between water and other nexus elements (with one other nexus element n=39, and several nexus n=39). In this presentation, we will show (i) how the response options were identified, (ii) which water challenge was most studied to date, and (iii) what is the current understanding that these response options deliver in relation to freshwater availability. The major findings of the assessment are that a large fraction of humanity’s freshwater demand is used to meet food production, and is dependent on forest for accessible freshwater. Thus a nexus approach to freshwater challenges is fundamental and already being up-took across water challenges, yet few cross across all nexus elements. Further, trade-offs emerge across nexus elements, either when focusing on water or on other elements, and resilience of freshwater therefore depends upon and affects resilience of the whole system, thus would benefit from a more integrated perspective rather than single element approaches.

IPBES Nexus Assessment Water team:

Maria J. Santos, A.A. Kouame, M. Lalika, C.M. Minaverry, S. Oinonen, L. Sandin, M.D. Simatele, N. Rafa, H.S. Embke, A. Gupta, D. Mason-D’Croz, S.C. Phang, T. L. van Huysen, R. Kumar, C. Paukert

How to cite: Santos, M. J. and the IPBES Nexus Assessment Water team: Nexus approaches to freshwater resilience: an overview from the IPBES Nexus assessment water chapter, EGU General Assembly 2026, Vienna, Austria, 3–8 May 2026, EGU26-19765, https://doi.org/10.5194/egusphere-egu26-19765, 2026.

EGU26-20618 | ECS | Orals | ITS4.22/HS12.9

Tracking agricultural water footprint and virtual water trade across global food systems over the period 1961–2023 

Francesco Semeria, Elena De Petrillo, Vittorio Giordano, Stefania Tamea, Marta Tuninetti, and Francesco Laio

Assessing freshwater resilience requires understanding how hydrological resources are embedded within coupled social and ecological systems. Global food production and trade play a central role in redistributing freshwater resources across regions, linking local water availability, ecosystem pressures, and societal demand through virtual water flows. Robust, long-term, and transparent datasets are therefore essential to support integrated assessments of freshwater resilience across scales.

Here we present the CWASI 2.0 dataset, an updated open-access database of global agricultural water footprints and virtual water trade. The database provides country-level, annually resolved estimates for over 300 food products over the 1961–2023 period, thereby enabling the analysis of long-term dynamics in freshwater use and redistribution through global food systems.

As in the original CWASI framework, time-varying unit water footprints are applied to FAO-derived production and reconciled bilateral trade data to compute annual virtual water trade matrices and export volumes, but with CWASI 2.0 several significant advancements have been introduced. Firstly, the temporal coverage of the original open-access database has been extended, from 2016 to 2023, providing the most up-to-date publicly accessible dataset of its kind. Secondly, the modelling framework has been enhanced by refining the description of food value chains: re-exports are now modelled with an updated tracing algorithm, food loss and waste material flows are described, and crops are dynamically allocated to animal diets according to historical trends. Thirdly, unit water footprints are now explicitly decomposed into green water (rainwater) and blue water (surface and groundwater) components, allowing for differentiated assessments. 

Collectively, these advancements lead to greater consistency and finer granularity in the estimation of both water footprints and virtual water flows, offering a robust data foundation which is able to capture recent shifts in global trade patterns and climate variability, allowing to study emerging vulnerabilities and adaptive responses within the freshwater–society–ecology nexus.

How to cite: Semeria, F., De Petrillo, E., Giordano, V., Tamea, S., Tuninetti, M., and Laio, F.: Tracking agricultural water footprint and virtual water trade across global food systems over the period 1961–2023, EGU General Assembly 2026, Vienna, Austria, 3–8 May 2026, EGU26-20618, https://doi.org/10.5194/egusphere-egu26-20618, 2026.

EGU26-20794 | ECS | Posters on site | ITS4.22/HS12.9

Exploring community adaptation to changes the Amazon River dynamics through a transdisciplinary approach and knowledge co-production 

Camilla Usai, Marta Crivellaro, Anna Cantoni, Manuel Castelletti, Andrés Vargas Luna, Massimo Zortea, and Guido Zolezzi

The ongoing intensification of extreme climate events poses an increasing threat to the Amazon River and its floodplains, significantly impacting the riverine Indigenous communities whose livelihoods, mobility, and health are closely linked to the dynamics of the freshwater environment. These increasing hydroclimatic changes highlight the need for a thorough understanding of freshwater systems within a social-ecological nexus in order to develop co-designed strategies and support locally grounded resilience planning.
The study presents an initial insight into the research activities of the NAÃNE project (New Strategies for Environmental Adaptation for Communities and Ecosystems, funded by the Italian Agency for Development Cooperation), which objective is to support community resilience to climatic change by conducting socio-morphodynamic investigations in the Colombian Amazon River corridor, which shall support the development of adaptation strategies including early warning systems.
The study is based on three months of field-campaign conducted among communities living along the Amazon River between the municipalities of Puerto Nariño and Leticia in the Colombian Amazon. By integrating hydrological and morphological perspectives with local knowledge, this project attempts to develop a transdisciplinary methodology of the case study area's freshwater systems resilience. The field methodology is based on preliminary context analysis, which reveals droughts and river contraction as the main challenge faced by the communities. Thus, field data collection comprised qualitative, semi-structured interviews combined with spatially explicit participatory mapping techniques. Field data collected were then compared and integrated with the available hydrological data (water levels) and remote sensing analysis of medium-resolution satellite images to evaluate the local morphodynamics. A total of seventeen interviews were conducted with representative members of four indigenous communities in the study area: Macedonia and Mocagua, located along the main channel, and San Martín de Amacayacu and San Francisco,  located on the tributaries. The combination of interviews and participatory mapping enabled the collection of community perceptions of changes in hydrological seasonality across space and time, from both a graphical and a qualitative perspective. The resulting maps identified historically and currently perceived seasonal water level changes, seasonal navigation points, and cultivated areas, integrated with available hydrological and morphodynamic evaluation. The findings highlighted the impacts of past drought events on community livelihoods, including fishing, agriculture, and local trade, as well as on navigation, access to drinking water, and human health. 
Overall, this study emphasises the importance of a transdisciplinary and inclusive methodology to have a thorough understanding of the local riverine communities and develop effective strategies for riverine systems resilience, setting the basis for knowledge co-production within the NAÃNE project, where local communities, policy makers and water resources managers collaborate to inform decision-making processes.

How to cite: Usai, C., Crivellaro, M., Cantoni, A., Castelletti, M., Vargas Luna, A., Zortea, M., and Zolezzi, G.: Exploring community adaptation to changes the Amazon River dynamics through a transdisciplinary approach and knowledge co-production, EGU General Assembly 2026, Vienna, Austria, 3–8 May 2026, EGU26-20794, https://doi.org/10.5194/egusphere-egu26-20794, 2026.

Water utilities around the world are faced with escalating climate change impacts. In poorer countries, they are also faced with limited financing, ageing infrastructure and shocks and stresses resulting from rapid urbanization and land use change. This study explores how Ghana’s water utility, Ghana Water Limited (GWL) navigates the pressures imposed by climate change impacts such as floods, drought, and raw water quality deterioration. Using a qualitative case study approach, we employ concepts of resilience, pragmatism and capital portfolio analysis to examine how GWL practices resilience and sustains service delivery under climatic stresses.

Pragmatism is discussed using the four P’s framework (practicality, positionality, pluralism, and provisionality) developed by Brendel (2006) and Shields (2008), and adapted by Schwartz and Boakye-Ansah (2023). Water utilities with resource constraints practice resilience by mobilizing their available capitals (natural, financial, human, physical/infrastructural, institutional and social capital) to address challenges they consider most problematic. Resilience is assumed to stem from the mobilization of resources or capitals that most water utilities in the Global South don’t have access to. So we ask: How does GWL practice and enhances its resilience in a resource-constrained environment where large-scale idealized resilience concepts do not seem applicable? Using interview data from several field visits at the water utility, in which we investigated how different actors in the system recall specific crisis events (pollution caused by gold-mining in the catchment and an episode of drought, both of which led to the shutdown of the water treatment plant for one month, each). The findings highlight that water utilities practice resilience by mobilizing different capitals that they have access to in a pragmatic manner. Interventions that are more resilient are often imperfect and temporary in nature, but in the prevailing contextual realities represent the most suitable option for the utility. The four P’s discussed here highlight that being resilient for water utilities in developing countries requires more than just technical and infrastructure fixes. Rather the degree of resilience depends on capitals that the utility has at its disposal coupled with the experience and adaptability to replace strategies with more effective and impactful ones. For a water utility like GWL, pragmatism appears as both a survival strategy as well as a means of building resilience in situations where permanent, ‘best-practice’ solutions remain elusive.

REFERENCES

Brendel, D. H. (2006). Healing psychiatry : bridging the science/humanism divide. MIT Press. http://site.ebrary.com/id/10173550 

Schwartz, K., & Boakye-Ansah, A. (2023, 2023). Pragmatism as an approach for decision-making: Why two Kenyan water utilities opted for pre-paid water dispensers. Utilities Policy, 84, 101623. https://doi.org/https://doi.org/10.1016/j.jup.2023.101623 

Shields, P. M. (2008, Mar-Apr). Rediscovering the taproot: Is classical pragmatism the route to renew public administration? Public Administration Review, 68(2), 205-221. https://doi.org/10.1111/j.1540-6210.2007.00856.x 


How to cite: Ephraim-Armoo, B. B. A.: Practicing Resilience: How Ghana’s Water Utility Adapts to Climate Change Impacts through Pragmatism, EGU General Assembly 2026, Vienna, Austria, 3–8 May 2026, EGU26-21571, https://doi.org/10.5194/egusphere-egu26-21571, 2026.

EGU26-4733 | ECS | Posters on site | ITS4.10/HS12.11

Promoting sustainable domestic wastewater management through Nature-based Solutions in a water-scarce Greek Island 

Taxiarchis Seintos, Evangelos Statiris, Asimina Koukoura, Evridiki Barka, Stelios Giannakaras, Elena Koumaki, Maria Kalli, Constantinos Noutsopoulos, Daniel Mamais, Athanasios S. Stasinakis, Tadej Stepisnik Perdih, Alexandra Tsatsou, and Simos Malamis

Water scarcity and the increasing demand for sustainable wastewater management have intensified interest in decentralized treatment systems that enable safe water reuse, energy recovery, and environmental protection. In Mediterranean and semi-arid regions, reclaimed wastewater is increasingly used for agricultural irrigation, raising concerns related to treatment robustness under variable climatic conditions, the fate of conventional and emerging contaminants, and potential impacts on soil health, crop productivity, microbial communities, and human health. These challenges are addressed in the present study by evaluating a full-scale integration of anaerobic systems and nature-based solutions to promote water reuse for agriculture within a circular water management framework in Lesvos Island, Greece.

The methodology combined long-term process monitoring, advanced chemical analysis, ecotoxicological risk assessment, monitoring antibiotic-resistant bacteria/genes and disinfection and controlled agronomic experiments. Domestic wastewater was treated for over 1000 days using an upflow anaerobic sludge blanket (UASB) reactor operated under ambient conditions, followed by a two-stage vertical subsurface flow constructed wetland designed to enhance solids removal, organic matter degradation, and nitrification. The quality of the reclaimed effluent was assessed for conventional pollutants and a broad spectrum of contaminants of emerging concern (CECs). Subsequently, reclaimed water was applied in real-scale and pilot irrigation trials, where soils, crops, and associated microbial communities were systematically monitored using physicochemical analyses, high-throughput DNA sequencing, and crop growth assessments. Human health risks were evaluated through exposure-based risk characterization using measured concentrations in reclaimed water and agricultural matrices.

The integrated system demonstrated high operational robustness despite pronounced seasonal fluctuations in temperature and hydraulic loading. The UASB reactor achieved substantial removal of suspended solids and COD while producing biogas, with methane yields strongly influenced by temperature. The constructed wetlands provided effective polishing, resulting in overall removals exceeding 90% for organic matter and solids and near-complete ammonium oxidation, producing effluents compliant with EU Class A water reuse standards. Nutrients were partially retained, supporting the fertigation needs. Chemical screening revealed that most CECs were significantly reduced during treatment, although some persistent compounds remained detectable at low concentrations. Nature-based treatment achieved higher ARB removal than conventional systems, while ARGs persisted despite UV and chlorination. Irrigation with reclaimed water enhanced crop biomass and soil moisture without compromising soil physicochemical properties. Microbial analyses showed moderate but structured shifts in bacterial and fungal communities, indicating functional adaptation rather than ecological disruption. Human health risk assessment indicated negligible risk under current reuse practices.

Overall, this investigation demonstrates that the integration of anaerobic treatment with constructed wetlands provides a reliable, energy-positive solution for decentralized wastewater treatment and agricultural reuse. The findings confirm that reclaimed water can be safely reused with minimal environmental and health risks when supported by appropriate treatment and monitoring. This work supports the implementation of circular water reuse strategies and provides a scientifically robust basis for scaling up nature-based solutions in water-stressed regions.

Acknowledgement 

This work was supported by CARDIMED project (https://www.cardimed-project.eu/), which has received funding from the European Union’s Horizon Programme under Grant Agreement ID: 101112731

How to cite: Seintos, T., Statiris, E., Koukoura, A., Barka, E., Giannakaras, S., Koumaki, E., Kalli, M., Noutsopoulos, C., Mamais, D., Stasinakis, A. S., Stepisnik Perdih, T., Tsatsou, A., and Malamis, S.: Promoting sustainable domestic wastewater management through Nature-based Solutions in a water-scarce Greek Island, EGU General Assembly 2026, Vienna, Austria, 3–8 May 2026, EGU26-4733, https://doi.org/10.5194/egusphere-egu26-4733, 2026.

Growing concerns with water resilience have contributed to a renewed interest in implementing nature-based solutions (NbS) such as rain gardens, constructed wetlands and riparian corridors. Offering strategies to fulfill both urban resilience and biodiversity restoration goals , NbS are being used to combat environmental degradation, reduce the risk of droughts and improve water quality in the Mediterranean region. However, emerging initiatives currently advancing the implementation of NbS in Mediterranean cities often focus on technical aspects and rarely provide pathways to mainstream these solutions within local institutional, social and economic contexts. For this reason, many gaps remain in our understanding of how NbS can be effectively integrated in existing practices and policy frameworks. Recognising the reliance on pilot projects that has characterised current research on NbS in the region, we examine various case studies to reveal how NbS can gain scale through "mainstreaming pathways". Exploring the experiences from nine different demonstration sites through the Climate Adaptation and Resilience Demonstrated in the Mediterranean project (CARDIMED), we discuss emerging strategies to support the development of NbS for water resilience through practice and policy innovations. Examining “mainstreaming” as an “ongoing, incremental process of creating and re-forming the institutional order of existing governance arrangements that determine how planning takes place”, we conducted 32 interviews with different stakeholders in CARDIMED to identify how industry, government, civil society and academic institutions are learning by implementing NbS. The experiences indicate that the implementation of NbS depends on innovative urban planning practices that are premised on integrating policies, supporting collaborative management and building networks to foster co-stewardship. Examples from different contexts, ranging from Portugal, Greece, Cyprus and France offer insights into how implementers of NbS can gradually change existing procedures, circumvent restrictions and build momentum for water resilience innovations through pilot projects. Different case studies in CARDIMED serve as examples of how the disruption of existing practices can create opportunities for experimentation with new technologies and how the mainstreaming of NbS can also benefit from more inclusive and participatory decision-making processes. The interviews show that the CARDIMED experiences offer insights into how cities in similar social, political and bioclimatic conditions in the Mediterranean region can achieve water resilience goals through policy and technical innovations. Aligned with a growing body of literature on urban policy and NbS design, our experiences show that mainstreaming NbS depends on finding ways for existing institutions to support greening practices and on transforming these institutions to support innovative practices for water resilience.

How to cite: Wolff, E. and Frantzeskaki, N.: Scaling Water Resilience in the Mediterranean: Lessons on Mainstreaming NbS from the Climate Adaptation and Resilience Demonstrated in the Mediterranean (CARDIMED) Case Studies, EGU General Assembly 2026, Vienna, Austria, 3–8 May 2026, EGU26-5710, https://doi.org/10.5194/egusphere-egu26-5710, 2026.

EGU26-9282 | Orals | ITS4.10/HS12.11

Assessing Nature-Based Solutions for Water Resilience Using Sentinel-2 and PlanetScope Imagery: Traditional Stone Weirs in Sifnos Island (Greece) 

Stylianos Kossieris, Panagiotis Michalis, Kostas Petrakos, Georgios Tsimiklis, and Angelos Amditis

Nature-based solutions (NBS) harness natural processes to address climate-related risks and evolving environmental challenges, providing sustainable and cost-effective alternatives to conventional grey infrastructure. Traditional stone weirs represent multifunctional and environmentally friendly structures that contribute to ecosystem sustainability while enhancing protection against water-related hazards. This type of NBS has demonstrated significant potential in regulating surface runoff by controlling water flow and retaining sediments, thereby reducing flow velocity and erosion during high-discharge events. Through these mechanisms, stone weirs support the enhancement of community resilience under changing climatic conditions. Within the framework of the CARDIMED project, a network of 120 traditional stone weirs was being developed and implemented on Sifnos Island (Greece). These structures are strategically distributed along two main stream networks with the objectives of improving water regulation, supporting aquifer recharge, enhancing biodiversity, and facilitating small-scale agricultural water use. The design and deployment of the weirs are tailored to the specific hydrological and ecological characteristics of the arid island environments of the eastern Mediterranean.

This study presents an integrated assessment of the effectiveness of stone weir nature-based solutions (NBS) in quantifying climate adaptation benefits, with a particular focus on stormwater regulation, using Sifnos Island (Aegean Sea, Greece) as a case study. The analysis adopts a multi-source monitoring framework that combines Earth observation data with in situ measurements collected through fixed monitoring stations, low-cost sensor deployments, and participatory crowdsourcing campaigns. Remote sensing techniques based on Sentinel-2 imagery are employed to derive key vegetation and water-related indices, including the Normalized Difference Vegetation Index (NDVI) and the Normalized Difference Water Index (NDWI), allowing the evaluation of vegetation condition, soil moisture availability, and land surface dynamics. To enhance spatial and temporal detail, PlanetScope imagery is integrated through the Copernicus Contributing Missions (CCM) programme, providing observations at 3 m spatial resolution. The near-daily revisit frequency of PlanetScope enables the monitoring of short-term dynamics and the computation of indices during hydrologically critical periods. Earth observation products are validated using in situ data acquired from monitoring systems installed at strategically selected locations, delivering high-resolution measurements of hydrological, meteorological, and ecological variables under varying climatic conditions. Overall, the proposed methodology offers a robust framework for quantifying the impacts of stone weir implementation and supports the evaluation of their scalability as effective, sustainable solutions for enhancing climate resilience on the regional scale.

Aknowledgments:

PlanetScope © Planet (2025) provided under Copernicus by European Union and European Space Agency.

This research has been funded by European Union’s Horizon Europe research and innovation programme under CARDIMED project (Grant Agreement No. 101112731) (Climate Adaptation and Resilience Demonstrated in the MEDiterranean region). 

How to cite: Kossieris, S., Michalis, P., Petrakos, K., Tsimiklis, G., and Amditis, A.: Assessing Nature-Based Solutions for Water Resilience Using Sentinel-2 and PlanetScope Imagery: Traditional Stone Weirs in Sifnos Island (Greece), EGU General Assembly 2026, Vienna, Austria, 3–8 May 2026, EGU26-9282, https://doi.org/10.5194/egusphere-egu26-9282, 2026.

EGU26-9597 | Orals | ITS4.10/HS12.11

Microalgae as a Nature-Based Solution for Nitrate-Impacted Hard Groundwater Reuse in Cyprus: Performance, Constraints, and Scale-Up Pathways 

Theocharis Nazos, Ilias Chatzimpalis, Ektor Vaidanis, Alexandra Tsatsou, Vassiliki Missa, Daniel Mamais, Constantinos Noutsopoulos, and Simos Malamis

Groundwater contamination by nitrates, together with high salinity, hardness and sulfates, increasingly constrains safe irrigation reuse in Mediterranean hotspots. Microalgae-based Nature-Based Solutions (NbS) can couple nutrient removal with biomass co-production; however, implementation in real groundwater matrices requires strategies that sustain phototrophic function under high Ca2+/Mg2+ and micronutrient limitation. Here we evaluate a naturally resilient Chlorella sp. strain characterized by an extensive extracellular matrix as an NbS-based treatment process for hard groundwater from Nicosia (Cyprus), targeting nitrate decontamination with resource recovery.

The groundwater exhibited a challenging ionic profile (45.2 mg·L-1 NO3-N; 1700 mg·L-1 SO₄²⁻; 361 mg·L-1 Na⁺; 148 mg·L-1 Mg²⁺; 660 mg·L-1 Ca²⁺; EC ~4.6 mS·cm-1), together with low bioavailable phosphorus and trace metals. In 7-day batch tests, nitrate removal was consistently high (>98%), while biomass formation remained substantial despite the unfavorable substrate (VSS increased from 160±5 mg·L-1 up to 1250 mg·L-1 depending on supplementation). Trace-mineral supplementation supported the “trace-metals-as-enabler” principle, as cultures in untreated groundwater exhibited strong stress, whereas Hutner’s trace-metals amendment restored photophysiology and pigment recovery, demonstrating that Fe/Mn/Cu limitation—not nitrate supply—governs culture robustness.

Phosphorus management emerged as the main scale-up constraint in this hard groundwater. A phosphate-buffer addition (6.66 mM K2HPO4 + 3.34 mM KH2PO4) promoted rapid Ca–phosphate mineral formation, driving acidification and removing phosphate beyond what could be explained by biomass assimilation; consequently, changes in Ca/Mg could not be interpreted as biological uptake. Consistent with this, dissolved Ca2+ decreased by ≥61% immediately and reached approximately 73% by day 7, indicating predominantly abiotic removal during medium preparation and cultivation. Dissolved Mg2+ also decreased by ≥15% at day 0, consistent with co-precipitation or sorption onto the newly formed mineral phases, while subsequent Mg decreases likely reflect a combination of continued chemical association and biosorption to algal surfaces.

To translate the approach toward field feasibility, we implemented a lab-scale photobioreactor (800 mL) using a bioenergetic cultivation strategy: low, demand-matched P dosing (5 mg·L-1 PO4–P as KH₂PO₄) with Hutner’s trace metals, daily pH control at 7.2 (acid/base adjustment), and semi-continuous operation (10% daily exchange). Under these conditions, no precipitation occurred, PO4–P remained near-depleted, and nitrate was fully removed by day 14 (>99.9%), alongside moderate co-reductions of Ca²⁺ (27%) and Mg²⁺ (21%). In the absence of phosphate-driven scaling, these co-removals are consistent with biosorption to the EPS-rich extracellular matrix and cell surfaces and removal with harvested biomass.

The validated combination of resilient strain selection, trace-mineral support, and low-dose P delivery with pH control provides a transferable design rule for cultivating microalgae in hard, nitrate-impacted groundwaters while achieving reliable decontamination and biomass co-production. This operating strategy is being validated for large-scale implementation in Nicosia within the CARDIMED demonstrator, including transfer to an outdoor tubular photobioreactor (1200 L) under real climatic conditions.

Acknowledgements: This research has been funded by the European Union’s Horizon Europe Innovation Programme under the CARDIMED project, Grant Agreement No. 101112731.

How to cite: Nazos, T., Chatzimpalis, I., Vaidanis, E., Tsatsou, A., Missa, V., Mamais, D., Noutsopoulos, C., and Malamis, S.: Microalgae as a Nature-Based Solution for Nitrate-Impacted Hard Groundwater Reuse in Cyprus: Performance, Constraints, and Scale-Up Pathways, EGU General Assembly 2026, Vienna, Austria, 3–8 May 2026, EGU26-9597, https://doi.org/10.5194/egusphere-egu26-9597, 2026.

EGU26-13272 | ECS | Orals | ITS4.10/HS12.11

RHEA-DAPT: A transformative AI DSS for supporting adaptation pathways co-development 

Fabio Favilli, Maria Katherina Dal Barco, Rebeca Biancardi Aleu, Debashmita Poddar, Federico Chiarello, and Elisa Furlan

The increasing impacts of climate change require urgent, systemic and innovative responses to address growing risks to human and natural systems. In this scenario of complexity and uncertainty, the challenge is no longer merely to generate new data, but to transform existing knowledge into collective capacities to imagine, design and implement adaptation processes.

The central question guiding our research is: how can we co-create future adaptation pathways in a world where uncertainty has become the new normal?

To address this challenge, RHEA-DAPT has been developed, a Decision Support System (DSS) based on a Retrieval-Augmented Generation (RAG) architecture, conceived as a shared cognitive infrastructure for co-creating a knowledge base for transformative adaptation planning. Developed within the INTERREG AcquaGuard project, it supports climate change adaptation and resilience in flood-prone regions, including Karlovac County (Croatia) and the Veneto Region (Italy), case study regions in the project.

Methodological consistency is ensured through its alignment with the Regional Resilience Journey (RRJ) and the Regional Adaptation Support Tool (RAST), in line with the EU Mission on Adaptation. Grounded in these frameworks, RHEA-DAPT is built on principles of knowledge democratization, collective intelligence, and eXplainable AI (XAI) to enable transparent, interpretable, and collaborative decision-making.

Its multi-level architecture integrates diverse sources such as climate glossaries, regulatory frameworks, policies, territorial plans, project reports, and Nature-based Solutions (NbS) portfolios. The RAG approach reduces the need for dedicated LLM training, lowering computational costs and environmental footprints. By combining retrieval with generative models, it mitigates hallucinations and improves contextual relevance across regions.

Applied to AcquaGuard case studies and co-designed with their local actors, RHEA-DAPT demonstrates how the integration of scientific knowledge, policy and territorial expertise can generate inclusive and transformative adaptation pathways.

RHEA-DAPT embodies a new decision-making paradigm: not a prescriptive model, but a knowledge navigator that helps local actors navigate uncertainty, scenarios and possible alternatives. In this perspective, AI is not an autonomous decision-maker but a cognitive and relational facilitator, capable of supporting collective learning processes. The key question becomes not whether AI is intelligent, but how we can use it intelligently to foster new connections, stimulate critical thinking and strengthen communities capacity for co-creation.

In this uncertain future, even the idea of the future itself changes in nature: no longer a horizon of prediction, but a space of strategic foresight where envisioning what may come through scenario planning and analysis becomes the act that may transform our current choices.

In this perspective, RHEA-DAPT moves to an infinity loop, a dynamic reactivation of the adaptive cycle in climate change adaptation. Through iterative phases of reorganization, exploration, and transformation, adaptation becomes a continuous process of learning and renewal, enabling territories to achieve their climate  resilience while boosting innovative and transformative actions over time.

How to cite: Favilli, F., Dal Barco, M. K., Biancardi Aleu, R., Poddar, D., Chiarello, F., and Furlan, E.: RHEA-DAPT: A transformative AI DSS for supporting adaptation pathways co-development, EGU General Assembly 2026, Vienna, Austria, 3–8 May 2026, EGU26-13272, https://doi.org/10.5194/egusphere-egu26-13272, 2026.

EGU26-14909 | ECS | Posters on site | ITS4.10/HS12.11

Coastal risk assessment: Nature-based solutions’ ecosystem services to drive transformative adaptation 

Fabienne Horneman, Ignacio Gatti, Elisa Furlan, Jacopo Furlanetto, Andrea Critto, and Silvia Torresan

The escalating climate change impacts and increasingly frequent extreme events pose severe threats to coastal ecosystems. As emphasized by the IPCC, these threats demand a strategic transition from incremental to transformative adaptation. Nature-Based Solutions (NBSs) are increasingly embedded in policies for climate adaptation, due to their capacity to mitigate risks and buffer against shocks. However, empirical evidence regarding NBS performance under the long-term influence of climate change and large-scale interventions is limited. Consequently, transformative risk modelling approaches that integrate response and adaptation measures provide a structured pipeline for evaluating both the risks posed by accelerating climate change and the effectiveness of transformative pathways at the landscape scale.

The Horizon 2020 REST-COAST project was designed to demonstrate how upscaled coastal restoration can identify climate adaptation pathways. This study utilizes a Bayesian Decision Network (BDN) capable of simulating NBSs and supporting decision-making to evaluate the performance of large-scale restoration in the Venice Lagoon (Italy). Specifically, it examines wetlands’ ability to enhance ecosystem services and reduce risks under current and future climate conditions. The model consists of nodes representing key variables - including total water level, significant wave height, suspended sediment concentration, saltmarsh vegetation, and elevation - and arcs allowing for the explicit modelling of how climate conditions and restoration could affect ecosystem services, i.e., wave attenuation, sedimentation, carbon accumulation and nutrient uptake.

The developed BDN incorporates historical observations, earth observations and modelling data from 2020 to 2024 to establish the initial conditions of the network. The pilot site in-situ monitoring data, not used for the initialization of the BDN, provides a calibration and validation dataset to evaluate the model predictions and confidence in the model’s ability to support risk-informed adaptation decisions. By comparing the model's predictions with the observed data, the probabilities associated with different states and transitions can be adjusted to better reflect reality. Once validated, the model serves as a tool to evaluate restoration upscaling - the replication of small-scale restoration interventions to the increased lagoon-scale to achieve increased adaptation benefits. These restoration scenarios, co-designed with local stakeholders to reflect their local knowledge, values, and vision for the future of the Venice lagoon, are simulated alongside climate conditions for the current, mid- and long-term RCP4.5 and 8.5 projections.

By modelling the impact of these what-if adaptation strategies, the BDN simulates the effectiveness of upscaled restoration in providing regulating ecosystem services under shifting climate conditions. By moving from localized restoration effects to lagoon-scale system responses, the framework supports the evaluation of transformative adaptation pathways rather than incremental interventions. This risk assessment framework brings together the local stakeholders and decision-makers to better understand, estimate and evaluate the effect of NBS interventions. Further developments will expand upon the REST-COAST findings by investigating the land-sea interface through the EU-funded COAST-SCAPES project, that will assess cross-sectoral interactions, synergies-tradeoffs, up- and outscaling of climate-resilient adaptation through an integrated, landscape-scale approach.

How to cite: Horneman, F., Gatti, I., Furlan, E., Furlanetto, J., Critto, A., and Torresan, S.: Coastal risk assessment: Nature-based solutions’ ecosystem services to drive transformative adaptation, EGU General Assembly 2026, Vienna, Austria, 3–8 May 2026, EGU26-14909, https://doi.org/10.5194/egusphere-egu26-14909, 2026.

EGU26-17605 | ECS | Posters on site | ITS4.10/HS12.11

Mainstreaming Nature-Based Solutions in Torrential Landscapes: Establishing Demonstration Sites in Austria and Slovenia 

Helinä Poutamo, Tamara Kuzmanić, Erik Kuschel, Klaudija Lebar, Nina Humar, Michael Obriejetan, Mark Bryan Alivio, Veronika Grabrovec, Klemen Kozmus Trajkovski, Johannes Hübl, Matjaž Mikoš, and Rosemarie Stangl

Torrential landscapes, characterized by steep slopes, confined channels, and rapid runoff, are increasingly susceptible to climate-driven hazards triggered by heavy precipitation. The resulting fluvial and pluvial floods, debris flows, and associated erosional processes pose a risk to infrastructure and communities in surrounding and in downstream areas. While historical evidence supports the use of nature-based solutions (NbS) in these environments, they support alternative and/or complementary investments to grey infrastructure. However, there is a significant lack of robust, long-term data regarding their effectiveness in the complex alpine terrain. Within the scope of the NATURE-DEMO project, this gap is addressed by investigating the potential of NbS to mitigate climate risks through real-world demonstration sites in Austria and Slovenia.

The project establishes two distinct demonstration sites within torrential landscapes located in Austria and Slovenia, addressing conflicting socio-economic, ecological and technical contexts. In Slovenia, the Gradaščica River site demonstrates NbS implementation in semi-urban and urban contexts within Ljubljana. This site focuses on large-scale river restoration, including channel widening and the creation of buffer zones, to protect over 17,000 inhabitants from recurrent flooding. In contrast, in Austria at the Brunntal Valley the focus is on facilitating sedimentation within the valley floor and mitigate erosional processes to safeguard aquifers that serve as a strategic drinking water supply for the city of Vienna. Given that stringent environmental regulations in this water protection zone largely prohibit conventional grey infrastructure and the application of NbS is preferable.

To gather empirical evidence on NbS functionality, the project employs advanced monitoring strategies. These include UAV-LiDAR and UAV-Photogrammetry to track geomorphological changes and sediment dynamics, alongside traditional hydrological gauging. Preliminary results from the planning and establishment phase highlight the challenges of technical approval and the necessity of stakeholder engagement in mainstreaming green solutions and shifting the paradigm from purely technical engineering to resilient, hybrid landscape management. This results in a multitude of ecological and socio-economic co-benefits that support climate resilience of water infrastructures. Thus, this contribution presents the establishment of torrential landscape demonstration sites and the monitoring strategies used to gather evidence on NbS functioning, along with preliminary results obtained during the planning and establishment phase.


Acknowledgements: The authors would like to acknowledge the financial support provided by the European Union’s Horizon Europe Research and Innovation Programme, within the scope of the project “NATURE-DEMO: Nature-Based Solutions for Climate-Resilient Infrastructure” (Grant agreement No. 101157448). The study was also partially financed by the Slovenian Research and Innovation Agency (ARIS) within the research program P2–0180. The research is also supported by the UNESCO Chair on Water-related Disaster Risk Reduction and the Slovenian national committee of the IHP UNESCO research programme.

How to cite: Poutamo, H., Kuzmanić, T., Kuschel, E., Lebar, K., Humar, N., Obriejetan, M., Alivio, M. B., Grabrovec, V., Kozmus Trajkovski, K., Hübl, J., Mikoš, M., and Stangl, R.: Mainstreaming Nature-Based Solutions in Torrential Landscapes: Establishing Demonstration Sites in Austria and Slovenia, EGU General Assembly 2026, Vienna, Austria, 3–8 May 2026, EGU26-17605, https://doi.org/10.5194/egusphere-egu26-17605, 2026.

EGU26-17881 | ECS | Posters on site | ITS4.10/HS12.11

Mainstreaming NbS for Water Resilience: A Process-Oriented Framework and Evidence from European Regions (EU HORIZON Project NBRACER) 

Oriana Jovanovic, Ase Johannessen, Silke Nauta, and Michiel Blind

Environmental challenges such as floods, heatwaves, and droughts and ongoing biodiversity loss are intensifying under climate change, thereby increasing the interest in Nature-based Solutions (NbS) as measures for mitigation and adaptation. Advancing NbS beyond pilot sites requires their systematic integration into policies, planning, and development practices, a process commonly referred to as mainstreaming. NbS mainstreaming is constrained by institutional, organisational, and cultural barriers, as well as development pathways historically dominated by technological and grey infrastructure solutions. While existing research has documented where and why mainstreaming occurs, less attention has been paid to how it unfolds as a dynamic process of change. Conceptualising mainstreaming as a process of innovation adoption and social learning, encompassing integration, institutionalisation, policy uptake, and governance transformation, is therefore critical to enable the systemic changes needed to embed NbS as standard practice in water and climate resilience planning.

The study employed a mixed qualitative approach to develop and refine a framework for mainstreaming NbS. Existing literature and prior project outputs on mainstreaming were systematically reviewed and compiled into a structured database to capture types of mainstreaming activities and associated capacities. A selected analytical framework was used to guide the design of interview protocols and data collection across regions. Empirical evidence was gathered through structured surveys, semi-structured interviews, and cross-regional knowledge exchange activities, including webinars, to identify best practices and facilitate peer learning. Case study insights were iteratively analysed to refine and expand the framework, in alignment with NBRACER’s work on transformational governance. Mainstreaming practices were documented by mapping regional experiences against established typologies, with additional elements incorporated where empirical evidence revealed gaps. This iterative process resulted in a living, practice-oriented framework that evolves as new forms of mainstreaming emerge.

The methodology is illustrated through a set of water-related NbS case studies representing diverse governance and biophysical contexts. These include the SIGMA Plan in Flanders, exemplifying a shift from engineered flood control to floodplain restoration; the Klimatorium initiative in Denmark, which facilitates cross-sectoral collaboration for climate-resilient water solutions; the Water-and-Soil Guiding Principles in Friesland (Netherlands), embedding NbS within regulatory planning frameworks; rainwater harvesting and constructed wetland systems in East and West Flanders; wetland restoration initiatives in Nouvelle-Aquitaine (France); and the interceptor channel in Cávado, Portugal, integrating flood protection, ecosystem restoration, and recreational functions.

Cross-case analysis identifies key enabling conditions for NbS mainstreaming, including the role of extreme events as catalysts for change, the importance of regulatory alignment and long-term policy commitment, and the influence of knowledge brokers and institutional champions. Social learning plays a central role. Co-design processes, trust-building, and iterative feedback loops enabled stakeholders to shift from scepticism to ownership. The findings further highlight the value of incremental implementation pathways, robust monitoring and evaluation frameworks, and comparative assessment methods that account for NbS co-benefits relative to conventional grey infrastructure.

These results underscore the importance of integrated social, institutional, and technical strategies for scaling and embedding NbS in governance and planning systems.

How to cite: Jovanovic, O., Johannessen, A., Nauta, S., and Blind, M.: Mainstreaming NbS for Water Resilience: A Process-Oriented Framework and Evidence from European Regions (EU HORIZON Project NBRACER), EGU General Assembly 2026, Vienna, Austria, 3–8 May 2026, EGU26-17881, https://doi.org/10.5194/egusphere-egu26-17881, 2026.

Mainstreaming Nature-based Solutions (NbS) is vital to translating the EU Water Resilience Strategy (2025) into meaningful action. Yet, bridging the gap between policy design and practical implementation requires not only technical and financial alignment, but also broad social acceptance and participatory governance.

The NbS Fresco©, supported by the Horizon Europe project NBRACER (n°101112836), emerges as an innovative tool designed to foster this social dimension by raising awareness and engagement around NbS. Inspired by the successful Climate Fresk, the NbS Fresco© builds on proven approaches that use visual storytelling and collaborative learning to make complex scientific knowledge accessible and emotionally resonant. Research shows that traditional environmental communication often fails to engage the public effectively because scientific concepts are presented as isolated facts with limited context. Storytelling helps connect logic with emotion, enhances trust, improves information retention, and motivates action.

The NbS Fresco©’s scope currently focuses on three landscapes (urban, rural, and coastal/marine) and the set of 22 NbS covered in the first version of this serious game addresses a variety of water resilience-related solutions. Through a visual, interactive, and collective narrative experience, the Fresco transforms the complex, interdisciplinary science of NbS into an engaging format that empowers participants to understand the systems behind them, recognize their benefits, and build hope and connection to nature. While not a practical training on NbS implementation, the Fresco’s strength lies in fostering social acceptance and stakeholder buy-in, both critical factors for mainstreaming NbS in integrated water management.

Citizen engagement approaches exemplified by the Fresco contribute to integrated governance by democratizing knowledge, encouraging shared learning, and supporting adaptive management through increased awareness. This participatory dimension is essential to aligning societal values with the EU’s water resilience goals and advancing NbS as viable, complementary alternatives to grey infrastructure.

This presentation will introduce and discuss the NbS Fresco©’s potential as a scalable, agile tool to close the implementation gap by building collective intelligence and fostering inclusive dialogue. It underscores the importance of innovative engagement methods in complementing scientific evidence and policy frameworks to accelerate NbS adoption, thereby enhancing water resilience and socio-ecological sustainability across Europe.

How to cite: Bussoletti, G. and Brack, N.: The NbS Fresco©: A collaborative learning tool to raise awareness and engage stakeholders in mainstreaming NbS for water resilience, EGU General Assembly 2026, Vienna, Austria, 3–8 May 2026, EGU26-19273, https://doi.org/10.5194/egusphere-egu26-19273, 2026.

EGU26-20292 | ECS | Posters on site | ITS4.10/HS12.11

Assessing the Impact of Nature-Based Solutions on Water Resources: A Catchment Scale Modeling Approach 

Awais Naeem Sarwar, Felice Daniele Pacia, Pasquale Perrini, Angelo Avino, Francesco Pugliese, Seifeddine Jomaa, and Salvatore Manfreda

Climate and environmental changes are impacting the hydrological water cycle, affecting water availability and having negative consequences for water security. There are numerous practices in place to address this challenge, one of which is utilizing nature in the form of Nature-based Solutions (NbS). NbS include various interventions, such as green roofs, urban wetlands, permeable pavements, and restored riparian corridors, all inspired by, supported by, or mimicking nature. NbS are emerging as a transformative approach that leverages ecological processes to address societal challenges while delivering multiple co-benefits. However, the application of NbS at a large scale, e.g., Catchment scale, is a challenging task due to constraints in the practicality of these solutions. One major challenge is identifying potential solutions and modeling the impact of these solutions, which seems a straightforward task but presents practical difficulties.

This study focuses on identifying and quantifying the impact of solutions on water availability utilizing the DREAM hydrological model. The case study is conducted in the German catchment, the Bode River Basin. Water management in the Bode is a crucial issue for authorities, as it faces extreme events such as droughts and has experienced significant deforestation in recent years. This approach first identified the potential NbS for the catchment using the catchment-scale framework (Sarwar et al., 2025). Then, those selected solutions were modeled, such as the construction of an infiltration basin, using the site's ecological features. Then, to evaluate the effect of these interventions on the water budget, baseline (without solutions) scenarios were compared to scenarios with solutions. Results showed that the total discharge of the basin is significantly affected, with a 5-10 percent decrease in flows. However, in the locations where infiltration basins were constructed, there has been a higher reduction in runoff volume and an increase in groundwater recharge.

How to cite: Sarwar, A. N., Pacia, F. D., Perrini, P., Avino, A., Pugliese, F., Jomaa, S., and Manfreda, S.: Assessing the Impact of Nature-Based Solutions on Water Resources: A Catchment Scale Modeling Approach, EGU General Assembly 2026, Vienna, Austria, 3–8 May 2026, EGU26-20292, https://doi.org/10.5194/egusphere-egu26-20292, 2026.

In the NBRACER Horizon Europe project, 14 nature-based solutions (NbS) are demonstrated for climate adaptation in rural lanscpaes in the Atlantic region. These solutions are spread over four demo regions Western-Denmark, West-Flanders (Belgium), Nouvelle Aquitaine (France) and Cantabria (Spain). These demonstrators address a range of climate challenges, such as flooding, drought, water quality degradation, and soil erosion, while targeting improvements in Key Community Systems (KCSs) like Water Management, Ecosystems, and Land use & Food Systems. Each of the demonstrators includes a co-design process and monitoring of demo impacts. The methodology combines participatory stakeholder engagement with technical assessments, including ecosystem service mapping and readiness level evaluations. Innovation in the demonstrators focusses on different aspects, depending on the local barriers and enablers, such  as technological readiness but also co-design and social acceptance, governance aspects and innovation in funding.

In this presentation we provide an overview of the demonstrators and their co-design processes. The co-design process is guided by five iterative steps: issue framing, knowledge gathering, co-design of options, stakeholder validation, and decision-making. We present a comparative analysis of the demonstrators, highlighting the diversity of approaches, stakeholder constellations, and maturity levels. We also identify enabling conditions and barriers to implementation, such as governance structures, data availability, and social acceptance.

Key findings show that while most demonstrators are still in early co-design stages, there is strong alignment between local needs, stakeholder engagement, and the potential of NbS to deliver climate resilience. The insights from this deliverable will inform the development of regional NbS portfolios and adaptation pathways for the rural landscapes in NBRACER.

How to cite: Notebaert, B., Baptista, C., and Vogelij, R.: Co-design of Transformative Systemic Rural climate adaptation Solutions in rural lansscapes in the Atlantic region, EGU General Assembly 2026, Vienna, Austria, 3–8 May 2026, EGU26-20723, https://doi.org/10.5194/egusphere-egu26-20723, 2026.

EGU26-21155 | Orals | ITS4.10/HS12.11

Mainstreaming Nature-Based Solutions for Water Resilience through System-Wide Landscape Planning 

Katerina Tzavella, Yuting Tai, Tom Bucx, Michiel Blind, Hung Vuong PHAM, Angelica Bianconi, Stamatios Petalas, Ioannis Tsakmakis, Nikolaos Kokkos, Christos Ouzounis, and Georgios Sylaios

Climate change is exacerbating droughts, floods, and water quality degradation across Europe, with particularly strong impacts in Mediterranean regions. While Nature-Based Solutions (NbS) are central to the EU Water Resilience Strategy, their implementation is often constrained by mono-hazard approaches, sectoral thinking, and fragmented governance and funding structures. These same structural barriers extend beyond water management, affecting flood risk management, landscape-scale adaptation and broader resilience planning, where institutional fragmentation and limited policy acceptance continue to hinder the deployment of NbS as integrated, system-wide resilience measures.

This contribution proposes a system-wide landscape planning approach grounded in a Complex Adaptive System of Systems (CASoS) perspective, which conceptualises landscapes as interdependent biophysical, socio-economic and governance systems. Resilience to climate change and extreme events is understood as the capacity to maintain key system functions (e.g., water regulation and supply, energy provision, mobility and ecosystem regulation), safeguard populations and critical services (e.g., healthcare delivery, emergency response, education and social care), adapt to evolving drivers, and transform adaptation pathways beyond critical tipping points rather than returning to pre-event states.

The approach is demonstrated through a Mediterranean case study using landscape characterisation and cross-domain typologies to classify landscape archetypes by integrating biophysical, socio-economic and governance factors with spatial multi-hazard analysis. Potential impacts on Key Community Systems (KCS), including water, health, ecosystems, mobility, energy and economic activities, are assessed to identify NbS such as floodplain and wetland restoration, natural water retention measures and green–blue infrastructure as risk reduction and resilience-building opportunities. NbS contributions to adaptation are evaluated using the Landscape Resilience Curve, which supports the definition of adaptation pathways and the sequencing of NbS portfolios by analysing how interventions modify exposure, sensitivity and recovery capacity under increasing hazard intensity.

Key barriers to NbS mainstreaming, including institutional silos, limited data integration and weak cross-sector coordination, are analysed alongside the governance and investment co-benefits of NbS, highlighting pathways for their scalable and system-wide implementation in support of climate-resilient water management and landscape-scale adaptation.


How to cite: Tzavella, K., Tai, Y., Bucx, T., Blind, M., Vuong PHAM, H., Bianconi, A., Petalas, S., Tsakmakis, I., Kokkos, N., Ouzounis, C., and Sylaios, G.: Mainstreaming Nature-Based Solutions for Water Resilience through System-Wide Landscape Planning, EGU General Assembly 2026, Vienna, Austria, 3–8 May 2026, EGU26-21155, https://doi.org/10.5194/egusphere-egu26-21155, 2026.

EGU26-21156 | ECS | Posters on site | ITS4.10/HS12.11

Integrating Critical Infrastructures and Nature-based Solutions as responses in an index-based flood risk mapping for the Cávado Region (Portugal) 

Christian Simeoni, Fabio Favilli, Vuong Pham, Katerina Tzavella, Tom Bucx, and Michiel Blind

This study presents a comprehensive risk assessment methodology tailored to the Cávado region, Portugal, an area vulnerable to flood hazards. The approach integrates the four core IPCC risk components (hazard, exposure, vulnerability, and response), leveraging open-source datasets to ensure transparency, replicability, and transferability. An index-based modelling framework is applied at 100m spatial resolution, combining flood simulations for multiple return periods (RP10, RP50, RP100, and RP500) to capture the spatial variability of flood risk.

A key novelty of this work lies in the integrated assessment of multiple response indicators aimed at risk mitigation, with particular attention to the spatial distribution and accessibility of critical infrastructure, including healthcare and educational facilities. A network-based analysis is implemented to evaluate access to essential services under different flood scenarios, assessing both walking and driving modes. Travel distances and times from road nodes to health-related points of interest are quantified to support emergency response planning.

The methodological framework was developed through continuous stakeholder engagement with regional authorities, involving an iterative dialogue to support data acquisition, define the baseline risk situation, jointly identify relevant Nature-based Solutions (NBS) to be modelled, and validate the modelling outcomes. 

Results include spatially explicit flood risk maps across different return periods, as well as an evaluation of how different response measures, including NBS, influence overall risk patterns. The proposed approach provides a robust, scalable, and policy-relevant tool to support data-informed decision-making in disaster risk reduction, emergency planning, health infrastructure investment, and climate adaptation strategies.

How to cite: Simeoni, C., Favilli, F., Pham, V., Tzavella, K., Bucx, T., and Blind, M.: Integrating Critical Infrastructures and Nature-based Solutions as responses in an index-based flood risk mapping for the Cávado Region (Portugal), EGU General Assembly 2026, Vienna, Austria, 3–8 May 2026, EGU26-21156, https://doi.org/10.5194/egusphere-egu26-21156, 2026.

EGU26-21431 | Orals | ITS4.10/HS12.11

A methodology for the nature-based management of the reservoir sediment: Supporting decision-making to enhance the resilience of local communities 

Micol Vascellari, Carla Asquer, Mario Deriu, Giovanni Satta, Silvia Serra, Filippo Arras, Maria Bonaria Careddu, Daniele Congiu, Susanna Marino, Andrea Motroni, Gian Piero Piredda, Loredana Poddie, Laura Santona, Daniela Utzeri, Roberto Meloni, Gabriele Marras, Giovanni De Falco, Alessandro Conforti, Claudio Kalb, and Simone Simeone

Sardinia has an integrated water reserve system comprising more than 30 dams on rivers. Built in the last century, these dams have become part of the modern landscape, while also continuing to affect sediment transport. The trapping of sediment has hindered its natural movement towards the coastal system ever since, thereby reducing the supply of sediment to sandy beaches and increasing their vulnerability to coastal erosion. On the other hand, the reservoirs' capacity to store water is also impacted. These two issues are of particular concern in the context of climate change.

For this reason, the present study addresses both issues by proposing a methodology to assess the feasibility of using reservoir sediment as a source of material for beach replenishment. The Autonomous Region of Sardinia and its regional partners are currently developing this methodology as part of the DesirMED project, which is funded through the HORIZON-MISS-2022-CLIMA-01 call, which addresses climate change adaptation through a nature-based approach.

The methodology was designed and structured in the following steps: the development of a database of sediment characteristics and reservoir locations; the application of multi-criteria analysis using a defined set of indicators; the selection of case studies where to conduct technical visits involving measurements and sampling;  a technical feasibility study on sediment-sand compatibility; and the assessment of the results from the perspective of potential sediment reuse for beach replenishment.

This study is part of the ongoing process of implementing adaptation measures. The Autonomous Region of Sardinia incorporates this process into its Regional Adaptation to Climate Change Strategy, which was adopted in 2019 and recently revised. Although the methodology is still in its early stages, it will contribute to improving the resilience of coastal communities and the implementation of adaptation measures at a local level.

How to cite: Vascellari, M., Asquer, C., Deriu, M., Satta, G., Serra, S., Arras, F., Careddu, M. B., Congiu, D., Marino, S., Motroni, A., Piredda, G. P., Poddie, L., Santona, L., Utzeri, D., Meloni, R., Marras, G., De Falco, G., Conforti, A., Kalb, C., and Simeone, S.: A methodology for the nature-based management of the reservoir sediment: Supporting decision-making to enhance the resilience of local communities, EGU General Assembly 2026, Vienna, Austria, 3–8 May 2026, EGU26-21431, https://doi.org/10.5194/egusphere-egu26-21431, 2026.

EGU26-21658 | ECS | Posters on site | ITS4.10/HS12.11

Urban Challenges Under Climate Change – Managing Sealed Surfaces 

Frane Gilić, Martina Baučić, Samanta Bačić, and Ana Grgić

In the topographic catchment of the River Jadro, areas designated for construction—including terrain modifications causing impermeability—account for 38% of the land. This figure highlights intense urbanization pressure on the catchment's natural environment. Currently, stormwater drainage infrastructure remains largely undeveloped. Future climate change scenarios predict more frequent heavy rainfall events, which will inevitably increase surface runoff and the risk of flash floods. Furthermore, stormwater flowing through urbanized zones will worsen existing pollution, contaminating the River Jadro, its estuary, and the coastal waters of Kaštela Bay. Under the Interreg project "Change We Care," a GIS analysis assessed current imperviousness within the catchment's built environment to support the "Climate Change Adaptation Plan for the River Jadro." Imperviousness data for urban surfaces were derived from the Copernicus Land Monitoring Service using the Imperviousness Density Status Layer and categorized by planned land use. Results indicate that within Solin’s administrative boundaries, built-up mixed-use areas possess 50% impervious surfaces. Conversely, in the Municipality of Klis, only 13% of the built-up area is impervious. However, urban regulations allow building plots to reach 80% imperviousness. Consequently, a rise in impervious surfaces to this maximum is probable, a trend already visible in commercial zones. Historically, artificial concrete banks were constructed along the Jadro’s middle and lower courses, disrupting the river's natural characteristics. Given the negative impacts of these anthropogenic changes, restoring river ecosystems is essential. Renaturalizing the main watercourse and its tributaries would significantly enhance regional sustainability. Because the natural and built environments are functionally intertwined, problem-solving requires an integrated approach that combines water management for the Jadro system with Solin’s urban water infrastructure. Therefore, the "Climate Change Adaptation Plan for the River Jadro" recommends mitigating urbanization impacts by strengthening natural components within urban spaces. Key measures include revising allowable impervious surface limits and differentiating permeability parameters by construction zone based on geological and topographic features. The plan also suggests introducing financial incentives for sustainable, ecological solutions. Physical interventions should include renaturalizing parts of the Jadro and its tributaries, protecting against coastal flooding by securing retention areas, and creating a "green-blue heart" in Solin and Klis by upgrading projects with Nature-based Solutions. Today, the DesirMED project is expanding these measures into an integrated management approach for the entire Kaštela Bay area in light of climate change. By collaborating with local stakeholders, a shared vision has been defined. Development is currently underway for adaptation pathways that feature a portfolio of innovative solutions, with a distinct priority placed on Nature-based Solutions to ensure long-term resilience. This evolution from specific river management to a broader bay-wide strategy represents a critical step forward. It acknowledges that effective climate adaptation requires looking beyond immediate municipal borders to encompass the wider hydrological and ecological context of the entire basin. Through these combined efforts, the region aims to balance necessary urban development with the urgent need for environmental preservation and climate resilience.

How to cite: Gilić, F., Baučić, M., Bačić, S., and Grgić, A.: Urban Challenges Under Climate Change – Managing Sealed Surfaces, EGU General Assembly 2026, Vienna, Austria, 3–8 May 2026, EGU26-21658, https://doi.org/10.5194/egusphere-egu26-21658, 2026.

EGU26-22078 | ECS | Orals | ITS4.10/HS12.11

Mainstreaming Nature-Based Solutions for Stormwater Management: Business Models for Urban Sprawl 

Maria Wirth, Eriona Canga, Sarah Gilani, Lauren Machí-Castañer, and Marco Hartl

Urban sprawl poses a persistent challenge for stormwater management, as low-density development patterns increase impervious surfaces while limiting the effectiveness and affordability of conventional, centralised drainage infrastructure. Nature-based Solutions (NbS) for urban areas, such as rain gardens, bioswales, and bioretention areas, have demonstrated strong potential to address stormwater quantity and quality challenges while delivering co-benefits such as urban cooling, biodiversity enhancement, and recreational value. However, despite extensive piloting, NbS for stormwater services are insufficiently mainstreamed in many urban regions and grey infrastructure often remain the default. A key barrier lies in the difficulty of developing scalable business models and governance arrangements that enable their long-term provision as part of regular stormwater services, particularly in dispersed urban environments.

This paper examines how co-creation processes can inform the development of business models for mainstreaming decentralised NbS for stormwater management in urban sprawl. Empirical insights are drawn from structured co-creation processes conducted in the metropolitan cities of Lyon (France) and Milan (Italy), involving the metropolitan authorities responsible for stormwater management, water utilities, planners, and researchers. The co-creation activities aimed to identify priority planning units or contexts, relevant stakeholder groups, and feasible implementation arrangements for NbS by aligning technical performance requirements with regional policies and governance structures, financing mechanisms, and stakeholder roles.

Across both case studies, three distinct urban environments emerged as particularly relevant for NbS-based stormwater service delivery in urban sprawl: (i) single household units, (ii) parking lots, and (iii) public parks. These environments differ substantially in terms of land ownership, regulatory context, investment logic, and operation and maintenance responsibilities, resulting in divergent requirements for viable business models. Rather than proposing a one-size-fits-all solution, the paper demonstrates how each urban environment is associated with a specific set of business model logics and governance pathways.

For single household units, mainstreaming NbS depends on incentive-based and technical assistance models that minimise transaction costs for private property owners and enable aggregation at neighbourhood scale. Parking lots, typically characterised by mixed ownership, offer opportunities for public–private partnership models that integrate NbS into asset management and redevelopment cycles. Public parks provide a setting for utility- or municipality-led models in which NbS are embedded into existing public service provision and justified through multi-functional value creation.

The findings highlight the importance of distinguishing between urban environments as planning and business model units when seeking to mainstream NbS in urban contexts. Co-creation proved instrumental in revealing institutional opportunities and constraints, aligning actor expectations, and identifying realistic pathways from pilot projects to standard practice. The paper concludes that successful mainstreaming of NbS for decentralised stormwater management requires environment-specific business models supported by coherent governance arrangements. Consistently, focusing on specific urban environments significantly reduces the complexity of navigating urban governance systems and can accelerate the development of scalable business models for NbS.

How to cite: Wirth, M., Canga, E., Gilani, S., Machí-Castañer, L., and Hartl, M.: Mainstreaming Nature-Based Solutions for Stormwater Management: Business Models for Urban Sprawl, EGU General Assembly 2026, Vienna, Austria, 3–8 May 2026, EGU26-22078, https://doi.org/10.5194/egusphere-egu26-22078, 2026.

There is growing awareness among urban communities that nature-based solutions (NbS) can actively mitigate climate change impacts, while securing ecosystem services. However, assessing the full potential of NbS to provide these multifaceted benefits remains a challenge, as NbS function at the intersection of physical and social processes that occur at different spatial and temporal scales (what we call herein as the Water-Energy-Ecosystem, WEE, nexus).

This coupling of physical and social dynamics is naturally represented as a network of relationships, making causal probabilistic networks (CPNs) suitable for encoding causal structures and propagating uncertainty. In practice, however, nexus approaches often face scarce and heterogeneous data, necessitating expert knowledge to parameterise the conditional probabilities of CPNs, a process that is time-intensive and difficult to scale.

Large language models (LLMs) have been recently shown to complement expert elicitation of conditional probabilities, alleviating the resources required for the parameterisation of CPNs. Nonetheless, open questions remain as to whether (a) LLMs can support expert elicitation in complex, interdisciplinary domains in a transparent and reproducible manner, and (b) retrieval-augmented generation (RAG) improves elicitation quality by grounding probability judgments in problem-specific evidence.

To answer those questions, this work proposes a structured validation framework for LLM-assisted elicitation. Validation targeted model utility for impact assessment using: (i) probabilistic coherence (bounds, monotonicity expectations, leak dominance, and required interactions), (ii) scenario-based stress-testing to verify expected risk ordering, and (iii) repeatability analysis across repeated LLM elicitations to quantify stability of CPN parameterisations. Three elicitation modes were considered: (i) human experts, (ii) LLM-only (proprietary and open-source LLMs were used), and (iii) RAG-LLM using pre-trained, open-source LLMs and a curated evidence pack retrieved and cited during elicitation.

The framework was tested using a dynamic CPN, which delineates the effects of urban blue–green interventions that integrate stormwater source control and greening strategies on mitigating runoff, enhancing infiltration, and regulating the microclimate. To reduce dimensionality while retaining mechanistic detail, variables were discretized into binary states and parameterized via Noisy-OR gates, eliciting only single-cause activation probabilities and leak terms using a standardized questionnaire that also captures uncertainty intervals and confidence ratings.

The evaluation of LLM-only and RAG- enhanced elicitation suggests that LLMs can offer a viable initial parameterisation for CPNs, particularly in contexts where data are scarce. LLM‑generated parameter sets satisfied coherence criteria and exhibited low variance across repeated elicitation runs, while stress‑testing confirmed that the resulting networks produce plausible risk orderings. RAG‑enhanced open‑source models achieved comparable performance to proprietary counterparts while offering greater traceability. Nevertheless, disagreements with the expert-derived elicitation persist at the parameter level. Miscalculated parameters propagated downstream effects during part of the stress-testing with climatic and asset-degradation scenarios, underscoring the need for expert supervision.

Equally importantly, however, this work provides a validation framework that functions as a structured practical benchmark for integrating LLM-assisted probabilistic elicitation into complex nexus models for the assessment of NbS when observational data are limited or unavailable.

How to cite: Kandris, K., Joshi, A., Nika, E., and Katsou, E.: Evaluating LLM-assisted elicitation of conditional probabilities in causal networks for the assessment of nature-based solutions across the water-energy-ecosystem nexus, EGU General Assembly 2026, Vienna, Austria, 3–8 May 2026, EGU26-22135, https://doi.org/10.5194/egusphere-egu26-22135, 2026.

HS13 – Further sessions of interest to Hydrological Sciences

EGU26-696 | ECS | Posters on site | AS2.2

Multivariate driver analysis and moisture attribution of the December 2023 Tuticorin floods 

Nikhil Ghodichore and Vinnarasi Rajendran

Between 17th -18th December 2023, Tuticorin district and adjoining regions in Southern India experienced an exceptional extreme precipitation event, receiving approximately 950 millimetres of rainfall within 24 hours, leading to severe inundation and extensive losses to agriculture and infrastructure. The fact that the amount of rainfall received on a single day exceeded the average annual rainfall over Tuticorin makes this event particularly noteworthy. This study investigates the hydrological and meteorological drivers responsible for this rare extreme event using high resolution reanalysis datasets and India Meteorological Department 0.25° gridded precipitation data. The influence of Integrated water Vapour Transport (IVT), along with other dynamic factors such as atmospheric instability and total column water vapour on the extreme precipitation is assessed using a factor combination methodology based on conditional probability. Additionally, to reveal the moisture sources for this event, the backward trajectory of moisture particles was traced using HYbrid Single Particle Lagrangian Integrated Trajectory (HYSPLIT) model. Results reveal that all three factors exceeded their 99th percentile thresholds, with their peaks occurring one day prior to the rainfall maximum, indicating a strong preconditioning of the atmosphere for extreme convection. HYSPLIT results confirmed sustained moisture influx from the Bay of Bengal and equatorial Indian Ocean up to seven days before the event. A comparative evaluation across El Niño years (1991, 1997, 2005, 2015, and 2023) showed that only the 2023 event exhibited concurrent extremes in all parameters. These findings underscore the compound nature of the 2023 Tuticorin flood and highlight the need for integrated moisture diagnostics in predicting future extreme rainfall events over peninsular India.

How to cite: Ghodichore, N. and Rajendran, V.: Multivariate driver analysis and moisture attribution of the December 2023 Tuticorin floods, EGU General Assembly 2026, Vienna, Austria, 3–8 May 2026, EGU26-696, https://doi.org/10.5194/egusphere-egu26-696, 2026.

EGU26-1138 | ECS | Posters on site | AS2.2

Increased PM levels influence leaf conductance and modify transpiration dynamics, altering groundwater levels in IGP India. 

Sombir Pannu, Prakhar Shrivastava, Vikram Singh, Usha Mina, Chandan Gupta, Bhupinder Singh, Piyush Jain, and Mayank kumar

Aerosols affect the worldwide plant environment in both beneficial and harmful ways. Despite its potential importance, its direct influence on plant–water interactions is little known. Tomato plants were grown in ambient urban air, filtered air, and severely polluted air following precise exposure procedures. While measuring transpiration rate and stomatal density, leaf hydration kinetics, microscopic leaf wetness creation, and aerosol deposition patterns were also assessed.

The experiment was conducted from August 2025 in three plant-growing chambers at IIT Delhi. Temperature and RH were the same. At plant level, plants were exposed to natural daylight (up to 1500 µmol m⁻² s⁻¹). Leaf dust deposition was monitored. Every other day, elevated chambers were sprayed with dust, while HEPA filters cleaned air in filtered chambers. PM2.5 deposition on leaves ranges from 50 µg/cm² to 600 µg/cm² for HEPA filter-equipped and increased PM conc. chambers, respectively. During the monitoring period, PM2.5 levels at several locations in the area averaged 150-600 µgm⁻³.Net photosynthesis, stomatal conductance, and transpiration rate were measured in real time using LI-COR 6400XT.

The mass accumulated on leaves was 10 to 12 times more in the elevated PM chamber. Fresh leaves from plants grown under reduced, ambient, and elevated chamber conditions were collected, affixed to specimen holders using adhesive Leit tabs, and analysed using environmental scanning electron microscopy. Stomatal density was seen to have risen (~170 per mm²) from the seedling stage. The minimum leaf conductance (gmin) was measured on leaflets. Photosynthetic rate increased from 14 µmol m⁻² s⁻¹ to 21 µmol m⁻² s⁻¹. The gmin is anticipated to rise when dust deposition on leaves increases. The rise in water uptake by plants suggests that phenomena such as hydraulic activation of stomata (HAS) or heat retention by deposited aerosols have intensified water loss, either through cooling themselves from the heat absorbed from excessive dust accumulation or by forming wicks into the leaves from the salts in the aerosols, thereby facilitating the escape of water from leaves into the environment through evaporation. The Fv/Fm ratio, a measure of photosynthetic efficiency, was maximised in the lowered chamber.

The impact of aerosols on plants is contingent upon their composition, species, and environmental conditions, affecting the movement of water via stomata and cuticular transpiration. Research indicates that ambient aerosol deposition in polluted urban environments elevates gmin, transpiration rates and modified stomatal density. Severity of impact increases pollution levels and hygroscopic aerosols due to extended exposure. Aerosol-induced water loss diminishes stomatal regulation, impairs drought resilience and water usage efficiency, and complicates carbon-water flow scaling. The increased transpiration rate leads to greater water consumption by plants, which might contribute to the depletion of groundwater levels in the IGP India. Additional investigation is required to elucidate the processes connecting aerosol deposition and stomatal response, considering their significance for global climate change.


How to cite: Pannu, S., Shrivastava, P., Singh, V., Mina, U., Gupta, C., Singh, B., Jain, P., and kumar, M.: Increased PM levels influence leaf conductance and modify transpiration dynamics, altering groundwater levels in IGP India., EGU General Assembly 2026, Vienna, Austria, 3–8 May 2026, EGU26-1138, https://doi.org/10.5194/egusphere-egu26-1138, 2026.

EGU26-1708 | Orals | AS2.2

Cloud–Forest Coupling: New insights integrating Amazon Observations and Explicit Canopy-Cloud Simulations 

Jordi Vila-Guerau de Arellano, Robbert Moonen, Vincent deFeiter, Hugo deBoer, Oscar Hartogensis, Thomas Röckmann, and Raquel Gonzalez-Armas

Forests and clouds are central to Earth’s carbon and water cycles, yet they are rarely studied as a coupled system. Recent observations reveal concurrent shifts in forest CO₂ uptake and cloud regimes across tropical, temperate, and boreal biomes, signaling changes in forest–atmosphere coupling with profound implications for cloud cycling and climate feedbacks. While rising CO₂ may enhance forest assimilation, declining trends in low cloud cover alters radiative fluxes and amplifies warming, potentially modifying forest photosynthesis, turbulence, and biogenic volatile organic compound emissions. In turn, these processes influence clear/cloud boundary layer dynamics by controlling the partitioning of canopy turbulent fluxes, influence boundary-layer dynamics and cloud formation. Yet current Earth system models largely overlook these cross-scale interactions.

To advance our understanding on the forest-cloud coupling, we focus on the Amazon basin as a proof-of-concept where we integrate field observations from the CloudRoots-Amazon22 campaign with new multi-layer canopy large-eddy simulations that explicitly resolve interactions between the forest canopy and the clear/cloudy boundary layer. The CloudRoots-Amazon22 experiment, conducted at the ATTO and Campina supersites during the August 2022 dry season, investigated the sub-diurnal evolution of the common clear-to-cloudy transition in the Amazon.

High-frequency observations reveal that stomatal conductance responds to variations in cloud optical thickness, demonstrating that canopy–cloud radiative perturbations regulate sub-diurnal canopy carbon and water exchange. Turbulent fluxes and vertical transport adjust within minutes to cloud passages, highlighting rapid land–atmosphere coupling. Collocated surface fluxes, profiles of thermodynamic variables, and CO₂ concentrations, further establish causal links between biophysical canopy processes and cloud dynamical development.

Building on these insights, we present an integrated framework that combines high-frequency observations with turbulence-resolving simulations embedded in global storm-resolving models to quantify shifts in cloud–forest coupling under climate change. This coupled approach advances our understanding of how cloud-radiative perturbations, turbulent transport, and photosynthesis co-evolve, bridging leaf-level processes and cloud-scale dynamics, and provides a pathway to constrain key uncertainties in Earth system models.

How to cite: Vila-Guerau de Arellano, J., Moonen, R., deFeiter, V., deBoer, H., Hartogensis, O., Röckmann, T., and Gonzalez-Armas, R.: Cloud–Forest Coupling: New insights integrating Amazon Observations and Explicit Canopy-Cloud Simulations, EGU General Assembly 2026, Vienna, Austria, 3–8 May 2026, EGU26-1708, https://doi.org/10.5194/egusphere-egu26-1708, 2026.

Ultrasonic anemometers (UA) are frequently employed to measure wind, air temperature, and turbulent exchange of energy and matter in the atmospheric boundary layer. They are fast-response, linear, accurate, first-principle instruments.  Their accuracy is determined by the lengths of the acoustic paths, the direction cosines of the path geometry, and the time of flight of the acoustic signals. A fundamental limitation of UA is the self-shadowing wake effect caused by the ultrasonic transducers and support structures interfering with the flow field, leading to underestimation of the wind measurement along the acoustic paths. To minimize the transducer wake effects, numerous UA designs with different geometry, orientation, and length of the ultrasonic paths have been proposed, but there is no consensus on optimal transducer arrangement. In a widely used non-orthogonal UA design each of the three acoustic paths is tilted 60 degrees from the horizontal plane and equally spaced 120 degrees around the vertical axes. The advantage of the non-orthogonal UA is that the transducers are taken out of the horizontal plane and the three sensing paths intersect forming a small measurement volume preserving the correlation between the components of the wind vector. Alternatively, in a less common orthogonal UA design, the acoustic paths are arranged perpendicular to each other and parallel to the axes of a Cartesian coordinate system, allowing the measurement of the vertical wind component by a single pair of transducers. A disadvantage of the orthogonal UA is the large separation between the wind components and the self-shadowing effects of the transducers in the horizontal plane. To compare the performance of the orthogonal and non-orthogonal UAs we designed a unique integrated twelve-transducer probe, combining both designs in one structure with all six acoustic paths referenced to a common coordinate system. Such an arrangement reduces the uncertainty of the combined wind measurements by eliminating the need for coordinate rotation to align each UA coordinate system to the mean flow field. This study is unique because the two UAs use the same ultrasonic transducers, have equal path length to transducer diameter ratios, utilize the same time-of-flight signal processing algorithm, sample rate and measurement bandwidth. The primary difference between the two UAs is the orientation of the six acoustic paths. We demonstrate the details of the design of the combined probe and present results from a field experiment.

How to cite: Bogoev, I. and Strickler, B.: Performance Evaluation of Three-Component Ultrasonic Anemometers with Orthogonal and Non-Orthogonal Transducer Arrays, EGU General Assembly 2026, Vienna, Austria, 3–8 May 2026, EGU26-3170, https://doi.org/10.5194/egusphere-egu26-3170, 2026.

Previous commercially available closed-path eddy covariance instrumentation used to quantify fluxes of trace gases relied on large flow rates from large pumps to attain high frequency response. These pumps would require AC mains power as well as environmental protection, limiting suitable locations for deployment. Building on over 20-years of experience manufacturing field-rugged trace gas analyzers, Campbell Scientific has developed a new novel closed-path analyzer to measure methane or nitrous oxide mixing ratios. The new analyzer achieves excellent frequency response (>3Hz bandwidth) with only 1.8 LPM flow rate and typical power consumption of 40W, while maintaining excellent noise performance (<5 ppb and <1 ppb typical noise at 10Hz Allan deviation for methane and nitrous oxide respectively).

How to cite: Conrad, B.: Frequency Response of a Low-Power Trace Gas Analyzer for Eddy-Covariance Flux Measurements, EGU General Assembly 2026, Vienna, Austria, 3–8 May 2026, EGU26-3183, https://doi.org/10.5194/egusphere-egu26-3183, 2026.

EGU26-3359 | ECS | Posters on site | AS2.2

The Mashash Desert Climate Observatory: A New Megasite for Air–Land Exchange Processes in Subtropical Deserts 

Aviv L. Cohen-Zada, Moshe Armon, Elad Dente, Nili Harnik, Eitan Hirsch, Arnon Karnieli, Ilan Koren, Shira Raveh-Rubin, Maxim Shoshany, Noam Weisbrod, and Nurit Agam

Arid and hyper-arid regions (deserts) are dynamic ecosystems that respond sensitively to changes in water availability, temperature, and atmospheric CO₂, and can both indicate and influence climate change. Although approximately 27% of the world’s land surface is classified as deserts, these regions are second only to oceans in the scarcity of long-term measurement sites. This results in an inadequate representation of the complex interactions among the pedosphere, hydrosphere, and atmosphere in these regions. This knowledge gap limits understanding of desert-specific air–land processes and, given the close coupling between desert climates and the global system, contributes to uncertainty in climate projections.

To address this gap, we are establishing a first-of-its-kind megasite in the Negev Desert representing the subtropical desert belt. Israel’s relatively small size, with ~60% of its territory classified as arid or hyper-arid, makes the Negev uniquely accessible for long-term observations. The Mashash Desert Climate Observatory is built on a record of meteorological data collected at the site since 1973 and extensive micrometeorological measurements conducted in recent years.

The new megasite will generate vertically resolved surface-to-atmosphere profiles of wind, temperature, and moisture, along with detailed radiation, heat, CO2, and dust fluxes, enabling direct analysis of air–land coupling from the soil to the top of the troposphere. Co-located measurements of soil moisture, soil heat flux, and soil CO₂ efflux will allow characterization of subsurface controls on surface energy partitioning and carbon exchange. These continuous estimates will highlight the evolution of dynamics at diurnal, seasonal, and annual scales, linking surface radiative forcing to turbulent transport and boundary-layer development. Combined radiative and thermodynamic profiles will further resolve the vertical structure of moisture transport and non-precipitating systems, clarifying how episodic hydrological inputs propagate through the soil–vegetation–atmosphere continuum in desert environments. The observatory will be open to the international research community, and its data architecture is designed to be compatible with global networks (e.g., FLUXNET and NASA archiving standards), while maintaining access to raw data to ensure transparency and scientific integrity.

By providing sustained observations of air–land interactions in an understudied environment, the Mashash Desert Climate Observatory will deliver essential data for improving land-surface and boundary-layer models, support model–observation intercomparisons and remote-sensing validation, and advance understanding of multi-scale desert processes toward initial upscaling to global climate models.

How to cite: Cohen-Zada, A. L., Armon, M., Dente, E., Harnik, N., Hirsch, E., Karnieli, A., Koren, I., Raveh-Rubin, S., Shoshany, M., Weisbrod, N., and Agam, N.: The Mashash Desert Climate Observatory: A New Megasite for Air–Land Exchange Processes in Subtropical Deserts, EGU General Assembly 2026, Vienna, Austria, 3–8 May 2026, EGU26-3359, https://doi.org/10.5194/egusphere-egu26-3359, 2026.

EGU26-4241 | ECS | Posters on site | AS2.2

Assessment of Surface Energy Balance Closure at eddy-covariance sites in Diverse Alpine Environments 

Sebastiano Carpentari, Mira Shivani Sankar, Nadia Vendrame, Dino Zardi, and Lorenzo Giovannini

The surface energy balance (SEB), which defines the partitioning of energy exchange between the Earth’s surface and the atmosphere, is crucial for characterizing the development and evolution of the atmospheric boundary layer. While an accurate assessment of SEB components is essential for numerous applications, eddy-covariance measurements remain affected by significant uncertainties. Specifically, turbulent heat fluxes typically fail to balance the available energy at the surface. Research suggests that this energy balance closure problem stems primarily from advection driven by secondary circulations, which are prevalent over heterogeneous and complex terrain due to differential heating.

This study assesses the relationship between SEB non-closure, surface heterogeneity, and the subsequent development of local and mesoscale thermally driven circulations. The analysis utilizes data from seven flux sites across diverse Alpine environments (both on flat and sloped terrain) - including vineyards, pastures, pre-alpine and continental forests - incorporating at least two years of data per site, with many exceeding four years. The results provide a systematic and robust quantification of SEB non-closure across several typical Alpine contexts, highlighting key similarities and differences between sites based on their topographic features, land cover, and prevailing meteorological conditions.

The present work is part of the INTERFACE project (INvestigating ThE suRFACe Energy balance over mountain areas), which is performed in the framework of the TEAMx research programme.

How to cite: Carpentari, S., Shivani Sankar, M., Vendrame, N., Zardi, D., and Giovannini, L.: Assessment of Surface Energy Balance Closure at eddy-covariance sites in Diverse Alpine Environments, EGU General Assembly 2026, Vienna, Austria, 3–8 May 2026, EGU26-4241, https://doi.org/10.5194/egusphere-egu26-4241, 2026.

EGU26-5034 | Posters on site | AS2.2

Why Maize Sometimes Behaves Like Pine: Throughfall Microstructure and LAI Influence 

Katarina Zabret, Lana Radulović, Borbala Szeles, Juraj Parajka, Dušan Marjanović, Urša Vilhar, Janez Pavčič, Mark Bryan Alivio, Tamara Kuzmanić, Klaudija Lebar, Nejc Bezak, Peter Strauss, Günter Blöschl, and Mojca Šraj

When vegetation intercepts precipitation, the quantity of rainwater reaching the ground is affected, as it passes through the canopy, drips from it, and runs down the stem. Interception also significantly alters the characteristics of rainfall, which is among others reflected in differences in the number, size and velocity of raindrops. Throughfall drop size distribution was monitored and analysed for three vegetation types, including a single pine tree in an urban park, trees in an urban mixed forest, and a maize field in an agricultural area. Velocity-diameter diagrams were compiled for the 33 selected throughfall events and grouped into three distinct clusters based on similarity using a hierarchical clustering approach. Pine throughfall events were grouped in Cluster 1, urban mixed forest events in Cluster 2, while maize events were split between Clusters 1 (with all the pine tree events) and Cluster 3. A detailed analysis of rainfall microstructure characteristics under maize and pine canopies was conducted in relation to the rainfall event conditions and crop growing stage to evaluate why, in some cases, throughfall microstructure under maize is similar to that beneath pine (events assigned to Cluster 1), and, in other cases, it differs (events assigned to Cluster 3). Throughfall events in Cluster 3 were generally larger and more intense, showing a unimodal temporal distribution. In contrast, maize throughfall events in Cluster 1 exhibited a bimodal distribution, with two intensity peaks separated by a rainfall break. Notably, the maize leaf area index (LAI) exceeded a value of 4 during the period when the shift occurred from the events assigned in Cluster 1 to the subsequent events assigned in Cluster 3. As maize leaves mature, they become less flexible and do not bend as much under the weight of rain. Consequently, throughfall consist of more drips (larger drops) than direct rainfall (smaller drops). Further research could include additional types of vegetation, and the results could be supported by measurements over a longer period of time. These values could also be used for direct analyses of rainfall erosivity.

Acknowledgment: This contribution is part of the ongoing research project entitled “Evaluation of the impact of rainfall interception on soil erosion” supported by the Slovenian Research and Innovation Agency (J2-4489) and the Austrian Science Fund (FWF) I 6254-N.

How to cite: Zabret, K., Radulović, L., Szeles, B., Parajka, J., Marjanović, D., Vilhar, U., Pavčič, J., Alivio, M. B., Kuzmanić, T., Lebar, K., Bezak, N., Strauss, P., Blöschl, G., and Šraj, M.: Why Maize Sometimes Behaves Like Pine: Throughfall Microstructure and LAI Influence, EGU General Assembly 2026, Vienna, Austria, 3–8 May 2026, EGU26-5034, https://doi.org/10.5194/egusphere-egu26-5034, 2026.

EGU26-5092 | ECS | Posters on site | AS2.2

Transport of blowing snow particles through turbulent motions 

Samuele Viaro

In mid-latitudes, and over polar regions, a vast majority of precipitations are linked to the production of ice crystals in clouds. Cloud microphysical processes of complex mountain regions, where mixed-phase clouds (MPC) are consistently present, are therefore better represented if the number of ice crystals are correctly estimated. However, observations have shown that measured ice crystal number concentration (ICNC) can exceed the concentration of ice nucleating particles by orders of magnitude. Moreover, model simulations that rely mainly on primary ice production mechanisms usually underestimate ICNC when compared with observations. Blowing snow particles (BSP) are believed to be one of the causes affecting this discrepancy, but their influence on ICNC in MPS remains poorly understood. Our research uses the numerical model CRYOWRF, which includes blowing snow prognostic equations coupled with the advanced land surface snow model SNOWPACK, to analyze how BSP influence the highly nonlinear cloud microphysics and ICNCs. Numerical results are then validated with observation data from the Cloud and Aerosol Characterization Experiment (CLAVE) 2014 campaign at Jungfraujoch. Results show that, when high wind velocities trigger blowing snow transport, due to the strong updraft typical of mountain regions, BSP reach high levels in the atmosphere thus affecting precipitation and snow redistribution.

How to cite: Viaro, S.: Transport of blowing snow particles through turbulent motions, EGU General Assembly 2026, Vienna, Austria, 3–8 May 2026, EGU26-5092, https://doi.org/10.5194/egusphere-egu26-5092, 2026.

EGU26-5481 | Orals | AS2.2

Integrated observations and atmospheric modeling to bridge the scaling gap from local to landscape 

Mathias Göckede, Sanjid Backer Kanakkassery, Abdullah Bolek, Nicholas Eves, Kseniia Ivanova, Lara Oxley, Elliot Pratt, Mark Schlutow, Nathalie Triches, Judith Vogt, Elias Wahl, Theresia Yazbeck, and Martin Heimann

Many natural ecosystems are subject to fine scale variability in biogeophysical and biogeochemical properties, consisting of a mosaic of patches with individual characteristics in e.g. vegetation, hydrology, or microclimate. Carbon cycle fingerprints between patch types may exhibit strong differences, and reactions to current variability in external forcing as well as to future climate change may substantially differ across spatial gradients of often just a few meters or less. Capturing a representative carbon budget for such landscapes is highly challenging, since footprints of common observation techniques are either rather small with limited representativeness (e.g. flux chambers), or rather large and therefore aggregating signals across multiple patch types (e.g. eddy covariance).

This study is based on a 2025 field campaign at Stordalen Mire in Northern Sweden, a highly structured wetland consisting of a patchwork of fens, bogs, palsas and open water areas. Observational platforms included 2 eddy covariance towers with different instrument heights but nested footprints, stationary (fixed collars) and mobile chamber flux measurements within the tower footprints, a floating mobile auto-chamber system for distributed observations across different lakes and lake zones, and a drone equipped with in-situ greenhouse gas analyzers and meteorological sensors for landscape-integrating surveys using grid, curtain and profile flights. Since all platforms focused their observations on the same wetland section (about 500x500m), our dataset allows to merge detailed process information for individual ecosystem patches (e.g. from flux chamber data) with the landscape-scale integrative products (e.g. by eddy towers or drone).

We present results from different scaling approaches for deriving ecosystem-scale CO2 and CH4 budgets and variability, including e.g. data-driven upscaling, decomposition of eddy-covariance observations into patch-level fluxes, and local scale inversion of drone observations, each focusing on different subsets of the observational database. Through combining all data streams we aim at reducing uncertainties in wetland-scale carbon budgets as well as in the assessment of flux representativeness for the larger region. Comparing upscaled fluxes reveals strengths and weaknesses of individual data streams for constraining net carbon budgets and identifying functional controls, and delivers guidelines towards optimum upscaling strategies.

How to cite: Göckede, M., Backer Kanakkassery, S., Bolek, A., Eves, N., Ivanova, K., Oxley, L., Pratt, E., Schlutow, M., Triches, N., Vogt, J., Wahl, E., Yazbeck, T., and Heimann, M.: Integrated observations and atmospheric modeling to bridge the scaling gap from local to landscape, EGU General Assembly 2026, Vienna, Austria, 3–8 May 2026, EGU26-5481, https://doi.org/10.5194/egusphere-egu26-5481, 2026.

EGU26-6083 | ECS | Posters on site | AS2.2

Investigating the impacts of anthropogenic heat over East China with a global variable-resolution model 

Qike Yang, Chun Zhao, Xuchao Yang, Ziyin Zhang, Jiawang Feng, Gudongze Li, Zihan Xia, Zining Yang, Mingyue Xu, and Jun Gu

Anthropogenic heat (AH) is an important urban forcing factor, with its impacts span local, regional, and larger-scale atmospheric processes. However, its multiscale effects are difficult to quantify using conventional global and regional models. Here we address this challenge by applying a global variable-resolution atmospheric model, the integrated Atmospheric Model Across Scales (iAMAS), which explicitly links urban-scale processes with regional and large-scale atmospheric feedbacks within a single modeling framework. The model employs grid spacing that transitions from 50 km globally to 3 km over the East China with 3 km to resolve the anthropogenic heat effect over urban areas. Two AH parameterizations are implemented in this study: a spatially uniform AH parameterization (UniAH) and a spatially distributed gridded dataset (GrdAH), enabling an investigation of the multiscale atmospheric impacts of different AH parameterizations. At the local boundary-layer scale, both UniAH and GrdAH indicate that AH increases near-surface temperature and planetary boundary layer height, with the strongest responses occurring in winter. Nevertheless, GrdAH reproduces observed 2-m air temperature and 10-m wind speed more accurately than UniAH. At the urban scale, both parameterizations reduce the underestimation of the urban heat island and enhance vertical motion, while producing distinct precipitation responses between urban areas and their surrounding rural regions. At larger scales associated with atmospheric circulation, both UniAH and GrdAH indicate that AH redistributes momentum, partially impeding the upper-level circulation and modifying urban-scale convergence and divergence patterns. The convergent circulation downwind of the city corresponds to enhanced precipitation, demonstrating the coupled interactions across different scales. These results highlight the inherently multiscale nature of AH effects and demonstrate the methodological value of variable-resolution modeling for capturing urban forcing and its associated multiscale atmospheric feedbacks.

How to cite: Yang, Q., Zhao, C., Yang, X., Zhang, Z., Feng, J., Li, G., Xia, Z., Yang, Z., Xu, M., and Gu, J.: Investigating the impacts of anthropogenic heat over East China with a global variable-resolution model, EGU General Assembly 2026, Vienna, Austria, 3–8 May 2026, EGU26-6083, https://doi.org/10.5194/egusphere-egu26-6083, 2026.

EGU26-6583 | Posters on site | AS2.2

Improved wavelet method for accurate high-resolution ecosystem flux estimation and time-derivative analysis 

Gabriel Destouet, Emilie Joetzjer, Nikola Besic, and Matthias Cuntz

We present two major advancements to the wavelet-based, non-stationary flux estimation method of Destouet et al. (2025), enabling accurate calculation of high-resolution (1-minute) ecosystem fluxes and their time-derivatives.

We introduce first a scale-dependent estimation process that explicitly accounts for frequency-dependent eddy correlation times. By assigning different averaging times to each frequency band, we enhances the isolation of turbulent scales, reduces flux estimation errors, and improves the separation of local turbulence from larger scales by eliminating spurious correlations around the 'spectral gap'. This advancement is particularly valuable for wavelet-based flux partitioning, as it preserves high-quality flux estimates while retaining small-scale eddies, such as those hypothesized to transport soil respiration through forest canopies.

Second, our method now enables the computation of flux time-derivatives, allowing analysis of turbulent transport dynamics and ecosystem responses to environmental changes. As a first application, we present how to optimally determine the averaging time required for observed turbulent fluxes to represent underlying ecosystem fluxes. This is achieved by analysing the co-variation of flux time-derivatives with variables such as incoming radiation and carbon storage, which reflect underlying ecosystem dynamics.

These improvements together refine high-resolution flux estimation and unlock new opportunities to investigate ecosystem dynamics from flux towers. They have been implemented in the open-source TurbulenceFlux.jl package, which is readily available for community use.

Reference:

Destouet G, Besic N, Joetzjer E, and Cuntz M (2025) Turbulent transport extraction in time and frequency and the estimation of eddy fluxes at high resolution, Atmospheric Measurement Techniques 18(13):3193–3215, doi:10.5194/amt-18-3193-2025

How to cite: Destouet, G., Joetzjer, E., Besic, N., and Cuntz, M.: Improved wavelet method for accurate high-resolution ecosystem flux estimation and time-derivative analysis, EGU General Assembly 2026, Vienna, Austria, 3–8 May 2026, EGU26-6583, https://doi.org/10.5194/egusphere-egu26-6583, 2026.

EGU26-6602 | Orals | AS2.2

Improving Urban Eddy-Covariance CO2 Flux Estimates Through Removal of Anomalies in High-Frequency Data Using the IMAS Algorithm 

Aneena Binoy, Armin Sigmund, Stavros Stagakis, and Alessandro Bigi

Urban areas are major sources of anthropogenic COemissions, contributing substantially to the global carbon budget. Accurate quantification of urban emissions remains challenging due to uncertainties in measurements and modelling approaches. Eddy covariance (EC) provides direct continuous measurements of net urban CO2 fluxes; however, flux estimates in heterogeneous urban environments can be systematically biased by unresolved micro-scale anthropogenic sources. This study investigates the efficiency of the Identification of Micro-scale Anthropogenic Sources (IMAS) algorithm (Kotthaus and Grimmond, 2012) to detect short-duration, high-frequency micro-scale signals on EC observations. IMAS removes statistically identified micro-scale events from high-frequency data prior to flux computation, enabling retention of standard 30-min averaging periods. Micro-scale event detection is based on statistical metrics computed at 1-min resolution for CO2, H2O and sonic temperature, combining kurtosis, median-based variability, and skewness-sensitive mid-range deviation referenced to a 30-min median.

We applied the IMAS algorithm to two years of continuous EC measurement data, which were collected at the Hardau tall-tower site in the city of Zurich, Switzerland, as part of the ICOS Cities project. Fluxes were measured on a mast on top of a high-rise building at 112 m a.g.l, sampling a heterogeneous footprint influenced by various sources such as residential heating, traffic, railway infrastructure and industrial activities. A local heating unit is located at a horizontal distance of 145 m south-east of the tower, which is used intermittently to support residential heating during cold periods and could potentially affect our tower measurements. Standard EC fluxes and quality control flags were computed using EddyPro software before (L1) and after (L2) the application of the IMAS algorithm. Flux differences between L1 and L2 show a strong dependence on wind direction, with the largest reductions in L2 occuring for sector spanning 120–160°, centered on the direction of a nearby local heating unit (~141°) within the urban footprint. During winter, standard EC processing (L1) overestimates CO2 fluxes by 3.96 ± 0.43 µmol m-2 s-1 (mean ± standard error of the mean) for wind originating from this sector, corresponding to a relative reduction of ~17 % after the IMAS-based removal of micro-scale events. Smaller but consistent mean reductions are also observed for H2O fluxes (0.039 ± 0.005 mmol m-2 s-1, ~12 %) and sensible heat fluxes (4.82 ± 0.75 W m-2, ~38 %). In contrast, IMAS-induced flux changes during summer were minimal. These results demonstrate that unresolved micro-scale emissions can propagate directly into urban CO2 flux calculations, highlighting the need for source-aware, high-frequency preprocessing to complement standard EC quality control in urban carbon flux monitoring.

How to cite: Binoy, A., Sigmund, A., Stagakis, S., and Bigi, A.: Improving Urban Eddy-Covariance CO2 Flux Estimates Through Removal of Anomalies in High-Frequency Data Using the IMAS Algorithm, EGU General Assembly 2026, Vienna, Austria, 3–8 May 2026, EGU26-6602, https://doi.org/10.5194/egusphere-egu26-6602, 2026.

EGU26-6756 | ECS | Posters on site | AS2.2

Tracing Carbon Flux Dynamics and Ecosystem Functioning Along a Land-Use Gradient: Long-Term Eddy Covariance Observations in the western Italian Alps 

Daria Ferraris, Marta Galvagno, Ludovica Oddi, Gianluca Filippa, Edoardo Cremonese, Paolo Pogliotti, Federico Grosso, Umberto Morra di Cella, Sofia Koliopoulous, Chiara Guarnieri, Georg Wohlfahrt, Georg Leitinger, Mirco Migliavacca, Albin Hammerle, and Dario Papale

This study reports a comparative investigation of two alpine research sites situated in the Aosta Valley (Italian Alps), representing distinct neighbouring ecosystems: a high-altitude grassland and a mature larch forest. Eddy covariance flux measurements have been operational since 2008 at the grassland site (2168 m a.s.l.) and since 2012 at the larch forest site (2100 m a.s.l.). Each station is fully instrumented for flux and meteorological observations using  identical instrumentation. The straight-line distance between the two sites is approximately 2.7 km and they experience comparable climatic conditions, thereby enabling direct inter-site comparisons.

The primary aim of this study is to quantify and interpret differences in the carbon dioxide exchange between these ecosystems, with particular attention to the peculiarities of the years showing extreme meteorological conditions.

The two sites represent contrasting stages along a land‑use transition gradient, where the abandoned grasslands — no longer subject to livestock grazing since 2008, when the area was fenced and permanently excluded from grazing — exhibit a progressive encroachment by woody species, ultimately evolving into mature larch stands. This is a widely documented process in the Alpine region: the abandonment of traditional grazing practices and the subsequent natural recolonization of former grasslands by forest species.

To complement this analysis, preliminary results from a third eddy covariance station, installed in 2024 within a transitional ecotone characterized by scattered small larch saplings and shrub species, will also be presented.

Overall, this study demonstrates how multi-year eddy covariance measurements can reveal differences in ecosystem functioning under the same climatic conditions but across distinct vegetation types and successional stages, offering new insights into carbon flux dynamics along alpine land-use gradients.

How to cite: Ferraris, D., Galvagno, M., Oddi, L., Filippa, G., Cremonese, E., Pogliotti, P., Grosso, F., Morra di Cella, U., Koliopoulous, S., Guarnieri, C., Wohlfahrt, G., Leitinger, G., Migliavacca, M., Hammerle, A., and Papale, D.: Tracing Carbon Flux Dynamics and Ecosystem Functioning Along a Land-Use Gradient: Long-Term Eddy Covariance Observations in the western Italian Alps, EGU General Assembly 2026, Vienna, Austria, 3–8 May 2026, EGU26-6756, https://doi.org/10.5194/egusphere-egu26-6756, 2026.

EGU26-6900 | Posters on site | AS2.2

Attributing the surface temperature difference between a northern boreal mire and forest to the differences in their surface biophysical properties 

Erkka Rinne, Juha-Pekka Tuovinen, Maiju Linkosalmi, and Mika Aurela

Restoration of drained peatlands aims to recover the natural carbon sink and storage functions of a mire but also leads to changes in the ecosystems’ biophysical surface properties and, consequently, to their local climate. Impacts of land cover changes on local temperatures are governed by both radiative and non-radiative processes, i.e. changes in albedo and energy partitioning, respectively, with the latter typically as the dominant factor.

There is evidence that the land surface temperature (LST) in degraded peatlands will tend to become similar to that in nearby intact ecosystems1. Therefore, quantifying how the differences in the surface properties between pristine mires and forests contribute to the differences in their LST is relevant to understanding the biophysical effects of peatland restoration. However, data on LST changes following a forest to mire transition are scarce.

We attribute the difference in LST between a boreal mire and forest to the differences in their biophysical surface properties: albedo, energy storage, aerodynamic resistance and bulk surface resistance to evapotranspiration. We use eddy covariance measurements of sensible and latent heat fluxes as well as supporting meteorology. The attribution methodology is the two-resistance mechanism2, but compared to previous studies we also include auto- and cross correlations between the attributed variables using second-order Taylor series expansion3. The attribution is compared between seasons based on vegetation phenology and between weather events based on climatic indicators of warm, cool, wet or dry days.

We hypothesized that contributions to LST difference from the differences in surface resistance would be important because of the very different hydrology and vegetation in the compared ecosystems. However, our results show that the importance of surface resistance was minor compared to aerodynamic resistance which is the dominant factor during spring, summer and autumn. The lower surface roughness of the open mire leads to higher aerodynamic resistance, which has been identified as a strong warming factor also in previous literature comparing forests and open ecosystem such as croplands (e.g. ref.4). During late winter with a continuous snow cover still on the mire, the higher albedo values in the mire explain most of the lower LST there. The interdependencies between the attributed variables emerge as important factors, especially when comparing between different weather conditions.


References

1. Burdun, I. et al. Satellite data archives reveal positive effects of peatland restoration: albedo and temperature begin to resemble those of intact peatlands. Environ. Res. Lett. 20, 084037 (2025).

2. Rigden, A. J. & Li, D. Attribution of surface temperature anomalies induced by land use and land cover changes. Geophys. Res. Lett. 44, 6814–6822 (2017).

3. Chen, C., Wang, L., Myneni, R. B. & Li, D. Attribution of Land-Use/Land-Cover Change Induced Surface Temperature Anomaly: How Accurate Is the First-Order Taylor Series Expansion? J. Geophys. Res. Biogeosciences 125, e2020JG005787 (2020).

4. Chen, C. et al. Biophysical effects of croplands on land surface temperature. Nat. Commun. 15, 10901 (2024).

How to cite: Rinne, E., Tuovinen, J.-P., Linkosalmi, M., and Aurela, M.: Attributing the surface temperature difference between a northern boreal mire and forest to the differences in their surface biophysical properties, EGU General Assembly 2026, Vienna, Austria, 3–8 May 2026, EGU26-6900, https://doi.org/10.5194/egusphere-egu26-6900, 2026.

The persistent lack of energy balance closure in single-tower eddy-covariance measurements remains a major source of uncertainty in surface–atmosphere exchange studies. In most eddy-covariance studies, turbulent fluxes (sensible and latent heat) underestimate available energy (net radiation minus ground heat flux), potentially affecting evapotranspiration estimates used in irrigation management, and propagating uncertainties into land-surface model evaluation and flux upscaling. One important contributor to this imbalance can be the choice of data processing steps, particularly corrections for high-frequency spectral losses, which are known to significantly influence eddy-covariance flux estimates. However, their impact on energy balance closure has not yet been sufficiently quantified for long-term cropland observations.

Here, we investigate how different high-frequency spectral correction methods affect turbulent fluxes and energy balance closure at a managed cropland site in Reinshof, central Germany. Three years of eddy-covariance data collected over rotating crops (winter wheat, winter barley, and sugar beet) during 2022–2024 were processed using EddyPro, applying both analytical (Moncrieff et al., 1997; Massman, 2000; Horst, 1997) and in situ (Ibrom et al., 2007; Fratini et al., 2012) spectral correction methods.

Results show that the choice of spectral correction methods led to differences of up to 3.5% in annual energy balance closure estimates for years using open-path gas analyzers and up to 9.4% for years using closed-path gas analyzers. The in situ correction by Fratini et al. (2012) consistently resulted in the highest energy balance closure across all years, whereas differences among analytical corrections were minor, with a maximum difference of 0.8% in 2023. These effects were driven exclusively by changes in latent heat flux, which increased by 5-15% for open-path systems and by 38% for closed-path systems at the annual scale after spectral correction.

Overall, this study demonstrates that the choice of high-frequency spectral correction methods critically affects energy balance closure estimates in long-term eddy-covariance measurements, with effects varying in magnitude between open- and closed-path systems.

How to cite: Gehrmann, M., Knohl, A., Tunsch, E., and Markwitz, C.: Comparison of high-frequency spectral correction methods for eddy-covariance fluxes over a central German cropland: effects on energy balance closure, EGU General Assembly 2026, Vienna, Austria, 3–8 May 2026, EGU26-7040, https://doi.org/10.5194/egusphere-egu26-7040, 2026.

EGU26-7041 | ECS | Orals | AS2.2

Pitfalls and precautions for understory eddy-covariance processing 

Alexander Platter, Albin Hammerle, and Georg Wohlfahrt

Understory, so within-canopy, eddy-covariance (EC) measurements of energy, water, or CO2 fluxes offer more detailed insights into ecosystem exchange dynamics. Deriving these fluxes from EC systems requires several processing steps, where some of them are only valid for the inertial sublayer (i.e., above the canopy). Here we show that several of these steps are not appropriate for understory EC systems, particularly coordinate rotation, frequency-response correction, and some quality-control procedures. Using a multi-year dataset from a mountain forest site in Austria (At-Mmg), we identify some pitfalls and present precautionary measures.

An underlying assumption of the EC method is that the coordinate system is aligned with the mean flow, which in real-world conditions is not necessarily level or parallel to the surface, requiring coordinate rotations in the post processing of the wind measurements. For complex flow conditions, sectorwise planar fit is a commonly used rotation approach and is often preferred over classical double rotation. We demonstrate advantages of the less commonly used continuous planar fit, which yields more satisfactory results and substantially influences the statistics. Furthermore, the use of seasonal windows is preferable to account for seasonality in the flow structure.

High-frequency response corrections for trace gases (e.g., water vapor, CO₂) require a valid reference spectrum to compensate for instrument-related attenuation. Within the canopy, theoretical reference spectra tailored to the inertial sublayer are not applicable due to altered spectral behavior caused by vegetation elements interacting with the flow. This can introduce additional processes, such as spectral short-cutting, which strongly deviates from expected inertial sublayer behavior and is evident in our dataset. We also show that reference spectra based on temperature measurements are not reliable for trace gases at our site. We therefore explore an experimental, site-specific reference obtained by extrapolating the mid-frequency portion of the CO₂ spectrum to inform corrections.

Quality-control procedures also require revision. Standard turbulence tests assess flux–variance relationships against models to evaluate well-developed turbulence, but these relationships are valid only for the inertial sublayer. Applying them uncritically can misclassify understory data quality. Moreover, some form of low-turbulence filtering is needed. Understory EC systems enable quantification of canopy decoupling, which is becoming an attractive alternative to classical friction-velocity filtering. However, we emphasize that canopy-scale decoupling should not be used to disqualify understory fluxes: for understory measurements, the relevant coupling is between the measurement height and the forest floor, not with the entire canopy.

How to cite: Platter, A., Hammerle, A., and Wohlfahrt, G.: Pitfalls and precautions for understory eddy-covariance processing, EGU General Assembly 2026, Vienna, Austria, 3–8 May 2026, EGU26-7041, https://doi.org/10.5194/egusphere-egu26-7041, 2026.

EGU26-8096 | Orals | AS2.2 | Highlight

The thermal cost of sitting under a parasol: a biometeorological essay 

Georg Wohlfahrt and Albin Hammerle

For many people, beaches are a place they long for and emblematic for summer vacation vibes, even though environmental conditions may be actually physiologically stressful. In order to reduce radiation load, and thereby also exposure to UV radiation, the use of parasols for shading is thus common practise. The parasol, depending on the optical properties of the used fabric, attenuates part of the solar (shortwave) radiation, however at the expense of additional longwave radiation radiated in the downward direction in proportion to the surface temperature of the parasol. Here we ask the question whether sitting under a parasol may actually increase thermal discomfort as the reduction in transmitted shortwave radiation may be compensated by an increase in downward longwave radiation. To this end we have developed a model which allows simulating human thermal comfort in the open (without parasol) compared to below a parasol on a beach. Human thermal comfort is quantified with the Universal Thermal Comfort Index (UTCI). Environmental model inputs are air temperature and relative humidity, mean horizontal wind speed and incident short- and longwave radiation at some reference height above the ground surface. The attenuation of shortwave radiation by the parasol, the upward longwave radiation flux from the sand and the downward longwave radiation flux from the parasol are calculated by solving the radiative and energy balance of the parasol and the sand surface. The radiation calculations below the parasol take the modification of upper and lower hemispheric view factors into account and separately solve for the temperature of the sunlit and shaded sand surface. Our calculations show that the UTCI is generally lower under the parasol (and thus human thermal comfort higher), but differences are often small. Moreover, under certain combinations of conditions, sitting under a parasol feels hotter and we discuss which conditions favour this outcome. Finally, we demonstrate our findings for summertime conditions at some of the globally most well-know beach destinations.

How to cite: Wohlfahrt, G. and Hammerle, A.: The thermal cost of sitting under a parasol: a biometeorological essay, EGU General Assembly 2026, Vienna, Austria, 3–8 May 2026, EGU26-8096, https://doi.org/10.5194/egusphere-egu26-8096, 2026.

Precise estimates of actual evapotranspiration (ETa) are crucial for enhancing our understanding of the water and energy exchanges between land and atmosphere. These estimates are essential for applications and advancements in meteorological, climatological, ecological, and hydrological research. This study compares ET measurements obtained by two commonly used methods: eddy covariance (EC) and lysimeter (LY), based on long-term parallel measurements from 2012 to 2020. The analyses reveal a pronounced seasonal cycle in all measurements, with the highest values observed in summer and the lowest in winter. ET measurements from two lysimeters showed a significant difference of about 30% between areas of vegetation and bare soil. The ET values from the lysimeter method showed good agreement with the EC measurements, with an approximate difference of 7% between the two methods. Additionally, precipitation estimates from the lysimeter method were slightly higher than those from rain gauge measurements. The study identified air temperature as the primary controlling factor of ET, contributing nearly 60%. Net radiation and NDVI also played significant roles, with contributions larger than 10% and approximately 10%, respectively. The main causes of discrepancies between lysimeter and EC measurements were attributed to different measurement scales, varying crop growth stages, and soil moisture conditions. This study quantified ET at two different scales in nine-year period, providing valuable insights into the rational utilization of water resources in the region. The findings underscore the importance of considering measurement scales and environmental conditions when interpreting ET data for water resource management.

How to cite: Xu, Z.: Evapotranspiration measurements in the north China plain: insights from multi-years of lysimeter and eddy covariance system, EGU General Assembly 2026, Vienna, Austria, 3–8 May 2026, EGU26-8519, https://doi.org/10.5194/egusphere-egu26-8519, 2026.

EGU26-8626 | ECS | Orals | AS2.2

Coupled fire-atmosphere behavior observations from a grassland prescribed burn in a Northern California valley 

Ajinkya Desai and the iFireNet Prescribed Burn Research Team

Prescribed burns, primarily aimed at preempting uncontrolled fires, present a valuable opportunity for obtaining field measurements on fire and smoke-plume behavior at micro- and sub-microscales. However, this potential remains underutilized for comprehensive data collection with broad spatio-temporal coverage across the burn unit, in part due to underexplored instrumentation strategies and a lack of synchronous, multidisciplinary observations. During a grassland prescribed burn experiment in a valley region, situated in Trinity County, California, the diverse and extensive instrumentation deployed around the 10-acre burn unit enabled the integration of fire-induced wind patterns with fireline evolution history, air-quality measurements, and fuel characteristics. Small uncrewed aircraft system (sUAS)–based infrared imagery tracked fireline progression and spread rate, together with sUAS-based RGB video that additionally helped quantify flame height via computer-vision techniques. Moreover, high-resolution (cm-scale), sUAS-based measurements of pre- and post-burn multispectral imagery and LiDAR point cloud helped quantify burn severity and post-fire residual fuels in combination with ground-based sampling of fuel characteristics (load, height, moisture). In addition, an autonomous, nano-sized, WeatherHive sUAS swarm sampled high‑resolution temperature, relative humidity, and wind data inside the smoke plumes along “lawnmower” trajectories. An Optical Particle Sizer and a DustTrak II measured high-frequency particle size distributions and mass concentrations near the surface, and were collocated with eddy-covariance (EC) instruments along the burn-unit edges, which measured in-situ turbulence and energy flux statistics. Strong fire-induced horizontal wind convergence at the burn-unit edges was captured by the EC sensors amid variable ambient winds. Within the plume, the WeatherHive swarm recorded temperature excursions up to 8°C with upward redirection of near-surface horizontal flow into strong buoyant updrafts. The dynamic local wind direction and fireline proximity strongly modulated the observed near-surface aerosol mass and number concentrations, which were dominated by fine particulate matter (PM2.5), with background conditions recovered about 2.5 hours post-burn. Additionally, data were leveraged to evaluate a physics-based computational module utilizing the popular Reynold-Averaged Navier Stokes or RANS turbulence model. These integrated datasets provide deeper insight into coupled fire-behavior processes, while also illuminating improved measurement strategies for future experiments, including prolonged pre-burn deployment to characterize terrain-induced ambient flow and calculated sensor placement to capture the burn area flux footprint more effectively. Thus, they contribute to a growing observational database useful in advancing predictive models describing fire and smoke behavior, thereby increasing the reliance on prescribed burns for fire management.

How to cite: Desai, A. and the iFireNet Prescribed Burn Research Team: Coupled fire-atmosphere behavior observations from a grassland prescribed burn in a Northern California valley, EGU General Assembly 2026, Vienna, Austria, 3–8 May 2026, EGU26-8626, https://doi.org/10.5194/egusphere-egu26-8626, 2026.

EGU26-8997 | ECS | Orals | AS2.2

Leveraging CO2 sensor networks to address challenges in urban eddy-covariance measurements 

Armin Sigmund, Dominik Brunner, Jia Chen, Rainer Hilland, Andreas Christen, Christian Feigenwinter, Roland Vogt, Lukas Emmenegger, Markus Kalberer, and Stavros Stagakis

Eddy-covariance measurements allow us to directly monitor the vertical turbulent CO2 flux at a specific point in the urban atmosphere. Under some assumptions such as stationarity and sufficient turbulence, this flux corresponds to the net emissions in a variable footprint area. Combined with a footprint model and a biospheric CO2 flux model, this method has a high potential for validating and optimizing urban emission inventories. However, the reliability of EC measurements depends on a careful site selection, data processing and quality control. Often, sensor heights below z=50 m a.g.l. are chosen to mitigate issues associated with horizontal heterogeneity, storage flux, and horizontal and vertical advection. The storage flux describes the temporal change of the CO2 amount in the control volume between the surface and sensor height. Tall-tower sites (z>50 m a.g.l.) would be beneficial to capture emissions from a larger part of the city but require careful consideration of these issues. While a few studies have reported plausible EC measurements for urban tall-tower sites, little is known about the impact of the storage flux and advection terms. 
In the ICOS-Cities project, tall-tower EC systems and networks of mid-cost and low-cost CO2 concentration sensors were installed in three cities. Here, we aim to better quantify the storage flux and identify periods with horizontal advection by leveraging data from the sensor networks in Zurich, Switzerland, and Munich, Germany, and thus improve the reliability of the observed net CO2 emissions. The low-cost sensors were deployed in the urban canopy layer while the mid-cost sensors were mostly located at the rooftop level and collocated with wind and temperature sensors. We estimate the storage flux by dividing the control volume into three to four layers and averaging data from different sensors in the same layer. The storage flux is then added to the turbulent flux to estimate net surface emissions. To filter out periods in which this estimate is biased by horizontal advection, we consider horizontal CO2 gradients determined using mid-cost sensors at rooftop sites. This approach is compared to the often-used filtering with a friction velocity threshold.
As expected, the storage flux is most important on days with a pronounced diurnal cycle in atmospheric stability. It reduces the net CO2 emission estimates in the morning hours after sunrise and generally increases these estimates at night. From 1.5 to 5 h after sunrise, this effect amounts on average to -7.3 and -8.0 µmol m-2 s-1 in Zurich and Munich, respectively, while in the first 3.5 hours after sunset, it amounts to +4.7 and +3.0 µmol m-2 s-1 (46% and 24% of the turbulent flux) in Zurich and Munich, respectively. On days with a small diurnal cycle in stability, the storage flux plays a smaller role, especially in winter. We will also present insights in the frequency of horizontal advection and favorable conditions for it. Finally, we will discuss the plausibility of median diurnal cycles of the derived net CO2 emissions, considering the directional dependence on land cover and associated sources and sinks.

How to cite: Sigmund, A., Brunner, D., Chen, J., Hilland, R., Christen, A., Feigenwinter, C., Vogt, R., Emmenegger, L., Kalberer, M., and Stagakis, S.: Leveraging CO2 sensor networks to address challenges in urban eddy-covariance measurements, EGU General Assembly 2026, Vienna, Austria, 3–8 May 2026, EGU26-8997, https://doi.org/10.5194/egusphere-egu26-8997, 2026.

EGU26-9186 | Posters on site | AS2.2

Diagnosing LE  

Marie-Claire ten Veldhuis, Judith Jongen-Boekee, and Bas van de Wiel

Despite its omnipresence in atmospheric models, the Penman-Monteith (PM) equation often fails to represent the latent heat (LE) flux accurately. Deviations of several tens of % between modelled and observed LE flux are not an exception. The original PM equation assumed a constant stomatal resistance in time, but most current atmospheric models implement a varying resistance that depends on atmospheric conditions such as radiation, temperature and vapor pressure, while more recent models account for plant physiological stomata control.

In this study, we present a diagnosis of LE fluxes modelled based on the Penman-Monteith equation combined with a fixed, an environmentally driven and a plant physiology driven stomatal conductance model versus observed LE fluxes by Eddy-Covariance. The analysis covers a decade of observations for a grass and three years for a forest site in the Netherlands. We identify atmospheric conditions where the model and observations most strongly disagree and evaluate the contribution of varying stomatal resistance models in reproducing flux observations. We demonstrate that implementing models that account for varying stomatal conductance in response to atmospheric and soil conditions does not help to improve LE model estimates for these two datasets. We investigate the role of aerodynamic versus stomatal conductance in controlling LE flux as well as the effects of diurnal effects of radiation, VPD and stomatal conductance response and how they differ between the grass and forest sites. The aim is to provide suggestions for conceptual improvements that can help resolve some of the shortcomings in the PM-based LE flux estimation. 

How to cite: ten Veldhuis, M.-C., Jongen-Boekee, J., and van de Wiel, B.: Diagnosing LE , EGU General Assembly 2026, Vienna, Austria, 3–8 May 2026, EGU26-9186, https://doi.org/10.5194/egusphere-egu26-9186, 2026.

EGU26-10099 | ECS | Orals | AS2.2

The essence of the Webb, Pearman and Leuning (WPL) correction: w-  correction 

Hanshu Wang, Yaoming Ma, and Jinshu Chi

Vertical wind velocity (w) and gas density (c) are two key variables for estimating trace gas fluxes using the eddy covariance (EC) technique. For many decades within the EC community, the Webb, Pearman and Leuning (WPL) theory proposed by Webb et al. (1980) has been widely accepted as a “density effect correction” for flux calculations. However, we found that Webb et al. (1980) derived their equations correctly by calculating the unmeasurable mean vertical velocity (

How to cite: Wang, H., Ma, Y., and Chi, J.: The essence of the Webb, Pearman and Leuning (WPL) correction: w-  correction, EGU General Assembly 2026, Vienna, Austria, 3–8 May 2026, EGU26-10099, https://doi.org/10.5194/egusphere-egu26-10099, 2026.

EGU26-10326 | ECS | Orals | AS2.2

The Complex Role of Semi-Arid Afforestation-Atmosphere Interactions In Shaping Local Weather 

Yotam Menachem, Leehi Magaritz-Ronen, Eyal Rotenberg, Lior Hochman, Shira Raveh-Rubin, and Dan Yakir

The effects of desert afforestation, such as those used for climate change mitigation, during extreme heat events remain an important yet unresolved question. The well-studied, semi-arid Yatir pine forest, located at the edge of the Negev Desert, provides a unique lens through which we study land surface-atmosphere interactions.

Due to high incoming solar radiation and low albedo, the Yatir Forest's net radiation is higher than in any other eco-region. The massive radiation load is balanced by large sensible heat flux, which can influence the forest microclimate and create a thermal contrast with the surrounding shrubland. These processes, in turn, can affect near-surface atmospheric conditions and boundary-layer dynamics.  

Here, we combine in-situ measurements with high-resolution ICON-LAM simulations to offer new insights into the role of local afforestation in shaping surface weather and boundary-layer dynamics during extreme heat events. The in-situ observations not only describe the forest’s physical and physiological properties but also provide essential inputs for the model, enabling an integrated framework that captures known forest-scale processes and demonstrates their upscaling effects across the region.

Our simulations of a heat wave event from May 20 to May 24, 2019, reveal midday sensible heat flux increases of up to 300 W m⁻² within the forest, resulting in surface (skin) cooling of up to 15 °C, while simultaneously producing warming of up to 2 °C in 2-m air temperature. These contrasts generate pronounced modifications in wind patterns and a distinct forest-induced circulation. Remarkably, this circulation produces strong local instability even under synoptic conditions dominated by harsh subsidence. Our findings underscore the complex and sometimes counterintuitive role of semi-arid afforestation during extreme heat events, with important implications for land-management strategies under different atmospheric forcing regimes.

How to cite: Menachem, Y., Magaritz-Ronen, L., Rotenberg, E., Hochman, L., Raveh-Rubin, S., and Yakir, D.: The Complex Role of Semi-Arid Afforestation-Atmosphere Interactions In Shaping Local Weather, EGU General Assembly 2026, Vienna, Austria, 3–8 May 2026, EGU26-10326, https://doi.org/10.5194/egusphere-egu26-10326, 2026.

EGU26-10726 | ECS | Posters on site | AS2.2

Influence of Atmospheric Water Harvesting on Coupled Land Surface-Atmosphere Processes 

Richard Owusu, Stefan Kollet, Stefan Poll, and Victor Selmert

Direct Air Capture (DAC) technologies designed for atmospheric water harvesting are increasingly being considered as a means of supplying water for green hydrogen production, particularly in arid and semi-arid regions. However, large-scale moisture removal from the atmosphere may affect the thermodynamics of the planetary boundary-layer, yet the magnitude and spatial characteristics of these impacts remain insufficiently characterized. In this study, we implement a physically based DAC parameterization within the ICOsahedral Nonhydrostatic (ICON) model, using Large-Eddy Simulation (LES) to explicitly resolve land–atmosphere exchange processes. DAC operation is represented as an imposed constant moisture extraction flux subtracted from the surface latent heat flux, with configurations spanning a range of flux densities (0–800 W/m) and deployment scales (4–900 units). Simulations reveal systematic near-surface warming and atmospheric drying associated with DAC operation. From the results High flux densities (>= 400 W/m^2)  1) reduce specific humidity of the local lower atmosphere by ~0.2 g/kg, and that of the land surface by 3.5 g/kg relative to the control, 2) decrease relative humidity by ~4 percentage points, 3) and increase virtual potential temperature by ~0.5 K with no significant regional effect. In addition, Large-scale deployments yield spatially distributed but cumulative effects both at the local and regional scale, producing domain-mean warming of ~0.5 K and specific humidity reductions of ~0.1–0.4 g/kg. These perturbations arise from suppressed evaporative cooling and reduced near-surface moisture availability, which may lead to modified local energy partitioning without fundamentally altering boundary-layer stability in the atmospheric boundary layer. For deployment densities above ~400 units, non-physical negative humidity values emerge, indicating that the extraction of moisture exceeds the atmospheric supply—a flux threshold for single unit DAC operation under the atmospheric conditions used here in the study. The results demonstrate that DAC-induced thermodynamic perturbations are non-negligible at both local and regional scales and can influence turbulent mixing, boundary-layer structure. This work provides a quantitative foundation for incorporating DAC into land-surface design, environmental regulation, and future deployment strategy for atmospheric water harvesting systems.

How to cite: Owusu, R., Kollet, S., Poll, S., and Selmert, V.: Influence of Atmospheric Water Harvesting on Coupled Land Surface-Atmosphere Processes, EGU General Assembly 2026, Vienna, Austria, 3–8 May 2026, EGU26-10726, https://doi.org/10.5194/egusphere-egu26-10726, 2026.

Dynamic sub grid-scale turbulence closures require explicit spatial filtering to separate resolved and sub filter-scale contributions. In unstructured-grid atmospheric models such as ICON, constructing consistent filtering operators is nontrivial due to the triangular mesh and the staggered placement of prognostic variables on cells and edges. This work presents the implementation of a spatial filtering framework for the ICON nonhydrostatic dynamical core, designed as methodological infrastructure for scale-aware turbulence modeling.

A coarse-graining filter based on neighbor averaging has been developed on the ICON triangular grid. Cell-centered variables are filtered using edge-connected neighboring cells, while edge-centered variables are treated consistently using the adjacent cell-edge connectivity. The filter may be applied iteratively to achieve a prescribed effective filter width and is compatible with ICON’s block-based data layout on an unstructured mesh.

The filtering operators are integrated into the diffusion module as a diagnostic operation applied after explicit diffusion and halo synchronization, ensuring consistency across MPI subdomain boundaries. Ongoing work focuses on extending this framework toward a dynamic Smagorinsky-type closure using a test-filter formulation.

How to cite: Baksi, A.: Spatial filtering framework for scale-aware turbulence modeling on the ICON unstructured grid., EGU General Assembly 2026, Vienna, Austria, 3–8 May 2026, EGU26-10777, https://doi.org/10.5194/egusphere-egu26-10777, 2026.

EGU26-11416 | Posters on site | AS2.2

Spatial variability of the diurnal cycle of heat fluxes in the atmospheric boundary layer over agricultural land and forest of the GLAFO site in Stuttgart (Germany) on a clear sky day 

Hans-Stefan Bauer, Lisa Jach, Oliver Branch, Diego Lange, Verena Rajtschan, Volker Wulfmeyer, and Kirsten Warrach-Sagi

Spatial heterogeneity of land use impacts land-atmosphere feedback and therefore the spatial and temporal variability of latent and sensible heat fluxes within the atmospheric boundary layer. This is especially visible during clear sky days without notable advection. 
In spring and summer 2025 at the GEWEX Land Atmosphere Feedback Observatory (GLAFO) site of the University of Hohenheim (Stuttgart, Germany) an extensive field campaign was performed by the research group Land Atmosphere Feedback Initiative (LAFI) funded by the German Research Foundation. During five intensive observation periods (IOPs) the GLAFO equipment, which includes two Eddy-Covariance stations, was extended by Lidar measurements of wind, humidity and temperature.
To study the three-dimensional pattern of the heat fluxes over a heterogeneous surface during the day we applied the Weather Research and Forecasting model (WRF). We used WRF in a nested configuration with resolutions of 1250 m, 250 m and 50 m, forced with ECMWF operational data for a clear sky case study on 24 June 2025. In the two inner domains, WRF was applied in Large-Eddy simulation (LES) mode with switched-off turbulence scheme. The simulated evolution of the planetary boundary layer and the influence of the land surface on its development was compared with the temporal and vertical evolution in data from the lidar systems and eddy-covariance stations. 
In addition, we focused on the vertical representation of latent and sensible heat fluxes at the different model resolutions and their dependence on the underlying land surface. This will reveal the so-called blending height, namely the height at which the horizontal distributions of the fluxes are no longer dependent on the underlying surface. The derivation of this important variable paves the way to a more physical coupling of the land surface and the atmosphere in the model.

How to cite: Bauer, H.-S., Jach, L., Branch, O., Lange, D., Rajtschan, V., Wulfmeyer, V., and Warrach-Sagi, K.: Spatial variability of the diurnal cycle of heat fluxes in the atmospheric boundary layer over agricultural land and forest of the GLAFO site in Stuttgart (Germany) on a clear sky day, EGU General Assembly 2026, Vienna, Austria, 3–8 May 2026, EGU26-11416, https://doi.org/10.5194/egusphere-egu26-11416, 2026.

EGU26-11835 | ECS | Posters on site | AS2.2

Earth’s Green Blanket: A study of Heat Transfer through Grass 

Jelle Steenge, Bas van de Wiel, Marie-Claire ten Veldhuis, Nick Romijn, and Steven van der Linden

Land-atmosphere interactions play a key role in the Earth’s climate. The surface temperature is a key parameter in calculating the latent and sensible heat flux and thus important for the closure of the surface energy balance (SEB). Yet vegetated surfaces have different properties compared to bare soil and thus behave differently. Grass-vegetated surfaces are by far the most common type of land cover, covering over 40 % of all land area. Therefore, accurate modelling of soil and grass temperatures is essential for improving numerical weather prediction models.

In current weather models, the surface temperature is often estimated using an empirical skin resistance model, which may lead to significant errors in both the phase and amplitude of the surface temperature, negatively affecting the closure of the SEB. A more refined and physics-based approach is thus needed for accurate modelling of heat transfer processes in the vegetation-soil continuum.

In this research we investigate a new modelling approach for grass-vegetated and topsoil layers, using both analytical and numerical diffusive modelling approaches, building on the work of Van Dijk (2024), where grass was treated as a homogeneous sponge-layer with a uniform thermal diffusivity. The aim is to capture the temperature dynamics within the grass (and soil) layer and compare these with millimetre-resolution observations using distributed temperature sensing (DTS) measurements, as described in Ter Horst (2025).

Results indicate that a purely diffusive model is accurate in describing the temperature dynamics within the soil, but is not fully able to capture the heat transfer within the vegetation layer accurately. Therefore, adjustments are made to the vegetation ‘sponge’-layer, adding a more realistic height-dependent density and a height-dependent (radiative) source term. 

First results from a rudimentary analytic model already show promising results for temperature profiles in quasi-steady state, both during night- and daytime. Similar temperature profile shapes to the DTS measurements are achieved, that would not have been possible for a purely diffusive model.

How to cite: Steenge, J., van de Wiel, B., ten Veldhuis, M.-C., Romijn, N., and van der Linden, S.: Earth’s Green Blanket: A study of Heat Transfer through Grass, EGU General Assembly 2026, Vienna, Austria, 3–8 May 2026, EGU26-11835, https://doi.org/10.5194/egusphere-egu26-11835, 2026.

EGU26-12061 | ECS | Posters on site | AS2.2

Turbulent Fluxes at a Sub-Arctic Peatland and the Role of Data Processing Choices in Carbon Dynamics 

Jon Cranko Page, Rasmus Jensen, Eero Koskinen, Juho Lämsä, Efrén López-Blanco, Hannu Marttila, Mikhail Mastepanov, Riku Paavola, and Torben R. Christensen

Sub-Arctic peatlands are often delicately poised at the carbon source-sink threshold. With peatlands among the most carbon-dense ecosystems on Earth, they are critical players in global climate regulation, with land–atmosphere feedbacks that can disproportionately influence climate change trajectories. However, peatland carbon dynamics, and whether they act as sources or sinks for carbon, are strongly shaped by local conditions underscoring the need for site-specific measurements of turbulent fluxes and meteorology to predict their future role in the carbon cycle. While eddy-covariance is a common and critical in-situ measurement technique, the choice of pre-processing algorithms has the potential to interfere in the clear interpretation of source or sink classification in transitional peatland regimes .  

Here, we present two years of eddy-covariance observations from a newly established eddy-covariance tower in a fen peatland in northeastern Finland. Our analysis characterises the carbon dynamics at the site and addresses a key methodological challenge that is often overlooked: the uncertainty introduced by the subjective choices inherent in eddy-covariance data processing. By generating multiple datasets using alternative processing algorithms, we quantify the sensitivity of flux estimates at the peatland to these decisions, where processing methods affect conclusions regarding its source-sink status. The results provide motivation for a framework for more robust interpretation of peatland carbon fluxes.

How to cite: Cranko Page, J., Jensen, R., Koskinen, E., Lämsä, J., López-Blanco, E., Marttila, H., Mastepanov, M., Paavola, R., and Christensen, T. R.: Turbulent Fluxes at a Sub-Arctic Peatland and the Role of Data Processing Choices in Carbon Dynamics, EGU General Assembly 2026, Vienna, Austria, 3–8 May 2026, EGU26-12061, https://doi.org/10.5194/egusphere-egu26-12061, 2026.

EGU26-12312 | ECS | Orals | AS2.2

Characterizing Scale-Dependent Variance and Flux Patterns Across Heterogeneous Permafrost Landscapes Using Airborne Measurements 

Guo Lin, Torsten Sachs, Manuel Helbig, Patrick Hogan, and Christoph Lotz

Low-level airborne eddy covariance measurements enable the characterization of how surface heterogeneity in Arctic permafrost regions influences the spatial variability of greenhouse gas exchange. This study uses the Polar-5 aircraft to collect high-frequency (20 Hz) data on wind, CO₂, and CH₄ over the Mackenzie Delta, Canada, in 2013. The aircraft operated at approximately 40–60 m above ground level (AGL), enabling detailed observation of near-surface greenhouse gas flux. Flight legs were partitioned into three regions based on surface-type classifications, elevation, and degree of surface heterogeneity. Using wavelet analyses, the scale-dependent variances and covariances (fluxes) are quantified across horizontal scales ranging from microscale (10 m – 2 km) to mesoscale (2-10 km). The results demonstrate that scalar variances exhibit clear scale dependence, linked to surface types, elevation, and the level of heterogeneity. Specifically, CH₄ and CO₂ concentrations and fluxes exhibit enhanced small-scale variability over highly heterogeneous terrain, whereas wetland- and lake-dominated regions are characterized by stronger mesoscale variability. By partitioning the domain into three regions, we highlight how the underlying state of permafrost and surface classification jointly affect greenhouse gas flux. Our findings provide a process-based framework that connects heterogeneity level, variance scaling, and the detectability of airborne fluxes in Arctic permafrost landscapes, thereby enhancing the interpretation of aircraft eddy covariance measurements for regional greenhouse gas budgets, compared to flux tower measurements.

How to cite: Lin, G., Sachs, T., Helbig, M., Hogan, P., and Lotz, C.: Characterizing Scale-Dependent Variance and Flux Patterns Across Heterogeneous Permafrost Landscapes Using Airborne Measurements, EGU General Assembly 2026, Vienna, Austria, 3–8 May 2026, EGU26-12312, https://doi.org/10.5194/egusphere-egu26-12312, 2026.

EGU26-13286 | Orals | AS2.2

Revisiting the Surface Energy Imbalance with Observed Kinetic Energy Dissipation Guided by the Generalized Thermal Energy Balance 

Jielun Sun, Gary Gary Granger, Steve Oncley, Chris Roden, Sebastian Hoch, and Chenning Tong

The disagreement between observed and theoretically expected thermal energy balances in a soil–air system at the ground surface, known as the surface energy imbalance (SEI), has been observed for over 80 years. This intriguing puzzle is marked by a systematic diurnal variation of the SEI across different surface types, beyond observational uncertainties. Guided by total energy conservation, the generalized thermal energy balance equation indicates that the traditional thermal energy balance equation based on the first law of thermodynamics would result in stability-dependent biases. Specifically, it would overestimate the thermal energy increases under convective conditions, underestimate them under stable conditions, and agree with the generalized thermal energy balance under neutral conditions. Considering the diurnal variation of the atmospheric stability within the atmospheric surface layer, these systematic biases align precisely with what field observations reveal in the SEI conundrum. In other words, the observed SEI suggests that a non-isothermal atmosphere is governed by total energy conservation. Furthermore, the limitation of the traditional thermal energy balance equation may also help explain several actively researched issues in the atmospheric boundary layer community, such as the dissimilarity between vertical temperature and humidity profiles under convective conditions and the difficulty of simulating the stable atmospheric boundary layer, including morning and evening transitions.

Turbulence kinetic energy dissipation is estimated using 4-k Hz hot-film observations at four observation heights ranging from 0.5 to 4 m. Its dependence on the atmospheric stability and wind speed is consistent with the development of turbulence driven by both thermal and mechanical forcing. These observations further demonstrate the important contribution of thermal energy transfer to kinetic energy changes, as revealed by the generalized thermal energy balance equation. Overall, this investigation provides additional evidence for the importance of interactions between kinetic and thermal energy variations in explaining the observed surface energy imbalance.


Acknowledgements: The research is supported by the U.S. National Science Foundation, AGS-2231229.


How to cite: Sun, J., Gary Granger, G., Oncley, S., Roden, C., Hoch, S., and Tong, C.: Revisiting the Surface Energy Imbalance with Observed Kinetic Energy Dissipation Guided by the Generalized Thermal Energy Balance, EGU General Assembly 2026, Vienna, Austria, 3–8 May 2026, EGU26-13286, https://doi.org/10.5194/egusphere-egu26-13286, 2026.

EGU26-13661 | ECS | Posters on site | AS2.2

Insights into planetary boundary layer height estimation from the Southern Ontario LIDar (SOLID) Mesonet  

Petra Duff, Robert Crawford, Elisabeth Galarneau, Audrey Lauer, Sylvie Leroyer, Zen Mariani, and Kimberly Strong

Planetary boundary layer height (PBLh), despite being key to atmospheric modelling parametrizations, remains difficult to consistently define, model, and observe. The Southern Ontario Lidar (SOLID) Mesonet, established by Environment and Climate Change Canada (ECCC) in and around Toronto beginning in 2022, provides an opportunity for high spatial and temporal resolution estimates of the PBLh in diverse atmospheric conditions. We present a Doppler lidar-derived PBLh data product using SOLID Mesonet observations, assessed in comparison to PBLh estimates from ECCC’s Global Environmental Multiscale (GEM) model, ERA5, and nearby radiosonde flights in Buffalo, NY. These comparisons highlight the uncertainties between various methods for PBLh estimation, particularly in stable atmospheric conditions such as overnight and in winter months, and give key insights into the accuracy of PBLh estimates for usage in atmospheric modelling as well as avenues for improvements.

How to cite: Duff, P., Crawford, R., Galarneau, E., Lauer, A., Leroyer, S., Mariani, Z., and Strong, K.: Insights into planetary boundary layer height estimation from the Southern Ontario LIDar (SOLID) Mesonet , EGU General Assembly 2026, Vienna, Austria, 3–8 May 2026, EGU26-13661, https://doi.org/10.5194/egusphere-egu26-13661, 2026.

EGU26-13713 | ECS | Orals | AS2.2

A four-Doppler Lidar study to quantify spatio-temporal heterogeneity of wind statistics over a deciduous forest during the LEAFF campaign 

Matteo Puccioni, Sonia Wharton, Stephan De Wekker, Robert Arthur, Tianyi Li, Ye Liu, Sha Feng, Kyle Pressel, Raj Rai, Larry Berg, and Jerome Fast

One fundamental assumption of surface layer flow theory is homogeneity over a horizontal plane, a hypothesis systematically challenged for many atmospheric flows. For example, variability in terrain elevation, presence of heterogeneous roughness sub-layers and mesoscale motions can alter the spatio-temporal flow evolution even over small distances (≈1 km). In this scenario, the experimental investigation of air-land interactions requires simultaneous data acquisitions at multiple sites, against which the hypothesis of flow homogeneity can be assessed. The Appalachian Mountains (in the Southeastern United States) represent a compelling environment to resolve complex flows over small distances due to their irregular terrain (800-1500 m elevation above sea level) and presence of moderately tall deciduous forests (~20 m) and open fields constituting an uneven roughness sub-layer. In this work, three nearby instrument sites (within 2 km of each another) are investigated as part of the Lidar Experiments for Assessing Flow over Forests (LEAFF) campaign located in and around a deciduous forest in mountainous Virginia (U.S.). Ten months of wind statistics are resolved both within the canopy by a well instrumented flux tower, and above it via four remote sensing Doppler Lidar (up to 300 m above ground, i.e. ≈15 times the forest height), thereby resolving the turbulent flow developing over a roughness sublayer with high statistical accuracy. The goal of the present analysis is twofold. First, to quantify the monthly variability of wind statistics induced by the annual cycles of leaf senescence and synoptic winds. Second, to quantify the heterogeneity of the wind statistics between different but closely spaced sites across different months. A year’s worth of data showed that the wind statistics are predominantly affected by synoptic forcing, while the leaf senescence cycle plays a marginal role in shaping mean wind and turbulence within the surface . Additionally, site-to-site heterogeneity is found to change following a monthly time scale, a result emphasizing the importance of selecting a sufficiently long observational period to correctly address site heterogeneity under different background flow conditions. The present study provides a compelling observational dataset to validate  numerical weather prediction tools accounting for the presence of a forest sub-layer, as well as improving our understanding of the physical mechanisms inducing flow heterogeneities over complex terrains.

How to cite: Puccioni, M., Wharton, S., De Wekker, S., Arthur, R., Li, T., Liu, Y., Feng, S., Pressel, K., Rai, R., Berg, L., and Fast, J.: A four-Doppler Lidar study to quantify spatio-temporal heterogeneity of wind statistics over a deciduous forest during the LEAFF campaign, EGU General Assembly 2026, Vienna, Austria, 3–8 May 2026, EGU26-13713, https://doi.org/10.5194/egusphere-egu26-13713, 2026.

EGU26-14605 | Orals | AS2.2

When Rain Meets Heat: Drivers of Peak Carbon Uptake in East African Drylands 

Lutz Merbold, Vincent Odongo, Matti Räsänen, Julius Omondi, Juuso Tuure, Francesco Fava, Petri Pellikka, Timo Vesala, Janne Heiskanen, Janne Rinne, Marcin Jackowicz-Korczynski, Martin Wooster, Thomas Dowling, Matthias Mauder, Rodolfo Ceriani, and Sonja Leitner

Semi-arid landscapes dominate much of Kenya, yet their contribution to regional carbon cycling remains poorly constrained, particularly regarding how peak ecosystem photosynthetic capacity responds to highly variable wet-season rainfall. Here, we synthesize eddy covariance observations from four contrasting Kenyan dryland ecosystems, including natural savannas—a managed savanna grassland at Kapiti and a wooded savanna at Choke—and croplands—a smallholder system at Maktau and a commercial farm at Ausquest. We examine how rainfall, canopy development, and atmospheric demand jointly regulate maximum net ecosystem CO₂ uptake (NEEₘₐₓ) during the wet season, when most annual carbon assimilation occurs and interannual variability in precipitation pulses is pronounced.

Site-specific relationships between rainfall and NEEₘₐₓ were derived, and responses to temperature and vapour pressure deficit (T–VPD) were analysed under light-saturated conditions to disentangle water supply effects from atmospheric constraints on photosynthesis. Across all sites, rainfall primarily acted as a trigger for peak carbon uptake, with NEEₘₐₓ increasing rapidly following rainfall onset but saturating once sufficient soil moisture supported canopy development. In natural savanna ecosystems, increasing rainfall consistently led to higher maximum leaf area index (LAIₘₐₓ) and enhanced NEEₘₐₓ, while differences between grassland and wooded savanna reflected contrasts in vegetation structure and rooting depth. In contrast, croplands exhibited a muted rainfall–NEEₘₐₓ response, with peak uptake largely governed by cropping cycles, crop type, and management practices rather than total rainfall amounts.

Under high-light conditions, temperature and VPD imposed a common upper bound on NEEₘₐₓ across all ecosystems, defining a narrow envelope of maximum photosynthetic capacity. These results demonstrate that peak carbon uptake in East African drylands emerges from interacting controls of rainfall timing, canopy development, vegetation structure, and atmospheric demand and is modulated by management and land use. Our findings provide critical constraints for land–atmosphere coupling in understudied dryland regions and have important implications for modelling carbon cycle responses under increasing rainfall variability and land-use change.

How to cite: Merbold, L., Odongo, V., Räsänen, M., Omondi, J., Tuure, J., Fava, F., Pellikka, P., Vesala, T., Heiskanen, J., Rinne, J., Jackowicz-Korczynski, M., Wooster, M., Dowling, T., Mauder, M., Ceriani, R., and Leitner, S.: When Rain Meets Heat: Drivers of Peak Carbon Uptake in East African Drylands, EGU General Assembly 2026, Vienna, Austria, 3–8 May 2026, EGU26-14605, https://doi.org/10.5194/egusphere-egu26-14605, 2026.

EGU26-14918 | ECS | Posters on site | AS2.2

A method to reduce sampling bias in multi-level tall-tower eddy covariance systems 

Konstantinos Kissas, Anastasia Gorlenko, Ziqiong Wang, Susanne Wiesner, Charlotte Scheutz, and Andreas Ibrom

Tall-tower eddy covariance (TTEC) systems are increasingly used to monitor land–atmosphere exchanges over complex agricultural and urban landscapes. However, interpreting flux estimates is challenging because the eddy covariance footprint varies significantly with meteorological conditions, which can introduce considerable bias assuming that sources and sinks are not uniformly distributed across the landscape or over the diel cycle. For fluxes with systematic diurnal patterns, such as traffic-related emissions, photosynthesis, or agricultural activities, uneven temporal sampling can prevent capturing a full daily cycle, introducing temporal sampling bias into daily flux estimates. The objective of this study was to evaluate the performance of a multi-level TTEC system in reducing footprint-related sampling bias.

The study site is located in an agricultural landscape west of Copenhagen, Denmark. A 15-month dataset (2023-2024) was collected, representing a heterogeneous landscape dominated by grassland and cropland, with scattered settlements, hedgerows, and forested areas. The TTEC system was installed on a 300 m telecommunication tower and equipped with three measurement levels at 70, 90, and 115 m. These sampling heights were selected a priori based on flux footprint estimates from wind data of a nearby tall tower, ensuring a more uniform footprint at a wider range of atmospheric stability conditions. Each level was equipped with a 3D ultrasonic anemometer (uSonic-3 Class A MP, METEK, Germany). A fast-response gas analyser was connected to the system and configured to sample air from one of the three heights at a time based on criteria related to optimal footprint size and constant flux layer requirements.

The results of the study showed that a greater number of observations were collected at the upper sampling height during daytime whereas nighttime observations were predominantly obtained from the lower level. The intermediate level was primarily used during the transition periods between day and night. The multi-level sampling scheme enabled a substantial reduction in sampling bias by actively controlling the horizontal extent of the flux footprint compared to a single-level TTEC system. Consequently, footprint size and the relative contributions of different land-cover types were more consistent across atmospheric stability regimes. The findings from this study highlight the importance of implementing a multi-level approach, particularly for TTEC systems operating over landscapes with greater heterogeneity than those typically sampled by conventional eddy covariance systems.


Acknowledgements

This project is supported by the Independent Research Fund Denmark (DFF-grant 1127-00308B - Observation System of Greenhouse Gas Sources and Sinks at the Landscape Scale for Verification of the Green Transition of Denmark). The authors wish to thank Cibicom A/S for sponsoring access to Hove telecommunication tower. 

How to cite: Kissas, K., Gorlenko, A., Wang, Z., Wiesner, S., Scheutz, C., and Ibrom, A.: A method to reduce sampling bias in multi-level tall-tower eddy covariance systems, EGU General Assembly 2026, Vienna, Austria, 3–8 May 2026, EGU26-14918, https://doi.org/10.5194/egusphere-egu26-14918, 2026.

EGU26-15855 | ECS | Posters on site | AS2.2

On the Role of Land-Atmosphere Coupling in Boundary Layer Cloud Development Over a Mixed Forest in Eastern Canada  

Lukas Rudaitis, Manuel Helbig, Xiaoli Zhou, Deklan Mengering, and Janna Heerah

Forests regulate moisture and heat fluxes in the lower atmosphere, which are inextricably linked to fair weather shallow cumulus formation within the boundary layer. Forest enhanced cloud shading thereby affects the earth’s surface radiation budget, a phenomenon that has been reasonably well studied through modelling and large-scale satellite studies. However, there is a lack of surface-based observational studies linking surface fluxes to cloud formationBy combining flux tower and ceilometer measurements in a mixed Acadian (Atlantic Canadian) forest near Fredericton, New Brunswick, we gain a unique opportunity to study land-cloud coupling using these local, surface-based flux observations. Analysis of 30-minute averaged surface-based tower measurements reveals fair weather summertime shallow cumulus formation over a 3-year period (2023-2025). Shallow cumuli occur on 160 days in total, exhibiting a clear seasonal cycle with a pronounced peak between June and August. We employ machine learning to determine the importance of environmental drivers and surface fluxes on daytime cloud fraction and cloud base height on days with shallow cumuli, with surface moisture exhibiting the strongest influence. Additionally, we show the response of shallow cumulus to extreme surface conditions by examining the period between August and September 2025. Fredericton experienced anomalously dry conditions, receiving only ~15% and ~40% of normal precipitation in August and September, respectively, during which soil moisture falls to 30% typical late-summer values. We find a significant reduction in shallow cumulus formation during the dry conditions, which we hypothesize is caused by the shift of surface flux partitioning from latent to sensible heating, and the concurrent enhancement of daytime lifting condensation level growth. 

How to cite: Rudaitis, L., Helbig, M., Zhou, X., Mengering, D., and Heerah, J.: On the Role of Land-Atmosphere Coupling in Boundary Layer Cloud Development Over a Mixed Forest in Eastern Canada , EGU General Assembly 2026, Vienna, Austria, 3–8 May 2026, EGU26-15855, https://doi.org/10.5194/egusphere-egu26-15855, 2026.

EGU26-16149 | Orals | AS2.2

On controlling regional greenhouse gas emission inventories with landscape scale flux observations 

Andreas Ibrom, Konstantinos Kissas, Anastasia Gorlenko, Ziqiong Wang, Susanne Wiesner, and Charlotte Scheutz

Effective greenhouse gas (GHG) emission policies rely on accurate and actual GHG emission data. Uncertainties in inventories arise from limited knowledge of actual activity data, the technology actually used and local ecosystem features that altogether need to be considered when estimating GHG emissions from a specific area. Independent monitoring and verification are expected to increase credibility of inventory reports and scenario estimations, ideally at the same spatial and temporal level of integration as the desired GHG inventory.

One key challenge to verify distributed anthropogenic GHG emissions with measured net GHG fluxes is that conventional GHG flux observation techniques are limited to process, facility or ecosystem scales and do rarely integrate over a representative fraction of the gross anthropogenic GHG fluxes in a region or country. We developed and built an observation system based on tall tower eddy covariance as one of the pillars of a future measurement based Danish national GHG observation system and explore its effectiveness to observe the integrated GHG exchange in a representative agricultural landscape.

We measured CO2, CH4, N2O and CO exchanges from a telecommunication mas (Hove, in a Danish agricultural landscape, West of Copenhagen (N 55.716, E12.238) for 15 months. We placed substantial efforts on estimating the origin of the measured fluxes and used this information to improve comparability of observed GHG exchanges with regional IPCC GHG emission inventories comparable.

The presentation focusses on 1. necessary processing steps for estimation of annual net GHG exchange budgets (spectral correction, data quality filtering and gap filling). 2. a novel “flux-landscape approach” to define a common reference area with inventories, and 3. an overview over the results of the comparison between observed GHG exchange and local IPCC inventory.

From these results we conclude that such comparisons strongly depend on the distinction of gross fluxes that are relevant for GHG accounting and reporting from other, biotic fluxes that are currently not climate policy relevant. This is particularly challenging for CO2, where we observe a strong net uptake, while the inventory is dominated by gross emissions.

We acknowledge funding by DFF (Independent Research Fund Denmark, ref. 1127-00308B) and sponsoring by CIBICOM A/S Ballerup Denmark.

How to cite: Ibrom, A., Kissas, K., Gorlenko, A., Wang, Z., Wiesner, S., and Scheutz, C.: On controlling regional greenhouse gas emission inventories with landscape scale flux observations, EGU General Assembly 2026, Vienna, Austria, 3–8 May 2026, EGU26-16149, https://doi.org/10.5194/egusphere-egu26-16149, 2026.

EGU26-16151 | Posters on site | AS2.2

Impact of Vertical Mixing on CO2 Simulations during the ASIA-AQ campaign 

Mina Kim, Rokjin J. Park, Jingi Jung, Sang-ik Oh, and Jaein I. Jeong

Uncertainty in vertical mixing is a major source of error in simulations of long-lived trace gases such as CO2 in atmospheric chemical transport models. We perform a set of sensitivity experiments with the GEOS-Chem model by applying different scaling factors to the vertical eddy diffusivity (Kz), thereby varying the strength of vertical mixing. Model results are evaluated using aircraft observations from the ASIA-AQ campaign conducted over Asia, a major anthropogenic CO2 source region where simulations are particularly sensitive to the representation of vertical mixing. The observations cover a wide range of boundary-layer and free-tropospheric conditions. Model–observation agreement is quantified using a suite of statistical metrics. Simulations with weaker vertical mixing consistently show better agreement with aircraft observations across regions than the default model configuration. The improved agreement reflects a better representation of the observed vertical and temporal variability. This study suggests that vertical mixing in GEOS-Chem may be overestimated over Asia and provides a basis for improving the model representation of vertical transport. 

How to cite: Kim, M., Park, R. J., Jung, J., Oh, S., and Jeong, J. I.: Impact of Vertical Mixing on CO2 Simulations during the ASIA-AQ campaign, EGU General Assembly 2026, Vienna, Austria, 3–8 May 2026, EGU26-16151, https://doi.org/10.5194/egusphere-egu26-16151, 2026.

EGU26-17086 | Posters on site | AS2.2

Quantifying Water Stress in Acer pictum subsp. mono and Hovenia dulcis Seedlings Using Thermal Imaging and Sap Flux 

Han Doo Shin, Seoyoung Park, Jiwon Baek, Ahreum Yun, Taegyu Lee, Minsu Lee, Kunhyo Kim, Jeonghyun Hong, and Hyun Seok Kim

 Land–atmosphere interactions at the leaf scale play a critical role in regulating surface energy exchange and plant water use under increasing heat and drought, yet quantitative indicators capturing short-term thermal–hydraulic coupling remain limited. This study compared seedlings of Acer pictum subsp. mono, with highly dissected leaves and low boundary-layer resistance, and Hovenia dulcis, with smoother leaves and thicker boundary layers, to test how leaf morphology constrains thermal and hydraulic regulation. Seedlings were exposed to well-watered, control, and severe-drought treatments, creating a clear soil-moisture gradient, while leaf temperature and sap flux were monitored alongside key environmental drivers. This design enabled evaluation of short-term leaf temperature variability (ΔT, 5-min scale) and its coupling with radiation and transpiration across contrasting water conditions.

 Across both species, ΔT was most strongly coupled with changes in photosynthetically active radiation(PAR). In A. mono, the PAR increase threshold triggering synchronized ΔT responses declined under severe drought (≈103 μmol m⁻² s⁻¹) relative to well-watered conditions (≈135 μmol m⁻² s⁻¹), whereas H. dulcis showed no significant treatment dependence. Under identical PAR reduction levels, higher sap velocity consistently enhanced leaf temperature declines, indicating transpiration-driven amplification of short-term cooling. At high temperatures (30–35 °C), A. mono maintained strong cooling responses, while H. dulcis exhibited flattened sap–ΔT relationships and increased ΔT amplitude under severe drought (≈5.0 °C). These results demonstrate that short-term leaf cooling emerges from the interaction between radiation forcing and transpiration, with species-specific constraints imposed by leaf morphology and hydraulic limitation. Integrating ΔT, PAR, and sap flux provides a quantitative framework for comparing thermal–hydraulic strategies among species and offers a sensitive tool for early diagnosis of drought vulnerability at the seedling stage.


How to cite: Shin, H. D., Park, S., Baek, J., Yun, A., Lee, T., Lee, M., Kim, K., Hong, J., and Kim, H. S.: Quantifying Water Stress in Acer pictum subsp. mono and Hovenia dulcis Seedlings Using Thermal Imaging and Sap Flux, EGU General Assembly 2026, Vienna, Austria, 3–8 May 2026, EGU26-17086, https://doi.org/10.5194/egusphere-egu26-17086, 2026.

EGU26-17305 | Orals | AS2.2

Disentangling the Effects of Forest Structural Heterogeneity on Observed Ecosystem Carbon and Water Fluxes 

Enrico Tomelleri, Anna Candotti, Torben Callesen, and Leonardo Montagnani
Eddy covariance (EC) measurements are essential to characterising biosphere–atmosphere exchanges of carbon (Net Ecosystem Exchange, NEE) and water vapour (Evapotranspiration, ET). However, their interpretation of structurally complex forest canopies remains challenging. EC fluxes integrate spatially variable source areas that are commonly treated as functionally homogeneous, neglecting the role of vegetation structural heterogeneity in regulating observed NEE and ET. Addressing this limitation is critical for improving flux interpretation and land-surface model parameterisation across heterogeneous forest ecosystems. We present a transferable, footprint-based framework. It integrates half-hourly EC fluxes with high-resolution Aerial Laser Scanning (ALS) data to explicitly resolve within-footprint vegetation structural heterogeneity. Using a two-dimensional flux footprint model (Kljun et al., 2015), EC fluxes were assigned according to the spatial contribution of distinct vegetation structural classes. This enables analysis of functional relationships between fluxes and the environment under comparable atmospheric forcing. The approach revealed substantial and systematic differences in both flux magnitude and functional responses among vegetation structural classes. Median differences reached up to 20 µmol m⁻² s⁻¹ for NEE and up to 5 mmol m⁻² s⁻¹ for ET. Light-response parameters and water-use efficiency varied consistently between structural groups. Our results underscore the importance of footprint heterogeneity characterisation for interpreting functional relationships in structurally complex forest ecosystems. By explicitly accounting for spatial heterogeneity within EC footprints, this framework provides a scalable pathway to link vegetation structure with ecosystem-scale carbon and water fluxes. The proposed framework is transferable to other EC sites. It offers the potential to improve the parameterisation of land-surface and dynamic global vegetation models, and ultimately to enhance predictions of biosphere–atmosphere exchange of matter and energy.

How to cite: Tomelleri, E., Candotti, A., Callesen, T., and Montagnani, L.: Disentangling the Effects of Forest Structural Heterogeneity on Observed Ecosystem Carbon and Water Fluxes, EGU General Assembly 2026, Vienna, Austria, 3–8 May 2026, EGU26-17305, https://doi.org/10.5194/egusphere-egu26-17305, 2026.

Atmospheric CO₂ measurements provide essential constraints for carbon-budget estimates and atmospheric modelling. Virtual tall tower (VTT) methods are a promising, but yet underexamined approach for upscaling ecosystem-level CO₂ concentrations measured at eddy covariance (EC) sites (typically 2–50 m above ground) to atmospheric measurements representative of tall towers (TT; ~100 m and higher). Implementing VTT approaches at existing EC stations could therefore expand the currently sparse network of TT observations. In this study, we evaluate the applicability of a VTT approach using collocated EC–TT measurements. We use 2024 data from the combined ecosystem-atmosphere station Svartberget site in northern Sweden (SE-Svb, SVB), part of the ICOS (Integrated Carbon Observation System) network, with brief examples from one or more other sites. A key advantage of the ICOS Svartberget station is that ecosystem EC and atmospheric TT measurements are available at the same location, with EC observations at 35 m and TT measurements at 35 m and 150 m. The 35 m TT measurements are an important asset for post-hoc calibration correction of the concentrations measured by the EC system, since state-of-the-art EC stations typically do not meet the high calibration requirements of a TT measurement. We implemented the VTT method proposed by Haszpra et al. (2015) and tested the gradient functions of Patton et al. (2003) and Wang et al. (2007) to define a base-run configuration. We then performed a sensitivity analysis of key variables in the VTT formulation. Model performance was evaluated using bias, root mean square error (RMSE), and correlation, by comparing VTT-estimated CO₂ concentrations at the TT top height (150 m) against measured TT concentrations. For 2024, approximately 30% of valid hourly data points met the well-mixed criteria required for VTT application. When treating EC calibration and VTT calculations as separate steps, EC calibration exerted the largest influence on estimated CO₂ at TT height, highlighting calibration as a critical prerequisite for reliable mixed-layer concentration estimates. Sensitivity analysis further showed that, when accounting for both numerical perturbations and measurement uncertainty, the planetary boundary layer height was the most influential variable, producing the largest changes in performance statistics relative to the target TT concentrations. Taken together, these results suggest that VTT approaches could increase the coverage of TT-representative atmospheric CO₂ estimates. Improving planetary boundary layer height (PBLH) estimates should further increase VTT accuracy. Further steps, VTT performance should be tested across additional sites and time periods to assess robustness under different conditions.

How to cite: Marcon-Henge, L., Graf, A., and Peichl, M.: Performance of a Virtual Tall Tower (VTT) approach for estimating CO2 concentrations in the mixed layer from eddy covariance measurements near the surface, EGU General Assembly 2026, Vienna, Austria, 3–8 May 2026, EGU26-17469, https://doi.org/10.5194/egusphere-egu26-17469, 2026.

A unified probability density function (PDF) parameterization for subgrid moist convection and turbulence is developed using a Lagrangian stochastic modeling (LSM) approach. The model solves the transport equations of the joint PDF of turbulent velocity and passive scalars by tracking an ensemble of stochastic particles governed by coupled stochastic differential equations (SDEs). Building on previously developed SDEs for particle velocity and temperature, the LSM is extended to represent inhomogeneous stratified turbulence and its entrainment process. Furthermore, using Lagrangian particle tracking data obtained from large-eddy simulations (LES) of boundary layer and moist convection cases, the SDEs are refined and their parameters are optimized to reproduce the Lagrangian statistics diagnosed from the LES. In the proposed model, turbulence statistics and turbulent fluxes are obtained directly from particle ensembles, providing a full representation of the turbulence PDF without invoking traditional closure assumptions for turbulent transport. The proposed model is evaluated against LES results for convective and stable atmospheric boundary layer (ABL) cases, including shallow convection cases. In convective regimes, the LSM realistically captures entrainment processes and reproduces mean thermodynamic profiles and turbulent fluxes that closely agree with LES results. The simulated joint PDFs exhibit pronounced non-Gaussian features and PDF separation in the entrainment zone. In stable ABL simulations, the LSM predicts realistic turbulence intensities and mean profiles, with near-Gaussian PDFs consistent with LES results. In the shallow convection case, the model simulates realistic vertical structures and variability of convection in the cloud layer. These results demonstrate that the proposed LSM framework provides a physically consistent and flexible approach for simulating both moist convection and turbulence with a full representation of the subgrid-scale PDF.

How to cite: Shin, J.: Unified PDF Parameterization of Subgrid Moist Convection and Turbulence Using a Lagrangian Stochastic Approach, EGU General Assembly 2026, Vienna, Austria, 3–8 May 2026, EGU26-18158, https://doi.org/10.5194/egusphere-egu26-18158, 2026.

EGU26-20490 | ECS | Posters on site | AS2.2

Data-Driven Parameterisations for the Multiscale Lorenz 96 System  

Miriam Ridao

Data-driven parameterisations offer a promising route to improving the representation of unresolved processes in geophysical models. In this work, the two-timescale Lorenz 96 system is used as a controlled testbed to systematically compare deterministic, stochastic, and memory-aware machine-learning closures. A range of architectures are implemented, including multilayer perceptrons, convolutional networks, recurrent models, and conditional generative approaches, and are evaluated in both offline and online settings using weather-style forecast metrics and long-term climatological diagnostics. The results show that models incorporating physically motivated inductive biases, such as stochasticity, spatial structure, or temporal memory, outperform simpler deterministic and memoryless closures. In particular, stochastic generative models and recurrent networks better reproduce regime behaviour, spatio-temporal correlations, and long-term statistics, highlighting the importance of representing intrinsic variability and non-Markovian effects. Ongoing and future work will extend this framework to more realistic dynamical systems, including quasi-geostrophic and primitive-equation models, with a focus on enforcing physical consistency, incorporating explicit memory effects, and developing hydrid physics-machine learning closures. 

How to cite: Ridao, M.: Data-Driven Parameterisations for the Multiscale Lorenz 96 System , EGU General Assembly 2026, Vienna, Austria, 3–8 May 2026, EGU26-20490, https://doi.org/10.5194/egusphere-egu26-20490, 2026.

EGU26-20896 | Posters on site | AS2.2

How important is the entrainment flux for characterizing land-atmosphere feedback in the convective boundary layer? 

Volker Wulfmeyer, Frank Beyrich, Thomas Jagdhuber, Harald Kunstmann, Matthias Mauder, Stan Schymanski, Christoph Thomas, Oliver Branch, Verena Rajtschan, Joachim Ingwersen, Natalie Orlowski, Florian Hellwig, Pauline Seeburger, Claudia Voigt, Benjamin Fersch, Anna Winkelmann, Linus von Klitzing, Moritz Schumacher, Andreas Behrendt, and Diego Lange

A high quality of the representation of land-atmosphere (L-A) feedbacks is fundamental for advancing the performance of weather forecasts, seasonal simulations, and climate projections. These feedbacks are due to a highly complex interaction of variables related to the exchange and conservation of momentum, energy, and mass. The Land-Atmosphere Feedback Initiative (LAFI, see https://www.lafi-dfg.de) is the Collaborative Research Unit 5639 funded by the German Research Foundation (DFG). The overarching goal of LAFI is to understand and quantify L-A feedbacks via unique synergistic observations and model simulations from the micro-gamma (» 2 m) to the meso-gamma (» 2 km) scales from diurnal to seasonal time scales.

The fundament to reach this goal is provided by the observation of L-A system processes and feedbacks at the Land-Atmosphere Feedback Observatory (LAFO) of the University of Hohenheim in Stuttgart, Germany. Here, a worldwide-unparalleled synergy of measurements is realized including water stable isotopes, temperature by fiber-optic distributed sensors, and a suite of atmospheric variables with turbulence resolution using scanning lidar systems.

A key research objective of LAFI is to quantify entrainment in the convective boundary layer (CBL), to separate and quantify related processes such as engulfment, and to derive similarity relationships for parameterizing entrainment fluxes. We will present first measurements of entrainment fluxes at LAFO with lidar synergy, which are typically on the order of 100-200 W/m2 around noon with respect to the latent heat. These new measurements allow for quantifying the flux divergences in the CBL that are an essential part of the heat and water-vapor budget equations. Furthermore, we will relate the entrainment flux to surface variables for characterizing feedback metrics such as the relative humidity tendency and the mixing diagram. Finally, we will present an outlook of future work and its collaboration and coordination with the Global Land-Atmosphere System Studies (GLASS) Panel of the Global Energy and Water Exchanges (GEWEX) project.

How to cite: Wulfmeyer, V., Beyrich, F., Jagdhuber, T., Kunstmann, H., Mauder, M., Schymanski, S., Thomas, C., Branch, O., Rajtschan, V., Ingwersen, J., Orlowski, N., Hellwig, F., Seeburger, P., Voigt, C., Fersch, B., Winkelmann, A., von Klitzing, L., Schumacher, M., Behrendt, A., and Lange, D.: How important is the entrainment flux for characterizing land-atmosphere feedback in the convective boundary layer?, EGU General Assembly 2026, Vienna, Austria, 3–8 May 2026, EGU26-20896, https://doi.org/10.5194/egusphere-egu26-20896, 2026.

EGU26-21639 | ECS | Posters on site | AS2.2

Enhancing Great Plains Nocturnal Precipitation and Low-Level Jets in AM4 with an Extended CLUBB Closure 

Emanuele Silvio Gentile, Vince Larson, Ming Zhao, Colin Zarzycki, and Gunilla Svensson

We extend the Cloud Layers Unified by Binormals (CLUBB) turbulence scheme within the GFDL atmospheric model (AM4) by implementing direct momentum-flux prognosis and a multiscale turbulent length scale, to improve the simulation of nocturnal precipitation and associated Low-Level Jets (LLJs) over the Great Plains (GP). Towards this aim, we set up four AM4-CLUBB configurations: diagnosed momentum flux, prognosed momentum flux, diagnosed momentum flux with a multiscale turbulent lengtshcale, and prognosed momentum flux with a multiscale turbulent lengtshcale. Simulations are evaluated against the AM4 control, the Integrated Multi-satellitE Retrievals for GPM (IMERG), and the Doppler wind radar profiles from the Atmospheric Radiation Measurement (ARM) program. Results show that all AM4-CLUBB configurations improve the precipitation timing from the unrealistic midday peak seen in the AM4 control simulation toward the satellite-observed nocturnal maximum. The configuration that prognoses momentum flux and uses a multi-scale turbulent length scale, best matches the timing and intensity of GP precipitation rate. This configuration is also that which more accurately simulates the ARM-observed nocturnal LLJ wind profiles, while increasing the frequency of counter-gradient momentum fluxes near the LLJ core compared to prognosing momentum fluxes with the original AM4-CLUBB turbulent lengthscale. Momentum budget analysis attributes this increase to a nearly fivefold enhancement in the buoyancy production term when using the multiscale formulation, and leads to stronger nocturnal convective activity, as diagnosed from the greater vertical velocity skewness and plume asymmetry.

How to cite: Gentile, E. S., Larson, V., Zhao, M., Zarzycki, C., and Svensson, G.: Enhancing Great Plains Nocturnal Precipitation and Low-Level Jets in AM4 with an Extended CLUBB Closure, EGU General Assembly 2026, Vienna, Austria, 3–8 May 2026, EGU26-21639, https://doi.org/10.5194/egusphere-egu26-21639, 2026.

EGU26-22783 | Posters on site | AS2.2

Towards dynamic closures for higher-order turbulence schemes 

Georgios Efstathiou and Peter Clark

Starting from the spatially filtered equations in the large-eddy simulation (LES) regime,
commonly used turbulence closures assume a local equilibrium between turbulence
production and dissipation, with the closure parameters representing the continuous
cascade of energy from the resolved to the subgrid scales. However, away from grid
resolutions that adequately resolve the inertial subrange of turbulence, this equilibrium
assumption breaks down. Moreover, at such resolutions, the dominant turbulent eddies
are only partially resolved, and the appropriate values of the closure parameters are
generally unknown.
In this study, we explore a dynamic closure for a prognostic turbulent kinetic energy
(TKE) scheme in a quasi-steady convective boundary layer (CBL) case, spanning
resolutions from LES toward the grey zone. The dynamic approach optimises the
closure parameters using information from the resolved small-scale turbulence,
exploiting the assumed similarity between resolved and unresolved scales. Preliminary
results show that the dynamically derived length scales exhibit the desired scale
dependency across resolutions, leading to improved agreement with LES.

How to cite: Efstathiou, G. and Clark, P.: Towards dynamic closures for higher-order turbulence schemes, EGU General Assembly 2026, Vienna, Austria, 3–8 May 2026, EGU26-22783, https://doi.org/10.5194/egusphere-egu26-22783, 2026.

EGU26-23263 | ECS | Orals | AS2.2

A Surface Layer Scheme for an Implicit Large Eddy Simulation Model 

Yuhang Tong, John Thuburn, and Georgios Efstathiou

This research focuses on improving the near-surface performance of an Implicit Large
Eddy Simulation (ILES) model. The ILES model uses the Semi-implicit semi-Lagrangian
numerical method for simulating the atmospheric boundary layer. Moreover, the model
is called an “implicit” model because it includes no explicit scheme to represent
subgrid-scale fluxes but makes use of the numerical dissipation. One of the problems
we’ve met so far is that, for example, in the neutral boundary layer case, some
simulations indicate the weakness of this model in resolving the eddies near the bottom
boundary, which can be reflected by, for example, failure to reproduce a log wind profile
for the neutral case. We hope that this type of issue can be solved by spreading the
eRect of surface flux convergence into several model layers using a surface model. The
purpose of this surface model is to minimize the inability of our ILES model to resolve
the near-surface eddies.

How to cite: Tong, Y., Thuburn, J., and Efstathiou, G.: A Surface Layer Scheme for an Implicit Large Eddy Simulation Model, EGU General Assembly 2026, Vienna, Austria, 3–8 May 2026, EGU26-23263, https://doi.org/10.5194/egusphere-egu26-23263, 2026.

EGU26-1857 | ECS | Orals | BG2.1

Using δ¹⁸O(PO4) for historical source apportionment of inorganic phosphates in the eutrophic lake Baldegg, Switzerland 

Ron Heinrich, Terry Cox, Deb Jaisi, Federica Tamburini, and Christine Alewell

The identification of phosphorus (P) sources is critical for implementing effective eutrophication mitigation strategies. Lake Baldegg (Switzerland) has a history of excessive phosphorus inputs leading to severe eutrophication. Here, we utilise the oxygen isotopic composition of inorganic phosphate (δ¹⁸O(PO4)) to discriminate soil-bound phosphate sources (orchard, arable, grasslands and forest; effluents from the local wastewater treatment plant and manure).
Previously, source apportionment using δ¹⁸O(PO4) has been limited by the number of sources exceeding the number of tracers. In attempt to resolve this issue, additional tracers (C, N and geochemical elements) have been incorporated into the mixing models. As these tracers may originate from different sources and/or undergo different biogeochemical cycling than phosphate, their use for phosphate apportionment can potentially lead to erroneous results.
To overcome this issue, we analysed the δ¹⁸O(PO4) values in multiple inorganic phosphate pools: NaOH-extractable (Fe/Al-bound), HCl-extractable (Ca/Mg-bound) and HNO₃-extractable residual inorganic P (modified Hedley sequence). The pools were purified using a zirconium-loaded resin, precipitated as Ag₃PO₄ and analysed for δ¹⁸O(PO₄) via high-temperature pyrolysis based isotope ratio mass spectrometry (TC/EA-IRMS).
Preliminary results show that δ¹⁸O(PO4) values discriminate in each pool between land-uses: forest (NaOH: +10.2‰; HCl: +10.6‰), orchards (NaOH: +15.6‰; HCl: +14.7‰), arable fields (NaOH: +16.0‰; HCl: +14.9‰) and grassland soils (NaOH: +17.0‰; HCl: +16.8‰). As such, multiple pools can be potentially used as tracers for phosphate apportionment and remove the need for additional non-phosphate-specific tracers. While this study demonstrates the discrimination between different sources, analysis of the lake sediments is currently ongoing. We aim to reconstruct 130 years of inorganic phosphate sources and identify key moments the catchment’s history.

How to cite: Heinrich, R., Cox, T., Jaisi, D., Tamburini, F., and Alewell, C.: Using δ¹⁸O(PO4) for historical source apportionment of inorganic phosphates in the eutrophic lake Baldegg, Switzerland, EGU General Assembly 2026, Vienna, Austria, 3–8 May 2026, EGU26-1857, https://doi.org/10.5194/egusphere-egu26-1857, 2026.

Oxygen (O), the most abundant element in the Earth's crust, has an underexplored isotope system in plant and soil sciences compared to carbon and nitrogen, despite its strong potential to serve as a robust proxy for climate, ecohydrology and biogeochemical studies. The stable isotope ratio of O (δ18O) in bulk soil organic matter (SOM) might reflect the isotope composition of soil water during SOM formation. However, this signal is blurred by the presence of O from inorganic minerals and a dynamic exchangeable O fraction that can quickly equilibrate with ambient water. To address these challenges, the O in SOM must be isolated from interfering O-containing inorganic compounds in plant OM and minerals. Moreover, the exchangeable O fraction must be accounted for. Although we hypothesise that the exchangeable O fraction in SOM is smaller than that of H, it can likely not be ignored.

We evaluated two alternative methods to separate organic and inorganic O from the soil: demineralisation (i.e., removal of inorganic compounds using HF and HCl) and removal of the organic compounds by muffling combined with a KCl treatment to remove oxyanions. After isolating the organic fraction, we applied a steam equilibration procedure, in which we equilibrated the samples with different water vapours of known O-isotopic composition to determine the δ18O value of the nonexchangeable O fraction, as has already been similarly established for H. We used standard materials like ethylene glycol, p-Nitro aniline, and Aldrich humic acid (AHA) for the demineralisation method and two O-containing minerals (Goethite and Apatite), both pure and mixed with AHA as model substances for the organic matter removal method and also 18O-spiked chemicals to select the procedure with no (or minimal) alterations of the original O isotope ratios. Our preliminary data reveal an exchangeable O fraction of 1-1.5% in AHA and excluding its effect by using mass balance calculation, the resulting δ18O value of the nonexchangeable fraction of AHA was ~15.2‰, which is significantly depleted relative to the humic acid extracted from natural soil (18.4-24.6‰), a discrepancy attributable to the absence of microbial decomposition and associated isotopic fractionation in our synthetic model compound (AHA). Thus, by quantifying the exchangeable O fraction and assessing the stability of the non-exchangeable O fraction against our treatments, this study provides a methodological prerequisite for the accurate determination of oxygen isotope ratios of the nonexchangeable O fraction in plant and soil science.

How to cite: Ghosh, D., Wilcke, W., and Oelmann, Y.: Decoding the stable isotope signature of the non-exchangeable oxygen fraction of bulk soil organic matter: methodological prerequisites , EGU General Assembly 2026, Vienna, Austria, 3–8 May 2026, EGU26-1885, https://doi.org/10.5194/egusphere-egu26-1885, 2026.

EGU26-2458 | Orals | BG2.1

Integrating Geolocator Tracking and Isotopic Tools to Reveal Winter Foraging Ecology and Mercury Exposure in Arctic Seabirds 

Mi-Ling Li, Sarah Janssen, Michael Tate, Emily Choy, Kyle Elliot, and Marianne Gousy-Leblanc

Winter is a critical yet understudied phase in the annual cycle of Arctic seabirds, largely due to logistical challenges of polar fieldwork. While geolocators have advanced our understanding of migration and overwintering behavior, their cost and technical limitations constrain widespread use. As a complementary and scalable alternative, feather analysis offers integrated insights into both ecology and contaminant exposure at individual and population levels.

In this study, we examined head feathers from thick-billed murres (Uria lomvia) collected at seven colonies spanning West Greenland, the Canadian Arctic, and Svalbard. This species breeds widely across the circumpolar Arctic, but several Atlantic populations are in decline. Because head feathers are grown during the non-breeding season, they reflect mercury exposure at overwintering sites. We measured total mercury concentrations, stable isotopes of carbon (δ¹³C) and nitrogen (δ¹⁵N), and mercury isotope compositions (δ²⁰²Hg, Δ¹⁹⁹Hg) to assess variation in winter foraging habitats and mercury exposure pathways. Our results reveal distinct spatial patterns in δ²⁰²Hg that align with known west-to-east gradients in the Hg isotopic composition of North Atlantic prey fish, suggesting region-specific foraging areas during winter. Intra-colony variation in δ²⁰²Hg further highlights individual-level differences in winter habitat use, consistent with patterns derived from geolocator data. Additionally, the strong positive correlation between total Hg concentration and Δ¹⁹⁹Hg suggests that foraging depth significantly influences mercury uptake. These findings demonstrate that an integrated isotopic-tracking approach advances ecological biogeochemistry by tracing both contaminant pathways and seabird movement using natural isotopic tracers.

How to cite: Li, M.-L., Janssen, S., Tate, M., Choy, E., Elliot, K., and Gousy-Leblanc, M.: Integrating Geolocator Tracking and Isotopic Tools to Reveal Winter Foraging Ecology and Mercury Exposure in Arctic Seabirds, EGU General Assembly 2026, Vienna, Austria, 3–8 May 2026, EGU26-2458, https://doi.org/10.5194/egusphere-egu26-2458, 2026.

Closed-transient chamber systems are widely used to measure the transport of non-reactive greenhouse gases (GHGs) and their stable isotopes between the soil and atmosphere. Technologies used to measure GHGs in chamber-based systems have advanced since their first introduction. In many early systems, gas analysis was performed off-line using gas chromatography and/or mass spectrometry. The introduction of non-dispersive infrared gas analyzers suitable for field deployment allowed CO2 to be measured on-line, but for other GHGs on-line analysis was not possible until the more recent introduction of tunable diode laser absorption spectroscopy (TDLAS)- based gas analyzers. The most recent generations of TDLAS analyzers have extended measurement capabilities from reporting total concentration of a given GHG, to separating concentrations of its most abundant stable isotopologues. For CO2, this advancement makes possible near real-time estimation of isotopic signature (δ13C) of the carbon source pool.

Linear mixing model-based approaches are used to separate the isotopic signature of a source pool from background condition observed during soil chamber measurements. The most common, those proposed by Keeling (1958) and Miller and Tans (2003), uses the relationship between the normalized isotopic ratio (δ) and total concentration, or some derivate term of either, to estimate the source pool conditions. Keeling’s methodology is widely cited but requires extrapolation well beyond measured conditions. The Miller-Tans approach is predicated on the same underlying mass balance as Keeling but uses a solution that estimates the source pool only over measured conditions, reducing uncertainty in final estimates. Both approaches require independent measurement of the total concentration and normalized isotopic ratio, which is not possible with TDLAS based analyzers. TDLAS analyzers measure individual isotopologue mole fractions and use the same set of individual measurements to calculate both total concentration and the normalized isotopic ratio, introducing an inherent autocorrelation between them. Additionally, the δ exhibits a bias as a function of total measured CO2 concentration, introducing an apparent concentration dependence error (CDE) in d reported from TDLAS.

We present an alternative approach to estimating the source pool isotopic composition specific to TDLAS measurements. This alternative approach relies only on measurements of individual isotopologue mole fractions, avoiding autocorrelation, and does not require extrapolation beyond measurement conditions. We include a sensitivity analysis of mixing model approaches and errors common to TDLAS based instruments, using a chamber dataset synthesized from field-based measurements of environmental conditions and physical properties of gas transport.

How to cite: Hupp, J., Belovitch, M., Lynch, D., and Vath, R.: An alternative approach to determine source stable carbon isotope composition for closed-transient chamber measurements using TDLAS analyzers, EGU General Assembly 2026, Vienna, Austria, 3–8 May 2026, EGU26-2823, https://doi.org/10.5194/egusphere-egu26-2823, 2026.

EGU26-3089 | Orals | BG2.1

Taking the Pulse: Tracking Wastewater Nutrients Through a River Using Lagrangian Sampling and Isotopic Tracers 

Daren Gooddy, Alex O'Brien, Mike Bowes, Nick Everard, Cedric Laize, Ponnambalam Rameshwaran, Chris Pesso, Patrick Harrison, James Sorensen, Andi Smith, and Stefan Krause

Effective management of river pollution is often limited by low-frequency monitoring approaches that fail to resolve the spatiotemporal dynamics of nutrient sources, hydrodynamic transport, and in-stream biogeochemical processing. To address this, we applied a high-resolution Lagrangian sampling framework to a well-characterised reach of the River Thames, enabling continuous tracking of water parcels downstream of key nutrient inputs. This approach combined nutrient concentration data, optical characterisation, and stable isotope tracers with detailed hydrodynamic measurements to resolve nutrient sources, mixing behaviour, and short-reach processing. Water samples were collected for conventional nutrient analysis, excitation–emission matrix (EEM) fluorescence, and isotopes of nitrate and phosphate. Field measurements were supported by drone-based infrared imaging to characterise surface flow structure and a remote-controlled survey vessel equipped with Acoustic Doppler Current Profiler, Single Beam Echo Sounder, and GPS to resolve hydrodynamics and channel morphology. In situ sondes and large-volume sampling further captured water-quality variability. Phosphate oxygen isotopes (δ¹⁸Op) were used to directly trace wastewater-derived phosphorus downstream of a wastewater treatment works (WWTW) outfall. Nineteen river samples collected at ~20 m intervals were compared with upstream river and WWTW effluent end members. Effluent phosphate exhibited a distinctly lower δ¹⁸Op value than background river phosphate, enabling a two-endmember isotope mixing model. Results indicate that WWTW-derived phosphate contributed approximately 20–55% of riverine phosphate across most of the reach, with localized zones of near-complete effluent dominance. A pronounced low-δ¹⁸Op anomaly coincident with elevated phosphorus concentrations is interpreted as a localized hydrodynamic pulse of wastewater phosphate superimposed on progressive biological reprocessing. Together, these results demonstrate that wastewater phosphorus can exert strong, spatially heterogeneous control on riverine phosphate over very short distances, even under conditions of active mixing and biological cycling. More broadly, this integrated Lagrangian-hydrodynamic-isotopic framework provides a powerful new basis for quantifying nutrient sources, transport, and transformation in rivers, with direct implications for more effective nutrient management strategies.

How to cite: Gooddy, D., O'Brien, A., Bowes, M., Everard, N., Laize, C., Rameshwaran, P., Pesso, C., Harrison, P., Sorensen, J., Smith, A., and Krause, S.: Taking the Pulse: Tracking Wastewater Nutrients Through a River Using Lagrangian Sampling and Isotopic Tracers, EGU General Assembly 2026, Vienna, Austria, 3–8 May 2026, EGU26-3089, https://doi.org/10.5194/egusphere-egu26-3089, 2026.

EGU26-3304 | Posters on site | BG2.1

GC-IRMS: optimization of injection techniques for analysis of saturated hydrocarbons, VOCs and PAHs 

Stefania Milano, Maria de Castro, and Mario Tuthorn

Rapidly expanding biogeochemical applications based on compound specific isotope ratios require instrumentation versatility to meet different analytical challenges. Here we present features and benefits of using the following GC injection techniques: on-column injection, Large Volume Injection (LVI) Programmed Temperature Vaporization (PTV) technique, Static Headspace Sampling (SHS) injection and conventional Split/Splitless injection. We will demonstrate capability of Thermo Scientific™ GC IsoLink™ II IRMS System to support these injection techniques to properly transfer a representative portion of the sample to the analytical column while avoiding discrimination and isotopic effects.

On-column injection is applied for analysis of thermally labile or unstable compounds, as well as for samples with large analyte-boiling-point differences. It can be advantageous in a wide area of applications, i.e. for investigations of alkenones and alkanes from soils and sediments. We will present an optimized GC-IRMS analytical setup for stable carbon isotope ratios analysis of saturated hydrocarbons.

The LVI PTV is an injection technique which allows the introduction of larger volumes of samples in the GC injector which can be particularly useful for analysis of organic pollutants present in very small quantities. Here we present an optimized methodology for analysis of very small amounts of saturated hydrocarbons.

The SHS injection via split/splitless injector eliminates the need for direct liquid sample injection, reducing column contamination and improving analyte separation and reproducibility of isotope data. Here we demonstrate excellent precision and accuracy for GC-C-IRMS analysis of VOCs by using an optimized method for SHS, including improved sensitivity and lower detection limits.

Finally, we also present an optimized workflow for the analysis of PAHs by GC-IRMS with conventional Splitless injection, including characterization of PAHs standards and data evaluation.

How to cite: Milano, S., de Castro, M., and Tuthorn, M.: GC-IRMS: optimization of injection techniques for analysis of saturated hydrocarbons, VOCs and PAHs, EGU General Assembly 2026, Vienna, Austria, 3–8 May 2026, EGU26-3304, https://doi.org/10.5194/egusphere-egu26-3304, 2026.

EGU26-3928 | Posters on site | BG2.1

Intra-annual tree-ring cellulose δ2H as an indicator of soil drought 

Charlotte Angove, Marco Lehmann, Matthias Saurer, Yu Tang, Elina Sahlstedt, Giles Young, Kerstin Treydte, Kersti Leppä, Pauliina Schiestl-Aalto, Guido Wiesenberg, and Katja Rinne-Garmston

Temporal variability of tree-ring cellulose δ2H (δ2Hring-cel) can be a unique tool for understanding tree physiology and climate. However, we do not fully understand the drivers of temporal variability in δ2Hring-cel. Investigating seasonal δ2Hring-cel in boreal forests is particularly challenging. Previous studies on intra-annual tree-ring δ18Ohave shown that tree-ring isotope variability can result from the combined but opposing effects of source water and leaf assimilates, a dynamic likely relevant for δ2Hring-cel as well. To be able to use δ2Hring-cel as a standalone and reliable bioindicator, it is important to understand the variable hydrogen isotope fractionation between source water and tree rings. Our study aimed to provide context to this variability in a natural forest by tracing intra-annual δ2Hring-cel to the δ2H of its sources (water, sugars & starch), and comparing δ2Hring-cel to physiological and climatic factors.

The δ2H of source water, leaf water and carbohydrate pools (i.e. water-soluble carbohydrates, starch) were analysed from five pine (Pinus sylvestris) trees during 2019 at Hyytiälä forest, Finland. Their δ2H were used to model continuous δ2H of source water (δ2Hsource) and bulk leaf water (δ2Hleaf-water) and photosynthetic water (δ2Hphoto-water). Intra-annual δ2Hring-cel were analysed in 2018 and 2019 at a resolution of 5-10 timepoints per year, and they were allocated to xylogenetic timepoints. They were then compared to time-integrated δ2Hsource, δ2Hleaf-water, δ2Hleaf-sug, net assimilation rate, and various other physiological and climatic factors.

Carbohydrate δ2H was significantly different among leaves, branches and stems. δ2Hring-cel had strong time-integrated relationships to modelled δ2Hsource, net leaf assimilation rate and evapotranspiration, but the direction of their relationships was different between years. At monthly resolution, water-soluble carbohydrate δ2H measured from one year-old needles had a strong, positive relationship to δ2Hring-cel. δ2Hring-cel also had strong relationships to Standardized Soil Moisture Index (SSMI) in both years.

We show that δ2Hring-cel has a potential as an indicator of soil drought conditions, and that this signal is likely mediated by the leaf-level response to soil drought. This clearly support the growing body of evidence that δ2Hring-cel is strongly mediated by physiological processes, while also opening a new avenue for δ2Hring-cel interpretations. Our results show promise for δ2Hring-cel functioning as a bioindicator of soil drought related physiological stress signals in long-term tree ring chronologies.

How to cite: Angove, C., Lehmann, M., Saurer, M., Tang, Y., Sahlstedt, E., Young, G., Treydte, K., Leppä, K., Schiestl-Aalto, P., Wiesenberg, G., and Rinne-Garmston, K.: Intra-annual tree-ring cellulose δ2H as an indicator of soil drought, EGU General Assembly 2026, Vienna, Austria, 3–8 May 2026, EGU26-3928, https://doi.org/10.5194/egusphere-egu26-3928, 2026.

Against the backdrop of climate change, the destructive power of tropical cyclones (TCs) has intensified, highlighting the urgent need for a more comprehensive understanding of tropical cyclone activity beyond the records provided by meteorological observations and historical documents. In this study, we compiled TC events affecting the Hong Kong region of South China since 1980 and investigated their isotopic imprints in precipitation and tree rings. We compared the hydrogen isotopic composition of precipitation (δ2Hppt) during TC-affected and TC-free months. After accounting for the rainfall amount effect and seasonal influences, we demonstrate that δ2Hppt consistently captured the anomalously depleted isotopic signals associated with TC rainfall. Furthermore, robust regression analysis indicated that TC-related precipitation isotopic variability explained approximately 30.5% of the variance in lignin methoxy stable hydrogen isotopes (δ2HLM) of tree-ring latewood in Pinus elliottii Engelm. at the Hong Kong site. Additionally, TC precipitation (TCP) exerted the strongest positive control on TC signals recorded in latewood δ2HLM, with additional contributions from TC intensity (MaxInte) and a significant negative seasonal effect (SeasonalIdx), while storm duration (Days) and distance (MinDist) showed limited independent influence. Overall, TC signals preserved in latewood δ2HLM reflect the integrated hydroclimatic effects of multiple storm characteristics at the annual scale, rather than being controlled by any single statistical descriptor of tropical cyclone activity. Our findings demonstrate that tree-ring latewood δ2HLM in P. elliottii can serve as a robust recorder of tropical cyclone signals. This work broadens the application of tree-ring lignin hydrogen isotopes and provides a novel proxy for improving interpretations of historical TC variability.

How to cite: Wang, Y., Li, W., and Song, X.: Extremely low δ2H signatures in tropical cyclone precipitation recorded by tree-ring lignin methoxy hydrogen isotopes, EGU General Assembly 2026, Vienna, Austria, 3–8 May 2026, EGU26-4359, https://doi.org/10.5194/egusphere-egu26-4359, 2026.

EGU26-4432 | Posters on site | BG2.1

Contrasting isotopic responses of dryland and wetland plants to a century of global anthropogenic changes in nutrient cycling 

Iwona Dembicz, Natalia Chojnowska, Piotr Chibowski, and Łukasz Kozub

The release of carbon dioxide and reactive nitrogen in various forms by humans disrupts the functioning of ecosystems around the world. In Europe, many valuable habitats, particularly wetlands and dry grasslands, are under threat due to eutrophication. However, contrasting water regimes mean that the uptake of anthropogenic nitrogen by plants in these ecosystems differs, and this is also interrelated with an increase in trophic level in both habitats.

In our study, we measured the δ15N and δ13C values, as well as the total nitrogen content (TN), of 99 pairs of foliar samples collected from seven species of vascular plants in dry grasslands and wetlands in Poland. Each pair consisted of a historical sample, collected from a herbarium voucher dating from before 1939 (i.e. before the widespread use of artificial fertilisers in agriculture), and a contemporary sample, collected in 2024, from the same species in a similar location.

We performed t-tests to determine whether there were significant differences in the means of δ15N, TN, and δ13C between samples from the two habitats. Next, we calculated the differences in δ15N, TN, and δ13C between the contemporary and historical samples for each pair. We then tested whether the difference for each species and habitat type was significantly different from zero using 90% confidence intervals. We analysed the relationships between differences in δ15N and TN over time and the following factors using multiple linear regression: habitat type, the proportion of farmland in the landscape, the consumption of synthetic nitrogen fertiliser and NOx deposition. 

The δ15N and TN values were lower for dry grassland species than for wetland species in both the contemporary and historical subsets. For dry grassland species, the mean δ15N value was lower in contemporary samples than in historical ones. For wetland species, however, the opposite was true. The difference in δ15N values between pairs of samples was positively correlated with the proportion of farmland in the landscape. The mean TN value was higher in contemporary wetland samples than in historical ones, but not in dry grassland plants. The mean δ13C value, corrected for the Suess effect, was lower in contemporary samples than in historical ones. The mean difference was −0.51 ‰ for dry grassland species and −3.85 ‰ for wetland species.

Our study revealed that a century of carbon emissions, increased nitrogen input into the environment and the dominance of artificial fertilisers and combustion-derived nitrogen over biological nitrogen sources has not resulted in consistent responses across habitats and species. While the isotopic composition of nitrogen and carbon in plant tissues in Central Europe has undoubtedly changed, this change is context-dependent. Its magnitude and direction are impacted by the habitat and the identity and/or ecology of the species. As expected, man-made alterations appear to be more pronounced in wetland environments than in dryland habitats. Furthermore, the source of disruption may differ between the habitat types. Specifically, wetlands are exposed to a multitude of anthropogenic nitrogen and carbon sources, whereas dry grasslands seem to be predominantly affected by changes in atmospheric composition.

How to cite: Dembicz, I., Chojnowska, N., Chibowski, P., and Kozub, Ł.: Contrasting isotopic responses of dryland and wetland plants to a century of global anthropogenic changes in nutrient cycling, EGU General Assembly 2026, Vienna, Austria, 3–8 May 2026, EGU26-4432, https://doi.org/10.5194/egusphere-egu26-4432, 2026.

EGU26-5063 | Posters on site | BG2.1

Methodological advancements for stable carbon isotope measurement of dissolved inorganic carbon using tunable diode laser absorption spectrometers 

Frank Griessbaum, Jason Hupp, Doug Lynch, Mike Scaboo, Ahlyia Leclerc, and Wei-Jun Cai

Dissolved inorganic carbon (DIC) - including aqueous CO2, carbonic acid, bicarbonate, and carbonate - is often the largest pool of carbon in aquatic systems. Biogeochemical processes result in exchanges of carbon between the various DIC components and may act to move carbon into or out of the DIC pool. The isotopic composition of carbon is a product of both its source and mass-dependent fractionation as carbon changes form through the processes acting on it. Consequently, measurement of the stable carbon isotope composition of DIC is a valuable tool for understanding biogeochemical processes in aquatic systems. However, differences in isotopic composition are small, and separating source contributions requires precise measurement.

Measurement of DIC can be done by conversion to CO2 in the presence of a strong acid and quantification of liberated CO2 by gas analysis. To determine isotopic composition of the liberated CO213C) historical methods used isotope ratio mass spectrometry (IRMS). More recently, tunable diode laser absorption spectrometry (TDLAS) based gas analyzers have been adopted for these measurements but have continued to base methodological considerations on those developed for IRMS. While IRMS and TDLAS can both be used to determine δ13C, there are fundamental differences in the technology, which should be considered during application. In particular, this has meant δ13C - DIC measurements have been unable to take full advantage of TDLAS performance characteristics.  

Here we describe methodological advancements from integration of a TDLAS (LI-7825 carbon isotope analyzer) with a DIC measurement system (LI-5370A), that include changes to the pneumatic and analytical approach used in the DIC system. Pneumatic modifications allow the TDLAS to operate at an independent flow rate from the DIC system and serve to manipulate the residence time for CO2 along the flow path. We describe use of a non-CO2 free carrier gas, which allows the DIC measurement to take full advantage of analyzer precision and minimize errors intrinsic to δ13C as determined by TDLAS. We present data demonstrating measurement precision over a range of conditions and show that under similar conditions, these methodological changes result in precision exceeding that published previously for TDLAS-DIC measurements.

How to cite: Griessbaum, F., Hupp, J., Lynch, D., Scaboo, M., Leclerc, A., and Cai, W.-J.: Methodological advancements for stable carbon isotope measurement of dissolved inorganic carbon using tunable diode laser absorption spectrometers, EGU General Assembly 2026, Vienna, Austria, 3–8 May 2026, EGU26-5063, https://doi.org/10.5194/egusphere-egu26-5063, 2026.

EGU26-5528 | ECS | Orals | BG2.1

Reconstructing hydroclimate across the Pleistocene–Holocene transition in southern Iberia using stable isotopes of gypsum hydration water 

Jorge Cañada-Pasadas, Fernando Gázquez, Lucía Martegani, Claudia Voigt, Ana Isabel Sánchez-Villanueva, Antonio García-Alix, and Gonzalo Jiménez-Moreno

This study examines the stable oxygen and hydrogen isotopic composition of gypsum (CaSO4·2H2O) hydration water (GHW) preserved in sediments from the Laguna de la Ratosa playa lake (Málaga Province, southern Iberian Peninsula). The objective was to reconstruct the lake water isotopic composition between 18.5 and 7.5 ka, reflecting hydroclimate variability in the southern Iberian Peninsula during the Pleistocene-Holocene transition. The GHW proxy relies on the fact that during crystallization, gypsum incorporates water from the solution, allowing the isotopic composition of the paleo-lake water to be directly inferred from that of GHW. This is possible because the oxygen and hydrogen isotope fractionation factors between aqueous solutions and GHW are well constrained and largely insensitive to temperature and salinity. The reconstructed lake-water isotopic values show a progressive decrease (from mean values of 6 to 0‰ for δ¹⁸O and from 10 to –5‰ for δ²H) between 18.5 and 11 ka, coincident with the deglaciation. This trend indicates a transition toward less evaporative conditions associated with increasingly humid climate. Superimposed on this overall trend, however, are three arid intervals centered at ca. 18 ka, 16 ka, and 12–13 ka, during which both δ¹⁸O and δ²H values increased. These arid phases are interpreted as reflecting the influence of the Last Glacial Maximum, Heinrich Stadial 1 (HS1), and the Younger Dryas on lake hydrology. During the Early-Mid Holocene (11–7.5 ka), isotopic values stabilized at the lowest levels of the record (ca. 0‰ for δ¹⁸O and ca. –5‰ for δ²H), suggesting persistently reduced evaporation and the establishment of a more permanent lacustrine system under sustained wetter conditions. Overall, these results demonstrate that gypsum hydration water preserved in playa-lake sediments constitutes a robust proxy for reconstructing paleohydrological variability and associated climatic changes.

Acknowledgments: This study was funded by the GYPCLIMATE (PID2021-123980OA-I00) and PID2021-125619OB-C21 projects of the Spanish Ministry of Economy and Competitiveness and FEDER European Regional Development Funds. J.C.P. acknowledges the Research Teaching Training contract PRE2022-103493 Ministry of Economy and Competitiveness of Spain. L.M. was funded by the FPU21/06924 grant of the Spanish Ministerio de Educación y Formación Profesional. C.V. was funded by the European Comission (Marie Curie postdoctoral fellowship, grant no. 101063961). F.G acknowledges the Ramón y Cajal contract (RYC2020-029811-I) and the PPIT-UAL grant from the Andalusian Regional Government -FEDER2022-2026 (RyC-PPI2021-01).

How to cite: Cañada-Pasadas, J., Gázquez, F., Martegani, L., Voigt, C., Sánchez-Villanueva, A. I., García-Alix, A., and Jiménez-Moreno, G.: Reconstructing hydroclimate across the Pleistocene–Holocene transition in southern Iberia using stable isotopes of gypsum hydration water, EGU General Assembly 2026, Vienna, Austria, 3–8 May 2026, EGU26-5528, https://doi.org/10.5194/egusphere-egu26-5528, 2026.

EGU26-5954 | ECS | Orals | BG2.1

Critical evaluation of internal normalization and standard-sample-bracketing for accurate ⁸⁷Sr/⁸⁶Sr analysis  

Anastassiya Tchaikovsky, Simone Braeuer, Walter Pohl, and Stephan Hann

The strontium isotope ratio 87Sr/86Sr is a key tracer with wide-ranging applications in geochemistry, hydrology, paleoclimatology and migration research. To make sound interpretations of 87Sr/86Sr isotope ratios in the context of biogeosciences, researchers need high quality data. In this contribution, we critically evaluate the accuracy of two conceptually different analytical protocols for 87Sr/86Sr determination on the example of a large dataset (= 135) comprising biogenic and abiogenic materials.  

Water, soil extracts, and hydroxyapatites (tooth enamel) were prepared according to established procedures and analyzed by solution-based multi-collector inductively coupled plasma mass spectrometry (MC ICP-MS). For the calibration we used two protocols: internal normalization (also termed internal mass bias correction or internal calibration) and standard-sample-bracketing (external calibration). Isotope dilution mass spectrometry was not considered suitable, because this calibration approach becomes very time- and cost-intensive when applying to a large sample set.

Analysis of water, soil extracts and hydroxyapatites showed that the majority of 87Sr/86Sr isotope ratios which were determined by internal normalization shifted towards higher values in comparison to data determined by standard-sample-bracketing. Extensive evaluations ruled out sample preparation or measurement errors. Instead, internal normalization yielded biased data, because it is based on the assumption that all samples have the same 88Sr/86Sr isotope ratio, which can be used for normalization. However, in 90% of the investigated samples the 88Sr/86Sr significantly deviated from the assumed invariant value; in particular, the 88Sr/86Sr that is conventionally expressed as δ(88Sr/86Sr)SRM987 ranged from -1.01‰ to 0.20‰. As a consequence, internally normalized 87Sr/86Sr data biased by up to 0.00043, which was 2-times larger than previously predicted by theoretical calculations. These results demonstrate that the choice of calibration method has a much higher impact on the accuracy of 87Sr/86Sr isotope ratios than initially expected. The implication of these findings in biogeoscience applications will be discussed.

This project has received funding from the European Research Council (ERC) under the European Union's Horizon 2020 research and innovation programme (grant agreement n°856453 ERC-2019-SyG).

How to cite: Tchaikovsky, A., Braeuer, S., Pohl, W., and Hann, S.: Critical evaluation of internal normalization and standard-sample-bracketing for accurate ⁸⁷Sr/⁸⁶Sr analysis , EGU General Assembly 2026, Vienna, Austria, 3–8 May 2026, EGU26-5954, https://doi.org/10.5194/egusphere-egu26-5954, 2026.

EGU26-6598 | ECS | Orals | BG2.1

A novel method for simultaneous quantification and isotope analysis of labile soil carbon directly from liquid extracts 

Getachew Agmuas Adnew, Maria de Castro, and Per Lennart Ambus

Quantifying labile soil carbon (C) pools and their stable isotope composition (δ¹³C) is fundamental for elucidating microbially mediated C cycling, soil organic matter turnover, and isotope fractionation during biogeochemical transformations. Extractable C and microbial biomass C are commonly obtained using salt solutions (e.g., 0.25–0.5 M K₂SO₄); however, subsequent determination of C concentrations and isotope ratios typically requires labor-intensive sample preparation steps, including freeze-drying, oven-drying, or desalting by dialysis. These procedures are time-consuming and may result in substantial losses of dissolved organic C, potentially biasing isotopic signatures.

Here, we present a novel analytical method that enables the simultaneous determination of C concentrations and stable isotope composition (δ¹³C) directly from liquid 0.5 M K₂SO₄ soil extracts without any prior sample preparation. This approach allows direct quantification of extractable and microbial biomass C, substantially reducing sample handling and associated analytical uncertainty.

Method validation across contrasting soil types demonstrates high precision and reproducibility for both elemental concentrations and isotope ratios, while avoiding C losses associated with dialysis or concentration procedures. The method facilitates rapid, high-throughput analysis and enhances the temporal and mechanistic resolution of studies on microbial turnover, rhizosphere processes, and soil C dynamics.

Overall, this approach provides a robust new tool for biogeoscience research, enabling integrated assessments of labile C pools and their isotopic signatures and supporting improved process-based understanding of soil biogeochemical cycling.

How to cite: Adnew, G. A., de Castro, M., and Ambus, P. L.: A novel method for simultaneous quantification and isotope analysis of labile soil carbon directly from liquid extracts, EGU General Assembly 2026, Vienna, Austria, 3–8 May 2026, EGU26-6598, https://doi.org/10.5194/egusphere-egu26-6598, 2026.

EGU26-9004 | ECS | Posters on site | BG2.1

Tracing twilight zone organic carbon remineralization and paleoproductivity with particulate barium proxies: insights and limitations 

Yi Yuan, Songling Zhao, Zhouling Zhang, Martin Frank, and Zhimian Cao

The biological pump is a fundamental component of the oceanic carbon cycle, in which export production from the euphotic zone and subsequent organic carbon remineralization in the twilight zone jointly regulate carbon sequestration in the ocean interior. However, the magnitude, spatial variability, and tracers of these coupled processes remain incompletely understood. Here, we investigate the linkage between export production, twilight zone remineralization, and particulate barium in the western North Pacific (wNP) and the South China Sea (SCS). Organic carbon remineralization fluxes in the twilight zone (150-600 m) are quantified using a newly developed transfer function relating particulate excess barium (PBaxs) to oxygen utilization rates, revealing pronounced spatial heterogeneity, with PBaxs concentrations and remineralization fluxes increasing from the subtropical gyre to the North Pacific transition zone. Satellite-derived net primary production (NPP) and export production (EP) exhibit spatial patterns broadly consistent with the inferred remineralization fluxes, indicating a strong association between upper-ocean productivity and mesopelagic carbon degradation. Estimates of the e-ratio and r-ratio based on NPP, EP, and remineralization fluxes demonstrate contrasting biological pump efficiencies, with low e-ratios and high r-ratios in the subtropical gyre reflecting weak carbon sequestration, and high e-ratios and low r-ratios in the transition zone indicating a more efficient biological pump. We further evaluate the potential of particulate barium isotopes as tracers of EP by establishing a calibration between twilight zone particulate barium isotopic composition and euphotic-zone EP in the modern ocean, which reveals a significant negative relationship. However, this relationship does not persist in sedimentary archives: barium isotopic compositions show no systematic response to glacial-interglacial variations in paleoproductivity, and EP reconstructed using the modern calibration exhibits no correlation with sedimentary total organic carbon fluxes. Overall, this study provides an integrated assessment of the applicability and limitations of barium-based proxies from the water column to sediments, highlighting the tight association between Ba, export production, and twilight zone remineralization while emphasizing the challenges and limitations in extending modern barium-based proxies to reconstruct past biological pump dynamics.

How to cite: Yuan, Y., Zhao, S., Zhang, Z., Frank, M., and Cao, Z.: Tracing twilight zone organic carbon remineralization and paleoproductivity with particulate barium proxies: insights and limitations, EGU General Assembly 2026, Vienna, Austria, 3–8 May 2026, EGU26-9004, https://doi.org/10.5194/egusphere-egu26-9004, 2026.

EGU26-9124 | Orals | BG2.1

Plant carbon-use efficiency under warming: insights from a ¹³CO2 pulse-chase experiment 

Xiaoying Gong, Ziyi Yang, Qi Liu, and Lei Li

Carbon use efficiency (CUE), defined as the ratio of net primary production (NPP) to gross primary production (GPP), reflects the efficiency of carbon conversion into plant biomass after accounting for respiratory losses. As a key parameter in plant carbon budgeting and terrestrial carbon sequestration assessments, CUE is difficult to measure directly due to the challenges in quantifying gross CO₂ fixation and total respiration. Thus, many carbon cycle models rely on simplified empirical values (e.g., 0.5). Although climate warming may influence CUE due to the widely observed temperature‐sensitivity of respiration, the responses of CUE to warming remain unclear.

In this study, we grew wheat (T. aestivum) and upland rice (O. sativa) in controlled chambers under two temperatures: 25°C (control) and 29°C (+4°C warming). We took advantage of a gas exchange and 13C-labelling facility to estimate the gross photosynthetic rate of individual plants and trace the allocation of fixed carbon to shoot and root growth. A compartment model was fit to the data of tracer dynamic during the chase period to analyze the turnover features of carbon pools.

Both species exhibited physiological acclimation to warming: increased leaf‐level maximum carboxylation rate and specific leaf area, but decreased basal respiration rate. Consequently, whole‐plant CUE did not differ significantly between temperature treatments. ¹³C dynamics further revealed that warming did not alter the turnover rates of carbon pools supporting respiration and growth. These results indicate that +4°C warming did not affect CUE in wheat or upland rice, demonstrating a coordinated acclimation of photosynthesis and respiration to elevated temperature.

How to cite: Gong, X., Yang, Z., Liu, Q., and Li, L.: Plant carbon-use efficiency under warming: insights from a ¹³CO2 pulse-chase experiment, EGU General Assembly 2026, Vienna, Austria, 3–8 May 2026, EGU26-9124, https://doi.org/10.5194/egusphere-egu26-9124, 2026.

EGU26-10602 | Posters on site | BG2.1

Strontium isotopes as geological fingerprints in potatoes cultivated on ocean-island basalts  

Oscar Perdomo-Sosa, Beverley C. Coldwell, Eduardo Lodoso Ruíz, Sttefany Cartaya Arteaga, María Asensio Ramos, Gladys V. Melián, Pedro A. Hernández, and Nemesio M. Pérez

Food fraud related to the geographical origin of high-value agricultural products represents a persistent challenge in regions where local production coexists with large volumes of imported material. In the Canary Islands, potatoes constitute a culturally and economically important crop, with locally grown and traditional cultivars commanding substantially higher market prices than imported varieties, creating clear incentives for mislabelling. 

Strontium isotope ratios (⁸⁷Sr/⁸⁶Sr) represent a metal isotope system that directly links agricultural products to the geological and biogeochemical characteristics of their cultivation environment through soil–plant transfer processes. Applications to plant-based products grown under contrasting agronomic and water-management conditions demonstrate that geological substrates exert primary control on strontium isotopic signatures. Potatoes cultivated on Tenerife display tightly constrained ⁸⁷Sr/⁸⁶Sr ratios between ~0.7046 and ~0.7054, consistent with uptake from low-radiogenic ocean-island basalts characteristic of the island. 

These isotopic values are well separated from those typically associated with continental European agricultural regions and remain coherent across different potato cultivars, despite variability in strontium concentrations (≈410–710 ppb/g). Even within a single basaltic island, small but reproducible variations in ⁸⁷Sr/⁸⁶Sr are observed, reflecting local geological heterogeneity and soil development. 

The results highlight the suitability of strontium isotopes as a geology-driven fingerprint within terrestrial biogeoscience systems and demonstrate their potential for verifying the Canarian origin of potatoes. This approach provides a robust foundation for applied provenance studies and authenticity control in volcanic island agro-ecosystems. 

How to cite: Perdomo-Sosa, O., C. Coldwell, B., Lodoso Ruíz, E., Cartaya Arteaga, S., Asensio Ramos, M., V. Melián, G., A. Hernández, P., and M. Pérez, N.: Strontium isotopes as geological fingerprints in potatoes cultivated on ocean-island basalts , EGU General Assembly 2026, Vienna, Austria, 3–8 May 2026, EGU26-10602, https://doi.org/10.5194/egusphere-egu26-10602, 2026.

EGU26-10623 | ECS | Posters on site | BG2.1

Lignin Methoxyl δ¹³C Reveals Particle-Size–Dependent Sources and Degradation  in Forest Soils 

Terry Cox, Fatima mharchat, and Christine Alewell

Lignin is a major component of plant-derived organic matter in soils, and the stable carbon isotopic composition of lignin-derived methoxyl (δ 13C LMeO) groups provides a distinct molecular fingerprint for identifying sources and their relative contributions to soil organic matter. This study investigates δ 13C LMeO values in soil profiles from surface horizons to bedrock in  a deciduous and coniferous forest in Switzerland, with the aim of estimating the relative contributions of lignin from photosynthetic and non-photosynthetic plant tissues. Analyses were conducted on two particle-size fractions (<63 µm and 63–200 µm), and the influence of ¹³C isotopic fractionation during lignin degradation was evaluated for both size fractions.

Preliminary source apportionment results, not accounting for isotopic fractionation during degradation, indicate that the coarse fraction at the coniferous site is dominated by lignin derived from non-photosynthetic plant tissues, approaching a 100% contribution. In contrast, the fine fraction at the coniferous site and both particle-size fractions at the deciduous site comprise approximately 60% lignin from non-photosynthetic tissues.

In contrast to bulk δ¹³C and other compound-specific stable isotope tracers, δ 13C LMeO  values exhibited a systematic isotopic depletion in the fine (<63 µm) fraction. This depletion suggests preferential stabilization of the more easily degradable lignin from photosynthetic tissues. In the coarse (63–200 µm) fraction, δ 13C LMeO values showed a clear relationship with the extent of degradation, consistent with isotopic fractionation during lignin loss. In contrast, no systematic degradation-related trend was observed in the fine fraction. Together, these results highlight contrasting controls of degradation and stabilization on lignin across soil particle-size fractions and underscore the importance of accounting for isotopic fractionation when applying δ 13C LMeO for soil organic matter source attribution.

How to cite: Cox, T., mharchat, F., and Alewell, C.: Lignin Methoxyl δ¹³C Reveals Particle-Size–Dependent Sources and Degradation  in Forest Soils, EGU General Assembly 2026, Vienna, Austria, 3–8 May 2026, EGU26-10623, https://doi.org/10.5194/egusphere-egu26-10623, 2026.

EGU26-10665 | Orals | BG2.1

Comparing eddy covariance estimates of gross primary production to estimates from stem sap flux and phloem d13C across sites. 

John Marshall, Lasse Tarvainen, Antoine Vernay, Marko Stojanović, Zsofia Reka Stangl, and Tobias Rütting

Gross primary production (GPP) describes ecosystem-scale canopy photosynthesis and provides the foundation of the ecosystem carbon budget. It is often derived from eddy covariance data based on models of the component processes. At several sites in Sweden and the Czech Republic, we have quantitatively tested these GPP estimates against independent empirical data based on stem-scale measurements of xylem water flux and intrinsic water-use efficiency (iWUE), where iWUE is estimated from the stable isotope composition of phloem contents. With one exception, these comparisons have agreed well in the middle of the growing season. On the other hand, at several sites, the methods showed distinct discrepancies either at the beginning or the end of the growing season. We discuss possible causes of these seasonal discrepancies ,including the decoupling of phloem contents from gas-exchange, the scaling of sap flux, mesophyll conductance, decoupling of air masses above and below the canopy, and the inference of GPP from eddy covariance data. Quantitative tests of these methods against independent data will be critical as our need to quantify carbon sources and sinks continues to grow.

How to cite: Marshall, J., Tarvainen, L., Vernay, A., Stojanović, M., Stangl, Z. R., and Rütting, T.: Comparing eddy covariance estimates of gross primary production to estimates from stem sap flux and phloem d13C across sites., EGU General Assembly 2026, Vienna, Austria, 3–8 May 2026, EGU26-10665, https://doi.org/10.5194/egusphere-egu26-10665, 2026.

EGU26-11165 | ECS | Orals | BG2.1 | Highlight

The Geologic Super-Cycle of Chilean Nitrate Deposition 

Camila J. Riffo Contreras, Guillermo Chong, Swea Klipsch, Michael E. Böttcher, Amelia Davies, and Michael Staubwasser

The Atacama Desert contains the largest natural nitrate accumulations on Earth. Yet, the processes controlling their formation and redistribution remain debated, particularly for nitrate veins hosted in bedrock. In this study, we combine field observations with chemical and stable isotope analyses (δ18O, Δ17O, δ15N) of nitrate from all major deposit types across the Atacama nitrate provinces. All nitrate occurrences display large positive Δ17O values (+13 to +22‰) and elevated δ18O (+43 to +65‰), confirming a unanimous atmospheric origin via ozone-driven photochemical oxidation of NOx.

Vein-hosted nitrates in volcanic and sedimentary rocks show suppressed Δ17O and δ18O values trending toward fossil hydrothermal waters, indicating partial oxygen isotope exchange during interaction with hot, saline, acidic fluids. Field relationships, fault-controlled mineralization, rhyolitic exsolution textures, and sulfate sulfur isotopes independently confirm hydrothermal dissolution, transport, and reprecipitation of originally atmospheric nitrate.

These results define a two-stage geological cycle: long-term atmospheric deposition, groundwater transport, and evaporative concentration under hyperaridity, followed by tectonically driven hydrothermal recycling linked to Andean magmatism. This two-mechanism framework reconciles the isotopic, mineralogical, and spatial diversity of nitrate deposits, demonstrating that the Atacama Desert records a coupled atmospheric–hydrothermal cycle linked to the tectonic and magmatic evolution of the central Andean margin, and providing a template for other nitrate-bearing deserts on Earth and potentially on other planets.

Nitrate deposit δ15N = −8 to +4‰ are slightly higher than in atmospheric nitrate and overlap with the Atacama soil nitrate profile compositions, but in contrast show a positive correlation with δ18O. This excludes humidity driven microbial denitrification and gaseous N loss as a major driver for local secondary composition contrasts.

How to cite: Riffo Contreras, C. J., Chong, G., Klipsch, S., E. Böttcher, M., Davies, A., and Staubwasser, M.: The Geologic Super-Cycle of Chilean Nitrate Deposition, EGU General Assembly 2026, Vienna, Austria, 3–8 May 2026, EGU26-11165, https://doi.org/10.5194/egusphere-egu26-11165, 2026.

EGU26-11252 | Posters on site | BG2.1

Fully integrated TOC and TNb analysis of estuarine and sea water samples with the Elementar iso TOC cube®  

Mike Seed, Calum Preece, Toby Boocock, and Marian De Reuss

Identifying and quantifying the processes that control the carbon and nitrogen cycling in aquatic systems is important for mitigating urban and agricultural pollution, optimizing environmental policy and understanding global nutrient cycles. The isotopic analysis of dissolved organic carbon (TOC) and total bound nitrogen (TNb) are particularly important to elucidate the different sources, track nutrient cycling processes and help contamination identification.  

Here, we present the δ13C performance of the Elementar iso TOC® cube for <5 mg/L carbon TOC concentrations in estuarine river water samples, highlighting a salinity gradient from 2g/L to 25g/L. We also present determination of TOC concentration and δ13C TOC in seawater, demonstrating the performance of the iso TOC® cube for the analysis of seawater samples.  

The iso TOC cube® elemental analyser has been developed for fully integrated TOC/TNb isotope ratio analysis. Optimised for precise measurements of TC, TOC, TIC and TNb isotope ratios covering a wide range of applications areas. All types of liquids from drinking water, industrial wastewater, soil leachates, or marine samples are determined reliably and with the highest isotopic precision. 

How to cite: Seed, M., Preece, C., Boocock, T., and De Reuss, M.: Fully integrated TOC and TNb analysis of estuarine and sea water samples with the Elementar iso TOC cube® , EGU General Assembly 2026, Vienna, Austria, 3–8 May 2026, EGU26-11252, https://doi.org/10.5194/egusphere-egu26-11252, 2026.

Volcanic hydrocarbon reservoirs are distributed across more than 40 basins in 13 countries globally. In recent years, significant exploration prospects have been identified in Mesozoic volcanic strata within China’s offshore basins, including the Bohai Bay, East China Sea, Pearl River Mouth, and Qiongdongnan basins. The study of volcanic reservoirs remains a frontier topic in petroleum geology. Characterized by strong heterogeneity resulting from the superposition of multiple diagenetic processes and subsequent reformation, these reservoirs pose significant challenges for favorable reservoir prediction. Furthermore, the pronounced intra-volcanic heterogeneity leads to significant variations in hydrocarbon properties within single volcanic edifices, complicating the determination of hydrocarbon sources and the reconstruction of accumulation histories.Taking the BZ8S-A area in the Bozhong Sag of the Bohai Bay Basin as a case study, this research addresses these challenges. The study area is currently drilled by four exploration wells, revealing distinct variations in hydrocarbon composition, reservoir temperature and pressure, gas-oil ratios (GOR), and hydrocarbon column heights. Notably, two of these wells have tested high-yield oil and gas flows. To delineate the hydrocarbon accumulation process, a comprehensive multi-disciplinary approach was adopted, integrating geological background analysis, source rock distribution, hydrocarbon generation evolution in adjacent sags, and seismic interpretation.Advanced geochemical analyses were employed, including compound-specific carbon isotope analysis of oil and gas, monomeric hydrocarbon carbon isotopes, and organic matter stable carbon isotopes. These were combined with biomarker analysis (saturated hydrocarbons, aromatics, and adamantanes) and numerical simulation of hydrocarbon migration pathways. By establishing carbon isotopic cross-plots for source rocks at different stratigraphic levels in the hydrocarbon-generating sags and comparing them with typical generated hydrocarbon samples, the study conclusively determines that the hydrocarbons in the BZ8S-A volcanic reservoir are primarily sourced from the Shahejie Formation. Moreover, the geochemical evidence indicates that hydrocarbons in different well locations originated from distinct hydrocarbon-generating sags, revealing a complex, multi-source charging model for this volcanic reservoir.

How to cite: Shiyang, Z. and Qi, W.: Tracing Multi-Source Mixing in Volcanic Reservoirs Using Biomarkers and Carbon Isotopes: A Case Study of the Bozhong Sag, Bohai Bay Basin, EGU General Assembly 2026, Vienna, Austria, 3–8 May 2026, EGU26-11279, https://doi.org/10.5194/egusphere-egu26-11279, 2026.

EGU26-13059 | Orals | BG2.1

Isotopic fingerprint of heterotrophic nitrification by Alcaligenes faecalis 

Claudia Frey, Wouter B. Lenferink, Maartje A.H.J. von Kessel, Paul M. Magyar, Mike S.M. Jetten, Moritz F. Lehmann, and Sebastian Lücker

The discovery of heterotrophic nitrification has expanded our view of nitrification beyond the canonical chemolithoautotrophs. Yet, the role of heterotrophic bacteria in nitrification across environmental and engineered systems remains unclear, partly due to limited physiological characterization and the absence of robust diagnostic tools. The analysis of nitrogen (N) isotope fractionation effects has been used for tracing biogeochemical N cycle processes and offers the potential to resolve underlying biochemical pathways. While autotrophic nitrification is known to generate substantial N isotope effects during ammonia (NH₃) oxidation to nitrite (NO₂⁻), comparable constraints for heterotrophic nitrifiers are lacking. Here, we report for the first time the N isotope effects associated with heterotrophic nitrification by Alcaligenes faecalis, an organism capable of converting NH₃ into several nitrogenous products. In batch incubations with 2.2 mM ammonium (NH₄⁺) as the sole N source, A. faecalis produced up to 0.67 ± 0.04 mM NH₂OH, 0.11 ± 0.01 mM NO₂⁻, and 12 ± 1.2 µM N₂O, while the remaining NH₄⁺ was assimilated into biomass. Therefore, the main NH4+consumption pathway of A. faecalis is, in fact, best described by ammonium assimilation, which supports previous findings. Total NH₄⁺ consumption showed an isotope effect of 13.8 ± 0.4‰, exceeding that of biomass formation (4.8 ± 0.2‰). Both values fall within the known range for bacterial NH₄⁺ assimilation, but the disparity suggests additional fractionating steps beyond assimilation alone. NH₂OH, NO₂⁻, and N₂O were initially strongly ¹⁵N-depleted relative to the NH₄⁺ source, and became progressively enriched as NH₄⁺ was consumed. N₂O exhibited a variable site preference (24–38‰), indicating contributions from at least two production pathways. Overall, our findings show that heterotrophic nitrification produces N-isotopic signatures fundamentally distinct from canonical ammonia oxidation. These characteristic patterns in both NH₄⁺ and NO₂⁻ pools highlight the diagnostic potential of stable isotopes for identifying heterotrophic nitrification in complex systems.

How to cite: Frey, C., Lenferink, W. B., von Kessel, M. A. H. J., Magyar, P. M., Jetten, M. S. M., Lehmann, M. F., and Lücker, S.: Isotopic fingerprint of heterotrophic nitrification by Alcaligenes faecalis, EGU General Assembly 2026, Vienna, Austria, 3–8 May 2026, EGU26-13059, https://doi.org/10.5194/egusphere-egu26-13059, 2026.

EGU26-14109 | Orals | BG2.1

Simple, Fast, and Highly Precise δ¹³C and δ²H Analysis of Organics via Dual Picarro CRDS Integration 

Jan Wozniak, Sohom Roy, Magdalena E. G. Hofmann, Joyeeta Bhattacharya, and Tina Hemenway

Stable isotope analysis of organic materials is essential in environmental, geochemical, and food authenticity research, offering insights into carbon sources and product origins. Traditional Picarro Combustion Module–Cavity Ring-Down Spectroscopy (CM-CRDS) systems provide reliable, cost-effective δ¹³C analysis; furthermore, enabling simultaneous δ²H measurement greatly expands their utility for many applications.

We present a straightforward extension of the CM-CRDS system, integrating two dedicated analyzers: the Picarro G2201-i for δ¹³C and the Picarro L2130-i for δ²H. Key modifications include removing the water trap, heating the transfer tubing, and adding a heated buffer volume, enabling direct isotopic analysis of water vapor alongside carbon dioxide. This setup maintains the original sample delivery for carbon isotope analysis, while a simple software adjustment allows precise peak integration for hydrogen isotopes.

Performance was validated using a range of international standards representing diverse organic materials: USGS88 (marine collagen), USGS89 (porcine collagen), USGS90 (millet flour), USGS91 (rice flour), and IAEA CH7 (polyethylene foil). The system demonstrated excellent δ²H linearity (with slopes of 1.040, 1.074 and 1.017 on three separate days and R² values exceeding 0.99) while maintaining the high accuracy of δ¹³C measurements. Precision was assessed with hexamethylenetetramine (HMT), yielding a δ²H standard deviation of 0.26‰ and δ¹³C of 0.04‰ over 50 replicates. We chose HMT to determine the precision because it does not exchange hydrogen isotopes during storage and analysis and is used to determine the carbon-bound non-exchangeable hydrogen in fructose and glucose in honey [1]. Calibration procedures and best practices for hydrogen isotope analysis are discussed.

Our findings highlight the potential of combining the G2201-i and L2130-i analyzers with a CM in a coordinated analytical workflow for dual isotope analysis. This methodology opens new opportunities for isotope studies for environmental as well as food authenticity and food origin studies, and is a low-cost, easy to use alternative to IRMS analysis.

Reference

[1] Li et al., 2024, A new approach to detecting sugar syrup addition to honey: Stable isotope analysis of hexamethylenetetramine synthesised from honey monosaccharides (fructose and glucose). Food Chemistry 434.

How to cite: Wozniak, J., Roy, S., Hofmann, M. E. G., Bhattacharya, J., and Hemenway, T.: Simple, Fast, and Highly Precise δ¹³C and δ²H Analysis of Organics via Dual Picarro CRDS Integration, EGU General Assembly 2026, Vienna, Austria, 3–8 May 2026, EGU26-14109, https://doi.org/10.5194/egusphere-egu26-14109, 2026.

EGU26-14217 | Posters on site | BG2.1

Seaweed is a sink for isotopically light molybdenum in temperate coastal environments 

Michael Ernst Böttcher, Vera Winde, Nadja Neubert, Patricia Roeser, and Thomas F. Nägler

The content and stable isotopic (98Mo/95Mo) composition of bladder wrack (Fucus vesiculosus) were investigated for their potential as a sink for dissolved molybdate in coastal environments. The macrophytes were grown in mesocosms fed with brackish coastal waters from a temperate coastal bay (Kiel Bight) under ambient conditions of simulated environmental stress, e.g., enhanced temperature and/or CO2 partial pressure. Conditions were set up to simulate possible future climate change scenarios applying a delta-approach. Dissolved molybdate in brackish Baltic seawater was isotopically found to be close to the open North Sea, with a slight trend towards isotopically more negative values with decreasing salinity. This is in-line with a fresh water contribution originating from weathered minerals in the catchment area. It was found that the organic tissue of Fucus vesiculosus was substantially enriched in 95Mo compared to dissolved seawater molybdate by up to -1.5 mU. Isotope fractionation was slightly enhanced by increasing temperature but no effect was observed for the other or combined treatments. Seasonal effects in the contents and isotope signatures of the tissue were observed with diminished incorporation of Mo during summer time and an associated lowered isotope signature. No clear trend in the fractionation of the different Mo isotopes can be predicted for different complex climate change scenarios, considering an increase in carbon dioxide partial pressure, in combination with temperature. Mainly temperature seems to impact Mo incorporation and associated isotope signature. A mass balance approach indicates, that the impact of Fucus growth on the total Mo budget in the coastal bight is small due to a continuous water exchange. The results for Mo in seaweed are compared to other trace elements and stable isotope signatures (C, N, S) incorporated into the tissue, too. The results from the present study demonstrate the potential of seaweed to act as an environmental multi-element biomonitor.

How to cite: Böttcher, M. E., Winde, V., Neubert, N., Roeser, P., and Nägler, T. F.: Seaweed is a sink for isotopically light molybdenum in temperate coastal environments, EGU General Assembly 2026, Vienna, Austria, 3–8 May 2026, EGU26-14217, https://doi.org/10.5194/egusphere-egu26-14217, 2026.

EGU26-14259 | Orals | BG2.1

Stable silicon isotopes as tracers of Arctic sea ice–ocean macronutrient cycling 

Georgi Laukert, Katharine Hendry, and Tristan J. Horner

Stable silicon isotopes have emerged as powerful tracers of marine biogeochemical processes, yet their application in high-latitude environments remains comparatively underexplored. Here we synthesize silicon isotope observations from the Eurasian Arctic Ocean to show how isotope patterns help disentangle physical transport, including open-ocean circulation, shelf–basin exchange, and river influence, from biological utilization across ice-covered and seasonally ice-free regimes. Using published case studies from the Siberian shelves and the Transpolar Drift, we illustrate how Si isotope signatures resolve coupled physical and biogeochemical controls on nutrient pathways. We then outline key methodological challenges for extending Si isotope work into sea ice, including defining open versus closed brine habitats, linking isotope signals to brine-network connectivity, and avoiding sampling artifacts that integrate unknown source volumes. Finally, we discuss how ongoing Arctic observing efforts, including large international campaigns, open new avenues for applying Si isotope techniques to questions of nutrient availability, ecosystem change, and ice–ocean coupling in a rapidly transforming Arctic system.

How to cite: Laukert, G., Hendry, K., and Horner, T. J.: Stable silicon isotopes as tracers of Arctic sea ice–ocean macronutrient cycling, EGU General Assembly 2026, Vienna, Austria, 3–8 May 2026, EGU26-14259, https://doi.org/10.5194/egusphere-egu26-14259, 2026.

EGU26-14404 | Orals | BG2.1

Stable isotopes in tree rings reveal the role of genetics and phenotypic plasticity in shaping water-use strategies of sessile oak across Europe 

Elisabet Martínez-Sancho, Yann Vitasse, Kerstin Treydte, Matthias Saurer, Marçal Argelich Ninot, Marta Benito-Garzón, Christof Bigler, Patrick Fonti, José Carlos Miranda, Aksel Pålsson, Anne Verstege, and Christian Rellstab

Quantifying the relative contributions of evolutionary mechanisms to tree water-use strategies is critical for predicting species’ responses to climate change and supporting forest management strategies. Common garden experiments can explicitly address the contributions of genetics and plasticity in physiological-related traits. However, these experiments typically focus on young trees, and long-term physiological measurements from common garden experiments are largely lacking. Stable isotope analysis of tree rings bridges this gap by enabling the reconstruction of long-term water-use strategies of mature trees growing in long-term common garden experiments.

In this study, we investigate the evolutionary mechanisms underlying long-term water-use strategies in Quercus petraea across its distribution range by analysing annually-resolved stable isotope ratios (δ¹³C, δ¹⁸O, δ²H) from tree-ring cellulose. We sampled 234 individuals originating from nine provenances grown in four European common gardens (Denmark, France, Poland, and the United Kingdom). For the period 2012–2021, we derived annual carbon isotope discrimination (∆¹³C), intrinsic water-use efficiency (iWUE), and isotopic enrichment relative to precipitation (∆¹⁸O and ∆²H). Linear mixed-effects models were used to quantify the contributions of genetic variation, phenotypic plasticity, and its interaction (i.e. genetically-based plasticity) to variation in iWUE, ∆¹⁸O, and ∆²H. The dual-isotope approach (δ¹³C and ∆¹⁸O) was applied to investigate the provenance-specific adjustments in photosynthetic rate and stomatal conductance across sites.

Our results revealed significant genetic and genetically-based plasticity effects on all isotope ratios whereas phenotypic plasticity had a significant effect only on ∆²H. ∆¹⁸O and ∆²H exhibited distinct patterns related to genetics and phenotypic plasticity effects. Notably, ∆²H variability across sites exceeded provenance-level variation. These results could be indirectly related to the link of ∆²H to primary C metabolism. The dual-isotope analysis (δ¹³C and ∆¹⁸O) further identified adjustments in stomatal conductance as the main plastic response to contrasting environments. The provenance with the least plasticity (originally from the United Kingdom) also showed reductions in photosynthetic rates, indicating a limited capacity to adjust to contrasting environments. Overall, these findings highlight strong genetic and plastic control in water-use traits and demonstrate the potential of stable isotopes in tree rings to unravel evolutionary mechanisms in tree water-use strategies.

How to cite: Martínez-Sancho, E., Vitasse, Y., Treydte, K., Saurer, M., Argelich Ninot, M., Benito-Garzón, M., Bigler, C., Fonti, P., Miranda, J. C., Pålsson, A., Verstege, A., and Rellstab, C.: Stable isotopes in tree rings reveal the role of genetics and phenotypic plasticity in shaping water-use strategies of sessile oak across Europe, EGU General Assembly 2026, Vienna, Austria, 3–8 May 2026, EGU26-14404, https://doi.org/10.5194/egusphere-egu26-14404, 2026.

EGU26-15347 | Orals | BG2.1

Gallium isotopes in silicified microbial hot spring deposits: a potential geochemical biosignature 

Michael C. Rowe, Tak Kunihiro, Ryoji Tanaka, Nghiem V. Dao, Tsutomu Ota, Kathleen A. Campbell, Steven W. Ruff, Ema E. Nersezova, Dominique Stallard, Barbara Lyon, and Andrew Langendam

Non-traditional trace metals are increasingly utilized to evaluate potential microbial processes in the search for evidence of ancient life. Recent investigations of modern terrestrial hot spring silica deposits (sinter), as analogs for early life on Earth or Mars (e.g. Homeplate, Gusev crater), have highlighted unique gallium enrichments associated with silicified microbial filaments and microbially mediated rock textures, such as stromatolites. We used new analytical methodologies for in situ and bulk analysis of gallium isotopes in sinter to better understand the observed Ga enrichment. In situ analysis, by Cameca 1280 ion probe, provides the necessary spatial resolution to target individual microbial filaments with a 10 μm ion beam, but with a lesser precision of ~±3 ‰, compared to the ±0.06 ‰ precision via MC-ICPMS bulk analysis. In situ results indicate heterogeneity of δ71Ga (>10 ‰ variation overall) with silicified microbial filaments on average isotopically lighter than adjacent silica.  Multiple processes may influence the Ga isotopic ratio in sinter including preferential microbial selection, changes in fluid chemistry, and silicification processes. Ongoing experiments on Ga-Si spiked microbial growth and abiotic silica precipitation may further elucidate the cause of isotopic variability as we continue to refine this in situ isotopic methodology and its utility in planetary biosignature detection.

How to cite: Rowe, M. C., Kunihiro, T., Tanaka, R., Dao, N. V., Ota, T., Campbell, K. A., Ruff, S. W., Nersezova, E. E., Stallard, D., Lyon, B., and Langendam, A.: Gallium isotopes in silicified microbial hot spring deposits: a potential geochemical biosignature, EGU General Assembly 2026, Vienna, Austria, 3–8 May 2026, EGU26-15347, https://doi.org/10.5194/egusphere-egu26-15347, 2026.

EGU26-15473 | ECS | Posters on site | BG2.1

Humidity Signal Recorded in δ¹³C of Pine Resin and Leaves in Southwestern China 

Yu Tang, Jiangpeng Cui, Katja T. Rinne-Garmston, and Shilong Piao

Stable carbon isotope compositions (δ13C) in plant materials are an important tool to study variations in the environment that plants live in. δ13C in resin has been less explored than in other extensively studied materials, e.g. tree rings, leaves and n-alkanes, with its temporal and spatial variability poorly quantified. Here, we sampled resin from the breast-height stem and leaves at the lower canopy across 80 pine forest plots in Southwestern China (~ 800,000 km2), and examined the climatic signal recorded in δ13C in resin and leaves. Our results show a clear humidity signal (e.g. precipitation and aridity index) recorded in resin δ13C, much stronger than that preserved in leaf δ13C. The climatic signal was strongest when averaged over the previous two growing seasons, suggesting an average turnover time of two years in the stem resin pool. Our results highlight that resin δ13C is a promising indicator for spatial variability in climatic signals, so resin can serve as a practical alternative to leaves for δ13C-based studies.

How to cite: Tang, Y., Cui, J., Rinne-Garmston, K. T., and Piao, S.: Humidity Signal Recorded in δ¹³C of Pine Resin and Leaves in Southwestern China, EGU General Assembly 2026, Vienna, Austria, 3–8 May 2026, EGU26-15473, https://doi.org/10.5194/egusphere-egu26-15473, 2026.

EGU26-15760 | Orals | BG2.1

Sub-continental patterns of carbon-isotope discrimination across Australia in relation to precipitation and soil nutrients 

Lucas Cernusak, Iftakharul Alam, Graham Farquhar, Thomas Givnish, Martin De Kauwe, Ernst-Detlef Schulze, Andrea Westerband, Ian Wright, and Alexander Cheesman

Carbon isotope ratios of C3 plants can been used to infer intrinsic water-use efficiency. Several transects have been established across Australia to study the sensitivity of intrinsic-water use efficiency to mean annual precipitation. These investigations showed a surprising divergence in the sensitivity of carbon-isotope discrimination to mean annual precipitation among sub-continental regions. Here, we combine previous observations with measurements along a new transect in northeastern Australia to show that such sub-continental scale sensitivity in the response of intrinsic water-use efficiency to precipitation depends on regional-scale soil phosphorus concentrations. The influence of soil phosphorus appears to operate through modulation of stomatal conductance, rather than, or in addition to, photosynthetic capacity. We hypothesize that Australian woody plant species have evolved to use high transpiration rates to facilitate phosphorus foraging in phosphorus-impoverished, ancient soils. Our analyses suggest that this strategy interacts with the well know strategy of increasing intrinsic water-use efficiency in response to decreasing mean annual precipitation.

How to cite: Cernusak, L., Alam, I., Farquhar, G., Givnish, T., De Kauwe, M., Schulze, E.-D., Westerband, A., Wright, I., and Cheesman, A.: Sub-continental patterns of carbon-isotope discrimination across Australia in relation to precipitation and soil nutrients, EGU General Assembly 2026, Vienna, Austria, 3–8 May 2026, EGU26-15760, https://doi.org/10.5194/egusphere-egu26-15760, 2026.

EGU26-20124 | ECS | Posters on site | BG2.1

In situ δ13C analysis of <1mm thick annual growth rings in archaeological wood samples via LA IRMS 

Hanne Marie Ellegaard Larsen, Ciprian Cosmin Stremtan, Cristina Montana Puscas, and Jesper Olsen

Archaeological wood holds value not only as a source of information on how people used to live centuries or millennia ago, it is also a valuable proxy for reconstructing past climatic and environmental changes. When the sample amount available for destructive analytical methods is limited it forces the research team to judiciously prioritize what information to extract and which method to use. When it comes to light stable isotope analyses, the most widely used instrumentation requires rather intensive manual sample preparation and the prepared sample cannot be recuperated after analyses.

The elemental analyzer is currently the go-to sample introduction peripheral for stable isotope analyses of tree rings, but as any analytical method it has its draw-backs and limitations. A key limitation is that each growth ring must be individually separated mechanically and prepared for analysis; this challenge can be managed with sufficient time and manpower. However, very narrow growth rings (<1mm) are a clear limiting factor when each ring needs to be manually removed or when multiple analysis are required for each growth ring. Both issues can easily be circumvented by using a laser ablation (LA) module as sample introduction peripheral. Core segments or wood slices of up to 4.5 cm length can be analyzed in situ (including duplicates and triplicates) without further preparation. For archaeological wood, this method has the added benefits of being minimally invasive, the ablation tracks being practically invisible, and circumventing the need to sacrifice a portion of the artifact for analyses.

Our case study is a fragment of oak wood (Quercus sp.) provided by the National Museum of Denmark. The wood originates from construction timber found during an archaeological excavation of wells located near The Wadden Sea in south-west Denmark. The whole sample contains 199 growth rings and has been dendrochronologically dated to AD 407-605, covering the mid-sixth century where a global climate crisis caused a longer period of cold and wet growth seasons; this is also expressed in archaeological wood by the formation of extremely narrow growth rings. Because of growth ring widths down to 0.49 mm, it is challenging to separate and prepare wood material from each ring for stable isotope analyses using the traditional EA IRMS method.

Our LA IRMS setup comprises the isoScell Δ100 sample chamber (Terra Analitic), LSX 213 G2+ (Teledyne Photon Machines), CryoPrep and HS2022 IRMS (both Sercon). For δ13C a spatial resolution of 60μm is easily achievable, with precision on the QC of 0.08 ‰. Mean δ13C on the analyzed segment is -24.17 ‰ v. VPDB. The dataset is also in acordance with data from wider rings that could be analyzed via EA IRMS.

How to cite: Ellegaard Larsen, H. M., Stremtan, C. C., Puscas, C. M., and Olsen, J.: In situ δ13C analysis of <1mm thick annual growth rings in archaeological wood samples via LA IRMS, EGU General Assembly 2026, Vienna, Austria, 3–8 May 2026, EGU26-20124, https://doi.org/10.5194/egusphere-egu26-20124, 2026.

EGU26-20589 | Orals | BG2.1

Mercury and selenium stable isotopes across contrasting food webs: marine insights, amazon priorities 

Zoyne Pedrero Zayas, Claudia Marchan Moreno, Silvia Queipo Abad, Gabriel Neves, Fernando Barbosa Jr., Warren Corns, Yves Cherel, Paco Bustamante, David Amouroux, Pascale Louvat, and Maite Bueno

Stable isotope approaches are rapidly transforming how we investigate trace-element cycling in living systems, offering information that goes far beyond concentration measurements. Mercury (Hg) stable isotopes, in particular, have proven highly informative across a broad range of environments, and marine studies have highlighted their value for disentangling sources and in vivo processing. Studies on apex marine predators (e.g., seabirds) show that Hg isotopes can track internal processing and trophic transfer. In contrast, selenium (Se) isotopic characterization in biota, more specifically in animals, is still limited and technically challenging, but it opens promising perspectives, especially given Se’s recognized antagonistic role in Hg toxicity.

Key gaps persist in the Brazilian Amazon, where complex Hg (and Se) exposure scenarios call for higher-resolution tracers. Translating Hg and Se isotope approaches to Amazonian freshwater systems, from fish to riverside populations, may clarify bioaccumulation pathways and fate. Recent progress achieved in marine organisms, including compound-specific strategies, will be presented, together with the main analytical challenges and opportunities for extending these approaches to the Amazon.

How to cite: Pedrero Zayas, Z., Marchan Moreno, C., Queipo Abad, S., Neves, G., Barbosa Jr., F., Corns, W., Cherel, Y., Bustamante, P., Amouroux, D., Louvat, P., and Bueno, M.: Mercury and selenium stable isotopes across contrasting food webs: marine insights, amazon priorities, EGU General Assembly 2026, Vienna, Austria, 3–8 May 2026, EGU26-20589, https://doi.org/10.5194/egusphere-egu26-20589, 2026.

EGU26-20811 | ECS | Posters on site | BG2.1

Cd isotopes under extreme euxinia: Tracing productivity and redox in palaeo-oceans 

Sophie Gangl, Claudine Stirling, Don Porcelli, Matt Druce, and Malcolm Reid

Cadmium (Cd) exhibits nutrient-type behaviour in the modern ocean and its isotope system has emerged as a promising tracer of primary productivity and carbon burial. Phytoplankton preferentially assimilate lighter Cd isotopes across a wide range of oceanic conditions, leaving surface waters comparatively enriched in heavier isotopes. This biologically-driven fractionation underlies the application of Cd-isotope ratios as a tracer for nutrient availability and the intensity of primary productivity in both modern marine settings and  palaeo-oceans. However, Cd-isotope systematics are also strongly influenced by redox conditions, specifically through the formation and removal of isotopically light Cd sulphides under euxinic conditions. The extent to which sedimentary Cd-isotope signatures faithfully record overlying water-colum processes under such conditions remains poorly constrained.

Here we present new Cd-isotope data from both the water column and sediments of Framvaren Fjord in Norway, the most intensely reducing modern marine basin. Framvaren Fjord serves as a modern analogue for strongly euxinic marine conditions that prevailed during extreme climate events throughout Earth’s history. Notably, the redoxline separating oxic from anoxic waters is uniquely located within the photic zone, in close proximity to the depth of maximum biological productivity. These data allow us to deconvolve Cd-isotope fractionation associated with biological uptake from that linked to Cd sulphide precipitation, and to shed light on how these processes are transferred to and preserved in the underlying sediment.

How to cite: Gangl, S., Stirling, C., Porcelli, D., Druce, M., and Reid, M.: Cd isotopes under extreme euxinia: Tracing productivity and redox in palaeo-oceans, EGU General Assembly 2026, Vienna, Austria, 3–8 May 2026, EGU26-20811, https://doi.org/10.5194/egusphere-egu26-20811, 2026.

EGU26-21521 | Posters on site | BG2.1

Hydrogen Isotope Dynamics in Macrocystis pyrifera: Implications for Compound-Specific Isotope Analyses 

Mohammad Ali Salik, Marc-Andre Cormier, Diana Steller, Marco Lehmann, Maya Al-Sid-Cheikh, and Patrick Gagnon

Marine macroalgae are central to coastal carbon cycling and represent a significant portion of global primary production and organic matter export. Giant kelp (Macrocystis pyrifera) forests, in particular, serve as major carbon sinks and influence regional nutrient dynamics. However, the isotopic and biochemical pathways that define these contributions remain poorly constrained. While hydrogen isotope (δ²H) analyses are widely utilised in terrestrial ecology to integrate environmental water signals and metabolic fractionation, their application in marine macroalgae, particularly at the compound-specific level, currently remains underutilised.

Our previous research demonstrated that δ²H values in the soluble sugars of M. pyrifera are highly sensitive to light intensity, which indicates a distinct metabolic imprint tied to photosynthetic carbohydrate supply. We have now expanded this investigation to include lipid biomarkers, specifically focusing on fatty acids (analysed as methyl derivatives) and sterols (analysed as acetate derivatives). Samples were collected across six kelp forest sites in Carmel Bay, California. Preliminary Gas Chromatography-Mass Spectrometry results from three fully processed sites show complex profiles of C12–C26 saturated and unsaturated fatty acids, alongside a range of cholest-, ergost-, and stigmast-based sterols. These molecular distributions vary systematically with site and depth, offering early evidence of biochemical partitioning between photosynthetic and post-photosynthetic pathways under varying natural light regimes.

This presentation will explore new compound-specific δ²H measurements performed on the aforementioned compounds. By doing so, we aim to determine whether δ²H signatures in fatty acids and sterols primarily track photosynthetic fractionation or are shaped by downstream metabolic adjustments. By synthesising isotopic and molecular data, we seek to disentangle external environmental drivers, such as light and water isotopic composition, from intrinsic biochemical controls on compound-specific δ²H values. Refining these relationships is vital for the development of robust δ²H-based paleoenvironmental proxies and for assessing the role of modern and ancient kelp forests as dynamic carbon sinks.

How to cite: Salik, M. A., Cormier, M.-A., Steller, D., Lehmann, M., Al-Sid-Cheikh, M., and Gagnon, P.: Hydrogen Isotope Dynamics in Macrocystis pyrifera: Implications for Compound-Specific Isotope Analyses, EGU General Assembly 2026, Vienna, Austria, 3–8 May 2026, EGU26-21521, https://doi.org/10.5194/egusphere-egu26-21521, 2026.

Research on the nitrogen (N) cycle in agricultural ecosystem is key to better understand and manage N nutrition of crops and N losses to the environment. Stable isotope tools have been extensively used to identify and quantify N pathways and processes, but suitable methods typically require sophisticated and expensive instrumentation which is not always available and is rarely suitable for in situ analysis. A quadrupole mass spectrometer (GAM200, InProcess, Bremen) was modified to study 15N enrichment in N species and N2 in water and air in the lab and in the field. To establish a membrane inlet mass spectrometer (MIMS) a silicone tubing inlet was added to enable online analysis of dissolved gases. Four applications were established:


  • The MIMS was used to analyze N2 and Ar in groundwater samples to determine excess-N2 from denitrification. In situ online analysis in the Fuhrberger Feld aquifer was conducted at multilevel groundwater monitoring wells, clearly identifying the steep rise in denitrification upon appearance of sulfides.
  • To study N2 production by denitrification the in situ 15N push pull method [1] was used, where 15N labelled NO3- solution is injected to groundwater and subsequently samples containing 15N labelled N2 are analyzed, in this study by the MIMS. This method was automated and tested in lab mesocosms [2].
  • An automated sample preparation unit for inorganic nitrogen (SPIN) was coupled to the MIMS for automated and sensitive determination of the 15N abundances and concentrations of nitrate, nitrite, and ammonium in aqueous solutions. It was based on the principle of the SPIN-MAS [3] but with the advantage to analyze samples online. It provides a wide dynamic range for all three N species for both isotope abundance and concentration measurements [4, 5]. We propose to use this method in conjunction with online sampling of dissolved N species in soil using dialysis membranes [6] which had not been performed until now to our knowledge.
  • The improved 15N gas flux method to measure N2 fluxes from soils under N2 depleted atmosphere has been applied int the field [7] but was complicated by the difficulty to maintain stable background concentrations [8]. A capillary inlet was added to the GAM 200 and used for in situ monitoring of background N2 concentrations in flux chambers.


We conclude the used quadrupole mass spectrometer has been proven as a versatile, economic and easy to use detector for a wide range of applications in N cycle research and is promising for future applications.


References:

  • Well, R. and D.D. Myrold, 1999. doi.org/10.1016/S0038-0717(99)00029-22.
  • Eschenbach, W. and R. Well DOI: 10.1002/rcm.5066
  • Stange, C.F. et al. ,2007 DOI: Doi 10.1080/10256010701550658
  • Eschenbach, W. 2018, DOI: 10.1021/acs.analchem.8b02956
  • Eschenbach, W. et al 2017 DOI: 10.1021/acs.analchem.7b00724
  • Inselsbacher, E., et al. 2011, doi.org/10.1016/j.soilbio.2011.03.003
  • Well, R., et al 2019 doi.org/10.1002/rcm.83638.
  • Eckei, J., et al., 2024. DOI: 10.1007/s00374-024-01806-z


How to cite: Dyckmans, J. and Well, R.: Using a quadrupole mass spectrometer as versatile detector to study N transformations and fluxes  in soils and aquatic systems, EGU General Assembly 2026, Vienna, Austria, 3–8 May 2026, EGU26-21873, https://doi.org/10.5194/egusphere-egu26-21873, 2026.

Climate-induced permafrost thaw unlocks large organic carbon stores. Permafrost rivers receive substantial terrestrial inputs of thawing organic carbon (OC) that is mostly degraded to photochemical and microbial respiratory carbon dioxide (CO2). Yet, there is little information on how photochemical and microbial processes combine to alter fluvial carbon dynamics, and ultimately, carbon budget in permafrost areas. Our results from permafrost rivers on the Qinghai-Tibet Plateau mechanistically describe that photodegradation, as a rate limiting and priming step, initiates ring cleavage reactions, rapidly reducing dissolved OC (DOC) molecular weight from aromatic to aliphatic compounds. This in turn resulted in alteration of riverine microbial communities, further converting photo-altered DOC to CO2. Strikingly, the combination of photochemical and microbial processes forms a synergistic interplay, expediting CO2 delivery to the atmosphere, of which 33 ± 10% is derived from millennial-aged permafrost carbon. Our findings highlight that strong solar radiation at high-altitude accelerates microbial CO2 production, and emission, from photo-altered permafrost DOC, contributing to the permafrost carbon feedback that intensifies warming.

How to cite: Zhang, L., Battin, T., and Karlsson, J.: Synergistic photochemical and microbial degradation of DOC enhance CO2 emissions from permafrost river on the Qinghai-Tibet Plateau, EGU General Assembly 2026, Vienna, Austria, 3–8 May 2026, EGU26-2275, https://doi.org/10.5194/egusphere-egu26-2275, 2026.

EGU26-3015 | ECS | Orals | BG4.1

Reservoir operation regulates the dynamics of dissolved organic matter in sediments 

Yingju Wu, Hongwei Fang, Lei Huang, Chen He, Quan Shi, Yuanbi Yi, Ding He, and Kai Wang

Dissolved organic matter (DOM) in sediments is pivotal in biogeochemical processes of aquatic ecosystems. Given the influence of reservoir operation on riverine ecosystems, the dynamics of DOM in reservoir sediments remain unclear. In this study, focusing on the Three Gorges Reservoir (TGR), one of the world’s largest reservoirs, we investigated the mechanisms underlying variations in sedimentary DOM using radiocarbon(Δ14C), optical, and molecular techniques. Furthermore, a DOM molecule–based numerical model was developed to assess the monthly and annual variations in sedimentary DOM from 2011 to 2080. Laboratory analysis demonstrated that there was more autochthonous DOM in sediments with a declining pattern from upstream to downstream in the wet season, and more allochthonous DOM in sediments with no spatial trend in the dry season. The findings suggested that variations of primary productivity and hydrological conditions influenced by reservoir operation likely modulated the dynamics of DOM in sediments of TGR. Moreover, based on the numerical simulation, from 2011 to 2080, July, April, and September hold major (>50%) of the year’s accumulation of allochthonous and autochthonous DOM in sediments. By 2080, the quantities of allochthonous and autochthonous DOM in sediments in TGR would reach 1166×104t and 129×104t, respectively. This study provides detailed insights into the dynamics of organic matter pools in reservoirs and enhances our understanding of the ecological impacts of reservoir construction on aquatic ecosystems.

How to cite: Wu, Y., Fang, H., Huang, L., He, C., Shi, Q., Yi, Y., He, D., and Wang, K.: Reservoir operation regulates the dynamics of dissolved organic matter in sediments, EGU General Assembly 2026, Vienna, Austria, 3–8 May 2026, EGU26-3015, https://doi.org/10.5194/egusphere-egu26-3015, 2026.

EGU26-3776 | ECS | Posters on site | BG4.1

Phosphorus cycling and REE enrichment in pelagic clay: Insights from a coupled Nd–P mass-balance approach 

Ryosuke Matsunami, Kazutaka Yasukawa, Kentaro Nakamura, and Yasuhiro Kato

“REE-rich mud” has attracted attention as an unconventional resource for critical rare-earth elements (REE) used in green and high-tech industries [1]. It is a type of pelagic clay characterized by high REE (especially heavy REE) concentrations. In REE-rich mud, biogenic calcium phosphate (BCP; fish-bone apatite) plays a key role as a major host phase of REE, linking sedimentary REE enrichment to marine phosphorus (P) cycling and biological productivity [2]. Preliminary Nd–P one-box mass-balance analyses [3] suggested that fish-derived P burial may constitute an important component of total P burial in pelagic realms and that variability in P cycling may therefore be a major control on the conditions favorable for REE-rich mud formation. This motivates a reassessment that explicitly accounts for oceanographic processes which regulates nutrient supply and redistribution.

In this study, we develop a Nd–P mass-balance model that represents the ocean in a subdivided, coupled-reservoir framework to account for internal transport and redistribution. The framework tracks major P cycling and burial pathways, including burial associated with organic matter, authigenic phases (Ca-phosphate and Fe-bound P), and fish debris (BCP), together with neodymium (Nd) as a representative REE.

Using this framework, we aim to examine how redistribution of nutrients and Nd influences inferred BCP burial contributions and, by extension, the conditions favorable for REE-rich mud formation. We will conduct sensitivity and scenario experiments on internal transport and biological productivity within the ocean, and discuss implications for linking Earth-system processes to REE-rich mud genesis.

[1] Kato et al. (2011) Nat. Geosci. 4, 535–539. [2] Ohta et al. (2020) Sci. Rep. 10, 9896. [3] Matsunami et al. (2025) AGU Annual Meeting 2025, PP24B-08.

1: School of Engineering, Univ. of Tokyo, 2: ORCeNG, Chiba Institute of Technology

How to cite: Matsunami, R., Yasukawa, K., Nakamura, K., and Kato, Y.: Phosphorus cycling and REE enrichment in pelagic clay: Insights from a coupled Nd–P mass-balance approach, EGU General Assembly 2026, Vienna, Austria, 3–8 May 2026, EGU26-3776, https://doi.org/10.5194/egusphere-egu26-3776, 2026.

EGU26-4433 | Orals | BG4.1

Fe(II) Biogeochemistry in Coastal Waters 

J. Magdalena Santana-Casiano, Melchor González-Dávila, Aridane G. González, Adrián Bullón-Téllez, Victor Coussy, Irene Sánchez-Mendoza, and David González-Santana

Ocean acidification and warming modify iron (Fe) redox cycling by altering reaction kinetics, speciation, and complexation processes that control Fe bioavailability in coastal waters. These drivers arise from both anthropogenic CO₂ emissions and natural volcanic inputs, which coexist in the ocean and allow the investigation of Fe(II) oxidation under contrasting chemical regimes.

Within the FeRIA project (PID2021-123997NB-I00), Fe(II) oxidation dynamics were investigated at coastal sites influenced by volcanic CO₂ emissions (Fuencaliente and Tazacorte, La Palma) and at sites mainly affected by anthropogenic CO₂ (El Hierro and Gran Canaria). Although both systems experience reduced pH, volcanic environments introduce additional chemical species that influence Fe complexation and redox reactivity.

Fe(II) oxidation rates exhibited strong spatial variability and were controlled by the combined effects of physi-cochemical parameters (pH, temperature, salinity, dissolved oxygen) and organic ligands. Lower pH consistently decreased Fe(II) oxidation kinetics, favouring longer Fe(II) lifetimes, while increasing temperature enhanced oxidation rates. Dissolved and particulate organic matter exerted a key control through complexation, either stabilising Fe(II) and inhibiting oxidation or promoting electron transfer depending on ligand composition and functional groups.

These results highlight the kinetic balance between acidification, warming, and organic complexation in regulating Fe(II) persistence. They also assess whether volcanic CO₂–impacted marine systems capture the dominant kinetic and complexation processes controlling Fe(II) oxidation under future anthropogenic ocean acidification.

How to cite: Santana-Casiano, J. M., González-Dávila, M., González, A. G., Bullón-Téllez, A., Coussy, V., Sánchez-Mendoza, I., and González-Santana, D.: Fe(II) Biogeochemistry in Coastal Waters, EGU General Assembly 2026, Vienna, Austria, 3–8 May 2026, EGU26-4433, https://doi.org/10.5194/egusphere-egu26-4433, 2026.

EGU26-4469 | ECS | Posters on site | BG4.1

Iron-binding ligands in the coastal waters of La Palma affected by the Tajogaite volcanic eruption 

Victor Coussy, Aridane G. González, David González-Santana, Melchor Gonzalez-Davila, and J. Magdalena Santana-Casiano

The 2021 eruption of Tajogaite volcano (La Palma, Canary Island) significantly altered the nearby coastal environment and chemistry through the formation of lava delta. Despite the importance of metal speciation for the ecosystems, our knowledge of Fe-organic speciation and the input of lava associated with the lava deltas formation in its biogeochemical cycle remains limited. This study explores the impact of the Tajogaite eruption on the Fe speciation by measuring the labile Fe-binding ligands (LFe) and their conditional stability constants (log KcondFe’L).

Before, during and after the volcano eruption, 10 stations were monitored and analyzed by competitive ligand exchange-adsorptive cathodic stripping voltammetry (CLE-ACSV) method, using TAC as a competitive ligand. To determine the optimal experimental conditions for comparing the different environments along the sampling years, different detection windows were employed (2, 5 and 10 µM TAC). The LFe concentrations ranged between 2.32 and 12.38 nM, with a maximum recorded in February 2023 near the southern lava delta (station 5, 28.616ºN, 12.38 nM). Other high concentrations were found from April to September 2024 at northern stations near to the other lava delta (28.624ºN, 11.20 nM). The minimum LFe concentration was observed at offshore station (station 10, 17.932ºW, 28.599ºN, 2.32 nM).

The observed log KcondFe’L were between 9.33 and 10.73 under the studied conditions and correspond to weak ligands (L2-type) such as humic substances or polyphenols. The results show clear spatial and temporal variability, with significantly higher ligand concentration near lava deltas, suggesting a lasting volcanic influence on ligand production with a clear impact on the Fe speciation. Thus, the arriving of lava and the lava deltas formation act as a local source of Fe-biding ligands for several years after the eruption, keeping Fe in solution. However, the impact is locally limited, highlighting the importance of sampling site selection for accessing volcanic effects on coastal trace metal cycling.

How to cite: Coussy, V., G. González, A., González-Santana, D., Gonzalez-Davila, M., and Santana-Casiano, J. M.: Iron-binding ligands in the coastal waters of La Palma affected by the Tajogaite volcanic eruption, EGU General Assembly 2026, Vienna, Austria, 3–8 May 2026, EGU26-4469, https://doi.org/10.5194/egusphere-egu26-4469, 2026.

Rising water temperatures and increasingly frequent low-flow conditions are expected to intensify under climate change, yet their combined effects on internal nutrient loading in streams remain poorly understood. During summer, higher temperatures can enhance biological activity and organic matter mineralisation at the sediment–water interface, while reduced discharge limits oxygen supply, potentially stimulating nutrient release from sediments.

In this study, we investigate the mechanisms and drivers of nutrient remobilisation from stream sediments using controlled laboratory experiments under different temperature and low-flow scenarios. We specifically assess how temperature effects interact with sediment characteristics to determine the magnitude of internal nutrient release.

Our results show that nutrient remobilisation responds significantly to temperature changes; however, the response is non-linear and strongly dependent on the initial trophic state of the stream and sediment biomass. These findings suggest that stream warming may substantially enhance internal nutrient loading in some systems but not in others. This context-dependent response highlights the need to account for sediment legacy effects when assessing climate change impacts on stream water quality and when designing management strategies under prolonged low-flow conditions.

How to cite: Liao, Z.: Can stream warming trigger internal nutrient remobilisation from sediments?, EGU General Assembly 2026, Vienna, Austria, 3–8 May 2026, EGU26-5605, https://doi.org/10.5194/egusphere-egu26-5605, 2026.

EGU26-5627 | ECS | Orals | BG4.1

Carbon Sources, Transport and Sequestration in Tropical River Floodplains of Sabaki and Tana, Kenya 

Shawlet Cherono, Sudam Samarasinghe, Christian Schwarz, Fredrick Tamooh, Fred Omengo, Alberto V. Borges, Helena Adriaenssen, Johannes Drijvers, and Steven Bouillon

Rivers form a crucial component of the global carbon (C) cycle. They not only link terrestrial and oceanic pools, but their floodplains and channels also act as C sources and sinks, and areas of C biogeochemical processing. Quantification of C fluxes is often challenging because estimates can be biased if measurements do not adequately capture the high spatial (upstream vs downstream, channel vs floodplain) and temporal (day vs night, dry vs wet seasons, year to year) variability. This study focuses on closing existing knowledge gaps on the influence of river geomorphology on biogeochemical C processes and lateral C exchanges across river reaches and seasons in tropical river systems by quantifying C processes, sources and storage in two tropical river floodplain systems. Rivers Sabaki and Tana both originate from Kenya’s central highlands and drain into the Indian Ocean, but they differ strongly in their geomorphology and the degree of impact by agriculture, reservoirs, industries and nutrient inputs. We characterized C pools and sources (using C and N stable isotope ratios as proxies) in river water and floodplain sediments during different field campaigns in 2024 and 2025 during the dry season (September - October), as well as regular sampling of river biogeochemistry throughout the year. Additionally, we measured in situ benthic and pelagic respiration rates and concentrations of dissolved greenhouse gases (GHG: CO2, N2O, CH4). Sediment organic carbon (OC) appeared to be mainly derived from riverine suspended matter, with localized contributions of floodplain vegetation in particular along the Tana River floodplains and in overbank floodplains of the Sabaki River. In the case of Sabaki, the sources of OC transported shows extreme contrasts between wet and dry periods, which are dominated by terrestrial runoff (mix of C4 and C3-derived C) and autochthonous production, respectively. The average sediment OC content showed a clear decline with depth (0.492% at <10 cm, 0.495% at 10-50 cm, 0.362% at 50-100 cm, 0.193% at 100-320 cm). Lower OC levels and preaged OC deposits within the top layer also supports the hypothesis that the floodplain OC is largely deposition from riverine particulate organic carbon (POC) during wet season. A strong correlation was observed between OC and clay content (r = 0.60, p < 0.001), and between OC and distance from the channel (r = 0.669 , p < 0.001).  Clay provides reactive surface area for OC sorption, and lower flow energy and fine sediments settle furthest. During the dry season Sabaki system is strongly autotrophic, characterized by strong CO2 undersaturation and suspended matter dominated by photosynthetic biomass with a high OC content (on average 16.5%). Overall, our findings demonstrate that tropical river systems are highly dynamic component of the C cycle, in which geomorphology, seasonality, and land use strongly regulate C sources, storage and processing. Low land floodplains are primarily depositional sinks for in situ plant derived OC and allochthonous POC, with spatial patterns controlled by hydrodynamics and sediment texture, while temporal variability reflects shifts between terrestrial inputs during wet seasons and autochthonous production during dry periods.   

How to cite: Cherono, S., Samarasinghe, S., Schwarz, C., Tamooh, F., Omengo, F., V. Borges, A., Adriaenssen, H., Drijvers, J., and Bouillon, S.: Carbon Sources, Transport and Sequestration in Tropical River Floodplains of Sabaki and Tana, Kenya, EGU General Assembly 2026, Vienna, Austria, 3–8 May 2026, EGU26-5627, https://doi.org/10.5194/egusphere-egu26-5627, 2026.

EGU26-6208 | ECS | Orals | BG4.1

Intensive water management of dryland rivers drives fine-sediment accumulation, redox-sensitive internal loading, and flow-controlled oxygen dynamics 

Josh Guyat, Douglas Tait, Scott Johnson, Benjamin Stewart, Angus Ferguson, James Padilla-Montalvo, Christopher Ralph, Kathryn Taffs, Matt Balzer, Warwick Mawhinney, Rio Beresford, and Damien Maher

The Menindee Lakes, situated on the lower Darling–Baaka River in central Australia, form a major regulated water-storage complex that supplies water to major agricultural and urban areas. As a shallow dryland lake–river complex, the system typically experiences prolonged low-flow periods punctuated by short pulse floods. However, the construction of the Menindee Lakes Scheme in the 1960s transformed the system into an artificial, low-energy lotic storage and sediment trap, fundamentally altering benthic sediment fluxes, residence times, and redox dynamics. With unexplained repeated mass fish mortality events over the past decade, it is essential to understand the biogeochemical mechanisms driving changes in oxygen availability.

Here, we combined seasonal sediment core incubations, stable isotope measurements, and field data-driven dissolved-oxygen modelling to identify and quantify the transformations and fate of nutrients and redox-active elements. Intact sediment cores were incubated in the field at eight sites spanning hydrologically distinct regions, capturing a gradient from fine, organic-rich sediments upstream to sandier sediments downstream. A two-step sequential oxic-to-anoxic incubation design, applied to the same cores, quantified fluxes of nutrients and redox metals, as well as nitrate isotope dynamics (δ¹⁵N–NO₃⁻, δ¹⁸O–NO₃⁻), resolving key redox-driven transformations.

Nutrient fluxes exhibited strong spatial and seasonal contrasts that aligned with flow regulation and associated fine-sediment accumulation. Fine-grained, organic-rich sediments associated with Lake Wetherell and the upper weir pool showed substantially higher biogeochemical reactivity than sandier downstream sites. In summer, weir-pool sediment oxygen demand nearly doubled, and Lake Wetherell consistently emerged as a biogeochemical hotspot, with NH₄⁺ and PO₄³⁻ release rates more than twice those elsewhere and PO₄³⁻ release increasing >20-fold. Under anoxic conditions, δ¹⁵N–NO₃ followed Rayleigh-type enrichment consistent with denitrification. However, δ¹⁸O–NO₃ showed decoupling from expected fractionation, indicating alternate redox-sensitive nitrogen cycling pathways (likely DNRA) that can recycle and retain N.

Anoxic fluxes of reduced nitrogen and redox-active species from the weir pool were stoichiometrically converted to sediment oxygen demand (SOD), upscaled to the weir-pool scale, and incorporated into a dissolved-oxygen box model to quantify sediment-mediated oxygen demand under no-flow conditions and the flow required for recovery following re-oxygenation. This demonstrated that during no-flow drought conditions, SOD can accumulate rapidly, while recovery following re-oxygenation is sensitive to both the magnitude and duration of managed flow releases. By integrating field, laboratory, and modelling approaches, we demonstrate how flow regulation and management-driven fine-sediment accumulation control redox-sensitive sediment biogeochemistry and amplify seasonal oxygen stress in regulated dryland rivers.

How to cite: Guyat, J., Tait, D., Johnson, S., Stewart, B., Ferguson, A., Padilla-Montalvo, J., Ralph, C., Taffs, K., Balzer, M., Mawhinney, W., Beresford, R., and Maher, D.: Intensive water management of dryland rivers drives fine-sediment accumulation, redox-sensitive internal loading, and flow-controlled oxygen dynamics, EGU General Assembly 2026, Vienna, Austria, 3–8 May 2026, EGU26-6208, https://doi.org/10.5194/egusphere-egu26-6208, 2026.

EGU26-6786 | ECS | Posters on site | BG4.1

Temperature effects on optimality-based phytoplankton growth model 

David Moncayo, Markus Schartau, Alexey Ryabov, Stefanie Moorthi, and Markus Pahlow

Phytoplankton are a key driver of global marine biogeochemical cycles, but the response to ocean warming remains difficult to predict, partly because the temperature-dependence of physiological processes is not well understood. This study extends an optimality-based phytoplankton growth model to include metabolic responses to temperature. Using microcosm data, we identify two key parameters showing roughly consistent temperature responses: maximum uptake rate (V0) and chlorophyll synthesis cost (ζC). We assess the accuracy of temperature-dependent species-specific (SS) and non-species-specific (nSS) model configurations in reproducing microcosm experimental data, relative to a non-temperature-dependent, species-specific control model (noTemp). Our results demonstrate that explicitly accounting for temperature-dependence can significantly improve predictions of phytoplankton biomass production, nitrogen uptake, and stoichiometry. The SS configuration consistently outperforms other setups in predicting particulate organic carbon, chlorophyll-a, and nutrients (DIN, DIP), while the nSS configuration still performs substantially better than the (species-specific) noTemp configuration. These findings underscore the importance of accounting for temperature-dependence in ecological models for future projections of phytoplankton responses to environmental change.

How to cite: Moncayo, D., Schartau, M., Ryabov, A., Moorthi, S., and Pahlow, M.: Temperature effects on optimality-based phytoplankton growth model, EGU General Assembly 2026, Vienna, Austria, 3–8 May 2026, EGU26-6786, https://doi.org/10.5194/egusphere-egu26-6786, 2026.

Predicting the outcomes of redox processes in aquatic environments requires quantitative constraints on electron transfer reactions. Advances in electrochemical techniques have significantly improved our ability to quantify and constrain mineral-related biogeochemical redox processes that regulate carbon, nutrient, and contaminant cycling in aquatic environments. Manganese oxides are key redox-active minerals in these systems that influence organic matter transformation, nutrient availability, and contaminant fate. In particular, Mn(III)-oxides occupy a critical role due to their ability to act as both electron acceptors and donors in the redox landscape. However, their redox characteristics are poorly understood due to their intermediate and metastable nature. Here, we apply mediated electrochemical analysis (MEA) as an analytical laboratory technique to study the effect of changing redox conditions and solution chemistry on the redox-activity of two representative Mn(III)-oxides—manganite and hausmannite. We initially use MEA to benchmark the reactivity of these Mn(III)-oxides in “simple” pH-controlled aqueous solutions. To interpret the results from MEA, we use a process-based model that couples interfacial electron transfer kinetics with mass-transport dynamics to simulate how the current response changes as a function of electrochemical driving force. Using this approach, we extract redox parameters that dictate the reactivity of these Mn(III)-oxides as a function of shifting redox conditions. After benchmarking the redox behaviour in controlled conditions, we investigate the effect of solution chemistry by performing MEA experiments in aqueous matrices containing carbonate, organic matter, and environmentally relevant ligands to characterize their effects on mineral reactivity. By providing quantitative constraints on Mn redox reactivity, this work illustrates how advanced electrochemical techniques can potentially  improve predictive understanding of coupled biogeochemical processes and inform models of water quality and ecosystem response under changing environmental conditions.

How to cite: Pothanamkandathil, V. and Aeppli, M.: Quantification of Mn(III)-Oxide Redox Activity: Integrating Mediated Electrochemistry with Kinetic and Mass-Transport Modelling., EGU General Assembly 2026, Vienna, Austria, 3–8 May 2026, EGU26-7407, https://doi.org/10.5194/egusphere-egu26-7407, 2026.

EGU26-7488 | ECS | Orals | BG4.1

Source-driven variability in dissolved organic carbon across a proglacial floodplain as a space- for time analogues of future carbon dynamics  

Oriana Lucia Llanos-Paez, Nicola Deluigi, Giulia Grandi, Lukas Hallberg, Jingyi Hou, and Matteo Tolosano

Proglacial floodplains are highly heterogeneous braided river systems in which glacier melt, groundwater, and snowmelt-fed tributaries interact over meter-to-tens-of-meters scales. This pronounced physicochemical heterogeneity among water sources generates contrasting hydrological regimes, benthic microbial communities, and water chemistry, resulting in strong spatial variability in biogeochemical processes. Confluences within these networks connect channels with distinct source signatures and microbial assemblages and may function as biogeochemical hotspots that disproportionately influence organic matter processing at the network scale. As rapid glacier retreat alters the relative contributions of meltwater, groundwater, and subglacial flows, proglacial floodplains offer valuable space-for-time analogues to investigate future shifts in carbon dynamics in alpine catchments.

Here, we investigated dissolved organic carbon (DOC) dynamics in a proglacial floodplain dominated by three contrasting water sources: a clean-ice glacier, a talus/rock glacier, and a groundwater spring. We hypothesized a transition from conservative transport or DOC consumption in glacier-fed streams to DOC production in streams influenced by talus/rock glacier and groundwater inputs, driven by differences in physicochemical conditions (e.g., turbidity, nutrients, temperature) and associated biological activity. Additionally, we aimed to quantify the net carbon balance of the floodplain at the system scale.

We sampled the three main water sources and 14 nodes across the braided network, with particular emphasis on major confluences. End-member mixing analysis (both EMMA/EEMMA) was applied to quantify source contributions, and differences between observed and expected DOC concentrations were evaluated. We used the percent differences between measured and predicted values to determine whether a stream segment functions as a DOC sink or source. Daily DOC loads were calculated at the floodplain outlet to assess net system functioning.

Our results revealed pronounced spatial variability in carbon dynamics associated with dominant water sources. Clean-ice glacier-dominated nodes were characterized by high discharge, elevated turbidity, and turbulent flow, and generally acted as DOC sinks. In contrast, nodes influenced by talus/rock glacier and groundwater inputs exhibited hydrological stability and functioned as DOC sources. Temporally, sink-source behavior shifted between early and late melt season conditions. Despite pronounced spatial and temporal variability, seasonal net DOC load at the outlet was close to zero, indicating that carbon behaved conservatively at the floodplain scale and reflecting the offsetting contributions of coexisting sink and source streams within the floodplain. Taken together, our results suggest that continued glacier retreat will promote a transition toward more hydrologically stable channels with enhanced carbon production. Such a shift is expected to reduce the prevalence of DOC sink behavior and increase the role of proglacial river networks as net carbon sources, with important implications for downstream carbon exports in future alpine catchments.

How to cite: Llanos-Paez, O. L., Deluigi, N., Grandi, G., Hallberg, L., Hou, J., and Tolosano, M.: Source-driven variability in dissolved organic carbon across a proglacial floodplain as a space- for time analogues of future carbon dynamics , EGU General Assembly 2026, Vienna, Austria, 3–8 May 2026, EGU26-7488, https://doi.org/10.5194/egusphere-egu26-7488, 2026.

EGU26-7567 | ECS | Orals | BG4.1

Evolution of DOM molecular fingerprints from a river to ocean continuum: a comprehensive view of water columns, surface sediments, and chemically dark matter 

Zekun Zhang, Peng Yao, Bin Zhao, Yuanbi Yi, Zhao Chen, Ruanhong Cai, Wenzhao Liang, and Ding He

Dissolved organic matter in estuarine sediments (SDOM) mediates carbon transformation and exchange across the sediment–water interface, yet its controls and fate remain poorly constrained. Here, we characterized SDOM along the Changjiang Estuary–East China Sea continuum using ultrahigh-resolution mass spectrometry, integrating prior stable and radiocarbon constraints to track SDOM provenance and age and to evaluate sediment–water exchange with co-located bottom-water DOM. SDOM was more biologically labile than bottom-water DOM, enriched in aliphatic, low-molecular-weight, nitrogen-containing compounds. We further examined chemically unassigned mass peaks (“dark matter”), which accounted for a substantial fraction of molecular richness but contributed a smaller share of bulk signal intensity. A sizable subset of these peaks was shared between sediments and the water column, indicating transferable sedimentary molecular fingerprints across the sediment–water interface. Spatial patterns identify the inner-shelf mobile mud zone as a hotspot where hydrodynamic disturbance and resuspension promote particle-mediated adsorption–desorption and rapid exchange, coupling the redistribution of fresh marine DOM with nearshore attenuation of terrestrial-derived signals. These results position SDOM as a reactive carbon pool in river-dominated margins and show that incorporating chemically dark matter yields a more complete molecular view of sediment–water DOM exchange.

How to cite: Zhang, Z., Yao, P., Zhao, B., Yi, Y., Chen, Z., Cai, R., Liang, W., and He, D.: Evolution of DOM molecular fingerprints from a river to ocean continuum: a comprehensive view of water columns, surface sediments, and chemically dark matter, EGU General Assembly 2026, Vienna, Austria, 3–8 May 2026, EGU26-7567, https://doi.org/10.5194/egusphere-egu26-7567, 2026.

EGU26-7984 | Posters on site | BG4.1

An advanced data evaluation strategy for assessing temporal changes in dissolved organic matter quality during flood events based on ultrahigh-resolution mass spectrometry 

Peter Herzsprung, Norbert Kamjunke, Oliver J. Lechtenfeld, Michael Rode, Kurt Friese, Clarissa Glaser, Stephanie Spahr, and Wolf von Tümpling

Water chemistry can change dramatically during a flood event. While variations in the concentration of inorganic ions, nutrients and bulk DOC as function of discharge have been  intensively investigated, changes in dissolved organic matter (DOM) quality were considered less detailed with respect to high resolution techniques. DOM is a highly complex mixture consisting of thousands of different elemental compositions. Fourier transform ion cyclotron resonance mass spectrometry (FTICR-MS) is the analytical tool with the up to date highest DOM quality resolution. Here we present a novel data evaluation strategy for time series applied to a flood event in a small river catchment. As sampling area the Ammer River near Tübingen, southern Germany was selected. During a flood event with 900% MQ in 2021, six water samples were collected within five hours period at the Pfäffingen monitoring station while discharge changed by a factor of five. Water samples were filtered (Whatman GF/F), acidified and passed through PPL cartridges. Methanolic eluates were analyzed by FTICR-MS in negative ionization mode (ESI-). Molecular formulas (MFs) were calculated for the mass range between 150–1000 Da using in-house software, considering the elements: carbon 12C1–80, hydrogen 1H1–198, oxygen 16O0–40, nitrogen14N0–2, and sulphur 32S0–1. A total of 3500 formulas were shared among all six samples. Inter sample ranks were calculated for each molecular formula based on relative signal intensity, with rank 1 representing the highest and rank 6 the lowest abundance.  (1,2). From the inter sample ranks the rank sequences were derived (for example 3-6-1-5-4-2) and used as input tor hierarchical cluster analysis (HCH). Five superordinate clusters were selected for further evaluation. Rank distribution of formulas within each cluster were visualized via bar graph and molecular formulas were plotted in van Krevelen diagrams (H/C versus O/C). This visualization revealed flood-specific compositional dynamics in DOM. Sulfur-containing compounds (CHOS) exhibited their highest relative abundance at peak discharge (fourth sample), whereas aliphatic CHO compounds (H/C > 1.5) were most abundant at low discharge (first and last samples). In contrast, aliphatic CHO (H/C > 1.5) showed highest abundance at lowest discharge (first sample and last sample). Nitrogen-containing components (CHNO) showed different ranking distribution and revealed highest abundance in the second and third sample (before discharge peak).

In conclusion, DOM exhibits highly divers and dynamic behavior during flood events due to its complex composition and information received from bulk DOC concentrations alone seems to be insufficient to capture these compositional changes.

1) Herzsprung P. et al., Environ. Sci. Technol. (2012), 46, 5511-5518

2) Dadi. et al., Environ. Sci. Technol. (2017), 51, 13705-13713

How to cite: Herzsprung, P., Kamjunke, N., Lechtenfeld, O. J., Rode, M., Friese, K., Glaser, C., Spahr, S., and von Tümpling, W.: An advanced data evaluation strategy for assessing temporal changes in dissolved organic matter quality during flood events based on ultrahigh-resolution mass spectrometry, EGU General Assembly 2026, Vienna, Austria, 3–8 May 2026, EGU26-7984, https://doi.org/10.5194/egusphere-egu26-7984, 2026.

EGU26-8649 | ECS | Orals | BG4.1

Depth-dependent patterns of microbial carbon and nitrogen metabolism functions in deep East African Rift Valley Lakes 

Xiaolong Yao, Zhonghua Zhao, Ismael Aaron Kimirei, and Lu Zhang

East African Great Lakes are globally important waters that regulating carbon and nitrogen sources and sinks. Yet, microbial carbon and nitrogen cycling functions as well as their underlying environmental drivers in tropical deep lakes remain largely unexplored. Here, were collected vertical samples from typical large deep lakes in East African Rift Valley to assess environmental gradients and microbial metabolism functions of primary biogenic elements. We examined vertical distributions of nutrients, dissolved organic matter (DOM) properties, and quantified microbial carbon, nitrogen, and phosphorus cycling genes using high-throughput Quantitative Microbial Ecology Chip (QMEC) technique. Preliminary analyses indicate clear depth-dependent patterns in nutrient availability and microbial functional genes. Dissolved organic matter properties are likely important drivers of the depth patterns of these functional genes. The observed relationships between microbial functional genes and environmental variables provide insights into the vertical organization of microbial biogeochemical functions in deep tropical lakes.

How to cite: Yao, X., Zhao, Z., Kimirei, I. A., and Zhang, L.: Depth-dependent patterns of microbial carbon and nitrogen metabolism functions in deep East African Rift Valley Lakes, EGU General Assembly 2026, Vienna, Austria, 3–8 May 2026, EGU26-8649, https://doi.org/10.5194/egusphere-egu26-8649, 2026.

EGU26-8911 | ECS | Orals | BG4.1

Climate pattern–land use pathways shape dissolved organic matter dynamics in the Pearl River Basin 

Yu Pang, Zhe-Xuan Zhang, Hongkai Qi, Cheng Xing, Haoran Wang, Yi Liu, Ming Ye, Zekun Zhang, Jianping Gan, and Ding He

Static models relying solely on land use are increasingly insufficient for predicting riverine dissolved organic matter (DOM) dynamics. Here, we address this limitation by proposing the Climate Pattern–Land Use Pathways (CPLUP) framework to disentangle the synergistic interactions between climatic drivers and land use. We developed this framework using a synoptic dataset from the Pearl River Basin (PRB, n=228) and validated it globally via a machine learning ensemble. In the Pearl River Basin, we observed that terrestrial signatures dominated the entire river network, whereas autochthonous signals significantly increased in the downstream reaches. Attribution analysis revealed that this spatial divergence was driven by climatic forces that activate static land-use sources. Specifically, high discharge provided the kinetic energy to mobilize terrestrial organic matter from land into rivers, representing a process limited by transport capacity. Conversely, solar radiation and temperature provided thermodynamic energy to catalyze biochemical transformations within the water column, representing a process limited by reaction kinetics. Building on these mechanistic insights, we established the CPLUP framework to explicitly map how distinct climatic drivers regulate specific land-use signals. By decoding these complex dynamics, our study provides a robust predictive tool (CPLUP) for forecasting riverine DOM under intensifying climate change and urbanization.

How to cite: Pang, Y., Zhang, Z.-X., Qi, H., Xing, C., Wang, H., Liu, Y., Ye, M., Zhang, Z., Gan, J., and He, D.: Climate pattern–land use pathways shape dissolved organic matter dynamics in the Pearl River Basin, EGU General Assembly 2026, Vienna, Austria, 3–8 May 2026, EGU26-8911, https://doi.org/10.5194/egusphere-egu26-8911, 2026.

    Amaranth (AM) is a typical anionic azo dye, which has been applied in cosmetics, wood, paper, synthetic fiber, food additives, leather, and artificial dyeing, poses significant risks to both human health and the environment. Therefore, its removal from water is essential to safeguard public health and ensure a sustainable ecosystem. In this work, a novel magnetic Fe3O4@LPP was successfully synthesized via a co-precipitation method and applied for the removal of AM dye from an aqueous environment. Several characterization techniques, including point of zero charge (pHPZC), N2 adsorption/desorption, Energy dispersive X-ray spectroscopy (EDS), Field emission scanning electron microscopy (FE-SEM), Vibrating sample magnetometer (VSM), Fourier transform infrared spectroscopy (FTIR), Transmission electron microscopy (TEM) and X-ray diffractometer (XRD), were analyzed to reveal the functional and structural properties of the as-synthesized Fe3O4@LPP composite. AM dye adsorption performances were tested as a function of the operational conditions, such as stirring speed (50-300 rpm), temperature (25-55 oC), initial pH solution (2-10), Fe3O4@LPP dosage (0.01 to 0.08 g/30 mL), contact duration (0-180 minutes), and initial AM dye concentration (50-500 mg/L) in a batch mode of operation. Kinetic analysis revealed that the sorption process followed the pseudo-1st-order kinetic model across all initial concentrations, showing strong correlation between the experimental data and the model predications. Furthermore, the equilibrium sorption data were best fitted by the Langmuir isotherm model, suggesting monolayer sorption on a homogeneous surface, with a maximal adsorption uptake of 445.5±19.6 mg g-1. The thermodynamic analysis of AM dye adsorption indicated that the process was endothermic, feasible, and spontaneous. Various eluting agents were evaluated in the desorption studies, and 0.1 M NaOH exhibited the greater desorption efficiency of 89.4%. Overall, the outcomes of this study confirm that Fe3O4@LPP composite is a promising and effective adsorbent for the remove of dyestuff from wastewater.    

Keywords: Removal, Amaranth, Iron oxide, Lychee peel, Desorption.

How to cite: Hsu, J.-Y., Munagapati, V. S., and Wen, J.-C.: Adsorptive removal of an anionic Amaranth dye from aqueous solution using magnetic iron oxide-loaded lychee peel powder (Fe3O4@LPP): Isotherm, kinetic, thermodynamic and desorption studies, EGU General Assembly 2026, Vienna, Austria, 3–8 May 2026, EGU26-9232, https://doi.org/10.5194/egusphere-egu26-9232, 2026.

EGU26-11589 | ECS | Orals | BG4.1

Two-dimensional imaging of porewater chemistry to investigate the heterogeneity of diagenetic processes in Amazonian mangrove sediments 

Matheus Cavalcante-Silva, João Barreira, Cleuza Leatriz Trevisan, Christiene Matos, Christiane do Nascimento Monte, José Berredo, Wilson Machado, Gwenaël Abril, Aurelia Mouret, and Edouard Metzger

Quantifying biogeochemical processes in coastal sediments requires analytical approaches capable of resolving microscale variability in redox-sensitive solutes. Conventional porewater sampling techniques provide limited spatial resolution and often disturb in situ equilibria, obscuring fine-scale heterogeneity associated with bioturbation, root activity, and microbial processes. These limitations are particularly critical in mangrove sediments, where organic matter remineralization and redox dynamics are highly heterogeneous. In addition, small-scale geomorphological contrasts between erosional and depositional settings can influence sediment structure, permeability, and diagenetic pathways. Here, we applied two-dimensional Diffusive Equilibration in Thin Films (2D-DET) coupled with colorimetric detection to map porewater solutes associated with early diagenesis in mangrove sediments from two sites (MAR1 and MAR2) in the Marapanim River Estuary (Pará State, Brazil). The sites, sampled in winter 2025, represent erosional and depositional zones on opposite sides of a tidal channel. Two-dimensional distributions of dissolved Fe and Mn (Fed and Mnd), PO₄³⁻, H₂S, NO₂⁻, NO₃⁻, and NH₄⁺ were quantified. Hyperspectral imaging enabled the discrimination of Fed and PO₄³⁻ distributions within a single gel. In general, Fed was broadly distributed throughout the imaged porewaters (to ~17 cm depth) at both sites, with patchy concentrations reaching up to ~500 µmol L-1. Dissolved H₂S, measured at MAR1, was largely absent across most of the profile, allowing Fed to remain mobile. In contrast, PO₄³⁻ was preferentially enriched at greater depths, indicating partial Fe-P decoupling likely related to efficient phosphate retention in shallow sediments and accumulation under more reducing conditions at depth. Mnd distributions were comparatively more homogeneous than Fed, consistent with slower redox kinetics. Near-zero NO₂⁻ and NO₃⁻ concentrations combined with elevated NH₄⁺ indicate dominant ammonification and nitrification that is inhibited or masked by nitrate consumption processes. Clear contrasts emerged between geomorphological settings. At the erosional site (MAR1), Fed and Mnd concentrations were higher, more laterally variable, and NH₄⁺ maxima occurred deeper in the sediment, consistent with enhanced porewater flushing and advective transport. In contrast, the depositional site (MAR2) exhibited more persistent Fe-P decoupling and shallower NH₄⁺ accumulation. Such differences could be attributed to differences in grain size, permeability and mudflat slope and therefore porewater residence time. Two-dimensional imaging further revealed pronounced lateral heterogeneity associated with biogenic structures. At MAR1, a microzone showed elevated sulfide and Fed depletion, consistent with localized pyritization and associated phosphate release. In another Fed/PO₄³⁻ gel from MAR1, microzones linked to sediment coloration and young Rhizophora plants reflected alternating Fed release and removal under contrasting redox conditions. At MAR2, a near-surface zone exhibited Mnd enrichment coupled with Fed depletion beneath a Rhizophora seedling, consistent with a root-influenced redox microenvironment. Overall, results demonstrate the capacity of 2D-DET to resolve geomorphology and biota-driven microscale diagenetic organization in macrotidal Amazonian mangrove sediments that is not accessible using conventional porewater techniques.

How to cite: Cavalcante-Silva, M., Barreira, J., Trevisan, C. L., Matos, C., do Nascimento Monte, C., Berredo, J., Machado, W., Abril, G., Mouret, A., and Metzger, E.: Two-dimensional imaging of porewater chemistry to investigate the heterogeneity of diagenetic processes in Amazonian mangrove sediments, EGU General Assembly 2026, Vienna, Austria, 3–8 May 2026, EGU26-11589, https://doi.org/10.5194/egusphere-egu26-11589, 2026.

EGU26-12402 | ECS | Orals | BG4.1

Observation-based reconstruction of riverine organic carbon fluxes reveals hydroclimatic controls on lateral carbon export 

Shengyue Chen, Shijie Jiang, Georgios Blougouras, Haicheng Zhang, Chunlin Song, Sung-Ching Lee, Elisa Calamita, Taiqi Lian, Jinliang Huang, and Markus Reichstein

Lateral export of organic carbon by rivers links terrestrial and aquatic carbon cycling, yet its magnitude, drivers, and variability remain poorly quantified at large spatial and temporal scales. Here we develop a physics-constrained multi-task machine learning model and use long-term in situ riverine total and dissolved organic carbon (TOC/DOC) observations to reconstruct daily TOC concentrations and fluxes at 0.25° resolution across the contiguous United States (CONUS) for the past four decades (1984–2023). The multi-task learning approach leverages DOC-rich records to inform TOC dynamics through their observed covariation, improving TOC estimates in regions with sparse measurements, particularly in the arid western United States. The reconstructed data reveal a widespread decoupling between TOC concentrations and fluxes, with concentration trends increasing over 47% of the domain while fluxes decline over 73%, indicating a dominant role of hydroclimatic control on transport efficiency rather than changes in carbon source availability alone. Analysis across dry and wet years shows that wetter hydroclimatic conditions, particularly following drought periods, are associated with pronounced TOC export, during which lateral carbon export can exceed 10% of concurrent terrestrial carbon uptake. These results demonstrate how hydroclimatic variability modulates organic carbon transport in river networks, with implications for estimating land carbon storage and land-water coupling under ongoing hydroclimatic change. We emphasize the importance of integrating large-sample, in situ riverine observations in improving understanding of coupled hydrological and biogeochemical processes from site to continental scales.

How to cite: Chen, S., Jiang, S., Blougouras, G., Zhang, H., Song, C., Lee, S.-C., Calamita, E., Lian, T., Huang, J., and Reichstein, M.: Observation-based reconstruction of riverine organic carbon fluxes reveals hydroclimatic controls on lateral carbon export, EGU General Assembly 2026, Vienna, Austria, 3–8 May 2026, EGU26-12402, https://doi.org/10.5194/egusphere-egu26-12402, 2026.

EGU26-13871 | ECS | Orals | BG4.1

Microbial taxonomic and functional diversity across the Drake Passage and the west Antarctic Peninsula 

Gabriella Gallo, Jacopo Brusca, Lorenza Maria Campoli, Luciano Di Iorio, Francesco Bolinesi, James A. Bradley, Olga Mangoni, Angelina Cordone, and Donato Giovannelli

Antarctica and the Southern Ocean are central to the Earth’s climate and oceanic circulation systems. Microbial communities inhabiting the Southern Ocean drive biogeochemical cycles, underpin trophodynamics, and  affect atmospheric chemistry. The ongoing climate crisis is affecting these processes, with possible cascading effects on the structure and functioning of phytoplankton communities in the surface waters of the Southern Ocean. The CLAW hypothesis, which describes a feedback mechanism between phytoplankton, the dimethylsulphide (DMS) production, the cloud condensation nuclei (CCN) formation, and albedo, represents a prominent link between the changing marine microbial dynamics and climate. Additionally, marine DMS production appears to be influenced by the availability of microbially-derived vitamin B12, involved in the methionine biosynthesis, and is already regarded as a limiting factor for the phytoplankton growth, thus playing a role in shaping microbial community structure. Understanding the role of the ocean microbiome in these processes is therefore essential to evaluate how marine microbial communities impact climate regulation, and vice versa.

Previous studies on the surface waters of the west Antarctic Peninsula and in the Southern Ocean have described taxonomic profiles of marine microorganisms and identified metabolic functions related to degradation of phytoplankton-derived organic matter. However, the role of the functional diversity in the interplay between climate change, microbial communities, and DMS-cycling pathway remains poorly understood. Here, we present an integrated analysis of the microbial functional diversity of surface waters along the Drake Passage and the west Antarctic Peninsula, sampled during the 2023/24 Austral Summer. Shotgun metagenomic sequencing and 16S rRNA amplicon analysis were performed, and enabled the description of spatial distribution of genes involved in DMS and cobalamin biosynthesis pathways along the transect. We coupled this data with chlorophyll chemotaxonomy and geochemical analyses. This integrated approach holds the potential to advance our understanding of microbial responses to the impacts of climate change, and the identification of specific microbial pathways that could enhance climate change in the Southern Ocean, ultimately helping to fill gaps in climate change modeling.

How to cite: Gallo, G., Brusca, J., Campoli, L. M., Di Iorio, L., Bolinesi, F., Bradley, J. A., Mangoni, O., Cordone, A., and Giovannelli, D.: Microbial taxonomic and functional diversity across the Drake Passage and the west Antarctic Peninsula, EGU General Assembly 2026, Vienna, Austria, 3–8 May 2026, EGU26-13871, https://doi.org/10.5194/egusphere-egu26-13871, 2026.

Stream microbial communities play a vital role in ecosystem functioning, contributing to nutrient cycling, organic matter decomposition, and overall ecological health. Despite this, biogeochemical cycling is typically investigated independently to microbial communities, reducing our understanding of the drivers of microbially-mediated biogeochemical reactions, including those which produce and/or consume greenhouse gases. Given the connectivity of stream ecosystems, microbial communities and chemical substrates (e.g. DOM, nutrients) are also susceptible to influences from land-use changes that occur in the wider watershed. While many studies have examined stream microbial community structure and function along a land-use gradient, few have considered their connectivity with nearby riparian zones, nor conducted microbial diversity surveys in conjunction with biogeochemical measurements. Additionally, recent advancements in high-resolution organic matter characterisation have enabled investigation of the importance of organic matter quality and key metabolites in driving ecosystem function. Here, we examined microbial communities, DOM chemodiversity, and nutrient and DOC concentrations in the water column, streambed sediments, and adjacent riparian zone sediments in 16 headwater streams across a land-use gradient (categorised by percent agriculture, residential, industrial, and human development). We performed incubations with paired streambed and riparian sediments to quantify potential greenhouse gas production (carbon dioxide, methane, and nitrous oxide) and assess the relationship between microbial community structure, potential functional capacity, and greenhouse gas fluxes. We subsequently used high-resolution organic matter characterisation techniques (FTICR-MS and LC-MS) to investigate organic matter quality and key metabolites and how these changed with land-use to also affect microbial communities and greenhouse gas emissions. This work underscores the importance of combining microbial and biogeochemical measurements and how organic matter quality drives ecosystem function, especially in highly connected and complex systems that experience human-driven impacts across scales.

How to cite: Comer-Warner, S., Wolheim, W., and Bulseco, A.: Unravelling drivers of stream microbial-biogeochemical cycling along a land-use gradient: Effects of organic matter quality and chemodiversity on greenhouse gas fluxes, EGU General Assembly 2026, Vienna, Austria, 3–8 May 2026, EGU26-14219, https://doi.org/10.5194/egusphere-egu26-14219, 2026.

EGU26-14283 | ECS | Posters on site | BG4.1

The origin of sediment organic carbon influences hydrophobic organic pollutant dynamics in Arctic shelf sediments 

Xiaodi Shi, Laurent Oziel, Jonathan P. Benskin, Örjan Gustafsson, and Anna Sobek

The fate of hydrophobic organic pollutants in the marine environment is largely controlled by organic carbon (OC) cycling processes. The Arctic is warming three times as fast as the global average, resulting in a profound alteration in OC fluxes to the Arctic Ocean. Consequently, remote Arctic shelf sediments serve as an ideal receptor for assessments of the impact of OC quantity and quality on pollutant fate.

Here, we compiled a database of congener-specific polychlorinated biphenyl (PCB) concentrations (510 entries, 84 sites) in surface sediment of four Eurasian Arctic shelves via integration of new measurements and literature data. Total organic carbon content and isotopic data were retrevied from CASCADE (The Circum-Arctic Sediment CArbon DatabasE) to examine the PCB storage in sediment as a function of OC source (marine versus terrestrial). In order to reduce the impact of variability in water-phase concentrations caused by region, latitude and depositional year, we controlled for these factors. The adjusted concentrations (in ng-PCB/g-OC) in sediment with high fractions of marine OC are 0.82-1.22 log units higher in Barents and Kara Seas and 0.092-1.49 log units higher in Laptev and East Siberian Seas, compared to those with high fractions of terrestrial OC. Albeit uncertainties in current estimations due to wide geographical coverage and correction assumptions, these values are comparable to previously reported differences of partition coefficients between marine and terrestrial OC in other regions (e.g., 0.2-1 log units higher in marine OC sites in Baltic Sea, compared to terrestral OC sites).

Based on these results, PCB accumulation in Arctic shelf sediment was predicted for future climate change scenarios using an observational dataset of terrestrial inputs and marine OC fluxes derived from the global state-of-the-art ocean- and sea ice biogeochemistry model FESOM2.1-REcoM3. The accumulated amount of PCBs in  marine OC in Arctic shelf sediments from 2000-2100 is estimated to be about 26 tonnes, which is more than 8 times higher than the accumulated amount in terrestral OC from both coastal erosion and riverine inputs. These results demonstrate that shifts in OC fluxes as a consequence of climate change can impact storage capacity of hydrophobic organic pollutants in aquatic systems.

How to cite: Shi, X., Oziel, L., Benskin, J. P., Gustafsson, Ö., and Sobek, A.: The origin of sediment organic carbon influences hydrophobic organic pollutant dynamics in Arctic shelf sediments, EGU General Assembly 2026, Vienna, Austria, 3–8 May 2026, EGU26-14283, https://doi.org/10.5194/egusphere-egu26-14283, 2026.

Biofilms (structured microbial communities), ubiquitous in a variety of aquatic and terrestrial ecosystems, strongly regulate arsenic (As) cycle. Dissolved organic matter (DOM), prevalent in natural environments, can stimulate the development and activity of microbial communities, thus enhancing microbially mediated arsenic biogeochemical processes. However how DOM regulate groundwater biofilms to drive the fate of As migration and transformation remains unclear. In this study, laboratory incubation experiments were integrated with extensive biofilm characterizations, 16S rRNA, qPCR, Scanning electron microscopy (SEM) and Fourier transform infrared spectroscopy (FTIR) to explore the behaviors and potential mechanisms of As under the mediation of biofilm and fluvic acid (FA), a representative of DOM in groundwater. The results showed that the regulation of FA induced more As incorporation and subsequent reduction of As(V) after the As(III) oxidation potentially mediated by aoxA/B. The interaction of protein and polysaccharide on the biofilms with As was the dominant adsorption mechanism. FA modification resulted in the secretion of more abundant EPS and provided more binding sites for the organic functional groups, which intensified the adsorption of protein and polysaccharide for As. In parallel, the addition of FA led to the secretion of larger amounts of α-configuration polysaccharide that produced greater steric hindrance promoting the As adsorption. The formation of FA-Ca-As ternary complexes still remained an important way for arsenic sequestration after biofilm-FA modification. The ultimately higher diversity and abundance of N and S cycling associated bacteria (e.g., Desulfitobacterium, Acinetobacter, Sphingobacterium), yielded by the addition of FA, likely contributed to the reduction of As(V) by enhancing arrA. Additionally, the electron shuttle effect of FA accelerated the electron transfer between As(V) and As (III), serving as another mechanism for As transformation. To the best of our knowledge, this study for the first time reveals the importance of DOM on the migration and transformation of As by biofilms. This study enriches the theoretical understanding of biosorption and biotransformation of As and provides new insight into environmental arsenic cycles.

How to cite: Li, H., Li, C., and Cavalca, L.: Biofilm Mediated Arsenic Migration and Transformation in Groundwater under the Influence of Dissolved Organic Matter, EGU General Assembly 2026, Vienna, Austria, 3–8 May 2026, EGU26-14816, https://doi.org/10.5194/egusphere-egu26-14816, 2026.

EGU26-14997 | ECS | Orals | BG4.1

Development of an Innovative Multiparameter Fluorometer to Sense the Impact of Organic Pollution on River Health  

Rosie Perrett, Matthew Coombs, Constance Tulloch, Robin Thorn, John Attridge, and Darren Reynolds

River systems in the UK are in poor condition, with sewage discharges and agricultural runoff identified as major contributors to declining river health. Effective assessment and management of river health requires real-time monitoring solutions; however, existing in-situ sensors are largely limited to physiochemical parameters and provide little information on organic pollution input or microbial contamination. This research demonstrates the implementation and deployment of novel multiparameter fluorescence-based sensors capable of measuring bacterial/algal contamination and organic pollution whilst simultaneously correcting for environmental optical interferences in real time. These portable multiparameter fluorometers were deployed as part of a sensing network along the River Dart catchment (UK) in October 2025.  We present a dataset collected continuously in real-time over a 3-month period. As part of a managed water quality monitoring programme, continuous data on microbial contamination and organic pollution in the River Dart catchment collected using deployed novel multiparameter fluorescence-based sensors were compared alongside regular field spot sampling and standard laboratory water quality analysis. For the latter, biological oxygen demand, microbial counts and nutrient analysis were performed to contextualise and verify (ground truth) sensing data. Sensing system performance for the detection of organic pollution events and their subsequent impacts on river ecology was evaluated. 

Our results demonstrate a strong correlation between tryptophan-like-fluorescence and biological oxygen demand, highlighting the ability of the sensor to monitor oxygen demand in real time. Using machine learning and artificial intelligence, we aim to produce a tool capable of detecting pollution events from sensor data and evaluating subsequent impacts on oxygen demand and phytoplankton growth. Our ultimate aim is to deliver a novel validated multiparameter fluorescence-based sensor, integrated within a real-time monitoring network, alongside a tool for interpreting water quality data regarding river health and pollution pressures. We anticipate these outputs combined will enhance potential for early detection of pollution events, facilitate agile decision making and river management and enhance understanding of biogeochemical processing in rivers.  

How to cite: Perrett, R., Coombs, M., Tulloch, C., Thorn, R., Attridge, J., and Reynolds, D.: Development of an Innovative Multiparameter Fluorometer to Sense the Impact of Organic Pollution on River Health , EGU General Assembly 2026, Vienna, Austria, 3–8 May 2026, EGU26-14997, https://doi.org/10.5194/egusphere-egu26-14997, 2026.

EGU26-15334 | Posters on site | BG4.1

Land use change effects on carbon yield in lowland streams of the Congo Basin 

Merveille Bondongwe Wombe, Travis Drake William, Dries Landuyt, Matti Barthel, Corneille Ewango, Pascal Boeckx, and Marijn Bauters

The expansion of land-use activities severely threatens primary forests in the Congo Basin. As the dominant mode of deforestation in this region, it is expected to affect soil nutrient stocks and availability and, consequently, forest productivity. To assess how shifting cultivation affects carbon species transformation and export to rivers, four catchments, of which two draining forested landscapes and two draining agricultural landscapes were selected in the Yangambi region, Democratic Republic of the Congo. The catchments were equipped with sensors to continuously quantify discharge, water temperature, oxygen concentrations and sediment loads, amongst other parameters, while periodic water sampling was conducted to quantify chemical water composition. Based on these samples, concentrations and yields of the full spectrum of carbon species (DOC, DIC, CO₂, CH₄) were calculated. We found that baseflow dissolved organic carbon (DOC) concentrations were nearly identical in both groups of streams. However, significantly higher carbon dioxide(CO₂) and methane(CH₄) concentrations were observed in streams draining agricultural landscapes compared to forested streams. This apparent paradox can be explained by much higher carbon turnover rates in agricultural streams, driven by enhanced microbial metabolism resulting from environmental changes such as increased light and temperature, greater erosion, and higher nutrient availability (N and P). Thus, agricultural streams rapidly mineralize organic carbon to CO₂ and CH₄, preventing its persistence in the dissolved organic pool.

How to cite: Bondongwe Wombe, M., Drake William, T., Landuyt, D., Barthel, M., Ewango, C., Boeckx, P., and Bauters, M.: Land use change effects on carbon yield in lowland streams of the Congo Basin, EGU General Assembly 2026, Vienna, Austria, 3–8 May 2026, EGU26-15334, https://doi.org/10.5194/egusphere-egu26-15334, 2026.

EGU26-16798 | ECS | Orals | BG4.1

Demand of carbon prevails over nutrients in proglacial streams subjected to glacier retreat: a nutrient manipulation bioassay 

Lukas Hallberg, Nicola Deluigi, Giulia Grandi, Jingyi Hou, Oriana Llanos-Paez, and Matteo Tolosano

Glacier-fed streams across the world’s major mountain ranges are consistently energy limited, contributing low concentrations of bio-reactive organic carbon (C) to downstream recipients. Yet, climate-driven glacial retreat is expected to alter both C and nutrient supply in glacial-fed streams with consequences for downstream elemental fluxes and ecosystem functioning. As sources shift from glacier melt to groundwater and snowmelt, reductions in stream power and turbidity promote primary production, giving rise to a “greening effect” that favours autochthonous supply of organic C. In conjunction, lower flow turbulence may also reduce phosphorus (P) inputs from erosion-driven rock weathering. Yet, the impacts of altered energy and nutrient stoichiometry on microbial energetics and C cycling remain unknown across high-mountain catchments.


In this study, we established chamber bioassays to measure metabolic rates and changes in dissolved organic carbon (DOC), nitrate, and phosphate concentrations over 24 h in, using sediments and stream water from clean ice glacier, rock glacier, and groundwater-fed headwaters, as well as from downstream recipients. Bioassays included three nutrient treatments (C+N, P+N, and C+N+P) together with an ambient stream water control, incubated at 8 °C under dark (12 h) and light (12 h) conditions. Gross primary production and ecosystem respiration metabolism rates were quantified with high resolution optical oxygen monitoring.


We found that both microbial degradation and production of DOC increased in headwaters without clean ice glacier inputs, with the highest metabolic rates and greatest reductions in DOC concentrations observed in sediments receiving rock glacier inputs. The sediments from rock glacier and groundwater-fed headwaters were also C limited, whereas the clean ice glacier showed no response to C additions. Interestingly, we found no evidence for microbial P limitation in any site, despite low ambient P concentrations.


These results demonstrate that microbial C cycling and energy demand in proglacial headwaters can be expected to increase with glacial retreat, imposed by a switch in the microbial communities from chemolithotrophic to heterotrophic and photoautotrophic dominance. Although microbial biomass growth increased and stream water stoichiometry predicted C and P co-limitation, the unexpected absence of P limitation in bioassays suggests flexibility in stoichiometric strategies, allowing for a wide range in C:P ratios of microbial biomass present in proglacial streams. To resolve the impacts of glacial retreat on stream ecosystem functioning, we thus stress the need for complementing indirectly inferred nutrient limitation with direct nutrient manipulation experiments.

How to cite: Hallberg, L., Deluigi, N., Grandi, G., Hou, J., Llanos-Paez, O., and Tolosano, M.: Demand of carbon prevails over nutrients in proglacial streams subjected to glacier retreat: a nutrient manipulation bioassay, EGU General Assembly 2026, Vienna, Austria, 3–8 May 2026, EGU26-16798, https://doi.org/10.5194/egusphere-egu26-16798, 2026.

EGU26-17944 | Posters on site | BG4.1

Lateral transport as a major control for old organic carbon ages in the SW Iberian margin  

Blanca Ausin, Celia Merchán Gómez, Prabodha Lakrani Hewage, Negar Haghipour, Clayton R. Magill, Anna Sanchez-Vidal, Timothy Eglinton, Gesine Mollenhauer, Hendrik Grotheer, Eric Achterberg, Mariem Saavedra-Pellitero, Joseph Dunlop, Minkyoung Kim, Álvaro Fernández Bremer, David Hodell, and Francisco J. Sierro

On continental margins, the vertical flux of particulate organic carbon (POC) attenuates rapidly. However, the role of lateral transport in redistributing and preserving older carbon is a major unresolved question. To quantify these carbon pathways, we integrate data from three complementary sources in the SW Iberian margin, a key mid-latitude region for (paleo)climate studies: a year-long (December 2023-November 2024) sediment trap time-series (four traps intercepting subsurface and deep layers on the mid- and lower slope), discrete-depth in-situ pump sampling (>1000 L per depth) at six stations, and surface sediment samples.

Complementary CTD and hydrographic data revealed distinct water masses: the Eastern North Atlantic Central Water (ENACW; ~50–500 m), underlain by the warm, saline Mediterranean Outflow Water (MOW; 500–1600 m), characterized by elevated turbidity, and the Northeast Atlantic Deep Water (NEADW; >1700 m).

The annual sediment trap record reveals subsurface Δ¹⁴C-POC ranges between -20 and -75‰ (i.e., 100-550 14C yr BP), while deep-water POC shows highly variable, older signatures, varying between -50 and -130‰ (i.e., 350-1070 14C yr BP). A pronounced Δ¹⁴C depletion in May at both moorings, coincident with MOW intensification onshore, signals a major lateral injection of aged carbon.

Along the water column during the oligotrophic season, discrete-depth samples show that POC concentrations peak at the fluorescence maximum (above 100 m depth) before declining sharply. Δ¹⁴C values above 100 m indicate POC that has incorporated bomb-¹⁴C. Below ~100 m, Δ¹⁴C decreases markedly, especially within local turbidity maxima across all water masses. Notably, Δ¹⁴C depletion within the MOW-intermediate nepheloid layer (INL) was not distinct from other INLs, suggesting that lateral transport operates broadly along the margin. Preliminary data indicate higher aluminum (Al) at depth at all stations, suggesting the lateral supply of resuspended sediments. Ongoing Al and δ¹³C-POC analyses will clarify the origin of this and sediment trap material.

In surface sediments, Δ¹⁴C and δ¹³C of sedimentary OC indicate the increase of more recalcitrant (older, potentially terrestrial) OC offshore. Critically, sedimentary OC (¹⁴C age: 875-4800 14C yr BP) is consistently older than coeval, bomb-¹⁴C–bearing planktic foraminifera. This decoupling demonstrates that laterally advected, mineral-protected organic matter is preferentially sequestered, while vertically exported labile carbon is degraded.

Our findings establish lateral transport as a major control on the age and redistribution of OC in this dynamic margin. We conclude that accurate carbon cycling models must explicitly account for lateral supply (particularly via nepheloid layers) as a key mechanism for delivering and preserving aged carbon in deep-sea sediments, challenging the traditional paradigm of vertical export as the principal sequestration pathway.

How to cite: Ausin, B., Merchán Gómez, C., Lakrani Hewage, P., Haghipour, N., Magill, C. R., Sanchez-Vidal, A., Eglinton, T., Mollenhauer, G., Grotheer, H., Achterberg, E., Saavedra-Pellitero, M., Dunlop, J., Kim, M., Fernández Bremer, Á., Hodell, D., and Sierro, F. J.: Lateral transport as a major control for old organic carbon ages in the SW Iberian margin , EGU General Assembly 2026, Vienna, Austria, 3–8 May 2026, EGU26-17944, https://doi.org/10.5194/egusphere-egu26-17944, 2026.

EGU26-17969 | Posters on site | BG4.1

Controls of inputs of reactive nitrogen into the German Bight in the main Estuaries: No two are alike 

Tina Sanders, Gesa Schulz, Louise Rewrie, Andreas Neumann, Vlad-Alexandru Macovei, Yoana Voynova, and Kirstin Dähnke

Estuaries act as biogeochemical filters for organic matter and nutrients transported from rivers into coastal waters, with the balance of turnover processes such as remineralization and nitrification determining whether these are retained, transformed or exported into the coastal ocean. In the German Bight, three main river systems (Ems, Weser and Elbe) provide water and matter inputs. These rivers and their estuaries are heavily impacted by human activities, including dredging, damming and intensive nutrient inputs causing eutrophication, which may substantially alter their biogeochemical filter function. We aim to assess how differing anthropogenic pressures may influence nitrogen transformation processes and, consequently, the efficiency of estuaries as biogeochemical filters.

During an early autumn 2024 cruise on the RV Heincke (HE647), we measured parameters such as salinity, turbidity, oxygen and chlorophyll-a-fluorescence in all three estuaries and sampled nutrients focusing on dissolved inorganic nitrogen (ammonium, nitrite and nitrate) and dual stable isotopes of nitrate. Additionally, nitrification and ammonium uptake rates were determined in the Elbe and Ems estuaries.

All three estuaries were characterized by high nitrate input to coastal waters. However, ammonium uptake and nitrification rates differed substantially among the systems, with the highest uptake observed during a phytoplankton bloom in the coastal outer waters of the Ems Estuary. Our results indicate that suspended matter concentration, oxygen availability and chlorophyll-a-fluorescence are the main factors driving the remineralization and retention of reactive nitrogen in estuarine and coastal waters.

How to cite: Sanders, T., Schulz, G., Rewrie, L., Neumann, A., Macovei, V.-A., Voynova, Y., and Dähnke, K.: Controls of inputs of reactive nitrogen into the German Bight in the main Estuaries: No two are alike, EGU General Assembly 2026, Vienna, Austria, 3–8 May 2026, EGU26-17969, https://doi.org/10.5194/egusphere-egu26-17969, 2026.

EGU26-18525 | Orals | BG4.1

Disentangling multiple stressors in rivers using multivariate biogeochemical spaces 

Tobias Goldhammer and Paula Torre Zaffaroni

Multiple stressors in aquatic systems interact across temporal and spatial scales, which complicates the evaluation of their individual and conjoint effects on water quality and ecosystem functioning. This is particularly complex when gradual changes (e.g. from multi-year droughts to decadal warming) add to the impact of short-termed extreme events (e.g. a heatwave or the sudden disruption of flow). At the same time, focusing on the individual dynamics of water quality/composition indicators as proxies of ecosystem functioning may lead to the underestimation of system-wide sensitivities. Here, we define the ‘biogeochemical space’ of a river system as the realized, two-dimensional configuration of water composition dynamics as captured by non-metric multidimensional scaling of spatially discrete and temporally-resolved monitoring data.

We applied this concept to explore the combined expression of hydrological, meteorological, and anthropic stress in the Lower Oder River, which flows along the German-Polish border, and where an unprecedented harmful algal bloom caused a major environmental disaster in the summer of 2022. Using 20 years of monthly physicochemical data over a 200-km river reach, and in combination with long-term temperature and discharge records, we reconstructed a progressive shift toward increasingly concentrated (ion-enriched) water composition states. This displacement was, on one side, strongly associated with multi-year anomalies in water temperature and in discharge (> 2°C and –40%) caused by drier conditions in the catchment since 2016. On another side, conservative ions showed monotonic increases that could not be explained by short- nor medium-term changes in discharge alone, which confirmed the increased pressure from industry and mining-related salt inputs that are significant in this region. Finally, we further illustrate how the biogeochemical space framework can be used to diagnose diverse responses in other river systems at regional and global scales, and characterize their sensitivities to multiple impacts.

How to cite: Goldhammer, T. and Torre Zaffaroni, P.: Disentangling multiple stressors in rivers using multivariate biogeochemical spaces, EGU General Assembly 2026, Vienna, Austria, 3–8 May 2026, EGU26-18525, https://doi.org/10.5194/egusphere-egu26-18525, 2026.

EGU26-20720 | Posters on site | BG4.1

Methanogenesis from the antidiabetic drug metformin 

Tetyana Gilevska, Stefano Bonaglia, and Amelia-Elena Rotaru

Pharmaceutical compounds are widespread in anoxic environments, yet their direct utilization by methanogens has not been demonstrated. We show that the antidiabetic drug metformin can serve as a substrate for methane production by the obligate methylotroph Methermicoccus shengliensis, representing the first reported case of methanogenesis from pharmaceuticals. Long-term incubations revealed methane production concomitant with 30% metformin consumption over 71 days, accompanied by 7% incorporation of ¹³C-labeled CO₂ into methane, which is lower than the ~30% reported for M. shengliensis during growth on methoxylated coal compounds (1). No methane production or degradation was observed for naproxen, an anti-inflammatory drug, despite its O-methoxy group being structurally similar to methoxylated coal compounds.

Proteomic analyses revealed substrate-specific differences between metformin- and methanol-grown cultures (reference substrate), including overexpression of dimethylamine-methyltransferases and changes in the expression of energy metabolism proteins. A strong stress response was observed, characterized by overexpression of proteins involved in metabolic maintenance and stress mitigation. Several upregulated proteins, along with those associated with potential substrate degradation or transport, were located within predicted horizontally transferred genomic regions.

This study expands the known substrate range of methylotrophic methanogens and identifies pharmaceuticals as a previously unrecognized contributor to anaerobic methane production, with potential implications for subsurface carbon cycling in contaminated environments.


(1) D. Mayumi et al., Methane production from coal by a single methanogen. Science 354, 222-225 (2016).

How to cite: Gilevska, T., Bonaglia, S., and Rotaru, A.-E.: Methanogenesis from the antidiabetic drug metformin, EGU General Assembly 2026, Vienna, Austria, 3–8 May 2026, EGU26-20720, https://doi.org/10.5194/egusphere-egu26-20720, 2026.

EGU26-20745 | ECS | Orals | BG4.1

Spatial and seasonal variability of nutrient export from a subarctic glacial river to the ocean 

Marco Ajmar, Jeffrey P. H. Perez, Helen K. Feord, Anne Eberle, Chiara Bahl, Runa Antony, Anirban Majumder, Sigurdur R. Gislason, Cassidy O'Flaherty, Alex Beaton, Gunnar Sigurðsson, Martyn Tranter, and Liane G. Benning

Glacial rivers play an important role in transporting dissolved and particulate nutrients from glaciers to downstream ecosystems where they influence ocean primary productivity. Abiotic and biotic processes in glacial environments enrich meltwaters with various nutrients. These may undergo changes in concentration and speciation along the river catchments due to lateral inputs or in-channel processes. However, the temporal and spatial variabilities of such nutrient fluxes are poorly constrained.
We monitored diurnal and seasonal changes in nutrient concentrations along a ~120-km long glacier river in Western Iceland. We combined time-resolved in situ chemical analysis using microfluidic sensors for dissolved nitrate (NO3aq) and phosphate (PO43-aq) with in situ temperature, pH, conductivity, and turbidity measurements. We also carried out seasonal sampling along glacier-to-ocean transects of the river catchment and characterized both aqueous and particulate fractions of macro- and micronutrients, dissolved organic matter composition, and DNA.
The in situ sensor data revealed diurnal fluctuations in NO3aq concentrations of up to 1 µM, with a decrease during the day and an increase at night. These diurnal trends were consistent across seasons. In contrast, PO43-aq exhibited seasonal variability, with significant changes related to glacial discharge.  
The glacier-to-ocean transect showed enrichment in dissolved organic carbon (DOC) and iron (Feaq) with increasing distance from the glacier, likely reflecting soil-derived lateral inputs and a variation in DSiaq due to geothermal inputs. Downstream, a link between decreasing PO43-aq and increasing Feaq concentrations may suggest adsorption or coprecipitation processes. Changes in dissolved inorganic nitrogen (DIN) hint at a potential increase in channel microbial uptake along the river path.
Overall, our findings highlight the spatial and temporal variability in nutrient export from glacial rivers to the ocean, showing relative contributions of different nutrient sources across seasons and distance from the glacier.

How to cite: Ajmar, M., Perez, J. P. H., Feord, H. K., Eberle, A., Bahl, C., Antony, R., Majumder, A., Gislason, S. R., O'Flaherty, C., Beaton, A., Sigurðsson, G., Tranter, M., and Benning, L. G.: Spatial and seasonal variability of nutrient export from a subarctic glacial river to the ocean, EGU General Assembly 2026, Vienna, Austria, 3–8 May 2026, EGU26-20745, https://doi.org/10.5194/egusphere-egu26-20745, 2026.

The relative supply of carbon (C), nitrogen (N), and phosphorus (P) to aquatic ecosystems is a key regulator of productivity, nutrient cycling, and food-web dynamics. Several environmental changes in high-altitude regions can directly or indirectly influence carbon (C), nitrogen (N), and phosphorus (P) cycling, retention, and availability through terrestrial, atmospheric, and in-situ aquatic processes, thereby regulating their export to lakes, rivers, and headwater streams.

While increasing concentrations of dissolved organic carbon (DOC) have been widely documented in high-latitude surface waters and increasingly reported for many high-elevation lakes and streams, concurrent long-term trends in nitrogen (N) and phosphorus (P) availability—and associated shifts in elemental stoichiometry—remain poorly constrained, particularly across heterogeneous high-mountain aquatic ecosystems. In these regions, declining atmospheric deposition can directly reduce external nutrient inputs but also indirectly alter soil chemistry and biogeochemical processes, for example by enhancing microbial mineralization of soil organic matter following reductions in soil acidity. At the same time, rapid climate warming and elevated atmospheric CO₂ are promoting increased alpine and subalpine plant productivity and upslope vegetation expansion, potentially enhancing nutrient sequestration in biomass and soils while increasing soil DOC production. Climate-driven shifts in seasonality, including earlier snowmelt, longer growing seasons, and warmer autumns and winters, further influence the timing and magnitude of nutrient uptake, transformation, and mobilization along terrestrial–aquatic flow paths. Finally, fundamental differences in hydrological residence times, internal processing, and network connectivity between lakes and rivers may drive divergent long-term trends in carbon and nutrient stoichiometry, but such cross-ecosystem assessments within high-mountain river networks remain scarce.

Here, we analyzed decadal-scale changes (from 2005 to 2025) in dissolved organic carbon (DOC), dissolved inorganic nitrogen (DIN), and soluble reactive phosphorus (SRP) across 35 sites spanning lakes (n = 14) and rivers and streams (n = 21) within the Pyrenees mountain range. Dissolved organic carbon (DOC) increased consistently across sites, while dissolved inorganic nitrogen (DIN) and soluble reactive phosphorus (SRP) showed widespread declines, largely independent of catchment type or aquatic system. Declines in dissolved inorganic nitrogen (DIN) were most pronounced during the growing season and, together with increasing dissolved organic carbon (DOC) at several sites, suggest enhanced retention of nitrogen by alpine vegetation and soil microbial communities, potentially reinforced by long-term reductions in atmospheric nitrogen deposition. In contrast, declines in soluble reactive phosphorus (SRP) occurred primarily during late autumn and winter, indicating that key biogeochemical controls operate during the non-growing season, potentially linked to reduced physical weathering inputs, altered hydrological pathways, increased sediment retention, and changes in atmospheric deposition

Linking nutrient trends with rising DOC concentrations revealed a consistent shift in elemental ratios across the majority of sites, characterized by increasing carbon availability relative to limiting nutrients. Collectively, these patterns indicate a co-ocurrance of increased DOC (or browning) and oligotrophication of high-mountain lakes and running waters, with likely consequences for primary production, microbial metabolism, and food-web structure in alpine and subalpine aquatic ecosystems under continued climate change.

How to cite: Gómez-Gener, L., Palacín, C., and Camarero, L.: Multi-decadal ecosystem stoichiometric changes across high-mountain Pyrenean aquatic ecosystems driven by reduced acid deposition and climate change, EGU General Assembly 2026, Vienna, Austria, 3–8 May 2026, EGU26-21235, https://doi.org/10.5194/egusphere-egu26-21235, 2026.

EGU26-21516 | ECS | Posters on site | BG4.1

 High Hydrostatic Pressure Activates Microbes to Accelerate Deep-Sea Carbon Recalcitrance 

Huaying Lin and Yu Zhang

The recalcitrant dissolved organic carbon (RDOC) pool in the deep ocean is crucial for long-term carbon sequestration, yet the mechanisms sustaining its stability below 1,000 m remain unclear. While high hydrostatic pressure (HHP) is traditionally viewed as inhibiting microbial activity, its role in regulating DOC transformation is poorly resolved. Here, we isolated the effect of pressure by incubating natural deep-sea DOC with a hadal microbial consortium across a gradient of 20–115 MPa at 4 °C, simulating depths from 2,000 to 11,000 m.

Over 25-day incubations, bulk DOC concentrations remained stable, yet microbial biomass exhibited a non-linear pressure response, peaking at intermediate pressures (20–60 MPa) and declining under higher pressures. Molecular-level analysis via FT-ICR MS revealed that increasing pressure systematically shifted the DOC pool toward higher oxidation states and O/C ratios, lower H/C ratios, and enrichment of carboxyl-rich, heteroatom-poor compounds. These changes were potentially driven by pressure-stimulated formation and persistence of thermodynamically stable DOC, rather than preferential removal of labile substrates. Metagenomic and metatranscriptomic analyses further indicated that HHP enhances oxidative stress responses and upregulates high-energy carbon oxidation pathways, suggesting microbial metabolic reprogramming toward energy maximization under extreme conditions.

Our findings demonstrate that HHP actively reprograms deep-sea microbial metabolism to accelerate DOC recalcitrance, transforming the deep biosphere into an active driver of long-term carbon storage. This challenges the paradigm of the deep sea as a passive carbon reservoir and underscores the need to incorporate pressure-dependent microbial metabolic flexibility into carbon cycle models to better predict oceanic carbon responses under global change.

How to cite: Lin, H. and Zhang, Y.:  High Hydrostatic Pressure Activates Microbes to Accelerate Deep-Sea Carbon Recalcitrance, EGU General Assembly 2026, Vienna, Austria, 3–8 May 2026, EGU26-21516, https://doi.org/10.5194/egusphere-egu26-21516, 2026.

EGU26-21744 | Posters on site | BG4.1

Exploring Metabolic Signals of Mixotrophy in Marine Protists Using Compound-Specific Hydrogen Isotopes 

Marc-Andre Cormier, Jean-Baptiste Berard, Mohammad Ali Salik, Kevin Flynn, and Gael Bougaran

Despite its central role in marine food webs, nutrient cycling, and carbon export, mixotrophy remains difficult to quantify, largely because robust tools for resolving the relative contributions of autotrophic and heterotrophic metabolism in plankton are still lacking. Mixotrophic strategies blur traditional functional classifications and could hypothetically confer ecological advantages under variable environmental regimes. Yet current approaches often rely on bulk physiological rates or grazing experiments that provide only partial or indirect insights into trophic behaviour. As highlighted by Millette et al.(2024), these methodological limitations hinder the integration of mixotrophy into ecosystem and biogeochemical models, underscoring the need for novel, process-based tracers capable of resolving trophic behaviour at the level of cellular metabolism.

Hydrogen isotope ratios (δ²H) in lipids and carbohydrates from aquatic and terrestrial organisms, as well as from sedimentary archives, are widely employed to reconstruct past hydroclimatic conditions. Emerging evidence, however, indicates that δ²H values in these biomolecules also encode metabolic signals in addition to climatic ones (Holloway-Phillips et al., 2025). Such influences complicate straightforward climatic reconstructions and highlight the need to better identify the processes that determine δ²H variability in organic matter. Yet, once these contributions are disentangled, the metabolic information embedded in δ²H values may itself become a valuable tracer for unresolved ecophysiological processes—among them, marine mixotrophy

Previous experimental work has revealed that lipid δ²H values in bacteria (Zhang et al., 2009) and green algae (Cormier et al., 2022) respond specifically to their trophic metabolism. Building on these findings, we present initial experiments with protists designed to test whether δ²H & δ13C values of different biomolecules (including fatty acids, phytols and sterols) similarly reflect shifts in central metabolic pathways. Two complementary experimental systems are compared: continuous cultures of Chlorella under osmo-heterotrophic conditions, and batch cultures of mixoplankton feeding on prey.

These new compound-specific isotope measurements were obtained using gas chromatography–isotope ratio mass spectrometry on the aforementioned compounds from these systems alongside RNA-sec, pigment and physiological data. Our data suggest that lipid δ²H values are indeed sensitive to the degree of heterotrophic growth in diverse protist lineages, pointing to their potential as indicators of metabolic flexibility.

If these relationships can be confirmed and quantitatively calibrated, compound-specific hydrogen isotope analysis could provide a powerful new tool for investigating the prevalence and dynamics of mixotrophy.

References:

Zhang, X. et al. (2009). PNAS. doi:10.1073/pnas.0903030106

Cormier, M.-A. et al. (2022). New Phytologist. doi:10.1111/nph.18023

Millette, N. C. et al. (2024). Journal of Plankton Research. doi:10.1093/plankt/fbad020

Holloway-Phillips, M. et al. (2026). New Phytologist. doi:10.1111/nph.70845

How to cite: Cormier, M.-A., Berard, J.-B., Salik, M. A., Flynn, K., and Bougaran, G.: Exploring Metabolic Signals of Mixotrophy in Marine Protists Using Compound-Specific Hydrogen Isotopes, EGU General Assembly 2026, Vienna, Austria, 3–8 May 2026, EGU26-21744, https://doi.org/10.5194/egusphere-egu26-21744, 2026.

Emerging contaminants, such as pharmaceutical residues, in aqueous environments provide serious threats to public health, aquatic life, and deteriorate water quality, demanding long-term and economical remediation techniques. These drugs are frequently used all around the world, and high residual concentrations are reported in wastewater across continents, including Asia. Biochar has drawn more attention as an adsorbent due to its high stability, surface functional groups, and potential for surface modification. In this study, biochar derived from rice husk was modified using the co-precipitation method to enhance acetaminophen and trimethoprim adsorption. Engineered biochar (surface area = 419 m2/g) easily adsorbed aqueous acetaminophen and trimethoprim (∼8 h equilibrium time) with adsorption capacities of 69.7–137.4 mg/g and 54.2–269 mg/g, respectively, vs. pristine biochar (surface area = 182 m2/g). The Elovich kinetic model (R2 = 0.90-0.99) showed the best correlation for both acetaminophen and trimethoprim. All isotherm models gave R2 > 0.95, suggesting simultaneous sorption processes (monolayer/multilayer and homogeneous/heterogeneous) are taking place. Mg or Al leaching from the adsorbent is well within the drinking water limit and not a concern. Spent adsorbent was regenerated using EDTA, HCl, H₂SO₄, ethanol, and methanol. Potential sorption interactions were hydrogen bonding, pore diffusion, π-π interaction, and electrostatic interactions. These findings demonstrate the potential of engineered biochar as a versatile and sustainable water treatment. The study contributes to advancing green materials for environmental remediation and provides insights for scaling biochar technologies within circular-economy frameworks.

How to cite: Chaubey, A. K. and Mohan, D.: Valorization of Rice Husk into MgO/Al₂O₃-Modified Biochar for Remediating Aqueous Emerging Contaminants , EGU General Assembly 2026, Vienna, Austria, 3–8 May 2026, EGU26-2048, https://doi.org/10.5194/egusphere-egu26-2048, 2026.

EGU26-8744 | ECS | PICO | BG8.7

Development of an extended ASM framework integrating rotifer–ciliate ecological mechanisms for predicting sludge reduction in septic tank systems 

Dongjun Seo, Jaechul Yi, Jaeyun Jung, Hyejoo Yoon, Jiyoun Kim, Gi Seok Kwon, and Hee Deung Park

Abstract

Continuous accumulation of sludge in septic tank systems causes reduced treatment efficiency and increased maintenance costs. However, existing Activated Sludge Models (ASM) are limited to bacterial trophic levels, failing to quantitatively explain sludge reduction mechanisms driven by higher-level predators. This study proposes a novel extended model integrating the ecological dynamics of rotifers and ciliates, based on the Storage-Growth framework of ASM3. The model functionally divides the bacterial community into Bacteria Biomass (XB) and Filamentous Biomass (XFB), and incorporates ciliates (XP) and rotifers (XR) that selectively graze on them, comprising a total of 16 state variables and 13 processes. Specifically, the model mathematically structures predator grazing not merely as biomass conversion, but as a process mediated by internal storage products (XSTO) involving respiration and maintenance metabolism during famine conditions. Differential analysis of Total Suspended Solids (XSS) demonstrated that, in addition to conventional endogenous respiration, the additional carbon mineralization occuring at the predation stage is a key mechanism for sludge reduction. Furthermore, the model suggests the potential for controlling sludge bulking through rotifer predation on filamentous bacteria. By introducing ecological interactions into process modeling, this study provides an advanced quantitative framework capable of simultaneously predicting sludge reduction efficiency and operational stability in septic tanks.

Acknowledgements

Following are results of a study on the "Convergence and Open Sharing System" Project, supported by the Ministry of Education and National Research Foundation of Korea

How to cite: Seo, D., Yi, J., Jung, J., Yoon, H., Kim, J., Kwon, G. S., and Park, H. D.: Development of an extended ASM framework integrating rotifer–ciliate ecological mechanisms for predicting sludge reduction in septic tank systems, EGU General Assembly 2026, Vienna, Austria, 3–8 May 2026, EGU26-8744, https://doi.org/10.5194/egusphere-egu26-8744, 2026.

EGU26-9302 | ECS | PICO | BG8.7

Nutrient Removal in Algal-Bacterial Consortia Treating Secondary Effluent During Light-Dark Cycles 

Styliani Biliani and Ioannis Manariotis

The scope of this study was to evaluate different environmental factors that affect the ability of algal-bacteria consortia to remove nutrients. The dark-cycle nitrogen removal process was investigated, providing valuable insights for improving wastewater treatment systems. The behavior of the consortia was examined under various illumination regimes (continuous 24-h light and a 12:12 h light-dark cycle) and varying aeration conditions (0 to 12 h and 0 to 24 h of air supply). Continuous light exposure combined with continuous aeration resulted in the highest nitrate and phosphorus removal. The results indicated that light duration had a greater effect on nutrient removal than air supply. When light and aeration were stopped after 12 hours, the zero‑order removal rate constants during the dark period decreased by 36% for nitrates and 55% for phosphorus compared with the 24‑hour light and aeration condition. Nitrate removal occurred more rapidly than phosphorus removal in the light and slightly faster in the dark. Although nutrient removal during the dark phase decreased approximately 58% for nitrates and 45% for phosphorus relative to the light phase, it did not cease entirely, even when the culture was refed without additional aeration. These findings demonstrate that algal-bacteria consortia can efficiently remove nitrates and phosphorus from wastewater, even in the absence of light, offering important information for the design and optimization of outdoor algal-based wastewater treatment systems.

How to cite: Biliani, S. and Manariotis, I.: Nutrient Removal in Algal-Bacterial Consortia Treating Secondary Effluent During Light-Dark Cycles, EGU General Assembly 2026, Vienna, Austria, 3–8 May 2026, EGU26-9302, https://doi.org/10.5194/egusphere-egu26-9302, 2026.

EGU26-13324 | ECS | PICO | BG8.7

Evaluation of the effectiveness of nature-based solutions to reduce the impact on water quality of farmyard runoff  

Fulu Zhuang, Simon Harrison, Martha Gosch, and William Burchill

Point source pollution from farmyard runoff can be a significant pressure on surface water quality in agricultural catchments with large uncertainty around the extent of these losses between farms and across seasons. Targeted natural-based solutions, such as willow filter beds and bunded drain systems, are currently being funded and deployed on Irish farms to intercept contaminated farmyard runoff before it enters receiving waters. However, field-based evidence of their effectiveness under variable farm management and hydrological conditions is limited.

This study presents an ongoing monitoring program aimed at (1) characterizing the physio-chemical characteristics of farmyard runoff across different farms and seasons and (2) evaluating the mitigation performance of small-scale willow filter beds (n = 6) and bunded drains (n = 2) installed on Irish farms in 2025. Water sampling consisted of monthly grab samples collected at the mitigation system inlets, internal treatment cells, and outlets, and was analyzed for pH, electrical conductivity (EC), dissolved oxygen (DO), total suspended solids (TSS), and nitrogen and phosphorus species. Sampling at the inlets allowed for the determination of physio-chemical parameters of farmyard runoff, which were also compared to the outlet values to determine the effectiveness of the mitigation systems. This abstract focuses on pH, EC, DO, and TSS data collected during the initial monitoring period from October to December 2025. Initial nitrogen and phosphorus concentration samples are currently under analysis and will be presented at the conference.

Preliminary observations indicate pronounced temporal variability in the composition of farmyard runoff, particularly in response to variability in farmyard runoff flow rates. Across the monitored farms and three sampling dates, inlet water quality exhibited substantial variability, with mean (Min-Max) TSS concentrations of approximately 120 mg L-1 (4-320 mg L-1), pH of 7.2 ( 5.3-9.2), EC of 900 µS cm-1 ( 40-1860 µS cm-1), and DO concentrations of 6 mg L-1 ( 0.2-11.3 mg L-1).

Early-stage analysis suggests attenuation of suspended sediment across the mitigation systems, with mean (Min-Max) outlet TSS concentrations of 60 mg L-1 ( 0.4-174 mg L-1), generally lower than those observed at the inlets. This reduction is accompanied by a reduction of the EC at the outlets to a mean (Min-Max) of 450 µS cm-1 (118-1074 µS cm-1). These patterns were most apparent during periods when flow conditions were sufficient to generate outlet discharge, enabling the comparison between inlets and outlets.

This study will continue for two years to encompass a wider range of seasonal dynamics, farmyard management conditions and additional water quality parameters, enabling a more comprehensive evaluation of farmyard runoff composition and mitigation effectiveness of these nature-based solutions as they mature.

How to cite: Zhuang, F., Harrison, S., Gosch, M., and Burchill, W.: Evaluation of the effectiveness of nature-based solutions to reduce the impact on water quality of farmyard runoff , EGU General Assembly 2026, Vienna, Austria, 3–8 May 2026, EGU26-13324, https://doi.org/10.5194/egusphere-egu26-13324, 2026.

EGU26-14095 | ECS | PICO | BG8.7

Evaluating the efficacy of short rotation willow coppice in attenuating phosphorus from small-scale wastewater treatment works’ effluent 

Suman Acharya, Raymond Wilson, Gabriel Gaffney, Chris Johnston, and Phil Jordan

Phosphorus (P) discharge from sewage treatment works remains a significant source of P pollution in freshwater systems. While a wide range of P-removal technologies have been successfully implemented at large wastewater treatment works (WWTWs), their application in small-scale systems is often constrained by high capital and operational costs, technical complexity, and highly variable influent flows. Consequently, P releases from small treatment works can have disproportionate and localised impacts on receiving freshwaters, leading to severe ecological degradation. These impacts are likely to intensify under climate change, particularly during prolonged dry periods associated with low or zero-flow conditions given reduced or zero discharge dilution. Nature-based solutions offer a potential treatment option for P removal in small-scale systems while delivering additional environmental benefits. However, the suitability of these approaches has not yet been extensively studied. Therefore, this study evaluated the performance and applicability of zero-discharge willow biofiltration system for attenuating P discharged from two small-scale WWTWs in Ireland. The experimental design comprised approximately 1.5 ha of mixed variety willow plantation at each site, irrigated with primary-treated wastewater using automated, sequential time-dosed irrigation systems. Using a before-after approach, stream P concentrations, measured as soluble reactive phosphorus (SRP), were monitored upstream and downstream of WWTW discharge points using automated samplers with hourly sampling over a period of 24 hours. Sampling was conducted following three rain-free days each month between March and November over different years. The results showed that, prior to wastewater diversion to irrigate the willow plantation, downstream SRP concentrations were substantially higher than upstream concentrations at both sites, with the highest concentrations observed during the summer months. Following the diversion of wastewater, the difference in SRP concentrations between upstream and downstream sites became negligible, indicating more than 95% of P attenuated through the willow biofiltration system. Ongoing work includes studying the fate of irrigated P to evaluate soil P saturation and P uptake in biomass.   


Keywords: Short rotation willow coppice, Effluent, Phosphorus, Wastewater treatment works

How to cite: Acharya, S., Wilson, R., Gaffney, G., Johnston, C., and Jordan, P.: Evaluating the efficacy of short rotation willow coppice in attenuating phosphorus from small-scale wastewater treatment works’ effluent, EGU General Assembly 2026, Vienna, Austria, 3–8 May 2026, EGU26-14095, https://doi.org/10.5194/egusphere-egu26-14095, 2026.

EGU26-15234 | PICO | BG8.7

Evaluating fungal-based nature-based solutions for agricultural drainage treatment 

Lipe Renato Dantas Mendes, Hannah Walling, Philip Schuler, Lucy Crockford, Paul Quinn, Stephanie Terreni-brown, Toby Parkes, Ellie Morris, Mark Wilkinson, and Marc Stutter

Diffuse nutrient pollution from agricultural runoff remains a major pressure on freshwater systems, contributing to eutrophication and downstream ecosystem degradation. Nature-based solutions (NbS) that can be deployed close to source are increasingly sought as cost-effective and multifunctional alternatives to conventional treatment approaches. Mycoremediation, using fungi to transform or retain contaminants, has potential but remains largely untested for promoting nutrient concentration and load reductions in agricultural drainage waters. Through a tiered experimental framework, we evaluate fungal-based filter matrices designed to treat agricultural runoff, with a primary focus on nitrate (NO₃⁻) and phosphate (PO₄³⁻) removal. This presentation focuses on the design, comparative performance, and field evaluation of fungal-based NbS for agricultural drainage treatment.

Filters combine organic and inorganic substrates selected to promote fungal colonisation and sustained biogeochemical activity. Saprotrophic fungal strains originating from England and Scotland were isolated, genetically confirmed, and screened under laboratory conditions to assess nutrient uptake performance. Column experiments enabled the shortlisting of substrate–fungal combinations with the strongest nutrient removal potential. Selected combinations were then tested in channel-scale experiments simulating agricultural drainage conditions using water enriched with NO₃⁻ and PO₄³⁻. We quantify upstream and downstream nutrient concentrations, dissolved oxygen dynamics, and redox potential within the filter media to assess conditions conducive to denitrification and nutrient retention. In parallel, continuous water quality monitoring is being used to assess filter performance under real-world hydrological and chemical variability across multiple agricultural sites in England and Scotland.

Data collection is ongoing and results are not yet conclusive; however, the combined laboratory, mesocosm, and field datasets will provide a robust evaluation of mycoremediation filters as scalable NbS for mitigating diffuse agricultural nutrient pollution.

How to cite: Dantas Mendes, L. R., Walling, H., Schuler, P., Crockford, L., Quinn, P., Terreni-brown, S., Parkes, T., Morris, E., Wilkinson, M., and Stutter, M.: Evaluating fungal-based nature-based solutions for agricultural drainage treatment, EGU General Assembly 2026, Vienna, Austria, 3–8 May 2026, EGU26-15234, https://doi.org/10.5194/egusphere-egu26-15234, 2026.

EGU26-16103 | ECS | PICO | BG8.7

When Wastewater Is a Social Dilemma: Individual and Collective Choices in Technology Adoption 

Kyra Selina Hagge, Poonam Arora, Gregory Howard, and Stephen Moysey

In many human–environment systems, individual actions influence community behavior and environmental outcomes and can be characterized as social dilemmas. In regional wastewater management, decisions made at the household level, such as the choice between individual septic systems and community-scale treatment options like cluster septic systems, collectively shape water quality outcomes at the watershed scale. While innovative wastewater technologies can reduce nutrient and contaminant loads, their effectiveness ultimately depends on adoption and appropriate use by households and communities.

Using a large-scale survey that includes a stated preference experiment conducted in the United States, with a focus on North Carolina (N = 2,068), we examine how willingness to pay (WTP) for improved wastewater treatment technologies varies depending on how individuals conceptualize the underlying interdependent decision context. We classify respondents’ decision-making into four archetypal mixed-motive games: Maximum Difference, Assurance, Chicken, and Prisoner’s Dilemma, and analyze differences in WTP across these mental representations. Results show that respondents, on average, favor individual solutions (advanced septic systems) over collective solutions (cluster septic systems) and are willing to pay a premium for the individual option. We interpret this premium as the cost of cooperation, reflecting perceived risks and governance challenges associated with collective wastewater management. As nature-based technologies and other alternative approaches rely on human cooperation on multiple levels, our findings provide valuable behavioral context for design and implementation of innovative water quality interventions. 

How to cite: Hagge, K. S., Arora, P., Howard, G., and Moysey, S.: When Wastewater Is a Social Dilemma: Individual and Collective Choices in Technology Adoption, EGU General Assembly 2026, Vienna, Austria, 3–8 May 2026, EGU26-16103, https://doi.org/10.5194/egusphere-egu26-16103, 2026.

EGU26-19236 | ECS | PICO | BG8.7

An Integrated Computational Framework for the Advanced Design of Vegetated Filter Strips in Agricultural Landscapes 

Iñigo Barberena, Rafael Muñoz-Carpena, Miguel Ángel Campo-Bescós, and Javier Casalí

Effective management of agricultural runoff is essential to safeguard water quality and promote sustainable land use. Vegetative filter strips (VFS), areas of dense vegetation established between pollution sources and receiving surface waters, are widely implemented as a nature-based solution to mitigate nutrient and sediment export from agricultural fields. Their performance is commonly assessed using established computer models such as VFSMOD. While VFSMOD provides a robust, physically-based representation of VFS performance, its conventional application is largely deterministic, limiting its ability to address the intrinsic environmental variability and uncertainty on VFS design for environmental management.

This work presents a new computational tool consisting of a graphical user interface built upon VFSMOD, specifically developed to enhance the design and assessment of vegetative filter strips under variable conditions. The cross-platform tool extends VFSMOD by incorporating a hypothesis-testing framework for model calibration based on observational data. Once calibration is achieved, the tool supports an advanced VFS design phase in which input uncertainty is considered and mitigation performance in terms of both efficiency and reliability.

The methodology was applied to a real-world agricultural setting. The case study demonstrates how the proposed tool facilitates robust VFS design while explicitly accounting for input uncertainty. Results indicate improved decision support compared with the previous user interface used to run VFSMOD.


How to cite: Barberena, I., Muñoz-Carpena, R., Campo-Bescós, M. Á., and Casalí, J.: An Integrated Computational Framework for the Advanced Design of Vegetated Filter Strips in Agricultural Landscapes, EGU General Assembly 2026, Vienna, Austria, 3–8 May 2026, EGU26-19236, https://doi.org/10.5194/egusphere-egu26-19236, 2026.

EGU26-20597 | ECS | PICO | BG8.7

Nitrogen dynamics and removal within a riparian zone used as a nature-based solution for secondary-treated wastewater 

Laura Escarmena, Núria Roca, Sílvia Poblador, Stefania Mattana, Àngela Ribas, Santi Sabaté, Teresa Sauras-Yera, Jenny Solís-Llerena, and Francesc Sabater

Wastewater treatment plant (WWTP) effluent discharge is one of the main pressures in Mediterranean non-perennial streams because of their low dilution capacity. The concentration of nutrients present in effluents leads to the aggravation of the quality of those ecosystems. As an alternative discharge approach, a Mediterranean riparian zone has been used as a nature-based solution (NbS) to remove nitrogen from NH4-rich effluents (3 mg/L). The effluent was discharged through an intermittent horizontal subsurface flow across a 250 m2 riparian soil area located in a Mediterranean basin. The system operated during spring and summer of 2021 and 2023. Effluent application periods (wet conditions) alternated with drainage periods (dry conditions) at a 1:1 ratio.

We conducted sampling campaigns under both conditions and compared them with a control zone. We assessed the removal efficiency of NH4 and NO3 and the impact of the discharge on their concentrations in soil and groundwater. We also measured the N2O soil emissions along with the expression (mRNA) of key microbial functional genes related to nitrification (archaeal and bacterial amoA) and denitrification (nirK and nosZ).

We found mean removal efficiencies of 50% for NH4 and 23% for NO3, similar to those reported for other NbS such as constructed wetlands. As expected, NH4 increased in both groundwater and soil, while NO3 decreased, with concentrations varying between wet and dry periods. Effluent application triggered a significant increase in N2O emissions, also showed a spatial pattern across the riparian zone. The hillslope zone -where the NH4 rich effluent was applied- presented the highest emissions mainly linked to nitrification. The near‑stream zone, characterized by higher soil moisture, had the lowest emissions, consistent with conditions favoring denitrification. Gene expression patterns confirmed the coupling between both processes. Under wet conditions, we found significant positive correlations between N2O and archaeal amoA expression, as well as with nitrifiers/denitrifiers ratio, suggesting that N2O production was more strongly influenced by nitrification. Moreover, we found positive correlations between amoA and nirK genes. The negative correlation between N2O and nosZ/nirK ratio, in addition to high nosZ/nirK ratio values, indicated that wetter conditions favored complete denitrification. Nevertheless, resulting emissions were generally one order of magnitude lower than those of other NbS and like those of riparian zones.

Overall, the biogeochemical heterogeneity of riparian soils, combined with flow intermittency and the NH4 load from wastewater, enhanced both nitrification and denitrification. This resulted in an effective system for nitrogen removal.

How to cite: Escarmena, L., Roca, N., Poblador, S., Mattana, S., Ribas, À., Sabaté, S., Sauras-Yera, T., Solís-Llerena, J., and Sabater, F.: Nitrogen dynamics and removal within a riparian zone used as a nature-based solution for secondary-treated wastewater, EGU General Assembly 2026, Vienna, Austria, 3–8 May 2026, EGU26-20597, https://doi.org/10.5194/egusphere-egu26-20597, 2026.

EGU26-21152 | ECS | PICO | BG8.7 | Highlight

Integrating social and environmental evidence to support the development of effective fungal-based filters for agricultural water remediation 

Hannah Walling, Lipe Renato Dantas Mendes, Lucy Crockford, Ellie Morris, Toby Parkes, Philip Schuler, Marc Stutter, Mark Wilkinson, and Stephanie Terreni-Brown

Water quality management in agricultural catchments remains a critical environmental and societal challenge. Whilst nature-based solutions (NbS), such as mycoremediation (the use of fungi to remediate contamination and remove pollutants) offer potentially resilient alternatives to conventional approaches, their widespread adoption is often constrained by social, practical and governance barriers. 


This presentation explores the role of stakeholder engagement in shaping the design, implementation, and upscaling of fungal-based filtration systems developed to intercept agricultural runoff at source. Building on ongoing field trials of mycoremediation filters, primarily targeting nitrate (NO₃⁻) and phosphate (PO₄³⁻) removal, we employed mixed-methods engagement framework to compliment practical results found in the field. Participants included a range of experienced practitioners, including farmers, land managers and regulators. 


Engagement activities helped identify perceived benefits and risks of filter deployment, practical constraints related to land use, regulations, maintenance and costs, and opportunities for interaction with existing farm infrastructure and agri-environmental schemes. Coupling stakeholder-derived insights and iterative in-field testing of filter design is refining the research to prioritise environmentally effective and operationally feasible solutions. This work demonstrates how integrating social and environmental evidence can support the transition of NbS from experimental trials, to scalable, catchment-scale interventions, contributing to more inclusive and sustainable water quality management. 


How to cite: Walling, H., Renato Dantas Mendes, L., Crockford, L., Morris, E., Parkes, T., Schuler, P., Stutter, M., Wilkinson, M., and Terreni-Brown, S.: Integrating social and environmental evidence to support the development of effective fungal-based filters for agricultural water remediation, EGU General Assembly 2026, Vienna, Austria, 3–8 May 2026, EGU26-21152, https://doi.org/10.5194/egusphere-egu26-21152, 2026.

Dissolved organic matter (DOM) is found across all freshwater systems and originates from soils, leaf litter and leachate from plant material and the decomposition processes. However, as a consequence of a combination of changes in both land use practices and climate change there has been a recorded increase in DOM export in freshwater systems over the last number of years. High concentrations of Dissolved Organic Matter (DOM) in water react with chlorine during treatment, forming harmful disinfection by-products (DBPs) such as trihalomethanes (THMs) and chloroform. There are numerous options available to mitigate and treat DBPs as part of the water treatment process, including a range of technologies and management procedures which aim to reduce contact between DOM precursors and disinfectants. Nevertheless, protection of the water at source represents an alternative and likely additional activity which could act to reduce DBP formation in drinking water in a more cost effective and efficient way.

Source Water Protection (SWP) through the use of Nature Based Solutions and other methodologies has been widely implemented in many regions of the world to improve raw water quality. However, compared with other potential contaminants such as microbial pathogens, very little work has specifically focused on the reduction of DOM input to water treatment plants. This study examines the potential effectiveness of SWP measures at reducing organic matter with the aim of minimising human exposure to DBPs in drinking water. A review was undertaken to identify SWP measures considered most likely to mitigate against DOM, pinpointing five key land use categories linked to DOM loading: forestry, peatland, agriculture, lakes/reservoirs, and wastewater treatment. Measures were assessed based on their proven effectiveness at reducing DOM or other relevant pollutants. Input was gathered from the Irish water sector via a focus group and survey to evaluate the feasibility of implementing these measures at catchment scale. The findings suggest there is a potential role for SWP for the mitigation of DOM in source water leading to improved DBP management in conjunction with treatment plant improvements and upgrades. However, there is currently a lack of evidence-based research demonstrating the effectiveness of SWP measures in mitigating against DOM and DBP formation which is a significant barrier to the uptake and implementation of such measures. In addition, active and participatory approaches to education and support in this area will encourage stakeholders to shift their perception from an end of pipe only solution to a multi-barrier approach to reduce the overall risk of DBP contamination of drinking water.


How to cite: Molloy, K. and McCarthy, V.: Potential source water protection measures to mitigate against organic matter based on its pathway and process of contamination using Ireland as a case study., EGU General Assembly 2026, Vienna, Austria, 3–8 May 2026, EGU26-21826, https://doi.org/10.5194/egusphere-egu26-21826, 2026.

EGU26-22099 | ECS | PICO | BG8.7

Resource-oriented sanitation and the SDGs: a target-level interaction assessment in the Austrian context 

Tamara Vobruba, Marco Hartl, Cecilia Delgado, Günter Langergraber, Verena Germann, and Ines Costa- Pereirae

Resource-oriented sanitation (ROS) is increasingly discussed as an innovative approach for circular resource use, yet its cross-sectoral sustainability implications are rarely assessed at the level of specific Sustainable Development Goal (SDG) targets. An expert-based scoring approach adapted from Nilsson et al. (2016) was applied within the Austrian UniNEtZ project to assess interactions between ROS and 123 SDG targets. The analysis identified 42 non-neutral interactions, particularly related to water management, nutrient cycling, food production, resource efficiency, health, innovation, and governance. ROS has the potential to improve water quality and reduce pollution loads through direct sanitation pathways as well as indirect effects linked to the reuse of reclaimed water and nutrients, with decentralised and nature-based solutions representing important implementation pathways. The identified interactions were contextualised through a food-system perspective to examine cross-sectoral pathways relevant for integrated governance and policy-relevant sustainability assessment in infrastructure-mature contexts.

How to cite: Vobruba, T., Hartl, M., Delgado, C., Langergraber, G., Germann, V., and Costa- Pereirae, I.: Resource-oriented sanitation and the SDGs: a target-level interaction assessment in the Austrian context, EGU General Assembly 2026, Vienna, Austria, 3–8 May 2026, EGU26-22099, https://doi.org/10.5194/egusphere-egu26-22099, 2026.

In recent decades, eutrophication, caused by the enrichment of nutrients in the water bodies
(mostly due to N and P), has emerged as a global environmental challenge with far-reaching
consequences for aquatic ecosystems health. ZeoPhos, an innovative eco-friendly clay-based
material, promises to simultaneously adsorb ammonium and orthophosphate ions, causing
eutrophication, from natural freshwaters. ZeoPhos consists of natural zeolite with a synergistic
combination of iron, calcium, and humic ions to enhance nutrient-binding affinity. Material
characterisation analysis (such as SEM/EDS and TEM) confirms that ZeoPhos successfully
altered the surface morphology and elemental composition, creating a more reactive surface for
adsorption. Batch adsorption kinetic experiments demonstrated high efficiency at achieving
removal rates of 78% and 70% for ammonium and orthophosphate ions, respectively. Pseudo-
second-order model of the kinetic studies suggests that the removal process is governed by
chemisorption, while the Langmuir model of isotherm studies indicate monolayer adsorption
onto a finite number of sites. The maximum adsorption capacities were 28.61mg/g and
27.13mg/g for ammonium and orthophosphate ions, respectively. ZeoPhos is an innovative,
economic and eco-friendly adsorbent material of high-capacity, capable of dual-nutrient
adsorption and ultimately promising to mitigate eutrophication in freshwater bodies.

How to cite: Biliani, I. and Zacharias, I.: Dual-nutrient removal from eutrophic freshwater using ZeoPhos: Synthesis, characterization, and adsorption mechanisms of a multi-ion modified zeolite., EGU General Assembly 2026, Vienna, Austria, 3–8 May 2026, EGU26-23225, https://doi.org/10.5194/egusphere-egu26-23225, 2026.

EGU26-493 | ECS | Orals | CL3.2.4

Storyline-based climate attribution reveals strong intensification of 2018-2022 multi-year droughts in Europe 

Ray Kettaren, Antonio Sanchez-Benitez, Helge Goessling, Marylou Athanase, Rohini Kumar, Luis Samaniego, and Oldrich Rakovec

Prolonged summer droughts represent a significant and growing threat across Europe, as their persistence hinders hydrological recovery and severely impacts water resources, ecosystems, and agricultural systems under ongoing climatic warming. These extended dry periods can create soil-moisture deficits, ecological stress, and amplified heat extremes. Understanding the response of multi-year droughts to different warming levels is vital for shaping both adaptation and mitigation strategies.

In this study, we investigate the behaviour and severity of the 2018-2022 European multi-year soil moisture drought across a range of climate warming levels. We apply an innovative storyline attribution approach, which enables a physically consistent comparison of the same drought sequence under different climate conditions. Specifically, we utilise spectrally nudged AWI-CM-1-1-MR, constrained to follow observed synoptic-scale circulation from ERA5, to force the mesoscale Hydrologic Model (mHM). This modelling setup allows us to specifically isolate how anthropogenic warming modifies soil-moisture deficits, without altering the real-world atmospheric conditions that triggered the drought sequence.

Under the present-day climate conditions, the 2018-2022 drought produced a soil-moisture deficit of -44 (±11.8) km3, affecting 0.63 (±0.07) million km2 (11.5% of the study area). In the absence of anthropogenic climate change (pre-industrial climate conditions), the 2018-2022 multi-year event would have shown a soil moisture surplus nearly double the magnitude of present-day losses, with drought spatial extent only about one-third of current levels. Future warming levels further exacerbate these impacts. With warming of 2 K to 4 K, the losses increase from -82 (±6.6) to -256 (±7.1) km3, while drought extent expands from approximately 16% to 43%.

Overall, our results demonstrate that rising global temperatures substantially intensify multi-year droughts by both enlarging their spatial footprint and deepening hydrological deficits. As climate warming increases the likelihood that single-year droughts transition into persistent multi-year events, the findings emphasise the urgent need for effective climate mitigation and adaptation strategies across Europe. A full version of this work is currently under review in Earth’s Future; the preprint can be accessed at https://doi.org/10.22541/au.176220208.89936181/v1 . 

How to cite: Kettaren, R., Sanchez-Benitez, A., Goessling, H., Athanase, M., Kumar, R., Samaniego, L., and Rakovec, O.: Storyline-based climate attribution reveals strong intensification of 2018-2022 multi-year droughts in Europe, EGU General Assembly 2026, Vienna, Austria, 3–8 May 2026, EGU26-493, https://doi.org/10.5194/egusphere-egu26-493, 2026.

EGU26-505 | ECS | Orals | CL3.2.4

Climate archetypes of simultaneous global crop failures  

Tamara Happé, Raed Hamed, Weston Anderson, Chris Chapman, and Dim Coumou

Most of the world's food is produced in a handful of countries, the so-called breadbaskets of the world. Due to climate change, there is an increasing risk of crop failures, due to compounding hot and dry extremes. Furthermore, certain climate drivers – through  teleconnections – have shown to lead to simultaneous crop failures around the globe. This highlights the importance to understand which climate processes drive global crop yield variability. Here we show global crop yield failures (Maize, Soya, Wheat, Rice, and combined) are associated with La Nina-like sea surface temperature (SST) anomalies, using Archetype Analysis. The adverse crop-yield archetypes show simultaneous hot-dry-surface imprints across the world, highlighting these high risk crop failure scenarios are driven by climate extremes. Our results demonstrate the importance in understanding the climate drivers of global crop production, and highlights the deep uncertainty associated with a changing climate. The response of ENSO due to anthropogenic activities is not yet fully understood and climate models often inaccurately reproduce the observed La Nina trends. Thus the fact that our results indicate that simultaneous crop failures are linked to La Nina like SSTs, highlights the deep uncertainty we currently face regarding food security in the future. 

How to cite: Happé, T., Hamed, R., Anderson, W., Chapman, C., and Coumou, D.: Climate archetypes of simultaneous global crop failures , EGU General Assembly 2026, Vienna, Austria, 3–8 May 2026, EGU26-505, https://doi.org/10.5194/egusphere-egu26-505, 2026.

EGU26-537 | ECS | Orals | CL3.2.4

Linking Emissions from Fossil Fuel Megaprojects to Lifetime Climate Extremes Across Generations and Multi-Century Committed Change  

Amaury Laridon, Wim Thiery, Rosa Pietroiusti, Chris Smith, Joeri Rogelj, Jiayi Zhang, Carl-Friedrich Schleussner, Inga Menke, Harry Zekollari, Lilian Schuster, Alexander Nauels, Matthew Palmer, and Jacob Schewe

Carbon bombs comprise 425 fossil fuel megaprojects whose cumulative potential emissions exceed by at least a factor of two the remaining global carbon budget compatible with the Paris Agreement. The full exploitation of these projects would therefore generate substantial additional warming. As high-impact climate extremes intensify with each increment of warming, a central challenge is to quantify how emissions from individual projects translate into concrete physical and societal impacts across current and future generations. 

Within the Source2Suffering project, we develop a modelling framework that links project-level CO₂ and CH₄ emissions to lifetime exposure to six categories of high-impact climate extremes, including heatwaves, droughts, and floods, using a storyline-based approach. The framework also quantifies each project’s contribution to committed glacier mass loss and multi-century sea-level rise. By explicitly representing uncertainties, it provides probabilistic estimates of how warming increments induced by individual fossil fuel projects propagate through physical processes to generate compound and cascading risks. 

The results reveal marked spatial and intergenerational inequalities in exposure. These arise from (i) physical mechanisms that amplify extreme hazards in many regions of the Global South, and (ii) demographic trends that concentrate most of the world’s present and future population in these highly affected areas. By establishing a tractable link between specific emission sources, the physical drivers of high-impact extremes, and their long-term societal consequences, this framework contributes to the development of scientifically grounded information to support climate mitigation efforts. 

How to cite: Laridon, A., Thiery, W., Pietroiusti, R., Smith, C., Rogelj, J., Zhang, J., Schleussner, C.-F., Menke, I., Zekollari, H., Schuster, L., Nauels, A., Palmer, M., and Schewe, J.: Linking Emissions from Fossil Fuel Megaprojects to Lifetime Climate Extremes Across Generations and Multi-Century Committed Change , EGU General Assembly 2026, Vienna, Austria, 3–8 May 2026, EGU26-537, https://doi.org/10.5194/egusphere-egu26-537, 2026.

EGU26-1535 | ECS | Orals | CL3.2.4

Regional aerosol changes modulate the odds of record-breaking heat extremes 

Florian Kraulich, Peter Pfleiderer, and Sebastian Sippel

Record-breaking heat extremes imply large health risks and can disrupt critical infrastructure, because societies are often adapted only up to previously observed extremes. Understanding how new records evolve is therefore essential. The probability of record-breaking heat events depends on the regional warming rate. This rate is mainly driven by greenhouse gas-induced global warming and has increased in recent decades. The resulting annual probability of record-breaking heat extremes is additionally modified in a nonlinear way by other regional forcing changes, such as aerosols. Because aerosol concentrations have changed substantially in many regions, they can amplify or reduce the annual likelihood of exceeding previous temperature records. 

We first analyze single forcing large ensemble simulations that isolate the effects of aerosols and greenhouse gases. In Europe, decreasing aerosol concentrations have increased the regional warming rate and thereby the probability of record-breaking heat extremes by about 35% today. In contrast, in South Asia, where aerosol concentrations are increasing, we find a dampening of record-breaking probabilities of about 40%. To evaluate the effect of near-future aerosol reductions, we use simulations from the Regional Aerosol Model Intercomparison Project (RAMIP). In RAMIP, aerosol emissions are reduced from SSP3-7.0 to SSP1-2.6 either globally or only in selected regions. This allows us to analyze the regional effects of aerosol reductions as well as their remote responses. In general, aerosol reductions lead to an increased probability of record-breaking heat extremes.

Finally, we examine recent observed record-breaking events and evaluate whether their regional frequency matches the expected record breaking probabilities from model simulations. We expect that changes in aerosol concentrations contribute to changes in the annual record-breaking probability in regions with major aerosol concentration changes in recent decades, such as Europe, North America, East Asia, and South Asia. Overall, these results suggest that changes in aerosol concentrations are important for the present and near-future probability of record-breaking heat extremes.

How to cite: Kraulich, F., Pfleiderer, P., and Sippel, S.: Regional aerosol changes modulate the odds of record-breaking heat extremes, EGU General Assembly 2026, Vienna, Austria, 3–8 May 2026, EGU26-1535, https://doi.org/10.5194/egusphere-egu26-1535, 2026.

EGU26-2212 * | Orals | CL3.2.4 | Highlight

Challenges and Opportunities for Understanding Societal Impacts of Climate Extremes 

Gabriele Messori, Emily Boyd, Joakim Nivre, and Elena Raffetti

Climate extremes exact a heavy and differential toll on society. Reported economic losses are primarily concentrated in developed economies, whereas reported fatalities occur overwhelmingly in developing economies. Moreover, even at single locations the adverse impacts of extreme climate events are often unequally distributed across the population. Understanding such impacts holds enormous societal and economic value, and is a key step towards climate resilience and adaptation. Recent research advances include improved impact forecasting and enhanced understanding of how the interaction between human and natural systems shapes the impacts of climate extremes. Nonetheless, there are some key challenges that have hindered progress. We focus on three: Limited availability and quality of impact data, difficulties in understanding the processes leading to impacts and lack of reliable impact projections. We argue that newly released datasets and recent methodological and technical advances open a window of opportunity to address several dimensions of these challenges. Notable examples include extracting impact information from textual sources using large language models and developing impact projections using data-driven approaches. Moreover, interdisciplinary collaborations between the social and natural sciences can elucidate processes underlying past climate impacts and enable building storylines of future societal impacts. We call for building momentum in seizing these opportunities for a breakthrough in the study of impacts of climate extremes. Achieving meaningful progress will require interdisciplinary and intersectoral research, and strong collaboration across academic, policy and practitioner communities.

How to cite: Messori, G., Boyd, E., Nivre, J., and Raffetti, E.: Challenges and Opportunities for Understanding Societal Impacts of Climate Extremes, EGU General Assembly 2026, Vienna, Austria, 3–8 May 2026, EGU26-2212, https://doi.org/10.5194/egusphere-egu26-2212, 2026.

EGU26-2537 | ECS | Orals | CL3.2.4

Dry and moist convective upper bounds for extreme surface temperatures 

Quentin Nicolas and Belinda Hotz

How hot can heatwaves get in a given region of the world? The current pace of climate change challenges the statistical methods traditionally used to answer this question. An alternative approach is to seek a physics-based upper bound to extreme surface temperatures (Ts). Recent work proposed to address this problem using the hypothesis that convective instability limits the development of heat extremes. Here, we show that under this hypothesis, the absolute upper bound for extreme Ts --- obtained in the limit of zero surface humidity --- is set by dry convection: that is, this bound is reached when the mid-troposphere and the surface are connected by a dry adiabat. Previous work suggested that this upper bound is instead set by moist convective instability and is several degrees hotter. We resolve this discrepancy by showing that moist convection only limits heatwave development when surface specific humidity is larger than a threshold, and that the moist convective upper bound cannot exceed the dry limit. Yet, numerous temperature profiles in observational and reanalysis records do exceed the dry convective limit. We show that these occur exclusively in regions with an extremely deep boundary layer and where a daytime superadiabatic layer develops near the surface. We conclude with an overview of the different upper bounds applicable in dry and moist scenarios, including the roles of processes such as entrainment and convective inhibition.

How to cite: Nicolas, Q. and Hotz, B.: Dry and moist convective upper bounds for extreme surface temperatures, EGU General Assembly 2026, Vienna, Austria, 3–8 May 2026, EGU26-2537, https://doi.org/10.5194/egusphere-egu26-2537, 2026.

EGU26-2749 | Posters on site | CL3.2.4

Co-occurrence of large hail and heatwaves in European regions in current and future climate scenarios 

Ellina Agayar, Brennan Killian, Iris Thurnherr, and Heini Wernli

Large hail and heatwaves are among the most extreme weather phenomena, posing serious risks to human health, ecosystems, and infrastructure, while also leading to significant economic losses. However, the co-occurrence of large hail and heatwaves, and the potential physical mechanisms linking these two phenomena, remain poorly understood. In this study, we investigate the climatology of large hail and the atmospheric drivers of large hail and heatwave co-occurrences across selected European regions, using an 11-year convection-permitting climate simulation with the COSMO regional climate model (2011–2021). In addition, we assess how these extremes may evolve under future climate conditions (+3°C global warming).

Results show increases in large hail frequency across Europe in a warmer climate. In central and eastern regions, the frequency rises approximately 20 %, whereas in the Alpine, Mediterranean, and Baltic regions it nearly doubles. Exceptions are France and Spain, where large-hail frequency declines by 26% and 33%, respectively. Also, there is a notable correlation between the occurrence of heatwaves and large hail across central and eastern Europe.  This relationship is less evident in southern Europe, due to large hail occurs mainly in autumn storms caused by large-scale disturbances. Additionally, large hail during heatwave days is forms in environments with higher median values of most-unstable convective available potential energy and 2 m temperature than large hail in the absence of heatwaves. A spatiotemporal analysis revealed that the days leading up to large hail events increasingly coincide with heatwave conditions. In the present climate, large hail is most often found within ~500 km of heatwave boundaries, both inside and outside them. The future climate scenario indicates a spatial shift of large hail events beyond the heatwave extent across all continental domains.

How to cite: Agayar, E., Killian, B., Thurnherr, I., and Wernli, H.: Co-occurrence of large hail and heatwaves in European regions in current and future climate scenarios, EGU General Assembly 2026, Vienna, Austria, 3–8 May 2026, EGU26-2749, https://doi.org/10.5194/egusphere-egu26-2749, 2026.

EGU26-2967 | ECS | Posters on site | CL3.2.4

Separating dynamic and thermodynamic contributions in Mediterranean extreme precipitation (in a storyline approach) 

Cosimo Enrico Carniel, Reto Knutti, and Erich Fischer

Extreme precipitation in the Mediterranean basin emerges from a complex interaction between large-scale circulation, moisture transport and mesoscale dynamics, making the most damaging events difficult to sample in conventional climate simulations. This work presents a storyline-based framework to explore  very rare and  extreme rainfall under present and future climate conditions. 

We apply ensemble boosting to the fully coupled CESM2 model to generate alternative realizations of the most intense precipitation events affecting the Southern Alps and the Spanish Mediterranean coast. Starting from a 35 member parent ensemble of CESM2, these occurrences are identified and resimulated through boosted ensembles, resulting in a large sets of dynamically consistent trajectories that preserve the synoptic evolution of the original event while sampling its internal variability by perturbing the initial conditions. Comparisons with ERA5 reanalysis and available observations are performed to assess the realism of the simulated circulation patterns and precipitation characteristics associated with these extreme events. 

Preliminary results demonstrate that ensemble boosting successfully reproduces the temporal evolution of reference precipitation extremes, with many boosted members closely matching the timing and peak intensity of the parent events. In several cases, individual boosted realizations exceed the peak intensity of the reference simulation, revealing physically consistent more intense scenarios within the same large-scale setup. The amplification potential depends strongly on the perturbation lead time: short lead starts tend to cluster near the reference intensity, whereas longer lead times display a broader ensemble spread and occasionally generate substantially stronger or delayed rainfall peaks. 

In a second step, a conditional attribution methodology is applied in which the large-scale circulation is constrained while the thermodynamic background is modified to represent different climate states. This allows us to isolate the thermodynamic contribution of climate change to extreme precipitation intensity, providing physically interpretable estimates of how much more intense these events become in a warmer climate. 

By bridging weather-scale event evolution with climate-scale statistics, this approach provides new insight into the physical limits of Mediterranean extreme precipitation and offers a robust basis for assessing future extreme rainfall scenarios. 

How to cite: Carniel, C. E., Knutti, R., and Fischer, E.: Separating dynamic and thermodynamic contributions in Mediterranean extreme precipitation (in a storyline approach), EGU General Assembly 2026, Vienna, Austria, 3–8 May 2026, EGU26-2967, https://doi.org/10.5194/egusphere-egu26-2967, 2026.

EGU26-3456 | ECS | Orals | CL3.2.4

Demonstrating the plausibility of worst-case month-long heatwave storylines in Western Europe 

Florian E. Roemer, Erich M. Fischer, Robin Noyelle, and Reto Knutti

What are the worst-case heatwaves that are plausible in the present or near-future climate? Model-based experiments using ensemble boosting, a computationally efficient method to simulate unprecedented extremes, suggest that month-long heatwaves that break previous records by more than 5 K across Germany and France are possible in the near future. But how can we assess the plausibility of these heatwaves unprecedented in the observational record? We here test whether the most extreme simulated month-long heatwaves in Germany and France are consistent with current process understanding and with historical heatwaves.
We show that despite their extreme record-breaking characteristics both events cannot be ruled out as implausible. To demonstrate this, we compare these two worst-case events with historical heatwaves in the reanalysis record. To this end, we calculate standardized anomalies relative to a time-evolving climatology of relevant physical variables such as temperature, 500 hPa geopotential, surface solar radiation, and soil moisture. We focus on two different worst-case events — one in Germany and one in France — which exhibit distinct characteristics and physical drivers. The event in Germany features extreme anomalies in most physical drivers, particularly those associated with land-atmosphere feedbacks, and features three short heatwaves in quick succession. In contrast, the event in France mostly features less extreme anomalies in these drivers and consists of one less intense but very persistent heatwave caused by anomalously weak zonal flow combined with above-average southerly winds. Using a multilinear statistical model and comparing with historical analogues, we show that the characteristics and physical drivers of both events are consistent with current process understanding and with historical events.

How to cite: Roemer, F. E., Fischer, E. M., Noyelle, R., and Knutti, R.: Demonstrating the plausibility of worst-case month-long heatwave storylines in Western Europe, EGU General Assembly 2026, Vienna, Austria, 3–8 May 2026, EGU26-3456, https://doi.org/10.5194/egusphere-egu26-3456, 2026.

EGU26-3579 | ECS | Posters on site | CL3.2.4

ERA5-Based Validation of Thermodynamic Extreme Heatwave Drivers of the Paris region in CMIP6 simulations. 

Maeve Mayer, Sylvie Parey, Claire Petter, Soulivanh Thao, and Pascal Yiou

Previous studies have argued that the upper bound of temperature extremes in mid-latitude regions is reached by minimizing near-surface moisture during high low-tropospheric temperatures. Here, we revisit these theories for the Île-de-France region using the ERA5 reanalysis and show that the highest annual temperatures occur within the moist-to-expected range of the summer (June–August) near-surface humidity distribution. However, during the most extreme events, relative humidity is minimized as soil moisture approaches the wilting point and the atmospheric boundary layer deepens. Using the statistical distributions of these indicators and their temporal evolution in ERA5, we evaluate the representation of thermodynamic drivers in selected CMIP6 large ensembles. Finally, we apply a recently published revised framework of dry convective instability to estimate maximum attainable temperatures in both ERA5 and CMIP6, highlighting how climate change may modify heatwave dynamics in the Paris region.

How to cite: Mayer, M., Parey, S., Petter, C., Thao, S., and Yiou, P.: ERA5-Based Validation of Thermodynamic Extreme Heatwave Drivers of the Paris region in CMIP6 simulations., EGU General Assembly 2026, Vienna, Austria, 3–8 May 2026, EGU26-3579, https://doi.org/10.5194/egusphere-egu26-3579, 2026.

EGU26-4070 | ECS | Orals | CL3.2.4

Enhancing impact monitoring by using computational text analyses 

Mariana Madruga de Brito, Jingxian Wang, Jan Sodoge, Ni Li, and Taís Maria Nunes Carvalho

Climate extremes, such as floods, heatwaves, and droughts, have myriad impacts across natural and social systems. However, traditional methods used for monitoring impacts tend to focus on single hazards or indicators (e.g., fatalities), address only quantitative consequences (e.g., economic losses), and frequently overlook indirect and social consequences (e.g., conflicts, mental health). Here, we show how text data can be used to measure the societal impacts of climate extremes across diverse text sources, including newspapers, social media, and Wikipedia articles.

First, we analyze over 26,000 newspaper articles on the July 2021 river floods in Germany to reveal cascading impacts across sectors like infrastructure, water quality, mental health, and tourism. Second, Twitter data from the 2022 drought in Italy is used to map public concern and perceived consequences, which align with observed socioeconomic indicators. Finally, we scale our analysis globally with Wikimpacts 1.0, a database of climate impacts extracted from 3,368 Wikipedia articles covering 2,928 events from 1034 to 2024, providing national and sub-national records of deaths, injuries, displacements, damaged buildings, and economic losses.

Together, these case studies illustrate the value of text-derived impact datasets for complementing traditional monitoring approaches. We also discuss the challenges of using such datasets, including representational biases, uneven temporal and spatial coverage, and differences in how impacts are reported. We conclude by discussing how the field can move towards shared standards and best practices, enabling more comparable and transparent use of text data for monitoring the impacts of climate extremes.

How to cite: Madruga de Brito, M., Wang, J., Sodoge, J., Li, N., and Nunes Carvalho, T. M.: Enhancing impact monitoring by using computational text analyses, EGU General Assembly 2026, Vienna, Austria, 3–8 May 2026, EGU26-4070, https://doi.org/10.5194/egusphere-egu26-4070, 2026.

EGU26-4263 | ECS | Orals | CL3.2.4

Why was the 2023 jump in global temperature so extreme? 

Julius Mex, Christophe Cassou, Aglaé Jézéquel, Sandrine Bony, and Clara Deser

Global surface air temperature (GSAT) reached unprecedented heights in 2023. The record of year-to-year temperature increases was surpassed by a significant margin, especially in early boreal fall. We attribute the majority of this seasonal jump to the onset and maturing stages of the 2023 El Niño event. Using a process-based analysis of multiple observational datasets, we show that the uniqueness of the 2023 event can be largely related to the La Niña-like ocean-atmosphere background state upon which it developed.
This resulted in (1) a steep year-to-year increase of Sea Surface Temperature (SST), particularly in mean atmospheric subsidence regions, leading to extreme reduction of low-cloud-cover and giving rise to a record-breaking change in the radiative budget over the central and eastern Indo-Pacific; (2) anomalous sustained precipitation over climatological high SSTs in the Western Pacific, fueling unusual diabatic heating and an exceptionally early increase in tropical tropospheric temperature in boreal fall, ultimately influencing the GSAT jump with an additional contribution from the North Atlantic.
Our study improves the understanding of the interactions between interannual internally-driven processes and changes in mean climate background state, which a changing background is crucial to assess the evolution and modulation of anthropogenically-driven trends.

How to cite: Mex, J., Cassou, C., Jézéquel, A., Bony, S., and Deser, C.: Why was the 2023 jump in global temperature so extreme?, EGU General Assembly 2026, Vienna, Austria, 3–8 May 2026, EGU26-4263, https://doi.org/10.5194/egusphere-egu26-4263, 2026.

EGU26-4462 | ECS | Orals | CL3.2.4

Future cost of climate change for humanitarian crises 

Juha-Pekka Jäpölä, Anna Berlin, Charlotte Fabri, Arthur Hrast Essenfelder, Sepehr Marzi, Karmen Poljanšek, Michele Ronco, Steven Van Passel, and Sophie Van Schoubroeck

Humanitarian crises are the tip of the iceberg in climate change adaptation, yet their future is rarely quantified in human and economic terms. We use machine learning to simulate future estimates of people in need of humanitarian aid and required funding under the business-as-usual scenario (SSP2-RCP4.5) with warming of 2.1–2.4°C by 2100. Humanitarian needs rise to a baseline of 410±22 million people and USD2024 64±8 billion annually by 2050 worldwide, increases of 28% and 30% respectively compared to the current (320 million people and USD 49 billion). A lightly optimistic simulation holds needs near the current, while a medium pessimistic simulation leads to 614±68 million people and USD2024 96±19 billion by 2050, increases of 92% and 96% respectively. Our results show empirical vulnerabilities and an opportunity cost, as resources for crisis response displace funding for adaptation and mitigation. Yet, sustained investment could curb the impacts even with climate inertia.

How to cite: Jäpölä, J.-P., Berlin, A., Fabri, C., Hrast Essenfelder, A., Marzi, S., Poljanšek, K., Ronco, M., Van Passel, S., and Van Schoubroeck, S.: Future cost of climate change for humanitarian crises, EGU General Assembly 2026, Vienna, Austria, 3–8 May 2026, EGU26-4462, https://doi.org/10.5194/egusphere-egu26-4462, 2026.

EGU26-4864 | ECS | Posters on site | CL3.2.4

Assessing the UNSEEN Flood-Relevant Winter Extreme Precipitation Over the Island of Ireland in the Present Climate 

Mohamed Bile, Conor Murphy, and Peter Thorne

Ireland’s winters are getting wetter, with more frequent heavy precipitation events increasing flooding risk across the Island. Extreme precipitation is a key driver of flooding in northwestern Europe; however, observational records are relatively short and represent only a single realisation of the climate state. As a result, they are inadequate for sampling low-likelihood, high-impact flood-relevant extreme precipitation events and for quantifying plausible maxima of such extremes. In this study, we quantify plausible maxima for flood-relevant winter precipitation under the current climate. We apply the UNprecedented Simulated Extremes using Ensembles (UNSEEN) approach to the flood-relevant winter precipitation indices (Rx1day, Rx5day, and Rx30days), using daily winter observations, the ECMWF SEAS5 seasonal prediction systems, and the CANARI Single Model Initial-condition Large Ensemble (SMILE) over the Island of Ireland. These indices are consistently derived across observations, pooled SEAS5 winter ensembles (ensemble member x lead times), and the CANARI SMILE. Model fidelity for CANARI and ensemble independence, stability, and fidelity for pooled SEAS5 are assessed to ensure that both models realistically represent extreme precipitation. Preliminary results indicate that both SEAS5 and the CANARI sample the physically plausible Rx1day and Rx5day extremes that exceed the maximum observed in the current climate, while neither system produces UNSEEN values exceeding the observed maximum Rx30day.  The CANARI large ensemble passes the fidelity test without bias correction, whereas the SEAS5 passes the fidelity test after applying simple multiplicative mean scaling bias correction. For CANARI, plausible maxima are approximately 18.01% higher for Rx1day and 20.77% higher for Rx5day than observed maxima, while Rx30day plausible maxima are approximately 8.70% lower than the highest observed Rx30day. For SEAS5, plausible maxima exceed observations by approximately 3.05% for Rx1day and 17.68% for Rx5day, while Rx30day plausible maxima are approximately 17.74% lower than the highest observed. These results highlight the limitations of observational records in sampling extreme tails and indicate that CANARI SMILE captures a broader range of internal climate variability than the initialised SEAS5 seasonal prediction system. They also show that UNSEEN ensembles are more effective at sampling short-duration precipitation extremes (Rx1day and Rx5day) than longer-duration accumulation precipitation extremes (Rx30day). Our study highlights the value of combining the UNSEEN approach with both seasonal prediction systems and SMILEs to better understand unprecedented flood-relevant precipitation extremes in the current climate.

How to cite: Bile, M., Murphy, C., and Thorne, P.: Assessing the UNSEEN Flood-Relevant Winter Extreme Precipitation Over the Island of Ireland in the Present Climate, EGU General Assembly 2026, Vienna, Austria, 3–8 May 2026, EGU26-4864, https://doi.org/10.5194/egusphere-egu26-4864, 2026.

Many countries rely on international trade to ensure food security. With climate change and projected increases in the frequency and severity of extreme weather events, a significant portion of currently traded crops is vulnerable to climate extremes. While many studies have quantified the impact of extreme weather on crop production, few have linked these impacts to international trade and analyzed how future risks differ from the past. In this study, I combined crop modeling with FAOSTAT on crop and food trade data to identify the worst-case scenario in which extreme weather affects global staple crop trade. Six staple crops were included in the analysis. Probability distributions of each crop’s production were estimated for both historical and future periods under the 2020 crop distribution baseline. The worst-case scenario was determined based on the amount of traded crop affected in the past and future climates. The results provide insight into how future risks differ from historical patterns and whether international trade can continue to ensure food security under changing climate conditions.

How to cite: Su, H.: Identify the worst-case scenario where extreme weather has the greatest impact on the global staple crop trade, EGU General Assembly 2026, Vienna, Austria, 3–8 May 2026, EGU26-5916, https://doi.org/10.5194/egusphere-egu26-5916, 2026.

EGU26-8004 | ECS | Posters on site | CL3.2.4

Better serving impact assessments via AI: Reconstructing daily extremes from spatiotemporal downscaling of monthly fields 

Yu Huang, Sebastian Bathiany, Shangshang Yang, Michael Aich, Philipp Hess, and Niklas Boers

Climate impact assessment studies strongly depend on fine representations of meteorological fields. Downscaling addresses the trade-off between data requirements and storage capacity, yet the faithful replication of extreme-value statistics and spatiotemporal consistency presents a persistent issue. We present an efficient generative AI model for spatiotemporal downscaling. Using coarse-resolution monthly fields as inputs, the model reconstructs sequences of daily fields with the enhanced spatial resolution. The AI-generated daily fields accurately reproduce spatial coherence, temporal persistence, and extreme-value characteristics, showing strong agreement with ground-truth daily observations. We look forward to applying this framework more effectively to future studies on the impacts of extreme events. 

How to cite: Huang, Y., Bathiany, S., Yang, S., Aich, M., Hess, P., and Boers, N.: Better serving impact assessments via AI: Reconstructing daily extremes from spatiotemporal downscaling of monthly fields, EGU General Assembly 2026, Vienna, Austria, 3–8 May 2026, EGU26-8004, https://doi.org/10.5194/egusphere-egu26-8004, 2026.

EGU26-8241 | ECS | Posters on site | CL3.2.4

A process-based physical climate storyline for the Hercules storm in Portugal: extreme coastal flooding under climate change 

Gil Lemos, Pedro MM Soares, Ricardo Simões, Carlos Antunes, Ivana Bosnic, and Celso Pinto

In the beginning of 2014, exceptionally energetic swells associated with the Hercules storm (also known as “Christina”) produced one of the most devastating coastal events ever recorded in Portugal. Between January 6th and 7th, coastal flooding affected more than 30 municipalities along the Portuguese coastline, with offshore buoys registering maximum individual wave heights and periods of 14.91 m and 28.10 s, respectively. The storm resulted in more than 16 million euros in direct damages due to overtopping and coastal flooding, while indirect losses (considering affected businesses and populations) are estimated to have reached hundreds of millions of euros. In this study, two physical climate storylines are developed to assess the impacts of a “Hercules”-like storm, at five key-locations along the Portuguese coastline, occurring by the end of the 21st century, under the combined influence of sea-level rise (SLR), projected changes in wave climate, and altered coastal morphology, while retaining the same statistical representativeness observed in 2014. The storyline approach enables a clear linkage to the original event and facilitates the assessment of future extreme events such as Hercules within the context of a changing climate, supporting decision-making by working backwards from specific vulnerabilities or decision points. Results indicate that the impacts of a future Hercules-like storm are projected to intensify, considering SLR and increases in high-percentile wave energy. Extreme coastal flooding is expected to affect 1.9 to 2.4 times more area than in 2014, resulting in 3.2 to 6.5 times more physically impacted buildings, particularly in densely urbanized coastal sectors. As coastal erosion is expected to reduce the natural protection of Portuguese sandy coastlines, the currently employed protection mechanisms will require robust adaptation measures, strategically defined to withstand long-return-period extreme events.


This work is supported by FCT, I.P./MCTES through national funds (PIDDAC): LA/P/0068/2020 - https://doi.org/10.54499/LA/P/0068/2020, UID/50019/2025, https://doi.org /10.54499/UID/PRR/50019/2025, UID/PRR2/50019/2025. The authors would like also to acknowledge the project “Elaboração do Plano Municipal de Ação Climática de Barcelos (PMACB).

How to cite: Lemos, G., MM Soares, P., Simões, R., Antunes, C., Bosnic, I., and Pinto, C.: A process-based physical climate storyline for the Hercules storm in Portugal: extreme coastal flooding under climate change, EGU General Assembly 2026, Vienna, Austria, 3–8 May 2026, EGU26-8241, https://doi.org/10.5194/egusphere-egu26-8241, 2026.

EGU26-9101 | Posters on site | CL3.2.4

Hot-dry compound events in the European Alps: Multi-century assessment (1600-2099 CE) indicates the need for fast adaptation 

Raphael Neukom, Tito Arosio, Alessandra Bottero, Anne Kempel, Veruska Muccione, Christian Rixen, Kerstin Treydte, and Pierluigi Calanca

Compound hot–dry events have recently led to severe consequences globally, often triggering cascading impacts across ecological and socio-economic systems. Currently, most analyses of hot–dry extremes rely on short observational records or projections, limiting evaluation against pre-industrial variability—the climatic range to which many natural and human systems adapted over centuries. This makes it difficult to place impacts of the increased intensity and frequency of compound events in an appropriate context for examining adaptation needs.

Here we leverage a unique data coverage in the Swiss Alps to quantify changes in summer mean climate and in compound hot–dry extremes and their associated return periods from 1600 to 2099 CE. Data used include multi-century temperature and atmospheric drought reconstructions from tree rings going back to 1600 CE, instrumental station records, and local-scale climate projections for 1981-2099.

Copula-based modelling shows that summers classified as extreme in pre-industrial conditions have become common in today's climate and are expected to correspond to cold and wet conditions by the end of the century. Our analysis further shows that the hot–dry conditions witnessed in summer 2003—characterized by simultaneous positive temperature and vapor pressure deficit (VPD) anomalies of 5.3°C and 2.6 hPa relative to the pre-industrial mean, respectively—were unprecedented over at least the past 400 years and are projected to remain rare until the end of the century under RCP2.6. By contrast, they are likely to occur every 2-3 years under RCP4.5 and even to become colder and wetter than average by 2070-2099 under RCP8.5, since in the latter case, temperature and VPD anomalies are projected to exceed pre-industrial conditions by 10.4°C and 8.1 hPa in the extreme case (30-year return period).

Without countermeasures, the consequences of these changes will include, among other things, dramatic losses in agricultural production and undesirable changes in forest ecosystem dynamics. Ultimately, our analysis suggests that rapid adaptation is necessary to avoid facing more frequent extreme heat and drought conditions than those observed under pre-industrial conditions. Under RCP8.5, in particular, socio-ecological systems will need to continuously adapt within 15 years to changes in the average climate to avoid facing high-impact hot-dry compound event frequencies higher than those experienced at any time over the past 400 years. Given that adaptation in mountain regions is currently not keeping up with the realized and projected climate impacts, as pointed out in several studies, we argue that the required speed of adaptation can pose substantial challenges for alpine societies.

How to cite: Neukom, R., Arosio, T., Bottero, A., Kempel, A., Muccione, V., Rixen, C., Treydte, K., and Calanca, P.: Hot-dry compound events in the European Alps: Multi-century assessment (1600-2099 CE) indicates the need for fast adaptation, EGU General Assembly 2026, Vienna, Austria, 3–8 May 2026, EGU26-9101, https://doi.org/10.5194/egusphere-egu26-9101, 2026.

EGU26-9800 | ECS | Posters on site | CL3.2.4

Sensitivity of Storm Boris rainfall intensification to wind nudging strength in event-based climate-change storyline simulations 

Antonio Sánchez Benítez, Marylou Athanase, and Helge F. Goessling

Understanding how climate change influences environmental extremes is vital for developing effective adaptation and mitigation strategies. In this study, we apply an event-based storyline approach to assess changes in accumulated precipitation associated with Storm Boris, which impacted Central Europe in September 2024. We examine both historical changes (attribution) and future projections and extend previous work by investigating the sensitivity of results to the degree of imposed dynamical constraint. Using the global CMIP6 coupled climate model AWI-CM1, we nudge simulations toward observed ERA5 winds—including the jet stream—across a range of climate backgrounds: preindustrial, present-day, and possible future states with 2, 3, and 4 °C global warming relative to preindustrial conditions. Two nudging configurations are compared: (1) a “weak constraint” configuration, in which only synoptic- and planetary-scale winds in the free troposphere are nudged, permitting some dynamical adjustment with warming; and (2) a “strong constraint” configuration, in which winds at all vertical levels and scales are imposed, thereby completely suppressing dynamical changes.

Both configurations capture the event, with stronger present-day rainfall in the strongly constrained configuration. The observed climate change between pre-industrial and present day is robust, with increases of 7% (4%) in accumulated rainfall under the weak (strong) constraint. Projections up to a 3ºC warmer climate show linear increases in the accumulated rainfall for both configurations. Beyond +3ºC, the response strongly diverges. Under weak constraint, rainfall changes at +4ºC are marginal or even mildly reduced relative to present-day, whereas the strongly constrained configuration continues to show linear increases. This divergence is linked to thermally-driven dynamical adjustments permitted under weak constraint. Whether these adjustments reflect a realistic response or methodological artifacts, and whether similar behaviour occurs in other events, remains to be explored. Our results highlight remaining uncertainties in storyline-based extreme precipitation projections, and demonstrate the importance of considering multiple possibilities.

How to cite: Sánchez Benítez, A., Athanase, M., and Goessling, H. F.: Sensitivity of Storm Boris rainfall intensification to wind nudging strength in event-based climate-change storyline simulations, EGU General Assembly 2026, Vienna, Austria, 3–8 May 2026, EGU26-9800, https://doi.org/10.5194/egusphere-egu26-9800, 2026.

EGU26-10410 | ECS | Orals | CL3.2.4

Extreme rainfall attribution distorted by structural warming biases in climate models 

Damián Insua Costa, Marc Lemus Cánovas, Martín Senande Rivera, Victoria M. H. Deman, João L. Geirinhas, and Diego G. Miralles

While the performance of climate models in simulating the magnitude of global warming has been extensively assessed, their fidelity in representing the three-dimensional (3-D) structure of warming, and how this affects extreme event attribution, remains poorly understood. Pseudo-global-warming experiments implicitly assume that imposed anthropogenic warming perturbations realistically capture the observed vertical and horizontal distribution of atmospheric temperature change. However, this assumption is rarely evaluated explicitly.

We diagnose 3-D structural warming discrepancies by comparing a representative set of six CMIP6 climate models against ERA5 temperature trends over 1940–2024. We show that widely used models exhibit systematic vertical and horizontal warming biases, typically over-amplifying warming in the mid-to-upper troposphere while damping the response near the surface, particularly across Northern Hemisphere mid-latitudes. We further show that these structural biases propagate into substantially different estimates of extreme rainfall intensification.

Using an ensemble of 81 high-resolution MPAS simulations within a storyline attribution framework, we analyze the October 2024 Valencia flood-producing storm as a high-impact case study. The diagnosed anthropogenic rainfall signal is highly sensitive to the 3-D structure of the imposed warming: CMIP6-based counterfactual experiments yield weak reductions in extreme rainfall (~10%), whereas observation-constrained warming profiles produce a stronger and more significant anthropogenic contribution (~30%). This amplification arises from enhanced low-level moistening and increased convective instability, together with dynamically consistent upper-level flow strengthening. The results confirm that 3-D warming structure is a first-order control on extreme-rainfall attribution, and that persistent model-structural errors can lead to a systematic underestimation of attribution signals in mid-latitude, high-impact precipitation extremes.

How to cite: Insua Costa, D., Lemus Cánovas, M., Senande Rivera, M., M. H. Deman, V., L. Geirinhas, J., and G. Miralles, D.: Extreme rainfall attribution distorted by structural warming biases in climate models, EGU General Assembly 2026, Vienna, Austria, 3–8 May 2026, EGU26-10410, https://doi.org/10.5194/egusphere-egu26-10410, 2026.

EGU26-10755 | ECS | Posters on site | CL3.2.4

Ensemble boosting of extreme precipitation in the Alps 

Laurenz Roither, Andreas F. Prein, Erich Fischer, and Neil Aellen

The Alps, with their complex topography, important geographic location and varying climatic influences have become a highly vulnerable region. Especially extreme precipitation and its associated impacts - from floods to landslides - are directly amplified by this distinct local environment.

Because observational timeseries are rather short and sample only limited locations, the impact-producing extreme tail of the precipitation distribution remains largely unexplored. In addition, the non-stationarity of the climate system makes data from a past climate less useful for gaining insights into current and future conditions. Coarse resolution global climate models can be used to produce long simulations including rare extreme events, but important processes such as topographic forcing and deep convection are poorly resolved, which limits physical interpretability. A different approach is needed to produce robust and actionable climate information on the local scales required for stress testing, early warning, adaptation and risk mitigation.

We suggest expanding the method of Ensemble Boosting into the realm of high-resolution modeling. We employ a global ICON setup with 10-20 km grid spacing with a two-way nested kilometer-scale European domain. Our initial goal is to simulate the 2013 Northern Alps flooding using ERA5 initial conditions. We asses lead time sensitivities for reinitializing simulations to optimize for variability and intensity within the boosted ensemble. We expect to produce physically consistent, interpretable and realistic storylines based on a historic extreme precipitation event in the Alps. These storylines enable us to assess driving processes and test physical limits of extreme precipitation in today’s climatic conditions.

With the current focus on a specific region and event we want to exercise a proof of concept embedded in a user-oriented framework. Next steps include producing a catalogue of extremes sampling across event types with the goal to physically constrain the extreme tail of precipitation distributions to reduce uncertainty in extreme value estimation, and to estimate return periods. Further applications of our approach could also be focused on climate projections or pseudo global warming simulations to gain insights into possible extremes in future climates.

How to cite: Roither, L., Prein, A. F., Fischer, E., and Aellen, N.: Ensemble boosting of extreme precipitation in the Alps, EGU General Assembly 2026, Vienna, Austria, 3–8 May 2026, EGU26-10755, https://doi.org/10.5194/egusphere-egu26-10755, 2026.

This study investigates the impact of climate change on the extreme 2020 Meiyu over the middle and lower reaches of the Yangtze River (MLYR) through global variable-resolution ensemble subseasonal hindcasts. Results reveal that post-1980 climate change enhanced the 2020 extreme Meiyu rainfall over the MLYR region by approximately 17.19% at monthly scale, while simultaneously decreasing light and moderate precipitation frequency but intensifying heavy and extreme precipitation occurrences. Climate change intensified the low-pressure over northern China and southern China while weakening the Western Pacific subtropical high and the low-pressure over the Indian Peninsula. The circulation pattern results in significant shear between northeasterly and northwesterly winds in the southern MLYR region, contrasting with the high-pressure dominance in the northern MLYR region. This configuration suppressed convergence, vertical motion, and precipitation in the northern MLYR while enhancing these processes along its southern. Comparison between frequently re-initialized and subseasonal simulations further demonstrates that subseasonal simulations, by allowing full development of interactions between regional systems and large-scale circulation, more realistically represent climate change impacts on Meiyu season. In contrast, the frequently updated initial conditions in re-initialized simulations constrain such feedback processes. This study highlights the importance of utilizing global variable-resolution simulations at subseasonal-scale for climate attribution studies. Future studies would benefit from improved subseasonal forecasting capabilities to enhance attribution reliability.

How to cite: Xu, M. and Zhao, C.: Investigating Climate Change Impacts on the 2020 extreme Meiyu Through Global Variable-Resolution Ensemble Subseasonal Hindcasts, EGU General Assembly 2026, Vienna, Austria, 3–8 May 2026, EGU26-11244, https://doi.org/10.5194/egusphere-egu26-11244, 2026.

EGU26-11790 | Posters on site | CL3.2.4

Exploring the changing dynamics of atmospheric blocking with a modified event-based storyline approach 

Wenqin Zhuo, Antonio Sánchez-Benítez, Marylou Athanase, Thomas Jung, and Helge Gößling

How atmospheric circulation patterns associated with extreme weather respond to climate change remains a challenging question. To explore this issue, we combine spectral nudging in a global climate model (AWI-CM1) with hindcasts, similar to ensemble boosting, in an event-based storyline framework. We examine the dynamic response to climate change of selected atmospheric blocking events associated with winter cold-air outbreaks and summer heatwaves in Eurasia. First, the large-scale circulation during the preconditioning phase of a blocking is constrained by spectral nudging toward reanalysis data, ensuring that the synoptic and planetary-scale environment is realistically and consistently reproduced in different climate backgrounds. The nudging is then switched off a few days before the blocking onset, allowing the model (including the atmospheric circulation) to evolve freely. We generate an ensemble with perturbed initial conditions to sample internal variability of the blocking development due to chaotic error growth. By applying this procedure under pre-industrial and +4 °C warmer climates compared to the present-day climate, we can separate the thermodynamic effects of climate change from the dynamical response, and quantify how a warming climate modifies both the evolution of atmospheric blocking (e.g., intensity and persistence) and the associated extreme weather impacts. We find that the climate state exerts a moderate and event-specific influence on blocking dynamics.

How to cite: Zhuo, W., Sánchez-Benítez, A., Athanase, M., Jung, T., and Gößling, H.: Exploring the changing dynamics of atmospheric blocking with a modified event-based storyline approach, EGU General Assembly 2026, Vienna, Austria, 3–8 May 2026, EGU26-11790, https://doi.org/10.5194/egusphere-egu26-11790, 2026.

EGU26-12438 | Orals | CL3.2.4

Surface flux contributions to Mediterranean heatwaves: a new Lagrangian diagnostic 

Vinita Deshmukh, Andreas Stohl, and Marina Dütsch

The increasing frequency of Mediterranean heatwaves is associated with widespread impacts on human health, agricultural productivity, and infrastructure. Previous studies have shown that large-scale circulation patterns, such as persistent ridges and atmospheric blocking, play a key role in triggering heatwaves, along with subsidence and warm-air advection. However, the intensity and persistence of these events depends not only on the advection of heat and moisture but also on the heat and moisture supplied by turbulent surface fluxes into the advected air mass. Sensible and latent heat fluxes modify air-mass temperature and humidity (and thus equivalent potential temperature) along transport pathways to the heatwave region. These flux contributions, and their relative importance for heatwave anomalies, remain uncertain.

In this study, the contribution of surface sensible and latent heat fluxes to near-surface moisture and temperature anomalies during heatwaves is quantified using a new Lagrangian framework that combines backward air-mass trajectories from the FLEXPART particle dispersion model with surface fluxes from ERA5 reanalysis data. Surface flux contributions to the moist static energy are estimated by coupling them with near-surface residence times of air parcels arriving in the heatwave region. The approach is first validated by showing that moist static energy at the heatwave location can be reproduced by the sum of the particle initial conditions (i.e., most static energy at trajectory termination points) and the surface flux contributions accumulated over the Lagrangian tracking period. Following this validation, surface flux contributions can be split into latent and sensible heat flux contributions and mapped geographically.

The method is then applied to two recent Mediterranean heatwaves to assess the relative roles of sensible and latent heat fluxes and to identify the dominant land and sea source regions. Overall, this framework provides a direct and physically consistent way to attribute the moist static energy associated with heatwaves to surface fluxes, offering new insights into the processes that build and maintain Mediterranean heatwaves.

How to cite: Deshmukh, V., Stohl, A., and Dütsch, M.: Surface flux contributions to Mediterranean heatwaves: a new Lagrangian diagnostic, EGU General Assembly 2026, Vienna, Austria, 3–8 May 2026, EGU26-12438, https://doi.org/10.5194/egusphere-egu26-12438, 2026.

EGU26-12593 | ECS | Posters on site | CL3.2.4

Unprecedented storm surges across European coastlines 

Irene Benito Lazaro, Philip J. Ward, Jeroen C. J. H. Aerts, Dirk Eilander, and Sanne Muis

Recent research has considerably advanced our ability to model extreme storm surges. Nevertheless, simulating unprecedented events remains a challenge. Current large-scale storm surge studies often rely on conventional statistical approaches to extrapolate data beyond historical records. However, these approaches entail large uncertainties and lack the capacity to physically characterise individual events. Furthermore, research on unprecedented events primarily focuses on hazard magnitude, often overlooking other dimensions relevant for risk management decisions.

This study addresses these gaps by examining unprecedented storm surges at a European scale across multiple dimensions. We follow a large-ensemble approach to generate numerous alternative pathways of reality, capturing a broader range of climate variability than the observational records. By pooling ensembles from the ECMWF SEAS5 seasonal forecast and forcing the Global Tide and Surge Model (GTSM), we obtain a 525-year dataset of unbiased, independent storm surge events. This synthetic dataset enables the identification of physically plausible events beyond those found in historical records. We evaluate the dataset against reanalysis-based storm surges to uncover and characterise unprecedented events across three dimensions: magnitude, spatial extent and temporal occurrence. Understanding these different dimensions of unprecedence provides a significant advance in our knowledge of coastal flood risk in Europe and supports improved coastal flood risk management decisions.

How to cite: Benito Lazaro, I., Ward, P. J., Aerts, J. C. J. H., Eilander, D., and Muis, S.: Unprecedented storm surges across European coastlines, EGU General Assembly 2026, Vienna, Austria, 3–8 May 2026, EGU26-12593, https://doi.org/10.5194/egusphere-egu26-12593, 2026.

EGU26-12603 | ECS | Posters on site | CL3.2.4

The influence of sea surface temperatures on moisture sources of Central European Storm Boris in September 2024 

Philipp Maier, Marina Dütsch, Imran Nadeem, Martina Messmer, and Herbert Formayer

This study investigates the role of climate-change-driven sea surface temperature (SST) anomalies in intensifying extreme precipitation associated with Storm Boris. During the period 12th to 16th September 2024, Storm Boris produced extreme precipitation and subsequent flooding in Central Europe, recording over 350 mm accumulated precipitation in five days in parts of Austria. To assess the influence of climate-change-driven SSTs in the Atlantic, Mediterranean and Black Sea, we perform pseudo experiments, in which the SSTs of these water bodies are systematically reduced by 2 K. For that purpose, a model chain consisting of the Weather Research and Forecasting (WRF) model coupled to the Lagrangian particle dispersion model FLEXPART run with back-trajectory settings and a moisture source and transport diagnostic is utilized. The WRF model is further run with wind and pressure nudging over the entire simulation period and without nudging during the event in order to separate thermodynamic and dynamic responses. The moisture uptakes and losses of air parcels arriving in the Central European study region are traced backward in time for up to ten days, enabling the identification of the dominant moisture sources contributing to the observed extreme precipitation. Our analysis reveals the Eastern Europe land areas and the Mediterranean – where SSTs exhibited a strong positive anomaly compared to the long-term climatology – as primary moisture sources for Storm Boris. We further show that the decrease in available moisture by SST reduction in the Black Sea and/or the Atlantic is partially compensated by additional moisture uptake in the Mediterranean. Finally, we assess the thermodynamic sensitivity of mean precipitation to SST changes by comparing the simulated rainfall across different historical SST climatologies. The results indicate an average precipitation increase of approximately 3 % per Kelvin of SST warming for this event, emphasizing the contribution of climate-driven SST increases to the extreme precipitation observed during Storm Boris.

How to cite: Maier, P., Dütsch, M., Nadeem, I., Messmer, M., and Formayer, H.: The influence of sea surface temperatures on moisture sources of Central European Storm Boris in September 2024, EGU General Assembly 2026, Vienna, Austria, 3–8 May 2026, EGU26-12603, https://doi.org/10.5194/egusphere-egu26-12603, 2026.

EGU26-12831 | ECS | Posters on site | CL3.2.4

Towards actionable storylines: development of a reproducible workflow 

Niels Carlier

Storylines, or tales of future weather, are an increasingly popular climate communication strategy. Storyline research aims to inform about how extreme events arise and how severe they may become under different background climates, connecting scientific knowledge and lived experience. Central to this approach is a focus on plausibility rather than probability.  Such "what-if" scenarios can stress-test policy and infrastructure, guiding or strengthening adaptation efforts. This study presents a reproducible chain of methodological steps for constructing such tales through data mining, which is demonstratively applied to the EURO-CORDEX ensemble to produce a coherent and communicable extreme heat storyline for Belgium. We present the results from a first workshop with city officials and emergency coordinators, which successfully launched an ongoing dialogue between stakeholders and scientists about the broader use of storylines as an accessible tool for climate adaptation.

How to cite: Carlier, N.: Towards actionable storylines: development of a reproducible workflow, EGU General Assembly 2026, Vienna, Austria, 3–8 May 2026, EGU26-12831, https://doi.org/10.5194/egusphere-egu26-12831, 2026.

EGU26-12895 | Orals | CL3.2.4

How reliably can we estimate trends of surface weather extremes? A conceptual study using ERA5 reanalyses 

Heini Wernli, Tomasz Sternal, Sven Voigt, Michael Sprenger, and Torsten Hoefler

How the frequency and intensity of extreme weather events is affected by global warming in different regions is one of the central questions of climate change research, with obvious direct implications for climate change adaptation. A standard approach of defining weather extremes is to consider the exceedance of a percentile threshold, calculated from the statistical distribution of a meteorological variable of interest in a predefined reference period. Trends can then be assessed by considering the frequency of threshold exceedances in a period that extends beyond the reference period. While this approach appears rather straightforward, it comes with several choices related to the parameter, percentile threshold, aggregation period, reference period, and boosting interval. Here aggregation period refers to the question whether, e.g., precipitation extremes are considered with a duration of 1 hour or 1 day or multiple days, and the boosting interval is the symmetric time window used to calculate percentiles for a given day of year. When checking these partly methodological choices in previous studies, e.g., those referenced in the IPCC report, it becomes evident that different studies made different choices. Since there is no obvious “best choice”, it is important to quantify the influence of these choices on the resulting trend estimates. Therefore, this study uses ERA5 reanalysis data to systematically and globally explore the trends in 2-m temperature (T2m) and precipitation (P) and their robustness with respect to the aforementioned parameters. Key results are that (i) trends vary strongly between regions, (ii) they are methodologically more robust for T2m than for P, (iii) in regions with weak P trends, the sign of the trend depends on the methodological choices. These explorative analyses with ERA5 data are complemented by synthetic data experiments, in particular to investigate the influence of the boosting window. We suggest that trend analyses of percentile threshold exceedances of any parameter in any dataset should consider these methodological sensitivities in order to communicate robust estimates.

How to cite: Wernli, H., Sternal, T., Voigt, S., Sprenger, M., and Hoefler, T.: How reliably can we estimate trends of surface weather extremes? A conceptual study using ERA5 reanalyses, EGU General Assembly 2026, Vienna, Austria, 3–8 May 2026, EGU26-12895, https://doi.org/10.5194/egusphere-egu26-12895, 2026.

EGU26-13076 | ECS | Orals | CL3.2.4

Global characterisation of the vertical temperature anomaly structure of heat extremes over land in ERA5 

Belinda Hotz, Heini Wernli, and Robin Noyelle

The formation of surface heat extremes is usually described in terms of surface processes and upper-level dynamics. However, their full vertical temperature profile contains additional essential information about the involved processes and dynamics. So far, it remains unclear whether heat extremes are associated with characteristic vertical temperature anomaly profiles and how they vary across the globe.
In this study, we globally and systematically classify vertical temperature anomaly profiles during annual maximum 2-m temperatures, so-called TXx events, using a k-means clustering approach. After a suitable normalisation and scaling of the anomaly profiles, we find three clusters, whose global distribution closely follows the polar, mid-latitude, and tropical climate zones. The three clusters capture key structural differences of heat extremes. Within the tropical cluster, positive temperature anomalies during TXx events are confined to the (often deep) boundary layer and intensify progressively in the days leading up to the event, while the upper troposphere is not deviating from its climatological mean. The mid-latitude cluster also exhibits bottom-heavy temperature anomalies, which, however, extend throughout the full troposphere, showing a strong vertical coupling during heat extremes. In the polar cluster, heat extremes are characterised by deep tropospheric warm anomalies, accompanied by the erosion of the near-surface inversion layer, resulting in a shallow layer of particularly strong temperature anomalies near the ground.
These results show that while multiple physical mechanisms can generate a heat extreme, at first order, temperature anomaly profiles during heat extremes are very similar to each other within a given climate zone. The variability between TXx events is much larger than the variability between the median profile of different grid points in the same cluster. Besides, the temperature profiles of the most extreme events are more similar to those of their cluster than the more moderate events, suggesting a typical dynamics of the most extreme heat events. 

How to cite: Hotz, B., Wernli, H., and Noyelle, R.: Global characterisation of the vertical temperature anomaly structure of heat extremes over land in ERA5, EGU General Assembly 2026, Vienna, Austria, 3–8 May 2026, EGU26-13076, https://doi.org/10.5194/egusphere-egu26-13076, 2026.

EGU26-13386 | Posters on site | CL3.2.4

An emergent constraint for the future frequency of European windstorms 

Matthew Priestley, David Stephenson, Adam Scaife, and Daniel Bannister

Windstorms are one of the most damaging natural hazards in western Europe, yet large inter-model spread limits robust assessment of future frequency changes. Previous assessments have suggested an increasing frequency, however models often have equal and opposite future responses. Using a novel statistical technique to quantify trends in these damaging windstorms we show that the historical mid-latitude meridional pressure gradient explains much of the inter-model variability in projected windstorm frequency across a large CMIP6 ensemble. Constraining projections using the pressure gradient index reduces uncertainty lowers the likelihood of increasing windstorm frequency and indicates a robust decline in pan-European windstorm frequency over the twenty-first century. We present a plausible mechanism via atmosphere–ocean feedbacks important for the North Atlantic storm track and circulation. These results suggest extreme increases in windstorm frequency are unlikely, despite projected increases in storm severity, with important implications for future loss and impact assessments.

How to cite: Priestley, M., Stephenson, D., Scaife, A., and Bannister, D.: An emergent constraint for the future frequency of European windstorms, EGU General Assembly 2026, Vienna, Austria, 3–8 May 2026, EGU26-13386, https://doi.org/10.5194/egusphere-egu26-13386, 2026.

EGU26-13482 | ECS | Orals | CL3.2.4

Global projections of short-duration rainfall extremes using temperature-covariate models 

Jovan Blagojević, Andreas Prein, Nadav Peleg, and Peter Molnar

Short-duration, high-intensity rainfall extremes associated with convective storms pose a growing risk to urban areas under a warming climate, yet their future evolution remains difficult to quantify at the global scale using existing modelling approaches. Local projections are often constrained by the lack of long high-resolution observations and by the limited ability of climate models to accurately simulate sub-daily precipitation processes at the global scale. Here, we present a globally applicable framework for projecting changes in rare, short-duration rainfall extremes using temperature as a covariate in a non-stationary extreme value framework building on the TENAX model, driven entirely by global climate model output and without reliance on local observational data. The focus on rare, short-duration extremes directly targets the class of events responsible for a disproportionate share of climate-related impacts.


The approach links changes in rainfall intensity distributions to projected shifts in wet-day temperature distributions from CMIP6 models, integrating over the full temperature distribution rather than relying on uniform scaling or mean-shift assumptions. Dew-point temperature is employed as a proxy for atmospheric moisture availability, allowing thermodynamically constrained intensification of convective rainfall extremes to be represented consistently across climates. In an initial multi-regional application, the framework projects robust intensification of hourly-scale rare rainfall events, with increases of order 10–20% by late century under intermediate emissions scenarios and substantially larger changes under high-emissions pathways. Accounting for changes in the full temperature distribution shows that the strongest intensification occurs for the rarest events, which is underestimated when intensities are scaled only by mean temperature changes.


We further extend the framework to a global scale to assess spatial patterns and key structural uncertainties in projected short-duration rainfall intensification. Results highlight that methodological choices, including the selection of temperature covariate (dew-point versus surface air temperature), can introduce differences comparable to inter-model climate uncertainty in some regions, particularly in moisture-limited and continental climates. Treating these choices explicitly as structural uncertainties provides a clearer interpretation of projection robustness across diverse hydroclimatic regimes and highlights uncertainties beyond inter-model spread alone.


Overall, this work demonstrates that temperature-covariate approaches, when carefully formulated and driven by global climate models, offer a transferable and physically grounded pathway for projecting rare, short-duration rainfall extremes worldwide. The framework enables consistent global assessments in data-scarce regions and supports climate-change impact studies and urban adaptation planning by explicitly quantifying the uncertainties that matter most for short-duration rainfall risk.

How to cite: Blagojević, J., Prein, A., Peleg, N., and Molnar, P.: Global projections of short-duration rainfall extremes using temperature-covariate models, EGU General Assembly 2026, Vienna, Austria, 3–8 May 2026, EGU26-13482, https://doi.org/10.5194/egusphere-egu26-13482, 2026.

EGU26-13670 | Orals | CL3.2.4

Understanding, interpreting, and communicating future extreme precipitation risk using flow precursors 

Joshua Oldham-Dorrington, Camille Li, Stefan Sobolowski, Robin Guillaume-Castel, and Johannes Lutzmann

Many of the most societally impactful weather events in Europe occur on short timescales and there is a growing demand for improved projections of how such extremes will change in the future. That is, how will global climate change over decades impact extreme weather over days? The multiscale nature of this question challenges the capabilities of current earth system models, and this is especially the case for hydrometeorological extremes. Accurately simulating the hazards posed by extreme precipitation requires faithfully resolving interactions between the large-scale circulation, synoptic dynamics, the local boundary-layer, and hydrological and land surface conditions.


This is not only a quantitative modelling challenge, but a challenge of interpretation and narrative: the dynamics of extreme precipitation are diverse across space and time, and the statistics of the highest impact events are necessarily poorly constrained. These challenges are complicated further by the evergrowing size and hetereogeneity of multi-model datasets How can we explain model biases and trends in extreme precipitation? When models project similar changes in hydrometeorological risk do they do so for the same reasons? What implications do these factors have for regional downscaling and impact modelling? Can we relate future extremes quantitatively and robustly to historical high-impact events, as often requested by societal stakeholders?


We tackle these questions through a novel flow-precursor framework, applied to observational data, large ensemble climate simulations and subseasonal weather forecasts. We decompose extreme event risk into contributions from different scales and flow conditions, using regionally specific synoptic flow precursors which are directly associated with individual high-impact extremes or classes of extreme. These precursors are algorithmically identified and can be easily computed in large datasets, allowing us to obtain a physical interpretation of changing extreme risk across Europe without obscuring regional or seasonal diversity in precipitation dynamics.


We show how climate model biases and forced changes in extreme precipitation can be explained, categorised, and visualised in a succinct way that highlights important differences in their suitability for use in downscaling, impact modelling and storyline development. We demonstrate how dynamical decomposition can extract usable climate information even from heavily biased models, and how insights from models at different scales–such as from large climate ensembles and high-resolution weather forecasts–can be quantitatively synthesised to provide new insights on future hazards and plausible worst-case scenarios. Finally, we show how the method can be used to reframe complex, probabilistic climate projections and weather forecasts in terms of individual high impact historical events, aiding scenario visualisation, and allowing stakeholders to leverage their experience and domain knowledge when preparing for future high-impact extremes.

How to cite: Oldham-Dorrington, J., Li, C., Sobolowski, S., Guillaume-Castel, R., and Lutzmann, J.: Understanding, interpreting, and communicating future extreme precipitation risk using flow precursors, EGU General Assembly 2026, Vienna, Austria, 3–8 May 2026, EGU26-13670, https://doi.org/10.5194/egusphere-egu26-13670, 2026.

EGU26-13840 * | ECS | Orals | CL3.2.4 | Highlight

Behind or ahead of committed warming: what it means for future hot extremes 

Dominik L. Schumacher, Victoria Bauer, Lei Gu, Lorenzo Pierini, and Sonia I. Seneviratne

Virtually all land regions have warmed over recent decades, yet heatwave trends show striking regional differences. The thermodynamic rise of hot extremes can be strongly modulated by atmospheric circulation, a phenomenon that has received increasing attention for regions such as Europe and parts of North America, where observed trends in hot extremes have been amplified and dampened, respectively. But what about other regions? How persistent are these circulation anomalies? And what are the implications for future heatwaves?

Using dedicated climate model experiments, we quantify how atmospheric internal variability has modulated historical heatwave trends globally. Building on a large ensemble framework, we interpret observed circulation contributions as placing regions on unusual warming trajectories — either well below or above the ensemble mean expectation. Regions currently displaying less warming compared to climate model simulations are effectively "lagging behind" the warming already committed to by anthropogenic forcing; those running warm are "ahead".

This warming trajectory position has profound implications for the pace of future change. Regions currently lagging behind, including much of North America, face substantially faster increases in hot extreme probability between now and the mid-century than ensemble mean projections suggest. Conversely, other regions have already experienced much of the expected probability increase. We illustrate these divergent futures through the evolving return period of what was once a 1-in-100-year hot extreme, showing how the present trajectory position determines the pace of change over the coming decades.

How to cite: Schumacher, D. L., Bauer, V., Gu, L., Pierini, L., and Seneviratne, S. I.: Behind or ahead of committed warming: what it means for future hot extremes, EGU General Assembly 2026, Vienna, Austria, 3–8 May 2026, EGU26-13840, https://doi.org/10.5194/egusphere-egu26-13840, 2026.

EGU26-14325 | ECS | Orals | CL3.2.4

A combined storyline-statistical approach for conditional attribution of climate extremes to global warming 

Dalena León-FonFay, Alexander Lemburg, Andreas H. Fink, Joaquim G. Pinto, and Frauke Feser

Quantifying the influence of anthropogenic global warming on extreme events requires both physical and statistical understanding. We present a framework combining two complementary conditional attribution methods: spectrally nudged storylines and flow-analogues. The storyline approach provides insights on how a specific event is shaped by the thermodynamic conditions representing past (counterfactual), present (factual) and future global warming levels (+2K, +3K, +4K). The flow-analogue method provides a statistical analysis of the recurrence of the observed event, and the future storyline-projected events based on similar dynamical patterns that lead to the event of interest. Together, this combined approach allows us to determine not only the change in likelihood of an extreme event occurring as it did in the present, but also the probability that an intensified version (storyline-projected) of it occurred in the future.

Applied to the 2018 Central European heatwave, storylines show an area-mean warming rate of 1.7 °C per degree of global warming. Through the flow-analogue method, it was evidenced that the atmospheric blocking leading to this event remains equally likely to occur regardless of global warming. Despite it, the storyline-projected intensities might become more frequent and extreme at their corresponding warming levels than the factual 2018 event was under present conditions. Specifically, the 2018 heatwave, with an intensity of 2.2 °C and a return period of 1-in-277-years today, is projected to intensify to 6.6 °C with a 1-in-26-years return period in a +4K world. This behavior revealed the importance of other physical mechanisms and interactions influencing the occurrence and intensification of heatwaves beyond the atmospheric circulation pattern and thermodynamic conditions. We conclude that this combined framework is promising for climate change attribution of individual extreme events, offering both a physical assessment of anthropogenic warming and its associated likelihood while accounting for potential shifts in atmospheric dynamics.

How to cite: León-FonFay, D., Lemburg, A., Fink, A. H., Pinto, J. G., and Feser, F.: A combined storyline-statistical approach for conditional attribution of climate extremes to global warming, EGU General Assembly 2026, Vienna, Austria, 3–8 May 2026, EGU26-14325, https://doi.org/10.5194/egusphere-egu26-14325, 2026.

EGU26-14525 | Posters on site | CL3.2.4

Extreme weather events in agriculturally important regions in the Bay of Bengal 

Martina Messmer, Santos José González-Rojí, and Sonia Leonard

The Bay of Bengal is one of the most densely populated regions globally, bordered by India, Bangladesh, and Myanmar. Its coastal zones represent critical hotspots from both societal and agricultural perspectives. Major river deltas, including those of the Brahmaputra and Ganges in Bangladesh, the Mahanadi in India, and the Ayeyarwady in Myanmar, provide essential freshwater resources that sustain highly productive agricultural systems and support large local populations. However, ongoing climate change is increasingly associated with extreme weather conditions, such as elevated temperatures, prolonged droughts, and intense precipitation events.

To investigate how climate change at different time horizons and levels of warming influences these extremes, we conducted five regional climate simulations using the Weather Research and Forecasting (WRF) model at 5km horizontal spacing. One simulation represents a 30-year reference period (1981–2010). Two additional simulations cover the mid-21st century (2031–2060) under the SSP2-4.5 and SSP5-8.5 scenarios, respectively. The remaining two simulations represent the late 21st century (2071–2100) under the same SSP2-4.5 and SSP5-8.5 emission pathways.

The results indicate a substantial increase in extreme heat across all river deltas. The number of days exceeding 40 °C is projected to double under SSP2-4.5 and to triple under SSP5-8.5 by the end of the century. Drought frequency increases markedly, with the number of drought events projected to quadruple under both scenarios. Concurrently, extreme precipitation, measured by the RX5 index, shows significant increases in the Ayeyarwady and Brahmaputra deltas. The combined effects of intensified heat stress, more frequent droughts, and increasingly severe precipitation events present major challenges for both local populations and agricultural systems, potentially increasing the risk of displacement in these vulnerable regions.

How to cite: Messmer, M., González-Rojí, S. J., and Leonard, S.: Extreme weather events in agriculturally important regions in the Bay of Bengal, EGU General Assembly 2026, Vienna, Austria, 3–8 May 2026, EGU26-14525, https://doi.org/10.5194/egusphere-egu26-14525, 2026.

EGU26-14618 | ECS | Orals | CL3.2.4

Evolution of global climate and regional hot extremes following CO2 emissions cessation. 

Andrea Rivosecchi, Andrea Dittus, Ed Hawkins, Reinhard Schiemann, and Erich Fischer

Reaching net zero greenhouse gas emissions is essential to halt the current global warming trend and attempt to stabilise global temperatures. However, uncertainties remain on the sign and the magnitude of the long-term responses of the climate system following anthropogenic emissions cessation.

This study contributes to constraining this uncertainty by exploring the global and regional temperature evolution under zero CO2 emissions conditions in the UKESM1.2 projections following the TIPMIP protocol (Jones et al., 2025). Stabilised warming levels spanning +1.5°C to +5°C above pre-industrial conditions are analysed to understand the impact of antecedent conditions on post zero-emissions trends. We find that the global average surface air temperature (GSAT) keeps increasing in all stabilised warming scenarios. The increase is more pronounced in the +3°C to +5°C scenarios, where it approaches 0.25°C per century. Most of the warming is registered in the Southern Hemisphere, particularly in the Southern Ocean, while the Northern Hemisphere experiences a slight cooling trend over land.

These regional cooling trends are more marked for the annual temperature maxima, with several regions across 45-65°N experiencing cooling of >1°C per century. The strongest cooling trends emerge in the higher warming scenarios, and we investigate their drivers in North America, where the cooling magnitude exceeds 1.5°C per century. Using a method based on constructed circulation analogues, we find that the projected cooling trend is almost completely explained by thermodynamic drivers and we reconcile this finding with the model vegetation changes. Our findings serve a double purpose. On one hand, they show the significant contribution that land-use changes can have regionally for the attenuation of annual temperature maxima, supporting the case for their careful consideration in future mitigation and adaptation strategies. On the other, they highlight how highly idealised protocols like TIPMIP could bias climate projections post emissions cessation if they do not include realistic projections of land use changes.


Bibliography

Jones, Colin, Bossert, I., Dennis, D. P., Jeffery, H., Jones, C. D., Koenigk, T., Loriani, S., Sanderson, B., Séférian, R., Wyser, K., Yang, S., Abe, M., Bathiany, S., Braconnot, P., Brovkin, V., Burger, F. A., Cadule, P., Castruccio, F. S., Danabasoglu, G., … Ziehn, T. (2025). The TIPMIP Earth system model experiment protocol: phase 1. https://doi.org/10.5194/egusphere-2025-3604.

How to cite: Rivosecchi, A., Dittus, A., Hawkins, E., Schiemann, R., and Fischer, E.: Evolution of global climate and regional hot extremes following CO2 emissions cessation., EGU General Assembly 2026, Vienna, Austria, 3–8 May 2026, EGU26-14618, https://doi.org/10.5194/egusphere-egu26-14618, 2026.

In the aftermath of extreme weather, policy makers, contingency planners and insurers often seek to understand the likelihood of experiencing such events. The most common tool for this is extreme value analysis (EVA), but likelihood estimates based on observed or reanalysis data can be highly uncertain due to the relatively short observational record. Substantially larger samples of plausible extreme weather events can be obtained using the UNprecedented Simulated Extremes using ENsembles (UNSEEN) approach, which involves applying EVA to large forecast/hindcast ensembles. While larger sample sizes generally reduce the uncertainty associated with EVA, using seasonal or decadal forecast data introduces additional uncertainties related to model bias and model diversity. In this study, a multi-model ensemble of hindcast data from the CMIP6 Decadal Climate Prediction Project was analysed to quantify these additional uncertainties in the context of extreme temperature and rainfall across Australia. Factoring in model bias and diversity dramatically increased the uncertainty associated with estimated event likelihoods from the UNSEEN approach, to the point that it equaled or exceeded the uncertainty from an observation-based approach at most locations. Model diversity tended to be the largest source of uncertainty (60-70% of the total). Bias correction was also a significant source of uncertainty (30-40%), while the uncertainty associated with EVA was trivial. Our results suggest that an UNSEEN-based approach to estimating the likelihood of climate extremes should be understood as an approach that has different uncertainty characteristics to an observation-based approach, as opposed to less uncertainty.

How to cite: Irving, D., Stellema, A., and Risbey, J.: Quantifying the uncertainty associated with extreme weather likelihood estimates derived from large model ensembles, EGU General Assembly 2026, Vienna, Austria, 3–8 May 2026, EGU26-14625, https://doi.org/10.5194/egusphere-egu26-14625, 2026.

EGU26-14884 | ECS | Posters on site | CL3.2.4

Emerging intra-annual sequences of climate extremes in Europe  

Andrea Böhnisch, Matthew Lee Newell, Ophélie Meuriot, Jorge Soto Martin, Ane Carina Reiter, and Martin Drews

Climate change drives an increase in the frequency of multiple meteorological extreme event types (e.g., extreme precipitation, storms, droughts, heatwaves) by affecting thermodynamic and dynamic processes in the coupled land-atmosphere system. For example, the extended droughts during 2018-2020 in Europe, flooding triggered by extreme precipitation in Germany in 2021, as well as Valencia and central France in 2024, or prolonged heatwaves in 2003, 2015, 2018, and 2022 across continental Europe had strong adverse impacts on socio-economic systems and the environment. Given a higher frequency of extreme events, it becomes more likely that regions experience events of the same or different types in consecutive seasons, thereby challenging the regions’ short-term coping and recovery ability and long-term resilience.

While extreme events are generally well-studied, holistic analyses of typical sequences of extreme events are missing. Compound analyses commonly focus on specific combinations of events, but usually miss typical intra-annual sequences of extreme events with the potential for high impacts.

Our analysis addresses the question 1) which sequences of extremes occur most often, 2) how robust they are, and 3) their physical implications. We assess intra-annual sequences of extreme seasons on the European scale in a regional multi-member ensemble of the Canadian Regional Climate Model version 5 (CRCM5) covering the European CORDEX domain at a high spatial resolution (0.11°, 12 km). The CRCM5 was driven by four members of the Max-Planck-Institute Grand Ensemble (MPI-ESM-LR) under SSP3-7.0. Given that the four members differ only by initial conditions and thus share the same climate, this setup quadruples the sample size for finding extreme events. We selected extreme event indicators for extreme heat, droughts, extreme precipitation and wind. They cover hazards of regionally varying importance, but each of them poses considerable risks to human and natural systems in Europe. The sequences of extreme events were derived using the sequential pattern mining algorithm cSPADE.

In this contribution, we show first findings on the most prevalent sequences of seasonal events under SSP3-7.0. We map vulnerability hotspots associated with intra-annual extreme event characteristics and present physical “stories” corresponding to the sequences. Furthermore, we aim to provide the basis for understanding potential interrelations of seasonal extreme events.

How to cite: Böhnisch, A., Lee Newell, M., Meuriot, O., Soto Martin, J., Reiter, A. C., and Drews, M.: Emerging intra-annual sequences of climate extremes in Europe , EGU General Assembly 2026, Vienna, Austria, 3–8 May 2026, EGU26-14884, https://doi.org/10.5194/egusphere-egu26-14884, 2026.

EGU26-15041 | ECS | Orals | CL3.2.4

Amplified socioeconomic impacts of compound drought–heatwave events 

Koffi Worou and Gabriele Messori

Isolated and compound climate extremes, such as droughts and heatwaves, are intensifying under global warming. Although recent studies have advanced the physical understanding and classification of compound events, their socioeconomic impacts remain poorly quantified at the global scale using disaster record databases. Building on evidence that compound drought–flood events can generate impacts substantially larger than those from isolated hazards, this study extends the inquiry by providing a global assessment of the socioeconomic impacts of compound drought–heatwave (CDH) events.

To achieve this, we use the Emergency Events Database (EM-DAT) for the period 1960–2025 and analyse reported drought and heatwave disasters at the global scale. CDH events are identified using complementary approaches, including overlapping drought and heatwave records within the same location (top-level administrative unit) and the “Associated Types” information in EM-DAT, thereby allowing assessment of sensitivity to event definition. Furthermore, EM-DAT drought events are compared with heatwave conditions derived from the ERA5 reanalysis to evaluate consistency between reported impacts and climatic co-occurrence. Socioeconomic impacts are quantified using the affected population, human fatalities, and reported damages.

Preliminary results show a clear increase in the number of reported areas affected by CDH events globally, particularly since the mid-2010s. Moreover, CDH events are consistently associated with greater impacts than single hazards. Specifically, using matching events within EM-DAT, compound events exhibit greater total damage, while fatalities during heatwaves increase by up to a factor of five when drought conditions co-occur. Furthermore, when drought impacts from EM-DAT are associated with heatwaves identified in ERA5, the damage and affected population are, respectively, two to four times higher than for isolated drought events.

Taken together, these findings provide global-scale evidence that co-occurring droughts and heatwaves substantially amplify socioeconomic impacts. This underscores the need to explicitly account for compound extremes in climate risk assessment, adaptation planning, and disaster risk reduction.

How to cite: Worou, K. and Messori, G.: Amplified socioeconomic impacts of compound drought–heatwave events, EGU General Assembly 2026, Vienna, Austria, 3–8 May 2026, EGU26-15041, https://doi.org/10.5194/egusphere-egu26-15041, 2026.

EGU26-15607 | ECS | Orals | CL3.2.4

Intensification of Short-Duration Extreme Precipitation in Greater Sydney 

Leena Khadke, Jason P. Evans, Youngil Kim, Giovanni Di Virgilio, and Jatin Kala

Short-duration extreme precipitation is a key driver of urban flooding and associated socio-economic impacts in a warming climate. Increasing urbanization further amplifies the vulnerability of cities to intense rainfall occurring over minutes to hours. These extremes frequently trigger flash floods and pose substantial risks to urban infrastructure and public safety. Despite growing recognition of its importance, regional-scale assessments of sub-hourly extreme precipitation remain limited. Emerging observational evidence indicates that short-duration precipitation events (≤1 hour) are intensifying at a faster rate than longer-duration events. In this study, we analyze short-duration extreme precipitation events at 5-, 10-, 20-, 30-, and 60-minute timescales using observations from 16 automated weather stations (AWS) across the rapidly urbanizing Greater Sydney region, New South Wales, Australia. Our results show a pronounced increasing trend in extreme precipitation at higher percentiles, particularly at the 5–10 minute timescales, compared to hourly extremes. At the hourly scale, we evaluate the performance of five convection-permitting regional climate model simulations (4 km ensemble) against AWS observations. The models reasonably capture the upper tail of the precipitation distribution but tend to slightly overestimate the frequency of extreme events. To assess future changes, we examine the intensity of 99th percentile precipitation extremes across three periods—historical (1951–2014), near future (2015–2057), and far future (2058–2100)—under three Shared Socioeconomic Pathway scenarios (SSP126, SSP245, and SSP370). The projections indicate a consistent intensification of extreme precipitation, with a substantial upward shift in the top 1% of historical extremes, most pronounced under the high-emission SSP370 scenario. Interestingly, the simulations also project a reduction in the total number of wet hours relative to the historical baseline, suggesting a transition toward shorter-duration but more intense precipitation events. Although considerable inter-model spread and spatial variability exist, increases in 99th percentile extremes are robust across most scenarios. Notably, under SSP126, a decline in extreme precipitation is projected in the far future, highlighting the potential benefits of strong emission mitigation. These findings underscore the need to explicitly incorporate short-duration precipitation extremes into urban planning and flood risk management under climate change.

Keywords: Automatic Weather Station, Climate change, Flash floods, NARCliM2.0, Regional climate models, Sub-hourly extreme precipitation

How to cite: Khadke, L., Evans, J. P., Kim, Y., Virgilio, G. D., and Kala, J.: Intensification of Short-Duration Extreme Precipitation in Greater Sydney, EGU General Assembly 2026, Vienna, Austria, 3–8 May 2026, EGU26-15607, https://doi.org/10.5194/egusphere-egu26-15607, 2026.

On 1 October 2020, the intense extra-tropical storm Alex impacted the north-west coast of France, producing unusually strong wind gusts for the season. On 2 October, the storm triggered record-breaking rainfall over the south-eastern French Alps and north-western Italian Alps. In France, this Heavy Precipitation Event (HPE) caused severe flooding and land­slides, resulting in casualties, and over 1 billion euros in economic losses.

We used convection-permitting regional climate modeling with a spa­tial resolution of 2.5 km to investigate these observed events. Simulations were conducted over September-October 2020 on an extensive domain centered on France. Our model successfully reproduces the characteristics of both the HPE and storm Alex, including the observed sequence of events and impacts (Bador et al., 2025).

We then explored how the observed 2020 Mediterranean HPE could have been differ­ent had it occurred 2 years later, in 2022, where warmer sea surface was recorded in the western Mediterranean Sea. This storyline analysis suggested reduced precipitation impacts over the south-eastern French Alps but enhanced impacts in Italy. Additional sensitivity experiments confirmed the key role of regional sea surface temperatures (SSTs) in shaping the HPE’s intensity in the western Alps, with an eastward shift of heavy precipitation with higher Mediterranean SSTs. Our simulations consistently show that sea surface warming can further intensify the Mediterranean HPE, while cooling reduces the intensity of extreme precipitation and local impacts. In contrast, modifications to the Atlantic SSTs affecting storm Alex itself have a limited influence on the regional Mediterranean circulation and the HPE.

All simulations were performed using initial-condition large ensembles to assess the role of internal variability in shaping local extremes. We highlighted variations among ensemble members in both local rainfall extremes and in gustiness. As impact sectors increasingly rely on km-scale climate modelling to inform local climate change assessments, our results underscore the importance of the ensemble-based approaches to fully capture the range of possible outcomes for extreme events locally.

How to cite: Bador, M., Noirot, L., Caillaud, C., and Boé, J.: Cooler than observed sea surface could have reduced impacts of storm Alex and induced mediterranean heavy precipitation event in France, EGU General Assembly 2026, Vienna, Austria, 3–8 May 2026, EGU26-16649, https://doi.org/10.5194/egusphere-egu26-16649, 2026.

EGU26-16825 | Orals | CL3.2.4

 Trends and Drivers of Cold Extremes in a Changing Climate 

Daniela Domeisen, Hilla Afargan-Gerstman, Russell Blackport, Amy H. Butler, Edward Hanna, Alexey Yu. Karpechko, Marlene Kretschmer, Robert W. Lee, Amanda Maycock, Emmanuele Russo, Xiaocen Shen, and Isla R. Simpson

Cold extremes — also referred to as cold air outbreaks, cold spells, or cold snaps — have received less attention in the scientific literature than hot extremes, largely because their frequency and intensity are projected to decrease under climate change. Nevertheless, cold extremes continue to exert substantial impacts across a wide range of sectors, including human health, agriculture, and infrastructure. Superimposed on their overall global decline is pronounced regional and seasonal variability, driven by variability in the underlying physical mechanisms, which themselves may be influenced by climate change. Here, we provide an overview of global and regional trends in cold extremes, examine their key drivers in both present and future climates, and discuss outstanding questions related to the dynamical forcing of cold extremes and their projected evolution under climate change.

How to cite: Domeisen, D., Afargan-Gerstman, H., Blackport, R., Butler, A. H., Hanna, E., Karpechko, A. Yu., Kretschmer, M., Lee, R. W., Maycock, A., Russo, E., Shen, X., and Simpson, I. R.:  Trends and Drivers of Cold Extremes in a Changing Climate, EGU General Assembly 2026, Vienna, Austria, 3–8 May 2026, EGU26-16825, https://doi.org/10.5194/egusphere-egu26-16825, 2026.

The increasing frequency of extreme hot events poses major societal and scientific challenges due to their adverse impacts on human and natural systems, compounded by their unpredictable nature. Climate models are essential for identifying the mechanisms that amplify extremes and for anticipating long-term changes that inform decision making, yet their accuracy is limited by internal variability, structural uncertainties, and systematic biases. Observational constraint approaches that link past and future behavior of physical observables offer a promising way to address these limitations, though they often rely on region-specific empirical relationships.

Here, we show that future changes in hot event probabilities and their uneven spread across global land areas depend critically on the historical properties of temperature distributions. In particular, historical variability controls the growth rates of probabilities, either amplifying or dampening the effects of regional background warming, with important implications for climate-change projections. Building on this insight, we develop a universal analytical framework that combines observational evidence with model output to provide more robust assessments of future changes. Results indicate that hot event probabilities may increase faster than suggested by models alone across much of the land surface. In large areas, including the Euro-Mediterranean and Southeast Asia, observation-constrained increases could exceed model-based estimates by nearly a factor of two, even at low levels of global warming. Surpassing the 2 °C warming threshold could push highly vulnerable regions, such as the Amazon and other tropical land areas, into uncharted climate conditions where extreme heat becomes routine.

These findings support more realistic evaluations of future risk and underscore the need for strengthened mitigation efforts to prevent rapid and potentially irreversible climate shifts.

How to cite: Simolo, C. and Corti, S.: Hot extremes increase faster than models suggest: evidence from observation-constrained projections, EGU General Assembly 2026, Vienna, Austria, 3–8 May 2026, EGU26-17562, https://doi.org/10.5194/egusphere-egu26-17562, 2026.

EGU26-18203 | ECS | Orals | CL3.2.4

Heat extremes in subseasonal hindcasts: a General Extreme Value perspective 

Pauline Rivoire, Maria Pyrina, Philippe Naveau, and Daniela Domeisen

Understanding and characterizing temperature extremes is essential for assessing climate impacts and risks. Robust statistical analysis of such extremes requires large datasets, yet observational records often provide limited samples of rare events. Hindcasts, i.e., retrospective forecast model runs for past dates, are typically used to correct model biases, but their potential for extreme event analysis remains underexplored. Approaches such as UNSEEN (UNprecedented Simulated Extremes using Ensembles) have investigated the potential of seasonal hindcast ensembles to provide large samples of events that are physically plausible, particularly for assessing rare events. However, seasonal hindcasts often focus on monthly means.

In this study, we explore whether a similar approach can be applied to subseasonal hindcasts, evaluating their potential to serve as alternative realizations of extreme events at daily resolution.  We use two complementary methods to compare global temperature extremes in ECMWF subseasonal hindcast with ERA-5 reanalysis: (1) the statistical upper bound of daily 2-meter temperature, and (2) the probability of record-breaking daily 2-meter temperature. By leveraging existing subseasonal hindcast ensembles, we aim to evaluate whether these datasets can be repurposed to study temperature extremes that have not yet been observed but are plausible under current climate conditions

How to cite: Rivoire, P., Pyrina, M., Naveau, P., and Domeisen, D.: Heat extremes in subseasonal hindcasts: a General Extreme Value perspective, EGU General Assembly 2026, Vienna, Austria, 3–8 May 2026, EGU26-18203, https://doi.org/10.5194/egusphere-egu26-18203, 2026.

Unclear and inconsistent terminology for high impact climate phenomena, including concepts such as tipping points, irreversibility, ‘collapse’ and ‘shutdown’, presents a substantial barrier to clear understanding of Earth system risks. These terms are frequently used in assessments of major subsystem shifts in ocean circulation, ice sheets and forest biomes, yet they are often applied without shared definitions across scientific, policy and public contexts. This inconsistency affects how scientific results are interpreted, including perceptions of how quickly changes may unfold and whether different parts of the climate system might influence one another. It also has important psychological and emotional impacts. Language that sounds dramatic or alarming may be intended to motivate action, but it can instead lead to desensitisation, message fatigue, denial or even the spread of misinformation. These reactions can weaken engagement and undermine societal preparedness for potential climate driven transitions.

Government science and policy teams, rely on clear and consistent terminology for effective decision making in situations where thresholds and impacts remain uncertain. To support this need, we – as communication specialists work extensively at the interface between science and policy - are developing an evidence-based glossary and guidance for terminology related to tipping points and other high impact climate concepts. The aim is to improve internal communication and to support clearer interpretation of scientific assessments used in national risk planning.

The project is grounded in social science and uses a mixed methods design. It began with a review of existing definitions and research on the psychological effects of climate language. We carried out semi-structured interviews and workshops with scientists and government officials, and this highlighted how linguistic ambiguity affects policy development and the evaluation of uncertain risks. Utilising ta broad cross section of Met Office staff, we carried out focus groups to explore how different definitions were perceived and understood. Participants, including those with strong scientific backgrounds, showed substantial disagreement about the meaning and implications of key terms. This indicates that confusion around terminology linked to tipping point research is not limited to public audiences but also exists within expert communities.

Insights from this analysis are guiding the co creation of a public facing glossary developed with an expert working group of twelve multidisciplinary specialists at the Met Office. Completion is planned for March 2026, alongside continued engagement with international bodies including WCRP and IPCC. By strengthening shared understanding of terms related to climate system transitions and critical thresholds, this work aims to support more coherent communication of high impact climate concepts, improve public and policy interpretation of uncertain risks and reduce unintended emotional and behavioural responses that can undermine, and distract from effective, and much needed climate action.

How to cite: Macneill, K. and Martin, L.: An Up-HILL Battle: Building consensus on terminology for high impact climate events and tipping point risks., EGU General Assembly 2026, Vienna, Austria, 3–8 May 2026, EGU26-18736, https://doi.org/10.5194/egusphere-egu26-18736, 2026.

EGU26-19875 | ECS | Posters on site | CL3.2.4

Using Stochastic Data to Simulate and Communicate Alternative Multi-Hazard Weather Extreme Events 

Judith Claassen, Wiebke Jäger, Marleen de Ruiter, Elco Koks, and Philip Ward

A stochastic weather generator (SWG) simulates realistic weather time series beyond the historical record by capturing the statistical properties of observed weather patterns. Here, we present a new spatiotemporal SWG, the MYRIAD Stochastic vIne-copula Model (MYRIAD-SIM), which simulates temperature, wind speed, and precipitation. MYRIAD-SIM captures both spatiotemporal and multivariate dependencies using conditional vine copulas. The simulated data enable new insights into compound climate and multi-hazard events by generating high-impact multivariate weather scenarios. For example, the triple storm sequence Dudley, Eunice, and Franklin, which impacted the UK and Europe in 2022, can be simulated as alternative triple-storm events, illustrating not only what happened but also what could have occurred under statistically plausible conditions, such as higher wind speeds or varying precipitation patterns. This study demonstrates how stochastic counterfactuals of historical events can support risk communication by framing hazards in a narrative, event-focused way rather than through abstract probabilities.

How to cite: Claassen, J., Jäger, W., de Ruiter, M., Koks, E., and Ward, P.: Using Stochastic Data to Simulate and Communicate Alternative Multi-Hazard Weather Extreme Events, EGU General Assembly 2026, Vienna, Austria, 3–8 May 2026, EGU26-19875, https://doi.org/10.5194/egusphere-egu26-19875, 2026.

EGU26-19952 | ECS | Posters on site | CL3.2.4

Circulation pathways and surface drivers of extreme summer heat stress over Europe 

Qi Zhang, Joakim Kjellsson, and Emily Black

Extreme summer heat stress presents increasing public health risks across Europe. These extremes are strongly influenced by large-scale atmospheric circulation, yet the specific pathways linking circulation evolution to surface heat stress amplification remain poorly understood. Using the simplified Wet Bulb Globe Temperature (sWBGT), which accounts for both temperature and humidity effects on heat stress, we analyze extreme summer (JJA) events during 1979–2023 based on ERA5 reanalysis and a seven-class European weather regime (WR) classification. We define extreme events as regional sWBGT exceeding the 95th percentile for at least three consecutive days. Extreme sWBGT events across Europe occur predominantly during blocking regimes, with European and Scandinavian blocking playing a dominant role in many regions. We then examine how blocking evolves prior to heat stress peaks. Results show that only Scandinavia exhibits a statistically robust tendency for blocking to develop shortly before the peak, suggesting a circulation transition preceding extreme heat stress. In contrast, most other European regions experience peak heat stress under blocking conditions that are already established several days in advance, highlighting the dominant role of persistent circulation patterns. The time interval between the onset of blocking and the heat stress peak typically ranges from 3 to 7 days. These contrasting circulation pathways are closely linked to different surface amplification processes. Circulation transitions maybe associated with rapid atmospheric adjustment and surface warming, whereas persistent blocking likely promotes the accumulation of radiative forcing and progressive soil moisture depletion. Understanding how these mechanisms vary across pathways can help explain regional differences in European heat stress extremes and may improve predictions of future events.

How to cite: Zhang, Q., Kjellsson, J., and Black, E.: Circulation pathways and surface drivers of extreme summer heat stress over Europe, EGU General Assembly 2026, Vienna, Austria, 3–8 May 2026, EGU26-19952, https://doi.org/10.5194/egusphere-egu26-19952, 2026.

EGU26-20226 | Orals | CL3.2.4

Robust and actionable information on climate change and extreme rainfall events in South America 

Alice M Grimm, Lucas G Fanderuff, and João P J Saboia

Obtaining robust and actionable information on regional precipitation change to enable adaptation planning and decision-making is a matter of great concern, since there are multiple sources of information.  Projections from large CMIP6 model ensembles (e.g., IPCC Interactive Atlas) show weak signal of climate change in total annual and seasonal precipitation over most of South America (SA), with low agreement between models. Besides, information from smaller ensembles is frequently discrepant. A dynamic framework for climate change in SA is necessary to achieve robust and actionable changes.

Even though they are weak and not robust, the precipitation changes produced over SA by large model ensembles suggest that their main driver is the ENSO increased variability in eastern Pacific, especially intensified El Niño events, produced by transient greenhouse-gas-induced warming. This is consistent with the large impact of ENSO on precipitation in SA. This dynamical framework requires that models used for climate projections in SA demonstrate good simulation not only of the climatology, but also of ENSO and its teleconnections with SA. The assessment of 31 models that provided at least three runs from the present (1979-2014) to the future climate (2065-2100), based on both criteria, selected five best-performing models. This reduced set accurately reproduces the observed seasonal impact of ENSO on precipitation in SA and produces strong and robust patterns of climate change with seasonal variation dynamically consistent with more intense future ENSO in a more El Niño-like mean state.

Since the most dramatic impacts of climate change are produced by changes in the frequency and intensity of extreme precipitation events, it is essential that robust and actionable information is also provided on changes of these events, defined as above the 90th percentile. The analysis is based on the same dynamic framework of the changes in total seasonal/monthly rainfall, since ENSO also exerts a large impact on the extreme events in SA, and the selected set of models shows good simulation of the observed seasonal/monthly impact of ENSO on the frequency and intensity of extreme events. The available information usually shows changes of annual extreme indices. We adopt a seasonal/monthly resolution, which is very useful, especially in a monsoon regime with pronounced annual precipitation cycle. The future changes in extreme events is obtained for SA with monthly temporal resolution and 1 degree spatial resolution. The patterns of change in frequency and intensity of extreme events do not coincide, as changes in frequency depend on dynamic changes, while changes in intensity also depend on thermodynamic changes that determine the precipitable water vapor. Patterns of change in the frequency of extreme events in future are similar to the patterns of El Niño impact on the frequency of extreme events in the present. Changes in the average intensity of precipitation in future extreme events are generally positive and predominate in southeastern South America, where the frequency also generally increases, maximizing impacts on densely populated areas of great importance for agricultural and energy production. The provided information contributes to increase societal preparedness to extreme precipitation in SA.

How to cite: Grimm, A. M., Fanderuff, L. G., and Saboia, J. P. J.: Robust and actionable information on climate change and extreme rainfall events in South America, EGU General Assembly 2026, Vienna, Austria, 3–8 May 2026, EGU26-20226, https://doi.org/10.5194/egusphere-egu26-20226, 2026.

EGU26-21160 | ECS | Posters on site | CL3.2.4

The influence of soil moisture on the extreme precipitation event in July 2021 in Western Europe 

Till Fohrmann, Svenja Szemkus, Oliver Heuser, Arianna Valmassoi, and Petra Friederichs

Soil moisture-precipitation feedback is an important factor in the water and energy cycles, but how important is it on the time scale of an atmospheric extreme precipitation event? We are investigating this question using the example of heavy precipitation in July 2021, which led to destructive flash floods in Western Europe.

We quantify the importance of soil moisture by running a storyline simulation. We compare the precipitation simulated in the ICON-DREAM reanalysis and in our control run to counterfactual scenarios with soils dried out to plant wilting point and soils wetted to saturation. We find that saturating the soil increases precipitation by about 10% while drying the soil decreases precipitation by about 36% comparing ensemble median values.

Moisture tracking shows that one reason is that land surfaces in the vicinity of the impacted region are relevant for fueling the heavy precipitation. We find that evaporation is not limited by water availability, which explains the non-linear response in the precipitation amounts. 

The changes in evaporation also affect the synoptic scale evolution of the event, which amplify the precipitation decrease in the dry scenario. Constraining the evolution of the event enough to produce the extreme of July 2021 was a major challenge of this study. The limited predictability of free forecasts conflicts with the need for enough lead time to allow soil moisture to impact the atmosphere in a meaningful way. We solve this problem by using data assimilation to constrain the large scale circulation of our global ICON simulations while disabling the assimilation within our region of interest.

Our work is part of the German Research Foundation (DFG) Collaborative Research Center 1502 DETECT. In DETECT we aim to answer the question of whether regional changes in land and water use impact the onset and evolution of extreme events. Our coarse approach to changes in water availability gives us an upper bound on changes we can expect as a result of human influence.

How to cite: Fohrmann, T., Szemkus, S., Heuser, O., Valmassoi, A., and Friederichs, P.: The influence of soil moisture on the extreme precipitation event in July 2021 in Western Europe, EGU General Assembly 2026, Vienna, Austria, 3–8 May 2026, EGU26-21160, https://doi.org/10.5194/egusphere-egu26-21160, 2026.

EGU26-21435 | ECS | Orals | CL3.2.4

Robust response of Antarctic sea ice to large-scale wind anomalies across different climate backgrounds 

Lingyun Lyu, Antonio Sánchez-Benítez, Marylou Athanase, Lettie A. Roach, Thomas Jung, and Helge F. Goessling

Antarctic sea ice has experienced small increases from 1979 to 2015, followed by an unexpectedly rapid decline reaching record-low anomalies in 2016 and 2023. The significant reduction is raising questions regarding the drivers of this decline and how the Antarctic sea ice will respond to future climate changes. Here we apply an event-based storyline approach based on a coupled global climate model (AWI-CM-1-1-MR), where the large-scale free-troposphere dynamics is constrained to ERA5 data. We focus on two multi-year sea-ice loss events, 2014–2017 and 2020–2023, to examine the response of sea ice to the observed atmospheric circulation anomalies if they occurred under different global climate backgrounds. By comparing the sea-ice response under present-day climate and projected future warm climates (+2°C, +3°C, and +4°C global mean surface warming relative to preindustrial), we separate the thermodynamic and dynamic effects of climate change and explore how the background climate state modulates the sea-ice response to wind anomalies. We find that the Antarctic sea-ice response remains surprisingly robust across this broad range of climate states, with a few exceptions where seasonal and regional deviations occur.

How to cite: Lyu, L., Sánchez-Benítez, A., Athanase, M., A. Roach, L., Jung, T., and F. Goessling, H.: Robust response of Antarctic sea ice to large-scale wind anomalies across different climate backgrounds, EGU General Assembly 2026, Vienna, Austria, 3–8 May 2026, EGU26-21435, https://doi.org/10.5194/egusphere-egu26-21435, 2026.

EGU26-353 | ECS | Orals | CL4.4

A westward shift of heatwave hotspotscaused by warming-enhanced land–aircoupling 

Kaiwen Zhang, Zhiyan Zuo, Wei Mei, Renhe Zhang, and Aiguo Dai

Heatwaves pose serious risks to human health and lives, but how their occurrence patterns may change under global warming remains unclear. Here we reveal a systematic westward shift of heatwave hotspots across the northern mid-latitudes around the late 1990s. Both observational analysis and numerical simulation show that this shift is caused by intensified soil moisture–atmosphere coupling (SAC) in eastern Europe, Northeast Asia and western North America under recent background warming. The strengthened SAC shifted the atmospheric high-amplitude Rossby wavenumber-5 pattern westwards to a preferred phase position, which increased the probability of the occurrence of high-pressure ridges over these 3 hotspots by a factor of up to 39. Our results highlight the importance of SAC in shaping heatwave patterns and large-scale atmospheric circulation and challenge the conventional view that the land surface only passively responds to atmospheric forcing.

How to cite: Zhang, K., Zuo, Z., Mei, W., Zhang, R., and Dai, A.: A westward shift of heatwave hotspotscaused by warming-enhanced land–aircoupling, EGU General Assembly 2026, Vienna, Austria, 3–8 May 2026, EGU26-353, https://doi.org/10.5194/egusphere-egu26-353, 2026.

EGU26-700 | ECS | Orals | CL4.4

Fluxes, Feedbacks, and Memory: Untangling Chamoli’s Seasonal Land–Atmosphere Coupling 

Rahul Jaiswal, Manish Kumar Pandey, and Sunita Verma

Chamoli district, located in the Garhwal Himalaya of Uttarakhand, functions as a critical ecological buffer connecting mountain environments with downstream river systems. Its complex terrain, diverse biota, and glacier-fed rivers play an essential role in sustaining regional water resources and enhancing climate resilience. Despite its importance, studies exploring the land–atmosphere coupling processes in this climate-resilient region remain scarce.

In this work, we employ an information-theoretic approach to examine seasonal land–atmosphere interaction networks using key variables: precipitation (P), temperature (T), latent heat flux (LH), sensible heat flux (SH), wind speed (WS), incoming shortwave radiation (SWL), and relative humidity (Q). The analysis is conducted for four seasons: pre-monsoon (MAM), monsoon (JJAS), post-monsoon (ON), and winter (DJF). The derived networks distinguish between two types of links: instantaneous (real-time) and lagged (memory-controlled). Entropy-based diagnostics indicate that MAM and JJAS exhibit the highest dynamical variability, DJF represents the most quiescent period, and ON behaves as a transitional regime for Chamoli. Wind speed exerts a dominant real-time control on precipitation and also shows delayed influences at higher altitudes. In general, real-time coupling is strongest during the monsoon season, whereas comparatively enhanced memory-driven relationships mark winter.

The pre-COVID and post-COVID periods are compared to assess changes in information flow; we find that entropy deviation decreased around 2019, then increased after 2021. These findings refine our understanding of land–atmosphere dynamics over Chamoli and provide a reference state for evaluating future changes arising from natural climate variability and anthropogenic forcing.

Keywords—Land-atmospheric interaction; information-centric method; real-time interaction; entropy.

How to cite: Jaiswal, R., Pandey, M. K., and Verma, S.: Fluxes, Feedbacks, and Memory: Untangling Chamoli’s Seasonal Land–Atmosphere Coupling, EGU General Assembly 2026, Vienna, Austria, 3–8 May 2026, EGU26-700, https://doi.org/10.5194/egusphere-egu26-700, 2026.

Vegetation plays a crucial role during heatwaves by altering surface energy partitioning and influencing local to regional climate. In addition to the thermodynamic response of vegetation, the differential heating caused by sensible heat gradients across adjacent regions of vegetation and dry, bare soil can generate a mesoscale circulation akin to sea breeze-like circulation, known as a ‘vegetation breeze’1, which redistributes heat and moisture and affects downwind regions. While the impacts of large‑scale heterogeneities such as land-sea contrasts and topography are well established, the influence of finer‑scale vegetation heterogeneity remains uncertain. This gap is critical because semi‑arid forests, covering nearly 18% of Earth’s land surface, are highly sensitive to heat extremes. Differences in their Bowen ratios can substantially alter surface energy budgets, producing varying levels of hydroclimatic stress under similar atmospheric forcing. Yet, their potential to amplify or mitigate the impacts of extreme heat events is still poorly understood.

This study focuses on the semi-arid deciduous forests of the Eastern Ghats in Peninsular India, which are part of the Nagarjulam Srisilam Tiger Reserve and neighbouring protected areas  located along the ecotone between the dry Deccan Plateau and the Eastern coast.  It is spread over 5 districts in Andhra Pradesh and Telangana which are known to experience extreme heatwaves. Our previous observational analyses show that these transitional forests are highly sensitive to climatic stressors, particularly through their land surface temperature (LST) and evapotranspiration responses. During heatwave events, we observed pronounced LST gradients between forested and adjacent non-forested areas, indicating strong surface thermal contrasts arising from vegetation-atmosphere interactions. Given the heightened climate sensitivity of these transitional ecosystems, it is essential to understand not only how these ecosystems respond to extreme heat but also how they may influence local atmospheric dynamics.

To address this, we investigate how vegetation driven circulations such as the ‘vegetation breeze’ and the canopy convector effect2 emerge from land surface heterogeneity, and how these processes affect boundary layer processes and downwind thermal anomalies during heatwaves. Our approach combines atmospheric reanalysis data for large‑scale boundary conditions, satellite observations to characterize land surface and vegetation, and high‑resolution WRF simulations to resolve fine‑scale forest-atmosphere feedbacks. Through a series of forest‑configuration experiments, we assess the capacity of semi‑arid forests to alter boundary layer processes and explore the implications for local and regional modification of extreme events as well as downwind impacts. By isolating the role of semi‑arid forests during heatwaves, these experiments contribute to the mechanistic understanding of semi-arid forest-atmosphere interactions and their role in shaping hydroclimatic extremes under a changing climate.


References

[1] McPherson, R. A. (2007). A review of vegetation—atmosphere interactions and their influences on mesoscale phenomena. Progress in Physical Geography, 31(3), 261-285.

[2] Banerjee, T., De Roo, F., and Mauder, M.: Explaining the convector effect in canopy turbulence by means of large-eddy simulation, Hydrol. Earth Syst. Sci., 21, 2987–3000, https://doi.org/10.5194/hess-21-2987-2017, 2017. 


How to cite: Sen, D. and Monteiro, J.: Vegetation-Driven Circulations and Their Modification During Heatwaves: Insights into the Downwind Impacts of Semi-Arid Forests in Peninsular India, EGU General Assembly 2026, Vienna, Austria, 3–8 May 2026, EGU26-945, https://doi.org/10.5194/egusphere-egu26-945, 2026.

EGU26-1052 | ECS | Posters on site | CL4.4

Analysis of the Relationship Between Soil Moisture and Precipitation Across Heat Stress Categories 

Manali Saha, Vishal Dixit, and Karthikeyan Lanka

Extreme heat stress events are marked by significant deviations in surface air temperature that surpass the typical climatological range, coupled with increased atmospheric humidity. These events are characterised by their intensity, duration, and spatial extent, often crossing thresholds critical for both human and terrestrial ecosystem functioning. At the local scale, land-atmosphere interactions during these heat extremes modulate stress on soil and vegetation by altering energy partitioning, boundary layer feedbacks, and soil moisture memory. During these episodes, evapotranspiration is constrained due to low soil moisture (SM) conditions, leading to increased sensible heat and temperatures, which serve as the primary thermodynamic pathway for heat amplification. In conditions characterized by high soil moisture (SM), light precipitation (P) occurs, with an increase in latent heat flux may elevate atmospheric humidity and exacerbate heat stress, underscoring the nonlinear and stress-dependent nature of SM–P interactions. Despite the centrality of these processes, the relationship between SM and P across diverse heat stress regimes in South Asia remains insufficiently explored.

In this study, the Weather Research and Forecasting (WRF) model is employed to simulate an extreme heat stress event that occurred in May 2015 in the Indo-Gangetic Plains of India, utilizing initial and boundary conditions from the ERA5 dataset. To examine the SM-P feedback relationship, the initial SM is perturbed by 25% and 50% to represent a full spectrum of heat stress conditions (no stress, caution, danger, and extreme danger). Under no-stress conditions, the SM-P feedback exhibits a typical convex-concave relationship on the E[PSM] curve. However, as the heat stress intensifies, this relationship is broken. Extremely hot and deeply mixed boundary layers inhibit the development of moist convection, raising the lifting condensation level (LCL). Although cloud formation may still occur, the environmental conditions are insufficient to trigger heavy precipitation. The presence of upper-level anticyclones during this time period further suppresses vertical motion, reinforcing atmospheric stability and preventing convective initiation. Overall, the analysis highlights that an intermediate soil moisture range of approximately 0.25–0.35 m³/m³ maximizes land–atmosphere coupling strength in the IGP during extreme heat events. Within this range, the surface is sufficiently moist to sustain strong evapotranspiration yet dry enough to produce high surface temperatures, creating a feedback loop that exacerbates heat stress. These findings underscore the importance of accurately representing soil moisture dynamics in regional climate models to improve predictions of heat extremes in South Asia.

How to cite: Saha, M., Dixit, V., and Lanka, K.: Analysis of the Relationship Between Soil Moisture and Precipitation Across Heat Stress Categories, EGU General Assembly 2026, Vienna, Austria, 3–8 May 2026, EGU26-1052, https://doi.org/10.5194/egusphere-egu26-1052, 2026.

EGU26-1932 | Orals | CL4.4

Oceanic-versus-terrestrial influences on land humidity: simulations and theory 

Michael Byrne, Andrew Chingos, Joshua Duffield, Marysa Laguë, and Paul O'Gorman

Humidity over land is a key climate variable that is strongly coupled to mean and extreme temperatures, to precipitation and evapotranspiration, and to wildfires. Understanding the processes controlling the climatology of land humidity and its response to a changing climate is a fundamental scientific question with important societal implications. Here we use a global climate model with tagged water tracers to directly diagnose the sources of land specific humidity over a range of climate states. The simulations isolate the contributions to land humidity from water evaporated: (i) from the land surface ("terrestrial source"); and (ii) from the ocean surface ("oceanic source"). The control simulation reveals that land humidity in most regions and for most months of the year is dominated by the oceanic source, i.e. water evaporated from the ocean and advected over land. The terrestrial source is important in some inland regions, for example Eurasia, and during Jun-Jul-Aug, when advection is weaker in the northern hemisphere. Under climate change, the oceanic source dominates changes in land humidity at all latitudes but with a non-negligible contribution from the terrestrial source. The results are interpreted using a conceptual box model which predicts that the terrestrial and oceanic moisture sources scale equally with warming, implying equal fractional changes in land and ocean humidity. Implications of these new results for understanding the large biases in observed versus simulated land humidity trends over the historical period are discussed.

How to cite: Byrne, M., Chingos, A., Duffield, J., Laguë, M., and O'Gorman, P.: Oceanic-versus-terrestrial influences on land humidity: simulations and theory, EGU General Assembly 2026, Vienna, Austria, 3–8 May 2026, EGU26-1932, https://doi.org/10.5194/egusphere-egu26-1932, 2026.

The El Niño event exerts a profound influence on the global carbon cycle by perturbing terrestrial photosynthesis through environmental stress. Plant isoprene emissions respond rapidly to such environmental stress, yet it remains unclear whether isoprene can capture the spatiotemporal evolution of El Niño. Here, we used satellite-derived global isoprene emissions for the first time to assess their dynamical response to the 2015–2016 El Niño. We observed that isoprene emissions increase by up to ~30% relative to the climatological mean, with pronounced anomalies emerging across tropical ecosystems. The spatiotemporal evolution of these anomalies closely aligns with the El Niño progression, as indicated by sea surface temperature anomalies in the equatorial Pacific. In contrast, commonly used satellite vegetation products, including leaf area index (LAI) and solar-induced chlorophyll fluorescence (SIF), exhibit weaker and spatially incoherent responses. These results demonstrate that satellite-derived isoprene provides a sensitive and mechanistically grounded tracer of ecosystem stress, offering a complementary perspective for monitoring the impacts and propagation of extreme climate events on terrestrial ecosystems.

How to cite: Liu, H., Prentice, I. C., and Morfopoulos, C.: Satellite‐derived isoprene emissions trace the spatiotemporal evolution of the 2015-2016 El Niño across terrestrial ecosystems, EGU General Assembly 2026, Vienna, Austria, 3–8 May 2026, EGU26-2949, https://doi.org/10.5194/egusphere-egu26-2949, 2026.

EGU26-3005 | Orals | CL4.4 | Highlight

Climate extremes and ecosystem disturbance feedbacks 

Ana Bastos, Francisco José Cuesta-Valero, Albert Jornet Puig, Nora Linscheid, Yimian Ma, Laura Mayer, João Martins Basso, and Johannes Quaas


Climate extremes have direct impacts on ecosystems, for example reduced productivity during heat-drought events, but often their impact is amplified by compounding ecosystem disturbances, such as wildfires or insect outbreaks.  Through their impact on ecosystem functioning and structure, compound climate extremes and ecosystem disturbances modulate land-atmosphere exchanges of water, energy, and greenhouse-gases, which in turn influence atmospheric properties from local to global scales, thus feeding-back to climate change.  Recent observations indicate that such feedbacks are, however, non-negligible and might result in a much weaker role of the biosphere in climate change mitigation, especially under high emission scenarios.

Currently, ecosystem disturbances are not appropriately represented in most Earth System Models, which implies that extreme-event induced climate-biosphere feedbacks are likely overlooked in future climate simulations. Here, we will examine observation-based evidence for extreme-event induced climate-biosphere feedbacks through CO2 and land-atmosphere water and energy exchanges at different scales. We will then showcase recent developments in simulating some of these feedbacks in a global land-surface model and discuss the resulting implications for climate change adaptation and mitigation.  

How to cite: Bastos, A., Cuesta-Valero, F. J., Jornet Puig, A., Linscheid, N., Ma, Y., Mayer, L., Martins Basso, J., and Quaas, J.: Climate extremes and ecosystem disturbance feedbacks, EGU General Assembly 2026, Vienna, Austria, 3–8 May 2026, EGU26-3005, https://doi.org/10.5194/egusphere-egu26-3005, 2026.

EGU26-4152 | ECS | Orals | CL4.4

Tropical Forest Canopy Thermoregulation Observed from Space 

Akash Verma and Iain Colin Prentice

Canopy temperature (Tc) is a key regulator of plant physiological processes, growth, and productivity, and serves as an indicator of surface energy partitioning and plant water status. Despite its importance, many dynamic vegetation models implicitly assume Tc to be equal to air temperature (Tair); while land surface models calculate an effective surface temperature based on energy balance, but typically have not evaluated this calculation against data. Using satellite-derived land surface temperature as a proxy for Tc, in combination with ERA5-Land Tair, we assessed whether tropical rainforests actively thermoregulate Tc relative to Tair. We find that ΔT (Tc – Tair) follows a consistent diurnal cycle, which is primarily controlled by diurnal variations in net radiation. Forest canopies are cooler than air at night, warm early in the morning and cool again below Tair in late afternoon. During the hottest part of the day, the slope (β) of the canopy-air relationship indicates strong megathermy in dry forests, while humid forests show responses ranging from limited homeothermy to megathermy depending on their capacity to dissipate heat. Humid forests with sufficient water availability show buffering of Tc against Tair variability through evaporative cooling, whereas dry forests frequently experience canopy warming as aridity constrains evaporative cooling. In humid forests, this evaporative cooling persists through the wet season but weakens—or reverses to canopy warming—during the dry season as water stress intensifies. Together, these findings provide an observational benchmark for improving the representation of canopy temperature, evaporative cooling, and vegetation–atmosphere energy and water exchanges in land-surface models.

How to cite: Verma, A. and Prentice, I. C.: Tropical Forest Canopy Thermoregulation Observed from Space, EGU General Assembly 2026, Vienna, Austria, 3–8 May 2026, EGU26-4152, https://doi.org/10.5194/egusphere-egu26-4152, 2026.

EGU26-4364 | ECS | Posters on site | CL4.4

Urban irrigation reduces moist heat stress in Beijing, China 

Shuai Sun, Chunxiang Shi, Qiang Zhang, Tao Zhang, and Junxia Gu

Although urban irrigation can modulate local hydrothermal conditions and mitigate urban heat island effects, its impact on moist heat stress (MHS) is poorly understood. Employing the Weather Research and Forecasting Single-Layer Urban Canopy Model (WRF-SLUCM), we evaluated the effect of urban irrigation on the MHS in Beijing, China Using the CMA-RA V1.5 reanalysis dataset and CLDAS-V3.0 soil moisture as boundary conditions. Taking the hot and humid weather events that occurred in Beijing in May and August 2022 as examples,we found that the updated initial soil moisture (SM) field improved the simulation of temperature, relative humidity, and wind speed. Besides, urban irrigation reduced urban and rural MHS, and particularly reduced afternoon and evening MHS by up to 1.2 °C but increased morning MHS by up to 0.4 °C. In addition, the effect of different irrigation times on MHS showed that irrigation at 02 and 20 h increased urban and rural MHS, with the best cooling effect at 00 and 13 h, which reduced the MHS by up to 2.65 °C in urban areas and 0.71 °C in rural areas. The findings highlighted mechanistically the effect of urban irrigation on MHS and shed light on how to mitigate urban heat island effects on urban sustainable development.

How to cite: Sun, S., Shi, C., Zhang, Q., Zhang, T., and Gu, J.: Urban irrigation reduces moist heat stress in Beijing, China, EGU General Assembly 2026, Vienna, Austria, 3–8 May 2026, EGU26-4364, https://doi.org/10.5194/egusphere-egu26-4364, 2026.

The impacts of deforestation over the Maritime Continent (MC) have increasingly raised concerns due to its potential influence on extreme rainfall during the early summer monsoon. This study investigates how MC deforestation modifies extreme rainfall characteristics and associated large-scale circulation responses during May–June (MJ) using 100-year simulations from the Community Earth System Model (CESM1). A control simulation is compared with a deforestation experiment in which MC forests are replaced by grassland, and rainfall changes are quantified using indices defined by the Expert Team on Climate Change Detection and Indices (ETCCDI). Results show that deforestation substantially enhances extreme rainfall over the MC and induces a pronounced rainfall regime shift from weakened light rainfall toward strengthened heavy rainfall, driven by increased atmospheric instability and intensified deep convection. In contrast, rainfall over South China-Taiwan (SCTW) decreases significantly, with both light and extreme rainfall being suppressed. Mechanism analyses indicate that enhanced MC convection induces a meridional circulation response, characterized by anomalous ascent over the tropics and subsidence over SCTW. This subsidence causes tropospheric stabilization, reduced cloud cover, and weakened southwesterly monsoon moisture transport, creating unfavorable conditions for rainfall development over SCTW. Overall, MC deforestation drives a coherent redistribution of early summer monsoon rainfall, featuring an extreme rainfall-dominated regime shift over the MC and circulation-induced rainfall suppression over subtropical East Asia, highlighting the role of tropical land-use change in modulating extreme rainfall and monsoon circulation during the early summer monsoon.

How to cite: Chen, Y.-C. and Huang, W.-R.: Maritime Continent Deforestation-Induced Extreme Rainfall Regime Shifts During the Early Summer Monsoon Season, EGU General Assembly 2026, Vienna, Austria, 3–8 May 2026, EGU26-4627, https://doi.org/10.5194/egusphere-egu26-4627, 2026.

EGU26-4802 | ECS | Orals | CL4.4

Mesoscale soil moisture heterogeneity can locally amplify humid heat 

Guillaume Chagnaud, Chris M Taylor, Lawrence S Jackson, Anne Barber, Helen L Burns, John Marsham, and Cathryn E Birch

Soil moisture is a key ingredient of humid heat through supplying moisture and modifying boundary layer properties. Soil moisture heterogeneity due to for example, antecedent rainfall, can strongly influence weather patterns; yet, its effect on humid heat is poorly understood. Idealized numerical simulations are performed with a cloud-resolving (Δx = 500 m), coupled land-atmosphere model wherein circular wet patches with diameter λ ∈ 25-150 km are prescribed. Compared to experiments with uniform soil moisture, humid heat is locally amplified by 1 to 4°C in experiments with heterogeneous soil moisture, with maximum amplification for the critical soil moisture length-scale λc = 50 km. Subsidence associated with a soil moisture-induced mesoscale circulation concentrates warm, humid air in a shallower boundary layer. Additional pairs of uniform-heterogeneous soil moisture simulations are performed to assess the influence of the background wind, the strength of the soil moisture contrast, and the vertical structure of the atmosphere, on the relationship between soil moisture length-scales and humid heat amplification. This study provides process-based insights into the effects of soil moisture heterogeneity on humid heat in various environments at fine time and space scales, challenging extreme humid heat outputs from coarser-resolution weather and climate models. Furthermore, these results will help to predict extreme humid heat at city and county scales across the Tropics based on observed soil moisture patterns.

How to cite: Chagnaud, G., M Taylor, C., S Jackson, L., Barber, A., L Burns, H., Marsham, J., and E Birch, C.: Mesoscale soil moisture heterogeneity can locally amplify humid heat, EGU General Assembly 2026, Vienna, Austria, 3–8 May 2026, EGU26-4802, https://doi.org/10.5194/egusphere-egu26-4802, 2026.

EGU26-4968 | Orals | CL4.4

How basic physical constraints shape land-atmosphere interactions 

Axel Kleidon, Sarosh Alam Ghausi, and Tejasvi Ashish Chauhan

Climate over land is strongly shaped by the conditions at the land surface, particularly regarding the partitioning of energy, the availability of water, and the presence of vegetation. What we show here is that a number of key climatological fluxes and variables can be estimated quite accurately simply by applying basic physical constraints. First, heat fluxes are associated mostly with convective motion, which requires work to be done in the form of buoyancy. The generation of this work is subject to a first, physical constraint, the thermodynamic limit of a heat engine. Second, on land, the large differences in solar heating over the course of the day are buffered within the lower atmosphere, and not below the surface as is the case over open water surfaces.  This sets a second constraint. Third, when hydrological aspects are involved, saturation, that is, the thermodynamic equilibrium state, sets another constraint to evaporation and the humidity of air.  We focus on diurnal variations of the surface energy balance, temperature, and humidity over land and compare these to observations to show that these three constraints dominantly shape climatological variations across regions.  What this implies is that physical constraints dominate the functioning of climate over land, and much of this is shaped by the prevalent radiative conditions, with secondary effects relating to soil water availability and advection.  This, in turn, should help us to better distinguish between the important drivers from mere responses in shaping land-atmosphere interactions.

How to cite: Kleidon, A., Ghausi, S. A., and Chauhan, T. A.: How basic physical constraints shape land-atmosphere interactions, EGU General Assembly 2026, Vienna, Austria, 3–8 May 2026, EGU26-4968, https://doi.org/10.5194/egusphere-egu26-4968, 2026.

EGU26-5957 | ECS | Orals | CL4.4

Amplified future drying of tropical land constrained by physical theory 

Andrew Chingos, Graeme MacGilchrist, and Michael Byrne

Near-surface relative humidity (RH) over land is a key mediator of land-atmosphere interactions, influencing surface energy partitioning, evapotranspiration, wildfire risk, and both temperature and precipitation extremes. Despite its central role in regulating land climate, the response of land RH to climate change remains highly uncertain, with climate models projecting a wide range of historical and future trends. Notably, many models struggle to reproduce the observed decline in land RH over the recent warming period, raising concerns about their representation of land climate processes and future projections. 

Here we develop a simple physical theory to constrain changes in land RH, grounded in an ocean-influence perspective on boundary layer moisture over land. The theory links fractional changes in tropical land RH to the land–ocean warming contrast. As land warms more rapidly than the ocean, the increase in the water-holding capacity of land air outpaces the supply of moisture imported from oceanic regions, leading to a systematic decline in land RH. This mechanism highlights how large-scale land-atmosphere interactions can be regulated by ocean-driven constraints on land boundary layer moisture. 

The theory explains much of the inter-model spread in historical tropical land RH trends, as well as the drying evident in reanalysis data. Combining the theory with observational estimates of the radiatively forced land–ocean warming contrast, we obtain constrained projections of future tropical land RH change (-6.4 %/K and -4.4 %/K) which indicate substantially stronger drying compared to the unconstrained projections (-1.5 %/K). This emergent constraint highlights a systematic underestimation of future land drying by climate models and its physical basis, with important implications for land-climate impacts in a warming world. 

How to cite: Chingos, A., MacGilchrist, G., and Byrne, M.: Amplified future drying of tropical land constrained by physical theory, EGU General Assembly 2026, Vienna, Austria, 3–8 May 2026, EGU26-5957, https://doi.org/10.5194/egusphere-egu26-5957, 2026.

EGU26-5979 | Posters on site | CL4.4

Impacts of Rural-Urban Surface Heterogeneity on Precipitation Events in the Central Great Plains 

Liang Chen, Ifeanyi Achugbu, and Rezaul Mahmood

In the U.S. Central Great Plains, intensive agriculture is not the only human activity that has modified the natural landscape and subsequently influenced the atmosphere. With rapid urban population growth, major cities in this region have undergone significant expansion over the past few decades. Urban surfaces interact with the lower atmosphere by altering radiative and turbulent fluxes due to their unique thermal and radiative properties, thereby affecting the urban boundary layer and precipitation processes. However, the collective influence of urbanization and surrounding irrigation on regional weather and climate remains poorly understood. In this study, we investigate the impacts of irrigation and urbanization on precipitation processes over the Central Great Plains, focusing on selected precipitation events near Omaha, Nebraska, which is the largest city in the state and one that lies adjacent to extensively irrigated agricultural regions to the west. The Weather Research and Forecasting (WRF) model is used to conduct sensitivity experiments for more than 20 summer precipitation events, when irrigation is most active, and land-atmosphere coupling is strongest. Results show that upwind irrigation significantly enhances precipitation intensity, while urbanization primarily affects the spatial distribution of precipitation. The magnitude of these impacts varies with synoptic conditions across events. Additionally, land-surface influences on the thermodynamic environment before and during storms highlight the role of rural-urban heterogeneity in shaping precipitation extremes in this region.

How to cite: Chen, L., Achugbu, I., and Mahmood, R.: Impacts of Rural-Urban Surface Heterogeneity on Precipitation Events in the Central Great Plains, EGU General Assembly 2026, Vienna, Austria, 3–8 May 2026, EGU26-5979, https://doi.org/10.5194/egusphere-egu26-5979, 2026.

Heatwaves are becoming more frequent and intense worldwide under ongoing climate warming, posing substantial risks to the terrestrial ecosystem carbon sink. Although heatwave impacts on gross primary productivity (GPP) and ecosystem respiration (ER) have been widely investigated, their causal interactions remain poorly understood, particularly the physiological and biochemical mechanisms underlying these responses. Here, we combine near-surface air temperature from the ERA5-Land reanalysis with long-term carbon flux estimates from FLUXCOM-X to investigate ecosystem carbon responses to heatwaves across biome-diverse sites globally. We identify bidirectional causal relationships between GPP and ER using convergent cross mapping and apply multivariate causal inference to quantify heatwave-induced changes in ecosystem physiological and biochemical traits. Results suggest that the bidirectional causal coupling between GPP and ER is significantly strengthened during heatwaves but weakens during the post-heatwave recovery, indicating a transient reorganization of ecosystem carbon dynamics as a legacy effect of heatwaves. Correspondingly, net ecosystem productivity (NEP) typically declines during heatwaves, reflecting a widespread transient loss of carbon sink strength, driven by a disproportionately stronger increase in ER relative to GPP. Our findings illustrate the vulnerability of the land carbon sink to heatwaves consistent with previous studies, while explicitly unravelling the causal processes that govern ecosystem carbon responses and recovery. These results provide important insights for the management of the global carbon budget and for advancing the representation of terrestrial processes in land surface models.

How to cite: Ping, J., Lee, S.-C., and Li, W.: Asymmetric causal coupling between ecosystem photosynthesis and respiration underlies ecosystem carbon sink losses during heatwaves, EGU General Assembly 2026, Vienna, Austria, 3–8 May 2026, EGU26-6000, https://doi.org/10.5194/egusphere-egu26-6000, 2026.

EGU26-7376 | Orals | CL4.4

The underestimated thirst: detectability of atmospheric water vapor uptake in ecosystem measurements and global models 

Sinikka J. Paulus, Mirco Migliavacca, Anke Hildebrandt, Rene Orth, Sung-Ching Lee, Arnaud Carrara, Markus Reichstein, Yijian Zeng, and Jacob A. Nelson

In this contribution, we aim at assessing the detectability of atmospheric water vapor uptake by dry soils at a variety of spatial scales and methodologies, from the ecosystem scale via eddy covariance, through larger scales via earth system models, and gridded products. 

Water vapor fluxes in the soil and at the soil-atmosphere interface are driven by vapor concentration gradients. Until today, it is mostly assumed that the soil pore air is roughly at 100% relative humidity (RH), resulting in vapor fluxes that are almost always towards the atmosphere. However, the vapor state in soil pore air is linked to the soil water (matric) potential. As the water potential becomes more negative, the equilibrium RH within the soil decreases substantially. Under these conditions, the soil behaves like a ‘thirsty material’: when the atmospheric vapor pressure exceeds that of the soil pores, vapor is adsorbed onto the solid soil particle surfaces, and the net vapor flux is directed towards the soil. 

Using subdaily measurement data from a globally distributed network of eddy covariance stations, we show an emergent functional relationship between volumetric water content (VWC), RH, and latent heat (λE) flux direction at the ecosystem scale. Vapor fluxes towards the soil under dry conditions can be explained by the soil's sorptive forces inducing very low water potentials. Based on eddy covariance data, we find that soil vapor adsorption most frequently occurred in arid and semi-arid regions, particularly in ecosystems with sparse vegetation such as savannas and dry shrublands. On average, soil vapor adsorption occurs for 4 ± 1.1 hours per night, and may last up to 7 hours and on more than 150 nights per year in some drylands.

Furthermore, we demonstrate that the relationship between VWC, RH, and the vapor flux direction is evident in a wide range of in situ measurements in drylands, including lysimeter and humidity profile data. However, this relationship is absent in site-level runs of gridded observation-based data products and land surface models.

We demonstrate for the first time that the effect of adsorptive forces can be detected at the ecosystem scale, several meters above the ground. Our findings at the operating scale of flux towers can be used to evaluate and improve model representation of land-atmosphere exchange in dry conditions. Additionally, the results highlight the influence of sorptive forces on sub-daily soil-atmosphere interactions, particularly in sparsely vegetated drylands.

How to cite: Paulus, S. J., Migliavacca, M., Hildebrandt, A., Orth, R., Lee, S.-C., Carrara, A., Reichstein, M., Zeng, Y., and Nelson, J. A.: The underestimated thirst: detectability of atmospheric water vapor uptake in ecosystem measurements and global models, EGU General Assembly 2026, Vienna, Austria, 3–8 May 2026, EGU26-7376, https://doi.org/10.5194/egusphere-egu26-7376, 2026.

EGU26-7512 | ECS | Posters on site | CL4.4

Climate Warming Favors the Early Emergence of Rapid Flash Drought 

Phynodocle Vecchia Ravinandrasana, Christian Franzke, and Christoph Raible

Global warming is expected to increase the likelihood of the rapid onset of drought development. Yet the timescale and region of the emergence and disappearance of the anthropogenic flash drought remain poorly constrained. Here, we assess the time of emergence and disappearance of soil-moisture-based flash drought across five onset timescales using a large ensemble of climate simulations. Anthropogenic influence is quantified through the Signal-to-Noise Ratio, defined as the forced response relative to internal climate variability. Rapid-onset FDs of 1 and 2 pentads onset timescale emerge earliest, in the mid-20th century, and expand over increasing land areas by the late century under SSP3-7.0. In contrast, moderate- to slow-onset FD, 3 to 5 pentads onset timescale emerge later in more spatially confined regions and disappear by 2100. The Time of disappearance patterns show broader regional variability, especially for slow-onset flash drought. Globally, median ToE occurs in the 2020s for rapid-onset flash drought and in later decades for longer-onset events, while disappearance occurs between the 2000s and 2050s, depending on onset timescales. Both emergence and disappearance exhibit strong regional variability and occur earlier under higher forcing. Mechanistically, Flash drought onset is governed by region-specific land–atmosphere processes, driven either by short-term precipitation deficits or rapid increases in evaporative demand. These results indicate an increasing tendency toward rapid, climate-driven flash drought emergence, emphasizing the need for region-specific early-warning strategies.

How to cite: Ravinandrasana, P. V., Franzke, C., and Raible, C.: Climate Warming Favors the Early Emergence of Rapid Flash Drought, EGU General Assembly 2026, Vienna, Austria, 3–8 May 2026, EGU26-7512, https://doi.org/10.5194/egusphere-egu26-7512, 2026.

EGU26-8187 | ECS | Posters on site | CL4.4

How stomatal function shapes evapotranspiration in a rising CO2 world 

Amy X. Liu, Abigail L.S. Swann, and Gabriel J. Kooperman

Evapotranspiration (ET) is a key process in the land water cycle, with plant transpiration accounting for ~60% of land ET. Transpiration is regulated through both stomatal functioning and total leaf area. Stomata control the diffusion of water vapor from leaves to the atmosphere, while leaf area determines the total surface over which transpiration occurs. Both processes are expected to change under elevated CO2 (eCO2), with increased CO2 availability allowing plants to optimize carbon gain to water loss by closing their stomata and decreasing transpiration per leaf. At the same time, CO2 fertilization increases leaf area, which can contribute to increasing total transpiration, as well as increasing rain water interception and reevaporation. The combined influence of these opposite physiological responses creates uncertainty in the total plant-driven ET response to eCO2. Observations also reveal a range of stomatal function across and within plant types in varying environments, much of which is not represented in Earth system models, contributing to uncertainty in the magnitude of stomatal closure under eCO2 and its impact on future ET. We quantify how uncertainty in stomatal functioning propagates into ET responses under eCO2 using Community Earth System Model (CESM2) simulations, where we perturb stomatal function across the observed range for each plant type at preindustrial and doubled preindustrial CO2. We also compare ET responses driven by stomatal uncertainty with those from leaf area growth and identify regions where ET is most sensitive to stomatal function assumptions. The total plant-driven ET response to eCO2 is a combination of the opposing contributions from stomatal closure and leaf area growth. Of the two contributors, leaf area growth tends to have a larger ET response to eCO2 compared with stomatal closure in CESM2. However, we find that stomatal uncertainty drives ET changes of comparable magnitude to the total combined plant-driven ET response to eCO2. Further, about 32% of land has greater ET sensitivity to stomatal uncertainty than the ET response to eCO2 driven leaf area growth. This occurs particularly in wet regions where stomata can strongly regulate transpiration yet remain sensitive to water availability. These results improve understanding of how uncertainty in plant physiological processes propagates into future water cycle responses and climate projections, and identify where uncertainties may be most influential.

How to cite: Liu, A. X., Swann, A. L. S., and Kooperman, G. J.: How stomatal function shapes evapotranspiration in a rising CO2 world, EGU General Assembly 2026, Vienna, Austria, 3–8 May 2026, EGU26-8187, https://doi.org/10.5194/egusphere-egu26-8187, 2026.

EGU26-8398 | ECS | Orals | CL4.4

Land-atmosphere Teleconnections Between Spring Soil Moisture and Summertime Climate 

Lily Zhang and David Battisti

Year-to-year variability in summertime temperature has a large impact on drought, wildfire, and extreme heat across the Western United States. A recent study showed that warmer-than-average summertime temperatures in the Western US are often preceded by drier-than-average springtime soil moisture over the Southwest US. To examine the possibility that land-atmosphere coupling modulates summertime temperature variability over this region, we perform an ensemble of soil moisture depletion experiments within the Community Earth System Model (CESM2) and find that reducing March surface soil moisture over the Southwest US causes positive May-June temperature anomalies throughout the Western US and precipitation anomalies in the Northwest that are consistent with observations. In our experiments, daytime diabatic heating over anomalously dry land surfaces in early spring excites circulation anomalies that evolve into a hemispheric-scale pattern similar to that observed following anomalously dry springtime in the Southwest US. We show that the subsequent late spring and early summer circulation anomalies are associated with large-scale reductions in atmospheric moisture and cloudiness that contribute to the near-surface warming. Our results suggest that spring soil moisture variations are a source of seasonal predictability for summertime climate extremes, through their non-local impact on summertime temperature variability over the Western US.

How to cite: Zhang, L. and Battisti, D.: Land-atmosphere Teleconnections Between Spring Soil Moisture and Summertime Climate, EGU General Assembly 2026, Vienna, Austria, 3–8 May 2026, EGU26-8398, https://doi.org/10.5194/egusphere-egu26-8398, 2026.

EGU26-8485 | ECS | Orals | CL4.4

Has agricultural irrigation masked intense warming in the central United States? 

Sofia Menemenlis, Gabriel Vecchi, Stephan Fueglistaler, Wenchang Yang, and Qinlan Yang

Since the 1980s, the central United States and southern-central Canada have experienced a notable lack of high temperature extremes, with many temperature record highs from the 1930s Dust Bowl period still standing. By contrast, atmospheric general circulation models (AGCMs) forced with observed sea surface temperatures consistently simulate exceptional warming over the central US during this period. What accounts for this discrepancy between observed and simulated temperature trends? We use ensembles of coupled and atmosphere-only climate model experiments to disentangle the influences of remote sea surface temperatures and local land-atmosphere interactions on historical temperature change in the central United States. Tropical Pacific teleconnections strongly impact central US temperatures: coupled general circulation models, which cannot reproduce observed trends in the tropical Pacific SST gradient, produce a moderate central US warming trend that is closer to observations than AGCMs prescribed with observed SSTs. Comparing seasonal latent and sensible heat fluxes in these experiments, we describe the central role of turbulent exchanges at the land surface on temperature trends. In a heavily irrigated area whose climate is known to be sensitive to changes in soil moisture, our results point to a possible role for agricultural irrigation in alleviating historical heat extremes, and in explaining the large difference between models and observations. We highlight the importance of understanding model-data discrepancies in tropical SST patterns and local land temperatures for predicting future climate extremes in the central US. 

How to cite: Menemenlis, S., Vecchi, G., Fueglistaler, S., Yang, W., and Yang, Q.: Has agricultural irrigation masked intense warming in the central United States?, EGU General Assembly 2026, Vienna, Austria, 3–8 May 2026, EGU26-8485, https://doi.org/10.5194/egusphere-egu26-8485, 2026.

EGU26-8630 | ECS | Posters on site | CL4.4

Identifying the Restructuring of Forced Responses and Internal Variability in Soil Moisture–Precipitation Coupling Mechanisms 

Mengxue Zhang, Feini Huang, Andrei Gavrilov, Nathan Mankovich, Miguel-Ángel Fernández-Torres, and Gustau Camps-Valls

The spatiotemporal coupling between soil moisture and precipitation is a fundamental pillar of the global hydrological cycle. With the escalating risk of severe droughts and pluvial extremes, a critical question arises: whether observed variations in soil moisture and precipitation coupling are the result of anthropogenic Forced Response (FR) or Internal Variability (IV). While recent benchmarks, such as the Forced Component Estimation Statistical Method Intercomparison Project, have advanced the estimation of forced components from observational data, a significant gap remains: how to leverage these diagnostic tools to elucidate the non-stationary and non-linear interactions across the full moisture spectrum.

This study introduces a statistical attribution framework that reconciles stationary and non-stationary coupling regimes, allowing for a more robust characterization of shifting climate dynamics. We extend the analysis of direct impacts—where FR and IV drivers linearly alter coupled variables—to the assessment of indirect impacts, where drivers exert non-linear influence on mediating variables, which modulate the dynamic sensitivity and strength of the coupling mechanisms. By decoupling these pathways, we move beyond the simple attribution of trends in moisture states; instead, we identify how anthropogenic forcing and internal variability are fundamentally restructuring the feedback mechanisms of the hydrological cycle.

How to cite: Zhang, M., Huang, F., Gavrilov, A., Mankovich, N., Fernández-Torres, M.-Á., and Camps-Valls, G.: Identifying the Restructuring of Forced Responses and Internal Variability in Soil Moisture–Precipitation Coupling Mechanisms, EGU General Assembly 2026, Vienna, Austria, 3–8 May 2026, EGU26-8630, https://doi.org/10.5194/egusphere-egu26-8630, 2026.

EGU26-8794 | ECS | Posters on site | CL4.4

Hydro-thermal heterogeneity contributes to the asymmetry of vegetation sensitivity to precipitation across northern mid-latitudes 

Taohui Li, Peng Zi, Wenxiang Zhang, and Ruowen Yang

A notable ecological phenomenon in northern terrestrial ecosystems, known as "the asymmetric response of vegetation to precipitation", has emerged over the past 20-plus years. However, it remains uncertain whether the response of northern terrestrial ecosystems to driving factors are temporally synchronous or has exhibit heterogeneity, and whether these impacts have been quantitatively evaluated. Here, we analyze the spatio-temporal patterns of vegetation sensitivity to precipitation (Sppt) across the NTML from 2001 to 2023, using two independent proxies of vegetation productivity–gross primary productivity (GPP) and solar-induced chlorophyll fluorescence (SIF). We confirm a pronounced asymmetry in Sppt trends between Eurasia and North America. Sppt increased significantly across Eurasia (GPP: +3.2×10⁻³ g·C·m-2·mm-1·yr-1) but decreased in North America (GPP: -3.8×10⁻³ g·C·m-2·mm-1·yr-1). Moisture budget diagnostics reveal asymmetric roles of zonal moisture transport in shaping precipitation trends over the two regions. This asymmetry is primarily driven by changes in hydro-thermal heterogeneity, which collectively modulate moisture availability and plant physiological processes. Crucially, further results from machine learning attribution analysis indicate that diurnal temperature range dominates Sppt changes across more than 23.5% of Eurasia, while precipitation is the key driver over 22.5% of North America. Our findings highlight the critical role of hydro-thermal heterogeneity in regulating vegetation–climate feedback and underscore the necessity of incorporate regional asymmetries into future Earth system models.

How to cite: Li, T., Zi, P., Zhang, W., and Yang, R.: Hydro-thermal heterogeneity contributes to the asymmetry of vegetation sensitivity to precipitation across northern mid-latitudes, EGU General Assembly 2026, Vienna, Austria, 3–8 May 2026, EGU26-8794, https://doi.org/10.5194/egusphere-egu26-8794, 2026.

Irrigation represents one of the most critical human interventions on the coupled water and energy cycles, driving substantial climate impacts via modifying surface energy balance and biogeochemical process. As irrigated farmland continues to expand, understanding the climate impact of extensive irrigation becomes increasingly important. Yet, the effect of irrigation on rainfall patterns, particularly extreme rainfall, at global scale remains poorly unclear. Here, using the “space-for-time” approach and global satellite precipitation datasets, we show that extreme rainfall events occur more often over irrigated lands than in surrounding rainfed areas. This signal is more pronounced in regions with more extensive irrigation, warmer temperatures, and higher precipitation. Our results improve mechanistic understanding of irrigation-precipitation interactions, which remain uncertain in climate and weather forecasting models.

How to cite: Liu, Y. and Li, Y.: Observational evidence of increased extreme rainfall due to irrigation practice, EGU General Assembly 2026, Vienna, Austria, 3–8 May 2026, EGU26-8906, https://doi.org/10.5194/egusphere-egu26-8906, 2026.

EGU26-10059 | Posters on site | CL4.4

Impacts of insect-driven tree mortality on land-surface water and energy exchanges 

João Luiz Martins Basso, Francisco José Cuesta-Valero, Johannes Quaas, and Ana Bastos

Insect-driven forest disturbances are important contributors to tree mortality and biomass losses in temperate and boreal regions. With the rising temperatures and shifting precipitation patterns, insect induced tree mortality is expected to increase in many regions. Insect outbreaks not only influence tree cover and carbon stocks, but , through their impact on tree functioning, also influence land-atmosphere exchanges of water and energy, which in turn can impact atmospheric properties. While insect outbreaks can impact very large regions, most observational studies focus on small regions and individual events.


Here, we aim to provide an observation-based regional synthesis of the impact of insect-driven tree mortality on land-atmosphere water and energy exchanges, focusing on western USA. For this, we analyse satellite-based data (MODIS) on evapotranspiration (ET), albedo, land-surface temperature (LST) and snow cover for insect-affected regions between 2001-2022. Preliminary results indicate an increase in summer LST in areas affected by more severe insect-driven tree mortality, along with a decrease in ET, compared to the years before the mortality events. These differences can be partly explained by reduced snow cover in winter, which contributes to decreased winter albedo in insect-affected areas. These effects are not only limited to the outbreak event, but also show persistent trends in the subsequent years.

How to cite: Martins Basso, J. L., Cuesta-Valero, F. J., Quaas, J., and Bastos, A.: Impacts of insect-driven tree mortality on land-surface water and energy exchanges, EGU General Assembly 2026, Vienna, Austria, 3–8 May 2026, EGU26-10059, https://doi.org/10.5194/egusphere-egu26-10059, 2026.

EGU26-10354 | ECS | Orals | CL4.4

Inter-annually varying vegetation improves seasonal forecasts of near-surface temperature in East Africa 

Daria Gangardt, Bethan Harris, Joshua Talib, Christopher Taylor, and Sonja Folwell

  Interactions between vegetation and the overlying atmosphere, mediated by changes in surface moisture availability and energy flux partitioning, exert significant influence on near-surface temperature and other atmospheric variables. At seasonal timescales, these vegetation-atmosphere interactions have the potential to enhance forecast predictability. However, current operational seasonal forecast systems, such as ECMWF’s SEAS5, prescribe vegetation to a fixed climatological state. This does not fully capture vegetation-atmosphere interactions and thus the potential predictability is not fully exploited. In this presentation, we investigate the atmospheric response to prescribing inter-annually varying Leaf Area Index (LAI) in seasonal hindcasts and assess its effect on seasonal forecast skill.  This work focuses on Africa, where seasonal forecasts are crucial for agricultural planning and extreme weather preparedness.

  A series of seasonal hindcasts run for the period 1993-2019 using ECMWF’s coupled Integrated Forecasting System are used. We compare two experiments – a control experiment, which uses climatological LAI and a non-varying land cover map, and an experiment which implements a dataset of inter-annually varying LAI and land cover maps produced by merging multiple satellite products. In general, prescribing inter-annually varying LAI increases African near-surface air temperatures by up to 0.2K compared to a fixed climatological LAI across Africa. To evaluate temperature changes associated with LAI variations, we perform a Seasonal-reliant Empirical Orthogonal Function analysis (see Wang and An, 2005) on the driving LAI dataset. We find a mode of variation that is correlated with the Indian Ocean Dipole (IOD) index for the September-November-December season (correlation coefficient of ~0.75); thus, we view this mode of LAI variation as the vegetation response to increased East African rainfall during active IOD events. Results show a consistent near-surface temperature response across East Africa when inter-annually varying LAI is prescribed. The temperature response is shown to be consistent with simulated changes in the surface energy balance. Forecast skill of temperature, measured as bias compared to ERA5 values, is shown to be improved when vegetation varies inter-annually. Improvements in bias are largest following extreme IOD events and for areas where the control hindcasts’ bias is largest, with a maximum in temperature bias reduction of 0.6K and an average bias reduction of 0.2K. Thus, we find that increased complexity in vegetation representation in seasonal forecasts leads to improvements in forecasted temperature through better representation of land-atmosphere interactions influenced by the IOD.

How to cite: Gangardt, D., Harris, B., Talib, J., Taylor, C., and Folwell, S.: Inter-annually varying vegetation improves seasonal forecasts of near-surface temperature in East Africa, EGU General Assembly 2026, Vienna, Austria, 3–8 May 2026, EGU26-10354, https://doi.org/10.5194/egusphere-egu26-10354, 2026.

Land surface conditions are known to strongly influence the intensity and frequency of heatwaves; however, their role in governing the temporal evolution and spatial propagation of heatwaves remains insufficiently explored. This study investigates the impact of land surface conditions on the temporal evolution and spatial propagation of pre-monsoon heatwaves in northwest and central India. Analysis of surface energy budget components during heatwave events reveals two dominant patterns of land surface flux evolution. In northwest India, the development of heatwaves is typically associated with weak near-surface winds that promote localized heat buildup. This phase is often followed by a strengthening of winds, which enhances sensible heat fluxes and facilitates horizontal heat transport. The resulting advection of warm air from the upwind northwest region plays a crucial role in triggering heatwave conditions over downwind areas of northern and central India. We further find that the downwind propagation of heatwaves is strongly dependent on the initial land surface temperature in the upwind region. Elevated land surface temperatures in northwest India induce anomalously low surface pressures, resulting in intensified wind speeds that enhance heat transport. As a result, heatwaves having high initial land surface conditions propagate more rapidly and are more likely to extend into central India. These results highlight the predictive potential of upwind land surface temperatures for the occurrence of heatwaves in downwind regions.

How to cite: Dar, J. A. and Apurv, T.: Understanding the influence of land surface conditions on the temporal evolution and spatial propagation of heatwaves in India, EGU General Assembly 2026, Vienna, Austria, 3–8 May 2026, EGU26-10671, https://doi.org/10.5194/egusphere-egu26-10671, 2026.

EGU26-10824 | Posters on site | CL4.4

Enhanced Representation of Landscape Heterogeneities in ICON-LAND: Implications for Hydrology and Carbon Processes 

Tobias Stacke, Philipp de Vrese, Veronika Gayler, Helena Bergstedt, Clemens von Baeckmann, Thomas Kleinen, and Victor Brovkin

Carbon fluxes play an important role in the Earth System, influencing climate, vegetation dynamics, and biogeochemical cycles. Accurately simulating these fluxes using Earth System Models is essential to understand and predict future climate change. However, these simulations depend on often poorly represented characteristics like small-scale landscape heterogeneities as well as small-scale variations in surface hydrology and temperature, which can impact carbon processes.

In this study, we analyze simulations performed with the ICON climate model, focusing on recent enhancements to its land surface component, ICON-Land. The modifications aim for a better represention of  small-scale heterogeneities by introducing distinct tiles within each grid cell that represent local states of moisture and temperature and can exchange water and heat fluxes between each other. The characteristics of these tiles are derived from high resolution topographical data. These improvements are expected to capture soil moisture and temperature dynamics - which are key drivers of carbon processes - in a more realistic way.

Our preliminary results, which are derived from simulations with prescribed atmospheric forcing, indicate that the improved representation of landscape heterogeneities in ICON-Land affects its hydrology and carbon processes. Specifically, we see an increase in soil moisture and evapotranspiration as well as Gross Primary Productivity and soil respiration in our simulations. These changes demonstrate that the improved model has a significant effect on interactions between the land surface and the atmosphere, and thereby might affect the global carbon cycle.

This study highlights the importance of representing small-scale landscape features in climate models and demonstrates the potential of the enhanced ICON-Land model to improve the simulation of carbon processes. Further analysis is underway to comprehensively assess the impacts of these modifications on the global carbon budget and fully-coupled climate projections.

How to cite: Stacke, T., de Vrese, P., Gayler, V., Bergstedt, H., von Baeckmann, C., Kleinen, T., and Brovkin, V.: Enhanced Representation of Landscape Heterogeneities in ICON-LAND: Implications for Hydrology and Carbon Processes, EGU General Assembly 2026, Vienna, Austria, 3–8 May 2026, EGU26-10824, https://doi.org/10.5194/egusphere-egu26-10824, 2026.

EGU26-12254 | ECS | Posters on site | CL4.4

Regional perspective of terrestrial carbon dioxide removal on land-atmosphere coupling and heat extremes 

Shraddha Gupta, Yiannis Moustakis, Felix Havermann, and Julia Pongratz

Terrestrial carbon dioxide removal (CDR), including afforestation and reforestation (A/R) and other land-based approaches, is a key element of climate mitigation pathways consistent with the Paris Agreement. While the mitigation potential and Earth system responses to terrestrial CDR deployment have been increasingly explored, its influence on land–atmosphere coupling and temperature extremes remains underexplored, particularly at regional scales. Understanding these processes is essential for evaluating both synergies and trade-offs associated with land-based mitigation strategies, including potential implications for biogeophysical co-benefits, resilience, and permanence.

Here, we present a spatio-temporal explicit analysis of how terrestrial CDR pathways modify land–atmosphere coupling and associated hot extremes across regions and seasons. The analysis is based on emission-driven simulations from the fully coupled MPI Earth System Model and considers a range of future scenarios that include both stylized large-scale terrestrial CDR deployment and more realistic mitigation pathways developed within CDRSynTra, LAMACLIMA, and RESCUE projects. This scenario diversity allows us to explore the robustness, plausibility, and potential non-linearities of land–atmosphere responses to terrestrial CDR. The scenarios considered include large-scale A/R aligned with national pledges, transformation pathways characterized by global sustainability and global inequality, and climate stabilization pathways with and without temperature overshoot that rely on portfolios of multiple CDR approaches. 

We apply various land–atmosphere coupling diagnostics, such as measures of soil-moisture control on latent and sensible heat fluxes, and relate these to hot-day and heatwave metrics over land to assess the processes linking surface fluxes, moisture availability, and temperature extremes. By explicitly focusing on regional responses, the analysis captures spatial heterogeneity in land–atmosphere feedbacks that is not apparent in global-mean assessments. Seasonal variability (e.g., during spring and summer) and different future time horizons (near-, mid-, and late-century; before and after overshoot), are considered to assess the sensitivity of land–atmosphere coupling processes to the timing and magnitude of the application of terrestrial CDR. 

Identifying regions where terrestrial CDR strongly modifies land–atmosphere coupling and heat extremes can help highlight hotspots for targeted monitoring and evaluation by indicating where observations and diagnostics are most relevant for tracking biophysical responses and emerging risks. Analyses indicate that regions such as Scandinavia, West Asia, and Northeast China exhibit contrasting responses, where changes in heat extremes coincide with shifts in soil-moisture control and evaporative cooling, and where observational coverage of surface fluxes remains limited. Such regional insights can also inform the assessment of where terrestrial CDR deployment may be associated with co-benefits, and where land–atmosphere feedbacks could pose challenges or limitations, including adaptation-relevant impacts on heat stress and labor productivity. Overall, this work helps fill a key gap in current assessments by explicitly linking terrestrial CDR deployment to land–atmosphere coupling and heat extremes at regional scales, and by providing a process-based assessment framework that can support risk-aware evaluation of land-based CDR strategies and be extended to other terrestrial CDR approaches.

How to cite: Gupta, S., Moustakis, Y., Havermann, F., and Pongratz, J.: Regional perspective of terrestrial carbon dioxide removal on land-atmosphere coupling and heat extremes, EGU General Assembly 2026, Vienna, Austria, 3–8 May 2026, EGU26-12254, https://doi.org/10.5194/egusphere-egu26-12254, 2026.

EGU26-12361 | ECS | Orals | CL4.4

Causal disentangling of soil moisture and temperature feedbacks on surface climate extremes under vegetation change 

Feini Huang, Gustau Camps-Valls, Alexander Winkler, Christian Reimers, Nuno Carvalhais, and Andrei Gavrilov

Land-atmosphere interactions are key drivers of climate extremes, mediating the influence of soil moisture, vegetation, and surface energy exchanges on droughts, heatwaves, and compound events. Observed vegetation changes such as climate-induced tree mortality, phenological shifts, and large-scale deforestation can substantially alter these interactions by modifying surface energy and water fluxes. A critical challenge is to understand how soil water-energy feedbacks propagate through the atmosphere, which is essential for both predicting extremes and evaluating Earth System Models (ESMs).

To address this, we propose a unified causal and explainable framework to disentangle soil water-energy feedbacks from observational data, creating a benchmark for ESM evaluation. First, we construct machine learning emulators to represent the dynamical responses of land and atmosphere modules to external forcings, consistent with a structural causal model (SCM). These emulators act as efficient, process-aware surrogates, enabling the reconstruction of causal pathways (e.g., soil moisture/temperature → near-surface states) in a computationally tractable way. Using do-calculus combined with explainable AI (XAI), we then estimate the causal coupling strengths of water-energy feedbacks, isolating the direct effects of soil states from confounding atmospheric influences. By comparing these causal estimates against observational constraints, we can evaluate and benchmark ESM representations, revealing structural biases, deficiencies, and uncertainties in simulated pathways.

Bridging causal inference, machine learning, and observations, our framework provides a robust tool for process-level diagnosis, model benchmarking, and ultimately improving the physical fidelity of complex ESMs. It advances the mechanistic understanding of how land states drive atmospheric extremes, offering actionable insights for predicting droughts and heatwaves under current and future climates.

How to cite: Huang, F., Camps-Valls, G., Winkler, A., Reimers, C., Carvalhais, N., and Gavrilov, A.: Causal disentangling of soil moisture and temperature feedbacks on surface climate extremes under vegetation change, EGU General Assembly 2026, Vienna, Austria, 3–8 May 2026, EGU26-12361, https://doi.org/10.5194/egusphere-egu26-12361, 2026.

EGU26-12389 | ECS | Orals | CL4.4

Revisiting Land-Atmosphere Coupling Across Spatial Scales: From Coarse to Kilometer-Scale Simulations 

Shuping Li, Daisuke Tokuda, Hsin Hsu, Ching-Hung Shih, Jie Hsu, Min-Hui Lo, and Kei Yoshimura

Soil moisture–precipitation (SM–P) coupling is a key component of land–atmosphere interactions, but its strength and sign remain highly uncertain in large-scale models. While high-resolution models that explicitly resolve convection offer a way to reduce these uncertainties, their impact on SM–P coupling is not yet fully understood. Here, we investigate global SM–P coupling across different spatial resolutions using the Nonhydrostatic Icosahedral Atmospheric Model (NICAM). We find that SM–P coupling strongly depends on model resolution. As resolution increases, precipitation becomes more localized, leading to a smaller rainy area and a more heterogeneous spatial structure of the coupling. These changes involve significant regional variations in both coupling strength and sign. At high resolution, coupling is strengthened in major land–atmosphere hotspots, driven by enhanced convection that produces higher precipitation and more active moisture exchange. Meanwhile, high-resolution simulations exhibit widespread sign reversals in SM–P coupling. These reversals are caused by the convection-driven redistribution of precipitation, where localized moisture convergence and divergence reshape the coupling relationships. Compared to FLUXNET and ERA5 data, increasing model resolution systematically reduces negative biases in SM–P coupling, bringing the simulation closer to observations. Our results show that high-resolution modeling helps reconcile simulations with observations and emphasize the importance of using high-resolution frameworks to represent land–atmosphere interactions accurately.

How to cite: Li, S., Tokuda, D., Hsu, H., Shih, C.-H., Hsu, J., Lo, M.-H., and Yoshimura, K.: Revisiting Land-Atmosphere Coupling Across Spatial Scales: From Coarse to Kilometer-Scale Simulations, EGU General Assembly 2026, Vienna, Austria, 3–8 May 2026, EGU26-12389, https://doi.org/10.5194/egusphere-egu26-12389, 2026.

EGU26-13031 | ECS | Orals | CL4.4

Amplification of soil moisture seasonality and compound warm–dry conditions over the Mediterranean under future climate scenarios 

Daniela C.A. Lima, Virgílio A. Bento, Ana Russo, and Pedro M.M. Soares

The Mediterranean region is widely recognized as a climate-change hotspot, where rising temperatures and declining precipitation are expected to intensify hydroclimatic stress. Most Mediterranean countries already experience increasing drought frequency and persistent soil moisture deficits leading to changes in terrestrial water storage. However, projected changes in the seasonal structure of soil moisture and its joint behaviour with temperature and precipitation remain insufficiently quantified.

Here, we assess future projections of soil moisture dynamics and compound warm–dry conditions across the Mediterranean using a multi-model ensemble of EURO-CORDEX regional climate simulations. We analyse daily total soil moisture, precipitation, 2-m temperature, and potential evapotranspiration for a historical baseline period (1971–2000), and three future periods (2011–2040, 2041–2070, 2071–2100) under three emission scenarios (RCP2.6, 4.5 and 8.5). Seasonal amplitude and phase changes in soil moisture are examined, and joint probability density functions are used to quantify compound warm–dry conditions and their drivers.

The projections show a clear reduction of soil moisture throughout the entire annual cycle, in response to a significant decrease in precipitation and an increase in temperature, leading to a substantial rise in potential evapotranspiration. The overall total soil moisture decreases ranges from -5% for the RCP2.6 to -20% (-10%) for the RCP8.5 (RCP4.5), with relation to the present climate. Projections reveal that for the RCP4.5 (RCP8.5) for the mid-century soil moisture deficits up to 5x (6x) are projected to occur, and for the end-of-century even 7x for the RCP8.5. Our results show a robust amplification of soil moisture seasonal amplitude across all Mediterranean sub-regions, increasing with higher greenhouse gas emissions and toward the end of the century. The largest increases are projected over the eastern Mediterranean, reflecting enhanced seasonal contrasts driven by intensified summer drying. Despite these amplitude changes, the phase of the soil moisture annual cycle remains stable across scenarios, indicating that climate change primarily intensifies existing seasonal dynamics rather than shifting their timing. Joint probability analyses show a substantial increase in the likelihood of compound warm–dry conditions, particularly under RCP4.5 and, more pronounced under RCP8.5, during mid- and late-century periods.

Overall, our findings highlight that future Mediterranean hydroclimatic risk is driven not only by mean drying but also by a pronounced intensification of soil moisture variability and compound extremes. These projections have important implications for ecosystem, water resources, and climate adaptation strategies.


This work is supported by FCT, I.P./MCTES through national funds (PIDDAC): LA/P/0068/2020 - https://doi.org/10.54499/LA/P/0068/2020, UID/50019/2025, https://doi.org /10.54499/UID/PRR/50019/2025, UID/PRR2/50019/2025. The authors would like also to acknowledge the project “Elaboração do Plano Municipal de Ação Climática de Barcelos (PMACB). This work was performed under the scope of project https://doi.org/10.54499/2022.09185.PTDC (DHEFEUS). DCAL acknowledge FCT I.P./MCTES (Fundação para a Ciência e a Tecnologia) for the FCT https://doi.org/10.54499/2022.03183.CEECIND/CP1715/CT0004.

How to cite: Lima, D. C. A., Bento, V. A., Russo, A., and Soares, P. M. M.: Amplification of soil moisture seasonality and compound warm–dry conditions over the Mediterranean under future climate scenarios, EGU General Assembly 2026, Vienna, Austria, 3–8 May 2026, EGU26-13031, https://doi.org/10.5194/egusphere-egu26-13031, 2026.

EGU26-13692 | Orals | CL4.4

An insufficient subsurface depth biases the long-term surface energy balance in Land Surface Models 

Fidel González-Rouco, Félix García-Pereira, Nagore Meabe-Yanguas, Johann Jungclaus, Stephan Lorenz, Stefan Hagemann, Carlos Yagüe, Francisco José Cuesta-Valero, Almudena García-García, and Hugo Beltrami

The land subsurface stored around 6% of the Earth’s energy imbalance in the last five decades (of around 0.5 Wm-2, equivalent to 380 ZJ), being the second contributor to the energy partitioning after the ocean (90%). Previous studies have shown that state-of-the-art Earth System Models (ESMs) remarkably underestimate the observational land heat uptake values. This underestimation stems from Land Surface Models (LSMs) within ESMs imposing too shallow zero-flux bottom boundary conditions to correctly represent the conductive propagation and land heat uptake with depth. When realistically deep boundary conditions are prescribed, land heat uptake increases by a factor of five. However, changes in ground surface temperature are negligible. The reasons for this lack of impact of the LSM depth on surface temperatures are assessed herein.

An ensemble of eight historical and RCP8.5 land-only simulations with different subsurface depths was conducted with the LSM of the Max Planck Institute for Meteorology ESM (MPI-ESM), JSBACH. Simulation-derived latent (LHF), sensible (SHF), and ground heat fluxes (GHF) were compared across simulations, and GHF was additionally evaluated against estimates from a one-dimensional heat conduction forward model. Results show that, for a global warming of 1.5 ºC with respect to 1850-1900, GHF increases from 0.04 to 0.07 Wm-2 when deepening the LSM from 10 to 22 m, saturating at around 0.12 Wm-2 when the boundary condition is placed at approximately 100 m. The increase in the incoming GHF is mainly compensated by a global decrease in the outgoing SHF, a small decrease of the LHF in wet regions, and a decrease in the surface net radiation in arid and semi-arid regions. These quantities, yet small, evidence that an insufficient LSM depth induces to an inaccurate resolution of the long-term surface energy balance, which may have implications for land-atmosphere interaction. Their accumulation over time also produces biases in the terrestrial energy partitioning.

How to cite: González-Rouco, F., García-Pereira, F., Meabe-Yanguas, N., Jungclaus, J., Lorenz, S., Hagemann, S., Yagüe, C., Cuesta-Valero, F. J., García-García, A., and Beltrami, H.: An insufficient subsurface depth biases the long-term surface energy balance in Land Surface Models, EGU General Assembly 2026, Vienna, Austria, 3–8 May 2026, EGU26-13692, https://doi.org/10.5194/egusphere-egu26-13692, 2026.

EGU26-13807 | ECS | Posters on site | CL4.4

Contribution of evaporative sources and atmospheric circulation to the spatiotemporal variability of moisture transport 

Vittorio Giordano, Arie Staal, Marta Tuninetti, Francesco Laio, and Luca Ridolfi
The coupling between land evaporation and precipitation is central to land-atmosphere interactions, yet remains one of the most poorly understood processes in the hydrological cycle. While evaporation is often viewed as having a predominantly local effect, growing evidence suggests that the land surface can significantly influence remote precipitation through atmospheric circulation and moisture transport. However, the sensitivity of precipitation to the interannual variability of its evaporative sources and atmospheric transport pathways remains largely unexplored.
 
Here, we employ the UTrack Lagrangian model driven by ERA5 reanalysis to perform a multi-annual moisture tracking analysis, identifying evaporative sources of precipitation and characterizing their variability over time. We develop statistical relationships to quantify the sensitivity of precipitation patterns to anomalies in both evaporative source strength and atmospheric moisture transport. Additionally, we investigate the correlation structure connecting evaporated moisture at the source, its transport through the atmosphere, and its contribution to precipitation at target locations.
 
Understanding the dominant factors driving moisture transport variability is crucial, as fluctuations in these pathways play a key role in the onset of droughts and extreme events and can be influenced by land uses and human activities. Furthermore, this work provides critical insights into the limitations of using climatological mean transport patterns compared to year-to-year analyses.

How to cite: Giordano, V., Staal, A., Tuninetti, M., Laio, F., and Ridolfi, L.: Contribution of evaporative sources and atmospheric circulation to the spatiotemporal variability of moisture transport, EGU General Assembly 2026, Vienna, Austria, 3–8 May 2026, EGU26-13807, https://doi.org/10.5194/egusphere-egu26-13807, 2026.

EGU26-13817 | ECS | Orals | CL4.4

Simulating Indian Monsoon Rainfall over irrigation intensive regions using updated LULC and irrigation representation in WRF model 

Prachi Khobragade, Kirthiga Murugesan, and Balaji Narasimhan

Accurate representation of land surface characteristics plays a crucial role in improving regional monsoon simulations. Recent studies demonstrate that irrigation in croplands positively influences rainfall; therefore, explicitly representing irrigated regions can lead to more accurate rainfall simulations. In this study, we employ the Weather Research and Forecasting (WRF v4.5) model to evaluate the performance of two land surface models (LSMs), Noah and Noah-MP, in simulating Southwest (SW) and Northeast (NE) monsoon rainfall over an irrigation-intensive region of India. Here, three simulations were conducted Noah, Noah-MP without irrigation, and Noah-MP with irrigation, using the National Remote Sensing Centre (NRSC) land use land cover (LULC) dataset for 2018-2019, which provides an updated representation of land cover over India. We implement the FAO irrigated fraction map, which serves as the default irrigation dataset in WRF v4.5. The model outputs were compared with the high-resolution regional reanalysis from the Indian Monsoon Data Assimilation and Analysis (IMDAA) of 12km resolution using statistical metrics such as root mean square error (RMSE) and mean bias. The results indicate that both LSMs reasonably capture the broad spatial and temporal characteristics of monsoon rainfall, albeit with varying levels of accuracy. These findings underscore the strong sensitivity of WRF rainfall simulations to both the land surface parameterization and the underlying land use representation, highlighting the importance of accurate region specific high resolution LULC data and LSMs for accurate monsoon rainfall modeling. The results demonstrate that irrigation alters land atmospheric interactions by inducing surface cooling and atmospheric moistening, which modify upper-level humidity, geopotential height, and wind patterns. These changes regulate convective activity differently across space and seasons, leading to regionally and temporally complex rainfall responses. This study provides guidance on selecting appropriate modeling schemes for irrigation-intensive, monsoon-focused simulations over the Indian region.

How to cite: Khobragade, P., Murugesan, K., and Narasimhan, B.: Simulating Indian Monsoon Rainfall over irrigation intensive regions using updated LULC and irrigation representation in WRF model, EGU General Assembly 2026, Vienna, Austria, 3–8 May 2026, EGU26-13817, https://doi.org/10.5194/egusphere-egu26-13817, 2026.

EGU26-15125 | ECS | Posters on site | CL4.4

How do land-use changes shape future extreme temperatures across Europe? 

Luana C. Santos, Rita M. Cardoso, Jorge Navarro Montesinos, Elena García Bustamante, J. Fidel González Rouco, Carlos DaCamara, and Pedro M. M. Soares

In recent decades, Europe has experienced a clear increase in the frequency and intensity of heatwaves, a trend projected to intensify under future climate change. Understanding the processes that modulate extreme heat is therefore critical. While land-use and land-cover changes (LULC) strongly affect surface energy and water exchanges, their role in shaping extreme temperatures at regional scales remains insufficiently explored, particularly under future climate scenarios.

Here, we investigate how LUC modulates extreme temperatures and heatwaves over Europe under the SSP3-7.0 scenario using high-resolution regional climate simulations performed with the Weather Research and Forecasting (WRF v4.5.1.4) model. The simulations analyzed contribute to both the EURO-CORDEX framework and the Flagship Pilot Study LUCAS (Land Use and Climate Across Scales). A standard EURO-CORDEX future experiment with fixed LULC is compared with a corresponding simulation following LUCAS Phase 2, in which LULC evolves annually, allowing the assessment of transient LULC effects under future climate conditions.

Extreme temperature days are identified using percentile-based thresholds of daily maximum temperature, and heatwaves are defined as periods of consecutive exceedances with varying durations. To enable a consistent comparison of event intensity across experiments, temperature and land-surface variables are normalized using seasonal interquartile ranges. Changes in the frequency, duration, and magnitude of extreme heat events are analyzed over Europe and across sub-regional domains.

This analysis aims to quantify the sensitivity of future extreme temperatures to LULC change and to assess the role of land-atmosphere interactions in modulating heat extremes under climate change conditions. The results will contribute to a better understanding of how land management choices may influence future extreme heat risk across Europe.


Acknowledgements

The authors wish to acknowledge the financial support from the Portuguese Fundação para a Ciência e Tecnologia (FCT, I.P./MCTES) through national funds (PIDDAC): LA/P/0068/2020 - https://doi.org/10.54499/LA/P/0068/2020, UID/50019/2025, https://doi.org/10.54499/UID/PRR/50019/2025, UID/PRR2/50019/2025.

L.C.S. and R.M.C. also acknowledge individual funding from FCT, I.P./MCTES grants https://doi.org/10.54499/UI/BD/154675/2023, and https://doi.org/10.54499/2021.01280.CEECIND/CP1650/CT0006.

How to cite: Santos, L. C., Cardoso, R. M., Navarro Montesinos, J., García Bustamante, E., González Rouco, J. F., DaCamara, C., and Soares, P. M. M.: How do land-use changes shape future extreme temperatures across Europe?, EGU General Assembly 2026, Vienna, Austria, 3–8 May 2026, EGU26-15125, https://doi.org/10.5194/egusphere-egu26-15125, 2026.

EGU26-16256 | ECS | Posters on site | CL4.4

Evaluating land-atmosphere interactions controlling precipitation over Central Africa in CESM 

Margo Cabuy, Jessica Ruijsch, Steven De Hertog, Diego Miralles, and Wim Thiery

Tropical precipitation is closely linked to the land surface through the exchange of water and energy between the surface and atmosphere, regulating boundary layer moistening and convective instability. In Central Africa, particularly the Congo Basin, the extensive rainforest contributes a substantial amount of moisture to the atmosphere through evaporation, enhancing convective activity and shaping the region’s seasonal and daily rainfall. In this study, we evaluate the ability of the Community Earth System Model (CESM) can represent these coupled land-atmosphere-convection processes and their control on precipitation across Central Africa.


CESM estimates of rainfall over the past 30 years are compared with multiple observational products (including IMERG, CHIRPS, and MSWEP) to assess whether the model reproduces the magnitude, variability, and spatial distribution of rainfall at daily and seasonal timescales. The same evaluation framework is applied to evaporation, with CESM estimates assessed against L-SAF, CERES, X-base, and GLEAM across consistent spatial and temporal scales. Beyond surface rainfall and evaporation, we analyse CESM’s column-integrated atmospheric moisture budget over the Congo Basin, including diagnostics of convective mass flux, against ERA5, to quantify the contributions of local evaporation, large-scale moisture convergence, and convective transport to precipitation. This approach allows us to identify whether CESM rainfall biases originate from misrepresented land surface fluxes, deficiencies in hydrometeorological parameterisation, or errors in large-scale moisture transport.


The analysis is conducted on both daily and seasonal timescales, to separate fast land-atmosphere coupling from slower circulation-driven controls. By combining evaluations of precipitation and evaporation with a process-oriented decomposition of moisture supply and convective response, this work assesses whether CESM can reliably represent land-driven rainfall variability, moisture recycling, and the emergence of hydroclimatic extremes in Central Africa.

How to cite: Cabuy, M., Ruijsch, J., De Hertog, S., Miralles, D., and Thiery, W.: Evaluating land-atmosphere interactions controlling precipitation over Central Africa in CESM, EGU General Assembly 2026, Vienna, Austria, 3–8 May 2026, EGU26-16256, https://doi.org/10.5194/egusphere-egu26-16256, 2026.

EGU26-17132 | ECS | Orals | CL4.4

Quantifying Land-Surface Effects on Cloud Occurrence Using Neural Networks 

Eva Pauli, Hendrik Andersen, Peer Nowack, and Jan Cermak

The aim of this study is to investigate the effect of land surface conditions on cloud occurrence by quantifying how they modulate the influence of large-scale meteorological conditions.
The land surface can modulate clouds through its influence on surface heat fluxes, local moisture availability, and surface roughness. However, quantifying these effects from observations remains challenging, as the temporal and spatial variability of cloud occurrence is large and influencing factors covary.
Here, we employ a convolutional neural network (CNN) to predict satellite-observed cloud fraction over Europe for the period 1983–2020. Cloud fraction is taken from the CM SAF Cloud Fractional Cover dataset based on Meteosat First and Second Generation observations (COMET). Predictors are derived from the ERA5 reanalysis, including ERA5-Land as well as ERA5 fields on single and pressure levels. To delineate the land surface impact on cloud occurrence predictability, we develop two model configurations: one driven solely by large-scale meteorological conditions, and a second one that additionally incorporates land surface variables. Both models achieve high predictive skill (R² > 0.8), with a slight increase in performance when land surface conditions are included. Sensitivity analyses using permutation feature importance and partial dependency indicates that cloud occurrence is primarily controlled by large-scale meteorological drivers, while soil moisture and surface sensible heat flux emerge as the most influential land surface variables.
Future work will use this framework to quantify the impact of land cover change on cloud occurrence and extend the framework beyond Europe.

How to cite: Pauli, E., Andersen, H., Nowack, P., and Cermak, J.: Quantifying Land-Surface Effects on Cloud Occurrence Using Neural Networks, EGU General Assembly 2026, Vienna, Austria, 3–8 May 2026, EGU26-17132, https://doi.org/10.5194/egusphere-egu26-17132, 2026.

EGU26-17634 | Posters on site | CL4.4

Vegetation–atmosphere feedback in the Mediterranean region from Regional Climate Model simulations: the Apulia case study 

Roberta D'Agostino, Roberto Ingrosso, Francesco Cozzoli, Gregorio Sgrigna, Enrica Nestola, Francesco Pausata, Piero Lionello, and Simona Bordoni

Over the past three decades, the Mediterranean region has experienced an increasing frequency and duration of drought events, a trend that is projected to intensify as anthropogenic emissions continue to rise. Available evidence indicates that drought conditions can trigger extensive tree mortality, amplify wildfire risk, and drive a progressive shift from Mediterranean ecosystems toward vegetation characteristic of semi-arid regions. The role of vegetation and land-use change in climate modelling is fundamental for estimating surface energy fluxes and carbon budgets. Land-use and land-cover changes (LULCCs) can alter surface energy and water fluxes, potentially leading to different responses in mean and extreme temperature and precipitation based on different representation of the vegetationApulia, in southeastern Italy, is an ideal case study, having experienced massive olive tree die-off due to Xylella fastidiosa, an invasive pathogen detected in 2008. This vegetation loss is compounded by increasing drought impacts. This case offers a unique case study to assess the consequences of extensive olive trees die-off after the spread of the pathogen/bacteria Xylella fastidiosa. In order to assess potential impacts of significant change in vegetation covers, winvestigated the effect of die-off and of massive replanting on the regional climate. The study involves two vegetation scenarios (deforestation and reforestation) performed with four sensitivity experiments at 12 km horizontal resolution with two different regional models: RegCM5 and CRCM/GEM4.8. Two experiments will serve as references for present-day (PD, 1990-2019) and future (2071-2100), while other two future experiments will be performed under both vegetation change scenarios. The percentage of plant functional types in the land component (CLM4.5) of RegCM was replaced with that used in the CRCM/GEM4.8 simulations. Preliminary results show that while temperature extremes can be exhacerbated by rewilding, increasing tree cover can help to keep soil moisturised, acting against the progressive aridification of the area. On the other hand, the deforested case leads to a decrease in daily maximum temperature, particularly in Fall and Winter and an increase in daily minimum temperature in Summer. These changes are driven by albedo feedback related to the land-use modification.

How to cite: D'Agostino, R., Ingrosso, R., Cozzoli, F., Sgrigna, G., Nestola, E., Pausata, F., Lionello, P., and Bordoni, S.: Vegetation–atmosphere feedback in the Mediterranean region from Regional Climate Model simulations: the Apulia case study, EGU General Assembly 2026, Vienna, Austria, 3–8 May 2026, EGU26-17634, https://doi.org/10.5194/egusphere-egu26-17634, 2026.

EGU26-17817 | ECS | Orals | CL4.4

Summer Land-Atmosphere Coupling over Europe: A Comparative Evaluation of Observation-based Datasets 

Monalisa Sahoo, Stefano Materia, and Markus Donat

Land–atmosphere coupling has long been recognized to modulate the surface fluxes partition in transitional evaporative regimes, where soil moisture anomalies control evapotranspiration. However, globally available in-situ observations for these variables remain limited. This study provides, for the first time, a comprehensive assessment of the similarities, dissimilarities, and limitations among observation-based datasets of surface soil moisture, evapotranspiration, potential evapotranspiration, and 2-meter mean air temperature across Europe. The analysis focuses on the IPCC-defined regions of Northern Europe, Eastern Europe, Western-Central Europe, and the Mediterranean during summer (June–August) for the recent 20-year period (2003–2022). In addition, the study evaluates and compares the representation of land–atmosphere coupling across the different datasets. The results show that most datasets exhibit strong agreement across most regions and effectively capture land–atmosphere interactions. The coupling analysis further reveals a clear north–south contrast: Northern Europe is energy-limited, where atmospheric coupling dominates, whereas the Mediterranean is water-limited, with stronger terrestrial coupling. Central and Eastern Europe show more variability within the season and across years. Overall, the findings highlight reasonable consistency among datasets in representing land–atmosphere processes, despite existing uncertainties.

Keywords: surface soil moisture, evapotranspiration, land-atmosphere coupling, summer

How to cite: Sahoo, M., Materia, S., and Donat, M.: Summer Land-Atmosphere Coupling over Europe: A Comparative Evaluation of Observation-based Datasets, EGU General Assembly 2026, Vienna, Austria, 3–8 May 2026, EGU26-17817, https://doi.org/10.5194/egusphere-egu26-17817, 2026.

EGU26-17995 | Posters on site | CL4.4

Impacts of high temperatures with varied hit timing on soil moisture drought 

Ye Zhu, Xinyu Zhang, Yi Liu, Bingwei Xu, and Linqi Zhang

High temepratures can impose different effects on soil mositure drought development depending on their hit timing. Based on the reanalysis soil moisture data, we identified the duration of soil moisture drought onset (defined as the time period for moisture to transition from a normal state to below-average condition), and designed a random forest based experimental framework to measure how rapidly soil mositure drought develops under varied high temeprature conditions in China. Results show that the duration of soil mositure drought onset would be shorten by 10-50 days under high temperatures in relative to that of annual mean temperature scenarios. With regard to the timing of high temepratures, the associated impacts were the greatest for high temperatures  of 1 month prior to soil moisture drought occurrence. In densely vegetated areas, pre-drought high temperatures played positively in accelerating the formation of soil moisture drought. In sparse vegetated areas by contrast, post-drought high temperatures contributed to the ongoing development of soil drought. The findings show the asymmetrical impacts of pre-drought and post-drought high temperatures on soil drought development, which may provide some references for improving the understanding of soil moisture drought mechanism in a warming future.

How to cite: Zhu, Y., Zhang, X., Liu, Y., Xu, B., and Zhang, L.: Impacts of high temperatures with varied hit timing on soil moisture drought, EGU General Assembly 2026, Vienna, Austria, 3–8 May 2026, EGU26-17995, https://doi.org/10.5194/egusphere-egu26-17995, 2026.

EGU26-19185 | ECS | Posters on site | CL4.4

Multivariate Climate Extremes and Their Impacts on Arctic Land–Atmosphere Carbon Exchange under Future Climate Change 

Lukas Fiedler, Armineh Barkhordarian, Victor Brovkin, and Johanna Baehr

Rapid warming of the Arctic is increasingly being linked to climate extremes such as heat waves, droughts, and wildfires, which are fundamentally altering the functioning of ecosystems, the dynamics of the carbon cycle, and the interactions between land and atmosphere in the Arctic. Increasing evidence suggests that high-latitude extreme events rarely occur in isolation but are frequently embedded within compound climate extremes. These multivariate events can strongly modify land surface states, through changes in soil moisture, vegetation structure, surface energy balance, and fire disturbance, and thereby influence carbon exchanges between the land and atmosphere. However, the extent to which compound climate extremes amplify or modulate Arctic carbon-cycle extremes in the future remains poorly constrained.

In this study, we investigate how compound climate extreme events shape the evolution of Arctic carbon-cycle extremes under future Arctic warming. Using large ensemble simulations with the Community Earth System Model version 2 (CESM2), which has demonstrated skill in representing Arctic climate processes, fire dynamics, and fire-weather interactions, we assess the evolution of extreme events in gross primary productivity, ecosystem respiration, and net ecosystem carbon balance throughout the 21st century. A multivariate statistical framework is applied to explicitly characterise compound extremes involving fire activity, heat waves, and droughts, and to qualify and quantify their combined impacts on land-atmosphere carbon flux variability in the Arctic. By linking compound climate drivers to ecosystem carbon responses, this work advances our understanding of how land surface conditions regulate extreme carbon-cycle behaviour in a rapidly changing Arctic.

How to cite: Fiedler, L., Barkhordarian, A., Brovkin, V., and Baehr, J.: Multivariate Climate Extremes and Their Impacts on Arctic Land–Atmosphere Carbon Exchange under Future Climate Change, EGU General Assembly 2026, Vienna, Austria, 3–8 May 2026, EGU26-19185, https://doi.org/10.5194/egusphere-egu26-19185, 2026.

EGU26-19261 | ECS | Orals | CL4.4

Uncertainties in land-atmosphere coupling still a big obstacle for accurate climate projections 

Almudena García-García, Francisco José Cuesta-Valero, Ana Bastos, René Orth, and Jian Peng

Terrestrial energy, water and carbon exchanges are regulated by the strength and sign of the coupling between the land surface and the atmosphere. Simulating this land-atmosphere coupling is crucial for realistic weather and climate projections and, especially, to anticipate the evolution of extreme events. After an exploration of the metrics and datasets available for studying land-atmosphere coupling at different temporal and spatial scales, we demonstrate that uncertainties in data products based on in-situ measurements, remote sensing data, and Earth System Model simulations remain large. The evaluation of model simulations according to a variety of land-atmosphere coupling metrics reveals large structural uncertainties in comparison with the small effect of internal variability on land-atmosphere coupling. We show that reducing uncertainties in available Earth Observations (EO) products for studying land-atmosphere coupling is also necessary. This could be done by collecting long-term measurements at the land surface and implementing more observational and physical constraints in the algorithms used to derive EO products. The availability of more accurate, physically consistent EO products with an accurate representation of land-atmosphere coupling will in turn help to develop the future generation of Earth System Models.

How to cite: García-García, A., Cuesta-Valero, F. J., Bastos, A., Orth, R., and Peng, J.: Uncertainties in land-atmosphere coupling still a big obstacle for accurate climate projections, EGU General Assembly 2026, Vienna, Austria, 3–8 May 2026, EGU26-19261, https://doi.org/10.5194/egusphere-egu26-19261, 2026.

EGU26-19934 | Orals | CL4.4

The Role of Land-Surface Dynamics in Climate Persistence and Convective Extremes 

Elizabeth Cultra, J s Nanditha, Jun Yin, Mark S Bartlett Jr, and Amilcare Porporato
The properties governing atmospheric convection, which can produce heavy rainfall and severe weather events, depend on both land-surface characteristics and atmospheric conditions. This work develops a stochastic, coupled plant–soil–atmosphere model that treats atmospheric drivers of moist convection, such as convective available potential energy (CAPE), as functions of the soil–vegetation surface. Further, we link trajectories of these atmospheric and surface variables, including rainfall intensity, to changes in functional plant type (i.e., response to drought stress) and soil type. This enables the realization of steady-state probability distributions of relevant ecohydrological quantities, including soil moisture, plant water potential, and CAPE. From this dynamical systems perspective, the probability of rainfall is conditioned on the terrestrial surface state. Therefore, the wet–dry switching that influences climatic persistence in convection-dominated regions can be directly related to soil moisture. This formulation provides a framework for understanding how very large CAPE and intense rainfall can emerge under specific combinations of antecedent soil moisture, land-surface fluxes, and free-atmospheric conditions.

How to cite: Cultra, E., Nanditha, J. S., Yin, J., Bartlett Jr, M. S., and Porporato, A.: The Role of Land-Surface Dynamics in Climate Persistence and Convective Extremes, EGU General Assembly 2026, Vienna, Austria, 3–8 May 2026, EGU26-19934, https://doi.org/10.5194/egusphere-egu26-19934, 2026.

Energy fluxes between the surface and the atmosphere are known contributors to the genesis and the amplification of temperature extremes: a classic example is the enhancement of land-to-atmosphere sensible heat fluxes during heatwaves over dry soils, boosting the already high surface temperatures to extreme values. Recent work on the Lagrangian analysis of temperature extremes has pinpointed that, in some specific continental regions, diabatic processes do not just act as amplifiers, but play a dominant role in the genesis of positive and negative extreme temperature anomalies. This observation suggests a distinction between world regions where extremely warm or cold air masses are locally generated by non-adiabatic processes, acting as warm or cold air "reservoirs", and other neighboring regions where such extreme air masses are exported adiabatically by the large-scale circulation.

In this work we propose a methodology to identify, in the ERA5 reanalysis data set, the surface energy balance regimes that correspond to the local generation of hot and cold air during summer and winter, respectively, and to separate them from cold/warm air advection regimes. The generation of cold air during winter is favored during clear, calm nights over continental or ice-covered regions, that leads to sustained radiative cooling. The regions where such conditions are most frequent are Siberia and the Canadian Arctic, which can be depicted as the two "boreal cold air reservoirs" of the northern hemisphere. Hot air generation during summer is more geographically spread than cold air, but occurs more frequently in subtropical areas including regions surrounding the Mediterranean Sea.

The framework is illustrated in detail through two case studies. The first is a cold air outbreak that affected eastern Asia during January 2023, which led to the new absolute negative temperature record for China. This event was preceded by particularly favorable conditions for cold air generation over northern Siberia. The second is the July 2022 heatwave, that led to temperatures exceeding 40°C over central England. In this case, a Lagrangian analysis suggests that the extremely high temperatures were related to strong diabatic heating not over the British Isles, but over the Iberian Peninsula in the days preceding the event.

How to cite: Riboldi, J. and Schnyder, F.: A framework to characterize the contribution of upstream land-atmosphere interactions to cold spells and heatwaves, EGU General Assembly 2026, Vienna, Austria, 3–8 May 2026, EGU26-20181, https://doi.org/10.5194/egusphere-egu26-20181, 2026.

EGU26-20768 | Orals | CL4.4

How do future land-use changes jointly influence summer land–atmosphere coupling and fire danger across Europe? 

Rita M. Cardoso, Luana C. Santos, Jorge Navarro, Elena García Bustamante, J. Fidel González Rouco, Carlos C. Camara, and Pedro M M Soares

Land use/land cover changes (LUC) modify local land surface properties that control the land-atmosphere mass, energy, and momentum exchanges. Through soil moisture and vegetation exchanges, land-atmosphere coupling contributes significantly to the evolution of extreme events like heat waves and forest fires. However, these interactions are still unsatisfactorily explored at regional scales under future climate scenarios.

Here, we investigate these processes using newly performed Weather Research and Forecasting (WRF v4.5.1.4) simulations under the SSP3-7.0 scenario, conducted within the EURO-CORDEX and LUCAS Phase 2 regional climate simulation ensembles. Both simulations use the LANDMATE Plant Functional Type (PFT) land cover dataset for Europe, in the first the landcover is kept constant using the 2015 map, while in the second, the land-use evolves annually according to the Land Use Harmonization dataset protocol for SSP3-7.0 scenario.

The impact of temperature–evapotranspiration coupling is assessed using a coupling metric defined as the product of normalised variables, allowing differences across regions and simulations to be examined consistently. The analysis focuses on the coupling between extreme heat (TX90p) or heat waves (defined as TX90p persisting for at least five consecutive days) and evapotranspiration (LH) or soil moisture (SMOIS), expressed through the metrics TX90p×LH and TX90p×SMOIS. Values lower than −1 indicate concurrent deficits in LH (or SMOIS), corresponding to a decoupled land–atmosphere regime. Conversely, values greater than 1 indicate strong land–atmosphere coupling.

The compound effects of extreme coupled and uncoupled events on future meteorological fire danger indices (FWI and FWIe) are analysed for both simulations, enabling a quantitative assessment of the sensitivity of future fire danger to combined climate and land-use changes.

Acknowledgements

The authors wish to acknowledge the financial support from the Portuguese Fundação para a Ciência e Tecnologia (FCT, I.P./MCTES) through national funds (PIDDAC): LA/P/0068/2020 - https://doi.org/10.54499/LA/P/0068/2020, UID/50019/2025, https://doi.org/10.54499/UID/PRR/50019/2025, UID/PRR2/50019/2025.

L.C.S. and R.M.C. also acknowledge individual funding from FCT, I.P./MCTES grants https://doi.org/10.54499/UI/BD/154675/2023, and https://doi.org/10.54499/2021.01280.CEECIND/CP1650/CT0006.

How to cite: Cardoso, R. M., Santos, L. C., Navarro, J., Bustamante, E. G., González Rouco, J. F., Camara, C. C., and Soares, P. M. M.: How do future land-use changes jointly influence summer land–atmosphere coupling and fire danger across Europe?, EGU General Assembly 2026, Vienna, Austria, 3–8 May 2026, EGU26-20768, https://doi.org/10.5194/egusphere-egu26-20768, 2026.

EGU26-20958 | Orals | CL4.4

Revisiting irrigation impacts on the North China Plain: Accounting for water resource limitations 

Hongbin Liang, Shulei Zhang, and Yongjiu Dai

Agricultural irrigation can strongly modify land–atmosphere interactions and regional climate, especially in densely irrigated areas. The North China Plain, the largest irrigated region in China, has experienced significant irrigation-driven changes in local temperature, precipitation, and extreme events. Previous studies often oversimplify irrigation by assuming constant application rates or neglecting water resource limitations, which can lead to biased estimates of irrigation-induced climate effects. To address this, we developed an enhanced irrigation module within a land surface model (Common Land Model, CoLM), coupled with the Community Regional Earth System Model (CRESM), explicitly representing irrigation demand, water availability constraints, and application methods. Using this framework, we successfully reproduced observed surface temperature, precipitation, irrigation amounts, and crop yields across the North China Plain. Our results show that accounting for water-limited irrigation reduces the overestimation of the intensity and frequency of extreme events found in simulations that ignore resource constraints. Furthermore, considering irrigation water limitations alters the simulated regional temperature and precipitation patterns, which in turn affects projections of future agricultural water demand. This study demonstrates that explicitly accounting for water–agriculture interactions is essential for accurately simulating irrigation impacts, supporting more informed strategies for sustainable water and agricultural management under climate change.

How to cite: Liang, H., Zhang, S., and Dai, Y.: Revisiting irrigation impacts on the North China Plain: Accounting for water resource limitations, EGU General Assembly 2026, Vienna, Austria, 3–8 May 2026, EGU26-20958, https://doi.org/10.5194/egusphere-egu26-20958, 2026.

Potential evapotranspiration (ETp) is a variable driven by many factors and one which is heavily affected by climate change. In many cases, the observed increase in ETp is attributed to rising air temperatures in the past and temperature is used as the main prediction variable for future developments of ETp in climate change projections.

The climate station at the lysimeter station Brandis (Saxony, Germany) has been recording a wide range of climate variables since 1980.  From the observations it is evident that, in addition to the increase in air temperature at the site, there has also been a significant increase of sunshine duration (average increase of 0,29h d⁻¹ decade⁻¹) and global radiation (average increase of 47,45 J cm⁻2 d⁻¹ decade⁻¹). This combination of higher temperature levels and increased energy availability leads to significant increases in ETP (average increase of 0,11 mm d⁻¹ decade⁻¹), which is a mayor driver of the local water balance and an important variable in describing the atmospheric demand in modeling studies. Based on the observed trend in sunshine durations we provide an analysis of the individual contributions of increases in global radiation and air temperature, to assess:

  • the individual contributions to the overall increase in potential evapotranspiration (according to Turc-Wendling)
  • the influence of global radiation and air temperature on the intra-annual course?

The individual contributions of increases in radiation and air temperature on the ETP was calculated using trend analysis over the period from 1980 to 2025. It shows that, according to the Turc-Wendling approach, 69% of the ETP increase at the site is radiation-driven, while air temperature only has an influence of 28%. Additionally, clear seasonal patterns are found in the individual contributions.  Overall, the results show that global radiation increases are a mayor driver for the increase in potential evapotranspiration at the site and future developments of potential trends in global radiation should be considered in projections of potential evapotranspiration.

How to cite: Tiedke, A. and Werisch, S.: The influence of increasing radiation (sunshine duration and global radiation) on the increase in potential evapotranspiration, EGU General Assembly 2026, Vienna, Austria, 3–8 May 2026, EGU26-21187, https://doi.org/10.5194/egusphere-egu26-21187, 2026.

EGU26-511 | ECS | Orals | CL5.8

Satellite-based detection of agricultural flash droughts and their ecosystem impacts in southeastern South America 

Lumila Masaro, Miguel A. Lovino, M. Josefina Pierrestegui, Gabriela V. Müller, and Wouter Dorigo

Flash droughts are rapid-onset events that develop within weeks, imposing severe and often unexpected impacts on agriculture. Their monitoring remains challenging due to several factors, including the scarcity of root-zone soil moisture (RZSM) observations and the lack of methodological consensus. This study has two main objectives: (1) to evaluate the applicability of the European Space Agency Climate Change Initiative Combined Root-Zone Soil Moisture product (ESA CCI COM RZSM) for detecting agricultural flash droughts (AFDs) across southeastern South America (SESA), and (2) to assess how satellite-based indicators obtained from the Moderate Resolution Imaging Spectroradiometer (MODIS) capture their physical evolution and agricultural impacts.

We apply two complementary AFD detection frameworks to ESA CCI COM and ERA5 RZSM data for 1979–2022: a statistical percentile-based approach and a physically based formulation derived from the Soil Water Deficit Index (SWDI). The percentile method detects AFDs as rapid transitions from above-normal to below-normal soil moisture. The SWDI identifies events through shifts from near-optimal water availability to physiological stress based on soil hydraulic properties. To evaluate agricultural impacts, we analyze satellite-derived evapotranspiration (EVT) and vegetation indicators from MODIS for two representative events in central-eastern and northern SESA. Vegetation indicators include the Land Surface Water Index (LSWI), fraction of absorbed Photosynthetically Active Radiation (fPAR), and Gross Primary Productivity (GPP).

Our results suggest that AFD detection is strongly conditioned by both methodological framework and dataset characteristics. The percentile-based approach tends to overestimate AFD occurrence in persistently wet or dry regimes, where small fluctuations are amplified after percentile transformation. In contrast, the SWDI-based approach preserves regional hydroclimatic gradients and provides a physically consistent representation of plant water stress. Regarding the dataset, ESA CCI COM RZSM captures the main spatial patterns and seasonal cycles of soil moisture depicted by ERA5 across SESA. However, it exhibits smoother short-term variability, delayed drying, and lower absolute soil moisture than ERA5, which could be attributed to the empirical filtering used to propagate surface signals into deeper layers.

Satellite-derived indicators effectively capture the evolution of AFDs across SESA. Soil moisture depletion is followed by reductions in EVT as ecosystems transition from energy- to water-limited conditions. Vegetation indicators respond shortly thereafter: LSWI reveals declining canopy water content, fPAR shows reduced photosynthetic activity, and GPP reflects suppressed ecosystem productivity. The magnitude and spatial extent of these impacts depend on antecedent soil moisture and land-cover type, highlighting the importance of background conditions in modulating drought severity.

Overall, the results demonstrate that ESA CCI COM RZSM provides valuable information for regional AFD monitoring when its physical limitations are considered. The coherence among soil moisture, surface fluxes, and biological responses highlights the potential of satellite observations to track the onset, intensification, and agricultural consequences of AFDs. These results strengthen the use of multi-sensor satellite systems for operational early-warning applications and impact assessment across climate-sensitive agricultural regions such as SESA.

How to cite: Masaro, L., Lovino, M. A., Pierrestegui, M. J., Müller, G. V., and Dorigo, W.: Satellite-based detection of agricultural flash droughts and their ecosystem impacts in southeastern South America, EGU General Assembly 2026, Vienna, Austria, 3–8 May 2026, EGU26-511, https://doi.org/10.5194/egusphere-egu26-511, 2026.

EGU26-1232 | ECS | Orals | CL5.8

Evaluating Divergent Evapotranspiration Feedbacks to Warming Across Water- and Energy-Limited Regimes 

Marco Possega, Emanuele Di Carlo, Annalisa Cherchi, and Andrea Alessandri

Land–atmosphere coupling is a central driver of climate variability and extremes, yet Earth System Models (ESMs) struggle to capture the complex interplay between hydrology, vegetation, and surface energy fluxes. In particular, the evapotranspiration–temperature (ET–T) feedback—a key mechanism linking soil moisture, vegetation water use, and near-surface climate—is poorly constrained, limiting confidence in projections of heat extremes and ecosystem stress. Here, we first assess ET–T feedback across a suite of post-CMIP6 ESMs for the historical period (1980–2014) as compared with available GLEAM observations; thereafter the ET-T feedback is investigated in a set of future idealized warming scenarios spanning multiple global temperature targets. To identify the physical and ecohydrological regimes controlling feedback strength, we apply the Ecosystem Limitation Index (ELI), which distinguishes energy-limited from water-limited conditions. Our results reveal a strong negative ET–T feedback in energy-limited regions, where evapotranspiration efficiently cools the surface and stabilizes temperature. In contrast, the feedback reverses in water-limited and transitional regions: here, worsening soil-moisture deficits suppress evaporation and reduce evaporative cooling, thereby amplifying surface warming. Comparison with GLEAM observations highlights regions where models succeed and fail in capturing these feedbacks, particularly in semi-arid ecosystems where land–atmosphere coupling is strongest. Future warming scenarios indicate an expansion of water-limited regimes, weakening negative ET–T feedbacks and reducing the ability of land surface to buffer temperature variability. This shift implies an increased risk of persistent heat extremes, stronger land-surface amplification of warming, and eco-hydrological transitions in sensitive regions. The findings of this study suggest priorities for next-generation ESMs: better representation of soil moisture dynamics, vegetation water-use strategies, and hydrological constraints.  

How to cite: Possega, M., Di Carlo, E., Cherchi, A., and Alessandri, A.: Evaluating Divergent Evapotranspiration Feedbacks to Warming Across Water- and Energy-Limited Regimes, EGU General Assembly 2026, Vienna, Austria, 3–8 May 2026, EGU26-1232, https://doi.org/10.5194/egusphere-egu26-1232, 2026.

Air pollutants can penetrate deep into the lungs, enter the bloodstream, and trigger a cascade of cardiovascular diseases. Elevated pollutant levels in cities are often associated with heavy traffic and industrial emissions, highlighting the need for effective mitigation strategies. Street trees can reduce air pollution through dry deposition, whereby particles are captured by tree canopies in the absence of precipitation. However, city-level models typically assume uniform deposition rates and neglect location-specific variation in tree benefits. Here, we designed a social-ecological systems approach (SES) and revealed substantial spatial disparities in tree-derived air quality benefits within a city. We found that communities with lower urban canopy received fewer air quality benefits. To address these differences, priority tree planting sites were determined using a stepwise framework that takes into account both neighbourhood-level population exposure and social vulnerability. Our findings demonstrate the uneven distribution of urban ecosystem services, emphasizing the importance of integrating environmental justice into urban forestry planning and provide practical guidance on optimizing planting for reducing population exposure to air pollutants. 

How to cite: Cui, S. and Adams, M.: Unequal Canopies, Unequal Benefits: Environmental Justice Implications of Street Tree Air Pollution Mitigation, EGU General Assembly 2026, Vienna, Austria, 3–8 May 2026, EGU26-2092, https://doi.org/10.5194/egusphere-egu26-2092, 2026.

EGU26-2682 | ECS | Posters on site | CL5.8

Constraining Flash Drought Projections Through Land-Atmosphere Coupling 

Yumiao Wang and Yuan Xing

The increasing drought onset speed is driving a global transition toward more frequent flash droughts, presenting unprecedented challenges for drought management and adaptation. However, projected changes in future flash drought characteristics show considerable divergence among climate models. Here, using models from the Coupled Model Intercomparison Project Phase 6 (CMIP6), we demonstrate that models capable of capturing the land-atmosphere coupling gradient between dry and wet soil conditions tend to project more pronounced global transition from slow to flash droughts in the future. This emergent relationship provides a robust constraint for future projections based on observed land-atmosphere coupling characteristics. Our analysis suggests that the societal and environmental risks posed by future flash droughts could be more severe than previously projected. Given the widespread impacts of flash droughts, this study not only enhances our understanding of uncertainties in drought projections, but also holds promise for supporting socio-economic planning and adaptation strategies through constrained projection.

How to cite: Wang, Y. and Xing, Y.: Constraining Flash Drought Projections Through Land-Atmosphere Coupling, EGU General Assembly 2026, Vienna, Austria, 3–8 May 2026, EGU26-2682, https://doi.org/10.5194/egusphere-egu26-2682, 2026.

In 2024, an exceptionally severe abrupt drought-to-flood transition (ADFT) event occurred over Henan Province in central China, causing substantial economic losses due to its abruptness and limited early warning. Although intraseasonal oscillations (ISOs) can provide precursors for forecasting extremes, previous studies have primarily focused on floods or droughts in isolation, leaving the synergistic impacts of multiple ISO modes on drought-to-flood transitions poorly understood. Here we show that the 2024 ADFT event was jointly modulated by two ISO modes with opposite propagation directions. During the drought stage, Rossby wave train maintained a Ural blocking pattern and displaced the westerly jet southward. This circulation configuration suppressed precipitation while enhancing temperature and sensible heat, leading to persistent drought conditions. During the transition-to-flood stage, both the Rossby wave train and the Western Pacific Subtropical High (WPSH) oscillation acted in concert. The southeastward-propagating Rossby wave train disrupted the blocking, while the WPSH oscillation migrated northwestward. Their combined effects shifted the rain belt northward, strengthened southerly moisture transport, increased latent heating, and ultimately triggered the extreme flood. The synergy between these two ISO modes amplified the transition magnitude by 50%, suggesting that the ADFT event would have been largely suppressed in the absence of their concurrent influence. These results underscore critical role of ISO phase evolution and propagation in ADFT events, and suggest that they may serve as useful precursors for forecasting abrupt transitions.

How to cite: Zhou, S. and Yuan, X.: The impact of intraseasonal oscillations on the 2024 abrupt drought-to-flood transition over central China, EGU General Assembly 2026, Vienna, Austria, 3–8 May 2026, EGU26-2684, https://doi.org/10.5194/egusphere-egu26-2684, 2026.

EGU26-3979 | Orals | CL5.8

Assessing Canopy and Roughness‑Sublayer Turbulence Representation in Noah‑MP over Forest and Grassland at Lindenberg (Germany) 

Kirsten Warrach-Sagi, Frank Beyrich, Cenlin He, and Ronnie Abolafia-Rosenzweig

Land–atmosphere exchange in tall canopies is strongly controlled by turbulence within and above the canopy and in the roughness sublayer (RSL), where classical Monin–Obukhov similarity theory (MOST) is known to be imperfect. Recent developments in the Noah‑MP land surface model (LSM) include a unified turbulence parameterization that aims to provide a consistent treatment of turbulence from within the canopy, through the RSL, to the surface layer (Abolafia‑Rosenzweig et al., 2021). While this scheme has been tested primarily under snow‑dominated conditions, its performance for non‑snow, multi‑canopy environments over long time periods remains largely unexplored.

Here, we evaluate the unified canopy–RSL turbulence parameterization in Noah‑MP (version 5.1.1) using multi‑year, multi‑level observations from the Lindenberg observatory of the German Meteorological Service (DWD). We focus on two contrasting sites: (i) Kehrigk, a tall evergreen needleleaf forest canopy where RSL effects are expected to be strong, and (ii) Falkenberg, a short grassland site that more closely conforms to MOST assumptions. Both sites provide continuous 30‑min data since 2005, including eddy‑covariance fluxes of sensible and latent heat, radiation components, soil heat flux at 5 cm depth, skin temperature, and multi‑level profiles of air temperature, humidity, and wind speed up to 30 m (forest) and 10 m (grassland). All forcing and flux data undergo standard DWD quality control procedures.

Noah‑MP is run offline at both sites with identical land and soil parameterizations, driven by observed meteorology. We compare a standard configuration (MOST‑based surface‑layer and canopy treatment) with the unified canopy–RSL turbulence configuration. Beyond standard flux evaluation, we will diagnose friction velocity, Monin–Obukhov length, bulk transfer coefficients for heat and moisture, and the vertical structure of wind and temperature in the surface and roughness sublayers. Model performance will be analysed as a function of season, canopy type, and atmospheric stability.

By linking detailed, long‑term observations to alternative turbulence representations in a widely used LSM, this study aims to clarify under which conditions enhanced canopy–RSL formulations improve land–atmosphere coupling in next‑generation Earth System Models.

How to cite: Warrach-Sagi, K., Beyrich, F., He, C., and Abolafia-Rosenzweig, R.: Assessing Canopy and Roughness‑Sublayer Turbulence Representation in Noah‑MP over Forest and Grassland at Lindenberg (Germany), EGU General Assembly 2026, Vienna, Austria, 3–8 May 2026, EGU26-3979, https://doi.org/10.5194/egusphere-egu26-3979, 2026.

Terrestrial water storage (TWS) is a key variable in the water cycle, and accurate estimation of TWS is crucial for understanding hydrological processes and improving hydrological prediction. In this study, we develop an AI-based data assimilation method for GRACE TWS observations, aiming to integrate the advantages of satellite observations and land surface models. The assimilation adopts the ResUnet model combined with a self-supervised learning strategy. Specifically, the ResUnet model is used to extract large-scale variation information from GRACE TWS observations and high-resolution information from the land surface model. This assimilation system is applied to the NoahMP land surface model for long-term simulation, and the performance is compared with the nudging method. Results show that the AI-based assimilation method is more conducive to depicting fine-scale hydrological processes. Quantitative evaluation indicates that the assimilation effect of the proposed method is superior to that of the nudging. In addition, validation against in-situ observations confirms the rationality and reliability of the proposed method, as it can more accurately estimate terrestrial water storage and related hydrological variables. In the future, this AI-based assimilation method can be extended to the assimilation of more hydrological variables and multi-source observations, which is expected to further improve the estimation capability of land surface hydrological variables and provide more reliable data support for water resource management.

How to cite: Zhu, E. and Wang, Y.: An AI-Based GRACE Terrestrial Water Storage Data Assimilation Improves Hydrological Simulation, EGU General Assembly 2026, Vienna, Austria, 3–8 May 2026, EGU26-4437, https://doi.org/10.5194/egusphere-egu26-4437, 2026.

The rapid development of numerical weather prediction (NWP) models offers new opportunities for improving quantitative precipitation forecasting, while raising challenges in objectively integrating multi-model forecasts. This study presents recent advances in an operational multi-model integration precipitation forecasting method based on the generalized Three-Cornered Hat (TCH) theory.Seven NWP models routinely operated at the National Meteorological Center of the China Meteorological Administration are considered, including ECMWF, GERMAN, NCEP, GRAPES_3KM, BEIJING_MR, GUANGZHOU_MR, and SHANGHAI_MR. The method applies TCH theory to estimate the relative error characteristics of precipitation forecasts from different models. A Bayesian framework is then used to derive objective, model-dependent weighting coefficients, enabling short-range multi-model integration forecasts.The integration performance is evaluated using Threat Score (TS) metrics for 2025. Results show that the TCH-based integration consistently outperforms the single ECMWF model across all precipitation categories. The 24-hour heavy rainfall TS reaches 0.2357, a 48% improvement, while the TS for extreme rainfall events reaches 0.1354, a 141% improvement relative to ECMWF.The multi-model integration products have been operationally implemented at the National Meteorological Center, providing critical support during high-impact weather events, highlighting both recent advances and remaining challenges in operational multi-model precipitation forecasting.

How to cite: chen, S.: Multi-model Integration Precipitation Forecasting Based on TCH Theory: Recent Advances and Challenges, EGU General Assembly 2026, Vienna, Austria, 3–8 May 2026, EGU26-6074, https://doi.org/10.5194/egusphere-egu26-6074, 2026.

Ecosystem water use efficiency (WUE), an indicator of the trade-off between carbon uptake and water loss, is widely used to assess ecosystem responses to climate change. However, large-scale studies of WUE typically assume a single, fixed lag or accumulation period of climatic drivers across regions. This static assumption neglects spatially heterogeneous temporal responses of WUE to climate, potentially biasing attribution analyses and reducing predictive skill. Here, we developed a pixel-level model to quantify the temporal effects of climatic drivers on WUE by explicitly accounting for no-effect, lagged, cumulative, and combined effects and allowing effect timescales to vary spatially. We found that more than 80% of pixels across China exhibited lagged and/or cumulative effects for each driver, with distinct temporal effect patterns among vegetation types and drivers. In herbaceous cover croplands, precipitation exhibited the shortest lag (0.31 ± 0.56 months) and the longest accumulation time (1.71 ± 0.96 months). Accounting for these spatially heterogeneous temporal effects increased the explanatory power of climatic drivers for WUE variation by 17.7% compared with models without temporal effects. We further showed that for most vegetation types, precipitation and air temperature were more strongly associated with temporal variation in WUE, whereas solar radiation contributed more to spatial variability. These findings indicate that location-specific temporal effects can modulate the climatic controls on WUE. Our framework is readily applicable beyond China and can support a shift toward dynamic climate responses in climate–ecosystem interaction modeling, thereby improving forecasts of ecosystem dynamics and informing climate-adaptive vegetation management.

How to cite: Jiao, X.: Widespread Time-Lagged and Cumulative Effects Modulate Climatic Controls on Ecosystem Water Use Efficiency , EGU General Assembly 2026, Vienna, Austria, 3–8 May 2026, EGU26-6580, https://doi.org/10.5194/egusphere-egu26-6580, 2026.

Abstract:To address the challenge of simulating runoff in ungauged regions, a hybrid physical–data-driven framework was developed by coupling Soil and Water Assessment Tool (SWAT) with an LSTM–Transformer. SWAT-derived process variables were fused with meteorological forcing to form a physically informed feature set for the Transformer-enhanced LSTM. The framework was first calibrated at a gauged station and then transferred to ungauged basins to evaluate its spatial generalizability. At the gauged station, the SWAT–LSTM–Transformer achieved the highest accuracy among all tested models, yielding an NSE of 0.587 and an R² of 0.728 on the validation dataset. It also maintained a better balance between calibration fit and validation robustness than SWAT–LSTM, SWAT–RF, SWAT–SVM, and stand-alone SWAT. SHAP-based interpretation revealed stable and hydrologically coherent predictor dependencies: temperature, lateral flow, and evaporation emerged as dominant drivers of the model’s runoff simulations, whereas precipitation and soil moisture exerted shorter-term and event-focused influences. When transferred to ungauged stations in the same watershed, the model reproduced seasonal runoff variations and event-scale fluctuations with high accuracy, with NSE ranging from 0.80 to 0.94 and R² from 0.83 to 0.92. Under cross-watershed transfer, the model continued to capture the main temporal patterns, with NSE and R² ranging from 0.62 to 0.83 and 0.60 to 0.84, respectively, although performance declined during extreme events. Overall, the coupled SWAT–LSTM–Transformer framework provides a robust and transferable approach for daily runoff simulation in data-scarce watersheds.

Key words: SWAT; LSTM-Transformer; runoff simulation; ungauged watersheds

How to cite: Peng, Z., Li, Y., and Liu, D.: An interpretable daily runoff simulation method in data-scarce watersheds by coupling SWAT and LSTM-Transformer, EGU General Assembly 2026, Vienna, Austria, 3–8 May 2026, EGU26-7092, https://doi.org/10.5194/egusphere-egu26-7092, 2026.

EGU26-7919 | ECS | Posters on site | CL5.8

A dynamic representation of wetlands for the ISBA land surface model 

Lucas Hardouin, Bertrand Decharme, Jeanne Colin, and Christine Delire

Wetlands play a critical role in terrestrial hydrology and land–atmosphere exchanges, yet they remain poorly represented in many land surface models. Most approaches rely on static wetland maps, preventing models from capturing hydrological variability and associated feedbacks. Here we introduce a new dynamic wetland scheme in the ISBA land surface model, combining explicit hydrological processes with an annually varying diagnostic of wetland extent.

Wetland extent is computed using a TOPMODEL-based approach that links grid-cell saturation deficit with sub-grid topographic indices, and includes a correction for soil organic content to better represent peat-rich areas. Hydrological properties of wetlands and sub-grid runoff redistribution allow water to accumulate and persist in saturated zones, influencing the overall grid-cell water budget.

Simulated wetland extent shows good spatial agreement with multiple satellite-derived wetland datasets across a range of climate zones. Hydrological evaluation against GRACE-based terrestrial water storage and observed river discharge indicates that dynamic wetlands exert a modest but physically consistent influence on ISBA hydrology: they adjust discharge timing and magnitude without degrading model skill, while increasing grid-cell water storage and associated evapotranspiration. However, regional patterns of simulated evapotranspiration reveal a strong sensitivity to the assumed wetland vegetation type, underscoring the need for improved vegetation representation.

In particular, the dynamic wetland extent opens new opportunities for simulating wetland biogeochemistry, including methane emissions, and for exploring the key role of soil oxygen availability in controlling greenhouse gas fluxes.

How to cite: Hardouin, L., Decharme, B., Colin, J., and Delire, C.: A dynamic representation of wetlands for the ISBA land surface model, EGU General Assembly 2026, Vienna, Austria, 3–8 May 2026, EGU26-7919, https://doi.org/10.5194/egusphere-egu26-7919, 2026.

EGU26-8456 | ECS | Posters on site | CL5.8

C4MIP Multi-Model Projections of Moisture Convergence and Extreme Precipitation Risks over East Asia 

Nayeon jeon, Rackhun Son, and Dasom Lee

As extreme precipitation events intensify under climate change, understanding changes in precipitation patterns over East Asia has become increasingly important. While most future projections have relied on CMIP6 models, the Coupled Climate Carbon Cycle Model Intercomparison Project (C4MIP) integrates terrestrial–oceanic carbon cycle feedback including nitrogen deposition and biogeochemical processes to enhance the reliability of climate projection. Despite these advancements, C4MIP has been underutilized in hydrological assessments for East Asia. In this study, we analyze precipitation patterns over East Asia during the historical period (1980–2014) using a C4MIP multi-model ensemble and evaluate model performance through comparison with reanalysis datasets. The C4MIP ensemble demonstrates improved skill in capturing seasonal and interannual patterns of vertically integrated moisture flux convergence (VIMFC), particularly during periods of pronounced moisture convergence and divergence. Under the SSP5–8.5-bgc scenario, projection indicate intensified moisture convergence and increased risks of extreme precipitation over southeastern China and North Korea. These findings provide a diagnostic evaluation of C4MIP's hydrological performance and offer valuable insights for future regional climate projections and adaptation strategies.


This work was funded by the Korea Meteorological Administration Research and Development Program under Grant RS-2024-00404042 and the National Research Foundation of Korea (NRF) grant funded by the Korea government (MSIT) (RS-2024-00343921).

How to cite: jeon, N., Son, R., and Lee, D.: C4MIP Multi-Model Projections of Moisture Convergence and Extreme Precipitation Risks over East Asia, EGU General Assembly 2026, Vienna, Austria, 3–8 May 2026, EGU26-8456, https://doi.org/10.5194/egusphere-egu26-8456, 2026.

EGU26-9964 | ECS | Posters on site | CL5.8

How do climate factors influence plant-based carbon sequestration in land surface model, and how does this change under global warming? 

He-Ming Xiao, Daniele Peano, Simone Mereu, and Antonio Trabucco

Gross primary production (GPP) is an important indicator of carbon uptake by ecosystems, and plants play a central role in ecosystem carbon sequestration. Understanding how plant-driven GPP fluctuates from year to year and which climate factors control these fluctuations is essential for assessing carbon sequestration. In addition, how carbon sequestration by these plants responds to a warming climate is still not well understood. The lack of high-resolution, well-networked, and long-term stable observations, together with mixed signals from land–atmosphere interactions, makes it difficult to identify and isolate the climate factors influencing plant-driven GPP from an observational perspective. In contrast, land surface models provide an alternative approach to addressing these limitations.

In this study, we conducted 5-km resolution simulations using a land surface model (Community Land Model Version 5, CLM 5, Lawrence et al., 2019) forced with high-resolution atmospheric datasets and updated land surface data covering the Italy and the western Mediterranean region. The high-resolution simulations allow for improved discrimination among different land types, such as urban areas and natural vegetation. We further articulated implementation of Corine land-cover data to better represent current land surface conditions and distribution of Plant Functional Types (PFT). Remarkable progress in the last years has increased representation of more and more complex processes incorporating, among others, plant and soil hydrological and carbon cycles, physiological and phenological processes, land surface heterogeneity and PFT parameterization in LSM. However, large limitations still remain due to uncertainties in representation of spatial and temporal dynamics of model parameters, sub-grid heterogeneity, and ultimately resolving optimal allocation and ecosystem functioning at small scales.  Mediterranean regions were selected as the focus of this study because, as climate change hotspot, they experience strong variability of ecosystem processes and dependencies to changing climate and to increasing severe drought-heatwaves compound events, making vegetation-based mitigation practices particularly urgent. 

We found that both temperature and precipitation play dominant roles in shaping interannual variations in GPP. Under cold or dry regimes, warmer temperatures and higher precipitation are beneficial for higher GPP. In contrast, under warm and wet regimes, further increases in temperature and precipitation are not beneficial for plant GPP production. We further used the model to identify suitable temperature and precipitation ranges for the growth of different plant types, and to examine how global warming is altering these ranges. Our analysis may provide implications for future afforestation practices, particularly in selecting forest types and specific climate/geographic zones that can achieve better carbon sequestration under a warming climate.

How to cite: Xiao, H.-M., Peano, D., Mereu, S., and Trabucco, A.: How do climate factors influence plant-based carbon sequestration in land surface model, and how does this change under global warming?, EGU General Assembly 2026, Vienna, Austria, 3–8 May 2026, EGU26-9964, https://doi.org/10.5194/egusphere-egu26-9964, 2026.

EGU26-11167 | Posters on site | CL5.8

An introduction to the EarthRes program 

Xing Yuan, Justin Sheffield, Ming Pan, Jonghun Kam, Xiaogang He, Joshua Roundy, Nathaniel Chaney, Niko Wanders, Linying Wang, Chenyuan Li, and Yi Hao

The High-Resolution Earth System Modeling, Analysis and Prediction for a Society Resilient to Hydrometeorological Hazards (EarthRes) is a program of the International Decade of Sciences for Sustainable Development (IDSSD), endorsed by UNESCO in 2025. EarthRes aims to build global societal resilience to hydrometeorological hazards through five pillars: (1) establishing cooperative observation networks; (2) advancing process-based understanding of Earth system dynamics; (3) enhancing prediction and early warning capabilities; (4) fostering indigenous and local knowledge and data sharing; and (5) strengthening capacity building among international partners.

This presentation will introduce the program's recent progress, including collaborative observations for understanding Earth system dynamics, the integration of a regional climate model with a coupled land surface-hydrology-ecology model that accounts for human activities (e.g., reservoir regulation, irrigation, urbanization), and the development of a forecasting framework. This framework connects the regional model with an AI model to predict droughts, floods, and compound events at synoptic to sub-seasonal scales.

Other activities under EarthRes will also be introduced, and future plans will be discussed. Through international collaboration and targeted capacity-building, EarthRes seeks to enhance sub-seasonal prediction and early warning capabilities, with particular benefits for vulnerable regions.

How to cite: Yuan, X., Sheffield, J., Pan, M., Kam, J., He, X., Roundy, J., Chaney, N., Wanders, N., Wang, L., Li, C., and Hao, Y.: An introduction to the EarthRes program, EGU General Assembly 2026, Vienna, Austria, 3–8 May 2026, EGU26-11167, https://doi.org/10.5194/egusphere-egu26-11167, 2026.

EGU26-13594 | ECS | Posters on site | CL5.8

Classification and Attribution of Compound Flood Events  

Jinjie Zhao and Carlo De Michele

Floods are the most common natural hazards, and the compound effects of flood events pose severe challenges to flood protection. The lack of flood observation data makes it difficult to identify and analyze compound flood effects. Here, we employed a data-driven approach to reconstruct discharge in ungauged regions. We classified flood events from a compound perspective, quantified the contributions of different drivers, and compared the impacts of compound and non-compound flood events. Our results showed that pronounced compound effects were common in most flood events, with many compound flood events clustered in India and southeastern China. Compound events caused substantially greater impacts than non-compound events in Asia and North America.

How to cite: Zhao, J. and De Michele, C.: Classification and Attribution of Compound Flood Events , EGU General Assembly 2026, Vienna, Austria, 3–8 May 2026, EGU26-13594, https://doi.org/10.5194/egusphere-egu26-13594, 2026.

EGU26-14172 | ECS | Posters on site | CL5.8

Benchmarking machine learning-based emulators and traditional methods to calibrate land model parameters for 124 global flux tower sites 

Ignacio Aguirre, Wouter Knoben, Nicolas Vasquez, and Martyn Clark

Accurately simulating latent and sensible heat fluxes is a long-standing open challenge in the land modeling community. The recent model intercomparison project PLUMBER 2 over 154 flux towers showed that simple 1-variable linear regression models can outperform process-based models in simulating latent and sensible heat. PLUMBER 2 simulations were run using default model parameters, leaving the potential performance gains from parameter estimation unquantified.

Identifying optimal parameters in land models has several challenges, including high computational cost and the need to identify parameters that can correctly reproduce temporal dynamics (i.e., good performance across different time epochs) and spatial patterns (i.e., good performance across many sites). To evaluate the ability of different calibration methods to handle these challenges, this study compared the performance of traditional and machine-learning emulator-based calibration methods against Long Short-Term Memory (LSTM) benchmarks, with single-objective experiments (latent heat or sensible heat calibrated individually) and multi-objective experiments (latent and sensible heat calibrated simultaneously). We also tested two ways to train emulators and LSTMs: either considering one site at a time or leveraging information from multiple sites and their attributes simultaneously.

Our results show that the calibrated simulations outperformed the default parameters and the simple benchmarks used in PLUMBER 2, demonstrating the potential to improve process-based models. Moreover, we observed that traditional calibration methods have a tendency to overfit: these traditional calibration methods can achieve high performance during calibration but are unable to achieve similar results during validation. The emulator-based methods achieve more consistent results across both calibration and validation time periods. Additionally, we found that parameter estimation methods that incorporate information from multiple sites simultaneously achieve better spatial consistency than methods that only learn from one site at a time. These results suggest that the performance gap between LSTM and process-based models can be significantly narrowed through calibration.


How to cite: Aguirre, I., Knoben, W., Vasquez, N., and Clark, M.: Benchmarking machine learning-based emulators and traditional methods to calibrate land model parameters for 124 global flux tower sites, EGU General Assembly 2026, Vienna, Austria, 3–8 May 2026, EGU26-14172, https://doi.org/10.5194/egusphere-egu26-14172, 2026.

Land hydrology is a fundamental part of the global water cycle, and as such, of Earth’s climate system, including the biosphere. Yet, this basic component is still poorly represented in current models, partly because the structure of the land features scales much smaller than what those models can resolve, but also due to a lack of understanding of processes occurring below ground that are not readily at sight. Here we will examine from the perspective of what is important to the atmosphere from seasonal to centennial timescales, questions such as what groundwater and surface water do in shaping water availability and how vegetation and ecosystems adapt to it, ultimately modulating land-surface fluxes and climate. How relevant are these processes and what are we missing in current land-surface models? 

How to cite: Miguez-Macho, G. and Fan, Y.: Land hydrology, water availability for ecosystems and land surface models: what are we missing? , EGU General Assembly 2026, Vienna, Austria, 3–8 May 2026, EGU26-15491, https://doi.org/10.5194/egusphere-egu26-15491, 2026.

Human interactions with the water cycle are increasingly recognised as critical drivers of land-climate feedbacks, yet they have long been under-represented in climate modelling.  With ongoing climate change, water management strategies and irrigation practices are becoming more important across many parts of the world. Since these activities can significantly alter surface energy and water fluxes, and thus local and regional climate, it is important to study these processes in more detail.

Although some Earth system models and regional climate models have started to incorporate irrigation routines, they still lack a representation of water availability from different sources and the competing demands of other sectors. To address this gap, we are developing the flexible water modelling tool C-CWatM that can be easily coupled with existing (regional) climate models. Based on the socio-hydrological model CWatM, it simulates river discharge, groundwater, reservoirs and lakes, as well as water demand and consumption from industry, households and agriculture.

In this contribution, we present initial results from coupled simulations using C-CWatM and the regional climate model REMO to study the impact of large-scale irrigation on regional climate conditions. The coupling is implemented via the OASIS3-MCT coupler, which manages synchronised data exchange and regridding of coupling fields. REMO provides the forcing fields required by C-CWatM and receives irrigation water amounts from C-CWatM, which are then applied within REMO's irrigation scheme. 

The development and coupling of C-CWatM allows climate models to realistically account for irrigation constraints, which is particularly important in water-scarce regions and under the increasing risk of droughts driven by climate change. Thus, our approach is an important step towards next-generation land surface modelling and promotes collaboration between hydrology and climate modelling communities to advance understanding of land-climate feedbacks and inform future adaptation strategies.

How to cite: Schmitt, A. and Greve, P.: Irrigation–climate feedbacks in coupled climate simulations: First results using an integrated hydrological modelling tool, EGU General Assembly 2026, Vienna, Austria, 3–8 May 2026, EGU26-17003, https://doi.org/10.5194/egusphere-egu26-17003, 2026.

EGU26-17882 | ECS | Posters on site | CL5.8 | Highlight

Rapid Forecasting Method for Flood Process by Using on Physically Based Numerical and AI Model 

Xinxin Pan and Jingming Hou

With the acceleration of urbanization, complex underlying surfaces, pipe networks, river channels, and hydraulic facilities (gates, sluices, pumps) have significantly increased the number of computational grids and physical processes, making the computational efficiency of physical rainfall-runoff models insufficient to meet the timeliness requirements of emergency management for flood disasters. This necessitates further research on new technologies to enhance the computational efficiency of flood simulation and forecasting models. The development of AI technology provides new approaches for rapid flood disaster simulation and forecasting. This study proposes three innovative methods to address these challenges. First, GPU Accelerated Model for Surface Water Flow and Associated Transport. Second, AI Based Rapid Predicting Method for Flood Process. Third, Model Application for Dam Break Flood Simulation. 

How to cite: Pan, X. and Hou, J.: Rapid Forecasting Method for Flood Process by Using on Physically Based Numerical and AI Model, EGU General Assembly 2026, Vienna, Austria, 3–8 May 2026, EGU26-17882, https://doi.org/10.5194/egusphere-egu26-17882, 2026.

EGU26-18864 | ECS | Posters on site | CL5.8

Global amplification of water whiplash revealed by terrestrial water storage 

Yuheng Yang and Ruiying Zhao

Hydroclimate volatility, characterized by abrupt transitions between dry and wet extremes, poses a growing threat to global water security. Yet, current understanding of these transitions largely relies on meteorological metrics, which often fail to capture the full complexity of hydrological processes, land surface memory, and human water management. Here, we present a global assessment of water whiplash through the lens of terrestrial water storage (TWS). By integrating hydrological modeling with data-driven approaches, we reconstructed a comprehensive long-term TWS dataset to identify these events and account for delayed hydrological responses. Our results reveal a widespread intensification of global water whiplash in recent decades, with a substantial further increase projected under high-warming scenarios. Attribution analysis indicates that while climate change acts as the dominant driver of this amplification, human water management plays a critical role in spatially modulating these events, capable of either significantly mitigating or exacerbating local volatilities. We identify key hotspots of intensification in the tropics and high latitudes, encompassing extensive agricultural regions and major river basins. These findings establish TWS as a vital integrative indicator for monitoring abrupt hydrological transitions and underscore the urgent need for adaptive water management strategies to navigate an increasingly volatile hydroclimate.

How to cite: Yang, Y. and Zhao, R.: Global amplification of water whiplash revealed by terrestrial water storage, EGU General Assembly 2026, Vienna, Austria, 3–8 May 2026, EGU26-18864, https://doi.org/10.5194/egusphere-egu26-18864, 2026.

EGU26-19214 | ECS | Orals | CL5.8

Introducing Groundwater Dynamics into the ECLand Land Surface Model: Implementation and Effects 

Vincenzo Senigalliesi, Andrea Alessandri, Stefan Kollet, and Simone Gelsinari

Land surface models still lack a realistic representation of groundwater, often relying on a free drainage condition at the bottom of the unsaturated soil column as in the current version of ECLand. This unrealistic assumption places the groundwater infinite depth below the surface, thus limiting the model’s ability to simulate realistic soil–vegetation-groundwater interaction.

To address this limitation, we implemented a Dirichlet boundary condition at the bottom of the unsaturated soil to enable a fully implicit numerical scheme for coupling with groundwater. First, we prescribed the water table depth (WTD) using global scale estimates to allow for the computation of realistic water fluxes between the unsaturated zone and the underlying aquifer. In a second step,  a dynamic WTD (hereafter the DYN configuration) was  developed by defining the water stored in the  unconfined aquifer, which evolves prognostically according to drainage (groundwater recharge) and subsurface runoff (groundwater discharge).

The effects of these developments were preliminarily evaluated through offline land-only simulations forced by station data from the PLUMBER2 project, which includes observational networks such as FLUXNET2015, La Thuile, and OzFlux. We validated the DYN configuration against the model setup with free-drainage conditions (CTRL). Our results show a systematic improvement in both latent and sensible heat fluxes, as quantified by the reductions in the error metrics  across most stations, with runoff scoring the best performances. 

The results of the global simulations largely corroborate and expand upon those of the station-based evaluation experiments conducted using PLUMBER2. The DYN configuration provides a more accurate representation of WTD, both spatially and temporally. This is evident in global climatological maps and independent observational datasets. Additionally, latent and sensible heat fluxes are consistently better represented in DYN than in CTRL, showing closer agreement with DOLCE and GLEAM products. Improvements are also evident in runoff simulations, with DYN exhibiting greater consistency with GLOFAS observations. Model performance was further evaluated against multiple observational datasets, such as GRACE/GRACE-FO to verify temporal variability in total water storage and to assess long-term mean conditions.

This work demonstrates that incorporating  groundwater dynamics significantly improves the realism of land-surface processes, particularly in the representation of the flux exchange of water and energy with other components. These results provide a foundation for the enhancement of the representation of land-climate interactions and hydroclimatological behaviour in next generation of reanalysis and climate predictions.

How to cite: Senigalliesi, V., Alessandri, A., Kollet, S., and Gelsinari, S.: Introducing Groundwater Dynamics into the ECLand Land Surface Model: Implementation and Effects, EGU General Assembly 2026, Vienna, Austria, 3–8 May 2026, EGU26-19214, https://doi.org/10.5194/egusphere-egu26-19214, 2026.

EGU26-19820 | Posters on site | CL5.8

 Surface Soil Moisture–Vegetation Feedbacks in Water-Limited Regions across Land Surface Models 

Andrea Alessandri, Marco Possega, Annalisa Cherchi, Emanuele Di Carlo, Souhail Boussetta, Gianpaolo Balsamo, Constantin Ardilouze, Gildas Dayon, Franco Catalano, Simone Gelsinari, Christian Massari, and Fransje van Oorschot

Soil moisture plays a critical role in water-limited regions through its strong coupling and feedbacks with vegetation. However, state-of-the-art Land Surface Models (LSMs) used in reanalysis and near-term prediction systems still lack a realistic coupling of vegetation, limiting their ability to properly account for the fundamental role of vegetation in modulating the feedback with soil–moisture.
In this study, we incorporate Leaf Area Index (LAI) variability from observations - derived from the latest-generation satellite products provided by the Copernicus Land Monitoring Service - into three different LSMs. The models perform a coordinated set of offline, land-only simulations forced by hourly atmospheric fields from the ERA5 reanalysis. An experiment using interannually varying LAI (SENS) is compared with a control simulation based on climatological LAI (CTRL) in order to quantify vegetation feedbacks and their impact on simulated near-surface soil moisture.
Our results show that interannually varying LAI substantially affects near-surface soil moisture anomalies across all three models and over the same water-limited regions. However, the response differs markedly among models. Compared with ESA-CCI observations, near-surface soil moisture anomalies significantly improve in one model (HTESSEL–LPJ-GUESS), whereas the other two models (ECLand and ISBA–CTRIP) exhibit a significant degradation in anomaly correlation. The improved performance in HTESSEL–LPJ-GUESS is attributed to the activation of a positive soil moisture–vegetation feedback enabled by its effective vegetation cover (EVC) parameterization. In HTESSEL–LPJ-GUESS, EVC varies dynamically with LAI following an exponential relationship constrained by satellite observations. Enhanced (reduced) soil moisture limitation during dry (wet) periods leads to negative (positive) LAI and EVC anomalies, which in turn generate a dominant positive feedback on near-surface soil moisture by increasing (decreasing) bare-soil exposure to direct evaporation from the surface. In contrast, ECLand and ISBA–CTRIP prescribe EVC as a fixed parameter that does not respond to LAI variability, preventing the activation of this positive feedback. In these models, the only active feedback on near-surface soil moisture anomalies is negative and arises from reduced (enhanced) transpiration associated with negative (positive) LAI anomalies.
Our findings demonstrate that simply prescribing observed vegetation properties in LSMs does not guarantee a realistic coupling between vegetation and soil moisture. Instead, it is shown that the explicit representation of the underlying vegetation processes is essential to activate the proper feedback and capture the correct soil moisture response.

How to cite: Alessandri, A., Possega, M., Cherchi, A., Di Carlo, E., Boussetta, S., Balsamo, G., Ardilouze, C., Dayon, G., Catalano, F., Gelsinari, S., Massari, C., and van Oorschot, F.:  Surface Soil Moisture–Vegetation Feedbacks in Water-Limited Regions across Land Surface Models, EGU General Assembly 2026, Vienna, Austria, 3–8 May 2026, EGU26-19820, https://doi.org/10.5194/egusphere-egu26-19820, 2026.

The plant litter layer, a critical interface between the atmosphere and soil, regulates energy, water, and carbon exchanges, yet its thermal insulation effects are poorly represented in Earth System Models (ESMs). This omission hampers our ability to accurately simulate the climate-hydrology-ecosystem nexus, particularly in cold regions where soil thermal regimes control freeze-thaw processes, hydrology, and biogeochemical cycles. To address this gap, we integrated a dynamic litter layer with explicit thermal properties into the Noah-MP land surface model. Validation against global flux tower sites confirms significant improvements in simulating soil temperature and moisture.
Our results reveal that litter insulation creates a strong seasonal asymmetry in soil temperatures, inducing a net annual cooling (up to –0.69 °C) by providing stronger summer cooling than winter warming. Furthermore, it fundamentally alters soil freeze-thaw processes (FTP), but with divergent impacts: it delays the freezing end date in permafrost regions while advancing it in seasonally frozen ground, with shifts up to 40 days. The strongest modulation of freezing duration (~100 days) occurs in regions with a mean annual temperature near 10°C. We identify six distinct FTP response modes, controlled by the non-linear interplay between climate, litter thickness, and snow depth. The altered thermal and hydrological states feedback to ecosystem processes, offsetting the greening-driven gains in gross primary productivity by 20.57 ± 3.65 g C m⁻² yr⁻¹ while enhancing forest soil organic carbon stocks by 2.08 ± 0.24 kg C m⁻².
These findings demonstrate that the litter layer is a key biogeophysical mediator, directly coupling vegetation dynamics with soil thermal-hydrological states. Explicitly representing this process in ESMs is therefore essential for advancing the simulation of the carbon-water-energy nexus, improving projections of permafrost thaw, ecosystem feedbacks, and hydrological changes under vegetation greening and climate warming.

How to cite: Huang, P., Wang, G., and Valentini, R.: Representing Plant Litter Insulation in Land Surface Models: A Critical Process for Simulating the Soil Thermal-Hydrological-Ecological Nexus in Cold Regions, EGU General Assembly 2026, Vienna, Austria, 3–8 May 2026, EGU26-22297, https://doi.org/10.5194/egusphere-egu26-22297, 2026.

Seasonal snowpack is one of the primary sources of freshwater for rivers in the Indian Himalaya. It plays a vital role in regional hydrology, climate variability, and water resource management. To understand these processes and their impact on the community, spatial and temporal monitoring of snow is essential. Snow depth is a key parameter for monitoring snow. However, in the Himalayas, due to accessibility challenges and logistical constraints,  limited snow depth observations are available. To address this gap and estimate snow depth at high spatial and temporal resolution, we develop a model using polarimetric parameters derived from Sentinel-1 SAR data, topographic and auxiliary data, integrated with field-based observations in the European Alps and Grand Mesa, USA. Field observations are filtered to match the Sentinel-1 pass, ensuring consistency between field-based observations and satellite acquisition. Our model employs topographic data (e.g., elevation, slope, and aspect) from the Copernicus 30 m digital elevation model, auxiliary parameters (such as day of the season (DoS)), Forest cover fraction from MODIS, and Sentinel-1 SAR-based polarimetric parameters (cross-ratio, entropy, Stokes parameters, alpha), ensuring a topographically dependent snow depth distribution. Sensitivity analysis is performed using SHAP (SHapley Additive Explanations) to identify the most critical parameters for estimating snow depth. The model shows a Mean Absolute Error (MAE) of 0.04m, a root mean square error (RMSE) of 0.15m, with a test R-squared (R2) of 0.95 and a cross-validation correlation coefficient (R) of 0.98 in the European Alps. We transfer the model to the mountains in the Chandra Bagha basin (33°01′N°, 76°40′E) of the Indian Himalayas. Our transferred model highlights the potential of estimating snow depth in data-scarce regions while resolving the spatial and temporal details. 

How to cite: Sharma, P. and Vijay, S.: Snow depth estimation model calibration and validation for high-altitude glacier valleys in the Indian Himalaya., EGU General Assembly 2026, Vienna, Austria, 3–8 May 2026, EGU26-738, https://doi.org/10.5194/egusphere-egu26-738, 2026.

EGU26-951 | ECS | PICO | CR5.1

Two decades of snow pit measurements in Sodankylä, Finland 

Leena Leppänen, Anna Kontu, Henna-Reetta Hannula, Aleksi Rimali, and Heidi Rytkönen

We present a 20-year timeseries of key snow properties measured in Sodankylä, northern Finland. Systematic snow pit observations began in 2006, and the range of measured variables and instruments has expanded substantially over time. Initially, observations included snow depth, stratigraphy, grain size, and temperature, recorded twice per week at a forest opening site. Snow water equivalent (SWE) measurements were added in 2007, density profiles and liquid water content in 2009, and specific surface area (SSA) measurements in 2012. Since 2010, snow pit observations have been conducted once per week.

The monitored locations have varied over the years. A forest opening site was observed from 2006 to 2018, a wetland site from 2009 to 2015 and again from 2019 onward, and a forest site has been included since 2018. Additional snow pits were dug at Lake Orajärvi between 2009 and 2014. Currently, routine observations are carried out at two sites: a wetland and a forest.

The present snow pit protocol includes definition of stratigraphy, a temperature profile measured every 10 cm, and estimation of grain size and grain type, complemented by macrophotography of grain samples from each layer. Density measurements are performed at the surface and at 5 cm vertical intervals using a rectangular cutter. When snow is wet, liquid water content is measured with a WISe instrument at the same heights as the density samples. SSA is measured using InfraSnow for the surface and ice layers, while other layers are measured with IceCube. For thicker layers, IceCube samples are taken every 5 cm. Penetration resistance is measured with SnowScope. Finally, bulk SWE is measured using a snow tube, and snow depth is measured at three points around each pit.

This 20-year dataset provides a unique opportunity to examine long-term changes in snowpack structure and properties, and it illustrates the impacts of a changing climate in snow conditions in northern Finland.

How to cite: Leppänen, L., Kontu, A., Hannula, H.-R., Rimali, A., and Rytkönen, H.: Two decades of snow pit measurements in Sodankylä, Finland, EGU General Assembly 2026, Vienna, Austria, 3–8 May 2026, EGU26-951, https://doi.org/10.5194/egusphere-egu26-951, 2026.

EGU26-2816 | PICO | CR5.1

Snow Modelling Locked Pastures from Rain-on-Snow Events in the Arctic 

Érika Boisvert-Vigneault, Melody Sandells, Vincent Vionnet, Nicolas Leroux, Nick Rutter, Alexandre Langlois, and Hannah Bloomfield

Rain-on-snow (ROS) events are an increasingly prevalent Arctic extreme weather phenomenon, driven by accelerated atmospheric warming. These events create ice layers within the snowpack, which can prevent foraging for ungulates like reindeers, caribou and muskoxen and have been linked to catastrophic herd die-offs. Accurately simulating physical consequences of ROS, specifically development of these ice crusts, is therefore critical for assessing wildlife habitat suitability. However, the performance of detailed snow models in high-latitude environments remains inadequately evaluated, particularly their ability to replicate the snowpack stratigraphy following complex meteorological events.

This study investigates the capacity of the snow model Crocus-SVS2 to simulate the impacts of known, major ROS events on the snowpack of Banks Island, Nunavut. We focus on a case study where a documented ROS event was followed by a severe muskoxen mortality event in the winter of 2003-2004. Our methodology forces Crocus-SVS2 with three meteorological reanalysis datasets: the Canadian Surface Reanalysis version 2.1 (CaSR2.1) and 3.1 (CaSR3.1), and ERA5 reanalysis. This multi-forcing approach allows to assess not only the model's physical fidelity but also the sensitivity of the simulations to different weather inputs, thereby evaluating the ability of reanalysis products to represent ROS in the Arctic accurately.

Model outputs are analysed to determine if Crocus-SVS2 can successfully replicate the formation, thickness, and vertical position of observed ice lenses within the snow profile. The primary outcome is a robust evaluation of whether an operational snow model, when driven by the best available meteorological data, can serve as a reliable tool for retrospectively analysing ROS impacts in data-sparse Arctic regions. This research also provides a framework to identify key meteorological conditions that separate minor ROS events from those causing catastrophic ungulate die-offs.

How to cite: Boisvert-Vigneault, É., Sandells, M., Vionnet, V., Leroux, N., Rutter, N., Langlois, A., and Bloomfield, H.: Snow Modelling Locked Pastures from Rain-on-Snow Events in the Arctic, EGU General Assembly 2026, Vienna, Austria, 3–8 May 2026, EGU26-2816, https://doi.org/10.5194/egusphere-egu26-2816, 2026.

EGU26-4478 | ECS | PICO | CR5.1

Development of Percolation Features After a Rain-on-Snow Event in the Southern Taiga  

Anton Komarov and Julienne Stroeve

In this study, we investigate the development of percolation columns in fine-grained snow triggered by the accumulation of liquid precipitation on a cold, dry snowpack during a rain-on-snow (ROS) event in the Southern Taiga. We analyze snow physical properties, stratigraphy, and meteorological conditions before and after the percolation event, documenting changes in snow layering and the formation of percolation columns. Furthermore, we examine how local-scale factors, such as ground surface microtopography and vegetation cover, influence the spatial distribution of these features by comparing snow properties at three adjacent sites with distinctly different surface and vegetation characteristics.

Our results demonstrate that, under certain conditions, percolation columns can form even within fine-grained, low-density snow. Their spatial distribution appears strongly influenced by ground microtopography, with preferential formation between tussocks, while the presence of deciduous vegetation may inhibit their development. Additionally, we discuss the development of preferential flow paths on the adjacent slope that formed simultaneously to the development of percolation columns on flat surfaces and describe the major morphological features we observed. These findings contribute to a deeper understanding of preferential flow in snow and highlight the need to consider localized environmental conditions and evolving climate patterns in future snow hydrology research and hazard forecasting models.

Our observations also provide valuable information for improving the representation of preferential flow processes, which remain a major source of uncertainty in snow models. The distinct vertical icy features associated with percolation columns are also likely to affect radar signal penetration and backscatter, with potential implications for the interpretation of remote sensing observations. Moreover, the fact that such features can be identified from above, for example using drone imagery, offers opportunities for model evaluation and spatial validation under natural conditions.

How to cite: Komarov, A. and Stroeve, J.: Development of Percolation Features After a Rain-on-Snow Event in the Southern Taiga , EGU General Assembly 2026, Vienna, Austria, 3–8 May 2026, EGU26-4478, https://doi.org/10.5194/egusphere-egu26-4478, 2026.

EGU26-5591 | ECS | PICO | CR5.1

Deriving the evolution of snow specific surface area from water vapor physics at the microstructure scale 

Kevin Fourteau, Anna Braun, Michael Lehning, and Henning Löwe

The specific surface area (SSA) is a crucial parameter to characterize the microstructure of snow. It is one of the main properties controlling the optical and mechanical behavior of snow. Thus, being able to describe the evolution of SSA under the effects of metamorphism is key for detailed numerical snowpack models. This then allows simulating for example the albedo of snow-covered surfaces and its evolution over time. To this end, we propose to derive the law governing the evolution of SSA of snow directly from the physics of water vapor transport at the microstructure scale. We identify the crucial physical parameters for the evolution of the SSA. We show that the evolution of SSA is generally composed of two additive terms: an isothermal contribution and a temperature gradient contribution, each characterized by scalar macroscopic properties relating the evolution of the SSA to the temperature and temperature gradient imposed to the snow. On-going work includes parameterizing these scalar properties in order to obtain a fully-closed and operational law for the evolution of SSA.

How to cite: Fourteau, K., Braun, A., Lehning, M., and Löwe, H.: Deriving the evolution of snow specific surface area from water vapor physics at the microstructure scale, EGU General Assembly 2026, Vienna, Austria, 3–8 May 2026, EGU26-5591, https://doi.org/10.5194/egusphere-egu26-5591, 2026.

EGU26-5841 | ECS | PICO | CR5.1

Emerging contaminants during Arctic Rain-On-Snow events: insights from the 2023-24 Ny-Ålesund campaign 

Azzurra Spagnesi, Stefania Gilardoni, Roberto Salzano, Matteo Feltracco, Beatrice Ulgelmo, Riccardo Maetzke, Francisco Ardini, Marco Grotti, Veronica Coppolaro, Tessa Viglezio, Simonetta Montaguti, Federico Scoto, Andrea Spolaor, Andrea Gambaro, Carlo Barbante, and Elena Barbaro

The Svalbard Archipelago has experienced rapid warming in recent decades, leading to an increased frequency and intensity of Rain-on-Snow (ROS) events. While the physical and ecological impacts of ROS in the Arctic are well documented, their potential role in influencing the atmospheric fate of emerging contaminants remains largely unexplored. This study examines the chemical signature of four ROS events observed during the 2023–24 field campaign in Ny-Ålesund (Kongsfjorden, Svalbard, Norway), with particular attention to the behaviour of emerging pollutants before, during, and after each event. By integrating aerosol and wet deposition measurements with meteorological parameters and air-mass back-trajectory analyses, we assess the capacity of ROS events to act as removal processes for benzothiazole derivatives, tris(2-carboxyethyl)phosphine (TCEP) used as a flame retardant, pesticides, and haloacetic acids. Our results reveal marked variability in contaminant patterns across events, indicating a strong influence of synoptic-scale air mass origins and local meteorological conditions. Diagnostic ratios and inorganic ion tracers further provide insights into potential atmospheric transformation pathways and transport mechanisms. This study presents the first detailed chemical characterisation of aerosols and depositions associated with Rain-on-Snow events, offering a preliminary framework to better understand the interactions between ROS processes and contaminant cycling in a rapidly warming Arctic. This work contributes to ongoing efforts to elucidate atmospheric scavenging mechanisms under changing climate conditions.

How to cite: Spagnesi, A., Gilardoni, S., Salzano, R., Feltracco, M., Ulgelmo, B., Maetzke, R., Ardini, F., Grotti, M., Coppolaro, V., Viglezio, T., Montaguti, S., Scoto, F., Spolaor, A., Gambaro, A., Barbante, C., and Barbaro, E.: Emerging contaminants during Arctic Rain-On-Snow events: insights from the 2023-24 Ny-Ålesund campaign, EGU General Assembly 2026, Vienna, Austria, 3–8 May 2026, EGU26-5841, https://doi.org/10.5194/egusphere-egu26-5841, 2026.

EGU26-6561 | ECS | PICO | CR5.1

Improvements of a subcanopy snow model conveyed by observations from a mid-altitude alpine site 

Thomas Pauze, Axel Bouchet, Aaron Boone, Matthieu Lafaysse, Mathieu Fructus, Agnès Rivière, Lejeune Yves, and Gouttevin Isabelle

In the Alpine region, forests cover about 2/3 of the ground, yet surface and/or snow models designed for hydrological applications, often represent them in a very coarse way.

In the current study, we present and evaluate new developments in the physics-based ISBA/MEB-Crocus model that enables a detailed representation of snow cover and processes in interaction with an above-lying 1-layer canopy and atmosphere, and with a litter layer on top of the ground. While the canopy representation within this model demonstrated an added value for climate modeling, due to a better representation of snowpack in subarctic regions characterised by boreal forests, ISBA/MEB-Crocus failed to reproduce the observed snowpack at a mid-altitude alpine forest site, systematically overestimating the snowpack in terms of depth and duration.

With a view of correcting for these biases, we use detailed snowpack and meteorological measurements available at the Col de Porte research site in the Chartreuse massif, France, at both open and forested sites. In addition to conventional measures, indirect interception measurements and tree and soil temperatures are recorded.

The use of this dataset enables the improvement of the MEB-Crocus model for alpine forests. This enhancement is achieved through an adaptation of the interception scheme, a revision of the melt parametrization for intercepted snow, and of the unloading scheme. The meteorological forcing is also adapted to align with the top-of-canopy conditions. We demonstrate that these adjustements enable the snowpack model to replicate the observations for the Col de Porte forest site without degrading the results for Artic regions. Furthermore, we characterize the influence of the various parameters employed for the representation of the forest and their physical consistency.

This detailed, point-scale evaluation paves the way for the use of this model for distributed simulations enabling an insight into the role of snow and snow-forest interactions in the hydrological regime of mid-altitude alpine catchments.

How to cite: Pauze, T., Bouchet, A., Boone, A., Lafaysse, M., Fructus, M., Rivière, A., Yves, L., and Isabelle, G.: Improvements of a subcanopy snow model conveyed by observations from a mid-altitude alpine site, EGU General Assembly 2026, Vienna, Austria, 3–8 May 2026, EGU26-6561, https://doi.org/10.5194/egusphere-egu26-6561, 2026.

EGU26-6663 | ECS | PICO | CR5.1

Changes in Snowmelt Timing and Peak Flow Generation in Non-Regulated Finnish Catchments 

Maedeh Edraki and Ali Torabi Haghighi

Climate change alters precipitation patterns and extends the warm season in Arctic and sub-Arctic regions, with direct consequences for river flow dynamics. Snow Water Equivalent (SWE) provides a critical link between climate forcing and streamflow response, as it represents the portion of the snowpack that is released as runoff. However, temporal analysis of SWE is challenged by the discontinuous nature of observations provided by the Finnish Environment Institute (SYKE). In this study, a degree-day model was used to generate daily SWE time series, which were subsequently corrected using observed data, for four non-regulated Finnish catchments. River flow timing was analyzed relative to snowmelt onset over the period 1982–2024. While no clear trend was identified in the calendar-day occurrence of spring peak discharge, analysis relative to snowmelt onset revealed a consistent shift toward later peak flow, indicating an increasing delay between melt initiation and maximum discharge. Temperature analysis during the snowmelt period showed a significant increasing trend, suggesting warmer melt-season conditions that promote intensified melt but also modify the timing of runoff generation. In addition, precipitation analysis indicated an increasing tendency toward rain-on-snow events, as well as a rising frequency of rainfall occurring between maximum SWE and peak discharge. These results indicate a potential shift from predominantly snowmelt-driven to increasingly rain-driven peak flow.

How to cite: Edraki, M. and Torabi Haghighi, A.: Changes in Snowmelt Timing and Peak Flow Generation in Non-Regulated Finnish Catchments, EGU General Assembly 2026, Vienna, Austria, 3–8 May 2026, EGU26-6663, https://doi.org/10.5194/egusphere-egu26-6663, 2026.

Dry snow microstructure refers to the complex three-dimensional arrangement of ice and air at the sub-millimeter scale. This microstructure undergoes constant shape transformations known as snow metamorphism. These transformations are driven by variations in equilibrium vapor pressure at the ice-air interface, which depend on the local curvature and temperature gradient. A key descriptor of snow microstructure is the specific surface area (SSA), which is the surface area of the ice and air interfaces normalized per ice volume or mass. This metric is commonly used to quantify the average grain size in snowpack models. Moreover, SSA affects important physical properties of the snowpack, including the spectral albedo of the surface and fluid permeability. Consequently, accurately representing SSA evolution in snowpack models is crucial. Overall, snow SSA decays over time, except in specific conditions where SSA increases, such as high temperature gradients. Current descriptions of SSA in snowpack models, such as CROCUS or SNOWPACK, are not fully satisfying, especially they fail to reproduce SSA increase. It restricts the model’s ability to represent processes under high temperature gradients, as typically occurring in Arctic regions. Recent efforts have been made to derive theoretical relations between SSA and microstructural and growth parameters, but have been applied to a limited number of snow evolution experiments.

In this work, we build upon these previous studies and investigate the physical mechanisms driving SSA evolution for numerous dry snow metamorphism scenarios. We re-derive a relationship between the SSA temporal evolution, the local interface growth velocity, and the local mean curvature. To examine the implications of this relation on different snow microstructures, we acquired 20 time series of 3D X-ray tomographic images of dry snow metamorphism at high temporal and spatial resolution during cold-lab experiments. These experiments span a wide range of thermal boundary conditions and initial snow types. Using this data set, we compute local properties on the grain surface, including interface growth velocity, mean curvature, and temperature gradients. Focusing on a subset of experiments, we present SSA evolution for temperature gradients ranging from 10 to 100 K/m. In particular, we investigate the mechanisms responsible for SSA increase at high temperature gradients. We aim to disentangle the respective contributions of local microstructural shape and local temperature gradients to the overall SSA evolution. A more comprehensive understanding of the mechanisms at stake in the SSA evolution will help develop a robust representation of SSA in snowpack models.

How to cite: Dick, O., Calonne, N., and Hagenmuller, P.: Specific surface area evolution during dry snow metamorphism: insights from interface growth velocity computed on 4D tomographic data, EGU General Assembly 2026, Vienna, Austria, 3–8 May 2026, EGU26-7829, https://doi.org/10.5194/egusphere-egu26-7829, 2026.

EGU26-8497 | PICO | CR5.1

Modeling depth hoar snow and its impact on permafrost and greenhouse gas fluxes 

Hotaek Park, Kazuyoshi Suzuki, and Steven Fassnacht

Recent permafrost temperature observations show warming, likely due to the combined impacts of more snow insulation and increased air temperatures. Depth hoar refers to coarse, faceted snow crystals that form near the bottom of the snowpack due to a strong temperature gradient that induces a vapor gradient. The thin and sparse connection between depth hoar crystals results in lower snow density. The depth hoar formed in a snowpack likely enhances permafrost warming during the winter season, and the impact could be sequentially fed back to CO2 fluxes from the permafrost soil during the next growing season. However, little quantitative assessments have been made on the impact of depth hoar on permafrost temperature and the associated feedback to CO2 fluxes. To address this deficiency, we coupled the depth hoar process to the land surface model CHANGE. The model assessed the impact of the depth hoar on permafrost and the associated greenhouse gases, based on two experiments that included or excluded the depth hoar process, over the pan-Arctic scale for the period 1979–2019. The differences between the two experiments illustrated that the depth hoar induced lower snow density and the resultant warmer permafrost temperature was linked to both larger vegetation photosynthesis and decomposition of soil organic carbon. These results strongly suggest that these snow processes improvement should be included in land surface models for better simulations and future projections on the Arctic environmental changes.

How to cite: Park, H., Suzuki, K., and Fassnacht, S.: Modeling depth hoar snow and its impact on permafrost and greenhouse gas fluxes, EGU General Assembly 2026, Vienna, Austria, 3–8 May 2026, EGU26-8497, https://doi.org/10.5194/egusphere-egu26-8497, 2026.

Accurate observation of seasonal snow depth (SD) across spatial scales remains a major challenge in mid-latitude regions, particularly over complex terrain where sub-footprint heterogeneity and scale mismatch strongly affect satellite-based retrievals. Although ICESat-2 has demonstrated high potential for SD estimation in high-latitude regions, its performance in mid-latitude areas is constrained by the limited availability of snow-free digital elevation models (DEMs) with centimeter-level vertical accuracy and by the scarcity of reliable ground-based validation due to ground-track shifting.

To address these challenges, we established a multi-scale “ground-airborne-satellite” synergistic observation framework within a controlled study area in northern Xinjiang, China. To reconcile spatial scale mismatches among the different observational platforms, UAV-LiDAR data were employed as a validated intermediate-scale bridge (RMSE = 6.03 cm against in-situ measurements). Based on this framework, we conducted an error propagation analysis to quantify ICESat-2 SD uncertainty under varying terrain conditions.

Results indicate that ICESat-2 achieves excellent accuracy over flat, open terrain (slope < 5°), with an RMSE of 6.69 cm. In contrast, over complex sub-footprint terrain combining steep slopes and artificial structures, SD deviations increased substantially, ranging from -30 to +60 cm, reflecting the strong influence of sub-footprint terrain heterogeneity on SD retrieval. Across the entire study area, ICESat-2 maintains robust overall performance, yielding a total RMSE of 15.61 cm.

This study demonstrates the feasibility of accurate ICESat-2 SD retrieval in mid-latitude regions and emphasizes the critical influence of sub-footprint terrain complexity on SD uncertainty. The proposed multi-scale observational framework provides a transferable approach for interpreting satellite-derived snow products and for improving the representation of snow processes across scales.

How to cite: zhu, L. and Zheng, L.: Monitoring Snow Depth with ICESat-2 at mid-latitudes: A Synergistic Multi-Scale Framework Integrating Ground-Airborne-Satellite Observations in Northern Xinjiang, China, EGU General Assembly 2026, Vienna, Austria, 3–8 May 2026, EGU26-10265, https://doi.org/10.5194/egusphere-egu26-10265, 2026.

EGU26-11937 | PICO | CR5.1 | Highlight

Field Studies of Feldspar-Assisted Snowmaking: Effects on Snow Volume, Density, and Reflectivity 

Albert Verdaguer, Júlia Canet, and Laura Rodríguez

Under most atmospheric conditions, snowfall is triggered by the freezing of supercooled water droplets in clouds through heterogeneous nucleation on airborne particles. Among the most efficient atmospheric ice-nucleating particles, capable of inducing freezing at temperatures only a few degrees below 0 °C, are feldspar minerals. Certain feldspars are known to initiate ice nucleation very efficiently at relatively warm subzero temperatures [1], which has led to their application in snowmaking [2] and controlled freezing processes [3].

In our group, we study the properties of snow produced with the aid of feldspar ice-nucleating particles under real environmental conditions at a Snow Laboratory located in the La Molina ski resort (Spain). In this work, we present results from field studies conducted during the 2022–2023 and 2023–2024 snow seasons. The Snow Lab consists of two technically identical and independent snow guns installed 25 m apart (see Figure a). Snow was produced under varying environmental conditions. In one snow gun, only reservoir water was used, while in the second gun a feldspar powder with high ice-nucleating efficiency [4] was added to the water supply.

The volume and physical properties of the produced snow, including density and reflectivity, were systematically compared between snow generated with and without feldspar additives. Three-dimensional maps of snow volume and physical properties were constructed from a grid of field measurements. The results show that, for the same amount of water, a larger volume of snow is produced when feldspar particles are introduced. In addition, feldspar-assisted snow exhibits lower surface density and higher reflectivity, indicating a modified crystallographic evolution of ice crystals as water exits the snow gun (see an example in Figure b).

These findings not only demonstrate the potential of feldspar additives to improve the efficiency and sustainability of artificial snowmaking, but also provide valuable insight into the crystallization pathways of supercooled water droplets in the presence of mineral ice-nucleating particles in natural and engineered environments.

Figure: (a) Images of the Snow Laboratory at La Molina. (b) Example snow density maps obtained with and without the use of feldspar additives.

[1] Kanji, Z. A., Ladino, L. A., Wex, H., Boose, Y., Burkert-Kohn, M., Cziczo, D. J., and Krämer, M.: Overview of Ice Nucleating Particles, Am. Meteorol. Soc., 58, 1.1-1.33, https://doi.org/10.1175/amsmonographs-d-16-0006.1, 2017.

[2] ]. Patent: “Artificial Snow Making Method And Product For Implementing The Method “ A. Verdaguer and M. Galvin https://uspto.report/patent/app/20190323753

[3] Daily, M. I., Whale, T. F., Kilbride, P., Lamb, S., John Morris, G., Picton, H. M., and Murray, B. J.: A highly active mineral-based ice nucleating agent supports in situ cell cryopreservation in a high throughput format, J. R. Soc. Interface, 20, 20220682, https://doi.org/10.1098/rsif.2022.0682, 2023

[4] Canet, J., Rodríguez, L., Renzer, G., Alfonso, P., Bonn, M., Meister, K., Garcia-Valles, M., Verdaguer, A.: Measurement report: Ice nucleation ability of perthite feldspar powder, EGU [preprint], https://doi.org/10.5194/egusphere-2025-5014, December 2025.

How to cite: Verdaguer, A., Canet, J., and Rodríguez, L.: Field Studies of Feldspar-Assisted Snowmaking: Effects on Snow Volume, Density, and Reflectivity, EGU General Assembly 2026, Vienna, Austria, 3–8 May 2026, EGU26-11937, https://doi.org/10.5194/egusphere-egu26-11937, 2026.

EGU26-12118 | ECS | PICO | CR5.1

Daily high-resolution SnowMicroPen Snow Stratigraphy measurements at a Swiss mountain site 

Leah Gaillard Festa, Bettina Richter, Lars Mewes, Benjamin Walter, and Matthias Jaggi

Snow density and specific surface area (SSA) are key parameters controlling snowpack stability, hydrological processes, and surface energy balance. Their accurate simulation is therefore essential for applications ranging from avalanche forecasting to climate modeling. However, these parameters are often time consuming to measure and are available at coarse vertical resolution. The SnowMicroPen (SMP) allows for high-resolution measurements of penetration force from which key microstructural parameters for instance snow density and SSA can be derived using parameterizations such as the one from  [Proksch et al., 2016] or [Calonne et al., 2020]. At the Weissfluhjoch research site located in the eastern Swiss Alps at 2536 m a.s.l, daily SMP measurements have been conducted by the SLF PhD students continuously since winter 2015–2016, resulting in a unique, long-term dataset documenting the seasonal evolution of alpine snowpack at high temporal (daily) and spatial (vertical) resolution.

Here, we present and analyze ten winters (2015–2025) of daily SMP measurements, combined with complementary manual observations, i.e. bi-weekly snow profile measurements, density cutter data, snow water equivalent (SWE) profiles, IceCube SSA measurements, and automated snow and meteorological observations. Post-processing steps, including the identification and correction of sensor offset effects, were applied to ensure comparability of the derived snow properties across the full multi-year dataset. This was crucial, as the data exhibited a clear offset that showed season-dependent behavior and strongly affected derived snow properties, particularly in low density snow ranges. SMP derived snow density and SSA were then evaluated against independent reference measurements across multiple winters.

Snow density showed good agreement with cutter and SWE-derived densities, with the strongest agreement observed for SWE from the full profile and calibration-period cutter data derived by [Calonne et al., 2020]. The SMP is limited to dry-snow conditions. Larger deviations were observed for fresh snow and under warm conditions. For SSA, SMP-derived values showed systematic deviations relative to IceCube measurements, particularly at higher temperatures.
This multi year, high temporal and vertical resolution dataset provides insight into the seasonal evolution of snow stratigraphy, densification, and microstructural changes in an alpine snow. The data allows for analyzing snow layer evolution across multiple winters, and how density and SSA respond to factors such as temperature gradients and densification processes. These findings highlight the potential of the SMP to improve understanding of snow microstructure which helps to improve representations of snow in climate and snowpack models.


References
Neige Calonne, Bettina Richter, H. L¨owe, C. Cetti, J. ter Schure, A. Van Herwijnen, C. Fierz, M. Jaggi, and M. Schneebeli. The rhossa campaign: multi-resolution monitoring of the seasonal evolution of the structure and mechanical stability of an alpine snowpack. The Cryosphere, 14(6):1829–1848, 2020. doi: 10.5194/tc-14-1829-2020.

M. Proksch, N. Rutter, C. Fierz, and M. Schneebeli. Intercomparison of snow density measurements: bias, precision, and vertical resolution. The Cryosphere, 10(1):371–384, 2016. doi: 10.5194/tc-10-371-2016.

How to cite: Gaillard Festa, L., Richter, B., Mewes, L., Walter, B., and Jaggi, M.: Daily high-resolution SnowMicroPen Snow Stratigraphy measurements at a Swiss mountain site, EGU General Assembly 2026, Vienna, Austria, 3–8 May 2026, EGU26-12118, https://doi.org/10.5194/egusphere-egu26-12118, 2026.

EGU26-12232 | ECS | PICO | CR5.1

Development of a 2D high-resolution field method to measure liquid water content in snow 

Valentin Philippe, Michael Lombardo, Lars Mewes, and Benjamin Walter

The liquid water content (LWC) of snow is a key parameter controlling snowpack stability, runoff generation, and the timing of meltwater release (Vorkauf et al., 2021). With climate warming, rain-on-snow events and earlier snowmelt are becoming more frequent (Beniston et al., 2016), raising challenges for water management, hydropower production, flood warning, and avalanche forecasting. Despite its importance, accurate measurement of LWC in the field remains difficult. Existing methods, such as calorimetry, centrifugal separation, and dielectric sensors (Denoth et al., 1984), provide useful estimates but are limited by relatively high uncertainties (1-2% LWC) and low spatial resolution (> 3 cm). Hyperspectral imaging can resolve LWC variability at millimetre scale but is costly and impractical for routine fieldwork.

In recent years, the Snow Physics group at WSL/SLF has developed the SnowImager, a near-infrared (NIR) imaging instrument capable of capturing snow properties at high spatial resolution (Macfarlane et al., 2023). Using this instrument, we investigated the influence of liquid water on reflectance images by comparing the relative difference between a wet snow surface and its (re)frozen dry reference state. The obtained trend as a function of LWC is consistent with theoretical predictions based on a modified single scattering equation that accounts for both LWC and SSA. Building on this result, we developed a straightforward method to estimate LWC from reflectance images acquired with the SnowImager. Preliminary cold-lab and field tests confirmed the feasibility of this approach and demonstrated its potential to produce quantitative, high-resolution 2D maps of LWC.

We anticipate that the resulting 2D LWC field method will provide cryospheric researchers with a long-needed, practical, and precise tool to characterize the spatiotemporal dynamics of wet snow. This advancement will support improving wet snow avalanche forecasting, melt water runoff modelling, and climate impact assessments, while enhancing the SnowImager’s role as a versatile instrument for the international snow science community.


REFERENCES

Beniston, M., & Stoffel, M. (2016). Rain-on-snow events, floods and climate change in the Alps: Events may increase with warming up to 4 °C and decrease thereafter. Science of the Total Environment, 571, 228–236. https://doi.org/10.1016/j.scitotenv.2016.07.146

Denoth, A., Foglar, A., Weiland, P., Mätzler, C., Aebischer, H., Tiuri, M., & Sihvola, A. (1984). A comparative study of instruments for measuring the liquid water content of snow. Journal of Applied Physics, 56(7), 2154–2160. https://doi.org/10.1063/1.334215

Macfarlane, A. R., Dadic, R., Smith, M. M., Light, B., Nicolaus, M., Henna-Reetta, H., Webster, M., Linhardt, F., Hämmerle, S., & Schneebeli, M. (2023). Evolution of the microstructure and reflectance of the surface scattering layer on melting, level Arctic sea ice. Elementa: Science of the Anthropocene, 11(1), Article 00103. https://doi.org/10.1525/elementa.2022.00103

Vorkauf, M., Marty, C., Kahmen, A., et al. (2021). Past and future snowmelt trends in the Swiss Alps: The role of temperature and snowpack. Climatic Change, 165, Article 44. https://doi.org/10.1007/s10584-021-03027-x

How to cite: Philippe, V., Lombardo, M., Mewes, L., and Walter, B.: Development of a 2D high-resolution field method to measure liquid water content in snow, EGU General Assembly 2026, Vienna, Austria, 3–8 May 2026, EGU26-12232, https://doi.org/10.5194/egusphere-egu26-12232, 2026.

EGU26-12655 | ECS | PICO | CR5.1

Identifying key physical processes in snow compaction at different strain rates 

Mathilde Bonnetier, Lars Blatny, Guillaume Chambon, Johan Gaume, and Maurine Montagnat

The mechanical behavior of snow is complex, as it depends on a variety of physical processes occurring at different scales, from the microstructure (sintering, bond breakage, etc.) to the scale of the snowpack and entire slopes. In particular, snow mechanical behavior is highly dependent on strain rate, with a ductile-to-brittle transition occurring at strain rates of about 10-4-10-3 s-1. It is important to develop comprehensive snow mechanical models accounting for this complexity for applications such as avalanche hazard evaluation, snowpack compaction or hydrological studies.

In this work, our objective is to build a continuous numerical model in a finite strain framework, that captures the key mechanical behavior of snow in a large range of strain rates. In particular, this model should be capable of properly retrieving the various deformation patterns observed in experiments, from quasi-homogeneous deformation in the ductile regime to the emergence of unstable localization patterns, such as compaction bands or cracks, typically observed in the brittle regime.

The model is based on an elasto-viscoplastic constitutive law, inspired by the Modified Cam Clay model, which is characterized by an elliptical yield surface. Two specific effects are included in the evolution of this yield surface throughout the deformation process: a hardening effect due to the compaction of the snow, and a viscous effect due to the competition between bond breakage and sintering of the microstructure. This law has been implemented in the software Matter [1] based on the Material Point Method (MPM). This method combines Lagrangian integration points and a fixed background mesh, which allows for computations of large deformations.

We performed 2D simulations of centimeter-scale samples (15mm x 15mm), undergoing uniaxial displacement-controlled compaction, at different strain rates between 1.8x10⁻⁶ and 7.5x10⁻³ s-1. These simulations are meant to reproduce the laboratory experiments of Bernard et al. [2], which were carried out in an X-ray microtomograph, providing reconstructions of the snow microstructure and deformation throughout the compression. Detailed comparisons between numerical and experimental results will be presented to evaluate the robustness of the numerical model.

In addition, a systematic sensitivity analysis was conducted to investigate the impact of the various physical processes considered in the constitutive law on the observed compaction patterns. Of particular interest is the role of sintering on the emergence and propagation speeds of localization bands. Finally, future adaptations of the model to investigate the propagation of instabilities in heterogeneous snowpacks will be discussed.


[1] Blatny, L. and Gaume, J.: Matter (v1): An open-source MPM solver for  granular matter, Geosci. Model Dev., 18, 9149–9166, https://doi.org/10.5194/gmd-18-9149-2025, 2025.

[2] Antoine Bernard. Etude multiéchelle de la transition ductile-fragile dans la neige. Science des matériaux [cond-mat.mtrl-sci]. Université Grenoble Alpes, 2023. Français. ⟨NNT : 2023GRALI027⟩. ⟨tel-04145610⟩

How to cite: Bonnetier, M., Blatny, L., Chambon, G., Gaume, J., and Montagnat, M.: Identifying key physical processes in snow compaction at different strain rates, EGU General Assembly 2026, Vienna, Austria, 3–8 May 2026, EGU26-12655, https://doi.org/10.5194/egusphere-egu26-12655, 2026.

EGU26-12973 | ECS | PICO | CR5.1

Modeling with SCHNAPS: the Snow Cover and High-resolutioN Atmospheric Processes System  

Dylan Reynolds, Samuele Viaro, Nander Wever, and Michael Lehning

Mass and energy exchanges between the cryosphere and the atmosphere affect the state of both systems, motivating the development of two-way coupled cryosphere-atmosphere models. For snow-atmosphere models, traditional atmospheric models are coupled to multilayer physics-based snow models and run in a large-eddy mode when simulating horizontal resolutions approaching 100m. For the CRYOWRF model in particular, the atmospheric model WRF was coupled to the snow model SNOWPACK. This approach has enabled detailed studies of snow-atmosphere feedbacks such as sublimation of drifting and blowing snow. However, the high computational cost of CRYOWRF limits its application to short spatio-temporal domains at scales relevant to drifting and blowing snow (<100m). This excludes research questions such as the role that blowing snow may play as an ice nucleation particle. A prior attempt to circumvent this experimental constraint by coupling the intermediate complexity atmospheric model HICAR and the snowpack model FSM2Trans yielded promising results but showed clear shortcomings when simulating drifting and blowing snow, as well as radiation-driven spatial melt patterns. This echoes work highlighting the importance of prognostic, physics-based models of surface albedo and blowing snow schemes which include vertical advection.

These considerations lead to the development of a two-way coupling between the physics-based SNOWPACK snow model and the intermediate-complexity atmospheric model HICAR. To capture mass exchange between the snow and atmosphere, blowing and drifting snow schemes similar to those in the CRYOWRF model are implemented. The resultant 2-way coupling of SNOWPACK to HICAR yields the Snow-Cover and High-resolutioN Atmospheric Processes System (SCHNAPS). Here we detail the coupling strategy, including a revised interface for SNOWPACK. Benchmarking runs at a 50m resolution are performed, showing the fractional increase in runtime attributed to using a snow model of higher physical complexity. A preliminary validation of SCHNAPS using distributed snow height measurements is presented. The improved representation of ice physics in SNOWPACK relative to NoahMP is also shown to improve the surface energy balance over a mountain glacier. Additionally, we present a comparison of blowing and drifting snow totals between SCHNAPS and CRYOWRF, as well as HICAR coupled to the intermediate complexity snow model FSM2Trans. SCHNAPS demonstrates how different representations of snowpack processes in a coupled snow-atmosphere model impacts snowpack evolution over the course of a season. This work sets the foundation for future studies of snow-atmosphere interactions in High Mountain Asia and the Antarctic via the SnowShifts Project.

How to cite: Reynolds, D., Viaro, S., Wever, N., and Lehning, M.: Modeling with SCHNAPS: the Snow Cover and High-resolutioN Atmospheric Processes System , EGU General Assembly 2026, Vienna, Austria, 3–8 May 2026, EGU26-12973, https://doi.org/10.5194/egusphere-egu26-12973, 2026.

EGU26-13371 | ECS | PICO | CR5.1

Optical Determination of Snow Microstructure Parameters with the SnowImager instrument 

Adrian Zölly, Benjamin Walter, Lars-Hendrik Mewes, Martin Schneebeli, Henning Löwe, and Tobias Thomi

Extensive and reliable ground-truth measurements of snow properties play a crucial role in environmental science to validate models and remote-sensing products. Among the available methods, optics-based approaches offer a good compromise between measurement accuracy and sufficiently large coverage.

We present the technical details of the SnowImager as well as its data products. The SnowImager is a novel, rugged yet portable field instrument that uses near-infrared (NIR) imaging to determine physical snow properties. It enables fast, accurate, and standardized retrieval of two-dimensional specific surface area (SSA) images as well as vertically resolved density profiles, both with millimetre-scale resolution. The SnowImager can be used on vertical snow profiles as well as on the surface scattering layer of sea ice. It was jointly developed by the Swiss federal institute for snow- and avalanche research SLF and Davos Instruments AG.

Providing enhanced snow microstructure characterization, the SnowImager allows better understanding of the processes influenced by the physical properties of snow as well as of their spatial variability. Examples of such fields of use include snow physics, avalanche science and forecasting, meltwater runoff modelling and water storage management, energy balance analysis in climatic models and permafrost studies and albedo observations in systems including snow or a surface scattering layer on sea ice.

How to cite: Zölly, A., Walter, B., Mewes, L.-H., Schneebeli, M., Löwe, H., and Thomi, T.: Optical Determination of Snow Microstructure Parameters with the SnowImager instrument, EGU General Assembly 2026, Vienna, Austria, 3–8 May 2026, EGU26-13371, https://doi.org/10.5194/egusphere-egu26-13371, 2026.

EGU26-15731 | PICO | CR5.1

Assessing the effects of uncertainty in windspeed and precipitation forcings on lateral snow redistribution in mountainous basins 

Rachel Corrigan, Adrienne Marshall, Christopher B. Marsh, and Andrew W. Wood

Snow-dominated montane watersheds provide critical ecological function, water storage, and water supply for downstream population centers across the globe. Recent literature suggests that hydrologic model uncertainty in these watersheds is largely driven by meteorological forcing uncertainty. Additionally, few models simulate lateral snow transport processes such as blowing snow and avalanche, meaning that the impact of forcing uncertainty on snowpack redistribution is unknown. This pair of limitations presents a distinct challenge for modelers in both identifying accurate model structures and identifying the drivers of simulated results. In this study, we ask how uncertainty in windspeed and precipitation forcing affects modeled lateral redistribution of snow in mountain basins. We hypothesize that windspeeds and precipitation from downscaled meteorological datasets require numerical correction for effective snow redistribution, and that the magnitude of these corrections will vary across geographic regions. Analyzing the impacts of these uncertainties allows us to determine how influential windspeed and precipitation forcings are on snow transport processes and on the spatial patterns of snow accumulation and melt dynamics.

We use the Canadian Hydrologic Model (CHM), to simulate snow accumulation and melt over five water years within a set of basins in the Sierra Nevada and Rocky Mountains in the United States that have extensive airborne lidar observations from the Airborne Snow Observatory (ASO). CHM runs over a triangular mesh with a six-layer snowpack energy balance model and lateral transport through blowing snow and avalanche. We use two climate forcing datasets with different underlying resolutions to evaluate the effects of windspeed and precipitation on modeled snowpack in mountainous terrain. ERA5-Land, a 9-km resolution dataset, is selected because its global coverage is advantageous for geographic generalizability. The CONUS404 product, a 4-km resolution dynamically downscaled dataset from ERA5 over the contiguous US, is selected to test a higher resolution product over the areas of interest. In each basin, windspeed and precipitation are perturbed to assess sensitivity and the resulting snowpack distribution.

We use observed SWE, snow cover, and derived snow disappearance date from SNOTEL, snow courses, and MODSCAG to evaluate model results using a standardized benchmarking process. This enables us to decipher whether corrections to windspeed and precipitation yield similar metrics despite different underlying redistribution processes. By evaluating models across two climatically distinct regions, we can assess whether numerical precipitation and windspeed adjustments improve snow simulations, and whether they are transferable or region-specific. We present an overview of the study and results demonstrating how uncertainty in meteorologic forcing propagates into lateral snow transport processes, which can provide guidance for improving snowpack simulations across complex mountainous terrain.

How to cite: Corrigan, R., Marshall, A., Marsh, C. B., and Wood, A. W.: Assessing the effects of uncertainty in windspeed and precipitation forcings on lateral snow redistribution in mountainous basins, EGU General Assembly 2026, Vienna, Austria, 3–8 May 2026, EGU26-15731, https://doi.org/10.5194/egusphere-egu26-15731, 2026.

EGU26-16310 | ECS | PICO | CR5.1

 Long-term changes in snow cover dynamics across Germany (1950–present) 

Markus Drüke, Fabiana Castino, Grit Machui-Schwanitz, Bodo Wichura, Alice Künzel, Anett Fiedler, and Monika Rauthe

Snow cover is a highly sensitive indicator of climate change and plays a crucial role in hydrological processes, including groundwater recharge, runoff generation, and flood dynamics. Reliable long-term information on snow cover depth, extent, duration, and variability is therefore essential for climate monitoring, hydrological modeling, and impact assessments.

This study presents a comprehensive climatology of snow cover dynamics in Germany from 1950 to the present. The analysis is based on daily snow depth observations from the dense monitoring network of the Deutscher Wetterdienst (DWD) complemented by partner networks in Germany and neighbouring countries. All station data underwent rigorous quality control and homogeneity testing. The cleaned observational dataset was then interpolated onto a regular 1 × 1 km² grid using an optimal interpolation scheme that forms an important part of the operational DWD snow-melt forecast model SNOW4.

A suite of snow-related parameters was derived, including mean and maximum snow depth, snow cover duration, onset and disappearance dates, length of the main continuous winter snowpack, timing of peak snow depth, snow cover persistence, and winter snowpack stability.

The results reveal a widespread, statistically significant decline in almost all snow-related parameters across Germany over the last seven decades. The magnitude of the negative trends is strongly elevation-dependent: while lowlands and mid-elevation regions show pronounced reductions in snow cover duration and depth, high-altitude ridge and summit areas exhibit substantially weaker or – in the highest zones – partly insignificant trends.

This new high-resolution snow climatology provides a robust, consistent dataset for hydrological applications, climate change impact studies, water resource management, and the development of future climate services in the field of snow and water resources in Central Europe.

How to cite: Drüke, M., Castino, F., Machui-Schwanitz, G., Wichura, B., Künzel, A., Fiedler, A., and Rauthe, M.:  Long-term changes in snow cover dynamics across Germany (1950–present), EGU General Assembly 2026, Vienna, Austria, 3–8 May 2026, EGU26-16310, https://doi.org/10.5194/egusphere-egu26-16310, 2026.

EGU26-16509 | ECS | PICO | CR5.1

Towards a Thermodynamically Consistent Phase-Field Model for Snow Metamorphism 

Henrik Jentgens, Thomas Kaempfer, and Mathis Plapp

The microstructure of snow undergoes continuous transformation in a process known as snow metamorphism. This evolving microstructure determines meso- and macroscopic optical, mechanical and thermal properties of the snowpack. Therefore, understanding the microstructural evolution on the pore scale is essential to forecast large-scale behavior.
By modeling phase transitions between ice and water vapor, we can treat fully coupled heat and mass transport on an arbitrary microstructure, allowing us to model dry snow metamorphism under temperature gradients and isothermal conditions alike. For this, a multi-phase-field model is used, by which we implicitly track the evolving microscopic ice-air interface. Compared to previous phase field models for dry snow metamorphism, a grand potential formulation is used to simplify the simulation of ice-vapor interfaces, as well as increasing the thermodynamic consistency. Thereby, we can treat various cross couplings between heat and mass transport like the Soret effect as well as surface diffusion and crystal growth dynamics. In this new model, near isothermal snow metamorphism is interpreted as sintering of ice grains. The thermodynamic properties of ice are modeled using CALPHAD data and humid air is modeled as a mixture of ideal gases.
We present our novel phase field model and validate it against semi-analytical solutions of the Stefan-problem and recently published experiments on simple geometries.

How to cite: Jentgens, H., Kaempfer, T., and Plapp, M.: Towards a Thermodynamically Consistent Phase-Field Model for Snow Metamorphism, EGU General Assembly 2026, Vienna, Austria, 3–8 May 2026, EGU26-16509, https://doi.org/10.5194/egusphere-egu26-16509, 2026.

EGU26-17234 | PICO | CR5.1

A new cold ring wind tunnel facility for studying airborne snow metamorphism 

Benjamin Walter, Valentin Philippe, and Sonja Wahl

Recent studies suggests that drifting snow particles undergo snow metamorphism while being transported by wind, involving concurrent sublimation and vapor deposition, affecting particle size, shape, specific surface area, and isotopic composition [Walter et al., 2024; Wahl et al., 2024]. This newly identified process of airborne snow metamorphism (ASM) is particularly relevant in polar regions, where snow particles in saltation layers may be transported over long distances and durations before final deposition. As a result, this process strongly influences the microstructure of surface snow, with large scale implications for albedo and climate signals. Experimental investigations of ASM under laboratory conditions has so far been constrained by the lack of facilities providing well controlled boundary conditions.

Based on our experience with an exisiting but limitied ring wind tunnel (RWT), we developed a new wind tunnel in a cold laboratory designed to study airborne snow metamorphism under controlled flow and thermal conditions. The obround closed-circuit wind tunnel enables particle transport over long durations while maintaining stable boundary conditions. The facility is installed in a cold laboratory at the WSL Institute for Snow and Avalanche Research SLF, about 2m x 3m x 0.5m (W x L x H) in dimensions, and includes enhanced thermal control, a revised wind turbine integration reducing heating of the air, and snow surface temperature control, allowing independent regulation of air and surface temperatures.

We present a first comprehensive characterization of the flow field, including velocity distributions, spatial flow homogeneity, and turbulence properties across a range of wind speeds relevant for snow saltation and suspension. We further present a characterization of the thermal performance of the RWT, demonstrating improved temperature stability of the air and snow surface. The new ring wind tunnel provides a unique experimental facility for studying aerodynamic and thermodynamic impacts on snow particle evolution during snow transport. Generally, the new RWT facility additionally allows for studying a wide range of particle-flow and flow-surface (ice, snow, or water) interaction processes in turbulent cryospheric environments.


Walter B, Weigel H, Wahl S, Löwe H (2024) Wind tunnel experiments to quantify the effect of aeolian snow transport on the surface snow microstructure, The Cryosphere, 18, 3633-3652, https://doi.org/10.5194/tc-18-3633-2024

Wahl, S., Walter, B., Aemisegger, F., Bianchi, L., & Lehning, M. (2024). Identifying airborne snow metamorphism with stable water isotopes. Cryosphere, 18(9), 4493-4515. https://doi.org/10.5194/tc-18-4493-2024


How to cite: Walter, B., Philippe, V., and Wahl, S.: A new cold ring wind tunnel facility for studying airborne snow metamorphism, EGU General Assembly 2026, Vienna, Austria, 3–8 May 2026, EGU26-17234, https://doi.org/10.5194/egusphere-egu26-17234, 2026.

EGU26-18027 | PICO | CR5.1

Multi-scale snowpack modeling in the Pyrenees using the Canadian Hydrological Model 

María Courard, Christopher Marsh, Isabelle Gouttevin, Hugo Merzisen, J. Ignacio López Moreno, César Deschamps-Berger, Eñaut Izaguirre, and Jesús Revuelto

In mountain ecosystems, snow is a critical resource that regulates hydrological processes, ecosystem dynamics, economical activities and downstream water availability. Accurately estimating snow at these highly heterogeneus environments remains a challenge, due to the strong spatial and temporal variability. The combination of snowdrift-permitting models and snowpack remote sensing observations can improve the accuracy of snowpack estimations across scales. The Canadian Hydrological Model (CHM) is a novel snow modeling framework that explicitly represents lateral snow transport processes over an irregular mesh. This study analyzes the impact of modelling spatial scales over three domains in the Pyrenees between 2019 and 2025 using CHM: the Izas Experimental Cathment (~10 km²), a portion of the Tena Valley (~100 km²), and a larger section of the mountain range (~1200 km²) using a snowdrift permitting model. Each domain is modelled using a different horizontal resolution, relative to the domain area, and driven by downscaled meteorological forcings. We analyze several snowpack properties, including snow covered area and snow depth, across the spatial scales, using point-scale snow survey stations, UAV-derived snow depth distribution maps at the catchment scale, Pléiades-derived snow depth maps at the valley scale and Sentinel 2 imagery at the mountain range scale. Error statistics, spatial efficiency metrics and scale breaks derived from semi variograms are used to evaluate the model performance. Preliminary results show that higher resolution simulations have a better representation of snow depth variograms and their scale breaks, and lower mean snow depth biases over the Izas catchment. However, snow depth is overestimated during the accumulation period and underestimated during the ablation season, and differences between the observed and simulated spatial snow distribution can be seen. This study improves our understanding of snowpack dynamics across spatial scales and of the horizontal resolution required for accurate snow simulations. Finally, this study enables the development of a remote sensing–based monitoring framework for the Pyrenees to improve snowpack simulation, which open new insights and allow more reliable forecasts.

How to cite: Courard, M., Marsh, C., Gouttevin, I., Merzisen, H., López Moreno, J. I., Deschamps-Berger, C., Izaguirre, E., and Revuelto, J.: Multi-scale snowpack modeling in the Pyrenees using the Canadian Hydrological Model, EGU General Assembly 2026, Vienna, Austria, 3–8 May 2026, EGU26-18027, https://doi.org/10.5194/egusphere-egu26-18027, 2026.

EGU26-18196 | PICO | CR5.1

Interannual variability of the arctic snowpack: Results from long-term observations at Ny-Ålesund, Svalbard 

Hans-Werner Jacobi, Catherine Larose, and Jean-Pierre Dedieu

The Arctic is undergoing rapid environmental changes, with profound implications for snowpack dynamics, hydrology, and regional climate feedbacks. Ny-Ålesund, Svalbard (79°N), serves as an important site for documenting these changes due to its unique geographic location in the Arctic and its year-round research infrastructure. Here, we present the results of a comprehensive snowpack monitoring at Ny-Ålesund during five consecutive winter seasons (2018–2023).

Manual in-situ measurements of snow stratigraphy—including layer thickness, density, temperature, and hardness—were performed in weekly snow pits. While the region is traditionally considered as dominated by cold, shallow, and wind-affected "tundra” snow, recent winters exhibit increasing occurrences of snow characteristics not attributed to tundra snow, such as melt-freeze layers, internal ice accumulation, or wet snow. These anomalies are linked to rising temperatures, increased precipitation, and episodic winter rainfall events, which contrast sharply with the historical tundra snow regime. While the winter of 2019–2020 displayed classic tundra snow conditions, others winter seasons showed dominant maritime snow features. The statistical analysis of the observed physical snow parameters reveals a high variability of the snowpack characteristics. Such variability underscores the sensitivity of Arctic snowpack to local changes and highlights the challenges in predicting seasonal snowpack evolution. Simulating this enhanced variability will likely require snow models with enhanced capabilities.

This research emphasizes the importance of long-term, high-resolution observations in the remote Arctic. As the Arctic continues to warm, understanding these dynamics is essential for assessing broader environmental impacts, from permafrost degradation to shifts in regional water and biogeochemical cycles. The results call for sustained monitoring efforts and adaptive research strategies to address the evolving challenges posed by climate change in the Arctic.

How to cite: Jacobi, H.-W., Larose, C., and Dedieu, J.-P.: Interannual variability of the arctic snowpack: Results from long-term observations at Ny-Ålesund, Svalbard, EGU General Assembly 2026, Vienna, Austria, 3–8 May 2026, EGU26-18196, https://doi.org/10.5194/egusphere-egu26-18196, 2026.

EGU26-18218 | PICO | CR5.1

Spatial and Temporal Variabilities of Solar and Longwave Radiation Fluxes below a Coniferous Forest in the French Alps 

Jean-Emmanuel Sicart, Clare webster, Yves Lejeune, Richard Essery, and Nick Rutter

At high altitudes and latitudes, snow has a large influence on hydrological processes. Large fractions of these regions are covered by forests, which have a strong influence on snow accumulation and melting processes. Trees absorb a large part of the incoming shortwave radiation and this heat load is mostly dissipated as longwave radiation. Trees shelter the snow surface from wind, so sub-canopy snowmelt depends mainly on the radiative fluxes: vegetation attenuates the transmission of shortwave radiation but enhances longwave irradiance to the surface. 13 pyranometers and 11 pyrgeometers were deployed on the snow surface below a coniferous forest at the CEN-MeteoFrance Col de Porte station in the French Alps (1325m asl) during the winters 2016-17 and 2017-18 in order to investigate spatial and temporal variabilities of solar and infrared irradiances in different meteorological conditions. Sky view factors measured with hemispherical photographs at each radiometer location ranged from 1.5 to 3.5. In clear sky conditions, the attenuation of solar radiation by the canopy reached 96% and its spatial variability exceeded 100 W.m-2. Longwave irradiance varied by 30 W.m-2 from dense canopy to gap areas. In overcast conditions, the spatial variabilities of solar and infrared irradiances were reduced and remained closely related to the sky view factor. Comparing the measurements at different radiometer locations, we investigated the dependence of surface net radiation on the overlying canopy density. Of particular interest were the atmospheric conditions that favor an offset between shortwave energy attenuation and longwave irradiance enhancement by the canopy, such that net radiation does not decrease with increasing forest density (situations of “radiation paradox”). It was found that cloud effects on the shortwave transmissivity and longwave emissivity factors of the canopy have a strong impact on the subcanopy radiation fluxes: canopy largely counteracts the effects of clouds on the incoming radiation fluxes. As a result, variations in net surface radiation due to forest cover appear to depend largely on meteorological conditions: “radiative paradox” conditions were more frequent during the winter of 2017 than in 2018, which was cloudier and colder. As a result, variations in surface net surface radiation by canopy cover appear to be largely dependent on weather conditions: “radiative paradox” conditions were more prevalent during the winter of 2017 than in 2018, which was cloudier and colder.

How to cite: Sicart, J.-E., webster, C., Lejeune, Y., Essery, R., and Rutter, N.: Spatial and Temporal Variabilities of Solar and Longwave Radiation Fluxes below a Coniferous Forest in the French Alps, EGU General Assembly 2026, Vienna, Austria, 3–8 May 2026, EGU26-18218, https://doi.org/10.5194/egusphere-egu26-18218, 2026.

Snow is a major component of the hydrological cycle in cold environments. Snowpacks not only directly contribute to the local water cycle through snowmelt in late winter, but also constantly interact with local atmospheric water vapor through sublimation and vapor exchange throughout the winter. However, the widely used ‘traditional’ snow water isotope sampling method is destructive and temporally discrete, which limits the ability to capture the highly dynamic snow-liquid-vapor process within snowpacks. Therefore, at the Julinia site in Finland, we conducted the first winter field deployment of an innovative in-situ water isotope probe (WIP) system to sample cold and dry water vapor from snowpack layers and ambient air, where WIP was originally designed for use in trees and soils to study tree water uptake during the growing season. Water vapor sampled in-situ based on the direct vapor equilibrium method was continuously measured by a laser spectroscopy isotope analyzer (Picarro). Combined with ‘traditionally’ sampled water isotopes from event-based snowfall and snowpack layers, the temporal variation of δ18O and δ2H in different snowpack layers formed by different snowfall events illustrate the isotopic process of snowpack compaction, vapor exchange within the snowpack, and snowmelt. This approach provides an opportunity to better understand the long-overlooked isotopic difference between snowfall, snowpack, and snowmelt water, which can lead to non-negligible bias in partitioning ‘blue water’ and ‘green water’ in snow-dominated regions when using the stable water isotope techniques.

How to cite: Chen, Z., Marttila, H., and Ala-Aho, P.: In-situ high-resolution stable water isotope measurements of snowpacks in cold environments: opportunities for better understanding dynamic snowpack processes, EGU General Assembly 2026, Vienna, Austria, 3–8 May 2026, EGU26-18697, https://doi.org/10.5194/egusphere-egu26-18697, 2026.

EGU26-20575 | ECS | PICO | CR5.1

Climatic controls on global snow surface sublimation based on ERA5-Land 

Adrià Fontrodona-Bach, Harsh Beria, Denis Groshev, Thomas E Shaw, Catriona Fyffe, Isabella Anglin, Michael Lehning, and Francesca Pellicciotti

Sublimation of snow represents an often important but poorly constrained component of the hydrological cycle, especially at the global scale. Studies that estimate snow sublimation at point or catchment scales demonstrate a range of uncertainties in the contribution of sublimation to total winter snowfall, ranging from 5% to 90%. Although it is well established that dry, windy and clear-sky conditions favor snow sublimation, a modern, global-scale assessment of the climatic controls and regions where sublimation occurs and is relevant for snowpack evolution, glacier mass balance and water resources is lacking. Existing global efforts are limited by coarse resolution (~250 km) reanalysis data, leaving a critical gap in our understanding of sublimation’s contribution to the water balance across climates and regions. Here we present a global analysis of snow surface sublimation hotspots, using ERA5-Land reanalysis at 0.1° (~10 km) resolution from 1980 to the present. Comparisons with sublimation observations from eddy-covariance flux towers demonstrate that ERA5-Land underestimates sublimation rates, but performs favorably compared to estimates from other reanalysis (GLDAS, GLEAM, MERRA-2) products. Comparisons with station observations also demonstrate that ERA5-Land correctly reproduces global patterns of seasonal snow variability. 

Preliminary results show clear latitudinal, elevation and climatic controls on global surface sublimation. Hotspots of snow sublimation (>80 mm/year) are identified in the higher elevations of South America, North America and Asia, with contributions to total snow ablation ranging mostly from 10 to 20%. Hotspots of lower total annual surface sublimation (30 to 60 mm/year) lie in latitudes between 40 and 60 °N in dry climates, where the contributions to total snow ablation mostly range from 20% to 60%. The strongest surface sublimation hotspots in absolute and relative terms are identified in parts of Greenland and coastal Antarctica, where uncertainty is high as no sublimation observations from flux towers are available to compare with. We also investigate historical (1980-2025) changes in sublimation fluxes in response to warming and changing snow cover patterns. 

Our results highlight regions where surface sublimation may be a significant component of the hydrological cycle, with implications for water resources, glacier mass balance and snow–atmosphere interactions. Important uncertainties remain, particularly in complex mountain regions where the resolution of ERA5-Land data may not fully capture sublimation processes such as boundary layer warming and drying. Furthermore, drifting and blowing snow sublimation are not resolved in ERA5-Land. Future efforts should refine these global estimates by using higher-resolution simulations and improved representations of snow–atmosphere interactions to identify sublimation hotspots over complex terrain.

How to cite: Fontrodona-Bach, A., Beria, H., Groshev, D., Shaw, T. E., Fyffe, C., Anglin, I., Lehning, M., and Pellicciotti, F.: Climatic controls on global snow surface sublimation based on ERA5-Land, EGU General Assembly 2026, Vienna, Austria, 3–8 May 2026, EGU26-20575, https://doi.org/10.5194/egusphere-egu26-20575, 2026.

EGU26-22324 | ECS | PICO | CR5.1

How snow, vegetation and soil properties influence soil temperatures in a permafrost environment (Trail Valley Creek, Western Canadian Arctic) 

Ephraim Erkens, Inge Gruenberg, Heidrun Matthes, Nick Rutter, and Julia Boike

Warming ground temperatures in the Arctic raise the need to forecast permafrost thaw. Seasonal snow cover is a crucial factor for ground temperatures as it can have a warming or cooling effect on the underlying soil, depending on snow cover timing and its physical properties. Vegetation and topography modulate snow distribution and affect the snow thermal insulation. However, the formation processes and resulting properties of Arctic snowpacks are difficult to represent in snow models and in-situ data is sparse. Further understanding of the interactions between snow, vegetation and permafrost and the deduction of empirical relationships could support the parametrization of snow in permafrost modeling.

We study how the ground thermal regime is influenced by the interplay of snow, vegetation, topography and climatic conditions. In particular, we evaluate the effect of snow density variation on the ground thermal regime. We present a novel dataset that combines air, surface and soil temperature, as well as soil moisture time series recorded from September 2024 to August 2025 with end-of-season snow depth distribution and high-resolution vertical snow density profiles. Temperatures and soil moisture were monitored using 60 TOMST TMS-4 loggers, distributed across different vegetation types and topographic features in the taiga-tundra ecotone (Trail Valley Creek, Northwest Territories, Canada). Snow density profiles were measured in March 2025 next to the TOMST loggers using a SnowMicroPen.

Our data shows several characteristic snowpack types which do not only differ in depth but also have a different layering structure. Low density snowpacks with high depth hoar fractions are most prominent in forested areas that are shielded from the wind, whereas leeward slopes can accumulate thick, high-density wind slab, regardless of vegetation. While snow depth is clearly one of the major drivers of soil temperature, the role of snow density is more complex.

Categorization of different tundra vegetation types with characteristic snow conditions and specific impact on permafrost vulnerability helps to refine permafrost models and constrain predictions of permafrost thaw.

How to cite: Erkens, E., Gruenberg, I., Matthes, H., Rutter, N., and Boike, J.: How snow, vegetation and soil properties influence soil temperatures in a permafrost environment (Trail Valley Creek, Western Canadian Arctic), EGU General Assembly 2026, Vienna, Austria, 3–8 May 2026, EGU26-22324, https://doi.org/10.5194/egusphere-egu26-22324, 2026.

In an era characterized by urban densification and increasing pressures on urban space, along with the costs and availability of construction materials, the optimal design of infrastructure has become a critical focus. Furthermore, cold climate regions are experiencing the impacts of climate change, which manifest in altered precipitation patterns, resulting in more extreme storm events, including rain-on-snow events and increased freeze-thaw cycles. According to Maurin et al. (2024), rain-on-snow events have been identified as the leading cause of the highest observed runoff from green roofs, presenting significant challenges for urban areas in preventing flooding.

The present study aims to enhance understanding of the effects of climate variability and change on the hydrological performance of nature-based infrastructure, with a particular emphasis on green roofs during winter, especially in relation to snow and rain-on-snow events in cold climate regions. The goal is to develop guidelines that assist stakeholders in optimizing the design of nature-based solutions (NBS) infrastructure, ensuring they are resilient over time and effectively manage stormwater in a changing climate. This initiative addresses the current gap in research, particularly the lack of location-specific regulations that incorporate future climate projections for stormwater infrastructure design, giving decision-makers accurate information regarding the requirements for long-term and robust infrastructure design.

The study uses models of six different green and grey roof configurations developed in the SFI Klima 2050 project, calibrated for the winter season. These models utilize precipitation and temperature time series originated from high-resolution, convection-permitting climate models with hourly resolution and a 3x3 km gridded projection. Simulations for winter event separation (Melt, Rain and Rain-on-snow) are conducted following the methodology outlined in Maurin et al. (2024).

Results indicate that the changing climate will influence stormwater management strategies during winter, including higher runoffs of urban infrastructure due to rain-on-snow event with effects unevenly distributed across Norway (9 different cities studied). This pinpoints the need to combine the local future climate with hydrological models able to capture rain-on-snow events when planning and designing stormwater managements solutions that must remain effective under future climate scenarios. The findings have laid the groundwork for local guidelines aimed at ensuring climate-resilient design of nature-based infrastructure.

Maurin, N., Abdalla, E.H.M., Muthanna, T.M., Sivertsen, E., 2024. Understanding the hydrological performance of green and grey roofs during winter in cold climate regions. Science of The Total Environment 945, 174132. https://doi.org/10.1016/j.scitotenv.2024.174132

How to cite: Maurin, N., Abdalla, E. M. H., Landgren, O., and Sivertsen, E.: Assessing green roof hydrological performance during winter and rain-on-snow events under climate variability and change using high-resolution convection-permitting climate models, EGU General Assembly 2026, Vienna, Austria, 3–8 May 2026, EGU26-22740, https://doi.org/10.5194/egusphere-egu26-22740, 2026.

EGU26-2979 | ECS | Posters on site | EOS1.4

Effects of emotional narratives and uncertainty visualization on non-experts’ trust in climate change forecast maps 

Sergio Fernando Bazzurri, Armand Kapaj, and Sara Irina Fabrikant

Climate change is an ongoing environmental and societal challenge. Communicating its ramifications and related uncertainties clearly to stakeholders and the public is an imperative task for time-critical decision-making. Public communication about climate change often includes maps, aimed at facilitating the understanding of complex scientific findings and making these more accessible to non-specialist audiences. This is especially important when difficult concepts such as inherent uncertainties related to climate predictions are involved.

While climate change communication may appear abstract and distant to non-experts, climate change discourse often involves strong emotional responses from the public. Engaging visual storytelling with climate change maps may be a useful strategy to reduce the psychological distance of the public. However, elicited emotions may influence how people perceive the presented information and thus their willingness to trust the maps.

We aimed to investigate the effect of emotional narratives on map readers’ trust in visualized (un)certainty information in static climate change forecast maps. We applied a 3x2 mixed factorial, map-based study design, including electrodermal activity measurements and eye-tracking. We designed three versions of climate change prediction map stimuli, inspired by the Swiss Climate Scenarios CH2018. Uncertainty was operationalized as a within-subjects independent variable such that participants viewed 18 map stimuli in total, showing different climate variables in randomized order, equally distributed across three conditions: (1) without uncertainty information, (2) uncertainty visualized as black gridded dots, or (3) uncertainty visualized as black randomly distributed dots. Following prior research, we used the term ‘certainty’ in our map stimuli, as it is better understood by the audience than ‘uncertainty’. We used narrative instructions as the between-subjects independent variable, with participants randomly assigned and matched across groups to one of the two conditions: (1) emotion or (2) control. In the emotion condition, each map stimulus was accompanied by an emotion-inducing verbal narrative and a human cartoon character. In the control condition, participants viewed the same map stimuli accompanied only by a factual verbal narrative.

We recruited 61 participants (30 females, 31 males, average age = 30 years) from the Department of Geography at the University of Zurich to participate in the study. After viewing each map stimulus, participants were asked (without any time restriction) to select one of the six predefined locations shown in the maps that they predicted to be most/least affected by climate change. Finally, they indicated their trust in each stimulus type using a standardized questionnaire.

Preliminary results suggest no significant differences in participants’ overall average trust ratings across the two narrative conditions. However, participants significantly trust climate change prediction maps more when certainty information is also included, regardless of the narrative condition they were assigned to. Conversely, we found no significant difference in trust ratings between the map stimuli that contain certainty information visualized as gridded or randomly distributed dots.

These novel empirical findings stress the need to visually communicate (un)certainty information to support people’s trust in climate science and climate change forecast maps. The use of cartoon characters to emotionally engage the public in climate change communication remains to be further empirically investigated.

How to cite: Bazzurri, S. F., Kapaj, A., and Fabrikant, S. I.: Effects of emotional narratives and uncertainty visualization on non-experts’ trust in climate change forecast maps, EGU General Assembly 2026, Vienna, Austria, 3–8 May 2026, EGU26-2979, https://doi.org/10.5194/egusphere-egu26-2979, 2026.

EGU26-5507 | ECS | Posters on site | EOS1.4

Communicating hydrological model calibration with toy examples 

Georgia Papacharalampous, Francesco Marra, Eleonora Dallan, and Marco Borga

Informing robust decisions on flood risk and water resource management necessitates, among other factors, clearer communication of hydrological model uncertainty to non-specialist audiences. In this presentation, we demonstrate that simplified toy models, which abstract away systemic complexity, can serve as an accessible and effective tool for this purpose. As a specific case study, we illustrate how the choice of calibration scoring function shapes model behavior and associated uncertainty estimates. This foundational approach helps build the core intuition needed to effectively engage with more complex, real-world systems. Overall, we present a practical framework that supports experts articulate, and non-experts comprehend, the essential "why" and "how" of uncertainty in hydrological predictions.

Acknowledgements: This work was funded by the Research Center on Climate Change Impacts - University of Padova, Rovigo Campus - supported by Fondazione Cassa di Risparmio di Padova e Rovigo.

How to cite: Papacharalampous, G., Marra, F., Dallan, E., and Borga, M.: Communicating hydrological model calibration with toy examples, EGU General Assembly 2026, Vienna, Austria, 3–8 May 2026, EGU26-5507, https://doi.org/10.5194/egusphere-egu26-5507, 2026.

EGU26-7755 | Posters on site | EOS1.4

Making Sense of Uncertainties: Ask the Right Question 

Alexander Gruber, Claire Bulgin, Wouter Dorigo, Owen Emburry, Maud Formanek, Christopher Merchant, Jonathan Mittaz, Joaquín Muñoz-Sabater, Florian Pöppl, Adam Povey, and Wolfgang Wagner

It is well known that scientific data have uncertainties and that it is crucial to take these uncertainties into account in any decision making process. Nevertheless, despite data producer’s best efforts to provide complete and rigorous uncertainty estimates alongside their data, users commonly struggle to make sense of uncertainty information. This is because uncertainties are usually expressed as the statistical spread in the observations (for example, as random error standard deviation), which does not relate to the intended use of the data.

Put simply, data and their uncertainty are usually expressed as something like “x plus/minus y”, which does not answer the really important question: How much can I trust “x”, or any use of or decision based upon “x”? Consequently, uncertainties are often either ignored altogether and the data taken at face value, or interpreted by experts (or non-experts) heuristically to arrive at rather subjective, qualitative judgements of the confidence they can have in the data.

In line with existing practices (e.g., the communication of uncertianties in the IPCC reports), we conjecture that the key to enabling users to make sense of uncertainties is to represent them as the confidence one can have in whatever event one is interested in, given the available data and their uncertainty.

To that end, we propose a novel, generic framework that transforms common uncertaintiy representations (i.e., estimates of stochastic data properties, such as “the state of this variable is “x plus/minus y”) into more meaningful, actionable information that actually relate to their intended use, (i.e., statements such as “the data and their uncertainties suggest that we can be “z” % confident that…”). This is done by first formulating a meaningful question that links the available data to some events of interest, and then deriving quantiative estimates for the confidence in the occurrence of these events using Bayes theorem.

We demonstrate this framework using two case examples: (i) using satellte soil moisture retrievals and their uncertainty to derive how confident one can be in the presence and severity of a drought; and (ii) how ocean temperature analyses and their uncertainty can be used to determine how confident one can be that prevailing conditions are likely to cause coral bleaching. 

How to cite: Gruber, A., Bulgin, C., Dorigo, W., Emburry, O., Formanek, M., Merchant, C., Mittaz, J., Muñoz-Sabater, J., Pöppl, F., Povey, A., and Wagner, W.: Making Sense of Uncertainties: Ask the Right Question, EGU General Assembly 2026, Vienna, Austria, 3–8 May 2026, EGU26-7755, https://doi.org/10.5194/egusphere-egu26-7755, 2026.

EGU26-11747 | ECS | Posters on site | EOS1.4

An overview of the scientific literature on uncertainty communication in geoscience  

Iris Schneider-Pérez, Marta López-Saavedra, Joan Martí, Judit Castellà, Solmaz Mohadjer, Michael Pelzer, and Peter Dietrich

Uncertainty is an inherent part of geoscience research and arises at multiple stages of the scientific process, from data collection and modelling to analysis and interpretation. In recent years, growing attention has been devoted to uncertainty quantification and assessment, alongside increasing recognition of the importance of uncertainty communication. These aspects are closely linked, as robust characterization of uncertainty provides an essential basis for transparent communication within the scientific community and beyond it.

Communicating uncertainty not only plays a key role in improving the understanding of how scientific knowledge is produced, but can also help to foster trust by increasing transparency and contextualizing results. Nevertheless, reluctance to explicitly assess and communicate uncertainty persists, particularly when addressing non-expert audiences. This challenge is especially relevant in the context of natural hazard risk assessment and management: Here, adequate communication of uncertainties can add particularly valuable information for decision-making, risk governance, and a better understanding of the risks at hand among public audiences.

This contribution presents an exploratory, database-driven overview of the scientific literature on uncertainty communication in geoscience, with a particular focus on natural hazards. Using structured queries in the Web of Science database, we examine publication trends over time, disciplinary distributions, thematic emphases, and possible blind spots. Keyword combinations range from general terms such as “uncertainty communication” and “multi-hazard communication” to more specific queries combining uncertainty, communication, and individual natural hazards (e.g., floods, earthquakes, droughts).

Preliminary results indicate that uncertainty communication spans a broad range of scientific categories, while the level of attention varies substantially across hazard types, with flood-related studies being more prominent than others. Initial findings also suggest that multi-hazard uncertainty communication remains comparatively underrepresented, despite the increasing emphasis on multi-hazard and multi-risk assessments in recent research and policy frameworks. The growing volume of publications further highlights the need for systematic approaches to literature mapping, as well as the potential role of data-driven and AI-assisted tools in supporting such analyses.

This research was partially funded by the European Civil Protection and Humanitarian Aid Operations (ECHO) of the European Commission (EC) through the VOLCAN project (ref. 101193100) and by the 2024 Research Prize of the Dr. K. H. Eberle Foundation to Mohadjer, Pelzer and Dietrich.

How to cite: Schneider-Pérez, I., López-Saavedra, M., Martí, J., Castellà, J., Mohadjer, S., Pelzer, M., and Dietrich, P.: An overview of the scientific literature on uncertainty communication in geoscience , EGU General Assembly 2026, Vienna, Austria, 3–8 May 2026, EGU26-11747, https://doi.org/10.5194/egusphere-egu26-11747, 2026.

EGU26-11821 | Posters on site | EOS1.4 | Highlight

Heatwaves and Early Warning Systems: Perception Data and the Role of Science Communication – A Case Study from Romania 

Selvaggia Santin, Adina-Eliza Croitoru, Norbert Petrovici, Cristian Pop, Maria-Julia Petre, Enrico Scoccimarro, and Elena Xoplaki

Heatwaves are among the most impactful climate extremes in Europe, driving acute health risks and socio-economic disruption. They are a challenge for early warning and public understanding due to uncertainties in event onset, severity, and human response. Building on the interdisciplinary Strengthening the Research Capacities for Extreme Weather Events in Romania (SCEWERO) project funded by the European Union, this study investigates how scientific evidence, perception data, and communication strategies interact within Romania’s heatwave Early Warning System operated by Meteo-Romania. We analyse both empirical perception data — collected through structured surveys and focus groups to quantify how different communities interpret heat warnings, risk levels, and confidence intervals — and observational heatwave metrics to map divergences between communicated risk and public understanding. This research highlights specific sources of uncertainty faced by forecasters (e.g., variable heat exposure, model forecast spreads), and documents how these uncertainties are interpreted or misinterpreted by non-expert audiences. By tracing how uncertainty in forecast signals propagates through institutional warning messages and into public perception, we identify communication gaps that can lead to maladaptive responses or reduced trust in warnings during heat events. Framing uncertainty, contextualised risk information, and tailored communication strategies improve both public comprehension and behavioural intent during heatwave alerts. We propose evidence-based recommendations for operational Early Warning Systems that move beyond fixed deterministic thresholds, instead incorporating probabilistic messaging where appropriate and grounding risk communication in locally derived perception data. This work illustrates how harmonising scientific uncertainty communication with Early Warning practices can strengthen societal resilience to heatwaves, offering a transferable framework for climate risk communication in other European regions.

How to cite: Santin, S., Croitoru, A.-E., Petrovici, N., Pop, C., Petre, M.-J., Scoccimarro, E., and Xoplaki, E.: Heatwaves and Early Warning Systems: Perception Data and the Role of Science Communication – A Case Study from Romania, EGU General Assembly 2026, Vienna, Austria, 3–8 May 2026, EGU26-11821, https://doi.org/10.5194/egusphere-egu26-11821, 2026.

Aquifer thermal energy storage (ATES) is a way to use the groundwater to heat and cool buildings, with very low CO2 emissions. It classifies as a shallow geothermal technology, and it is gaining popularity worldwide because of its sustainability, efficiency and cost-effectiveness. While its potential has been extensively proven in traditional homogenous, productive sandy groundwater layers, investing in more complex subsurface settings has greater financial risk. This is related to uncertainty about the (hydraulic) project feasibility and (thermal) efficiency of the system. Basically, we cannot directly look underground, so it is uncertain to what extent our subsurface model correctly represents reality. Even though this subsurface uncertainty leads to a great globally untapped potential for thermal energy storage, it is often neglected in feasibility studies. To move new ATES developments forward in complex subsurface settings, we present an uncertainty-driven sound scientific method to make investment decisions. Uncertainty in subsurface models is recognized by using a stochastic approach. The model predictions are then processed with clustering and global sensitivity analysis. This allowed to define criteria on critical subsurface properties that guarantee project (in)feasibility. For edge-cases, uncertainty is quantified to determine the probability of project feasibility from a risk-taking or risk-averse decision-maker perspective. Additionally, this approach quantified the potential of changing operational parameters (flow rate, well spacing, design injection temperature) to enhance project feasibility. All results are summarized in an easy-to-interpret decision tree that guides go/no-go decisions for new ATES projects. Importantly, the decision-tree can be followed prior to carrying out costly field tests. To illustrate, the uncertainty-driven decision tree approach is applied to a low-transmissivity aquifer for ATES, which represents a subsurface setting at the limit of ATES suitability. In conclusion, our approach effectively handles uncertainty while also focusing on improving clear communication to investors about the probability of project feasibility. As such, it could be an example study on how to handle model uncertainty for predictions of aquifer thermal energy storage systems in the future.

How to cite: Tas, L., Caers, J., and Hermans, T.: An Uncertainty-Driven Decision Tree Approach Guiding Feasibility Decisions of Shallow Geothermal Systems in Complex Subsurface Settings, EGU General Assembly 2026, Vienna, Austria, 3–8 May 2026, EGU26-14276, https://doi.org/10.5194/egusphere-egu26-14276, 2026.

EGU26-15153 | ECS | Posters on site | EOS1.4

Communicating Flood Risk Uncertainty for Decision-Making in Aotearoa-New Zealand 

Clevon Ash, Matthew Wilson, Carolynne Hultquist, and Iain White

Flood risk uncertainty is a growing problem in New Zealand and the rest of the world. Decision-makers are facing increasing uncertainty in planning for future events. Growing population centres, increased cost of living and the resulting increased exposure to these natural hazards are just some of factors they need to consider in planning and mitigating future events. Climate change predictions represent a large part of the uncertainty present in these future flood risk assessments. Variables such as rainfall intensity and duration are likely to change significantly with increased temperatures which would result in potentially larger and more frequent flood events. To better understand how these different uncertainties could influence decision-making, a series of flood model and risk assessment output representations containing uncertainty were generated from a Monte Carlo framework. These representations were tested using an online survey and focus groups across regional councils, national response agencies and private companies that work with flood information. The results showed that traditional flood outputs such as depth and extent were still rated more useful than uncertain outputs such as confidence and exceedance probabilities. Larger AEPs (annual exceedance probabilities) such as 0.5% and 0.1% were seen as useful for long-term development planning but lower AEPs such as 1% and 5% were better suited for mitigation and emergency response plans. Across all the uncertainty outputs, respondents stressed the need for additional contextual information such as socio-economic overlays, area specific information such as land use and building types that would work in tandem with rebuild cost estimates and building damage data. From this feedback, a series of recommendations for presenting flood uncertainty information to decision-makers were created.

How to cite: Ash, C., Wilson, M., Hultquist, C., and White, I.: Communicating Flood Risk Uncertainty for Decision-Making in Aotearoa-New Zealand, EGU General Assembly 2026, Vienna, Austria, 3–8 May 2026, EGU26-15153, https://doi.org/10.5194/egusphere-egu26-15153, 2026.

EGU26-17550 | ECS | Posters on site | EOS1.4

Communicating the Uncertain Nature of Science Through the Lens of Science Education 

Jakub Stepanovic, Sandy Claes, and Jan Sermeus

Uncertainty is a defining feature of the nature of science; besides driving curiosity in research, its acknowledgement and reporting are expected to ensure transparency and credibility. However, when science is communicated to a non-expert audience, uncertainty often gets oversimplified or omitted. This practice can lead to misconceptions about science (e.g., science leads to absolute knowledge) or erode confidence when uncertainties inevitably surface. In this session, we will explore how uncertainty is framed within the Nature of Science framework of science education, and which educational strategies might be of interest for science communication. Drawing on examples from communicating planetary science, we will discuss approaches that can make uncertainty relatable and constructive, helping audiences appreciate science as a dynamic, evidence-based process rather than a collection of fixed facts.

How to cite: Stepanovic, J., Claes, S., and Sermeus, J.: Communicating the Uncertain Nature of Science Through the Lens of Science Education, EGU General Assembly 2026, Vienna, Austria, 3–8 May 2026, EGU26-17550, https://doi.org/10.5194/egusphere-egu26-17550, 2026.

EGU26-20429 | ECS | Posters on site | EOS1.4

Communicating uncertain future climate risk: Lessons learned from adaptation and disaster risk practitioners in Madagascar 

Ailish Craig, Rachel James, Alan Kennedy-Asser, Elisabeth Stephens, Katharine Vincent, Richard Jones, Andrea Taylor, Christopher Jack, Alice McClure, and Christopher Shaw

Climate information is increasingly being produced and shared as governments, businesses and individuals need to adapt to the changing climate. Yet, communicating uncertain climate change information to non-experts remains a challenge. The information that is currently made available to non-climate science specialists is too complex for them to understand and use. A key challenge in climate science is that estimating future change comes with uncertainties which are highly technical to non-climate specialists. Nevertheless, it is paramount that when climate information is shared and used, the limitations and uncertainties attached are well understood. This is particularly important amongst audiences that lack technical familiarity with climate science. Additionally, scientists and climate service providers do not have a common approach to represent the range of future change. Some scientists place an emphasis on probabilistic projections, meanwhile others focus on the full range of plausible futures.

There has been a limited effort to assess whether the audience understands what the producer of the climate information intended. Testing or evaluating different methods and visualisations of communicating future climate information, and its related uncertainties, can provide insight into what is most effective. Isolating what is (mis)understood can shed light on how to effectively communicate future climate information. This study investigates the interpretation of different presentations of future climate information using a survey and discussion with 45 participants working within weather and disaster agencies in Madagascar. Icon arrays, climate risk narratives, key statements and verbal probability language was tested to provide insight into how practitioners understand different ways of communicating future climate information. Both probabilistic and plausible framings of uncertainty are considered to explore how participants interpret each.

The percentage of participants that selected the correct answers across comprehension questions ranged from 24-82%. For the interpretation of verbal and numeric probabilities which was communicated as “virtually certain [99-100%]”, the correct numerical probability was selected by 24% of participants, highlighting the systematic misinterpretation of verbal and numerical probabilities. The climate risk narrative provided 3 plausible narratives, however, over a third of participants incorrectly believed there were 3 narratives to allow decision makers to select a narrative that is sector relevant. Some reasons for misinterpretation were provided by the participants such as confusing legends and icons, using their prior knowledge instead of the information document or experiencing cognitive dissonance. Meanwhile some expressed difficulty understanding due to lots of information while others requested additional insights, demonstrating the need for flexibility in design.

This study has highlighted new ways of communicating climate risk as well as ineffective current practises.  Recommendations suggest that climate scientists and climate communicators should; include an explicit explanation of why there are multiple climate risk narratives; reconsider the use of numeric and verbal probability expression given they are commonly misinterpreted and consider that an individuals’ prior knowledge influences their interpretation of new information. 

How to cite: Craig, A., James, R., Kennedy-Asser, A., Stephens, E., Vincent, K., Jones, R., Taylor, A., Jack, C., McClure, A., and Shaw, C.: Communicating uncertain future climate risk: Lessons learned from adaptation and disaster risk practitioners in Madagascar, EGU General Assembly 2026, Vienna, Austria, 3–8 May 2026, EGU26-20429, https://doi.org/10.5194/egusphere-egu26-20429, 2026.

EGU26-1872 | ECS | Posters on site | ESSI2.2

dc_toolkit: A parallelized pipeline to navigate the complex ecosystem of compression algorithms 

Nicoletta Farabullini and Christos Kotsalos

As Earth System Sciences (ESS) datasets from high-resolution models reach petabyte scales, the scientific community encounters severe constraints in storage, transfer efficiency, and data accessibility. Identifying the right parameters for high compression ratios with strict scientific fidelity within the vast ecosystem of lossy and lossless compression algorithms is a complex and delicate technical challenge.

We present dc_toolkit (https://github.com/C2SM/data-compression): an open-source, parallelized pipeline designed to support researchers navigate through this complex landscape. It leverages a set of user-friendly, customizable command-line tools to allow users to make informed, data-driven decisions. By systematically evaluating over 40,000 combinations of compressors, filters, and serializers, it autonomously identifies the most suitable configuration for both structured and unstructured data with single or multiple variables.

The workflow comprises a three-stage approach: (1) Evaluation & Optimization: the toolkit leverages parallel processing (via Dask and mpi4py) to rapidly evaluate combinations while filtering out those that violate scientific precision requirements and user-defined error tolerances (L-norms). (2) Analysis & Visualization: to help scientists analyze the trade-offs between data reduction and information loss, the tool performs k-means  clustering on the outputs to display clear and organized results. Furthermore, it provides spatial error plotting to verify that domain-specific features (such as periodicity in global grids) are preserved. (3) Application & Interoperability: once the user has decided on a specific configuration, the toolkit handles the high-throughput compression of the dataset into Zarr-based storage. It ensures seamless integration into existing workflows by including utilities for a variety of actions such as inspecting compressed files and converting compressed data back to standard NetCDF format.

By providing a streamlined, automated, and verifiable method for selecting compression parameters, dc_toolkit lowers the entry barrier for lossy compression. It allows ESS researchers to more easily apply data reduction strategies with the confidence that the integrity of their downstream analysis remains intact. Accessibility is further enhanced through available web-based tools and GUI implementations for diverse user technicalities.

How to cite: Farabullini, N. and Kotsalos, C.: dc_toolkit: A parallelized pipeline to navigate the complex ecosystem of compression algorithms, EGU General Assembly 2026, Vienna, Austria, 3–8 May 2026, EGU26-1872, https://doi.org/10.5194/egusphere-egu26-1872, 2026.

EGU26-5035 | ECS | Posters on site | ESSI2.2

Parallel file access: the missing piece in efficient large scale geosimulation 

Junxian Chew and Kor de Jong

Forward simulation of geographical systems typically involves time step iterations of reading, compute and writing temporal states until the target end time. As the spatial fidelity of geographical data continues to be refined to achieve simulations with higher accuracy, so does the amount of operations associated with read, compute and write within each time step. Simulations of continental or global scale can only be completed within a reasonable time scale if the data can be distributed over multiple supercomputer nodes, in conjunction with parallel execution for the operations within each time step. 

The LUE framework is designed to be a general software platform that enables scientists in defining custom computational models and achieving scalable performance on large-scale computing environment. There have been some efforts in the parallel implementations of compute operations which demonstrated good scaling behaviour[1,2]. This is achieved in LUE by distributing small subsets of the global geographical dataset to available CPU threads across multiple supercomputer nodes in an asynchronous manner, each subset having its own set of compute operations to be executed. The asynchronicity of the workload queueing allows large number of subsets to be processed in parallel, as well as ensuring full workload occupancy to all available compute resources.

This advancement, however, inadvertently highlighted the inefficiency of serial handling of read/write operations. File access operations like read/write is also known as Input/Output (I/O) operations. Just as scalable computation requires parallel algorithms to realize, scalable I/O requires the utilization of parallel I/O libraries to distribute the I/O workload over multiple I/O-specific compute nodes. However, combining parallel I/O with asynchronously spawned computations, while ensuring that the resulting file output is correct is challenging. 

The challenge originates from complexities in ensuring data in memory is synced to the file storage system while the storage system is being acted on by all participating CPU threads. Often times, careless management of I/O results in unintended overwriting of file content due to concurrent accesses. This highlights the added difficulties in file access parallelization compared to in-memory operations such as computations. As such, much care is needed in the design and planning of file access and synchronisation patterns for meaningful gain in parallel I/O performance within an asynchronous many task execution. 

In this work, we attempt to implement a parallel read/write access pattern that works well with the asynchronous parallel compute paradigm deployed within the LUE modelling framework. Integration of parallel I/O in an asynchronous execution brings additional benefit of interleaved compute and I/O tasks. Part of the I/O latencies can be hidden by concurrent compute workloads, which is harder to realize in a synchronous parallel execution. Success of this work will enable scalable compute and parallel file access for geoscience simulation workloads carried out via the LUE framework, reducing the overall computational resource consumption for large scale simulations. 

References:
1. https://doi.org/10.1016/j.cageo.2022.105083
2. https://doi.org/10.1016/j.envsoft.2021.104998

How to cite: Chew, J. and de Jong, K.: Parallel file access: the missing piece in efficient large scale geosimulation, EGU General Assembly 2026, Vienna, Austria, 3–8 May 2026, EGU26-5035, https://doi.org/10.5194/egusphere-egu26-5035, 2026.

EGU26-6903 | ECS | Posters on site | ESSI2.2

Evaluating a meteorological downscaling method for volcanic ash dispersion and deposition modelling 

Carlos Villalta López, Leonardo Mingari, Alexandros-Panagiotis Poulidis, and Arnau Folch

High-resolution meteorological data is essential for accurate volcanic ash dispersion modelling, particularly in regions with complex topography. However, performing fully dynamical atmospheric simulations at very fine spatial resolution is computationally expensive and may limit their applicability in contexts where urgent computing is required, such as operation forecasting. Diagnostic downscaling methods offer a potential alternative by enhancing coarse-resolution meteorological fields at a lower computational cost, but their added value relative to full dynamical nesting remains to be further explored. In this work, we assess the effectiveness of diagnostic meteorological downscaling using an integrated simulation workflow based on the MetPrep tool coupled with the FALL3D ash dispersion model. This approach is applied to the case study of the 2021 Tajogaite eruption (La Palma), comparing meteorological data from three WRF-ARW dynamically nested domains with increasing spatial and temporal resolution (domains d01, d02 and d03) against diagnostic downscaling applied to the coarser WRF domains (d01+MetPrep and d02+MetPrep). All dispersion simulations are run using identical eruptive parameters in order to isolate the impact of the meteorological downscaling method. The simulated ash deposits are compared against field observations using point-to-point validation metrics and spatial characterisation based on isopach area fits. In addition, physically motivated wind metrics, including vertical wind shear and wind-topography coherence, are analysed to interpret the effects introduced by diagnostic downscaling on the flow. Preliminary results show that diagnostic downscaling can partially bridge the gap between coarse and high-resolution dynamical simulations, improving the representation of near-surface flow and ash deposition patterns at a fraction of the computational cost. The study highlights both the potential and the limitations of diagnostic downscaling as an alternative to full dynamical nesting for volcanic ash dispersion applications.

Funded by the European Union. This work has received funding from the European High Performance Computing Joint Undertaking (JU) and Spain, Italy, Iceland, Germany, Norway, France, Finland and Croatia under grant agreement No 101093038, ChEESE-2P, project PCI2022-134973-2 funded by MCIN/AEI/10.13039/501100011033 and by the European Union NextGenerationEU/PRTR.

How to cite: Villalta López, C., Mingari, L., Poulidis, A.-P., and Folch, A.: Evaluating a meteorological downscaling method for volcanic ash dispersion and deposition modelling, EGU General Assembly 2026, Vienna, Austria, 3–8 May 2026, EGU26-6903, https://doi.org/10.5194/egusphere-egu26-6903, 2026.

EGU26-7902 | Posters on site | ESSI2.2

Towards standardised metrics of performance, energy and carbon footprint for CMIP experiments 

Mario Acosta, Sergi Palomas, Sophie Valcke, Pierre-Antoine Bretonnière, and Paul Smith

Global climate models are among the most computationally demanding scientific applications, with rapidly increasing resolution and complexity driving unprecedented requirements in high-performance computing. While model intercomparison efforts have traditionally focused on scientific output and physical fidelity, the computational performance, energy consumption and carbon footprint of climate simulations are becoming critical factors for the sustainability of next-generation modelling activities.

Building on previous coordinated work done for CMIP6, this work extends the scope towards a global assessment framework applicable to all major climate models. We present a list of metrics applicable to climate simulations to systematically quantify model performance, energy cost and associated carbon footprint using standardised and reproducible metrics across supercomputing platforms. The proposed framework combines workload analysis, runtime monitoring and workflow-level instrumentation to enable consistent comparisons between modelling systems.

This effort is conducted in the context of the World Climate Research Programme ESMO Infrastructure Panel (WIP), where a dedicated task team is coordinating the systematic collection of performance, energy and carbon footprint metrics from modelling centres participating in CMIP7, in collaboration with initiatives such as ESiWACE, ENES-RISe,  Destination Earth and FUTURA. The objective is to establish community-endorsed metrics and monitoring practices that can be integrated into operational model development and production workflows, from CMIP7 and beyond.

By treating computational efficiency and carbon footprint as first-class metrics in climate model evaluation, this work aims to support informed decisions on model design, resource allocation and optimisation strategies, contributing to a more efficient and sustainable future for global climate modelling.

How to cite: Acosta, M., Palomas, S., Valcke, S., Bretonnière, P.-A., and Smith, P.: Towards standardised metrics of performance, energy and carbon footprint for CMIP experiments, EGU General Assembly 2026, Vienna, Austria, 3–8 May 2026, EGU26-7902, https://doi.org/10.5194/egusphere-egu26-7902, 2026.

EGU26-9673 | ECS | Posters on site | ESSI2.2

Compression Safeguards - Towards Safe and Fearless Lossy Compression of Earth System Data 

Juniper Tyree, Daniel Köhler, Robert Underwood, Clément Bouvier, Tim Reichelt, Heikki Järvinen, and Milan Klöwer

The volume of data produced by Earth System Science models, e.g. high-resolution weather and climate models, is increasing faster than the methods and budgets for storing, sharing, and analysing this data. To reduce data sizes, lossy data compression methods discard some quality, details, or precision of the original data. Even though some lossy compressors promise size reductions of 100x or more, the lack of trust in lossy compression, rooted in the fear of losing important information, has so far limited their adoption.

We introduce compression safeguards to help overcome this trust gap by

(i) enabling scientist users to precisely express their (general or specific) safety requirements for lossy compression, e.g. preserving specific values, regionally varying error bounds on the data or quantities derived from it, or any logical combination thereof,

(ii) securing any (existing) (lossy) compressor with the corresponding safeguards, which then

(iii) guarantee that the safety requirements are always met by the safeguarded compressor.

Compression safeguards thus provide a unified and flexible interface for specifying and guaranteeing user safety requirements that works with any existing compressor. They therefore shift the burden of trust in fulfilling these requirements away from specific compressor implementations. With the appropriate safeguards, even untrusted, potentially unsafe compressors can be used safely and without fear. We hope that compression safeguards will provide Earth System scientists with the guarantees to use lossy compression safely and without fear, thereby helping to unlock the benefits of lossy compression in reducing data volumes for the Earth System Science community.

We will showcase how our reference implementation, compression-safeguards (https://compression-safeguards.readthedocs.io/en/latest/), can be applied to safeguard important properties in several real-world meteorological examples, evaluate the impact on compression ratio (only low for sparse corrections) and computational load at compression (major) and decompression (negligible) time, and discuss the future pathway towards safe and fearless lossy compression.

How to cite: Tyree, J., Köhler, D., Underwood, R., Bouvier, C., Reichelt, T., Järvinen, H., and Klöwer, M.: Compression Safeguards - Towards Safe and Fearless Lossy Compression of Earth System Data, EGU General Assembly 2026, Vienna, Austria, 3–8 May 2026, EGU26-9673, https://doi.org/10.5194/egusphere-egu26-9673, 2026.

EGU26-9822 | ECS | Orals | ESSI2.2

Coupling km-Scale Earth System Model to Hierarchical Output for Analysis-Ready Dataset 

Siddhant Tibrewal and Nils-Arne Dreier

Kilometer-scale Earth System Model (ESM) simulations increasingly generate petabyte-scale datasets. The scientific return from such datasets still remains constrained by their accessibility and heterogenity as well as the cost of their downstream analysis. Analysts often rely on ad-hoc workflows and even analyses on reduced datasets require repeated access to high-resolution data, limiting scalability. We present Hiopy (Hierarchical Output in Python), a tool for generating cloud accessible, analysis-ready dataset directly from a km-scale ESM simulation using the ICON model by computing hierarchical temporal and spatial aggregations in situ. Building on the work of Kölling et al. (2024, EGU), Hiopy produces multi-resolution, self-describing datasets that enable seamless access from coarse to native resolution using the Zarr format. To mitigate the computational and communication overhead of in-situ aggregations, Hiopy uses YAC (Yet Another Coupler) to couple the model to the output component and configures the aggregates such that the model’s domain decomposition and the prefered Zarr chunking are aligned for even distribution of workload across the output processes. As a result of this, the communication overhead is reduced and efficient parallel computation is possible without penalising the simulation throughput. Additional optimisations reduce communication buffers, eliminate redundant duplications in metadata handling, allows streaming the data directly to its final location and eases configuration for varying requirements. Hiopy supports native ICON model grids, regular latitude–longitude grids and the HEALPix grid and has been validated by producing publicly accessible datasets from the km-scale ESM simulations across multiple projects. This work demonstrates a practical tool in the software stack of high resolution climate modelling.

How to cite: Tibrewal, S. and Dreier, N.-A.: Coupling km-Scale Earth System Model to Hierarchical Output for Analysis-Ready Dataset, EGU General Assembly 2026, Vienna, Austria, 3–8 May 2026, EGU26-9822, https://doi.org/10.5194/egusphere-egu26-9822, 2026.

EGU26-10395 | ECS | Posters on site | ESSI2.2

Improvements to 6D Grid Optimisation in Vlasiator 

Leo Kotipalo, Urs Ganse, Yann Pfau-Kempf, Jonas Suni, and Minna Palmroth

Vlasiator is a global hybrid-Vlasov space plasma simulation, modeling the velocity distribution of ions in a large region of near-Earth space. Due to the high memory and computation demands of the kinetic method as well as the large physical scale, optimisations are required to make simulation feasible. This presentation explores optimisations used in the spatial and velocity grids.

We first consider the spatial dimension. For this, Vlasiator utilises cell-based octree adaptive mesh refinement (AMR). Essentially, each spatial cell may be split in all three spatial dimensions to create eight smaller children in order to improve simulation accuracy in relevant regions. This can be repeated if necessary, with runs typically using four levels of refinement. Refinement may be done statically at the start of the simulation, or dynamically based on the plasma parameters.

Vlasiator uses a combination of several parameters for dynamic runtime refinement. These include scaled gradients of macroscopic variables to detect steep changes, the ratio of the current density to perpendicular magnetic field for current sheets and reconnection, as well as pressure anisotropy and vorticity for foreshock refinement.

For the velocity grid we use a somewhat similar method of stretching. In order to simplify translation, the velocity grid is static and identical in each spatial cell. To eliminate splitting of acceleration pencils, the size of cells in each coordinate direction is a function of that coordinate. Thus if we consider a grid with higher resolution around some point, the grid appears stretched along the coordinate axes when moving away from that point. The main purpose of the stretched grid is to enable modeling of colder distributions requiring a higher resolution without increasing resolution for the entire velocity grid.

Combining these optimisations enables simulation on modern supercomputers with scale and resolution which would be unfeasible without them. This is achieved by limiting resources expended on regions where they are less critical for simulation accuracy and the scientific focus of a given run, while allowing higher fidelity in more important regions. These methods are applicable to other kinetic simulations, as well as grid-based simulations in general.

How to cite: Kotipalo, L., Ganse, U., Pfau-Kempf, Y., Suni, J., and Palmroth, M.: Improvements to 6D Grid Optimisation in Vlasiator, EGU General Assembly 2026, Vienna, Austria, 3–8 May 2026, EGU26-10395, https://doi.org/10.5194/egusphere-egu26-10395, 2026.

EGU26-10512 | Posters on site | ESSI2.2

Finite-Difference modeling of elastic wave propagation in solid-moving fluid systems 

Max Dormann, Mudassar Razzaq, Claudia Finger, and Erik H. Saenger

Numerical simulations of elastic or acoustic wave propagation usually assume a stationary background medium. In many practical situations, however, such as marine exploration or the inspection of engineered structures pipelines, elastic waves propagate in bodies of moving fluid as well. Ambient flow fields introduce changes to the wave field such as a direction-dependent wave propagation velocity or phase shifts that can be observed in real-world measurements. To obtain simulations that more faithfully represent elastic wave propagation in coupled systems of stationary solids and moving fluids, and that are better suited for comparison with experimental, laboratory, and field data in the future, a formulation is introduced in which a material derivative expands the elastic wave equation. The resulting partial differential equation is solved using an augmented rotated-staggered finite-difference scheme that combines the spatial operators of the rotated-staggered grid with a conventional central-difference approximation. The performance of this new formulation is examined on the propagation of elastic wave fields in ambient steady uniform and steady laminar flow fields in combined fluid-solid models, and compared to reference simulation with no moving background medium. The analysis focuses on travel-time variations and phase shifts, demonstrating that the numerical results are consistent with analytical expectations for wave propagation in moving media.

How to cite: Dormann, M., Razzaq, M., Finger, C., and Saenger, E. H.: Finite-Difference modeling of elastic wave propagation in solid-moving fluid systems, EGU General Assembly 2026, Vienna, Austria, 3–8 May 2026, EGU26-10512, https://doi.org/10.5194/egusphere-egu26-10512, 2026.

EGU26-10844 | ECS | Orals | ESSI2.2

EBCC: an Error Bounded Climate-data Compressor 

Langwen Huang, Luigi Fusco, Jan Zibell, Florian Scheidl, Michael Armand Sprenger, Sebastian Schemm, and Torsten Hoefler

As the resolution of weather and climate simulations increases, the amount of data produced is growing rapidly from hundreds of terabytes to tens of petabytes. The huge size becomes a limiting factor for broader adoption, and its fast growth rate will soon exhaust all available storage devices. To address these issues, we present EBCC (Error Bounded Climate-data Compressor). It follows a two-layer compression approach: a base compression layer using JPEG2000 to capture the bulk of the data with a high compression ratio, and a residual compression layer using wavelet transform and SPIHT (Set Partitioning In Hierarchical Trees) encoding to efficiently eliminate long-tail extreme errors. EBCC outperforms other methods in the benchmarks at relative error targets ranging from 0.1% to 10%. In the energy budget closure and Lagrangian trajectory benchmarks, it can achieve more than 100× compression while keeping errors within the natural variability derived from ERA5 uncertainty members. We implement EBCC as a standalone C library which is seamlessly integrated with NetCDF and Zarr pipelines.

How to cite: Huang, L., Fusco, L., Zibell, J., Scheidl, F., Sprenger, M. A., Schemm, S., and Hoefler, T.: EBCC: an Error Bounded Climate-data Compressor, EGU General Assembly 2026, Vienna, Austria, 3–8 May 2026, EGU26-10844, https://doi.org/10.5194/egusphere-egu26-10844, 2026.

EGU26-10878 | ECS | Posters on site | ESSI2.2

MPTRAC: Domain-decomposed Massively-Parallel Trajectory Calculations 

Jan Clemens, Lars Hoffmann, Rolf Müller, Felix Plöger, Marvin Henke, Nicole Thomas, Sabine Grießbach, and Catrin Meyer

Models for the calculation of Lagrangian particle dispersion in the atmosphere or the ocean are indispensable tools for understanding natural and anthropogenic processes. These processes range from volcanic ash clouds, through cloud microphysics to the study of the ozone layer on climate scales. With exascale machines at our disposal, such calculations can now be performed at significantly higher resolutions, both in terms of the driving wind field and particle number density.

Massive-Parallel Trajectory Calculations (MPTRAC) is a library designed to enable Lagrangian particle dispersion analysis for atmospheric transport processes in the free troposphere and stratosphere. It is optimized for modern high-performance computing infrastructure. MPTRAC was developed with contemporary high-performance computing (HPC) systems in mind, ensuring high scalability across GPU and CPU clusters through an MPI-OpenMP/ACC hybrid parallelization approach. Its data structures are tailored to the multi-layered cache systems of modern compute nodes. MPTRAC is routinely executed on the JUWELS-Booster supercomputer and is planned for deployment on the JUPITER exascale machine.

This contribution outlines ongoing developments in MPTRAC. A central aspect of the presented work is the implementation of domain decomposition, which partitions wind field data and associated tracer particles across distributed subdomains. This methodology promises to enhance computational efficiency and scalability, particularly in the context of large-scale atmospheric transport simulations. Furthermore, we detail the integration of MPTRAC with the ICON modeling framework through its community interface. This extension enables the direct application of particle-based transport methods within ICON, supporting high-resolution climate and weather simulations.

The described developments are conducted within the scope of the WarmWorld Project, which aims to enable high-resolution calculations using ICON.

MPTRAC is available under an open-source licence: https://github.com/slcs-jsc/mptrac

How to cite: Clemens, J., Hoffmann, L., Müller, R., Plöger, F., Henke, M., Thomas, N., Grießbach, S., and Meyer, C.: MPTRAC: Domain-decomposed Massively-Parallel Trajectory Calculations, EGU General Assembly 2026, Vienna, Austria, 3–8 May 2026, EGU26-10878, https://doi.org/10.5194/egusphere-egu26-10878, 2026.

EGU26-12783 | Posters on site | ESSI2.2

HERMES_Delta: An open source, python-based, parallel software to process official emission inventories and support air quality modelling efforts in Spain 

Carles Tena, Marc Guevara Vilardell, Johanna Gehlen, Paula Camps Pla, Oscar Collado, Luca Rizza, and Laura Herrero

Air pollution is one of the most critical environmental threats, contributing to respiratory and cardiovascular diseases and millions of premature deaths worldwide. To support air quality assessment, forecasting and planning efforts, chemical transport models (CTMs) need to be fed with robust, temporally and spatially resolved emission input data. 

Official annual national emission inventories prepared by countries to fulfill mandatory reporting obligations provide robust and consistent data. However, for their use in CTMs, emission data needs to be spatially distributed over a grid, temporally broken down into hourly resolution and chemically mapped to the species defined in the CTMs mechanism. Bridging the gap between official inventory data and CTM model-ready emission input needs requires a scalable, transparent, and reproducible system that can process raw inventories into gridded, hourly and chemically speciated CTM-compatible datasets.

HERMES_Δ is a open-source emission model developed at the Barcelona Supercomputing Center (BSC) to address this challenge. Implemented in object-oriented Python and designed to run on High Performance Computing (HPC) infrastructures, it integrates temporal, spatial, vertical, and chemical disaggregation within a modular architecture. Configuration relies entirely on YAML or CSV files, allowing activity- and region-specific settings while maintaining traceability by preserving the connection between modeled emissions and their original reporting sources. Spatial disaggregation, which is the most computationally demanding step, is parallelized using MPI and optimized through domain decomposition. The produced output files are fully compatible with multiple state-of-the-art CTMs, including CMAQ, CHIMERE; MOCAGE, WRF-CHEM and MONARCH.

To assess the performance of HERMES_Δ, multiple benchmark experiments were performed  on the MareNostrum 5 and CIRRUS Spanish HPC facilities. All tests were performed considering a destination grid of 0.005° (~500 m) resolution covering Spain (peninsular and balearic islands), estimating hourly and speciated emissions for 24 time steps. Performance benchmarking, including time-to-solution and memory profiling, indicates good parallel scalability and resource efficiency. This enables the production of hourly gridded emissions for over 10 000 activity–region combinations, while maintaining reproducibility and strict Coordinated Universal Time (UTC) alignment.

In conclusion, HERMES_Δ provides a robust framework for processing official emission inventories to high spatial and temporal resolutions using geolocated activity proxies. By combining national emission inventories with efficient HPC methods, the system improves the representativeness of emissions in CTMs, strengthens collaboration between emission inventory compilers and air quality modellers, and enables more detailed and realistic simulations for policy development and operational forecasting.

HERMES_Δ is currently being implemented as the emission core of the official Spanish air quality forecasting system operated by the Spanish Meteorological Agency (AEMET)

How to cite: Tena, C., Guevara Vilardell, M., Gehlen, J., Camps Pla, P., Collado, O., Rizza, L., and Herrero, L.: HERMES_Delta: An open source, python-based, parallel software to process official emission inventories and support air quality modelling efforts in Spain, EGU General Assembly 2026, Vienna, Austria, 3–8 May 2026, EGU26-12783, https://doi.org/10.5194/egusphere-egu26-12783, 2026.

EGU26-14316 | ECS | Posters on site | ESSI2.2

High-Performance Computing Benchmarking for Coastal Hydrodynamic Modelling Using Delft3D Flexible Mesh 

Abdulaziz Alabduljalil, Nada Alsulaiman, Yousef Alosairi, and Tahani Hussain

High-resolution coastal hydrodynamic models are used increasingly to measure and support environmental assessment, crisis mitigation, and forecasting. Yet, these models become constrained by the computing resources available to them resulting in lower-grade results. High-Performance Computing (HPC) thus becomes essential to increase simulation speeds while maintaining high resolutions. In this study, we present a benchmarking of resource configurations for a coastal hydrodynamic model using Delft3DFM Flexible Mesh (D-Flow FM), utilizing HPC resources while focusing on parallel performance, scalability, and efficiency. Benchmarking experiments were run while comparing two MPI libraries, MPICH and Intel MPI, across multiple CPU core counts and partition combinations on both two-dimensional and three-dimensional model configurations, including barotropic and baroclinic configurations. The results showcase how varied the runtime performance becomes depending on the hydrodynamic configuration, MPI implementation, and HPC parallel partition, and how HPC hardware can affect which combination is best. The goal is to provide guidance on finding optimal HPC configurations, including resource allocation and MPI library use, when running coastal hydrodynamic models of high resolution and quality.

How to cite: Alabduljalil, A., Alsulaiman, N., Alosairi, Y., and Hussain, T.: High-Performance Computing Benchmarking for Coastal Hydrodynamic Modelling Using Delft3D Flexible Mesh, EGU General Assembly 2026, Vienna, Austria, 3–8 May 2026, EGU26-14316, https://doi.org/10.5194/egusphere-egu26-14316, 2026.

EGU26-14912 | ECS | Posters on site | ESSI2.2

Integration of Historical and Modern Gravimetric Data to Model the Temporal Variation of the Gravity Field over Italy 

Gabriele Esposito, Roberta Ravanelli, and Mattia Crespi

This study is part of a broader effort to modernize the Italian gravimetric database and to support the computation of the new national geoid. Its primary aim is the integration of historical gravimetric measurements with modern observations, including data from ongoing airborne surveys, to establish a consistent framework for analyzing temporal variations of the gravity field across Italy. The current study addresses the initial phase of this effort, including the digitization of historical records, the transformation of legacy coordinates into the official Italian geodetic reference frame, a preliminary GIS-based visualization, and the design of a unified database for future spatial and temporal analyses.

Historical gravimetric records from major volumes edited by the former Italian Geodetic Commission (Ballarin, 1936; Cunietti & Inghilleri, 1955; Riccò, 1903; Solaini, 1939; Soler, 1930), covering the late 19th century to the 1960s, were digitized. Pages were scanned at high resolution, and image enhancement techniques, including noise reduction, contrast adjustment, and edge sharpening, were applied to improve legibility and data extraction.

Digitization employed AI-based optical character recognition (OCR) using DeepSeek OCR (Wei et al., 2025), supported by ChatGPT-4 and ChatGPT-5 (OpenAI, 2023, 2025) for table-structure interpretation. This workflow enabled accurate recognition of degraded or complex tables, merged cells, and inconsistent delimiters. Data were initially stored in editable Excel spreadsheets as an intermediate validation step to verify, correct, and standardize key parameters, including geographic coordinates, orthometric height, absolute gravity measurements, year of observation, and survey campaign information. Historical coordinates referred to old Italian datums (Roma1940, ED1950, or other local datums) were converted to WGS84 (EPSG:4326) to ensure compatibility with modern measurements. A key challenge stemmed from the heterogeneity of the legacy reference frame, which required accurate datum transformations for reliable integration with contemporary datasets.

Following digitization and coordinate conversion, historical data are being prepared for integration with modern gravimetric measurements from the national network and ongoing airborne surveys. Initial GIS-based visualization provides an early assessment of spatial coverage and potential inconsistencies. The unified database is designed to manage spatial variability and temporal evolution of gravity and is scalable to accommodate future datasets.

Once fully established, the dataset will undergo quality control and validation using statistical and geospatial methods. While temporal gravity modeling lies beyond the scope of this contribution, the proposed workflow lays a solid foundation for subsequent analyses.


References

Ballarin, S., 1936: Trentadue determinazioni di gravità relativa. Commissione geodetica italiana.

Cunietti, M., Inghilleri, G., 1955: Rete Gravimetrica Fondamentale Italiana. Commissione geodetica italiana.

OpenAI. 2023. GPT‑4 Technical Report: https://cdn.openai.com/papers/gpt-4.pdf.

OpenAI. 2025. GPT‑5 System Card (Technical Overview): https://cdn.openai.com/gpt-5-system-card.pd

Riccò, A., 1903: Determinazione della Gravità Relativa in 43 Luoghi della Sicilia Orientale delle Calabrie. Memorie della Società Degli Spettroscopisti Italiani.

Soler, E., 1930: Due Campagne Gravimetriche sul Carso. Università di Padova.

Solaini, L., 1939: Determinazione di gravità relativa eseguite a Castelnuovo Scrivia, Tortona, Alessandria, Valmadonna, S. Salvatore Monferrato e Sannazzaro De' Burgondi nell'anno 1939. Commissione geodetica italiana.

Wei, H., Sun, Y., Li, Y. . DeepSeek-OCR: Contexts Optical Compress


How to cite: Esposito, G., Ravanelli, R., and Crespi, M.: Integration of Historical and Modern Gravimetric Data to Model the Temporal Variation of the Gravity Field over Italy, EGU General Assembly 2026, Vienna, Austria, 3–8 May 2026, EGU26-14912, https://doi.org/10.5194/egusphere-egu26-14912, 2026.

EGU26-15196 | Posters on site | ESSI2.2

Zarr at scale: virtualization, sharding, and performance optimizations for Earth science data 

Max Jones, Joe Hamman, Davis Bennett, Kyle Barron, and Justus Magin

As geoscientific datasets continue to grow in size and complexity, the Zarr community has developed a modern, open-source solution for storage and I/O of multi-dimensional arrays and metadata. Zarr offers a high-performance, highly scalable, cloud-native container for scientific data, which allows scientists to transcend the constraints of individual files and think in terms of coherent datasets. Zarr’s potential has led to widespread adoption across government, industry, and academia. In this presentation, we offer practical guidance for how to leverage the latest and greatest features in the Zarr ecosystem, including:

  • Sharding to reduce the number of files, benefiting HPC users in particular
  • Virtualization via VirtualiZarr and Icechunk to enable high-performance access to data spread across NetCDF4/HDF5, GRIB, or GeoTIFF files
  • Custom data types, compression schemes, and variable chunk grids
  • Client-side (i.e., in-browser) rendering of large multidimensional geospatial datasets

Through concrete examples and best practices, we demonstrate how the Zarr ecosystem enables researchers to work with multi-terabyte datasets as seamlessly as small files.

How to cite: Jones, M., Hamman, J., Bennett, D., Barron, K., and Magin, J.: Zarr at scale: virtualization, sharding, and performance optimizations for Earth science data, EGU General Assembly 2026, Vienna, Austria, 3–8 May 2026, EGU26-15196, https://doi.org/10.5194/egusphere-egu26-15196, 2026.

EGU26-15706 | Orals | ESSI2.2

Histogram compression of large ensemble forecasts 

Fenwick Cooper, Shruti Nath, Antje Weisheimer, and Tim Palmer

1000 member ensemble forecasts of rainfall are compressed from ~230 MB to ~400 KB using lossy histogram compression. This level of compression allows fast download, analysis and responsive display on a website, even when using obsolete laptop computers or basic smartphones. The information lost to achieve this level of compression is ignored in all but the most specialist of applications, and the algorithm scales to much higher ensemble sizes with negligible additional storage. The method is currently in operation every day with national meteorological centres in East Africa.


Physics based weather models are routinely used produce ensemble forecasts with up to 100 members. These ensembles are an advance on single deterministic forecasts, in that they indicate uncertainty. With larger ensembles providing more accurate distributions of forecast variables. The downside of large ensembles is their storage, transmission and processing cost. Furthermore, machine learning models are being used operationally to generate very large forecast ensembles. For example, rainfall forecasts by ICPAC and national meteorology centres in East Africa are now routinely produced with 1000 ensemble members. Analysis and transmission of these forecasts using traditional methods is completely impractical given currently available hardware. Compression is necessary and can be achieved by storing the ensemble as a series of histograms, sacrificing spatial correlation information.

How to cite: Cooper, F., Nath, S., Weisheimer, A., and Palmer, T.: Histogram compression of large ensemble forecasts, EGU General Assembly 2026, Vienna, Austria, 3–8 May 2026, EGU26-15706, https://doi.org/10.5194/egusphere-egu26-15706, 2026.

EGU26-16260 | ECS | Posters on site | ESSI2.2

Breaking Computational Bottlenecks in Land Surface Modelling with Shifted-Window Transformers 

Siddik Barbhuiya and Vivek Gupta

The development of hyper-resolution land surface modelling poses significant computational challenges. Detailed water balance assessments, ensemble-based uncertainty quantification, and climate scenario exploration all require running physics-based models like VIC, Noah-MP, and CLM at continental scales with high spatial resolution, long temporal spans, and multiple parameter configurations. The computational cost becomes prohibitive. Machine learning surrogates have recently emerged as potential solutions; however, existing LSTM and CNN approaches have fundamental architectural problems. Sequential processing prevents parallel computation, limited receptive fields miss long-range dependencies, and most approaches only predict single variables, which restricts comprehensive hydrological analysis.

We present a shifted-window transformer framework that simultaneously predicts multiple land surface fluxes (runoff, evapotranspiration, and soil moisture) while maintaining computational efficiency at continental scales. The hierarchical attention mechanism captures both local temporal patterns through windowed self-attention and global temporal context through shifted-window operations. This eliminates recurrent bottlenecks. We adapt vision transformers for hydrological regression by tokenizing meteorological sequences temporally, using relative position biases to encode lag-dependent hydrological relationships, and designing multi-task regression heads that preserve both nonlinear interactions and direct physical drivers.

We demonstrate the approach by emulating the VIC model across India's 76,390 land grid cells at 6 km resolution, spanning diverse climate regimes. Training uses sparse spatial sampling with only a small fraction of available locations. This allows us to evaluate how well the surrogate generalizes VIC's process behaviors to the newer, unseen regions and parameter configurations. We test multiple variants, including autoregressive formulations that incorporate previous timestep outputs, and benchmark everything against LSTM baselines to isolate the contributions of the architecture.

How to cite: Barbhuiya, S. and Gupta, V.: Breaking Computational Bottlenecks in Land Surface Modelling with Shifted-Window Transformers, EGU General Assembly 2026, Vienna, Austria, 3–8 May 2026, EGU26-16260, https://doi.org/10.5194/egusphere-egu26-16260, 2026.

EGU26-16512 | Orals | ESSI2.2

Good model performance? 

Edwin Sutanudjaja, Saeb Faraji Gargari, and Oliver Schmitz

For environmental scientists like hydrologists or ecologists, the performance of a model mostly refers to how well a simulation run mimics the modelled phenomenon, often evaluated by a broad range of measures comparing the simulated output to observed data. Increasing the model performance is then an ongoing process of improving the model by incorporating new or refining the existing implementation of environmental processes, possibly combined with using improved datasets at higher spatial and temporal resolutions. This, however, increases the computational burden of the simulations. Improving the computational performance of a model to efficiently support a range from stand-alone computers to HPC systems is typically not in the scope of an environmental scientist, while a reduced runtime would be beneficial for the entire modelling cycle.


The LUE (https://zenodo.org/records/16792016) environmental modelling framework is a software package for building HPC-ready simulation models. The Python bindings provide domain scientists a large set of spatial operations for model building. All LUE operations are implemented in C++ using HPX (https://doi.org/10.5281/zenodo.598202), a library and runtime environment providing an optimal asynchronous execution of interdependent tasks on both shared-memory and distributed computing systems. Models constructed with LUE can therefore run on HPC systems without further modifications of the Python code and without explicit knowledge of programming HPC systems. In addition, the lue.pcraster Python sub-package provides an almost effortless transformation of existing PCRaster Python based models to LUE. In our presentation we showcase PCR-GLOBWB (https://doi.org/10.5194/gmd-11-2429-2018), a model simulating hydrology and water resources at a global scale, as an example of transforming an existing large scientific code base to LUE. We also demonstrate how efficiently the model now uses hardware ranging from one to thousands of CPUs, and therefore is prepared for global modelling studies at resolutions finer than 1 km.

How to cite: Sutanudjaja, E., Faraji Gargari, S., and Schmitz, O.: Good model performance?, EGU General Assembly 2026, Vienna, Austria, 3–8 May 2026, EGU26-16512, https://doi.org/10.5194/egusphere-egu26-16512, 2026.

EGU26-17230 | ECS | Posters on site | ESSI2.2

Multi-GPU acceleration of high-resolution and large-scale urban flood modelling using MPI–OpenACC 

Bomi Kim, Hyungon Ryu, Seungsoo Lee, Jun-Hak Lee, and Seong Jin Noh

High-resolution urban flood modelling is increasingly critical for disaster mitigation, but simulations remain computationally expensive, particularly when applying meter-scale grids over large spatial domains. Such computational constraints often restrict the practical use of high-resolution simulations in operational forecasting and scenario-based analyses. To address this challenge, this study investigates the use of multi-GPU acceleration to improve computational efficiency in large-scale urban flood simulations. We present a multi-GPU implementation of the H12 2D urban flood model based on an MPI–OpenACC framework. The H12 2D model is a physics-based two-dimensional urban flood model that supports CPU-based parallel execution and is extended here to GPU architectures. The proposed approach employs directive-based parallelization. This approach allows a single code base to be executed on both CPU and GPU systems without extensive code modification. Domain decomposition is managed using MPI, while computationally intensive kernels are offloaded to GPUs through OpenACC directives. This hybrid design ensures portability across heterogeneous high-performance computing environments and enables efficient use of multiple GPUs. We evaluate performance using spatial resolutions ranging from 1 to 20 m over two contrasting domains: an urban catchment in downtown Portland, Oregon (USA), and a downstream reach of the Han River basin (Republic of Korea). This study will discuss how computational performance varies with model resolution, domain size, and the distribution of computational workload across multiple GPUs, with a focus on scalability and parallel efficiency. The improved computational efficiency achieved in this study can support pseudo real-time urban flood prediction for early warning applications. In addition, the proposed framework facilitates large-scale, high-resolution simulations that can be used to generate ground-truth datasets for the development and validation of physics-informed or data-driven flood prediction models.

How to cite: Kim, B., Ryu, H., Lee, S., Lee, J.-H., and Noh, S. J.: Multi-GPU acceleration of high-resolution and large-scale urban flood modelling using MPI–OpenACC, EGU General Assembly 2026, Vienna, Austria, 3–8 May 2026, EGU26-17230, https://doi.org/10.5194/egusphere-egu26-17230, 2026.

EGU26-17426 | Posters on site | ESSI2.2

Enabling numerical Models as a Service (MaaS) 

Stefan Verhoeven, Bart Schilperoort, Peter Kalverla, and Rolf Hut

Running numerical models you are unfamiliar with is not always straightforward. The models have different kinds of interfaces, different program languages, and different names for the same concepts. To standardize this, the Basic Model Interface (Hutton, 2020) was developed by the Community Surface Dynamics Modeling System (CSDMS). With the Basic Model Interface (BMI), users are presented with a standard set of functions to query and control numerical models. This standard interface also allows users to couple models together, allowing for the creation of standard components that can be coupled to create a full model (Peckham, 2013). 

However, coupling these models or components, whether they are written in C, C++, Fortran or Python, requires them to all share the same interpreter or (Python) environment. This is not always possible or viable and can require compilation on the end-user's side. This also prevents containerization of models. 

For cross-language and cross-container communication we developed grpc4bmi in 2018, making it possible to use the BMI over a HTTP connection. However, while highly performant, gRPC is not supported in many languages. To this end, we developed the new RemoteBMI protocol. RemoteBMI can communicate to models using the Basic Model Interface using a RESTful API, making it easier to support any language; only a HTTP server and JSON parser implementation are required. 

With grpc4bmi and RemoteBMI it is possible to package a model or model component inside a software container (e.g., Docker) and communicate with these models over an HTTP connection. This makes models more interoperable and reproducible, as container images can easily be archived and used by other people. It also enables running models on different machines than your own, and then directly communicating with them or coupling them to other models. 

With these technologies, you can now, for example, host models that require specific and difficult-to-share input data and provide them to anyone interested as a web-based service. This model-as-a-service (MaaS) architecture could also make it easier for end-users to try out your model in the browser before committing to installing it locally if they are interested. 

Currently, the grpc4bmi and RemoteBMI protocols are used by the eWaterCycle platform (Hut, 2022), allowing hydrologists and students easy access to containerized hydrological models through a common interface, accelerating both research and teaching. 

 --- 

Hutton, E.W.H., Piper, M.D., and Tucker, G.E., 2020. The Basic Model Interface 2.0: A standard interface for coupling numerical models in the geosciences. Journal of Open Source Software, 5(51), 2317, https://doi.org/10.21105/joss.02317. 

Peckham, S.D., Hutton, E.W., and Norris, B., 2013. A component-based approach to integrated modeling in the geosciences: The design of CSDMS. Computers & Geosciences, 53, pp.3-12, http://dx.doi.org/10.1016/j.cageo.2012.04.002. 

Hut, R., et al. (2022). The eWaterCycle platform for open and FAIR hydrological collaboration. Geoscientific Model Development, 15(13), 5371–5390. https://doi.org/10.5194/gmd-15-5371-2022  

How to cite: Verhoeven, S., Schilperoort, B., Kalverla, P., and Hut, R.: Enabling numerical Models as a Service (MaaS), EGU General Assembly 2026, Vienna, Austria, 3–8 May 2026, EGU26-17426, https://doi.org/10.5194/egusphere-egu26-17426, 2026.

EGU26-19114 | Orals | ESSI2.2

Enhancing Earth system models efficiency: Leveraging the Automatic Performance Profiling framework 

Roc Salvador Andreazini, Xavier Yepes Arbós, Oriol Tintó Prims, Stella Paronuzzi Ticco, and Mario Acosta Cobos

The continuous increase in spatial and temporal resolution of Earth System Models (ESMs) is essential to better represent physical processes and extreme events. However, these advances come at a rapidly growing computational cost, pushing simulations towards unprecedented levels of parallelism on modern High Performance Computing (HPC) architectures. As a result, inefficiencies in load balance, communication, I/O, and memory usage increasingly limit scalability and scientific throughput.

Identifying and addressing parallel performance bottlenecks in large, multi-component climate models remains a complex and time-consuming task, often requiring specialized HPC expertise and manual profiling workflows. This represents a significant barrier for model developers aiming to efficiently exploit current and future exascale systems.

We present the Automatic Performance Profiling (APP) framework, an automated and extensible workflow designed to provide performance analysis of high-resolution ESMs. APP runs end-to-end profiling experiments and generates a comprehensive, multi-level performance report that combines high-level metrics (e.g., simulated years per day (SYPD) and scalability curves) with detailed insights into MPI communication patterns, cache behavior, and function profiling. This approach enables systematic identification of bottlenecks arising from extreme concurrency and fine spatial/temporal resolution demands.

Integrated with the Autosubmit workflow manager, APP facilitates reproducible performance studies, cross-platform and model configurations/resolutions comparisons. Its modular design supports multiple climate models (NEMO and ECE4) and HPC systems (BSC’s MN5 and ECMWF’s HPC2020) and allows straightforward extension to new HPC platforms and models.

By lowering the barrier to parallel performance analysis, APP empowers the climate modelling community to improve scalability and resource efficiency, supporting the sustainable development of next-generation high-resolution ESMs.

How to cite: Salvador Andreazini, R., Yepes Arbós, X., Tintó Prims, O., Paronuzzi Ticco, S., and Acosta Cobos, M.: Enhancing Earth system models efficiency: Leveraging the Automatic Performance Profiling framework, EGU General Assembly 2026, Vienna, Austria, 3–8 May 2026, EGU26-19114, https://doi.org/10.5194/egusphere-egu26-19114, 2026.

EGU26-20436 | Orals | ESSI2.2

Minimising I/O, maximising throughput: earthkit-workflows, a task-graph engine for heterogeneous systems  

Jenny Wong, Vojtech Tuma, Harrison Cook, Corentin Carton de Wiart, Olivier Iffrig, James Hawkes, and Tiago Quintino

In-memory HPC workflows promise significant performance gains by reducing I/O, but achieving these gains requires precise scheduling of data-dependent task graphs on heterogeneous computing platforms. While existing Python frameworks such as Dask provide abstractions for parallel execution, they are not designed to fully exploit advanced topology-aware scheduling, natively support tightly coupled CPU-GPU task graphs in complex HPC environments, or utilise captured profiling information during scheduling. 

Earthkit-workflows is a Python library with a declarative API for constructing task graphs, and the capability to schedule and execute them on local or remote resources. It targets heterogeneous environments, enables task-based parallelism across CPUs, GPUs, and distributed HPC or cloud systems. Expensive I/O operations and intermediate storage are minimised via shared memory and high-speed interconnects, allowing intermediate results to be exchanged efficiently during task-graph execution. Streaming outputs from tasks, such as stepwise forecasting, are given first-class support, to allow starting downstream tasks without delay. The library also offers extensible graph-building interface with a plugin mechanism, allowing users to define custom operations, and interoperates seamlessly with the wider earthkit ecosystem. 

The task-graph construction and execution capabilities of earthkit-workflows are being applied in ECMWF’s next generation of data processing frameworks. Individual data processing functions are published as modular and reusable graphs, enriched with profiling measurements, and then combined together to form operational workflows. Two operational workflows which happen to have a subgraph in common, for example two subgraphs retrieving the same data as input, can be automatically merged for efficient resource utilisation. For operational robustness, checkpointing capability is also provided. 

Earthkit-workflows additionally finds application as the core of Forecast-in-a-Box, ECMWF’s offering that combines data-driven weather forecasting models with meteorological product generation, in a manner portable to personal workstation, high power local device or cloud computing, and aimed at non-technical users. Support for GPU is particularly critical, enabling efficient inference for data-driven weather forecasting models, not limited to HPC environments. 

How to cite: Wong, J., Tuma, V., Cook, H., Carton de Wiart, C., Iffrig, O., Hawkes, J., and Quintino, T.: Minimising I/O, maximising throughput: earthkit-workflows, a task-graph engine for heterogeneous systems , EGU General Assembly 2026, Vienna, Austria, 3–8 May 2026, EGU26-20436, https://doi.org/10.5194/egusphere-egu26-20436, 2026.

EGU26-20630 | ECS | Orals | ESSI2.2

Compression and Reconstruction of High-Dimensional Weather Simulation Data Using Tensor Decompositions 

Clara Hartmann, Rafael Ballester-Ripoll, Julian A. Croci, Jorge Gacitua Gutierrez, Juan Jose Ruiz, Paola Salio, Alexandra Diehl, and Renato Pajarola

High-resolution numerical weather and climate simulations increasingly produce very large data with high dimensionality. Such datasets usually span three spatial dimensions, time, multiple physical variables, and ensemble members, leading to six-dimensional (6D) hypervolume datasets. Being grid-based, these datasets can be interpreted as 6D data tensors. The storage, processing, visualization, and analysis of such large data poses significant computational and memory storage challenges. Tensor decomposition and approximation methods have proven to be an efficient tool for compression and reconstruction of such large, high-dimensional scientific datasets. Using rigorous mathematical principles, tensor decompositions are exploiting multi-linear structure and redundancy inherent in scientific data, leading to an effective compression of the datasets while providing visually accurate results.

In this work, we investigate the applicability of tensor decompositions for the compression and efficient representation of 6D weather simulation data. We focus on two of the state-of-the-art low-rank tensor formats, tensor-train (TT) and Tucker decompositions. These methods generalize the singular value decomposition (SVD) to higher-order tensors, enabling compression of spatial, temporal, and physical modes through rank reduction. Therefore, the large high-dimensional tensor is factorized into multiple smaller, rank-reduced tensors with lower dimensionality, reducing the size of the original data significantly while preserving essential features. Such a reduced representation is also called a tensor approximation (TA).

We apply the tensor decompositions to a real-world weather simulation dataset from the Alpine region of Switzerland (COSMO-1E), organized along longitude, latitude, vertical level, time, physical variables (such as temperature), and 11 ensemble dimensions. We evaluate the performance of the compression in terms of storage reduction, relative reconstruction error, peak-signal-to-noise-ratio (PSNR), structural similarity index measure (SSIM), computational costs, and visual comparison to the original data. Our results demonstrate significant compression ratios while preserving high visual accuracy. For example, a TT-based compression with a compression ratio of 1 : 900 provides results with a relative error of only 0.0005. The obtained compression ratio reduces the size of 4GB of the original dataset to 4.6MB for the compressed dataset. Lower compression ratios lead to even higher accuracy.

Beyond efficient data compression, the linear structure of the tensor decompositions allows for efficient application of filters in the tensor domain. The computation of the mean, standard deviation or similar linear operations along user-defined dimensions can directly be performed on the decomposed tensors, without ever having to reconstruct the large 6D dataset. Furthermore, the structure of the tensors allows for efficient partial reconstruction and visualization of slices or subsets of the dataset without reconstructing the complete dataset.

Overall, this work highlights tensor decompositions as powerful tool for managing the growing size and complexity of high-dimensional weather simulation data. Their linear structure, which allows for efficient filter application in the compressed domain, makes them especially suitable for scientific analysis of complex datasets. Their integration into geoscientific data pipelines offers a promising pathway towards scalable and accurate data compression and analysis in numerical weather prediction and climate science. 

How to cite: Hartmann, C., Ballester-Ripoll, R., Croci, J. A., Gacitua Gutierrez, J., Ruiz, J. J., Salio, P., Diehl, A., and Pajarola, R.: Compression and Reconstruction of High-Dimensional Weather Simulation Data Using Tensor Decompositions, EGU General Assembly 2026, Vienna, Austria, 3–8 May 2026, EGU26-20630, https://doi.org/10.5194/egusphere-egu26-20630, 2026.

EGU26-20880 | ECS | Orals | ESSI2.2

Evaluating Tensor Decomposition and Approximation as Lossy Compression for Weather Data Visualization Tasks 

Julian A. Croci, Marc Rautenhaus, Clara Hartmann, Jorge Gacitua Gutierrez, Juan Jose Ruiz, Paola Salio, Alexandra Diehl, and Renato Pajarola

Major challenges with modern weather and climate simulations are the resources required to store, analyze and visualize the generated data. This storage problem forces scientists to compromise on data dimensionality, for example by discarding physical variables or the reduction of temporal timestamps

Tensor decomposition and approximation (TA) methods recently got a revival in the context of neural networks, to reduce the number of network parameters. However, TA methods also exhibit interesting properties favorable for the lossy compression of volumetric data. For example, for turbulence volumes created by simulations, compression ratios higher than 300 can be reached while preserving high precision. This allows for more efficient storage of large multi-dimensional data grids. Furthermore, tensor decompositions allow for partial reconstruction as well as the application of linear functions in the compressed domain, making these representations especially suitable for a variety of down-stream tasks analyzing the data such as statistical analysis. However, one open question, as for all lossy compression techniques, is, how the loss influences the quality of said tasks.

For the operationalization of TA methods, another challenge is their parametrization. Various decomposition techniques exist and selecting the most appropriate one is non-trivial. Further, data likely needs to be divided into smaller pieces, e.g. chunks, to achieve the best results, meaning high compression ratios while introducing as little error as possible. The division of the data in this context can mean both, omitting dimension (and hence reducing the dimensionality of the tensor) as well as splitting the data within dimensions. Finally, different tensor decomposition methods allow for different setups, further widening the compression parameter space to explore.

In this work we present an experimental setup that verifies compression performance regarding error metrics directly on the data as well as impact of the compression losses in downstream visualization tasks. We are using an offline TA-based compression scheme in which the data is reconstructed, i.e. decompressed, before saving it again in a standard format and hence being easily able to be fed into downstream visualization applications such as Met.3D. On this example, we will discuss how numerical error metrics, such as the relative error or the RMSE, are not always representative for errors in the visualization of the data in downstream tasks, especially for variables derived from the data. Further, we present different strategies for partitioning the data into chunks and motivate the effectiveness of tensor decomposition methods in the domain of numerical weather forecast data.

How to cite: Croci, J. A., Rautenhaus, M., Hartmann, C., Gacitua Gutierrez, J., Ruiz, J. J., Salio, P., Diehl, A., and Pajarola, R.: Evaluating Tensor Decomposition and Approximation as Lossy Compression for Weather Data Visualization Tasks, EGU General Assembly 2026, Vienna, Austria, 3–8 May 2026, EGU26-20880, https://doi.org/10.5194/egusphere-egu26-20880, 2026.

EGU26-1564 | Posters on site | ESSI3.2

Managing your drone data through the data life cycle: RDA guidelines for FAIR and responsible UAV Use 

Alice Fremand, Jens Klump, Sarah Manthorpe, Mari Whitelaw, France Gerard, Wendy Garland, Charles George, and Thabo Semong

The use of Remotely Piloted Aerial Systems (RPAS), also referenced as Uncrewed Aerial Vehicles (UAVs) and more generally as drones, is increasingly prevalent across various scientific disciplines, enabling the collection of large volumes of data for diverse research applications. These technologies are revolutionising data collection by offering higher temporal and spatial resolutions and enabling data collection in hazardous and inaccessible areas. However, the volume of data generated and the absence of standardised workflows to document operations and data processing often complicate data sharing and publication. 

As part of the Research Data Alliance (RDA) Small Uncrewed Aircraft and Autonomous Platforms Data Working Group, we have developed guidelines on how best to improve the Findability, Accessibility, Interoperability and Reusability (FAIR, Wilkinson et al. 2016) of these data and processing workflows. The working group compiled use cases showcasing RPAS applications across various research disciplines, documenting best practices and identifying gaps and challenges researchers have while handling their RPAS-derived data. We paid specific attention to legal, privacy and ethical considerations. Drawing on these insights, the group has now developed guidelines and recommendations to improve RPAS data management throughout the research life cycle, from mission planning to data publication and archiving, linking to existing resources and examples from the scientific community.

How to cite: Fremand, A., Klump, J., Manthorpe, S., Whitelaw, M., Gerard, F., Garland, W., George, C., and Semong, T.: Managing your drone data through the data life cycle: RDA guidelines for FAIR and responsible UAV Use, EGU General Assembly 2026, Vienna, Austria, 3–8 May 2026, EGU26-1564, https://doi.org/10.5194/egusphere-egu26-1564, 2026.

EGU26-3136 | Posters on site | ESSI3.2

Data Access Made Easy: flexible, on the fly data standardization and processing 

Mathias Bavay, Patrick Leibersperger, and Øystein Godøy

Automatic Weather Stations (AWS) deployed in the context of research projects provide very valuable point data thanks to the flexibility they offer in term of measured meteorological parameters and setup. However this flexibility is a challenge in terms of metadata and data management. Traditional approaches based on networks of standard stations struggle to accommodate these needs, leading to wasted data periods because of difficult data reuse, low reactivity in identifying potential measurement problems, and lack of metadata to document what happened.

The Data Access Made Easy (DAME) effort is our answer to these challenges. At its core, it relies on the mature and flexible open source MeteoIO meteorological pre-processing library. Originally developed for the needs of numerical models consuming meteorological data it has expanded as a data standardization engine for the Global Cryosphere Watch (GCW) of the World Meteorological Organization (WMO). For each AWS, a single configuration file describes how to read and parse the data, defines a mapping between the available fields and a set of standardized names and provides relevant Attribute Conventions Dataset Discovery (ACDD) metadata fields. Low level data editing is also available, such as excluding a given sensor, swapping sensors or merging data from another AWS, for any given time period. Moreover an arbitrary number of filters can be applied on each meteorological parameter, restricted to specific time periods if required. This allows to describe the whole history of an AWS within a single configuration file and to deliver a single, consistent, standardized output file possibly spanning many years, many input data files and many changes both in format and available sensors.

Through the EU project Arctic Passion, a web interface has been developed that allows data owners to manage the configuration files for their stations, refresh their data at regular intervals, inspect the data QA log files, receive notification emails and allow on-demand data generation. The same interface allows other users to request data on-demand for any time period.

How to cite: Bavay, M., Leibersperger, P., and Godøy, Ø.: Data Access Made Easy: flexible, on the fly data standardization and processing, EGU General Assembly 2026, Vienna, Austria, 3–8 May 2026, EGU26-3136, https://doi.org/10.5194/egusphere-egu26-3136, 2026.

In recent years, significant progress has been made in digitizing natural history collections using increasingly industrialized workflows involving conveyor belts, digital camera setups, robotics and Artificial Intelligence (AI). Also, new technologies became available to analyse the specimens. Analysis of both biodiversity and geodiversity samples has shifted from destructive analysis to non-destructive, high-resolution, and automated techniques accelerating the creation of new information.However, the resulting data is often fragmented across systems and repositories. Efforts to reconnect these data to the original specimen or derived samples frequently fail because identifiers were missing at the time of analysis, are not globally unique, change over time, or are referenced incorrectly. These issues can be solved by maintaining a digital object on the internet that is created at the time of collecting the sample, which contains contextual information and (links to) its derived data as this becomes available. This is called a Digital Specimen and different entities(human or machine) who create an analysis can add information to the digital object. A one-to-one relationship between the physical sample preserved as a specimen can be kept by giving the physical objecta persistent identifier like an IGSN, International Generic Sample Number. The digital object also gets a persistent identifier: a Digital Specimen identifier in the form of a FAIR Digital Object compliant DOI (Digital Object Identifier).

The Digital Specimen is a citable, machine-actionable proxy for physical specimens that is FAIR by design (FAIR Digital Object compliant) and has a Persistent Identifier (PID) in the form of a DOI to create a self-contained unit of knowledge. This design enables seamless linkage to derived data—such as chemical analysis, digital media, and publications. To implement this, DiSSCo (Distributed System of Scientific Collections) developed the open Digital Specimen (openDS) specification. By integrating community standards like Darwin Core with W3C PROV-O and JSON-LD, openDS provides a common semantic language for global interoperability.

DiSSCo is currently in transition from its project phase into becoming an operational European Research infrastructure. It has already created the first millions of FDO-compliant Digital Specimens and has developed infrastructure to allow the annotation of these digital objects with new data or improvements, either by humans or machines. AI fueled Machine Annotation Services (MAS) developed by third parties can operate in the infrastructure for analysis of the data or knowledge extraction from specimen images. 

In the presentation we will show how the FDO design supports advanced capabilities like multiple redirect to different digital representations for either human or machine, versioning and provenance to allow mutable objects, tooltips in journal systems that show contextual information about a referred sample in a publication through the PID record, and machine actionable metadata that supports machines to act on the data.

How to cite: Addink, W. and Islam, S.: DiSSCo's Vision Applied: (Re-)connecting Fragmented Specimen Data through FAIR Digital Objects, EGU General Assembly 2026, Vienna, Austria, 3–8 May 2026, EGU26-3293, https://doi.org/10.5194/egusphere-egu26-3293, 2026.

EGU26-4891 | ECS | Posters on site | ESSI3.2

A FAIR Protocol for Hybrid Models and Data in Hydrology 

Akash Koppa, Son Pham-Ba, Felix Bauer, Olivier Bonte, Oscar Baez-Villanueva, Reda El Ghawi, Alexander Winkler, Diego G. Miralles, Fabrizio Fenicia, Charlotte Gisèle Weil, and Sara Bonetti

Hybrid modeling, which integrates physics-based and machine learning (ML) components, is a growing research area in hydrology and the broader Earth Science community. By combining the interpretability of process-based models with the predictive power of data-driven algorithms, these hybrid architectures offer improved accuracy and representation of complex environmental processes. However, their adoption is currently constrained by significant challenges regarding FAIR principles (Findable, Accessible, Interoperable, Reusable) . Unlike traditional physics-based models, the reusability of hybrid systems is frequently hindered by the dynamic nature of ML components, which are inextricably linked to specific training datasets and hyperparameter configurations. Furthermore, existing data data and model repositories are rarely designed to host such models.

To address these systemic barriers, we collaboratively designed and implemented a standardized FAIR protocol specifically tailored for hydrological hybrid models. This framework, termed as FRAME, consists of three critical components: (a) a set of interoperability coding standards for the physics and ML modules, (b) a unified metadata specification that captures the disparate requirements of both physics-based parameters and ML architectures, and (c) a specialized online repository designed for the persistent hosting and sharing of integrated hybrid assets. To facilitate user adoption, we developed an associated command line interface (CLI) for automated retrieval and setup of these models. To ensure the long-term impact and scalability of this protocol, we are actively soliciting participation from the global hydrologic modeling community. By establishing a community-driven standard, this protocol aims to provide a robust foundation for the transparent, reproducible, and collaborative advancement of hybrid modeling in hydrology.

How to cite: Koppa, A., Pham-Ba, S., Bauer, F., Bonte, O., Baez-Villanueva, O., El Ghawi, R., Winkler, A., G. Miralles, D., Fenicia, F., Gisèle Weil, C., and Bonetti, S.: A FAIR Protocol for Hybrid Models and Data in Hydrology, EGU General Assembly 2026, Vienna, Austria, 3–8 May 2026, EGU26-4891, https://doi.org/10.5194/egusphere-egu26-4891, 2026.

EGU26-5023 | Orals | ESSI3.2

Using “Data Agreements” in universities to clarify research data rights of use 

María Piquer-Rodríguez, Esther Asef, Sophia Reitzug, and Andreas Hübner

The Earth, Space, and Environmental Sciences are research disciplines in which a large amount of research data is generated and in which the principles of FAIR and open data are now receiving considerable attention.

Both FAIR and open data aim to enable and enhance the reusability of data, but before research data can be made available for broad reuse, it is essential to clarify rights and permissions: who is authorized to share the data and with whom, who may publish it, how credit for data-related work will be attributed, and what arrangements apply if a researcher transfers to another institution.

Concrete regulation of usage rights for research data continues to pose major challenges for researchers and research institutions alike. There are legal uncertainties due to room for interpretation in the general legal requirements, and in many cases, there are no systematised workflows for defining usage rights. To close this gap, a working group at the Department of Earth Sciences at Freie Universität Berlin has developed and implemented a ‘Data Agreement’ that provides clarity on the exercise of usage rights to research data within the group (for students and researchers) and also helps to operationalise FAIR and CARE principles in everyday research practice.

The ‘Data Agreements’ are used as an opportunity to discuss expectations regarding data management and to define and agree on binding rights of use for research data with each new member of the group or student´s thesis projects. We present the key aspects of the ‘Data Agreements’ and report on practical experiences with their use. We show how it not only facilitates clear agreements and prevent subsequent disagreements. In addition to legal aspects, practical aspects such as backup strategies or storage locations can also be specified within this process and thus improve the data management practice within the group.

The ‘Data Agreements’ [1] were developed in the working group together with the Research Data Management team and the university's legal office and are available under CC0 for reuse in other research groups or institutions. While the agreements were developed within a university context and relate to German academic practice and law, they may be reused or serve as templates for other research institutions, in other national or international contexts, and over a wide variety of Earth, Space, and Environmental Sciences disciplines and beyond.

[1] http://dx.doi.org/10.17169/refubium-46356

How to cite: Piquer-Rodríguez, M., Asef, E., Reitzug, S., and Hübner, A.: Using “Data Agreements” in universities to clarify research data rights of use, EGU General Assembly 2026, Vienna, Austria, 3–8 May 2026, EGU26-5023, https://doi.org/10.5194/egusphere-egu26-5023, 2026.

AQUARIUS is an ongoing Horizon Europe funded project. An impressive range of 57 research infrastructure services is made available by Transnational Access (TA) Calls to include research vessels, mobile marine observation platforms, fixed marine facilities, experimental research facilities, river & basin supersites, aircraft, drones, satellite services, and sophisticated data infrastructures.

As a result of the TA projects, many new data sets in a large variety of data types are being collected by TA teams, using and combining multiple and different observation installations. A major aim of AQUARIUS is supporting the EU Mission to Restore our Ocean and waters by 2030, and other marine initiatives, including contributing to the European Digital Twin of the Ocean and the UN Decade for Ocean Sciences.

There is a strong effort in AQUARIUS to get the maximum return of investment from the TA activities. An open data policy has been adopted, implemented with a dedicated Data Management approach, to ensure that all gathered metadata and data are managed in line with the FAIR principles. They should become part of the repositories managed and operated by leading European data management infrastructures, such as SeaDataNet, EurOBIS, ELIXIR-ENA, ICOS-Ocean, and Copernicus INSTAC, for quality assurance, long term stewardship, and wide access and use. These infrastructures in turn are feeding into EMODnet, Copernicus Marine, Blue-Cloud (EOSC), Digital Twin of the Ocean (DTO) developments, and globally to e.g. GEOSS, and the UN-IOC Ocean Decade programme.

To achieve a maximum result, the TA scientific teams are being supported by data centres, experienced in marine data management, and well connected to the European data management infrastructures. Most of them are National Oceanographic Data Centres (NODCs). They provide training and coach the TA teams during the AQUARIUS data management flow scheme. This includes steps from planning to training to deployment to publishing, and a number of instruments. One of those is the AQUARIUS TA Data Summary Log App which is used by PIs of TA projects to keep an overview and index of the data collection events. It produces a list for the data centres to know what data to expect from where and who and as a checklist for the next steps. The AQUARIUS TA Data Summary Log contains only metadata and no data. As follow-up, the TA teams and assigned data centres will work on elaborating the collected data to prevailing standards and inclusion in the European repositories. That progress is made visible through the AQUARIUS Dataflow Dashboard (ADD), integrated in the AQUARIUS website. It follows the progress from planning stage through to publishing of results for each awarded TA project. The ultimate goal is to give discovery and public access to research data sets as collected and processed and data products as generated by the TA research teams as part of the AQUARIUS TA projects.

The presentation will provide more background information on the AQUARIUS project and will highlight more details about the data management approach.

How to cite: Ni Chonghaile, B., Schaap, D., and Fitzgerald, A.: AQUARIUS, Integrating Research Infrastructures, Connecting Scientists, and Enabling Transnational Access for Healthy and Sustainable Marine and Freshwater Ecosystems, EGU General Assembly 2026, Vienna, Austria, 3–8 May 2026, EGU26-5326, https://doi.org/10.5194/egusphere-egu26-5326, 2026.

SeaDataNet is a major pan-European infrastructure for managing and providing access to marine data sets, acquired by European organisations from research cruises and other observational activities in European coastal marine waters, regional seas and the global ocean. Founding partners are National Oceanographic Data Centres (NODCs), and major marine research institutes. The SeaDataNet network gradually expanded its network of data centres and infrastructure, during a series of dedicated EU RTD projects, and by engaging as core data management infrastructure and network in leading European Commission initiatives such as the European Marine Observation and Data network (EMODnet), Copernicus Marine Service (CMS), and the European Open Science Cloud (EOSC).

SeaDataNet develops, governs and promotes common standards, vocabularies, software tools, and services for marine data management, which are widely adopted. A core service is the CDI data discovery and access service which provides online unified discovery and access to vast resources of data sets, managed by 115+ connected SeaDataNet data centres from 34 countries around European seas, both from research and monitoring organisations. Currently, it gives access to more than 3 Million data sets, originating from 1000+ organisations in Europe, covering physical, geological, chemical, biological and geophysical data, acquired in European waters and global oceans. Standard metadata and data formats are used, supported by an ever-increasing set of controlled vocabularies, resulting in rich and highly FAIR metadata and data sets. SeaDataNet provides core services in EMODnet Chemistry, Bathymetry, and Physics for bringing together and harmonizing large amounts of marine data sets, which are used by EMODnet groups for generating thematic data products.

EMODnet Bathymetry is active since 2008 and maintains a Digital Terrain Model (DTM) for the European seas. This is published every 2 years, each time extending coverage, and improving quality and precision. The DTMs are produced from surveys and aggregated data sets that are referenced with metadata via the SeaDataNet Catalogue services. Bathymetric survey data sets are gathered and populated by national hydrographic services, marine research institutes, and companies in the SeaDataNet CDI Data Discovery & Access service. Currently, this amounts to more than 45.000 datasets from 78 data providers. A major selection of these datasets has been used for preparing the 2024 release of the EMODnet DTM for all European waters and Caribbean, which has been published on the EMODnet portal. Currently, work is ongoing for a new 2026 version. 

The EMODnet DTM has a grid resolution of 1/16 * 1/16 arc minutes (circa 115 * 115 m), covering all European seas. It is based upon circa 22.000+ in situ datasets. It can be downloaded in tiles and viewed as map layers in the EMODnet portal. The maps are derived from EMODnet Bathymetry OGC WMS, WMTS, and WFS services. The EMODnet Bathymetry products are very popular and in 2024 – 2025 more than 100.000 EMODnet DTM files were downloaded, and more than 60 million OGC service requests were registered over the 2 years. EMODnet Bathymetry is also managing the European contribution to the international Seabed 2030 project.

How to cite: Schaap, D. M. A., Scory, S., Piel, S., and Schmitt, T.: SeaDataNet, pan-European infrastructure for marine and ocean data management and major pillar under EMODnet Bathymetry for generating the best Digital Bathymetry for European Seas   , EGU General Assembly 2026, Vienna, Austria, 3–8 May 2026, EGU26-5581, https://doi.org/10.5194/egusphere-egu26-5581, 2026.

EGU26-5601 | ECS | Orals | ESSI3.2

Providing analysis-ready campaign data via the InterPlanetary File System 

Lukas Kluft and Tobias Kölling

During field campaigns, timely data sharing across distributed teams is essential, yet access to central repositories is often constrained by limited bandwidth. As a result, preliminary datasets are frequently exchanged offline, which commonly leads to confusion about dataset versions once post-campaign releases occur.

We present a proof-of-concept to campaign data dissemination based on content-addressable storage. During the ORCESTRA campaign, observations were converted into analysis-ready Zarr stores and published via the InterPlanetary File System (IPFS). By accessing data through immutable content identifiers (CIDs), teams can use datasets offline in the field while ensuring that the exact same, verifiable data objects remain accessible after the campaign.

To improve discoverability and usability, we developed the ORCESTRA Data Browser, which dynamically generates dataset landing pages by fetching metadata client-side directly from IPFS. Together, these components demonstrate how decentralized, content-addressed data access can support version clarity, reproducibility, and robust data sharing for field campaigns and beyond.

How to cite: Kluft, L. and Kölling, T.: Providing analysis-ready campaign data via the InterPlanetary File System, EGU General Assembly 2026, Vienna, Austria, 3–8 May 2026, EGU26-5601, https://doi.org/10.5194/egusphere-egu26-5601, 2026.

EGU26-5819 | Posters on site | ESSI3.2

Making FAIRness Visible: Practical FAIR Assessment for Earth System Science Data 

Heinrich Widmann, Andrea Lammert, Eileen Hertwig, Beate Krüss, Karsten Peters-von Gehlen, and Hannes Thiemann

The FAIR-by-design approach pursued by most repositories and data services today requires significant and sustained effort in the curation and quality assurance of both data and metadata. Beyond providing research data that complies with the FAIR principles, it is essential that the level of FAIRness is transparently apparent to users from the metadata prior to data access and download. FAIRness indicators benefit both data providers and reusers by rewarding high-quality curation and supporting informed data selection in  complex, data-intensive Earth System Science (ESS) workflows.

In practice, making FAIRness levels visible requires repository data managers to perform  FAIR evaluation, either through manual assessment or by using established FAIR assessment tools. At the World Data Center for Climate (WDCC) the fully automated F-UJI tool is applied in operational practice to assess and expose FAIRness levels across large collections of climate data.

F-UJI is a web based service that programmatically assess FAIRness of research data objects at the dataset level based on the FAIRsFAIR Data Object Assessment Metrics. Its   automated and machine-aided analytics are well suited for the large amounts of datasets archived in WDCC and reflect established repository practices such as the assignment of DataCite DOIs and the provision of rich, standardised metadata. At the same time, automated assessment relies on clearly machine-assessable criteria, and thus can not fully capture FAIR aspects that require human interpretation, such as reuse relevance or domain-specific semantics. In addition, FAIRness results depend on the machine-detectability of persistent identifiers resolving directly to datasets, which are not always available at higher levels of data collection hierarchies.

Based on our operational experience, we compare F-UJI results with other FAIR assessment approaches, building on findings from a previous comparative study evaluating FAIR assessment methods for WDCC datasets (Peters-von Gehlen et al., 2022). This comparison shows that automated, manual, and hybrid FAIR evaluation approaches each have distinct strengths: automated methods focus on standardised, machine-actionable criteria, while manual assessments capture contextual aspects relevant for data reuse; hybrid approaches combine these advantages and mitigate the limitations of purely automated or manual methods.

This poster shares practical experiences from conducting operational FAIRness assessment at a climate data repository and discusses benefits, limitations, and best practices of automated and hybrid FAIR evaluation approaches in Earth System Science.

How to cite: Widmann, H., Lammert, A., Hertwig, E., Krüss, B., Peters-von Gehlen, K., and Thiemann, H.: Making FAIRness Visible: Practical FAIR Assessment for Earth System Science Data, EGU General Assembly 2026, Vienna, Austria, 3–8 May 2026, EGU26-5819, https://doi.org/10.5194/egusphere-egu26-5819, 2026.

EGU26-6870 | ECS | Orals | ESSI3.2

FAIRness and Openness Commitments as a catalyst for cultural change in research organisations 

Daniel Nüst, Anne Sennhenn, Jörg Seegert, Andreas Hübner, Khabat Vahabi, Stephan Hachinger, Markus Möller, Carsten Hoffmann, Lars Bernard, James M. Anderson, Sarah Fischer, Markus Reichstein, Mélanie Weynants, Carsten Keßler, Katharina Koch, Klaus-Peter Wenz, Nicole van Dam, and Babette Regierer

Many research communities and disciplines undergo a transformation towards promoting, facilitating, and recognising FAIRness (Wilkinson et al., 2016; https://doi.org/10.1038/sdata.2016.18) and Openness in Research Data Management (RDM) practices. These transformations require buy-in from stakeholders at multiple levels and warrant many conversations between all roles to be sustainable. One approach to facilitate  and document the requested stakeholders’ ownership is the use of so-called commitments, where public endorsements by individuals or organisations serve as a driver to normalize desirable practices and offerings. Commitments can establish a community norm, whose practices may eventually turn into standards, requirements and guarantees.

The Earth System Sciences (ESS) consortium of the German Research Data Infrastructure (NFDI) programme, NFDI4Earth (https://nfdi4earth.de/), and the NFDI consortium for the agrosystems research community, FAIRagro (https://fairagro.net), take deliberate steps to initialize cultural change in the form of commitments. The NFDI4Earth and FAIRagro FAIRness and Openness Commitments (https://doi.org/10.5281/zenodo.10123880, published in September 2024; https://doi.org/10.5281/zenodo.14925202 from February 2025) help to start conversations about changing the way that research data is collected, created, published, used, and recognised and request institutions to engage in the implementation and operation of FAIR RDM and related services. The signature of members and representatives of the respective communities signals agreement with the goals and values of the Commitments and with the consortias’ missions, products, and services. The signatories build a community of practice that takes into account diverse expertises, roles, and user groups for a sustainable shift towards more and diversified FAIR research outputs, and increasing adoption of Open Science and Open Research principles and practices.

The Commitments consist of two matching main statements and twelve supporting statements. The main statements are: (1) We commit to advance FAIRness and Openness in Earth System Science/Agricultural Sciences and beyond. (2) We value data infrastructures and data experts. The supporting statements concretise the engagement and give starting points for the implementation. Changes in the supporting statements enabled FAIRagro to incorporate community-specific aspects in its adoption of the NFDI4Earth Commitment. The NFDI4Earth and FAIRagro commitments have 8 and 7 institutional signatories, respectively, and 70 and 54 group or individual signatories, correspondingly (https://nfdi4earth.de/commitment, https://fairagro.net/en/commitment/).

In this work, we present the two Commitments and recap the process for their creation (cf. https://doi.org/10.5194/egusphere-egu23-14456), their differences, and lessons learned. We report on the interactions sparked by the Commitments with community stakeholders. We focus on the role of organisations and groups, because they are crucial to implement cultural change: they can set requirements, provide incentives for their members, and match these with supporting services and infrastructures. Specifically, we report from an exchange of experiences between representatives of institutional and group signatories from a workshop that connected institutions, created a space for open exchange, and laid a foundation for generalisable approaches.

How to cite: Nüst, D., Sennhenn, A., Seegert, J., Hübner, A., Vahabi, K., Hachinger, S., Möller, M., Hoffmann, C., Bernard, L., Anderson, J. M., Fischer, S., Reichstein, M., Weynants, M., Keßler, C., Koch, K., Wenz, K.-P., van Dam, N., and Regierer, B.: FAIRness and Openness Commitments as a catalyst for cultural change in research organisations, EGU General Assembly 2026, Vienna, Austria, 3–8 May 2026, EGU26-6870, https://doi.org/10.5194/egusphere-egu26-6870, 2026.

EGU26-7107 | ECS | Posters on site | ESSI3.2

Automated workflows for ever-growing, analysis-ready datasets at the Barbados Cloud Observatory 

Rowan Orlijan-Rhyne, Lukas Kluft, and Tobias Kölling

The Barbados Cloud Observatory (BCO), in continuous operation by the Max Planck Institute for Meteorology, offers an extensive record of clouds in the trade wind region since its birth in 2010. In the form of public, analysis-ready zarr stores processed with automated workflows, the record can be studied at time scales from seconds to years and serves to drive theoretical and model advancements. As an important geoscientific research asset, data from the BCO is trustable, reproducible, and versioned, but also easily available.

BCO data processing employs Apache Airflow’s automated workflows which append to zarr stores whenever new data arrives. Management of dynamic and growing datasets—as opposed to static (e.g. campaign) datasets—permits many versions, all of which are accurate and can be automatically regenerated. In shepherding the data, we choose our own unique keys, including dataset version numbering, which make up an intake catalog. We also implement quality control of dataset metadata and encodings with in-house tools.

By allowing for rolling processing of the data, often at daily intervals, our products can be easily probed for scientific, technical, and other use. For instance, we develop a javascript viewer which allows users to quickly and easily visualize data from many instruments. Additionally, by providing raw (i.e. directly from the instrument, as format permits), time-aggregated, commonly gridded, and sitewide 'best estimate' datasets, we also iterate on levels of processing complexity for a host of needs. These usability advantages are consequences of our technical approach, namely automated workflows and analysis-ready zarr stores.

How to cite: Orlijan-Rhyne, R., Kluft, L., and Kölling, T.: Automated workflows for ever-growing, analysis-ready datasets at the Barbados Cloud Observatory, EGU General Assembly 2026, Vienna, Austria, 3–8 May 2026, EGU26-7107, https://doi.org/10.5194/egusphere-egu26-7107, 2026.

EGU26-7717 | Orals | ESSI3.2

Integrating biodiversity in Situ data, Earth observation and stakeholder engagement - from machine- to policy-actionability 

Claus Weiland, Lena Perzlmaier, Daniel Bauer, Jonas Grieb, Julian Oeser, Taimur Khan, Sharif Islam, and Niels Raes

The EU’s Biodiversity Strategy for 2030, a core part of the European Green Deal, addresses the complex relationship between human society and its environment by prioritizing the restoration of ecosystems and building resilience against climate change, deforestation, and biodiversity loss.

These environmental stressors do more than just degrade ecosystems; they create a pressing need for policymakers, researchers, and society to actively track and mitigate ecological shifts. In order to design effective mitigation strategies, new political frameworks and massive simulation infrastructures are being developed with the aim to establish a common European Green Deal Data Space. The involved initiatives rely on the integration and standardization of diverse, large-scale datasets, ranging from long-term biodiversity records (e.g., eDNA) to real-time IoT sensor data (e.g., camera traps) and global Earth observation (EO) data combined with model-derived reanalysis datasets like ERA5.

‘Biodiversity Meets Data’ (BMD) is a Horizon Europe project delivering a unified access point for AI-assisted biodiversity monitoring and cross-realm (terrestrial, marine, freshwater) analysis tools representing a key contribution to the thematic expansion of the European Green Deal Data Space ecosystem. By providing a robust technical infrastructure, BMD facilitates the quantification of diverse ecological pressures - ranging from climate change to land-use shifts - on biodiversity. The project is strategically focused on the EU Natura 2000 network, equipping stakeholders such as conservation managers and policy makers with the necessary tools to implement and evaluate EU Nature Directives such as the Birds and Habitats Directives.

In this talk, we will present how BMD leverages FAIR Digital Objects (FDOs) and data space concepts around governance, licensing, and provenance tracking to synthesize computational workflows and diverse datasets into actionable knowledge units (“Workflow Run RO-Crate”, Figure 1). We will demonstrate our implementation path for such data-rich, self-contained digital containers building on web-based technologies such as RO-Crate (lightweight data packages) and FAIR Signposting (machine-interpretable layer describing resources). Those webby FDOs are designed to bridge the gap between practical needs of conservation stakeholders such as supporting data-driven decision making and technical capabilities of the Green Deal Data Space ecosystem.

Integration of targeted feedback from stakeholders, notably Natura 2000 site managers, into our development process ensures that the FAIR-compliant data products and FDO service framework are not only technically robust, but also socially and politically actionable.


Figure 1. Throughout its life cycle in the BMD data space, data is represented as RO-Crate. Initially (left), the data and the computational workflow are bundled as Workflow RO-Crate. Following processing, this is combined with the results and enriched with retrospective provenance and metadata to form a Workflow Run RO-Crate (right). Finally, these are presented as webby FAIR Digital Objects, incorporating a machine-interpretable layer based on FAIR Signposting (bottom).


How to cite: Weiland, C., Perzlmaier, L., Bauer, D., Grieb, J., Oeser, J., Khan, T., Islam, S., and Raes, N.: Integrating biodiversity in Situ data, Earth observation and stakeholder engagement - from machine- to policy-actionability, EGU General Assembly 2026, Vienna, Austria, 3–8 May 2026, EGU26-7717, https://doi.org/10.5194/egusphere-egu26-7717, 2026.

EGU26-7771 | ECS | Orals | ESSI3.2

Standardizing and encouraging best practices in tephra sample and data collection 

Abigail Nalesnik, Kristi Wallace, Andrei Kurbatov, Kerstin Lehnert, and Stephen Kuehn

The tephra research community spans diverse disciplines—from volcanology to archaeology—but faces persistent challenges due to fragmented databases and limited data accessibility. To address these issues, the global tephra community has developed best practices for standardized data collection and reporting, documented in Wallace et al. (2022; zenodo.org/records/6568306). These guidelines and templates for physical and geochemical datasets promote FAIR principles by improving data consistency, discoverability, and interoperability. Implementing these practices can significantly enhance multidisciplinary research and foster collaboration.

To advance data discovery and accessibility, the tephra community has partnered with the Interdisciplinary Earth Data Alliance (IEDA²) to create the Tephra Information Portal (TIP). TIP serves as an integrated framework that connects tephra data from existing cyberinfrastructures—such as EarthChem, PetDB, GeoDIVA, SESAR, TephraBase, and StraboSpot—allowing users to search across tephra platforms using common criteria, enhancing data findability and reuse. Standardized data submissions to these platforms are therefore critical for improving the findability of samples and datasets through TIP, and their adoption is strongly encouraged by the tephra community.

How to cite: Nalesnik, A., Wallace, K., Kurbatov, A., Lehnert, K., and Kuehn, S.: Standardizing and encouraging best practices in tephra sample and data collection, EGU General Assembly 2026, Vienna, Austria, 3–8 May 2026, EGU26-7771, https://doi.org/10.5194/egusphere-egu26-7771, 2026.

EGU26-7777 | Posters on site | ESSI3.2

Reproducible, transparent and traceable cleaning of IOC Tide Gauge Data 

Thomas Saillour and Panagiotis Mavrogiorgos

Accurate tide gauge records are essential for coastal monitoring, sea level analysis, and the calibration and validation of numerical models. However, global sea level data providers such as the Intergovernmental Oceanographic Commission (IOC)1 often contain inconsistencies related to vertical datums, step changes, sensor noise, and undocumented interventions, which limit their direct applicability for modelling and validation purposes.

We present ioc_cleanup (github.com/oceanmodeling/ioc_cleanup) , an open-source Python repository designed to clean tide gauge time series using a reproducible and transparent workflow defined in structured JSON files. All transformations are traceable, version-controlled using Git, allowing for consistent quality control, peer-review and community-driven improvements. The framework explicitly addresses common data quality issues, including spikes, sensor noise, sensor replacement or substitution, and step changes, as well as the challenge of distinguishing bad data from genuine physical events such as storm-driven sea level extremes or tsunamis.

The cleaned datasets have been used for the calibration and validation of a global barotropic model, revealing systematic data quality patterns across stations and regions. While the framework is applied here to sea level data, the methodology is provider-agnostic and applicable to other geophysical time series.

By formalising expert-driven flagging and corrections in a transparent manner, ioc_cleanup provides a foundation for future developments, including the potential use of machine learning techniques to assist data flagging, reduce operator subjectivity, and extend spatial and temporal coverage. The framework offers a scalable contribution to other datasets (such as GESLA42) and supports reproducible coastal data curation.

Citations:
[1] Flanders Marine Institute (VLIZ); Intergovernmental Oceanographic Commission (IOC) (2025): Sea level station monitoring facility. Accessed at https://www.ioc-sealevelmonitoring.org/ on 2025-12-15 at VLIZ. DOI: 10.14284/482

[2] Haigh, I.D., Marcos, M., Talke, S.A., Woodworth, P.L., Hunter, J.R. & Hague, B.S. et al. (2023) GESLA Version 3: A major update to the global higher-frequency sea-level dataset. Geoscience Data Journal, 10, 293–314. Available from: https://doi.org/10.1002/gdj3.174

How to cite: Saillour, T. and Mavrogiorgos, P.: Reproducible, transparent and traceable cleaning of IOC Tide Gauge Data, EGU General Assembly 2026, Vienna, Austria, 3–8 May 2026, EGU26-7777, https://doi.org/10.5194/egusphere-egu26-7777, 2026.

EGU26-9152 | Posters on site | ESSI3.2

istSOS4Things - FAIR & Open Source IoT platform for Open Science 

Massimiliano Cannata, Daniele Strigaro, and Claudio Primerano

Sensor-based environmental monitoring is increasingly vital for research and decision-making, yet the current web standards used to share these data streams, such as the OGC SensorThings API (STA), do not fully support scientific reproducibility, data provenance, or data sovereignty. To meet reproducibility requirements, researchers often resort to downloading and archiving static snapshots of evolving time-series datasets, leading to unnecessary data duplication, loss of linkage with live sources, and inefficient data management.

IstSOS4Things (www.istsos.org) aims to close this critical gap by extending the STA standard with versioning and time-travel capabilities, enabling data auditing and persistent, immutable access to historical states of sensor observations through persistent URL. Much like Git allows access to past versions of code, the proposed STA-traveltime extension let users cite, query and extract the exact dataset used in a study, even years later.

This breakthrough addresses a long-standing limitation of geospatial web services and paves the way for fully FAIR (Findable, Accessible, Interoperable, Reusable) and reproducible research. In parallel, istSOS4Things introduces mechanisms for fine-grained access control embedded within the web service itself, empowering researchers and institutions to share their data in accordance with the principle of “as open as possible, as closed as necessary.” This helps overcome common hesitations for data sharing, ensuring trust, transparency, and legal compliance.

How to cite: Cannata, M., Strigaro, D., and Primerano, C.: istSOS4Things - FAIR & Open Source IoT platform for Open Science, EGU General Assembly 2026, Vienna, Austria, 3–8 May 2026, EGU26-9152, https://doi.org/10.5194/egusphere-egu26-9152, 2026.

EGU26-9158 | Orals | ESSI3.2

Making STAC FDO-ready: A Practical Path toward FAIR Digital Objects in Geoscientific Data Spaces 

Hannes Thiemann, Ivonne Anders, Marco Kulueke, Beate Kruess, and Karsten Peters-von Gehlen

FAIR Digital Objects (FDOs) provide an actionable framework for implementing the FAIR principles by combining persistent identifiers with machine-readable metadata, explicit typing, and structured relations. The FDO Forum, as an open, community-driven initiative, develops and coordinates specifications and reference concepts to support interoperable digital objects across infrastructures. A key challenge, however, is demonstrating how these specifications can be applied in practice within existing data ecosystems, where established domain standards and evolving collections must be integrated rather than replaced.

In this contribution, a practical implementation of FDO specifications is presented using the SpatioTemporal Asset Catalog (STAC) as an example. As a widely adopted standard for spatio-temporal data, STAC's modular design makes it an ideal bridge between established community practices and the FDO paradigm. The demonstration shows how STAC objects are transformed into typed FDOs using Handle-based PIDs and registered object types via a Data Type Registry (DTR). This approach enables machine-actiolnable navigation and interpretation that transcends domain-specific tooling.

The approach is illustrated using a STAC-based catalog developed at the German Climate Computing Center (DKRZ), reflecting typical characteristics of climate research and climate modelling data, such as evolving and versioned collections and multiple levels of aggregation. The focus is on the practical application of FDO specifications, illustrating how typing, identifiers, and relations can be introduced in a standards-compliant manner without disrupting existing infrastructures, while enabling stable referencing, automated discovery, and seamless integration into data-processing workflows.

The results show that implementing FDO specifications through STAC is a pragmatic and transferable pathway from specification-level concepts to operational adoption. The implementation enables the creation of interoperable, machine-actionable data spaces while building on established standards and tooling, and provides lessons learned for other infrastructures aiming to operationalize FAIR Digital Objects in practice.

How to cite: Thiemann, H., Anders, I., Kulueke, M., Kruess, B., and Peters-von Gehlen, K.: Making STAC FDO-ready: A Practical Path toward FAIR Digital Objects in Geoscientific Data Spaces, EGU General Assembly 2026, Vienna, Austria, 3–8 May 2026, EGU26-9158, https://doi.org/10.5194/egusphere-egu26-9158, 2026.

EGU26-9202 | Posters on site | ESSI3.2

PID-Driven Global Access to Flagship km-scale Climate Simulation Data 

Karsten Peters-von Gehlen, Kameswar Rao Modali, Florian Ziemen, Martin Bergemann, Christopher Kadow, Karl-Hermann Wieners, Siddhant Tibrewal, Ivonne Anders, Katharina Berger, Tobias Kölling, Lukas Kluft, Marco Kulüke, and Fabian Wachsmann

Climate science enterprise both produces and depends on extremely large datasets in order to meet the needs of diverse scientific and downstream user communities, especially as climate models are increasingly run at kilometre-scale resolutions, resulting in rapidly growing data volumes which increase demands on data handling infrastructures. Individual flagship simulations are no longer used by a single research group, but are routinely reused by dozens or even hundreds of researchers globally. Consequently, data findability, accessibility and reuse must be straightforward, data provenance must be transparent, and the full heritage of simulation data should be preserved in a machine-actionable manner to ensure scientific rigour, explainability and reproducibility.

In this contribution, we present a conceptual infrastructure-level approach developed within the WarmWorld project based on leveraging the versatility of globally unique persistent identifiers (PIDs) to address these challenges. Specifically, we illustrate that by assigning handles to simulation datasets already at the point of production, simulation data stored locally at a HPC data center can become part of a globally interoperable data ecosystem. In our concept, handle profiles contain an URL at which the dataset can be opened. Further, machine-actionable metadata, such as the detailed provenance information describing the employed model configuration or a data reuse license and citation, would be available from the handle landing page. Thus, the motivation behind the approach we follow here is akin to that of the FDO specifications.

Finalized simulation datasets would be exposed through globally accessible SpatioTemporal Asset Catalogs (STAC), where PIDs serve as the authoritative entry point for discovery and access. Data access would be handled by system libraries that resolve storage locations across heterogeneous storage tiers. Crucially, data access shall be designed to be globally open without the need for credentials, reflecting a strong demand from the climate research community, as clearly demonstrated during the WCRP kilometre-scale hackathon (May 2025).

Systematic assignment and pragmatic leveraging of handles assigned to locally stored datasets can thus enable scalable and interoperable access to flagship climate datasets across infrastructures and communities, effectively integrating traditionally closed HPC data environments into the global data space and facilitating interoperability with other large-scale data holdings.

How to cite: Peters-von Gehlen, K., Modali, K. R., Ziemen, F., Bergemann, M., Kadow, C., Wieners, K.-H., Tibrewal, S., Anders, I., Berger, K., Kölling, T., Kluft, L., Kulüke, M., and Wachsmann, F.: PID-Driven Global Access to Flagship km-scale Climate Simulation Data, EGU General Assembly 2026, Vienna, Austria, 3–8 May 2026, EGU26-9202, https://doi.org/10.5194/egusphere-egu26-9202, 2026.

EGU26-9425 | ECS | Orals | ESSI3.2

Advancing FAIR Digital Objects for Machine-Actionable Research: Integrating Semantic Enrichment in Research Object Ecosystems 

Adam Rynkiewicz, Raul Palma, Paulina Poniatowska-Rynkiewicz, and Malgorzata Wolniewicz

Achieving higher levels of FAIR-ness for research artefacts demands not only structured packaging but also semantic enrichment that links textual resources to knowledge bases. ROHub, a reference platform implementing the Research Object paradigm, enables scientists to package and share research outputs as structured Research Object Crates (RO-Crates) - combining data, methods, software, and associated metadata into a unified, machine-processable entity. 

While RO-Crates inherently improve metadata richness and FAIR compliance by aggregating diverse resources with persistent identifiers and schema-based annotations, many research outputs still contain unlinked textual artefacts (e.g., reports, questionnaires, narratives) whose contextual semantics remain underutilized. Manual semantic annotation to link these textual elements to external knowledge bases - such as domain ontologies or vocabularies - is time-consuming and error-prone, yet crucial for enhancing findability, semantic interoperability, and machine-actionability. 

To address this gap, we extend ROHub with an automated semantic annotation service that identifies entities within text resources and links them to relevant knowledge bases, producing enriched metadata that feeds back into the RO-Crate structure. This service integrates entity linking techniques to reduce manual curation overhead and systematically increase the FAIRness and discoverability of research objects - making them more accountable to machine discovery, integration, and automated workflows. The result is a FAIR research object ecosystem where textual content, semantic context, and structured metadata co-exist in a machine-processable form, enhancing both human and computational reuse.

How to cite: Rynkiewicz, A., Palma, R., Poniatowska-Rynkiewicz, P., and Wolniewicz, M.: Advancing FAIR Digital Objects for Machine-Actionable Research: Integrating Semantic Enrichment in Research Object Ecosystems, EGU General Assembly 2026, Vienna, Austria, 3–8 May 2026, EGU26-9425, https://doi.org/10.5194/egusphere-egu26-9425, 2026.

EGU26-10308 | ECS | Posters on site | ESSI3.2

Interoperable CSV for Environmental Data Archival and Exchange– iCSV 

Patrick Leibersperger, Mathias Bavay, Ionut Iosifescu Enescu, and Chase Núñez

Environmental research relies on seamless data exchange between institutions globally, but inade-
quate documentation and complex formats hinder collaboration. We introduce iCSV, a self-describing,
human-readable format that combines the simplicity of CSV with the metadata richness of NetCD-
F/CF. iCSV ensures long-term interpretability, interoperability and user accessibility, addressing
key challenges in environmental data stewardship. By embedding structured metadata directly in a
human-readable text file, iCSV enables automated validation, supports FAIR principles and lowers
the barrier to data sharing and reuse while ensuring data remains interpretable for future users and
maintaining broad compatibility with existing software. This work motivates the need for a simple,
self-describing tabular format for environmental time series, presents the iCSV specification, positions
it within existing binary and human-readable format ecosystems through comparative analysis, and
discusses current limitations with directions for future improvements.

How to cite: Leibersperger, P., Bavay, M., Enescu, I. I., and Núñez, C.: Interoperable CSV for Environmental Data Archival and Exchange– iCSV, EGU General Assembly 2026, Vienna, Austria, 3–8 May 2026, EGU26-10308, https://doi.org/10.5194/egusphere-egu26-10308, 2026.

EGU26-10344 | Orals | ESSI3.2

FAIR Assessment in Geo-INQUIRE: Lessons Learned from Two Years of Experience 

Otto Lange, Laurens Samshuijzen, Enoc Martinez, Javier Quinteros, Helle Pedersen, Angelo Strollo, Carine Bruyninx, Florian Haslinger, Marc Urvois, Danciu LAurentiu, and Anna Miglio

The Geo-INQUIRE* project concerns an initiative in which, in a cross-domain setting, the European ESFRI landmark environmental research infrastructures EPOS, EMSO, ECCSEL, the Center of Excellence for Exascale Computing ChEESE, and the ARISE infrasound community, exploit innovative techniques to meet their FAIR data ambitions. At EGU25 we informed the audience about the project’s data management objectives and the strategies that were applied to translate the abstract concept FAIRness into practices that could widely be adopted in a large heterogeneous landscape of data producers. Specifically, we demonstrated how we established a pipeline for the assessment of levels of FAIRness with the integration of the F-UJI tool. This Geo-INQUIRE FAIRness Assessment Pipeline (GiFAP) is in use now for a period of about two years, in which it has proven to be a valuable instrument for the ongoing evaluation of the FAIRness of multiple datasets over time. However, interpreting and comparing snapshots of the value collections is by no means trivial and must be managed and communicated with care.

Because the integration of an assessment tool like F-UJI at the time always involves the adoption of a solution which itself is under active development and as such can hinder the reproducibility of outcomes, special care must be taken with respect to the versions used of both the tool itself and the underlying metrics framework. It is also essential to understand the effect of choices made during repeated assessment across time on the FAIR scores and their subsequent interpretation. The practical use of the overall pipeline as a tool to guide improvements in the FAIRness of data, mainly by adapting and improving the metadata, has revealed valuable insights in the subtleties of applying the FAIR data concept in different communities and to different data types.

As an important real-world example of applying the FAIR concept in a complex dynamic data-lifecycle setting we will explain how we technically integrated the F-UJI instrument in the existing infrastructure. A special focus will be put on possible pitfalls and their solutions regarding versioning issues that naturally arise when comparisons will be made over a longer period of time. The importance of managing expectations, the dependency on data managers, and the interference with applications for long tail researchers will be discussed and we will explain how we covered these within the project. Finally, we will explain how the Geo-INQUIRE solution could be adopted for comparable scenarios. 

* Geo-INQUIRE is funded by the European Union (GA 101058518)


How to cite: Lange, O., Samshuijzen, L., Martinez, E., Quinteros, J., Pedersen, H., Strollo, A., Bruyninx, C., Haslinger, F., Urvois, M., LAurentiu, D., and Miglio, A.: FAIR Assessment in Geo-INQUIRE: Lessons Learned from Two Years of Experience, EGU General Assembly 2026, Vienna, Austria, 3–8 May 2026, EGU26-10344, https://doi.org/10.5194/egusphere-egu26-10344, 2026.

EGU26-11300 | Posters on site | ESSI3.2

FAIR-compliant infrastructure based on istSOS for high-resolution rainfall monitoring and alerting 

Daniele Strigaro, Massimiliano Cannata, Claudio Primerano, and Andrea Salvetti

In Switzerland, short-duration and spatially concentrated rainfall events increasingly affect small catchments, where limited response times can lead to flash floods and debris flows with significant impacts on local infrastructure. These phenomena typically develop at spatial and temporal scales that are not fully captured by conventional meteorological monitoring networks.

Recent events in Southern Switzerland, including in the municipality of Lumino, have shown how localized precipitation can rapidly overload drainage systems and watercourses. Such situations highlight the need for rainfall observations with higher spatial density and minute-scale temporal resolution, able to complement regional forecasting and warning services.

National early warning systems, including those provided by MeteoSwiss, form a key component of flood risk management but may not resolve precipitation variability at local scales. To complement these systems, SUPSI and the Canton Ticino’s Ufficio dei corsi d’acqua (UCA) are testing a denser rainfall monitoring network based on rain gauges delivering one-minute data streams in near real time.

The monitoring infrastructure is designed according to FAIR data principles, ensuring that observations are findable, accessible, interoperable, and reusable. Data are managed through a cloud-based, event-driven architecture built on open geospatial standards, notably the OGC SensorThings API, implemented using the istSOS framework. Incoming data streams are processed on a computing cluster to derive cumulative rainfall indicators at multiple temporal scales (10-minute, hourly, and three-hourly), which are used to support threshold-based alerting mechanisms.

By combining high-resolution observations with open, standards-based data services, the system enables real-time visualization, automated notifications, and seamless integration with existing hydrological and risk management workflows. This approach demonstrates how FAIR-by-design monitoring infrastructures can bridge the gap between regional forecasts and local-scale observations, strengthening early warning capabilities and supporting more resilient flood risk management in a changing climate.

How to cite: Strigaro, D., Cannata, M., Primerano, C., and Salvetti, A.: FAIR-compliant infrastructure based on istSOS for high-resolution rainfall monitoring and alerting, EGU General Assembly 2026, Vienna, Austria, 3–8 May 2026, EGU26-11300, https://doi.org/10.5194/egusphere-egu26-11300, 2026.

EGU26-11768 | Posters on site | ESSI3.2

A Cloud-Native GNSS Data Lakehouse for Scalable Ingestion, Processing, and Analysis 

Nils Brinckmann and Markus Bradke

The rapid growth of Global Navigation Satellite System (GNSS) observations, driven by dense station networks, high-rate data streams, and the modernisation of satellite constellations places increasing demands on data centers in terms of scalability, reliability, and reproducibility. Traditional monolithic GNSS data management systems are often difficult to scale and adapt to evolving processing and analysis workflows. To address these challenges, we are developing a cloud-native GNSS data center architecture based on container orchestration and streaming technologies.

Our system is built on Kubernetes to enable flexible deployment, horizontal scalability, and fault tolerance of GNSS services. Data ingestion is handled through Apache Kafka, which provides a robust, high-throughput messaging backbone for streaming GNSS observations from heterogeneous sources. This approach decouples data producers and consumers, allowing independent scaling of ingestion, processing, and downstream analytics.

For long-term storage and analytical access, GNSS data are ingested via ETL pipelines into an Apache Iceberg data lakehouse. Iceberg provides schema evolution, partition management, and ACID (Atomicity, Consistency, Isolation, and Durability) guarantees, enabling efficient access to large, time-series GNSS datasets for both batch and interactive analysis.

System performance, data flow, and service health are continuously monitored using Prometheus, with operational and scientific metrics visualized through Grafana dashboards. This monitoring framework facilitates operational stability, performance optimization, and transparent reporting of data latency and availability.

We present the overall system design, implementation details, and initial performance results, and discuss how this architecture improves scalability, resilience, and reproducibility compared to conventional GNSS data centers. The proposed approach provides a flexible foundation for next-generation GNSS services and can be extended to other geodetic and Earth observation data streams.

How to cite: Brinckmann, N. and Bradke, M.: A Cloud-Native GNSS Data Lakehouse for Scalable Ingestion, Processing, and Analysis, EGU General Assembly 2026, Vienna, Austria, 3–8 May 2026, EGU26-11768, https://doi.org/10.5194/egusphere-egu26-11768, 2026.

EGU26-13109 | ECS | Orals | ESSI3.2

A harmonized, modular data quality framework facilitating cross-disciplinary usage and time-efficient evaluation of geospatial data 

Barbara Riedler, Sophia Klaußner, Stefan Lang, and Khizer Zakir

The increasing availability of spatial data coupled with the utilization of artificial intelligence, makes it essential to focus on the evaluation of data quality. At the same time, the fragmentation of existing quality frameworks hinders the attainment of comparable assessment results. We introduce a novel, modular framework for the evaluation of geospatial data quality with particular emphasis on FAIRness, transferability, reusability and spatial consistency. The framework thereby accommodates data of differing data processing levels, types and contexts. The hierarchical structure integrates common quality dimensions (e.g., completeness, accuracy, consistency) with new dimensions emphasizing upstream validity (metadata, traceability of input data, reproducibility) and downstream usability (applicability, transferability). Additionally, the framework enables the evaluation of two interlinked concepts: general data quality (DQ) and data adequacy (DA). The latter incorporates the relevance of data and the fit to use case-specific requirements. DQ and DA are measured through a combination of machine-evaluable metrics and structured expert judgment, aggregated as indicators on dimension and domain level. The assessment protocol is implemented in form of a spreadsheet and a web-based survey tool. The overall objectives of this development are (1) to achieve harmonization of existing quality concepts to facilitate cross-disciplinary data integration; (2) to support data selection processes in geospatial applications which involve multiple data sources and/or time-critical situations, through the reusability of evaluation results; and (3) to leverage the reflected data usage and integration into operational workflows through the consideration of spatial uncertainties and the implementation of aspects of FAIRness.

How to cite: Riedler, B., Klaußner, S., Lang, S., and Zakir, K.: A harmonized, modular data quality framework facilitating cross-disciplinary usage and time-efficient evaluation of geospatial data, EGU General Assembly 2026, Vienna, Austria, 3–8 May 2026, EGU26-13109, https://doi.org/10.5194/egusphere-egu26-13109, 2026.

EGU26-13278 | Orals | ESSI3.2

Is FAIR Sufficient for Interactive Data Services? Ensuring Sustainability and Reliability of the IPCC WGI Interactive Atlas 

Martina Stockhause, José Manuel Gutiérrez, Ezequiel Cimadevilla Alvarez, Maialen Iturbide, Lina Sitz, and Antonio S. Cofiño

The FAIR principles — Findable, Accessible, Interoperable, and Reusable — underpin Open Science but does not fully ensure the long-term usability of interactive data services like the IPCC WGI Interactive Atlas. Drawing on lessons learned from developing and operating the Interactive Atlas, this presentation explores the challenges of sustaining such services, which rely not only on FAIR-compliant data and software but also on continuous stewardship, infrastructure maintenance, and institutional commitment.

Scientific quality and transparency of the Interactive Atlas are supported through expert assessment by the IPCC authors, provenance documentation, and Complex Citation, which combine the attribution of credit for assessed digital objects with the traceability of digital IPCC results. Yet, sustaining reliability requires ongoing stewardship of both data and software to prevent degradation and preserve reproducibility. Addressing these needs demands joint efforts of the IPCC Data Distribution Centre (DDC) Partners to maintain data, documentation, and interactive components for a diverse user community. FAIR alone is not enough — long-term data preservation and infrastructure maintenance are essential to ensure the sustainability and trustworthiness of interactive data services in Earth system science.

By reflecting on both the successes and limitations of the Interactive Atlas, this contribution offers insights relevant to other Earth system science communities developing interactive or service-oriented data products. These approaches are also applicable to fields beyond Earth system science. 

How to cite: Stockhause, M., Gutiérrez, J. M., Cimadevilla Alvarez, E., Iturbide, M., Sitz, L., and Cofiño, A. S.: Is FAIR Sufficient for Interactive Data Services? Ensuring Sustainability and Reliability of the IPCC WGI Interactive Atlas, EGU General Assembly 2026, Vienna, Austria, 3–8 May 2026, EGU26-13278, https://doi.org/10.5194/egusphere-egu26-13278, 2026.

EGU26-13673 | Orals | ESSI3.2

Bridging fragmented terminologies: advancing vocabulary harmonization in Seismology through AI and community co-creation 

Juliano Ramanantsoa, Angelo Strollo, Florian Haslinger, Javier Quinteros, Daniele Bailo, Otto Lange, Samshuijzen Laurens, Sven Peter Naesholm, and Mathilde B. Sørensen

The conceptual clarity of any scientific field depends fundamentally on the precision and standardisation of its terminology. Prior studies have shown that an absence of standardized terminologies can lead to interpretive ambiguity, imprecise outputs, and divergent interpretations across research communities. In seismology, terminologies remain scattered across institutional glossaries, impeding data FAIRness (Findability, Accessibility, Interoperability, and Reusability), metadata consistency, and collaboration with adjacent fields such as  transdisciplinary research and AI engineering.

This work, carried out within the Geo-INQUIRE* project, introduces a vocabulary generation framework and a prototype database implementing three integrated innovations that consolidate the sparse seismological terminologies into a structured, machine-readable format: i) authority-first retrieval, ii) AI-mediated semantic triangulation, and iii) participatory expert governance.

The authority-first pathway performs weighted, priority-ranked extraction from eight expert-curated data centre sources (including FDSN, USGS, EarthScope, EPOS, and other relevant documents from the community), ensuring that the definitions originate from trusted references. The AI fallback pathway is activated only when authoritative retrieval fails, employing a semantic triangulation method in which three large language models - such as OpenAI's GPT-5.2, Anthropic's Claude Opus 4.5, and Google's Gemini 3 - independently generate candidate definitions. Embedding-based similarity analysis determines synthesis eligibility; if cross-model agreement falls below 50 percent, an expert flag is raised to prevent semantic uncertainty. When synthesis proceeds, a transparent concept-merging process extracts common and unique contributions from each model, recording all reasoning steps and preserving full provenance, overcoming a critical limitation of black-box AI knowledge generation.

Beyond technical generation, this work embeds vocabulary development within a participatory framework that transforms terminology from static definitions into community-validated knowledge. Through structured digital deliberation involving more than ten domain experts via a GitHub-based workflow, the approach delivers transparency, auditability, and collective ownership. Experts validate AI-retrieved content, resolve edge cases, and steward terminology evolution through documented discussion threads, ensuring definitions reflect both institutional authority and practitioner consensus while fostering public trust in seismology.

The system produces vocabulary encoding scheme-compliant entries with dual definitions: an authoritative version weighted by source priority, and an AI-synthesized alternative with full provenance. The source-weighting mechanism is fully flexible ensuring the reusability of the framework. Applied to over 500 terms across 4 thematic clusters, this framework demonstrates that AI can systematically extend vocabulary completeness while participatory governance safeguards epistemic integrity. By coupling algorithmic precision with community oversight, this framework strengthens data discovery, metadata coherence, and research infrastructure interoperability across European and international seismological networks that advance transparent, reproducible, and interoperable seismological science.

*Geo-INQUIRE (Geosphere INfrastructures for QUestions into Integrated REsearch) is funded by the European Union (GA 101058518).


How to cite: Ramanantsoa, J., Strollo, A., Haslinger, F., Quinteros, J., Bailo, D., Lange, O., Laurens, S., Naesholm, S. P., and Sørensen, M. B.: Bridging fragmented terminologies: advancing vocabulary harmonization in Seismology through AI and community co-creation, EGU General Assembly 2026, Vienna, Austria, 3–8 May 2026, EGU26-13673, https://doi.org/10.5194/egusphere-egu26-13673, 2026.

EGU26-14101 | ECS | Orals | ESSI3.2

Embedding Indigenous Data Governance in Research Data Infrastructures through Local Contexts 

Sarvenaz Ghafourian, Sean Tippett, and Chantel Ridsdale

Indigenous Data Sovereignty reflects the inherent rights of Indigenous Peoples to govern data relating to their communities, lands, and knowledge, while Indigenous Data Governance concerns how these rights are enacted within data systems. Translating this into practice within large-scale environmental data infrastructures remains a challenge.

Ocean Networks Canada (ONC) hosts long-term, near real-time coastal and oceanographic datasets that are widely reused across research, operational, and increasingly automated and machine-assisted workflows. In this context, ensuring that Indigenous governance expectations are clearly communicated and respected throughout the data lifecycle is critical. This work presents ONC’s ongoing efforts to implement Local Contexts Traditional Knowledge and Biocultural Labels and Notices as part of its research data management infrastructure, bridging ethical principles with operational practice.

We describe how Local Contexts information is being integrated into ONC’s metadata profiles, dataset landing pages, and persistent identifier workflows using established standards such as ISO 19115 and DataCite, making the metadata human- and machine-readable. This approach ensures that governance signals, including community-defined use expectations and restrictions, remain visible and interpretable to both human and machine users as data moves through downstream discovery platforms and reuse pathways.

This work is being undertaken as a pilot project and proof of concept, using ONC-owned datasets within the Local Contexts Test Hub. Due to capacity constraints faced by many Indigenous communities, full implementation with community-generated labels is not yet in place. Instead, this pilot allows ONC to explore technical integration pathways, identify challenges related to metadata standardization and machine-readability, and develop documentation, guidance, and technical support in advance. This approach is intentionally designed to ensure that, when communities are ready to engage, they are provided with clear resources and meaningful options for participation without undue technical burden.

This case study demonstrates how Indigenous Data Sovereignty can be meaningfully embedded into existing Earth science data infrastructures without compromising FAIR principles or interoperability. By operationalizing CARE-aligned governance within metadata and identifier systems, this work offers a practical, scalable model for repositories seeking to support ethical, transparent, and community-centred data reuse in the Earth and environmental sciences.

How to cite: Ghafourian, S., Tippett, S., and Ridsdale, C.: Embedding Indigenous Data Governance in Research Data Infrastructures through Local Contexts, EGU General Assembly 2026, Vienna, Austria, 3–8 May 2026, EGU26-14101, https://doi.org/10.5194/egusphere-egu26-14101, 2026.

EGU26-14565 | Posters on site | ESSI3.2

From Assessment to Action: ODATIS's Progressive Journey Toward FAIR Implementation in Ocean Sciences 

Erwann Quimbert and the ODATIS team

ODATIS, the ocean data hub within France's Data Terra research infrastructure, demonstrates how systematic progression from assessment through certification to innovation translates FAIR principles into sustainable community practices. Through three interconnected initiatives, ODATIS provides a replicable model for implementing FAIR while respecting domain-specific requirements.

Infrastructure Foundation

ODATIS operates through ten specialized Data and Service Centers (DSC) serving 130+ French research entities in physical oceanography, biogeochemistry, coastal observations, seafloor mapping, and marine ecosystems. This territorial network connecting national research infrastructure with local researchers provides the organizational foundation for systematic FAIR adoption. Two platforms anchor the infrastructure: SEANOE, a certified repository providing DOIs and preservation, and Sextant, a geographic catalog implementing ISO 19115 and OGC standards.

Assessment: The COPILOTE Project

Before imposing solutions, ODATIS assessed current capabilities through COPILOTE using the FAIR Data Maturity Model (FDMM). Evaluations revealed heterogeneous maturity levels and identified barriers: insufficient metadata, limited controlled vocabularies, unclear licensing, and inadequate provenance tracking. Participatory assessment engaged data managers and researchers in structured dialogue, transforming abstract FAIR concepts into concrete criteria. COPILOTE produced tailored improvement roadmaps demonstrating how standardized frameworks can respect institutional diversity while driving collective progress.

Certification: CoreTrustSeal Achievement

Building on assessment findings, ODATIS DSC pursued CoreTrustSeal certification, documenting organizational infrastructure, digital object management, and preservation capabilities. Successfully certified repositories including SEANOE achieved formal recognition of their trustworthiness, providing researchers with confidence in long-term data preservation and accessibility.

Innovation: The SO'Odatis Project

Funded by France's National Fund for Open Science, SO'Odatis develops integrated services making FAIR intrinsic to workflows. Four initiatives include: launching a diamond open-access journal linking publications with datasets and software; extending Sextant to catalog software with DOIs and Software Heritage integration; developing automated data paper generation from metadata; implementing comprehensive training through the correspondent network.

Cross-Disciplinary Lessons

ODATIS's journey demonstrates critical principles. Assessment before intervention reveals actual barriers and capabilities, preventing misdirected effort. Formal certification embeds FAIR into organizational culture beyond projects. Sustainable adoption requires reducing researcher burden through automation and workflow integration, not adding compliance tasks. Territorial networks enable bidirectional knowledge flow between infrastructure and communities. Critically, FAIR implementation is iterative, each phase builds on previous achievements while identifying new opportunities.

ODATIS offers a concrete roadmap: rigorous assessment identifies gaps; certification drives organizational maturity; innovation develops enabling tools; community engagement ensures relevance. This progression provides a replicable model for infrastructures translating FAIR principles into community-supported practices across Earth and environmental sciences.

How to cite: Quimbert, E. and the ODATIS team: From Assessment to Action: ODATIS's Progressive Journey Toward FAIR Implementation in Ocean Sciences, EGU General Assembly 2026, Vienna, Austria, 3–8 May 2026, EGU26-14565, https://doi.org/10.5194/egusphere-egu26-14565, 2026.

EGU26-15996 | Orals | ESSI3.2

Enhancing discoverability and impact of dispersed data through persistent identifiers in Australia 

Julia Martin, Kerry Levett, and Hamish Holewa

Australian environmental, biodiversity and climate research generates vast and diverse datasets from a wide variety of organisations across the research, government, public and private sectors: all with significant potential to inform research, management and policy. However, these data are frequently stored across multiple institutional and government repositories that lack consistent governance, adequate rich metadata and consistent application of externally-agreed community standards that are fundamental to machine-to-machine discovery and interoperability. As a result, valuable long-tail data remain difficult to find, access and reuse, limiting their impact and hindering translation into decision-making and environmental management. National consultation led by the Australian Research Data Commons (ARDC) confirmed that poor discoverability of domain-specific data is a major barrier to research progress and evidence-based decision-making .

The Domain Data Portals (DDP) program, delivered through the ARDC Planet Research Data Commons, addresses this challenge by improving access to FAIR (Findable, Accessible, Interoperable and Reusable) environmental and climate data held in distributed repositories. The program equips data stewards with tools and capabilities to make long-tail datasets FAIR for knowledge creation. This program partners with the National Environmental Science Program (NESP), Australia’s longest-running environmental research initiative, and the Australian Plant Phenomics Network (APPN). NESP is led by the Australian Government Department of Environment, Climate Change, Energy and Water (DCCEEW) and has 29 research partner organisations. NESP has four hubs in different environmental disciplines: 1)marine and coastal, 2) terrestrial ecology, 3) waste and sustainability, and 4) climate systems. APPN is an Australian National  Collaborative Research Infrastructure Strategy (NCRIS) Facility with nine research nodes. The DDP program is working with data managers across the nodes and disciplines to harmonise data formats and workflows while respecting domain-specific requirements.

The program is delivering cohesive, domain-level discovery of NESP and APPN research outputs through a dedicated portal within ARDC Research Data Australia, which is a metadata aggregation service that enables findability, accessibility, and reuse of data for research from over one hundred Australian research organisations, government agencies, and cultural institutions. To enable Research Data Australia to programmatically harvest the NESP and APPN metadata into the relevant portal, ARDC and the DDP project leads have worked with the  institutions and repositories in scope to develop guidelines on how to include relevant Persistent Identifiers in the metadata for their funded research outputs and ensure rich FAIR-compliant metadata. By developing rich, standardised metadata for all project outputs and leveraging national infrastructure, including persistent identifiers, controlled vocabularies and data publishing services, the DDP program enables robust, efficient aggregation and national discoverability of datasets.

This approach supports consistent adoption of community standards and enhances data visibility, integration and reuse. The Domain Data Portals approach can be applied to other research communities in Australia to make their data FAIR, leveraging components of ARDC’s national information infrastructure.

How to cite: Martin, J., Levett, K., and Holewa, H.: Enhancing discoverability and impact of dispersed data through persistent identifiers in Australia, EGU General Assembly 2026, Vienna, Austria, 3–8 May 2026, EGU26-15996, https://doi.org/10.5194/egusphere-egu26-15996, 2026.

EGU26-16338 | Orals | ESSI3.2

Today’s research for tomorrow’s challenges – building national research infrastructure across the full data life cycle 

Tim Rawling, Angus Nixon, Bryant Ware, Alex Hunt, Jens Klump, Anusuriya Devaraju, Rebecca Farrington, and Lesley Wyborn

As the volume and complexity of Earth science data continues to grow, driven by the availability of advanced instrumentation and requirement for new approaches to address geoscience questions and challenges, there is an increasing need for robust, end-to-end approaches to data management across the full data life cycle. Earth science datasets are, however, notoriously heterogeneous, spanning disciplines from geochemistry to geophysics and Earth observation, at observation levels from nanoscale to global, and amassing data volumes from megabytes to multi-petabyte collections. Yet for the vast majority of these datasets, the ‘raw’ observations collected by instrumentation, or Primary Observational Datasets (PODs), are not routinely reported or associated with the downstream, analysis-ready data products used to inform scientific or policy decisions. To enable reproducible and repurposable science particularly in a context where technical advances continue to push the data requirements upstream towards the primary observations, these PODs must be preserved for potential future applications and linked with the outputs they underpin.  

AuScope is Australia’s national geoscience research infrastructure funded through the National Collaborative Research Infrastructure Strategy (NCRIS), supports the geoscience community by providing data, data products, and software that align with the FAIR and CARE principles. Recognising that a single, monolithic repository cannot serve all disciplines, data types, or user communities, AuScope is developing an Earth Science Data Ecosystem that enables seamless access to PODs hosted across high-performance compute–data (HPC-D) and cloud environments, and provides pathways to connect raw observational data with curated, analysis-ready products delivered through distributed platforms and portals. A critical component of this ecosystem is strengthening digital infrastructure at the point of data generation and associating that primary observation with the published output. To address persistent challenges associated with manual data transfer, incomplete metadata capture, and limited long-term reuse, AuScope has embarked on the scoping and implementation of an Australian-first repository and capture system for PODs in geochemistry. By strengthening digital infrastructure at the point of data generation and embedding standards throughout the data life cycle, this work supports more efficient, interoperable, and collaborative Earth science research, maximising the long-term value of publicly funded data. 

How to cite: Rawling, T., Nixon, A., Ware, B., Hunt, A., Klump, J., Devaraju, A., Farrington, R., and Wyborn, L.: Today’s research for tomorrow’s challenges – building national research infrastructure across the full data life cycle, EGU General Assembly 2026, Vienna, Austria, 3–8 May 2026, EGU26-16338, https://doi.org/10.5194/egusphere-egu26-16338, 2026.

EGU26-16876 | Orals | ESSI3.2

What happens when FAIR is built in from the start? Insights from the GOYAS Project 

Fernando Aguilar Gómez, Daniel García Díaz, Antonio López, Aina García-Espriu, and Cristina González-Haro

The Geospatial Open Science Yielding Applications (GOYAS) project, developed under the Horizon Europe OSCARS framework, demonstrates a comprehensive pathway from FAIR principles to operational practice for Earth observation (EO) data products. While the FAIR principles (Findable, Accessible, Interoperable, Reusable) are widely endorsed by research data communities, translating them into reproducible and scalable workflows across heterogeneous data providers remains challenging. This contribution presents concrete results and lessons learned from GOYAS project, which has developed and implemented a FAIR-by-design system that supports community adoption and cross-disciplinary data reuse.

At its core, GOYAS comprises a set of customized software components, including an automated data production pipeline, a georeferenced data repository, and an OGC-standard API endpoint. The data ingestion pipeline integrates automation that reduces the initial effort required from data producers to generate FAIR data, by automatically producing standardized metadata, provenance information, and quality metrics as a by-product of routine processing. This approach enables transparency, consistency, and long-term reuse across all stages of the data lifecycle. To enforce the “F” of Findability, persistent identifiers (PIDs) are minted for mature data products using EOSC-Beyond services, ensuring persistent, machine-actionable references and reliable data product traceability.

A key outcome of GOYAS is the implementation of a validation framework that acts as a prerequisite for the publication of final data products, whereby persistent identifiers are assigned only to validated outputs. Each product undergoes:

  • Metadata standard validation, ensuring compliance with agreed schemas and machine-readability requirements (ISO 19139);

  • INSPIRE alignment, verifying that spatial data components meet European geospatial interoperability standards;

  • FAIRness evaluation using FAIR EVA (Evaluator, Validator and Advisor), assessing the degree to which products comply with FAIR principles through automated tests.

Only when all validation checks are successfully passed is a product considered mature for publication and assigned a persistent identifier (PID), thereby guaranteeing discoverability and long-term referenceability within EOSC and beyond.

We discuss how FAIR-by-design principles were embedded at key architectural layers, including metadata generation, PID minting, and automated quality assessment, and how these design choices support not only technical interoperability but also community adoption. Lessons learned highlight the importance of early integration of FAIR requirements into workflow design, the practical challenges of harmonizing cross-domain standards (FAIR and INSPIRE), and the role of automation in enabling scalable FAIR implementations without imposing additional effort on data producers.

By providing a documented and operational model that combines FAIR principles, persistent identification, standards compliance, and automated validation, GOYAS advances the practical implementation of FAIR and open data management in environmental sciences and offers transferable insights for related research communities.

How to cite: Aguilar Gómez, F., García Díaz, D., López, A., García-Espriu, A., and González-Haro, C.: What happens when FAIR is built in from the start? Insights from the GOYAS Project, EGU General Assembly 2026, Vienna, Austria, 3–8 May 2026, EGU26-16876, https://doi.org/10.5194/egusphere-egu26-16876, 2026.

EGU26-18803 | Posters on site | ESSI3.2

Operationalizing Data Fitness-for-Purpose Through Standardized Metrics, Local Uncertainty, and LLM-Extracted Quality Reasoning  

Markus Möller, Mahdi Hedayat Mahmoudi, and Paul Peschel

Making geospatial data FAIR requires more than metadata standardization - it demands transparent, structured reporting of data quality and uncertainty that allows researchers to assess fitness-for-purpose across diverse applications. Yet most FAIR implementations still treat quality as a generic metadata field, while uncertainty and fitness‑for‑purpose remain buried in narrative documentation and disciplinary tacit knowledge.

In the FAIRagro consortium, we operationalize an application‑oriented quality framework using the example of  Germany‑wide phenology time series (1 km, 1993-2022) by combining three components: (1) standardized producer‑side quality metrics (global R² and RMSE following ISO 19157‑1 for each crop, phase, and year), (2) spatially explicit local uncertainty layers, and (3) a machine‑actionable, application‑specific data quality matrix (AS‑DQM) that captures documented use contexts, validation strategies, limitations, and fitness‑for‑purpose statements from existing publications and workflow descriptions. Large Language Models (LLMs) are central to this workflow: after structure‑preserving conversion of PDFs to enriched Markdown, multimodal LLMs extract quality‑relevant concepts from text, tables, and figures, normalize them against a formal schema, and generate provenance‑linked AS‑DQM JSON profiles that can be queried and reused across applications.

These quality, uncertainty, and fitness profiles are then packaged as FAIR Digital Objects using interoperable containers (ARCs) for version‑controlled, reproducible workflows and RO‑CRATE standards for structured research object metadata - enabling seamless integration with research data management infrastructure and discovery systems. This approach ensures that quality reasoning, local uncertainty estimates, and application contexts travel together with phenology data through the research lifecycle, preserving provenance and enabling automated quality‑aware dataset selection.

This poster represents a transferable template for domain-specific FAIR implementation, demonstrating that structured uncertainty reporting, ISO-compliant quality metrics, LLM-assisted formalization of fitness-for-purpose information, and user-centered fitness-for-purpose assessments are essential bridges between abstract FAIR principles and practical, cross-disciplinary data reuse. For application, users can query not only "where are data FAIR?" but "where are data sufficiently accurate, well‑validated, and uncertainty‑constrained for this specific decision context?". By embedding LLM‑derived quality knowledge, uncertainty products, and an application matrix into machine‑actionable FAIR Digital Objects, we move from static compliance towards dynamic, evidence‑based fitness‑for‑purpose assessment - thereby strengthening trust in public data sets.

How to cite: Möller, M., Hedayat Mahmoudi, M., and Peschel, P.: Operationalizing Data Fitness-for-Purpose Through Standardized Metrics, Local Uncertainty, and LLM-Extracted Quality Reasoning , EGU General Assembly 2026, Vienna, Austria, 3–8 May 2026, EGU26-18803, https://doi.org/10.5194/egusphere-egu26-18803, 2026.

EGU26-18884 | Orals | ESSI3.2

Scaling FAIR Data Practices in Climate Modelling  

Kelsey Druken, Joshua Torrance, Romain Beucher, Martin Dix, Aidan Heerdegen, Paige Martin, Charles Turner, and Spencer Wong

Making research data Findable, Accessible, Interoperable and Reusable (FAIR) is now widely recognised as essential for open and reproducible science. In practice, however, translating FAIR principles into everyday data management remains challenging, particularly in climate modelling, which involves large data volumes and complex software and data environments on high-performance computing (HPC) platforms. Research rarely follows a simple path from data generation to publication, and FAIR is still often treated as a final, optional step rather than as a set of practices embedded and maintained throughout scientific workflows. 

We present a case study from Australia’s Climate Simulator (ACCESS-NRI) that examines how FAIR principles can be advanced through two complementary approaches applied in parallel. One focuses on the social and practical aspects of FAIR, supporting researchers to apply FAIR practices as part of their everyday research activities. The other centres on embedding FAIR directly into tools and processes, thereby reducing reliance on manual effort and helping to minimise the errors and inconsistencies that naturally arise in complex, collaborative environments. 

Through an open, merit-allocation based approach, ACCESS-NRI provides multiple data sharing pathways, from shorter-term spaces that support active development and collaboration to more curated, publication-ready datasets for longer-term access. This staged model supports the progressive application and uplift of FAIR practices as data are generated, shared, and refined over time, substantially streamlining later curation. Alongside this, we have also focused on improving the consistency and standardisation of ACCESS model outputs by embedding established community conventions and defined data specifications directly in the ACCESS software and release processes. This helps reduce variation across model outputs, supports reuse across tools and researchers, and shifts FAIR from a largely manual effort towards standard practice. 

This case study demonstrates how FAIR principles can be advanced through practical, community-aligned approaches that fit within real research contexts. For ACCESS-NRI, these efforts provide a foundation for tackling deeper FAIR data challenges, with lessons that are relevant to other Earth and environmental science domains facing similar constraints. 

How to cite: Druken, K., Torrance, J., Beucher, R., Dix, M., Heerdegen, A., Martin, P., Turner, C., and Wong, S.: Scaling FAIR Data Practices in Climate Modelling , EGU General Assembly 2026, Vienna, Austria, 3–8 May 2026, EGU26-18884, https://doi.org/10.5194/egusphere-egu26-18884, 2026.

EGU26-18954 | ECS | Posters on site | ESSI3.2

EOPF Toolkit: Engaging the Sentinel community to adopt the EOPF Zarr data format 

Gisela Romero Candanedo, Julia Wagemann, Sabrina H. Szeto, Emmanuel Mathot, Felix Delattre, Ciaran Sweet, James Banting, Sharla Gelfand, and Tom Christian

The European Space Agency (ESA), through the Earth Observation Processor Framework (EOPF), is reprocessing Sentinel-1, -2, and -3 archives into the cloud-optimised format Zarr. Through the EOPF Sentinel Zarr Samples Service, Sentinel data users can get early access to sample data in the new EOPF Zarr format.

The ESA-funded EOPF Toolkit project supports users transitioning from the legacy .SAFE Sentinel format to the cloud-optimised EOPF Zarr standard. The core development is EOPF 101, a comprehensive online resource designed to help users explore EOPF Sentinel Zarr data in the cloud. Through step-by-step and hands-on tutorials, Sentinel data users learn how to effectively use EOPF Sentinel Zarr products and build Earth Observation workflows that scale.

Chapter 1 - About to EOPF provides a high-level, easy-to-understand overview of the EOPF project by ESA. Chapter 2 - About EOPF Zarr provides a practical introduction to the cloud-optimised Zarr data format. It shows the benefits of the format, gives an overview of the data structure and includes performance comparisons with other formats. Chapter 3 - About Chunking provides an introduction to the chunking paradigm and lets users explore how to optimise their workflow. Chapter 4 - About EOPF STAC gives easy-to-understand practical examples on how to discover and access data with the EOPF STAC catalog. Chapter 5 - Tools to work with Zarr provides a collection of practical examples of languages, libraries and plug-ins that support users in working with data from the EOPF Samples Service. Chapter 5 - EOPF in Action is a collection of hands-on, practical end-to-end workflows featuring the use of EOPF Zarr data in different application areas.

Besides EOPF 101, the project had additional community engagement activities such as a notebook competition and a collaboration with Champion Users. The notebook competition took place between October 2025 and January 2026. During this period, the Sentinel data community was invited to try out the new EOPF Zarr data format themselves and share their workflows in the form of Jupyter Notebooks. The project further engaged with five organisations (Champion Users) to develop end-to-end workflows in different application domains

The EOPF Toolkit bridges the gap between data provision and practical application through three pillars of engagement: structured learning, expert guidance, and competitive innovation. While the EOPF 101  provides the foundational roadmap, Champion Users offer expert-level insights, and the notebook competition builds a library of community-sourced examples. Together, these initiatives create a feedback loop that transforms new adopters into active contributors, reducing the time-to-insight to the EOPF Zarr data format.

In this presentation, we will provide an overview of the community resources developed under the EOPF Toolkit and will share lessons learned from the community engagement activities.

How to cite: Romero Candanedo, G., Wagemann, J., H. Szeto, S., Mathot, E., Delattre, F., Sweet, C., Banting, J., Gelfand, S., and Christian, T.: EOPF Toolkit: Engaging the Sentinel community to adopt the EOPF Zarr data format, EGU General Assembly 2026, Vienna, Austria, 3–8 May 2026, EGU26-18954, https://doi.org/10.5194/egusphere-egu26-18954, 2026.

EGU26-19834 | Posters on site | ESSI3.2

EMODnet Chemistry and FAIR principles; evaluating and updating vocabularies 

Megan Anne French, Blakeman Samantha, Alessandra Giorgetti, Hans Mose Hansen, Marina Lipizer, Maria Eugenia Molina Jack, Gwenaelle Moncoiffe, Anna Osypchuk, and Matteo Vinci

The European Marine Observation and Data Network (EMODnet) was established in 2009 and is proposed as the European Commission (EC) in situ marine data service of the EC Directorate-General Maritime Affairs and Fisheries (DG MARE). EMODnet represents a network of organisations providing free access to European marine data available as interoperable data layers and data products for seven themes: Bathymetry, Geology, Physics, Chemistry, Biology, Seabed habitats, and Human activities. EMODnet Chemistry makes aggregated data collections and products available for contaminants, eutrophication, and marine litter following the Findable, Accessible, Interoperable, and Reusable (FAIR) principles (Wilkinson et al., 2016); for instance, the use of standardised vocabularies supports findability, interoperability, and reuse. EMODnet Chemistry uses the standardised, hierarchically mapped vocabularies of the Natural Environment Research Council (NERC) Vocabulary Server (NVS, managed by the British Oceanographic Data Centre (BODC)) for indexing and annotating meta(data). For example, the BODC Parameter Usage Vocabulary (P01, https://vocab.nerc.ac.uk/search_nvs/P01/) is used to describe variables by providing detailed information on the target chemical object (S27 vocabulary) or property and the matrix/medium including phase, while the SeaDataNet Parameter Discovery Vocabulary (P02, https://vocab.nerc.ac.uk/search_nvs/P02/) and EMODnet Chemistry chemical groups (P36, https://vocab.nerc.ac.uk/search_nvs/P36/) are used to group P01s. Recently, working group activities evaluated EMODnet Chemistry vocabulary issues and needs and proposed improvements; for example, deprecating and replacing the P36 for polychlorinated biphenyls with a new P36 for organohalogens. Thus, some new P36 vocabularies were created/deprecated and the names and definitions of other P36 chemical groups were revised for correctness and to ensure that lower-level vocabularies could be mapped. This work resolved numerous mapping issues for EMODnet Chemistry, allowing all chemical substances to be mapped, making more data findable and interoperable in EMODnet. It also increased alignment with the vocabularies of the International Council for the Exploration of the Sea (ICES). Overall, these efforts improve EU marine data management and support alignment with other EU frameworks.


Reference

Wilkinson et al., 2016. The FAIR Guiding Principles for scientific data management and stewardship. 10.1038/sdata.2016.18

How to cite: French, M. A., Samantha, B., Giorgetti, A., Hansen, H. M., Lipizer, M., Molina Jack, M. E., Moncoiffe, G., Osypchuk, A., and Vinci, M.: EMODnet Chemistry and FAIR principles; evaluating and updating vocabularies, EGU General Assembly 2026, Vienna, Austria, 3–8 May 2026, EGU26-19834, https://doi.org/10.5194/egusphere-egu26-19834, 2026.

EGU26-20023 | Orals | ESSI3.2

Paving the Road to FAIR – Strategies and Considerations to activate PIDs in a large Organization 

Emanuel Soeding, Dorothee Kottmeier, Andrea Poersch, Stanislav Malinovschii, Johann Wurz, and Sören Lorenz

At the Helmholtz Association, we aim to establish a harmonized data space that connects information across distributed infrastructures. Ideally, this should work within and beyond our organization. Achieving requires standardizing dataset descriptions using suitable metadata. A handy strategy is, to use persistent identifiers (PIDs) and their metadata records to harmonize central parts of the metadata. This will ensure a first level of interoperability and machine actionability even between discipline-unrelated datasets.

While harmonizing PID metadata is a key step, practical implementation depends on a number of factors: 1. Leadership, to support the necessary change processes, 2. A general awareness of roles and responsibilities across the whole research organization, 3. An implementation plan that prioritizes tasks, identifies the right people and interfaces, and specifies the tools and services required to record metadata. 4. An implementation group comprising people with the relevant expertise to implement and communicate the change process, 5. Informational material and training, to onboard the ones who are affected by change, 6. an organization's management supporting the upcoming change, and 7. Funding to be able to overcome the initial obstacles and get everything up and running.

For example, ORCID identifies research contributors. While often associated with publishing scientists, other contributors—such as technicians, data managers, and administrative staff—also play vital roles. Their contributions are often overlooked or not systematically recorded. To change this, PID workflows should begin early, ideally at the hiring stage, to ensure people's roles are captured and linked to datasets.

Similarly, the PIDINST system—developed by an RDA working group—provides unique identifiers for scientific instruments. It includes a simple schema for recording key metadata about instruments, enabling the reliable identification of measurements made with specific devices. Here, workflows should begin with instrument acquisition and include responsibilities for updating metadata, typically assigned to technicians.

In this presentation, we propose tailored PID workflows involving key stakeholder groups within Helmholtz. We outline strategies for implementing ORCID, ROR, PIDINST, IGDS, DataCite and CrossRef DOIs and assign responsibilities for metadata curation. Our goal is to embed PID usage in day-to-day research processes across all centers of our organization and clarify stakeholder roles, thereby strengthening metadata quality and data interoperability of our metadata.

How to cite: Soeding, E., Kottmeier, D., Poersch, A., Malinovschii, S., Wurz, J., and Lorenz, S.: Paving the Road to FAIR – Strategies and Considerations to activate PIDs in a large Organization, EGU General Assembly 2026, Vienna, Austria, 3–8 May 2026, EGU26-20023, https://doi.org/10.5194/egusphere-egu26-20023, 2026.

EGU26-20356 | Posters on site | ESSI3.2

The role of domain repositories in sustaining high-quality data publications: researcher-oriented tools and strategies under limited resources  

Kirsten Elger, Alexander Brauser, Holger Ehrmann, Ali Mohammed, and Melanie Lorenz

In the geosciences, most research results are supported by data. These data are measured, collected, generated or compiled by humans or machines (including numerical modelling) and they represent an increasingly important part of the research outcome. They should be made available and shared in openly in a reusable format wherever possible, while fully acknowledging the contributions of the individual researchers and institutions that collected or generated the data.

Research data repositories are permanent archives that provide access to data, metadata to related physical samples, as well as scientific software. An increasing number of repositories are assigning digital object identifier (DOI) to the data stored in their archives. The range of services offered includes fully self-service DOIs at large generic repositories, to institutional repositories that are open to institutional members only, and curated data publications by domain repositories specialising in data from a specific scientific field.

The involvement of skilled data curators, who are often also domain researchers, makes domain repositories the preferred destination for the publication of well-documented and reusable data. The generic metadata required for DOI registration is complemented by extensive, domain-specific metadata properties, such as the information on the temporal and geospatial domains, mineral or rock names, instruments and analytical methods. Ideally, this information derives from embedded controlled vocabularies or ontologies, which increase the discoverability of the data for humans and machines. During curation, author information is also supplemented with ORCID and ROR identifiers, and the published data is digitally connected to related research articles, datasets, software, and the physical samples from which the data were obtained. However, they are facing challenges due to insufficient staff to uphold these high publication standards. Unfortunately, the resulting delay in processing requests directs many researchers to generic repositories offering self-service DOIs that do not provide any data curation.

To address these challenges, GFZ Data Services provides intuitive tools for collecting rich metadata (metadata editors), data description templates with extensive explanations and online instructions on recommended file formats, for example. These tools enable researchers to provide high-quality metadata from the outset, thereby reducing the workload and time required for data curation.

In November 2025, GFZ Data Services launched ELMO, the fully revised and modernised version of our metadata editor. ELMO is not only a new web interface, but also contains many new features that improve the quality of metadata and the FAIRness of the data it describes, while simplifying the entry of information for researchers. For example, authors' names and institutions can be automatically entered by entering the ORCID; affiliations can be selected from a drop-down menu linked to the Registry of Research Institutions (ROR); and the controlled, linked data vocabularies already in use (e.g., GCMD and geosciML) are directly connected to the vocabulary services API, thus ensuring they are always up to date.

This presentation will outline the advantages and disadvantages of domain repositories, and introduce our new metadata editor ELMO.

How to cite: Elger, K., Brauser, A., Ehrmann, H., Mohammed, A., and Lorenz, M.: The role of domain repositories in sustaining high-quality data publications: researcher-oriented tools and strategies under limited resources , EGU General Assembly 2026, Vienna, Austria, 3–8 May 2026, EGU26-20356, https://doi.org/10.5194/egusphere-egu26-20356, 2026.

Making research data Findable, Accessible, Interoperable, and Reusable (FAIR) is widely recognised as essential for open and reproducible science. However, researchers often face a gap between FAIR-compliant datasets and data that are actually fit for specific scientific or operational applications. This gap arises because data quality is inherently application-dependent, while critical assumptions, limitations, and uncertainty characteristics are frequently documented only implicitly across publications, dataset metadata, and workflow descriptions. 

We present a document-driven, application-oriented approach to data quality assessment developed within the FAIRagro initiative. 
The method uses the \textbf{Application-Specific Data Quality Matrix (AS-DQM)}, which systematically captures reasoning linking documented data characteristics—such as spatial and temporal resolution, validation strategies, and known limitations—to application requirements and explicit fitness-for-Purpose statements (\href{https://zenodo.org/records/17981173}{FAIRagro resources}). Rather than computing new quality metrics, the AS-DQM formalizes existing knowledge already generated by research communities, reduces barriers to adoption, and supports responsible data reuse. 

The approach is illustrated using a Germany-wide phenology time series as a pilot example. By analysing dataset documentation together with a concrete phenology-based scientific studies, the AS-DQM demonstrates how application-specific quality requirements—such as acceptable temporal uncertainty, spatial aggregation assumptions, and suitability for regional-scale analyses—can be systematically extracted and made explicit. Comparing the resulting application-level quality profile with the dataset-level documentation shows how fitness-for-Purpose emerges from the interaction between data characteristics and application context, highlighting cases where datasets are conditionally suitable or explicitly unsuitable for specific analyses. 

We discuss strengths, limitations, and adoption challenges of document-driven, application-oriented data quality reasoning, emphasizing its broad relevance across Earth and environmental sciences and its role in fostering sustainable, community-driven FAIR data practices.

How to cite: Hedayat Mahmoudi, M. and Möller, M.: From FAIR Principles to Fitness-for-Purpose: Document-Driven, Application-Oriented Data Quality in Agrosystem Research, EGU General Assembly 2026, Vienna, Austria, 3–8 May 2026, EGU26-21042, https://doi.org/10.5194/egusphere-egu26-21042, 2026.

EGU26-21662 | Posters on site | ESSI3.2

Integration of TERENO into the DataHub Digital Ecosystem 

Ralf Kunkel, Marc Hanisch, Christof Lorenz, Ulrich Loup, David Schäfer, Thomas Schnicke, and Jürgen Sorg

In Earth sciences, there is an increasing demand for long-term observation data related to the hydrosphere, pedosphere, biosphere, and lower atmosphere across multiple spatial and temporal scales. In parallel, standardized methods to manage, find, access, provide interoperability, and reuse these data (FAIR) have been developed. Numerous centralized or distributed data infrastructures (thematic silos) exist, often with similar architectures but with a diversity of access methods, vocabularies for description, and frameworks for handling data and data flows.

DataHub is an initiative of the German Helmholtz Research Field Earth and Environment (E&U) with the aim of developing and operating a scalable, FAIR, and distributed digital research infrastructure to link research data from all compartments of the Earth system. By coordinating vocabularies, persistent identifiers (PIDs), and a common nomenclature across centres, DataHub ensures interoperability with national and international systems. The goal is the transition from isolated silos to interdisciplinary infrastructures. This is achieved by creating a community-driven digital research data ecosystem characterized by collaborative software development; the provision and use of products under a common open-source license model; a harmonized architecture of data management systems; connectivity of data via standardized interfaces (e.g., OGC STA, CSW, WMS); and, most importantly, the harmonization of data descriptions and data flows. As a first step, existing data infrastructures are integrated into the jointly developed DataHub environment.

TERENO (TERrestrial ENvironmental Observatories) is used as a reference implementation for the integration of an existing distributed data infrastructure into DataHub. TERENO is an interdisciplinary, long-term research program involving five centres of the German Helmholtz Association (FZJ, GFZ, UFZ, KIT, DLR). Running since 2008, it comprises an Earth observation network across Germany and provides long-term environmental data at multiple spatial and temporal scales to study the long-term impacts of land-use and climate change. It provides more than 3.3 billion observations from over 900 sites.

During the last decade, several drawbacks have been identified in the operation of TERENO, such as inhomogeneities in metadata describing measurement instrumentation and the observed data themselves. Moreover, different data quality routines and assessment schemes are applied.

How to cite: Kunkel, R., Hanisch, M., Lorenz, C., Loup, U., Schäfer, D., Schnicke, T., and Sorg, J.: Integration of TERENO into the DataHub Digital Ecosystem, EGU General Assembly 2026, Vienna, Austria, 3–8 May 2026, EGU26-21662, https://doi.org/10.5194/egusphere-egu26-21662, 2026.

EGU26-21754 | Orals | ESSI3.2

Collaborative Governance Solutions for NASA Science Mission Directorate (SMD) Data, Information, and Software 

Kaylin Bugbee, Deborah Smith, Emma Koontz, Rhea Bridgeland, Emily Foshee, Jaclyn Stursma, Dhanur Sharma, Rishab Dey, and Fred Kepner

Effective data governance requires a collective approach rather than isolated efforts. To achieve this, the NASA Science Mission Directorate (SMD) governance team—part of the Data and Analysis Services Project (DASP)—is implementing a strategy to support the Chief Science Data Officer’s vision for interdisciplinary, interoperable open science. The DASP governance team focuses on several key functions. First, the governance team has developed a framework to create governance and guidance for the data, information, and software used across the SMD community to ensure compliance with agency and government policies. The current governance model employs a rapid-response approach, using focused initiatives to identify high-priority needs and develop practical solutions. Second, the DASP governance team works to streamline operations and reduce friction for scientists and data stewards by utilizing automation and targeted training. Third, the DASP governance team is building a robust community of data repositories to empower open science and foster collaboration between divisions. To enhance these efforts, DASP has launched a centralized online hub designed to strengthen connections between SMD data stewards. This centralized platform allows for governance initiative reviews, community updates and sharing of relevant resources. This presentation will share the high-level SMD governance process, the development of the centralized governance community platform, and lessons learned from the first initiatives developed via the governance process. 

How to cite: Bugbee, K., Smith, D., Koontz, E., Bridgeland, R., Foshee, E., Stursma, J., Sharma, D., Dey, R., and Kepner, F.: Collaborative Governance Solutions for NASA Science Mission Directorate (SMD) Data, Information, and Software, EGU General Assembly 2026, Vienna, Austria, 3–8 May 2026, EGU26-21754, https://doi.org/10.5194/egusphere-egu26-21754, 2026.

Abstract Text (235 words):
Making marine geospatial data Findable, Accessible, Interoperable, and Reusable (FAIR) remains challenging for researchers and policy implementors, particularly in integrating geological and biological datasets for Special Areas of Conservation (SACs) management. This contribution shares experiences developing domain-specific FAIR workflows for west coast Ireland SACs (Porcupine Seabight, Belgica Mound, Inisheer Island), harmonizing INFOMAR multibeam data, EMODnet Geology, OBIS biodiversity, and Copernicus currents via the European Digital Twin Ocean (EDITO) and Destination Earth (DestinE) platforms (and others).

Seabed integrity metrics (e.g., Bedrock Suitability Index information) and substrate maps (85% accuracy, Random Forest classification) will be processed on available platforms, e.g., EDITO and DestinE HPC, post-QC for best possible and valid geometries and INSPIRE compliance. Biodiversity connectivity matrices (previous published work and code from the coastalNet R package will be cited and explored), pairwise probabilities e.g., 0.35 Belgica-to-Porcupine) overlay oceanographic simulations (e.g., ESRI EMUs), deposited as interoperable WMS layers on Figshare DOIs with plain-language metadata and APIs.

Specific challenges include integrating "dark" datasets and bridging technical-policy gaps; solutions involved AI-driven summarization, automated versioning, and user-centric pilots (e.g., co-design workshops, tracking download rates, policy citations). Additional challenges include alignment with MSFD thresholds (>25% degraded seabeds) and OSPAR goals fostered adoption, with sensitivity analyses (low BSI reduces connectivity 20-40%) potentially useful for informing trawling vignettes and conservation and restoration efforts (reefs on BSI>0.7).

This approach respects ocean science needs while promoting cross-disciplinary understanding and reuse (e.g., hydrology via sediment mobility), demonstrating cultural shifts through stakeholder panels and GDPR-compliant training toolkits. Outcomes advance RDA ESES goals by scaling FAIR practices for real-time AI dashboards, inviting dialogue on community-driven refinement.

How to cite: Auerbach, J. and Crowley, Q.: FAIR Marine Data Workflows for Policy: Unifying Seabed Integrity and Connectivity in Irish SACs via EDITO and DestinE, EGU General Assembly 2026, Vienna, Austria, 3–8 May 2026, EGU26-21811, https://doi.org/10.5194/egusphere-egu26-21811, 2026.

EGU26-22121 | Posters on site | ESSI3.2

Translating FAIR Principles into Practice: Lessons from Four Decades of Cryospheric Data Stewardship 

Donna Scott, Siri Jodha Singh Khalsa, Shannon Leslie, Amanda Leon, Amy Steiker, and Ann Windnagel

Applying the FAIR (Findable, Accessible, Interoperable, and Reusable) principles to enable open and reproducible science is now a core goal across research communities. Yet, for well-established data centers and specialized domains, translating these principles into everyday, sustainable practice remains a significant challenge. Using the National Snow and Ice Data Center (NSIDC) as a case study—founded in 1976 as the World Data Center for Glaciology—we examine how legacy data holdings, evolving research practices, and emerging standards converge in the pursuit of FAIR-aligned stewardship.

This presentation highlights both progress and hurdles in modernizing four decades of passive microwave snow and ice data records from SMMR, SSM/I, and SSMIS sensors managed by the NSIDC Distributed Active Archive Center (DAAC) and NOAA@NSIDC data programs. Many of these data products predate mature standards for metadata, provenance, and interoperability standards, originally distributed in basic binary formats with limited documentation and access options. We describe efforts to migrate these legacy products to self-describing formats, enhance provenance, improve transparency, broaden accessibility and services, and align repository operations with contemporary expectations for FAIR and Open Science.


Equally important are the cultural and organizational shifts needed to foster engagement among  researchers, data producers, and data managers in adopting and refining best practices that serve the cryospheric community’s specific needs. We share strategies for balancing standardization with domain-specific requirements, and reflect on how lessons learned from cryospheric data stewardship may inform broader FAIR implementation across the Earth sciences. By sharing these experiences, we hope to contribute to interdisciplinary dialogue on building sustainable, community-driven data ecosystems that support open and reproducible scientific research.

How to cite: Scott, D., Khalsa, S. J. S., Leslie, S., Leon, A., Steiker, A., and Windnagel, A.: Translating FAIR Principles into Practice: Lessons from Four Decades of Cryospheric Data Stewardship, EGU General Assembly 2026, Vienna, Austria, 3–8 May 2026, EGU26-22121, https://doi.org/10.5194/egusphere-egu26-22121, 2026.

EGU26-22747 | Orals | ESSI3.2

Fostering cross-disciplinary dialogue and credit attribution practices through Science Explorer, a digital library that tracks impact of literature, software and data 

Anna Kelbert, Alberto Accomazzi, Edwin Henneken, Kelly Lockhart, Jennifer Bartlett, and Michael Kurtz
The NASA-funded Science Explorer (SciX) is an open, curated information discovery platform for Earth and space science providing trusted access to interdisciplinary scientific resources. Developed as an extension of the Astrophysics Data System (ADS), a cornerstone of scholarly communication in astrophysics, SciX is designed to serve a broader scientific community, with a strong focus on supporting Earth science research, applications, and societal decision-making.
 
At the heart of SciX is a carefully curated database, where all indexed content (literature, datasets, and software) is sourced from reputable, authoritative providers. This ensures that users engage only with credible scientific information, making SciX a trusted environment for
discovery and decision support. The system integrates peer-reviewed research, preprints, conference and meeting abstracts, funded projects, mission and archival datasets, and software tools across domains, fostering connections between Earth and space sciences. This multidisciplinarity is essential for addressing complex societal challenges such as climate adaptation, disaster resilience, as well as larger research questions such as the origin of the solar system and the presence of life in the universe. The key ingredient that SciX is providing is a unified and precise, full-text search across these curated resources. We discuss our efforts to enrich these resources with common disciplinary and cross-disciplinary controlled vocabularies
to enhance findability and cross-disciplinary dialogue.
 
We also discuss our efforts to build a knowledge graph at SciX that connects the literature and the data and software resources, exposing the use of data and software in research and tracking the impact of these resources. In doing so, we hope to facilitate a cultural shift in the Earth and space science communities to streamline adoption of data and software citations, and to better align academic incentives with FAIR practices that have broad societal impact, such as metadata transparency, and resource accessibility and reuse.

How to cite: Kelbert, A., Accomazzi, A., Henneken, E., Lockhart, K., Bartlett, J., and Kurtz, M.: Fostering cross-disciplinary dialogue and credit attribution practices through Science Explorer, a digital library that tracks impact of literature, software and data, EGU General Assembly 2026, Vienna, Austria, 3–8 May 2026, EGU26-22747, https://doi.org/10.5194/egusphere-egu26-22747, 2026.

EGU26-5221 | ECS | Posters on site | G3.4

First Results for Simulation Environment using Multi-Sensor Network Observing Hintereisferner  

Katharina Lechner, Martin Rückamp, and Roland Pail

Glaciers are vulnerable to the impacts of climate change, making them a dynamic and rapidly transforming element of the Earth system. The consequences of these changes extend far beyond the polar and mountain regions, affecting ecosystems and water resources globally. Challenges such as flood risks and hazards like rock moraines underscore the importance of understanding this part of the ecosystem. Monitoring and measuring glacial environments are essential not only for mitigating risks but also for advancing scientific knowledge. By studying the dynamics of glaciers, scientists can gain a deeper understanding of their interactions with the Earth's climate system and better predict future changes.

The alpine glaciers have been research areas of several institutes for different geodetic sensors for over 150 years. The current challenge lies in leveraging observational data to develop a glacier model that can assimilate geodetic observations. This research aims to design an optimized geodetic sensor network that enhances the integration of field observations into glacier modeling. Both simulations and real-data processing should be considered. Sensitivity studies evaluate first the data products themselves and second the model’s response to various data inputs, identify observation errors, and refine the network design.

At this stage, a framework for a closed-loop simulation environment tailored to the Hintereisferner is presented. This environment should enable systematic assessment of sensor performance, network accuracy, and future scalability on a simulation basis. Spatial and temporal resolution of the ground truth and the observation methods are discussed. Different sensors are introduced in terms of spatial resolution and measurement accuracy. Initial results from sensitivity studies using different sensors are presented. Additionally, challenges in implementing the simulation environment are discussed.

How to cite: Lechner, K., Rückamp, M., and Pail, R.: First Results for Simulation Environment using Multi-Sensor Network Observing Hintereisferner , EGU General Assembly 2026, Vienna, Austria, 3–8 May 2026, EGU26-5221, https://doi.org/10.5194/egusphere-egu26-5221, 2026.

EGU26-5720 | ECS | Orals | G3.4

Assessing the Potential of Next-Generation Gravity Missions for Estimating Total Drainable Water Storage 

Alireza Sobouti, Mohammad J. Tourian, Peyman Saemian, Cuiyu Xiao, Benjamin Kitambo, and Nico Sneeuw

Total Drainable Water Storage (TDWS) represents the fraction of terrestrial water storage that can drain naturally from a basin. It is a key indicator of basin-scale hydrological responses, acting as a proxy for a basin’s water-retention capacity  and  availability for ecosystems and society. Satellite gravimetry provides a unique observational constraint on terrestrial water storage changes by sensing gravity variations caused by the redistribution of water mass on and beneath the land surface. While current missions such as GRACE and GRACE-FO successfully observe total water storage anomalies, they do not measure absolute water storage or any proxy of it. TDWS must therefore be inferred by interpreting gravity-based storage changes through the storage–runoff relationship, which governs how storage variations translate into drainage and river discharge. However, the limited effective spatial resolution of current gravity missions restricts robust analyses to large river basins and prevents investigations of smaller basins and sub-basin-scale hydrological processes. These limitations lead to the question of what improvements in TDWS estimation can be expected from next-generation gravity missions with enhanced spatial resolution and sampling.

In this study, we assess the potential impact of next-generation gravity missions, specifically NGGM and MAGIC, on the global-scale estimation of TDWS. We use simulated gravity observations, with two generations of the ESA Earth System Model (ESM2.0 and ESM3.0) providing the Total Water Storage Anomaly (TWSA) as the reference signal. TDWS is then estimated using a storage–runoff relationship, with TWSA representing storage and runoff taken from in situ observations. All mission scenarios, including GRACE-C, NGGM, and MAGIC, are processed using an identical TDWS estimation framework, ensuring that differences in the resulting TDWS parameters arise solely from mission design characteristics such as spatial resolution, temporal sampling, and noise levels.

Mission performance is evaluated at the basin scale by comparing basin-averaged total water storage anomalies and TDWS-related parameters against ESM reference values. The impact of each mission is quantified in terms of (i) accuracy, defined as the closeness of mission-based parameters to the model reference, and (ii) parameter uncertainty, assessed through confidence intervals derived from the storage–runoff fitting. The analysis is further stratified by basin size, storage–discharge coupling, and hydrological complexity.

The results show that NGGM and MAGIC reproduce basin-scale TDWS parameters more accurately than a GRACE-C–like scenario, particularly for smaller basins. Comparison with the ESM reference demonstrates that future missions reduce parameter errors, tighten confidence intervals, and better capture differences in hydrological behavior across basins. At the same time, the study demonstrates that improved gravity observations must be complemented by physically meaningful storage–runoff relationships to fully exploit the potential of future missions. A comparison between results obtained from ESM2.0 and ESM3.0 is therefore required to assess how advances in the representation of basin-scale hydrological processes affect the evaluation of future mission impacts on complex hydrological behavior.

This work was carried out within the SING project, funded by the European Space Agency under the ‘NGGM and MAGIC Science and Applications Impact Study’ ESA Contract No. 4000145265/24/NL/SC.

How to cite: Sobouti, A., Tourian, M. J., Saemian, P., Xiao, C., Kitambo, B., and Sneeuw, N.: Assessing the Potential of Next-Generation Gravity Missions for Estimating Total Drainable Water Storage, EGU General Assembly 2026, Vienna, Austria, 3–8 May 2026, EGU26-5720, https://doi.org/10.5194/egusphere-egu26-5720, 2026.

Changes in terrestrial water storage (TWS) induce measurable elastic deformation of the Earth’s surface, known as hydrological loading. GNSS observations quantify these surface deformations and, despite being point measurements, they contain the full spectrum of the hydrological loading. Likewise, GRACE and GRACE-FO satellite missions support the monitoring of these hydrological loads, but their coarse spatial resolution (i.e., long-wavelength components) limits the characterization of short-wavelength and localized hydrological processes. Given these two different yet complementary geodetic remote sensing technologies, recent efforts have been made to combine them for recovering high-resolution TWS fields.

Building on these recent efforts, we adopted a remove-restore framework, a widely used technique in regional gravity field modeling, to invert TWS variations from GNSS-derived vertical displacements. In this framework, GRACE-based hydrological loading is first synthesized into vertical deformation up to degree and order 60, and then removed from GNSS observations, isolating residual displacements dominated by sub-GRACE-scale hydrological signals (i.e., short-wavelength components). These residuals are then inverted using a modified elastic Green’s functions to recover residual high-resolution TWS anomalies, which are subsequently restored with the long-wavelength GRACE signal to obtain high-resolution TWS anomaly fields. We applied the method to Chile, a region characterized by strong hydro-climatic gradients and significant tectonic activity, which served as a challenging testbed for the inversion of hydrological loading into high-resolution TWS.

Our results showed that the remove–restore approach enhances both the spatial detail and amplitude of TWS variations compared to GRACE alone, while preserving consistency with large-scale mass changes. Comparisons with land surface and hydrological model outputs indicated improved representation of regional and local hydrological variability. Overall, this exercise demonstrates the potential of integrating GNSS and GRACE/GRACE-FO through a remove-restore strategy to reconcile complementary geodetic observations and better resolve multi-scale water storage dynamics.


How to cite: Ferreira, V., Zeng, Z. B., and Montecino, H.: High-resolution terrestrial water storage from GNSS vertical deformation using a remove–restore hydrological loading framework: Application to Chile, EGU General Assembly 2026, Vienna, Austria, 3–8 May 2026, EGU26-6155, https://doi.org/10.5194/egusphere-egu26-6155, 2026.

EGU26-6604 | Orals | G3.4

A dataset of long daily TWS changes over Europe, inferred from vertical displacements measured by GPS 

Anna Klos, Artur Lenczuk, and Janusz Bogusz

Vertical displacements of Earth’s crust recorded by a set of permanent stations of Global Positioning System (GPS) antennas are used to infer the gridded changes in Terrestrial Water Storage (TWS) using elastic loading theory. Spatial resolution of the resulting gridded TWS changes is dependent on the number of displacement observations available for the region. For several regions around the world, including Europe, dense networks of GPS stations may guarantee high spatial resolution of the inferred gridded TWS changes, far exceeding the spatial resolution of gridded TWS changes that can be obtained from the Gravity Recovery and Climate Experiment (GRACE) observations. Similarly, the daily temporal resolution of gridded TWS changes that we can infer using daily GPS displacements is extremely competitive with monthly GRACE solutions. Both improvements allow for the analysis of regional sub-monthly TWS changes. In this presentation, we showcase a dataset of daily gridded TWS changes over Europe, inferred from vertical displacements measured by more than 4,000 GPS stations across Europe, for a period of 1994-2023. We use the vertical displacements provided by the Nevada Geodetic Laboratory (NGL) and analyze them thoroughly to eliminate the displacements showing apparent changes unrelated to hydrology. We then divide the displacements into three temporal scales of short-term, seasonal and long-term changes to enhance a better understanding of the resulting gridded TWS changes and classify this set of GPS stations into hydrological benchmarks. We then use this benchmark dataset and invert the displacement time series into gridded TWS changes over Europe. We perform several comparisons on regional and local spatial scales with GRACE, hydrological models, and other datasets, and prove that the resulting TWS changes may enhance future analyses of regional hydrological changes.

How to cite: Klos, A., Lenczuk, A., and Bogusz, J.: A dataset of long daily TWS changes over Europe, inferred from vertical displacements measured by GPS, EGU General Assembly 2026, Vienna, Austria, 3–8 May 2026, EGU26-6604, https://doi.org/10.5194/egusphere-egu26-6604, 2026.

EGU26-8530 | ECS | Posters on site | G3.4

Analysis of Three-Dimensional Seasonal deformation induced by GPS and loading models in Yunnan, China 

Yujiao Niu, Guangli Su, Layue Li, Wei Zhan, Min Li, and Yanqiang Wu

Seasonal deformation related to mass redistribution on the Earth’s surface can be recorded by continuous global positioning system (GPS) and simulated by surface loading models. In this study, we compared the three-dimensional seasonal deformation from 27 continuous GPS stations and surface loading models in Yunan, China. A good consistency of vertical seasonal variations can be observed between GPS and loading models, while obvious discrepancies exist in the horizontal seasonal deformation between them, especially for the East component. The reduction ratios of the median amplitudes of GPS annual variations obtained with loading corrections are 39.37%,-18.01% and 56.39% for the North, East and Up components respectively. We found that the significant difference in horizontal annual deformation between GPS and loading models is primarily attributed to the discrepancies of GPS annual phases at different stations. Seasonal vectors are employed to discriminate loading at different spatial scales. The results suggests that the large-scale load is concentrated in the southwest of Yunnan, the disordered horizontal annual phase may be related to local-scale mass loading. In addition, after removing the loading deformation from GPS time series, GPS vertical velocity uncertainties are significantly reduced, with the mean reduction ratio about 9%.

How to cite: Niu, Y., Su, G., Li, L., Zhan, W., Li, M., and Wu, Y.: Analysis of Three-Dimensional Seasonal deformation induced by GPS and loading models in Yunnan, China, EGU General Assembly 2026, Vienna, Austria, 3–8 May 2026, EGU26-8530, https://doi.org/10.5194/egusphere-egu26-8530, 2026.

EGU26-9175 | Orals | G3.4

Uplift and subsidence by heavy rains: Hydrogeodesy of Mt. Fuji, Japan 

Kosuke Heki, Shuo Zheng, Jianli Chen, Zizhan Zhang, and Haoming Yan

Active volcanoes often deform by magmatic activities at depth. Here we report that they deform also by hydrological activities induced by rains. By analyzing the daily coordinates of global navigation satellite system stations deployed around the Fuji volcano, the highest mountain of the country in central Japan, we detected transient surface uplift of 1-2 centimeters correlated with heavy rains. We consider they were caused by the expansion of shallow aquifers within Shin-Fuji lava layers. Such hydrological inflation of the volcano, lasting for a day or two, occurs within ~25 km from the summit. The uplift gradually decays with distance and is replaced with large-area subsidence by rainwater loading beyond the end of these lava layers. Subsidence is proportional to daily rains, rather than cumulative rains, suggesting dynamic equilibrium of precipitation and run-off. Understanding such ‘cold’ deformation of active volcanoes would help us correctly interpret ‘hot’ ones by magmatic activities.

How to cite: Heki, K., Zheng, S., Chen, J., Zhang, Z., and Yan, H.: Uplift and subsidence by heavy rains: Hydrogeodesy of Mt. Fuji, Japan, EGU General Assembly 2026, Vienna, Austria, 3–8 May 2026, EGU26-9175, https://doi.org/10.5194/egusphere-egu26-9175, 2026.

EGU26-11420 | Posters on site | G3.4

Comparison of GNSS residuals displacementswith environmental loading models 

Jean-Paul Boy, Paul Rebischung, and Zuheir Altamimi

All geodetic technique observations (DORIS, GNSS, SLR and VLBI) have been processed up to the end of 2024 in order to compute the  second update of the International Terrestrial Reference Frame 2020, namely ITRF2020-u2024 (https://itrf.ign.fr/en/solutions/ITRF2020-u2024). Following the IERS conventions, no environmental loading corrections have been applied besides ocean tides.

We also compute daily GNSS solution using the GINS software in iPPP (precise point positioning with integer ambiguity resolution) for the 2000-2025 period, and orbit/clock products from the CNES/CLS analysis center.

In parallel, the IERS Global Geophysical Fluid Center has provided atmospheric, induced oceanic and hydrological loading estimates for all permanent stations based on the latest ECWMF reanalysis (ERA5) and the barotropic ocean model TUGO-m (http://loading.u-strasbg.fr/ITRF2020/).

In this paper, we present a comparison of both the combined ITRF2020-u2024 and our daily GNSS residual displacements to environmental (atmosphere, ocean and continental hydrology) loading estimates. In more details, we show that the ERA5-based reanalyzes are in better agreement with the geodetic observations than the MERRA2 (Modern-Era Retrospective Analysis for Research and Applications, Version 2) reanalysis. We also show the improvement of the ERA5-land, a re-run of the land component of the ECMWF ERA5 climate reanalysis, versus the original ERA5 hydrological component.

Finally, we also show that a dynamic ocean response to pressure and wind is more suitable to model high frequency ocean non-tidal loading effects than the classical inverted barometer (IB) approximation.

How to cite: Boy, J.-P., Rebischung, P., and Altamimi, Z.: Comparison of GNSS residuals displacementswith environmental loading models, EGU General Assembly 2026, Vienna, Austria, 3–8 May 2026, EGU26-11420, https://doi.org/10.5194/egusphere-egu26-11420, 2026.

EGU26-14041 | Posters on site | G3.4

Terrestrial Quantum Gravimetry for Climate Monitoring: First Measurements in Greenland 

Tim Enzlberger Jensen, Przemyslaw Dykowski, and Adam Ciesielski

During summer 2025, an Absolute Quantum Gravimeter (AQG, manufactured by Exail) was deployed for one week in western Greenland to explore the potential of quantum gravimetry for geodetic observations in an Arctic environment - under remote and harsh field conditions - and to evaluate the sensitivity of absolute gravity measurements to mass redistribution processes associated with glacier dynamics and solid Earth deformation.

For most of the week, the AQG collected measurements at an established gravity point in the hangar of Ilulissat airport (ILUL). For one day, the instrument was transferred by helicopter to another established gravity point in the bedrock near the Greenland Ice Sheet, approximately 50 km inland along the Ilulissat ice stream. The point is co-located with the Kangia North (KAGA) permanent GNSS station, enabling a direct link between absolute gravity, surface deformation and cryospheric mass change signals. The station is located in proximity of the calving front of the Ilulissat glacier, one of the fastest-flowing and most dynamically active glaciers in Greenland.

In this contribution, we present preliminary results from the 2025 campaign and compare them with previous absolute gravity measurements obtained using an absolute A10 gravimeter at both sites. These time-separated absolute gravity observations provide a basis for assessing the potential of AQGs to monitor gravity variations associated with ice and water mass changes together with Glacial Isostatic Adjustment (GIA). We discuss the significance of the observed values, compare them with predicted gravity trends, and assess the credibility and uncertainty of the results under Arctic field conditions. The AQG observations are evaluated as a complement to GNSS and classical absolute gravimetry as a geodetic method for long-term cryospheric monitoring, with the 2025 campaign serving as a baseline for future repeated measurements. The expedition serves as a pilot study for repeated quantum gravimetry observations in Greenland, planned to be continued with a similar instrument in summer 2028.

The campaign was carried out within the project EQUIP-G (funded by the European Commission under the Horizon Europe program, grant number 101215427) and with support from the Danish Climate Data Agency.

How to cite: Jensen, T. E., Dykowski, P., and Ciesielski, A.: Terrestrial Quantum Gravimetry for Climate Monitoring: First Measurements in Greenland, EGU General Assembly 2026, Vienna, Austria, 3–8 May 2026, EGU26-14041, https://doi.org/10.5194/egusphere-egu26-14041, 2026.

EGU26-16776 | Orals | G3.4

Mass Loss of the Antarctic Peninsula ice sheet and its peripheral glaciers from 2007 to 2021 

Maud Bernat, Etienne Berthier, Amaury Dehecq, Romain Hugonnet, Joaquin MC Belart, Naomi Ochwat, Ted Scambos, Peter Kuipers Munneke, Elizabeth Case, Louis-Marie Gauer, and David Youssefi

The Antarctic Peninsula (AP), encompassing the ice sheet and its peripheral glaciers, is a highly dynamic component of the cryosphere, disproportionately contributing to sea level rise. However, a large spread remains between the mass changes estimated using gravimetry, altimetry and the input/output method. Among these techniques, the satellite (radar or laser) altimetry method has a resolution of, at best, 1 km, which is too coarse to resolve the complex pattern of changes in the Peninsula. Therefore, we use digital elevation models (DEMs; 30x30 m) to map elevation changes for the entire Peninsula, combining 476 DEMs derived from SPOT5-HRS satellite images (2006-2008) and 2525 strips of the Reference Elevation Model of Antarctica (2020-2022) to provide a comprehensive 14-year record. We bias-corrected each DEM using near-synchronous ICESat/-2 laser altimetry measurements.

Our observations cover 70% of the AP ice sheet and 60% of its peripheral glaciers, including for regions of the Peninsula poorly studied to date and decipher a spatially complex pattern of elevation changes. After correction with different models of firn air content and solid-earth response, we find that between 2007 and 2021, the AP ice sheet lost -27 ± 9 Gt/yr while its peripheral glaciers lost -14 ± 2 Gt/yr. For the AP ice sheet, our new estimate is 4 to 5 times more negative than the one obtained in IMBIE using purely altimetry data (-6 ± 6  Gt/yr from 2006 to 2018) and in better agreement with gravimetry and the input/output method. Our study highlights the importance of resolving fine scale elevation changes of glaciers and ice sheets. 

How to cite: Bernat, M., Berthier, E., Dehecq, A., Hugonnet, R., Belart, J. M., Ochwat, N., Scambos, T., Kuipers Munneke, P., Case, E., Gauer, L.-M., and Youssefi, D.: Mass Loss of the Antarctic Peninsula ice sheet and its peripheral glaciers from 2007 to 2021, EGU General Assembly 2026, Vienna, Austria, 3–8 May 2026, EGU26-16776, https://doi.org/10.5194/egusphere-egu26-16776, 2026.

GFZ provides elastic surface deformation estimates caused by atmospheric surface pressure, ocean bottom pressure, terrestrial water storage, and barystatic sea level variations on global grids. To keep those loading deformations consistent with the latest GRACE de-aliasing products AOD1B R07 we updated the loading products by using ECMWF ERA5 atmospheric forcing, the latest MPIOM ocean model, and the latest hydrological model release from LISFLOOD. We present some statistics on the new ESMGFZ loading deformation products to demonstrate its enhanced long-term stability and suitability for the realization of future high accurate terrestrial reference systems. Especially the hydrological loading component benefits now from the new LISFLOOD terrestrial water storage estimates forced with ECMWF ERA5 atmospheric data and simulated on a global high spatial resolution grid of 0.05° to resolve high deformation amplitudes in the vicinity of large rivers, lakes, and dams. The new ESMGFZ loading products cover the period 1960 to the present.

How to cite: Dill, R., Dobslaw, H., and Jensen, L.: New ESMGFZ loading products for global long-term stable elastic surface deformations consistent with ECMWF ERA5 and GRACE de-aliasing AOD1B 07, EGU General Assembly 2026, Vienna, Austria, 3–8 May 2026, EGU26-17254, https://doi.org/10.5194/egusphere-egu26-17254, 2026.

EGU26-17316 | ECS | Orals | G3.4

Crustal uplift in the Kerguelen Islands from Sentinel-1 InSAR : A consequence of recent ice melting? 

Charlotte Spriet, Kristel Chanard, Raphaël Grandin, Étienne Berthier, Kevin Gobron, Louis-Marie Gauer, and Luce Fleitout

The Kerguelen Islands (49°S, 69°E), a volcanic archipelago in the southern Indian Ocean, have experienced substantial environmental change over recent decades, including significant retreat of the Cook ice cap. The rapid ice loss is expected to induce measurable crustal deformation.

In this study, we use the complete archive of Sentinel-1 SAR imagery acquired since 2015 to examine the present-day deformation field of the Kerguelen Islands. Our small-baseline InSAR time-series analysis reveals a broad ~ 100 km-wide pattern of crustal uplift centered on the Cook ice cap, reaching up to ~ 6 mm/yr. 

To investigate the physical processes driving this uplift, we combine observed change in ice elevation inferred from multiple Digital Elevation Model over the 2015-2025 period with local estimates of shallow elastic properties derived from seismic experiments. Using a layered Cartesian elastic Earth model, we predict the surface deformation resulting from present-day unloading of the Cook ice cap, and compare model predictions to the InSAR-derived deformation field.

We then explore time-dependent deformation scenarios by considering viscoelastic deformation of the solid Earth induced by a range of plausible ice-loss histories over recent decades, and show that recent ice melting in the Kerguelen island can be used to place constraints on the rheology of the Earth’s upper mantle at decadal timescales. Finally, given the volcanic setting of the Kerguelen Islands, we also investigate whether magmatic sources could contribute to the observed long-wavelength uplift pattern.

Overall, this work highlights the potential of InSAR observations in remote subpolar environments to quantify ice-driven deformation and to infer solid Earth rheological properties on decadal timescales.

How to cite: Spriet, C., Chanard, K., Grandin, R., Berthier, É., Gobron, K., Gauer, L.-M., and Fleitout, L.: Crustal uplift in the Kerguelen Islands from Sentinel-1 InSAR : A consequence of recent ice melting?, EGU General Assembly 2026, Vienna, Austria, 3–8 May 2026, EGU26-17316, https://doi.org/10.5194/egusphere-egu26-17316, 2026.

EGU26-18216 | Orals | G3.4

Enhanced mass balance of Antarctica from RINGS airborne grounding line survey 

Rene Forsberg, Carl Leuschen, Andreas Stokholm, Jilu Li, Tim Jensen, Emily Arnold, and Fernando Rodriguez-Morales

Determining the mass balance of Antarctica by satellite gravimetry, altimetry and input-output methods is still suffering from large discrepancies between methods, especially for East Antarctica. Error sources for the different estimation methods include GIA for GRACE/GRACE-FO, firm compaction for satellite altimetry, and poorly known interior snow fall and grounding line mass flux for outlet glaciers in the input-output method. To narrow down uncertainties for the latter, an international SCAR project “RINGS” was initiated in 2023, aiming as a primary goal to cover all major unmapped outlet glaciers with new radar ice thickness data in the coming years. A unique multi-disciplinary airborne remote sensing RINGS campaign was carried out as part of a first circumnavigation of Antarctica 2024/25, using a Twin-Otter as dedicated science aircraft. The airborne campaign instruments included a 30 GHz deep ice sounding radar, a 5 GHz broadband snow radar, along with scanning lidar, nadir and side-looking imagery, and gravimetry, as well as atmosphere monitoring sensors for chemistry and aerosols. In the presentation we outline the results of the RINGS airborne campaign, the impact on the input-output method of the new outlet glacier thicknesses, and compare the changes to current GRACE/GRACE-FO mass balance results.

How to cite: Forsberg, R., Leuschen, C., Stokholm, A., Li, J., Jensen, T., Arnold, E., and Rodriguez-Morales, F.: Enhanced mass balance of Antarctica from RINGS airborne grounding line survey, EGU General Assembly 2026, Vienna, Austria, 3–8 May 2026, EGU26-18216, https://doi.org/10.5194/egusphere-egu26-18216, 2026.

EGU26-20281 | ECS | Orals | G3.4

The Caspian Sea defines the recent global inland surface water storage decline 

Benjamin M. Kitambo, Mohammad J. Tourian, Peyman Saemian, Omid Elmi, Sly Wongchuig, Daniel Moreira, Maurício C.R Cordeiro, Ayan Santos Fleischmann, Raphael M. Tshimanga, Frederic Frappart, Catherine Prigent, and Fabrice Papa

The quantification of inland surface water storage anomaly (SWSA) and its spatial-temporal variability across rivers, streams, lakes, reservoirs, floodplains, and wetlands is crucial for understanding the role of continental water in the global hydrological and biochemical cycles. Such knowledge is also essential for sustaining human societies and ecosystems. For more than a decade, significant efforts have been devoted to characterising SWSA in some major river basins and globally for only some types of water bodies. However, global SWSA for all surface water bodies simultaneously has not yet been quantified, and its long-term behavior has not yet been investigated. 

Here, we present the first global estimates of SWSA and investigate its long-term behaviour from 1992 to 2020. This is achieved by benefiting from the integration of multi-mission global satellite products, including satellite-derived Surface Water Height (SWH) from nadir altimeters and Surface Water and Ocean Topography (SWOT). Two methods have been coupled to estimate SWSA over each type of surface water body. The first one, a hypsometric curve method, consists of the combination of surface water extent (from the Global Inundation Extent from Multi-Satellite (GIEMS-2 dataset)) with topographic data from the global Digital Elevation Model (DEM), namely Forest And Buildings removed Copernicus DEM (FABDEM). The second one, based on the lake water level – area storage model, combined the simultaneous lake surface water extent and SWH. Our new SWSA dataset agrees well with other existing regional SWSA estimations.

Our results highlight the relevance of the Caspian Sea system in driving the recent global SWSA decline. At the global scale, results including the Caspian Sea provide a significant negative trend of -14 km3 yr-1. Conversely, the exclusion of the Caspian Sea shows a positive trend at 6 km3 yr-1. 

The newly developed global satellite observation-based SWSA dataset enables novel insights as a new source of information for hydrological and multidisciplinary sciences, including data assimilation, land–ocean exchanges, and water management. Moreover, this global dataset is a benchmark of SWOT-based storage products and their evaluation and validation.

How to cite: M. Kitambo, B., J. Tourian, M., Saemian, P., Elmi, O., Wongchuig, S., Moreira, D., C.R Cordeiro, M., Santos Fleischmann, A., M. Tshimanga, R., Frappart, F., Prigent, C., and Papa, F.: The Caspian Sea defines the recent global inland surface water storage decline, EGU General Assembly 2026, Vienna, Austria, 3–8 May 2026, EGU26-20281, https://doi.org/10.5194/egusphere-egu26-20281, 2026.

Variations in surface temperature and groundwater pressure within aquifer systems generate internal thermoelastic and poroelastic strain in the shallow subsurface, producing surface deformation and crustal stress perturbations. We develop a general mathematical framework to compute surface displacements and stresses at depth driven by internal strain, accounting for realistic mechanical properties of the Earth, including depth-dependent layering and lateral heterogeneities. 
We show that variations in surface temperature induce deformation below layers affected by internal strain and surface horizontal displacements that scale with the Young’s modulus of the shallow layers where internal strain occurs. Because these layers generally have weak elastic moduli across continental regions (soils, weathered rock, etc.), long-wavelength thermoelastic horizontal deformation is predicted to be negligible. In contrast, vertical displacements driven by thermal expansion within shallow weak layers are expected to reach the millimeter level, implying that thermoelastic effects should be considered when interpreting GNSS signals, in particular at the annual timescale.
At regional scale, lateral contrasts in elastic properties, such as transitions from bedrock to sedimentary basins or across fault damage zones, can produce annual thermoelastic horizontal displacements up to a few mm. The associated annual thermoelastic stress perturbations at depths of a few km may reach several kPa, locally exceeding stresses induced by seasonal hydrological loading, suggesting a potential contribution of surface temperature forcing observed seasonal modulation of seismicity. Over longer timescales, progressive climate-driven warming may also cause non-negligible stress perturbations in intraplate regions. 
Using the same formalism, we investigate deformation and stresses induced by poroelastic pressure variations in aquifer systems. We show that for 10 m variations of the water table, vertical displacements of a few mm to a few cm are expected and lateral variations of elastic properties can generate horizontal deformation of a few mm and crustal stress perturbations of several kPa.

How to cite: Chanard, K. and Fleitout, L.: Thermoelastic and poroelastic deformation of the solid Earth driven surface temperature and groundwater level variations, EGU General Assembly 2026, Vienna, Austria, 3–8 May 2026, EGU26-20492, https://doi.org/10.5194/egusphere-egu26-20492, 2026.

EGU26-20596 | Posters on site | G3.4

Evaluating different-scale hydrological corrections against high-precision terrestrial gravity time series at the Geodetic Observatory Wettzell, Germany 

Anna Winter, Marvin Reich, Patricio Yeste, Ezequiel D. Antokoletz, Andreas Güntner, and Hartmut Wziontek

Hydrological monitoring methods usually observe water storage changes in specific depths or for a limited number of storage compartments and are often representative for a small volume only. In contrast, gravity measurements are sensitive to mass changes as a spatially integrated signal. This makes them a valuable complementary tool for monitoring total water storage changes. The hydrological contribution to the time-variable gravimetric signal often plays a major role for the overall signal dynamics. Nevertheless, there is still a lack of understanding the influence of the local hydrological dynamics at many terrestrial gravity stations. Thus, advancing the hydrological corrections of gravity signals is highly valuable for improving the interpretation of gravity measurements with respect to other processes of interest, e.g., geodynamic, atmospheric or ocean-loading effects. At the same time, high-precision gravity measurements provide a reliable validation to mass-variations as represented by hydrological models.

In this case study, we consider the Geodetic Observatory Wettzell (GOW), located in the river Regen catchment in a low mountain range in East Bavaria, Germany. Here, long-term stable records of superconducting gravimeters (SGs) are available at three different points at the observatory within a distance of about 200 meters. Moreover, an extensive hydrological sensor network has been operated at GOW for more than a decade, which allows for a precise consideration of local effects. Dividing the hydrological effects into local, regional and global contributions, the regional component is calculated based on the mesoscale Hydrologic Model (mHM, Helmholtz Centre for Environmental Research – UFZ), implemented for the river Regen catchment with a spatial resolution of one kilometer and forced with national and global meteorological data sets. Global contributions are considered from various models, including MERRA-2 and several GLDAS solutions.

To assess the efficiency of a small-scale versus a large-scale approach for hydrological corrections, we evaluate all hydrological contributions against gravity residuals, after precise removal of tides, atmospheric, non-tidal ocean loading and polar motion effects. We focus on the consistent combination of each contribution and the impact of local influences, e.g., finely resolved topography in the vicinity of the gravimeters and the effect of buildings. First results show that changing the approach for, or neglecting the local contribution can easily double the total hydrological effect. This emphasizes the importance of carefully considering local effects in the hydrological gravity modelling, in particular at stations with a marked subsurface complexity and heterogeneity like GOW.

How to cite: Winter, A., Reich, M., Yeste, P., Antokoletz, E. D., Güntner, A., and Wziontek, H.: Evaluating different-scale hydrological corrections against high-precision terrestrial gravity time series at the Geodetic Observatory Wettzell, Germany, EGU General Assembly 2026, Vienna, Austria, 3–8 May 2026, EGU26-20596, https://doi.org/10.5194/egusphere-egu26-20596, 2026.

EGU26-21216 | Posters on site | G3.4

Towards the coupling of a glacier and a hydrological model (OGGM and OS LISFLOOD) for improved loading estimations 

Henryk Dobslaw, Robert Dill, and Laura Jensen

Modelling crustal loading deformations is crucial for various geodetic applications, including the realization of precise and stable terrestrial reference frames. Commonly, hydrological, atmospheric and oceanic models are used to predict surface deformations. But also cryospheric deformations are not negligible considering the accelerating melting of glaciers, and glacier models exist to estimate cryospheric mass variations. However, it is not appropriate to just complement the existing hydrological model with the glacier model estimates as part of the glacier induced deformations are already taken into account by the hydrological model via simplified snow routines, which would lead to double-counting of masses.

A consistent way to consider glacier mass variations in deformation studies would be to couple a hydrological model with a glacier model. While on a basin scale this has been done before, large-scale or even global coupling approaches are still rare partly due to the heterogeneous glacier behavior and relatively small extent of glaciers (often smaller than the grid cell size of the global model). The Open Global Glacier Model (OGGM) is designed for global glacier modelling, and thus, a suitable candidate for a global coupling. Here we present first steps towards coupling OGGM with OS LISFLOOD, an open-source global hydrological model running with a global 0.05° spatial resolution previously used for geodetic applications.

As a first case study, we chose the Fraser river basin in North America. We initially conduct model runs separately with OGGM for selected glaciers contained in the study area, and with OS LISFLOOD to obtain mass storage estimates particularly for the snow compartment. Comparison of both model results gives an impression of the potential double-counting of mass if both models were applied separately, and reveals challenges in a possible coupling workflow. For example, OGGM output is stored per glacier, and thus has to be summed per grid cell in order to pipeline it to grid-based OS LISFLOOD. Furthermore, OS LISFLOOD would have to be adjusted to take input from OGGM in glaciated regions with varying extent.

How to cite: Dobslaw, H., Dill, R., and Jensen, L.: Towards the coupling of a glacier and a hydrological model (OGGM and OS LISFLOOD) for improved loading estimations, EGU General Assembly 2026, Vienna, Austria, 3–8 May 2026, EGU26-21216, https://doi.org/10.5194/egusphere-egu26-21216, 2026.

EGU26-22109 | ECS | Orals | G3.4

Remote Sensing-Based Framework for Detecting and Interpreting Permafrost Terrain Hydrologic Connectivity 

David Richards IV, Trina Merrick, Robert Liang, Andrei Abelev, Michael Vermillion, Maya Maciel-Seidman, and Sofia Grossman

Arctic coasts are among the most vulnerable landscape on Earth, where periglacial terrain undergoes thermal contraction and expansion through seasonal freeze–thaw cycles. Along the Utqiaġvik (formerly Barrow), Alaska coastline, shifting thermal regimes have accelerated ice wedge degradation, influenced by the evolution of polygonal trough networks. However, accurately mapping trough structure, variability, and hydrologic connectivity across spatial scales remains challenging. This study integrates high-resolution remote sensing and terrain modeling to investigate the relationship between surface hydrology and ice wedge polygon morphology. Using a 0.5 m resolution LiDAR-derived digital elevation model (DEM), ice wedge polygons were manually delineated and compared with Thiessen (Voronoi)  polygons to evaluate differences in structure, spatial extent, and representation of natural variability. Intersection analyses revealed significant discrepancies in boundary alignment and area estimates between the two approaches. Hydrologic influences on polygon development were assessed through compound terrain analysis, drainage network extraction, and surface flow modeling. Results show strong spatial correspondence between modeled flow paths and mapped trough networks, indicating that surface hydrology plays a key role in ice wedge thaw and trough evolution. Calculated hydrologic and morphometric parameters suggest high runoff potential, driven by flat terrain, permafrost-limited infiltration, dense drainage networks, and short overland flow paths. High TWI (> 12) and SPI (> 60) values mark zones of concentrated surface saturation and flow accumulation, often coinciding with trough depressions. Despite high runoff potential, minimal gradients lead to slow-moving flow and persistent surface ponding, contributing to widespread wetland formation. This integrated approach demonstrates the value of combining high-resolution topographic data with hydrologic modeling to improve detection and interpretation of permafrost terrain features. The framework developed offers a scalable method for monitoring Arctic terrain dynamics and enhances remote sensing applications for assessing permafrost vulnerability.

How to cite: Richards IV, D., Merrick, T., Liang, R., Abelev, A., Vermillion, M., Maciel-Seidman, M., and Grossman, S.: Remote Sensing-Based Framework for Detecting and Interpreting Permafrost Terrain Hydrologic Connectivity, EGU General Assembly 2026, Vienna, Austria, 3–8 May 2026, EGU26-22109, https://doi.org/10.5194/egusphere-egu26-22109, 2026.

EGU26-631 | ECS | Posters on site | G3.1

Length of Day Variability and Climate Indicators: Insights from ENSO Events  

Dominika Staniszewska and Małgorzta Wińska

The interplay between the length of day (LOD) and the El Niño–Southern Oscillation (ENSO) has been investigated in geophysical research since the 1980s. LOD, defined as the negative time derivative of UT1-UTC, is intrinsically linked to the Earth Rotation Angle (ERA), a fundamental Earth Orientation Parameter (EOP).

ENSO, a dominant climate mode in the tropical eastern Pacific, substantially influences tropical and subtropical regions. Extreme ENSO episodes are associated with significant hydroclimatic anomalies across multiple regions, including severe droughts and floods. These events evolve over extended incubation periods, during which interannual fluctuations in LOD and the angular momentum of the atmosphere (AAM), ocean (OAM), and lithosphere/hydrogeosphere (HAM) are modulated by complex ocean–atmosphere interactions.

Key manifestations of ongoing climate change, such as rising global temperatures and sea levels, are strongly modulated by ENSO. Interannual variability in global mean sea surface temperature (GMST) and global mean sea level (GMSL) further reflects Earth's rotational dynamics changes.

This study aims to elucidate the interannual (2–8 years) couplings between LOD, AAM, OAM, HAM, and selected climate indices, including the Southern Oscillation Index (SOI), Oceanic Niño Index (ONI), GMST, and GMSL. The influence of these climate signals on LOD from 1976 to 2024 will be assessed using advanced semblance analysis, exploring multiple methodological variants based on the continuous wavelet transform to capture correlations across both temporal and spectral domains.

A detailed understanding of these interactions enhances our knowledge of Earth’s dynamic system, informs geophysical modeling efforts, and improves the precision of applications that rely on accurate timekeeping and measurements of Earth’s rotational behaviour. 

How to cite: Staniszewska, D. and Wińska, M.: Length of Day Variability and Climate Indicators: Insights from ENSO Events , EGU General Assembly 2026, Vienna, Austria, 3–8 May 2026, EGU26-631, https://doi.org/10.5194/egusphere-egu26-631, 2026.

EGU26-4049 | Posters on site | G3.1

Estimation of surface hydrological diffusivity and atmospheric flux bias using GRACE satellite data 

Guillaume Ramillien, José Darrozes, and Lucia Seoane

Variations in terrestrial water storage (TWS), as observed by the GRACE/GRACE-FO  missions, provide unique insights into large-scale hydrological processes. However, translating these satellite observations into transport parameters such as surface diffusivity, lateral water fluxes, and groundwater recharge remains challenging. In this study, we propose using a surface diffusion-advection model coupled with a WGHM data assimilation framework of gridded GRACE solutions to estimate subsurface diffusivity and systematic precipitation–evapotranspiration biases simultaneously. The global kinematic hydrology model represents the lateral and vertical transport of water by diffusion, while GRACE observations represent the total water storage. In the steepest descent 4D Var-like procedure, the parameter gradients of the objective function are computed using the hydrological model's adjoint. Errors on derived diffusivities are also computed. The optimised parameters enable us to diagnose effective surface diffusivity and lateral water fluxes, as well as net groundwater recharge. This framework provides a physically consistent interpretation of GRACE-observed mass redistribution and offers new perspectives on large-scale hydrological transferts.

How to cite: Ramillien, G., Darrozes, J., and Seoane, L.: Estimation of surface hydrological diffusivity and atmospheric flux bias using GRACE satellite data, EGU General Assembly 2026, Vienna, Austria, 3–8 May 2026, EGU26-4049, https://doi.org/10.5194/egusphere-egu26-4049, 2026.

More than 90% of the excess energy entering the Earth system due to increased greenhouse gas concentrations is stored in the ocean within just a few years. This ocean heat storage has helped limit surface warming and modulate Earth’s radiative response, thereby influencing the global energy budget. Understanding Ocean Heat Content (OHC), including its temporal and spatial variations, is crucial for grasping global energy dynamics and constraining climate change projections.

Geodetic observations from satellite gravimetry (GRACE and GRACE-FO) and satellite altimetry enable to estimate OHC through thermal expansion, derived from sea level rise corrected for changes in ocean mass. This geodetic approach provides broad coverage and high resolution but faces challenges in resolving interannual variability. In particular, it cannot determine the depth at which heat is stored, introducing ambiguity when converting thermal expansion into OHC anomalies.

This work introduces a new OHC product that, for the first time, combines in-situ, altimetric, and gravimetric data using an inverse method. The inclusion of in-situ ARGO data helps constrain the vertical distribution of heat down to 2000 m, addressing ambiguities in the geodetic approach. By optimizing the residuals between in-situ and geodetic OHC and applying objective mapping techniques, the method produces consistent OHC fields along with associated uncertainty estimates.

The new product is validated against existing in-situ datasets. Its derivative—Ocean Heat Uptake (OHU)—is compared with CERES radiation budget data to assess the closure of the Earth’s energy balance over the ocean. The comparison shows that the ocean energy budget is closed from the top of the atmosphere (TOA) to 2000 m depth on an annual basis, with a residual of approximately 0.3 W/m² (1σ). This implies that energy anomalies greater than 0.3 W/m² can be tracked within the ocean system between TOA and 2000 m depth thanks to their signature on the Earth deformation.

How to cite: Blazquez, A., Meyssagnac, B., Fourest, S., and Duvignac, T.: Satellite gravimetry and altimetry combined with in-situ ocean temperature profiles enable to close the Earth energy budget and track yearly global energy anomalies from top of the atmosphere to the ocean, EGU General Assembly 2026, Vienna, Austria, 3–8 May 2026, EGU26-6539, https://doi.org/10.5194/egusphere-egu26-6539, 2026.

Coastal zones face increased risks from the combined effects of climate-driven sea-level rise and vertical land motion (VLM), which together determine rates of relative sea-level (RSL) change. While oceanic contributions to RSL are increasingly well monitored and projected, land subsidence (i.e., negative VLM) remains one of the least systematically observed and most spatially heterogeneous components of RSL, despite its potential to locally exceed climate-driven ocean rise by an order of magnitude. This observational gap is especially pronounced in rapidly urbanizing and data-limited regions, where sparse tide-gauge and GNSS networks hinder the identification of subsidence hotspots and their evolving impacts on coastal risks.

In this talk, I present a framework that leverages satellite geodesy as a climate observing system to resolve the spatiotemporal dynamics of land subsidence and quantify its contribution to present and future relative sea-level change, using Java Island, Indonesia, as a regional-scale case study. We generated high-spatial resolution (75 m) contemporary VLM fields from using multi-geometry Sentinel-1 interferometric synthetic aperture radar (InSAR), revealing widespread and temporally evolving subsidence patterns with rates exceeding 1 cm per year across multiple coastal and inland urban centers. While Jakarta has dominated the subsidence narrative in Indonesia, we find that several other coastal cities, including Cirebon, Pekalongan, Tegal, and Semarang, are sinking two to three times faster, with localized rates approaching 10 cm per year.

To disentangle the dominant drivers of deformation, we applied unsupervised machine-learning spatiotemporal clustering to InSAR time series, guided by geological and land-use information. This analysis reveals nonlinear and spatially heterogeneous subsidence behaviors primarily associated with groundwater extraction in urban, industrial, and agricultural regions, alongside localized deformation linked to natural processes such as volcanism. Finally, we constructed synthetic tide-gauge records at 5-km spacing along the 1,500 km northern coastline by integrating InSAR-derived VLM with satellite altimetry and probabilistic sea-level projections. These virtual gauges show that neglecting land subsidence leads to systematic underestimation of RSL change by more than 90% in some locations and that subsidence will remain the dominant contributor to RSL rise across much of the coastline through 2050.

This work illustrates how geodetic observing systems can fill critical observational gaps in coastal climate research, enabling spatially explicit, process-informed RSL estimates and providing a transferable framework for improving sea-level risk assessments in vulnerable, data-sparse regions worldwide.

How to cite: Ohenhen, L.: Resolving land subsidence contribution to present and future relative sea level change using satellite geodesy, EGU General Assembly 2026, Vienna, Austria, 3–8 May 2026, EGU26-8826, https://doi.org/10.5194/egusphere-egu26-8826, 2026.

EGU26-9263 | ECS | Orals | G3.1

Scientific Scenarios of Climate Change for Decadal Forecasts of Earth’s Surface Movements in Germany  

Nhung Le, Anna Klos Kłos, T.T.Thuy Pham, T.Thach Luong, Chinh Nguyen, and Maik Thomas

Abstract:

Climate change has been proven to exacerbate the ongoing deformations of the Earth's surface in Germany. Also, human activities such as mining, fluid extraction, and reservoir-induced seismicity cause local surface deformations. Therefore, long-term forecasts of Earth's surface movements are needed for infrastructure planning, hazard mitigation, and the sustainable management of natural resources in Germany. By applying Machine Learning (ML) and statistical analyses, we develop scientific scenarios of climate change to forecast surface movements in Germany over the next two decades. Together with Global Navigation Satellite Systems (GNSS), data from five interdisciplinary fields, including the Sun and Moon ephemerides, polar motions, surface loadings, gravity variations, and meteorology, are utilized as features for training ML-based forecast models. Our results indicate that the accuracy of regression ML models reaches millimeter levels, and the decadal forecast models produce fewer than 2% extreme values in the total predictions per year. Based on climate change scenarios, the findings reveal that the average intra-plate motions in Germany will accelerate from ~1.2 mm/yr to ~1.5mm/yr over the next two decades. The annual variations across the 346 GNSS monitoring stations are predicted to increase from 4.7mm to 5.1mm. Surface deformations will be more severe in the southeastern regions and river basins such as the Elbe, Weser, Ems, and Rhine. Significant extensions are expected in the Eifel volcanic region, while notable compressions may occur along the Upper Rhine Graben and the Saxony region in the next twenty years. Additionally, experimental functions showing the statistical distribution of Earth's surface deformation trends in Germany over the next two decades have been proposed. Potentially, the methodology in this study can also be adapted to forecast surface movements related to climate change in polar regions.

Keywords:

Climate change, Surface deformation, Movement forecast, Machine learning, GNSS

How to cite: Le, N., Kłos, A. K., Pham, T. T. T., Luong, T. T., Nguyen, C., and Thomas, M.: Scientific Scenarios of Climate Change for Decadal Forecasts of Earth’s Surface Movements in Germany , EGU General Assembly 2026, Vienna, Austria, 3–8 May 2026, EGU26-9263, https://doi.org/10.5194/egusphere-egu26-9263, 2026.

EGU26-9761 | ECS | Posters on site | G3.1

A study of the potential for using trends of GPS displacements to determine TWS trends in Poland 

Kinga Kłos, Anna Klos, and Artur Lenczuk

Permanent stations of the Global Positioning System (GPS) enable the registration of elastic deformations of the Earth’s surface that occur in response to variations in hydrological mass loads over continental areas. Analysis of long-term changes in displacements observed by a set of GPS permanent stations allows for the identification of deformations induced by long-term changes of the Terrestrial Water Storage (TWS). Densely distributed GPS stations provide adequate spatial coverage for regional scale analysis and their exact spatio-temporal analysis. We use a set of vertical displacements for the period 2010-2020 observed by 493 GPS permanent stations situated in Poland and neighboring regions, whose observations were processed by the Nevada Geodetic Laboratory (NGL). 213 of these stations exhibit more than 80% of temporal coverage with Gravity Recovery and Climate Experiment (GRACE) and GRACE Follow-On satellite missions. We use these vertical displacements and invert them using elastic Earth theory and load Love numbers to infer trends of TWS in Poland. The obtained results were compared with independent estimates of TWS trends derived from the GRACE and GRACE Follow-On missions, and other external datasets. The analysis demonstrates that GPS-observed vertical displacements provide a reliable source of information for the assessment of TWS trends in Poland.

How to cite: Kłos, K., Klos, A., and Lenczuk, A.: A study of the potential for using trends of GPS displacements to determine TWS trends in Poland, EGU General Assembly 2026, Vienna, Austria, 3–8 May 2026, EGU26-9761, https://doi.org/10.5194/egusphere-egu26-9761, 2026.

EGU26-10722 | ECS | Orals | G3.1

Benefits of future satellite gravimetry missions for characterizing extreme wet events in terrestrial water storage 

Klara Middendorf, Laura Jensen, Marius Schlaak, Julian Haas, Henryk Dobslaw, Roland Pail, Andreas Güntner, and Annette Eicker

Under the assumption that a warming climate leads to an intensification of the global water cycle, it is hypothesized that also the occurrence frequency and severity of extreme events such as droughts and floods will increase in the upcoming decades. GRACE/-FO observations of terrestrial water storage (TWS) have been used in the past to identify and analyse extreme events both on a global and regional scale. However, these analyses are restricted by the limited spatial and temporal resolution of current satellite gravimetry observations. Especially, flooding events tend to occur very locally and with short temporal (sub-monthly) extent, thus capturing them is challenging. Future satellite gravimetry missions, particularly the double-pair constellation MAGIC, are expected to significantly enhance the spatial and temporal resolution. In this study, we globally investigate the benefit MAGIC can achieve to detect wet extreme events using long-term (50 years) end-to-end simulations of GRACE-C and MAGIC.

The simulation environment is based on the acceleration approach and considers tidal and non-tidal background model errors as well as instrument noise of the acceleration and ranging instruments following the current MAGIC mission design studies. As input and reference, we use the daily output of a climate model (GFDL-CM4) from the CMIP6 archive that has been identified as a realistic representation of water storage evolution in previous studies. To explore the improved temporal and spatial resolution expected from the MAGIC constellation, we (i) compare extreme values derived from 5-daily gravity field simulations to those from monthly fields, and (ii) show how the weaker spatial filtering required for MAGIC has a positive influence on the detectability of extremes.

For the analysis two different approaches are exploited: One method focuses solely on the stochastic characteristics of the time series in terms of extreme value theory, evaluating the magnitude-frequency relationship of large TWS values by calculating expected return levels of wet extremes. The other approach builds on the fact that a 50-years simulation time series allows to derive statistically meaningful conclusions from directly comparing reference and simulation output on a time series level. We evaluate the time of occurrence of wet extremes on the basis of classification scores assessing correctly and incorrectly identified extreme events.

How to cite: Middendorf, K., Jensen, L., Schlaak, M., Haas, J., Dobslaw, H., Pail, R., Güntner, A., and Eicker, A.: Benefits of future satellite gravimetry missions for characterizing extreme wet events in terrestrial water storage, EGU General Assembly 2026, Vienna, Austria, 3–8 May 2026, EGU26-10722, https://doi.org/10.5194/egusphere-egu26-10722, 2026.

EGU26-10826 | ECS | Orals | G3.1

A global inversion for sea-level contributions from satellite data: towards improving Antarctica's representation 

Matthias O. Willen, Bernd Uebbing, Martin Horwath, and Jürgen Kusche

Variations in sea level are a globally comprehensively measurable indicator of the effect of climate change on the Earth system. Satellite geodesy provides data with global coverage to analyze sea level changes in space and time, but also to investigate the individual contributions to sea level from the subsystems oceans, continental hydrology, glaciers, ice sheets, and the solid Earth. Particularly valuable for this purpose are time-variable satellite gravity, realized by the GRACE and GRACE-FO missions, and satellite altimetry over the oceans, realized, e.g., by the Jason-1/-2/-3 and Sentinel-6 reference missions. However, previous studies show that the uncertainty of the estimated Antarctic Ice Sheet’s contribution to sea level remains large, primarily due to errors in the glacial isostatic adjustment (GIA) correction. We use a global fingerprint inversion method that evaluates GRACE and ocean altimetry data in a globally consistent framework and enables the quantification of individual contributions to sea level on a monthly basis on global grids. The inversion is additionally supplemented by observations from Argo floats. The parametrization of the contributions from steric effects, ice sheets, glaciers, hydrology, and GIA are realized by time-invariant sea-level fingerprints obtained from a priori information. This includes, e.g., the locations of mass changes or statistically obtained information from geophysical model simulations. In a methodological advancement of the inversion method, we have implemented a new parametrization of the ice mass changes (IMC) of the Antarctic ice sheet. Previously, IMC and corresponding sea level change has been estimated only on basin level for 27 large ice catchment areas, so-called drainage basins. However, this coarse parametrization of IMC prevents the inversion method from better resolving errors in the GIA correction in upcoming inversion implementations. We have therefore introduced a high-resolution parametrization based on individual grid points with a resolution of up to 50 km, resulting in up to 4755 Antarctic mass balance parameters to be estimated in a globally consistent way. In order to solve this inverse problem, we introduced altimetry over ice sheets as an additional observation at a 10 km spatial and a monthly temporal resolution. We present and discuss results from different variants of parametrization of IMC and different variants of implementation of ice altimetry observations. This methodological advancement presented here is a necessary step towards minimizing GIA-related errors when determining the sea level budget utilizing this global framework in the future.

How to cite: Willen, M. O., Uebbing, B., Horwath, M., and Kusche, J.: A global inversion for sea-level contributions from satellite data: towards improving Antarctica's representation, EGU General Assembly 2026, Vienna, Austria, 3–8 May 2026, EGU26-10826, https://doi.org/10.5194/egusphere-egu26-10826, 2026.

EGU26-10838 | ECS | Posters on site | G3.1

Impact of non-tidal loading corrections and processing strategy on Antarctic GNSS vertical time series 

Aino Schulz, Yohannes Getachew Ejigu, Jyri Näränen, and Maaria Nordman

Accurate estimation of vertical land motion in Antarctica is crucial for understanding glacial isostatic adjustment (GIA), ice mass change, and sea-level rise. However, Global Navigation Satellite System (GNSS) position time series are affected by non-tidal loading (NTL), which can obscure geophysical signals and bias trend estimates. In this study, we evaluate the performance of 11 NTL model combinations from EOST (École & Observatoire des Sciences de la Terre, Strasbourg) and ESMGFZ (Earth System Modelling Group, GFZ Potsdam) in correcting vertical GNSS time series at three East Antarctic stations in Dronning Maud Land. We analyse five GNSS solutions processed with different strategies, including precise point positioning (PPP), double-difference (DD) network solutions, and a combined product.

Our results show that NTL corrections improve time series quality in PPP-based solutions, reducing root mean square (RMS), coloured noise, and seasonal amplitudes by more than 20 % at some sites. In contrast, network-based and combined solutions exhibit limited improvements, and in some cases, corrections introduced additional variability. Among loading components, non-tidal atmospheric loading (NTAL) consistently produces the largest reductions, while additional non-tidal oceanic (NTOL) and hydrological loading (HYDL) contributions are beneficial mainly in specific GFZ model combinations applied to PPP datasets.

Our findings demonstrate that both GNSS processing strategy and NTL model choice can affect inferred vertical trends, and in some cases even change their sign. Our evaluation provides a regional assessment of widely used NTL products under Antarctic conditions, with direct implications for GIA modelling and reference frame realisation, and supports the development of more robust correction strategies for future Antarctic GNSS studies.

How to cite: Schulz, A., Ejigu, Y. G., Näränen, J., and Nordman, M.: Impact of non-tidal loading corrections and processing strategy on Antarctic GNSS vertical time series, EGU General Assembly 2026, Vienna, Austria, 3–8 May 2026, EGU26-10838, https://doi.org/10.5194/egusphere-egu26-10838, 2026.

EGU26-10903 | Posters on site | G3.1

Multi-year regional water mass solutions by inversion of hydrology-related GRACE(-FO) KBRR residuals 

Lucia Seoane, Guillaume Ramillien, and José Darrozes

Our analysis presents 10-day water mass solutions estimated from both GRACE and GRACE-FO KBR Range (KBRR) residuals for continental hydrology using GINS software developed by the CNES/GRGS group.  The inter-satellite velocity residuals have been converted into along-track differences of gravity potential using the energy balance approach. Maps of Equivalent Water Height (EWH) are obtained by inversion of these potential differences onto juxtaposed surface elements over the region of interest or time coefficients of designed orthogonal Slepian functions. This latter band-limited representation offers the advantage of reducing  drastically the number of parameters to be fitted and the computation time. We also used another type of orthogonal basis functions, as well as decomposition using anisotropic wavelets. These functions require larger computing resources but have the advantage of being adapted to the shape of the studied watersheds for improving hydrology variation survey locally. All of these regional solutions are compared to spherical harmonics and mascons series of existing Level-2 solutions for validation. The patterns shown in the proposed regional solutions reveal dominant seasonal cycles of water mass in the large tropical basins (e.g. Amazon,  Nil and Congo), as well as extreme events such as floods and droughts.

How to cite: Seoane, L., Ramillien, G., and Darrozes, J.: Multi-year regional water mass solutions by inversion of hydrology-related GRACE(-FO) KBRR residuals, EGU General Assembly 2026, Vienna, Austria, 3–8 May 2026, EGU26-10903, https://doi.org/10.5194/egusphere-egu26-10903, 2026.

EGU26-11806 | ECS | Orals | G3.1

TUD-L2B-EWH_UNC: A Monthly Global Level-2B GRACE(-FO) EWH Uncertainty Product 

Michal Cuadrat-Grzybowski and Joao G. de Teixeira da Encarnacao

The Gravity Recovery and Climate Experiment (GRACE) and its successor GRACE-FO provide unique observations of Earth’s time-variable gravity field, enabling direct monitoring of mass redistribution expressed as equivalent water height (EWH). While gridded Level-2B products are widely used across hydrology, glaciology, and solid-Earth studies, uncertainty information remains fragmented or inaccessible to end users. In practice, this has led to the widespread use of empirical or ad hoc uncertainty estimates, limiting data assimilation and other geophysical applications that require spatially and temporally resolved observational error information.

We present TUD-L2B-EWH_UNC-GRACE, a globally gridded Level-2B GRACE(-FO) EWH data product that provides a comprehensive and transparent characterisation of uncertainty alongside the mass anomaly fields. Unlike conventional approaches that rely on propagation of full normal matrices or impose assumptions on error correlations, TUD-L2B-EWH_UNC combines ensemble statistics from multiple independently processed Level-2 solutions to quantify pre-processing uncertainties. These include contributions from ocean tide model differences, parametrisation strategies, and uncertainty in the Atmosphere and Ocean De-aliasing (AOD1B) background model.

Post-processing uncertainties associated with filtering, leakage, and Glacial Isostatic Adjustment (GIA) are quantified separately. Filtering-related uncertainty is evaluated using a known-pair approach, while GIA uncertainty is assessed using an ensemble of 56 published GIA models. Error fields are provided for a suite of anisotropic filtering strategies (DDK(2–7)), enabling systematic assessment of filtering choices, leakage effects, and model dependence on the total uncertainty budget.

TUD-L2B-EWH_UNC is the first Level-2B EWH dataset to deliver end-to-end, spatially and temporally resolved uncertainty fields in a user-ready gridded format. This design supports consistent uncertainty handling across hydrological, glaciological, and solid-Earth applications. Ancillary tidal corrections and climatological fits of signal and leakage-related errors are distributed separately through the companion products TUD-L2B-EWH_CLIM-GRACE and TUD-L2B-EWH_CLIM_LEAKAGE-GRACE. All datasets are publicly available (DOI: doi.org/10.4121/4fc748e8-01c7-4f06-87da-653937b078f7) via the TU Delft GRACE Portal (https://grace-cube.lr.tudelft.nl/).

How to cite: Cuadrat-Grzybowski, M. and de Teixeira da Encarnacao, J. G.: TUD-L2B-EWH_UNC: A Monthly Global Level-2B GRACE(-FO) EWH Uncertainty Product, EGU General Assembly 2026, Vienna, Austria, 3–8 May 2026, EGU26-11806, https://doi.org/10.5194/egusphere-egu26-11806, 2026.

EGU26-12466 | ECS | Posters on site | G3.1

Improving the representation of water, energy and carbon cycles in land surface modelling: Assimilation of MAGIC TWSA data 

Annika Nitschke, Jürgen Kusche, and Harrie-Jan Hendricks Franssen

The upcoming MAGIC (Mass Change and Geoscience International Constellation) mission aims to extend the current record of mass change observations with higher spatiotemporal resolution data. This study evaluates the potential of terrestrial water storage (TWS) observations from MAGIC in improving our understanding of the coupled water, energy, and carbon cycles.   

Using a synthetic data assimilation experiment, we integrate simulated MAGIC TWS data into a high-resolution (3 km) land surface model over two European study areas. These regions are selected for their strong land-atmosphere coupling, providing suitable test cases for investigating whether and how improvements in soil moisture profiles and snow cover from TWS assimilation translate to improved estimates in energy and carbon cycle variables. Our research addresses two primary objectives: (i) quantifying the added benefit of assimilating TWS changes in constraining model states, such as land surface temperature and vegetation growth, relative to a known reference, and (ii) investigating how the increased resolution of MAGIC supports an improved representation of land-atmosphere coupling, particularly during extreme drought events, using ecosystem-scale water use efficiency (the ratio of gross primary productivity to evapotranspiration) as a diagnostic of vegetation response. 

How to cite: Nitschke, A., Kusche, J., and Hendricks Franssen, H.-J.: Improving the representation of water, energy and carbon cycles in land surface modelling: Assimilation of MAGIC TWSA data, EGU General Assembly 2026, Vienna, Austria, 3–8 May 2026, EGU26-12466, https://doi.org/10.5194/egusphere-egu26-12466, 2026.

EGU26-12707 | ECS | Posters on site | G3.1

Study of changes induced by global warming in Svalbard based on spatial geodetic data and in situ geophysical measurements 

Alicia Tafflet, Joëlle Nicolas, Agnès Baltzer, Jérome Verdun, Florian Tolle, Eric Bernard, and Jean-Michel Friedt

The Svalbard Archipelago, located in the Arctic region of Norway, is extremely vulnerable to the climate change. With a current increase of 3 at 5°C in average air temperature and a change in precipitation with an increasing proportion of rain, certain negative consequences for the environment and ecosystem are inevitable. One of the most obvious signs of climate change in this region is the melting of ice, which is causing the Earth’s crust to deform. But there are other consequences, such as the loss of sea ice cover, changes in how sediment is transported and also changes in biodiversity.

These phenomena are widely studied in this region. For example, deformation of the Earth’s crust is determined using 3D positioning data acquired by GNSS across Svalbard, particularly  in Ny-Alesund. Since 2000, daily positioning time series show a strong upward component, with an average vertical velocity of between 8 to 13 mm/yr. This velocity is the Earth’s response  to various episodes of glaciation and deglaciation in the past like the last glacial maximum or the Little Ice Age, and to the current melting of ice. This current melting has also been  studied a lot at Ny-Alesund station, where glaciers are monitored to measure changes in ice height from one year to the next and calculate the glacier’s surface mass balance. This is the case for the Austre Lovenbreen, for which data has been available since 2007, showing record melting over the last ten years. The same is true for the study of the prodeltas evolution since 2009, which shows a stabilisation of almost all prodeltas since 2016.

All these phenomena are largely studied separately, but our analysis consists of interpreting all this data in order to study the possible correlation between these observations which share the same cause: climate change. In our study, we ask how we can link measurements taken at the glacier or in the underwater sediment, along with space geodesy data, to better understand the ongoing geophysical processes that mark the transition between a glacial environment and paraglacial environment.

How to cite: Tafflet, A., Nicolas, J., Baltzer, A., Verdun, J., Tolle, F., Bernard, E., and Friedt, J.-M.: Study of changes induced by global warming in Svalbard based on spatial geodetic data and in situ geophysical measurements, EGU General Assembly 2026, Vienna, Austria, 3–8 May 2026, EGU26-12707, https://doi.org/10.5194/egusphere-egu26-12707, 2026.

EGU26-12852 | ECS | Posters on site | G3.1

Quantifying mass signatures of drought and flood events using water fluxes and terrestrial water storage anomalies 

Sedigheh Karimi, Roelof Rietbroek, Marloes Penning de Vries, and Christiaan van der Tol

The Gravity Recovery and Climate Experiment (GRACE) and its follow-on mission (GRACE-FO) have been providing spaceborne observations of terrestrial water storage (TWS) changes since 2002. These observations help to understand how water fluxes change in an intensifying water cycle at watershed scales. However, the accuracy of the derived TWS anomalies depends on the choice of spatial and spectral filtering methods, which can attenuate their amplitude.

In this poster, we present our filter-free inversion scheme that estimates TWS anomalies at watershed scales from Level-2 Stokes coefficients together with their associated full error covariance matrices. We apply the scheme to the watersheds in the Greater Horn of Africa and compare the obtained TWS anomalies with the accumulated watershed-wide precipitation and evapotranspiration fluxes from the ERA5 atmospheric reanalysis, and the accumulated river discharge from GLOFAS and GEOGLOWS products. We further assess the consistency between the temporal derivatives of TWS anomalies and the corresponding water fluxes. Additionally, we quantify mass deficits and surpluses in TWS anomalies and investigate the relative contributions of atmospheric net flux (i.e., precipitation minus evapotranspiration) and river discharge to the magnitude of TWS anomalies during drought and flood events.

How to cite: Karimi, S., Rietbroek, R., Penning de Vries, M., and van der Tol, C.: Quantifying mass signatures of drought and flood events using water fluxes and terrestrial water storage anomalies, EGU General Assembly 2026, Vienna, Austria, 3–8 May 2026, EGU26-12852, https://doi.org/10.5194/egusphere-egu26-12852, 2026.

EGU26-15089 | ECS | Posters on site | G3.1

Snow Accumulation Monitoring using GNSS-Interferometric Reflectometry for Antarctica 

Laura Crocetti, Christopher Watson, Matthias Schartner, and Matt King

Antarctica plays a central role in Earth's global climate system and stores most of the planet's freshwater. However, due to the continent's remoteness and extreme conditions, reliable in situ observations of snow accumulation remain rare. This gap in measurements makes it difficult to constrain ice sheet models and accurately project Antarctica's contribution to global sea level rise. In particular, regions such as the Totten Glacier in East Antarctica are of interest due to the significant mass loss since the 1990s, dominated by changes in coastal ice dynamics. In the context of Antarctica, GNSS Interferometric Reflectometry (GNSS-IR) presents an efficient and sustainable approach to monitor changes in snow accumulation with the potential to offer insights into regional surface mass balance models.

This contribution investigates a unique in situ dataset of six GNSS stations deployed on the Totten Glacier, operated seasonally between November 2016 and January 2019. These stations were originally designed to track ice motion, but they also capture reflections from the snow surface. By applying GNSS-IR, time series of snow accumulation are generated – once with the traditional retrieval approach using the gnssrefl software, and once by testing a novel machine learning-based retrieval framework. The derived snow accumulation time series are cross-referenced with outputs from regional surface mass balance models. The results provide insights into the spatio-temporal patterns of snow accumulation over the Totten Glacier and showcase the potential of GNSS-IR for environmental sensing.

How to cite: Crocetti, L., Watson, C., Schartner, M., and King, M.: Snow Accumulation Monitoring using GNSS-Interferometric Reflectometry for Antarctica, EGU General Assembly 2026, Vienna, Austria, 3–8 May 2026, EGU26-15089, https://doi.org/10.5194/egusphere-egu26-15089, 2026.

EGU26-16019 | ECS | Posters on site | G3.1

Spatially refined global terrestrial water storage trends and annual cycles from GRACE and GRACE-FO 

Mary Michael O'Neill, Matt Rodell, and Bryant Loomis

Satellite gravimetry has revolutionized the observation of shifts in terrestrial water storage (TWS) in reponse to climate and human activities. Robust detection and attribution of these changes remain a challenge because TWS exhibits strong seasonal variability and is traditionally observed at coarse spatial and temporal resolution. Recent studies have shown that direct regression of Level-1B observations (inter-satellite range data) from the Gravity Recovery and Climate Experiment (GRACE) and its Follow-On mission (GRACE-FO) can substantially improve effective spatial resolution of regression terms, compared to popular monthly mascon products. Applying this framework, we demonstrate that stacked Level-1B regression yields spatially refined estimates of both long-term TWS trends and seasonal amplitude, improving the ability to identify regions where human land and water use alter local freshwater availability. For trend analysis, the enhanced resolution strengthens attribution of storage change to anthropogenic drivers such as irrigation, groundwater extraction, reservoir operations, and land-use change at sub-basin scales. For seasonal characterization, we show that assuming simplified representations of the annual cycle, such as stationary, symmetric, or unimodal seasonality, can enable robust recovery of mean annual TWS amplitude with substantially reduced signal attenuation and leakage. Such refinements are particularly important for applications that depend on accurate annual water budgets, including water-balance-based evapotranspiration estimation and assessments of interannual hydroclimatic variability. The spatial scale at which GRACE satellites can independently observe water resources will continue to improve as additional years of measurements become available.


How to cite: O'Neill, M. M., Rodell, M., and Loomis, B.: Spatially refined global terrestrial water storage trends and annual cycles from GRACE and GRACE-FO, EGU General Assembly 2026, Vienna, Austria, 3–8 May 2026, EGU26-16019, https://doi.org/10.5194/egusphere-egu26-16019, 2026.

EGU26-16439 | ECS | Orals | G3.1

Reconstructing terrestrial water storage anomalies based on climate data and pre-GRACE satellite observations 

Charlotte Hacker, Benjamin D. Gutknecht, Anno Löcher, and Jürgen Kusche

The Gravity Recovery And Climate Experiment (GRACE) and its follow-on mission, GRACE-FO, have observed global mass changes and transports, expressed as total water storage anomalies (TWSA), for over two decades. However, for climate change attribution and other applications, multi-decadal TWSA time series are required. This need has prompted several studies on reconstructing TWSA using regression or machine learning techniques, aided by predictor variables such as rainfall and sea surface temperature. However, the training period is limited to a couple of years, making it hard to capture interannual signals accurately. Furthermore, learned relationships between climate variables and water storage cannot be transferred straightforwardly to the past. To overcome the limitation and provide a more long-term, consistent dataset, we derive a preliminary reconstruction and combine it with large-scale time-variable pre-GRACE gravity information from geodetic satellite laser ranging (SLR) and Doppler Orbitography by Radiopositioning Integrated on Satellite (DORIS) tracking from Löcher et al. (2025). We reconstruct GRACE-like TWSA for the global land, excluding Greenland and Antarctica, from 1984 onward. We find that the seasonal cycle of our new reconstruction is consistent with that of previously published purely climate-data-based reconstructions. Moreover, in many regions, TWSA trends were markedly different in the pre-GRACE timeframe, and we thus suggest caution when interpolating GRACE-derived trends.


How to cite: Hacker, C., Gutknecht, B. D., Löcher, A., and Kusche, J.: Reconstructing terrestrial water storage anomalies based on climate data and pre-GRACE satellite observations, EGU General Assembly 2026, Vienna, Austria, 3–8 May 2026, EGU26-16439, https://doi.org/10.5194/egusphere-egu26-16439, 2026.

In existing GNSS-based terrestrial water storage (TWS) inversion studies, the PREM model is commonly adopted, and crustal structural heterogeneity is often neglected. Here, we conduct a comprehensive assessment of how different Earth models affect inversion results using both checkerboard-model experiments and continuous smooth-model experiments. The results show that, under realistic hydrological loading conditions within the study region (100°E–115°E, 25°N–40°N), inversion differences among global 1-D reference Earth models are below 2%, whereas the differences between global 1-D reference models and regional crustal models are ~11%; meanwhile, discrepancies between the two regional crustal models remain below 4%. Application to observed GNSS coordinate time series in Yunnan indicates that the spatial pattern of the annual equivalent water height (EWH) amplitude derived from GNSS is broadly consistent with that from the GLDAS hydrological model; however, the choice of Earth model can still substantially alter the magnitude of the inferred amplitude and its spatial distribution. Correlation analyses further suggest that Earth-model dependence is weak for large-scale inversions, but becomes non-negligible at smaller spatial scales. For a representative small-scale subregion (101.75°E–102°E, 22.75°N–23°N), we therefore recommend using the AK135F model to construct Green’s functions. Overall, our findings demonstrate that Earth-model selection is a key source of uncertainty in GNSS-based TWS inversion, and provide practical guidance for choosing appropriate Earth models to improve inversion accuracy.

How to cite: He, J. and Li, Z.: Impact of Earth Model Selection on Terrestrial Water Storage Inversion from GNSS Vertical Displacements, EGU General Assembly 2026, Vienna, Austria, 3–8 May 2026, EGU26-17088, https://doi.org/10.5194/egusphere-egu26-17088, 2026.

EGU26-18067 | ECS | Orals | G3.1

Constraining transient solid Earth rheology using satellite orbit perturbations to assess the dynamics of climate change 

Maxime Rousselet, Alexandre Couhert, Kristel Chanard, Pierre Exertier, and Luce Fleitout

Monitoring essential climate variables such as Sea level rise, Earth’s Energy Imbalance, and ice-mass changes relies critically on space-geodetic observations of surface deformation and variations of the gravity field.
In particular, satellite geodesy provides decades-long, globally consistent records that are fundamental for quantifying climate-driven surface mass redistribution. However, these observations integrate both mass changes from the oceans, atmosphere, cryosphere and continental hydrology and the associated solid Earth response. Isolating climate variables from geodetic data therefore requires models that reflect the solid Earth response across timescales relevant to contemporary variability.
Yet, a critical assumption underlies much of current space-geodetic standard processing: the solid Earth response to surface mass variations is treated as purely elastic, i.e. instantaneous and fully recoverable. However, there is a growing body of evidence from laboratory rock mechanics experiments and geophysical observations suggesting that the Earth’s mantle exhibits a time-dependent, recoverable anelastic response across intermediate timescales  that could significantly affect geodetic at decadal to centennial timescales.
Here, we exploit several decades of Satellite Laser Ranging (SLR) observations towards passive spherical satellites to constrain key parameters governing the time-dependent mantle anelasticity. Owing to long-term measurements and sensitivity to low-degree gravity field variations, including solid Earth tides (C20, C30) and the pole tide (C21/S21), SLR observations are particularly well suited to probing deep Earth mantle rheology over decadal timescales.
We combine analytical orbit perturbation theory with the Hill-Clohessy-Wiltshire equations to quantify the sensitivity of the SLR observables to rheology and to choose an optimal parametrization. We then numerically estimate the solid Earth transient rheological properties from the SLR time series using an anelasticity framework consistent with seismic attenuation theory. Our results are compared with independent rheological constraints and yield a new set of frequency-dependent Love numbers that capture the Earth’s mantle transient rheology across decadal timescales.
We further show that accounting for this  transient rheology by incorporating the corresponding frequency-dependent Love numbers into the modeling of solid Earth tides, pole tide and surface loading-induced deformation, introduces systematic differences in climate-relevant geodetic time-series, including  satellite altimetry sea level rise estimates and ocean mass trends derived from satellite gravimetry.
More broadly, our results show that as space geodetic records become longer, data processing cannot rely solely on an  elastic solid Earth assumption. Instead, it must account for solid Earth transient rheology and the fact that geodetic observables will increasingly depend on the cumulative loading history, strengthening the need for interdisciplinary geodetic, geophysical and climate studies.

How to cite: Rousselet, M., Couhert, A., Chanard, K., Exertier, P., and Fleitout, L.: Constraining transient solid Earth rheology using satellite orbit perturbations to assess the dynamics of climate change, EGU General Assembly 2026, Vienna, Austria, 3–8 May 2026, EGU26-18067, https://doi.org/10.5194/egusphere-egu26-18067, 2026.

EGU26-18146 | ECS | Posters on site | G3.1

Uncertainties in Antarctic elevation change estimates by comparing radar and laser altimetry 

Maria T. Kappelsberger, Johan Nilsson, Martin Horwath, Veit Helm, Alex S. Gardner, and Matthias O. Willen

Since 1992, surface elevation change estimates of the Antarctic Ice Sheet (AIS) have been derived from satellite radar altimetry. However, large uncertainties remain due to local topography and the time-variable signal penetration into snow and firn. The unprecedented accuracy of measurements from the ICESat-2 satellite laser altimetry mission, launched in 2018, now enables inter-comparison with radar altimetry results. The primary goal of this study is to improve understanding of the uncertainties in AIS volume and mass balance estimates by quantifying how results from ICESat-2 and the CryoSat-2 radar altimetry mission diverge under different processing regimes. To do so, we analyse coincident ICESat-2 and CryoSat-2 measurements over the 6.9 million km² area of the relatively flat and large AIS interior, where topography-related errors are small. We apply a suite of state-of-the-art correction methods to the CryoSat-2 measurements, including multiple retracking algorithms and empirical corrections for the time-variable surface and volume scattering of the radar signal. From April 2019 to October 2024, ICESat-2 observations show a thickening of 97 ± 4 km3 yr−1, coincident with excess snowfall in this period. CryoSat-2 solutions indicate systematically lower thickening rates than ICESat-2. The smallest bias (0.6 ± 1.0 cm yr−1 or 42 km3 yr−1) between the results from the two missions is found when using the AWI-ICENet1 convolutional neural network retracker. One of our hypotheses is that the systematic radar-laser differences might be due to residual errors related to the time-variable radar penetration, particularly affected by the heavy snowfall events in recent years. While further work is needed to test this hypothesis, our study demonstrates both the challenges of resolving subtle, long-term surface mass balance trends using radar altimetry and the value of joint laser-radar analyses for improving AIS volume and mass balance estimates.

How to cite: Kappelsberger, M. T., Nilsson, J., Horwath, M., Helm, V., Gardner, A. S., and Willen, M. O.: Uncertainties in Antarctic elevation change estimates by comparing radar and laser altimetry, EGU General Assembly 2026, Vienna, Austria, 3–8 May 2026, EGU26-18146, https://doi.org/10.5194/egusphere-egu26-18146, 2026.

EGU26-18337 | ECS | Orals | G3.1

Impact of NGGM and MAGIC on Sea Level and Energy Budgets Closure 

Ramiro Ferrari, Julia Pfeffer, Marie Bouih, Benoît Meyssignac, Alejandro Blazquez, and Ilias Daras

The SING project aims to evaluate the added value of the NGGM and MAGIC missions for scientific applications and operational services in hydrology, ocean sciences, glaciology, climate sciences, solid earth sciences, and geodesy. Using a closed-loop simulator with a comprehensive description of instrumental, ocean tide, dealiasing and toning errors, synthetic observations of the gravity field have been generated to assess the observability of mass changes occurring in the atmosphere, ocean, hydrosphere, cryosphere, and solid earth for different mission configurations, including GRACE-C-like (single polar pair), NGGM (single inclined pair), and MAGIC (double pair). 

The synthetic gravity observations have first been used to assess the closure of the sea level budget. With historical GRACE, altimetry, and Argo data, global sea level budget closure is achieved with an accuracy of 0.3–0.4 mm/yr (2003–2015). Using VADER-filtered simulations, all three configurations contribute <0.1 mm/yr to the global mean sea level error. NGGM and MAGIC maintain this accuracy even without filtering, unlike GRACE-C. At regional scales, NGGM and MAGIC notably improve significantly the sea level budget closure, especially at seasonal and interannual timescales, though gains for decadal trends remain modest. 

The synthetic gravity observations were also used to assess the closure of the global energy budget. Historical gravimetry, altimetry, and Argo data yield global mean ocean heat uptake (GOHU) accuracy of 0.2–0.3 W/m² (2003-2015). With VADER-filtered simulations, GRACE-C-like missions contribute up to 0.19 W/m² uncertainty, while NGGM and MAGIC improve this by 30–40%, achieving ~0.12–0.13 W/m² accuracy. They also enhance the stability and temporal consistency of GOHU retrievals. Regionally, NGGM and MAGIC outperform GRACE-C by up to 80% in recovering ocean heat content changes at mid-latitudes (30–60° N/S). Slightly better results are obtained with NGGM due to the use of mission error covariance information in the VADER filter. NGGM and MAGIC recover mean and temporal variations in ocean heat uptake at regional scales with up to 50% higher accuracy than GRACE-C.
The NGGM and MAGIC missions will substantially enhance the accuracy, spatial and temporal resolution of gravity-based observations of sea level changes and its drivers. These improvements strengthen global climate assessments, support the evaluation of mitigation policies, and improve climate model validation. In particular, sustained and redundant monitoring of ocean heat uptake would provide an early and robust indicator of changes in radiative forcing, preceding detectable stabilization of global temperatures by several decades. Improved characterization of regional heat-uptake pathways also enhances projections of sea level rise, marine heat extremes, and ocean circulation changes, supporting climate risk management across coastal, marine, and ecosystem applications.

How to cite: Ferrari, R., Pfeffer, J., Bouih, M., Meyssignac, B., Blazquez, A., and Daras, I.: Impact of NGGM and MAGIC on Sea Level and Energy Budgets Closure, EGU General Assembly 2026, Vienna, Austria, 3–8 May 2026, EGU26-18337, https://doi.org/10.5194/egusphere-egu26-18337, 2026.

EGU26-18774 | Posters on site | G3.1

How is the global and regional sea level budget closed from the latest observations?  

Marie Bouih, Robin Fraudeau, Julia Pfeffer, Ramiro Ferrari, Michaël Ablain, Anny Cazenave, Benoît Meyssignac, Alejandro Blazquez, Martin Horwath, Jonathan Bamber, Antonio Bonaduce, Roshin Raj, Stéphanie Leroux, Nicolas Kolodziejczyk, William Llovel, Giorgio Spada, Andrea Storto, Chunxue Yang, and Erwan Oulhen and the ESA SLBC CCI+ team

The closure of the Sea Level Budget (SLB) is a key challenge for modern physical oceanography. First, it is essential that we ensure the proper identification and quantification of each significant contributor to sea level change through this closure. Second, it provides an efficient means to closely monitor and cross-validate the performance of intricate global observation systems, such as the satellite altimetry constellation, satellite gravimetry missions (GRACE/GRACE-FO), and the Argo in-situ network. Third, this closure reveals to be a beneficial approach for assessing how well the observed climate variables, such as sea level, barystatic sea level, temperature and salinity, land ice melt, and changes in land water storage, comply with conservation laws, in particular those related to mass and energy.

In this presentation, we will discuss the state of knowledge of global mean and regional sea level budget with up-to-date observations, encompassing 1) an up-to-date assessment of the budget components and residuals, along with their corresponding uncertainties, spanning from 1993 to 2023 in global mean and throughout the GRACE and Argo era for spatial variations; 2) the identification of the periods and areas where the budget is not closed, i.e. where the residuals are significant; 3) advancements in the analysis and understanding of the spatial patterns of the budget residuals. 

To investigate the sea level budget (SLB) misclosure, we developed an objective solution that closes the SLB globally. This approach is based on an inverse method that optimally combines the contributions to sea level, weighted by their estimated instrumental uncertainties, and draws from publications such as those by Rodell et al. (2015) and L’Ecuyer et al. (2015).

This objective method allows us to precisely identify the dates when the SLB misclosure falls outside the uncertainty estimates, as well as the contributor most likely responsible for the discrepancy. The results of this analysis will be detailed during the presentation.

A focus will be made on the North Atlantic Ocean where the residuals are significantly high. We investigate the potential errors causing non-closure in each of the components (e.g., in situ data sampling for the thermosteric component, geocenter correction in the gravimetric data processing) as well as potential inconsistencies in their processing that may impact large-scale patterns (e.g., centre of reference and atmosphere corrections). 

This work is performed within the framework of the Sea Level Budget Closure Climate Change Initiative (SLBC_cci+) programme of the European Space Agency (https://climate.esa.int/en/projects/sea-level-budget-closure/). This project was initiated by the International Space Science Institute Workshop on Integrative Study of Sea Level Budget (https://www.issibern.ch/workshops/sealevelbudget/).

How to cite: Bouih, M., Fraudeau, R., Pfeffer, J., Ferrari, R., Ablain, M., Cazenave, A., Meyssignac, B., Blazquez, A., Horwath, M., Bamber, J., Bonaduce, A., Raj, R., Leroux, S., Kolodziejczyk, N., Llovel, W., Spada, G., Storto, A., Yang, C., and Oulhen, E. and the ESA SLBC CCI+ team: How is the global and regional sea level budget closed from the latest observations? , EGU General Assembly 2026, Vienna, Austria, 3–8 May 2026, EGU26-18774, https://doi.org/10.5194/egusphere-egu26-18774, 2026.

EGU26-304 | ECS | Orals | GI2.1

Detecting Fin Whale Calls from Ocean-Bottom Seismometer Data with Deep Learning 

Jocelyn Japnanto, Alex Saoulis, Miriam Romagosa, Rita Leitão, Mónica A. Silva, Matt Graham, and Ana M. G. Ferreira

Fin whales (Balaenoptera physalus) produce low-frequency vocalisations that propagate efficiently through the ocean and seafloor, making them detectable on broadband ocean bottom seismometers (OBS). While primarily deployed for seismic studies, OBSs offer a unique and cost-effective opportunity for passive acoustic monitoring (PAM) of marine mammals in remote regions over extended periods. Traditional detection and classification of whale calls have relied on energy thresholding, cross-correlation, or matched filtering techniques. These approaches, however, may falter in performance in high-noise environments typical of OBS datasets and often require extensive manual post-processing, making them a labour-intensive process. These limitations motivate automated, noise-robust approaches capable of exploiting the growing volume of seismic data now available.

We present a deep learning framework for detecting fin whale calls from broadband OBSs surrounding the São Jorge Island in the Azores, as well as up to twenty stations of the wider UPFLOW array spanning the Azores–Madeira–Canaries region. Our method uses a semantic segmentation model that operates on spectrogram representations between 12–35 Hz, a frequency band encompassing the classic ‘20-Hz’ fin whale note and the lower frequency ‘backbeat’. The model architecture includes a ResNet-18 encoder pretrained on ImageNet with a U-Net decoder to identify calls in both time and frequency. Training was conducted on a dataset comprising of ~6 days of manually annotated spectrograms and an additional ~6 days of background-only spectrograms. Performance was evaluated using mean Intersection-over-Union and F1-score, achieving 0.65 and 0.80 respectively.

Once validated, the model was applied to months- to year-long OBS records across the region. Fin whale calls were detected at all stations, with clear seasonal patterns showing peak calling activity between October and February, consistent with known migratory patterns in the North Atlantic. Spatial differences in call characteristics and temporal patterns further revealed potential regional variations in vocal behaviour, offering insights into song plasticity and complexity.

By applying a deep learning-based detector on OBS data, we show that machine learning provides a powerful and efficient approach to automating fin whale call detection at scale. Our method processed hundreds of thousands of hours of OBS recordings and identified nearly a million calls across all stations. This large-scale detection unlocks detailed analyses of vocal behaviour, spatial distribution, and seasonal trends, deepening our understanding of their behaviour in the north-east Atlantic. Our findings not only highlight the interdisciplinary value of OBS datasets, but also the potential of machine learning in supporting PAM efforts for the conservation and management of wide-ranging marine species.

How to cite: Japnanto, J., Saoulis, A., Romagosa, M., Leitão, R., Silva, M. A., Graham, M., and Ferreira, A. M. G.: Detecting Fin Whale Calls from Ocean-Bottom Seismometer Data with Deep Learning, EGU General Assembly 2026, Vienna, Austria, 3–8 May 2026, EGU26-304, https://doi.org/10.5194/egusphere-egu26-304, 2026.

EGU26-716 * | ECS | Orals | GI2.1 | Highlight

An Integrated Digital Framework for Multi-Scale Water Security in Africa. 

Samuel Berchie Morfo and Nana Kwame Osei Bamfo

This presentation outlines a comprehensive framework of multi-scale digital solutions designed to address Africa's pressing water challenges. We explore the integration of advanced physical modelling with a diverse suite of next-generation hydrologic observations from remote sensing and in-situ networks to crowd-sourced data. The core of our approach lies in automated systems for data fusion, processing, and assimilation, leveraging machine learning and hybrid techniques to enhance model accuracy. Critically, we incorporate robust uncertainty quantification to ensure reliable outputs. These integrated components enable the development of actionable, real-time forecasting and decision support systems for water resources allocation and disaster management. We will demonstrate practical applications, including autonomous processes and embedded devices, showcasing a transformative pathway towards proactive, data-driven water governance across the African continent.

How to cite: Berchie Morfo, S. and Bamfo, N. K. O.: An Integrated Digital Framework for Multi-Scale Water Security in Africa., EGU General Assembly 2026, Vienna, Austria, 3–8 May 2026, EGU26-716, https://doi.org/10.5194/egusphere-egu26-716, 2026.

The Gross Calorific Value (GCV) indicates coal quality by measuring the total heat released during the complete combustion of the coal. Accurate GCV estimation is crucial for efficient pricing, processing, and energy performance assessment in industries. Conventional oxygen bomb calorimetry, though precise, is relatively slow and expensive for large-scale analyses. Since coal’s organic and elemental composition strongly affects its heating value, understanding this relationship can help with reliable GCV evaluation. In this study, we analyzed the mid-infrared FTIR spectra of coal and selected 56 absorption bands associated with the relevant organic and elemental constituents of coal. These were used as input features for various machine learning (ML) models to predict the GCV of coal from the Johilla coal basin in India. The ML models tested included piecewise linear regression (PLR), partial least squares regression (PLSR), support vector regression (SVR), random forest regression (RFR), artificial neural networks (ANN), and extreme gradient boosting regression (XGB). By combining the predictions from the three models (PLSR, RFR, and XGB) through a simple average, we achieved the highest accuracy (R² = 0.951, RMSE = 19.05%, MBE = 1.42%, MAE = 4.053 cal/g), indicating strong agreement between the predicted and measured values. Overall, the FTIR-based method yields results that match or surpass those of traditional laboratory techniques reported in earlier research. The GCV values predicted from the FTIR models were statistically tested using t-tests (test for mean) and F-tests (test for variance) at a 1% significance level and were found to be statistically similar to the results from the standard bomb calorimeter method. The study demonstrates that the FTIR-based approach is independent and reliable and can be used as a faster and more convenient alternative method for determining GCV, making it highly useful for quick coal quality analysis in industry.

How to cite: Vinod, A., Prasad, A. K., and Varma, A. K.: A novel method for rapid and reliable estimation of Gross Calorific Value (GCV) of Coal using mid-infrared FTIR Spectroscopy and a multi-model Machine Learning Approach, EGU General Assembly 2026, Vienna, Austria, 3–8 May 2026, EGU26-1075, https://doi.org/10.5194/egusphere-egu26-1075, 2026.

EGU26-1760 | ECS | Orals | GI2.1

Toward Robust Three-Dimensional Magnetic and Gravity Inversion Using Deep Learning 

Shiva Tirdad, Gilles Bellefleur, Fidele Yrro, Mojtaba Bavand Savadkoohi, and Erwan Gloaguen

Magnetic and gravity surveys remain among the most cost-effective geophysical tools for investigating the subsurface. They provide information on rock geometry and bulk properties at regional to deposit scale, and they have long been used to guide mineral exploration. However, turning geophysical anomalies into reliable three-dimensional property models requires inversion, a process that is inherently non-unique: multiple subsurface distributions can explain the same anomaly. Conventional approaches, such as least-squares or Bayesian inversion, can produce valuable results; however, they remain computationally demanding for large 3D models and require strong regularization choices that may bias geological interpretation.
Over the last decade, geoscientists have explored machine learning as an alternative approach. Instead of repeatedly solving forward equations, machine learning methods learn a mapping between geophysical anomalies and subsurface properties using large training libraries of synthetic examples. Early work with convolutional neural networks (CNNs) and U-Net architectures showed the concept is viable for electromagnetic and seismic data. More recent studies have shown that deep neural networks can recover magnetic susceptibility distributions from magnetic data and, in some cases, perform joint inversion of gravity and magnetic observations. Nevertheless, purely convolutional architectures often struggle to preserve long-range spatial relationships in fully three-dimensional volumes, resulting in blurred boundaries and reduced geological interpretability.
Recent advances in deep learning offer new opportunities to address these limitations. Emerging models are designed to capture long-range dependencies and preserve sharper boundaries. They have been effective in other 3D volumetric fields, such as medical imaging and seismic interpretation, but have yet to be explored for potential-field inversion.
In this study, we develop a deep-learning-based inversion method for magnetic and gravity data aimed at critical mineral exploration. The approach targets mineral systems with distinct geophysical signatures, with a focus on volcanogenic massive sulfide (VMS) environments. By combining data-driven learning with physics-informed training, the method produces reproducible three-dimensional susceptibility and density models that reduce ambiguity in subsurface interpretation. The workflow is tested using data from the Flin Flon VMS district in Manitoba, Canada, demonstrating its potential to improve targeting of buried copper-zinc mineralization and to support the integration of advanced AI methods into geoscience workflows.


How to cite: Tirdad, S., Bellefleur, G., Yrro, F., Bavand Savadkoohi, M., and Gloaguen, E.: Toward Robust Three-Dimensional Magnetic and Gravity Inversion Using Deep Learning, EGU General Assembly 2026, Vienna, Austria, 3–8 May 2026, EGU26-1760, https://doi.org/10.5194/egusphere-egu26-1760, 2026.

EGU26-3405 | Orals | GI2.1

SatWellMCQ: A Vision–Language Satellite Datasetfor MCQ-Based Image Grounding of Oil Wells 

Ahmed Emam, Sultan Alrowili, Mathan K. Eswaran, Romeo Kinzler, and Younes Samih

Monitoring oil and gas wells is essential for assessing environmental degradation and long-term impacts such as methane emissions from abandoned and orphaned wells. Satellite imagery combined with machine learning offers scalable capabilities for detecting and characterizing oil and gas infrastructure, yet progress remains constrained by the lack of multimodal, multiple-choice (MCQ) vision-language datasets that enable structured evaluation and post-training of vision-language models (VLMs) for oil well scene grounding. Existing resources are predominantly visual-only and therefore provide limited support for image grounding from satellite imagery.

To address this gap, we introduce SatWellMCQ, a vision-language dataset of expert-verified satellite imagery paired with natural-language descriptions and multiple-choice supervision for image-grounded identification and localization of oil wells. SatWellMCQ uses high-resolution multispectral Planet imagery (RGB and infrared) and text annotations that describe well type and spatial context. Each sample includes one expert-verified correct description and three semantically plausible distractor descriptions drawn from other samples, enabling structured MCQ evaluation. All samples were manually verified by a senior domain expert with 100% intra-expert agreement, ensuring accurate alignment between images, labels, and text. The dataset covers four categories relevant to oil well monitoring: active wells, suspended wells, abandoned wells, and control samples without visible wells, yielding a balanced distribution for training and evaluation. We publicly release SatWellMCQ to support research on image grounding and vision-language adaptation in satellite imagery of oil wells.

We evaluate SatWellMCQ across state-of-the-art VLMs in zero-shot and supervised fine-tuning (SFT) settings. In the zero-shot setup, performance is moderate only for large-scale models, with the best result achieved by Qwen3-VL-235B at 0.670 accuracy. Compact models transfer poorly in zero-shot evaluation (e.g., Granite~3.3~2B at 0.422 and Phi-4-multimodal-instruct~6B at 0.376), highlighting the difficulty of domain-specific oil well analysis without targeted supervision. Supervised fine-tuning on SatWellMCQ yields substantial gains for compact models: Granite~3.3~2B improves to 0.722 and Phi-4-multimodal-instruct~6B reaches 0.730, surpassing all zero-shot baselines. These results show that SatWellMCQ poses a challenging benchmark for current VLMs while enabling effective domain adaptation through structured MCQ supervision.

Overall, SatWellMCQ provides a resource for post-training and benchmarking VLMs on image grounding of oil wells in satellite imagery and supports  geoscientific monitoring tasks relevant to environmental impact assessment and methane mitigation.

How to cite: Emam, A., Alrowili, S., Eswaran, M. K., Kinzler, R., and Samih, Y.: SatWellMCQ: A Vision–Language Satellite Datasetfor MCQ-Based Image Grounding of Oil Wells, EGU General Assembly 2026, Vienna, Austria, 3–8 May 2026, EGU26-3405, https://doi.org/10.5194/egusphere-egu26-3405, 2026.

EGU26-4011 | ECS | Orals | GI2.1

Identifying valuable forest habitats for conservation in north-western Germany using AI and citizen science 

Katharina Horn, Daniele Silvestro, Christine Wallis, Pedro J. Leitao, Ender Daldaban, and Annette Rudolph

Around the globe we experience a significant biodiversity loss, mainly driven by direct anthropogenic exploitation, land use changes, and climate change. The most effective strategy to limit biodiversity loss is the designation and management of protected areas. Consequently, the European Union has adopted the EU Biodiversity Strategy for 2030, aiming to protect 30% of aquatic and terrestrial ecosystems by 2030. However, a consistent framework to designate protected areas across all EU member states is lacking. Additionally, the monitoring of biodiversity is challenged by the dynamic nature of the biological system, exacerbated by ongoing climate change, putting additional pressure on the member states in the identification of suitable areas for conservation. 

In contrast, the increasing amount of detailed geospatial and climatic data contains valuable information that can be used to optimise protected area designation. Recent developments in artificial intelligence and machine learning now provide us with powerful tools to best utilise these vast amounts of data. In this study, we develop a transparent and reproducible framework to prioritise protected areas in forests. Here we apply the CAPTAIN framework based on reinforcement learning (RL) to identify valuable forest habitats for conservation in the federal state of North Rhine-Westphalia (NRW), Germany. First, we model habitats of ten forest bird indicator species across the period of 2016-2024. Second, we use the changing habitat patterns to train a RL model that identifies 30% of the most valuable forest sites in the federal state. Finally, we model valuable forest sites under different policies (e.g., including or excluding opportunity costs for nature conservation) to illustrate how potential limitations of nature conservation management can be addressed. Our results indicate that forest sites in the south-east of NRW are most suitable for conservation. Furthermore, we find that including opportunity costs for nature conservation in the model predictions produces similarly strong outcomes for safeguarding the most endangered bird species. The framework makes use of open-source data and can be applied to any other region or country to support strategic nature conservation management.

How to cite: Horn, K., Silvestro, D., Wallis, C., Leitao, P. J., Daldaban, E., and Rudolph, A.: Identifying valuable forest habitats for conservation in north-western Germany using AI and citizen science, EGU General Assembly 2026, Vienna, Austria, 3–8 May 2026, EGU26-4011, https://doi.org/10.5194/egusphere-egu26-4011, 2026.

Geological mapping in complex metallogenic provinces often relies on band ratios and thresholding techniques. While effective for simple targets, these traditional methods struggle to capture non-linear spectral associations inherent in natural mineral mixtures and require significant prior knowledge of the target mineralogy. This study introduces a novel, data-driven unsupervised pipeline for mineral target generation, applied to the Aït Saoun region in the Moroccan Anti-Atlas, a strategic zone characterized by polymetallic occurrences (Cu, Co, Fe, Mn).

We leverage the full spectral topology of ASTER satellite imagery (VNIR-SWIR bands) rather than reduced indices. Our approach integrates topological manifold learning to reduce the high-dimensional spectral space, followed by density-based spatial clustering to delineate mineral clusters. This combination allows for the preservation of local data structure and the automated rejection of noise without human supervision.

The pipeline successfully identified spatially coherent clusters corresponding to specific hydrothermal alteration zones. It autonomously distinguished between structural iron-manganese anomalies and lithology-controlled copper mineralization a nuance often missed by standard linear ratios. The metallogenic relevance of these spectral clusters was rigorously validated through field mapping and geochemical analysis using Atomic Absorption Spectroscopy (AAS). Results confirmed economic grades in the predicted zones, yielding Copper concentrations up to 2.60% in propylitic alteration zones and Iron-Manganese oxide grades (21.94% Fe, 1.80% Mn) in tectonic corridors. Furthermore, the detection of distal barite anomalies highlights the method’s capability to map complete hydrothermal zonations.

These findings demonstrate that topological machine learning offers a robust, superior alternative to conventional remote sensing techniques for vectoring exploration targets in arid environments. By converting raw spectral data into validated metallogenic maps, this pipeline provides a scalable tool for de-risking early-stage mineral exploration in the Anti-Atlas.

How to cite: Elomairi, M. A. and El GAROUANI, A.: Automated Mineral Cluster Detection in ASTER Data Using Topological Machine Learning: A Novel Data-Driven Approach for Geological Exploration in Ait Saoun, Anti Atlas, Morocco, EGU General Assembly 2026, Vienna, Austria, 3–8 May 2026, EGU26-4179, https://doi.org/10.5194/egusphere-egu26-4179, 2026.

EGU26-4956 | ECS | Posters on site | GI2.1

Electromagnetic & Cone Penetration Test Data Fusion on Soil Characterization 

Dimitrios Madelis, Marios Karaoulis, and Philippe De Smedt

Defining subsurface soil conditions in complex coastal settings requires the use of both geophysical and geotechnical datasets, each with different resolution and sensitivity. This study combined helicopter-borne electromagnetic (HEM) data, where large areas are spatially covered with limitations to vertical resolution, with cone penetration test (CPT) data, where high resolution can be achieved while the spatial resolution often is very sparse due to drilling associated costs. Τo formulate a continuous three-dimensional model of subsurface soil properties for levee risk assessment, these datasets were integrated. HEM data provides extensive covering resistivity profiles, while CPT provides high resolution, spatially limited measurements of mechanical soil behaviour.
It is known that resistivity as a soil property depends on many parameters (mostly water quality and soil type), and there is no straightforward method to directly translate it to soil, hence the use of ML. To deal with these complexities, we employed machine learning methods – Random Forests and neural networks – to merge heterogeneous datasets and predict continuous soil behaviour indices and discrete lithological types. We propose the use of multiple features, such as spatial coordinates, depths, distance from coast, soil types and local geological conditions. After pre-processing, machine-learning models were trained to fuse the datasets to ensure spatial consistency in the coastal environment. Afterwards, the Soil Behaviour Type Index (SBT) (Robertson, 1990) was calculated using the CPT measurements and then was discretized into lithological units.
A classical machine learning algorithm (Random Forest) and a PyTorch-based neural network were trained for regression (predicting the continuous SBT index) and classification (predicting soil types) tasks, and their performance was evaluated using standard statistical and visual metrics. Final models were retrained on the full dataset to increase generalizability and robustness. The final product is to map 𝐼𝑐 values and lithological classes at every HEM point and ultimately to make a 3D subsurface soil model. The outcome for each process was validated against an 80%-20% test to ensure reasonable results.
While regression models had similar RMSE scores, classification models generally produced models with greater accuracy of dominant soil types but captured fewer underrepresented mixed lithologies. This work focuses on the interpretability of soil models through integrating data (i.e., not just purely statistical but spatial output) and ultimately continuity in the spatial domain (where engineers are most concerned). The goal of this study is to develop a framework where continuous geophysical data, collected either by helicopters or drones can be combined with additional geological boreholes and CPTs and other geotechnical information, to enable us to image the subsurface beyond resistivity. One of the products of this study serves to represent an approach to providing a better product to those grappling with levee design and safety.

How to cite: Madelis, D., Karaoulis, M., and De Smedt, P.: Electromagnetic & Cone Penetration Test Data Fusion on Soil Characterization, EGU General Assembly 2026, Vienna, Austria, 3–8 May 2026, EGU26-4956, https://doi.org/10.5194/egusphere-egu26-4956, 2026.

EGU26-5687 | ECS | Orals | GI2.1

Application of Gaussian Mixture Models for Geochemical Anomaly Detection 

Judith Jaeger, José I. Barquero, Julio A. López-Gómez, and Pablo Higueras

Geochemical prospecting is a fundamental tool in mineral exploration. Traditionally, the interpretation of geochemical data has relied on classical statistical methods, which in many cases are univariate or linear in nature and may fail to adequately capture the complex multivariate relationships among geochemical parameters. In this context, machine learning approaches offer an alternative framework for the integrated analysis of multivariate data and the identification of hidden patterns. 

This study evaluates the application of a Gaussian Mixture Model (GMM) as an unsupervised method for the identification of geochemical anomalies of potential geological interest. The analysis was conducted on a dataset of 114 soil samples collected from the southwestern sector of the province of Ciudad Real. Before the application of the GMM, an exploratory statistical analysis was performed, including the Kaiser–Meyer–Olkin (KMO) test and the Measure of Sampling Adequacy (MSA), aimed to assess the suitability of the variables for multivariate analysis. 

After conducting several experiments, the results indicate that the Gaussian Mixture Model can identify zones with anomalous values consistent with geological interest, highlighting its potential as a supportive tool in geochemical prospecting. 

How to cite: Jaeger, J., Barquero, J. I., López-Gómez, J. A., and Higueras, P.: Application of Gaussian Mixture Models for Geochemical Anomaly Detection, EGU General Assembly 2026, Vienna, Austria, 3–8 May 2026, EGU26-5687, https://doi.org/10.5194/egusphere-egu26-5687, 2026.

EGU26-6107 | ECS | Posters on site | GI2.1

Forecasting Offshore Caisson Tilt via Deep Learning: A Numerical Simulation-Based Approach Accounting for Geotechnical Uncertainty 

Saeyon Kim, Jingi Hong, Inyoung Huh, and Heejung Youn

This study presents a comparative analysis of time-series forecasting models to predict caisson tilt using early-stage monitoring data. To establish a training dataset that accounts for inherent geotechnical uncertainty, 1,000 2D numerical simulations were performed using PLAXIS2D, based on an actual design case in South Korea. To incorporate spatial variability, the subsurface was discretized into 61 independent zones: Deep Cement Mixing (33 zones), foundation rubble (6 zones), backfill rubble (10 zones), and underlying heaving soil (12 zones). Geotechnical parameters including elastic modulus (E), undrained shear strength (Su), and interface strength reduction factor (Rinter), were varied by up to 50% of their design values. Latin Hypercube Sampling (LHS) was used to assign geotechnical properties to each zone. Each case simulated a 28-stage construction sequence, with caisson tilt extracted at each stage to generate time-series data.

Four forecasting models such as ARIMA, LSTM, Temporal Convolutional Network (TCN), and an encoder-only Transformer, were evaluated. The dataset was split into 680 simulations for training, 170 for validation, and 150 for testing. Forecasting performance was assessed across varying initial observation lengths (cut = 3, 5, 10, 15, and 20 stages) to predict all remaining future stages. Results indicate that while the statistical baseline (ARIMA) showed consistently high errors regardless of observation length, with RMSE values of approximately 0.09 at cut = 3 and 0.08 at cut = 10. In contrast, deep learning models exhibited clear error reductions as more initial observations became available. Among the tested models, the TCN achieved the highest accuracy, with RMSE values of approximately 0.006 at cut = 10 and 0.004 at cut = 15. The encoder-only Transformer model also maintained stable performance for cut ≥ 10, with RMSE values below 0.01.

Acknowledgements This work was supported by the National Research Foundation of Korea (NRF) grant funded by the Korea government (MSIT) (No. 2023R1A2C1007635).

How to cite: Kim, S., Hong, J., Huh, I., and Youn, H.: Forecasting Offshore Caisson Tilt via Deep Learning: A Numerical Simulation-Based Approach Accounting for Geotechnical Uncertainty, EGU General Assembly 2026, Vienna, Austria, 3–8 May 2026, EGU26-6107, https://doi.org/10.5194/egusphere-egu26-6107, 2026.

EGU26-6766 | ECS | Posters on site | GI2.1

Rapid Bayesian Geophysical Inversion Using General Geophysical Neural Operator 

heng zhang and yixian xu

Bayesian inversion provides a rigorous framework for uncertainty quantification in geophysics, but is often computationally prohibitive due to the reliance on Markov Chain Monte Carlo (MCMC) sampling, which requires massive numbers of forward simulations. While deep learning surrogate models offer acceleration, existing architectures (e.g., CNNs, FNO, DeepONet) often struggle with fixed discretization constraints and cannot flexibly handle the irregular observation coordinates typical in field surveys.

To address these challenges, we propose the General Geophysical Neural Operator (GGNO), a novel Transformer-based architecture designed for mesh-independent operator learning. This design fulfills three fundamental requirements for forward solvers in the context of practical inversion: (1) Discretization-invariant, allowing the processing of input models with different mesh resolutions; (2) Prediction-free, enabling direct solution querying at arbitrary spatio-temporal coordinates; and (3) Domain-independent, decoupling input and output discretizations. 

We validate GGNO on Magnetotelluric (MT) forward modeling, demonstrating exceptional generalization while achieving accuracy two orders of magnitude higher than traditional methods. By integrating GGNO into a Bayesian framework, we achieve highly efficient MCMC sampling, reducing the computational time from tens of days to a few minutes, which allows for a comprehensive exploration of the posterior distribution. Applied to field data, this approach successfully recovers complex subsurface resistivity structures with rigorous uncertainty bounds. These results highlight GGNO's potential to enable high-precision subsurface imaging and robust probabilistic interpretation for complex geophysical exploration.

How to cite: zhang, H. and xu, Y.: Rapid Bayesian Geophysical Inversion Using General Geophysical Neural Operator, EGU General Assembly 2026, Vienna, Austria, 3–8 May 2026, EGU26-6766, https://doi.org/10.5194/egusphere-egu26-6766, 2026.

EGU26-7774 | ECS | Posters on site | GI2.1

Probabilistic Reconstruction of Sentinel-2 Satellite Image Time Series Using Multi-Sensor Gaussian Process Models 

Bastien Nespoulous, Alexandre Constantin, Dawa Derksen, and Veronique Defonte

Satellite Image Time Series (SITS) are a cornerstone of Earth observation, enabling long-term monitoring of environmental processes such as vegetation dynamics, land-use change, and natural hazards. However, optical satellite time series, including Sentinel-2, are frequently irregular and incomplete due to cloud cover, atmospheric effects, and acquisition constraints, which strongly limit their usability in operational monitoring systems. In contrast, Sentinel-1 Synthetic Aperture Radar (SAR) provides regular observations for any weather condition and offers complementary information for mitigating optical sensor limitations. Generating dense and reliable Sentinel-2 time series from multi-sensor observations therefore remains a critical challenge.

This work investigates Gaussian Process (GP) based statistical models for the reconstruction and densification of Sentinel-2 image time series by jointly exploiting Sentinel-1 and Sentinel-2 data. Gaussian Processes offer a flexible Bayesian framework for pixel interpolation and extrapolation. We explore GP formulations capable of handling irregular temporal sampling, multi-output dependencies, and latent variable structures, enabling the fusion of heterogeneous optical and radar observations.

An in-depth analysis of the state-of-the-art is conducted, covering multi-output Gaussian Processes, sparse and variational approximations for scalability, latent variable models (including hierarchical GP-LVMs), and inverse GP approaches based on shared latent spaces. These methods are evaluated with respect to three key challenges: ensuring spatio-temporal coherence of reconstructed images, fusing asynchronous multi-sensor observations, and maintaining computational tractability for large-scale satellite datasets.

To support experimental investigations, a representative multi-regional dataset is constructed over mainland France and overseas territories, capturing diverse climatic patterns, land-cover types, and cloud conditions, including extreme events such as flooding. 

This study establishes the methodological foundations for reconstructing dense Sentinel-2 time series conditioned on Sentinel-1 observations, with explicit uncertainty quantification. By leveraging Sentinel-1 data, the approach effectively imputes missing Sentinel-2 values while providing consistent average pixel estimates with associated uncertainty, which is critical for geoscience applications. The proposed framework contributes toward more robust Earth observation monitoring systems and the development of reliable geospatial digital twins.

How to cite: Nespoulous, B., Constantin, A., Derksen, D., and Defonte, V.: Probabilistic Reconstruction of Sentinel-2 Satellite Image Time Series Using Multi-Sensor Gaussian Process Models, EGU General Assembly 2026, Vienna, Austria, 3–8 May 2026, EGU26-7774, https://doi.org/10.5194/egusphere-egu26-7774, 2026.

EGU26-7860 | Posters on site | GI2.1

Densification and forecasting of Sentinel-2 time series from multimodal SAR and optical satellite data using deep generative models 

Véronique Defonte, Dawa Derksen, Alexandre Constantin, and Bastien Nespoulous

Sentinel-2 optical image time series are a key source of information for many Earth observation applications, including climate monitoring, agriculture, ecosystem dynamics, and land surface change analysis. Dense and regular observations are essential to accurately capture seasonal patterns, abrupt events, and long-term trends. However, in practice, Sentinel-2 time series are often sparse and irregular due to cloud cover and varying acquisition conditions. These limitations significantly complicate continuous monitoring and the analysis of surface dynamics. Moreover, beyond time series densification, there is a growing need to anticipate future optical observations to support scenario analysis, early warning systems, and predictive environmental monitoring.

To address these challenges, we propose a deep learning–based framework for densifying Sentinel-2 time series by generating plausible optical images at arbitrary past or future dates. The approach relies on multimodal satellite observations, jointly exploiting optical Sentinel-2 and radar Sentinel-1 data. Indeed, SAR measurements are insensitive to cloud cover and provide complementary structural and temporal information. This multimodal setting enables the reconstruction of missing observations and the prediction of future optical states while preserving realistic spatio-temporal dynamics.

From a methodological perspective, the model is explicitly designed to handle sparse, incomplete, and temporally misaligned multimodal time series. It operates on temporal sets of Sentinel-2 and Sentinel-1 images acquired at irregular dates around a target time. A cross-attention mechanism is used to explicitly model interactions across time and modalities, allowing the network to identify and weight the most relevant observations for generating a Sentinel-2 image at a given target date.

In addition, the proposed framework incorporates a probabilistic decoder that estimates not only the predicted Sentinel-2 image but also an associated uncertainty map. This uncertainty estimation provides valuable insight into the confidence of the generated pixels, which is particularly important for downstream applications such as anomaly detection, risk assessment, and decision-making support.

The model is evaluated across multiple geographical regions and land-cover types, demonstrating strong performance in both densification and forecasting tasks. Results show that the proposed approach successfully preserves the temporal dynamics of the scenes, notably by accurately reproducing vegetation phenology as reflected in NDVI time series. Forecasting experiments further highlight the importance of radar information: Sentinel-1 observations close to the target date allow the model to detect surface changes occurring after the last available optical image, thereby improving future predictions. Overall, the proposed method represents a step towards the densification and forecasting of Sentinel-2 time series, offering a promising direction for future methodologies aimed at continuous Earth surface monitoring and predictive analysis.

How to cite: Defonte, V., Derksen, D., Constantin, A., and Nespoulous, B.: Densification and forecasting of Sentinel-2 time series from multimodal SAR and optical satellite data using deep generative models, EGU General Assembly 2026, Vienna, Austria, 3–8 May 2026, EGU26-7860, https://doi.org/10.5194/egusphere-egu26-7860, 2026.

EGU26-8542 | Orals | GI2.1

A Big Data and Text Mining–Based Media Analysis Framework for Disaster Cause Investigation 

Jin Eun Kim, Heeyoung Shin, and Sengyong Choi

 As similar disasters and accidents continue to occur, public concern about the limitations of existing disaster response systems and the need for institutional improvement is increasing. The National Disaster Management Research Institute of Korea conducts disaster cause investigations as part of its statutory responsibilities, examining problems observed before and after disasters, institutional weaknesses, and public demands for improvement. In this context, news data provide valuable unstructured information that reflects on-site conditions, response activities, policy debates, and public opinion, and thus complement official investigation records in understanding institutional and managerial factors related to disasters.


 This study aims to develop a media analysis framework based on big data and text mining for use in disaster cause investigations. Disaster-related news articles were first collected, and a large language model (Gemini) was applied to identify and extract sentences that describe problems and suggested improvements in the stages of disaster occurrence and response. The extracted sentences were then processed using natural language processing techniques, including stopword removal and the merging of duplicate and semantically similar sentences. Based on semantic similarity, the remaining sentences were grouped to organize major issues. In addition, nouns were extracted and their frequencies were analyzed by year to identify key terms and to examine changes in topics emphasized in media coverage.
 

 Applying the proposed framework to the disaster cause investigation of the 2023 Osong Underpass Flooding Disaster conducted in 2025, we identified 21 problem items grouped into seven categories, such as insufficient pre-closure of the underpass and inadequate maintenance of river embankments. In addition, 17 improvement measures were derived in six categories, including improvements to underpass closure criteria and flood risk grading, as well as the strengthening of river management practices, and were systematically organized and proposed. The results indicate that combining news big data, text mining, and large language models can effectively structure key issues and institutional weaknesses, and can serve as a useful analytical tool for strengthening the evidence base and explanatory power of disaster cause investigations.

How to cite: Kim, J. E., Shin, H., and Choi, S.: A Big Data and Text Mining–Based Media Analysis Framework for Disaster Cause Investigation, EGU General Assembly 2026, Vienna, Austria, 3–8 May 2026, EGU26-8542, https://doi.org/10.5194/egusphere-egu26-8542, 2026.

EGU26-10174 | ECS | Orals | GI2.1

A global–hierarchical–categorical alignment framework to address sample scarcity and domain shift in crop mapping 

Jingya Yang, Qiong Hu, Mariana Belgiu, and Wenbin Wu

The scarcity and high acquisition cost of field crop samples remain a major bottleneck for applying Artificial Intelligence (AI)–driven supervised learning methods in large-scale geoscientific applications such as crop type mapping. Meanwhile, crop phenology and, consequently, spectra-temporal characteristics of the same crop type present significant interannual and regional variations due to the differences in local conditions and human activities, such as climatic, soil properties and farming practices. This causes the “domain shift” challenge. Therefore, directly applying a classification model trained in a specific region and year to a new region or year inevitably leads to poor prediction performance. The gap between the abundant availability of Earth Observations imagery and the limited accessibility of training crop samples hider efficient mapping of varied crop types across large regions. To address training sample scarcity and cross-region/year domain shift in large-scale crop type mapping, we propose a transferable crop mapping method named Global-Hierarchical-Categorical feature Alignment (GHCA). GHCA integrates unsupervised domain adaptation, contrastive learning, and pseudo-labeling to achieve multi-dimensional alignment between source domain and target domain at global, hierarchical and categorical levels. The developed method enables accurate and transferable crop mapping across diverse agricultural landscapes with minimum field survey requirements. The main contributions of our study can be summarized as follows: (1) A global feature pre-alignment mechanism is introduced by calculating the Multi-Kernel Maximum Mean Discrepancy (MK-MMD) metric across different hierarchical features to align source and target domains in global and hierarchical feature spaces. This mechanism substantially improves the initial reliability of pseudo-labels generated for the target domain, providing a reliable foundation for subsequent fine-grained categorical level feature alignment; (2) A robust pseudo-label generation strategy is developed by jointly considering prediction confidence, prediction certainty, and prediction stability. Reliable pseudo-labels for target domain are selected by calculating model prediction probabilities and predictive uncertainty estimates through teacher-student model. Moreover, the Exponential Moving Average (EMA) strategy is adopted to updated model parameters in the teacher path to enable the acquisition of obtaining more stable pseudo-labels; (3) Category-wise feature alignment is achieved by integrating pseudo-labeling with contrastive learning, which explicitly pulls intra-class feature closer for the same crop types across source and target domains, while pushing inter-class feature apart for different crop types. The effectiveness of the proposed GHCA method for both cross-region and cross-year crop mapping was evaluated across five regions in China and the U.S. over a two-year timeframe. GHCA was compared with a machine learning method (RF), supervised deep learning models (DCM, Transformer, and PhenoCropNet), and transfer learning methods (DACCN, PAN, and CSTN) for cross‑year and cross‑region crop mapping. Experimental results showed that GHCA outperformed other models in most transfer cases, with OA ranging from 0.82 to 0.95 (cross-region) and 0.89 to 0.98 (cross-year), achieving an average OA increase of 6.2% and 3.5% in cross-region and cross-year experiments, respectively. These results highlight the strong potential of advanced AI methodologies to deliver robust, quantitative, and transferable solutions for complex geoscientific problems using large Earth observation datasets.

How to cite: Yang, J., Hu, Q., Belgiu, M., and Wu, W.: A global–hierarchical–categorical alignment framework to address sample scarcity and domain shift in crop mapping, EGU General Assembly 2026, Vienna, Austria, 3–8 May 2026, EGU26-10174, https://doi.org/10.5194/egusphere-egu26-10174, 2026.

This study introduces an innovative methodology for generating realistic soil prediction maps that visualise the spatial distribution of specific chemicals, achieved through the rigorous evaluation and comparison of advanced modelling techniques, including innovative modelling techniques based on the use of neural networks and multilayer perceptrons (MLPs). The Drava River floodplain was selected as the primary case study based on stringent criteria: a) intensive historical metal ore mining and metallurgical processing activities, which have left a legacy of contamination; b) distinctive geomorphological features, such as dynamic floodplains and sediment deposition zones; and c) diverse geological settings that facilitate reliable model calibration across transboundary reaches. Soil measurements were integrated with diverse geospatial datasets—derived from Digital Elevation Models (DEMs), land cover classifications, and remote sensing imagery—to enable high-resolution mapping of contaminant distributions via sophisticated predictive modelling powered by neural networks and MLPs. A novel, holistic approach was applied to simultaneously reconstruct multiple influencing processes, including erosion, sediment transport, and pollutant dispersion, across the entire study area. This comprehensive framework not only advances contamination mapping practices but also empowers the developed models to trace primary distribution pathways, quantify the true extent of affected zones, enhance data interpretability, and inform evidence-based decisions on land-use planning, remediation strategies, and environmental management in mining-impacted regions.

How to cite: Alijagić, J. and Šajn, R.: Advanced AI Soil Mapping Techniques and Transboundary Risk Assessment for the Drava River Floodplain , EGU General Assembly 2026, Vienna, Austria, 3–8 May 2026, EGU26-10465, https://doi.org/10.5194/egusphere-egu26-10465, 2026.

EGU26-11012 | Posters on site | GI2.1

Deep-learning based large-scale automated observation of earthquake surface ruptures 

Xin Liu, Shirou Wang, Xuhua Shi, Cheng Su, Yann Klinger, Arthur Delorme, Haibing Li, Jiawei Pan, and Hanlin Chen

Rapid and objective mapping of co-seismic surface ruptures is essential for post-earthquake impact assessment and for improving our understanding of fault geometry, stress transfer, and rupture processes that inform longer-term seismic hazard analyses. However, rupture mapping has traditionally relied on manual interpretation of field observations or remote-sensing data, which is time-consuming and difficult to extend consistently to large spatial extents, multiple earthquakes, and diverse data sources. Here we present an automated deep-learning framework—the Deep Rupture Mapping Network (DRMNet)—a convolutional neural network designed for end-to-end, high-precision detection of co-seismic surface ruptures from multi-sensor imagery. DRMNet is applied to four large continental earthquakes: the 2021 Mw 7.4 Maduo, 2022 Mw 6.9 Menyuan, 2001 Mw 7.8 Kokoxili, and 1905 Mw ~8 Bulnay (Mongolia) events. The framework consistently delineates both primary and subsidiary rupture structures across centimetre-scale drone imagery and metre-scale satellite data. Across diverse tectonic settings, image resolutions, and preservation states, DRMNet achieves precisions approaching or exceeding 90%. By enabling consistent rupture recognition across multiple events, sensors, and timescales, the proposed framework overcomes the event-specific and local-scale limitations of previous approaches, supporting both rapid post-earthquake response and retrospective rupture reconstruction, and laying the groundwork for standardized global surface-rupture inventories.

How to cite: Liu, X., Wang, S., Shi, X., Su, C., Klinger, Y., Delorme, A., Li, H., Pan, J., and Chen, H.: Deep-learning based large-scale automated observation of earthquake surface ruptures, EGU General Assembly 2026, Vienna, Austria, 3–8 May 2026, EGU26-11012, https://doi.org/10.5194/egusphere-egu26-11012, 2026.

EGU26-12550 | ECS | Posters on site | GI2.1

Identifying zircon provenances using domain-adversarial neural network 

Mengwei Zhang, Guoxiong Chen, Timothy Kusky, Mark Harrison, Qiuming Cheng, and Lu Wang
  • Zircon trace element geochemistry is a pivotal tool for unraveling petrogenesis and the evolutionary history of the Earth’s crust. While two-dimensional (2D) discriminant diagrams are conventionally used to identify parent rock types, the emergence of machine learning (ML) has introduced a transformative research paradigm. ML not only enhances classification accuracy but also resolves the inherent ambiguities found in traditional geochemical diagrams. However, the reliability of current ML models typically depends on the vast archives of labeled samples from the Phanerozoic. When extending research to “deep-time” samples, such as Hadean zircons, the scarcity of labeled data often forces researchers to rely on models trained exclusively on Phanerozoic datasets. This approach is prone to misclassification due to “domain shift,” caused by systematic variations in zircon trace element distributions across different geological eons. To address this challenge, we propose a Domain Adversarial Neural Network (DANN) framework tailored for zircon trace element analysis. By aligning the feature distributions of the source domain (Phanerozoic) and the target domain (Precambrian), the DANN extracts “domain-invariant yet geologically significant” high-dimensional feature representations, effectively mitigating the effects of temporal data bias. Our results demonstrate that DANN significantly outperforms traditional machine learning methods across multiple performance metrics. Furthermore, t-SNE visualization confirms that the source and target domains are effectively aligned within the feature space. When applied to ~4.3 Ga zircon samples from the Jack Hills, the model achieved a classification accuracy of 0.923. This high level of performance underscores the framework’s exceptional generalization capability for identifying unlabeled deep-time samples and its potential for broader applications in Precambrian geology. This study develops a transferable, data‑driven framework for inferring deep‑time geological processes, providing a novel methodology to address the limitations inherent in the traditional principle of uniformitarianism. Furthermore, the framework is extensible to other mineral systems (e.g., apatite, monazite), thereby opening new avenues for quantitatively reconstructing the dynamic evolution of the early Earth.

How to cite: Zhang, M., Chen, G., Kusky, T., Harrison, M., Cheng, Q., and Wang, L.: Identifying zircon provenances using domain-adversarial neural network, EGU General Assembly 2026, Vienna, Austria, 3–8 May 2026, EGU26-12550, https://doi.org/10.5194/egusphere-egu26-12550, 2026.

EGU26-13366 | ECS | Orals | GI2.1

Spatial Downscaling of Land Surface Temperature Using Sentinel-2 and Sentinel-3 Data Fusion for Agricultural Applications 

Bouchra Boufous, Fatima Ben zhair, and Salwa Belaqziz

Land surface temperature (LST) is a key variable for assessing crop thermal stress and supporting precision agriculture. However, thermal satellite products often involve a trade-off between spatial and temporal resolution. Sentinel-3 provides frequent LST observations, but its coarse spatial resolution limits its use for field-scale agricultural monitoring.

This study proposes a spatial downscaling approach for LST based on the fusion of Sentinel-3 thermal data with high-resolution multispectral information from Sentinel-2. The method exploits the inverse relationship between surface temperature and vegetation cover through the Normalized Difference Vegetation Index (NDVI). A linear regression model was developed to estimate LST at a spatial resolution of 10 m using Sentinel-2 NDVI as the primary predictor.

The approach was applied over the agricultural site of El Ghaba in the Marrakech–Safi region (Morocco), covering different crop types, including annual cereals (barley, wheat, and kerenza) and perennial olive orchards. Results show a clear negative correlation between NDVI and LST, confirming the regulatory role of vegetation on surface temperature. The downscaled LST maps reveal fine-scale spatial heterogeneity that is not detectable in the original Sentinel-3 product.

Quantitative evaluation indicates low absolute errors for annual crops (generally below 0.5 °C), demonstrating the robustness of the proposed method, while higher discrepancies observed for olive orchards highlight the complexity of perennial crop thermal behavior. This work enhances the spatial usability of satellite thermal data for agricultural monitoring and crop stress assessment.

How to cite: Boufous, B., Ben zhair, F., and Belaqziz, S.: Spatial Downscaling of Land Surface Temperature Using Sentinel-2 and Sentinel-3 Data Fusion for Agricultural Applications, EGU General Assembly 2026, Vienna, Austria, 3–8 May 2026, EGU26-13366, https://doi.org/10.5194/egusphere-egu26-13366, 2026.

EGU26-13941 | Orals | GI2.1

Why Automated Mineralogy needed an upgrade 

Rich Taylor

Automated Mineralogy – the past

The automated classification of mineral phases in rocks has been a mainstay of the Geoscience analytical community for over 40 years. While we have seen great leaps forward in AI in µCT and light microscopy/petrography, the automated capabilities for the SEM have progressed and changed very little in decades, relying heavily on outdated methods that were available at the time.

The technology come with several significant problems moving forward, including excessive hardware-software dependencies, complex mineral libraries and classifications, inconsistent user experience, and difficult workflows outside their intended use.


Recent technological advances

There are two broad shifts that are taking place across a number of microscopy and microanalysis techniques – the acquisition of more quantitative data, and the application of deep learning neural networks. As a general trend this can be thought of as building better datasets, and building bigger datasets.

EDS as a SEM-based technique is fertile territory for both of these shifts. As an analytical technique EDS is commonly applied qualitatively, or as an image based method for distinguishing regions based on chemical maps. In recent years it has become easier than ever before to calibrate systems and detectors for concentration data, meaning the SEM can generate more robust datasets without having to fall back on other techniques.

Deep Learning is a topic that covers a broad range of mathematical applications to everything from the acquisition of microscopy datasets, through to data processing and interpretation across almost all sciences. There are many different flavours of deep learning neural network (DLNN) and each type lends itself to different applications, particularly in the varied data rich environments of microscopy. DLNN are inherently hard to track exactly how they operate, but at their best should be easy to use, and easy to understand how they’ve been applied to a scientific problem.


Automated Mineralogy – the future

The introduction of both quantitative mineral chemistry and DLNN to automated mineral classification is a huge leap forward, solving many of the problems of traditional software. Detaching data acquisition from processing removes software dependencies and frees users to build their ideal system. An DLNN-driven, unsupervised data processing approach can be data led rather than user led, making it more robust and consistent across instruments and facilities. Quantitative analysis can build on the DLNN approach by allowing a “best fit” classification, removing the need for constant modification of mineral libraries, and simply allowing “textbook” globally consistent mineral compositions to drive the labelling of segmented data.

How to cite: Taylor, R.: Why Automated Mineralogy needed an upgrade, EGU General Assembly 2026, Vienna, Austria, 3–8 May 2026, EGU26-13941, https://doi.org/10.5194/egusphere-egu26-13941, 2026.

EGU26-14415 | ECS | Orals | GI2.1

Multi-agent Geochemical Literature Data Mining System 

Tianyu Yang, Karim Elezabawy, Daniel Kurzawe, Leander Kallas, Marie Traun, Bärbel Sarbas, Adrian Sturm, Stefan Möller-McNett, Matthias Willbold, and Gerhard Wörner

The increasing volume and complexity of geochemical literature pose major challenges for the sustainable curation of domain-specific databases such as GEOROC (Geochemistry of Rocks of the Oceans and Continents), the world’s largest repository of geochemical and isotopic data from igneous and metamorphic rocks and minerals, aggregating more than 41 million values from over 23,000 publications. Although GEOROC underpins a wide range of geoscientific research, the extraction and harmonization of metadata from publications still relies heavily on manual effort, which significantly limits the scalability.

In this contribution, we present a novel information extraction architecture that moves beyond linear processing pipelines toward an Large Language Model (LLM)-based multi-agent system combining document layout analysis, schema-driven reasoning, and modality-aware extraction. Unlike generic LLM approaches that treat documents as continuous text streams, our architecture adopts a "Visual-First" strategy. We utilize a layout-aware backbone (MinerU, Niu et al., 2025) to decompose PDF manuscripts into a sequence of geometrically grounded primitive blocks, each representing a localized document region with associated visual and typographic features, preserving the geometric grounding essential for interpreting complex data tables. A routing agent subsequently validates and refines the initial layout classification, dynamically dispatching blocks to specialized downstream agents for text, table, or figure processing. This adaptive routing strategy improves robustness against layout variability across journals, publication years, and formatting styles.

Central to the framework is an active schema agent that operationalizes the GEOROC metadata model. Rather than treating the database schema as a static template, this agent continuously provides extraction targets, normalization rules, unit standards, and conflict-resolution policies that guide all subsequent processing steps. Text blocks are handled by an  Optical Character Recognition (OCR) driven information extraction agent, table blocks by a table parsing agent capable of reconstructing complex table structures, and figure blocks by a visual reasoning agent designed to interpret diagrams and digitize plotted values. Each agent produces structured candidate values enriched with confidence estimates and fine-grained provenance, including page-level and bounding-box references to the original document.

The outputs of these modality-specific agents are consolidated by a merge-and-judge agent, which goes beyond simple aggregation. This agent performs cross-modal arbitration, unit harmonization, and deduplication, resolving conflicts between heterogeneous sources according to schema-defined priorities and data-quality criteria. The final result is a machine-readable JSON representation that preserves both extracted values and their evidential context.

By combining layout grounding, adaptive routing, schema-driven reasoning, and judgment-based integration, this system delivers a robust and extensible approach to large-scale metadata extraction. The framework substantially supports the curation process and strengthens GEOROC’s role as a FAIR-compliant reference infrastructure by enabling more efficient reuse of published geochemical data in future geochemical research.

References:

Niu, J., Liu, Z., Gu, Z., Wang, B., Ouyang, L., Zhao, Z., ... & He, C. (2025). Mineru2. 5: A decoupled vision-language model for efficient high-resolution document parsing. arXiv preprint arXiv:2509.22186.

How to cite: Yang, T., Elezabawy, K., Kurzawe, D., Kallas, L., Traun, M., Sarbas, B., Sturm, A., Möller-McNett, S., Willbold, M., and Wörner, G.: Multi-agent Geochemical Literature Data Mining System, EGU General Assembly 2026, Vienna, Austria, 3–8 May 2026, EGU26-14415, https://doi.org/10.5194/egusphere-egu26-14415, 2026.

EGU26-14874 | ECS | Posters on site | GI2.1

Quartz grain microtexture analysis using Artificial Intelligence: application to tsunami and storm deposits provenance studies 

Natércia Marques, Pedro Costa, and Pedro Pina

Quartz grain surface microtextures observed by scanning electron microscopy (SEM) provide important information on sediment transport history, depositional processes and sediment provenance. Traditionally, the interpretation of these features has relied upon qualitative visual assessment—an approach deeply rooted in expert judgement and cumulative experience. While fundamental, this methodology is inherently susceptible to subjectivity and inter-analyst variability. To counter balance this problem, we explore image-based classification approaches (utilizing Deep Learning frameworks) as a tool to support quartz microtextural analysis and assist in the identification of likely depositional environments thus establishing sediment provenance relationships.

A dataset of 3 367 SEM images was compiled, spanning a diverse range of sedimentary contexts: aeolian dunes, beach faces’, alluvial systems, basal sands, and nearshore, alongside with high-energy deposits from storm and tsunami events. Based on this dataset, five classification models were developed. Three were designed to discriminate between the full set of seven depositional classes, while two focused on a reduced classification scheme comprising four classes (alluvial, beach, dune and nearshore). All models were optimised using an increasing number of training epochs to assess the stability and evolution of classification performance. The results obtained were further examined in comparison with SandAI, an existing tool for microtexture classification, to evaluate its behaviour when applied to new sedimentary contexts and datasets acquired under different conditions.

The most consistent classification results were obtained for environments characterised by well-preserved and distinctive mechanical microtextures (e.g. aeolian sediments). Conversely, while environments defined by overlapping processes occasionally yielded higher nominal accuracies in QzTexNet (CNN-based models developed within the scope of this work), this is potentially attributed to their over-representation in the dataset. Analysis of classification outcomes indicates that microtextural overprinting, dataset imbalance and variations in image quality reduced the visibility of diagnostic features, thereby complicating the differentiation of depositional settings. Nevertheless, the data suggests that our models successfully capture sedimentologically meaningful patterns when surface textures remain clear. While SandAI showed stable performance within its original scope, its accuracy was limited, peaking at 47% for its target environments and dropping significantly when faced with complex deposits like tsunami or nearshore grains. In contrast, the newly developed QzTexNet models showed slightly more encouraging results, reaching accuracies of around 55% and demonstrating a steady improvement through successive refinements.

Ultimately, these findings demonstrate that automated classification offers a powerful complement to traditional analysis, particularly in ensuring reproducibility across large-scale datasets. Solely based on our database, it was observed that challenges regarding dataset equilibrium and textural complexity persist, targeted methodological refinements and supervised training hold significant potential. Such advancements represent a promising frontier in sedimentary provenance studies, particularly for the rigorous identification of deposits linked to extreme geological events.

This work is supported by FCT, I.P./MCTES through national funds (PIDDAC): LA/P/0068/2020 (https://doi.org/10.54499/LA/P/0068/2020), UID/50019/2025(https://doi.org /10.54499/UID/PRR/50019/2025), UID/PRR2/50019/2025). Finally this work is a contribution to project iCoast (project 14796 COMPETE2030-FEDER-00930000).

How to cite: Marques, N., Costa, P., and Pina, P.: Quartz grain microtexture analysis using Artificial Intelligence: application to tsunami and storm deposits provenance studies, EGU General Assembly 2026, Vienna, Austria, 3–8 May 2026, EGU26-14874, https://doi.org/10.5194/egusphere-egu26-14874, 2026.

Wildfires are increasingly reshaping landscapes across the U.S., disrupting hydrogeologic processes such as runoff, infiltration, and sediment transport—posing major challenges for streamflow prediction and water resource management. Traditional conceptual and physically based hydrologic models often struggle to capture these disturbance-driven dynamics. In this study, we explore the potential of long short-term memory (LSTM) networks, a type of recurrent neural network, to simulate post-fire streamflow across 1,082 fire-affected basins spanning the contiguous U.S.—representing the first near-continental-scale application of LSTMs for wildfire-related hydrologic prediction. 

Three LSTM models were trained on different temporal splits of fifteen-year datasets containing wildfire events: one using pre-fire data, one using post-fire data, and one using the full dataset. Models were evaluated on unseen basins in both pre- and post-fire windows. Results show that the model trained on the full dataset consistently outperformed the others, underscoring the importance of temporally diverse training data that include disturbance events. Importantly, LSTMs demonstrated strong generalization across disturbed and undisturbed environments, highlighting their ability to learn hydrologic patterns beyond the constraints of traditional process-based modeling frameworks. 

Feature importance analysis revealed that topographic variables (e.g., elevation and slope) were most influential, followed by soil/geologic and vegetation characteristics, while fire-specific indicators (e.g., burn severity) ranked surprisingly low. This suggests that the LSTMs internalized key controls on streamflow response without heavy reliance on the explicit disturbance metrics included. To further isolate the model’s learned response to wildfire, simulations were performed with synthetic unburned conditions for each disturbed basin and compared against burned scenarios. Spatial analysis by EPA Level II ecoregion revealed that in the Southeastern U.S., Ozark/Appalachian Forests, and Mediterranean California, the model identified a persistent, multi-year increase in streamflow-lasting up to three years after wildfire. These regions share ecological characteristics such as high vegetation biomass, seasonal climate regimes, and terrain-driven hydrologic gradients that collectively amplify post-fire reductions in evapotranspiration and enhance runoff generation. In contrast, no significant streamflow change was detected in the Western Cordillera, South Central Prairies or Cold Desert ecoregions, where water-limited climates and lower fuel loads results in a dual-action response of hydrologic buffering and constrained post-fire increases in water yield.    

Together, these findings demonstrate that LSTMs can detect regionally coherent hydrologic responses to wildfire even in the absence of strong dependence on explicit disturbance features, highlighting the promise of AI-driven, data-centric approaches for modeling hydrologic change in an era of increasing disturbances. As wildfires and other extreme events become more frequent, integrating machine learning into hydrologic prediction frameworks offers a powerful pathway toward adaptive water resource management and improved resilience across diverse ecohydrologic settings. 

How to cite: Hogue, T., Moon, C., and Corona, C.: Quantifying Post‑Wildfire Hydrologic Response Using LSTMs: Ecoregion Patterns Across the Contiguous United States, EGU General Assembly 2026, Vienna, Austria, 3–8 May 2026, EGU26-15295, https://doi.org/10.5194/egusphere-egu26-15295, 2026.

EGU26-15913 | ECS | Posters on site | GI2.1

AI-assisted Remote Sensing Screening of Potential Natural Hydrogen Seepage Features in Alta Guajira, Northern Colombia 

Miguel Angel Monterroza Montes, Stephanie San Martín Cañas, Boris Lora-Ariza, and Leonardo David Donado

Natural (geological) hydrogen refers to molecular hydrogen produced in the subsurface through abiotic and biogenic pathways, which may migrate, accumulate transiently, be consumed by secondary reactions, or escape to the surface. Increasing evidence indicates that such systems could be a strategic low-carbon energy source, but their exploration is limited as regional-scale, data-driven approaches to identify mechanisms of active or fossil migration in geologically complex environments are lacking. Surface expressions such as circular and sub-circular depressions associated with soil and vegetation anomalies have been reported worldwide as indirect indicators of hydrogen migration and leakage. However, their detection remains limited to either local reconnaissance of the field or manual interpretation of remote-sensing data. In this research, we present an AI-assisted remote sensing framework to conduct a regional screening based on the potential for natural hydrogen seepage patterns to enhance early-stage exploration and improve the quantitative characterization of surface indicators linked to subsurface energy systems. Deep-learning–based computer vision models are used to study high-resolution satellite imagery and automatically identify and classify circular and sub-circular geomorphological features that could correspond to hydrogen exudation. The resulting detections are integrated into a GIS framework for the extraction of morphometric and spatial statistics, providing a formal analytical benchmark to relate surface structures to lithology, structural configuration, and the regional tectonic setting. The workflow is applied to the Alta Guajira region (in northern Colombia), a geologically complex segment of the Caribbean margin characterized by accreted oceanic crust, major fault systems, and sedimentary depocenters that may favor hydrogen generation and migration. Using an AI-based approach allows the construction of a regional inventory of candidate seepage-related structures while significantly reducing false positives associated with purely morphology-based analyses. The results support the prioritization of targets for future field verification, geochemical sampling, and subsurface investigations. Beyond its implications for natural hydrogen prospectivity, the proposed methodology demonstrates how artificial intelligence can translate qualitative geological observations into quantitative, reproducible screening tools. By providing a transparent and spatially explicit representation of subsurface energy systems, AI-assisted screening also facilitates communication with stakeholders and local communities, contributing to informed public perception of emerging sustainable subsurface energy resources in data-limited regions such as Alta Guajira.

The researchers thank the SHATKI Research Project (code 110563), Contingent Recovery Contract No. 112721-042-2025, funded by the Ministry of Science, Technology and Innovation (Minciencias) and the National Hydrocarbons Agency (ANH).

How to cite: Monterroza Montes, M. A., San Martín Cañas, S., Lora-Ariza, B., and Donado, L. D.: AI-assisted Remote Sensing Screening of Potential Natural Hydrogen Seepage Features in Alta Guajira, Northern Colombia, EGU General Assembly 2026, Vienna, Austria, 3–8 May 2026, EGU26-15913, https://doi.org/10.5194/egusphere-egu26-15913, 2026.

EGU26-16953 | ECS | Orals | GI2.1

Local Similarity-Driven Refinement for Model-Agnostic Ground-Based Cloud Detection 

Yangfan Hu, Pinglv Yang, Zeming Zhou, Ran Bo, Shuyuan Yang, and Guangyang Zhang

Cloud cover estimation is of crucial significance in meteorological observations and short-term/long-term weather forecasting, as it directly affects the accuracy of radiation balance assessment, precipitation prediction, and climate change modeling. Ground-based automated cloud quantification observation instruments enable continuous, high-resolution cloud monitoring with spatial-temporal continuity that satellite remote sensing cannot fully achieve, highlighting the immense value of ground-based cloud image processing for practical meteorological applications. However, existing cloud detection methods predominantly rely on supervised training with ground truth masks, which overlook the rich contextual information and inherent regularization constraints embedded in original cloud images. This oversight frequently results in mismatched cloud boundaries, inadequate model interpretability, and poor adaptability to complex cloud morphologies—particularly for thin clouds and cirrus clouds characterized by weak grayscale contrast, sparse texture, and irregular shapes. Consequently, these limitations lead to suboptimal detection performance, including under-segmentation or over-segmentation, and further induce inaccuracies in quantitative cloud cover estimation.

To address the aforementioned issues and achieve accurate cloud cover detection results, this study proposes a model-agnostic refinement method designed to optimize the coarse detection masks generated by any pre-trained cloud detection model. The framework is jointly optimized by three loss functions: a local similarity descriptor, total variation (TV) regularization, and a traditional detection loss (e.g., cross-entropy). Specifically, the local similarity descriptor is defined as the difference between two terms: the average grayscale difference of each pixel and cloud region and background pixels within a local window. This descriptor effectively enhances the discriminability between cloud and non-cloud regions at the local level. The total variation regularization term is introduced to maintain the smoothness of the detection boundary and suppress spurious noise. The cross-entropy loss ensures the overall consistency between the refined result and the ground truth.

Minimizing the combined loss function drives the coarse detection result to evolve adaptively along the actual cloud boundary, thereby achieving more precise alignment with the true cloud contours. Notably, the proposed framework elevates the detection of thin clouds and cirrus clouds, effectively mitigating missed detection areas in these tenuous cloud structures. Furthermore, the integrated loss function enhances model interpretability: the local similarity descriptor explicitly quantifies the differences within local window, and minimizing this term inherently refines the detection by strengthening the distinction between cloud and background regions. Ultimately, the refined detection results substantially improve the accuracy of cloud cover estimation, laying a solid foundation for reliable meteorological observations and weather forecasting applications.

How to cite: Hu, Y., Yang, P., Zhou, Z., Bo, R., Yang, S., and Zhang, G.: Local Similarity-Driven Refinement for Model-Agnostic Ground-Based Cloud Detection, EGU General Assembly 2026, Vienna, Austria, 3–8 May 2026, EGU26-16953, https://doi.org/10.5194/egusphere-egu26-16953, 2026.

Earth Observation (EO) is an essential source of information for most geosciences. However, high costs, large data volumes, and difficult access constrained its use for decades. Open data programs like Copernicus have reduced costs, and cloud access via the Copernicus Data Space Ecosystem (CDSE) has made local processing largely obsolete. In fact, API (Application Programming Interface)-based cloud access, analysis-ready mosaics and calibrated Copernicus Land Monitoring Service data products have made Sentinel data AI-ready. But despite these advances, the requirement for complex programming skills remained a significant barrier until recently. Here, we demonstrate how cloud-native processing APIs and generative artificial intelligence (AI) are removing this obstacle by enabling the "vibe coding" paradigm shift. Vibe coding is an approach to software development where the researcher focuses on the high-level logic, the functional vision, and the end product, while the syntax and code are generated and refined by AI.
Copernicus Data Space Ecosystem facilitates this transition through three key features: (1) the abstraction of EO analysis pipelines via RESTful APIs, which reduces tasks to a series of mathematical operations on pixel values; (2) the availability of intuitive web browser visualization for rapid prototyping and debugging; and (3) an extensive body of open documentation and code examples that serve as a robust training foundation for generative AI.
On CDSE, the Sentinel Hub API family utilizes "custom scripts" (or "evalscripts") — modular JavaScript files defining data inputs, outputs, calculations, and visualizations. The openEO API uses "process graphs", JSON representations of the processing steps in a unified structure as a series of nodes. Because the backend manages big data optimization and the browser handles rendering, these scripts are concise enough for AI assistants to generate, adapt, and debug effectively. The Sentinel Hub Custom Script Repository, containing over 200 community-contributed scripts, and the openEO community examples repository and CDSE "Algorithm Plaza" have laid the foundation for this approach. Neither of these advances was intentionally created to support AI, but rather to simplify programming for humans; however, combined, they enable a breakthrough in code development. We demonstrate how AI tools can efficiently adapt scripts across different satellite sensors, combine spectral indices into decision trees, and produce scalable quantitative outputs. This allows researchers not specialized in remote sensing to utilize existing code modules and natural language prompts to create meaningful results for their specific fields. Beyond the capabilities of Sentinel Hub, OpenEO supports joint analysis of data from multiple back-ends and the application of user-defined external code, such as biophysical models or pre-trained ONNX deep learning networks. While this added complexity presents a higher technical threshold, it also creates a massive opportunity for AI-driven automation. Ultimately, in combination with the public data space approach, generative AI further democratizes Earth Observation, transforming it from a specialist-only domain into an integrated component of all geoscience research workflows.

How to cite: Zlinszky, A.: From natural language to quantitative satellite imagery analysis: Copernicus Data Space Ecosystem and AI enable vibe coding of custom scripts, EGU General Assembly 2026, Vienna, Austria, 3–8 May 2026, EGU26-18394, https://doi.org/10.5194/egusphere-egu26-18394, 2026.

EGU26-18939 | ECS | Posters on site | GI2.1

Evaluating Fractional Vegetation Cover using Multimodal Large Language Models: A Comparative study with Human Observations 

Omar A. Lopez Camargo, Mariana Elias Lara, Marcel El Hajj, Hua Cheng, Dario Scilla, Victor Angulo, Areej Al wahas, Kasper Johansen, and Matthew F. McCabe

Fractional Vegetation Cover (FVC) is a key ecological variable for monitoring ecosystem health, land degradation, and vegetation dynamics in dryland environments. While satellite and UAV observations enable scalable FVC estimation over large spatial extents, the accuracy and robustness of these models remain strongly dependent on high-quality field-based reference data for calibration and validation. Traditional in-situ methods, including visual estimates using transect-based surveys, remain widely used but are labor-intensive and inherently subjective. Digital photography has emerged as a practical alternative, typically analyzed using index-based computer vision techniques or deep learning models. However, these methods are highly sensitive to background variability and therefore rely on massive labeled datasets. Recent advances in multimodal large language models (MLLMs) suggest a potential paradigm shift, as these models combine visual perception with high-level reasoning and benefit from diverse pre-training that enables conceptual knowledge transfer across tasks. In this study, we evaluate the feasibility of using MLLMs for direct estimation of FVC from ground-level photographs without task-specific training. We collected and compiled a dataset of more than 1,100 quadrat pictures from across 26 dryland sites in Saudi Arabia, spanning a wide range of surface conditions from bare soil to sparsely vegetated rangelands. Each picture corresponded to a 1 m × 1 m quadrat with FVC estimated independently by two experts, whose average was used as reference data for assessment of model predictions. Six state-of-the-art multimodal large language models, including Qwen2.5-VL, Mistral-Small-3.2, LLaMA-4-Maverick, LLaMA-4-Scout, and two Gemma-3 variants, were evaluated using four prompt designs that varied in length, ecological context, and methodological detail. Across all models and prompts, MLLMs achieved a mean absolute error of approximately 7.8%, demonstrating competitive performance relative to traditional image-based methods. The best-performing model-prompt combinations achieved mean absolute error values below 5%, with low systematic bias. Short and ecologically explicit prompts consistently outperformed more complex prompt designs, achieving an average reduction in mean absolute error (MAE) of approximately 1.3–1.4 percentage points compared to visually guided or highly structured prompts (MAE ≈ 6.9% versus 8.2–8.4%). Overall performance was more sensitive to model choice than to prompt structure, with mean MAE varying from approximately 5.6% to 10.0% across models, compared to a narrower range across prompts. The highest accuracy was obtained using the Qwen2.5-VL model with an ecologically detailed prompt, which achieved a mean absolute error of 4.9%, near-zero bias, and an RMSE of 8.4%. Across all prompt designs, Qwen2.5-VL and Mistral-Small-3.2 consistently delivered the best overall performance, both maintaining mean MAE values below 6% and exhibiting stable behavior across prompt variations, indicating robustness to prompt design. These results demonstrate that MLLMs can provide accurate and scalable FVC estimates directly from field photographs, without requiring specialized training datasets. This approach offers a promising alternative for rapid field surveys and reference data generation, particularly in dryland ecosystems where background complexity and data scarcity limit the effectiveness of conventional methods.

How to cite: Lopez Camargo, O. A., Elias Lara, M., El Hajj, M., Cheng, H., Scilla, D., Angulo, V., Al wahas, A., Johansen, K., and McCabe, M. F.: Evaluating Fractional Vegetation Cover using Multimodal Large Language Models: A Comparative study with Human Observations, EGU General Assembly 2026, Vienna, Austria, 3–8 May 2026, EGU26-18939, https://doi.org/10.5194/egusphere-egu26-18939, 2026.

Earth system is characterized by intricate interactions between human activities and natural processes, where stochastic dynamics, nonlinear feedbacks, and emergent behaviors collectively determine system evolution and sustainability outcomes. Despite significant advances in Earth system science, two fundamental challenges persist: the insufficient integration of physical process models with observational data, and the lack of interpretable frameworks for simulating coupled human-Earth dynamics and optimizing governance strategies. These limitations critically impede our ability to conduct effective Earth system governance and guide human-environment interactions toward sustainable development pathways. To overcome these challenges, this study proposes an innovative framework that synergistically integrates data assimilation and reinforcement learning to enhance both predictability and decision-making capabilities in the complex Earth system. Data assimilation, as a well-established methodology in Earth system science, systematically combines dynamic models with multi-source observations to improve system observability and forecast accuracy. Reinforcement learning, grounded in the Bellman equation and Markov decision processes, provides a natural paradigm for modeling adaptive human-environment interactions and deriving optimal strategies through sequential decision-making under uncertainty. Building upon these complementary methodologies, we develop a Multi-Agent Deep Reinforcement Learning (MADRL) framework that employs the Markov decision process as the theoretical foundation, integrates agent-based modeling to represent heterogeneous stakeholder behaviors across multiple organizational levels, utilizes deep neural networks to handle high-dimensional state-action spaces, and incorporates data assimilation techniques to continuously update system states and reduce forecast uncertainties. This integrated framework is specifically designed to address fundamental Earth system governance challenges by capturing emergent phenomena arising from complex human-environment interactions, enabling the exploration of intervention mechanisms such as economic incentives, regulatory policies, and cooperative arrangements, and providing interpretable decision pathways that balance economic development with environmental sustainability. Through this integration, our framework offers a systematic approach to tackle classical problems in Earth system governance, from the tragedy of the commons to planetary boundaries, ultimately advancing our capacity to navigate toward sustainable development trajectories in an increasingly coupled human-Earth system.

How to cite: Yuan, S. and Li, X.: Generalizing human-Earth systems modeling and decision-making: A multi-agent deep reinforcement learning framework, EGU General Assembly 2026, Vienna, Austria, 3–8 May 2026, EGU26-19409, https://doi.org/10.5194/egusphere-egu26-19409, 2026.

EGU26-19427 | Posters on site | GI2.1

Improving the seismic catalogue completeness of Tenerife (Canary Islands, Spain) through deep learning 

Manuel Calderón-Delgado, Luca D’Auria, Aarón Álvarez-Hernández, Rubén García-Hernández, Víctor Ortega-Ramos, David M. van Dorth, Sergio de Armas-Rillo, Pablo López-Díaz, and Nemesio M. Pérez

The volcanic island of Tenerife (Canary Islands, Spain) is characterized by low-magnitude background seismicity associated with local hydrothermal and volcano-tectonic processes. The island has been experiencing, since 2016, a slight increase in seismic activity, with earthquakes generally having magnitudes below 2. For this reason, we are revising the seismic catalogue using deep learning tools to improve its completeness.

Over the last decade, machine learning methods—particularly deep learning approaches—have gained traction across multiple disciplines due to their increased computational efficiency, high accuracy, and reduced need for manual supervision. One such method, PhaseNet [1], is a deep convolutional neural network based on the U-Net architecture [2] that has shown strong performance in waveform-based seismic phase detection. Its ability to process large volumes of seismic data and automatically identify relevant signal features represents a significant opportunity to enhance the quality and completeness of seismic catalogs. Nevertheless, applying a neural network to data with a different nature from that used for its training phase can lead to a substantial decrease in performance. In particular, PhaseNet was primarily trained on tectonic seismicity, whereas seismic events in Tenerife are predominantly volcanic-hydrothermal. Consequently, retraining the network on waveforms representative of the target seismicity is essential to ensure a reliable inference.

Using PhaseNet as a baseline, we conducted an extensive comparative analysis of several training configurations to adapt the original network to the seismic data from the Canary Islands (Tenerife). Our study focused on four key aspects: model initialization, learning rate selection, data clustering strategies, and model partitioning. The model initialization strategies include fine-tuning from pre-trained weights and training from randomly initialized weights. Regarding model partitioning, we evaluated a global model (a single model trained on all data), local models (one model per station), and cluster-based models (trained on groups of stations with similar characteristics). The performance of each configuration was evaluated on an independent dataset using multiple metrics to provide a comprehensive assessment. Specifically, we analyzed precision, recall, and ROC curves to identify suitable trade-offs between detection sensitivity and specificity.

These preliminary results will be beneficial for subsequent analysis aimed at a better characterization of the island's microseismicity and its relationship with the activity of its volcanic-hydrothermal system.

References:

  • [1] Zhu and G. C. Beroza, “PhaseNet: a Deep-Neural-Network-Based seismic arrival time picking method,” Geophysical Journal International, Oct. 2018, doi: 10.1093/gji/ggy423.
  • [2] O. Ronneberger, P. Fischer, and T. Brox, “U-NET: Convolutional Networks for Biomedical Image Segmentation,” in Lecture notes in computer science, 2015, pp. 234–241. doi: 10.1007/978-3-319-24574-4_28.


How to cite: Calderón-Delgado, M., D’Auria, L., Álvarez-Hernández, A., García-Hernández, R., Ortega-Ramos, V., M. van Dorth, D., de Armas-Rillo, S., López-Díaz, P., and M. Pérez, N.: Improving the seismic catalogue completeness of Tenerife (Canary Islands, Spain) through deep learning, EGU General Assembly 2026, Vienna, Austria, 3–8 May 2026, EGU26-19427, https://doi.org/10.5194/egusphere-egu26-19427, 2026.

EGU26-19439 | ECS | Posters on site | GI2.1

Onboard Hybrid Orbit Prediction with Lightweight Machine-Learning Error Correction 

Benedikt Aigner, Fabian Dallinger, Thomas Andert, and Benjamin Haser

Autonomous spacecraft operations are increasingly important as missions grow more complex, ground contact opportunities remain limited, and the number of LEO satellites continue to rise. Reliable onboard orbit determination (OD) and orbit prediction (OP) are essential for mission planning, resource allocation, and communication scheduling. Operational OD/OP typically relies on physics-based models that estimate parameters (initial state, drag coefficient, etc.) from tracking data. However, environmental modeling is not perfect, and uncertainties in atmospheric density can cause prediction errors to grow rapidly. This limits OP reliability.

We present an onboard-oriented hybrid OD/OP concept that augments a classical physics-based OD/OP chain with a lightweight machine-learning (ML) correction module to compensate for systematic OP errors in real time. While data-driven correction of propagator errors has been explored previously, this work emphasizes the tight integration of a compact correction model into an operational workflow under onboard constraints. The implementation is based on the Python OD/OP toolbox Artificial Intelligence for Precise Orbit Determination (AI4POD) and targets deployment within the Autonomous Space Operations Planner and Scheduler (ASOPS) experiment, that is planned for validation on the ATHENE-1 satellite.

The approach is demonstrated using simulated GPS-like tracking data generated with a high-fidelity reference model, while OD/OP are performed with a reduced-complexity model representative of onboard settings. A compact artificial neural network (ANN) is trained to predict OP errors in the RSW frame from available onboard data, reducing the maximum three-day along-track error from ~5 km to ~1.2 km.

To assess operational robustness, we complement the baseline results with a statistical consistency check of the residuals across all prediction cases and outline planned tests with additional ML/DL correction models.

How to cite: Aigner, B., Dallinger, F., Andert, T., and Haser, B.: Onboard Hybrid Orbit Prediction with Lightweight Machine-Learning Error Correction, EGU General Assembly 2026, Vienna, Austria, 3–8 May 2026, EGU26-19439, https://doi.org/10.5194/egusphere-egu26-19439, 2026.

EGU26-19927 | ECS | Posters on site | GI2.1

Single- vs. Multilayer Physics-Informed Extreme Learning Machines for Orbit Determination 

Fabian Dallinger, Benedikt Aigner, Thomas Andert, and Benjamin Haser

Orbit Determination (OD) is commonly addressed with classical estimators such as Weighted Least Squares, which are statistically well founded but can be sensitive to poor initialization and may degrade when the initial state is weakly known. Physics-Informed Machine Learning offers an alternative by embedding orbital dynamics directly into the estimation process. In this work, Physics-Informed Extreme Learning Machines (PIELMs) are investigated as fast OD models that do not require a high-quality initial guess, since the output layer is obtained from a physics-based training objective that enforces consistency with both measurements and dynamics.

While single-layer PIELMs can achieve high accuracy, they may exhibit reduced stability in regimes with limited measurement support. To improve representational capacity and generalization, the Deep PIELM augments the model with an autoencoder-based feature hierarchy that is pretrained efficiently via the Moore–Penrose pseudoinverse, followed by physics-informed nonlinear least-squares optimization of the final layer.

Comparative results highlight the trade-offs among classical least squares, single-layer PIELM, and Deep PIELM in terms of OD accuracy, robustness under poor initialization, and computational efficiency under sparse optical and range measurements from a limited set of ground stations. For suitable hyperparameter configurations, the multilayer architecture provides improved stability and accuracy over the single-layer variant while retaining low training times, positioning Deep PIELMs as an effective complement to classical least-squares OD when robust performance without reliable initial guesses is required. The presented work is part of the Artificial Intelligence for Precise Orbit Determination project.

How to cite: Dallinger, F., Aigner, B., Andert, T., and Haser, B.: Single- vs. Multilayer Physics-Informed Extreme Learning Machines for Orbit Determination, EGU General Assembly 2026, Vienna, Austria, 3–8 May 2026, EGU26-19927, https://doi.org/10.5194/egusphere-egu26-19927, 2026.

EGU26-20311 | ECS | Orals | GI2.1

Performance Comparison of Some Artificial Intelligence Algorithms for Metallic Mineral Deposits: A Case from Türkiye 

Gizem Karakas, Bahunur Civci, Birgul Topal, Candan Gokceoglu, Ahmet Ozcan, Cagri Erbasli, F. Sumeyye Cebeloglu, Murat Koruyucu, and Banu Ebru Binal

Recent advances in artificial intelligence and geospatial data analytics have led to an increasing adoption of data-driven approaches in the identification and prediction of mineral deposits. Traditional mineral exploration methods often rely on single data sources or expert-driven interpretations and may therefore be inadequate in regions where geological information is limited or spatially complex. In contrast, artificial intelligence–based approaches enable the quantitative assessment of mineral potential and the identification of spatial patterns associated with mineralization by jointly integrating multi-source geological, geophysical, and remote sensing data. Therefore, the comparative evaluation of different artificial intelligence algorithms using approaches that account for spatial dependence is critical for selecting reliable and interpretable models in early-stage mineral exploration conducted under data-limited conditions.

This study focuses on a comparative evaluation of artificial intelligence algorithms for predicting potential iron (Fe) mineralization under limited geological data conditions in a region with metallic mineralization potential in Türkiye. The study area covers approximately 2,340 km². A total of seven predictor variables were incorporated into the modeling, classified into geological (lithology, geological age, formation type), structural (fault density), geophysical (magnetic anomaly and gravity-tilt features), and remote sensing–based datasets (iron oxide potantial zones derived from ASTER imagery). The mineralization inventory is highly sparse, comprising only 15 iron occurrences and 24 non-iron reference points selected by geologists To address this limitation, a spatially aware hard negative mining strategy was applied, in which negative samples were preferentially selected from areas spatially proximal to known mineralization occurrences. Model performance was evaluated using GroupKFold-based spatial cross-validation to minimize bias arising from spatial autocorrelation, within which the Random Forest (RF) and XGBoost (XGB) algorithms were compared. The obtained results show that the RF and XGB models achieved mean Area Under Curve (AUC) values of 0.85 and 0.89, respectively. According to the generated mineral prospectivity maps, the Random Forest model delineates approximately 207.02 km² of high-potential areas (probability ≥ 0.90), while the XGBoost model identifies high-potential areas covering approximately 404.04 km² at the same probability threshold. These results indicate that there are pronounced differences in the spatial distribution of high-potential areas depending on the algorithm used. Additionally, the feature importance analysis revealed that geological age, magnetic anomaly, formation type, and gravity-tilt features are the primary controlling factors influencing the spatial distribution of iron mineralization.

This study outcomes revealed the importance of algorithm selection and spatially aware validation strategies in artificial intelligence–based mineral exploration. The findings indicate that reliable mineral prospectivity assessments can be achieved even under limited geological data conditions. Furthermore, in early-stage exploration programs, these approaches strengthen effective target area prioritization and decision-support processes and contribute to cost reduction through more efficient planning of exploration activities.

How to cite: Karakas, G., Civci, B., Topal, B., Gokceoglu, C., Ozcan, A., Erbasli, C., Cebeloglu, F. S., Koruyucu, M., and Binal, B. E.: Performance Comparison of Some Artificial Intelligence Algorithms for Metallic Mineral Deposits: A Case from Türkiye, EGU General Assembly 2026, Vienna, Austria, 3–8 May 2026, EGU26-20311, https://doi.org/10.5194/egusphere-egu26-20311, 2026.

EGU26-20838 | ECS | Orals | GI2.1

AI-Based Quantification of Crack Geometry on Retaining Walls from Mobile Earth-Observation Imagery 

Yen-Chun Chiang, Shao-Chin Chu, and Guan-Wei Lin

Cracks on retaining walls and road surfaces can reveal the early warning signs of geohazards such as landslides or slumps in rural areas. However, even today, many governments still rely on manual visual inspection to identify and evaluate cracks, which is time-consuming, subjective, and highly dependent on individual experience. Artificial intelligence (AI) applied to Earth-observation imagery not only enables the detection of potentially dangerous cracks but also makes it possible to quantify their geometric properties, providing a more objective and quantitative basis for infrastructure monitoring and geohazard risk management.

Nevertheless, several key challenges remain. First, although recent studies have developed many advanced algorithms for crack detection and segmentation, methods for measuring crack width, length ,and area are still insufficient. Second, most existing models are designed for road cracks, while cracks on retaining walls present more complex textures, illumination conditions, and background noise, requiring dedicated model fine-tuning. Third, in regions with dense vegetation, branches, leaves, and shadows often produce false detections, making it difficult for AI models to distinguish real cracks from environmental interference.

In this study, we aim to quantify crack geometry from mobile panoramic Earth-observation imagery and to develop an AI model optimized for cracks on retaining walls in complex environments. A multi-stage approach is used to combine YOLO-based crack detection with 3D geospatial information for estimating the length, width, and area of individual cracks. By focusing on real cracks under vegetation-rich and noisy conditions, this approach advances AI-based quantitative analysis of surface degradation. These crack metrics provide a foundation for future retaining wall stability assessment and risk-informed infrastructure management.

How to cite: Chiang, Y.-C., Chu, S.-C., and Lin, G.-W.: AI-Based Quantification of Crack Geometry on Retaining Walls from Mobile Earth-Observation Imagery, EGU General Assembly 2026, Vienna, Austria, 3–8 May 2026, EGU26-20838, https://doi.org/10.5194/egusphere-egu26-20838, 2026.

EGU26-22777 | Posters on site | GI2.1

AETHER: AI Enhancement for Third-gen Earth observing ImageR. Reaching 3x spatial upsampling and 10x temporal upsampling from existing MTG-I products. 

Nicolas Dublé, Sylvain Tanguy, Lucas Arsene, Vincent Poulain, Danaele Puechmaille, Oriol Hinojo Comellas, and Miruna Stoicescu

The Meteosat Third Generation (MTG) mission represents a major step forward in geostationary meteorological observation by combining, onboard Meteosat-12, multiple instruments with highly complementary characteristics. Among them, the Flexible Combined Imager (FCI) provides multispectral images of the full Earth disk every ten minutes with a spatial resolution reaching 1 km at nadir, while the Lightning Imager (LI) observes the same scene at a much higher temporal sampling, but with a coarser spatial resolution of approximately 4.5 km at nadir. Although designed for distinct operational purposes, these two sensors offer a unique opportunity for joint exploitation, as they observe identical atmospheric phenomena under fundamentally different spatio-temporal trade-offs. In this context, Thales investigates the use of artificial intelligence techniques to leverage this complementarity and generate enhanced observation products from existing MTG-I data. 

The core hypothesis of this work is that the high temporal density of LI observations implicitly encodes fine-scale spatial information. In other words, temporal correlations within LI time series can partially compensate for the sensor’s lower spatial resolution. By exploiting these correlations, fine spatial features can be reconstructed from high temporal frequencies. The availability of reference matching high resolution data enables to consider this process without the need for artificially degraded training data. 

To implement this hypothesis, a hybrid deep learning architecture combining convolutional neural networks (CNNs) and Transformers is proposed. CNN components are used to efficiently extract local spatial structures, such as gradients, cloud edges, and internal texture patterns, while Transformer-based attention mechanisms model short- and long-range temporal dependencies across successive LI acquisitions. This combination enables a joint representation of spatial detail and temporal coherence, while remaining compatible with large data volumes and near-operational processing constraints. 

The proposed approach is evaluated along two complementary scientific tasks. The first focuses on spatial super-resolution of LI images using LI temporal sequences alone. The second addresses the fusion of FCI and LI data to generate a product combining high spatial resolution with high temporal frequency. In both cases, the results are conclusive. The use of FCI images as a cross-reference makes it possible to assess the physical consistency of reconstructed features and to prevent the introduction of spurious, non-physical details. The super-resolved products remain radiometrically consistent with the input observations, with low radiance discrepancies (RMSE below 1), while recovering finer spatial structures than those achievable through conventional interpolation methods. Compared to standard SISR (Single Image Super Resolution), CNN + Temporal Conv1D, CNN + sparse Conv3D approaches, the hybrid CNN–Transformer model achieves the best overall performance. 

As a perspective, the proposed method shows strong potential for operational deployment. Its computational efficiency allows approximately one hour of MTG data—corresponding to about sixty full-disk Earth images—to be processed in less than five minutes on standard computing infrastructure with one Nvidia H-100 configuration, paving the way for the routine generation of high-resolution, high-frequency products from existing geostationary missions. 

How to cite: Dublé, N., Tanguy, S., Arsene, L., Poulain, V., Puechmaille, D., Hinojo Comellas, O., and Stoicescu, M.: AETHER: AI Enhancement for Third-gen Earth observing ImageR. Reaching 3x spatial upsampling and 10x temporal upsampling from existing MTG-I products., EGU General Assembly 2026, Vienna, Austria, 3–8 May 2026, EGU26-22777, https://doi.org/10.5194/egusphere-egu26-22777, 2026.

Small watersheds play a crucial role in sustaining river hydrology, ecological flows and local water security. However, they are increasingly threatened by climate change, rapid transformations of land use and escalation of anthropogenic pressures. These problems are worse in areas with little data, where few hydrological observations, sparse monitoring networks, and inconsistent long-term datasets make it hard to accurately assess vulnerability and make plans. To address this critical gap, this study introduces a unique and data-efficient Criteria Importance Through Intercriteria Correlation- Group Method of Data Handling (CRITIC-GMDH) hybrid framework, specifically developed to accurately assess watershed vulnerability in regions where large, continuous, or high-resolution datasets are unavailable. This interpretable decision-support approach integrates CRITIC for objective indicator weighting with the nonlinear modelling capability of the GMDH, enabling robust vulnerability prediction under constrained data conditions, overcoming key limitations of conventional hydrological models and black-box machine learning techniques. The framework incorporates eleven hydro-meteorological, geomorphological, and socio-economic parameters, including rainfall, temperature, runoff, watershed area, watershed length, water quality index, average slope, forest area, impervious area, population density, and highest flood level. The approach is demonstrated across four major river basins in Northeast India, such as Gomati, Haora, Khowai, and Manu, which represent highly sensitive and partially transboundary catchments. Future climate projections from CMIP6 SSP1-2.6 and SSP5-8.5 scenarios were used to compute the Vulnerability Index across decadal periods (2005–2065). Results show a significant escalation in vulnerability, particularly under SSP5-8.5, with Haora and Gomati exhibiting Vulnerability Index > 0.85, indicating extreme exposure to climate extremes, and urbanization stress. Sensitivity analysis identifies rainfall, runoff, and temperature as dominant controlling parameters, and validation through the Falkenmark indicator and green-blue water stress indices confirms emerging scarcity risks. The study provides a scientifically grounded pathway for watershed prioritization and climate-resilient planning, offering an adaptable methodological foundation for sustainable management of small river systems in data-scarce regions.

How to cite: Rudra Paul, A. and Kumar Roy, P.: Climate-Induced Vulnerability Assessment of Small Watersheds Using a CRITIC–GMDH Hybrid Model: A Methodology Tailored for Data-Scarce Regions, EGU General Assembly 2026, Vienna, Austria, 3–8 May 2026, EGU26-4175, https://doi.org/10.5194/egusphere-egu26-4175, 2026.

Urban roads in fast-growing cities fall apart quickly, and everyone feels the impact—traffic slows down, accidents happen, and the city’s economy takes a hit. The old way of checking roads—sending people out to inspect them on foot—just doesn’t cut it anymore. It’s slow, expensive, and puts workers in harm’s way. So, we’ve built something better: an automated system that uses drones and AI to keep an eye on road conditions.

Here’s how it works. Drones fly over city streets, snapping high-resolution images that pick up everything from big potholes to tiny cracks. We run these images through our analytics pipeline. First, we use classic machine learning to weed out the stretches of road that are still in good shape. That way, the system doesn’t waste time on areas that don’t need attention.

Next, we use a deep learning model—based on YOLO, which stands for “You Only Look Once”—to hunt down and label the actual problem spots. We’ve trained this model using annotated drone photos, so it can handle tricky lighting or weird road surfaces. The model doesn’t just spot the defects—it also nails down where they are, how big they’ve gotten, and how bad the damage is.

But spotting problems isn’t enough. City agencies need to see this info and act on it, fast. So, we’ve built a web portal using OpenLayers and PostGIS that maps out every defect. Maintenance crews can sort issues by type or severity, pull up interactive maps, and even generate reports to plan repairs.

This whole setup is practical, affordable, and scales up easily for any city that wants to take road maintenance seriously. By bringing together drones, AI, and smart mapping, we’re giving city managers the real-time, reliable data they need to keep roads safe and traffic moving. And honestly, this system can help any city make smarter decisions about their roads and urban development.

How to cite: Manu, H. and Bhoopathi, S.: UAV-Based Road Defect Detection Using Hybrid Machine Learning Approach with Web GIS Visualization, EGU General Assembly 2026, Vienna, Austria, 3–8 May 2026, EGU26-6705, https://doi.org/10.5194/egusphere-egu26-6705, 2026.

EGU26-10741 | ECS | Orals | GI2.4

Machine Learning-Based Root-Zone Soil Moisture Estimation Using Satellite-Derived Surface Soil Moisture 

siddaling Bakka and Sudardeva Narayanan

Root-zone Soil Moisture (RZSM; 10–102 cm) is a critical variable for land–atmosphere interactions, plant water availability, groundwater recharge, and hydrological extremes; however, its reliable estimation at deeper layers over large spatial scales remains challenging. Ground-based monitoring networks such as the International Soil Moisture Network (ISMN) provide accurate multi-depth soil moisture observations, but their utility is constrained by sparse station distribution, high installation and maintenance costs, and limited spatial coverage (Dorigo et al. 2011). In contrast, microwave remote sensing based satellite missions, including Soil Moisture Active Passive (SMAP), Soil Moisture and Ocean Salinity (SMOS), and Sentinel-1, offer frequent and spatially continuous SM observations but are sensitive only to near-surface conditions (top ~5 cm), leaving deeper soil layers unobserved. This disparity between depth-limited in-situ observations and surface-focused satellite measurements motivates the present study to develop a machine learning based framework to estimate RZSM from satellite-derived surface SM by incorporating temporal memory and forcing. This approach effectively captures persistence effects and vertical moisture transfer, which are essential for accurate prediction of deeper SM layers (Pal &Maity, 2019). Multi-depth SM observations from 5 to 102 cm, obtained from ISMN stations and categorized according to USDA Hydrologic Soil Groups (HSG A–D; four stations per HSG), account for differences in soil water movement and retention behaviour (Ross et al. 2018). For each soil group, Support Vector Regression (SVR) and Random Forest (RF) models were trained using a sequential, depth-wise prediction strategy comprising four depth transitions: 5–10 cm, 10–20 cm, 20–51 cm, and 51–102 cm. Model evaluation demonstrates strong predictive performance across all depth intervals (R² = 0.85–0.95 for RF and 0.63–0.95 for SVR at validation sites), indicating that HSG classification effectively captures soil-specific SM dynamics. The trained models successfully generate comprehensive RZSM profiles using satellite-derived SM from the SMAP mission.These profiles are rigorously validated against ground-based observations and demonstrate strong applicability across diverse landscapes lacking direct subsurface measurements.

How to cite: Bakka, S. and Narayanan, S.: Machine Learning-Based Root-Zone Soil Moisture Estimation Using Satellite-Derived Surface Soil Moisture, EGU General Assembly 2026, Vienna, Austria, 3–8 May 2026, EGU26-10741, https://doi.org/10.5194/egusphere-egu26-10741, 2026.

EGU26-11280 | Orals | GI2.4

Combining different hydraulic methods to estimate the discharge from Combined Sewer Overflows (CSO) into streams. 

Michael Robdrup Rasmussen, Mathias Ulsted Jackerott, Janni Mosekær Nielsen, Ida Kemppinen Vestergaard, and Jesper Ellerbæk Nielsen

Combined Sewer Overflows (CSOs) in cities can play a significant role in the morphology and hydraulic performance of streams near urban areas. A complete urban drainage system is often modelled by a dedicated hydrological/hydraulic model (e.g., SWMM or Mike+). However, these models must be calibrated against observations. Especially the flow from CSOs is difficult to estimate. The quality of the data and the drainage models depend on the accuracy of the overall mass balance of the drainage system. If it is not possible to estimate the discharge from, for example, a CSO, the results from other parts of the system become unreliable.

This research evaluates flow dynamics through a multi-methodological approach where the CSO is evaluated by theoretical models, CFD models, experimental work in a laboratory, and a new innovative method where the noise from a CSO is analyzed. The sound is both analyzed directly and by training a machine learning model on the laboratory experiments. The result is a hybrid model filtering all the estimates to one flow estimate. CFD has been used to model the specific CSO to take a Q-h relationship into account, and to generate a so-called catalog method. In this method, multiple variations of geometry are simulated in a free-surface CFD model to cover many different geometries, and general equations are extracted from these simulations.

The hybrid approach opens the door to a new way of estimating interactions between the urban water cycle and the receiving waters. Applying edge processing makes it possible to continuously adapt to local conditions that were not present during the calibration and validation of the model. Edge processing involves signal processing and modeling at the measuring point, where the maximum bandwidth of the sensor data is available and can be used for the most accurate data estimation.

How to cite: Rasmussen, M. R., Jackerott, M. U., Nielsen, J. M., Vestergaard, I. K., and Nielsen, J. E.: Combining different hydraulic methods to estimate the discharge from Combined Sewer Overflows (CSO) into streams., EGU General Assembly 2026, Vienna, Austria, 3–8 May 2026, EGU26-11280, https://doi.org/10.5194/egusphere-egu26-11280, 2026.

EGU26-12001 | Orals | GI2.4

Evaluating Climate Change Impacts and Adaptation Options for Paddy Yield Using Data-Curated Modelling in Goa, India 

Ankit Balvanshi, Jayakumar Kv, and Venkappayya r Desai

This study investigates the coastal-region impacts of climate change on rice yield in Goa, India, a monsoon-driven agroecosystem highly dependent on paddy cultivation and vulnerable to rainfall variability, salinity intrusion, and rising temperatures. The study aims to (i) estimate future crop evapotranspiration (ETc) and rice yield projections under different Shared Socioeconomic Pathways (SSP 2.6, SSP 4.5, and SSP 8.5), and (ii) assess the effectiveness of adjusting planting dates, along with the integration of drought-resilient cultivars, alternate wetting and drying (AWD) irrigation, and soil management practices, as adaptation strategies to mitigate yield reductions. To achieve these objectives, the CropWat and AquaCrop models were employed, using statistically downscaled CMIP6 CESM2 climate data.

The AquaCrop model was calibrated using data from 1994 to 2004 and validated for the period 2005–2014, demonstrating strong performance metrics (Nash–Sutcliffe Efficiency = 0.86, RMSE = 278.5, r² = 0.93). Our findings indicate that projected climatic changes pose a significant threat to rice yield stability in the region. Rising temperatures and shifting monsoon patterns are expected to elevate evapotranspiration demand by 10–14%, thereby intensifying irrigation requirements even in high-rainfall areas.

In response, adjusting planting dates emerged as a promising adaptation strategy. Specifically, delaying planting by 5 days until 2070 and by 10 days from 2071 to 2099 significantly mitigated yield declines across all SSP scenarios. An optimum 10-day delay in planting was found to recover up to 17% of yield losses under SSP 2.6 and SSP 4.5. Furthermore, compound strategies—including drought-tolerant rice cultivars, AWD irrigation, and improved soil management—provided up to 25% additional yield gains. These integrated approaches not only improved crop water productivity but also stabilized yields under moderate emission pathways. However, under the high-emission SSP 8.5 scenario, yield reductions remained substantial (up to 20%) due to increased temperature stress and shortened grain-filling duration, underscoring the limits of adaptation under extreme climate conditions.

The results highlight the importance of temporally optimized sowing schedules, integrated irrigation management, and improved soil practices for enhancing the resilience of coastal rice systems. This study further demonstrates that reliable data curation, model calibration, and parameter selection are essential to improving predictive accuracy in agro-hydrologic modelling. The findings emphasize the need for consistent methodological frameworks that couple climate projections with process-based crop models to assess adaptation effectiveness under uncertain future conditions.

Overall, the study provides actionable insights for strengthening the accuracy and reliability of water- and climate-based agricultural modelling frameworks. The outcomes contribute to developing climate-resilient strategies for paddy cultivation in coastal India, reinforcing the broader understanding of model validation, uncertainty reduction, and data-driven adaptation in hydrologic and agricultural research.

How to cite: Balvanshi, A., Kv, J., and Desai, V. R.: Evaluating Climate Change Impacts and Adaptation Options for Paddy Yield Using Data-Curated Modelling in Goa, India, EGU General Assembly 2026, Vienna, Austria, 3–8 May 2026, EGU26-12001, https://doi.org/10.5194/egusphere-egu26-12001, 2026.

EGU26-12042 | ECS | Posters on site | GI2.4

Strategies for spatial leave-one-out cross-validation 

Cristina Olimpia Chavez Chong, Cécile Hardouin, and Ana Karina Fermin Rodriguez

The purpose of the talk is to discuss spatially adapted cross-validation methods that maintain sufficient separation between training and validation sets, thus providing more accurate estimates of model risk. We begin by reviewing various spatial cross-validation techniques, including spatial blocked cross-validation and spatial leave-one-out, under scenarios of low to strong spatial dependence. We then propose a practical framework for determining an optimal “buffer size” for spatial leave-one-out that reduces autocorrelation between training and validation subsets. This framework is further enhanced by a parametric bootstrap approach designed to approximate the true risk in single-realization settings. Simulation experiments confirm that these methods effectively capture the underlying spatial structure, leading to more reliable risk estimation.

How to cite: Chavez Chong, C. O., Hardouin, C., and Fermin Rodriguez, A. K.: Strategies for spatial leave-one-out cross-validation, EGU General Assembly 2026, Vienna, Austria, 3–8 May 2026, EGU26-12042, https://doi.org/10.5194/egusphere-egu26-12042, 2026.

EGU26-13261 | ECS | Orals | GI2.4

Flow Modulation and Wave Impact Reduction by Retreated Crown Walls in Vertical Breakwaters 

Shaik Firoj and Mohammad Saud Afzal

This study investigates wave-induced flow behaviour around vertical breakwaters with retreated crown wall using numerical simulations. Previous experimental work has shown that moving the crown wall landward can reduce wave forces, moments, and overtopping. However, the associated flow mechanisms near the wall and trunk region have not been examined in detail. In this work, the open-source CFD model REEF3D is used to simulate regular wave interaction for crown wall retreat configuration. The model solves the Reynolds-averaged Navier–Stokes equations, with a level set method for free-surface tracking and a k–ω turbulence closure. The numerical results are first validated against published experimental data to ensure accuracy. The simulations provide detailed information on velocity fields, vortex formation, and flow separation during wave impact and overtopping. The results show that retreating the crown wall modifies the local flow structure, leading to a redistribution of momentum and a reduction in direct wave impact on the wall. These findings help to clarify the hydrodynamic role of retreated crown wall in vertical breakwater design.

How to cite: Firoj, S. and Afzal, M. S.: Flow Modulation and Wave Impact Reduction by Retreated Crown Walls in Vertical Breakwaters, EGU General Assembly 2026, Vienna, Austria, 3–8 May 2026, EGU26-13261, https://doi.org/10.5194/egusphere-egu26-13261, 2026.

Watershed hydrodynamics is governed by various hydrological flow processes that occur at different spatiotemporal scales. Most hydrological models couple the surface flow solver with the standard empirical infiltration models for flood propagation modeling. However, the empirical infiltration models are not applicable for heterogeneous and anisotropic soils and shallow groundwater tables, which are most vulnerable to waterlogging problems. Hence, simultaneous and integrated modeling of the surface and subsurface flow processes is essential for the continuous monitoring of watershed hydrodynamics. A physically based unified multi-region, multi-process watershed model integrates the various hydrological flow components in different regions through unique coupling mechanisms at the interfaces. The current work presents a Finite Volume (FV) method-based watershed flow model developed using the OpenFOAM® framework [1]. The developed model framework utilizes the ‘multi-region’ structure from the OpenFOAM® library to integrate the OpenFOAM®-based solvers for the individual processes of surface overland flow [2,3] and saturated-unsaturated subsurface flow [4] through the imposition of appropriate interface boundary conditions or addition of source/sink terms at the interfaces of the flow regions. The surface flow component is modeled using the diffusive wave or the zero-inertia (ZI) approximation of the two-dimensional (2D) depth-averaged shallow water equations (SWE). On the other hand, the flow through the variably saturated subsurface media is modeled using the ‘mixed form’ of the 3D modified Richards Equation. The flux exchange between the surface and subsurface regions (infiltration or exfiltration rate) is modeled using a switching algorithm to impose the boundary condition on the interface between the two regions. The algorithm changes the interface to a Dirichlet or a Neumann type boundary condition based on the rainfall intensity and the saturated hydraulic conductivity of the ground surface. A stabilized and adaptive time-stepping algorithm has been implemented to ensure smooth convergence of the iterative technique used for linearizing the nonlinear governing equations. The developed model is equipped with parallelization strategies to be run on multi-core processors, which is essential for increased computational efficiency while solving regional-scale watershed flow problems. The developed watershed model has been verified and validated against the standard benchmark problems on saturation excess and infiltration excess from the literature. Moreover, the applicability of the developed model has been extended to solve complex hydrological problems on exfiltration occurring over natural catchments, yielding satisfactory results.

References

[1] Jasak, H., A. Jemcov, Z. Tukovic. (2007). OpenFOAM: A C++ library for complex physics simulations. In Vol. 1000 of Proc., Int. Workshop on Coupled Methods in Numerical Dynamics,1–20. Dubrovnik, Croatia: Inter-University Center

[2] Dey, S., Dhar, A. (2024). Applicability of Zero-Inertia Approximation for Overland Flow Using a Generalized Mass-Conservative Implicit Finite Volume Framework. Journal of Hydrologic Engineering, 29(1), 04023042.

[3] Dey, S. (2025). zeroInertiaFlowFOAM – a OpenFOAM®-based computationally efficient, mass-conservative, implicit zero-inertia flow model for flood inundation problems on collocated grid-systems (No. EGU25-17402). Copernicus Meetings.

[4] Dey, S., & Dhar, A. (2022). Generalized mass-conservative finite volume framework for unified saturated–unsaturated subsurface flow. Journal of Hydrology, 605, 127309.

How to cite: Dey, S. and Dhar, A.: An OpenFOAM®-based coupled surface-subsurface flow model for simulating watershed hydrodynamics, EGU General Assembly 2026, Vienna, Austria, 3–8 May 2026, EGU26-13540, https://doi.org/10.5194/egusphere-egu26-13540, 2026.

EGU26-16374 | ECS | Orals | GI2.4 | Highlight

Reorganization of Heatwave Day Regimes across India under Recent and Near Future Warming 

Srikanth Bhoopathi and Manali Pal

Heatwaves are among the most rapidly intensifying climate extremes over India, yet their evolving spatial characteristics under recent and near future climate change remain inadequately quantified. This study examines the spatio-temporal variability of Heatwave Days (HWDs) across India using daily maximum temperature from the India Meteorological Department (IMD) gridded dataset for the historical period 1975-2024 and extends the analysis to the near future (2025-2044) using CMIP6 climate projections. Heatwave days are identified at each grid point using a calendar day based percentile approach, where daily maximum temperature exceeding the local 95th percentile threshold for the same calendar day, computed over a fixed reference period of 1981-2010, is classified as a heatwave day. Grid wise cumulative and decadal HWDs are analysed to assess long-term exposure and spatial redistribution. To objectively identify dominant heatwave regimes, Self-Organizing Maps (SOMs) are employed using multiple HWD metrics, enabling classification of regions with distinct heatwave characteristics and temporal evolution. Observational results indicate a clear reorganization of heatwave patterns over India. During the late 20th century (1975-1994), HWD accumulation is largely limited to north-western and parts of central India, typically ranging between 26 to 50 days per decade, with most eastern and peninsular regions experiencing fewer than 25 HWDs. From the mid-1990s onward, a pronounced intensification and spatial expansion is evident. By 2005-2014, large parts of central and eastern India exhibit decadal HWDs in the range of 51 to 100 days. The most recent decade (2015-2024) shows widespread moderate to high HWDs accumulation across the country, with several regions of central, eastern, and peninsular India experiencing 101 to 150 HWDs, and localized hotspots exceeding 150 days per decade. Future HWDs for 2025-2044 are derived from daily maximum temperature projections of the MPI-ESM1-2-HR model under the SSP2-4.5 scenario. The near-future decadal projections (2025-2034 and 2035-2044) indicate a continued intensification and spatial expansion of HWDs, with extensive areas of north-western, central, and peninsular India experiencing 151 to 250 HWDs per decade, and emerging hotspots exceeding 250 to 350 days, particularly over parts of north-western and southern India. Eastern India also shows a marked transition toward higher HWDs classes, indicating increasing regional vulnerability. Overall, the combined observational and CMIP6 based analysis demonstrates a transition toward widespread and persistent heatwave exposure across India in both recent decades and the near future. The integration of a grid specific, calendar day based percentile definition with SOM based classification provides a robust framework for identifying evolving heatwave regimes and supports improved heat risk assessment, climate adaptation planning, and early warning strategies under continued warming.

How to cite: Bhoopathi, S. and Pal, M.: Reorganization of Heatwave Day Regimes across India under Recent and Near Future Warming, EGU General Assembly 2026, Vienna, Austria, 3–8 May 2026, EGU26-16374, https://doi.org/10.5194/egusphere-egu26-16374, 2026.

Considering the dearth of gauge-based rainfall observations at desirable resolution, it becomes immensely challenging to quantify and monitor droughts, especially over the developing countries. This can be circumvented by utilizing the high-resolution open-access rainfall products. This study is envisaged with the objective to assess the spatiotemporal variation of meteorological droughts over the Bundelkhand region, India. The multi-source weighted-ensemble precipitation (MSWEP), a blended product of global gauge-based, satellite-based and reanalysis precipitation datasets, is utilized for a period of 44 years (1980-2023). The MSWEP rainfall is bias-corrected with respect to the India Meteorological Department (IMD) gridded observation dataset for the 14 districts in the region. Using the corrected rainfall product, the droughts over each district are characterized by Standardized Precipitation Index (SPI) at three different timescales, i.e., the SPI-3, SPI-6 and SPI-12 are used to model short-term, intermediate-term and long-term droughts, respectively. A drought severity index (DSI) is proposed considering the probability of droughts in different severity classes (i.e., near-normal, moderate, severe and extreme). Further, the trend analysis of SPI at different timescales is carried out using Modified Mann-Kendall (MMK) test. The results reveal the MSWEP dataset’s problems in capturing higher quantiles, which affects the probabilistic distribution used for quantifying drought events. However, the bias-corrected MSWEP product showed an excellent match with the IMD gridded data, thereby substantiating its applicability over the Bundelkhand Region. The region is found to be prone to droughts with an increasing trend of dryness. The novel approach of DSI is found to distinguish the drought severity levels at district-scale, which can be helpful for planning and management of droughts. Overall, this study provides critical insights on the drought characterization using state-of-the-art datasets and innovative approaches, which can also be extended to other drought-prone regions of the world.


Keywords: Bias-correction; Bundelkhand; DSI; MSWEP; MMK; SPI

How to cite: Swain, Dr. S.: A statistical approach of mapping drought severity using bias-corrected blended dataset over a semi-arid region, EGU General Assembly 2026, Vienna, Austria, 3–8 May 2026, EGU26-18814, https://doi.org/10.5194/egusphere-egu26-18814, 2026.

EGU26-18906 | Orals | GI2.4

Passive Acoustic Characterization of Marine Bedload Transport Based on Interparticle Collision Dynamics 

Debasish Dutta, Armelle Jarno, Hugues Besnard, Bruno Morvan, and Francois Marin

Marine sediments are very important for keeping the coast stable and protecting the shoreline naturally. However, anthropogenic activities can greatly change how sediment moves, making their accurate monitoring essential. In marine settings, understanding bedload sediment transport can be challenging due to conventional methods reliant on visual observations or direct sediment sampling tend to be intrusive, spatially constrained, and inadequate for long-term or continuous monitoring. In this situation, passive underwater acoustics is a promising non-intrusive option that can provide continuous monitoring with high temporal resolution. This study investigates the acoustic signatures related to marine bedload transport, focusing particularly on the sounds generated by interparticle collisions of mobile sediments. A series of controlled laboratory experiments are performed utilising simplified experimental arrangements in which artificial sediments (spherical glass beads) are mobilised under oscillatory motion that simulates wave-induced seabed forcing. We use glass beads of different sizes to create idealised bedload conditions, and we use an oscillating plate to control the movement of the particles. Hydrophones placed close to the sediment bed record acoustic pressure signals. The recorded acoustic signals are analyzed in both the time and frequency domains. Individual particle impacts are characterised by short transient acoustic events, and spectral analyses show clear peak frequencies that are linked to sediment motion. The results indicate that the peak frequency of the acoustic spectrum is predominantly determined by particle diameter and is additionally influenced by the amplitude and frequency of the applied oscillatory motion. These observations align with theoretical models, such as those suggested by Thorne (1985), that explain the generation of pressure waves during underwater particle collisions. To further explore the mechanisms of sound generation, experiments are conducted with both smooth and rough beds below the beads layers. The analysis reveals the existence of sediment-specific acoustic signatures, facilitating the differentiation of particle sizes according to their spectral characteristics. This study illustrates the significant potential of passive acoustic methods for the remote monitoring of marine bedload transport. The study offers novel insights into sound generation mechanisms linked to sediment motion across various particle sizes, motion amplitudes, and bed configurations, utilising a combination of laboratory experiments, theoretical frameworks, and comprehensive spectral analysis, with direct implications for intricate coastal and offshore environments.

How to cite: Dutta, D., Jarno, A., Besnard, H., Morvan, B., and Marin, F.: Passive Acoustic Characterization of Marine Bedload Transport Based on Interparticle Collision Dynamics, EGU General Assembly 2026, Vienna, Austria, 3–8 May 2026, EGU26-18906, https://doi.org/10.5194/egusphere-egu26-18906, 2026.

EGU26-1257 | ECS | Posters on site | GI4.3

An Automated Morphometric Approach for Global Lentic and Lotic Classification of Inland Waters  

Ankit Sharma, Mukund Narayanan, and Idhayachandhiran Ilampooranan

The distinction of lentic (still) and lotic (flowing) inland waters is fundamental for understanding ecosystem functions, hydrodynamic behavior, nutrient cycling, and biogeochemical exchanges across terrestrial and aquatic interfaces. These systems influence carbon storage, sediment balance, biodiversity support, water residence time, and regional climate regulation, making accurate separation essential for large-scale hydrological assessments. However, existing classification approaches often depend on site-specific information, manual interpretation, or large training datasets, and commonly struggle to classify inland waters smaller than 3 hectares due to resolution limitations and insufficient annotated samples. This work presents an Automated Data Efficient Morphometric Approach (ADEMA) for classifying inland waters down to 0.09 ha (single LANDSAT pixel) using multi-dimensional morphometric interpretations derived using the Global Surface Maximum Extent (GSMW) dataset. The approach was trained and validated using 17,391 expert-labeled samples from 66 geographically diverse locations across multiple climate zones, varied topographies, and hydrological regimes. Further, ADEMA was benchmarked against optimized machine learning, deep learning, and global classification products. Results showed that across all size classes (small: <10 ha, medium:10-1,000 ha, and large: >1,000 ha), ADEMA provided comparable F1 scores (94%) to machine and deep learning models with minimal omission (2%), demonstrating its ability to achieve reliable classification with significantly lower computational and data requirements. A multi-decadal evaluation from 1991 to 2021 showed stable accuracy, highlighting temporal ADEMA’s robustness (F1 score = 92%). When compared to global classification products, ADEMA achieved substantially higher accuracy (average F1 score: 97% vs. 62%), especially for small and medium inland waters that are often underrepresented in global datasets. The method offers a data-efficient and automated solution suitable for regional to global hydrography. However, the framework excludes inland waters >10,000 ha to maintain computational feasibility, limiting coverage of large systems. Single-pixel detections (~0.09 ha) are less reliable due to noise, vegetation, and GSMW uncertainty, with accuracy stabilizing above ~0.5 ha. With further advancements, ADEMA could improve global open-water inventories, guide conservation strategies, and strengthen our understanding of how small inland waters collectively shape hydrology and ecosystem resilience across different environments.

How to cite: Sharma, A., Narayanan, M., and Ilampooranan, I.: An Automated Morphometric Approach for Global Lentic and Lotic Classification of Inland Waters , EGU General Assembly 2026, Vienna, Austria, 3–8 May 2026, EGU26-1257, https://doi.org/10.5194/egusphere-egu26-1257, 2026.

EGU26-3118 | ECS | Orals | GI4.3

Assessment of chemical contamination of condensed water from Atmospheric Water Harvesting 

Thomas Merlet, Amira Doggaz, Yan Ulanowski, Stéphane Laporte, Mohamed Ali Abid, and Bérengère Lebental

As access to drinking water is a major public health issue worldwide, many technologies have emerged for water harvesting from alternative sources. Among these, active atmospheric water harvesting technologies, known as atmospheric water generators (AWGs), are attracting growing interest as a decentralised water production system. However, the water quality they produce is known to be influenced by the ambient air pollution, but scientific data on air-to-water transfer is limited, stressing the need for assessment tools to support monitoring and management strategies. This difficulty is exacerbated by the complexity of atmospheric chemistry and the large number of compounds present in the air, which far exceeds the number of compounds regulated in drinking water. To address this challenge, we present the first systematic methodology for risk assessment of air-to-AWG water transfer and apply it to the Greater Paris area. First a bibliographic inventory of the compounds found in the air in the region of interest and of their maximum reported concentration was created. For each compound, empirical (when available) or theoretical air-to-water transfer models were applied to determine the upper concentration expected in AWG water. The risk level of each compound was determined based on the ratio between this concentration and experimental or extrapolated guideline values for ingestion toxicity. In the Greater Paris area, while as many as 193 air pollutants were inventoried with quantified ground-level atmospheric concentrations over the last 15 years, only about half of them presented a risk of being present in AWG water above the set thresholds. Of these, around 20 - a much more manageable number of species to monitor - may reach concentration levels two orders of magnitude or more above the threshold values and may require priority consideration. These include ammonium, Polycyclic Aromatic Hydrocarbons -PAHs- (e.g., phenanthrene), pesticides (e.g., prosulfocarb), organic acids (e.g., acetate), phenols (e.g., benzenediol), and aldehydes (e.g., acrolein). The presence of some of these species linked to vehicle emissions was studied experimentally in the water of an AWG exposed to varying levels of diesel emissions through integrated water and air quality monitoring, both in-situ and in Sense-City climatic chamber (https://sense-city.ifsttar.fr/). A large number of species were discovered for the first time in AWG water, notably numerous PAHs and acrylamide, while several were observed to exceed EU regulatory thresholds (pH, ammonium, nitrite, Cu, Al, Mn, Pb, Ni, benzo(a)pyrene, benzene and acrylamide), some of them for the first time (Cu, acrylamide). The composition of raw AWG water was found to be directly correlated with exhaust levels through NOx and TVOC concentrations with turbidity, total organic content, nitrite, BTEX, several metals and most PAHs. Acrylamide concentration also featured correlation with the exhaust pollution, a surprising, as of yet unreported, finding in air or water that thus needs to be extensively confirmed. Overall, the study confirms the strong influence of air pollution on AWG water but its viability despite extreme pollution conditions.

How to cite: Merlet, T., Doggaz, A., Ulanowski, Y., Laporte, S., Abid, M. A., and Lebental, B.: Assessment of chemical contamination of condensed water from Atmospheric Water Harvesting, EGU General Assembly 2026, Vienna, Austria, 3–8 May 2026, EGU26-3118, https://doi.org/10.5194/egusphere-egu26-3118, 2026.

EGU26-7210 | ECS | Posters on site | GI4.3

Monitoring of the saline wedge in the rivers of the Ferrara province (Emilia Romagna region,Italy). 

Francesca Fongo and Enzo Rizzo

Saltwater intrusion threatens coastal ecosystems and water resources globally, intensified by
climate change. Rising sea levels and reduced river flows disrupt the water balance in estuarine
zones, allowing seawater to penetrate upstream into rivers and coastal aquifers. Studies predict a
9.1% global average increase in saltwater intrusion under high emissions scenarios, with extreme
events becoming up to 25 times more frequent [2]. The Po River Delta exemplifies this
vulnerability. The Ferrara area, characterized by minimal slopes and elevations mostly below sea
level, is particularly exposed. Projections indicate the Po di Goro estuary could experience up to
63% annual increase in saltwater intrusion, reaching 120% in summer [6]. The 2022 drought
demonstrated system fragility, with saltwater compromising irrigation and domestic water
supplies. Groundwater aquifers face additional stress from excessive extraction and reduced
natural recharge [1], affecting drinking water quality, agriculture, natural habitats, and soil
integrity. Traditional monitoring relies on point measurements of electrical conductivity using
boat-mounted probes, providing inadequate spatial and temporal resolution. Geophysical
methods—particularly electrical resistivity tomography (ERT) and electromagnetic (FDEM)
surveys—offer rapid, high-resolution alternatives. Previous research demonstrated the
effectiveness of combined ERT-FDEM approaches in the Po di Goro for monitoring saltwater
wedge advancement [4]. Integration of multiple geophysical techniques enables multi-scale
characterization [3].
This PhD project develops an integrated monitoring and predictive modeling system for saltwater
wedge intrusion in Ferrara, combining advanced geophysical methods with machine learning.
Building on long-term FDEM monitoring (2022-2025) in the Po di Goro, the project extends to
other Ferrara rivers and incorporates additional methods (ERT, GPR).
Expected outcomes include: (1) precise mapping of saltwater wedge extent, depth, and temporal
evolution; (2) machine learning-based predictive tools to forecast intrusion evolution; (3) decision-
support tools for sustainable water resource management, agriculture, and territorial planning,
with methodologies transferable to other estuaries globally.


The project addresses a critical gap: the absence of systematic monitoring systems and reliable
predictive tools. Increasing salinization frequency underscores the urgency for robust predictive
capabilities enabling preventive interventions. The project responds to the 2022 Po River basin
water crisis, offering practical solutions through informed policy on coastal defense, flood
mitigation, subsidence reduction, and intrusion control [5].
References
[1] Crestani, E. (2022). Large-Scale Physical Modeling of Salt-Water Intrusion. Water, 14(8), 1183.
[2] Lee, J., et al. (2025). Global increases of salt intrusion in estuaries. Nature Communications, 16,
3444.
[3] Mansourian, D., et al. (2022). Geophysical surveys for saltwater intrusion assessment. Journal
of the Earth and Space Physics, 48(3), 331–341.
[4] Rizzo, E., et al. (2023). DC and FDEM salt wedge monitoring of the Po di Goro river. EGU23-
5297.
[5] Simeoni, U. (2009). A review of the Delta Po evolution. Geomorphology, 107(1–2), 64–71.
[6] Verri, G., et al. (2024). Salt-wedge estuary's response to rising sea level. Frontiers in Climate, 6,
1408038.

How to cite: Fongo, F. and Rizzo, E.: Monitoring of the saline wedge in the rivers of the Ferrara province (Emilia Romagna region,Italy)., EGU General Assembly 2026, Vienna, Austria, 3–8 May 2026, EGU26-7210, https://doi.org/10.5194/egusphere-egu26-7210, 2026.

EGU26-10394 | Orals | GI4.3

Characterization of Offshore Freshened Groundwater systems on the Ross sea shelf 

Francesco Chidichimo, Ariel Tremayne Thomas, Michele De Biase, Salvatore Straface, and Aaron Micallef

Offshore Freshened Groundwater (OFG) is increasingly recognized as an important component of continental shelf hydrogeology, yet its physical structure, geochemical evolution, and preservation mechanisms remain poorly documented in polar settings. This study characterizes OFG systems on the Ross Sea shelf using borehole porewater data from IODP (Integrated Ocean Drilling Program) Sites U1522 and U1524, with the aim of resolving their vertical structure, origin, and diagenetic state.

Depth-resolved porewater samples were analyzed for chloride, stable water isotopes (δ¹⁸O, δ²H), major cations and anions, and redox-sensitive species. Lithological information was used to assess stratigraphic controls on fluid distribution. A groundwater transport model was applied to evaluate the relative roles of diffusive and advective processes in shaping present-day porewater profiles.

Both sites host vertically stratified OFG systems comprising a saline, marine-influenced upper unit, an intermediate transition zone, and a deeper freshened interval preserved beneath finer-grained sediments. Downcore decreases in chloride and progressive depletion of δ¹⁸O and δ²H indicate dilution by a non-marine water source, while elevated Br/Cl ratios and smooth concentration gradients support long residence times and limited modern exchange. Redox profiles show sulfate depletion, ammonium enrichment, and methane production at depth, indicating active diagenetic alteration of the fluids. The transport model demonstrates that diffusion is the dominant control on present-day tracer distributions, with only minor or negligible vertical flow patterns.

The Ross Sea OFG systems at Sites U1522 and U1524 are therefore laterally extensive, vertically stratified, and geochemically evolved bodies, preserved through stratigraphic confinement and diffusion-dominated transport. Their characteristics reflect long-term isolation and water-rock interaction rather than active recharge phenomena, highlighting OFG as a stable subsurface reservoir and an archive of past hydrogeological conditions on polar continental shelves.

How to cite: Chidichimo, F., Thomas, A. T., De Biase, M., Straface, S., and Micallef, A.: Characterization of Offshore Freshened Groundwater systems on the Ross sea shelf, EGU General Assembly 2026, Vienna, Austria, 3–8 May 2026, EGU26-10394, https://doi.org/10.5194/egusphere-egu26-10394, 2026.

EGU26-11204 | ECS | Orals | GI4.3

Preliminary results of a cost-effective optical imaging and deep learning system for algal bloom monitoring in Lake Lugano  

alessandro centazzo, daniele strigaro, claudio primerano, massimiliano cannata, and camilla capelli

Algal blooms represent a significant challenge for the sustainable management of freshwater habitats, strongly affecting water quality, biodiversity, ecosystem functioning, and human activities. Their occurrence is often driven by complex interactions between natural processes and anthropogenic pressures [1–3]. Consequently, there is a growing demand for monitoring strategies capable of capturing the spatial and temporal variability of algal dynamics while supporting a holistic assessment of water habitat health. Traditional monitoring approaches typically rely on point-scale in situ measurements or satellite remote sensing products, which, although essential, are often limited by spatial resolution, revisit frequency, operational costs, or deployment constraints [4]. In this context, low-cost, image-based sensing systems represent a promising complementary solution, enabling continuous and visually explicit observations at local to regional scales. 

This contribution presents preliminary results from an in situ monitoring system based on cost-effective optical imaging cameras combined with deep learning-based image analysis. The proposed approach is developed within the framework of the WINCA4TI (Water Interactions with Nature, Climate and Agriculture for Ticino) Interreg project, which aims to foster cross-border innovation in environmental monitoring through low-cost sensing technologies and data-driven methods. The system is designed to complement high-end in situ instrumentation and satellite observations by providing flexible, scalable, and cost-effective monitoring capabilities, with a specific focus on the automatic characterization of algal bloom phenomena to support near-real-time detection and decision making. 

The monitoring system relies on compact cameras and optical sensors operating in the visible and near-infrared spectral ranges, deployed on fixed platforms suitable for long-term observations and on-site (edge) processing. Image data are initially combined with in situ measurements to build a reliable reference dataset, which is subsequently exploited to enable image-only monitoring. The computational workflow integrates image preprocessing, including illumination normalization and water surface masking, with deep learning–based image segmentation to derive spatial and temporal indicators of algal presence, surface coverage, and bloom dynamics. 

Preliminary results demonstrate the capability of the proposed approach to capture fine-scale spatial and temporal patterns of algal blooms, bridging the gap between localized field measurements and large-scale remote sensing products. The findings suggest that low-cost image-based monitoring systems can enhance the responsiveness and resilience of water management strategies, particularly where traditional monitoring is constrained by cost, logistics, or spatial coverage. 


  • Strigaro D., Capelli C. (2024). An open early-warning system prototype for managing and studying algal blooms in Lake Lugano. https://doi.org/10.5194/isprs-archives-XLVIII-4-W12-2024-143-2024 
  • Bosse K. R., Fahnenstiel G. L., Buelo C. D., Pawlowski M. B., Scofield A. E., Hinchey E. K., & Sayers M. J. (2024). Are harmful algal blooms increasing in the Great Lakes? https://doi.org/10.3390/w16141944 
  • Zeng K., Gokul E. A., Gu H., Hoteit I., Huang Y., & Zhan P. (2024). Spatiotemporal expansion of algal blooms in coastal China seas.  https://doi.org/10.1021/acs.est.4c01877 
  • Ogashawara I. (2019). Advances and limitations of using satellites to monitor cyanobacterial harmful algal blooms. https://doi.org/10.1590/S2179-975X0619 

How to cite: centazzo, A., strigaro, D., primerano, C., cannata, M., and capelli, C.: Preliminary results of a cost-effective optical imaging and deep learning system for algal bloom monitoring in Lake Lugano , EGU General Assembly 2026, Vienna, Austria, 3–8 May 2026, EGU26-11204, https://doi.org/10.5194/egusphere-egu26-11204, 2026.

EGU26-13495 | Posters on site | GI4.3

Advances in supraglacial lake detection and characterization on the Nansen Ice Shelf from active microwave and visible light satellite remote sensing 

Francesco De Biasio, Stefano Vignudelli, Stefano Zecchetto, Matteo Zucchetta, Emiliana Valentini, Marco Salvadore, and Roberto Salzano

The evolution of cryospheric components (snow cover, ice, and meltwater) plays a fundamental role in regulating energy exchanges between the atmosphere and ice shelves and represents a key indicator of climate change impacts in remote polar regions. Within the framework of the HOLISTIC (Holistic Overview of the supraglacial Lake–Ice–Snow Timing and Climate causality) project, funded by the Italian National Antarctic Research Program, we present an advanced multi-sensor assessment of supraglacial lake (SGL) dynamics over the Nansen Ice Shelf (Victoria Land, Antarctica).

We adopted a synergistic remote sensing approach, aimed at integrating active microwave observations from satellite SAR and radar altimetry missions with optical imagery. This multi-frequency and multi-platform strategy investigates the possibility of detection, mapping and temporal monitoring of SGL position and extent and spatial distribution under all-weather conditions and across different spatial and temporal scales. HH-polarized SAR data proved effective in identifying surface meltwater signatures and characterizing seasonal lake evolution, despite polarization limitations, while optical data provided complementary constraints on lake morphology and surface hydrology during cloud-free periods. The seasonal melt and refreezing processes of SGL units were further investigated by leveraging the combined revisit time of operational sensors such as Sentinel-2 and Landsat, together with dedicated tasking missions like PRISMA, providing a more comprehensive understanding of lake dynamics over time.

A dedicated processing chain for Sentinel-3 altimetry L1A individual echoes was implemented using the PISA algorithm (Abileah and Vignudelli, 2021, https://doi.org/10.1016/j.rse.2021.112580). This allowed the retrieval of localized elevation anomalies associated with bright targets, mountainous targets and supraglacial water bodies, and the characterization of surface roughness changes presumably linked to melt and drainage processes, as well as to changes in snow density and surface slope.

The combined analysis highlights the strong coupling between snowpack evolution, surface energy feedback, and the formation and drainage of SGLs, providing new insights into ice-shelf surface hydrology and its seasonal to interannual variability. The results represent a step forward in quantifying SGL properties using active microwave and passive/active optical techniques and offer a valuable testbed for existing and future altimetry missions, such as NASA's ICESat-2 and ESA’s CRISTAL missions, aimed at directly retrieving snow depth. The capabilities of high-resolution satellite-born SAR sensors are also expected to benefit from this study, in detecting and monitoring snowpack changes, particularly those resulting from surface snow melt and the formation of supraglacial lakes. Supraglacial lakes emerge as particularly suitable targets for assessing visible light as well as Ka-, Ku- and C-band scattering contributions and for advancing the understanding of snow–ice–water interactions in polar environments.

How to cite: De Biasio, F., Vignudelli, S., Zecchetto, S., Zucchetta, M., Valentini, E., Salvadore, M., and Salzano, R.: Advances in supraglacial lake detection and characterization on the Nansen Ice Shelf from active microwave and visible light satellite remote sensing, EGU General Assembly 2026, Vienna, Austria, 3–8 May 2026, EGU26-13495, https://doi.org/10.5194/egusphere-egu26-13495, 2026.

EGU26-14117 | ECS | Orals | GI4.3

Coastal and Land Use Variations of Burullus Lake, Egypt Using Remote Sensing  

Elsayed Abdelsadek, Salwa Elbeih, and Abdelazim Negm

Monitoring lakes is traditionally expensive, but satellite technology offers a more affordable solution. Human activities are currently damaging water bodies worldwide, including Egypt's coastal lakes. This study focuses on Burullus Lake, Egypt’s second-largest lake in the northern Mediterranean. Researchers used Remote Sensing and Geographic Information Systems (GIS) to track changes in the coastline and land use. The authors analyzed Landsat images from 1984 to 2019 and compared 2019 Landsat data with Sentinel-2A imagery. They also performed field visits to confirm their findings. Using a supervised classification method, they identified eight categories, including seawater, urban areas, and fish farms.

The results show significant changes between 1984 and 2019: the lake’s open water decreased by 16%, and floating plants dropped by 52%. Conversely, agricultural land expanded by 648 km^2, and fish farms grew by 290 km^2. These updated maps help officials identify where human activity is most harmful. This data is essential for restoring the lake and meeting Sustainable Development Goals (SDGs).

Keywords: Remote Sensing & GIS, Environmental Monitoring, Land Use/Land Cover (LULC), Change Detection, Burullus Lake, Egypt,

How to cite: Abdelsadek, E., Elbeih, S., and Negm, A.: Coastal and Land Use Variations of Burullus Lake, Egypt Using Remote Sensing , EGU General Assembly 2026, Vienna, Austria, 3–8 May 2026, EGU26-14117, https://doi.org/10.5194/egusphere-egu26-14117, 2026.

EGU26-18033 | ECS | Orals | GI4.3

MaD-OPS: Monitoring & Detection of Organic Pollution from Sewage: Implementation of an agile sensing network for informing river health 

Connie Tulloch, Rosie Perrett, Matthew Coombs, Izaak Stanton, John Attridge, Robin Thorn, Lyndon Smith, and Darren Reynolds

Rivers are under pressure from many different sources, including farming and rural land use, wastewater treatment, towns and transport. In England, very few rivers achieve good ecological status, and none achieve good chemical status. This comes after many years of exploiting our freshwater systems. In 2024 there were more than 450,000 combined sewer overflow discharges in England, totalling over 3.5 million hours of spills. This sewage has direct implications on ecological and human health, increasing the environmental contaminant load in rivers. In response, Section 82 of the Continuous Water Quality Monitoring Programme mandates continuous monitoring of freshwater systems, with scope for future expansion of monitored parameters.  

Current water quality monitoring relies heavily on infrequent spot sampling, often missing key impact events, with limited spatiotemporal context. The MaD-OPS project has developed a novel sensing network for continuous monitoring of biological, chemical, and physical water quality parameters. A key focus is to demonstrate the value of a new fluorescence-based optical sensor for detecting organic pollution and bacterial contamination within a demonstrator catchment, with the potential to reveal underlying biogeochemical cycling processes. 

To isolate different pollution sources, sensor nodes have been deployed at multiple points along a river. Alongside continuous sensor data, regular spot sampling is being carried out for faecal indicator organisms, BOD₅, nutrient analysis, and microbial community profiling to provide robust ground-truthing.  

The project aims to develop a user-friendly dynamic Water Quality Index (WQI) that integrates high-frequency sensor data with machine learning, for real time assessment of river health that can be used by citizen scientists, community groups, and regulators alike. Using a novel dynamic baseline approach, the WQI will assess each sensor node relative to the least impacted section of the river at any given time.  

Preliminary results demonstrate that continuous monitoring captures point source pollution and hydrological events that are not detected through spot sampling alone. Comparison between the dynamic headwater baseline and downstream sensor nodes highlights the direct impact of point source events on river health.  

We present progress in deploying the sensing network, early insights into river health derived from high-frequency data, and how these findings are informing the development of the WQI framework. 


How to cite: Tulloch, C., Perrett, R., Coombs, M., Stanton, I., Attridge, J., Thorn, R., Smith, L., and Reynolds, D.: MaD-OPS: Monitoring & Detection of Organic Pollution from Sewage: Implementation of an agile sensing network for informing river health, EGU General Assembly 2026, Vienna, Austria, 3–8 May 2026, EGU26-18033, https://doi.org/10.5194/egusphere-egu26-18033, 2026.

EGU26-18415 | ECS | Posters on site | GI4.3

Selective Fluorescence Sensing of Methylene Blue Dye Using Yeast-Based Carbon Dots: Experimental and Computational Study 

Neeraj Chauhan, Stefan Krause, Manjinder Singh, and Amrit Pal Toor

Synthetic dyes released from textile and related industries are a major source of aquatic pollution and can pose risks to ecosystem and human health. Methylene blue (MB), a widely used cationic thiazine dye in industrial dyeing and pharmaceutical applications, is of particular concern because it can persist in water and affect photosynthetic activity, aquatic biodiversity, and water quality. However, monitoring dye contamination often relies on laboratory-based analytical techniques that are costly and time-consuming, limiting rapid assessment in field conditions.

In this study, yeast powder (a low-cost and renewable bio-precursor) was converted into fluorescent carbon dots (C-dots) using a simple one-pot hydrothermal synthesis route. The as-prepared C-dots showed excitation-dependent fluorescence emission with a clear red shift from 360 to 460 nm. Structural and chemical characterisation using UV–Vis, TEM, XPS, XRD, FTIR and Raman spectroscopy confirmed quasi-spherical particles with an average size of 3–8 nm and an amorphous carbon structure enriched with oxygen-containing functional groups. The C-dots exhibited high stability across a wide range of pH and salinity (NaCl), under prolonged UV exposure and during storage.

The C-dots were then applied as a fluorescence-based sensor for rapid and selective detection of methylene blue in water. A strong decrease in fluorescence intensity was observed upon addition of MB, with a linear response in the range of 1 ppb to 1 ppm. The sensor achieved a limit of detection (LOD) of 73.9 ppb and a limit of quantification (LOQ) of 246.4 ppb, demonstrating high sensitivity. The sensing mechanism was attributed to fluorescence quenching dominated by FRET, supported by experimental spectroscopy and computational investigations. Theoretical analysis further indicated that π–π stacking and hydrogen bonding interactions between MB molecules and the C-dot surface contribute to strong binding and enhanced selectivity.

Finally, the developed sensor was successfully applied to real water samples, showing satisfactory recoveries between 96% and 116%. Overall, this work demonstrates a green, cost-effective and highly sensitive fluorescent nanosensor for MB monitoring, offering strong potential for real-time water quality assessment and pollution control in freshwater and wastewater systems.

How to cite: Chauhan, N., Krause, S., Singh, M., and Toor, A. P.: Selective Fluorescence Sensing of Methylene Blue Dye Using Yeast-Based Carbon Dots: Experimental and Computational Study, EGU General Assembly 2026, Vienna, Austria, 3–8 May 2026, EGU26-18415, https://doi.org/10.5194/egusphere-egu26-18415, 2026.

EGU26-18591 | ECS | Orals | GI4.3

Monitoring Contaminants of Emerging Concern and eDNA off the Coast of Ireland Using Autonomous Surface Vehicles: A Spatiotemporal Study 

Nicolette Sale, Fiona Regan, Anne Parle-McDermott, Michelle Wosinski, Gerard Dooly, Luke Griffin, Dinesh Babu Duraibabu, Paulo Prodöhl, and M. Isabel Cadena-Aizaga

Contaminants of emerging concern (CECs), including pharmaceuticals, pesticides, and PFAS, have attracted increased attention due to their potential to affect the environment and human health. At the same time, environmental DNA (eDNA) can detect and monitor biological communities and can complement chemical monitoring to give a more comprehensive picture of ecosystem status. The simultaneous sampling of CECs and eDNA presents significant technical and logistical challenges and requires very sensitive techniques. Autonomous surface vehicles (ASVs) offer a flexible platform for monitoring coastal water systems, particularly when repeated or prolonged sampling is required. Their use is increasingly relevant for supporting emerging biological and chemical monitoring techniques. Despite its potential, few studies investigate seawater ecosystems using this combined approach. 


This work involves innovative monitoring of Irish coastal waters using an interdisciplinary approach that integrates expertise in engineering, chemistry, and biology. Research involving an ASV capable of reliable dynamic positioning during extended sampling operations will be shown alongside sensitive analytical techniques for investigating CECs and eDNA in seawater matrices. Results will show strategies to address a key challenge for ASV-based eDNA sampling of maintaining precise station for adequate periods while water is actively pumped through our filtration systems. Study observations include methods for sample handling to overcome the challenge of low target analyte concentration degradation, and contamination.

How to cite: Sale, N., Regan, F., Parle-McDermott, A., Wosinski, M., Dooly, G., Griffin, L., Duraibabu, D. B., Prodöhl, P., and Cadena-Aizaga, M. I.: Monitoring Contaminants of Emerging Concern and eDNA off the Coast of Ireland Using Autonomous Surface Vehicles: A Spatiotemporal Study, EGU General Assembly 2026, Vienna, Austria, 3–8 May 2026, EGU26-18591, https://doi.org/10.5194/egusphere-egu26-18591, 2026.

EGU26-18973 | Posters on site | GI4.3

Quantifying early seagrass growth with UAV imagery 

Matteo Albéri, Mohamed Abdelkader, Cinzia Cozzula, Federico Cunsolo, Nedime Irem Elek, Engin Can Esen, Ghulam Hasnain, Fabio Mantovani, Michele Mistri, Cristina Munari, Maria Grazia Paletta, Marco Pezzi, Kassandra Giulia Cristina Raptis, Andrea Augusto Sfriso, Adriano Sfriso, and Virginia Strati

Within the framework of proximal sensing, monitoring early-stage seagrass colonization in turbid waters presents challenges due to the spectral similarity between the dwarf eelgrass Zostera noltei and ephemeral macroalgae. A preliminary study previously demonstrated the utility of high-resolution Unmanned Aerial Vehicle (UAV) imagery for general monitoring through visual inspection (Mistri et al., 2025). However, the reliance on manual detection and known transplantation coordinates limits the scalability of the approach. In this study, we take a further step to overcome these limitations by applying pixel-based supervised classification to high-resolution orthomosaics. This allows for precise and quantitative tracking of the spatial evolution of seagrass meadows over time.

Ultra-high-resolution aerial surveys were conducted in the Caleri Lagoon (Po River Delta, Italy) using a DJI Air 2S UAV flown at an altitude of 7 meters, achieving a theoretical ground sampling distance of 0.2 cm/pixel. The collected imagery was processed into georeferenced orthomosaics and analyzed using a supervised Maximum Likelihood Classification algorithm based on Bayes’ theorem. To isolate the spectral signal of the target seagrass, the probabilistic framework incorporated 40 regions of interest for each of five classes: seagrass, green algae, red algae, shadow, and background. To reduce high-frequency 'salt-and-pepper' noise, a post-classification Sieve filter (20×20 pixel window) was applied, refining patch segmentation based on neighborhood mode.

Multitemporal analysis revealed a distinct non-linear expansion trajectory within the 0.5-hectare study area. Starting from a planted footprint of just 2.5 m² (~0.05% of the study area) in August 2023, the seagrass colonies expanded to 60 m² (1.2%) by June 2024, reaching approximately 716 m² (14%) by October 2025.

These results demonstrate that combining low-altitude UAV photogrammetry with probabilistic classification offers a highly repeatable and scalable framework for quantifying restoration dynamics. This methodology effectively overcomes the limitations of manual monitoring, enabling the detection of the subtle, non-linear growth patterns typical of early-stage colonization.

How to cite: Albéri, M., Abdelkader, M., Cozzula, C., Cunsolo, F., Elek, N. I., Esen, E. C., Hasnain, G., Mantovani, F., Mistri, M., Munari, C., Paletta, M. G., Pezzi, M., Raptis, K. G. C., Sfriso, A. A., Sfriso, A., and Strati, V.: Quantifying early seagrass growth with UAV imagery, EGU General Assembly 2026, Vienna, Austria, 3–8 May 2026, EGU26-18973, https://doi.org/10.5194/egusphere-egu26-18973, 2026.

Machine learning (ML) models have become essential tools for monitoring water system dynamics, enabling accurate prediction of water levels, discharge patterns, and responses to meteorological forcing. However, their operational deployment remains constrained by limited interpretability and the challenge of translating numerical outputs into actionable insight, particularly when assessing system anomalies, regime shifts, and potential impacts on aquatic and riparian habitats.

This study introduces a novel framework that integrates large language models (LLMs) as a semantic interpretation layer within ML-based hydrological monitoring systems. Building on established time-series ML architectures for water level prediction, model outputs are coupled with statistical anomaly detection techniques to identify atypical hydrological behaviour, threshold exceedances, and periods of elevated system stress relevant to near-real-time monitoring. These quantitative signals, together with meteorological drivers and system metadata, are subsequently processed by an LLM to generate structured, contextual natural-language explanations.

The proposed framework is demonstrated using historical water monitoring datasets, with particular emphasis on extreme events and hydrological anomalies. When such events are detected, the LLM synthesizes information across multiple data streams to articulate observed patterns, plausible hydro-meteorological drivers, and potential implications for water system functioning and associated habitats. Rather than replacing process-based understanding or predictive models, the LLM acts as an intelligent synthesis component that contextualizes ML outputs and supports their interpretation.

Results indicate that LLM-enhanced monitoring outputs can substantially improve transparency, interpretability, and communicability compared to conventional numerical monitoring approaches, thereby facilitating improved situational awareness and decision support during critical periods. By embedding natural-language reasoning within data-driven monitoring workflows, this work establishes a pathway toward interpretable, stakeholder-centred hydrological monitoring that aligns advanced artificial intelligence methods with practical environmental observation and management needs.

Keywords

  • Hydrological monitoring
  • Machine learning interpretability
  • Large language models
  • Water system intelligence

How to cite: slaimi, A. and Scriney, M.: Explainable Hydrological Monitoring: Large Language Models as Semantic Interpreters of Machine-Learning-Based Water System Intelligence, EGU General Assembly 2026, Vienna, Austria, 3–8 May 2026, EGU26-19125, https://doi.org/10.5194/egusphere-egu26-19125, 2026.

EGU26-19151 | ECS | Orals | GI4.3

Open-Source Fluorescence Sensing with a Turbidity Correction Model for Community-based Freshwater Monitoring 

Riccardo Cirrone, Francesco Vesprini, Amedeo Boldrini, Alessio Polvani, Xinyu Liu, Luisa Galgani, and Steven Loiselle

Monitoring and maintaining functioning freshwater habitats is increasingly challenging, despite the widespread implementation of European and international freshwater quality monitoring frameworks. With the complexities of climate change, there is a need for data with higher spatial and temporal resolution. In this context, citizen science initiatives have emerged as a valuable complement to official monitoring programs. These initiatives are particularly important in small river basins and remote rural areas, where data from environmental agencies is often sparse or unavailable. However, concerns regarding the reliability and consistency of citizen-generated data persist, highlighting the need for novel technological solutions capable of improving the quality of in situ measurements collected by volunteers.

We present a low-cost fluorometer for field measurements of phytoplankton biomass, through the measurement of chlorophyll-a, featuring a multivariate turbidity correction algorithm and automated online data upload. This open-source device aims to advance monitoring by integrating cutting-edge optical sensing with IoT connectivity and citizen science.
The sensor is integrated in a 3D-printed case and comprises an optical system with two light sources: an 820 nm LED for turbidity measurements and a 430 nm SMD LED for chlorophyll-a excitation, coupled with a long-pass optical filter. The voltage signal from the photodiode is acquired via a 16-bit analog-to-digital converter and transmitted to a microcomputer (Raspberry Pi Zero 2 W), which powers and controls the system.
Laboratory and field evaluations demonstrated that the sensor delivers accurate and reproducible measurements, achieving higher resolution and precision than measurements without turbidity correction. For ease of replication, the 3D enclosure CAD model, software, and user guidelines are openly accessible online.

How to cite: Cirrone, R., Vesprini, F., Boldrini, A., Polvani, A., Liu, X., Galgani, L., and Loiselle, S.: Open-Source Fluorescence Sensing with a Turbidity Correction Model for Community-based Freshwater Monitoring, EGU General Assembly 2026, Vienna, Austria, 3–8 May 2026, EGU26-19151, https://doi.org/10.5194/egusphere-egu26-19151, 2026.

EGU26-19435 | ECS | Orals | GI4.3

Towards an Assessment of Atmospheric Forcing on Chlorophyll-a and Turbidity in an Oligotrophic Lake: Lake Bolsena Case Study 

Valentina Terenzi, Mariano Bresciani, Cludia Giardino, Anna Joelle Greife, Monica Pinardi, Patrizio Tratzi, Flaminia Fois, and Cristiana Bassani

Chlorophyll-a (Chl-a) is commonly used as an indicator of phytoplankton biomass and eutrophication in inland waters, as it reflects changes in primary productivity and nutrient availability. Turbidity describes the optical effect of suspended particles in the water column and, in oligotrophic lakes, is typically low but highly responsive to external factors such as wind-induced mixing and precipitation. Analyzing Chl-a and turbidity together in relation to atmospheric conditions is therefore crucial for evaluating water quality and identifying potential pressures on aquatic ecosystems.
In this study, Lake Bolsena was investigated as a representative oligotrophic system to evaluate how atmospheric conditions influence Chl-a concentration and turbidity. The analysis was conducted over the lake surface and an additional surrounding land buffer of approximately 15 km, selected to account for meteorological and atmospheric processes that are not confined to the water body itself but can indirectly affect its optical and biological properties.
Chl-a and turbidity were derived from the data set (version 2.1) of the ESA Lakes_cci project based on the processing of OLCI images for the period 2016-2022. Meteorological variables considered include wind speed at 10m, 2-m air temperature, surface pressure, boundary layer height, precipitation, and solar radiation, all derived from the ERA5 reanalysis dataset (Hersbach et al., 2020). In oligotrophic lakes, wind speed regulates water column mixing and sediment resuspension, while air temperature and solar radiation influence thermal stratification and the energy available for phytoplankton growth; precipitation contributes to suspended material modifying surface optical properties. Boundary layer height and surface pressure provide additional information on atmospheric stability and mixing conditions that modulate air–water exchanges.
Aerosol Optical Depth (AOD) retrieved using the MAIAC algorithm was also included, although it is not available directly over the lake surface but only in the surrounding area (Lyapustin et al., 2018). AOD was used as a proxy for regional aerosol loading to investigate its potential indirect effects on the lake through dry and wet deposition of particulate matter and nutrients, which may alter water transparency and, over time, phytoplankton dynamics even under oligotrophic conditions.
Correlation analysis revealed significant seasonal variability throughout the studied period. Chl-a is particularly influenced by multiple atmospheric forces in autumn, while turbidity is primarily driven by meteorological factors in summer. Both water quality parameters exhibit variable but significant dependencies in spring; on the other hand, atmospheric influence is less relevant in winter.
References
Hersbach, H., et al. (2020). The ERA5 global reanalysis. Quarterly Journal of the Royal Meteorological Society, 146, 1999–2049, https://doi.org/10.1002/qj.3803
Lyapustin, A., Wang, Y., Korkin, S., and Huang, D.: MODIS Collection 6 MAIAC algorithm, Atmos. Meas. Tech., 11, 5741–5765, https://doi.org/10.5194/amt-11-5741-2018, 2018.

How to cite: Terenzi, V., Bresciani, M., Giardino, C., Greife, A. J., Pinardi, M., Tratzi, P., Fois, F., and Bassani, C.: Towards an Assessment of Atmospheric Forcing on Chlorophyll-a and Turbidity in an Oligotrophic Lake: Lake Bolsena Case Study, EGU General Assembly 2026, Vienna, Austria, 3–8 May 2026, EGU26-19435, https://doi.org/10.5194/egusphere-egu26-19435, 2026.

EGU26-21301 | ECS | Orals | GI4.3

Advancing Water Data Ecosystems: Identifying and Optimizing Connectivity and Beyond-Connectivity Requirements with 5G/6G Technologies 

Abdelhak Kharbouch, Mehdi Monemi, Pirkko Taskinen, and Mehdi Rasti

This paper examines the connectivity and beyond-connectivity requirements essential for water data ecosystems, highlighting the critical role of advanced communication technologies, such as 5G/6G, in enabling rapid, reliable data transmission for real-time monitoring and decision-making. Optimizing communication protocols supports robust infrastructure, interoperability among diverse sources, including environmental sensors, weather data, and utility-provided information, and seamless data integration and utilization, while promoting innovation, efficiency, and sustainability in water management.

The study is structured in two main parts. First, it identifies specific connectivity and beyond-connectivity requirements, focusing on the integration of various water data sources and evaluating the efficacy of communication protocols to support dynamic data integration, including capabilities like artificial intelligence, sensing, and sustainability. This forms the foundation for subsequent analysis. Second, it analyzes and optimizes connectivity services offered by 5G/6G and beyond technologies to meet these requirements, considering factors such as energy efficiency, reliability, scalability, and integrated services like sensing, AI, and computation.

The study aims to demonstrate that addressing these requirements enhances the integration and utilization of diverse water data, facilitating access to information, development of new solutions, improved understanding of water management challenges, and innovation in water supply through enhanced prediction models and more efficient, sustainable solutions. It identifies and optimizes key performance indicators (KPIs) as well as services derived from standardization bodies, tailored to water-related use cases such as leak detection, wastewater monitoring, and resource efficiency. These include ultra-low latency for critical alerts, high reliability for infrastructure control, energy efficiency in sensor networks, scalability for IoT-dense environments, and integrated AI for dynamic data processing. Anticipated insights reveal how water data ecosystems can overcome challenges like demand-supply gaps through efficient data collection, sharing, and utilization, while addressing barriers such as limited data availability and regulatory constraints. This necessitates clear visions, effective data-sharing mechanisms, and scalable architectures to drive innovation and reduce water loss.

The proposed framework facilitates informed strategies and new opportunities for stakeholders in water utilities and related sectors. This study advances the understanding of digitalization in critical infrastructure, demonstrating how optimized connectivity can promote efficiency and sustainability in water management.

How to cite: Kharbouch, A., Monemi, M., Taskinen, P., and Rasti, M.: Advancing Water Data Ecosystems: Identifying and Optimizing Connectivity and Beyond-Connectivity Requirements with 5G/6G Technologies, EGU General Assembly 2026, Vienna, Austria, 3–8 May 2026, EGU26-21301, https://doi.org/10.5194/egusphere-egu26-21301, 2026.

EGU26-22477 | Posters on site | GI4.3

Spatial Dynamics of Mercury and Phytoplankton in Lake Maggiore: An Integrated Monitoring Approach 

Martina Austoni, Laura Fantozzi, and Giorgio Luciano

Mercury contamination in freshwater ecosystems is of major concern due to its persistence, toxicity, and bioaccumulation potential.  This preliminary study investigates mercury dynamics in Lake Maggiore by integrating surface water mercury analyses with high-resolution assessments of phytoplankton structure and chlorophyll concentrations along the water column and surface water. Monitoring activities were conducted using FluoroProbe probe (BBE Moldaenke GmbH) to characterize algal groups with particular focus on the horizontal spatial distribution of both chlorophyll and mercury in proximity to tributaries and lake outlets. Surface water samples were analyzed for mercury concentrations using a Lumex RA‑915+ portable atomic absorption spectrometer, equipped with the dedicated attachment for dissolved and total mercury determination in water, while FluoroProbe profiles were used to quantify algal group composition and chlorophyll distribution. Results reveal marked spatial heterogeneity in mercury concentrations, closely associated with tributary zones and changes in chlorophyll patterns, suggesting coupling between hydrological inputs, phytoplankton dynamics, and mercury behavior. This integrated monitoring approach improves understanding of mercury–ecosystem interactions in large lake systems and supports the development of effective monitoring and management strategies for freshwater environments.

How to cite: Austoni, M., Fantozzi, L., and Luciano, G.: Spatial Dynamics of Mercury and Phytoplankton in Lake Maggiore: An Integrated Monitoring Approach, EGU General Assembly 2026, Vienna, Austria, 3–8 May 2026, EGU26-22477, https://doi.org/10.5194/egusphere-egu26-22477, 2026.


Muography is a rapidly evolving interdisciplinary field that uses cosmic-ray muons to image the internal structure of large objects. Muons are highly penetrating particles whose energy loss depends on the distance traveled in a medium (e.g., rock) and on the medium’s density. By detecting and analyzing muons that pass through an object, it is possible to reconstruct its internal density distribution. This emerging method offers new opportunities in areas such as mining, volcano monitoring, cave exploration, archaeology, and structural diagnostics.

The muography project portfolio of HUN-REN Wigner Research Centre for Physics is actively engaged in developing hardware and software for muography detectors, as well as in advancing data-processing techniques and exploring potential applications. We maintain several international collaborations, within which multiple successful measurements have been conducted in active European mines.

In this presentation, we focus on muograpic measurements conducted in the Jánossy Underground Laboratory. This lab is located on the KFKI Campus in Budapest, Hungary, provides a well-characterized environment ideally suited for testing our detectors and evaluating the various steps of muography data processing. The main objective of this measurement program is to build a comprehensive dataset that supports the refinement of data processing methods, the testing of different inversion techniques, and precision parameter analysis using well-defined artificial anomalies (tunnels). We will discuss the results of a series of measurements carried out at the laboratory and the developments derived from these studies: 

- validation of the direct problem

-inversion distortion analysis and sensitivity test

-precision parameter analysis (diameter, direction, position) using known tunnels 

How to cite: Stefán, B. A., Hamar, G., Balázs, L., and Surányi, G.: Development of muography data processing and procedures, inversion and precision parameter analysis based on measurements performed at the Jánossy Underground Laboratory, EGU General Assembly 2026, Vienna, Austria, 3–8 May 2026, EGU26-1255, https://doi.org/10.5194/egusphere-egu26-1255, 2026.

Cosmic-ray neutron sensing (CRNS) has emerged as a powerful tool for monitoring near-surface water across a wide range of spatial scales, from soil moisture and snowpack on Earth to hydrogen mapping on planetary surfaces. While most terrestrial CRNS applications focus on environments with appreciable liquid water, far less is known about neutron behavior in extremely dry systems where hydrogen is sparse and primarily bound in minerals. These conditions are directly relevant to planetary neutron spectroscopy and provide an opportunity to connect environmental CRNS research with space science.

Here we present results from portable CRNS deployments at ultra-dry terrestrial analog sites, including Alvord Desert, Oregon, and the Namib Desert, Namibia. These campaigns targeted sites spanning very dry to dry conditions, dune and interdune settings, and minimal vegetation, allowing us to examine local-scale variability in moderated and bare neutron measurements under low-moisture endmember conditions. We apply state-of-the-art corrections for atmospheric pressure, water vapor, and incoming cosmic-ray intensity, and propagate counting statistics to assess uncertainty at rover-scale and field-scale integration times.

A central motivation for this work is the interpretation of passive neutron data acquired by the Dynamic Albedo of Neutrons (DAN) instrument on the Curiosity rover following the loss of its active pulsed neutron generator. Unlike terrestrial CRNS studies, Mars lacks direct ground-truth soil moisture measurements, and near-surface liquid water or ice is unstable at equatorial latitudes. As a result, the neutron signal is dominated by mineral-bound hydrogen and bulk composition effects. The terrestrial analog sites presented here provide a controlled framework for understanding neutron sensitivity, spatial variability, and correction strategies in similarly dry environments, while leveraging active neutron measurements and in situ sensors on Earth as calibration anchors.

Our results demonstrate that even under extremely dry conditions, corrected neutron counts exhibit measurable spatial and temporal structure, and that uncertainties associated with environmental corrections can be comparable to or exceed those from counting statistics. These findings highlight the value of cross-disciplinary collaboration between planetary science and environmental CRNS communities, and suggest that dry terrestrial analogs can play a key role in improving neutron-based water detection and modeling across Earth and planetary applications.

How to cite: Hardgrove, C. and Franz, T.: Cosmic-Ray Neutron Sensing in Ultra-Dry Environments: Linking Terrestrial Mars Analogs and Planetary Neutron Spectroscopy, EGU General Assembly 2026, Vienna, Austria, 3–8 May 2026, EGU26-3177, https://doi.org/10.5194/egusphere-egu26-3177, 2026.

The need to measure soil moisture accurately and continuously and to monitor its climatic impact has moved into the public focus through the rising number of flood events and droughts in recent years. Currently the German Meteorological Service (DWD) operates a soil moisture viewer based on the soil-vegetation-atmosphere-model AMBAV and provides agrometeorological consultation. In addition to modelled soil moisture data, several institutions and some federal states started to set up their own soil moisture observations locally, but a nationwide observation network is still lacking in Germany.

The DWD’s internal project IsaBoM (“Integration of standardized and automatized soil moisture measurements in the DWD observation network”) aims to prepare the introduction of automized soil moisture measurements with two complementary measuring systems (in-situ sensors and Cosmic-Ray Neutron Sensing - CRNS), following the guidelines of the WMO (World Meteorological Organization) to permanently monitor this essential climate variable. The project’s tasks are, amongst other aspects, testing and selecting suitable sensors and calibration procedures, setting up data analysis methods, preparing the automatic dataflow and public data provisioning and ultimately providing solutions to integrate the soil moisture data into the existing operational models.

Here, we present the progress of the project IsaBoM for the preparation of a nationwide soil moisture network starting with 20 preliminary designated stations of the DWD’s operational network, where the chosen locations are representative of the soil properties and climatic conditions throughout Germany, while also being equally distributed geographically. We report on first results from our two test sites in Braunschweig and Dürnast (Freising), where the parallel measurements of multiple arrays of in-situ sensors and several CRNS sensors are tested on two operational DWD measurement sites differing in soil type and climate and providing additional meteorological measurements. We show first comparisons of soil moisture estimates from CRNS detectors with different sensitivities and the observed effects of precipitation, vegetation cover and irrigation on the signal.  The CRNS signals at both stations are calibrated using repeated soil sampling campaigns with varying equipment. Additionally, experimental sensor layouts (arrangement of in-situ profiles towards the CRNS) are used to further test the comparability and synergies between the two systems.

Feasible solutions and means for the optimal utilization of both soil moisture measuring systems, while adapting to the particular conditions when deployed on operational meteorological measurement sites, are discussed with regards to the chances and challenges from the perspective of a meteorological service.

How to cite: Albert, M., Herbst, M., Hufnagl, L., Kurtz, W., and Lenkeit, J.: Integration of in-situ and Cosmic-Ray Neutron Sensing derived soil moisture measurements into the observation network of the German Meteorological Service – progress of the project IsaBoM, EGU General Assembly 2026, Vienna, Austria, 3–8 May 2026, EGU26-4197, https://doi.org/10.5194/egusphere-egu26-4197, 2026.

EGU26-4249 | ECS | Posters on site | GI4.7

Characterizing Multi-Timescale Soil Moisture Memory across Australia's CosmOz Network 

Nagesh Mishra, Nikhil Rajdeep, Subbarao Pichuka, Robert Faggian, and David McJannet

Memory effects are ubiquitous in geophysical systems, arising from internal dynamics and interactions with external forcings across multiple timescales. Within land surface systems, soil moisture memory is a key factor governing land–atmosphere feedbacks, influencing the intensity, persistence, and predictability of hydro-climatic extremes such as droughts and floods. This study quantifies soil moisture memory across the CosmOz-Australia network using long-term Cosmic Ray Neutron Sensing (CRNS) observations and characterizes memory across land surface and meteorological timescales.

The CRNS technique offers a novel, field-scale measurement of soil moisture with high temporal resolution and a time-varying effective sensing depth, thereby overcoming the limitations of traditional point-scale observations and enabling the robust characterization of soil moisture memory across various timescales. Despite the widespread application of CRNS data for soil moisture monitoring and validation, their potential for systematic, multi-timescale soil moisture memory estimation has not yet been explored.

This study estimates the short-term energy-limited (τs) and long-term water-limited (τL) memory components applying a hybrid stochastic-deterministic modeling framework that represents rapid surface-layer responses and slower root-zone and subsurface controls at the land surface scale. In addition, to capture memory at the meteorological scale, we estimate a non-parametric, model-free entropy-based effective memory timescale that quantifies information persistence beyond linear correlations, and compute the e-folding memory timescale as a standard measure of decorrelation. Results reveal pronounced spatial heterogeneity in soil moisture memory across Australia. Short-term memory is consistently low (median τs ≈ 0.3–1.0 days), reflecting rapid drying over the effective sensing depth and low memory in drylands. Long-term memory (median τL ≈ 4–11 days) is highest over the humid eastern and south-eastern regions, consistent with a water-limited evapotranspiration regime where higher precipitation frequency, lower aridity, finer soils, and denser vegetation enhance root-zone storage and slow anomaly decay. Entropy-based effective memory ranges from approximately 19 to 36 days, indicating substantial information retention at monthly timescales, while e-folding timescales extend up to ~70 days in temperate and monsoon-influenced regions. The strong spatial agreement between entropy-based and correlation-based metrics suggests robust and consistent soil moisture memory regimes across Australia, highlighting their dependence on hydro-climate, soil texture, and vegetation. The results provide observation-based characterization of multi-timescale soil moisture memory using CRNS data, with important implications for land surface model evaluation, drought diagnostics, and sub-seasonal to seasonal climate forecasting.

How to cite: Mishra, N., Rajdeep, N., Pichuka, S., Faggian, R., and McJannet, D.: Characterizing Multi-Timescale Soil Moisture Memory across Australia's CosmOz Network, EGU General Assembly 2026, Vienna, Austria, 3–8 May 2026, EGU26-4249, https://doi.org/10.5194/egusphere-egu26-4249, 2026.

EGU26-7994 | ECS | Orals | GI4.7

Bridging Synthetic Modeling and Field Reality: Assessing Dry-Region Dominance in Cosmic-Ray Neutron Sensing via Geophysical Integration 

Viola Cioffi, Luca Peruzzo, Matteo Censini, Mirko Pavoni, Francesca Manca, Markus Köhli, Jannis Weimar, and Giorgio Cassiani

The accurate quantification of field-scale volumetric water content (VWC) is a critical requirement across multiple disciplines, from optimizing irrigation in precision agriculture to assessing slope stability and managing regional water resources. Cosmic-Ray Neutron Sensing (CRNS) is a pivotal non-invasive technology, providing integrated VWC estimates over large footprints (10–20 hectares) and significant depths (up to 80 cm). However, the interpretation of CRNS data in heterogeneous environments remains challenging. The inherently non-linear relationship between neutron intensity and hydrogen content, combined with a complex spatial weighting function, leads to "dry-region dominance," where the sensor response is disproportionately influenced by the drier portions of the soil. This research investigates these effects through a multidisciplinary workflow that integrates CRNS monitoring with preliminary geophysical spatial characterization. The first stage involved a purely synthetic investigation using the URANOS Monte Carlo neutron transport code to replicate the subsurface heterogeneity of the Borgo Grignanello site (Siena, Italy). To ensure a controlled and quantifiable comparison, the site was represented through a simplified two-region ground model characterized by distinct VWC values, constrained by several high-resolution Electrical Resistivity Tomography (ERT) transects and Electromagnetic Induction (EMI) data. This simplified framework provided a robust "forward model" and numerical proof of the dry-region bias: the derived VWC in the heterogeneous domain demonstrated an agreement with RMSE of 1.01% with the values of the drier region.

To provide empirical evidence for these synthetic findings, the second part of the research compares real CRNS time series with local TDR sensors during selected infiltration events. Given that the local sensors are positioned within the wetter units of the site, a significant incongruence between the two datasets is observed. This discrepancy serves as a direct experimental validation of the dry-region dominance predicted by the forward model, confirming that the CRNS signal is governed by the drier soil components, which effectively overshadow the moisture values of the wetter units in such heterogeneous contexts.

In conclusion, this work demonstrates that a multidisciplinary geophysical strategy is key to a more accurate interpretation of CRNS datasets. By integrating synthetic modeling with prior site characterization, this framework provides the reliable, spatially-aware insights necessary for effective hydrological modeling, natural hazard mitigation, and sustainable land management

How to cite: Cioffi, V., Peruzzo, L., Censini, M., Pavoni, M., Manca, F., Köhli, M., Weimar, J., and Cassiani, G.: Bridging Synthetic Modeling and Field Reality: Assessing Dry-Region Dominance in Cosmic-Ray Neutron Sensing via Geophysical Integration, EGU General Assembly 2026, Vienna, Austria, 3–8 May 2026, EGU26-7994, https://doi.org/10.5194/egusphere-egu26-7994, 2026.

EGU26-8396 | Posters on site | GI4.7

Recent developments in cosmic ray soil moisture observing system in Slovenia 

Rozalija Cvejić, Martina Bavec, Matjaž Glavan, Nejc Golob, Marija Klopčič, Tamara Korošec, Matjaž Mikoš, Boštjan Naglič, Matic Noč, Urša Pečan, Tatjana Pirman, Maja Podgornik, Denis Rusjan, Špela Srdoč, Denis Stajnko, Žiga Švegelj, and Vesna Zupanc

Reliable soil moisture observations are pivotal for informing sustainable agricultural decisions under an ongoing changing climate. A cosmic-ray soil moisture observing system (SI-COSMOS) network was established for the period 2025-2040 to enhance soil moisture monitoring in Slovenia. The rationale was based on extensive experience with point soil moisture sensors in operational decision-making at the farm level, where they proved highly vulnerable to damage from land operations and wildlife activity. At the same time, the information was limited to micro-local conditions. As an alternative, a less vulnerable, non-invasive, intermediate soil-moisture network was established. As of Jan 2026, the network consists of 14 cosmic ray neutron sensors (CRNS). In this contribution, we present the network architecture, current calibration experiences, and discuss the network's role in the national and international context.

SI-COSMOS locations spread across the Continental, Alpine, Karst, Mediterranean, and Pannonian regions. Installed are lithium fluoride and boron carbide-based CRNS. The network's elevation ranges from 10 m to 500 m above sea level. Land use at locations includes olive groves (3), grasslands and pastures (2), hop plantations (2), mixed land-use systems (6), and forest (1), mainly under rainfed, but also irrigated (drip, drum, and pivot) conditions. Soil moisture is captured in various soil types.

At the national scale, the vision of SI-COSMOS is to support investigating soil–water-plant–atmosphere interactions under diverse climate, land-use, and soil conditions, to support improved drought detection and management, as well as hydrological modelling and applications. Additionally, the network aims to further develop and validate surface soil moisture products based on remote sensing or modelled data, for improved large-scale soil moisture observations at the national and international scales. Products based on SI-COSMOS will support development of transferable real-time land management tools for enhanced water resilience.

Acknowledgements: This research was funded by the Slovenian Research Agency (ARRS) with a grant to the Ph.D. students Nejc Golob and Špela Srdoč, and partially supported by research programme P4-0085, national targeted research project (V4-2406), Interreg Alpine Space program, project Alpine Space Drought Prediction (A-DROP) (grant number 101147797), European Union – LIFE Programme (LIFE23-IPC-SI-LIFE4ADAPT), OPTAIN Horizon 2020 (grant number 862756), the NextGenerationEU project ULTRA 4. Sustainable Environment, and the Slovenian CAP Strategic Plan 2023–2027.

How to cite: Cvejić, R., Bavec, M., Glavan, M., Golob, N., Klopčič, M., Korošec, T., Mikoš, M., Naglič, B., Noč, M., Pečan, U., Pirman, T., Podgornik, M., Rusjan, D., Srdoč, Š., Stajnko, D., Švegelj, Ž., and Zupanc, V.: Recent developments in cosmic ray soil moisture observing system in Slovenia, EGU General Assembly 2026, Vienna, Austria, 3–8 May 2026, EGU26-8396, https://doi.org/10.5194/egusphere-egu26-8396, 2026.

EGU26-11143 | ECS | Posters on site | GI4.7

Estimation of Spatiotemporal Soil Moisture Dynamics in a Temperate Organic Alley Cropping System in Hessen, Germany 

Alvin John Felipe, Farimah Asadi, Lutz Breuer, and Suzanne Jacobs

The exponentially growing population drives the intensification of agricultural production, which contributes to land and water quality degradation, biodiversity loss, and climate change. In this regard, nature-based solutions like silvoarable agroforestry systems, which integrate trees on arable land, have taken a new dawn due to their potential multifaceted benefits derived from nature’s contributions to people. Among the limiting factors in sustainable agricultural production is water availability, which governs biogeochemical processes, such as the regulation of material fluxes, nutrient availability and movement, carbon sequestration, microbial activity, and modification of soil properties. In temperate agroforestry systems, soil moisture regimes are not well understood. Efforts in collecting long-term data are of high importance, particularly in determining how agroforestry systems in temperate climates affect water availability and, therefore, their potential to support food production under current and future climate conditions. Knowledge of soil moisture could help in understanding whether agroforestry systems improve water availability for crop growth, which would offer resilience against droughts, or, on the other hand, cause competition with trees that reduces soil moisture availability.

In this ongoing study, we investigate point- and field-scale soil moisture dynamics in a six-year-old organic alley cropping system in Hessen, Germany. The system consists of six strips of 3-meter-wide tree rows with apple, poplar, and timber trees, alternated with 18-meter-wide crop alleys. We instrumented three transects with Frequency Domain Reflectometry (FDR) soil moisture sensors at 1, 2.5, 6, and 10.5 meters perpendicular from the tree row (upslope and downslope) at 10, 40, and 60 cm depths, to study soil moisture dynamics along the tree-crop interface. We also employed three cosmic ray neutron sensors (CRNS) to assess the field-scale trend and dynamics of the soil moisture based on the inverse relationship of the amount of hydrogen (water) in the soil and the intensity of epithermal neutrons over its dynamic footprint. Here, we present our experimental setup to capture both the transect-point scale and field-scale spatiotemporal soil moisture patterns and show preliminary findings for a full cropping season. Such an approach has the potential to provide soil moisture data at different scales relevant to efficient system design, tree-crop species selection, and agricultural water management.

How to cite: Felipe, A. J., Asadi, F., Breuer, L., and Jacobs, S.: Estimation of Spatiotemporal Soil Moisture Dynamics in a Temperate Organic Alley Cropping System in Hessen, Germany, EGU General Assembly 2026, Vienna, Austria, 3–8 May 2026, EGU26-11143, https://doi.org/10.5194/egusphere-egu26-11143, 2026.

EGU26-11732 | Orals | GI4.7

Can Cosmic Rays Neutron Sensors provide valuable data about space weather events? 

Gianmarco Cracco, Enrico Gazzola, Martin Schrön, Roberto Salzano, Solveig Landmark, Tino Rödiger, and Andre Daccache

Cosmic Rays Neutron Sensing (CRNS) is a method to derive the amount of water in the environment by the measurement of neutron albedo in the proximity of the soil. The signal is strongly affected by the incoming cosmic rays modulation, requiring a continuous real-time correction that is typically achieved by taking as a reference the observations provided by the Neutron-Monitor DataBase (NMDB). Using the incoming flux of muons as a reference has been proposed as an alternative method of correction by Finapp, whose CRNS detector is capable of contextually measuring both neutrons and muons.

What is noise for some can be signal for others, which leads to increasing collaboration between the CRNS and the Space Weather communities. While CRNS devices cannot provide a level of accuracy and resolution comparable to dedicated neutron monitors, they would compensate with the number of deployed detectors. Being low-cost, easy to install and maintain, their use is spreading fast for various purposes, from agriculture to environmental monitoring. This can be seen as a low-cost world-wide diffuse observatory, potentially with a much higher spatial density than the NMDB and spontaneously growing.

Assessing how neutron and muon count rates measured by these devices are affected by space weather events, like Forbush decreases or Ground-Level Enhancements (GLE), could increase the understanding and monitoring of such events by providing a mapping of their impact on the Earth surface. If the CRNS station is equipped with a Finapp detector, the contextual detection of muons can provide additional information.

In this presentation we will analyze how a small set of Finapp CRNS probes, located in different locations of Earth, responded to some major events of Furbush decrease or GLE, in the neutron and muon count rate signals. The set includes, among others, two probes located in NMDB sites (OULU and JUNG) and a probe installed in Svalbard. This aims to be an example of the potential interest of CRNS for Space Weather investigation. A large database of collected data may be already available and underused.

Acknowledgement

We acknowledge the NMDB database (www.nmdb.eu), founded under the European Union's FP7 programme (contract no. 213007) for providing data. Jungfraujoch neutron monitor data were kindly provided by the Physikalisches Institut, University of Bern, Switzerland. Oulu neutron monitor data were kindly provided by the Sodankyla Geophysical Observatory (https://cosmicrays.oulu.fi). CaLMa neutron monitor data were kindly provided by the Space Research Group (SRG-UAH), University of Alcala, Spain.

How to cite: Cracco, G., Gazzola, E., Schrön, M., Salzano, R., Landmark, S., Rödiger, T., and Daccache, A.: Can Cosmic Rays Neutron Sensors provide valuable data about space weather events?, EGU General Assembly 2026, Vienna, Austria, 3–8 May 2026, EGU26-11732, https://doi.org/10.5194/egusphere-egu26-11732, 2026.

EGU26-12026 | Posters on site | GI4.7

Automated Contextual Pre-processing of Mobile Rail-CRNS Measurements for Large-Scale Soil Water Content Assessment  

Daniel Altdorff, Solveig Landmark, Steffen Zacharias, Sascha E. Oswald, Peter Dietrich, Attinger Attinger, and Martin Schrön

Soil water content (SWC) is a key variable in hydrology, agriculture, and climate research, but large-scale measurements remain challenging due to spatial heterogeneity and logistical limitations. Stationary Cosmic Ray Neutron Sensing (CRNS) provides intermediate-scale estimates (~200m footprint), yet covers only local areas. Mobile Rail-CRNS platforms overcome this by enabling continuous SWC mapping along hundreds of kilometers of railway networks. In 2024, the UFZ operated five such Rail-CRNS systems, collecting data up to hundredth of kilometer daily across diverse landscapes in Germany. However, rail roving multiplies exposure to dynamic environmental influences (e.g., tunnels, bridges, parallel tracks, urban areas, water bodies, roads, topography, biomass/forest types), which can systematically bias neutron signals. Further, inaccuracies in GPS positioning can cause the measurement positions to be several meters off the track. At this data volume, manual screening is infeasible, automated detection, flagging, and quantitative scoring of these influences are required for data quality control and correction.

Here we present a fully automated, Python-based pre-processing pipeline that evaluates measurements at both point and segment levels. GPS positions are first snapped to OSM railway tracks (nearest-points projection) to correct for localization errors. Each point is then queried for proximity to OSM features, tree species from the German Aerospace Center and DEM-derived topography, using configurable minimum feature sizes (e.g. length of a river, tunnel), influence radii, and weights (e.g., tunnel > bridge). These parameters can be flexibly adjusted and regionally adapted. To address the integral nature of mobile measurements, we introduce segment-based scoring: Intervals between consecutive points are subdivided into subsamples (minimum 3, additional every ~10 m for longer segments), incorporating direction (azimuth) for asymmetric effects (e.g., lateral slopes) guaranteeing its real length but its planar projection. Influences are evaluated proportionally. In addition, for segments above a defined length, a speed flag is added to indicate reduced data density and reliability.

An interactive map allows you to review the selected settings in relation to the potentially influencing features: Segment colors reflect its cumulative scores, flags as rings in relation to its cause, and geo-layers toggleable. Mouse-over tooltips provide instant score breakdowns for iterative parameter tuning.

The pipeline enables targeted filtering of uncertain segments, application of region- or forest-type-specific correction factors, and integrative comparison of land-use groups (point vs. segment scale). Initially tested on a pilot transect in the Harz Mountains (~ 8 km), ~60% were marked as having substantial impacts, demonstrating its necessity as well as its robustness and practical applicability. Fully transferable across Germany, it paves the way for consistent, large-scale Rail-CRNS SWC mapping. Future steps include machine-learning-based weight optimization.


How to cite: Altdorff, D., Landmark, S., Zacharias, S., Oswald, S. E., Dietrich, P., Attinger, A., and Schrön, M.: Automated Contextual Pre-processing of Mobile Rail-CRNS Measurements for Large-Scale Soil Water Content Assessment , EGU General Assembly 2026, Vienna, Austria, 3–8 May 2026, EGU26-12026, https://doi.org/10.5194/egusphere-egu26-12026, 2026.

EGU26-12686 | ECS | Posters on site | GI4.7

Cosmic Ray Neutron Sensing (CRNS) as a Space Weather Tool? 

Hanna Giese, Stephan Böttcher, Bernd Heber, Konstantin Herbst, Lasse Hertle, and Martin Schrön

Since mid 2024 a CRNS detector has been installed in Kiel close to the Kiel neutron monitor (NM). The latter is a measure of the incoming cosmic ray induced neutron environment and is used to correct the CRNS data in order to determine the soil moisture in the surrounding area of the system. 
The fact that the CRNS detector and the NM are at the same location allows a unique insight into the correlation of both measurements. Since both count rates are expected to decrease during Forbush Decreases (FDs) we can investigate their correlation during all FDs observed from mid 2024. In contrast, the correlation is far lower during the occurrence of rain events, which can lead to a similar shaped decrease in the count rate. The analysis has been repeated utilizing NMs at different locations (e.g. Jungfraujoch) in order to estimate the uncertainties of the above analysis. Furthermore, the count rates of different CRNS detectors have been compared for FDs as well as rain events to see if a distinction between both is possible without the use of a NM.

How to cite: Giese, H., Böttcher, S., Heber, B., Herbst, K., Hertle, L., and Schrön, M.: Cosmic Ray Neutron Sensing (CRNS) as a Space Weather Tool?, EGU General Assembly 2026, Vienna, Austria, 3–8 May 2026, EGU26-12686, https://doi.org/10.5194/egusphere-egu26-12686, 2026.

EGU26-13972 | Orals | GI4.7

Assessing an empirical approach to derive SWE from CRNS for pre‑alpine to high‑alpine locations 

Benjamin Fersch, Nora Krebs, and Paul Schattan

When high‑energy cosmic rays strike the upper atmosphere, they produce cascades of secondary particles, including fast neutrons that reach the Earth's surface. These neutrons are efficiently moderated by collisions with hydrogen atoms; consequently, the intensity of the neutron flux above ground decreases in proportion to the amount of water present—whether stored in the soil, in liquid form, or frozen as snow.

A stationary cosmic-ray neutron sensing (CRNS) detector records counts of these epithermal neutrons, and a single local water‑content reference is sufficient to convert the count rate into a quantitative estimate of soil moisture. The count‑versus‑moisture relationship has been shown to be remarkably consistent across diverse soils, climates, and geographic regions.

Because the calibration curve is essentially universal, typically only a single in‑situ reference measurement is required; thereafter, and retrospectively, the detector can continuously monitor spatially integrated changes in soil moisture. This simplicity has established CRNS as a valuable tool for agricultural water management, hydrological research, and field‑scale climate monitoring.

In contrast, converting neutron counts to snow water equivalent (SWE) for a sensor positioned above the snowpack has required extensive site‑specific calibration, which has hindered rapid network expansion. This difficulty arises from discrepancies between theoretical models and the limited empirical data available.

Based on a compilation of extensive in‑situ measurements at several montane locations within the Pre‑Alpine Terrestrial Environmental Observatory (TERENO Pre‑Alpine), we derived a set of empirical coefficients for the count–SWE relationship. Most locations in our dataset show good agreement with these empirical coefficients, although some outliers exist. Nevertheless, this empirical approach can reduce the effort required to establish new CRNS stations for SWE monitoring. We also evaluate transferability to alpine–nival sites—characterized by shallow soils, steep topography, and very high SWE—and analyze causes of deviations in the empirical approach’s performance due to site-specific environmental conditions.

How to cite: Fersch, B., Krebs, N., and Schattan, P.: Assessing an empirical approach to derive SWE from CRNS for pre‑alpine to high‑alpine locations, EGU General Assembly 2026, Vienna, Austria, 3–8 May 2026, EGU26-13972, https://doi.org/10.5194/egusphere-egu26-13972, 2026.

EGU26-16311 | ECS | Posters on site | GI4.7

Long Short-Term Memory model to predict root zone soil water content from neutron count measured by Cosmic Ray Neutron Sensing 

Atina Umi Kalsum, Pieter Janssens, Jan Vanderborght, and Jan Diels

Accurate estimation of soil water content in the root zone (e.g., 0 – 30 cm) is essential for designing irrigation schedules and requires measurements that represent the field scale. Cosmic Ray Neutron Sensing (CRNS) offers a non-invasive solution that provides integrated soil moisture measurements with a horizontal footprint of approximately 7 to14 hectares and depths ranging from 15 to 83 cm, making it suitable in an area with a homogenous land use, like agricultural fields. However, CRNS sensitivity varies with both distance and depth relative to the sensor, complicating its use for estimating soil moisture in specific layers. When soil moisture is known, it is feasible to perform a forward calculation to derive neutron counts from soil water content. In this study, such calculations were performed using COSMIC, integrated with the HYDRUS-1D model. However, backward calculations, deriving soil water content from neutron counts, are not straightforward. This is because wetting and drying processes start at the soil surface, where CRNS is most sensitive. Consequently, the integrated measurement disproportionately reflects changes in the upper layers, creating a non-unique or hysteretic relationship between neutron counts and soil moisture during wetting and drying cycles. This makes predicting the 0 – 30 cm water content from neutron counts particularly challenging.

To address these limitations, we explore the application of the Long Short-Term Memory (LSTM) model to predict the average soil water content in the 0 – 30 cm layer by training the model using time series of average 0 – 30 cm soil water content and neutron counts (simulated with HYDRUS-1D COSMIC) as well as meteorological data (precipitation and reference evapotranspiration). The LSTM model is well-suited because it can learn temporal dependencies and patterns of long sequence data. The initial simulations were based on three years record of synthetic data under bare soil conditions for a region in Flanders, Belgium. While initial findings indicate a potential, further research will focus on improving the model’s robustness by training the model with more diverse variables, expanding the dataset, and integrating field measurement soil moisture records to enhance its applicability across different scenarios. This research highlights the feasibility of combining CRNS measurement, physically based modelling, and data-driven techniques to improve soil moisture estimation for irrigation management.

How to cite: Kalsum, A. U., Janssens, P., Vanderborght, J., and Diels, J.: Long Short-Term Memory model to predict root zone soil water content from neutron count measured by Cosmic Ray Neutron Sensing, EGU General Assembly 2026, Vienna, Austria, 3–8 May 2026, EGU26-16311, https://doi.org/10.5194/egusphere-egu26-16311, 2026.

EGU26-18160 | Posters on site | GI4.7

The SoMMet characterization of a Finapp Cosmic-Ray Neutron Sensor and its first real-world application 

Enrico Gazzola, Zdenek Vykydal, Rudi Nadalet, Martin Pernter, Roberto Dinale, Stefano Gianessi, and Barbara Biasuzzi

Cosmic Ray Neutron Sensing (CRNS) has been established as a reliable method for measuring Soil Moisture (SM) at an intermediate spatial scale, bridging the gap between point-scale measurements and satellite observations. While CRNS stations are increasingly included in meteorological and environmental monitoring networks, integration and intercomparison between different methods remain tricky.

Different technologies not only explore different scales of observations, but they do that through different physical methods, with possibly different responses to the same event. CRNS relies on the correlation of SM with the count of environmental neutrons, generated by cosmic rays and absorbed by hydrogen in water. While a standard conversion formula is widely used, it’s known to significantly deviate from experimental validation under extreme conditions of either dryness or wetness. For this reason, new formulas have been proposed and are in a phase of validation.

The SoMMet (Soil Moisture Metrology) project, funded by EURAMET (European Partnership on Metrology), was set up to develop metrological tools to enhance traceability and harmonization across different methods of SM observation. As part of the SoMMet project activities, various commercial CRNS probes were tested in SI-traceable reference neutron fields at participating national metrology institutes. The understanding of detector performance under laboratory conditions and the validation of Monte Carlo (MC) neutron transport modelling can be used to predict the detector response under real field conditions.

The development and validation of the specific MC model for the CRNS detector manufactured by Finapp has been recently published by the SoMMet Collaboration [1] and it introduces a new conversion formula. We will here review the SoMMet activities on characterization and MC model validation of the Finapp CRNS probe, performed in the reference neutron fields of Czech Metrology Institute (CMI) and Slovak Institute of Metrology (SMU) and consequent model verification at the Physikalisch-Technische Bundesanstalt (PTB), Germany.

As a first application to real-world conditions, we apply the SoMMet conversion formula to the datasets of two automated snow stations managed by the Office for Hydrology and Dams of the Civil Protection Agency of the Autonomous Province of Bolzano, Italy, equipped with Finapp CRNS sensors. The two sites (Pian dei Cavalli and Malga Fadner) are mountain sites at elevations above 2000 m, characterized by a very low soil bulk density and a very high water content, with presence of peatland in the footprint. The CRNS measurement was calibrated by the standard gravimetric campaign, but the standard conversion formula provides physically unrealistic results. The formula proposed by SoMMet is successfully applied.

[1] Z. Vykydal et al. (2025), Monte Carlo Simulation and Experimental Validation of the Finapp Model 3 Cosmic-Ray Neutron Sensor. Meas. Sci. Technol., in press, DOI:10.1088/1361-6501/ae2649

Aknowledgments: The project 21GRD08 SoMMet received funding from the European Partnership on Metrology, co-financed from the European Union’s Horizon Europe Research and Innovation Programme and by the Participating States.

How to cite: Gazzola, E., Vykydal, Z., Nadalet, R., Pernter, M., Dinale, R., Gianessi, S., and Biasuzzi, B.: The SoMMet characterization of a Finapp Cosmic-Ray Neutron Sensor and its first real-world application, EGU General Assembly 2026, Vienna, Austria, 3–8 May 2026, EGU26-18160, https://doi.org/10.5194/egusphere-egu26-18160, 2026.

EGU26-18390 | ECS | Orals | GI4.7

Latitude Survey of Neutrons and Muons to Determine Cosmic Ray Neutron Sensing YieldFunction 

Lasse Hertle, Fraser Baird, Ulrich Schmidt, Bernd Heber, Michael Walter, Nora Krebs, Paul Schattan, Peter Dietrich, Steffen Zacharias, Solveig Landmark, Daniel Rasche, Marco Kossatz, Gary Womack, Steve Hamann, Enrico Gazzola, and Martin Schrön

Cosmic Ray Neutron Sensing (CRNS) is a ground based technique that utilises epithermal neutron measurements as a proxy for environmental hydrogen content. Similarly, to other ground based cosmic ray detectors (e.g. neutron monitors), CRNS detectors observe the solar cycle and space weather events. Typically, these effects must be corrected, but CRNS detectors have also been specifically used to observe space weather. The specific sensitivity of CRNS detectors to the primary spectrum and the relationship to other cosmic ray measurements is not fully understood. During the maximum of solar cycle 25 a latitude survey utilising a mini neutron monitor (MNM), two CRNS detectors of different design and a muon telescope was undertaken onboard the German Research Vessel Polarstern. The observations are used to derive differential response functions and yield functions for two neutron detectors. While the differential response, between neutron detectors is similar, it strongly deviates between muon and neutron detectors. The yield functions of CRNS and MNM are in good agreement with each other, indicating that CRNS detectors and MNM observe a comparable range of the primary cosmic ray spectrum.

How to cite: Hertle, L., Baird, F., Schmidt, U., Heber, B., Walter, M., Krebs, N., Schattan, P., Dietrich, P., Zacharias, S., Landmark, S., Rasche, D., Kossatz, M., Womack, G., Hamann, S., Gazzola, E., and Schrön, M.: Latitude Survey of Neutrons and Muons to Determine Cosmic Ray Neutron Sensing YieldFunction, EGU General Assembly 2026, Vienna, Austria, 3–8 May 2026, EGU26-18390, https://doi.org/10.5194/egusphere-egu26-18390, 2026.

EGU26-19012 | Orals | GI4.7

Exploring the inner structure of Esztramos Hill using cosmic rays 

Bence Rábóczki, Gergely Surányi, László Balázs, and Gergő Hamar

Cosmic-ray muography is a developing geophysical method that uses high energy cosmic muon particles to explore the inner structure of large objects, such as volcanoes, pyramids or mountains. Cosmic muons originate from upper atmosphere and have a known, steady, angle dependent flux on the surface. Muons are absorbed as they pass through matter, depending on the density of the material along their trajectories. By comparing the expected and the measured muon flux and using geoinformatic models of the observed area it is possible to calculate the density distribution inside these structures. Our research group at the HUN-REN Wigner Research Centre for Phyiscs has been conducting muographic measurements in the abandoned iron ore mine of Esztramos Hill (located in northeastern Hungary) for more than six years. Over the years we created muographic images of the hill from multiple drifts, resulting in a detailed understanding of its inner structure around the abandoned parts of the mine and the Rákóczi cave system, the main cave of which is part of the UNESCO World Heritage List. Based on a 3-D muographic inversion, our results were able to confirm the location of partially collapsed, inaccessible mined-out stopes and indicate the existence of a possible cave nearby, which was published in Scientific Reports last year.

How to cite: Rábóczki, B., Surányi, G., Balázs, L., and Hamar, G.: Exploring the inner structure of Esztramos Hill using cosmic rays, EGU General Assembly 2026, Vienna, Austria, 3–8 May 2026, EGU26-19012, https://doi.org/10.5194/egusphere-egu26-19012, 2026.

EGU26-19089 | Orals | GI4.7

Results from a newly established long-term cosmogenic neutron observatory at kilometer scale with focus on soil water dynamics and distribution 

Sascha E. Oswald, Lena Scheiffele, Peter M. Grosse, Merlin Schiel, Maik Heistermann, and Till Francke

Cosmic-ray neutron sensing (CRNS) has shown its capability for estimating soil water content by providing spatially integrated measurements at an intermediate scale between invasive in-situ and satellite remote sensing observations. This constitutes a major advantage over point-scale sensors, which are often sparsely installed and are affected by small-scale heterogeneity, leading to uncertain absolute values. CRNS thus serves as an important link between local and larger scales and is increasingly used as a reference for remote sensing products and hydrological or land-surface models and other applications related to soil water balance. However, to fully close the scale gap observations are needed that reach the km scale.

Within the DFG-research Cosmic Sense and the European project SoMMet (21GRD08), a multiscale soil moisture monitoring was implemented by establishing a cluster of CRNS integrated with a range of complementary in-situ observations. This Potsdam Soil Moisture Observatory (PoSMO) was established in 2023 and features an accumulated CRNS footprint size of close to one km2 in total, constituting the largest long-term observation of epithermal cosmic-ray neutrons so far as well as the highest accumulated count rate of stationary CRNS worldwide. It comprises 16 stationary CRNS sensors located at an agricultural research site in the northeast of Germany, with some of the CRNS stations operated since end of 2019. They provide estimates of root-zone soil moisture at daily resolution, that is soil water content within the first decimeters of soil, but also co-located point-scale soil moisture measurements from shallow depth in 5 cm down to one meter. Intensive manual sampling campaigns of soil water content, bulk density, organic matter, and soil texture complement the dataset and enable robust CRNS calibration.

We discuss the PoSMO field set up, challenges associated with its design and the long-term monitoring operation. And we present the results of two years of harmonized soil water content time series from the different sensor types, including the CRNS cluster, shallow soil water content measurements, and soil water content profile data. Beyond the large area covered, CRNS and point sensors deliver also spatially resolved observations that will be shown as interpolated time-series of soil moisture maps for the inner part of the cluster. A sparser installation at the periphery and more singular sensors in the vicinity provide potential to even derive a soil moisture estimate for an area of up to 3.4 km2. Also, the potential benefit of accompanying physical measurements of the neutron spectrum (via Bonner spheres), muon measurements with a scintillator-based CRNS or roving CRNS may be discussed as well as the link to the Brandenburg state CRNS network.

How to cite: Oswald, S. E., Scheiffele, L., Grosse, P. M., Schiel, M., Heistermann, M., and Francke, T.: Results from a newly established long-term cosmogenic neutron observatory at kilometer scale with focus on soil water dynamics and distribution, EGU General Assembly 2026, Vienna, Austria, 3–8 May 2026, EGU26-19089, https://doi.org/10.5194/egusphere-egu26-19089, 2026.

EGU26-19701 | ECS | Orals | GI4.7

Environmental Neutron Spectrometry: Continuous outdoor measurement with the PTB Bonner sphere spectrometer NEMUS-UMW 

Jonas Marach, Markus Köhli, Jannis Weimar, Peter Grosse, Marcel Reginatto, and Miroslav Zboril

After three years, the European research project SoMMet (Soil Moisture Metrology) has come to an end. One of PTB’s (Physikalisch-Technische Bundesanstalt) tasks within this collaboration with 17 other institutes was to develop the Bonner sphere spectrometer (BSS) system NEMUS-UMW, capable of performing continuous, automated neutron spectrometry under outdoor conditions. PTB now plans to continue these activities by identifying new scientifically interesting sites for such measurements.

The BSS NEMUS-UMW uses 11 proportional counters to detect the neutron component of secondary cosmic radiation. By varying the sizes (3" to 10" in diameter) of the polyethylene moderating spheres surrounding the counters, and by using copper or lead shells in the larger spheres, the system covers an energy range from 10⁻⁹ MeV to 10³ MeV. Using the known response functions of the individual spheres, the neutron energy spectrum can be unfolded. The system was calibrated in the PTB neutron reference fields and is therefore capable of determining outdoor neutron spectra and radiation levels in absolute units of neutron fluence rate.

During SoMMet, the BSS NEMUS-UMW was deployed at the test field site ATB Marquardt (Potsdam, Germany). In collaboration with the University of Potsdam and Heidelberg University, surrounding field and soil parameters were monitored, and the measured neutron-spectrum time series was used to benchmark URANOS-based neutron simulations.

In January 2026, the BSS NEMUS-UMW was installed on the PTB premises in Braunschweig (Germany), where it has also been used to study the impact of heavy snowfall on neutron radiation in early 2026.

This presentation introduces the BSS NEMUS-UMW setup and data analysis, including corrections for environmental influences, and compares measurement results with simulations.

How to cite: Marach, J., Köhli, M., Weimar, J., Grosse, P., Reginatto, M., and Zboril, M.: Environmental Neutron Spectrometry: Continuous outdoor measurement with the PTB Bonner sphere spectrometer NEMUS-UMW, EGU General Assembly 2026, Vienna, Austria, 3–8 May 2026, EGU26-19701, https://doi.org/10.5194/egusphere-egu26-19701, 2026.

EGU26-20428 | Posters on site | GI4.7

COSMOS-UK incoming neutron intensity correction case study for soil moisture monitoring using cosmic-ray neutron sensors 

Jonathan Evans, Magdalena Szczykulska, and Tim Howson and the COSMOS-UK Team

Cosmic-ray neutron sensors (CRNSs) provide state-of-the-art soil moisture measurements at a field scale. This sensing technique utilises cosmic-ray neutrons which need to be corrected for any temporal changes due to the external factors other than soil moisture. These typically include corrections for changes in humidity, pressure and the incoming flux of neutrons. The last correction is strongly linked with the changes in the solar activity and typically uses standardized neutron monitors (NMs), which are in operation around the world, as the reference signal. Different approaches have emerged for calculating the correction parameter, often referred to as ‘tau’, which accounts for location differences between the CRNS and NM stations. This work is a case study of the published incoming neutron flux correction parameters (taus) applied to the UK COsmic-ray Soil Moisture Observing System (COSMOS-UK) network. We investigate the impact of the different approaches on the resulting soil moisture and compare them against a correction parameter derived using the local CRNS data (gamma), and also against the available point sensor soil moisture measurements. We discuss the potential causes of discrepancies between the published (tau-based) methods and our insitu (gamma-based) method, especially in the context of soil moisture trends visible at some COSMOS-UK sites when using the tau-based methods.

How to cite: Evans, J., Szczykulska, M., and Howson, T. and the COSMOS-UK Team: COSMOS-UK incoming neutron intensity correction case study for soil moisture monitoring using cosmic-ray neutron sensors, EGU General Assembly 2026, Vienna, Austria, 3–8 May 2026, EGU26-20428, https://doi.org/10.5194/egusphere-egu26-20428, 2026.

EGU26-20506 | ECS | Posters on site | GI4.7

Observations of GLE 77 from the Ground, On Aircraft and Balloons 

Fraser Baird, Ben Clewer, Chris Davis, Keith Ryden, Clive Dyer, and Fan Lei

Cosmic rays generate an ever-present radiation field in Earth’s atmosphere, right down to the ground. On rare occasions, high energy particles accelerated at the Sun can increase this radiation field, in events known as Ground Level Enhancements (GLEs). November 11th 2025 saw the strongest GLE in nearly 25 years: GLE 77. The event resulted in the count rate of some sea level neutron monitors exceeding 100% of the pre-event mean. In this contribution, we present a comprehensive set of observations of the event made from the UK and the Netherlands. At ground level, we present data from the Compact Neutron Monitors in Guildford, in the south of the England, and Shetland, off the north coast of Scotland. Dose rate measurements are presented from SAIRA instruments onboard two trans-Atlantic flights during the event. In addition, the data from SAIRA instruments onboard weather balloons, launched from Shetland, Cornwall, and the Netherlands, are presented. Finally, modelling results derived from the MAIRE-S system will be shown briefly.

How to cite: Baird, F., Clewer, B., Davis, C., Ryden, K., Dyer, C., and Lei, F.: Observations of GLE 77 from the Ground, On Aircraft and Balloons, EGU General Assembly 2026, Vienna, Austria, 3–8 May 2026, EGU26-20506, https://doi.org/10.5194/egusphere-egu26-20506, 2026.

EGU26-20716 | Posters on site | GI4.7

Neptoon: An open-source and extensible software tool for data processing of cosmic-ray neutron sensors  

Martin Schrön, Daniel Power, Markus Köhli, Rafael Rosolem, Till Francke, Louis Trinkle, Fredo Erxleben, and Steffen Zacharias

The highly interdisciplinary method of Cosmic Ray Neutron Sensing (CRNS) has emerged as a key technology for monitoring root-zone soil moisture at the hectare scale. The technique bridges the spatial gap between traditional point-scale measurements and coarser remote sensing products. While CRNS is widely used in agriculture and weather services, processing of its data requires advanced knowledge about cosmic-ray physics. With the increasing adoption of CRNS across research infrastructures and observatories world-wide, standardised, flexible, and easy-to-use processing tools are essential for supporting data integration within these networks. Here we present neptoon, an open-source Python tool for neutron data processing that addresses these highly interdisciplinary challenges. It implements a modular, expandable framework to support both operational deployment of CRNS, as well as methodological innovation. Building from previous CRNS processing tools, we will present the overall architecture of neptoon and how it implements established processing methodologies while maintaining extensibility for emerging approaches. Through an intuitive configuration system and graphical user interface, neptoon streamlines data processing workflows and ensures reproducibility across research sites. As our understanding of the sensor signal continues to improve, the ability for research infrastructures to quickly implement the latest advancements becomes ever more important. We will demonstrate how neptoon facilitates rapid deployment of these latest processing methodologies, supports cross-site harmonisation, whilst also enabling robust testing of experimental correction methods. Through its support of multiple stakeholders, from researchers to sensor owners, the latest advancements can be pushed quickly back to the broader community. By providing a standardised yet flexible processing framework, neptoon aims to accelerate the integration of CRNS measurements into critical zone research and enhance our understanding of soil moisture dynamics across scales.

How to cite: Schrön, M., Power, D., Köhli, M., Rosolem, R., Francke, T., Trinkle, L., Erxleben, F., and Zacharias, S.: Neptoon: An open-source and extensible software tool for data processing of cosmic-ray neutron sensors , EGU General Assembly 2026, Vienna, Austria, 3–8 May 2026, EGU26-20716, https://doi.org/10.5194/egusphere-egu26-20716, 2026.

EGU26-21790 | ECS | Orals | GI4.7

Linking field-scale soil water regimes with vegetation response using CRNS and soil hydrophysical thresholds: a case study in Ireland 

Konstantin Shishkin, Owen Fenton, Paul Murphy, Klara Finkele, and Tamara Hochstrasser

Reliable assessment of soil water regime at the field scale is essential for understanding plant–soil interactions in managed grassland systems, yet remains challenging due to strong spatial heterogeneity and scale mismatches between soil moisture observations and vegetation response. Point-scale sensors provide detailed local measurements but often fail to represent field-scale conditions, while integrative approaches require independent validation to ensure their relevance for agrosystem functioning.

This study presents an integrated framework combining Cosmic-Ray Neutron Sensing (CRNS) with soil hydrophysical characterisation based on Soil Water Retention Curves (SWRC) to assess soil water regime dynamics and their relationship with vegetation response. CRNS-derived volumetric water content was interpreted relative to physically meaningful hydrophysical thresholds obtained from SWRC analysis, enabling continuous classification of soil moisture conditions across wet, optimal, and water-limited regimes.

Vegetation data were used as an independent indicator of soil water status to evaluate the consistency of CRNS–SWRC-derived regimes with observable plant responses. Field-scale grass growth dynamics were compared against classified soil moisture regimes to assess whether transitions in soil water availability were reflected in changes in vegetation productivity. This comparison allowed the identification of periods where vegetation response deviated from expected soil moisture conditions, highlighting potential anomalies related to root-zone decoupling, management interventions, or sub-footprint soil heterogeneity.

The results demonstrate that the combined CRNS–SWRC approach captures seasonal and event-scale variability in soil water regimes that correspond with observed grass growth patterns. At the same time, mismatches between soil moisture regimes and vegetation response provide valuable diagnostic information, enabling the detection of anomalous conditions not evident from soil moisture data alone.

The proposed framework extends beyond soil moisture monitoring by linking integrative hydrological measurements with biological response, offering a robust tool for field-scale assessment of soil–plant water interactions. This approach supports improved interpretation of soil water dynamics in heterogeneous agricultural landscapes and provides a foundation for anomaly detection and decision support in grassland management.

How to cite: Shishkin, K., Fenton, O., Murphy, P., Finkele, K., and Hochstrasser, T.: Linking field-scale soil water regimes with vegetation response using CRNS and soil hydrophysical thresholds: a case study in Ireland, EGU General Assembly 2026, Vienna, Austria, 3–8 May 2026, EGU26-21790, https://doi.org/10.5194/egusphere-egu26-21790, 2026.

EGU26-807 | ECS | Posters on site | GM2.5

Deep-learning classification of cave-floor surface types from LiDAR data for detailed cave mapping 

Michaela Nováková, Jozef Šupinský, and Jozef Širotník

High-resolution 3D mapping of subterranean environments remains challenging due to their complex geometry, low-light conditions, and restricted accessibility. Among these environments, caves represent particularly demanding settings where detailed spatial documentation is essential for monitoring processes, supporting exploration and conservation efforts. Laser scanning has become a key technique for capturing accurate and detailed 3D representations of caves that form the basis for this heritage documentation and multidisciplinary research. Despite these advances, the creation of cave maps still commonly relies on traverse-line measurements and field sketches, later digitized using specialized cave-surveying software. In recent years, LiDAR data have been used for deriving the cave extent. While this method effectively captures the general geometry of cave passages, the delineation of cave-floor units, sediments, speleothems, rock blocks, and other features remains largely manual and relies heavily on the surveyor’s interpretation. As a result, feature boundaries vary between authors, and detailed cave-surface representation lacks reproducibility that is problematic for long-term documentation. In this study, we explore the use of deep-learning semantic segmentation for classifying selected cave-floor surface types based on geometric features derived from LiDAR data. Building on previous work focused on semi-automatic cave-map generation from LiDAR point clouds, we extend the workflow from deriving cave extent and floor morphology toward the automated interpretation of surface materials and forms. The method was tested on several common cave-floor surface types, including clastic sediments, flowstone, and bedrock, as well as artificial surfaces and objects typical in showcaves. The resulting classifications show that deep-learning models can distinguish surfaces with subtle geometric differences and produce consistent, reproducible delineations of units that are traditionally mapped by hand. Compared with manual digitization, the approach reduces subjectivity and provides a scalable way to generate polygonal layers used in speleocartographic workflows.

How to cite: Nováková, M., Šupinský, J., and Širotník, J.: Deep-learning classification of cave-floor surface types from LiDAR data for detailed cave mapping, EGU General Assembly 2026, Vienna, Austria, 3–8 May 2026, EGU26-807, https://doi.org/10.5194/egusphere-egu26-807, 2026.

EGU26-1968 | ECS | Posters on site | GM2.5

Comparative Analysis of 30-m DEM Products for Hydrological Applications: A Case Study in the Flinders Catchment Australia 

Laleh Jafari, Ben Jarihani, Jack Koci, Ioan Sanislav, and Stephanie Duce

Digital Elevation Models (DEMs) are fundamental to hydrological modelling, watershed delineation, flood hazard assessment, and resource management. However, the reliability of these applications depends heavily on the vertical accuracy of the DEMs. Although several global DEM products with 30-m spatial resolution are widely available, variations in sensor technology, data acquisition methods, and surface characteristics can significantly influence their accuracy and suitability for hydrological studies. This research provides a comparative evaluation of five commonly used global DEMs—TanDEM-X, ASTER GDEM, SRTM, Copernicus DEM, and ALOS World 3D—by assessing their vertical accuracy against high-resolution airborne LiDAR data and ICESat-2 ATL06 measurements. The findings aim to inform best practices for selecting DEMs in hydrological modelling and catchment-scale applications, particularly in data-scarce regions.

The Flinders River catchment in northern Queensland was selected as the critical test area for evaluating how DEM errors propagate into hydrological calculations. This region is characterised by low rainfall and pronounced topographic variability, encompassing flat lowland plains, dissected upland terrain, and localised areas of steep slopes. All DEMs were standardised to a common horizontal and vertical reference framework and co-registered with the test datasets to eliminate systematic discrepancies. ICESat-2 ATL06 data were rigorously filtered to retain only the highest-quality measurements, based on a combination of quality flags, topographic slope thresholds, and signal strength criteria in vegetated areas.

Elevation differences were computed at matched locations, and DEM performance was evaluated using key statistical metrics, including bias, root mean square error (RMSE), mean absolute error (MAE), median error, and standard deviation. To provide a more comprehensive assessment, error behaviour was analysed in relation to terrain slope and catchment characteristics, highlighting zones most vulnerable to error propagation in flow routing and watershed delineation. Systematic patterns in DEM error were further examined with respect to sensor characteristics under varying landscape conditions.

Results indicate that TanDEM-X and Copernicus DEM exhibit the highest vertical accuracy, closely aligning with ICESat-2 and LiDAR observations, whereas ASTER GDEM and SRTM show larger mean errors, particularly in dissected or mountainous terrain. These findings suggest that TanDEM-X and Copernicus DEM are preferable for hydrology-focused applications in semi-arid basins, while ASTER and SRTM should be used cautiously where precise modelling is required. The study underscores the importance of DEM accuracy evaluation in relation to basin characteristics, as errors can significantly influence hydrological modelling outcomes.

How to cite: Jafari, L., Jarihani, B., Koci, J., Sanislav, I., and Duce, S.: Comparative Analysis of 30-m DEM Products for Hydrological Applications: A Case Study in the Flinders Catchment Australia, EGU General Assembly 2026, Vienna, Austria, 3–8 May 2026, EGU26-1968, https://doi.org/10.5194/egusphere-egu26-1968, 2026.

EGU26-3936 | Posters on site | GM2.5

Historical Images for Surface Topography Reconstruction Intercomparison eXperiment (Historix) 

Amaury Dehecq, Friedrich Knuth, Joaquin Belart, Livia Piermattei, Camillo Ressl, Robert McNabb, and Luc Godin

Historical film-based images, acquired during aerial campaigns since the 1930s and from satellite platforms since the 1960s, provide a unique opportunity to document changes in the Earth’s surface over the 20th century. Yet, these data present significant and specific challenges, including complex distortions in the scanned image and poorly known exterior and/or interior camera orientation. In recent years, semi- or fully-automated approaches based on photogrammetric and computer vision methods have emerged (e.g., Knuth et al., 2023; Dehecq et al., 2020; Ghuffar et al., 2022), but their performance and limitations have not yet been evaluated in a consistent way.

The ongoing “Historical Images for Surface Topography Reconstruction Intercomparison eXperiment (Historix)” project aims at comparing existing methods for processing stereoscopic historical images and harmonizing processing tools.

Within this experiment, participants are provided with a set of historical images and available metadata and invited to return a point cloud and estimated camera parameters. We selected two study sites near Casa Grande, Arizona, and south Iceland, chosen for their  good availability of historical images and variety of terrain types. For each site, we selected 3 sets of film-based images acquired in the 1970s or 80s, overlapping in space and time: aerial images with fiducial marks from publicly available archives and 2 image sets from the American Hexagon (KH-9) reconnaissance satellite missions acquired by the mapping camera (KH-9 MC) and panoramic camera (KH-9 PC). The submitted elevation data will be cross-validated across different image sets and participant submissions, as well as against reference elevation data over stable terrain. The spread in the retrieved elevations will be analysed with respect to image type, terrain type and processing methods to highlight the strengths and limitations of the different approaches.

In this presentation, we will introduce the experiment design, the selected benchmark dataset, the current methodologies and the preliminary results of the intercomparison. Finally, we will present some of the open-source code that exist or are being developed to process historical images.

How to cite: Dehecq, A., Knuth, F., Belart, J., Piermattei, L., Ressl, C., McNabb, R., and Godin, L.: Historical Images for Surface Topography Reconstruction Intercomparison eXperiment (Historix), EGU General Assembly 2026, Vienna, Austria, 3–8 May 2026, EGU26-3936, https://doi.org/10.5194/egusphere-egu26-3936, 2026.

EGU26-4849 | ECS | Orals | GM2.5

Historical aerial imagery–derived Digital Elevation Models and orthomosaics for glacier change assessment in the western Antarctic Peninsula since 1989 

Vijaya Kumar Thota, Thorsten Seehaus, Friedrich Knuth, Amaury Dehecq, Christian Salewski, David Farías-Barahona, and Matthias H.Braun

The Antarctic Peninsula (AP) is a hotspot of global warming, with pronounced atmospheric warming reported during the 20th century. Although it is critical in terms of climate change studies, the mass balance of glaciers prior to 2000 remains poorly constrained. Existing mass balance estimates are further characterized by high uncertainties due to a lack of observations. In contrast, more than 30000 historical images in archives are the sole direct observations to quantify past glacial changes and their contribution to sea-level rise. 

In this study, we present a unique, timestamped, high-resolution Digital Elevation Model (DEM) and orthomosaic dataset, derived from aerial imagery that covers about 12000 km2 area on the western Antarctic Peninsula and surrounding islands between 66–68° S. We used a film-based aerial image archive from 1989 acquired by the Institut für Angewandte Geodäsie (IfAG), and is kept in the Archive for German Polar Research at the Alfred Wegener Institute, Germany, to generate the historical DEMs and orthoimages. The historical DEMs were co-registered to the Reference Elevation Model of Antarctica (REMA) mosaic on stable terrain. Our historical DEMs have vertical accuracies better than 6 m and 8 m with respect to modern elevation data, REMA, and ICESat-2, respectively. We have made this dataset publicly available at  https://doi.org/10.5281/zenodo.16836526.

Initial mass balance estimates from DEM differencing of our 1989 DEM with recent surfaces from REMA strip DEMs show a near-constant ice mass despite widespread glacier frontal retreat and thinning. We hypothesize that low-elevation ice thickness loss in this period is largely compensated by higher surface mass balance in higher areas. However, this regime appears to be changing, with glaciers transitioning toward increased dynamic activity with enhanced mass loss, and higher ice fluxes.

How to cite: Thota, V. K., Seehaus, T., Knuth, F., Dehecq, A., Salewski, C., Farías-Barahona, D., and H.Braun, M.: Historical aerial imagery–derived Digital Elevation Models and orthomosaics for glacier change assessment in the western Antarctic Peninsula since 1989, EGU General Assembly 2026, Vienna, Austria, 3–8 May 2026, EGU26-4849, https://doi.org/10.5194/egusphere-egu26-4849, 2026.

Quantifying pebble size, shape, and roundness is fundamental to
understanding sediment transport and abrasion in fluvial systems, yet
remains challenging in natural, densely packed settings.  Most existing
approaches rely on 2D imagery and therefore fail to capture true
three-dimensional morphology. Here, we present a curvature-based instance
segmentation framework for reconstructed surface meshes and demonstrate its
role as a key step enabling 3D roundness and orientation analysis.

In our approach, individual pebbles are detected directly from 3D surface
reconstructions using curvature features, without prior shape assumptions.
Validation against high-resolution reference models yields a high detection
precision of 0.98, with remaining errors mainly due to under-segmentation
in overly smooth reconstructions.  Estimates of 3D pebble orientation are
strongly controlled by the represented surface area, highlighting both the
potential and current limitations of orientation retrieval from incomplete
surface segments.

We illustrate how reliable segmentation allow downstream 3D shape and
roundness analyses that are not accessible in 2D, including curvature-based
surface metrics and volumetric descriptors. Example fluvial scenes
demonstrate that segmentation quality directly controls the stability of
roundness estimates and their geomorphic interpretation. Our results
establish curvature-based 3D pebble segmentation as a methodological
foundation for reproducible analyses of pebble shape, roundness, and
orientation in natural river systems.

How to cite: Rheinwalt, A. and Bookhagen, B.: Curvature-based pebble segmentation as a foundation for 3D roundness and orientation analysis, EGU General Assembly 2026, Vienna, Austria, 3–8 May 2026, EGU26-5922, https://doi.org/10.5194/egusphere-egu26-5922, 2026.

Currently available global Digital Elevation Model (DEM) surfaces are either derived from the stereoscopic exploitation of multispectral satellite imagery, point-wise laser altimetry measurements or the interferometric processing of bistatic synthetic aperture radar data, but only radar data allows the acquisition of a global product in a reasonable timeframe. The public private partnership of DLR and Airbus in the TanDEM-X mission paved the ground for the WorldDEM product line and its derivatives such as the Copernicus DEM. Both datasets are based on data acquisitions from December 2010 to January 2015, manual and semi-automated DEM editing procedures and represent a very accurate, very consistent and only pole-to-pole DEM data set. The Copernicus DEM is available with a free-and-open licence.

Various ecosystems such as the geosphere, biosphere, cryosphere and anthroposphere are subject to continuous changes which demand the monitoring of Earth’s topography in regular updates of global Digital Elevation Model data. The WorldDEM Neo product represents the successor of the aforementioned WorldDEM but is based on a fully-automated editing & production process and newer data: the on-going TanDEM-X mission is expected to operate until 2028 and has created an archive of up-to-date DEM scenes ready for integration into a new global DEM coverage (>90% of global landmass acquired between 2017 and 2021; ~60% of global landmass acquired again between 2021 and 2025). In conjunction with continuous improvements of the fully-automated production processes, a new global DEM coverage of WorldDEM Neo is produced early 2026. DEM applications such as the orthorectification of raw satellite imagery will benefit from the availability of an accurate and up-to-date global DEM dataset. Other applications such as multi-temporal 3D change analysis based on a single satellite mission (TanDEM-X) are possible and support the understanding of environmental changes thanks to the 3rd dimension. The rapid availability of the error-compensated WorldDEM Neo Digital Surface Model (DSM) and bare-ground Digital Terrain Model (DTM) after raw data acquisition serve various applications of global DEMs. Future acquisitions of the on-going TanDEM-X mission (until 2028) allow the processing of final and up-to-date DSM and DTM coverages at the end of the mission lifetime.

The presentation comprises a short look into the history with its manual & semi-automated DEM editing procedures. The main focus will be on the fully-automated production processes for truly global DSM & DTM coverages. Accuracy metrics, 3D change statistics between the different global coverages but also visual impressions of the various global DEM coverages will be addressed, too. On-going challenges with interferometry-based elevation data are part of an outlook and different error compensation strategies (e.g. height reconstruction from radar amplitude data based on machine-learning techniques) are highlighted.

How to cite: Fahrland, E. and Schrader, H.: Updating and upgrading a global Digital Elevation Model - the fully automated production of WorldDEM Neo with acquisitions until 2025, EGU General Assembly 2026, Vienna, Austria, 3–8 May 2026, EGU26-6660, https://doi.org/10.5194/egusphere-egu26-6660, 2026.

EGU26-9007 | ECS | Orals | GM2.5

Use of time-lapse photogrammetry to capture substantial accumulation rates on an on-glacier avalanche deposit  

Marin Kneib, Patrick Wagnon, Laurent Arnaud, Louise Balmas, Olivier Laarman, Bruno Jourdain, Amaury Dehecq, Emmanuel Le Meur, Fanny Brun, Andrea Kneib-Walter, Ilaria Santin, Laurane Charrier, Thierry Faug, Giulia Mazzotti, Antoine Rabatel, Delphine Six, and Daniel Farinotti

Avalanches are critical contributors to the mass balance and spatial accumulation patterns of mountain glaciers. While gravitational snow redistribution models predict high localized accumulation, these predictions lack field validation due to the difficulty of monitoring highly dynamic avalanche cones. Here, we present two years of high-resolution monitoring of a large avalanche cone in the accumulation area of Argentière Glacier (French Alps). To capture these dynamics, we employed a multi-sensor approach: Uncrewed Aerial Vehicle (UAV) surveys and a time-lapse photogrammetry array consisting of 7 low-cost cameras deployed ~1 km away from the cone. The distance of the sensors from the surveyed area, its geometry (>30°), its surface characteristics (smooth snow surface) and the absence of fixed stable terrain due to the surrounding headwalls being episodically covered in snow made this environment particularly challenging for the photogrammetry methods applied. Point clouds and Digital Elevations Models were produced at a two-week resolution using Structure-from-Motion photogrammetry in Agisoft Metashape v1.8.3. with the alignment being constrained with Pseudo Ground Control Points. We could further co-register all point clouds to a September UAV acquisition with the Iterative Closest Point algorithm from the open-source project Py4dgeo, using automatically-derived stable ground from the RGB information of the images.

Methodological validation shows that while side-looking time-lapse photogrammetry captures the overall trend, it tends to underestimate elevation changes compared to UAV data, with biases up to 1.8 m and standard deviations of 2–6 m. Winter-time acquisitions with low light conditions over smooth snow surfaces also lead to reduced correlation over the cone. Despite these uncertainties, our results reveal extreme spatial variability in accumulation. The top of the cone is the most active zone, exhibiting elevation changes of ~30 m annually and a strong accumulation of 60 m w.e. between March 2023 and 2025 when accounting for the ice flow—roughly 15 times the annual mass balance recorded by the GLACIOCLIM program in the nearby accumulation area not affected by avalanche deposits. We identify a topographical threshold for snow storage: the upper cone fills early in the season until reaching a critical slope of ~35°, after which subsequent avalanches bypass the apex to deposit mass at the cone’s base. From May onwards, mass redistribution is further modulated by the development of surface channels. Our findings demonstrate that time-lapse photogrammetry is a viable tool for monitoring dynamic glacier surfaces and provide rare empirical evidence of the dominant role avalanches play in glacier mass budgets.

How to cite: Kneib, M., Wagnon, P., Arnaud, L., Balmas, L., Laarman, O., Jourdain, B., Dehecq, A., Le Meur, E., Brun, F., Kneib-Walter, A., Santin, I., Charrier, L., Faug, T., Mazzotti, G., Rabatel, A., Six, D., and Farinotti, D.: Use of time-lapse photogrammetry to capture substantial accumulation rates on an on-glacier avalanche deposit , EGU General Assembly 2026, Vienna, Austria, 3–8 May 2026, EGU26-9007, https://doi.org/10.5194/egusphere-egu26-9007, 2026.

EGU26-9167 | ECS | Posters on site | GM2.5

Optimizing SfM workflows for continuous river bank monitoring: evaluating image alignment accuracies across diverse environmental conditions 

László Bertalan, Lilla Kovács, Laura Camila Duran Vergara, Dávid Abriha, Robert Krüger, Xabier Blanch Gorriz, and Anette Eltner

River bank erosion represents a dynamic geomorphic hazard, particularly in meandering channels where migration rates threaten critical infrastructure and agricultural land. While our previous work on the Sajó River (Hungary) established a novel, low-cost monitoring framework utilizing Raspberry Pi (RPi) cameras for near-continuous observation, the reliability of photogrammetric reconstruction under uncontrolled outdoor conditions remains a critical challenge. This study presents a systematic evaluation of the accuracy constraints inherent in automated Structure-from-Motion (SfM) processing pipelines, with a specific focus on optimizing image alignment across a wide range of scene conditions.

To determine the robustness of RPi imagery, we conducted a comprehensive sensitivity analysis of the SfM-based image alignment phase. We systematically tested over 120 variations of processing parameters, manipulating keypoint and tie-point limits, upscaling factors, and masking strategies. The implementation of rigorous masking was critical, as the imagery is geometrically challenging: the moving river surface in the foreground and the sky in the background occupy the majority of the field of view, leaving only a narrow, static fraction of the image relevant for reliable 3D reconstruction. These combinations were evaluated against a dataset representing the full range of environmental variability, including clear, cloudy, dark, foggy, overexposed, and rainy conditions, as well as distinct hydrological states such as low flows, flood events, and snow cover.

Preliminary results indicate that a specific balance of 30,000 keypoints and 5,000 tie points (ratio 6.0) optimizes reconstruction fidelity, achieving an RMS error of 0.75 pixels under clear weather conditions. Notably, the system demonstrated unexpected robustness in low-light scenarios, maintaining consistent error margins of 1.17–1.18 pixels across various configurations. Conversely, scaling up these limits beyond the optimum yielded diminishing returns, confirming that higher computational loads do not necessarily equate to improved geometric accuracy. Furthermore, we applied gradual selection algorithms to filter sparse point clouds, removing unreliable points based on reconstruction uncertainty to isolate the most geometrically valid features.

The crucial final phase of this research bridges the gap between digital reconstruction and physical reality. We validate the optimized SfM-based point clouds by comparing them directly against high-precision Terrestrial Laser Scanning (TLS) data acquired during two previous campaigns and upcoming field surveys. This multi-temporal comparison allows us to quantify specific error margins for volumetric and horizontal material displacement calculations. By defining these accuracy constraints, we establish a validated protocol for calculating erosion volumes during high-flow events, ensuring that automated, low-cost monitoring systems can provide actionable, high-precision data for river management even under adverse environmental conditions.

---

The research was funded by the DAAD-2024-2025-000006 project-based research exchange program (DAAD, Tempus Public Foundation).

How to cite: Bertalan, L., Kovács, L., Duran Vergara, L. C., Abriha, D., Krüger, R., Blanch Gorriz, X., and Eltner, A.: Optimizing SfM workflows for continuous river bank monitoring: evaluating image alignment accuracies across diverse environmental conditions, EGU General Assembly 2026, Vienna, Austria, 3–8 May 2026, EGU26-9167, https://doi.org/10.5194/egusphere-egu26-9167, 2026.

Long-term observations of glacier mass change provide a key indicator of atmospheric warming and are essential for understanding glacier behaviour and responses to climate forcing. Archived aerial photographs represent an underutilised source of historical information from which three-dimensional surface geometry can be reconstructed to quantify past glacier change. This approach is particularly valuable in Antarctica, where surface-elevation change prior to the 1990s remains poorly constrained due to limited pre-satellite altimetry and a scarcity of reliable Ground Control Points (GCPs). As a result, historic mass-balance estimates have largely relied on climate reanalysis and modelling.

Advances in photogrammetric techniques have substantially improved the efficiency and accuracy of Digital Elevation Models (DEMs) derived from historical aerial imagery. Here, we present a newly compiled inventory of Antarctic aerial surveys conducted throughout the twentieth century, documenting their spatial and temporal coverage to identify regions suitable for DEM reconstruction. Then, building on established workflows, we show newly constructed DEMs for three glaciers that formerly fed the Larsen A Ice Shelf on the Antarctic Peninsula, capturing surface geometry both before and after its collapse in 1995. These reconstructions reveal heterogenous glacier responses to reduced buttressing, controlled by local morphology and consistent with previous regional observations.

How to cite: Rowe, E., Willis, I., and Fenney, N.: Compiling an Inventory of Historic Antarctic Aerial Photographs to Measure Long-Term Glacial Mass Balance Change from Digital Elevation Models, EGU General Assembly 2026, Vienna, Austria, 3–8 May 2026, EGU26-13015, https://doi.org/10.5194/egusphere-egu26-13015, 2026.

EGU26-13875 | Posters on site | GM2.5

Using high-resolution bathymetric data from a multibeam sonar acquisition to map and analyse geomorphical underwater structures in the proglacial Grastallake in the Horlachtal valley/ Ötztal Alps 

Florian Haas, Manuel Stark, Jakob Rom, Lucas Dammert, Till Kohlhage, Toni Himmelstoss, Diana-Eileen Kara-Timmermann, Moritz Altmann, Carolin Surrer, Korbinian Baumgartner, Peter Fischer, Sarah Betz-Nutz, Tobias Heckmann, Norbert Pfeifer, Gottfried Mandlburger, and Michael Becht

As part of the DFG research group “Sensitivity of high alpine geosystems to climate change since 1850” (SEHAG), high-resolution multibeam sonar data was collected from the proglacial Grastallake in the Ötztal valley during a boat survey in the summer of 2025. The Grastallake has an area of approximately 63,000 m², a maximum depth of approximately 16 m, and lies at an altitude of 2,584 m. The lake is situated in a former cirque, and its shores and the surrounding are partly composed of loose material and partly of solid rock. In the western part, there is a large whaleback with already known Egesen-moraines on top. On the southern and eastern shores, larger active debris flow cones are coupled to the lake, with meltwater runoff from the higher Grastalferner glacier flowing into the lake as a perennial stream via the eastern debris flow cone. Due to the permanent inflow from the glacier and the topographic conditions of the catchment area, the eastern debris flow cone is very active and has intensively been reshaped by several extreme debris flow events during the last years.

The bathymetric data was collected using a Norbit multibeam sonar (WBMS), which was supplemented by an SBG INS system (dual GNSS patch antenna system, SBG Eclipse D) by Kalmar Systems. Since the underwater topography of the lake was unknown and its high turbidity due to the glacier inflow, the first step was to conduct a rough survey of the lake. This step made it possible to create a coarse depth map on site in order to identify spots with shallow water, determine the system settings, and draw up a navigation plan along strips. After field work the recorded data was processed using Quinertia for trajectory calculation and Opals for strip adjustment. This resulted in a final 3D point cloud with an average point density of 400 points per square meter, which was converted to raster data in order to perform spatial analyses.

Using the data, geomorphological forms were mapped in a first step. In addition to a previously unknown late glacial moraine section, the underwater deposits of recent debris flows became visible. In addition to mapping, geomorphological structures were used for spatial analysis, such as comparing the depositions of debris flows above and below the water. Since the data is very well suited for mapping underwater structures, this case study demonstrates the enormous potential of bathymetric data acquired by multibeam sonar measurements, that has rarely been used for geomorphological studies to date. Multitemporal analysis in the sense of a 4D analysis could only be carried out to a limited extent in this case study. However, with the data now available, multitemporal analysis, i.e., quantification of sediment input into lakes, will also be possible in the future. This would then enable assessments to be made of the hazard potential of newly formed lakes in the proglacial area and of their lifespan. 

How to cite: Haas, F., Stark, M., Rom, J., Dammert, L., Kohlhage, T., Himmelstoss, T., Kara-Timmermann, D.-E., Altmann, M., Surrer, C., Baumgartner, K., Fischer, P., Betz-Nutz, S., Heckmann, T., Pfeifer, N., Mandlburger, G., and Becht, M.: Using high-resolution bathymetric data from a multibeam sonar acquisition to map and analyse geomorphical underwater structures in the proglacial Grastallake in the Horlachtal valley/ Ötztal Alps, EGU General Assembly 2026, Vienna, Austria, 3–8 May 2026, EGU26-13875, https://doi.org/10.5194/egusphere-egu26-13875, 2026.

EGU26-17031 | ECS | Posters on site | GM2.5

High-precision point cloud generation for forest inventory: Integrating GNSS-RTK and SLAM for handheld laser scanning 

Carolin Rünger, Stefan Binapfl, Ferdinand Maiwald, Robert Krüger, and Anette Eltner

In recent years, forest management and inventory have increasingly relied on handheld personal laser scanners (H-PLS) for capturing flexible three-dimensional data. These systems have become essential for extracting critical tree attributes, such as diameter at breast height (DBH) and tree height. Most traditional H-PLS systems utilize Simultaneous Localization and Mapping (SLAM), which fuses LiDAR and Inertial Measurement Unit (IMU) data to reconstruct environments. However, SLAM is based on relative sensor measurements, which inherently causes accumulated errors and trajectory drift. In complex forest environments, similar-looking stems and moving vegetation can further confuse the mapping process, resulting in distorted point clouds or duplicated stems that reduce the accuracy of extracted tree attributes.

While Global Navigation Satellite System (GNSS)-based Real-Time Kinematic (RTK) positioning provides centimetre-level absolute accuracy and usually drift-free trajectories, its application in forestry is critically hindered by signal obstruction in dense canopies. The integration of GNSS-RTK and SLAM offers a robust and synergetic solution to these challenges, allowing one method to compensate for the failures of the other. A promising development in this field is an H-PLS system that integrates GNSS-RTK, IMU, LiDAR, and camera measurements to generate georeferenced point clouds directly in the field. This hybrid approach utilizes LiDAR and camera data to maintain positioning during GNSS outages and utilizes RTK information to re-initialize and correct the trajectory once the signal is restored.

Our study evaluates whether this integrated GNSS-RTK SLAM approach improves point cloud geometry and tree attribute extraction compared to traditional SLAM methods without GNSS integration. We conducted a field campaign in a mixed forest stand during the leaf-off period to simulate realistic operating conditions with alternating GNSS visibility. The performances of a SLAM-only and a SLAM + GNSS-RTK H-PLS were validated against highly accurate terrestrial laser scanning (TLS) reference data. The analysis involved tree segmentation to assess individual tree identification and the derivation of DBH, stem positions, and tree heights. Furthermore, we investigated internal geometric quality by analysing local noise levels using cross-sectional residuals relative to fitted circles and assessed spatial homogeneity to identify artifacts like duplicated stems or gaps.

Initial results indicate that the SLAM + GNSS-RTK H-PLS system provides DBH estimates comparable to TLS, with observed differences of 6.3 mm and 1.17 cm for major and minor axes, respectively. Despite slight overestimations due to scattering, the significantly reduced acquisition time makes this integrated system an efficient alternative for forestry applications. These findings contribute to a better understanding of how integrated positioning systems can enhance mobile laser scanning workflows and support the development of autonomous, high-precision forest mapping solutions.

How to cite: Rünger, C., Binapfl, S., Maiwald, F., Krüger, R., and Eltner, A.: High-precision point cloud generation for forest inventory: Integrating GNSS-RTK and SLAM for handheld laser scanning, EGU General Assembly 2026, Vienna, Austria, 3–8 May 2026, EGU26-17031, https://doi.org/10.5194/egusphere-egu26-17031, 2026.

EGU26-17484 | Orals | GM2.5

Permanent terrestrial laser scanning for environmental monitoring 

Roderik Lindenbergh, Sander Vos, and Daan Hulskemper

Many topographic scenes demonstrate complex dynamic behavior that is difficult to map and understand. A terrestrial laser scanner fixed on a permanent position can be used to monitor such scenes in an automated way with centimeter to decimeter quality at ranges of up to several kilometers. Laser scanners are active sensors, and can continue operation during night. Their independence from surface texture properties ensures in principle that they provide stable range measurements for varying surface conditions.

Recent years have seen an increase in the employment of such systems for different applications in environmental geosciences, including forestry, glaciology and geomorphology. This employment resulted in a new type of 4D topographic data sets (3D point clouds + time) with a significant temporal dimension, as such systems can acquire thousands of consecutive epochs.

However, extracting information from these 4D data sets turns out to be challenging, first, because of insufficient knowledge on error budget and correlations, and second, because of lack of algorithms, benchmarks, and best-practice workflows.

The presentation will showcase recently active systems that monitored a forest, a glacier, an active rockfall site and a sandy beach respectively. Data from these systems will be used to illustrate different systematic challenges that include instabilities of the sensor system, meteorological and atmospheric influence on the data product and the maybe surprising need for alignment of point clouds from different epochs.

In addition, different ways to extract information from these 4D data sets will be discussed, in connection with particular applications. While bi-temporal change detection is often a starting point for exploring 4D data, several methods are being developed that truly exploit the extensive time dimension, including tracking, trend analysis, time series clustering and spatio-temporal region growing.

Lessons learned from experiences with these systems in different domains lead to several recommendations for future employment considering field of view design, auxiliary sensors (e.g. IMU, camera, weather station) and the possible deployment of low-cost alternatives, thereby providing a view on the near future of permanent laser scanning.

Reference

Lindenbergh, R., Anders, K., Campos, M., Czerwonka-Schröder, D., Höfle, B., Kuschnerus, M., Puttonen, E., Prinz, R., Rutzinger, M., Voordendag, A & Vos, S. (2025). Permanent terrestrial laser scanning for near-continuous environmental observations: Systems, methods, challenges and applications. ISPRS Open Journal of Photogrammetry and Remote Sensing, 17, 100094. DOI: 10.1016/j.ophoto.2025.100094

How to cite: Lindenbergh, R., Vos, S., and Hulskemper, D.: Permanent terrestrial laser scanning for environmental monitoring, EGU General Assembly 2026, Vienna, Austria, 3–8 May 2026, EGU26-17484, https://doi.org/10.5194/egusphere-egu26-17484, 2026.

EGU26-17571 | ECS | Posters on site | GM2.5

Testing the Red Relief Image Maps methodology to enhance the beachrock cartography in Torredembarra coast (Catalan coast, West  Mediterranean Sea) 

Miguel-Angel Vicente-Ginés, Joana Mencos, and Carles Roqué

Beachrocks are cemented coastal deposits formed within the intertidal zone by the precipitation of magnesium-rich calcium carbonate. They constitute important paleogeographic and paleoclimatic markers, as they allow the reconstruction of past shoreline evolution. In addition, beachrocks influence current coastal dynamics and represent valuable geological heritage and ecological reservoirs that require preservation.

This study focuses on a sequence of multiple beachrock levels located along the Catalan Coast (NE Iberian Peninsula). The system consists of a complex sequence of submerged beachrocks with a wide formation range, situated at water depths between −0.25 m and −48 m below the current sea level. These deposits exhibit lateral continuity of up to 4.5 km and are characterized by reduced thicknesses and low geomorphic expression. The underlying substrate is composed of unconsolidated marine sediments. In certain sectors, a spatial overlap with Posidonia oceanica meadows occurs.

The aforementioned characteristics hinder their cartographic representation using traditional methods, such as aerial image interpretation and hillshade maps derived from bathymetric data, particularly for thin structures located at greater depths and in areas where Posidonia oceanica meadows are present.

The aim of this study is to evaluate the usefulness of the Red Relief Image Map (RRIM) method as an alternative quantitative terrain visualization tool for the cartography of submerged beachrocks. This method is based on the quantitative attribute openness, which expresses the degree of dominance or enclosure of a location on an irregular surface and enhances concave (negative openness) and convex (positive openness) features. Using this attribute, the RRIM method combines three main elements: topographic slope, positive openness and negative openness, allowing the visualization of subtle, low-relief topographic structures on apparently flat surfaces.

Using this approach, this study aims to improve the identification and cartographic delineation of submerged beachrock levels and to define optimal visualization parameters that contribute to a better understanding of the beachrock sequence.

How to cite: Vicente-Ginés, M.-A., Mencos, J., and Roqué, C.: Testing the Red Relief Image Maps methodology to enhance the beachrock cartography in Torredembarra coast (Catalan coast, West  Mediterranean Sea), EGU General Assembly 2026, Vienna, Austria, 3–8 May 2026, EGU26-17571, https://doi.org/10.5194/egusphere-egu26-17571, 2026.

EGU26-17927 | ECS | Posters on site | GM2.5

Long-term glacier elevation change at Gran Campo Nevado since 1945  

Lucas Kugler, Camilo Rada, Clare Webster, Jan Dirk Wegner, Etienne Berthier, and Livia Piermattei

Scanned historical aerial photographs acquired with film cameras from the early twentieth century to the early 2000s are the longest and richest archive of Earth observation data for reconstructing past topography. Those with stereoscopic acquisition enable the generation of Digital Elevation Models (DEMs) and orthoimages when processed with photogrammetric techniques, extending the assessment of environmental change beyond the time scale of modern satellite observations.  

In this study, we present a long-term (1945-2020) dataset of glacier surface elevation for the Gran Campo Nevado ice field in southern Chile. The dataset is based on aerial photographs acquired in 1945 using a Trimetrogon camera and in the 1980s and 1990s using nadir-looking film cameras from the Chile60 and Geotec flight campaigns, complemented by a 2020 Pléiades satellite–derived DEM made available through the Pléiades Glacier Observatory program (Berthier et al., 2023). To process the historical photographs, we developed an open-source pipeline that builds on structure-from-motion (SfM) principles and incorporates learning-based feature-detection and matching algorithms, such as SuperPoint and LightGlue. Absolute image orientation is achieved through automated detection of ground control points derived from the Pléiades DEM and orthoimage. DEMs accuracy was evaluated over stable terrain by comparing them with the Pléiades reference DEM. As well, the reconstructed DEMs are compared with those obtained using an established SfM processing workflow (HSfM; Knuth et al., 2023). The resulting DEMs provide a reconstruction of glacier surface elevation spanning more than seven decades, and glacier elevation changes are quantified from the DEM time series. By using reproducible, open-source methodologies, this presentation demonstrates opportunities for the research community to leverage other historical datasets and extend analyses beyond what is possible with modern satellite observations alone. 

How to cite: Kugler, L., Rada, C., Webster, C., Wegner, J. D., Berthier, E., and Piermattei, L.: Long-term glacier elevation change at Gran Campo Nevado since 1945 , EGU General Assembly 2026, Vienna, Austria, 3–8 May 2026, EGU26-17927, https://doi.org/10.5194/egusphere-egu26-17927, 2026.

EGU26-18399 | ECS | Orals | GM2.5

From badland to bushland? Analysis of geomorphic process dynamics and vegetation development in a sub-humid calanchi area based on high-resolution UAS data (2014-2024). 

Manuel Stark, Annalisa Sannino, Martin Trappe, Jakob Rom, Jakob Forster, Georgia Kahlenberg, Florian Haas, and Francesca Vergari

Badlands are among the most rapidly developing landscapes and exhibit a significant degree of geomorphological activity. In semi-arid/ sub-humid landscapes, specific precipitation dynamics result in particularly rapid geomorphological development. This applies in particular to land cover and geomorphology. This study employs quantitative, multi-temporal analysis to examine the spatio-temporal changes in a sub-humid calanchi badland in the upper Val d'Orcia (Italy) over a period of ten years (2014-2024). Particular emphasis lies on the dynamics of geomorphological processes and topographical changes, while considering the variables of vegetation and precipitation. The analysis encompasses both extreme events and prolonged rainfall lasting several days, which are the primary factors for surface changes in subhumid badlands. The utilisation of UAS SfM-MVS in conjunction with precise dGNSS measurements facilitates high-resolution change detection and landform analysis across five distinct observation periods, each spanning two years (= five DoD). The interactions between vegetation and geomorphological processes are investigated using a semi-automatic mapping approach based on the Triangular Greenness Index (TGI) and the interpretation of topographical changes (DoD). The vegetation analysis are based on high-resolution orthomosaics with a resolution of 0.05 m, while the geomorphic change detection analysis is carried out on 2.5D rasterised digital surface models with a resolution of 0.25 m. The major results are as follows: The mean slope gradient of the entire study site remained largely stable despite certain areas showing enhanced geomorphic activity. The DoD analysis revealed four 'geomorphic hot spots', areas of enhanced geomorphic activity and sediment contribution from the tributaries to the main valley (the major deposition area). The annual erosion rates vary between -0.4 cm (2018-2022) and -4 cm (2022-2024). The observed topographic changes can be attributed primarily to high-magnitude events (complex landslides and debris-like flows) that occur irregularly. The multi-temporal mapping of landforms has revealed a significant reduction in water erosion, with a 50% decrease observed from 35% in 2014 to 17% in 2024. Furthermore, the combination of 2D-mappings and 2.5D DoD-analysis enabled the documentation of a geomorphological process previously unknown in badland areas, namely gravitational bulging. This describes the deformation of sediments in lower-lying clay layers as a response to water infiltration, high swelling capacities of clays and the pressure exerted by the sediment packages lying above them. A significant increase in vegetation cover has been observed, particularly in areas designated as potentially moist and gentle terrain, often the deposition areas from the previous period. In general, vegetation underwent a gradual transition, evolving from a fragmented to a continuous structure, primarily due to the widespread colonisation of the main valley and the landslide pathways.  Although the area affected by erosion processes decreased over the course of the study period, erosion rates remained relatively constant. This indicates a shift from high-frequency to high-magnitude processes in the most recent observation period. Overall, the phase under consideration in this study (2014-2024) can be characterised as a phase of badland stabilisation.

How to cite: Stark, M., Sannino, A., Trappe, M., Rom, J., Forster, J., Kahlenberg, G., Haas, F., and Vergari, F.: From badland to bushland? Analysis of geomorphic process dynamics and vegetation development in a sub-humid calanchi area based on high-resolution UAS data (2014-2024)., EGU General Assembly 2026, Vienna, Austria, 3–8 May 2026, EGU26-18399, https://doi.org/10.5194/egusphere-egu26-18399, 2026.

EGU26-19445 | ECS | Orals | GM2.5 | Highlight

From Static to Dynamic: Modernizing the Sharing of HistoricalPhotogrammetry Datasets 

Felix Dahle, Roderik Lindenbergh, and Bert Wouters

The recovery of historical topography from analogue aerial archives has has become a well-established workflow in geosciences, unlocking high-resolution records of topographic change that were previously inaccessible. However, the standard practice for sharing these results relies on static FTP servers or raw file downloads. Consequently, these datasets often remain difficult to discover, particularly for researchers from other disciplines who cannot easily assess the spatial coverage or relevance of the archive through static file lists. Furthermore, existing web-based visualization solutions often require complex database configurations and advanced full-stack development skills, rendering them inaccessible for many geoscience research groups lacking dedicated software engineers.

In this work, we present a lightweight, open-source web application designed to support the publication of historical photogrammetric data. The design prioritizes portability and ease of deployment for non-developers. Unlike complex Content Management Systems (CMS) that rely on heavy database backends, our tool utilizes a streamlined file-based ingestion pipeline. Researchers can deploy a fully interactive instance by populating a directory structure with standard geospatial vector formats (e.g., Shapefiles, GeoJSON) and point cloud data. The Node.js-based backend automatically parses these inputs to configure the visualization interface, thereby eliminating the need for manual database administration.

We demonstrate the capabilities of the website using a dataset from the Antarctic TMA archive with ~ 250.000 images. The resulting interface facilitates spatio-temporal discovery through an interactive map that visualizes survey footprints, including the residuals between metadata-derived and SfM-estimated positions. This allows users to rapidly assess geometric quality and survey coverage. To extend the platform beyond simple 2D mapping, we present the architectural integration of Potree for browser-based 3D visualization. We discuss the workflow for streaming massive point clouds to the client, a feature designed to transform the website from a passive gallery into an active analytical tool for measurement and validation. Finally, we address the challenge of data distribution by outlining the implementation of a bulk-download utility, structured to allow users to filter and request specific subsets of raw imagery, associated metadata and processed data based on their visual selection.

By providing a self-contained, low-dependency solution, we aim to shift the community standard from static archiving to dynamic, interactive exploration. This tool allows geoscientists to easily share their historical images and reconstructions and make their data truly accessible to the broader scientific community without the overhead of custom software development.

How to cite: Dahle, F., Lindenbergh, R., and Wouters, B.: From Static to Dynamic: Modernizing the Sharing of HistoricalPhotogrammetry Datasets, EGU General Assembly 2026, Vienna, Austria, 3–8 May 2026, EGU26-19445, https://doi.org/10.5194/egusphere-egu26-19445, 2026.

EGU26-20499 | ECS | Posters on site | GM2.5

Detecting desert kites in 3D point clouds by learning anomalies 

Reuma Arav

Desert kites are large prehistoric hunting traps typically composed of two long, low stone walls that converge toward an enclosure.  These structures are widely distributed across the arid and semi-arid margins of the Middle East and Central Asia, exhibiting substantial variability in size, geometry, construction techniques, and topographic setting. To better understand their functionality from the Neolithic to sub-contemporaneous times, terrestrial laser scanning has increasingly been used to capture high-resolution three-dimensional representations of desert kites, enabling detailed characterization of their construction and local terrain setting. However, the kites’ subtle expression, their large spatial extent, and their progressive blending into the natural surface complicate their detection. These difficulties are further exacerbated by variable point density resulting from the alignment of multiple terrestrial scans, unavoidable occlusions caused by topography or vegetation, and the sheer volume of data produced by high-resolution ground-based surveys.  Together, these factors make the reliable identification and analysis of desert kite features within raw terrestrial point clouds a challenge, which requires extensive manual intervention and expert interpretation.

In this study, I present an automated, machine-learning-based approach for highlighting desert kite features directly within 3D point clouds derived from terrestrial laser scanning, without the need for manual annotation or labelled training data. The proposed method is based on the premise that the kites' structures introduce geometric irregularities (anomalies) relative to the surrounding natural surface. Rather than explicitly modelling the kite's form  or imposing predefined shape descriptors, the method learns a representation of the underlying terrain surface directly from the point cloud. This learned representation is then used to reconstruct the surface, which is subsequently compared to the original terrestrial measurements. Local deviations between the reconstructed surface and the original point cloud are quantified, with larger reconstruction errors interpreted as potential surface anomalies indicative of the kite's features. 

The proposed workflow is fully data-driven and unsupervised. It does not rely on prior knowledge of kite geometry, site-specific heuristics, or expert-defined thresholds. Instead, the learning process adapts to the local surface characteristics captured in the input dataset, making it robust to variations in resolution, occlusions, and terrain complexity commonly encountered in terrestrial laser scanning surveys. 

The findings demonstrate that surface-reconstruction-based anomaly detection offers a promising pathway for the automated identification of desert kite features in terrestrial 3D point clouds. More broadly, the approach is applicable to archaeological structures that exhibit weak or subtle geometric signatures. By reducing dependence on manual interpretation and labelled datasets, the method supports more objective, scalable, and reproducible analyses of archaeological landscapes, particularly in complex terrain where anthropogenic features are embedded within natural surfaces.

How to cite: Arav, R.: Detecting desert kites in 3D point clouds by learning anomalies, EGU General Assembly 2026, Vienna, Austria, 3–8 May 2026, EGU26-20499, https://doi.org/10.5194/egusphere-egu26-20499, 2026.

Despite significant advancements in landslide monitoring, landslides occurring on densely forested slopes remain largely unexplored. While conventional subsurface characterization methods (e.g., DPH, CPT, percussion drilling) are often impractical due to limited accessibility and steep rugged terrain, surficial analyses using remote sensing techniques frequently face challenges in capturing high-resolution ground surface data due to occlusion caused by dense vegetation cover as well as technical limitations.
Although trees and forests are generally acknowledged to reduce the probability of landslide occurrence, they are unlikely to prevent or substantially mitigate deep-seated landslides or failures on very steep slopes. Instead, trees may serve as proxies of landslide activity, potentially improving the understanding and monitoring of densely forested slopes. Affected by slope movements, trees experience external growth disturbances and develop characteristic growth anomalies that can be partly attributed to underlying landslide processes.

Multiple studies have demonstrated the feasibility of extracting such external growth disturbances, primarily stem tilting, by assessing the inclination and curvature of tree stems in LiDAR point clouds, greatly building upon previous forestry-related studies exploring the mapping, classification, and derivation of stem parameters such as height and diameter from digital twins. However, the potential to extract externally visible eccentric growth patterns in stem cross-sections at heights of maximum bending, analogous to dendrogeomorphologic tree-ring analyses, as a proxy for landslide activity has not yet been explored. Additionally, the classification of overall tree shape may provide valuable insights into the characteristics of underlying slope movements, but, to the best of the author’s knowledge, this has not been addressed in previous research.

To investigate the potential of automatically extracting tree shape and stem eccentricity from LiDAR data, and to evaluate their suitability as proxies of landslide activity, we introduce an improved two-stage processing pipeline for tree identification and extraction, along with a dedicated framework for digital dendrogeomorphology. Building upon previous work, we compute normal vectors of locally fitted planes and projected point densities to separate trees from the point cloud. To enhance the extraction of complex shaped trees (e.g., S-shaped or pistol-butted) characteristic of landslide-prone slopes, we introduce dynamically adjusted normal vector thresholds derived from estimated stem inclination. After segmenting tree stems from the point cloud, ellipses are fitted at configurable height intervals to determine cross-section centroids. These centroids are then connected as vertices of a 3D polyline, which is subsequently smoothed using a natural spline to represent the generalized stem geometry. Based on the curvature of the resulting polyline, the height of maximum bending is identified, and the corresponding cross-section eccentricity is extracted. In addition, the curvature of the polyline is used to categorically classify overall tree shape.

Our digital dendrogeomorphology approach applied to 3D point clouds enables accurate extraction of stem eccentricity, even for complex tree shapes typical of landslide-prone slopes. When paired with automated tree-shape classification, these data offer insights into slope movement and improve understanding of landslide processes in densely forested environments.

How to cite: Kamaryt, T.-H. and Müller, B.: Tree Geometry as a Potential Proxy for Landslide Activity in Densely Forested Slopes: A LiDAR-Based Digital Dendrogeomorphology Approach, EGU General Assembly 2026, Vienna, Austria, 3–8 May 2026, EGU26-21238, https://doi.org/10.5194/egusphere-egu26-21238, 2026.

Large-scale infrastructure development in mountain regions produces significant changes in slope morphology and surface processes. However, stability assessments conducted after construction often rely on static or short-duration evaluations. These approaches tend to assume an immediate geomorphic adjustment to human disturbance, which can overlook delayed and nonlinear responses of hillslopes. This study examines terrain adjustments that occur with a time delay following major construction activities in complex mountainous settings. The analysis is based on a series of high-resolution topographic datasets obtained through repeated LiDAR surveys along the Sibiu - Pitești motorway corridor in the Southern Carpathians of Romania. Changes in terrain configuration caused by excavation, filling, drainage alteration, and the unloading of slopes are identified by comparing elevation models and terrain metrics. Instead of focusing solely on deformation located at the site of intervention, the study investigates terrain responses that appear later and in areas situated upslope or laterally from the engineered zones. Findings show that slope instability and surface reorganization often emerge after a measurable time delay, typically reactivating existing geomorphic features such as drainage pathways, slope breaks, and erosional forms. These responses are not random but show a strong dependence on prior landscape conditions and the type of construction-related disturbance. The results emphasize the limitations of early assessments performed shortly after construction, which may fail to capture landscape dynamics relevant for landslide initiation. The study demonstrates the usefulness of repeated LiDAR mapping for detecting evolving terrain responses in engineered mountain landscapes and supports the integration of time-sensitive processes into hazard assessment strategies.

How to cite: Al-Taha, W., Andra-Topârceanu, A., and Mustățea, S.: Delayed slope response to infrastructure-induced landscape modifications in mountainous terrain revealed by high-resolution LiDAR analysis, EGU General Assembly 2026, Vienna, Austria, 3–8 May 2026, EGU26-21758, https://doi.org/10.5194/egusphere-egu26-21758, 2026.

EGU26-22072 | ECS | Posters on site | GM2.5

Automated photogrammetric reconstruction of Birch Glacier, Switzerland (1946–2025): A high-density time series of topographic change preceding catastrophic glacier collapse 

Friedrich Knuth, Elias Hodel, Holger Heisig, Mauro Marty, Mylène Jacquemart, Andreas Bauder, Jean-Luc Simmen, and Daniel Farinotti

As glaciers retreat, permafrost degrades, and mountains destabilize, modern landscape evolution is increasing the potential for catastrophic events, such as the Birch Glacier collapse on May 28, 2025. To improve our understanding of mass movements in mountainous regions and support future hazard assessment and risk mitigation efforts, we are generating time series of glacier surface elevation change from historical aerial photography provided by the Swiss Federal Office of Topography (Swisstopo). 

In this case study, we leveraged multi-temporal photogrammetric reconstruction and Digital Elevation Model (DEM) coregistration techniques, implemented in the Historical Structure from Motion (HSfM) pipeline, to generate an ~80-year record of self-consistent DEMs and orthoimage mosaics from analog film imagery collected over the Birch Glacier between 1946 and 2010. From 1985 until 2010 we generated nearly annual surface measurements, making this a unique and remarkably dense historical time series. The time series is augmented with modern surface measurements generated from linescan and UAV imagery collected during the period of 2010 to 2025. To quantify the uncertainty of elevation change measurements we compute residuals with respect to the swissSURFACE3D elevation over stable ground, defined by the swissTLM3D land surface classification. The reconstructed time series provides geometric constraints to precisely model the preconditioning phase leading up to the May 2025 Nesthorn-Birchglacier hazard cascade, which may help mitigate future risks in mountainous terrain (see Jacquemart et al. 2026 in GM3.1)

How to cite: Knuth, F., Hodel, E., Heisig, H., Marty, M., Jacquemart, M., Bauder, A., Simmen, J.-L., and Farinotti, D.: Automated photogrammetric reconstruction of Birch Glacier, Switzerland (1946–2025): A high-density time series of topographic change preceding catastrophic glacier collapse, EGU General Assembly 2026, Vienna, Austria, 3–8 May 2026, EGU26-22072, https://doi.org/10.5194/egusphere-egu26-22072, 2026.

EGU26-401 | ECS | Orals | GM3.3 | Highlight

AI-enhanced simulation of sediment transport in cold regions  

Ting Zhang, Shiyu Li, Albert Kettner, Shijie Jiang, Louise Farquharson, Yiyi Li, and Dongfeng Li

Climate change is rapidly reshaping hydro-geomorphological processes in cold regions. Melting glaciers and thawing permafrost are altering how and when sediment is mobilized, creating sediment supplies that are highly sensitive to warming and shifting precipitation patterns. During heavy rainfall and/or intense melting, this abundant and readily mobilized sediment can lead to substantial increases in sediment fluxes, triggering episodic sediment transport events widely observed in permafrost watersheds. These events are typically characterized by the complex co-occurrence of multiple factors such as transient and complex flow conditions, temporarily enhanced erosivity, and dynamic sediment availability. However, widely applied empirical, process-based, and data-driven sediment-transport models (e.g., rating curves, SAT, HydroTrend, SWAT, WBMsed) commonly assume stationary parameters or simplified process dynamics and tend to underestimate both the magnitude of episodic sediment transport. Artificial intelligence (AI)–based data-driven models, including machine learning and deep learning algorithms, have emerged as powerful tools for suspended sediment concentration modeling due to their ability to represent nonlinear and nonstationary processes. Using twenty years of hydrological observations, we found that the drivers of sediment transport now show distinct seasonal variations. To better capture these complex and seasonal shifting processes, we developed a modified deep learning model to learn seasonal differences in sediment transport and dynamically adjusts its predictive weights. It performs substantially better than current widely applied models including rating-curves, processes-based and random forest models, particularly during extreme sediment transport. Our results demonstrate the promise of integrating AI with process understanding to simulate highly variable sediment dynamics under changing climate and cryosphere conditions.

How to cite: Zhang, T., Li, S., Kettner, A., Jiang, S., Farquharson, L., Li, Y., and Li, D.: AI-enhanced simulation of sediment transport in cold regions , EGU General Assembly 2026, Vienna, Austria, 3–8 May 2026, EGU26-401, https://doi.org/10.5194/egusphere-egu26-401, 2026.

Extreme weather events, i.e., heavy rainfall, trigger widespread mass movements, producing large volumes of unconsolidated sediments that continue to shape geomorphic processes long after the event. However, the post-event evolution of precipitation-triggered landslides remains much less known, especially in paraglacial mountain systems. This study examines the decadal evolution of landslides in the Mandakini catchment, Uttarakhand, India, a landscape characterised by three distinct geomorphological zones: the lower fluvial, middle paraglacial, and upper glaciated regions. Using multi-temporal LISS-IV and PlanetScope imagery (2014–2023), the characteristics and activity of landslides were assessed across these zones. Results show that landslide activity peaked immediately after the 2013 Kedarnath disaster and declined gradually, although there was an increase in activity in 2018, 2020, and 2023, with clear geomorphic controls. The fluvial zone exhibited the highest landslide densities and continued reactivation, whereas the paraglacial zones were largely characterised by debris flow-type landslides that remained largely dormant, except for renewed movement in 2023. High-intensity short-duration rainfall emerged as a major trigger regardless of antecedent moisture, driving a marked surge in new landslides and debris flows during the 2023 monsoon. Additionally, anomalously high winter precipitation coincided with elevated debris-flow activity in the paraglacial zone, suggesting a significant role for snowmelt, which is likely to intensify under rising temperatures. Roughly 40% of the landslide-impacted area was fully revegetated by 2023. These findings highlight how a paraglacial terrain, rainfall extremes, and evolving snowmelt patterns collectively shape long-term slope sensitivity, with implications for hazard assessment and targeted mitigation in the Himalayas and similar environments worldwide.

How to cite: Sekar, A. and Siva Subramanian, S.: Extreme weather event-driven evolution of mass movements over upper, middle, and paraglacial zones of a Central Himalayan catchment , EGU General Assembly 2026, Vienna, Austria, 3–8 May 2026, EGU26-1152, https://doi.org/10.5194/egusphere-egu26-1152, 2026.

EGU26-5330 | ECS | Orals | GM3.3

Biogeomorphic River Response to an Unprecedented Hydrological Drought: Evidence from the Po River (Italy)  

Martina Cecchetto, Elisa Matteligh, Federica Vanzani, Elisa Bozzolan, Andrea Brenna, Elia Taffetani, Nicola Surian, and Simone Bizzi

As extreme hydrological events become increasingly frequent and intense, there is a growing need for innovative approaches to systematically monitor their impacts on riverine landscapes. This need is especially crucial in human-modified river systems, where such events can have significant consequences on the surrounding anthropized areas. The Po River in Italy exemplifies this challenge, having experienced an unprecedented drought in 2022—its lowest streamflow in two centuries—followed in 2024 by one of the most hydrologically intense years on record. This sequence of contrasting extremes makes the Po River an ideal case study for investigating morphological adjustments and assessing river sensitivity to hydrological variability.

We leveraged Sentinel-2 satellite imagery collection, spanning 2017 to 2025, on a 130-km-long segment of the Po River. A free, globally applicable Fully Convolutional Neural Network was employed to automatically classify monthly median composite images and delineate the active channel—defined as the area encompassing both flowing water and adjacent exposed, unvegetated sediment bars. We generated a continuous, updatable time series, identifying the emergence of progressively activated areas or regions undergoing gradual vegetation colonization (“deactivated” areas). By analysing changes over multiple years rather than on a year-by-year basis, this method more effectively distinguishes areas that consistently remain active or inactive from those that fluctuate between these two states. That helps separate changes driven by varying water stage from those resulting from morphological modifications, e.g. bank erosion.

Our analysis reveals that the 2022 drought was part of an extended period of hydrological scarcity lasting nearly three years. During this time, all reaches of the Po River experienced a net loss of active channel area due to vegetation encroachment. By comparing these trends with a 2022 LiDAR-derived Relative Elevation Model, we demonstrate that vegetation encroachment expanded into topographically lower zones closer to the low-flow channel that had not previously supported vegetation. This indicates a significant shift in morphological setting and ecological dynamics. The hydrologically intense conditions of 2024 triggered unprecedented bank erosion and the widespread reactivation of previously abandoned areas, particularly those deactivated during the preceding dry years. Interestingly, not all areas reactivated in 2024 persisted into 2025. We show that patterns of reactivation and the new activation of floodplain areas depend on river configuration and the degree of artificial confinement. While some reaches restored the active channel width to pre-drought levels, others have not yet fully recovered, suggesting that changes in vegetation establishment may have induced long-lasting morphological adjustments.

This approach provides a practical and scalable tool for global river monitoring, enhancing our understanding of river sensitivity to a rapidly changing climate.

How to cite: Cecchetto, M., Matteligh, E., Vanzani, F., Bozzolan, E., Brenna, A., Taffetani, E., Surian, N., and Bizzi, S.: Biogeomorphic River Response to an Unprecedented Hydrological Drought: Evidence from the Po River (Italy) , EGU General Assembly 2026, Vienna, Austria, 3–8 May 2026, EGU26-5330, https://doi.org/10.5194/egusphere-egu26-5330, 2026.

EGU26-5951 | ECS | Posters on site | GM3.3

Geomorphological Response of the Valnontey River Basin (NW Italy) to the Extreme Rainfall Event of June 2024 

Asif Nawaz, Eleonora Dallan, Stefano Crema, Marco Cavalli, Stefano Ferraris, Francesco Comiti, and Vincenzo D’Agostino

Abstract: Mountainous regions are now subject to more recurring flash floods than they were in the past decades. These recurring flash floods are attributed to short-duration extreme precipitation events, which are driven by climate change. Mountainous flash floods are far more hazardous as they trigger landslides, activate debris flows, and carry a large amount of dead wood, which can destroy entire valley infrastructure such as roads, bridges, and dams. Moreover, in response to these floods, valley rivers (confined or partially confined) also undergo geomorphological transformation, owing to debris flows. The sediment transportation activates processes like bank erosion, channel incision, bed alteration, and overbank aggradation both at the spatial and temporal scales. In June 2024, a mountainous flash flood led to dreadful destruction of the Valnontey catchment located in Cogne, Valle d’Aosta (northwestern Italian Alps). Not only was the valley infrastructure destroyed within a few hours, but the valley river network also experienced significant geomorphological changes due to the activity of debris flows and landslides. Intensive Post-Event Campaigns (IPECs) were carried out to quantify the flash flood and its geomorphological impacts in the Valnontey catchment. The 24-hour cumulative rainfall was estimated to be approximately 120 mm, and the reconstructed peak discharge ranged between 200 and 250 m³ s⁻¹. This is why in alpine catchments, where the real-time data on flood events is almost absent, post-event studies of hydro-geomorphological response to extreme rainfall events can be extensively found in the literature. However, the impact of resulting geomorphological changes to a flood event, mainly the channel widening, is generally not considered in flood hazard assessment and mountain river basin management, and so the study of all associated factors to geomorphological changes during high-magnitude floods remains a significant research gap. In this study, the analysis of geomorphological dynamics and channel response to such a flood event has been performed, with a principal focus on channel widening. The widening, a geomorphic response to flood events, of the main channel in the Valnontey basin was investigated quantitatively through manual digitization of channel margins using GIS tools. The methodological framework was based on multitemporal high-resolution pre-flood orthophotos and a LiDAR survey acquired immediately after the flood event (August 2024). It was observed that the main channel was predominantly widened because of floodplain island erosion and bank erosion processes that supplied sediments to the main channel. Statistically, the channel response, usually expressed as the width ratio (post-event width/pre-event width), was analysed in relation to channel bed slope and stream power. The results indicate that channel widening was controlled not only by extreme rainfall intensity and stream power (hydraulic factor), but also by morphological characteristics, including lateral confinement, channel bed slope, sediment availability, transport mechanisms, and hillslope–channel coupling.

Keywords: Alpine catchments; Extreme rainfall; Flash floods; Channel widening; Flood hazard

How to cite: Nawaz, A., Dallan, E., Crema, S., Cavalli, M., Ferraris, S., Comiti, F., and D’Agostino, V.: Geomorphological Response of the Valnontey River Basin (NW Italy) to the Extreme Rainfall Event of June 2024, EGU General Assembly 2026, Vienna, Austria, 3–8 May 2026, EGU26-5951, https://doi.org/10.5194/egusphere-egu26-5951, 2026.

EGU26-6221 | ECS | Orals | GM3.3

Decadal-scale changes in sediment export from an Alpine proglacial area linked to an increasing frequency of rainfall extremes: evidence for an emerging sediment-export regime shift? 

Ananya Pandey, Tobias Heckmann, Marco Cavalli, Matteo Crozi, Francesca Mura, Andrea Andreoli, Francesco Zucca, and Sara Savi

Climate change is strongly affecting sediment dynamics in the highly sensitive proglacial areas of high-mountain environments, as accelerated glacier melt and permafrost degradation expose new surfaces to erosion, while changing precipitation patterns influence erosion rates and sediment transport. Quantifying these changes is crucial for assessing geomorphological evolution, anticipating natural hazards, and evaluating the responses of both proglacial and downstream ecosystems. However, this task remains challenging as sediment yields from these landscapes are governed by complex interactions among moraine activity, glacial erosion, paraglacial adjustment, and channel morphology, with ongoing climate change further modulating the timing and magnitude of these processes.

This study aims to quantify temporal changes in sediment fluxes in the Sulden proglacial area in South Tyrol, Eastern Italian Alps, from 2005 to 2025, and to assess the role of climate variability in driving these changes. We used high-resolution digital elevation models (DEMs) from 2005, 2017, 2021, 2023, and 2025 to compute multi-temporal DEMs of Difference (DoDs) and derive mean annual sediment fluxes for each interval. Unequal interval lengths can bias flux estimates because short-lived peaks associated with extreme precipitation events may be averaged out over long periods. To address this, we calculated mean annual sediment flux over cumulative intervals starting in 2005 (2005-2017, 2005-2021, 2005-2023, and 2005-2025), providing a framework to evaluate whether, and to what extent, recent changes in precipitation patterns influence longer-term mean flux estimates. 

Our results show that mean sediment fluxes, referenced to 2005, have increased sharply and nonlinearly over time, spanning more than one order of magnitude by 2025 and revealing a clear acceleration relative to the 2005-2017 baseline. Comparison of the non-overlapping intervals 2005-2017 and 2017-2025 further emphasizes this shift, with mean fluxes during 2017-2025 approximately 40 times higher than during 2005-2017, indicating a fundamental increase in sediment export efficiency rather than short-term variability around a stable long-term mean. Interestingly, periods with similar amounts of erosion reveal contrasting amounts of deposition along low-slope fluvial pathways within the proglacial system, illustrating how functional connectivity controls sediment storage and ultimately sediment export. Precipitation records indicate an increase in the frequency of high-magnitude rainfall events after 2017, including more frequent exceedances of daily extremes and events approaching or exceeding a 10-year return period.

Together, these findings suggest that the increasing frequency of extreme precipitation events is a key driver of enhanced sediment yields in proglacial environments, with important implications for sediment-related hazards and associated management costs.

How to cite: Pandey, A., Heckmann, T., Cavalli, M., Crozi, M., Mura, F., Andreoli, A., Zucca, F., and Savi, S.: Decadal-scale changes in sediment export from an Alpine proglacial area linked to an increasing frequency of rainfall extremes: evidence for an emerging sediment-export regime shift?, EGU General Assembly 2026, Vienna, Austria, 3–8 May 2026, EGU26-6221, https://doi.org/10.5194/egusphere-egu26-6221, 2026.

Snow avalanches constitute a widespread and dynamic geomorphic process in the Carpathian Mountains, playing a key role in sediment and debris transfer on steep slopes within alpine and subalpine belts. The occurrence, magnitude, and frequency of snow-avalanche events are strongly controlled by climatic factors, particularly snowfall amount, snowpack structure, temperature fluctuations, and extreme weather conditions. In the context of ongoing climate variability, understanding the long-term relationship between climate drivers and avalanche activity is essential for improving hazard assessments in high-mountain regions.

In remote areas of the Carpathians, snow-avalanche hazard assessment is severely limited by the scarcity of systematic observations and the absence of long-term archival records of past avalanche events. This data gap is especially pronounced in the Eastern Carpathians, where documentary evidence of extreme snow avalanches is largely missing. At the same time, increasing human presence and recreational activities in high-mountain environments over recent decades have amplified exposure to avalanche hazards, highlighting the urgent need for reliable, long-term reconstructions of avalanche activity and climate-induced extremes.

This study aims to enhance the understanding of climate-driven snow-avalanche dynamics in the Eastern Carpathians through dendrochronological methods. Multiple avalanche paths located in different mountain ranges were investigated, targeting both coniferous and broadleaved tree species affected by past snow-avalanche activity. Trees disturbed by avalanches were sampled along selected paths, and growth anomalies caused by the mechanical impact and mass movement of snow were identified and precisely dated within annual growth rings. These disturbances include impact scars, tangential rows of traumatic resin ducts, compression wood, and growth-suppression sequences, which serve as reliable proxies for past snow-avalanche events.

By synchronizing avalanche signals recorded in tree-ring series and relating them to regional climatic patterns, this study reconstructs the spatial extent, frequency, and return periods of snow-avalanche events, with particular emphasis on extreme events likely associated with anomalous climatic conditions (e.g., winters with exceptional snowfall, or rapid temperature increases). The results provide insight into temporal variations in avalanche activity and allow the identification of climatically controlled periods of enhanced snow-avalanche occurrence. The dendrochronological reconstruction of climate-induced snow-avalanche activity offers a valuable long-term perspective on avalanche regimes in the Eastern Carpathians. These findings contribute to improved snow-avalanche hazard assessment and zonation and provide a robust framework for evaluating the potential impacts of future climate variability and change on avalanche dynamics at both local and regional scales.

How to cite: Pop, O.: Tree-ring reconstruction of climate-induced extreme snow-avalanche events in the Eastern Carpathians (Romania), EGU General Assembly 2026, Vienna, Austria, 3–8 May 2026, EGU26-6368, https://doi.org/10.5194/egusphere-egu26-6368, 2026.

EGU26-6585 | ECS | Orals | GM3.3

Juvenile and mature alpine sediment fans respond differently to rainfall intensification 

Philipp Gewalt, Thomas Wagner, Natalie Barbosa, Carolin Kiefer, and Michael Krautblatter

Alpine alluvial fans and debris flow cones are central components of the sediment cascade. The projected increase in heavy precipitation due to ongoing climate warming is thought to intensify sediment redistribution dynamics under transport-limited conditions. However, alluvial fan response to increasing heavy precipitation has been shown to strongly differ between individual catchments. In this study, we compare decadal-scale planimetric dynamics of a mature alpine alluvial fan (“Friedergries”, 5 km2 catchment area) to juvenile debris flow cones (Lake Plansee, catchment areas mostly < 0.5 km2) in the Main Dolomite region of the Northern Calcareous Alps. We show that the juvenile cones corresponding to small and steep catchments are susceptible to moderate precipitation while floodplain dynamics on the mature fan are only susceptible to extreme precipitation events with supra-regional extent. Our observation indicates that sediment redistribution on juvenile cones with small and steep catchments will shift towards spring and autumn, corresponding to the seasonal shift of moderate precipitation extremes (1-year return level). In contrast, sediment redistribution on mature fans with larger, gentler catchments will continue to occur mainly in summer, as supra-regional extreme events with return levels > 1 year will occur during the hottest months also in a changing climate (Brönnimann et al., 2018). Here we show that catchment morphology and fan maturity control future susceptibility to rainstorms and thus sediment fan evolution over the coming decades.

Brönnimann, S., Rajczak, J., Fischer, E.M., Raible, C.C., Rohrer, M. & Schär, C. (2018): Changing seasonality of moderate and extreme precipitation events in the Alps. – Natural Hazards and Earth System Sciences, 18: 2047 – 2056. DOI: 10.5194/nhess-18-2047-2018.

How to cite: Gewalt, P., Wagner, T., Barbosa, N., Kiefer, C., and Krautblatter, M.: Juvenile and mature alpine sediment fans respond differently to rainfall intensification, EGU General Assembly 2026, Vienna, Austria, 3–8 May 2026, EGU26-6585, https://doi.org/10.5194/egusphere-egu26-6585, 2026.

EGU26-13856 | ECS | Posters on site | GM3.3

The role of sediment transport in amplifying flooding 

Josh Wolstenholme, Christopher Skinner, Christopher Hackney, Matthew Perks, and Daniel Parsons

Rivers are dynamic, with channel size and shape adapting to fluctuations in water and sediment supplied from their upstream catchments. These changes directly affect flood conveyance capacity, yet sediment transport processes are often overlooked in flood hazard prediction and management, where channels are treated essentially as static pipes through landscapes. Recent global floods show this assumption can be flawed, as extreme rainfall events can liberate and transport vast volumes of sediment, and in doing so potentially amplify flood hazard.

Here we show, using a prototype catchment in the UK and rainfall data, including that derived from an extreme event associated with Storm Desmond in 2015, the critical role of intra-event sediment transport on flood inundation levels. Our analysis reveals a substantial increase in flood inundation volumes compared to projections that exclude sediment transport processes. Extending these simulations to a range of storm scenarios, we find that both event duration and intensity can significantly influence sediment-driven flood amplification processes, with longer-duration floods of the same magnitude increasing inundation.

These findings underscore the need to consider incorporating intra-event sediment fluxes into flood hazard assessments and that failing to address and integrate these processes could underestimate future risks under climate change.

How to cite: Wolstenholme, J., Skinner, C., Hackney, C., Perks, M., and Parsons, D.: The role of sediment transport in amplifying flooding, EGU General Assembly 2026, Vienna, Austria, 3–8 May 2026, EGU26-13856, https://doi.org/10.5194/egusphere-egu26-13856, 2026.

EGU26-15213 | Posters on site | GM3.3

Basin Relief and Hypsometry Indicate Rapid Erosion in the Badlands of the Active Fold-Thrust Belt of Southwestern Taiwan 

Maryline Le Béon, Kifayat Ali, Lionel Siame, Kai-Feng Chen, Ngoc-Thao Nguyen, Pak-Hin Leung, Kuo-En Ching, and Erwan Pathier

The badlands of southwestern Taiwan lie within an active fold-and-thrust belt, where surface geology mainly consists of a thick Plio-Pleistocene mudstone formation. In the absence of fluvial markers of river incision, we investigate relief and hypsometry within the badlands as potential proxies for long-term (0.1-1 ka) tectonic uplift. In parallel, hypsometric curves allow us to assess the balance between tectonics and erosion.

We selected three badland sites located at different structural positions, with decadal uplift rates from 12 to 55 mm/yr (continuous GNSS, levelling or traverse measurements), yet with similar lithology and climate. The badlands are of calanchi type, with unvegetated slopes and sharp ridges, low relief (<50 m) and short basin length (<200 m). Topographic datasets include high-resolution (2.5 to 10 cm) UAV-derived Digital Surface Models (DSM) at all sites and a 1-m LiDAR Digital Earth Model (DEM) at one site. Drainage network, divides and geomorphic metrics (basin relief BR, hypsometric integral HI and hypsometric curve) were extracted using ArcGIS and Matlab TopoToolbox, for 12 to 27 basins over areas of 5000 to 34000 m2 from site to site.

At the fastest-uplift site, the 10-cm-resolution DSM and 1-m DEM lead to similar average BR (35 ± 7 m and 37 ± 7 m, respectively) and HI (0.49 ± 0.05 and 0.46 ± 0.05), although results for individual basins differ significantly for 20% of the 24 basins. Hence, even though crestlines and gullies are commonly narrower than 1 m, the 1-m LiDAR DEM mainly provides representative values for the investigated metrics. Results obtained from UAV DSMs at the three sites show no clear influence from decadal uplift or structural position. With increasing uplift of 12, 23, and 55 mm/yr, we respectively obtained average BR and HI of 27 ± 8 m and 0.50 ± 0.03, 23 ± 6 m and 0.48 ± 0.07, and 35 ± 7 m and 0.49 ± 0.05. Hypsometric curves fluctuate around a S shape at all sites, indicating a transitional stage with sustained uplift and erosion. A notable difference in the field is the thinner crestines and larger amount of clasts transiting along the hillslopes at the fastest-uplift site, indicating a larger production of clasts than run-off can transport. We interpret these results as erosion rates exceeding the already rapid uplift rates. This would be facilitated by the low erodibility of the mudstone formation. Indeed, a regional analysis based on a 20 m DEM shows that mean and maximum values of local slope and relief are lower in the mudstone domain than in siltstone and sandstone domains, in spite of active anticlines and larger decadal uplift being located in the mudstone domain. Ongoing complementary works on basin-wide denudation rates in several-km-long river basins draining the mudstone domains led to contrastingly low denudation rates of 0.8 mm/yr, indicating that badlands denudation either represents a different timescale or that other processes dominate denudation at the larger spatial scale.

How to cite: Le Béon, M., Ali, K., Siame, L., Chen, K.-F., Nguyen, N.-T., Leung, P.-H., Ching, K.-E., and Pathier, E.: Basin Relief and Hypsometry Indicate Rapid Erosion in the Badlands of the Active Fold-Thrust Belt of Southwestern Taiwan, EGU General Assembly 2026, Vienna, Austria, 3–8 May 2026, EGU26-15213, https://doi.org/10.5194/egusphere-egu26-15213, 2026.

The routing of sediment from source to sink is commonly described as a “jerky” conveyor belt, in which sediment flux is strongly controlled by connectivity between source areas and transfer zones. However, the extent to which extreme flood events increase source connectivity and modify sediment transfer through river reaches via combined hillslope and fluvial processes remains poorly understood. The increasing availability of multitemporal, high-resolution lidar now enables the development of event-scale topographic sediment budgets, providing new insights into sediment flux during extreme events.

In February 2023, the landfall of Cyclone Gabrielle caused catastrophic flooding along the eastern coast of the North Island of Aotearoa New Zealand. Repeat lidar surveys were acquired for three catchments—Esk (264 km²), Aropauanui (158 km²), and Tangoio (71 km²)—to quantify landscape change and develop catchment-scale sediment budgets. Sediment delivery ratios were estimated to be approximately 0.4 across all three rivers, with sediment volumes delivered to the marine environment of 9.6 × 10⁶ m³ for the Esk, 5.1 × 10⁶ m³ for the Aropauanui, and 2.4 × 10⁶ m³ for the Tangoio.

Sediment budgets were further refined through geomorphic mapping and two-dimensional flood modelling to partition sediment sources and sinks into geomorphic process zones. The sediment routing model D-Cascade was used to route upstream sediment supply, combined with hillslope-derived inputs along the reach, through individual river sections. Results identify river reaches where observed sediment fluxes exceed modelled fluvial transport capacity, indicating locations where debris-flow-dominated transport processes likely governed sediment routing during the cyclone. These findings demonstrate the potential importance of non-fluvial processes in shaping sediment transfer during extreme floods and highlight the value of lidar-based sediment budgets for resolving sediment dynamics at the event scale.

How to cite: Stout, J., Rogers, J., and Brasington, J.: Jerky conveyor belts under stress: sediment connectivity and routing during an extreme flood event in New Zealand, EGU General Assembly 2026, Vienna, Austria, 3–8 May 2026, EGU26-15722, https://doi.org/10.5194/egusphere-egu26-15722, 2026.

EGU26-16773 | ECS | Posters on site | GM3.3

Are CRN-derived denudation rates representative of contemporary natural sediment fluxes? 

Florence Tan, Benjamin Campforts, Veerle Vanacker, Pasquale Borrelli, and Matthias Vanmaercke

Disentangling human signals from geomorphic, tectonic, and climatic drivers of contemporary sediment fluxes is key to understanding the magnitude of human impacts on river basins and the landscape. Denudation rates derived from cosmogenic radionuclides (CRN) can provide a useful baseline of ‘natural’ sediment fluxes, especially in regions where little to no undisturbed catchments remain or where contemporary monitoring networks are lacking. However, their integration time can span very long timescales (up to 100kyr), which may limit their suitability for establishing contemporary natural rates of sediment export. Here, we investigate whether (and where) CRN-derived denudation rates are representative of current climatic, geomorphic, and tectonic conditions and can provide relevant contemporary baseline fluxes. We do so by first compiling hundreds of contemporary sediment yield (SY) observations from ‘quasi-natural’ catchments worldwide. We define quasi-natural catchments as ones with little to no expected disturbance to their sediment transport regime due to anthropogenic changes to the landscape or river system (e.g., land cover/land use, dams and reservoirs, mining). In addition to clear indicators of human disturbance such as the degree of regulation of the river network or the human footprint in the catchment, we base our selection of quasi-natural catchments on a combination of biome-specific thresholds and patterns of acceptable semi-natural vegetation, land cover classification, and potential natural vegetation maps. We then compare a global denudation rate model (trained on >4,000 CRN samples) against the contemporary SY observations and examine possible global and regional patterns of correlation. We further explore the potential of integrating both types of data into a combined global natural SY model, with the goal of further improving our understanding of nature- vs human-driven sediment dynamics worldwide.

How to cite: Tan, F., Campforts, B., Vanacker, V., Borrelli, P., and Vanmaercke, M.: Are CRN-derived denudation rates representative of contemporary natural sediment fluxes?, EGU General Assembly 2026, Vienna, Austria, 3–8 May 2026, EGU26-16773, https://doi.org/10.5194/egusphere-egu26-16773, 2026.

EGU26-17476 | ECS | Posters on site | GM3.3

Fluvial response to Andean-Amazonian Transition Dynamics: evidence from Huallaga River terraces in central Peru 

Carolina Cruz, Priscila Souza, Willen Viveen, Anarda Simoes, Gabriella Campos, Caio Breda, Renan Brito, Daniel Souza, Andre Sawakuchi, Bodo Bookhagen, and Fabiano Pupim

The uplift of the Andes mountain range is widely recognized as a primary factor in shaping South America's climate patterns and transforming adjacent river landscapes. These changes have played a fundamental role in the dynamics of the rivers that drain the Amazon lowlands and      shaping the physical landscapes and ecosystems over time.      Here, we reconstruct the geomorphological and sedimentary evolution of the Huallaga River in central Peru. As part of the Amazon drainage system, the Huallaga River preserves a sedimentary record that allows us to disentangle the relative roles of tectonics and climate.

This study uses geomorphological mapping, sedimentological characterization, and feldspar post-infrared infrared-stimulated luminescence (pIRIR)      dating to investigate the geomorphological and sedimentary evolution of the upper Huallaga River     . Feldspar      pIRIR                at 225oC and at 290oC was applied to determine sediment      deposition ages from river terraces and the Juanjui Fm. in the Juanjuí region, which is located on the eastern edge of the Peruvian Andes. The Huallaga River deposits are generally characterized by thick sedimentary layers (0 - 75 m) composed of conglomerates supported by a fine sand matrix and framework. The Pliocene-Pleistocene Juanjui Fm.           consists of polymictic conglomerates with a sandy matrix. The conglomerate framework      consists of gneiss, volcanic rock, schist, and sandstone pebbles that were reworked and deposited in a fluvial-alluvial fan environment. Geomorphological mapping indicates eight distinct terrace levels, named T1 to T8 from lower to higher elevation      ranging from 3 to 142 meters above the riverbed. Feldspar      pIRIR      ages range from 100 to 300 thousand years ago (ka), but some      sediment layers have similar ages, indicating a fill-cut deposit. The evolution of this region can be divided into four phases. The first phase is represented by the deposition of the Pliocene Juanjuí Fm. over the Miocene Ipururu Fm., indicating a period of high-energy aggradation. The second phase is characterized by the beginning of uplift of      a syncline, promoted by the Biabo fault. This uplift caused erosion of part of the Juanjuí Fm.      due to incision by the ancient Huallaga River. This was followed by the deposition of alluvial fans in the axial portion of the river system. The third phase is characterized by continued uplift, which promoted the erosion of the      Pleistocene alluvial deposits (now, exposed in terrace levels) and the onset of a new phase of river incision. The last phase records the current configuration of the fill-cut terraces. These minimum ages are older than previously reported ages for the top of the Juanjuí Fm. in a nearby anticline. An integrated analysis of mapping, sedimentology, and chronology allowed the interpretation of river terrace deposition and incision phases, supporting future links with regional tectonic deformation. These results improve our understanding of recent dynamics along the eastern Andean margin and its role in shaping the Amazon basin. Funding provided by FAPESP (23/16031-4 and 22/03007-5).


Keywords: fluvial evolution, pIRIR dating, geomorphological mapping, Sub-Andean deposits

How to cite: Cruz, C., Souza, P., Viveen, W., Simoes, A., Campos, G., Breda, C., Brito, R., Souza, D., Sawakuchi, A., Bookhagen, B., and Pupim, F.: Fluvial response to Andean-Amazonian Transition Dynamics: evidence from Huallaga River terraces in central Peru, EGU General Assembly 2026, Vienna, Austria, 3–8 May 2026, EGU26-17476, https://doi.org/10.5194/egusphere-egu26-17476, 2026.

It is widely stated that atmospheric warming, together with an increasing frequency of rainfall events, enhance the activation of sediment sources, erosion and sediment-transport processes in cold-climate environments, with these increases being mainly driven by cryosphere degradation. In this study we compare the effects of ongoing environmental changes on measured sediment yields in three different cold-climate environments in Norway: (i) partially-glacierized drainage basins (Bødalen and Erdalen, connected to the Jostedalsbreen ice cap, western Norway), (ii) one drainage-basin system with discontinuous permafrost (upper Driva, central Norway), and (iii) one boreal drainage-basin system free of permafrost (Selbusjøen, central Norway).  Our study includes the multi-year (>10 yr) monitoring of fluvial solute and sediment transport using a range of different advanced techniques. In the partially-glacierized drainage basins mechanical denudation dominates over chemical denudation. Most sediment transport occurs during pluvial events in fall, followed by thermally-determined glacier melt in summer, and thermally-determined snowmelt in spring.  An increasing frequency of extreme rainfall events leads to increased sediment yields whereas smaller amounts of wintry snow and the ongoing retreat of outlet glaciers are not causing a detectable increase of sediment yields. For the drainage-basin system with discontinuous permafrost it is found that global warming and the connected shifts in the ratio of snow and rain, the increased frequency of heavy rainfall events, and the continued thawing of permafrost have complex effects on denudation, with an increasing importance of pluvially-induced denudational events, a decreasing importance of snowmelt-induced denudation processes, and an increasing dominance of chemical denudation over mechanical denudation. Also in the boreal environment an increasing importance of pluvially-induced denudational events, a decreasing importance of snowmelt-induced denudation processes, and an increasing dominance of chemical over mechanical denudation can be observed. As a result, the different cold-climate environments respond differently to ongoing environmental changes. A significant increase of mechanical denudation due to cryosphere degradation cannot be detected in our study areas while an increased frequency of pluvial events causes an enhanced activation of sediment sources and rising mechanical denudation.

How to cite: Beylich, A. A. and Laute, K.: Effects of environmental change on the activation of sediment sources in different cold-climate drainage basins in Norway , EGU General Assembly 2026, Vienna, Austria, 3–8 May 2026, EGU26-19301, https://doi.org/10.5194/egusphere-egu26-19301, 2026.

EGU26-20653 | ECS | Posters on site | GM3.3

Sensitivity of Escarpment Evolution to Lithology and Climate Forcing: Forward Landscape Evolution Study from the Swabian Alb 

Sahil Kumar, Christoph Glotzbach, Alexander Beer, and Daniel Peifer

Escarpment landscapes represent prominent geomorphic boundaries that result from the long-term interaction of tectonic uplift, climate induced surface processes and lithological diversity over the one million timescales. However, quantifying the relative contribution of each factor remains challenging over such long periods. Process-based landscape evolution models provide these controls to be isolated and systematically tested under regulated conditions.
In this study, we use forward numerical landscape evolution simulations to investigate the sensitivity of escarpment evolution in the Swabian Alb
(southwestern Germany). We employ the Landlab modeling tools to simulate landscape transformations over approximately 1 Myr. Fluvial incision is
represented using a detachment-limited stream-power model, while hillslope sediment transport is depicted as diffusive smoothing. Spatially variable uplift is utilized to model long-term tectonic forces. Lithological heterogeneity is characterized by stratified layers exhibiting regionally diverse erodibility
coefficients, guided by channel steepness metrics that are commonly used to evaluate geographical discrepancies in river incision potential. Sensitivity studies examine different precipitation/runoff forcing scenarios to evaluate how climatic forcing changes erosion patterns compared with lithological controls.
Model results indicate that erosion and escarpment retreat are markedly concentrated along the Albtrauf escarpment facing tributaries of neckar and the primary river, but the core of the Swabian Alb plateau remains reasonably intact throughout the 1 million-year simulations. In the basic arrangement, high-erosion zones (≥P80) encompass a significant area of the escarpment domain but only a small section of the plateau. Sensitivity experiments indicate that variations in lithology significantly influence the magnitude and duration of erosion hotspots. They may improve hotspot coverage by up to as 10–12 percentage points relative to the basic model in some catchments however changes in uplift rate create very minor changes. Increasing precipitation significantly raises erosion level, however hardly influences the dimensions of hotspots. This indicates that climate mostly exacerbates erosion rather than altering its spatial distribution.

Reorganizing drainage by relocating divisions and trapping water locally
enhances incision concentration within existing channel networks. This results in
the gradual erosion of escarpments over an million timescale.

How to cite: Kumar, S., Glotzbach, C., Beer, A., and Peifer, D.: Sensitivity of Escarpment Evolution to Lithology and Climate Forcing: Forward Landscape Evolution Study from the Swabian Alb, EGU General Assembly 2026, Vienna, Austria, 3–8 May 2026, EGU26-20653, https://doi.org/10.5194/egusphere-egu26-20653, 2026.

EGU26-22128 | ECS | Posters on site | GM3.3

Linking fan surface morphology to erosional process regimes: A morphometric framework 

Maryn Sanders and Joshua Roering

Fans formed by the accumulation of debris flows, rockfalls, and fluvial action are often found at the base of steep escarpments, which commonly border infrastructure corridors. Escarpments evolve at discordant rates, due to climate and tectonic gradients, and geologic heterogeneity. The variations influence watershed morphology, which in turn determines the dominant erosional processes and potential hazard along fans, such as rockfall, landsliding, avalanches, or flooding. Classically, erosional process regimes have been determined from simple morphometric indices, such as watershed length and the Melton Ratio (watershed relief divided by the square root of area; Wilford et al., 2004). Here, we propose a new framework that leverages high-resolution topography and its topographic derivatives along the steep Columbia River Gorge (CRG) escarpment (Oregon, USA) to classify erosional process regimes across 78 fans. Using fan slope, surface roughness, and drainage density, we map transitions from colluvial to debris-flow dominated fans. We show these topographic derivatives along fans can stand alone, providing the ability to distinguish upslope catchment processes without catchment morphology. This work serves as a framework for preliminary assessment of regional-scale process variability on fans, with applications ranging from hazard mitigation efforts to planetary geomorphology.

How to cite: Sanders, M. and Roering, J.: Linking fan surface morphology to erosional process regimes: A morphometric framework, EGU General Assembly 2026, Vienna, Austria, 3–8 May 2026, EGU26-22128, https://doi.org/10.5194/egusphere-egu26-22128, 2026.

EGU26-22181 | Orals | GM3.3

HOLOCENE AND PRESENT-DAY EVIDENCES OF RECURRENT POST-FIRE LANDSLIDES: geomorphological responses to climatic and environmental changes. 

Ana Luiza Coelho-Netto, Ana Carolina Facadio, Leticia Bolsas, Karoline Ishimine, and Roberta Silva

Given the accelerated pace of climate change (increased droughts and the frequency of intense rainstorms) and human-induced land-use changes, this work assesses the magnitude of their effects on slope evolution in the Serra do Mar mountainous domain of Rio de Janeiro, SE Brazil. Morphological, historical, and functional approaches were integrated to evaluate the conditions controlling landslides in response to Holocene bioclimatic changes and present-day environmental dynamics, with emphasis on the role of fire in intensifying these phenomena. Past processes dynamics were inferred through geomorphological, chronostratigraphic, and palynological evidence. Current studies include geological-geotechnical, hydro-geomorphological, and vegetation analysis; classification of landslide susceptibility and comparison with the January 2011 landslide inventory; monitoring rainfall and soil suction in fire-affected vegetation (degraded forest and herbaceous-shrubby vegetation); in situ tests of Ksat and fire-controlled field experiments. Regionally, colluvial deposits mark distinct landslide episodes throughout the Holocene, with local recurrence intervals of about 300 years. Variations in δ13C and palynological analyses suggest significant transformations in vegetation cover during the Mid-Holocene, with a predominance of herbaceous-shrubby post-fire vegetation and pioneer species; spores and pollen grains with mechanical damage, indicative of a high-energy transport environment, attest to landslide transport. Charcoal fragments in colluvial deposits suggest frequent paleofires during the Holocene. Nowadays, recurrent short-term fires (<10 years) replace forests with herbaceous-shrubby vegetation, where most of the landslides (70%, N=382) from the 2011 catastrophic event are concentrated. At some slopes, fires create a hydrophobic layer in herbaceous vegetation, and short roots (≤30 cm deep) reduce evapotranspiration, keeping soil conditions near saturation at 1,5 m depth, even during prolonged droughts. Post-fire, soil suction increases in the upper soil meter in both vegetation types, within a five to six-month delay. During the following rainy season or extreme rainfall, soils tend to saturate completely, leading to rapid suction loss and excess pore pressure that could trigger landslides. In degraded secondary rainforest, dominated by pioneer and early-succession species that sustain rapid hydrological responses to rainfall, the absence of functional anchoring roots would increase the likelihood of landslides. 

How to cite: Coelho-Netto, A. L., Facadio, A. C., Bolsas, L., Ishimine, K., and Silva, R.: HOLOCENE AND PRESENT-DAY EVIDENCES OF RECURRENT POST-FIRE LANDSLIDES: geomorphological responses to climatic and environmental changes., EGU General Assembly 2026, Vienna, Austria, 3–8 May 2026, EGU26-22181, https://doi.org/10.5194/egusphere-egu26-22181, 2026.

Mountainous regions in India and Vietnam are highly vulnerable to landslides due to their complex terrain, active tectonic settings, and intense seasonal rainfall, posing severe risks to infrastructure, ecosystems, and human settlements. This study employs the Small Baseline Subset Interferometric Synthetic Aperture Radar (SBAS-InSAR) technique to monitor long-term ground deformation and evaluate slope stability in landslide-prone areas across these regions. Using Sentinel-1 satellite imagery from 2020–2025, SBAS-InSAR was applied to mitigate decorrelation challenges caused by dense vegetation and steep topography, enabling millimeter-scale accuracy in displacement measurements. Time-series deformation maps reveal spatially heterogeneous movement patterns, with accelerated displacement during monsoon periods, strongly correlated with rainfall intensity and geological factors such as fractured bedrock and colluvial deposits. Validation through field observations and geotechnical data confirms the reliability of SBAS-InSAR results, identifying critical failure zones influenced by groundwater infiltration and slope oversteepening. The findings demonstrate the effectiveness of SBAS-InSAR for monitoring slow-moving landslides in remote mountainous regions, providing actionable insights for hazard assessment, early warning systems, and sustainable infrastructure planning. This research underscores the role of spaceborne radar technology in enhancing disaster resilience and risk mitigation strategies in both the Indian Himalayas and northern Vietnam.


Keywords: SBAS-InSAR, slope instability,Indian Himalayans, North Vietnam, Sentinel-1, deformation monitoring. 

How to cite: Manocha, A. R.: Assessing Slope Stability and Landslide Hazards using InSAR-Based Deformation Monitoring In the India and Vietnam., EGU General Assembly 2026, Vienna, Austria, 3–8 May 2026, EGU26-238, https://doi.org/10.5194/egusphere-egu26-238, 2026.

On 23 September 2023, a major quick-clay landslide occurred at the Stenungsund interchange on the E6 highway in southwestern Sweden. It caused extensive damage to critical transport infrastructure, resulting in long-term regional disruption and underscoring the societal vulnerability of development in sensitive clay terrains. This study presents an integrated geological, geomorphological, hydrological, and anthropogenic analysis of the Stenungsund landslide, aiming to clarify the mechanisms that led to failure and to extract lessons relevant for hazard assessment and land-use planning.

The landslide affected approximately 15 hectares, with a runout distance of about 620 m and an estimated displaced volume of ~1.85 million m³. We combine field mapping, stratigraphic logging, geotechnical data, historical documentation, and LiDAR-derived terrain models with aerial and satellite imagery and hydrological modelling to reconstruct pre-failure conditions, failure kinematics, and post-event morphology. The geological setting consists of thick sequences of late- to postglacial marine clay in a fracture-valley landscape, interbedded with permeable silt, sand, shell-rich horizons, and glaciofluvial sediments. These conditions promote groundwater flow, clay pore-water salt leaching, and the development of quick clay.

Our results indicate that failure initiated at depth within weak clay layers beneath recently placed fill and evolved into a translational progressive landslide. Anthropogenic loading from construction activities acted as the primary trigger, while altered drainage and groundwater pathways raised pore-water pressures. Hydrological modelling shows that excavation, blasting, and filling redirected runoff toward the site and increased infiltration along fractured bedrock and permeable sediment layers. Heavy rainfall in the days before the event likely added to the pressure build-up and influenced the timing of failure. Once downslope resistance was lost, rapid mobilization of quick clay produced large horizontal displacements and complex deformation patterns, including subsidence, heave, and circular-cylindrical failures.

The Stenungsund case highlights the tight coupling between geological predisposition and human modification in quick-clay terrain. It shows how short-term construction activity can destabilize systems that may appear stable under conventional assessments. Integrated evaluations that consider hydrogeological connectivity, stratigraphic variability, and cumulative anthropogenic effects are needed to improve risk mapping and guide controls on loading and drainage changes. Enhanced monitoring of groundwater conditions is likewise essential. As extreme rainfall events become more frequent, reassessing design methodologies and land-use practices in sensitive clay landscapes become increasingly important.

How to cite: Öhrling, C. and Fredin, O.: The Stenungsund (Sweden) Quick-Clay Landslide of 2023: Anthropogenic Influence and Infrastructure Consequences, EGU General Assembly 2026, Vienna, Austria, 3–8 May 2026, EGU26-4567, https://doi.org/10.5194/egusphere-egu26-4567, 2026.

EGU26-6610 | Orals | GM3.5

Coupled Hydro-Geomechanical modelling of dike breaching 

Nathan Delpierre, Sandra Soares-Frazão, and Hadrien Rattez

Dike breaching following overtopping event is considered as one of the most common failure mechanisms.  Understanding this process is critical, as breaches typically result in catastrophic flooding. While overtopping failures have been studied both experimentally and numerically, the coupled physical mechanisms remain complex. Erosion associated with high-velocity water flowing downstream has often been considered as the main leading cause of failure. Yet, suction pressure and water content fluctuations provide additional strength to the dike material. The effects of suction on the geomechanical strength of the dike material have often been disregarded.  

In this work, we propose a proof-of-concept of a numerical model that encompasses what we consider as the main physical processes occurring during dike overtopping. First, we solve, in a traditional hydraulics approach, the Shallow-Water-Exner equations system to evaluate the water flow and the erosion potential. Second, we solve the Richards equation, for groundwater flow evaluation. This provides the information on the suction pressure evolution in the dike, spatially and in time, subject to overtopping.  Third, we propose a geomechanical approach that accounts for suction pressure effects on the mechanical strength of the soil. Large displacements of the geomaterial are computed by means of the Particle Finite Element Method (PFEM). It is a Lagrangian based method, that relies on a very efficient remeshing algorithm to simulate large displacements.  

The resulting model is a proof-of-concept for advanced dike failure simulation. We compare the outcome of the model in a dike failure theoretical case with a purely hydraulic based model and with a sediment transport-based model. The analysis focuses on the differences between these models, as reflected in the output hydrographs. The aim is to underline the need for tightened coupling between hydrodynamic, sediment transport and geomechanical processes to accurately simulate dike breaching events and improve hydrograph prediction.

How to cite: Delpierre, N., Soares-Frazão, S., and Rattez, H.: Coupled Hydro-Geomechanical modelling of dike breaching, EGU General Assembly 2026, Vienna, Austria, 3–8 May 2026, EGU26-6610, https://doi.org/10.5194/egusphere-egu26-6610, 2026.

Geomorphic transitions—such as the interface between rivers and floodplains—are critical zones controlling water, sediment, and nutrient transport. River–floodplain connectivity often occurs through secondary channels that convey fluxes into the floodplain. In other cases, connectivity is created or amplified by human interventions. But is higher connectivity in a landscape always beneficial?

In this talk, we examine the role of connectivity—both structural and functional—in shaping flood wave attenuation and long-term land change. We draw on two contrasting landscapes. First, in the Trinity River (Texas), rivers and floodplains are connected via floodplain channels. Using an idealized model, we show that attenuation transitions from connectivity-limited to storage-limited as discharge increases. Secondary channel conveyance promotes early floodplain inundation and attenuation at lower flows, but at higher flows it can fill storage rapidly and even increase downstream flood peaks. Greater conveyance and wider floodplains increase fluxes to the floodplain, yet conveyance shortens residence times while wider floodplains prolong them.

Second, we examine coastal Louisiana: the sediment-rich Wax Lake Delta, which is gaining land, and the sediment-starved Terrebonne Bay, which is losing land. Here, connectivity plays opposite roles—enhancing resilience and land growth in one system while accelerating degradation in the other.

This work shows that connectivity is not universally “good”: it can attenuate floods and build land under some conditions, but under others it transfers risk or drives loss. Understanding these dynamics is critical for designing floodplain reconnection and managing landscapes under climate change.

How to cite: Passalacqua, P., Tull, N., and Wright, K.: When connectivity helps and when it hurts: How natural vs. human-induced connectivity affect flood wave attenuation and land change, EGU General Assembly 2026, Vienna, Austria, 3–8 May 2026, EGU26-7550, https://doi.org/10.5194/egusphere-egu26-7550, 2026.

The LAREDAR project addresses transnational flood risk mitigation in the Danube River Basin by focusing on the roles of lakes and reservoirs and by developing tools and guidance to support coordinated management across countries. Led by the Middle Tisza District Water Directorate, LAREDAR operates under the Danube Region Programme priority on climate adaptation and disaster management and is planned for a 30-month implementation period. Its core intent is to strengthen basin-wide cooperation through an integrated platform built on a joint GIS database and improved understanding of transnational flood effects, enabling sustainable and coordinated action during flood events across borders.

The Austrian–Slovenian Mura River is one of three multinational pilot areas selected to characterize the role of lakes and reservoirs in flood mitigation. The Austrian reach is hydrologically modified by hydropower generation, comprising a series of run-of-river power plants with impounded reaches and narrow embankments raised above the adjacent floodplain. During large floods, overtopping of these embankments enables natural floodplain inundation and creates secondary flowing retention that bypasses the power plants. Yet it remains rather unclear how flow regulation and floodplain flow interact.

Previous studies (Volpi et al., 2018; Cipollini et al., 2022; Stecher and Herrnegger, 2022) show that run-of-river power plants typically exert only minor influence on downstream flood peaks. Within the Austrian reach of the Mura Pilot area the focus is on the interdependencies between main channel and floodplain flows in a hydrologically altered river landscape. The lateral exchange between river and floodplain—its controls, dynamics, and consequences for total flood retention at reach to basin scales—remains insufficiently quantified, potentially limiting effective transnational flood management. We adapt the Floodplain Evaluation Matrix - FEM (Habersack and Schober, 2020) to explicitly account for run-of-river power plants and regulated flow regimes to assess the performance of floodplain-impoundment interrelations.

This work aims to (i) quantify retention effects across multiple spatial and temporal scales, (ii) evaluate the effectiveness of past flood mitigation measures, (iii) provide evidence on when and where floodplain connectivity provides meaningful peak reduction, and (iv) clarify upstream–downstream interactions in a transnational setting. The resulting evidence base will extend current knowledge and support river managers in optimizing flood risk mitigation and targeted prevention measures. It will also foster robust transnational cooperation and data exchange for improved flood risk management.

First findings already underline the important retention effect of existing floodplains, but also indicate the potential of optimizing floodplain connectivity, making better use of impounded river reaches for improved flood management. More detailed, quantified results are expected in 2026.

How to cite: Preiml, M. and Bertinotti, J.: Improved transboundary flood risk management through better understanding of floodplain connectivity in an impounded, flow regulated river reach. , EGU General Assembly 2026, Vienna, Austria, 3–8 May 2026, EGU26-7999, https://doi.org/10.5194/egusphere-egu26-7999, 2026.

Estimation of flood response in ungauged catchments remains a critical challenge in hydrology, particularly in regions with heterogeneous physiography and limited observational data. In India, the Central Water Commission (CWC) provides regional empirical equations for deriving unit hydrographs within predefined, contiguous hydrological zones. Although widely applied, this zonal framework does not explicitly account for variations in internal catchment structure and drainage network organization. The present study proposes an alternative approach for flood response estimation based on catchment topological characteristics, with application to South Indian catchments located within CWC zones 3d, 3e, 3f, 3g, 3h, and 3i. Initially, unit hydrographs were computed using the CWC regional relationships and subsequently converted into instantaneous unit hydrographs (IUHs). Given the contiguous nature of the selected CWC zones, a topology-based classification of catchments was then introduced to better represent hydrological response mechanisms. Catchments are grouped according to their drainage network configuration, and empirical width functions were derived for each group. Since the width function describes the spatial distribution of contributing areas with respect to flow travel distance, it provides a physically meaningful representation of the instantaneous unit hydrograph of a catchment. A comparative analysis was conducted between IUHs derived from CWC-based unit hydrographs and those obtained directly from width functions. The results show good agreement between the two approaches in terms of hydrograph shape, peak timing, and overall response dynamics, indicating that catchment topology exerts a dominant control on flood response. Based on these findings, new regional relationships were developed using topological classification rather than contiguous geographic zoning. The proposed framework offers a physically based and alternative approach to existing CWC methodologies for estimating ungauged instantaneous unit hydrograph for Indian catchments. By emphasizing drainage network structure over zonal continuity, the approach enhances applicability across catchments with similar topological characteristics and provides a robust tool for regional flood estimation and hydrological modeling in data-scarce regions.

Keywords: Instantaneous Unit Hydrograph, Catchment Topology, Width Function, Regionalization, Ungauged Catchments.

How to cite: Rana, S. and Chavan, S. R.: Proposing an alternative approach based on channel network topology to determine Instantaneous unit hydrographs for ungauged Indian catchments , EGU General Assembly 2026, Vienna, Austria, 3–8 May 2026, EGU26-8793, https://doi.org/10.5194/egusphere-egu26-8793, 2026.

EGU26-11066 | ECS | Posters on site | GM3.5

Geomorphic Diversity Loss Following Post-Flood Interventions 

Martin Lehký and Jakub Langhammer

Extreme flood events naturally act as drivers of geomorphic heterogeneity, creating complex channel-floodplain systems characterized by diverse bedforms, bank erosion features, and sediment splays. However, the subsequent phase of flood recovery often involves rapid and extensive anthropogenic interventions that counteract these natural processes. This study evaluates the loss of geomorphological diversity in montane streams of the Opava River Basin (Czechia) by analyzing the conflict between natural recovery and technical river management.

The research methodology employs a multi-temporal approach combining field investigation and remote sensing. While systematic geomorphological field mapping was conducted at two key stages—immediately following the 2024 flood to record the "pristine" impact and one year later to assess the final state—UAV photogrammetric campaigns were executed repeatedly throughout the post-flood year. This high-frequency monitoring provided multiple temporal windows, allowing us to track the precise sequence of changes and distinguish between gradual natural adjustments and abrupt anthropogenic modifications.

The analysis of this time-series data reveals a significant trajectory of channel simplification:

  • Erasure of Complexity: The repeated UAV models document how initial flood-created features (cut banks, gravel bars) were systematically removed by engineering works. In reaches subjected to heavy machinery, geomorphic diversity was reduced by up to 100%.
  • Dynamics of Intervention: The multiple time windows highlighted that the most severe loss of diversity often occurred weeks or months after the flood event itself, during the "recovery" phase. Moreover, this loss of diversity was significantly stronger in proximity to habited areas compared to natural river reaches.
  • Impact of Intensity: We identified a direct correlation between the intensity of technical adjustments and the degree of channel homogenization. While "soft" interventions allowed for the partial preservation of flood-induced forms, heavy engineering works resulted in the complete artificial straightening of the thalweg.

The study demonstrates that high-resolution UAV monitoring is essential for capturing the transient states of river recovery. The findings suggest that current post-flood protocols often prioritize rapid hydraulic streamlining at the expense of ecological integrity, effectively "resetting" the river's geomorphic value to a pre-flood, or even simpler, state.


How to cite: Lehký, M. and Langhammer, J.: Geomorphic Diversity Loss Following Post-Flood Interventions, EGU General Assembly 2026, Vienna, Austria, 3–8 May 2026, EGU26-11066, https://doi.org/10.5194/egusphere-egu26-11066, 2026.

EGU26-13400 | ECS | Posters on site | GM3.5

Assessing Temporal Consistency and the Effect of Predisposing Factors in Landslide Susceptibility Models in the Ribeira Quente Valley (São Miguel Island, Azores) 

Maria João Silva, Rui Marques, Rui Fagundes Silva, César Andrade, and Paulo Amaral

Situated in the North Atlantic Ocean, the Azores is an archipelago of nine volcanic islands, where numerous destructive landslide events have occurred over the past five centuries, triggered by several factors, namely seismic activity, volcanic eruptions, and episodes of intense rainfall. Within this context, this study focuses on the Ribeira Quente valley, located in Povoação Municipality (S. Miguel Island), covering an area of 9,15 km². The valley is highly prone to landslides, which often damage the only road to Ribeira Quente village, leaving it isolated. A major event occurred on October 31st,1997, when an episode of very intense rainfall triggered nearly 1,000 shallow landslides, primarily translational slides and debris flows. This event resulted in 29 fatalities, the destruction of 36 houses, and left 114 people homeless, while the village became isolated for over 12 hours.

Three historical landslide inventories were developed for this study. The first inventory, based on a 2004 ortophotomap with a resolution of 40 centimeters and a scale of 1:15,000, included approximately 400 landslides. The second inventory, from 2010, was developed using Google Street View, and contained around 250 landslides. Finally, the third inventory, conducted through fieldwork in 2025, identified approximately 260 landslides. In total, the three inventories include around 910 landslides.

Landslide susceptibility analysis provides the essential basis for hazard mapping, a crucial component for quantitative risk assessment. The main objectives of this study are: (i) to investigate whether there is temporal variability in the spatial distribution of landslide susceptibility results; and (ii) to determine the optimal combination of predisposing factors for inclusion in the landslide susceptibility model, maximizing its predictive performance.

Susceptibility modelling was performed using 11 predisposing factors, which were processed as raster datasets with a 5 m × 5 m resolution, alongside historical landslide inventories. To evaluate the influence of each predisposing factor on landslide distribution, factors were hierarchically ranked by their ability to distinguish between terrain units with and without landslides.

The modeling process employed the Information Value method, a bivariate probabilistic approach derived from Bayesian theory. A total of 2,047 susceptibility models were tested for each landslide inventory, and the best model was selected based on its goodness of fit, determined by computing the Success Rate Curves (SRC) and the Area Under the Curve (AUC). The predictive capacity of the best models was then assessed by computing the Prediction Rate Curves and the corresponding AUC.

This study provides essential tools for land-use planning and civil protection. Landslide susceptibility maps can also support the implementation of site-specific risk mitigation measures and prioritize detailed geotechnical investigations. This research is financially supported by the INTERREG program through the PRISMAC project – “Análise, Mitigação e Gestão do Risco de Movimentos de Vertente Potenciados pelas Alterações Climáticas na Macaronésia” (Ref. 1/MAC/2/2.4/0112).

How to cite: Silva, M. J., Marques, R., Silva, R. F., Andrade, C., and Amaral, P.: Assessing Temporal Consistency and the Effect of Predisposing Factors in Landslide Susceptibility Models in the Ribeira Quente Valley (São Miguel Island, Azores), EGU General Assembly 2026, Vienna, Austria, 3–8 May 2026, EGU26-13400, https://doi.org/10.5194/egusphere-egu26-13400, 2026.

EGU26-13811 | ECS | Orals | GM3.5

 Predicting land subsidence and cascading flood hazards on deltas in the twenty-first century  

Austin J. Chadwick, Michael S. Steckler, Carol A. Wilson, Steven L. Goodbred, Suzana J. Camargo, Farzana Rahman, Md. Masud Rana, Sharmin Akter, Anwar Hossain Bhuiyan, Stacy Larochelle, Md. Jakir Hossain, Sheak Sazzad Mahmud, Ashraful A. Tanvir, Zohur Ahmed, and Afroza Mim

Densely populated coastal deltas worldwide face cascading flood hazards associated with sea-level rise, storm surges, dwindling sediment supplies, and land subsidence. One of the greatest hurdles to hazard prediction stems from this last component—land subsidence—which can vary drastically in space and time for a given delta. Here we constrain subsidence variations on the Ganges Brahmaputra Delta, using a state-of-the-art 1D compaction model based upon fundamental principles of porous-media mechanics and groundwater flow; as well as constitutive relations for porosity and edaphic factors (e.g., plant roots, animal burrows). The model accurately reproduces field observations (GNSS, RSET-MH, optical-fiber compaction meters, auger cores), showing compaction-induced subsidence rates of 1–30 mm/y depending upon local thickness and lithology of underlying Holocene deposits, forest tree density, and sedimentation rate. Sedimentation drives a dynamic compaction response over timescales of 10–100 years, such that floodplains cut off from sediment after embankment construction in the 1960s have undergone significant elevation loss, but are now experiencing a gradual subsidence slowdown. Some of the fastest subsidence rates can be attributed to buried Pleistocene paleovalleys infilled with thick Holocene sediments, portending a legacy of ancient sea-level changes on future flood hazards. Updated coastal flooding estimates informed by our model indicate that compaction-induced subsidence will be responsible for up to 50% of twenty-first-century relative-sea-level rise, and exert a first-order control on flooding hotspots. This predictive subsidence model can improve assessments of coastal flood risk on the Ganges-Brahmaputra and other deltas worldwide; and help inform ongoing billion-dollar restoration efforts facing crucial decisions as to where and when coastal barriers, sediment diversions, and settlement relocations should be implemented in the coming century.

How to cite: Chadwick, A. J., Steckler, M. S., Wilson, C. A., Goodbred, S. L., Camargo, S. J., Rahman, F., Rana, Md. M., Akter, S., Bhuiyan, A. H., Larochelle, S., Hossain, Md. J., Mahmud, S. S., Tanvir, A. A., Ahmed, Z., and Mim, A.:  Predicting land subsidence and cascading flood hazards on deltas in the twenty-first century , EGU General Assembly 2026, Vienna, Austria, 3–8 May 2026, EGU26-13811, https://doi.org/10.5194/egusphere-egu26-13811, 2026.

EGU26-14135 | Orals | GM3.5

The Northern Vietnam landslide events mapped with Change Vector Analysis 

Janusz Godziek, Łukasz Pawlik, and Tran Trung Hieu

Multiple landslides triggered by heavy rain, associated with debris flows and flash floods are major geohazard in the mountainous areas of Northern Vietnam, resulting in lost of life and property. Mapping landslides immediately after their occurrence remains crucial for providing a better understanding of their causes , the course of their formation, and the influence they exert on both nature and human.

We analyzed the effects of several landslide events that occurred between 2020 and 2024 in Northern Vietnam. We aimed to develop a fully automated geospatially integrated software workflow for rapid and accurate mapping of landslide and debris flows in the subtropical zone. The method we applied was Change Vector Analysis (CVA), which is based on detecting changes betweeen two images (pre- and post-event) by emploing two metrics: magnitude, referring to the amount of change between pixels, and direction, describing the type of change. As input data, we used the Sentinel 2A optical imagery with a spatial resolution of 10 m. For each landslide event we analyzed a separate area, where its geomorphic effects were the most robust. As the exact dates of landslide events varied for each study area, we downloaded pre- and post-event image pairs for each area with different acquisition dates and low cloudiness (below 10%). Due to the mountainous terrain and the potentially disruptive influence of atmospheric correction, we decided to use L1C data. For validation, we used the landslide vectorization polygons. For each study area, we generated random points labeled as “landslide” or “no landslide” based on the landslide polygons. Then, we performed CVA parameter tuning for each area and selected the CVA variant most effective at landslide delineation. We integrated the entire workflow into R script. The results indicate that simple data analysis methods such as CVA can be efficient for landslide mapping. Despite the cloudiness limitation, optical Sentinel-2 data can be applied in the subtropical zone to map the landslides and debris flows.

The study has been supported by the Polish National Science Centre (project no 2023/49/B/ST10/02879).

How to cite: Godziek, J., Pawlik, Ł., and Hieu, T. T.: The Northern Vietnam landslide events mapped with Change Vector Analysis, EGU General Assembly 2026, Vienna, Austria, 3–8 May 2026, EGU26-14135, https://doi.org/10.5194/egusphere-egu26-14135, 2026.

Landscape evolution principles provide a conceptual framework for understanding how relief develops through long-term interaction of tectonics, climate, and surface processes. In tectonically active mountain regions, these interactions strongly influence the spatial distribution and recurrence of hydrogeomorphological hazards affecting human settlements (Winckell et al., 1997).

The objective of this research is to evaluate the role of landscape evolution as a control factor in flood and landslide hazards within the central Paute River basin, with particular attention to tectonic structures, hydrogeomorphological adjustments, hillslope dynamics, and their interactions with anthropogenic environments. The analysis combines multiple source and scale datasets, including a detailed mass-movement inventory derived from historical images and official cartography from the Geographical Institute of Ecuador (SIGTIERRAS, 2014) and the National Secretariat for Risk Management (SNGRE, 2024). These data were complemented with high-resolution unmanned aerial vehicle (UAV) surveys conducted annually in identified active sectors, which enable documentation of recent reactivations and relevant geomorphic changes.

Results show that floods and landslide hazards are strongly conditioned by long-term landscape evolution. The valley orientations controlled by structures and the inherited sedimentary environments condition the floodplain development and recurrent overbank flooding along the Burgay, Déleg, and Paute Rivers; particularly in the cities of Biblián, Azogues, Déleg, and Paute, provide a clear example of how un-equilibrated base-level conditions influence the hazard (Torres et al., 2022; Torres Ramírez, 2022). Landslide activity is mainly concentrated on slopes shaped by lithological contrasts, tectonic discontinuities, and the presence of previous landslides (Torres-Ramírez & Marco-Molina, 2025), as demonstrated by large-scale events such as La Josefina in 1993 (Plaza & Egüez, 1993), with rainfall acting as a trigger mechanism rather than a primary cause.

These findings reveal that floods and landslides in the central Paute River basin are direct expressions of an evolving landscape in which human settlements are located. Identifying geomorphic controls on hazardous processes provides a better understanding of risk patterns and supports more informed landscape approaches to land-use planning and hazard management in intermontane Andean regions.

Keywords: Landscape evolution, Hydrogeomorphology, Landslides, Floods, Paute river basin, Ecuador

References:

Plaza, G., & Egüez, A. (1993). Consideraciones Geológicas-Geotécnicas sobre el Deslizamiento de La Josefina. Coloquio científico El deslizamiento de La Josefina.

SIGTIERRAS. (2014). Mosaicos de ortofotos a nivel nacional. Sistema Nacional de Información de Tierras Rurales e Infraestructura Tecnológica. Quito, Ecuador. https://bit.ly/2twJiRn

SNGRE. (2024). Database Eventos Registrados. Secretaría Nacional de Gestión de Riesgos y Emergencias, Ecuador. Periodo 2010 a 2024.

Torres, R., Sánchez, E., & Marco, J. (2022). Análisis de la dinámica fluvial del río Burgay al norte de la ciudad de Azogues (Ecuador) y su influencia en el medio urbano mediante técnicas fotogramétricas y TWITTER API. XVII Coloquio Ibérico de Geografía, 332–343.

Torres Ramírez, R. (2022). Estimación morfométrica de la erosión lateral del río Burgay producida por las precipitaciones del 20 de abril de 2022. http://rua.ua.es/dspace/handle/10045/123388

Torres-Ramírez, R., & Marco-Molina, J. (2025). Inventario de movimientos en masa en la zona centro de la cuenca del Río Paute. Avances de La Geomorfología Española En 2023 - 2025.

Winckell, A., Zebrowski, C., & Sourdat, M. (1997). Las regiones y paisajes del Ecuador (Segunda Ed.). CEDIG.

How to cite: Torres-Ramírez, R. and Marco-Molina, J. A.: Landscape evolution as a key driver of flood and landslide hazards: tectonic and hydrogeomorphological evidence from the central Paute River basin, Ecuador, EGU General Assembly 2026, Vienna, Austria, 3–8 May 2026, EGU26-14983, https://doi.org/10.5194/egusphere-egu26-14983, 2026.

EGU26-17324 | ECS | Posters on site | GM3.5

Machine learning and rainfall threshold-based assessment of landslide hazards in Vietnam 

Tran Trung Hieu, Łukasz Pawlik, Pham Van Tien, and Nguyen Cong Quan

For an effective landslide hazard assessment, it is essential to accurately predict the occurrence, timing, and magnitude of landslides. This work presents a detailed analysis of landslide spatiotemporal probability and size distribution for a case study Vietnam. Spatial probability was modeled using Extreme Gradient Boosting (XGB), Random Forest (RF), and Logistic Regression (LR) with 12 predictor variables and a landslide inventory recorded from 2017 to 2024. Temporal probability was estimated using daily rainfall data, applying an event rainfall–duration threshold in combination with a Poisson model. Landslide size probabilities were derived from a probability density function (PDF). Finally, a set of hazard maps was produced for three different time periods and three landslide size classes.

The study has been supported by the Polish National Science Centre (project no 2023/49/B/ST10/02879).

How to cite: Trung Hieu, T., Pawlik, Ł., Van Tien, P., and Cong Quan, N.: Machine learning and rainfall threshold-based assessment of landslide hazards in Vietnam, EGU General Assembly 2026, Vienna, Austria, 3–8 May 2026, EGU26-17324, https://doi.org/10.5194/egusphere-egu26-17324, 2026.

EGU26-17413 | ECS | Orals | GM3.5

Unstable Slopes and Shifting Landscapes: Slow-moving landslides in the East African Rift 

Antoine Dille, Matthias Vanmaercke, Toussaint Mugaruka Bibentyo, Floriane Provost, Benoît Smets, and Olivier Dewitte

Human activities are transforming tropical mountain landscapes at unprecedented rates through deforestation, agricultural expansion, and urbanization. These changes amplify the frequency and magnitude of geo-hydrological hazards such as landslides. While shallow, rapid landslides are well documented, the controls on the activity and dynamics of large, slow-moving landslides (SML) remain much less understood, despite their persistent impacts on communities and sediment dynamics.

This study demonstrates how the combined use of radar and optical Earth observation data enables the detection, mapping, and monitoring of deep-seated landslides across vast and remote tropical regions such as the Albertine Rift. By mapping and comparing more than 120 active and 3,000 historical landslides distributed along the ~1,500 km Rift branch, we reveal how climatic, lithological, tectonic, and anthropogenic factors jointly control their occurrence.

We further analyse multi-year landslide dynamics across contrasting environments, supported by unique ground-based validation datasets built on years of fieldwork in the region, and provide detailed insights into failure mechanisms of recent catastrophic landslides in the area. Altogether, this work delivers a unique regional-scale assessment of SML activity in tropical environments and highlights how landscape and human-driven land use changes can modulate their behaviour. It offers new perspectives on how environmental transformations shape landscape evolution, geo-hydrological hazards and sediment transfer in rapidly changing mountain regions.

How to cite: Dille, A., Vanmaercke, M., Mugaruka Bibentyo, T., Provost, F., Smets, B., and Dewitte, O.: Unstable Slopes and Shifting Landscapes: Slow-moving landslides in the East African Rift, EGU General Assembly 2026, Vienna, Austria, 3–8 May 2026, EGU26-17413, https://doi.org/10.5194/egusphere-egu26-17413, 2026.

EGU26-18461 | Orals | GM3.5

Large wood recruitment during the extreme 2021 Ahr flood (Germany) 

Rainer Bell, Adrian Zmelty, Michael Dietze, Sergiy Vorogushyn, Heiko Apel, and Anna Schoch-Baumann

The Ahr flood of 2021 had severe consequences, including 135 fatalities, extensive damage to infrastructure and buildings, and significant geomorphologic change. Clogging of bridges exacerbated water levels, leading to outburst flooding on top of high water levels when the bridges failed. The clogging of bridges was mostly due to large woody debris. Thus, the question arose as to where and when the large wood (LW) was sourced. This study aims to analyse and quantify the recruitment of LW during this extreme event in a lower mountain range with a return period of more than 500 years.

LW with a crown diameter greater than 2 m was mapped across the floodplain of the Ahr river using aerial images and orthophotos from 2019, 2021, 2022, 2023 and 2025. This approach enabled us to determine how much LW was uprooted, washed away or merely tilted by the flood. Furthermore, it provided data on how much LW was cut by humans after the flood (Zmelty and Büchs, 2025). Information on LW properties, including tree height, was obtained from 1 m LiDAR data (2019, 2021 and 2022). Canopy height models (CHM) of the valley floor and resulting CHM of Difference (CoD) data sets were calculated for all time slices. The causes of LW recruitment were analysed using the water levels and flow velocity of the 2021 flood (Vorogushyn et al., 2025).

Manual mapping revealed that 12,499 woody structures were uprooted, 4,424 were tilted and 2,763 were cut by humans after the event. Preliminary analysis of LiDAR data shows that the location of the removed LW fits relatively well with the manual mapping, considering the distortion between the different aerial images and orthophotos. The LiDAR results show that 5,397 trees were between 5 and 10 metres high and 3,556 trees were higher than 10 metres. Preliminary analyses indicate a correlation between LW recruitment and modelled water levels and flow velocities. However, the LW data needs to be cleared of trees cut by humans and differentiation between uprooted and tilted trees is necessary. In any case, the results demonstrate the extreme uprooting of trees by the 2021 flood in the lower mountain range. The missing trees have seriously altered the ecological condition of the floodplain, left the river and riverbanks unprotected, leading to increased bank erosion and river warming during the summer.


Vorogushyn, Sergiy; Han, Li; Apel, Heiko; Nguyen, Viet Dung; Guse, Björn; Guan, Xiaoxiang; et al. (2025): It could have been much worse: spatial counterfactuals of the July 2021 flood in the Ahr Valley, Germany. Natural Hazards and Earth System Sciences. 10.5194/nhess-25-2007-2025

Zmelty, A. & Büchs, W. (2025): The ecological potential of a flood disaster - opportunities and failures after the heavy rainfall event in the Ahr Valley in 2021. - Das ökologische Potential einer Flutkatastrophe - Chancen und Versäumnisse nach dem Starkregenereignis im Ahrtal 2021. Decheniana (Bonn) 178: 185–214.

How to cite: Bell, R., Zmelty, A., Dietze, M., Vorogushyn, S., Apel, H., and Schoch-Baumann, A.: Large wood recruitment during the extreme 2021 Ahr flood (Germany), EGU General Assembly 2026, Vienna, Austria, 3–8 May 2026, EGU26-18461, https://doi.org/10.5194/egusphere-egu26-18461, 2026.

EGU26-19736 | Posters on site | GM3.5

Landslide Magnitude Exceedance Probability Modelling for Ribeira Quente Valley (São Miguel Island, Azores-Portugal) 

Rui Marques, Maria João Silva, and Rui Fagundes Silva

Landslide size is a strong predictor of runout distance across a wide range of landslide types and therefore represents a key parameter for hazard assessment. Within the conceptual risk framework, landslide hazard analysis requires estimating the probability of exceedance of landslide magnitude, in a manner analogous to approaches commonly applied to other natural hazards, such as earthquakes. Integrating magnitude–probability relationships into landslide hazard assessments enhances the robustness of potential impact characterization and supports informed risk-based decision-making.

Situated in the North Atlantic, the Azores archipelago comprises nine volcanic islands where numerous destructive landslide events have occurred over the past five centuries, triggered by seismic activity, volcanic eruptions, and intense rainfall. Within this context, this study focuses on the Ribeira Quente valley (Povoação Municipality, São Miguel Island), covering 9.15 km². The study area exhibits high susceptibility to landslide occurrence, characterized by very friable volcanic deposits and extremely steep slopes. Landslides frequently affect the only access road to Ribeira Quente village, leaving it isolated. Since 1900, 31 landslides events have affected Ribeira Quente parish, causing 32 fatalities. A major event on 31 October 1997 triggered nearly 1,000 shallow landslides, resulting in 29 fatalities, the destruction of 36 houses, and 114 people left homeless, while the village remained isolated for over 12 hours.

Three historical landslide inventories were compiled. The first inventory, based on 2004 data, included ~400 landslides. The second, from 2010, contained ~250 landslides. The third, compiled in 2025, identified ~260 landslides. Overall, the inventories include approximately910 landslides, mainly superficial translational slides and debris flows.

The main objective of this study is to propose and parameterize probability distributions specifically tailored to the study area. The landslide scar areas were used as the magnitude descriptor. A total of 65 theoretical probability distributions were fitted to the scar area data. Parameterization was performed using the maximum likelihood method, and goodness of fit was evaluated with the Kolmogorov–Smirnov (K-S) test. The best-fitting probability density function (PDF) was then selected, and exceedance probabilities for different magnitude scenarios were computed based on its complementary cumulative distribution function (1 − CDF).

This study provides a probabilistic approach for assessing landslide magnitudes, presenting valuable insights for land-use planning and civil protection. The derived magnitude–exceedance functions enhance hazard characterization and can guide the prioritization of risk mitigation actions and targeted geotechnical investigations. This research was supported by the INTERREG program through the PRISMAC project – “Análise, Mitigação e Gestão do Risco de Movimentos de Vertente Potenciados pelas Alterações Climáticas na Macaronésia” (Ref. 1/MAC/2/2.4/0112).

How to cite: Marques, R., Silva, M. J., and Silva, R. F.: Landslide Magnitude Exceedance Probability Modelling for Ribeira Quente Valley (São Miguel Island, Azores-Portugal), EGU General Assembly 2026, Vienna, Austria, 3–8 May 2026, EGU26-19736, https://doi.org/10.5194/egusphere-egu26-19736, 2026.

Active geomorphological processes such as landslides, surface deformation, fluvial erosion, and structural reactivation pose serious geohazards in tectonically and climatically dynamic regions. Accurate identification and monitoring of these processes require high‐resolution surface information capable of capturing spatial variability and short‐term geomorphic changes. In this study, high‐resolution unmanned aerial vehicle (UAV) based optical imagery is used to investigate active geomorphological processes, structural controls, and geohazard distribution in a seismically active region of the northeastern Himalaya of India.

The study is conducted in the Kopili Fault Zone (KFZ), in the Northeast of India. It is a major active tectonic corridor located at the junction of the Himalayan and Indo-Burman plate boundary systems. The region is characterised by steep slopes, intense monsoonal rainfall, dense vegetation, frequent moderate earthquakes, and widespread slope instability. These combined tectonic and climatic conditions result in recurring landslides, rapid landscape modification, and complex interactions between tectonic structures and surface processes.

UAV-derived optical images are processed using photogrammetric techniques to generate high‐resolution orthomosaics and digital surface models. These datasets are used for detailed landslide inventory mapping, identification of scarps, crown cracks, debris accumulation zones, and assessment of landslide geometry and spatial distribution. Structural mapping of lineaments, fault traces, and fracture patterns is carried out through visual interpretation and GIS-based analysis of UAV imagery, enabling evaluation of tectonic controls on slope instability and drainage development.

The results include the generation of a high-resolution landslide inventory, improved delineation of structurally controlled instability zones, and enhanced identification of active deformation and erosion hotspots. The study is expected to demonstrate clear spatial relationships between landslide occurrence, active fault segments, and geomorphic anomalies. Overall, this research highlights the effectiveness of UAV-based optical remote sensing for resolving fine-scale geomorphological processes and improving geohazard characterisation, thereby supporting hazard mitigation, land-use planning, and risk reduction strategies around the Kopili Fault Zone and similar tectonically active regions.

How to cite: Sahu, D. K. and Manocha, A. R.: Investigation of Active Geomorphological Processes and Landslide Mapping Using Advanced UAV Data around the Kopili Fault Zone, in the Northeast Himalayan region of India, EGU General Assembly 2026, Vienna, Austria, 3–8 May 2026, EGU26-21553, https://doi.org/10.5194/egusphere-egu26-21553, 2026.

EGU26-572 | ECS | PICO | GM6.2

Paleoenvironmental history preserved in shoreline dunes of the Wimmera lake overflow system, Wotjobaluk Country, south-eastern Australia 

Victoria Schwarz, Tobias Lauer, Andrew Gunn, Sumiko Tsukamoto, Barengi Gadjin Land Council Aboriginal Corporation, and Kathryn E. Fitzsimmons

Australia’s dryland margins are increasingly vulnerable to drought, flood and fire. Investigating past landscape and climate conditions using evidence preserved within landforms and their sediments provides important context for past, present and future climate-coupled water availability and landscape change. Such work is challenging in the Australian context, however, due to the sparse preservation of paleoenvironmental records and high spatial heterogeneity. Our study focuses on the Wimmera catchment, located on the dryland margins of south-eastern Australia, which is an understudied region of high agricultural, ecological and cultural importance. The landscapes of the Wimmera comprise a unique overflow-lake system with well-preserved shoreline dunes. Shoreline dunes form valuable archives of past hydrologic lake conditions in this semi-arid region; deflation of the lake floor, and transport of these sediments onto the dunes, records preservation of the adjacent lake’s condition within the sediments. We combine optically stimulated luminescence (OSL) dating of single grain quartz to derive depositional ages, and a larger chronological dataset using portable OSL measurements, with facies characterisation from field observations and grainsize measurements, to provide first insights into the rich history preserved within these lake shoreline dunes. 

How to cite: Schwarz, V., Lauer, T., Gunn, A., Tsukamoto, S., Aboriginal Corporation, B. G. L. C., and Fitzsimmons, K. E.: Paleoenvironmental history preserved in shoreline dunes of the Wimmera lake overflow system, Wotjobaluk Country, south-eastern Australia, EGU General Assembly 2026, Vienna, Austria, 3–8 May 2026, EGU26-572, https://doi.org/10.5194/egusphere-egu26-572, 2026.

Despite the modern hyperaridity of the Atacama Desert (mean annual rainfall <1 mm), evidence for wetter climates during the Holocene have been found in cores from salars (i.e., salt flats) and sedimentary basins. There are several major discrepancies in the Holocene climate of the Atacama Desert after the Last Glacial Maximum, including asynchronous wet phases in the Coastal Cordillera and the Altiplano as well as a discordance between paleo-wetland and Salar de Atacama chronology. We address the following research question: How did fluvial and mass flow activity in the Atacama Desert respond to regionally fluctuating hyperaridity throughout the Quaternary period?  A series of large alluvial fans sourcing from the western Andean foothills that terminate at these salars remain largely underutilized as a paleoclimate record, though alluvial fan stratigraphy is often used to reconstruct past environmental conditions. These alluvial fans, which may serve as a bridge between competing paleoclimate signals, have modern transport and depositional processes that include layered, overbank mudflows that extend laterally for up to hundreds of meters from the channel, aeolian reworking of inactive fan surfaces, and terminations in playa-like environments. To determine how fan activity is tied to Quaternary climate change, we made detailed stratigraphic correlations of 6 sedimentary facies across 18 study sites along the fan sourcing from Quedabra de Chacarilla. We then used single-grain post-infrared infrared stimulated luminescence (post-IR IRSL) to precisely date 11 samples taken from interpreted aeolian-deposited facies within the stratigraphy. Detailed chronology of the fan stratigraphy using post-IR IRSL will allow us to compare with other regional climate proxies and understand how Atacama alluvial fans record and preserve evidence of past climate evolution. This will advance our understanding for how future climatic changes in the region may impact people and infrastructure due to mudflow-based flooding.

How to cite: Rogers, E., Palucis, M., and Morgan, A.: Constraining the paleoclimate of the Northern Atacama Desert, Chile using luminescence dating of alluvial fan stratigraphy, EGU General Assembly 2026, Vienna, Austria, 3–8 May 2026, EGU26-775, https://doi.org/10.5194/egusphere-egu26-775, 2026.

EGU26-2431 | ECS | PICO | GM6.2

Subsurface architecture of aeolian erosion features in hyper-arid alluvial systems of the Atacama Desert: Insights from ground-penetrating radar 

Pablo Schwarze, Jan Igel, Pritam Yogeshwar, Barbara Blanco Arrue, Janek Walk, and Simon Matthias May

Aeolian erosion of the alluvial deposits in the hyper-arid core of the Atacama Desert appears in several sites in the form of deflation hollows. Despite constituting signs of degradation of the unique and ancient landscape, their architecture and formation is as yet poorly understood. Ground-penetrating radar (GPR) is an effective way to image the internal structure of such aeolian landforms, and in this study, eight 200-500 m GPR profiles were acquired across deflation hollows and an eroded alluvial fan. A 400 MHz antenna was used, penetrating more than 3 m deep. Evaporitic crusts and salt-cemented layers were identified and mapped. In the leeward side of hollows, younger aeolian deposits can be differentiated from the older alluvial sediments, and similarities were found in the radar facies of several eroded surfaces. This work reveals the shallow subsurface architecture of the aeolian cover and alluvial deposits and provides new insights into the landscape formation in hyper-arid environments through the use of GPR.

How to cite: Schwarze, P., Igel, J., Yogeshwar, P., Blanco Arrue, B., Walk, J., and May, S. M.: Subsurface architecture of aeolian erosion features in hyper-arid alluvial systems of the Atacama Desert: Insights from ground-penetrating radar, EGU General Assembly 2026, Vienna, Austria, 3–8 May 2026, EGU26-2431, https://doi.org/10.5194/egusphere-egu26-2431, 2026.

Studies have demonstrated that >~100 absolute ages of aeolian sand at certain spatial/vertical resolutions are necessary for constructing a reliable chronological framework for palaeoenvironmental/palaeoclimatic interpretations of dunefield histories (Telfer and Hesse, 2013). As acquiring such an interpretable dataset demands significant resources, several approaches, such as portable-OSL-OSL age estimates, have attempted to partly overcome this necessity (Stone et al., 2019).

Encroaching dunes in the past and present, dam drainage systems. In arid environments this process generates proximal upstream, dune-dammed waterbodies. These waterbodies that are often seasonal, deposit distinct, low-energy, fluvial, fine-grained sediments (LFFDs), often as sedimentary couplets. When dry, the water-body deposits sustain a playa morphology. This recurring aeolian-dominated, aeolian-fluvial  process gradually leads to amplified LFFD accumulation, and partly reconfigures dunefield, and particularly dunefield margin, landscape evolution. In medium-sized basins (~10-200 km2) along the margins of the northwestern (NW) Negev desert dunefield of Israel, LFFD stratigraphic buildup gradually levels with dune-dam crest elevation, consequently leading to a dune-dam break outburst flood. The dune dam break in turn generates rapid fluvial incision of the LFFDS, reviving an open, fluvial-dominated environment in a transformed landscape (Robins et al., 2022,2023).

The INQUA DuneAtlas of global inland dunefield chronological data includes some dated samples that are non-dune sediments such as interdune and LFFD samples (Lancaster et al., 2016). However, the complementary contribution of such sediments to interpreting dunefield chronologies has not been fully assessed. Also, DuneAtlas sand samples dating to the LGM are sparse.

Here, we demonstrate for the NW Negev dunefield that OSL-dating, partly supported by port-OSL profiling, mainly of sandy units within LFFDs, improves the resolution and reliability of determining dunefield chronologies. The approach also gleans information on the morphological maintenance of existing dunes, and in some cases, reveals sand mobilization episodes that are absent in adjacent dated, dune cores.

Spatially dense, OSL-dated dune cores and sections of the ~103 km2-sized NW Negev dunefield revealed that the dunefield was constructed in two main sand incursions and vegetated linear dune (VLD) buildup/extension periods – associated with the Heinrich 1 (H1) and Younger Dryas (Roskin et al., 2011). In this study, exposed OSL-dated LFFD sections along the upstream-facing, dunefield margins revealed that dune-dammed waterbodies partly to completely erode earlier dunefield-margin dunes but also preserve remains of eroded dunes between LFFD units. This partial preservation of aeolian deposits enables the construction of a reliable archive. The LFFD sections also revealed evidence of significant and initial dune incursion and damming during the LGM, intermittently recurring until the early Holocene (Robins et. al.). Early Holocene LFFDs may imply partial dune buildup or equilibrium-like dune maintenance, and/also, a significant lag between Younger Dryas dune-damming and dune-dam breaching. Altogether, dating dunefield LFFDs is proposed to be a primary approach for jointly studying dunefield and fluvial histories.


References

Lancaster, N., et al., 2016. QI 

Robins, L., et al., 2022. QSR 

Robins, L., et al., 2023. QSR

Roskin, J., et al., 2011. QSR 

Stone, A. et al. 2019. QG 

Telfer, M.W. and Hesse, P.P., 2013. QSR 


How to cite: Roskin, J., Robins, L., and Greenbaum, N.: Dune-dammed waterbody, aeolian and fluvial sediment chronologies improve resolution of dunefield histories, EGU General Assembly 2026, Vienna, Austria, 3–8 May 2026, EGU26-3582, https://doi.org/10.5194/egusphere-egu26-3582, 2026.

Carbonate nodules are pedogenic carbonates commonly found in regions of high evapotranspiration, such as arid and semiarid areas. The stable carbon isotopes in these nodules are influenced by the type of vegetation (C3 or C4 plants), while the stable oxygen isotopes are controlled by soil water and temperature. Carbonate nodules persist in the soil, and their isotopic signatures can reflect the paleoclimatic conditions under which they formed. Carbonate nodules are distributed across the alluvial plains of southwestern Taiwan; however, the present humid conditions may not be favorable for their formation. The objective of this study was to evaluate the climatic conditions and vegetation types that influenced the formation of carbonate nodules using stable carbon and oxygen isotopes. Four pedons with different ages of soil formation were sampled in accordance with marine transgression and regression phases, corresponding to 10,000 years before present (yr BP), 8,000 yr BP, 5,000 yr BP, and 3,000 yr BP. Carbonate nodules were collected from the pedons, and their stable carbon and oxygen isotopes were analyzed using an automated carbonate preparation device. The δ13C values indicated a mixed C3/C4 vegetation, with a predominance of C4 plants (68.0 to 98%). The mean annual temperature (12.3-14.0°C), calculated using the climofunction of temperature and δ18O, was lower than the present (24.7°C). The mean annual precipitation (1036 to 1342 mm yr-1), calculated from the geochemical climofunction, was also lower than the present (1829 mm yr-1). The radiocarbon ages of the carbonate nodules ranged from 4063 yr BP to 690 yr BP, implying that climatic conditions may have been drier and cooler than present during this time frame. This may be due to a weaker East Asian Summer Monsoon, which favored calcification in the soils. These climatic conditions are consistent with the formation environment of carbonate nodules.

How to cite: Hum, H. Z., Wang, P.-L., Huang, W.-S., and Hseu, Z.-Y.: Stable carbon and oxygen isotopic composition in carbonate nodules from alluvial soils and their implications for paleoclimate in Taiwan, EGU General Assembly 2026, Vienna, Austria, 3–8 May 2026, EGU26-4748, https://doi.org/10.5194/egusphere-egu26-4748, 2026.

EGU26-4809 | ECS | PICO | GM6.2

Late Quaternary palaeohydrology, aeolian dynamics and erosion rates recorded in a small, dune-dammed, arid dunefield margin playa 

Nitay Golovaty, Joel Roskin, Shlomy Vainer, and Galina Faershtein

Small endorheic basins at the arid, northwestern Negev desert dunefield margin were hypothesized to preserve finely resolved and quasi-continuous archives of climate‑driven sediment dynamics. Two 7.5‑m deep cores from the Givat Hayil dune‑dammed playa (0.047km2) captures sedimentation processes and erosion rates of a small, ~2 km2 basin, characterized by ~1 short-lived flood per annum. A multi‑proxy approach combined laser‑diffraction grain‑size analysis and imaging, X‑ray fluorescence geochemistry, and portable-OSL (port‑OSL) profiling to diagnose the sediments, identify accumulation trends, delineate stratigraphic boundaries and target samples for OSL dating.

The cored sequence documents transitions between fluvial to aeolian dominated environments, from the onset of MIS-3 until today, and mainly since the Younger Dryas (YD). Basal, well‑bedded silt loams dating to the early MIS-3 suggest floodplain deposition of up-basin-sourced, primary, MIS-6-MIS-2 (calcic) loess deposits, indicative of initial and enhanced basinal loess erosion evolving into hyper-concentrated flows. A long MIS-3 - YD hiatus suggests significant decrease in loess erosion rates. YD - early Holocene aeolian sand influx led to the playa-forming  dune dam. During the Holocene, the playa efficiently trapped sediments undergoing varying upbasin fluvial erosion rates and ongoing dustfall, punctuated by anthropogenically-induced Roman-Byzantine sand mobilization. Thin units with diluted aeolian sand content probably indicating rapid pulses of eroded up-basin loess delivery driven by high-intensity rain events are interpreted to document major and altogether, evenly distributed, ~1:1,000 yr recurring floods.

Changing sediment accumulation rates appears to capture a complete and fluctuating erosion trajectory of up-basin loess—from a MIS-3 loess‑loaded landscape to a present loess-starved basin. Inversed magnitude-lower loess erosion rates along the Late Pleistocene–Holocene transition in relation to the Holocene, despite higher up-basin loess availability, probably reflects a moister Late Pleistocene that enhanced vegetation and crust development, that in turn, increased loess preservability. Three-fold larger late Holocene accumulation rates in relation to the early Holocene, despite depleting up-basin loess availability, may be a result of higher erosion rates due to more high-intensity rainfall events, in line with gradually increasing aridity.

Altogether, this underrecognized, high‑resolution archive demonstrates how sediment archives of small, dunefield fringe endorheic basins can serve to resolve the timing, magnitude, and mechanisms of both aeolian and fluvial processes, in particular extreme floods and erosion rates, in arid and hyper-arid environments.

How to cite: Golovaty, N., Roskin, J., Vainer, S., and Faershtein, G.: Late Quaternary palaeohydrology, aeolian dynamics and erosion rates recorded in a small, dune-dammed, arid dunefield margin playa, EGU General Assembly 2026, Vienna, Austria, 3–8 May 2026, EGU26-4809, https://doi.org/10.5194/egusphere-egu26-4809, 2026.

EGU26-6041 | ECS | PICO | GM6.2

Linking Dune Dynamics to Facies Heterogeneity in Preserved Aeolian Systems 

Na Yan, Luca Colombera, Nigel Mountney, and Grace Cosgrove

Aeolian sedimentary systems record past climate changes due to their sensitivity to environmental variables, such as changing rates of sediment supply, climate, wind regime and palaeoflow, the action of physical, chemical and biogenic stabilising agents, and also interactions with other coeval sedimentary systems. Due to the interplay of allogenic and autogenic controls, the preserved sedimentary record of aeolian systems is highly complex and exhibits a variety of sedimentary architectures and spatial heterogeneities in facies distributions. Meanwhile, the accumulated deposits of aeolian sedimentary successions form important potential subsurface geothermal reservoirs and underground repositories for large-scale carbon capture and storage in both depleted and repurposed hydrocarbon reservoirs, and in very large saline aquifer bodies. In this study, a novel rule-based forward stratigraphic model, the Dune Architecture and Sediment Heterogeneity model (DASH), is used to investigate the variations in facies heterogeneity across different types of dunes, taking into account their sizes, migration rates, and aggradation rates over a broad spectrum of temporal scales. The DASH model is a geometric-based model that can reproduce different hierarchies of sedimentary architectures and bounding surfaces of aeolian dune and interdune and fluvial dune, barform and sheet-like deposits. The modelling outputs will enable more accurate predictions and systematic analysis of facies spatial distributions in different aeolian systems, including transverse dunes, linear dunes, and superimposed dunes. The modelling outputs can further be employed for predictions of petrophysical heterogeneity, for example, to guide models to assess geothermal reservoir potential and to model carbon capture and storage scenarios.

How to cite: Yan, N., Colombera, L., Mountney, N., and Cosgrove, G.: Linking Dune Dynamics to Facies Heterogeneity in Preserved Aeolian Systems, EGU General Assembly 2026, Vienna, Austria, 3–8 May 2026, EGU26-6041, https://doi.org/10.5194/egusphere-egu26-6041, 2026.

EGU26-7403 | ECS | PICO | GM6.2

Late Quaternary geomorphological processes and landscape evolution in the Kkoor va Biabanak basin using quartz OSL and K-feldspar pIRIR225 ages 

Mehdi Torabi, Thomas Kolb, Morteza Fattahi, Christian Buedel, Zakieh Rashidi Koochi, and Markus Fuchs

The Central Iranian Plateau is a key region for understanding Late Quaternary landscape evolution. However, palaeoenvironmental reconstructions remain limited due to harsh climatic conditions and difficult access. The Khoor va Biabanak Basin, at the eastern edge of the Great Kavir, preserves diverse geomorphological archives that record interactions between climate and surface processes.

We used an integrative approach combining geomorphological mapping, stratigraphical analyses, and luminescence dating of 12 sedimentary sequences across eight geomorphic units, including pediments, alluvial fans, dunes, sand sheets, and playa surfaces.

Quartz OSL signals from dunes and sand sheets were generally dim and dominated by medium and slow components. Dose recovery tests show limited reliability, with high failure rates for recycling and recuperation, although performance improved at preheat temperatures of 180-280 °C. OSL-IR depletion tests indicate feldspar contamination in ~21% of aliquots, limiting the applicability of quartz OSL in this setting.

Preliminary K-feldspar pIRIR225 results are more promising. Fading rates range from 0.5–2.3% per decade, and residual doses are 2–5%. The first age estimates are currently in progress and will provide essential chronological constraints for Late Quaternary geomorphological processes in the basin.

The oldest landforms indicate alternating pediment erosion, alluvial fan deposition, dune activity, and soil formation, likely corresponding to periods before and during MIS 3. Subsequent alluvial fan progradation and dune development reflect cold and arid conditions during the Last Glacial Maximum. Holocene features show increasing aridity, including gypsum-rich soils, dune reactivation, and deflation of playa surfaces. In the future, with the completion of dating results, these observations will allow a robust reconstruction of Late Quaternary landscape evolution and its climatic drivers in the Khoor Basin.

This study provides the first comprehensive model for landscape evolution in the Khoor va Biabanak Basin, demonstrating both the potential and limitations of luminescence dating in arid-region environments and highlighting the complex interactions between climate, geomorphology, and sedimentary processes in Central Iran.

How to cite: Torabi, M., Kolb, T., Fattahi, M., Buedel, C., Rashidi Koochi, Z., and Fuchs, M.: Late Quaternary geomorphological processes and landscape evolution in the Kkoor va Biabanak basin using quartz OSL and K-feldspar pIRIR225 ages, EGU General Assembly 2026, Vienna, Austria, 3–8 May 2026, EGU26-7403, https://doi.org/10.5194/egusphere-egu26-7403, 2026.

EGU26-7772 | PICO | GM6.2

Loess in northern Pakistan? Current Understanding, Knowledge Gaps, and New Field Observations 

Christian Zeeden, Waheed Murad, Arshad Mehmood Abbasi, Sumiko Tsukamoto, and Arne Ulfers

Loess and other Late Quaternary palaeoclimate archives in Pakistan are not documented adequately yet and their extent and composition remain unclear, with only a few isolated occurrences being described. This highlights a major gap in systematic research to comprehend the ecological and palaeoclimate dynamics critical for the evolution of dryland and sedimentary records in this region. In this context the present investigation focuses on the presence and composition of silty Quaternary sediments. These have been suggested to be of aeolian and fluvial origin.

In this contribution, we summarize literature, and present observations from a recent field excursion supplemented by magnetic susceptibility data. We consider both aeolian loess and redeposited loess-like fluviolacustrine sediments to be present in much larger areas than earlier reports. Magnetic susceptibility properties are typical for in-situ sol formation, suggesting phases of landscape stability over at least centuries. We find that an aeolian sediment flux into the landscape was repeatedly intercalated by fluviolacustrine sediments of similar silt grain size. The aeolian sedimentation proceeded into mountain regions north of the Peshwar Basin, but in-situ preservation of fine material in sparse. At several places, loess is intercalated with (unrounded) slope deposits and fluvial deposits.

We conclude that Quaternary sedimentation in northern Pakistan is complex, and that landscape stability phases with soil formation occurred. Next steps will be to assess the stratigraphic and spatial (in) homogeneity of deposits, and to provide a temporal frame for soil formation phases. 

How to cite: Zeeden, C., Murad, W., Mehmood Abbasi, A., Tsukamoto, S., and Ulfers, A.: Loess in northern Pakistan? Current Understanding, Knowledge Gaps, and New Field Observations, EGU General Assembly 2026, Vienna, Austria, 3–8 May 2026, EGU26-7772, https://doi.org/10.5194/egusphere-egu26-7772, 2026.

EGU26-14484 | ECS | PICO | GM6.2

Multi-millennial increased humidity in the Atacama Desert during MIS 5e: evidence from a lacustrine record in southern Peru 

Marco Nieslony, Swann Zerathe, Pierre Valla, Diana Ochoa, Luis Albinez, Dulio Gomez, Fabrizio Delgado, Xavier Robert, Laurence Audin, Regis Braucher, and Audrey Taillefer

The Atacama Desert, along the Pacific margin of the Central Andes, is one of the driest high-altitude regions on Earth, with hyperaridity persisting for at least 10-12 Ma due to its latitudinal location, Humboldt Current and Andean orographic barriers. This has produced landscapes with exceptionally well-preserved Quaternary geomorphologies, including mega-landslides, alluvial terraces and fans. While the roles of tectonics and climate in shaping and controlling these features remain debated, recent regional studies suggest the occurrence of past humid periods, though their timing, duration, moisture sources and controlling mechanisms remain largely unresolved.

We conducted a multi-proxy study of a 20-30 m thick and 300 m long sedimentary sequence trapped behind the Caquilluco mega-landslide (~2000 m a.s.l., Pleistocene). This site provides a rare exposure of lacustrine deposits and natural dam that have been partially re-incised. To reconstruct depositional conditions, document the paleoenvironment, and constrain the chronology, our analyses included stratigraphy (facies, grain size), geochemistry (XRF) and paleoenvironmental indicators (diatom, pollen) combined with feldspar OSL and ¹⁰Be exposure dating.

Results indicate predominantly lacustrine conditions, through fine and regularly deposited sediments. Slumps in distal deposits suggest minimum water depths of several meters, while desiccation cracks and debris flow layers indicate intermittent drying events. Although only partially preserved, pollen and diatom assemblages point to a semi-humid paleoenvironment, dominated by shallow-water taxa. OSL dates constrain deposition of the exposed sequence to 133 ± 14 ka – 115 ± 16 ka, corresponding to MIS 5e and consistent with ¹⁰Be exposure ages of dam and gorge incision. Given the small catchment area (~10 km²) and high evaporation rates, sustaining lacustrine conditions over ~20 ka would require substantial precipitation. We hypothesize that strong Pacific surface temperature anomalies during MIS 5e may have induced semi-permanent "El Niño"-type conditions, aligning with other regional proxies supporting enhanced humidity in the Atacama Desert during the last interglacial.

This study highlights the value of high-altitude drylands as archives of Quaternary environmental change and demonstrates the potential of lacustrine deposits in reconstructing past hydroclimatic variability, providing insights into the interplay of climate, geomorphology, and hydrology in dryland evolution.

How to cite: Nieslony, M., Zerathe, S., Valla, P., Ochoa, D., Albinez, L., Gomez, D., Delgado, F., Robert, X., Audin, L., Braucher, R., and Taillefer, A.: Multi-millennial increased humidity in the Atacama Desert during MIS 5e: evidence from a lacustrine record in southern Peru, EGU General Assembly 2026, Vienna, Austria, 3–8 May 2026, EGU26-14484, https://doi.org/10.5194/egusphere-egu26-14484, 2026.

Unlike the modern hyper-arid conditions across most of the Arabian Peninsula, the region experienced pronounced humid phases during the Quaternary, supporting a dense vegetation cover. Evidence for these humid periods and the associated greening is documented in regional geological and paleoenvironmental records, including speleothems, lake-level reconstructions, lacustrine sediment sequences, and the presence of soil carbonate. However, the timing, extent, and moisture sources of these humid phases remain poorly constrained in the northern Arabian Peninsula, particularly in the area now occupied by Kuwait. There is evidence that the area once experienced wetter intervals, but it is unclear whether they were driven by incursions of a Tropical Ocean monsoon (summer) or by enhanced Mediterranean (winter) westerlies.

This study investigates the nature of Quaternary humid conditions in Kuwait using petrographic, mineralogical, and oxygen- and carbon-isotope analyses (δ¹⁸O and δ¹³C) of relict pedogenic and paleosol carbonates. A total of 84 soil samples were collected across 21 sites in Kuwait, targeting calcic and petrocalcic horizons. Petrographic thin sections show progressive stages of carbonate development from stages I to III. Stage III carbonates are older and have δ¹⁸O values that cluster between −12 ‰ and +3 ‰ (VPDB) and δ¹³C values between −9 ‰ and 0 ‰. These ranges reflect the coevolution of soil moisture sources and vegetation types. During monsoon-influenced intervals, long-distance moisture transport and the amount effect produce isotopically light rainfall, resulting in carbonates with more depleted δ¹⁸O values. In contrast, carbonates have more isotopically enriched δ¹⁸O values during periods influenced by Mediterranean winter westerlies. The δ¹⁸O values of stage III soil carbonate suggest moisture sourced from both the tropical monsoon and the Mediterranean. Lower δ¹³C values reflect the contribution of soil-respired CO₂ from C₃ plants, whereas higher δ¹³C values reflect a greater contribution of C₄ plants. The δ¹³C values of stage III soil carbonate in Kuwait clearly reflect humid phases sourced from the tropical monsoon and supporting C4 vegetation, as well as winter rainfall from the Mediterranean and supporting C3 vegetation. The determination that Kuwait has experienced wetter conditions in the past from both tropical and Mediterranean sources is important for determining potential future precipitation amounts.

How to cite: Al-Qattan, N., Rech, J., and Currie, B.: What Caused the Greening of Kuwait: An Isotopic Investigation of the Source of Moisture During Quaternary Pluvial Periods in Kuwait, EGU General Assembly 2026, Vienna, Austria, 3–8 May 2026, EGU26-15946, https://doi.org/10.5194/egusphere-egu26-15946, 2026.

EGU26-19146 | ECS | PICO | GM6.2

Tracing Saharan dust to the Eastern Mediterranean: Integrating mineralogical and isotopic proxies with atmospheric trajectory modelling 

Simon Bitzan, Cécile L. Blanchet, Sylvain Pichat, Georgios E. Christidis, Kerstin Schepanski, and Fabian Kirsten

Long-distance aeolian dust transport is fundamental in shaping dryland environments and adjacent deposition regions, influencing sediment budgets, soil development, and ecosystem functioning. The Eastern Mediterranean constitutes a key corridor for Saharan dust transport, yet multi-proxy studies linking depositional records with atmospheric transport modelling are scarce. This study presents new insights into the provenance, transport dynamics, and seasonal variability of long-range aeolian dust deposited on the island of Crete (Greece), integrating laboratory sediment analyses with simulated air-mass trajectories.

Deposition samples were collected over a 15-month period at seven sites across western Crete, complemented by analyses of local surface material and reference aerosols from North Africa. Mineralogical composition, grain-size distribution, and radiogenic isotope ratios (Nd, Pb, Sr) reveal that deposited material is dominated by long range transported Saharan dust, with only minor local contributions. The persistent presence of palygorskite, uniform silt-dominated grain-size spectra, and isotopic signatures distinct from local substrates clearly indicate a North African origin. Temporal variability greatly exceeds spatial variability, and no substantial topography-related sorting is observed across the Lefka-Ori mountain range.

Seasonal shifts in mineralogical assemblages and isotopic composition indicate changes in dominant source regions, ranging from northeastern Algeria during winter to northeastern Libya and northwestern Egypt in summer, with transitional phases in spring and autumn. Transport-related fractionation is reflected in the depletion of coarse grain-size fractions and soluble minerals such as gypsum, as well as in variable illite/kaolinite ratios, pointing to mixing of particles from multiple source areas rather than single-source contributions.

To evaluate the plausibility of these interpretations and to assess the added value of combining depositional records with atmospheric modelling, laboratory-derived provenance indicators were compared with backward trajectories calculated using the HYSPLIT model for days with increased dust concentrations in the deposition region. The comparison highlights how the integration of mineralogical and isotopic fingerprints, deposition and concentration measurements, and modelled air-mass trajectories enhances the resolution of dust source attribution beyond what each approach can achieve independently.

This combined methodological framework advances our understanding of aeolian processes in large-scale aeolian systems and demonstrates the potential of integrated proxy-model approaches for reconstructing dust dynamics, with implications for geomorphic processes, and human environment interactions in dust-affected regions.

How to cite: Bitzan, S., Blanchet, C. L., Pichat, S., Christidis, G. E., Schepanski, K., and Kirsten, F.: Tracing Saharan dust to the Eastern Mediterranean: Integrating mineralogical and isotopic proxies with atmospheric trajectory modelling, EGU General Assembly 2026, Vienna, Austria, 3–8 May 2026, EGU26-19146, https://doi.org/10.5194/egusphere-egu26-19146, 2026.

EGU26-20574 | ECS | PICO | GM6.2

Potential dust source areas of Quaternary vega sediments on Lanzarote (Canary Islands) 

Jakob Labahn, Christopher-B. Roettig, Thomas Kolb, Anja-M. Schleicher, Christina Günter, Carsten Marburg, and Dominik Faust

On the eastern Canary Islands, several valleys exist that were dammed later on by volcanic activity. Since that damming, these valleys (locally called “vegas”) have acted as sediment traps. The deposited materials include volcanic material, redeposited (soil-)sediments from the surrounding slopes, and dust originating from the northern African continent. Due to intense postsedimentary calcification processes Vega sections are typically characterised by an alternation of pale-coloured, carbonate-enriched layers (PCL) and reddish, clay-enriched layers (RCL), forming recurring sedimentary sequences.

This study shall contribute to the reconstruction of palaeoenvironmental conditions during the formation of vega sections on Lanzarote, with particular emphasis on aeolian dust deposits. Therefore, we combine grain-size analyses, geochemical (XRF) and mineralogical analyses (XRD), and luminescence dating (IRSL) with a principal component analysis (PCA) to evaluate geochemical fingerprints and compositional end-members.

Four distinct clusters have been identified reflecting different sediment sources and transport pathways. A first cluster is characterised by increased Si, Zr, quartz and plagioclase contents and has been interpreted as short range (silt-dominated) aeolian dust input. A second cluster shows high Al, K and kaolinite loadings and indicates long range (fine-grained) aeolian dust derived from more southerly regions of northern Africa. A third cluster is defined by elevated Fe, Ni and Zn concentrations, which are typical for basaltic source rocks on the eastern Canary Islands and reflect locally derived material. In contrast, Rb–V–enriched samples define a distinct trend, as Rb substitutes for K in fine-grained mineral phases and V is associated with Fe-(hydr-)oxides, pointing to a fine-grained sediment component differentiated from the Ni–Zn–rich basaltic signal and possibly reflecting an additional aeolian contribution. The fourth cluster is associated with Ti and Cr, elements occurring both in Saharan dust and in local basaltic volcanics; however, the presence of K-feldspar suggests a predominantly allochthonous contribution.

The cyclic pattern (alternating PCLs and RCLs) within vega sections highlights the sensitivity of these archives to changing environmental conditions. While variations in grain size, mineralogical composition, and geochemical signatures indicate shifting potential source areas and pathways of dust, the carbonate redistribution in combination with the characteristics of clay-dominated sediment layers reflect changing hydrological and hence palaeoclimatic conditions on the Eastern Canary Islands. Finally, we hope to contribute on the one hand to the understanding of Late Quaternary conditions in an over regional scale and on the other hand to the individual behaviour of the different subterritories.

How to cite: Labahn, J., Roettig, C.-B., Kolb, T., Schleicher, A.-M., Günter, C., Marburg, C., and Faust, D.: Potential dust source areas of Quaternary vega sediments on Lanzarote (Canary Islands), EGU General Assembly 2026, Vienna, Austria, 3–8 May 2026, EGU26-20574, https://doi.org/10.5194/egusphere-egu26-20574, 2026.

EGU26-21262 | ECS | PICO | GM6.2

Exploring the palaeoenvironmental context of surface archaeology in the Namib Sand Sea 

Tessa Spano, Abi Stone, George Leader, Rachel Bynoe, Ted Marks, Dominic Stratford, Kaarina Efraim, Alexandra Karamitrou, Mark Bateman, Andrew Gunn, Eugene Marais, and Vaibhav Singh

The hyper-arid conditions of the Namib Sand Sea in the present day pose significant challenges for all but some extremely well-adapted species. The presence of a rich-archaeological surface record of stone age lithics at numerous interdunal pan sites raises questions around the evolution of this environment throughout the Quaternary. Specifically, was this region subject to phases of elevated humidity, allowing the proliferation of a network of ‘green corridors’ through which hominin populations exploited this landscape, or were hominins adapted to hostile conditions much like those of today?

Earlier insights into the palaeoenvironmental context of interdune pan sites were provided by Teller et al. (1990), although this was before the development of chronological techniques that could provide reliable age constraint on sediments greater than 100 ka, where we have found the quartz luminescence signal to be in saturation. Feldspar dating protocols will allow us to provide age control for the later part of the Earlier Stone Age and the Middle Stone Age (e.g. Stone et al., 2024). The PANS project (Palaeoenvironmental context of Palaeolithic Archaeology in the Namib Sand Sea) applies single grain and multiple grain multiple elevated temperature infrared-stimulation luminescence (MET-IRSL) alongside a multi-proxy approach to environmental reconstruction at new sites in the northern Namib Sand Sea to situate environmental change and patterns of hominin activity within the regional palaeoclimatic framework. We present MET-IRSL results alongside palaeoclimatic proxies and explore the use of palaeoecological markers, at key new sites visited in 2025. We combine these datasets with remote sensing techniques to reconstruct former watercourses in this hyper-arid environment.


Stone, A., Leader, G., Stratford, D., Marks, T., Efraim, K., Bynoe, R., Smedley, R., Gunn, A. and Marais, E., 2024. Landscape evolution and hydrology at the Late Pleistocene archaeological site of Narabeb in the Namib Sand Sea, Namibia. Quaternary Science Advances, 14, p.100190.

Teller, J.T., Rutter, N., Lancaster, N., 1990. Sedimentology and paleohydrology of Late Quaternary lake deposits in the northern Namib Sand Sea, Namibia. Quat. Sci. Rev. 9, 343–364.

How to cite: Spano, T., Stone, A., Leader, G., Bynoe, R., Marks, T., Stratford, D., Efraim, K., Karamitrou, A., Bateman, M., Gunn, A., Marais, E., and Singh, V.: Exploring the palaeoenvironmental context of surface archaeology in the Namib Sand Sea, EGU General Assembly 2026, Vienna, Austria, 3–8 May 2026, EGU26-21262, https://doi.org/10.5194/egusphere-egu26-21262, 2026.

EGU26-22019 | ECS | PICO | GM6.2

Testing rock magnetic- and colorimetric- based climofunctions at the Middle Pleistocene Köndringen loess-palaeosol-sequence, SW Germany 

Mathias Vinnepand, Christian Zeeden, Tobias Sprafke, Kamila Ryzner, Mohammad Paknia, Felix Martin Hofmann, and Frank Preusser

Global climate oscillations may strongly modify continental precipitation patterns. Understanding the history of these is thus, relevant for comprehending effects of past and ongoing climate change. For this purpose, precipitation estimates in a high spatio-temporal resolution are extremely useful and may be derived from geophysical properties of former land-surfaces such as fossil soils and sediments, if reliable climofunctions are available. Recently, promising transfer functions have been provided by linear regression analyses between geophysical topsoil properties (magnetic and colorimetric) across the Bačka Loess Plateau (Serbia) along a narrow precipitation gradient (MAP: 525±1 mm/a to 584±1 mm/a) and available meteorological data. Whilst these climofunctions need to be expanded regarding the calibrated precipitation range and tested considering different sediment and soil types, they testify to a pronounced sensitivity of geophysical properties to precipitation, exceeding these of MAP- δ13C derived climofunctions. We aim to test multiple climofunctions for geophysical properties using an extended precipitation-calibration range (up to ~1200 mm/a) at the Köndringen loess-palaeosol-sequence (LPS). This site mostly consists of polygenetic palaeosols and pedosediments of varying development that are in parts intersected. This testifies to a complex local geomorphological evolution and consequently, provides a difficult and thus, promising testing environment for the climofunctions at test. A thorough evaluation of these is pivotal as different climatic settings, soil/sediment properties, geomorphological positions and provenance effects may influence the climate-sensitive iron-(hydr-)oxide composition and eventually constrains the applicability of climofunctions. We also directly compare our findings to climate-model output data to assess derived MAP calculations through an independent measure. We contribute a critical assessment to test the potential of climofunctions for geophysical properties for moister western Central European settings that show magnetic enhancement and/or distinct color hues indicative for the presence of goethite and/or hematite.

How to cite: Vinnepand, M., Zeeden, C., Sprafke, T., Ryzner, K., Paknia, M., Hofmann, F. M., and Preusser, F.: Testing rock magnetic- and colorimetric- based climofunctions at the Middle Pleistocene Köndringen loess-palaeosol-sequence, SW Germany, EGU General Assembly 2026, Vienna, Austria, 3–8 May 2026, EGU26-22019, https://doi.org/10.5194/egusphere-egu26-22019, 2026.

Rivers across the world are responding to natural and anthropogenic disturbances including post-glacial landscape evolution, land-use changes, and climate change. Beaver Dam Analogs (BDAs) have emerged as a low-tech, process-based restoration tool designed to mimic the geomorphic and hydrological functions of natural beaver dams and increase water retention, sediment storage, flood attenuation, and habitat creation. Despite the adoption of BDAs in selective areas in North America  uncertainties remain regarding their effect on fish habitat and potential flood risks under failure scenarios. These uncertainties continue to constrain permitting, implementation, and acceptance of BDAs as a widely accepted restoration method. This research integrates machine learning, field observations, and controlled physical experimentation to evaluate how BDAs influence fluvial processes across spatial and temporal scales. A province-wide habitat suitability model is being developed using satellite imagery, environmental variables, and a database of mapped beaver dam locations. This model identifies stream conditions most conducive to successful BDA implementation and highlights areas where environmental characterstics may limit suitability. Second, controlled experiments in the University of British Columbia’s river flume laboratory test how variations in BDA design affect channel morphology, sediment transport, and flow dynamics. These experiments simulate incised channel conditions typical of many degraded systems and quantify geomorphic responses under varying discharge regimes and dam configurations. Third, field data from ongoing restoration projects combined with flume-derived relationships will inform the development of a flood risk model. This component assesses hydraulic impacts and potential dam failure scenarios, addressing key management concerns related to downstream infrastructure and fish passage. The results will directly support the British Columbia Wildlife Federation,  and the Lheidli T’enneh First Nation in refining restoration strategies and developing evidence-based guidelines for BDA design and implementation. 

How to cite: Matechuk, L.: Evaluating Geomorphic and Hydrological Responses to Beaver Dam Analogs: Integrating Machine Learning, Field Data, and Flume Experiments to Inform River Restoration, EGU General Assembly 2026, Vienna, Austria, 3–8 May 2026, EGU26-265, https://doi.org/10.5194/egusphere-egu26-265, 2026.

EGU26-402 | Orals | GM10.2

A Multi-Horizon Morphodynamic Forecasting and Near Real-Time Scour Monitoring Framework for the Jamuna River 

Imran Khan, Mostazer Billah, Md Alifnur Salim, Md Musfequzzaman, Muhammad Anowar Saadat, and Sarwat Jahan

Large braided rivers pose persistent challenges for the protection of major river training works, as rapid channel migration, evolving char formations, and highly localized scour can compromise structures within short timescales. The Jamuna River in Bangladesh is one of the most morphodynamically active systems of this kind, making it an ideal but demanding environment for operational forecasting and adaptive management.

Since 2014, a morphological model of the Jamuna River has been progressively developed using detailed survey data and MIKE 21C simulations. This model underpins annual monsoon-season morphological forecasts, predicting planform adjustments and potential scour depths for the upcoming monsoon. The 2025 forecast report which was submitted on 30 April, identified elevated scour risk between CH 1300–2500, with maximum predicted depths ranging from -31.51 mPWD under a 1 in 100 year flood to -37.16 mPWD under a 1-in-2.33-year flood. These predictions guided initial preparedness and monitoring plans for the monsoon season.

In recent years, the framework has been extended to provide near-real-time scour forecasts for all major river training works, integrating short-term hydrological forecasts with high-frequency bathymetric observations. During the 2025 monsoon, the near-real-time hydro-morphodynamic modelling system was continuously updated using the latest 5-day water level forecasts from the Flood Forecasting and Warning Centre (FFWC) and validated through frequent single-beam and multibeam bathymetry surveys. This approach enabled timely detection of rapid scour intensification near CH 2600-2700. Based on combined survey and model results for August, a targeted dumping plan along CH 2470-2780 was formulated and executed. This represents an adaptive intervention strategy, where protective measures are triggered in response to evolving river dynamics indicated by both predictive simulations and real-time observations. By late August, measured scour reached -33.34 mPWD exceeding the design threshold by more than 6 m. Yet timely adaptive interventions maintained apron stability and prevented wider structural exposure.

This study demonstrates that operational morphodynamic forecasting integrating annual monsoon-season predictions with near real time model updates and survey observations, can significantly enhance the resilience of major river training works in highly dynamic sand bed rivers. It represents one of the first operational applications of an integrated multi-horizon and near real time morphodynamic forecasting framework for guiding adaptive river training interventions providing a practical and scalable blueprint for infrastructure risk management under increasing hydrological variability and climate-driven extremes.

How to cite: Khan, I., Billah, M., Salim, M. A., Musfequzzaman, M., Saadat, M. A., and Jahan, S.: A Multi-Horizon Morphodynamic Forecasting and Near Real-Time Scour Monitoring Framework for the Jamuna River, EGU General Assembly 2026, Vienna, Austria, 3–8 May 2026, EGU26-402, https://doi.org/10.5194/egusphere-egu26-402, 2026.

EGU26-985 | ECS | Posters on site | GM10.2

Disentangling anthropogenic and geological drivers of morphodynamics change in a Himalayan river: The Yamuna River, India 

Shalini Singh, Louis Rey, Nikita Karnatak, Barbara Belletti, Herve Piegay, and Vikrant Jain

River processes and its morphodynamics are shaped by a combination of geological, climatic, and human-driven factors. Recently, increasing population pressures, rapid urbanization, and related stresses, such as large-scale water diversions by dams and sediment mining activities, have begun to disrupt riverine systems, raising concerns about their long-term sustainability.

This study investigates the impact of human activities and geological controls on geomorphic change in the Yamuna River, a major Himalayan system that originates from the Yamunotri Glacier at an elevation of 6,387 m and drains a basin of 3.66x10⁵ km² over a distance of 1,376 km. The river flows through the Delhi megacity, which is home to approximately 11 million people. Besides the pressure from the megacity, the presence of the dams and sand mining from the channel bed causes intense anthropogenic stress, making it an ideal system for assessing human impacts on the channel form of a major Himalayan river. Downstream of Delhi, the river is further influenced by three major tributary confluences, which introduce significantly more water and sediment flux into the Yamuna River channel, making it a suitable location to study the natural reference stage of the river.

To evaluate these driving factors, we extracted the active floodplain using the Global Surface Water maximum water extent dataset (1984–2021) and applied the Fluvial Corridor Toolbox to segment the river into discrete geomorphic objects. Using Landsat and Sentinel-2 imagery (1984–2024), we quantified object-based geomorphic parameters, including active channel width, water width, braiding index, and vegetation width, for a 1100 km long part of the river.

Results indicate that human activities, such as dam construction, sand mining, and urban expansion, have significantly altered channel structure across multiple scales, particularly in upstream reaches and within the Delhi region. In the detailed analysis, it was found that the impact of sand mining and the pressure exerted by the Delhi megacity were more prominent than that of the dam.  In contrast, the downstream reaches of Delhi reflect a dominant tributary contribution, where these tributaries drive the geomorphic recovery and reorganization of channel form. Together, these patterns demonstrate that the Yamuna is shaped by a complex interplay between human-induced disturbances and natural fluxes from tributaries. Recognizing this dual influence is essential for designing reach-specific, sustainable river management strategies that address both immediate anthropogenic pressures and longer-term geomorphic controls.

How to cite: Singh, S., Rey, L., Karnatak, N., Belletti, B., Piegay, H., and Jain, V.: Disentangling anthropogenic and geological drivers of morphodynamics change in a Himalayan river: The Yamuna River, India, EGU General Assembly 2026, Vienna, Austria, 3–8 May 2026, EGU26-985, https://doi.org/10.5194/egusphere-egu26-985, 2026.

The Badlands of the Lower Chambal Valley (LCV) continue to evolve under the combined influence of overland flow, seepage-induced piping, and land-use interventions such as widespread land levelling. Recent work in the region has shown that slope–area (SA) relationships, when combined with width–depth ratios, can differentiate dominant erosion processes and reveal the strong role of soil piping in gully initiation. However, several key research gaps limit the ability to predict where gullies will form—and reform—under changing land management. This contribution outlines emerging research prospects in the LCV. First, the sustainability of land-levelling remains poorly understood: recurrence of gullies on reclaimed parcels suggests that the original erosional thresholds persist in the subsurface, yet the conditions that trigger renewed incision remain unquantified. Second, integrating SA thresholds can offer a new understanding to link surface thresholds with subsurface susceptibility to piping. Third, multi-season monitoring of newly levelled and marginal lands is needed to establish recurrence intervals and identify early-warning indicators of gully reactivation. Finally, combining SA relationship with continuous monitoring of gully recurrence and soil characteristics may allow better understanding of processes that dominate in pristine Badlands and remodelled slopes (land levelling). By framing these prospects, a future direction may be adopted to better understand and possibly check recurrence of gullies in the remodelled slopes.

How to cite: Ranga, V.: Future Directions in understanding gully initiation and recurrence in the Lower Chambal valley, India, EGU General Assembly 2026, Vienna, Austria, 3–8 May 2026, EGU26-1059, https://doi.org/10.5194/egusphere-egu26-1059, 2026.

EGU26-1298 | ECS | Orals | GM10.2

Evidence Based Hydraulic and Geomorphic Complexity of Large Wood Interventions for Habitat Creation 

Ghazaleh Nassaji Matin, Diego Panici, Georgie Bennett, and Richard Brazier

Large wood (LW) has become an essential tool in river restoration due to its ability to enhance habitat heterogeneity and restore natural processes disrupted by human activities such as channelisation.  This work presents findings from 2-year field monitoring across 4 restoration sites in the UK, aimed at quantifying the effects of various LW interventions on geomorphic changes and hydraulic complexity.

The sites including in our monitoring have been selected for the diverse type of interventions, catchment type (ranging from stream orders 3rd to 6th), and LW complexity that has been used for restoration, for example, Stage-0 (Holnicote, Somerset, UK and Tattiscombe, Devon, UK), complex dams and deflectors (Magdalen Farm, Somerset, UK), simple deflectors (Mosterton, Somerset). The monitoring process encompassed the quantification of surface velocity variations around LW installations through a drone-based large scale particle image velocimetry (LSPIV) method coupled with the structural complexity and type of LW, and measurement of LW-induced geomorphic changes using high-resolution RTK drone surveys and walk-overs using Leica GNSS unite. To identify the impact of LW on restoration, we employed a control (unwooded) versus impact (restored) design for Magdalen and Mosterton farms combined with a before‑and‑after monitoring approach for Holnicote and Tattiscombe.

For the first objective, LSPIV was employed to acquire spatially continuous velocity fields across selected rivers reaches within the sites, mitigating the methodological limitations of traditional point-measurement techniques near complex LW structures. LSPIV surveys were conducted during contrasting low (Q90-Q99) and high (Q10-Q4) flow conditions at intervention and upstream control reaches. Velocity analyses quantified spatial heterogeneity using coefficient of variation in velocity, revealing consistent formation of distinct wake zones (reduced velocity) and acceleration zones near wood features. For example, in LW jams in Mosterton, a cross-section with 33.34% wood cover exhibited a velocity coefficient of variation 195.82% higher than the control reach (unwooded), with P value equal to 3.9×10⁻⁴⁴ (Wilcoxon test) confirming that LW significantly drives flow variability. The observed hydraulic heterogeneity defines three functional zones: high‑energy, erosion‑ or scour‑prone reaches; low‑energy, depositional zones; and intermediate turbulent‑mixing areas. By overlaying these flow‑zone maps onto concurrent drone‑derived orthophotos, we can relate flow patterns to specific geomorphic responses such as pool development, bar migration, or bank erosion. This will allow us to predict where erosional and depositional processes are most likely to occur under different LW configurations and flow conditions.

How to cite: Nassaji Matin, G., Panici, D., Bennett, G., and Brazier, R.: Evidence Based Hydraulic and Geomorphic Complexity of Large Wood Interventions for Habitat Creation, EGU General Assembly 2026, Vienna, Austria, 3–8 May 2026, EGU26-1298, https://doi.org/10.5194/egusphere-egu26-1298, 2026.

Tropical regions cover 19% of the world's landmass and account for more than 40% of the world's population.  Rivers in these zones exhibit significant hydrological and geomorphic dynamism, primarily due to the enormous variability in rainfall and the associated energy regimes, while also supporting some of the world's most productive biological systems.  Furthermore, tropical rivers remain among the most heavily regulated, with flow modification, dam construction, and floodplain encroachment all causing significant deviations from natural channel behaviour.  The downstream geomorphic consequences of these regulatory pressures are yet poorly constrained, emphasizing the need for large-scale, process-based studies of river variability and its governing mechanisms.
To address this research gap, the present study applies the River Styles Framework, a process-based approach and reach-scale geomorphic classification method, to the Narmada River basin (98,796 km²; 1,312 km), the largest west-flowing system in Peninsular India. The study aims to: (i) classify geomorphically distinct river styles; (ii) identify hydrological, geological, and morphological controls governing transitions along the longitudinal profile; and (iii) formulate reach-specific insights to support sustainable river-management strategies. Geomorphic characterization integrates multi-source remote-sensing datasets, SAR-based floodplain delineation, and field validation of key geomorphic units, including floodplains, riffles, pools, barforms, and planform metrics such as sinuosity. Hydrological variability is quantified through Gumbel flood-frequency analysis of four decades of discharge records to determine spatial and temporal patterns in stream power. Sedimentological assessments combine AI-assisted photogrammetry for coarse fractions with laboratory-based particle-size analysis of finer sediments.
The results show 17 distinct River Styles along the Narmada River continuum. Excluding segments affected by reservoir backwater, approximately 64% of the channel length occurs within confined valley settings, 31% within partly confined reaches, and only 5% within laterally unconfined valley environments. Valley slopes, stream power distribution, tributary confluences, and anthropogenic activities, such as dam construction, emerge as the primary controls on spatial variations in channel form and process.
Overall, the study offers a comprehensive, process-based understanding of geomorphic variation along the Narmada River and identifies reaches with high geomorphic sensitivity that require priority management intervention. By combining geomorphic, hydrological, and sedimentological assessments, the findings provide a robust scientific basis for designing economically viable and sustainable management strategies. Narmada's diverse landscapes, geological discontinuities, and significant climatic gradients make it an ideal natural laboratory for developing approaches applicable to major tropical and monsoon-dominated river systems worldwide.

How to cite: Jha, S. K. and Jain, V.:  Tracing Geomorphic Variability and Forcing Mechanisms of a Highly Regulated Tropical River System in India, EGU General Assembly 2026, Vienna, Austria, 3–8 May 2026, EGU26-1997, https://doi.org/10.5194/egusphere-egu26-1997, 2026.

EGU26-2077 | ECS | Orals | GM10.2

Sustainable Mining Zones: A Multi-Criteria Framework for Balancing Sand Extraction and River Integrity in the Mekong Delta 

Sonu Kumar, Edward Park, Dung Duc Tran, and Adam D. Switzer

Unregulated sand mining has become a major global sustainability challenge, yet managers still lack clear tools to determine where sand can be extracted and how much can be removed without damaging river systems. This study presents a new, practical framework called Sustainable Mining Zones (SMZ) that combines high-resolution sediment mapping with ecological and geomorphic sensitivity analysis to support science-based sand mining decisions. The Vietnamese Mekong Delta, one of the world’s most intensively mined river systems, is used as a test case. Using a high-resolution Delft3D-FM model initialized with a 2017 riverbed survey and validated against 2020 observations, we simulated hydrodynamics, sediment transport, salinity intrusion, and riverbed evolution from 2017–2021. Results indicate a cumulative sediment loss of approximately 250 Mm³, with severe reach-scale deficits reaching ~−79.5 Mm³ yr⁻¹ in the Tien River and a median incision rate of ~0.30 m yr⁻¹, strongly coinciding with observed dredging hotspots. Although the delta contains substantial sediment resources (~10.59 Bm³ above a conservative thickness threshold), sustainability screening reduces the effective resource to ~4.91 Bm³ once geomorphic stability and ecological constraints are applied through the Suitability-Weighted Reserve (SWR). Scenario simulations show that an equilibrium extraction benchmark of approximately ~4.9 Mm³ per year produces minimal morphological impact, while a practical upper operational limit of about 9.8-9.9 Mm³ per year can meet moderate construction demand if extraction is confined to high-suitability mid-channel and point-bar zones. The SMZ framework provides a transferable, map-based tool for regulators to balance development needs with long-term river resilience in sediment-stressed river basins worldwide.

Keywords: Sand mining; Mekong Delta; sediment dynamics; sustainable management; river morphology; decision support

How to cite: Kumar, S., Park, E., Tran, D. D., and Switzer, A. D.: Sustainable Mining Zones: A Multi-Criteria Framework for Balancing Sand Extraction and River Integrity in the Mekong Delta, EGU General Assembly 2026, Vienna, Austria, 3–8 May 2026, EGU26-2077, https://doi.org/10.5194/egusphere-egu26-2077, 2026.

EGU26-2171 | ECS | Orals | GM10.2

Vegetation Phenology Shifts Driven by Cascade Reservoir Operations in the Lancang–Mekong River Basin 

Yixuan Zhang, Mengzhen Xu, Yongxian Zhang, and Yuan Xue

Large-scale infrastructure represents one of the most pervasive anthropogenic disturbances to fluvial systems, yet the cascading interactions between reservoir operations and alpine land-surface processes remain elusive. This study targets the Lancang–Mekong River Basin, a critical transboundary hotspot originating from the Qinghai-Tibet Plateau, to quantify how hydrological regulation mediates the coupling between local microclimates and vegetation phenology (including the start of the growing season (SOS) and the end of the growing season (EOS)). We developed an analytical framework integrating long-term multi-source remote sensing observations with structural equation modeling and interpretable machine learning to disentangle the cumulative, spatially heterogeneous responses to damming. Our results reveal a fundamental regime shift: over the past 24 years, the vegetation growing season in dam-concentrated reaches has extended by over 30 days, characterized by a 22-day advance in SOS and a 9-day delay in EOS. While natural climatic drivers typically dominate alpine phenology, reservoir-induced impoundment has perturbed the local hydrothermal equilibrium and alleviated water stress in dry-hot valleys. Attribution analysis reveals that reservoir-regulated soil moisture dynamics account for 42.7% of vegetation variability, representing a mechanistic transition from climatic dominance to a coupled human-environment regulation regime. This mechanistic shift provides essential geomorphic and eco-hydrological insights for the adaptive management and ecological restoration of disturbed river systems in high-altitude hotspots.

How to cite: Zhang, Y., Xu, M., Zhang, Y., and Xue, Y.: Vegetation Phenology Shifts Driven by Cascade Reservoir Operations in the Lancang–Mekong River Basin, EGU General Assembly 2026, Vienna, Austria, 3–8 May 2026, EGU26-2171, https://doi.org/10.5194/egusphere-egu26-2171, 2026.

EGU26-3729 * | Posters on site | GM10.2 | Highlight

River sand and gravel mining: A global synthesis of drivers, extents and impacts for sustainable management 

Edward Park, Christopher Hackney, Mette Bendixen, Jim Best, Dung Duc Tran, and Sonu Kumar

Sand and gravel are mined from rivers globally at unprecedented scales, yet the full extent and impacts of this extraction remain underrecognized relative to other environmental crises. Here we present a comprehensive review of riverine sand and gravel mining (SGM), synthesizing 279 studies published over the last five decades within a novel Driver-to-Management Pathway for Sustainable Mining (DMPSM) framework. This framework links the drivers of SGM, the spatial extent of extraction, and the resulting hydrogeomorphic impacts to inform sustainable management strategies. Our synthesis reveals pronounced spatial and scalar mismatches among the scales of drivers, extraction, and impacts: the socioeconomic drivers of sand demand often act at regional to global levels, whereas extraction extents are poorly quantified at local scales, and impacts can propagate far beyond mining sites, complicating effective governance. Excessive sand removal disrupts sediment budgets, triggering riverbed incision, bank erosion, and channel instability. These geomorphic changes steepen hydraulic gradients, lower alluvial water tables, and reduce hyporheic exchange, collectively degrading riverine habitats and water resources. We further find that SGM impacts are compounded by multiple anthropogenic stressors: upstream dams trap sediment, land‐use changes increase sediment demand, and climate change alters flow regimes, creating compounding feedbacks that accelerate channel degradation. Our global synthesis underscores the urgent need for improved monitoring across scales and integrated management and governance strategies to bridge these disconnects. Aligning extraction with natural sediment replenishment, strengthening regulatory frameworks and enforcement, and enhancing stakeholder engagement are critical steps to mitigate SGM’s cumulative impacts and ensure sustainable river basin management.

How to cite: Park, E., Hackney, C., Bendixen, M., Best, J., Tran, D. D., and Kumar, S.: River sand and gravel mining: A global synthesis of drivers, extents and impacts for sustainable management, EGU General Assembly 2026, Vienna, Austria, 3–8 May 2026, EGU26-3729, https://doi.org/10.5194/egusphere-egu26-3729, 2026.

EGU26-4561 | Orals | GM10.2

Future Geographies:  The Shapes of Things to Come 

Gordon Grant, Bretwood ( Higman, and Becky Fasth

As climate change drives the world toward a warmer and more unpredictable future, it presents significant challenges for geographers and geomorphologists: how will Earth's surface evolve? While landscapes may never be in perfect equilibrium with their formative processes, there is no doubt that climate change—and the shifting frequencies, magnitudes, and intensities of geomorphic events—is creating widespread disequilibrium. Rapid, real-time landscape transformation is evident in phenomena such as sea level rise, glacial retreat, mega-wildfires, and permafrost melting. Fundamental questions for current and future generations of earth scientists include: Can we predict the trajectory of these landscapes? How long will the transformations take, and what will the resulting landscapes look like? What will the consequences be for humans and other species, and is our science adequate for the task of prediction?

Southeast Alaska, a vast and dramatic region, serves as a natural laboratory for exploring these questions. Subject to the aforementioned climate drivers, as well as the world’s highest rates of isostatic rebound, frequent tectonic uplift, and exceptional precipitation intensities, the landscape is transforming before our eyes, acting as a global bellwether for geographic change.

Drawing on examples from this dynamic environment, this presentation will explore the prospects for predicting geomorphic change, anticipating its consequences, and extracting lessons applicable to other regions.  Specifically we will identify regions where rapidly melting and thinning glaciers are likely to cause dramatic landscape changes, including drainage captures, fluvial redirection, landslide acceleration, and delta abandonment.  We will elaborate on the consequences of these plausible changes to ecosystems, human infrastructure, and natural hazards, and suggest the roles that models and scientists might play in anticipating these changes and communicating them to broader audiences.


How to cite: Grant, G., Higman, B. (., and Fasth, B.: Future Geographies:  The Shapes of Things to Come, EGU General Assembly 2026, Vienna, Austria, 3–8 May 2026, EGU26-4561, https://doi.org/10.5194/egusphere-egu26-4561, 2026.

EGU26-7646 | ECS | Posters on site | GM10.2

How does wood move on forested floodplains? Wood tracking in flume experiments of a forested river corridor 

Josie Welsh, Katherine Lininger, and Virginia Ruiz-Villanueva

Large wood (LW; >10 cm in diameter and >1 m in length) within river corridors – including channels and adjacent floodplains – plays a key role in shaping hydraulic conditions, sediment deposition and erosion, nutrient cycling, and habitat availability for aquatic and terrestrial species. Thus, to fully understand how a river system functions, we must understand when, how, and why LW is stored or transported. Most previous work on understanding LW dynamics in river systems has focused on LW behavior in channels, overlooking the possible importance of floodplains on how LW moves through these systems. Leveraging video datasets from a series of flume experiments on LW behavior in forested river corridors, we tracked LW piece movement to understand controls on LW trajectories and deposition patterns.

We analyzed of a set of 36 experiments conducted in a 4m wide by 10m long fixed bed flume at St. Anthony Falls Laboratory at the University of Minnesota. The flume represented a river corridor for a relatively steep, headwater stream in the central Rocky Mountains. These experiments explored variations in LW transport and deposition across a range of 4 floodplain forest stand densities, 2 overbank flood magnitudes and 2 LW transport regimes (the amount of LW added at one time). For each experiment, we dropped a total of 870 pieces into the channel at the head of the flume and observed where they were deposited. Using video data from the experiments, we developed a dataset of wood piece trajectories under different conditions. The videos were collected using four nadir-oriented GoPro cameras mounted above the flume surface. We orthomosaiced the video streams and stitched them together to form a single video covering the entire experimental surface at a resolution of 2mm/pixel and 24 frames/second. We then retrained and tested a python-based convolutional neural network (CNN) for real-time object detection and tracking called YOLO (You Only Look Once)  v11 (Redmon et al., 2016) on 2000 images of LW in the flume (70/30 train/test split). We ran this object detection model for each experiment, resulting in a dataset of LW trajectories for hundreds of LW pieces for each of the 36 experiments. We performed survival analysis on distances traveled by each piece using the Kaplan-Meier method to statistically assess how far LW pieces tended to travel in each experiment.

We present results of the survival analysis for each experiment compared across forest stand densities, flood magnitudes and transport regimes.  We found that sparser forests and larger overbank floods increased transport distances. Additionally, as each experiment progressed, there were changes in the distance traveled by pieces, likely due to the formation of jams that promoted wood deposition in specific locations. These analyses advance our understanding of how LW moves in forested river corridors by providing information at the wood piece level – something rare among LW studies. Additionally, these results will support future efforts to use IberWood (a 2D numerical model of river flow and LW transport) to connected channel-floodplain systems, improving tools used to inform river restoration and management.

How to cite: Welsh, J., Lininger, K., and Ruiz-Villanueva, V.: How does wood move on forested floodplains? Wood tracking in flume experiments of a forested river corridor, EGU General Assembly 2026, Vienna, Austria, 3–8 May 2026, EGU26-7646, https://doi.org/10.5194/egusphere-egu26-7646, 2026.

EGU26-8932 | Posters on site | GM10.2

140 years of river aggradation and incision following Euro-American settlement 

Andrew Wickert, Jimmy Wood, Phillip Larson, and Lawrence Svien

The Whitewater River and its tributaries, located in southeastern Minnesota, USA, received intensive geomorphic study starting in 1939. By this point, up to 4.5 meters of sediment buried the prior channel and floodplain. The culprit was agricultural intensification starting with Euro-American settlement around the year 1855. By converting forest and deep-rooted prairie into row crops and grazing land, these settler–farmers set the stage for gullying, erosion, and eventual infilling of the valley floor. Nearly 2000 probes down to the pre-settlement soil provide a ca. 1855 floodplain surface along 94 transect lines. Topographic surveys in 1939, 1965, and 1994 extend this record to about 140 years and the number of total transects to 107. We digitized primary historical sources, many of which existed only as paper records, and built a geospatially registered data set of valley-bottom topography. This data set reveals migrating waves of erosion and deposition over time scales long enough to observe how Earth's surface responds to human disturbance and shape our thinking about river dynamics in fluvial geomorphology.

How to cite: Wickert, A., Wood, J., Larson, P., and Svien, L.: 140 years of river aggradation and incision following Euro-American settlement, EGU General Assembly 2026, Vienna, Austria, 3–8 May 2026, EGU26-8932, https://doi.org/10.5194/egusphere-egu26-8932, 2026.

EGU26-9544 | ECS | Posters on site | GM10.2

Impacts of Barge as Flexible Infrastructure on Riverbed Morphology 

Antonija Harasti and Gordon Gilja

Sediment accumulation at river confluences can severely compromise fairway stability and navigation safety. To provide a non-invasive alternative to dredging, a novel low-water training concept based on “flexible infrastructure” has recently been introduced, using temporarily anchored, ballasted barges to locally modify flow conditions and induce targeted bed erosion. This study evaluates the morphodynamic influence of barge location at the confluence and identifies hydraulic conditions under which this approach is most effective. A three-dimensional numerical model was developed in FLOW-3D, to evaluate scour and deposition patterns around deployed barge. Hydraulic and sediment transport calibration was performed using in situ ADCP velocity measurements and bathymetric surveys collected over a 10-day low-flow period. A series of numerical experiments was conducted using identical geometric configurations while varying boundary conditions (flow velocity and water depth) over low, mean, and high flow conditions. This study analyze the relative influence of flow velocity, water depth, and flow contraction on the maximum local scour beneath the barge. Results indicate that flow contraction and velocity are the dominant controls on barge performance, while barge effectiveness becomes negligible under high-flow conditions associated with large water depths. These findings demonstrate that barges can serve as adaptable and environmentally low-impact infrastructure elements for localized sediment management.


Acknowledgements

This work has been funded in part by the iNNO SED project. This project has received funding from the European Union’s Horizon Europe research and innovation programme under grant agreement No. 101157360.

This publication uses information and/or outputs developed within the FAIRway Danube II project. The authors acknowledge the FAIRway Danube II consortium for making relevant datasets, methodologies, and results available

How to cite: Harasti, A. and Gilja, G.: Impacts of Barge as Flexible Infrastructure on Riverbed Morphology, EGU General Assembly 2026, Vienna, Austria, 3–8 May 2026, EGU26-9544, https://doi.org/10.5194/egusphere-egu26-9544, 2026.

Water resources are being heavily affected by armed conflicts, which worldwide have greatly increased in numbers. Rivers and floodplains are used as frontlines, while waters of reservoirs as weapons of war. Military actions on the territory of Ukraine have unprecedent effects on freshwaters and water infrastructure of the country caused by pollution, physical damage and placing of mines along river courses. Since 2022, several dams were destroyed along the Irpen, Oskil, and Inhulets rivers. The most dramatic, however, was a collapse of the Kakhovka dam on the Dnieper river on the 6th of June 2023. This war-induced dam destruction caused drainage of one of the Europe’s largest reservoirs, resulting in catastrophic flooding and pollution of the river, estuarine and Black Sea environments. Understanding impacts of such dam destructions during the war time is challenging due to restricted access to affected territories and limited field assessments.

Here I will introduce an innovative framework to assess short and long-term environmental and human-health related impacts of sudden dam destructions using the case of the Kakhovka Dam. Our framework combines results of pre- and post-destruction field surveys, numerical modelling and remote-sensing to outline spatial-temporal scales of the disaster and predicts trends in re-establishment of altered ecosystems. We highlight previously overlooked risks imposed by accumulations of heavy metals in exposed sediments of the former reservoir. Assessment of scenarios to mitigate the pollution and possible solutions are provided. Sudden dam destructions caused by warfare or extreme weather events can be well assessed by our framework, to effectively mitigate risks posed by aging dams around the world.

How to cite: Shumilova, O.: Understanding impacts of military dam destructions on river ecosystems: the case of Ukraine, EGU General Assembly 2026, Vienna, Austria, 3–8 May 2026, EGU26-10142, https://doi.org/10.5194/egusphere-egu26-10142, 2026.

EGU26-10435 | Posters on site | GM10.2

A GIS-based multi-criteria method for prioritizing river restoration in Portugal 

Marcelo Fernandes, Carlos Alexandre, Joana Boavida-Portugal, Bernardo Quintela, Sílvia Pedro, Sara Carona, Marta Ramalho, Esmeralda Pereira, Ana Rato, and Pedro Raposo de Almeida

River management is often driven by energy production, irrigation crops, and flood mitigation, largely enabled by widespread dam construction. However, river damming has brought severe environmental consequences for river dynamics, including morphological changes, hydrological regime, and interruption of the sediment cascade. These physical changes have profound impacts on the ecology of numerous fish species, particularly highly migratory ones, which, together with parallel drivers, led to an 85% reduction in world freshwater species populations since 1970. This work aims to provide a methodological framework for identifying priority rivers within the Portuguese strategy for improving river connectivity affected by obsolete dams and weirs under the European Nature Restoration Law.

The official fish dataset of the Portuguese Institute for Nature Conservation and Forests was first used, which included >20,000 occurrences for 61 fish species between 2010 and 2020. Each species was classified according to the following variables: species origin (native, exotic), conservation status (Critically Endangered, Endangered, Vulnerable, Near Threatened, Least Concern, Data Deficient, Not Evaluated), phenology (diadromous, potamodromous, resident), socioeconomic importance (very high, high, low significance), and endemism degree (Iberian or Lusitanian endemism). A score was attributed to each criterion, and the species index was calculated using Equation 1. Finally, to ensure functional connectivity to the ocean, we have included the lowermost segment of the main rivers up to the first insurmountable dam.

Equation 1: R = a · (0,25 · Xi + 0,40 · Xii + 0,20 · Xiii + 0,15 · Xiv)

Where the species index (R) resulted from the multiplication of the origin coefficient (α: species origin) with the weighted mean of the variables (Xi: conservation status; Xii: phenology; Xiii: socioeconomic importance; Xiv: endemism degree).

In parallel, hydrographic modelling was carried out using the Strahler model to ensure full representation of the Portuguese river network and a hierarchy adjusted to the sub-basin scale. The sub-basins were selected based on the 4th, 5th, 6th, and 7th Strahler hierarchies, and the excluded areas in the main river margins were included using the 8th hierarchy. For each sub-basin, the arithmetic mean of the species index was calculated within the Geographical Information System environment. The prioritization for river restoration was based on the upper quartile means for each hydrological region independently.

All rivers within the prioritized sub-basins were divided into segments according to the 3rd cycle of River Basin Management Plans and the Water Framework Directive, as provided by the Portuguese Environmental Agency. Each segment was classified according to water quality (chemical status and ecological quality), and segments were excluded if these criteria were simultaneously negative. At this stage, the Strahler 3rd-order streams connected to selected segments were included to guarantee ecological coherence in fluvial connectivity. The presence of a protected area (Natura 2000) and the density of transversal barriers were also evaluated. Finally, the national barrier dataset was updated using satellite imagery to identify new barriers.

In total, 77 rivers, encompassing ca. 6500 km at the sub-basin scale, were prioritized within the Portuguese strategy to improve river connectivity affected by obsolete dams and weirs.

How to cite: Fernandes, M., Alexandre, C., Boavida-Portugal, J., Quintela, B., Pedro, S., Carona, S., Ramalho, M., Pereira, E., Rato, A., and Raposo de Almeida, P.: A GIS-based multi-criteria method for prioritizing river restoration in Portugal, EGU General Assembly 2026, Vienna, Austria, 3–8 May 2026, EGU26-10435, https://doi.org/10.5194/egusphere-egu26-10435, 2026.

The Danube's discharge in the National Park is highly variable, influenced by Alpine snow and glacier melt as well as regional rainfall. Average flow typically ranges between 1,500 and 1,900 m³/s. Low flow levels can drop to 600–900 m³/s, while 100-year flood events can reach 8,500 – 11,000 m³/s. Due to climate change, there is an overall decreasing trend in growing season (April–September) streamflow, while winter volumes are slightly increasing due to changing precipitation patterns. Snowmelt-driven spring floods are occurring earlier, and often more pronounced, in the year due to reduced mountain snow storage. While major floods are rare due to regulation, extreme precipitation (like the 2002, 2013 or 2024 events) can cause rapid regional flooding with significant geomorphic effects.

The National Park contains the last major “free-flowing” stretch of the Danube in Austria (36 km), yet it faces significant structural and ecological challenges. A major deficit in bedload sediment from upstream dams causes the riverbed to deepen progressively. Management combats this by dumping gravel to stabilize the bed. Paradoxically, while the main bed level sinks, the floodplains (incl. present side arms) are rising due to overbank sedimentation, fragmenting vital floodplain habitats and increasing terrestrialization trends. Projects like "Dynamic Life Lines Danube" aim to foster complete side-arm reconnections to reactivate “natural” erosion and the renewal of aquatic habitats in the adjacent floodplains.

Within the EU-funded “DANube SEdiment Restoration (DANSER): Towards deployment and upscaling of sustainable sediment management across the Danube River basin”  project, the Danube Floodplain National Park section comprises an important pilot site in the “Upper Danube DEMO” region. One essential project task is to model the long-term hydro-geomorphic effects of different types of river(scape) management and restoration  efforts, such as the reconnection of side-arms. In this presentation, we will highlight the results of different scenario runs using the 2D landscape evolution model CAESAR-Lisflood. We will focus on complex hydro-geomorphic responses to various external (incl. management) and internal perturbations, with a particular focus on the effects of flooding and side-arm reconnections and related long-term consequences for lateral connectivity and riverscape evolution.

This research acknowledges support from the EU Projects HEU DANSER (grant agreement No 101157942)

How to cite: Recinos, S. and Pöppl, R.: Modelling riverscape evolution in the Danube Floodplain National Park (Austria) - Effects of flooding and side-arm reconnections on lateral connectivity and geomorphic change, EGU General Assembly 2026, Vienna, Austria, 3–8 May 2026, EGU26-16333, https://doi.org/10.5194/egusphere-egu26-16333, 2026.

EGU26-16644 | Posters on site | GM10.2

Geoinformation Tools in the Evaluation of River Renaturation Projects in the Czech Republic 

Jitka Elznicová, Dominik Brétt, Tomáš Matys Grygar, Jiří Rous, Vít Rous, Oto Weber, and Zbyněk Tačovský

Geoinformation tools (GIT) allow for the identification of historical and current riverbeds and previous anthropogenic interventions to river systems. Due to the decreasing costs of high-precision data acquisition and the necessary hardware, GIT has become a standard tool for monitoring the fluvial dynamics of watercourses.

Czech rivers have long been influenced by human activity. The most significant engineering interventions were carried out during the 20th century, driven by efforts to maximize agricultural land use and ensure flood protection. Over the past two decades, efforts to remediate these impacts have emerged on a small portion of Czech rivers, primarily in the form of "revitalization". This involves constructing new channels using more natural materials, such as stone instead of concrete

The Nature Restoration Regulation (NRR, adopted in June 2024) requires that by 2030, at least 25,000 kilometres of free-flowing rivers be restored in EU countries compared to 2020 levels. This requires identifying and removing artificial structures to restore the natural functions of watercourses and enhance sediment erosion and deposition. Most modifications to Czech rivers have focused on stabilizing flows and river banks, preventing flooding, enabling farming, and ensuring sustainable water use for human needs. However, those aims are not compatible with NRR's concept of free-flowing rivers. Recently, some "renaturation" projects have attempted to restore river dynamics and functions in the Czech Republic. These projects remain in the minority due to the societal inertia of over a century of engineering approaches and restrictions on river dynamics.

This contribution presents several examples of recent renaturation projects in the Czech Republic. The first examples are innovative projects on three-kilometre-long sections of two headwater streams in the Ore Mountains. From 2009 to 2010, the previously channelized stream was reconstructed in a meandering pattern following former revitalisation strategy. The recent renaturation project in this area began in August 2023 and ended in April 2024. It began with the decommissioning and backfilling former, deeply incised, artificial channels to allow the water to create its own paths and to support of a self-evolving channel - an approach fully compatible with NRR objectives. Another project was implemented on a five-kilometre section of a Czech lowland river. There, an embankment was transformed into near-natural banks with artificial channel bars and side arms.

We used a LiDAR-equipped drone to generate digital terrain models (DTMs) and a full-frame camera to produce high-resolution orthomosaics to monitor the restoration of channel dynamics. We subsequently used this data for morphological and hydrological analyses by the ArcGIS (Esri) software. Field surveys were also conducted. To evaluate the restoration of channel dynamics, the headwater streams were monitored four times a year for two years, and the lowland river was monitored three times a year for two years. The monitoring demonstrated success with renaturation of the headwater streams. However, the modifications to the lowland river were more robust, so significant channel dynamics did not manifest within the two-year evaluation period. The results show viable pathways to meet the NRR requirements.

How to cite: Elznicová, J., Brétt, D., Matys Grygar, T., Rous, J., Rous, V., Weber, O., and Tačovský, Z.: Geoinformation Tools in the Evaluation of River Renaturation Projects in the Czech Republic, EGU General Assembly 2026, Vienna, Austria, 3–8 May 2026, EGU26-16644, https://doi.org/10.5194/egusphere-egu26-16644, 2026.

EGU26-19914 | Orals | GM10.2

Hydraulic effects of channel realignment and floodplain reconnection in a headwater stream 

Matthew Perks, Nick Barber, George Heritage, Jess Knaggs, Sim Reaney, Hannah Runeckles, Neil Williams, Duncan Wishart, and Rebecca Powell

Channel realignment and floodplain reconnection are increasingly used as nature-based solutions for flood management, yet their hydraulic effects remain poorly quantified in field settings. This study examines the impact of such interventions on hydraulic response in a headwater catchment, Goldrill Beck, Cumbria, UK. Here, 1-km of a historically engineered and confined single-thread channel was restored to a more geomorphically complex system. Using a combination of hydrological observational data spanning pre- and post-realignment conditions and two-dimensional hydraulic modeling (LISFLOOD-FP), changes in key hydraulic metrics (flood wave transmission and celerity, reach-scale hysteresis, and peak flow attenuation) were assessed. Results indicate that realignment increased flood wave travel time (median transmission time increased from 15 to 40 min), reduced flow celerity, and altered hysteresis patterns, suggesting enhanced in-channel and floodplain storage under low to intermediate flow conditions. Realignment also improved the diversity of flow biotopes and aquatic habitats, whilst increasing the wetted area by 47%. However, during more extreme events, transmission times decreased, and peak discharge was slightly elevated, highlighting limitations in attenuation potential for large floods. The findings contribute to the evidence base for renaturalisation of watercourses for flood mitigation, emphasizing the role of valley morphometry, channel morphology, and floodplain roughness in influencing hydraulic responses.

How to cite: Perks, M., Barber, N., Heritage, G., Knaggs, J., Reaney, S., Runeckles, H., Williams, N., Wishart, D., and Powell, R.: Hydraulic effects of channel realignment and floodplain reconnection in a headwater stream, EGU General Assembly 2026, Vienna, Austria, 3–8 May 2026, EGU26-19914, https://doi.org/10.5194/egusphere-egu26-19914, 2026.

Long profiles of alluvial rivers are sensitive to changes in water discharge (Qw) and sediment supply (Qs), both of which depend on local climatic and tectonic conditions. Consequently, changes in prevailing environmental boundary conditions impact the adjustment of river long profiles. Rivers respond through modifications in channel slope, either by steepening via sediment deposition supplied from upstream or by lowering through bed incision driven by sediment entrainment.  The time of river long-profile adjustment is commonly estimated using a range of equations derived from models of river evolution. While these formulations are widely applied, they do not distinguish between incision and aggradation and hence predict similar response times, despite these adjustments being governed by different physical processes. As a result, it remains unclear whether incision and aggradation operate on different characteristic timescales of slope adjustment. Given the increasing number of rivers with artificially fixed channel width due to anthropogenic activities, we focus here on the response of fixed-width rivers to changes in boundary conditions. Based data from analogue flume experiments, we investigate how the type of adjustment, i.e., incision or aggradation, affects the response time of slope adjustment of fixed-width rivers to changes in water discharge (Qw) and sediment supply (Qs). Across the experiments, we systematically vary water discharge (Qw), sediment supply (Qs) and grain size, while continuously recording the evolution of the channel slope. Response times are quantified using e-folding fits. We further explore the potential of estimating response times using an Ornstein—Uhlenbeck framework. While both approaches assume exponentially fast adjustment towards new boundary conditions, the Ornstein--Uhlenbeck formulation explicitly incorporates stochastic variability, accounting for model uncertainty and natural slope fluctuations. This makes it a robust alternative for characterizing slope adjustment dynamics. Preliminary results indicate a power-law relationship between steady-state channel slope in and the Qs/Qw ratio, consistent with previous studies. Moreover, the time of slope adjustments increases with the volume of material that has to be eroded or deposited to reach the new long profile. Furthermore, both water discharge (Qw) and sediment supply (Qs) seem to act as catalyst, exerting a primary control on the rate of the slope adjustment in the sense that for fixed Qs/Qw ratio the rate scales positively with an increase in (Qw), implying an increase in (Qs) to retain the ratio Qs/Qw, and vice versa an increase in (Qs). Fluvial systems shape our landscapes. Consequently, characterizing the time of river long-profile adjustment allows for accurate predictions of landscape evolutions, and we expect our results to provide new meaningful insights in that regard.

How to cite: Tiepner, A.: Response times of fixed-width rivers to changes in boundary conditions: Incision vs Aggradation, EGU General Assembly 2026, Vienna, Austria, 3–8 May 2026, EGU26-20733, https://doi.org/10.5194/egusphere-egu26-20733, 2026.

River management and restoration increasingly aim to create resilient rivers capable of adjusting to future environmental uncertainty. However, centuries of channel modification and floodplain disconnection have severely reduced river resilience. Valley-floor reset is a novel restoration approach that involves infilling existing channels and regrading the floodplain to re-establish hydrogeomorphic processes across the valley floor. By effectively resetting river–floodplain morphology, this approach is hypothesised to restore the capacity of rivers to evolve and adapt to changing input drivers. This study investigates the geomorphic and hydrologic responses of rivers to valley-floor reset restoration, focusing on the River Aller (UK), one of the first valley-floor reset restoration schemes implemented in Europe. Restoration transformed an incised, single-thread river into a wide, multi-thread river–wetland corridor by reconnecting channels to floodplains at low flows. Water storage increased by 1,156%, while the water table elevation rose across the valley floor by an average of 0.8 m. Subsequent geomorphic evolution has included channel development and sediment sorting, creating a mosaic of river and wetland habitats. The results demonstrate that reconnecting rivers to their floodplains at low flows can fundamentally alter the functioning of heavily modified rivers, shifting them from efficient linear drainage systems to laterally connected river-wetlandscapes, and offering a promising strategy for adapting rivers to a changing climate.

How to cite: Mason, R.: Adapting rivers to a changing world: Can restoration ‘reset’ riverscapes and increase resilience?, EGU General Assembly 2026, Vienna, Austria, 3–8 May 2026, EGU26-21427, https://doi.org/10.5194/egusphere-egu26-21427, 2026.

Hydrological signatures (HS) have proven to be highly effective in calibrating physically-based hydrological models, enhancing their process consistency. However, their integration into parameter optimization for deep learning (DL)-based hydrological models has been limited. To address this gap, we propose a novel HS-informed framework that dynamically integrates hydrological signatures into DL parameterization through a multi-task learning approach. This study evaluates the impact of HS integration on model performance using a large-scale, global hydrological dataset. The HS-informed model achieved a significant performance improvement, with a median Nash-Sutcliffe Efficiency (NSE) of 0.739, compared to 0.666 for the baseline model across the test set. Notably, the most pronounced improvements in NSE were observed in hydrologically complex basins, including baseflow-dominated (+0.135), drought-prone (+0.148), and flood-prone basins (+0.159). Sensitivity analysis further revealed that the HS-informed model could leverage extended historical input data (over 120 days) to sustain robust performance (median NSE of 0.715) over a 30-day forecast period. Shapley Additive Explanations (SHAP) analysis highlighted two key mechanisms underlying these improvements: the enhanced recognition of long-term hydrological patterns through improved memory and a better representation of catchment heterogeneity by emphasizing non-climatic attributes. These findings demonstrate that integrating hydrological signatures offers a superior approach to traditional point-error-based calibration in AI-driven hydrological modeling.

How to cite: wang, Z., li, C., and cui, P.: A Novel Hydrological Signature-Informed Framework for Enhancing Extreme Streamflow Prediction Using Multi-Task Learning, EGU General Assembly 2026, Vienna, Austria, 3–8 May 2026, EGU26-2556, https://doi.org/10.5194/egusphere-egu26-2556, 2026.

EGU26-3383 | PICO | NH1.3

Groundwater Flooding: Developing an approach to risk assessment and communication 

Gabriele Chiogna and Beatrice Richieri

The increasing frequency of extreme weather events is drawing attention to groundwater flooding, which is caused by rising groundwater levels and can result in significant damage to infrastructure, buildings, and the environment. Unlike fluvial or pluvial flooding, groundwater flooding is difficult to detect and not easily managed with traditional protective measures. Numerical models—particularly probabilistic approaches such as Bayesian inference—help to better quantify uncertainties in modeling and forecasting. Flood risk maps are essential for managing groundwater flooding; however, precise uncertainty analyses are often lacking. Citizen science and low-cost sensors can also contribute by bridging data gaps and encouraging public participation. This study presents a framework for assessing vulnerability to groundwater flooding that accounts for uncertainties and generates probabilistic maps. Using a case study from Garching in 2023, it demonstrates how modeling tools can be effectively utilized. Finally, the study suggests expanding monitoring tools and citizen engagement to strengthen risk communication, raise awareness, and better integrate groundwater flood protection measures.

How to cite: Chiogna, G. and Richieri, B.: Groundwater Flooding: Developing an approach to risk assessment and communication, EGU General Assembly 2026, Vienna, Austria, 3–8 May 2026, EGU26-3383, https://doi.org/10.5194/egusphere-egu26-3383, 2026.

EGU26-4172 | ECS | PICO | NH1.3

Global–regional integrated subseasonal forecasts of soil moisture drought 

Quan Zhang and Xiaomeng Huang

Soil moisture is a core element in shaping land–atmosphere interactions, playing a critical role in ecosystem functioning and sustaining water resources for human use. However, existing approaches, including numerical and AI-based methods, still suffer from notable limitations in soil moisture forecasting. In this study, we develop a novel AI-based soil moisture forecasting model (ASM), which is capable of providing low-resolution global forecasts and high-resolution regional forecasts of soil moisture at the subseasonal timescale. ASM consistently outperforms other representative state-of-the-art AI models across all forecast lead times. Compared with ECMWF, ASM is closer to the ground truth, and better preserve finer-scale spatial details. For regional predictions, ASM produces reliable high-resolution subseasonal soil moisture forecasts for two drought-prone regions selected as case studies: Southern Africa and Henan Province, China.

How to cite: Zhang, Q. and Huang, X.: Global–regional integrated subseasonal forecasts of soil moisture drought, EGU General Assembly 2026, Vienna, Austria, 3–8 May 2026, EGU26-4172, https://doi.org/10.5194/egusphere-egu26-4172, 2026.

EGU26-5267 | ECS | PICO | NH1.3

Changing flood-generating mechanisms and their impacts on flood characteristics in snow-dominated catchments 

Xinli Bai, Wenbin Liu, Hong Wang, Yao Feng, and Fubao Sun

Global warming is altering snowmelt dynamics and flood generating mechanisms, yet their compound effects on cold-region floods remain unclear. Here, we investigate flood mechanism transitions and their drivers across 424 Northern Hemisphere snow-dominated catchments. Through comparative analysis, we pinpoint the specific impacts of these shifts on flood characteristics. Our results indicate that 48.3% of the catchments have undergone a snowmelt-to-rainfall transition in flood generating mechanisms. While this has not systematically altered long-term flood magnitude trends, it has significantly steepened the flood rising limb. Furthermore, although rising temperatures have advanced the timing of snowmelt and rain-on-snow floods, the shift toward rainfall dominance has largely offset this trend, leading to a stronger synchronization between flood timing and extreme precipitation. These findings offer critical insights for flood forecasting and water management in snow-dominated regions.

How to cite: Bai, X., Liu, W., Wang, H., Feng, Y., and Sun, F.: Changing flood-generating mechanisms and their impacts on flood characteristics in snow-dominated catchments, EGU General Assembly 2026, Vienna, Austria, 3–8 May 2026, EGU26-5267, https://doi.org/10.5194/egusphere-egu26-5267, 2026.

EGU26-5280 | PICO | NH1.3

Mapping global floodplain development disparities highlights drivers underlying intensifying flood losses 

Zhiyang Lan, Wenbin Liu, Tingting Wang, and Fubao Sun

Floodplains attract disproportionate concentrations of population and economic activity globally, yet the systemic flood risks emerging from this uneven development remain poorly characterized. Through a global analysis spanning 2000-2020, we quantify floodplain development patterns and associated flood losses across nations with varying income levels and flood protection capacities. Our results reveal that floodplains have experienced faster growth than non-floodplains in both population density and GDP density. These trends diverge sharply by income and protection levels: floodplain population density growth rates in low- and lower-middle-income countries outpaced those in high-income nations by factors of 2.33 and 7.58, respectively. Similarly, due to levee effect, regions with flood protection capacity of 100 years or more experienced GDP density growth that was 4.51 times higher than in regions with less than 10-year protection. The heightened sensitivity of flood losses to socio-economic growth stems from uneven floodplain development. This creates a divergent risk pattern: wealthier, well-protected regions accumulate greater economic assets at risk, whereas poorer, under-protected areas face the compounded burden of exposure to both population and GDP risks. Our findings highlight the urgent need for flood risk adaptation strategies that explicitly consider and address underlying floodplain socio-economic inequalities in exposure and protection.

How to cite: Lan, Z., Liu, W., Wang, T., and Sun, F.: Mapping global floodplain development disparities highlights drivers underlying intensifying flood losses, EGU General Assembly 2026, Vienna, Austria, 3–8 May 2026, EGU26-5280, https://doi.org/10.5194/egusphere-egu26-5280, 2026.

EGU26-5997 | ECS | PICO | NH1.3

Cascading propagation of subseasonal droughts across the land-atmosphere system 

Sudhanshu Kumar and Di Tian

Droughts are commonly classified into meteorological, agricultural, hydrological, and ecological types, yet how these categories interact dynamically and propagate across space and time at subseasonal scales remains poorly understood. Here we show that subseasonal droughts propagate as directional, cascading processes across the land-atmosphere system. We develop an event-based analytical framework using event coincidence analysis to identify subseasonal drought events as sustained extremes in precipitation-evapotranspiration balance, soil moisture, runoff, and vegetation condition across the contiguous United States from 1982 to 2025, using satellite observations and land data assimilation system simulations. We find robust lead-lag relationships and coherent propagation pathways in which meteorological droughts systematically precede agricultural, hydrological, and ecological droughts across space and time. Event coincidence analysis identifies statistically significant drought sources and sinks and their time-lagged directional dependencies, allowing directional propagation patterns to be traced across drought types and regions. We find consistent cross-type drought transitions in several climate-sensitive regions (for example, SPEI → soil moisture → NDVI in the Southern Plains), with meteorological droughts typically preceding agricultural and ecological impacts by several weeks and with variable amplification along the transition. Linking these propagation pathways to near-surface temperature, wind fields, and 850-hPa geopotential height shows that large-scale atmospheric circulation modulates timing and intensity of cross-type drought cascades. These findings show that subseasonal drought evolution is governed by directional temporal cascades and by coherent spatial propagation pathways across the land-atmosphere system, indicating non-local controls and distinct temporal signatures.

How to cite: Kumar, S. and Tian, D.: Cascading propagation of subseasonal droughts across the land-atmosphere system, EGU General Assembly 2026, Vienna, Austria, 3–8 May 2026, EGU26-5997, https://doi.org/10.5194/egusphere-egu26-5997, 2026.

Flash droughts (FDs) are characterized by their rapid onset, but their societal and agricultural impacts depend critically on the duration of anomalous moisture stress. While the land–atmosphere processes governing FD initiation have been widely studied, the role of subsurface water storage in regulating persistence and recovery remains poorly constrained. Groundwater depth serves as the primary regulator of drought propagation. Rather than treating groundwater as a passive reservoir, this research investigates its active role in the initiation and subsequent evolution of FDs. We investigate how groundwater storage either dampens flash-drought intensification via upward moisture flux or catalyzes the evolution of these events into major hydrological crises. Our approach determines the precise influence of the water table on the intensification and multi-seasonal persistence of FD events. We utilize groundwater-level observations from the Central Ground Water Board of India, spanning 1996 – 2023, to construct seasonal groundwater depth fields (0.25° resolution) for pre-monsoon, monsoon, and post-monsoon conditions. FD events are identified using a gridded catalog derived from the Standardized Evaporative Stress Ratio (SESR). Our analysis will employ contingency-based statistical tests (χ²) and survival-type hazard analysis to quantify the probability of drought termination as a function of categorized water-table depths (shallow, intermediate, and deep). Spatial block-bootstrapping will be applied to account for regional spatial dependencies. We aim to identify critical groundwater depth thresholds beyond which the probability of flash-to-hydrological drought transition increases significantly. This work provides a new perspective on groundwater as a modulator of drought evolution in monsoon-dominated, groundwater-stressed environments.

How to cite: Vidushi, V. and Syed, T. H.: Groundwater Depth as a Control on Flash-Drought Dissipation Versus Hydrological-Drought Development in India, EGU General Assembly 2026, Vienna, Austria, 3–8 May 2026, EGU26-6210, https://doi.org/10.5194/egusphere-egu26-6210, 2026.

EGU26-6318 | ECS | PICO | NH1.3

Exploring neighbourhood effects of farm-level drought adaptation on groundwater extremes with a coupled agent-based and hydrological model  

Lars De Graaff, Maurizio Mazzoleni, Marthe L.K. Wens, Claudia C. Brauer, and Anne F. Van Loon

Increasingly frequent and severe droughts pose substantial risks to agricultural water systems globally. Farmers can mitigate drought impacts through on-farm adaptation strategies, such as reducing drainage or increasing groundwater retention. However, the feedback between farmers’ adaptive behaviour and groundwater dynamics remains poorly understood. To address this gap, we developed an agent-based model to evaluate how individual farmers’ adaptation decisions influence local and regional groundwater systems. The model couples farmer decision-making, grounded in protection motivation theory, with the hydrological dynamics of the eastern Netherlands simulated using the WALRUS hydrological model. We ran scenarios based on different climate conditions and land use configurations to assess the effects of adaptation behaviour. Our findings show that farmers with adaptation measures experience substantially less drought damage associated with low groundwater levels during moderate droughts (65% reduction), but these measures are less effective during extreme droughts (13% reduction). Farmers who adopt these measures also experience slightly increased damage during wet periods, indicating a higher risk of waterlogging. Importantly, both benefits and drawbacks extend beyond the farm scale, affecting groundwater levels of both adapting and non-adapting farmers in the area. Ongoing work explores the spatial distribution of these effects in more detail to better understand the neighbourhood effects for both social and hydrological dynamics. The findings of our study can be used to support strategies that minimise trade-offs between groundwater extremes through both individual and collective adaptation. 

How to cite: De Graaff, L., Mazzoleni, M., Wens, M. L. K., Brauer, C. C., and Van Loon, A. F.: Exploring neighbourhood effects of farm-level drought adaptation on groundwater extremes with a coupled agent-based and hydrological model , EGU General Assembly 2026, Vienna, Austria, 3–8 May 2026, EGU26-6318, https://doi.org/10.5194/egusphere-egu26-6318, 2026.

EGU26-6478 | ECS | PICO | NH1.3

Exploring human-groundwater feedbacks in the Dutch agricultural context under climate extremes using an agent-based model 

Jose David Henao Casas, Lars De Graaff, Marjolein Van Huijgevoort, Ype Van Der Velde, and Anne Van Loon

In recent years, the Netherlands has experienced extreme climatic events, including droughts in 2018 and 2022 and record-breaking wet years, such as 2024. These events are prompting a paradigm shift among water managers and users from rapidly draining water to holding it when possible to mitigate dry years, while maintaining the capacity to deal with floods. This research aims to examine how water users' decisions to adapt to drought can influence the water system, and vice versa, while accounting for trade-offs with flood risk. We address this research question using an agent-based model (ABM) based on a small agricultural catchment (Hupsel, ~1,400 ha) in which dairy farming is the predominant land use. The ABM has two main components: 1) the hydrological system; and 2) the human decision-making system. The hydrological system focuses on shallow groundwater and surface water, represented by a MODFLOW model that includes drainage and surface water networks, a single-layer sandy aquifer, and different land use types via the unsaturated zone flow (UZF) package. In the human decision-making system, farmers can decide among different adaptation options to drought based on the protection motivation theory: 1) adopt groundwater irrigation; 2) retain water in ditches to enhance recharge; 3) remove drains or ditches to enhance recharge further; and 4) change crops to less water-demanding ones. Results focused on irrigation indicate that consecutive years of drought lead to higher irrigation adoption, which, in turn, depletes the aquifer and makes the water system more sensitive to dry spells. ABMs are a valuable tool to explore the feedback between humans and the water system in a spatially explicit way, moving beyond the usual representation of anthropogenic interventions as model boundary conditions.

How to cite: Henao Casas, J. D., De Graaff, L., Van Huijgevoort, M., Van Der Velde, Y., and Van Loon, A.: Exploring human-groundwater feedbacks in the Dutch agricultural context under climate extremes using an agent-based model, EGU General Assembly 2026, Vienna, Austria, 3–8 May 2026, EGU26-6478, https://doi.org/10.5194/egusphere-egu26-6478, 2026.

EGU26-6507 | ECS | PICO | NH1.3 | Highlight

Resident Adaptation Patterns Under the Influence of Global Flood Evolution 

Ning Wang

Global warming has significantly altered the spatiotemporal distribution of floods, leading to substantial variations in human adaptation patterns. Identifying the potential drivers of these changes and the underlying mechanisms of disaster adaptation is essential for formulating effective flood risk strategies. Based on observed streamflow records from 9,531 hydrological stations and data from 910 major flood events worldwide, this study reveals that most regions globally exhibit synchronized trends in drought and flood flows, with 28.14% showing a simultaneous increase and 33.36% showing a simultaneous decrease. To mitigate flood risk, residents in 53% of countries—most notably in the Middle East—demonstrate a tendency to migrate away from flood-prone areas. This retreat has significantly reduced flood-related mortality and forced displacement. Conversely, in regions with robust flood protection infrastructure, residents tend to maintain shorter migration distances. Further analysis of the drivers behind floodplain migration indicates that in developing nations, flood-induced mortality and displacement are the primary catalysts for relocation. In these contexts, the psychological memory of destruction or the urgent need for resources often compels residents to either flee or, paradoxically, migrate toward flood-prone zones. Under climate-driven pressures, the extent of flood inundation is a more significant determinant of migration patterns in regions such as Australia. Notably, in countries like the Philippines and Kenya, the mitigation of compound drought-flood extremes has encouraged further settlement in flood-prone areas, highlighting the complexity of multi-hazard interactions. This study systematically deciphers the mechanisms underlying flood adaptation strategies and attributes their primary drivers, providing a robust scientific framework for enhancing flood risk management and regional resilience.

How to cite: Wang, N.: Resident Adaptation Patterns Under the Influence of Global Flood Evolution, EGU General Assembly 2026, Vienna, Austria, 3–8 May 2026, EGU26-6507, https://doi.org/10.5194/egusphere-egu26-6507, 2026.

EGU26-7681 | ECS | PICO | NH1.3

Linking pre-event hillslope-channel connectivity to its geomorphic response during an extreme rainfall event: insights from the 2020 Gloria storm in the Tordera River basin (NE Spain) 

Noemi Jacobo-Quiñones, Marta Guinau, Clàudia Abancó, David García-Sellés, José Andrés López-Tarazón, Ignacio Zapico, Mar Tapia, Marta González, and Jordi Pinyol

Intense rainfall events often trigger landslides and torrential flows, which are not only hazardous processes on their own, but can also generate cascading hazards through sudden and massive sediment delivery to river networks. Slope processes are therefore key drivers of geomorphic change in mountainous catchments, enhancing hillslope-channel connectivity and promoting rapid channel reorganisation. In light of the above, it is essential to characterise structural and functional connectivity (Heckmann et al., 2018), as well as geomorphic organisation before and after intense precipitation events, to better evaluate flood hazards and associated risks. Against this background, the January 2020 Gloria storm affected the Tordera River basin (Catalonia, NE Spain), where more than 480 mm of rainfall was recorded over 96 hours, with 24-hour accumulation over 200 mm, causing widespread sediment mobilisation and channel changes, as well as significant damage due to flooding and landslides.

In this study, we aim to evaluate: 1) how pre-event hillslope-channel connectivity influences the geomorphic response to extreme floods and the post-event geomorphic changes through an integrated analysis of the index of connectivity (IC); 2) the spatial distribution patterns of erosion and sedimentation through the geomorphic mapping of the active riverbed and sediment bars (both active and stable), before and after the Gloria storm, and the existing inventory of landslides caused by the event. High-resolution DTMs (Digital Terrain Models) were generated from airborne LiDAR surveys conducted in 2011, 2016, and 2023. The IC was derived from a pre-event DTM to characterise structural sediment connectivity following Cavalli et al. (2013), while erosion and sedimentation processes were quantified using the difference between DTMs (DTMs of Difference, DoDs) for pre-event (2016-2011) and post-event (2023-2016) periods. GIS-based geomorphic mapping of active channels and sediment bars before and after Gloria was used to assess event-scale channel reorganisation.

Preliminary results indicate a clear spatial correspondence between pre-event connectivity patterns and the magnitude of the geomorphic change observed during that extreme flood. Areas characterised by high pre-event erosion rates, identified from 2016-2011 DoDs, largely coincide with sectors where numerous landslides were triggered during the Gloria storm. High connectivity values also correspond to areas dominated by erosion and deposition in the 2016-2011 DoDs, highlighting the role of pre-event structural connectivity in conditioning sediment transfer pathways. Furthermore, active bars mapped after the event predominantly overlap with areas affected by pre-event erosion, whereas bars that remained stable during the storm are mainly associated with zones characterised by pre-event deposition. The active channel also experienced noticeable widening during the event, while the majority of vegetated bars that were stable before Gloria remained stable throughout the storm, reinforcing the link between pre-event geomorphic organisation and flood response. These findings highlight the importance of pre-event structural connectivity in controlling geomorphic response during extreme rainfall events, providing valuable insight for hazard assessment and river management.


Cavalli, M. et al.  (2013). Geomorphometric assessment of spatial sediment connectivity in small Alpine catchments. Geomorphology188, 31-41.

Heckmann, T. et al.  (2018). Indices of sediment connectivity: opportunities, challenges and limitations. Earth-Science Reviews187, 77-108.

How to cite: Jacobo-Quiñones, N., Guinau, M., Abancó, C., García-Sellés, D., López-Tarazón, J. A., Zapico, I., Tapia, M., González, M., and Pinyol, J.: Linking pre-event hillslope-channel connectivity to its geomorphic response during an extreme rainfall event: insights from the 2020 Gloria storm in the Tordera River basin (NE Spain), EGU General Assembly 2026, Vienna, Austria, 3–8 May 2026, EGU26-7681, https://doi.org/10.5194/egusphere-egu26-7681, 2026.

Kerala, on the windward side of the Western Ghats in southern India, receives about 3000 mm of annual rainfall under a tropical monsoon climate, driven by orographic south-west monsoon rainfall. The state has a high population density of about 859 persons per square kilometre and a limited geographical extent, with settlements concentrated in river valleys and downstream of reservoirs. These physiographic and socio-hydrological conditions make flood events critically important from both hydrological and societal perspectives. The catastrophic flood of 2018 further emphasized the need for an updated hydrological reassessment of existing dams and their spillway performance, and reservoir rule curves in Kerala.
Kerala has 53 large dams, of which 30 dams distributed across nine river basins are analysed in this study. The selected catchments are characterized by short hydrological response lengths and steep terrain, with longitudinal bed slopes ranging from 20 to 80 m km⁻¹. The Western Ghats rise sharply from near sea level to elevations of approximately 2500 m, promoting intense orographic rainfall, short travel times, and rapid runoff concentration. For the 30 dam catchments, the Time of Concentration (Tc) varies between 0.7 and 5 h, indicating fast-rising floods with minimal natural attenuation. Several catchments exhibit high hydrological response, with specific flood exceeding 13 m³ s⁻¹ km⁻². Most dams are located within 100 km of the Arabian Sea coastline and occur in serial or cascade arrangements along the same river valleys, a configuration that is hydrologically relevant for upstream–downstream flood interactions.
The study reassesses the Inflow Design Flood (IDF) and spillway adequacy of the selected dams. Of the 30 projects, 20 dams were completed before 1985, before the Bureau of Indian Standards (BIS) issued Indian Standard IS 11223:1985, which formally introduced IDF categories such as the Probable Maximum Flood (PMF), Standard Project Flood (SPF), and 100-year flood. In projects commissioned before 1985, spillway capacities were generally fixed using prevailing hydrological practices, limited storm data, and engineering judgment.
In the present reassessment, IDF estimation is carried out in accordance with BIS guidelines using a hydro-meteorological approach, and unit hydrograph parameters are derived from the Flood Estimation Report. Storm parameters are derived from the Probable Maximum Precipitation (PMP) Atlas for the West-Flowing Rivers of the Western Ghats, published by the India Meteorological Department (IMD) and the Central Water Commission (CWC), which compiles major historical storm events from 1905 to 2010. The revised design floods are compared with existing spillway capacities, and the analysis also examines relationships with Tc, gross storage, specific flood, and year of dam completion.
Results indicate that 26 out of the 30 dams show spillway inadequacy under the revised IDF. In several projects, design flood exceedance exceeds 200%, and in some cases, reaches more than 300%. Spillway inadequacy is more frequent in short-response catchments with lower Tc and higher specific flood values. This study offers a comparative hydrological perspective for steep tropical catchments in Kerala. It may support an informed, evidence-based reassessment of existing dams using updated datasets and contemporary analytical practices for prioritization of dam safety.

How to cite: Issac, I., Sen, S., and Goel, N. K.: Design Flood Revisions and Spillway Adequacy in Steep Tropical Catchments: A Multi-Dam Reassessment from Kerala, India , EGU General Assembly 2026, Vienna, Austria, 3–8 May 2026, EGU26-7809, https://doi.org/10.5194/egusphere-egu26-7809, 2026.

EGU26-8602 | PICO | NH1.3

Biophysical impacts of Earth greening modulate average and extreme water availability 

Ziwei Li, Wenbin Liu, Tingting Wang, and Fubao Sun

Surface water availability (WA), defined as precipitation minus evapotranspiration, is affected by changes in vegetation structure. These biophysical impacts can alter the distribution of water availability, shifting both its average and extreme values, while the divergence is not yet quantified. Using long-term remote sensing observations, our analysis reveals that increases in leaf area index (LAI) lead to a widespread decline in average water availability, with a global reduction of -2.11 mm/month m2 m-2. Additionally, we show that in humid regions, extreme water availability—represented by the 15th and 85th percentiles of water availability from 2001 to 2020—exhibits stronger sensitivity to LAI variations than average water availability. Overall, the fraction of variance in low water availability explained by greening is minimal (-2.7%), followed by average water availability (6.8%), while high water availability exhibits the largest fraction (-23.6%).

How to cite: Li, Z., Liu, W., Wang, T., and Sun, F.: Biophysical impacts of Earth greening modulate average and extreme water availability, EGU General Assembly 2026, Vienna, Austria, 3–8 May 2026, EGU26-8602, https://doi.org/10.5194/egusphere-egu26-8602, 2026.

Extreme precipitation events have caused obvious damage to human environments and socioeconomic systems. However, the changes in extreme precipitation and their underlying causes remain unclear. This study analyzed daily precipitation data from 2,254 meteorological stations across China from 1981 to 2018, focusing on two key extreme precipitation indicators: Max 1-day precipitation amount (Rx1day) and Max 5-day precipitation amount (Rx5day). Trend analysis was conducted for 17 river basin divisions using the Mann-Kendall method. We also applied the field significance test, a statistical method to evaluate whether a spatial pattern of locally significant results, to determine whether observed trends at individual stations were statistically significant or due to random variation. The results showed that 59.3% and 58.6% of the stations exhibited increasing trends in Rx1day and Rx5day, respectively, with significant trends identified at 5.4% and 4.1% of the stations. The field significance test revealed a significant increasing in Rx1day across China at the 5% significance level. Among the 17 sub-basins, significant increases in extreme precipitation were observed in the Inland rivers of Xinjiang and Northern Tibet. The result was consistent with the warming and humidification trends in northwest China. We further analyzed the relationship between urbanization and extreme precipitation by using population density to distinguish rural and urban stations. We found that the spatial distribution of urban stations closely overlapped with stations experiencing increased extreme precipitation, while rural stations corresponded with those showing a decrease. With the progress of urbanization, variations in the trends observed at urban and rural stations have emerged. Nevertheless, urban stations exerted a more pronounced influence on the increasing trend of extreme precipitation.

How to cite: Wu, L.: Urbanization influence on changes of extreme precipitation in mainland China, EGU General Assembly 2026, Vienna, Austria, 3–8 May 2026, EGU26-9087, https://doi.org/10.5194/egusphere-egu26-9087, 2026.

EGU26-9856 | ECS | PICO | NH1.3

ENSO impacts on flood risk and insurance claims in the United States: a machine learning approach 

Konstantinos-Christofer Tsolakidis, Konstantinos Papoulakos, Nikolaos Tepetidis, Theano Iliopoulou, Panayiotis Dimitriadis, Dimosthenis Tsaknias, and Demetris Koutsoyiannis

This research investigates the influence of the El Niño–Southern Oscillation (ENSO) on extreme flood events in the United States and its potential connection to flood insurance claims from the National Flood Insurance Program (NFIP). Given the recently observed increase in the frequency of extreme weather events, this study aims to quantify the correlation between ENSO indicators and recorded economic losses at state and county levels across the USA. Emphasis is particularly placed on the state of California, which is highly sensitive to El Niño events.

The methodology is based on the integration of multiple datasets, including ENSO indices from NOAA, US-CAMELS streamflow data, COBE sea surface temperature (SST), digital elevation models (DEM), National Hydrography Dataset (NHD), OpenStreetMap (OSM), and US Census data. From these datasets, geospatial and physical features were extracted, such as hydrographic and road network density, mean elevation, distance to the coastline, county centroid coordinates, and population. These features were analyzed using statistical tools, including the Pearson correlation coefficient and Threshold Exceedance Analysis, applied across multiple percentile showing thresholds (90–99%).

In addition, a machine learning model was developed to predict flood insurance claims per 100,000 residents. The results indicate that correlations between ENSO indices and streamflow data are significantly stronger than those between ENSO indices and insurance claim records, highlighting the substantial influence of socioeconomic factors on the insurance claim filing process. California exhibits the highest positive correlation between the maximum annual ENSO index and insurance claims (r ≈ 0.35). The developed CatBoost model can be used to predict a high percentage (>60%) of their variability, using both static and dynamic features.

The study concludes that ENSO indices can contribute meaningfully to flood risk prediction frameworks. Future work will focus on extending the analysis to additional states or the entire USA and incorporating new explanatory features to further improve model performance.

How to cite: Tsolakidis, K.-C., Papoulakos, K., Tepetidis, N., Iliopoulou, T., Dimitriadis, P., Tsaknias, D., and Koutsoyiannis, D.: ENSO impacts on flood risk and insurance claims in the United States: a machine learning approach, EGU General Assembly 2026, Vienna, Austria, 3–8 May 2026, EGU26-9856, https://doi.org/10.5194/egusphere-egu26-9856, 2026.

EGU26-9896 | PICO | NH1.3

Is society aware of “invisible” droughts? - a groundwater perspective  

Zhenyu Wang, Daniela Peña Guerrero, Jan Sodoge, Pia Ebeling, Yanchen Zheng, Christian Siebert, Mariana Madruga de Brito, Ralf Merz, Kerstin Stahl, and Larisa Tarasova

Climate change and anthropogenic activities increasingly stress groundwater resources, even in generally water-rich areas like Germany, threatening socio-economic and ecological systems. Since the impacts of groundwater droughts often emerge slowly and implicitly, it remains unclear to what extent they are noticed and recognized by society.

We address this gap by linking hydrological observations of groundwater droughts in Germany with news-derived indicators of societal awareness at the national scale. We analyzed 30-year groundwater records from and 521 regions and 13,900 monitoring wells across aquifers of different depths, after quality control including outlier screening, level-shift detection, and linear interpolation of short gaps (≤1 month) to daily resolution. We then identified drought periods and quantified their duration and severity using the variable threshold method, and classified events by the strength of potential human influence. Drought events with strong human influence are defined as those for which the variability of the associated time series dominates more by long-term trend rather than by interannual variability, or the event itself is strongly affected by abrupt level shifts. Finally, drought periods with strong and weak human influence were linked to a multi-sector drought-impact dataset derived from German newspaper articles (2000–2024) to assess societal awareness of groundwater droughts nationwide.

We found at least one drought event in 89.4% of the time series. In regions, drought events with weak human influence lasted, on average, 127 days and had a mean severity (maximum deviation below the drought threshold) of 0.2 m. Societal awareness was generally highest during the early phases of groundwater droughts, prior to the maximum groundwater-level deviation. Strong human influence amplified drought conditions, increasing the number of events by 7.2% and their mean duration by 2.9% within each region, and also leading to much earlier societal awareness. However, awareness did not persist throughout the drought period: awareness strength declined much faster than the groundwater-level recovery rate, and no significant relationship was found between changes in awareness strength and groundwater levels in deep aquifers during drought periods. These findings suggest that "invisible" groundwater droughts, especially in deep aquifers, are not fully perceived by society and highlight the need for improved groundwater policy coordination at the national level.

How to cite: Wang, Z., Peña Guerrero, D., Sodoge, J., Ebeling, P., Zheng, Y., Siebert, C., Madruga de Brito, M., Merz, R., Stahl, K., and Tarasova, L.: Is society aware of “invisible” droughts? - a groundwater perspective , EGU General Assembly 2026, Vienna, Austria, 3–8 May 2026, EGU26-9896, https://doi.org/10.5194/egusphere-egu26-9896, 2026.

EGU26-11457 | ECS | PICO | NH1.3

Beyond climatic-driven groundwater drought: extracting anthropogenic signatures fromstandardized groundwater indices 

Daniela Cid-Escobar, Natalia Limones, María Fernández, and Lucia De Stefano

Groundwater abstraction can substantially reshape how climatic drought propagates into aquifer storage in semiarid Mediterranean settings. Here we propose an attribution framework to separate hydroclimatic and anthropogenic controls on standardized groundwater anomalies in two hydraulically connected aquifers of Spain’s Ebro Basin: the Plio-Quaternary of Alfamén and the Miocene of Campo de Cariñena.

We first reconstruct temporally continuous groundwater-level series for 1980–2025 using transfer-function noise (TFN) models in Pastas. Models are driven by daily precipitation and Penman–Monteith potential evapotranspiration, and include reconstructed monthly abstraction stresses. From these reconstructions we compute monthly Standardized Groundwater Indices (SGI) under current, pumped conditions and compare them to multiscale Standardized Precipitation–Evapotranspiration Index (SPEI) to quantify climate–groundwater coupling and identify spatial response types. We then isolate the effect of abstraction by building counterfactual “no-pumping” simulations through linear decomposition of calibrated TFN models and removal of pumping contributions, enabling within-piezometer comparisons against a reference-consistent baseline. Focusing on 2010–2025, we evaluate how abstractions alters anomalies beyond frequency using an SGI < −1 threshold, including month-level reclassification, event structure, peak timing, exceedance probabilities, and the instantaneous abstraction effect defined as ΔSGI = SGI_pumped − SGI_nopump.

Under pumping, climate–groundwater coupling strengthens monotonically with climatic accumulation, mean SGI–SPEI correlations increase from ~0.07–0.10 at 1-month SPEI to ~0.43 (Alfamén) and ~0.52 (Cariñena) at 48-month SPEI scales. Long-window coupling and response types show coherent spatial organization across intensively cultivated areas, particularly along the valley floor and lower piedmont. Persistent SGI declines under pumping concentrate in the central parts of both aquifers, broadly coinciding with irrigation hotspots, whereas piezometers near aquifer margins more often exhibit transient or non-significant declines. A key exception occurs in the shallow Plio-Quaternary of Alfamén near ephemeral streams, where episodic focused infiltration can temporarily offset local drawdown. Removing abstraction fundamentally shifts the apparent drought timescale. SGI without pumping shows no declining trends and aligns most strongly with annual climate variability (around SPEI12), with correlation peaks up to ~0.8 and network means near ~0.45 in both aquifers, indicating that observed downward SGI trends largely reflect externally imposed abstraction.

Counterfactual diagnostics reveal temporal reorganization. Pumping produces longer, more persistent anomalies episodes and seasonally biased onsets (late autumn/early winter, plus a June onset cluster in Cariñena), while peak timing of the events remains partly climate-governed. Exceedance probabilities of crossing SGI < −1 are higher at every monitoring point under pumping; the largest increases appear in central sectors, where sustained pumping and thicker saturated zones amplify cumulative stress on storage, but elevated likelihoods and ΔSGI also extend beyond the main abstraction hotspots into areas without raw drawdown signals. Over the monitoring network, we observe that pumping increases the likelihood and persistence of moderate groundwater anomalies, delays recovery, and lengthens the effective memory of the system, implying that SGI derived from observed heads in heavily exploited aquifers reflects a compound climate–management signal and should be complemented with counterfactual baselines and month-resolved persistence metrics for attribution and management.

How to cite: Cid-Escobar, D., Limones, N., Fernández, M., and De Stefano, L.: Beyond climatic-driven groundwater drought: extracting anthropogenic signatures fromstandardized groundwater indices, EGU General Assembly 2026, Vienna, Austria, 3–8 May 2026, EGU26-11457, https://doi.org/10.5194/egusphere-egu26-11457, 2026.

EGU26-20700 | PICO | NH1.3

From Drought to Aridification: Land-Cover Fingerprints of a Drying Chile 

Francisco Zambrano, Anton Vrieling, Francisco Meza, Iongel Duran-Llacer, Francisco Fernández, Alejandro Venegas-González, Nicolas Raab, and Dylan Craven

Chile has endured a decade-long “mega-drought,” yet it remains unclear whether this represents a temporary climate anomaly or the onset of long-term aridification. While droughts are typically temporary events, persistent or recurrent droughts can indicate a transition toward aridification, that is, a gradual shift to drier conditions. We assessed how temporal changes in water supply and demand at multiple time scales affect vegetation productivity and land cover changes in continental Chile to diagnose the region's climate trajectory from drought to aridification. Since 2000, much of the region has seen a continuous decrease in water supply alongside a rise in atmospheric water demand. Further, in water-limited ecoregions, evapotranspiration, likely reflecting reduced transpiration or vegetation cover, has declined over time, with this trend intensifying over longer time scales. A long-term decline in water availability and shifting demand have led to declining vegetation productivity, especially in the Chilean Matorral and the Patagonia Steppe ecoregions. We discovered a link between these declines and drought indices related to soil moisture and actual evapotranspiration at time scales of up to 12 months. Further, our results indicate that the trends in drought indices account for up to 78% of shrubland and 40% of forest area changes across all ecoregions. The most important variable explaining cropland changes is the burned area. Our findings suggest that Chile is undergoing a transition from episodic drought to aridification, underscoring the need for adaptation strategies aligned with this emerging baseline.

How to cite: Zambrano, F., Vrieling, A., Meza, F., Duran-Llacer, I., Fernández, F., Venegas-González, A., Raab, N., and Craven, D.: From Drought to Aridification: Land-Cover Fingerprints of a Drying Chile, EGU General Assembly 2026, Vienna, Austria, 3–8 May 2026, EGU26-20700, https://doi.org/10.5194/egusphere-egu26-20700, 2026.

Moisture-driven landslides (MDLs) are a recurrent natural hazard in the Northeastern Himalayas (NEH) during the southwest monsoon season, where steep terrain and prolonged wetness frequently trigger catastrophic slope failures, underscoring the need for a credible early warning systems. In our recent work (Monga & Ganguli, 2025), we propose the compounding role of triggering and antecedent moisture content at an optimal d-day time lag to derive regional and local scale Event–duration (E–D) threshold model for northeastern Himalayas (NEH); however, we have not explicitly quantify the role of subsurface soil saturation in modulating the landslide likelihood. Here, we present at-site analysis of over the 21 landslide-prone sites across the NEH, considering the compound interaction of d-day time lag antecedent moisture, triggering rainfall and sub-surface root-zone saturation (up to 200 cm depth), and develop a moisture-preconditioned ED threshold model for landslides in a Bayesian probabilistic framework coupled with non-crossing quantile regression. To this end, we analyze 764 rainfall-induced landslides over 13-year (2007–2019) across the NEH and consider at-site rainfall time series from gauge-based high-frequency daily observations. The site-specific antecedent moisture content shows a mid-to-long-term memory, spanning from 2–3-week, prior to slope failure, reflecting the need to consider preceding antecedent accumulated moisture content in developing the ED threshold model. The derived 3-d E-D thresholds, computed at the modest (20th percentile) hazard level, demonstrate significant spatial variability: approximately 30% (6/21) of the sites show the robust control of antecedent moisture content over triggering rainfall, with varying optimal time lags that range from 3 to 60 days in triggering landslides. Conversely, ~25% (5/21) of the sites are more responsive to intense, short-duration rainfall in triggering slope failure. Within the Bayesian probabilistic framework, incorporating root-zone saturation, alongside the compounding role of triggering rainfall and antecedent moisture content, systematically elevates the landslide likelihood. At Kalimpong, accounting for effective soil saturation (S) of 0.85, we find an increase in the skill score by a factor of two in derived E–D thresholds, indicating the new model outperforms our earlier model as well as the one proposed in the literature.  Regionally, landslide likelihood peaks when high rainfall co-occurs with elevated sub-surface soil saturation, confirming a strong nexus between accumulated antecedent moisture content, subsurface soil saturation and short-duration record rainfall, in triggering slope failure. The derived insights aid in operational early warning systems, offering improved landslide forecast credibility in the NEH region with predominant space-time rainfall seasonality.

How to cite: Monga, D. and Ganguli, P.: Improving Skill of Rainfall Thresholds for Moisture-Driven Landslides by Integrating Root-Zone Soil Moisture at the Northeastern Himalayas, EGU General Assembly 2026, Vienna, Austria, 3–8 May 2026, EGU26-1906, https://doi.org/10.5194/egusphere-egu26-1906, 2026.

Recent studies have suggested that rainwater infiltrates not only the soil layer but also the underlying bedrock in small mountainous catchments, forming a bedrock aquifer. This bedrock groundwater subsequently discharges into the soil layer, potentially affecting the initiation of shallow landslides. To clarify this influence, it is essential to understand the runoff dynamics of bedrock springs in response to precipitation. However, direct observation of bedrock spring runoff remains challenging because bedrock springs are usually covered by thick soil layers. As a result, only a limited number of studies have investigated the runoff characteristics of individual bedrock springs, and the development of runoff models for bedrock springs is still insufficient. In this study, we conducted detailed field observations in a small mountainous catchment (6.87 ha) in Hokkaido, northern Japan. The study site is underlain by granite, and bedrock layer is exposed on both banks of the stream, where springs emerge from fractures in the bedrock. As of 2025, multiple bedrock spring outlets have been identified within the catchment. Soil temperature, bedrock spring water temperature, precipitation, and bedrock spring runoff were monitored. Soil temperature and bedrock spring water temperature were continuously recorded at hourly intervals. Precipitation was measured at hourly intervals using a tipping bucket rain gauge. Bedrock spring runoff was measured by constructing small dams immediately downstream of each spring outlet and directing all spring water into triangular weirs or tipping bucket discharge gauges. In addition, soil water, bedrock spring water, and rainwater were collected for water quality analysis. Soil temperature, bedrock spring water temperature, and water quality data were used to estimate the origin of the bedrock spring water. We applied the Pw1 model, a functional model based on antecedent precipitation, to reproduce bedrock spring runoff dynamics. This model was originally proposed by Kosugi et al. (2013) to reproduce groundwater level variations that cause deep-seated landslides, using antecedent precipitation with an arbitrary half-life time and positive constants. Model parameters were optimized to maximize the Nash–Sutcliffe efficiency (NSE). Finally, we discuss the relationship between the origin of bedrock spring water and the model parameters.

Reference
Kosugi, K., Fujimoto, M., Yamakawa, Y, Masaoka, N, Itokazu, T, Mizuyama, and T, Kinoshita, A. (2013): Functional models correlating antecedent precipitation indices to bedrock groundwater levels, Journal of the Japan Society of Erosion Control Engineering, Vol.66, No.4, p.21 - 32.

How to cite: Saito, H., Katsura, S., and Tanabe, R.: Runoff dynamics and functional modeling of bedrock springs in a small granitic mountainous catchment in Hokkaido, northern Japan, EGU General Assembly 2026, Vienna, Austria, 3–8 May 2026, EGU26-2913, https://doi.org/10.5194/egusphere-egu26-2913, 2026.

EGU26-4339 | Posters on site | NH3.14

Coupling Remote Sensing and Hydrological-Geotechnical Modeling for Rapid Assessment of Cascading Flood-Landslide Risks 

Guoding Chen, Lijun Chao, Tianlong Jia, and Sheng Wang

Rainfall-induced floods and landslides are globally prevalent natural hazards. Moreover, floods and landslides often occur in a cascading manner, posing significant risks and amplifying losses beyond each individual hazard event. Effective disaster preparedness and hazard management heavily rely on sufficient knowledge of flood-landslide cascading processes and accurate assessment of potential consequences. However, existing methods predominately analyse individual hazard event, and there is a notable lack of rapid, physically-based modeling approaches, particularly for regions where observations are limited. To address this challenge, we propose a novel framework to quantify flood and landslide risks by integrating remote sensing data with a high-performance hydrological-geotechnical model. The model is driven exclusively by remote sensing data (including meteorological forcings and ground properties) and forecasts flood and landslide processes based on physical principles. Moreover, this framework quantifies risk by synthesizing hazard intensity, population exposure, and regional socioeconomic conditions, while explicitly accounting for the compound interactions between these hazards. We evaluate this framework utilizing a heavy rainfall event of July 3–4, 2012 in the Yuehe River Basin, which triggered widespread floods, landslides, and debris flows. Our results demonstrate that the model effectively reproduces meteorological forcings and disaster processes, offering a new perspective for disaster risk assessment in data-scarce regions. The proposed framework could contribute to the development of effective mitigation strategies, enhancing regional resilience against cascading natural hazards. 

How to cite: Chen, G., Chao, L., Jia, T., and Wang, S.: Coupling Remote Sensing and Hydrological-Geotechnical Modeling for Rapid Assessment of Cascading Flood-Landslide Risks, EGU General Assembly 2026, Vienna, Austria, 3–8 May 2026, EGU26-4339, https://doi.org/10.5194/egusphere-egu26-4339, 2026.

EGU26-5276 | Orals | NH3.14

Model-derived hydrological signatures of debris avalanches and debris flows for enhanced landslide prediction 

Graziella Devoli, Thomas Skaugen, Heidi A. Grønsten, Mengistu Zelalem, Ivar Berthling, Abdusjekur Iseni, and Hervé Colleuille

The Norwegian landslide forecasting and warning service provides daily regional predictions of shallow landslides (i.e. debris avalanches and debris flows) triggered by intense rainfall, snowmelt and high soil moisture conditions.

While landslide initiation is clearly linked to hydrological processes through infiltration and increasing soil-water pressure, no distinct signature from rainfall–runoff models has yet been identified for use at local scale alongside existing landslide forecasting models. Progress is limited because few landslides occur in catchments with calibrated hydrological models, leaving little basis for relating landslide triggers to simulated hydrological states.

To address this gap, the Norwegian Water Resources and Energy Directorate (NVE) has developed a system to parameterise the Distance Distribution Dynamics (DDD) rainfall-runoff model for ungauged basins. The DDD model use a parsimonious set of parameters that can be estimated from landscape and climatic characteristics. We configure the DDD model for landslide-affected catchments, using samples from the Norwegian landslide database (containing landslide type, location, time of occurrence and observation quality), and simulate time series of hydrological variables at 1 hour temporal resolution from 2014 onward.

The DDD model simulates hydrological variables such as soil moisture in saturated and unsaturated zones, snow parameters, flood values, and runoff. By examining these variables at the time of landslide events, we aim to identify hydrological signatures associated with landslide initiation. Preliminary results indicate that, subsurface saturation, high flows, and the incremental rate in subsurface saturation relative to the incremental rate in runoff, are key factors in triggering shallow landslides. Analysis of historical events across multiple regions supports dependencies between simulated hydrological states and landslide occurrence. Ultimately, integrating simulated hydrological states into operational forecasting could enhance landslide prediction and improve early warning systems.

How to cite: Devoli, G., Skaugen, T., Grønsten, H. A., Zelalem, M., Berthling, I., Iseni, A., and Colleuille, H.: Model-derived hydrological signatures of debris avalanches and debris flows for enhanced landslide prediction, EGU General Assembly 2026, Vienna, Austria, 3–8 May 2026, EGU26-5276, https://doi.org/10.5194/egusphere-egu26-5276, 2026.

EGU26-5658 | ECS | Orals | NH3.14

What is wrong with landslide susceptibility mapping: Insights from data-driven analysis and field investigations 

Tobias Halter, Alexander Bast, Jordan Aaron, Peter Lehmann, and Manfred Stähli

Shallow landslides pose a significant threat to people and infrastructure in mountainous regions and can occur abruptly on steep soil slopes. To assess their hazard potential, data-driven landslide susceptibility mapping aims to predict the spatial likelihood of such events. In recent decades, machine learning approaches and high-quality spatial information have continuously improved landslide susceptibility assessment. Nevertheless, discrepancies between predicted susceptibility and observed landslide occurrence seem to remain unavoidable. In simple terms, this mismatch between predicted and observed patterns can have two causes: 1) the information on covariates controlling landslide triggering is limiting (the predicted susceptibility is ‘wrong’) or 2) the observed time scale is too short to capture the failure of more areas with similar (correctly predicted) susceptibilities. To explore these two options, we first developed a landslide susceptibility map for Switzerland based on a wide range of spatial datasets and machine-learning methods. Next, we evaluated its performance against an independent inventory which contains detailed field information of 763 landslides. Information from soil profiles collected at the head scarps of these landslides allowed us to assess the specific conditions that lead to slope instabilities which large-scale spatial models are not capable of addressing. In a third step, we performed field investigations at selected past landslide sites and compared their subsurface structure (deduced from electrical resistivity tomography) with nearby locations that had not yet failed but exhibited similar predicted susceptibility values. These measurements revealed significant differences in the subsurface. Our approach highlights the critical role of subsurface complexity in controlling hydrological flow paths that ultimately govern slope failure. In particular, variations in soil texture, soil development, soil type and soil depth strongly influence the mechanical and hydrological conditions affecting slope stability. These findings provide new insights into the limitations of large-scale susceptibility mapping and emphasize the importance of subsurface hydrology in understanding shallow landslide initiation.

How to cite: Halter, T., Bast, A., Aaron, J., Lehmann, P., and Stähli, M.: What is wrong with landslide susceptibility mapping: Insights from data-driven analysis and field investigations, EGU General Assembly 2026, Vienna, Austria, 3–8 May 2026, EGU26-5658, https://doi.org/10.5194/egusphere-egu26-5658, 2026.

EGU26-5859 | ECS | Posters on site | NH3.14

Scenario-Based Assessment of Material and Hydrological Controls on Attabad Landslide Dam Stability 

Muhammad Shareef Shazil, Emilia Damiano, and Roberto Greco

Landslide-dammed lakes are natural barriers formed by slope failures that can cause serious hazards downstream. Their stability depends on both dam shape and material and on the upstream hydrological conditions that control lake extension and water level. Changes in these conditions can increase lake level and activate hydraulic processes like seepage and overtopping, which can compromise the stability of dam. Understanding the interplay of upstream hydrology and stability is important to assess dam safety and downstream flood risk.

In early 2010, a rockslide in Attabad created a dam on the Hunza River in Pakistan, forming a lake that still exists today. In this study, lake surface area and volume were assessed using Landsat images and the Normalized Difference Water Index (NDWI), and pre-lake digital elevation model was used to estimate lake volume changes. Observations show seasonal fluctuations and consistency in lake volume over the years, influenced by spillway excavations and other hydrological processes.

A simplified geometry of dam body was defined based on literature data and images. Grain size distribution of dam materials typical of rockslides was also analyzed, and the Hazen formula was used to estimate hydraulic conductivity values. These were applied in GeoStudio SEEP/W to simulate nine scenarios with different combinations of clay and gravel permeability. Results show that total seepage (under current conditions) is moderate but strongly depends on material properties. Gravel-dominated zones have higher seepage, while clay-dominated zones have lower seepage. Some gravel areas could be prone to localized internal erosion or piping under high water levels.

We also analyze dam’s stability under different hydrological conditions. One approach is to evaluate seepage and structural response using current lake water level, which can help back-analyze and validate the mechanical properties of the dam materials. The second approach is to simulate future possible water levels to assess whether the dam remains stable under extreme conditions.

This study shows that combining remote sensing and hydrological modelling allows developing scenario-based analyses that can help understand how hydrology and dam material and shape control its stability. It provides a useful approach for monitoring and managing landslide-dammed lakes in areas with limited field data.

Keywords: Landslide dams, hydrological modeling, dam stability, scenario-based analysis, remote sensing

How to cite: Shazil, M. S., Damiano, E., and Greco, R.: Scenario-Based Assessment of Material and Hydrological Controls on Attabad Landslide Dam Stability, EGU General Assembly 2026, Vienna, Austria, 3–8 May 2026, EGU26-5859, https://doi.org/10.5194/egusphere-egu26-5859, 2026.

EGU26-5909 | ECS | Posters on site | NH3.14

When Climate Change Affects Rainfall, Landslide Frequency Responds: An Assessment at the Subregional Scale 

Daniel Camilo Roman Quintero, Roberto Greco, Thom Bogaard, and Ruud van der Ent

This study presents a methodological framework to assess climate change impacts on the hydrological conditions leading landslide occurrence. The approach is applied to a ~170 km² landslide-prone area in southern Italy, characterized by complex topography and rainfall-driven slope instability. Regional climate projections from CORDEX for the period 2006–2070, under moderate (RCP4.5) and high (RCP8.5) emission scenarios, were bias-corrected using observed rainfall data (2006–2023) and evaluated against a synthetic dataset representing present-day climatic conditions.

Aiming at event-scale detection of rainfall-triggered landslides throughout the study period, soil hydrological processes were simulated using physically based models and coupled with slope stability analyses that account for unsaturated soil behavior. Scenario-based statistical comparisons were carried out across three rainfall-homogeneous subregions. The analysis reveals a general trend toward drier conditions, in line with regional climate projections, together with enhanced rainfall variability at the subregional scale. Nevertheless, landslide occurrence is projected to increase significantly in climate change scenarios, with a more pronounced rise under RCP4.5 compared to RCP8.5.

This apparently counterintuitive response reflects contrasting changes in rainfall and landslide dynamics. Under RCP8.5, landslides are mainly triggered by more intense rainfall events, whereas under RCP4.5 they arise from the combined influence of wetter antecedent soil conditions and more intense early-peak rainfall. These results underscore the persistent and critical role of antecedent soil moisture in landslide initiation, even under rapidly evolving climate conditions.

How to cite: Roman Quintero, D. C., Greco, R., Bogaard, T., and van der Ent, R.: When Climate Change Affects Rainfall, Landslide Frequency Responds: An Assessment at the Subregional Scale, EGU General Assembly 2026, Vienna, Austria, 3–8 May 2026, EGU26-5909, https://doi.org/10.5194/egusphere-egu26-5909, 2026.

EGU26-6463 | ECS | Posters on site | NH3.14 | Highlight

Areal landslide hazard assessment: case study of landslide-prone area covered by pyroclastic deposits  

Pasquale Marino, Abdullah Abdullah, Daniel Camilo Roman Quintero, Giovanni Francesco Santonastaso, and Roberto Greco

Large mountainous areas of Campania (southern Italy) are frequently hit by rainfall-triggered shallow landslides, which often cause significant damage to buildings and infrastructures. Specifically, they involve steep slopes covered with unsaturated air-fall pyroclastic deposits, formed by alternating layers of ashes and pumices of variable thickness, lying upon heavily fractured limestone bedrock. The main triggering factor of these catastrophic events is the rainfall. Nonetheless, there are other causes linked to the hydrological conditions predisposing the slopes to failure (Roman Quintero et al., 2025), often associated with soil moisture conditions prior to the onset of rainfall (Greco et al., 2021). Predicting the occurrence of these landslides is highly challenging due to the significant spatial and temporal variability of the factors driving them. Thus, landslide hazard assessment needs attention and remains a critical task, especially in terms of reliably predicting the triggering location. In this work, a method for the preliminary assessment of landslide hazard in a sloping area covered by pyroclastic deposits is proposed, based on available historical precipitation records and considering only slope inclination and soil thickness as geomorphological controlling factors while assuming soil characteristics as homogeneous. The study area is located on the Cornito slope near the town of Cervinara, around 40 km northeast of the city of Naples, which belongs to the north-facing part of the Partenio Massif in the southern Apennines of Campania. Specifically, a small catchment of 0.4 km2 was investigated, where on 16 December 1999 a rain event of approximately 300mm in 48h triggered several landslides evolving in the form of fast debris flows. The largest one travelled nearly 2 km downslope toward the town of Cervinara, causing destruction and killing five people. The natural landforms of the catchment were considered using the Digital Elevation Model (DEM) with a resolution of 10 m grid cell, downloaded from the dataset TINITALY/01. This DEM was obtained by simple linear interpolation of contour lines digitized from the 1:25000 maps of the Istituto Geografico Militare (IGM) before the landslides of 1999 (Tarquini et al., 2007). Grid cells were grouped into fifteen classes of slope inclination and corresponding soil thickness, ranging from 33.5° to 47.5°, for simulating the hydrological processes of rainwater infiltration. Specifically, the 1D Richards’ equation model was run to simulate soil saturation profile at hourly resolution for each cell, considering the hourly rainfall recorded during the event of 1999. The model has been calibrated with both laboratory measurements (Roman Quintero et al., 2024) and field data collected during previous hydrological monitoring activities (Marino et., 2020). Then, based on the results obtained with the unsaturated flow model, the landslide hazard map is generated by looking at cells with a Factor of Safety, calculated under the infinite slope hypothesis, smaller than 1. The generated areal landslide hazard map was validated by comparison with the documented landslide inventory, showing agreement with the spatial distribution of reported landslides, especially with the location of the scarp of the largest one recorded, with an estimated mobilized volume of 30000 m3.

How to cite: Marino, P., Abdullah, A., Roman Quintero, D. C., Santonastaso, G. F., and Greco, R.: Areal landslide hazard assessment: case study of landslide-prone area covered by pyroclastic deposits , EGU General Assembly 2026, Vienna, Austria, 3–8 May 2026, EGU26-6463, https://doi.org/10.5194/egusphere-egu26-6463, 2026.

Landslides represent a major threat to human safety and infrastructure, particularly in mountainous regions. Accurately predicting landslide susceptibility in a physically based deterministic manner requires an integrated, multidisciplinary approach that combines geology, geomorphology, and hydrology. In this work, a hydromechanical modeling framework is developed to forecast the initiation of large-scale shallow landslides by computing the local factor of safety (LFS) as a measure of slope instability. The framework couples (1) a finite element method (FEM) solver for hydromechanically coupled landslide processes implemented within a Java-based, object-oriented modeling environment, with (2) an external hydrologic model, allowing for detailed three dimensional simulations of slope response to transient rainfall events across extensive hillslope domains. The proposed framework is first validated using a benchmark test on a homogeneous hillslope with constant inclination and is subsequently applied to a real-world large-scale case study in the Braies Alpine Catchment, Alto Adige, Northern Italy. In the benchmark scenario, the model successfully reproduces shallow landslide triggering under prolonged rainfall, while in the real-case application it reliably captures the initiation of multiple landslides during an intense summer storm. These results highlight the framework’s robustness and accuracy in predicting landslide initiation in complex terrain, demonstrating its potential as a cost-effective tool for landslide hazard and risk assessment.

How to cite: Busti, R., Formetta, G., and Lu, N.: A Regional-Scale Framework for Landslide Prediction Combining Three-Dimensional Hydrological Modeling and the Local Field Factor of Safety, EGU General Assembly 2026, Vienna, Austria, 3–8 May 2026, EGU26-7592, https://doi.org/10.5194/egusphere-egu26-7592, 2026.

EGU26-8173 | ECS | Posters on site | NH3.14

Large-scale assessment of rainfall-induced landslides in pyroclastic soils of Campania (Italy): a synthetic hydrometeorological approach 

Abdullah Abdullah, Daniel Camilo Roman Quintero, Pasquale Marino, and Roberto Greco

The development of reliable tools for assessing rainfall-induced landslide hazard over large areas is often constrained by the limited availability of historical landslide inventories and high-quality rainfall data. This challenge is particularly evident in the pyroclastic soil deposits of Campania (southern Italy), where coarse-grained soils formed by air-fallen volcanic material exist in alternating layers. These deposits are frequently affected by rainfall-induced landslides, primarily triggered by intense rainfall, with antecedent soil moisture acting as a key preparatory factor.

In this study, the Partenio and Sarno Mountains, covering an area of approximately 500 km² and monitored by 23 rain gauges, were subdivided into three zones based on the probability distributions of rainfall event series. Events were separated using a minimum inter-event time of 24 hours with rainfall amounts lower than 2 mm. The zoning reflects the orographic control on rainstorms in the area and was defined using Kolmogorov-Smirnov tests. For each zone, the NRSP stochastic model of rainfall was calibrated based on observed rainfall data, and 500-year-long synthetic hourly rainfall time series were generated. These synthetic series were then used as input to a 1D model of the flow in the unsaturated soil deposit, to simulate the response to precipitation for a representative slope in each zone. The resulting time series of soil moisture and soil suction were employed to perform slope stability analyses, evaluating the factor of safety (FS) with the infinite slope model.

Using the synthetic dataset, empirical thresholds for landslide prediction were derived for each zone, including both meteorological thresholds (based on rainfall intensity and duration) and hydrometeorological thresholds (combining rainfall depth with antecedent root-zone soil moisture). The results indicate that hydrometeorological thresholds are more effective than meteorological thresholds when rainfall and slope properties are accurately known. Moreover, the inclusion of antecedent hydrological variables allows the identification of two distinctive landslide-triggering mechanisms typical of the initial and end phases of the rainy season.

To improve the reliability of the proposed approach, uncertainties associated with the spatial variability of geomorphological slope properties and hydrometeorological variables were explicitly considered. These uncertainties were modeled as normally distributed random errors, and the synthetic datasets of the representative slopes were accordingly perturbed. Accounting for uncertainty shows the robustness of the hydrometeorological thresholds, limiting both false alarms and missed events across all zones. This result was confirmed through validation against available landslide, rainfall, and root-zone soil moisture data for the period 1999-2025.

The proposed methodology provides a practical framework for incorporating uncertainty in hydrometeorological information into landslide hazard assessment over large areas. Furthermore, once the site-specific dominant hydrological processes and controlling variables are identified, the approach can be readily transferred to other regions affected by rainfall-induced landslides.

How to cite: Abdullah, A., Roman Quintero, D. C., Marino, P., and Greco, R.: Large-scale assessment of rainfall-induced landslides in pyroclastic soils of Campania (Italy): a synthetic hydrometeorological approach, EGU General Assembly 2026, Vienna, Austria, 3–8 May 2026, EGU26-8173, https://doi.org/10.5194/egusphere-egu26-8173, 2026.

EGU26-8752 | Posters on site | NH3.14

Changes in rainfall–groundwater level response associated with large displacement of a deep-seated landslide in Japan 

Sogo Kobayashi, Shin'ya Katsura, Taishi Aoki, Mio Kasai, and Yuichi Hayakawa

Understanding the relationship between rainfall and groundwater level response is crucial for elucidating landslide mechanisms and for planning structural mitigation measures, such as groundwater drainage works, for deep-seated, slow-moving landslides. It is well known that elevated groundwater levels induce landslide displacement; however, such displacement often causes fracturing and deformation of the landslide mass. These processes can alter the internal hydrogeological structure of the landslide, potentially changing the rainfall–groundwater level response relationship. Although some previous studies have reported differences in this relationship before and after large landslide displacements, its linkage to fracturing and deformation remains unclear.

In this study, we observed groundwater level dynamics at four observation wells (depth: 1.3–7.4 m) within a deep-seated, slow-moving landslide in Biratori, Hokkaido, northern Japan. The slip surface was estimated to be located at a depth of approximately 8 m. In November 2023, the landslide experienced approximately 4 m of displacement over a two-week period. The observation period was divided into intervals before and after this large displacement, and covariance analysis was applied to evaluate changes in the rainfall–groundwater level response relationship. For each analysis period, an antecedent precipitation index (API) was calculated from daily rainfall data. The half-life (days) and lag time (days) were optimized to maximize the correlation coefficient with the observed groundwater levels, and these optimized parameters were used in the covariance analysis. Preliminary results indicate statistically significant changes at three of the four observation wells. Furthermore, comparison with topographic changes derived from UAV-LiDAR measurements (10-cm resolution DEMs acquired on November 9 and 28, 2023), suggests that changes in half-life reflect variations in landslide-mass permeability caused by compression and tension, whereas decreases in lag time indicate the formation of new seepage pathways associated with increased fracturing. These findings suggest that the rainfall–groundwater level response relationship is not stable in actively moving landslide masses. Further analyses will examine and discuss its linkage to topographic changes in greater detail.

How to cite: Kobayashi, S., Katsura, S., Aoki, T., Kasai, M., and Hayakawa, Y.: Changes in rainfall–groundwater level response associated with large displacement of a deep-seated landslide in Japan, EGU General Assembly 2026, Vienna, Austria, 3–8 May 2026, EGU26-8752, https://doi.org/10.5194/egusphere-egu26-8752, 2026.

EGU26-9604 | ECS | Orals | NH3.14

Hydrological Controls on the 30 July 2024 Wayanad Debris-Flow Disaster: Rainfall Extremes, Catchment Response, and Runout Dynamics 

Aditya Harikumar, Santosh G Thampi, Sachin Ramesh VV, Mridul K Vinod, and Jishnu Mohan

In late July 2024, a prolonged spell of extreme monsoon rainfall led to progressive slope saturation in the upper Punnapuzha catchment, culminating in a catastrophic landslide and debris-flow disaster in Meppadi Grama Panchayat, Wayanad District, Kerala, India, which then resulted in widespread loss of life and severe geomorphic alteration of the Punnapuzha river corridor. Understanding the hydrological processes that governed initiation of slope failure, debris mobilization, and long runout is critical for improving landslide hazard assessment in steep, monsoon-dominated terrains. This study presents an integrated, event-based reconstruction of the disaster, focusing on the role of rainfall characteristics, catchment-scale hydrological response, and debris-flow dynamics. Rainfall analysis was carried out using data from several raingauge stations surrounding the landslide crown, with particular emphasis on spatial representativeness and consistency during extreme events. These rainauges recorded more than 570 mm of rainfall over 29–30 July 2024, indicating rapid slope saturation and exceptional hydrological loading. Catchment response was simulated using the SWAT+ hydrological model, calibrated and validated against observed discharge records. The model reproduces daily runoff dynamics reasonably well and provides insight into the antecedent moisture conditions and runoff generation that preceded slope failure. To capture terrain modification caused by the event, post-landslide LiDAR-derived elevation data (0.1 m resolution) were compared with pre-event satellite-based DEMs. This analysis reveals extensive aggradation, channel widening, and reorganization of flow paths along an approximately 8 km debris-flow corridor. Two-dimensional debris-flow simulations were then performed using the non-Newtonian module in HEC-RAS, adopting Bingham rheology to represent high-concentration sediment–water mixtures. Simulations on pre-event terrain show strong agreement with observed runout extent and deposition patterns, with maximum flow depths exceeding 40 m near the landslide crown and progressively decreasing downstream. The results demonstrate that the disaster was controlled not by rainfall magnitude alone, but by the combined effects of intense short-duration rainfall, rapid catchment response, and efficient debris routing along confined valley geometry. By explicitly linking rainfall variability, hydrological response, and debris-flow propagation, this study provides a process-based framework for interpreting extreme landslide events in tropical mountain regions and highlights the importance of integrating hydrological understanding into landslide hazard analysis.

How to cite: Harikumar, A., Thampi, S. G., Ramesh VV, S., Vinod, M. K., and Mohan, J.: Hydrological Controls on the 30 July 2024 Wayanad Debris-Flow Disaster: Rainfall Extremes, Catchment Response, and Runout Dynamics, EGU General Assembly 2026, Vienna, Austria, 3–8 May 2026, EGU26-9604, https://doi.org/10.5194/egusphere-egu26-9604, 2026.

EGU26-9877 | ECS | Orals | NH3.14

When Frozen Slopes Switch Regimes: Moisture-Controlled Runoff Generation and the Transient Role of Macropores 

Julian Bauer, Sebastian Müller, Thomas Heinze, Homa Khanahmadi, and Ivo Baselt

Rainfall on frozen slopes represents a critical hydrological control on landslide and debris-flow initiation in cold and alpine environments, as frozen soil layers can strongly limit infiltration and favour surface runoff. Depending on the thermal and hydraulic state of the subsurface, precipitation may either infiltrate through partially unfrozen pathways or be rapidly converted into runoff, with important implications for erosion and slope destabilisation. Freeze-thaw dynamics and preferential flow through macropores can further complicate this partitioning by transiently modifying soil permeability and infiltration pathways, while their interaction with pre event soil moisture conditions remains poorly constrained under event-scale conditions.

We present nine large-scale rainfall experiments conducted on an inclined frozen soil body inside a controlled climate chamber. The experiments systematically varied initial volumetric water content and the presence or absence of an interconnected macropore network, while continuously monitoring soil temperature, liquid water content, subsurface drainage, and surface runoff. Our results show that hydrological responses of frozen slopes are primarily controlled by initial water content, with macropores exerting a secondary but highly non-linear influence. At low initial water content, infiltration was dominated by matrix flow despite frozen conditions, resulting in limited surface runoff. At intermediate water content, macropores enabled rapid bypass infiltration through the partially frozen profile, promoting early drainage and subsurface water transfer. At high initial water content, the frozen matrix became effectively impermeable and infiltration depended almost entirely on macropore flow. However, macropore functionality was transient: progressive refreezing and particle-assisted clogging reduced hydraulic connectivity during ongoing infiltration, causing a rapid shift from bypass infiltration to runoff-dominated conditions.

These results demonstrate that macropores in frozen slopes act as dynamic flow pathways whose hydraulic effectiveness depends on pre-event moisture conditions. While open macropores can enable subsurface infiltration under otherwise restrictive frozen conditions, progressive refreezing or clogging can reduce their functionality during infiltration events, causing a shift from infiltration-dominated responses toward surface runoff. The observed regime shifts highlight the need to explicitly represent transient preferential flow and refreezing processes in landslide hydrology and slope stability models, as they critically control hydrological preconditioning and the timing and magnitude of runoff-driven erosion and slope instability in seasonally frozen terrain.

How to cite: Bauer, J., Müller, S., Heinze, T., Khanahmadi, H., and Baselt, I.: When Frozen Slopes Switch Regimes: Moisture-Controlled Runoff Generation and the Transient Role of Macropores, EGU General Assembly 2026, Vienna, Austria, 3–8 May 2026, EGU26-9877, https://doi.org/10.5194/egusphere-egu26-9877, 2026.

EGU26-10404 | ECS | Orals | NH3.14

Exploring the role and connections between rainfall and soil moisture over cascading hazards in the Himalayas 

Sudhanshu Dixit, Srikrishnan Siva Subramanian, and Sumit Sen

In recent years, the frequency and severity of extreme rainfall events have increased in the Himalayas, triggering landslides and debris flows often as a cascading hazard. Understanding the interactions between rainfall, initial soil moisture, and the triggering of landslides or debris flows is essential for mitigating risks to communities and infrastructure. However, the limited availability of observed hydrometeorological data poses serious challenges for accurate hazard assessment and early warning. To address these, numerical modelling-based reanalysis of rainfall-induced cascading hazards are chosen as a good choice. This study examines the influence of key hydrometeorological parameters, particularly rainfall and initial soil moisture, on the initiation and progression of shallow landslides and runoff-generated debris flows within a small mountainous catchment in the Himalayas, utilizing a basin-scale numerical modeling approach. We utilize multiple precipitation data sources, including reanalysis products, satellite-based retrievals, and outputs from numerical weather prediction models, to conduct a retrospective analysis of a historical cascading hazard event. This approach enables us to assess how these parameters impact the timing and severity of individual hazards, such as landslides and debris flows, within the cascading hazard chain. Our findings reveal distinct temporal patterns and triggering mechanisms for shallow landslides and runoff-generated debris flows, shedding light on their cascading behaviour in data-scarce, topographically complex regions. We also observe that initial soil moisture has a strong influence on hazard severity, and understanding its connection with rainfall is crucial for reliable hazard assessment.

How to cite: Dixit, S., Siva Subramanian, S., and Sen, S.: Exploring the role and connections between rainfall and soil moisture over cascading hazards in the Himalayas, EGU General Assembly 2026, Vienna, Austria, 3–8 May 2026, EGU26-10404, https://doi.org/10.5194/egusphere-egu26-10404, 2026.

The Campania region (southern Italy) is characterized by a widespread hydrogeological risk due to the presence of many slopes covered by pyroclastic deposits derived from the activity of the Vesuvius and Campi Flegrei volcanic complexes. Indeed, numerous areas in the region are prone to rainfall-induced landslides—particularly shallow landslides and debris flows—which are often triggered by short-duration, high-intensity precipitation events. Over the years, the region has been affected by severe landslide events, causing loss of lives and economic damage. In Campania, a territorial landslide early warning system (Te-LEWS) has been operational since 2005 managed by the regional department for Civil Protection. For early warning purposes, the regional territory is divided into eight distinct warning zones according to the following factors: hydrography, morphology, climate, geology, land use and administrative boundaries. The predictions of a weather numerical model are used to evaluate the possible occurrence of rainfall-induced landslides within each warning zone. The daily assessment of the criticality is established by comparing the weather forecasts to a set of thresholds associated with rainfall precursors.

In the scientific literature it is widely recognized that rainfall primarily acts as a triggering mechanism, while hydrological variables (e.g., soil moisture) control slope predisposition to failure. Therefore, an evaluation that neglects antecedent hydrological conditions may result in a high number of false alarms, limiting the reliability and credibility of rainfall-only warning models. In recent years, a growing number of weather and hydrological reanalysis products have been produced at fine temporal and spatial resolutions, allowing the potential use of soil moisture data into operational Te-LEWS. This study proposes a hydrometeorological approach integrating meteorological and hydrological information and testing its performance in a landslide-susceptible area of the Campania region, southern Italy. A two-dimensional Bayesian analysis is employed to quantify the conditional probability of landslide occurrence and to derive multiple hydro-meteorological thresholds associated with increasing warning levels. The performances of the warning models are assessed by means of statistical indicators to identify the best-performing combination of hydro-meteorological thresholds. Finally, the potential added value of incorporating soil moisture into territorial landslide warning models is assessed by comparing the hydro-meteorological model developed in this study with the current regional warning system in a real-case scenario.

How to cite: Pecoraro, G., Calvello, M., and Zhang, S.: Adopting a hydrometeorological approach for territorial landslide early warning: insights and effectiveness evaluation from a case study in Campania (Italy), EGU General Assembly 2026, Vienna, Austria, 3–8 May 2026, EGU26-10933, https://doi.org/10.5194/egusphere-egu26-10933, 2026.

Soil moisture plays a central role in slope hydrology by integrating atmospheric forcing and subsurface processes, thereby shaping antecedent wetness conditions relevant to landslide preconditioning. A key property governing this role is soil moisture memory, defined as the persistence of moisture anomalies following external perturbations. Despite its importance, the seasonal organization of soil moisture memory and its physical controls remain insufficiently constrained at regional scales.

This study focuses on understanding how soil moisture variability across Italy is organized by the interplay between external hydro-meteorological forcing and internal system persistence across seasons. Specifically, using high-resolution gridded reanalysis-based data within a causal discovery framework, the analysis examines the seasonal dominance of different drivers and the spatial and temporal variability of soil moisture persistence, with emphasis on large-scale background hydrological states.

The results indicate pronounced spatial and seasonal heterogeneity. Soil moisture variability is primarily governed by atmospheric water inputs over large portions of the domain, while cryospheric and energy-related processes become relevant under specific climatic and seasonal conditions. Crucially, soil moisture persistence exhibits systematic seasonal contrasts and is not uniformly associated with the apparent strength of external forcing. The joint behavior of forcing strength and memory instead organizes soil moisture dynamics into distinct seasonal regimes, reflecting different modes of system response shaped by land–atmosphere coupling and soil water loss processes. These findings support a physically consistent interpretation of antecedent wetness conditions relevant to landslide preconditioning.

How to cite: Liu, X. and De Michele, C.: Seasonal controls and memory of soil moisture variability across Italy: a process-oriented perspective relevant to landslide preconditioning, EGU General Assembly 2026, Vienna, Austria, 3–8 May 2026, EGU26-11992, https://doi.org/10.5194/egusphere-egu26-11992, 2026.

EGU26-15316 | ECS | Posters on site | NH3.14

Deformation-informed hydrometeorological thresholds for landslide early warning: inventory enhancement and spatiotemporal downscaling 

Xiao Feng, Luigi Lombardo, Juan Du, Bo Chai, and Thom Bogaard

Hydrometeorological thresholds are central to many operational landslide early warning systems, yet they often remain coarse and weakly linked to slope physics. Two persistent limitations are (i) the dependence on landslide inventories that are incomplete and often poorly timed, and (ii) the assumption that a single regional threshold can represent heterogeneous and evolving slope stability conditions. This contribution presents a deformation-informed perspective to advance threshold-based landslide early warning. We show that slope deformation, measured as continuous time series, can act as an transition state variable that bridges hydrometeorological forcing and slope failure. By explicitly incorporating deformation, hydrometeorological thresholds can be better constrained as well as better used operationally. First, deformation observations can be used to supplement event information for threshold assessment. Automated extraction of “deformation events” from geodetic time series can complement landslide records as physically meaningful proxies, reducing the sensitivity of threshold estimation to inventory incompleteness and timing uncertainty, and improving the robustness of calibrated thresholds. Second, deformation can guide the spatiotemporal refinement of warning criteria. By quantifying how different slopes respond to rainfall over multiple time windows, deformation-derived indices can characterize slope-specific response patterns and stability states. This information enables a downscaling strategy in which regional hydrometeorological thresholds for landslide initiation are transformed into slope-specific, dynamically updated thresholds that better reflect local conditions and temporal changes in stability. In this way, deformation moves thresholds from static and regionally averaged triggers toward adaptive criteria that are more physically grounded and spatially actionable.

Overall, the proposed deformation-aware framework brings two complementary benefits in early warning: (1) strengthening landslide initiation threshold development through deformation-informed event characterization, and (2) enhancing threshold application through slope-specific, time-varying adaptation. This approach is sensor-agnostic (applicable to GNSS and InSAR) and compatible with different threshold formulations, offering a practical pathway to improve reliability and reduce uncertainty in landslide early warning across data-limited and highly heterogeneous regions.

How to cite: Feng, X., Lombardo, L., Du, J., Chai, B., and Bogaard, T.: Deformation-informed hydrometeorological thresholds for landslide early warning: inventory enhancement and spatiotemporal downscaling, EGU General Assembly 2026, Vienna, Austria, 3–8 May 2026, EGU26-15316, https://doi.org/10.5194/egusphere-egu26-15316, 2026.

EGU26-20673 | ECS | Orals | NH3.14

Are one-dimensional infiltration models suitable for simulating soil moisture in landslide-prone hillslopes?    

danubia teixeira silva, Gean Paulo Michel, Franciele Zanandrea, Nelson Ferreira Fernandes, Otto Correa Rotunno Filho, Artur Nonato Vieira Cereto, Clara Moreira Cardoso, and Rodrigo coutinho Loureiro Mansur

The dynamics of water in hillslopes influence the processes that govern slope stability and the triggering of landslides, particularly under intense rainfall events. Understanding hydrological processes across multiple scales, from the watershed to the microscopic level of the soil, is essential for identifying the causes and triggers of slope instability. Hydraulic anisotropy, the presence of discontinuities, textural variability, and slope angle control the direction and intensity of water flows over time, generating both vertical and lateral flow components.

On steep slopes, water flow in the soil can be described by two distinct infiltration fronts: a transient front, which propagates perpendicular to the ground surface (associated with vertical flow), and a stationary front, which develops parallel to the slope and is governed by lateral flow. The predominance of transient front or stationary front depends on variables such as the initial depth of the water table, soil hydraulic conductivity, constant infiltration rate, and slope angle.

In this context, the present study evaluates the validity of the hypothesis of predominant one-dimensional flow in simulating infiltration on landslide-prone hillslopes, focusing on periods of intense rainfall, during which the short duration of events tends to limit the contribution of lateral flows. Simulations of volumetric soil moisture were performed using observed rainfall data and hydraulic parameters derived exclusively from pedotransfer functions. However such type of simulation has not satisfactorily reproduced the observed hydrological behavior (mean Spearman correlation coefficient ρ = -0.27). On the other side, when the hydraulic parameters have been adjusted based on soil moisture field in situ measurements, the calibrated simulations showed fairly acceptable and good agreement between both, simulated and observed soil moisture, depicting positive and statistically significant correlations at all monitored depths (mean Spearman correlation coefficient ρ = 0.80).

The results indicated a predominance of downward vertical flow during intense rainfall events, depicting that, despite the fact that hillslope hydrology is inherently multidimensional, one-dimensional model approach still can adequately represent soil moisture dynamics under transient conditions associated with rapid infiltration events. Furthermore, the results highlight the need for site-specific calibration of soil hydraulic parameters. 

Overall, the findings highlight the importance of site-specific calibration of soil hydraulic parameters and reinforce the value of continuous soil moisture monitoring as an effective tool for identifying hillslope areas susceptible to shallow landslides.

How to cite: teixeira silva, D., Paulo Michel, G., Zanandrea, F., Ferreira Fernandes, N., Correa Rotunno Filho, O., Nonato Vieira Cereto, A., Moreira Cardoso, C., and coutinho Loureiro Mansur, R.: Are one-dimensional infiltration models suitable for simulating soil moisture in landslide-prone hillslopes?   , EGU General Assembly 2026, Vienna, Austria, 3–8 May 2026, EGU26-20673, https://doi.org/10.5194/egusphere-egu26-20673, 2026.

This study investigated the complex temporal behavior of cosmogenic Beryllium-7 (7Be) by analyzing daily activity concentrations from 21 monitoring stations in the CTBTO network, spanning the years 2010 through 2017. By applying multifractal detrended fluctuation analysis (MF-DFA), it was established that 7Be time series exhibit significant nonlinear scaling behaviors. The results indicate a broad multifractal spectrum (Δα ranging from 0.17 to 0.66), with statistically significant multifractality observed at all locations except RN45 and RN47. Leveraging the extracted spectral width and Hölder exponents, current study utilized the K-means algorithm to categorize the global stations into three distinct clusters based on their dynamic signatures. Furthermore, this study assessed the external forcing of 7Be variations via multifractal cross-correlation analysis against five major indices: the Southern Oscillation Index (SOI), North Atlantic Oscillation (NAO), and solar activity markers (Total, Northern, and Southern hemisphere sunspot numbers). While cross-correlations varied across indices, the NAO emerged as the dominant driver. Notably, station RN16 (Yellowknife, Canada) displayed the highest sensitivity to these external drivers, suggesting a unique coupling between atmospheric/solar indices and isotope concentration at this latitude.

How to cite: Ogunjo, S.: Global Beryllium-7 Dynamics: Nonlinear Scaling Properties, Spatial Classification, and Sensitivity to Atmospheric Teleconnections, EGU General Assembly 2026, Vienna, Austria, 3–8 May 2026, EGU26-963, https://doi.org/10.5194/egusphere-egu26-963, 2026.

Various empirical methods exist to calculate fractal dimension of geospatial objects with the box-counting principle being a popular one. However, these methods generally require geospatial data to be projected to Euclidean space. While this works fine at small geographic scales, computation at larger or global scales introduces distortions inevitable with projection due to the curvature of the earth. I show from mathematical principles how Discrete Global Grid Systems (DGGSs) – hierarchical spatial data structures composed of polygonal cells that are increasingly being used for modelling geospatial data – can be employed creatively to act as the covering set for calculating the Minkowski-Bouligand dimension using the box-counting principle. This enables computation of the fractal dimension of geospatial data in spherical coordinates without having to project the data in question on a planar surface. Results on synthetic datasets are within 1% of their theoretical fractal dimensions. A case study on opaque cloud fields obtained from a geostationary meteorological remote sensing satellite image yields a result of 1.577±0.0207 when aggregated using three different geodesic DGGSs based on the Icosahedral Snyder Equal Area (ISEA) projection, in line with values reported in the literature. As the cells of a DGGS are generally pre-defined and fixed to the earth, this method also brings some relief associated with the box-counting method in general, particularly the choice of cell-sizes to be sampled as well as the placement and orientation of the grid that acts as the covering set – issues that are usually circumvented by rules of thumb and conventions. I comment on the possibility to extend the method for use with raster data.  Ways to improve the method using low-aperture DGGSs to better capture the self-similarity and possibilities of developing custom DGGSs for this purpose are also noted. Being a computationally intensive method, development of software libraries making use of parallel computing to enhance performance and scalability is also proposed. With climatic variables exhibiting spatiotemporal autocorrelation with long-range effects, I believe this method would be of interest to climate scientists interested in studying their fractal properties at continental and global scales.

How to cite: Ghosh, P.: Computing fractal dimension at large geographic scales using Discrete Global Grid Systems, EGU General Assembly 2026, Vienna, Austria, 3–8 May 2026, EGU26-4299, https://doi.org/10.5194/egusphere-egu26-4299, 2026.

EGU26-4711 | ECS | Orals | NP3.3

Numerical Study on the Path-Dependent Evolution of the Excavation Damage Zone under Transient Unloading 

Gongliang Xiang, Ming Tao, Xibing Li, Qi Zhao, Linqi Huang, Tubing Yin, Rui Zhao, and Jiangzhan Chen

Excavation and unloading of deep rock mass under varying in-situ stress levels is a typical non-linear geomechanical process, Specifically, in the context of the widely used drilling and blasting (D&B) method, the excavation damage zone (EDZ) around underground opening induced by transient unloading represents a dynamic response problem governed by multiple factors. While the exact theoretical solution of stress state in surrounding rock during transient excavation can describe the stress state and eventually converge to the Kirsch solution after rock mass excavation completed, it cannot fully capture the dynamic damage process. Therefore, a circular tunnel model for transient excavation was established in this study using a dynamic finite element code LS-DYNA. An equivalent released nodal force method was implemented to stably control the transient unloading path under non-hydrostatic in-situ stress conditions after stress initiation, which realizing the synchronous release of radial and tangential stresses in the excavated zone. Moreover, the validity of the linear elastic transient excavation model was verified through comparison with an analytical solution. Then the dynamic stress redistribution, as well as the EDZ evolution process were numerically simulated under various stress unloading paths and lateral pressure coefficients, utilizing an elastoplastic constitutive model. This study provides a basis for simulating transient excavation under various paths and understanding failure of surrounding rock in non-hydrostatic stress states.

How to cite: Xiang, G., Tao, M., Li, X., Zhao, Q., Huang, L., Yin, T., Zhao, R., and Chen, J.: Numerical Study on the Path-Dependent Evolution of the Excavation Damage Zone under Transient Unloading, EGU General Assembly 2026, Vienna, Austria, 3–8 May 2026, EGU26-4711, https://doi.org/10.5194/egusphere-egu26-4711, 2026.

EGU26-7074 | Posters on site | NP3.3

Global-scale multidecadal climate variability: The stadium wave 

Sergey Kravtsov, Andrew Westgate, and Andrei Gavrilov

A significant fraction of multidecadal fluctuations in the reanalysis-based gridded estimates of the observed climate variability over the past century and a half lie outside of the envelope generated by ensembles of climate-model historical simulations. Several pattern-recognition methods have been previously used to map out a truly global reach of the observed vs. simulated climate-data differences; in our own work we dubbed these global discrepancies the stadium wave to highlight their most striking spatiotemporal characteristic. Here we used a novel combination of such methods in conjunction with a large multi-model ensemble and two popular twentieth-century reanalysis products to: (i) succinctly describe the geographical evolution of the observed stadium wave in the annually sampled near-surface atmospheric temperature and mean sea-level pressure fields in terms of three basic patterns; (ii) show the robustness of this identification with respect to methodological details, including the demonstration of the truly global character of the stadium wave; and (iii) provide essential clues to its dynamical origin. All input time series were first decomposed into the forced signal and the residual internal variability; multi-model forced-signal estimates were also decomposed into their common-evolution part and the individual-model residuals. Analysis of the latter residuals suggests a contribution to the stadium-wave dynamics from a delayed climate response to variable external forcing despite the observed stadium-wave patterns’ exhibiting the magnitudes and the level of global teleconnectivity unmatched by the forced-signal residuals.

How to cite: Kravtsov, S., Westgate, A., and Gavrilov, A.: Global-scale multidecadal climate variability: The stadium wave, EGU General Assembly 2026, Vienna, Austria, 3–8 May 2026, EGU26-7074, https://doi.org/10.5194/egusphere-egu26-7074, 2026.

Scaling dynamics, intermittency, and multifractality in complex natural systems remain a central challenge across physics, geoscience, and hazard science. Earth system dynamics exhibit strongly non-equilibrium behaviour, long-range codependences, irreversible energy and information flows, and multiscale spatiotemporal coevolution, including dynamically adaptive interactions across spatial, temporal, and organizational domains.

The present contribution introduces and explores our latest advances in information physical intelligence for addressing these challenges, further building from our recent developments in non-ergodic nonlinear open quantum systems, where systems non-recurrently exchange energy, matter and information with structural-functional coevolutionary environments. In this setting, entropy production, information backflow, coherence, and decoherence are anchored on cross-scaling organizing principles spanning from microphysical foundations to emergent macrophysical behaviour, dynamically traceable and solvable through our novel nonlinear quantum developments.

Our new nonlinear quantum intelligence framework is then equipped with our latest non-ergodic information physical categorical algebraic infrastructure and associated mathematical physics apparatus, underlying the natural emergence of coevolutionary cyber-physical cognitive systems. These are then tested in controlled synthetic and free-range natural experiments, in order to provide operational insights on their ability to autonomously unfold and shape structural-functional emergence of complex system dynamics including scaling mechanisms in nonlinear non-ergodic multiscale stochastic-dynamical systems exhibiting scale-dependent entropy production rates, anomalous dissipation, and multidirectional cascades, on an inherent information physical thermodynamic process for far-from-equilibrium coevolutionary multifractal scaling.

One of the advances herein brings out a novel coevolutionary far-from-equilibrium thermodynamic renormalization of non-ergodic open quantum dynamics, where delocalization and aggregation across scales induces effective non-Markovianity, memory kernels, and scale-dependent effective energetics. These features are then shown to map naturally onto formal multifractal signatures observed in turbulence, precipitation fields, seismicity, geomagnetic activity, and climate variability.

Within this framework, coevolutionary multifractality emerges as a signature of competing irreversible processes operating across coevolving subsystems, rather than as a purely statistical or kinematic geometric construct. The corresponding generalization of information-theoretic quantities, including quantum relative entropy, Fisher information, and entropy production fluctuations, provide structural descriptors of scaling regimes and phase-transition-like behaviour in Earth system dynamics.

From theory to operation, we demonstrate how these information physical foundations and developments enable cross-domain integration in multiscale, multidomain Earth system modeling and more broadly across our System-of-Systems for Multi-Hazard Risk Intelligence Networks (SoS4MHRIN) platform. In doing so, we unveil and elicit coevolutionary scaling mechanisms linking traditional quantum information to meso and macroscale complexity, and harness elusive predictability pertaining to far-from-equilibrium non-ergodic non-recurrent emergence, intermittence and persistence of structural-functional changes, critical transitions and extreme events, along with their interactions and impacts.

This is particularly relevant for compound, cascading, coevolutionary and synergistic multi-hazards, where earthquakes, volcanic eruptions, extreme weather, floods, wildfires, and landslides interact across scales and domains. Far-from-equilibrium entropy production and information physical flows act as early warning indicators and organizing variables for multi-hazard interactions and tipping dynamics.

By synergistically articulating non-ergodic information physics, nonlinear open quantum thermodynamics, scaling theory, and Earth system science, this work provides a physically grounded, scale-aware framework for better understanding and operating on complexity, predictability, and resilience in the Earth system under ongoing structural-functional multiscale coevolution.


How to cite: Perdigão, R. A. P. and Hall, J.: Nonlinear Quantum Intelligence Framework for Coevolutionary Scaling and Multifractality across Far-from-Equilibrium Earth System Dynamics and Multi-Hazards, EGU General Assembly 2026, Vienna, Austria, 3–8 May 2026, EGU26-7773, https://doi.org/10.5194/egusphere-egu26-7773, 2026.

EGU26-8215 | ECS | Orals | NP3.3

Accounting for spatially autocorrelated errors is necessary to infer cross-scale biodiversity–ecosystem functioning patterns in natural world 

Zibo Wang, Yunfei Li, Fen Zhang, Jianye Yu, Chongshan Wang, Long Chen, and Xiaohua Gou

Cross-scale biodiversity–ecosystem functioning (BEF) relationships are widely used to evaluate how biodiversity relates to ecosystem functioning across space. Theory predicts that when species turnover is incomplete across space, the BEF slope follows a characteristic hump-shaped scaling pattern, strengthening with increasing scale before weakening at broader scales. In real landscapes, however, biodiversity and ecosystem function often co-vary along environmental gradients, and spatial autocorrelation naturally increases with scale, potentially confounding regression-based BEF inference.

We combined simulations and field data to quantify how explicitly accounting for spatial autocorrelation (SAC) affects BEF scaling. In simulations, biodiversity and ecosystem function were generated under joint control of an environmental gradient and a spatial stochastic component, allowing SAC to emerge in both predictors and responses. In empirical analyses, we used forest inventory data from two temperate forests. We constructed a sequence of spatial scales by aggregating plots using a k-nearest-neighbor procedure, with k increasing from small to large neighborhoods. At each scale, we estimated BEF as the slope of species richness (SR) on biomass increment, while controlling for climate, soil, and trait covariates. We then contrasted non-spatial models with spatial models that include SAC in the residual structure, and quantified ΔBEF as the difference in SR slopes between spatial and non-spatial fits.

Across simulations and observations, ignoring SAC produced an apparently monotonic strengthening of BEF with scale. However, when SAC was included, the BEF scaling curve followed the predicted hump-shaped pattern. Moreover, ΔBEF increased with residual Moran’s I, indicating that stronger spatial dependence systematically inflates non-spatial BEF estimates as scale increases. Finally, the BEF slopes were negatively correlated with excess species richness and positively correlated with species turnover after correcting for SAC, consistent with the theory that species turnover plays a key role in BEF scaling. Our study emphasizes that accounting for SAC is essential for accurate BEF scaling and provides a useful approach for future studies.

How to cite: Wang, Z., Li, Y., Zhang, F., Yu, J., Wang, C., Chen, L., and Gou, X.: Accounting for spatially autocorrelated errors is necessary to infer cross-scale biodiversity–ecosystem functioning patterns in natural world, EGU General Assembly 2026, Vienna, Austria, 3–8 May 2026, EGU26-8215, https://doi.org/10.5194/egusphere-egu26-8215, 2026.

EGU26-9513 | ECS | Posters on site | NP3.3

CMIP6 simulations overestimate historical decadal temperature variability over most land areas 

Tom Schürmann and Kira Rehfeld

A robust understanding of the potential range of Earth system dynamics is essential for effectively simulating future climate change. Previous studies have reported increasing discrepancies in modelled temperature variability from global to local scale, and beyond decadal timescales, based on paleoclimate reconstructions. The instrumental record is most complete for the last 145 years. This limits a spatio-temporal assessment of historical temperature variability to multidecadal timescales at the upper end.  To this day, model-observation comparisons of regional climate variability have mostly focused on sea surface temperature. 

Here, we compare historical near-surface air temperatures from an ensemble of 50 CMIP6 models with similar initial conditions and two single-model initial-condition large ensembles (SMILE) with reanalysis and observation datasets. Following a robust like-for-like approach, all datasets are interpolated to a common grid of about 2.8 degrees and compared over the period of 1880 to 2015. Spectral analysis and filters reveal the structure of temperature variability over different spatial and temporal scales. Specifically, we focus on temperature variability on timescales of 10 to 30 years from global to local scale.  

On the global scale, models consistently display higher temperature variance in bands from 10 to 30 years than reanalysis data. Masking the analysis to regions with a consistent observational record confirms this trend. On the local scale, observed temperature variability can deviate substantially from the mean of stacked model standard deviation fields. For example, observed temperature variability in Europe lies in the lower tail of the model distribution. Vice versa, observed temperature in the southern Atlantic is representative of the model distributions' upper tail. Consistently over the multi-model ensemble and two SMILEs, decadal temperature variability is overestimated on land, but underestimated over the ocean. Nevertheless, there are exceptions to this pattern. For example, in the northern Atlantic, modelled variability overestimates observations consistent with the literature. Overall, these regional inconsistencies suggest that multiple, regionally heterogeneous processes are involved. 

How to cite: Schürmann, T. and Rehfeld, K.: CMIP6 simulations overestimate historical decadal temperature variability over most land areas, EGU General Assembly 2026, Vienna, Austria, 3–8 May 2026, EGU26-9513, https://doi.org/10.5194/egusphere-egu26-9513, 2026.

Empirical, data-driven models provide a complementary approach to dynamical models for simulating and forecasting weather and climate variability across daily to subseasonal timescales. We present ongoing work toward the development of a global, data-driven weather emulator for temperature and precipitation based on higher-order Linear Inverse Models (LIMs) formulated within the Empirical Model Reduction (EMR) framework. This formulation enables the representation of effective low-order dynamics, memory effects, and scale-dependent variability embedded in high-dimensional atmospheric fields. Rather than relying on a fixed EOF-based spatial decomposition, we explore a state-space approach in which the spatial basis is parameterized and optimized using Kalman filtering, thereby learning an optimal dynamical representation directly from the data.

The model is trained using a combination of NASA satellite observations and atmospheric reanalysis products. Near-surface temperature is modeled directly, while precipitation is represented using a pseudo-precipitation variable: precipitation equals observed rainfall where it occurs and otherwise corresponds to the negative air-column integrated water-vapor saturation deficit, defined as the amount of water vapor required to bring the atmospheric column to saturation at each vertical level. This formulation yields a continuous and dynamically meaningful representation of moist processes that facilitates the analysis of variability statistics across scales.

Model performance is evaluated in terms of its ability to reproduce observed variability statistics, temporal persistence, and subseasonal prediction skill, while dynamical diagnostics will be used to investigate the underlying sources of forecast skill. By focusing on the statistical and dynamical representation of variability, this work contributes to ongoing efforts to bridge data-driven modeling and theoretical perspectives on weather to climate variability across scales.

How to cite: Hébert, R. and Kravtsov, S.: A Global Data-Driven Weather Emulator for Temperature and Precipitation Based on Higher-Order Linear Inverse Modeling, EGU General Assembly 2026, Vienna, Austria, 3–8 May 2026, EGU26-10397, https://doi.org/10.5194/egusphere-egu26-10397, 2026.

EGU26-11706 | ECS | Posters on site | NP3.3

Atlantic Multidecadal Variability-like behaviour since 1850 is largely externally forced 

Yongyao Liang, Ed Hawkins, Gerard McCarthy, and Peter Thorne

Whether observed Atlantic Multidecadal variability (AMV) is truly an intrinsic internal mode of climate variability or an externally forced response remains contentious, with conflicting literature that North Atlantic SST variability arises from internal dynamics or external forcing. The availability of several single-model initial-condition large ensembles (SMILEs) and new insights into potential biases in sea surface temperature (SST) variations offer a fresh opportunity to reassess this question. We show that SMILE ensembles provide strong evidence that AMV-like variability is largely externally forced. New insights into potential SST biases also raise questions about apparent early 20th-century oscillatory behaviour, suggesting that discrepancies between observations and climate model simulations may not arise solely from model deficiencies. SMILE models with stronger multidecadal variability show weaker agreement with observed AMV phasing, even in the best-performing individual ensemble members, suggesting that large internal model variability may obscure the forced signal. We conclude that future variations in North Atlantic SST will very likely be driven primarily by future anthropogenic activities.

How to cite: Liang, Y., Hawkins, E., McCarthy, G., and Thorne, P.: Atlantic Multidecadal Variability-like behaviour since 1850 is largely externally forced, EGU General Assembly 2026, Vienna, Austria, 3–8 May 2026, EGU26-11706, https://doi.org/10.5194/egusphere-egu26-11706, 2026.

EGU26-12081 | ECS | Posters on site | NP3.3

Universal Multifractals characterization of high-resolution rainfall in the Paris region 

Atheeswaran Balamurugan, Auguste Gires, Daniel Schertzer, and Ioulia Tchiguirinskaia

Rainfall exhibits strong variability, intermittency and a heavy-tailed distributions across a wide range of scales. Understanding and characterizing these features is needed for numerous applications such as quantifying the extremes or merging measurements from various sensors operating at different space-time scales. 

This study presents a comprehensive multifractal analysis of high-resolution (30 s) 1D rainfall time series from the Paris region (2018 – 2024) using the Universal Multifractals (UM) framework. The data was collected with the help of optical disdrometers installed on the campus of Ecole nationale des Ponts et chausséee campus (https://hmco.enpc.fr/portfolio-archive/taranis-observatory/) UM framework has been widely used to characterize and simulate rainfall across wide range of scales with the help of only three parameters: the mean intermittency C₁, the multifractality index α and  the non-conservation parameter H. 

Spectral analysis identifies a clear scale break around 1 h, separating two distinct regimes. Coarse scales (>1h) are characterized by smooth, low-intermittency variability (spectral slope β ≈ 0.4), while fine scales (<1h) exhibit stronger spectral slope (β > 1). Accordingly, a regime-dependent analysis strategy is adopted: actual rainfall series are used at coarse scales to preserve large scale structure, while absolute values of fluctuation series are preferred at fine scales to reduce to study underlying conservative field and obtain cleaner scaling behaviour.

Analyses reveal strong multifractality (α ≈ 1.6 –1.7) and moderate intermittency (C₁ ≈ 0.12 – 0.45) at fine scale regimes. At coarser scale regimes, rainfall exhibits smoother variability with moderate multifractality (α < 1)and lower intermittency (C₁ ≈ 0.15–0.18). The UM parameters display good inter annual stability over 2018 – 2024, mild seasonal modulation (slightly higher C₁ in summer), and individual rain-event analyses were performed to examine event-to-event variability, indicating substantial heterogeneity between events.  

These results demonstrate the relevance of the UM framework for quantitatively characterizing rainfall variability in the Paris region. Initial attempts to interpret the observed differences between fine and coarse scales regimes using a unique model will be presented. 

Authors acknowledge partial financial support by the European Union as part of the Horizon Europe programme, Marie Skłodowska-Curie Actions, call COFUND-2022 and under grant agreement number 101126720; the France-Taiwan Ra2DW project (grant number by the French National Research Agency – ANR-23-CE01-0019-01).

How to cite: Balamurugan, A., Gires, A., Schertzer, D., and Tchiguirinskaia, I.: Universal Multifractals characterization of high-resolution rainfall in the Paris region, EGU General Assembly 2026, Vienna, Austria, 3–8 May 2026, EGU26-12081, https://doi.org/10.5194/egusphere-egu26-12081, 2026.

EGU26-12716 | ECS | Posters on site | NP3.3

Linking meteorological extremes to clay shrink–swell hazard: Insights from 65 years of climate data 

Carl Tixier, Pierre-Antoine Versini, and Benjamin Dardé

Clay shrink-swell (CSS) behavior arises from fluctuations in soil moisture driven by seasonal cycles of rainfall and drought. This phenomenon causes ground movements that can damage building foundations and infrastructure. In France, where approximately 54% of constructions are exposed to this hazard, CSS ranks as the second most significant category of natural disaster insurance claims.

The French central reinsurance fund reports that the average annual cost, calculated over a five-year sliding window, remained below €300 million in 2016. Since 2017, this figure has increased, reaching about €1.35 billion as of 2025. Climate change is expected to amplify droughts, heatwaves, and precipitation extremes, further intensifying CSS processes and potentially rendering their financial burden unsustainable for insurers.

To address this issue, we analyze meteorological data from the SAFRAN reanalysis provided by Météo-France, which offers daily observations at an 8 km spatial resolution across France since 1958. Our study applies geostatistical and multifractal techniques to characterize spatiotemporal variability, identify scale breaks, estimate extreme values, and examine spectral properties of key climatic variables. Specifically, we compute:

  • Multifractality index (α): It measures the speed of change in intermittency;
  • Mean singularity (C₁): Average singularity, characterizes intermittency;
  • Maximum probable singularity (γₛ): maximum probable singularity.

Tracking these parameters from 1958 to 2025 enables us to identify regions most affected by changes in extremes. Analyses focus on variables influencing CSS behavior, including precipitation, temperature, evapotranspiration, and soil moisture index.

Finally, we compare the evolution of extremes in these climatic parameters with trends in CSS occurrence, quantified through insurance claims. This spatial and temporal comparison between multifractal indicators and affected areas provides insights into the relationship between the intensification of extreme meteorological events and the dynamics of clay shrink-swell processes.

This work is part of the IRGAK (inhibition of clay shrinkage-swelling by K+ ion injection) project, founded by the French Agency for Ecological Transition (ADEME). Its objective is to model the link between climate variability and CSS, and to propose adaptation strategies to mitigate a risk that is expected to increase significantly with climate change, leading to escalating insurance costs and growing socio-economic impacts.

How to cite: Tixier, C., Versini, P.-A., and Dardé, B.: Linking meteorological extremes to clay shrink–swell hazard: Insights from 65 years of climate data, EGU General Assembly 2026, Vienna, Austria, 3–8 May 2026, EGU26-12716, https://doi.org/10.5194/egusphere-egu26-12716, 2026.

EGU26-14920 | Orals | NP3.3

Understanding extreme heat: Causes and time scales revealed by Rényi information transfer 

Milan Paluš, Pouya Manshour, Anupam Ghosh, Zlata Tabachová, Eva Holtanová, and Jiří Mikšovský

Recently, Paluš et al. (2024) demonstrated that information-theoretic generalization of Granger causality – based on conditional mutual information/transfer entropy – when reformulated in terms of Rényi entropy, provides a time-series analysis tool suitable for identifying the causes of extreme values in affected variables.

Investigating the causes of warm summer surface air temperature extremes in Europe, Rényi information transfer highlights the role of blocking events among large-scale circulation patterns and modes of variability. Soil moisture interacts with air temperature on a daily scale, exhibiting bidirectional causal effects on the mean, whereas its influence on temperature extremes emerges over longer time scales, from a fortnight to a month. In contrast, the causal effect of blocking on temperature extremes is primarily observed at the daily scale. Using tools from Rényi information theory, we aim to disentangle this complex, multicausal, multiscale phenomenon and identify the regions in Europe where these factors modulate the probability of extreme summer heat.


This research was supported by the Johannes Amos Comenius Programme (P JAC), project No. CZ.02.01.01/00/22_008/0004605, Natural and anthropogenic georisks; and by the Czech Science Foundation, Project No. 25-18105S.

Paluš, M., Chvosteková, M., & Manshour, P. (2024). Causes of extreme events revealed by Rényi information transfer. Science Advances, 10(30), eadn1721.


How to cite: Paluš, M., Manshour, P., Ghosh, A., Tabachová, Z., Holtanová, E., and Mikšovský, J.: Understanding extreme heat: Causes and time scales revealed by Rényi information transfer, EGU General Assembly 2026, Vienna, Austria, 3–8 May 2026, EGU26-14920, https://doi.org/10.5194/egusphere-egu26-14920, 2026.

EGU26-14999 | Orals | NP3.3

From Eons to Epochs: multifractal  Geological Time and a compound multifractal-Poisson model 

Shaun Lovejoy, Andrej Spiridonov, Raphael Hebert, and Fabrice Lambert

Geological time is punctuated by events that define biostrata and the Geological Time Scale’s (GTS) hierarchy of eons, eras, periods, epochs, ages. Paleotemperatures and macroevolution rates, have already indicated that the range ≈ 1 Myr to (at least) several hundred Myrs) is a scaling (hence hierarchical) “megaclimate” regime.  We apply analysis techniques including Haar fluctuations, structure functions trace moment and extended self-similarity to the temporal density of the boundary events (r(t)) of two global and four zonal series.  We show that r(t) itself is a new paleoindicator and we determine the fundamental multifractal exponents characterizing the mean fluctuations, the intermittency and the degree of multifractality.  The strong intermittency allows us to show that the (largest) megaclimate  scale is at least  ≈ 0.5 Gyr.  We also analyze a Precambrian series going back 3.4Gyrs directly confirming this limit and allowing us to quantatively compare the Phanerozoic with the Proterozoic eons.

We find that the probability distribution of the intervals (“gaps”) between boundaries and find that its tail is also scaling with an exponent qD≈ 3.3 indicating huge variability with occasional very large gaps such that it’s third order statistical moment barely converges.  The scaling in time implies that record incompleteness increases with its resolution (the “Resolution Sadler effect”), while scaling in probability space implies that incompleteness increases with sample length (the “Length Sadler effect”). 

The density description of event boundaries is only a useful characterization over time intervals long enough for there to be typically one or more events.  In order to model the full range of scales (and low to high r(t)), we introduce a compound Poisson-multifractal model in which the multifractal process determines the probability of a Poisson event.   The model well reproduces all the observed statistics.

Scaling changes our understanding of life and the planet and it is needed for unbiasing many statistical paleobiological and geological analyses, including unbiasing spectral analysis of the bulk of geodata that are derived from cores.

How to cite: Lovejoy, S., Spiridonov, A., Hebert, R., and Lambert, F.: From Eons to Epochs: multifractal  Geological Time and a compound multifractal-Poisson model, EGU General Assembly 2026, Vienna, Austria, 3–8 May 2026, EGU26-14999, https://doi.org/10.5194/egusphere-egu26-14999, 2026.

EGU26-15166 | ECS | Orals | NP3.3 | Highlight

Global sonde datasets do not support a mesoscale transition in the turbulent energy cascade 

Thomas DeWitt, Tim Garrett, Karlie Rees, and Stephen Oppong

The dynamics driving Earth's weather are commonly presumed to be governed by a hierarchy of distinct dynamical mechanisms, each operating over some limited range of spatial scales. The largest scales are argued to be driven by quasi-two-dimensional turbulence, the mesoscales by gravity waves, and the smallest scales by 3D isotropic turbulence. In principle, such a hierarchy should result in observable breaks in atmospheric kinetic energy spectra at discrete points as one mechanism transitions to the next. Using global radiosonde and dropsonde datasets, we show that this view is not supported in observations. Between 200m and 8km, we find that structure functions calculated along the vertical direction display a Hurst exponent of H_v \approx 0.6, which is inconsistent with either gravity waves (H_v = 1) or 3D turbulence (H_v = 1/3). In the horizontal directions, large-scale structure functions between 200km and 1800km display a Hurst exponent of H_h \approx 0.4, which is inconsistent with quasi-geostrophic dynamics (H_h = 1). We show that these observations are instead consistent with a lesser-known theory of stratified turbulence proposed by Lovejoy and Schertzer in 1985, where at all scales the dynamics obey a single anisotropic turbulent cascade with H_v=3/5 and H_h =1/3.

Our results suggest a reinterpretation of atmospheric dynamics: rather than being controlled by a hierarchy of distinct dynamical elements, atmospheric flow should instead be thought of as a superposition of anisotropic turbulent eddies that continually cascade from large scales to small scales. We show how this view may be interpreted literally and used to construct photorealistic and quantitatively accurate simulations of atmospheric volumes, and without integration of the hydrodynamic equations. We argue that the model also provides a more intuitive basis for interpreting both the intermittent and the anisotropic aspects of the observed statistics of the atmosphere.

How to cite: DeWitt, T., Garrett, T., Rees, K., and Oppong, S.: Global sonde datasets do not support a mesoscale transition in the turbulent energy cascade, EGU General Assembly 2026, Vienna, Austria, 3–8 May 2026, EGU26-15166, https://doi.org/10.5194/egusphere-egu26-15166, 2026.

The background continuum of climate variability recorded in proxy records is often modelled using parametric spectral models, such as power-laws, auto-regressive processes, or stochastic differential equations.

However, fitting such models to proxy data is usually done in an ad-hoc manner, such as by using least-squares fitting in log-log space.

Here I will discuss two formal Bayesian methods for fitting parametric stochastic models to proxy data. One is a spectral-domain approach based the Whittle likelihood. The other is a time-domain approach based on Gaussian Processes.

In both cases, I show how the standard approaches can be modified to account for some of the ways in which climate proxies alter spectral slopes: measurement error, time uncertainty, uneven sampling, and smoothing (e.g. from diffusion or bioturbation). Finally, I use synthetic data generated from power-law and Matern processes, and proxy-system models, to show expected skill of the two approaches for different proxies.

I find that these formal approaches provide significant bias reduction relative to typical ad-hoc approaches, allowing for much more accurate calibration of stochastic models of climate variability across scales.

How to cite: Proistosescu, C.: Bayesian methods for fitting spectral models to noisy, sparse, proxy data, EGU General Assembly 2026, Vienna, Austria, 3–8 May 2026, EGU26-15967, https://doi.org/10.5194/egusphere-egu26-15967, 2026.

EGU26-19829 | Posters on site | NP3.3

Extending the Fresnel Platform with a 3D Isometric Graphical Interface for Land-Use Scenario Design in Hydrological Modeling   

Guillaume Drouen, Daniel Schertzer, Auguste Gires, Pierre-Antoine Versini, and Ioulia Tchiguirinskaia

Urban areas are increasingly exposed to localized extreme rainfall events, with evidence suggesting a trend toward higher precipitation volumes and more frequent short-duration, high-intensity storms, posing major challenges to infrastructure resilience and public safety. 

Urban hydrometeorology is characterized by highly nonlinear processes, strong interactions with geophysical systems, and pronounced variability across spatial and temporal scales, making both scientific understanding and operational management particularly demanding. 

Within this context, the Fresnel platform is a state-of-the-art urban hydrometeorological observatory combining conceptual modeling approaches with extensive field measurements. One of its components, RadX, is a Software-as-a-Service (SaaS) platform that provides real-time and historical data from high-resolution sensors, together with a graphical user interface (GUI) for Multi-Hydro, a fully distributed and physically based hydrological model developed at École nationale des ponts et chaussées (ENPC). Multi-Hydro relies on four open-source software components representing different processes of the urban water cycle. The RadX GUI allows users to efficiently run simulations using dedicated high-performance computing resources, configure multiple scenarios for a given catchment, modify land-use parameters, and assess their impacts on drainage system discharges. 

The originality of this contribution lies in the development of a new 3D isometric graphical interface based on an open-source game engine. Unlike conventional interfaces relying on the editing of raster matrices, this approach provides a more intuitive and spatially explicit visualization of land-use configurations. It enables a clearer representation and manipulation of Nature-based Solutions (NbS), such as porous pavements, whose implementation often remains abstract when expressed solely through raster data. 

Beyond hydrological modeling, RadX also supports integrating shared value principles into business models to enhance resilience and sustainability. Within the PIA3 TIGA-CFHF project (“Construire au futur, habiter le futur”), it promotes an integrated vision where economic activities are situated within a complex socio-environmental system, aligning economic performance with environmental and societal objectives. 

To support this transition, RadX aims to incorporates multifractal and advanced socio-economic analysis tools that enable organizations to assess performance and develop shared value–oriented strategies aligned with measurable environmental objectives. 

The RadX platform is continuously improved through an iterative development process driven by feedback from students, academic researchers, and industry practitioners, and may integrate additional visualization or forecasting components in future developments. 

How to cite: Drouen, G., Schertzer, D., Gires, A., Versini, P.-A., and Tchiguirinskaia, I.: Extending the Fresnel Platform with a 3D Isometric Graphical Interface for Land-Use Scenario Design in Hydrological Modeling  , EGU General Assembly 2026, Vienna, Austria, 3–8 May 2026, EGU26-19829, https://doi.org/10.5194/egusphere-egu26-19829, 2026.

EGU26-20114 | Orals | NP3.3

Geophysical extremes, scaling and fractal support induced by zero-values 

Ioulia Tchiguirinskaia, Auguste Gires, and Daniel Schertzer

In the era of the data-driven research, the zero-values of geophysical fields require increased attention in order to improve understanding of their effective impacts on the prediction of extreme geophysical phenomena.

In everyday life, we use the idea that zero denotes the absence of quantity, whereas in geophysics, it refers to a chosen reference point, not necessarily the absence of a physical phenomenon.  It then results from the removal of the background field, either by design of the measured quantity or due to the current limitations of empirical detection.

Regardless of their origin, the presence of zeros in data significantly alters the resulting statistical distributions and influences the estimates of statistical parameter. Regarding universal multifractals (UM), two approaches have been favoured over the last thirty years to mimic the appearance of zeros and/or quantify their influence on the resulting UM estimates. The first, among the most widely used, relies on multiplying of a UM field by an independent fractal model, the ‘beta-model’, i.e. to assume the field has physically a fractal support. The second consist of thresholding the UM singularities and ignoring the fluctuations below the threshold, i.e. assuming that there is a detection of low field values.

This presentation will revisit these two approaches, emphasizing the significant resulting differences in the theoretical behaviour of the multifractal phase transitions, which are responsible for the behaviour of multifractal extremes. Then practical methods for preliminary detection of the most appropriate zero-creation mechanism within the data will be illustrated with concrete examples from geophysical fields.

How to cite: Tchiguirinskaia, I., Gires, A., and Schertzer, D.: Geophysical extremes, scaling and fractal support induced by zero-values, EGU General Assembly 2026, Vienna, Austria, 3–8 May 2026, EGU26-20114, https://doi.org/10.5194/egusphere-egu26-20114, 2026.

EGU26-21023 | ECS | Posters on site | NP3.3

A Dye-Tracer Forward-Modeling Framework for Deglacial Meltwater Reconstruction 

Laura Endres, Ruza Ivanovic, Yvan Romé, and Heather Stoll

Freshwater input from melting polar ice sheets can profoundly alter ocean circulation, in particular the Atlantic Meridional Overturning Circulation (AMOC), with far-reaching climatic consequences. Yet the sensitivity of the AMOC to freshwater forcing remains highly uncertain: models exhibit divergent responses depending on source location, background climate state, and circulation regime, while the instrumental record is too short to unambiguously detect and characterise a melt-driven weakening.

Palaeoclimate archives, especially from the last deglaciation, provide ample evidence of melt events through indicators such as surface-ocean δ¹⁸O and biomarkers (e.g. BIX) in sediment cores and speleothems. However, the spatial and temporal characteristics of the underlying meltwater forcing remain poorly constrained. While meltwater discharge into the North Atlantic may be local, rapid, and event-like, its redistribution and impact on the AMOC unfold over centuries, complicating direct inference from surface-ocean proxies. Consequently, in deglacial general circulation model simulations, meltwater forcing is typically inferred indirectly from ice-sheet reconstructions or expected climate responses, resulting in a wide spread of applied forcings that propagates into substantial uncertainty.

Here we introduce a new forward-modelling approach aimed at strengthening the estimation and detection of regionally distinct and temporally evolving surface-ocean meltwater signals in proxy archives. We develop an empirical Green’s-function (impulse-response) framework based on a new suite of HadCM3 simulations, in which conservative tracers track meltwater originating from different source regions under distinct AMOC modes representative of deglacial conditions. Signals at terrestrial proxy sites are inferred using atmospheric back-trajectory analysis. The resulting kernels encode the system’s response for different source regions across multiple time lags, allowing any transient meltwater history to be reconstructed through discrete convolution with a derived 500-year response function. Applied to the last deglaciation, the framework demonstrates how differences between ice-sheet reconstructions (e.g. GLAC-1D versus ICE-6G) translate into distinct surface-ocean meltwater anomalies in the North Atlantic. The model highlights the critical role of meltwater amount, timing, and injection location, as well as the underlying AMOC circulation mode, in shaping surface-ocean proxy signals. It further provides quantitative estimates of how meltwater-related surface anomalies propagate to proxy sites distributed across the North Atlantic. Notably, transitions between AMOC modes can effectively mask even massive meltwater pulses, such as Meltwater Pulse 1A, at certain proxy locations. This forward-modelling approach thus offers an alternative perspective on deglacial freshwater forcing in the proxy realm and represents a step towards data-constrained reconstructions of past surface-ocean freshening and AMOC resilience.

How to cite: Endres, L., Ivanovic, R., Romé, Y., and Stoll, H.: A Dye-Tracer Forward-Modeling Framework for Deglacial Meltwater Reconstruction, EGU General Assembly 2026, Vienna, Austria, 3–8 May 2026, EGU26-21023, https://doi.org/10.5194/egusphere-egu26-21023, 2026.

EGU26-153 | ECS | Orals | NP5.1

WeGen FastEvaluation: An open-source tool for the evaluation and comparison of machine learning models in weather and climate applications 

Ilaria Luise, Savvas Melidonis, Julius Polz, Sorcha Owens, Timothee Hunter, Christian Lessig, and Michael Tarnawa

The next generation of machine learning (ML) weather and climate models is increasingly trained on a wide variety of datasets, including reanalyses, forecasts and observations . This diversity can typically not be handled by existing evaluation tools that are often limited to gridded data or fixed lead times Furthermore, many existing evaluation frameworks are developed internally by institutions, remain closed-source, and lack interoperability across platforms and high-performance computing (HPC) environments. This creates a gap in the ability to systematically assess model skill across different data streams, experiments, and computing infrastructures.

The WeGen FastEvaluation tool, developed within the WeatherGenerator project, aims to bridge this gap. It provides a flexible, open-source framework designed to evaluate machine learning–based weather prediction models across a wide range of dataset types and formats. Unlike most existing tools, WeGen FastEvaluation makes minimal assumptions about data structure, allowing consistent analysis of both gridded and unstructured inputs, deterministic and probabilistic outputs, and multiple forecast lead times. Built on xarray, the WeGenFastEvaluation supports multi-dimensional data handling, including probabilistic outputs and ensemble forecasts. The tool enables efficient computation of skill metrics and generation of 2D visualizations, allowing users to compare an arbitrary number of model runs across different data streams and forecast configurations.

The presentation will introduce the design and capabilities of the WeGen FastEvaluation, highlighting its integration within the WeatherGenerator workflow. Through examples, we demonstrate how the WeGen FastEvaluation tool enables consistent benchmarking, collaborative analysis across HPC systems, and reproducible ML-for-weather research.


How to cite: Luise, I., Melidonis, S., Polz, J., Owens, S., Hunter, T., Lessig, C., and Tarnawa, M.: WeGen FastEvaluation: An open-source tool for the evaluation and comparison of machine learning models in weather and climate applications, EGU General Assembly 2026, Vienna, Austria, 3–8 May 2026, EGU26-153, https://doi.org/10.5194/egusphere-egu26-153, 2026.

EGU26-1553 | ECS | Orals | NP5.1

Deriving meaning from metrics – a new approach for machine learning nowcasting verification 

Jakub Lewandowski, Leif Denby, and Andrew Ross

Nowcasting - the prediction of weather conditions over the next few hours - is critical for mitigating the impacts of severe convective storms. Machine learning offers new opportunities for improving nowcasting, particularly for convective precipitation, where traditional numerical models struggle. Yet, despite rapid progress in model development, evaluating these models remains a major challenge. Current verification practices typically rely on a narrow set of standard metrics that often fail to capture the complexity of atmospheric phenomena and cannot distinguish between different types of errors, providing limited insight into the specific weaknesses of the models.

This research introduces a comprehensive verification framework that combines carefully crafted datasets with sensitivity analyses, aiming to transform metric-based evaluation into a more informative process. Synthetic datasets are generated using ArtPrecip, a novel tool that randomly generates radar-like precipitation fields while allowing full control over properties such as motion, initiation, and evolution. Observational radar data are classified based on synoptic setting and observed precipitation properties, using different dimension-reduction methods. Sensitivity analyses examine how existing metrics respond to various error patterns, providing guidance on interpreting benchmark results.

The resulting system provides a well-defined and well-described set of benchmarks and enables reproducible, objective, and meaningful comparison of models. By addressing gaps in evaluation methodology, this work contributes to a more robust assessment of machine learning nowcasting skill and its applicability to severe weather forecasting.

How to cite: Lewandowski, J., Denby, L., and Ross, A.: Deriving meaning from metrics – a new approach for machine learning nowcasting verification, EGU General Assembly 2026, Vienna, Austria, 3–8 May 2026, EGU26-1553, https://doi.org/10.5194/egusphere-egu26-1553, 2026.

EGU26-1764 | ECS | Posters on site | NP5.1

Spectral representations for regional AI-based weather prediction 

Emily O'Riordan

Both dynamical and AI-based NWP have seen success in using spectral transformations to represent atmospheric variables efficiently. In particular, Fourier-based representations are widely adopted due to fast computational methods and compact encoding of large-scale structure. However, as the NWP community targets higher-resolution models, Fourier-bases may inadequately represent the sharp gradients and multi-scale features that often characterise extreme weather events. Furthermore, for limited-area domains, Fourier representations can impose artificial periodicity, making them less physically appropriate.

In this work, we investigate whether alternative spectral transformations better support AI-based NWP in regional, extreme-weather settings. We systematically compare neural forecasting models trained using Fourier, wavelet, and Legendre spectral representations, assessing their ability to predict multiple atmospheric variables over the Aotearoa New Zealand domain.  Wavelet and polynomial bases are explicitly designed for bounded domains and provide multi-scale, non-periodic representations, making these transformations more suitable for the regional forecasting task.

Aotearoa New Zealand provides an ideal test-bed for these methods, as a region with complex coastlines, steep orography, and frequent exposure to high-impact weather systems. Models are trained and evaluated on reanalysis datasets (ERA5 and BARRA-2), using standard verification metrics and case studies of major Aotearoa New Zealand storms such as Cyclones Gabrielle and Bola. Our results demonstrate that spectral choice has a measurable impact on forecast skill, particularly for extremes and fine-scale structure.

By analysing how different spectral representations influence AI-NWP performance in a regional context, this work provides guidance on the appropriate use of spectral methods for limited-area forecasting, and contributes to the development of more accurate and physically consistent AI-driven weather prediction systems for localised and extreme events.

How to cite: O'Riordan, E.: Spectral representations for regional AI-based weather prediction, EGU General Assembly 2026, Vienna, Austria, 3–8 May 2026, EGU26-1764, https://doi.org/10.5194/egusphere-egu26-1764, 2026.

EGU26-2056 | ECS | Posters on site | NP5.1

An NWP-Free, Observation-Driven Deep Learning Approach to Heavy-Rainfall Nowcasting Beyond the Three-Hour Limit  

Ryu Shimabukuro, Tomohiko Tomita, Tsuyoshi Yamaura, and Ken-ichi Fukui

Quasi-stationary convective bands over Kyushu, Japan, frequently trigger rainy-season disasters, and hours with ≥50 mm h−1 rainfall are increasing. Yet skillful nowcasts beyond 3 h remain limited. This study presents FlowsNet, an observation-based multi-sensor fusion model that learns directly from radar/rain gauge-analyzed precipitation, surface variables from ground stations, geostationary satellite imagery, and satellite-derived precipitation context. The model targets category-4 (C4; ≥50 mm h−1) rainfall and incorporates two attention mechanisms: a channel-wise module that weights informative modalities and a spatial module that aligns features with banded structures at multi-hour leads. Training uses a tail-aware ordinal loss that couples focal reweighting with Earth Mover’s Distance to highlight rare extremes. FlowsNet maintains a non-zero C4 Critical Success Index through 6 h. From 4 to 6 h, it matches or exceeds the Japan Meteorological Agency’s very-short-range forecast, and it outperforms a leading extrapolation method and current deep-learning nowcasters. Case studies show preserved band geometry and corridor placement at long lead over complex terrain. Ablation experiments identify satellite water-vapor context and near-surface humidity as key for long-lead C4 prediction; combining satellite context with surface observations stabilizes placement and reduces false alarms. By avoiding numerical weather prediction model state and objective analyses/reanalyzes, the approach reduces latency and hardware demand, improves portability and resilience when model cycles degrade, and offers a practical route to earlier and more transferable warnings for extreme rainfall events.

How to cite: Shimabukuro, R., Tomita, T., Yamaura, T., and Fukui, K.: An NWP-Free, Observation-Driven Deep Learning Approach to Heavy-Rainfall Nowcasting Beyond the Three-Hour Limit , EGU General Assembly 2026, Vienna, Austria, 3–8 May 2026, EGU26-2056, https://doi.org/10.5194/egusphere-egu26-2056, 2026.

Rapid population growth and the continuous restructuring of economic relationships have significantly increased global demand for efficient transportation systems. In this context, accurate prediction of the Rate of Penetration (ROP) of the Tunnel Boring Machine (TBM) is crucial for construction planning, cost estimation, and real-time operational decision-making in TBM tunneling. When TBMs are appropriately selected in terms of type and capacity according to route conditions and are operated in compliance with sound engineering principles, they enable the excavation of tunnels at very high rate of penetration while maintaining economic feasibility. Estimating tunnel completion time based on geological and geotechnical conditions along the tunnel alignment and the operational capacity of the TBM has been one of the most intensively studied topics in tunneling research over the past two decades. However, recent advances in artificial intelligence (AI) techniques offer significant potential for achieving higher predictive performance in ROP estimation. In light of these developments, this study evaluates the performance of various AI algorithms using data obtained from the T2 tunnel of the Bahçe–Nurdağ (Türkiye) twin tunnels, the longest railway tunnels in Türkiye. In addition, synthetic input parameters were generated to enhance prediction accuracy beyond that achieved in previous studies. The results demonstrate that incorporating these synthetic input parameters leads to improved model performance, with an increase of up to 2.65% in terms of the correlation coefficient. Given the already high predictive capability achieved without synthetic inputs (R² = 0.8637), the improvement obtained in this study (R² = 0.8866) is particularly noteworthy. Overall, the findings indicate that ensemble-based artificial intelligence models incorporating synthetic input data can predict ROP of TBM with very high accuracy, thereby offering a robust and reliable tool for estimating tunnel completion times in TBM tunneling projects.

How to cite: Gokceoglu, C. and Ozcan, A.: Use of Synthetic Input Parameters for Enhancing Prediction Performance of Rate of Penetration of TBM , EGU General Assembly 2026, Vienna, Austria, 3–8 May 2026, EGU26-2357, https://doi.org/10.5194/egusphere-egu26-2357, 2026.

EGU26-2503 | ECS | Posters on site | NP5.1

 Spatial aggregation of ROC and PR curves 

Romain Pic, Zhongwei Zhang, Johanna Ziegel, and Sebastian Engelke

Receiver Operating Characteristic (ROC) and Precision–Recall (PR) curves are widely used to assess the discrimination ability of forecasts for binary events, such as threshold exceedances or warnings of extreme events. In weather forecasting, forecasts are provided as spatial fields, yielding location-wise ROC and PR curves that are often aggregated to facilitate comparison, although the effect of the aggregation strategy on performance assessment remains poorly understood.

We investigate how different aggregation strategies for ROC and PR curves affect the assessment of discrimination ability. In particular, we identify conditions under which aggregation strategies satisfy two desirable properties for fair comparison: preservation of dominance between forecasts and preservation of concavity of the curves. We review commonly used aggregation approaches from the literature, analyze their theoretical properties, and highlight potential pitfalls that may lead to misleading interpretations. Based on these findings, we provide practical guidelines for the interpretation of aggregated ROC and PR curves. The proposed framework is illustrated using AI-based global weather forecasts, showing how different aggregation strategies can lead to different rankings.

How to cite: Pic, R., Zhang, Z., Ziegel, J., and Engelke, S.:  Spatial aggregation of ROC and PR curves, EGU General Assembly 2026, Vienna, Austria, 3–8 May 2026, EGU26-2503, https://doi.org/10.5194/egusphere-egu26-2503, 2026.

EGU26-4039 | ECS | Posters on site | NP5.1

A Framework for Explainable AI in Weather Forecasting: Diagnosing Deep Learning Models via Gradient-Based Attributions 

Younes Essafouri, Corentin Seznec, Luciano Drozda, Laure Raynaud, and Laurent Risser

Each day, potentially critical decisions made by governments and organizations depend on accurate weather forecasts, determining whether to evacuate for a storm or simply to carry an umbrella. In this context, Deep Learning (DL) models are becoming a popular and computationally efficient alternative to traditional Numerical Weather Prediction (NWP) models, offering the potential to capture complex data patterns which may be missed using physical explicit equations (Lam et al., 2023). However, their opaque (black-box) nature remains a barrier to operational trust.

Explainable AI (XAI) aim to address this opacity by revealing the decision process behind predictions. Indeed, classical XAI techniques reveal when DL models rely on spurious correlations rather than causal physical mechanisms to deliver predictions (Geirhos et al., 2020). However, their direct application to meteorological data often yields attribution maps that are noisy (Kim et al., 2019) and difficult to interpret due to their high dimensionality. It additionally remains unclear whether these tools can consistently identify the complex physical drivers inherent in NWP (Bommer et al., 2024).

Based on previous works (Bommer et al., 2024; Kim et al., 2023; Yang et al., 2024), we establish a framework to generate compact and interpretable explanations of local weather forecast predictions obtained using deep neural networks. These explanations build on the output of gradient-based methods like VanillaGrad and SmoothGrad (Smilkov et al., 2017), which are scalable to high-dimensional data. More specifically, our framework first allows for targeted analysis by selecting a region of interest (e.g., Paris area) and a target variable (e.g., accumulated precipitation). It therefore answers the question: "Why did the neural network predict this feature at this location?" To do so, it first computes dense attribution maps with respect to all input variables (e.g., wind components at varying altitudes). Traditionally, bounding boxes are used to define the region of importance in these maps (Kim et al., 2023). However, they are unable to provide detailed directional information. We therefore propose in our framework to determine regions of importance using "confidence ellipses" that summarize the center, main directions, and importance of the most concentrated regions. Unlike bounding boxes, the representation of these ellipses, with the raw attribution maps as a background, provides rich and easily interpretable information regarding the directionality and spatial spread of the model's focus.

Preliminary results on the hybrid transformer-convolutional-based model UNETR++ (Shaker et al., 2024) trained and tested on the TITAN dataset from Météo-France (comprising hourly surface and vertical profiles of wind, temperature, and geopotential over metropolitan France) demonstrate our framework's pertinence for explaining predictions from deep neural networks. We were able to verify that different trained models successfully capture the vertical hierarchy of atmospheric variables, evidenced by an effective receptive field that expands with increasing altitude. More interestingly, our framework allowed us to identify systematic biases learned during training that correlate with known physical occurrences. These findings serve as a foundational step for future work on developing novel explainability methods to detect whether trained models capture complex physical mechanisms.

How to cite: Essafouri, Y., Seznec, C., Drozda, L., Raynaud, L., and Risser, L.: A Framework for Explainable AI in Weather Forecasting: Diagnosing Deep Learning Models via Gradient-Based Attributions, EGU General Assembly 2026, Vienna, Austria, 3–8 May 2026, EGU26-4039, https://doi.org/10.5194/egusphere-egu26-4039, 2026.

Artificial intelligence (AI) and machine learning (ML) tools are rapidly growing in capability and application across the weather enterprise.  Fully AI-based numerical weather prediction (NWP) emulators are beginning to outperform traditional NWP, and many weather agencies have started to adopt ML-derived guidance products into the forecast process.  For example, the United States National Weather Service’s Storm Prediction Center (SPC) has implemented a number of ML models to aid in the prediction and detection of tornadoes, severe wind, hail, and wildfires.  However, the development of these AI/ML products and their subsequent transition into SPC operations revealed several challenges which potentially slowed their overall adoption into the forecasters’ workflow.  This presentation will discuss several factors that impacted the adoption of AI/ML into forecast operations and highlight some best practices used by SPC to help streamline the research-to-operations transition.  Case studies of AI/ML projects that were successfully transitioned into SPC operations will help illustrate the application of these best practices and showcase some of the common pitfalls faced by AI/ML development for operational applications.

How to cite: Harrison, D., Jirak, I., and Marsh, P.: Lessons Learned from the Development and Implementation of AI Forecast Guidance at the U.S. National Weather Service’s Storm Prediction Center, EGU General Assembly 2026, Vienna, Austria, 3–8 May 2026, EGU26-4103, https://doi.org/10.5194/egusphere-egu26-4103, 2026.

EGU26-4550 | ECS | Orals | NP5.1

From Forecast Skill to Forecast Value: Do AI Weather Forecasts Deliver Real-World Economic Benefits? 

Leonardo Olivetti, Gabriele Messori, Paolo Avner, and Stéphane Hallegatte
Recent years have witnessed rapid advances in data-driven weather forecasting, with an ever-increasing number of AI-based models reporting skill comparable to or exceeding that of physical models. Comparing AI and physical forecasting systems, however, remains challenging: these models often exhibit a different set of strengths and weaknesses, making their real-world value strongly dependent on the specific application. Yet, most existing comparisons of AI and physical models focus exclusively on meteorological skill, largely overlooking the question of forecast value in real-world decision-making.
 
In this talk, we tackle this question by proposing an application-dependent framework to evaluate the real-world value of AI weather forecasts. The framework is based on the classical concept of relative economic value, which we extend in several novel ways to better reflect realistic use cases. Besides allowing for varying cost–loss ratios to represent different protection and forecast costs, we introduce flexible penalty functions to account for compounding losses from sequential forecast misses as well as declining user trust due to repeated false alarms.
 
We apply the framework to a number of case studies, comprising cities exposed to high economic losses from weather-related natural hazards. We show that forecast value in these contexts depends not only on forecast and prevention costs, but also on the choice of penalty function and on whether compound losses from repeated misses or false alarms are considered. We thus advocate for evaluating real-world value alongside meteorological skill when developing and comparing forecasting models, to ensure that improvements in predictive accuracy translate into meaningful societal and economic benefits.

How to cite: Olivetti, L., Messori, G., Avner, P., and Hallegatte, S.: From Forecast Skill to Forecast Value: Do AI Weather Forecasts Deliver Real-World Economic Benefits?, EGU General Assembly 2026, Vienna, Austria, 3–8 May 2026, EGU26-4550, https://doi.org/10.5194/egusphere-egu26-4550, 2026.

Accurate real-time tracking of infectious diseases is often challenged by reporting delays. Existing nowcasting methods typically struggle with three major limitations: they either (1) oversimplify complex reporting delays; (2) ignore spatial connections by treating regions separately; or (3) are too computationally expensive when handling detailed spatio-temporal data, making them impractical for real-time use.

To solve these issues, we propose a flexible Bayesian spatio-temporal framework that incorporates a delay adjustment structure, allowing the framework to adapt to changing reporting behaviors while effectively capturing spatial dependencies. To ensure this complex model is fast enough for real-time applications, we implement it via inlabru using a novel linear approximation strategy. This method significantly improves computational efficiency, enabling scalable inference without the speed bottlenecks of traditional MCMC methods.

We validate the framework by monitoring dengue in Brazilian states during 2025. Our model outperforms the baseline model in 22 out of 26 states (85\% win rate), successfully capturing rapid trend shifts and providing more precise estimates compared to existing systems.

Our findings demonstrate that combining detailed delay dynamics with a spatio-temporal structure effectively balances model flexibility with computational speed. This offers a robust, scalable solution for monitoring epidemics in diverse geographical regions.

How to cite: Xiao, Y. and Moraga, P.: Bayesian spatio-temporal disease nowcasting using parametric time-varying functions of cumulative reporting probability, EGU General Assembly 2026, Vienna, Austria, 3–8 May 2026, EGU26-4713, https://doi.org/10.5194/egusphere-egu26-4713, 2026.

Multi-step time series forecasting is a fundamental problem across geoscientific applications, including meteorology, hydrology, climate analysis, and space and environmental sciences. A persistent challenge in such tasks is the progressive degradation of predictive accuracy as the forecast horizon increases. This phenomenon is primarily driven by the accumulation and temporal propagation of forecast errors, while most existing statistical and machine learning models lack explicit mechanisms to characterize, model, and correct the evolving dynamics of horizon-dependent residuals.

To address this limitation, we propose an adaptive error post-processing framework termed the Adaptive Residual Decay Mechanism (ARDM). ARDM is designed as an end-to-end predictive optimization strategy that enhances forecasting stability, robustness, and generalization across diverse temporal patterns and application scenarios. Rather than modifying the internal structure of forecasting models, ARDM operates as a residual-aware modification layer that can be seamlessly integrated with a wide range of statistical and machine-learning-based forecasting pipelines.

The proposed framework systematically integrates data preprocessing, initial multi-step forecasting, residual sequence construction, residual dependency modeling, dynamic error modification, and final output refinement. By explicitly constructing residual time series from preliminary forecasts, ARDM captures both short-term and long-term temporal dependencies in forecast errors, enabling structured modeling of error evolution across lead times. Within a symmetrical residual modeling architecture, a time-sensitive adaptive decay function is introduced to dynamically estimate and correct horizon-dependent forecast errors, allowing error adjustments to evolve consistently with increasing prediction horizons.

The decay function and its parameters are optimized through a joint multi-metric loss formulation evaluated across geoscientific and cross-domain time series forecasting datasets. This optimization strategy balances sensitivity to error magnitude with robustness to directional deviations, ensuring stable and reliable post-processing behavior, particularly for longer-range forecasts. Furthermore, ARDM systematically exploits historical residual information during the observation phase, enabling horizon-aware and dynamically consistent refinement of prediction errors through structured residual dependencies without increasing model complexity.

Extensive experiments conducted on multiple real-world geophysical time series datasets, including representative geomagnetic indices, demonstrate that ARDM consistently outperforms mainstream baseline statistical and machine learning methods across a range of standard evaluation metrics, including MAE, MSE, RMSE, MAPE, SSE, and the index of agreement (IA). Performance improvements are especially pronounced at longer prediction horizons, highlighting ARDM’s effectiveness in mitigating error accumulation in multi-step forecasting of geophysical processes. These results suggest that residual-aware, horizon-adaptive statistical post-processing provides a powerful and flexible pathway for improving the reliability of geophysical time series forecasting, with direct relevance to space weather and broader Earth system applications.

How to cite: zhang, Y., zou, Z., and liu, Y.: ARDM: Adaptive Residual Decay Mechanism for Dynamic Error Modification in Geophysical Time Series Forecasting, EGU General Assembly 2026, Vienna, Austria, 3–8 May 2026, EGU26-4804, https://doi.org/10.5194/egusphere-egu26-4804, 2026.

EGU26-5091 | Posters on site | NP5.1

Fair logarithmic score for multivariate Gaussian forecasts 

Sándor Baran and Martin Leutbecher

In evaluating multivariate probabilistic forecasts predicting vector quantities such as a weather variable at multiple locations or a wind vector, an important step is the assessment of their calibration and reliability. Here, we focus on the logarithmic score and are interested in the specific case when the density is multivariate normal with mean and covariance structure given by the ensemble mean and ensemble covariance matrix, respectively. Under the assumptions of multivariate normality and exchangeability of the ensemble members, a relationship is derived that describes the dependence on ensemble size. It is exploited to introduce a fair logarithmic score for multivariate ensemble forecasts [1].

An application to medium-range weather forecasts demonstrates the usefulness of the ensemble size adjustments when multivariate normality is only an approximation, where we consider ensemble predictions of sizes from 8 to 100 of vectors consisting of several different combinations of upper air variables. We show how the logarithmic score depends on ensemble size for various examples and to what extent the fair logarithmic score reduces this dependence.

References

1. Leutbecher, M. and Baran, S., Ensemble size dependence of the logarithmic score for forecasts issued as multivariate normal distributions. Q. J. R. Meteorol. Soc. 151 (2025), paper e4898, doi:10.1002/qj.4898.

*Research was supported by the Hungarian National Research, Development and Innovation Office under Grant No. K142849.

How to cite: Baran, S. and Leutbecher, M.: Fair logarithmic score for multivariate Gaussian forecasts, EGU General Assembly 2026, Vienna, Austria, 3–8 May 2026, EGU26-5091, https://doi.org/10.5194/egusphere-egu26-5091, 2026.

A widely recognized limitation of most post-processing methods is that they are typically applied independently for each forecast horizon, location, and variable, potentially neglecting important dependencies across these dimensions. Despite the development of numerous statistical and machine learning methods for modeling these dependencies, the topic remains the subject of ongoing research.
In this work, the proposed approach employs a graph neural network (GNN) trained with a composite loss function that combines the energy score (ES) and the variogram score (VS) for the multivariate postprocessing of ensemble forecasts. The method is evaluated using WRF-based solar irradiance forecasts over northern Chile and ECMWF visibility forecasts over Central Europe.
Across all multivariate verification metrics, the dual-loss GNN consistently outperforms empirical copula–based postprocessing methods as well as GNNs trained solely with CRPS or ES. For the WRF forecasts, the learned rank-order structure captures dependency information more effectively, leading to improved restoration of spatial relationships compared with both the raw ensemble and historical observational ranks. Moreover, incorporating VS into the training loss also improves univariate predictive performance for both forecast targets.

Lakatos, M. (in press). A composite-loss graph neural network for the multivariate post-processing of ensemble weather forecasts.
Quarterly Journal of the Royal Meteorological Society.

How to cite: Lakatos, M.: A Composite-Loss Graph Neural Network for the Multivariate Post-Processing of Ensemble Weather Forecasts , EGU General Assembly 2026, Vienna, Austria, 3–8 May 2026, EGU26-5377, https://doi.org/10.5194/egusphere-egu26-5377, 2026.

Fog and low stratus forecasting remains a challenge due to the high sensitivity of these phenomena to boundary layer processes. One-dimensional models, such as COBEL–ISBA, offer physical consistency but often lead to systematic errors in key surface variables. This work proposes a novel hybrid calibration framework combining physical modeling with machine learning (ML) to correct COBEL–ISBA forecasts at Nouasseur Airport, Morocco. Using two winter seasons of model outputs and SYNOP observations, we calibrate five variables (2-m temperature and humidity, 10-m wind components, visibility) for each forecast run and lead time (0–12 h).

Two ML architectures are tested: direct correction (ML–COBEL) and residual-learning approach (ML–Phys) using Random Forest and XGBoost. For visibility, a two-stage classification-regression model is implemented, and an oversampling technique is used to address class imbalance. Results are benchmarked against classical bias correction and quantile mapping.

The ML–Phys approach outperforms traditional methods across all variables and lead times, reducing errors (bias, RMSE) while preserving observed temporal variability. Furthermore, it improves also low-visibility event detection. In contrast, traditional methods show limited skill, often degrading beyond short lead times. This work demonstrates the potential of hybrid AI-physics strategies to mitigate 1D model limitations, providing a path toward more reliable operational fog and visibility forecasting.

How to cite: Oubouisk, M., Bari, D., and Mordane, S.: Hybrid AI-Physics Calibration of a 1D Fog Model: Improving Near-Surface and Visibility Forecasts at a Moroccan Airport, EGU General Assembly 2026, Vienna, Austria, 3–8 May 2026, EGU26-5760, https://doi.org/10.5194/egusphere-egu26-5760, 2026.

EGU26-7223 | ECS | Orals | NP5.1

How skilful are AI-based forecasts of 2023 Indian summer monsoon precipitation? 

Mehzooz Nizar, Reinhard Schiemann, Andrew G Turner, Kieran Hunt, and Steffen Tietsche

India relies on agriculture as one of its main sources of income. Therefore, reliable prediction of Indian summer monsoon
rainfall is crucial to the country’s policy making and development of crop management strategies. The recent development
of global AI Weather Prediction (AIWP) models has revolutionized weather forecasting. Owing to the very recent
emergence of AIWP models, their performance in simulating the Indian monsoon system is still insufficiently explored.
In this study, we verify the precipitation forecast skill of AIWP models GraphCast and FuXi at a lead time of 1-9 days
during Indian summer monsoon 2023 and compare their performance to the physics-based model ECMWF IFS-HRES
(IFS). Satellite-derived precipitation dataset IMERG is used as the ground truth to verify precipitation along with
ERA5 precipitation. Root mean squared error (RMSE), pattern correlation coefficient (PCC), structure (S)-amplitude
(A)-location error (L) and stable equitable error in probability space (SEEPS) were the metrics used to evaluate the
models.

A number of case studies, seasonal and intra-seasonal characteristics of precipitation forecast at various lead times were
analysed during June-September 2023. The case studies reveal that the AIWP models have lower RMSE and higher PCC
than IFS in general, while the AIWP models smoothen (positive S error) precipitation at longer leads. FuXi consistently
underestimates precipitation (negative A error) in the case studies. Analysing the daily mean rainfall for the country
as a whole and the precipitation bias at a lead time of 5 days, it is confirmed that FuXi shows a systematic dry bias in
forecasting monsoon rainfall. Non-parametric statistical tests were conducted to decide which model performs the best
at each metric in forecasting the entire season at various lead times. It is found that FuXi consistently achieved the
lowest RMSE, IFS delivered the best S, and GraphCast recorded the smallest SEEPS score at a lead time of 1, 5 and 9
days while no model shows a significant advantage in PCC, A and L. It was also seen that AIWP models outperformed
IFS in RMSE and PCC while AIWP models have larger S error than IFS corroborating the findings of case studies.
FuXi scored the largest A error across all lead times. The loss functions used to train AIWP models directly penalise
point-wise errors, which likely explains their RMSE advantage over IFS.

These results show us that even though AIWP models have good overall accuracy and correlation with observed precipi-
tation, exhibits a lack of realism in capturing the spatial distribution and the intensity of precipitation. Also, model skill
is metric dependent and choosing between an AIWP or physics-based model should hinge on the forecaster’s priority.

How to cite: Nizar, M., Schiemann, R., Turner, A. G., Hunt, K., and Tietsche, S.: How skilful are AI-based forecasts of 2023 Indian summer monsoon precipitation?, EGU General Assembly 2026, Vienna, Austria, 3–8 May 2026, EGU26-7223, https://doi.org/10.5194/egusphere-egu26-7223, 2026.

EGU26-7775 | ECS | Posters on site | NP5.1

Advancing Rainfall Nowcasting in Tropical Southeast Asia with Physics-Informed Deep Generative Models 

Zhixiao Niu, Song Chen, Zhihuo Xu, Joshua Lee, Hugh Zhang, Shuping Ma, Yaomin Wang, Xinyue Liu, and Xiaogang He

Rainfall nowcasting of deep convection in the tropics is extremely challenging, particularly in highly urbanized coastal regions such as Singapore, where high spatial resolution is required. Conventional optical flow-based nowcasting methods typically struggle with capturing the initiation, duration, and spatiotemporal evolution of deep convection and rainfall. When it comes to extreme rainfall, these existing methods cannot deliver skillful nowcasts due to rapid changes in localized features of individual deep convection events. Recent advances in AI-based data-driven models, particularly deep generative models utilizing high-resolution radar imagery, have improved nowcasting accuracy at longer lead times. However, they often serve as black boxes, neglecting the underlying physics, potentially missing unseen extremes, and underestimating their rainfall intensity. To better tackle convection onset prediction, we adopt a novel importance sampling strategy that targets convective initiation by identifying convective cells based on a 35 dBZ threshold and fitting a linear growth trend across frames. Samples with steeper growth and fewer initial convective cells are prioritized to emphasize early-stage development. To enhance physical realism in deep tropics, we further propose a physics-informed deep generative model that incorporates diurnal and seasonal cycles to reflect tropical weather variability. Moreover, the model includes three-dimensional physical information such as Doppler wind and multi-altitude reflectivity. With the incorporation of additional physical information, the proposed generative framework consistently outperforms baseline models, particularly at early forecast lead times. Relative to the original DGMR driven solely by precipitation inputs, the physics-informed model achieves substantially higher skill across multiple rainfall thresholds. Over a 90-min forecast horizon, the average probabilities of detection (POD) reach 0.70, 0.47, and 0.21 at 1.0, 4.0, and 16.0 mm h⁻¹, corresponding to relative improvements of 27%, 25%, and 25%, respectively, with associated critical success indices (CSI) of 0.47, 0.30, and 0.15. In addition, spatial correlation is enhanced across pooling scales of 0.5, 2.0, and 8.0 km, yielding average Pearson correlation coefficients (PCC) of 0.27, 0.32, and 0.46, representing relative gains of 15–16% compared with the baseline. Attribution analysis further indicates that multi-altitude reflectivity contributes most strongly to nowcasting skill, followed by composite reflectivity, while the influence of time-regime information increases with forecast lead time and the contribution of three-dimensional wind fields remains comparatively modest. Our novel physics-informed deep generative model provides valuable insight into convective precipitation processes, supports more reliable nowcasting, and helps guide future data collection in tropical regions.

How to cite: Niu, Z., Chen, S., Xu, Z., Lee, J., Zhang, H., Ma, S., Wang, Y., Liu, X., and He, X.: Advancing Rainfall Nowcasting in Tropical Southeast Asia with Physics-Informed Deep Generative Models, EGU General Assembly 2026, Vienna, Austria, 3–8 May 2026, EGU26-7775, https://doi.org/10.5194/egusphere-egu26-7775, 2026.

EGU26-7988 | ECS | Orals | NP5.1

Assessment of high-resolution physical and AI-based precipitation forecasts in the Ecuadorian Tropics 

Angela Iza-Wong, Gabriel Moldovan, Zied Ben Bouallegue, Becky Hemingway, Matthew Chantry, and David A. Lavers

Accurate precipitation forecasting remains challenging, particularly in regions with complex terrain and sparse observational networks. This study evaluates precipitation forecasts from the European Centre for Medium-Range Weather Forecasts (ECMWF), the Integrated Forecasting System (IFS), and Artificial Intelligence/Integrated Forecasting System (AIFS) (ECMWF, 2024, 2025)​, including experimental models trained on the Integrated Multi-satellite Retrievals for GPM (IMERG) and Multi-Source Weighted-Ensemble Precipitation (MSWEP) datasets, the high-resolution (4km) model developed within the Destination Earth (DestinE) initiative (ECMWF et al., 2025)​, and the GraphCast model (Lam et al., 2022)​. The evaluation is based on 2 years of observational data (2023–2024) from 30 Ecuadorian weather stations in coastal and Andean regions and considers forecast lead times of 1-10 days. Throughout the evaluation period, AIFS exhibits the highest overall predictive skill, whereas DestinE is most effective at identifying extreme precipitation events. Most models display a marked positive bias, particularly within the Andean region. AIFS models trained on IMERG and MSWEP demonstrate the lowest bias and highest skill, as indicated by the Stable Equitable Error in Probability Space (SEEPS) ​(Rodwell et al., 2010)​ and the Equitable Threat Score (ETS). The Frequency Bias Index (FBI) decreases across all models as thresholds increase from the 90th to the 99th percentile, with consistently elevated FBI values observed over mountainous terrain. AIFS (IMERG) achieves the best overall performance, while GraphCast demonstrates the lowest skill in both total and mountainous regions. Overall, in the Ecuadorian tropics, AI-based models generally outperform physical models, except during extreme precipitation events, when physical models remain more reliable. These results underscore the critical importance of training data for AI-based systems and the ongoing challenges of forecasting high-impact precipitation across both operational and experimental models.

Keywords: Precipitation forecasting, artificial intelligence, ECMWF, GraphCast, Ecuador, extreme rainfall

References

ECMWF. (2024). IFS Documentation CY49R1 - Part I: Observations. In IFS Documentation CY49R1. ECMWF. https://doi.org/10.21957/fd16c61484

ECMWF. (2025). ECMWF’s AI forecasts become operational ECMWF. https://www.ecmwf.int/en/about/media-centre/news/2025/ecmwfs-ai-forecasts-become-operational

ECMWF, EUMETSAT, & ESA. (2025). Destination Earth (DestinE)-digital model of the Earth. https://destination-earth.eu/

Lam, R., Sanchez-Gonzalez, A., Willson, M., Wirnsberger, P., Fortunato, M., Alet, F., Ravuri, S., Ewalds, T., Eaton-Rosen, Z., Hu, W., Merose, A., Hoyer, S., Holland, G., Vinyals, O., Stott, J., Pritzel, A., Mohamed, S., & Battaglia, P. (2022). GraphCast: Learning skillful medium-range global weather forecasting. http://arxiv.org/abs/2212.12794

Rodwell, M. J., Richardson, D. S., Hewson, T. D., & Haiden, T. (2010). A new equitable score suitable for verifying precipitation in numerical weather prediction. Quarterly Journal of the Royal Meteorological Society, 136(650), 1344–1363. https://doi.org/10.1002/qj.656

How to cite: Iza-Wong, A., Moldovan, G., Bouallegue, Z. B., Hemingway, B., Chantry, M., and Lavers, D. A.: Assessment of high-resolution physical and AI-based precipitation forecasts in the Ecuadorian Tropics, EGU General Assembly 2026, Vienna, Austria, 3–8 May 2026, EGU26-7988, https://doi.org/10.5194/egusphere-egu26-7988, 2026.

EGU26-8100 | Posters on site | NP5.1

COBASE: A new copula-based shuffling method for ensemble weather forecast postprocessing 

Elisa Perrone, Maurits Flos, Bastien François, Irene Schicker, and Kirien Whan

Weather predictions are often provided as ensembles generated by repeated runs of numerical weather prediction models. These forecasts typically exhibit bias and inaccurate dependence structures due to numerical and dispersion errors, requiring statistical postprocessing for improved precision. A common correction strategy is the two-step approach: first adjusting the univariate forecasts, then reconstructing the multivariate dependence. The second step is usually handled with nonparametric methods, which can underperform when historical data are limited. Parametric alternatives, such as the Gaussian Copula Approach (GCA), offer theoretical advantages but often produce poorly calibrated multivariate forecasts due to random sampling of the corrected univariate margins. In this work, we introduce COBASE, a novel copula-based postprocessing framework that preserves the flexibility of parametric modeling while mimicking the nonparametric techniques through a rank-shuffling mechanism. This design ensures calibrated margins and realistic dependence reconstruction. We evaluate COBASE on multi-site 2-meter temperature forecasts from the ALADIN-LAEF ensemble over Austria and on joint forecasts of temperature and dew point temperature from the ECMWF system in the Netherlands. Across all regions, COBASE variants consistently outperform traditional copula-based approaches, such as GCA, and achieve performance on par with state-of-the-art nonparametric methods like SimSchaake and ECC, with only minimal differences across settings. These results position COBASE as a competitive and robust alternative for multivariate ensemble postprocessing, offering a principled bridge between parametric and nonparametric dependence reconstruction.

How to cite: Perrone, E., Flos, M., François, B., Schicker, I., and Whan, K.: COBASE: A new copula-based shuffling method for ensemble weather forecast postprocessing, EGU General Assembly 2026, Vienna, Austria, 3–8 May 2026, EGU26-8100, https://doi.org/10.5194/egusphere-egu26-8100, 2026.

EGU26-8449 | Orals | NP5.1

High-resolution Probabilistic Forecasts of Fire Weather Conditions in California using Downscaling Machine Learning Models 

Charles Jones, Callum Thompson, David Siuta, Nathan Quinn, and Nicholas Sette

California is prone to extreme fire weather conditions characterized by high winds, elevated temperatures, and low humidity. Accurate predictions with high spatial resolution are critical for emergency operations to monitor and respond to fast-spreading wildfires. While current operational numerical weather prediction models, such as the NOAA Global Forecasting System GFS model, offer reliable probabilistic forecasts in the medium range (up to 15 days), their coarse spatial resolution (typically 0.25° latitude/longitude, ~25 km) limits their utility for localized fire risk assessment. This resolution is insufficient for capturing terrain-driven wind patterns and microclimate variations that drive fire behavior, especially in complex topography regions like the wildland–urban interface.

High-resolution probabilistic forecasts of fire weather conditions are generated by downscaling GFS ensemble outputs from a native resolution of 0.25° latitude/longitude to 1.5 km horizontal grid spacing over a domain encompassing California and Nevada. The downscaling framework integrates singular value decomposition (SVD), UNet-based convolutional neural networks, and diffusion models to capture both large-scale variability and fine-scale terrain-driven features. Models are trained using GFS initial conditions (00 UTC) and paired with 1.5 km Weather Research and Forecasting (WRF) simulations spanning the period 2015–2020. To evaluate forecast skill, ten high-impact case studies characterized by strong wind events in the Sierra Nevada and Southern California are analyzed. Probabilistic predictions of surface air temperature, relative humidity, and wind speed are validated against surface meteorological observations. The study includes a discussion of forecast skill metrics, operational applications, and ongoing research directions.

How to cite: Jones, C., Thompson, C., Siuta, D., Quinn, N., and Sette, N.: High-resolution Probabilistic Forecasts of Fire Weather Conditions in California using Downscaling Machine Learning Models, EGU General Assembly 2026, Vienna, Austria, 3–8 May 2026, EGU26-8449, https://doi.org/10.5194/egusphere-egu26-8449, 2026.

EGU26-8532 | ECS | Orals | NP5.1

Design, operation and validation of the ERA5-land Global Gridded Stochastic Weather Generator 

Alex Schuddeboom, Christian Zammit, David Plew, Piet Verburg, and Aidin Jabbari

The ERA5-land Global Gridded Stochastic Weather Generator (EGGS-WG) model was released to the public last year as an open source and freely accessible stochastic weather generator. The purpose of this model is to provide an easy to use, low resource and modern Stochastic Weather Generator that can produce rainfall, air temperature and dew point temperature. This model offers several advancements over existing freely available stochastic weather generators, including the ability to simulate any terrestrial region of the planet, moving from a single site simulation approach to an entire gridded domain and increasing the temporal resolution of temperature simulation from daily to hourly.

Validation case studies have been performed over a range of different regions that represent substantially different climates. In general, EGGS-WG shows a strong ability to recreate the statistical behaviour seen in the ERA5-Land dataset. Precipitation occurrence rates and daily rainfall amounts are shown to be reproduced accurately by the model. Several different aspects of these variables are validated, including seasonality, spatial correlations and rainfall spells. While the general quality of the simulation is high, there are some clear issues in the simulation of the most extreme precipitation values, as well as some unique issues in consistently wet climates. Analysis of the air temperature and dew point temperature simulations shows stronger agreement. In particular, the spatial distributions and diurnal cycles of temperature are shown to be well simulated.

Many future developments have been planned that build on the released software package. Most prominent amongst these is the expansion of the simulated variables to include winds and radiation, which introduces a unique set of challenges due to the strong diurnal patterns and spatial organisation. Additionally, integrated support for CMIP6 driven future warming simulation is a high priority. These extensions are in various stages of development and are likely to be released over the coming year.

How to cite: Schuddeboom, A., Zammit, C., Plew, D., Verburg, P., and Jabbari, A.: Design, operation and validation of the ERA5-land Global Gridded Stochastic Weather Generator, EGU General Assembly 2026, Vienna, Austria, 3–8 May 2026, EGU26-8532, https://doi.org/10.5194/egusphere-egu26-8532, 2026.

EGU26-8733 | Orals | NP5.1

Development of AI-based precipitation forecasting at KIAPS 

Tae-Jin Oh, In-Chae Na, and Woo-Yeon Park

This study outlines the development of an artificial intelligence (AI)-based precipitation forecasting system at the Korea Institute of Atmospheric Prediction Systems (KIAPS). The system is designed with three main components:  an observation-based model for very short-term forecasting (nowcasting), a post-processing model to correct numerical weather prediction (NWP) fields for longer lead times, and a hybrid model to integrate these approaches which is to be built. The nowcasting model utilizes a U-Net architecture incorporating ConvLSTM at the bottleneck. It uses radar and satellite data sequences to produce 6-hour forecasts; the training strategy involves pretraining on radar/satellite data followed by fine-tuning with 1-hour accumulated rainfall gauge data from Automatic Weather Stations (AWS). The post-processing model employs a ConvNeXt v2 U-Net to correct Korea Integrated Model (KIM) NWP fields for forecasts up to 24 hours. Performance evaluations show that the observation-based model excels at shorter lead times with 34% improvement in the Critical Success Index (CSI) for precipitation exceeding 8 mm/hr, averaged over the 1–6 hour forecast period, compared to the baseline KIM forecast. Meanwhile, the post-processing model, which incorporates a differentiable CSI loss function for robust heavy precipitation forecasting, averaged over the 24 hour forecast period, achieves 31% CSI improvement relative to KIM with reduced performance degradation at longer lead times. Future work will focus on developing the hybrid model to merge these outputs for optimal accuracy across all forecast lead times.

How to cite: Oh, T.-J., Na, I.-C., and Park, W.-Y.: Development of AI-based precipitation forecasting at KIAPS, EGU General Assembly 2026, Vienna, Austria, 3–8 May 2026, EGU26-8733, https://doi.org/10.5194/egusphere-egu26-8733, 2026.

EGU26-9336 | Posters on site | NP5.1

Environment-Specific Fog Detection over the Korean Peninsula Using GEO-KOMPSAT-2A and DeepLabV3+ 

Suhwan Kim, Dongjin Kim, and Jong-Min Yeom

Fog detection using geostationary satellite data has the advantage of monitoring large areas in a short period of time. However, because fog exhibits highly diverse optical characteristics in both space and time, it is difficult to achieve reliable detection with a single satellite-based detection strategy that does not consider environmental conditions. Therefore, this study utilized data from GEO-KOMPSAT-2A (GK2A) to pre-define fog occurrence environments, construct appropriate input data and labels for each environmental condition, and then applied a categorized deep learning-based fog detection system.

First, fog was identified when ground-station visibility was under 1 km. To create reliable training data, the ground-station visibility data was spatially aligned with fog labels from the Korea Meteorological Administration (KMA) for GK2A observations. Only areas consistently identified as fog by both ground-station observations and KMA fog labels were selected and cropped. In this process, a spatial grouping method was used to eliminate noise and ensure the fog regions had continuous spatial coverage.        

In constructing the input data, variables representing surface characteristics were chosen to optimize detection accuracy for each environmental condition. Using this high-quality dataset, data were organized into different groups based on four seasons, three time periods (daytime, nighttime, dawn/dusk), and two surface types (land, ocean). Separate DeepLabV3+ models were trained for each category, with 2022 data used for training and 2023 data for validation.

To evaluate the model's ability to generalize, the entire 2024 dataset not included in training was used as an independent test set. For accurate assessment, post-processing filtering with a cloud mask was applied to measure detection performance in cloud-free regions. The results revealed notable seasonal fluctuations in performance, indicating that detection efficiency depends on environmental conditions. Even with the same deep learning architecture, this suggests that careful data preprocessing and environment-specific strategies can help advance satellite-based fog detection technology.


This work was supported by the National Research Foundation of Korea(NRF) grant funded by the Korea government(MSIT)(RS-2025-00515357).

How to cite: Kim, S., Kim, D., and Yeom, J.-M.: Environment-Specific Fog Detection over the Korean Peninsula Using GEO-KOMPSAT-2A and DeepLabV3+, EGU General Assembly 2026, Vienna, Austria, 3–8 May 2026, EGU26-9336, https://doi.org/10.5194/egusphere-egu26-9336, 2026.

EGU26-9685 | ECS | Orals | NP5.1

Comparative Assessment of Predictor Variable Combinations within Data Driven Approaches for NWP based Precipitation Forecast Enhancement 

Sudhanyasree Prasanna Ravikumar, Sakila Saminathan, and Subhasis Mitra

Precipitation forecasts generated by Numerical Weather Prediction (NWP) models often exhibit systematic biases arising from limitations in model resolution, representation of sub-grid-scale processes, and uncertainties in initial conditions. This study systematically assesses different predictor combinations (PC) obtained from the European Centre for Medium-Range Weather Forecasts (ECMWF) model to improve short-range precipitation forecasts using data-driven approaches over the peninsular Indian region. Different data-driven formulations, comprising of four machine learning (ML) models and two deep learning (DL) models, were implemented and systematically compared. Further, the different PCs and data driven formulations are evaluated and compared against the traditional Bayesian Model Averaging (BMA) approach, widely adopted for precipitation forecast enhancement. The improvement in precipitation forecast skill was assessed using standard deterministic and probabilistic verification metrics. The results indicate that incorporating exogenous predictor variables leads to a slight improvement in precipitation forecast skill, while DL models exhibit performance comparable to that of traditional ML models. Overall, the exogenous variable PC achieved higher forecast skill than other PCs and the traditional BMA, yielding an approximate 20% improvement in RMSE compared to 14% for the traditional BMA. Feature importance analysis revealed that total precipitation, wind speed, and 2-m temperature consistently ranked among the top five most influential variables across the different data driven formulations, underscoring the interpretability of the models.

How to cite: Prasanna Ravikumar, S., Saminathan, S., and Mitra, S.: Comparative Assessment of Predictor Variable Combinations within Data Driven Approaches for NWP based Precipitation Forecast Enhancement, EGU General Assembly 2026, Vienna, Austria, 3–8 May 2026, EGU26-9685, https://doi.org/10.5194/egusphere-egu26-9685, 2026.

EGU26-10414 | Orals | NP5.1

Forecasting Cold Winter Temperatures in Finland with the Aila AI Weather Model 

Marko Laine, Leila Hieta, Tuukka Tuukka Himanka, Mikko Partio, and Olle Räty

Advances in data-driven artificial intelligence (AI) weather models are transforming how national meteorological services produce forecasts. The Finnish Meteorological Institute (FMI) has developed Aila, a regional AI model inspired by Met Norway's Bris AI model and built using the Anemoi framework - an open European initiative that integrates machine learning techniques with meteorology. Aila has been trained on 40 years of European Centre for Medium-Range Weather Forecasts (ECMWF) global historical ERA5 reanalysis data and about three years of high-resolution Harmonie analyses over the Scandinavian region, utilizing the computational power of the LUMI supercomputer. The model's graph-based neural network architecture enables enhanced spatial resolution and improved representation of atmospheric processes over Northern Europe. 

This study focuses on evaluating Aila's performance during cold winter conditions in Finland, a key challenge for numerical weather prediction models. Prolonged low-temperature episodes are often governed by persistent high-pressure systems and strong temperature inversions that prove difficult to forecast accurately. Using case studies from recent winters, we evaluate Aila’s skill in forecasting 2-meter temperatures during cold spells by comparing its predictions against FMI's operational forecast products and observations.

The results demonstrate that the AI-based Aila model achieves competitive accuracy in temperature forecasts during challenging cold weather conditions while providing substantial computational efficiency compared to traditional numerical approaches. Future development efforts will focus on implementing a multi-decoder approach where the Aila model will be fine-tuned using observational data to better capture extreme cold temperatures and improve forecast reliability.

How to cite: Laine, M., Hieta, L., Tuukka Himanka, T., Partio, M., and Räty, O.: Forecasting Cold Winter Temperatures in Finland with the Aila AI Weather Model, EGU General Assembly 2026, Vienna, Austria, 3–8 May 2026, EGU26-10414, https://doi.org/10.5194/egusphere-egu26-10414, 2026.

EGU26-11641 | ECS | Orals | NP5.1

Hybrid Neural Operator and Physics-Informed Learning for Renewable Energy Forecasting 

Andrejs Cvečkovskis, Juris Seņņikovs, and Uldis Bethers

Forecasting of local renewable energy variables such as solar irradiance and wind speed is critically important for operational grid management and energy markets. We present a hybrid machine learning model that combines Adaptive Fourier Neural Operator (AFNO) architectures with physics-informed loss constraints, designed to capture both learned spatial–temporal patterns and key physical relationships in atmospheric fields. The model is trained on reanalysis and high-resolution observational datasets over the Baltic region and evaluated in comparison with baseline statistical and numerical weather prediction benchmarks.

Our contributions include: (i) a hybrid modelling strategy that enforces approximate physical consistency via penalised residuals of key balance equations during training; (ii) a detailed benchmarking framework for lead-time dependent forecast skill on solar and wind energy generation targets; and (iii) an assessment of uncertainty and calibration properties using probabilistic scoring metrics. Results are evaluated against numerical weather prediction baselines, highlighting the strengths and limitations of the hybrid approach and outlining a viable pathway for future improvements in sub-daily renewable energy forecasting.

This work contributes to the session’s themes of advanced machine learning and statistical forecasting methods in geosciences and highlights the potential of hybrid approaches for enhancing short-term predictive skill.

How to cite: Cvečkovskis, A., Seņņikovs, J., and Bethers, U.: Hybrid Neural Operator and Physics-Informed Learning for Renewable Energy Forecasting, EGU General Assembly 2026, Vienna, Austria, 3–8 May 2026, EGU26-11641, https://doi.org/10.5194/egusphere-egu26-11641, 2026.

EGU26-11765 | ECS | Orals | NP5.1

Assessing the physical realism of AI-based weather forecasts: insights from extratropical storms and large-scale flow diagnostics. 

Soufiane Karmouche, Linus Magnusson, Tim Hewson, and Thomas Haiden

Standard scores such as the root mean squared error provide limited insight into whether Machine-learning (ML) weather prediction systems reproduce the physically consistent dynamical structures that underpin high-impact weather. Here, we present a multi-faceted assessment of the physical realism of ECMWF’s Artificial Intelligence Forecasting System (AIFS), combining case-study diagnostics of severe extratropical storms with conditional verification based on large-scale circulation.

We first examine two North Atlantic storms: Storm Amy (October 2025) and Storm Eowyn (January 2025). Using diagnostics inspired by Charlton-Perez et al. (2024), we analyse frontal structure, vorticity, and surface and upper-air wind fields in AIFS-Single and AIFS Ensemble Control forecasts, benchmarked against the IFS Control and analysis. While ML systems capture storm tracks and large-scale frontal geometry well, they systematically smooth sharp gradients, compact vorticity cores, and localized wind maxima, leading to underestimation of extreme winds. Probabilistic training in the ensemble configuration improves realism but does not fully overcome these structural limitations.

We then present ongoing work assessing the physical consistency of ML forecasts using diagnostics of the ageostrophic-to-geostrophic wind ratio at multiple pressure levels. These reveal systematic differences between ML-based and physics-based models, particularly in dynamically active midlatitude regions.

Finally, we present regime-based verification results highlighting improved AIFS performance for 2-m temperature forecasts during persistent wintertime anticyclonic conditions, illustrating ML strengths in stable large-scale regimes where physics-based forecasts suffer from long-standing systematic biases.

Overall, our results highlight the importance of moving beyond general verification scores toward diagnostic and physically interpretable evaluation frameworks when assessing AI-based weather forecasts, especially for high-impact weather events.

This work is funded by the Destination Earth project.

REFERENCES:

Charlton-Perez, A.J., Dacre, H.F., Driscoll, S. et al. Do AI models produce better weather forecasts than physics-based models? A quantitative evaluation case study of Storm Ciarán. npj Clim Atmos Sci 7, 93 (2024). https://doi.org/10.1038/s41612-024-00638-w

How to cite: Karmouche, S., Magnusson, L., Hewson, T., and Haiden, T.: Assessing the physical realism of AI-based weather forecasts: insights from extratropical storms and large-scale flow diagnostics., EGU General Assembly 2026, Vienna, Austria, 3–8 May 2026, EGU26-11765, https://doi.org/10.5194/egusphere-egu26-11765, 2026.

I present a data-driven forecast system applied to the Indian summer monsoon rain. By forecasting pentads, 5-day rain totals, the system is well suited to forecasting the monsoon onset/withdrawal as well as its progression, also known as intra-seasonal variability. I will provide a comparison of the forecast skill with those of other systems, both physics-based NWP and AI systems. The skill of the JJA seasonal forecast issued on 1 May in terms of the Pearson correlation coefficient far surpasses that of GLOSEA5. I will also discuss delicate questions about forecast skill, as to what is concepotually sound and what can be computed.

How to cite: Bodai, T.: Data-driven seasonal weather forecast: An application to the Indian summer monsoon rain, EGU General Assembly 2026, Vienna, Austria, 3–8 May 2026, EGU26-12477, https://doi.org/10.5194/egusphere-egu26-12477, 2026.

EGU26-12713 | ECS | Posters on site | NP5.1

Verifying the spatial structure of precipitation fields from a foundation model of the atmosphere 

Sebastian Buschow and Wael Almikaeel and the WeatherGenerator Team

Data driven weather models have proven their ability to learn various aspects of the weather prediction problem. While their point-to-point skill has been proven, the precise nature of their errors is not yet fully understood.

This contribution takes a first look at the spatial precipitation patterns simulated by the Weather Generator – a foundation model trained on diverse data sources with the goal of learning the underlying behavior of the atmosphere as a whole.  We analyze the correlation structure of the simulated precipitation fields using spatial verification techniques including two-dimensional wavelet transforms. Some attention is paid to the problem of applying these methods to global data on an irregular grid. The results can be compared to observations, reanalysis and potentially other data-driven forecast models.

How to cite: Buschow, S. and Almikaeel, W. and the WeatherGenerator Team: Verifying the spatial structure of precipitation fields from a foundation model of the atmosphere, EGU General Assembly 2026, Vienna, Austria, 3–8 May 2026, EGU26-12713, https://doi.org/10.5194/egusphere-egu26-12713, 2026.

EGU26-12781 | Orals | NP5.1

A Lagrangian blending of optical flow and ML-based radar precipitation nowcasts  

Dominique Brunet, Laura Huang, Jonathan Belletête, Ahmed Mahidjiba, and Sudesh Boodoo

Recent research and development at Environment and Climate Change Canada has been conducted on improving the current operational radar precipitation nowcasting by transitioning from an optical flow method (Farnebäck smoothed) to machine learning (ML)-based nowcasts. Two ML-based nowcasting models were trained on the Canadian radar composite: RainNet, a convolutional neural network based on the U-Net architecture, and NowcastNet, which combines a Generative Adversarial Network with an Evolution Network to explicitly model precipitation dynamics. Verification of radar precipitation nowcasts revealed that the optimal method depends on both lead time and precipitation threshold. RainNet performed best for low precipitation thresholds (0.1-1 mm/h) at all lead times, highlighting its ability to capture widespread, weak precipitation, while NowcastNet outperformed the others at longer lead times (beyond one hour) and for higher precipitation thresholds (4+ mm/h). Farnebäck smoothed remained the most skillful for nowcasting heavy precipitation (12+ mm/h) during the first hour, likely due to its robust short-term motion estimation. 

Building on these results, we propose a Lagrangian blending method that optimally combines the predicted motion paths and the growth and decay of precipitation intensity components of the different nowcasting methods.  While optical flow methods assume constant motion and intensity evolution, ML-based methods produce time-varying motion vectors and precipitation intensities, which are explicitly leveraged in the blending framework. For deterministic nowcasts, we apply a bias-correction followed by the blending of both motion paths and intensity, allowing the generation of time-evolving blended motion fields with growth and decay.  

We also generate probabilistic nowcasts of precipitation occurrence (0.1 mm/h) and extreme precipitation (50 mm/h) by determining the optimal spatial smoothing for each model and lead time based on the area under the ROC curve. We then calibrate the resulting probabilities using isotonic (i.e. monotonically increasing) regression. Experiments are conducted using both static and dynamically varying weighting strategies for both deterministic and probabilistic radar precipitation nowcasting. The goal is to produce a blended and post-processed nowcast that outperforms each individual method across all lead times and precipitation thresholds. 

How to cite: Brunet, D., Huang, L., Belletête, J., Mahidjiba, A., and Boodoo, S.: A Lagrangian blending of optical flow and ML-based radar precipitation nowcasts , EGU General Assembly 2026, Vienna, Austria, 3–8 May 2026, EGU26-12781, https://doi.org/10.5194/egusphere-egu26-12781, 2026.

EGU26-13223 | ECS | Orals | NP5.1

Scale-dependent analysis of the accuracy–activity trade-off in AI weather forecasts 

Britta Seegebrecht, Sabrina Wahl, Stefanie Hollborn, Erik Pavel, Wael Almikaeel, Michael Langguth, Martin Schultz, Christian Lessig, Ilaria Luise, Juergen Gall, Anas Al-Iahham, and Mohamad Hakam Shams Eddin

Data-driven weather prediction models based on artificial intelligence (AI) have rapidly advanced in recent years and are frequently reported to outperform traditional physics-based numerical weather prediction (NWP) models for selected verification scores. However, optimization with respect to a specific loss function can adversely affect other metrics, potentially leading to unrealistic forecast characteristics, such as overly smooth spatial structures when mean-squared or mean-absolute error–based loss functions are used.

A robust and meaningful comparison of AI-based and NWP models therefore requires a carefully chosen and diverse set of verification metrics that accounts for potential dependencies. The main focus is placed on the prominent forecast accuracy-activity tradeoff, associated with the double penalty problem of deterministic forecasts. Related questions include: How sensitive is the relationship between accuracy and activity metrics to the choice of verification measure? Are there systematic differences between AI-based and NWP models? What is the impact of the (in)dependence between the AI training loss function and the verification metrics on the assessment of forecast skill?

These questions are addressed using both scale-independent and scale-dependent verification metrics, allowing the quantification of forecast performance on individual spatial scales.

As a starting point, global deterministic forecasts are considered. The analysis is partly based on forecasts from the Weather Prediction Model Intercomparison Project (WP MIP), which provides a collection of NWP and AI-model forecasts from multiple national weather services and research institutions.

The work is conducted within the RAINA project, which aims to develop a foundation model for the atmosphere with a particular focus on reliable, high-resolution forecasts of extreme wind and precipitation events. Consequently, the relation between, e.g., forecast activity and the predictive capability for extreme weather are of special interest.

How to cite: Seegebrecht, B., Wahl, S., Hollborn, S., Pavel, E., Almikaeel, W., Langguth, M., Schultz, M., Lessig, C., Luise, I., Gall, J., Al-Iahham, A., and Shams Eddin, M. H.: Scale-dependent analysis of the accuracy–activity trade-off in AI weather forecasts, EGU General Assembly 2026, Vienna, Austria, 3–8 May 2026, EGU26-13223, https://doi.org/10.5194/egusphere-egu26-13223, 2026.

As meteorological organisations transition to high-resolution ensemble-based forecasting, they risk leaving behind downstream users who rely on deterministic data: a need that may arise from the inability to process large volumes of data, or difficulty integrating probabilistic information into decision-making processes. Current solutions for such users typically involve providing the control (unperturbed) member of the ensemble, or deriving a single-value forecast through the independent treatment of variables (e.g., taking a median). However, relying solely on the control member discards the valuable information encoded within the full ensemble, fundamentally undermining the purpose of the ensemble. Meanwhile, univariate approaches can result in forecasts that lack physical consistency across variables. This limitation becomes critical when variables are interpreted jointly in real‑world decision‑making. Wind speed and direction exemplify this: these variables are used together in sectors such as renewable energy, where they inform turbine operation and resource planning, and aviation, where they underpin safety‑critical decisions around take‑off and landing. For these users, unrealistic combinations of speed and direction can translate directly into flawed risk assessments. 


To address this gap, we present a novel ensemble post-processing technique that generates physically-consistent spot forecasts of wind speed and direction by exploiting the full ensemble distribution. The method constructs joint predictive probability density functions (PDFs) using a Gamma kernel for wind speed and a von Mises kernel for wind direction, accommodating the distinct statistical properties of these variables: non-negativity and skewness for speed, and circularity for direction. A single-value forecast is then obtained by selecting the ensemble member that maximizes its log-likelihood under the joint density across a specified forecast horizon. Because the selected forecast corresponds to one of the original ensemble members, it represents a physically plausible atmospheric state and maintains consistency across all variables, including those not directly analysed. This is critical for operational users: approaches that treat wind speed and direction separately (such as taking independent averages or applying separate post-processing to each variable) can produce unrealistic artefacts when passed through downstream physical or statistical models.  


This method was evaluated using the Met Office convective-scale ensemble, MOGREPS-UK, over the UK domain for a full calendar year, with verification at both the surface and aloft. Results are promising: the approach demonstrates the potential to outperform the control member, particularly at longer leadtimes where ensemble spread is greatest. These findings highlight an important step toward improving our offering to users and ensuring they remain supported as we transition to purely ensemble-based forecasting. Crucially, this work is not just theoretical; the next stage is to embed the technique into operational workflows and deliver it within user-facing products, ensuring these advances translate directly into improved real-world decision-making. 

How to cite: Lake, A.: Joint Forecasting of Wind Speed and Direction via Ensemble Post-Processing, EGU General Assembly 2026, Vienna, Austria, 3–8 May 2026, EGU26-13365, https://doi.org/10.5194/egusphere-egu26-13365, 2026.

Current state-of-the-art artificial-intelligence weather prediction (AI-WP) systems are trained on a large archive of atmospheric reanalysis data. The training objective is to replicate the analysis at a future time step using the previous time steps. Loss functions guide the model to minimize the prediction error on known data. An analysis-based verification of forecasts derived from unseen data will reveal the strength and weaknesses of the AI-WP model in reproducing the statistical and dynamical characteristics of the underlying reanalysis.

In contrast, the development and fine-tuning of traditional physics-based numerical weather prediction (NWP) systems relies on verification against observations, with the aim of reducing discrepancies relative to various observational systems. This fundamental difference raises the question of what to expect when applying observation-based verification to AI-WP models that are trained on reanalysis rather than directly on observations.

Reanalysis datasets have well-known errors with respect to observations which are documented in literature. Consequently, observation-based verification of AI-WP systems will inherently reflect the observational error characteristics of the reanalysis. Deviations from this expectation are particularly informative: a larger error than that of the reanalysis may indicate deficiencies in emulation, whereas a smaller error raises the question of whether, and from where, additional information beyond the reanalysis has been obtained.

To address these questions, we apply the multiple correlation decomposition based on partial correlations introduced by Glowienka-Hense et al. (2020). This method decomposes the explained variance of two different datasets with respect to the same observations into a component of information contained in both datasets (shared explained variance) and the respective added values, i.e., information present in one dataset but not in the other. This decomposition enables quantification of the information transferred from the reanalysis into the forecasts and reveals potential deficiencies, or improvements relative the reanalysis, in the training process. Furthermore, it facilitates comparison of different forecasting systems in terms of there shared and unique information content. The method is demonstrated using 2m-temperature station observations and global deterministic AI-WP and NWP forecasts.

Glowienka-Hense et al. (2020): Comparing forecast systems with multiple correlation decomposition based on partial correlation, ASCMO, 6, 103–113, https://doi.org/10.5194/ascmo-6-103-2020

How to cite: Wahl, S.: Observation-based verification of AI weather prediction models: What can we expect?, EGU General Assembly 2026, Vienna, Austria, 3–8 May 2026, EGU26-13910, https://doi.org/10.5194/egusphere-egu26-13910, 2026.

EGU26-14107 | Posters on site | NP5.1

Improvements to the Met Office operational Visibility diagnostic using Machine Learning  

Katharine Grant and Gavin Evans

Visibility forecasting is critical for aviation, transportation, and public safety, yet remains a challenging aspect of meteorology due to complex atmospheric processes and aerosol interactions. Accurate visibility prediction is essential for operational decision-making, but traditional approaches often struggle with physical realism and probabilistic reliability. 

This study addresses these challenges within the Met Office’s IMPROVER (Integrated Model post-PROcessing and VERification) framework, which provides probabilistic post-processing of Numerical Weather Prediction (NWP) output for customers including the UK Public Weather Service. Historically, visibility diagnostics in IMPROVER have been constrained by limitations in the underlying NWP model. To overcome this, two key enhancements were introduced. First, the integration of VERA (Visibility Employing Realistic Aerosols), an existing diagnostic within the Unified Model (UM), which incorporates polydisperse aerosol effects to deliver a more physically consistent representation of visibility.  
Second, building on this improved foundation, a statistical post-processing step was implemented using Quantile Regression Forests (QRF), marking the first application of machine learning within IMPROVER. QRF was chosen for its ability to capture complex, non-linear relationships and produce calibrated probabilistic forecasts. 

The primary objective was to improve forecast skill at operationally significant thresholds, particularly <7.5 km and <1 km, which are critical for aviation and road safety. Benchmarking on the EUPPBench dataset compared QRF against reliability calibration and Distribution Regression Networks (DRN). QRF demonstrated superior performance, achieving a 45% improvement in Ranked Probability Skill Score (RPSS) over the raw NWP output. Subsequent testing using Met Office data also showed significant improvement, with QRF delivering a 9% RPSS increase for thresholds <7.5 km and a 22% improvement in Continuous RPSS across all thresholds. 

This work demonstrates the value of combining physically realistic NWP diagnostics with machine learning techniques to enhance probabilistic visibility forecasts. These improvements pave the way for more reliable decision-making in sectors sensitive to visibility conditions. Putting this research into operational production as of early 2026 represents a significant step forward in the quality of our visibility forecasts. 

How to cite: Grant, K. and Evans, G.: Improvements to the Met Office operational Visibility diagnostic using Machine Learning , EGU General Assembly 2026, Vienna, Austria, 3–8 May 2026, EGU26-14107, https://doi.org/10.5194/egusphere-egu26-14107, 2026.

EGU26-14658 | ECS | Posters on site | NP5.1

Representation of equatorial waves in state-of-the-art data-driven weather prediction models 

Jasmin Haupt, Hyunju Jung, Marie Müller, Steffen Tietsche, Tobias Selz, Peter Knippertz, and Julian Quinting

Equatorial waves are a key process in shaping tropical weather and have been linked to tropical-extratropical teleconnections. Besides, they are one of the reasons for the higher predictability limit in the tropics compared to the extratropics. Yet, their correct representation in weather prediction models is a long-standing challenge, even at model resolutions on the km-scale, leaving substantial potential in global weather predictions unused.

In this study, we systematically quantify and compare the representation of equatorial waves in 10-day forecasts of operational deterministic state-of-the-art weather prediction models (numerical, hybrid, and data-driven). The forecast data initialized from 01 January 2020 to 16 December 2020 are provided by WeatherBench2 and dedicated experiments with AIFS from the European Centre for Medium-Range Weather Forecasts (ECMWF). Equatorial Kelvin, Rossby, and westward-moving mixed Rossby-Gravity waves have been identified based on 850-hPa winds and geopotential height using the approach of Yang et al. (2003). The filtered data-driven forecast data are evaluated against ERA5 and operational ECMWF analysis for wave amplitude and pattern correlation, and compared with the numerical weather prediction (NWP) model Integrated Forecasting System (IFS) from ECMWF.

The key finding is that for the period 2020, all data-driven weather prediction models outperform the NWP-based forecasts of the IFS model in representing equatorial wave patterns beyond 3 days lead time, evaluated with the Pearson Correlation Coefficient, except for the Rossby wave mode n=1, which is equally well represented by all models.  
For Kelvin waves, the difference in forecast skill is most remarkable with an extension of the forecast horizon in most models from 8 to 10 days. In terms of Kelvin wave activity bias, ML-models exhibit a smaller systematic error than the IFS model, which locally underestimates the Kelvin wave activity by up to 30 % when evaluated against ERA5, with the highest underestimation in the Pacific. Interestingly, the equatorial wave representation in the data-driven model Pangu-Weather depends on the initialization dataset. We currently investigate the reason for this difference by systematically comparing ML-forecasts initialized from ERA5 and operational ECMWF analysis.

How to cite: Haupt, J., Jung, H., Müller, M., Tietsche, S., Selz, T., Knippertz, P., and Quinting, J.: Representation of equatorial waves in state-of-the-art data-driven weather prediction models, EGU General Assembly 2026, Vienna, Austria, 3–8 May 2026, EGU26-14658, https://doi.org/10.5194/egusphere-egu26-14658, 2026.

This study aims to estimate the objective amount of the supercooled liquid water content (SLWC) using in situ aircraft observation data to construct an objective and consistent long-term dataset of aircraft icing intensity. SLWC was estimated using two conventional calibration methods and a newly proposed Gated Recurrent Unit (GRU) model, based on measurements from the Rosemount Icing Detector (RICE) and collocated in situ aircraft observations. The observations were collected by NARA research aircraft operated by the National Institute of Meteorological Sciences in South Korea, which has conducted regular atmospheric observations since February 2018. The GRU-based approach demonstrated substantially improved performance compared to the calibration methods, achieving a Pearson correlation coefficient of 0.945 and a Nash–Sutcliffe efficiency of 0.891 when evaluated against independent observations not used in model training. In particular, the proposed method enables a more detailed representation of SLWC evolution by providing time-series SLWC estimates, whereas calibration-based approaches typically provide a single representative value for each icing event. The GRU-based estimates closely reproduce the observed temporal variability of SLWC in NARA icing cases, further demonstrating the capability of the proposed method to capture realistic SLWC evolution. The estimated SLWC from the proposed model were subsequently used to classify icing intensity based on operationally established SLWC thresholds for each icing intensity category, resulting in a robust long-term icing intensity dataset spanning over six years. The outcomes of this study are expected to contribute not only to aircraft icing research but also to a broad spectrum of applications including remote-sensing-based hydrometeor detection, cloud microphysical processes, and numerical weather prediction model parameterizations.

Acknowledgement: This research is supported by the Korea Meteorological Administration Research and Development Program under Grant RS-2022-KM220310 and RS-2022-KM220410.

How to cite: Kim, E.-T. and Kim, J.-H.: A Novel Method for Estimating the Supercooled Liquid Water Content Using In Situ Aircraft Observation Data and Gated Recurrent Unit, EGU General Assembly 2026, Vienna, Austria, 3–8 May 2026, EGU26-15199, https://doi.org/10.5194/egusphere-egu26-15199, 2026.

EGU26-17204 | ECS | Orals | NP5.1

Dynamical evaluation of the error representation in the generative AI nowcasting model  LDCast 

Martin Bonte, Stéphane Vannitsem, and Lesley De Cruz

The variability in ensemble forecasts can either be generated dynamically - as is usually done with Numerical Weather Prediction (NWP) models -, stochastically or by using new approaches such as AI generative techniques. As these approaches are in their infancy for geophysical applications, the properties of the ensembles of generative models are still far from clear, especially if those models are to be used in operational activities. This aspect is investigated here for nowcasting models.

This work provides a predictability analysis over Belgium for the generative AI nowcasting model LDCast [1], as well as for the stochastic STEPS nowcasting algorithm (pysteps implementation [2]). Both models correctly estimate the error at almost all scales by means of their ensemble spread (i.e. good spread/error relationship), and they adapt the morphology of their ensembles depending on whether the event dynamics is convective or stratiform. Surrogate ensembles are also derived from the ensembles of STEPS and LDCast, and used as benchmarks with which to compare the spatial scores of the models. This reveals that both STEPS and LDCast ensembles struggle to provide added value for the spatial localization of the uncertainty associated with the growth and decay of rainfall. Therefore, STEPS and LDCast ensembles seem to be accurate statistically but not dynamically.

[1] Leinonen, J., et al. (2023). Latent diffusion models for generative precipitation nowcasting with accurate uncertainty quantification. arXiv preprint arXiv:2304.12891.

[2] Pulkkinen, S., et al. (2019). Pysteps: an open-source python library for probabilistic precipitation nowcasting (v1.0). GMD, 12(10):4185–4219.

How to cite: Bonte, M., Vannitsem, S., and De Cruz, L.: Dynamical evaluation of the error representation in the generative AI nowcasting model  LDCast, EGU General Assembly 2026, Vienna, Austria, 3–8 May 2026, EGU26-17204, https://doi.org/10.5194/egusphere-egu26-17204, 2026.

EGU26-17479 | Orals | NP5.1

From ERA5 to Precipitation Extremes: Global km-Scale, Sub-Hourly Downscaling with Generative AI 

Luca Glawion, Julius Polz, Harald Kunstmann, Benjamin Fersch, and Christian Chwala

Global reanalysis products such as ERA5 are indispensable for climate and hydrological studies, yet their coarse spatial and temporal resolution limits the representation of localised and short-lived precipitation extremes. Building on our earlier work [1], we now present the published and ready-to-use version of spateGAN-ERA5, a generative AI framework for global spatio-temporal downscaling of ERA5 precipitation to kilometre and sub-hourly scales (2 km, 10 min) [2].

The model, trained using gauge-adjusted radar observations over Germany, generates realistic high-resolution precipitation ensembles conditioned on ERA5 inputs. We demonstrate robust performance across multiple climate regimes through independent evaluations over Germany, the United States, and Australia, showing clear improvements in spatial structure, temporal coherence, and extreme rainfall representation compared to native ERA5 fields. Ensemble generation further enables probabilistic uncertainty quantification.

To facilitate broad adoption, we provide a public, easy-to-use downscaling tool [3] that enables on-demand generation of high-resolution precipitation for any region and time period worldwide. The approach is computationally efficient and applicable on modest GPU hardware, making it suitable for both regional studies and large-scale applications. spateGAN-ERA5 thus establishes a practical pathway toward global high-resolution precipitation products for climate impact analysis, hydrological modelling, and AI-based weather and climate research.

[1] Glawion, L., Polz, J., Kunstmann, H., Fersch, B., & Chwala, C. (2023). spateGAN: Spatio‑temporal downscaling of rainfall fields using a cGAN approach. Earth and Space Science, 10, e2023EA002906. https://doi.org/10.1029/2023EA002906

[2] Glawion, L., Polz, J., Kunstmann, H., Fersch, B., & Chwala, C. (2025). Global spatio‑temporal ERA5 precipitation downscaling to km and sub‑hourly scale using generative AI. npj Climate and Atmospheric Science, 8, 219. https://doi.org/10.1038/s41612-025-01103-y

[3] https://github.com/LGlawion/spateGAN_ERA5

How to cite: Glawion, L., Polz, J., Kunstmann, H., Fersch, B., and Chwala, C.: From ERA5 to Precipitation Extremes: Global km-Scale, Sub-Hourly Downscaling with Generative AI, EGU General Assembly 2026, Vienna, Austria, 3–8 May 2026, EGU26-17479, https://doi.org/10.5194/egusphere-egu26-17479, 2026.

EGU26-17711 | ECS | Orals | NP5.1

Probabilistic Benchmarks and Post-Processing for Data-Driven Weather Forecasting 

Tobias Biegert, Nils Koster, and Sebastian Lerch

In recent years, significant progress in machine learning technologies has enabled the development of various artificial intelligence weather prediction (AIWP) models, approaching, or even surpassing the skill of numerical weather prediction (NWP) models.

However, despite these advancements, several important questions remain open. Most data-driven models primarily focus on deterministic point forecasts and lack the capability to generate probabilistic predictions, which, however, is crucial for optimal decision making and quantifying weather risk in applications. Further, while it has been widely demonstrated that physics-based NWP models substantially benefit from post-processing methods, which aim to correct systematic errors, the use of post-processing for data-driven weather models has not been explored in detail.

Our overarching aim thus is to investigate the application of various post-processing techniques to potentially improve predictions, as well as to generate probabilistic forecasts from deterministic AIWP as well as NWP model outputs. We assess whether AI-based weather models benefit from post-processing to a similar extent as physics-based NWP, enabling a fair comparison between post-processed AIWP and NWP forecasts. The resulting post-processed AIWP forecasts also yield a relatively simple probabilistic benchmark for evaluating whether inherently probabilistic AIWP models deliver commensurate skill improvements given their increased computational cost.

Experiments are based on the WeatherBench 2 framework, which provides a standardized archive of prominent AIWP as well as operational NWP model outputs. Specifically, we apply a suite of established statistical and machine learning post-processing methods to model outputs for the eight variables defined as headline scores (Z500, T850, Q700, WV850, T2M, WS10, MSLP, TP24hr) in the WeatherBench 2 framework, and systematically evaluate the effectiveness of these methods for improving deterministic and probabilistic forecasts.

Results show that post-processed probabilistic forecasts can outperform the ensemble predictions from the European Centre for Medium-Range Weather Forecasts for shorter lead times of up to one week for selected variables, but the results vary across variables, lead times, post-processing methods and forecasting models.

How to cite: Biegert, T., Koster, N., and Lerch, S.: Probabilistic Benchmarks and Post-Processing for Data-Driven Weather Forecasting, EGU General Assembly 2026, Vienna, Austria, 3–8 May 2026, EGU26-17711, https://doi.org/10.5194/egusphere-egu26-17711, 2026.

Taiwan is located along the circum-Pacific seismic belt and is frequently affected by destructive earthquakes. Identifying reliable preseismic anomalies is therefore crucial for seismic hazard mitigation. Previous studies have demonstrated that groundwater levels are influenced not only by nontectonic factors—such as precipitation, atmospheric pressure, tides, and temperature—but also by stress redistribution associated with earthquake preparation processes. However, robust quantitative methods capable of separating nontectonic influences from tectonic anomalies remain limited. In this study, the 2016 Meinong earthquake in southern Taiwan was investigated as a case study. Support vector regression (SVR) models were developed using meteorological variables and groundwater level observations to construct predictive models of groundwater fluctuations and to identify preseismic anomalies related to crustal stress accumulation. Groundwater monitoring stations located west of the epicenter were first selected based on their clear coseismic responses and strong spatial correspondence with observed surface deformation. Using air temperature, precipitation, and atmospheric pressure as explanatory variables, the SVR model and the Akaike Information Criterion (AIC) were applied to determine optimal lag structures and to establish pre-earthquake groundwater prediction models. The trained models were then used to simulate groundwater levels over the two years preceding the earthquake, and residual analysis was performed to identify anomalous signals. Among the 12 analyzed stations, 9 exhibited coefficients of determination (R²) ranging from 0.18 to 0.79. Stations situated in coastal fine-sand aquifers showed substantially higher predictive performance (R² = 0.42–0.79) than those located in mountainous regions (R² = 0.18–0.49). Six stations displayed pronounced negative residual anomalies exceeding two standard deviations approximately one year prior to the earthquake, followed by a gradual recovery toward the event. This temporal pattern is consistent with deformation trends observed at nearby surface monitoring stations. In addition, three stations exhibited short-term residual anomalies exceeding two standard deviations within approximately one month before the earthquake. These results demonstrate that groundwater level anomalies derived from physically informed predictive models can be systematically linked to surface deformation and short-term precursory processes preceding earthquakes. Our findings highlight the potential of groundwater monitoring as a complementary indicator for earthquake precursor detection and seismic hazard assessment.

How to cite: Mai, Y.-L., Chen, X.-N., and Lu, T.-H.: Identification of Tectonic Anomalies Prior to the Meinong Earthquake in Taiwan Using a Support Vector Regression–Based Groundwater Level Model, EGU General Assembly 2026, Vienna, Austria, 3–8 May 2026, EGU26-18581, https://doi.org/10.5194/egusphere-egu26-18581, 2026.

EGU26-18999 | Posters on site | NP5.1

Machine learning sea-surface temperature forecasting based on empirical orthogonal functions 

Takeshi Enomoto, Aki Saito, and Saori Nakashita

Data-driven forecasting of the atmosphere and ocean is evolving rapidly. Recent reports on machine learning weather prediction (MLWP) demonstrate that these models rival or even outperform traditional numerical weather prediction (NWP) from leading operational centres. While the inference is faster than physics-based models, MLWP typically requires Graphical Processing Units (GPUs) or Tensor Processing Units (TPUs) with significant memory, and the computational requirements for training remain enormous.

Certain applications prioritize efficiency, such as sea-surface temperature (SST) prediction on research vessels with limited communication bandwidth. We address this problem by proposing a light-weight alternative to convolutional neural networks (CNNs) or vision transformers (ViTs). To this end, we utilize gradient boosting, specifically XGBoost, which is highly efficient for tabular data. To incorporate spatial patterns, we conduct the Singular Value Decomposition (SVD) to derive Empirical Orthogonal Functions (EOFs). We train the model on the four years of 0.1° SST data based on Himawari over the Western Pacific (120°E–150°E, 20°N–50°N). Preliminary 5-day forecasts show a median error improvement to −0.082 K from 0.10 K and a reduction in standard deviation to 0.68 K from 0.74 K compared to the persistence baseline.

Acknowledgements: This work was supported by JSPS KAKENHI 24H02226.

How to cite: Enomoto, T., Saito, A., and Nakashita, S.: Machine learning sea-surface temperature forecasting based on empirical orthogonal functions, EGU General Assembly 2026, Vienna, Austria, 3–8 May 2026, EGU26-18999, https://doi.org/10.5194/egusphere-egu26-18999, 2026.

Uncertainty remains a major challenge in typhoon rainfall forecasting over Taiwan, even when cloud-resolving numerical weather prediction models are employed. Individual forecasts often exhibit large variability in rainfall amount and spatial distribution, particularly at long lead times, while their credibility is generally unknown at forecast time.

This study presents a machine learning–based framework for the a priori diagnosis of uncertainty in typhoon rainfall forecasts. Approximately fifteen years of cloud-resolving regional model forecasts and corresponding precipitation observations are used to quantify forecast quality through a similarity skill score (SSS), which measures the spatial agreement between forecasted and observed accumulated rainfall during the typhoon impact period. The machine learning model is designed to predict the future SSS of individual forecasts using only information available at forecast time, including diagnostics from the regional model and large-scale environmental and track-related predictors derived from global forecasts.

To ensure robust evaluation, the dataset is split by independent typhoon cases and time periods to avoid information leakage. Preliminary analyses suggest that the proposed approach can capture variations in forecast credibility, with forecasts predicted to have high SSS exhibiting a substantially higher likelihood of achieving high observed SSS.

Rather than improving rainfall forecasts themselves, this study focuses on statistical post-processing and uncertainty diagnosis, demonstrating the potential of machine learning as an objective tool for assessing the credibility of high-resolution typhoon rainfall forecasts.

How to cite: Chen, S.-H. and Wang, C.-C.: A Priori Diagnosis of Uncertainty in Cloud-Resolving Typhoon Rainfall Forecasts over Taiwan Using Machine Learning, EGU General Assembly 2026, Vienna, Austria, 3–8 May 2026, EGU26-19403, https://doi.org/10.5194/egusphere-egu26-19403, 2026.

EGU26-19639 | Orals | NP5.1

Discrete Learning Algorithms for Precipitation Estimation from Commercial Microwave Links 

Guy Even, Andreas Karrenbauer, Rex Lei, Jonatan Ostrometzky, and Christian Sohler

Commercial microwave links (CMLs) are part of the infrastructure of wireless networks.  Their measured attenuations have been studied as an opportunistic source for monitoring spatiotemporal rainfall and other atmospheric phenomena. CML attenuation measurements can enhance the spatiotemporal accuracy and resolution of existing weather monitoring instruments. In addition, they serve as stand-alone weather monitoring devices in places where dedicated weather monitoring devices are scarce or do not exist.

Current techniques for 2D rainfall map reconstruction usually reduce CML measurements to virtual rain-gauges (i.e., point measurements) and rely on interpolation techniques such as inverse distance weighting or Kriging. While effective in many scenarios, these methods are suboptimal because they do not address the mis-modeling due to the reduction from a link-path attenuation integration to a single point rain-intensity measurement.

In this study, we revisit the rainfall map reconstruction problem from CML signal attenuation measurements as a principled optimization approach. We formulate the problem of the partial-to-complete field reconstruction as a physics-informed optimization problem. The reconstructed rainfall field is quantized and represented by pixel-rainfall variables whose values are constrained to agree with the observed CML signal attenuations. The resulting solution minimizes a weighted sum of the attenuation errors along the links, spatial differences between neighboring pixels, and the total rainfall in all the pixels of the map.

To evaluate our approach, we create a benchmark of hundreds of rainfall maps and CML locations and attenuations.
Rainfall maps are algorithmically extracted by identifying rain events in EURADCLIM rain maps (the European climatological high-resolution gauge-adjusted radar precipitation dataset). We identify rain events consisting of patches of about 50x50 km² over various terrain types and rain patterns.
We overlay CMLs on each patch using the free ``Four-year commercial microwave link dataset for the Netherlands'' (publicly available in the 4TU.ResearchData platfrom).
We then apply the ITU-R P.838 model at a pixel level to compute the CML attenuations based on the rainfall to obtain noiseless attenuation measurements.

We apply the inverse optimization procedure to the CML attenuations to reconstruct the rainfall maps. The accuracy of the reconstructed rainfall map is evaluated and compared with the inverse distance weighting approach.
Overall, this study reframes rainfall reconstruction from opportunistic sensing networks as a well-posed inverse problem with an explicit objective function.
Our reconstruction framework can also assist in explaining AI-solutions in the absence of ground truth.

How to cite: Even, G., Karrenbauer, A., Lei, R., Ostrometzky, J., and Sohler, C.: Discrete Learning Algorithms for Precipitation Estimation from Commercial Microwave Links, EGU General Assembly 2026, Vienna, Austria, 3–8 May 2026, EGU26-19639, https://doi.org/10.5194/egusphere-egu26-19639, 2026.

As a proper score, the continuous ranked probability score (CRPS) is widely used within the field of statistical postprocessing of ensemble forecasts, both for forecast verification and as a loss function for parameter estimation with distributional regression approaches. This includes standard ensemble model output statistics (EMOS) and machine learning (ML) based approaches such as distributional regression networks (DRN). It is known that the CRPS admits equivalent representations as an integral of the Brier score over probability thresholds or an integral of the quantile score over quantile levels. The CRPS can be further generalized with a weighting function to put more weight on certain regions of the predictive distribution (the threshold-weighted CRPS or twCRPS), or to put more weight on certain quantiles of the distribution (quantile-weighting, denoted qwCRPS). In this work, we consider a general 2-parameter class of weight functions that give rise to an analytical expression for the qwCRPS for certain predictive distributions such as the logistic distribution. This generalized version of the CRPS puts a different penalty on over- or underforecasting the meteorological variable, allowing tailored postprocessing for end users with specific cost-loss ratios. We apply a DRN approach using the qwCRPS as loss function to various use cases, including the postprocessing of wind power forecasts for the Belgian Offshore Zone, and compare with the use of the standard CRPS as loss function. We also perform validation using the quantile score and the continuous generalisation of the relative economic value.

How to cite: Van den Bergh, J. and Smet, G.: Tailored postprocessing of ensemble forecasts with distributional regression networks and a quantile-weighted version of the continuous ranked probability score, EGU General Assembly 2026, Vienna, Austria, 3–8 May 2026, EGU26-20150, https://doi.org/10.5194/egusphere-egu26-20150, 2026.

Weather forecasts are issued by numerical weather prediction models, which describe the dynamic behaviour of the atmosphere. Due to the chaotic nature of the atmospheric processes, assessing the uncertainty of forecasts is essential. The state-of-the-art method is to run the prediction models several times with different initialisation and/or parameterisation to obtain an ensemble of forecasts, better representing the possible scenarios.

In the last few years, AI-based models have become the centre of attention in weather forecasting due to their accuracy and efficiency. The European Centre for Medium-Range Weather Forecasts (ECMWF) has developed its Artificial Intelligence/Integrated Forecasting System (AIFS) model, which was first to provide data-driven ensemble forecasts in June 2024. Since July 2025, the AIFS ensemble model has been operational and runs in parallel with the physics-based Integrated Forecasting System (IFS) model of ECMWF, which is considered the gold standard in weather prediction. The new AIFS model can generate forecasts ten times faster than the classical physics-based one, while consuming approximately a thousand times less energy.

We present the results of our systematic comparison of the performances of the IFS and AIFS models by investigating the accuracy of raw and post-processed 10-metre wind-speed forecasts generated by the two models between July 2025 and November 2025 across several thousand station locations. The post-processed case involves the application of the parametric Ensemble Model Output Statistics method as well as a nonparametric quantile regression approach to correct any systematic biases and dispersion inaccuracies in the raw forecasts, which are usually detectable in the case of ensemble predictions.

How to cite: Kocsis, M. and Baran, S.: AI and Physics-Based Weather Forecasting: A Comparative Study of ECMWF's Operative AIFS and IFS Ensemble Wind Speed Predictions, EGU General Assembly 2026, Vienna, Austria, 3–8 May 2026, EGU26-20244, https://doi.org/10.5194/egusphere-egu26-20244, 2026.

EGU26-20598 | ECS | Posters on site | NP5.1

Efficient deep learning for radar precipitation nowcasting using spatiotemporal encoding and two-dimensional reconstruction  

Manasa Pawar, Nicoletta Noceti, and Antonella Galizia

Short-term precipitation nowcasting, the prediction of rainfall over lead times from a few minutes to about an hour, remains challenging because radar-derived precipitation fields evolve not only through motion but also through rapid, non-linear changes such as growth, decay, and structural reorganization. Classical extrapolation methods are efficient yet struggle to represent these intensity and morphology changes, while many learning-based approaches become costly when scaled to large, high-resolution radar grids. 

Our approach treats temporal learning and spatial reconstruction as two separate problems. A compact 3D convolutional encoder processes a short radar sequence to capture how precipitation structures evolve over time. We then convert the encoder feature volumes into 2D skip representations through depth aggregation and channel compression and use a lightweight 2D decoder to reconstruct full resolution forecasts. We benchmark against persistence and a strong 2D convolution baseline. 

The framework is evaluated on the RYDL dataset derived from the German Weather Service radar composite, providing 2D radar fields every five minutes over Germany at 1 × 1 km resolution on a 900 × 900 grid. Performance is benchmarked against persistence and a strong 2D convolutional baseline using complementary verification measures, including mean absolute error, critical success index at multiple intensity thresholds, and fractions skill score with spatial tolerance. Across benchmark lead times, the proposed approach reduces MAE from 0.22 to 0.20 at 5 min, from 0.35 to 0.28 at 30 min, and from 0.44 to 0.42 at 60 min relative to the 2D baseline, indicating improved robustness at intermediate horizons while retaining competitive short-range accuracy. These results suggest that combining explicit spatio-temporal encoding with efficient two-dimensional reconstruction offers a practical route to scalable radar nowcasting on large domains. 
Keywords: Radar nowcasting, precipitation forecasting, deep learning, spatio-temporal representation learning, forecast verification 

How to cite: Pawar, M., Noceti, N., and Galizia, A.: Efficient deep learning for radar precipitation nowcasting using spatiotemporal encoding and two-dimensional reconstruction , EGU General Assembly 2026, Vienna, Austria, 3–8 May 2026, EGU26-20598, https://doi.org/10.5194/egusphere-egu26-20598, 2026.

EGU26-21878 | Orals | NP5.1

ExtremeWeatherBench 1.0: A Flexible Evaluation Framework for Extreme Weather Events 

Amy McGovern, Taylor Mandelbaum, and Daniel Rothenberg

Properly evaluating AI and NWP models before deployment will help to ensure that the final models are trustworthy. Currently, most evaluation is done at a global scale, such as with WeatherBench, rather than focusing on high-impact events. While this global evaluation is important, it can obscure the results of how a model performs on high-impact events. For example, a heat wave may be poorly forecast by one model but the model may look promising overall when examining global Root Mean Squared Error. Only by examining specific case studies do we get the bigger picture of how the model performs on phenomena that impact humanity around the world.

We introduce Extreme Weather Bench (EWB), a new community driven benchmarking suite with almost 300 case studies of high-impact weather events across the globe. EWB facilitates model validation and verification on a variety of high-impact hazards that matter to people around the globe. EWB provides a standard set of case studies (spanning multiple spatial and temporal scales and different parts of the weather spectrum), observational data, impact-based metrics, and open-source code for users to evaluate their models. The case studies include tropical cyclones, atmospheric rivers, convective weather outbreaks, heat waves and major freeze events. To facilitate ease-of-use, EWB is distributed as a pure Python package, and integrates with either local data or data saved on the cloud.

EWB will help to drive the science forward for all weather models, enabling true comparisons across models and enabling people to evaluate their models on specific high-impact phenomena while diving deeply into case studies. EWB is a free open-source community-driven system and will be adding additional phenomena, test cases and metrics in collaboration with the worldwide weather and forecast verification community.

How to cite: McGovern, A., Mandelbaum, T., and Rothenberg, D.: ExtremeWeatherBench 1.0: A Flexible Evaluation Framework for Extreme Weather Events, EGU General Assembly 2026, Vienna, Austria, 3–8 May 2026, EGU26-21878, https://doi.org/10.5194/egusphere-egu26-21878, 2026.

EGU26-21929 | Posters on site | NP5.1

Estimation and spatial prediction methods for high-frequency space-time solar irradiance 

William Kleiber and Nicolas Coloma

As the power grid moves to a more renewable future, energy sources from weather-driven phenomena such as solar power will form an increasingly large portion of electricity generation.  The predicatibility, non-Gaussianity and intermittency of solar resources challenge current grid operation paradigms, and realistic data scenarios are required for grid planning and operational studies.  However, such data are not available at the space-time resolution needed for realistic grid models.  Given sparse spatial samples that are high-resolution in time, we introduce a framework for spatiotemporal prediction and downscaling in a functional data analysis framework when data exhibit nonstationary phase misalignment.  The approach is illustrated on a challenging irradiance dataset and compares favorably against existing methods.

How to cite: Kleiber, W. and Coloma, N.: Estimation and spatial prediction methods for high-frequency space-time solar irradiance, EGU General Assembly 2026, Vienna, Austria, 3–8 May 2026, EGU26-21929, https://doi.org/10.5194/egusphere-egu26-21929, 2026.

EGU26-211 | ECS | Orals | SM3.4

Automatic detection and classification of Nanoseismicity in Distributed Acoustic Sensing data 

Dominic Seager, Jessica Johnson, Lidong Bie, Beatriz De La Iglesia, and Ben Milner

The detection of nanoseismicity (very tiny earthquakes sometimes associated with small cracks in rock, also called acoustic emissions) is an important area of research aiding in the understanding of geophysical processes, hazard detection, material failure and human-driven nanoseismicity. The high frequency and attenuation of nanoseismicity require high-frequency monitoring within metres of the source to capture the event. This has made them difficult to monitor in conditions outside of small-scale lab experiments, in which failure is intentionally induced. The development of distributed acoustic sensing (DAS) as a new tool for seismic monitoring, however, has increased the feasibility of investigating such signals in the field due to its high temporal and spatial resolution. Manual picking of these events, while possible, is impractical for long-term deployments and for time-critical applications such as stability monitoring, which limits the utility of the technology. Automation of the detection of nanoseismic events within such data is therefore essential for the long-term processing of DAS data and real-time processing of data for use in stability monitoring.  

We have developed a pipeline for the automated extraction of nanoseismic events from DAS data, using a new, simple ratio technique called Spatial Short-Term Average (SSTA). The pipeline takes an input of DAS data and generates a series of windows within the data containing information about high amplitude signals relating to nanoseismicity.  

Using the automatically detected events, we labelled the windows to train a series of machine learning models to classify the different signals. Once trained, we evaluated the performance of the various models to select the most effective method for processing the collected data. The best performing models will then be tested at scale with the resulting classified dataset being plotted spatially along the length of the deployment to identify patterns of activity across space and time. 

How to cite: Seager, D., Johnson, J., Bie, L., De La Iglesia, B., and Milner, B.: Automatic detection and classification of Nanoseismicity in Distributed Acoustic Sensing data, EGU General Assembly 2026, Vienna, Austria, 3–8 May 2026, EGU26-211, https://doi.org/10.5194/egusphere-egu26-211, 2026.

EGU26-893 | ECS | Orals | SM3.4

Optical Interferometry-based seafloor cable Measurements for Rupture Imaging and Tsunami Signal Analysis in the Southwest Pacific 

Amin A. Naeini, Bill Fry, Giuseppe Marra, Max Tamussino, Johan Grand, Jennifer D. Eccles, Kasper van Wijk, Dean Veverka, and Ratnesh Pandit

Optical interferometry on submarine fiber-optic telecommunication cables offers a transformative opportunity for offshore geohazard monitoring by providing continuous measurements of seafloor perturbation at useful intervals over trans-oceanic distances (Marra et al., 2022). We analyze a southwest Pacific subset of data from a section of the Southern Cross NEXT cable connecting Auckland (New Zealand) to Alexandria (Australia). Using only cable-based measurements, we image the seismic rupture kinematics of the 17 December 2024 Mw 7.3 Vanuatu earthquake, the largest seismic event recorded on this cable since its installation.


We analyze measurements of a section of cable more than 1,000 km in length and comprising 18 inter-repeater spans including the section that runs roughly parallel to the Vanuatu subduction zone and the adjoining section extending southward toward New Zealand. The earthquake produces clear and coherent arrivals in the optical frequency deviation recorded across multiple spans, with well-defined signatures visible in both time series and spectrograms. We first extract earthquake-related strain signals in the 0.1-0.3 Hz frequency band and apply the Multiple Signal Classification (MUSIC) back-projection technique to recover the source-time evolution of the rupture. The inferred rupture is predominantly bilateral and consistent with the USGS finite-fault solution, confirming that interferometric submarine cables can function as effective regional seismic arrays for rapid characterization of offshore earthquakes.


These results further demonstrate the capability of submarine fiber-optic cables to image earthquake rupture processes using high-frequency strain signals, providing valuable monitoring coverage, especially in instrumentally sparse regions such as the southwest Pacific. By resolving rupture kinematics directly, cable-based observations offer a pathway toward improved tsunami early-warning strategies that rely less on empirical magnitude–scaling relations, which are uncertain for large earthquakes. Planned upgrades of the interrogating laser will allow the performance of this approach to be assessed at lower frequencies, where cable-based observations may provide direct constraints on tsunami propagation and other long-period geophysical processes.

How to cite: A. Naeini, A., Fry, B., Marra, G., Tamussino, M., Grand, J., D. Eccles, J., van Wijk, K., Veverka, D., and Pandit, R.: Optical Interferometry-based seafloor cable Measurements for Rupture Imaging and Tsunami Signal Analysis in the Southwest Pacific, EGU General Assembly 2026, Vienna, Austria, 3–8 May 2026, EGU26-893, https://doi.org/10.5194/egusphere-egu26-893, 2026.

EGU26-1594 | ECS | Orals | SM3.4

Physics-based earthquake early warning using distributed acoustic sensing 

Itzhak Lior and Shahar Ben Zeev

We present a physics-based point source earthquake early warning system using distributed acoustic sensing (DAS) data. All core modules of the system are based on physical principles of wave propagation, and models that describe the earthquake source and far-field ground motion. The detection-location algorithm is based on time-domain delay-and-sum beamforming, and the magnitude estimation and ground motion prediction are performed using analytical equations based on the Brune omega squared model. We demonstrate the performance of the system in terms of magnitude estimation and ground motion prediction, and in terms of real-time computational feasibility using local 3.1 ≤ M ≤ 3.6 earthquakes. This DAS early warning system allows for fast deployment, circumventing some calibration phases that require gathering local DAS earthquake data before the system becomes operational.

How to cite: Lior, I. and Ben Zeev, S.: Physics-based earthquake early warning using distributed acoustic sensing, EGU General Assembly 2026, Vienna, Austria, 3–8 May 2026, EGU26-1594, https://doi.org/10.5194/egusphere-egu26-1594, 2026.

EGU26-3915 | ECS | Orals | SM3.4

Quasi-static waveform inversion from DAS observations 

Le Tang, Etienne Bertrand, Eléonore Stutzmann, Luis Fabian Bonilla Hidalgo, Shoaib Ayjaz Mohammed, Céline Gélis, Sebastien Hok, Maximilien Lehujeur, Donatienne Leparoux, Gautier Gugole, and Olivier Durand

As a vehicle approaches the fiber-optic cable, the distributed acoustic sensing (DAS) records a broadband strain rate, which corresponds to propagating seismic waves at high frequencies (>1Hz) and to quasi-static strain fields at low frequencies (<1Hz). However, characterizing the subsurface media through quasi-static deformations remains challenging. Here, we propose a new method for imaging shallow urban subsurface structures using quasi-static strain waveforms, measured with fiber-optic cables. This technique utilizes the quasi-static waveform of a single DAS channel to generate a local 1D velocity model, thereby enabling high-resolution imaging of the underground using thousands of densely packed channels. We employed the Markov Chain Monte Carlo (MCMC) inversion strategy to investigate the depth range of inversion using car-induced quasi-static waveforms. The synthetic data demonstrates that the quasi-static strain field generated by a standard small car moving over the ground enables detailed imaging of structures at depths from 0 to 10 meters. Additionally, we conducted field experiments to measure the 2D shear-wave velocity model along a highway using quasi-static strain waveforms generated by a four-wheeled small car. The velocity structure we obtained is closely aligned with that derived from the classical surface-wave phase-velocity inversion. This consistency indicates that the inversion depth range is comparable to the simulation results, which confirms the applicability of this method to real data. In the future, we anticipate using the city's extensive fiber-optic communication network to record quasi-static deformations induced by various types of vehicles, thereby enabling imaging of the urban subsurface at a citywide scale. This will provide valuable insights for the design of urban underground infrastructure and for assessing urban hazards and risks.

How to cite: Tang, L., Bertrand, E., Stutzmann, E., Bonilla Hidalgo, L. F., Mohammed, S. A., Gélis, C., Hok, S., Lehujeur, M., Leparoux, D., Gugole, G., and Durand, O.: Quasi-static waveform inversion from DAS observations, EGU General Assembly 2026, Vienna, Austria, 3–8 May 2026, EGU26-3915, https://doi.org/10.5194/egusphere-egu26-3915, 2026.

EGU26-4163 | Orals | SM3.4

Seismic data telemetry system and precise hypocenter location for distributed acoustic sensing observation using seafloor cable off Sanriku, Japan 

Masanao Shinohara, Shun Fukushima, Kenji Uehira, Youichi Asano, Shinichi S. Tanaka, and Hironori Otsuka

A seismic observation using Distributed Acoustic Sensing (DAS) using seafloor cable can provide spatially high-density data for a long distance in marine areas. A seafloor seismic and tsunami observation system using an optical fiber cable off Sanriku, northeastern Japan was deployed in 1996. Short-term DAS measurements were sporadically repeated since February 2019 using spare fibers of the Sanriku system (Shinohara et al., 2022). A total measurement length is approximately 100 km.  It has been concluded that measurement with a sampling frequency of 100 Hz, a ping rate of 500 Hz, gauge length of 100 m, and a spatial interval of 10 m is adequate for earthquake and tsunami observation.  From March 2025, we started a continuous DAS observation to observe seismic activity. When the continuous DAS observation was commenced, we developed quasi real time data transmission system through the internet. Because a DAS measurement generates a huge mount of data per unit time and capacity of internet is limited, decimation for spatial direction is adopted. In addition, data format is converted from HDF5 to conventional seismic data exchange format in Japan (win format). An interrogator generates a HDF5 file every 30 seconds. After the file generation, the telemetry system reads the HDF5 file, and decimates data for spatial domain. Then, the data format is changed to the win format and the data are sent to the internet. In other words, data transmission is delayed for a slightly greater than 30 seconds. Data with the win format can be applied to various seismic data processing which has been developed before. To locate a hypocenter using DAS data, seismic phases in DAS data must be identified. To evaluate performance of hypocenter location using DAS records, arrival times of P- and S-waves were picked up on the computer display for local earthquakes. Every 100 channel records on DAS data and data from surrounding ordinary seismic stations were used. Location program with absolute travel times and one-dimensional P-wave velocity structure was applied. Results of location of earthquakes were evaluated by mainly using location errors. Errors of the location with DAS data were smaller than those of the location without the DAS data. Increase of arrival data for DAS records seems to be efficient to improve a resolution. However, picking up signals for all channels (seismic station) manually are costly due to a large number of channels. To expand the location method, an improved automatic pick-up program using evaluation function from conventional seismic network data by seismometers for DAS data (Horiuchi et al., 2025) was applied to the DAS data obtained by the Sanriku system. As a result, arrivals time of P, S and converted PS waves can be precisely identified with high resolution. We have a plan to locate earthquakes using all DAS channels (seismic stations)  and surrounding ordinary marine and land seismic stations.

How to cite: Shinohara, M., Fukushima, S., Uehira, K., Asano, Y., Tanaka, S. S., and Otsuka, H.: Seismic data telemetry system and precise hypocenter location for distributed acoustic sensing observation using seafloor cable off Sanriku, Japan, EGU General Assembly 2026, Vienna, Austria, 3–8 May 2026, EGU26-4163, https://doi.org/10.5194/egusphere-egu26-4163, 2026.

EGU26-4254 | Orals | SM3.4

Using a hybrid seismic and Distributed Acoustic Sensing (DAS) network to study microseismicity in high spatiotemporal resolution offshore of Kefalonia Island, Greece  

Rebecca M. Harrington, Gian Maria Bocchini, Emanuele Bozzi, Marco P. Roth, Sonja Gaviano, Giulio Pascucci, Francesco Grigoli, Ettore Biondi, and Efthimios Sokos

Combining traditional seismic networks with Distributed Acoustic Sensing (DAS) to record ground-motion on telecommunications cables provides new opportunities to study small earthquakes with unprecedented spatial and temporal resolution. Here we present a detailed study of an earthquake sequence offshore northwest of Kefalonia island, Greece that began in March 2024 and returned to background levels by November–December. The sequence was recorded by both a permanent seismic network for its duration and by DAS on a fiber-optic telecommunications cable between 1 - 15 August 2024.  The two-week DAS dataset provides continuous strain measurements along ~15 km of optical fiber between northern Kefalonia and Ithaki during a period that captured elevated seismic activity. Combining seismic station and DAS data reveals distinct physical features of the sequence that are not observable with seismic stations alone, including details of mainshock-aftershock clustering and well-resolved source spectra at frequencies of up to ~50 Hz for M < 3 events. The signal-to-noise-ratio > 3 at frequencies of up to 50 Hz observed on DAS waveforms for a representative group of events suggests consistency with typical earthquake stress-drop values that range from 1-10 MPa. It further suggests that DAS data may be used to augment detailed studies of microearthquake source parameters.

We apply semblance-based detection to DAS waveforms and manually inspect 5,734 earthquakes that occurred within ~50 km of the fiber to build an initial earthquake catalog. We then combine DAS and seismic-station data to locate 284 events with high signal-to-noise ratios and compute their local magnitudes with seismic station data to create a detailed subset of the initial catalog. We apply waveform cross-correlation to offshore DAS data for events in the detailed catalog to associate unlocated detections with template events and estimate relative magnitudes from amplitude ratios and further enhance the detailed catalog. This approach adds an additional 2,496 earthquakes (2,780 events in total) with assigned locations and magnitudes and leads to an enhanced catalog with completeness magnitude Mc = -0.5. Most earthquakes (2,718 of 2780) cluster within a ~5 km radius approximately 10 km offshore of northwestern Kefalonia and exhibit local rates exceeding 100 events per hour.

Our enhanced catalog provides a detailed spatiotemporal record of seismicity in a region with limited station coverage and demonstrates the effectiveness of integrating DAS with seismic networks for earthquake monitoring of active seismic sequences. Furthermore, it resolves details of mainshock–aftershock clustering that would have otherwise likely have been erroneously classified as swarm-like with standard monitoring, highlighting how observational resolution influences the interpretation of the physics driving earthquake sequences.

How to cite: Harrington, R. M., Bocchini, G. M., Bozzi, E., Roth, M. P., Gaviano, S., Pascucci, G., Grigoli, F., Biondi, E., and Sokos, E.: Using a hybrid seismic and Distributed Acoustic Sensing (DAS) network to study microseismicity in high spatiotemporal resolution offshore of Kefalonia Island, Greece , EGU General Assembly 2026, Vienna, Austria, 3–8 May 2026, EGU26-4254, https://doi.org/10.5194/egusphere-egu26-4254, 2026.

The first commercially available fibre-optic Distributed Acoustic Sensing (DAS) system, Cobolt, was released in 2004, with early uptake driven by applications in perimeter security, pipeline monitoring, and upstream oil and gas operations. Although these deployments demonstrated the disruptive potential of DAS, it is only within the past five years that the geoscience community has widely embraced the technology, exploiting its ability to deliver continuous, high-fidelity measurements with exceptional spatial and temporal resolution.

Historically, commercially available DAS systems were optimised for industrial monitoring rather than scientific metrology. As a result, key requirements of geoscience applications—such as quantitative accuracy, extreme sensitivity, extended range, and robustness in challenging environments—were not primary design drivers. This situation is now changing rapidly as geoscience applications mature and expand. This contribution reviews the principal performance characteristics that define the suitability of modern DAS systems for geoscience research and examines how recent technological developments are addressing these needs.

Five performance parameters are of particular importance. First, the transition from amplitude-based, qualitative DAS to phase-based, quantitative systems has enabled true strain-rate and strain measurements suitable for metrological applications. Second, instrument sensitivity has improved by several orders of magnitude, with contemporary systems achieving pico-strain-level detection along standard telecom fibre. Third, measurement range—ultimately limited by available backscattered photons in pulsed DAS—has been extended beyond 150 km through the adoption of spread-spectrum interrogation techniques. Fourth, spatial resolution continues to improve, with gauge lengths of ≤1 m and sampling intervals of ≤0.5 m now routinely achievable, and further reductions anticipated. Finally, dynamic range remains a critical consideration for high-amplitude signals such as earthquakes; however, reductions in gauge length provide a clear pathway to mitigating cycle-skipping limitations, supporting the future use of DAS in Earthquake Early Warning (EEW) systems.

Alongside raw performance, the ability to quantify and compare DAS system capabilities has become increasingly important. Industry-led efforts have resulted in well-defined test methodologies and performance metrics, providing a common framework for objective evaluation of DAS instruments used in scientific studies.

Practical deployment considerations are also shaping system design. Reduced size, weight, and power (SWaP) enable operation in remote and hostile environments, while improved reliability, passive cooling, and environmental sealing facilitate long-term field installations. These advances are particularly relevant to emerging marine and subsea applications, where low-power, marinised DAS systems are required for seabed deployment.

Finally, the growing complexity of DAS instrumentation places increasing emphasis on software. Automated configuration, intuitive user interfaces, and integrated edge-processing capabilities are becoming essential to ensure that non-specialist users can reliably extract high-quality scientific data.

Together, these developments signal a transition in DAS from an industrial monitoring tool to a mature geoscience instrument, with continued innovation expected to further expand its role across solid-Earth, cryospheric, and marine research over the coming decade.

How to cite: Hill, D.: DAS design features critical to geoscience applications, EGU General Assembly 2026, Vienna, Austria, 3–8 May 2026, EGU26-4295, https://doi.org/10.5194/egusphere-egu26-4295, 2026.

EGU26-4413 | ECS | Posters on site | SM3.4

Coherent Source Subsampling of Seismic Noise for Distributed Acoustic Sensing in the Swiss Alps 

Sanket Bajad, Daniel Bowden, Pawan Bharadwaj, Elliot James Fern, Andreas Fichtner, and Pascal Edme

Distributed Acoustic Sensing (DAS) provides dense measurements of seismic noise along fiber-optic cables and offers new opportunities for subsurface characterization. In environments where controlled sources are unavailable, conventional noise interferometry workflows for DAS construct virtual shot gathers via cross-correlation and average them over long time windows to obtain coherent surface waves for dispersion analysis and subsequent shear-wave velocity (Vs) inversion. In noise-based interferometric imaging, the distribution of noise sources controls the quality of the retrieved interstation response. In practice, seismic sources are highly anisotropic and intermittent, and so simply averaging all available time windows produces interferometric responses that are difficult to interpret and lead to unstable dispersion curves and biased Vs estimates. We present a data-driven coherent source subsampling (CSS) framework that automatically identifies and selects the time windows of seismic noise that contribute constructively to the physically interpretable interstation response.

We demonstrate the method using DAS data acquired along 30 km of pre-existing telecommunication fiber deployed by the Swiss Federal Railways (SBB) in a major alpine valley floor, recorded with a Sintela interrogator at 3 m channel spacing with 6 m gauge length. Our objective is to recover stable Rayleigh-wave dispersion curves and a shallow Vs structure in the upper 50 m. The fiber runs along the railway track in surface cable ducts, providing a realistic test bed with complex ambient noise, including car traffic, factories, quarry blasts, in addition to the train-generated signals. Subsampling strategies based on prior knowledge of the sources, such as train schedules or velocity-based filtering, can partly mitigate this problem. However, these strategies are tedious, strongly location-dependent along the fiber, and do not guarantee that the retained windows contribute coherently to the interstation response of the segment under investigation.

Here, we use a symmetric variational autoencoder (SymVAE) to perform coherent source subsampling. Trained on virtual shot gathers from multiple time windows, the SymVAE groups windows according to the similarity of their correlation wavefields and enables the selection of those windows that consistently exhibit symmetric surface-wave contributions on both the causal and acausal sides. Averaging only these subsampled windows yields interstation responses that are substantially denoised and symmetric. We interpret these cleaner and symmetric cross-correlations as being associated with the stationary-phase contributions for the fiber segment under investigation. The same framework also identifies fiber segments that lack coherent, dispersive Rayleigh waves, indicating where robust subsurface imaging is not feasible.

Applying CSS to the SBB DAS data produces stable Rayleigh-wave dispersion curves along the cable, which we invert for two-dimensional Vs profiles. Although demonstrated here on railway-generated noise, the proposed CSS framework can be extended to any uncontrolled settings, such as road-traffic-dominated areas, where source variability and non-uniformity may be even more severe.

  • 1Centre for Earth Sciences, Indian Institute of Science, Bangalore, India
  • 2Department of Earth and Planetary Sciences, ETH Zurich, 8092 Zurich, Switzerland
  • 3 SBB CFF FFS


How to cite: Bajad, S., Bowden, D., Bharadwaj, P., Fern, E. J., Fichtner, A., and Edme, P.: Coherent Source Subsampling of Seismic Noise for Distributed Acoustic Sensing in the Swiss Alps, EGU General Assembly 2026, Vienna, Austria, 3–8 May 2026, EGU26-4413, https://doi.org/10.5194/egusphere-egu26-4413, 2026.

EGU26-4603 | ECS | Orals | SM3.4

What Controls Variability in DAS Earthquake Observations? Implications for Ground-Motion Models 

Chen-Ray Lin, Sebastian von Specht, and Fabrice Cotton

Distributed Acoustic Sensing (DAS) provides dense, meter-scale ground-motion measurements along fiber-optic cables. However, developing ground-motion models (GMMs) from DAS data is challenging because observations are controlled by DAS-specific factors such as cable coupling, orientation, and channel correlation. In this study, we present the first regional, partially non-ergodic DAS-based GMM that explicitly identifies and quantifies cable-related contributions to ground-motion variability. We analyze strain-rate data from a 400-channel DAS array at the Milun campus in Hualien City, Taiwan, compiling peak strain rates and Fourier amplitudes (0.1–10 Hz) from 77 regional earthquakes (3<M<7, 45<R<170 km). Building on classical seismometer-based GMMs, we extend the variability framework to account for (1) cable coupling influenced by installation and environment types, (2) cable orientation, and (3) channel correlation inherent to DAS measurement principles and array geometry. Channel correlation is modeled using Matérn kernels parameterized by along-fiber and spatial proximity distances. The resulting DAS-based GMM shows magnitude-distance scaling comparable to classical models, while decomposing variability into physically interpretable components. Cable coupling emerges as a dominant broadband source of within-event variability, whereas orientation effects capture repeatable, frequency-dependent earthquake source radiation patterns. Modeling channel correlation significantly reduces channel-related standard deviations, demonstrating that treating DAS channels as independent observations biases uncertainty estimates. Overall, our results show that DAS-derived ground motions require a fundamentally different variability framework than that of classical GMMs, highlighting the importance of deployment metadata and correlation modeling. This approach provides a statistical and physical foundation for next-generation seismic hazard assessments using dense fiber-optic sensing.

How to cite: Lin, C.-R., von Specht, S., and Cotton, F.: What Controls Variability in DAS Earthquake Observations? Implications for Ground-Motion Models, EGU General Assembly 2026, Vienna, Austria, 3–8 May 2026, EGU26-4603, https://doi.org/10.5194/egusphere-egu26-4603, 2026.

Monitoring fin whale (Balaenoptera physalus) vocalizations is of significant scientific importance and practical value for marine ecology, hydroacoustics, and geophysics. Conventional monitoring approaches, such as hydrophone arrays, ocean-bottom seismometers (OBS), and satellite tagging, are limited by sparse spatial coverage, potential biological disturbance, and high costs. Distributed acoustic sensing (DAS) is an emerging technology that utilizes submarine optical cables as dense acoustic arrays, providing opportunities for large-scale, high-resolution monitoring of whale vocalizations. Here, we reveal the wavefield features of fin whale vocalizations by integrating DAS observational data combined with numerical simulations. Three distinct features—Insensitive response segment (IRS), high-frequency component loss, and acoustic notch—were identified in the observed wavefield. DAS response analysis via ray-acoustic modeling indicates that the length of the IRS is positively correlated with the vertical source-to-cable distance, while the gauge length is responsible for the high-frequency loss in Type-B calls. Furthermore, wavefield simulations using the spectral-element method (SEM) demonstrate that the acoustic notches represent transitions between transmission zones of waterborne multipath waves entering the seafloor, exhibiting high sensitivity to the seafloor P-wave velocity, water depth, and topography. These findings not only enhance our understanding of the DAS-observed wavefields, but also highlight the potential of utilizing DAS and acoustic notches for ocean environmental parameter estimation.

How to cite: Wang, Q.: Revealing the Wavefield Features of Fin Whale Vocalizations Observed by Distributed Acoustic Sensing, EGU General Assembly 2026, Vienna, Austria, 3–8 May 2026, EGU26-4625, https://doi.org/10.5194/egusphere-egu26-4625, 2026.

This study aims to develop a system for the identification of vessels, seismic events, and volcanic activity through analysis of the spatiotemporal characteristics of wavefields recorded by distributed acoustic sensing (DAS) using a submarine fiber-optic cable. DAS provides unprecedented spatial coverage and resolution, making it highly suitable for monitoring dense wavefield variations and anthropogenic activities, whereas traditional seismometers remain indispensable for quantitative seismic analysis and low-frequency observations. In this study, continuous DAS records acquired from a submarine fiber-optic cable located in the northeastern offshore region of Taiwan near Guishan Island, an active volcano. This region experiences frequent seismic activity due to the northwestward subduction of the Philippine Sea Plate beneath the Eurasian Plate. In addition, the passage of the Kuroshio Current, a warm ocean current, brings abundant fish resources, resulting in frequent activities of fishing vessels and whale-watching boats. Event detection is first carried out using the recursive short-time-average/long-time-average (STA/LTA) method which uses two time windows with different durations and computes the average signal amplitude within each window. When a signal arrives, the average amplitude within a short time window changes rapidly, thereby increasing the ratio of the short-time average to the long-time average. An event is detected when this ratio exceeds a predefined threshold and manual secondary inspected. However, low signal-to-noise ratios (SNR) can significantly reduce the sensitivity of STA/LTA-based detection, leading to missed events. To overcome this problem, signal processing adjustments were applied to enhance detection performance. To validate the detection performance, the detected ship-related events were compared with records from the Automatic Identification System (AIS), while earthquake events identified from the DAS data were compared with the earthquake catalog of Taiwan Seismological and Geophysical Data Management System (GDMS). Subsequently, a regression analysis of catalog magnitudes against hypocentral distance and maximum DAS-recorded amplitude was applied to determine the minimum detectable earthquake magnitude. The proposed framework demonstrates the potential of DAS as a complementary tool for offshore geophysical and maritime monitoring, providing a basis for future studies on vessel tracking, seafloor topography, and earthquake monitoring.

How to cite: Wei, Y. J. and Chan, C. H.: Application of Distributed Acoustic Sensing to Detect and Identify of Vessels and Natural Events in the Northeastern Offshore Region of Taiwan, EGU General Assembly 2026, Vienna, Austria, 3–8 May 2026, EGU26-4712, https://doi.org/10.5194/egusphere-egu26-4712, 2026.

EGU26-5156 * | Orals | SM3.4 | Highlight

Englacial ice quake cascades in the Northeast Greenland Ice Stream - Observations and implications of ice stream dynamics 

Andreas Fichtner, Coen Hofstede, Brian Kennett, Anders Svensson, Julien Westhoff, Fabian Walter, Jean-Paul Ampuero, Eliza Cook, Dimitri Zigone, Daniela Jansen, and Olaf Eisen

Ice streams are major contributors to ice sheet mass loss and critical regulators of sea level change. Despite their important, standard viscous flow simulations of ice stream deformation and evolution have limited predictive power, mostly because our understanding of the involved processes is limited. This leads, for instance, to widely varying predictions of sea level rise during the next decades.


Here we report on a Distributed Acoustic Sensing experiment conducted in the borehole of the East Greenland Ice Core Project (EastGRIP) on the Northeast Greenland Ice Stream. For the first time, our observations reveal a brittle deformation mode that is incompatible with viscous flow over length scales similar to the resolution of modern ice sheet models: englacial ice quake cascades that are not being recorded at the surface. A comparison with ice core analyses shows that ice quakes preferentially nucleate near volcanism-related impurities, such as thin layers of tephra or sulfate anomalies. These are likely to promote grain boundary cracking, and appear as a macroscopic form of crystal-scale wild plasticity. A conservative estimate indicates that seismic cascades are likely to produce strain rates that are comparable in amplitude to those measured geodetically, thereby bridging the well-documented gap between current ice sheet models and observations.

How to cite: Fichtner, A., Hofstede, C., Kennett, B., Svensson, A., Westhoff, J., Walter, F., Ampuero, J.-P., Cook, E., Zigone, D., Jansen, D., and Eisen, O.: Englacial ice quake cascades in the Northeast Greenland Ice Stream - Observations and implications of ice stream dynamics, EGU General Assembly 2026, Vienna, Austria, 3–8 May 2026, EGU26-5156, https://doi.org/10.5194/egusphere-egu26-5156, 2026.

We present a back-projection based earthquake location method tailored to Distributed Acoustic Sensing (DAS) arrays, using short overlapping fiber segments and a combined P–S framework to reliably locate local earthquakes. A 66km quasi-linear telecommunication fiber in Israel was repurposed as a DAS array. We analyzed several local earthquakes with varying source–array geometries. We divided the fiber into overlapping 5.4 km segments and back-projected P- and S-wave strain-rate recordings using a local 1D velocity model over a regional grid of potential earthquake locations. Each grid point is assigned with P- and S-phase semblance, and the corresponding phase-specific origin times, associated with the timing of maximum semblance. Segment-specific P- and S-phase semblance maps and the difference between P and S origin times were combined through a weighting scheme that favors segments with spatially compact high-semblance regions. The objective is maximizing both P- and S-wave semblance and minimizing P- and S-wave origin time discrepancies. Results for the analyzed earthquakes reveal robust constraints on both azimuth and epicentral distance from the fiber, and demonstrate the ability to mitigate DAS-related artifacts associated with broadside sensitivity and reduced coherency. We demonstrated the potential of the approach for real-time earthquake location and showed its performance when only P-wave recordings are available, underscoring the method’s potential for future DAS-based earthquake early warning implementation.

How to cite: Noy, G., Ben Zeev, S., and Lior, I.: Earthquake Location using Back Projection with Distributed Acoustic Sensing with Implications for Earthquake Early Warning, EGU General Assembly 2026, Vienna, Austria, 3–8 May 2026, EGU26-5259, https://doi.org/10.5194/egusphere-egu26-5259, 2026.

EGU26-5274 | ECS | Orals | SM3.4

Spectral analysis of background and transient signals at Mount Etna using rectilinear fibre-optic segments 

Hugo Latorre, Sergio Diaz-Meza, Philippe Jousset, Sergi Ventosa, Arantza Ugalde, Gilda Currenti, and Rafael Bartolomé

Etna is the largest, most active and closely monitored volcano in Europe,
making it a crucial study region for volcanology and geohazard assessment. In early
July 2019, a 1.5 km fibre-optic cable was deployed near the summit of Mount Etna
and interrogated for two months. The cable was divided into four main segments, two
of which point towards different active crater areas. Temporary seismic broadband
stations and infrasound sensors were also deployed along the cable. During the
experiment, three distinct eruptive events were recorded. The first two events are
characterised by a large number of explosions in the active crater area, together with
an increase in background tremor activity. The third event is characterised by a larger
increase in background tremor, but almost no explosions.

The continuous recordings are analysed in the frequency-wavenumber domain,
which reveals the features of the background tremor activity and the stacked transient
signals, such as explosions. During the first two eruptive events, the stack of
explosive sources is characterised by a non-dispersive arrival, travelling with
different apparent velocities along each segment, and a non-linear ground response up
to 25 Hz. These segments can be used as an antenna to estimate an average back-
azimuth for the explosions, which come from the same crater area during both
eruptive events.

Outside of the three eruptive events, the background tremor features two slow
dispersion modes, both well resolved on the raw recordings. The slowest mode is
affected by gauge-length attenuation at higher frequencies, due to its short
wavelength, but remains detectable up to 27 Hz, with group velocities as low as 170
m/s. These observations showcase the utility of simple, rectilinear geometries in
deployments despite their known shortcomings, such as in location procedures. For
known source regions, such as volcanoes, a well-oriented segment can leverage
continuous activity to record the incoming wavefield and extract dipersion curves
without the need to perform cross-correlations, simplifying the workflow.

How to cite: Latorre, H., Diaz-Meza, S., Jousset, P., Ventosa, S., Ugalde, A., Currenti, G., and Bartolomé, R.: Spectral analysis of background and transient signals at Mount Etna using rectilinear fibre-optic segments, EGU General Assembly 2026, Vienna, Austria, 3–8 May 2026, EGU26-5274, https://doi.org/10.5194/egusphere-egu26-5274, 2026.

EGU26-5880 | ECS | Posters on site | SM3.4

Enhancing High-frequency Ambient Noise for shallow subsurface imaging using urban ambient noise DAS recordings 

Leila Ehsaninezhad, Christopher Wollin, Verónica Rodríguez Tribaldos, and Charlotte Krawczyk

Distributed Acoustic Sensing (DAS) enables unused fiber optic cables in existing telecommunication networks, known as dark fibers, to function as dense arrays of virtual seismic receivers. Seismic waves generated by human activities and recorded by dense sensor networks provide an abundant, high-frequency energy source for high-resolution, non-invasive imaging of the urban subsurface. This approach enables detailed characterization of near-surface soils, sediments, and shallow geological structures with minimal surface impact, supporting applications such as groundwater management, site response and seismic amplification analysis, seismic hazard assessment, geothermal development, and urban planning. However, extracting coherent seismic signals from complex urban noise is challenging due to uneven source distribution, uncertain fiber deployment conditions, and variable coupling between the fiber and the ground. In particular, high-frequency range signals (e.g., above 4 Hz), needed to resolve shallow subsurface structures, are particularly difficult to recover. Two strategies can be used to address some of these challenges, by discarding poor quality seismic noise segments or by focusing on particularly favorable noise sources. In this study, we adopt the second approach and use vibrations generated by passing vehicles, particularly trains which are energetic sources that contain valuable high frequency information . Capturing and exploiting the seismic waves generated by these vehicles offers unique opportunities for efficient and high resolution urban seismic imaging.

We present an enhanced ambient noise interferometry workflow designed to exploit noise sources that are particularly favorable to the fiber geometry, i.e. transient and strong sources occurring at the edge of the fiber segment to be analyzed. The workflow is applied to traffic-dominated seismic noise recorded on a dark fiber deployed along a major urban road in Berlin, Germany. First, we select short seismic noise segments that contain signals from passing trains and then apply a frequency–wavenumber filter to isolate the targeted train-generated surface waves while suppressing other wavefield contributions. The filtered data is then processed using a standard interferometric approach based on cross-correlations to retrieve coherent seismic phases from ambient noise, producing virtual shot gathers. Finally, Multichannel Analysis of Surface Waves is applied to derive one dimensional velocity models. This workflow targeted on specific transient sources reduces computational cost while enhancing dispersion measurements particularly at higher frequencies. By stacking the responses from tens of tracked vehicles, enhanced virtual shot gathers can be obtained and inverted to improve shallow subsurface models. This can be achieved with only a few hours of seismic noise recording, which is challenging using conventional ambient noise interferometry workflows.

How to cite: Ehsaninezhad, L., Wollin, C., Rodríguez Tribaldos, V., and Krawczyk, C.: Enhancing High-frequency Ambient Noise for shallow subsurface imaging using urban ambient noise DAS recordings, EGU General Assembly 2026, Vienna, Austria, 3–8 May 2026, EGU26-5880, https://doi.org/10.5194/egusphere-egu26-5880, 2026.

EGU26-6600 | ECS | Posters on site | SM3.4

Multi-fiber Distributed Acoustic Sensing for Urban Seismology in Athens, Greece 

Mohammed Almarzoug, Daniel Bowden, Nikolaos Melis, Pascal Edme, Adonis Bogris, Krystyna Smolinski, Angela Rigaux, Isha Lohan, Christos Simos, Iraklis Simos, Stavros Deligiannidis, and Andreas Fichtner

Distributed Acoustic Sensing (DAS) offers a promising approach for dense seismic recording in urban environments by repurposing existing telecommunication infrastructure. Athens presents an ideal setting for such an approach, as Greece is one of the most seismically active countries in Europe, and the Athens metropolitan area — home to nearly four million inhabitants — lies within a geologically complex basin whose vulnerability was demonstrated by the destructive 1999 Mw 5.9 Parnitha earthquake. Seismic hazard assessment requires accurate subsurface velocity models, but acquiring the data to build them in dense urban areas remains challenging.

We present results from a multi-fiber DAS experiment conducted in Athens, Greece, from 16 May to 30 June 2025, using four telecommunication fibers provided by the Hellenic Telecommunications Organisation (OTE). Two Sintela ONYX interrogators simultaneously interrogated the four fibers, which fan out from an OTE building with lengths of approximately 24, 38, 42, and 48 km, providing extensive azimuthal coverage of Athens. This makes the study one of the largest urban DAS campaigns ever performed.

Data were acquired in two configurations, a lower spatial resolution mode optimised for earthquake recording (~26 days) and a higher resolution mode for ambient noise interferometry (~19 days). To detect seismic events, we applied bandpass filtering followed by phase-weighted stacking across channels to enhance coherent arrivals. An STA/LTA (short-time average/long-time average) trigger was then used to identify candidate events. During the acquisition period, the National Observatory of Athens (NOA) recorded 2,645 events across the broader seismic network, of which 548 were detected on at least one fiber (368, 343, 328, and 322 on fibers 1–4, respectively). Detection capability depends on distance and magnitude — we achieve near-complete detection within ~20 km, while many events of ML ≥ 2 were recorded at distances exceeding 200 km. The array also captured small local events absent from the NOA catalogue, likely corresponding to local seismicity below the detection threshold of the sparser regional network. Characterising this unobserved local seismicity is one of the objectives of ongoing work.

For events within 50 km of the interrogator site, we pick P- and S-wave arrivals to constrain body-wave travel times. These picks are used to locate events in the NOA catalogue, which enables us to compare with network-derived hypocentres and allows us to assess potential improvement from the dense DAS coverage, before applying the approach to smaller events detected only by DAS. The travel-time data will also serve as input for 3D eikonal traveltime tomography to image subsurface velocity structure beneath metropolitan Athens.

How to cite: Almarzoug, M., Bowden, D., Melis, N., Edme, P., Bogris, A., Smolinski, K., Rigaux, A., Lohan, I., Simos, C., Simos, I., Deligiannidis, S., and Fichtner, A.: Multi-fiber Distributed Acoustic Sensing for Urban Seismology in Athens, Greece, EGU General Assembly 2026, Vienna, Austria, 3–8 May 2026, EGU26-6600, https://doi.org/10.5194/egusphere-egu26-6600, 2026.

EGU26-6949 | ECS | Posters on site | SM3.4

SAFE - Tsunami early warning system using available seafloor fiber cables with Chirped-pulse DAS 

Javier Preciado-Garbayo, Jaime A. Ramirez, Alejandro Godino-Moya, Jorge Canudo, Diego Gella, Jose Maria Garcia, Yuqing Xie, Jean Paul Ampuero, and Miguel Gonzalez-Herraez

Traditional tsunami early warning systems (TEWS) are typically expensive, have limited real-time availability, require continuous maintenance, and involve long deployment times. The SAFE project aims to overcome these limitations by developing a new tsunami warning technology based on Distributed Acoustic Sensing (DAS), leveraging existing seafloor fiber optic cables. This approach offers continuous 24/7 monitoring, near-zero maintenance, faster response times, and ease of installation. The project includes contributions ranging from the development of a novel Chirped-pulse DAS interrogator (HDAS) with improved low-frequency performance to a novel post-processing software to obtain tide height from the measured seafloor strain and automatic detection and confirmation of a tsunami wave. All this has been implemented in a friendly user interface and is undergoing final evaluation by the tsunami warning authority in the NE Atlantic (the Instituto Português do Mar e da Atmosfera, IPMA).  

The validation is currently ongoing using the ALME subsea cable, which connects Almería and Melilla across the Alboran Sea. The interrogator has demonstrated the ability to detect swell waves with a maximum error of 20 cm in the deep sea and a post-processing response time of less than 90 seconds. It is expected that slower tsunami waves will yield more precise estimations of wave height.

Importantly, the technology could also successfully detect the 5.3 Mw earthquake near Cabo de Gata, Spain, on July 14, 2025, at a distance of only 40 km from the epicenter without major saturation. The extremely large dynamic range of the interrogator (approximately 10 times larger than a usual phase system) enables the system to monitor large-magnitude earthquakes without signal clipping. The SAFE system is capable of delivering critical seismic and hydrodynamic data within 5 minutes of an event, supporting early tsunami detection and rapid response.

How to cite: Preciado-Garbayo, J., A. Ramirez, J., Godino-Moya, A., Canudo, J., Gella, D., Garcia, J. M., Xie, Y., Ampuero, J. P., and Gonzalez-Herraez, M.: SAFE - Tsunami early warning system using available seafloor fiber cables with Chirped-pulse DAS, EGU General Assembly 2026, Vienna, Austria, 3–8 May 2026, EGU26-6949, https://doi.org/10.5194/egusphere-egu26-6949, 2026.

EGU26-7247 * | ECS | Orals | SM3.4 | Highlight

Submarine Cable Optical Response to Seismic Waves: Insights from Controlled-Environment Tests 

Max Tamussino, David M. Fairweather, Ali Masoudi, Zitong Feng, Richard Barham, Neil Parkin, David Cornelius, Gilberto Brambilla, Andrew Curtis, and Giuseppe Marra

Fibre-optic sensing technology is transforming seafloor monitoring by enabling dense, continuous measurements across vast distances using existing telecommunication infrastructure. Distributed acoustic sensing (DAS) and optical interferometry [1] have demonstrated remarkable potential for earthquake detection, ocean dynamics monitoring, and hazard early warning. However, for these technologies to be used for these applications, the transfer function between environmental perturbations and measured optical signal changes in submarine cables needs to be known.

We present the, to the best of our knowledge, first controlled-environment characterisation of submarine cable responses to active seismic and acoustic sources, comparing DAS and optical interferometry measurements with ground-truth data from 58 geophones, 20 three-component seismometers, and microphones [2]. Our results reveal three key findings:

  • In contrast with proposed theoretical models [3], our interferometric measurements show first-order sensitivity to broadside seismic sources, enabling localisation of arrivals along straight fibre links.
  • We identify a previously unreported fast-wave phenomenon, attributed to seismic energy coupling into the cable's metal armour and propagating at velocities exceeding 3.5 km/s, significantly altering recorded waveforms.
  • We compared measurements between adjacent fibres within the same cable. Results show significant discrepancies between the measured waveforms, which should be considered in applications operating in a similar frequency range as our tests.

These findings show the complexity of submarine cable mechanics and their impact on optical sensing performance. Understanding these processes is critical for calibrating transfer functions and improving the reliability of fibre-based geophysical observations.  In addition to these findings, we also discuss the limitations of our methodology, which primarily arise from the limited range of seismic source frequencies available. Our work presents a first step towards understanding the complex transfer function of environmental perturbations to optical signals in subsea cables, advancing the vision of large-scale, cost-effective Earth observation systems.

[1] Marra, G. et al. Optical interferometry–based array of seafloor environmental sensors using a transoceanic submarine cable. Science 376 (6595), 874–879 (2022)

[2] Fairweather, D.M., Tamussino, M., Masoudi, A. et al. Characterisation of the optical response to seismic waves of submarine telecommunications cables with distributed and integrated fibre-optic sensing. Sci Rep 14, 31843 (2024)

[3] Fichtner, A., Bogris, A., Nikas, T. et al. Theory of phase transmission fibre-optic deformation sensing. Geophysical Journal International, 231(2), 1031–1039, (2022)


How to cite: Tamussino, M., Fairweather, D. M., Masoudi, A., Feng, Z., Barham, R., Parkin, N., Cornelius, D., Brambilla, G., Curtis, A., and Marra, G.: Submarine Cable Optical Response to Seismic Waves: Insights from Controlled-Environment Tests, EGU General Assembly 2026, Vienna, Austria, 3–8 May 2026, EGU26-7247, https://doi.org/10.5194/egusphere-egu26-7247, 2026.

EGU26-7298 | ECS | Orals | SM3.4

Coastal Ambient Noise and Microseismic Monitoring with Distributed Acoustic Sensing: a Case Study from Norfolk, UK 

Harry Whitelam, Lidong Bie, Jessica Johnson, Andres Payo Garcia, and Jonathan Chambers

Seismic ambient noise is a ubiquitous and constant resource, ideal for non-invasive investigations of the solid earth. Coastlines around the world are handling an increase in coastal erosion due to sea level rise and more energetic storms. Monitoring this is becoming an increasingly necessary task to protect coastal settlements. Using Distributed Acoustic Sensing in seismic monitoring has already shown incredible potential and offers the advantage of dense measurements. Our project seeks to identify the efficacy of Distributed Acoustic Sensing for monitoring subsurface changes which precede cliff failure. We present early findings from the first long-term deployment of a fibre optic cable along the coastline - North Sea, Norfolk, UK. We investigate differences in signal characteristics between conventional seismometers and Distributed Acoustic Sensing in this setting, and interpret the seismic signatures of key sources in the area. This deployment was recording for 22 months, allowing us to monitor both short-term and seasonal changes. We identify the frequency ranges excited by storm events (0.2 - 1 Hz), the dominance of short-period secondary microseismic activity, and the importance of local sea state and weather on influencing higher frequency signals. We also discuss limitations of Distributed Acoustic Sensing and the sources it can not reliably capture when compared to broadband seismometers and nodal geophones. We conclude by discussing how this noise analysis affects the use of ambient noise tomography for seismic velocity monitoring. Future research will test the efficacy of such applications, with the hope of providing better estimates of coastal recession and identifying hazardous areas on a metre-scale.

How to cite: Whitelam, H., Bie, L., Johnson, J., Payo Garcia, A., and Chambers, J.: Coastal Ambient Noise and Microseismic Monitoring with Distributed Acoustic Sensing: a Case Study from Norfolk, UK, EGU General Assembly 2026, Vienna, Austria, 3–8 May 2026, EGU26-7298, https://doi.org/10.5194/egusphere-egu26-7298, 2026.

EGU26-7427 | ECS | Orals | SM3.4

Distributed Fiber-Optic Sensing for Strain and Temperature Monitoring in an Underground Mine to Enable Digital Twin Integration 

Michael Dieter Martin, Nils Nöther, Erik Farys, Massimo Facchini, and Jens-André Paffenholz

The aim of this study is to assess the potential of distributed fiber-optic sensors for measuring strain and temperature in order to monitor the structural integrity of underground mining drifts and chambers. The work is conducted within the framework of the project “Model coupling in the context of a virtual underground laboratory and its development process” (MOVIE). The overall MOVIE project aim is intended to support the creation of a digital twin, thereby improving safety and operational efficiency through enhanced digital planning across various mining environments. Time-dependent, spatially distributed temperature and rock deformation data will be recorded along fiber-optic sensing cables. These measurements will serve as boundary conditions for integrated geometrical and geomechanical models of the drift and chambers. In the initial phase, a 60-meter-long drift is instrumented using fiber-optic Brillouin-based Distributed Temperature and Strain Sensing (DTSS). Based on laboratory tests and considering the specific environmental conditions of the subsurface mine, i.e., ambient temperature variations, surface roughness, dust, and humidity, the optimal adhesive bonding materials and technique for direct cable installation on gneiss host rock was identified and successfully implemented. Following the initial monitoring setup, further experimental investigations are planned, including the monitoring of induced deformations in yielding arch support, rock bolts and the rock in contact with a hydraulic prop. The drift geometry and the spatial location of the fiber-optic cables within the drift are given by a 3D point cloud. Therefore, a 3D point cloud was captured after the fiber-optic cable installation using a high-end mobile mapping SLAM platform geo-referenced in a project-based coordinate frame. The locations of the geo-referenced fiber-optic cables will be correlated with the acquired DTSS measurements along the fiber-optic sensing cables. Ultimately, the meshed 3D point cloud will serve as foundational input for the combined geometrical and geomechanical model, forming the basis for a virtual reality-compatible digital twin enriched with real-time sensor data.

How to cite: Martin, M. D., Nöther, N., Farys, E., Facchini, M., and Paffenholz, J.-A.: Distributed Fiber-Optic Sensing for Strain and Temperature Monitoring in an Underground Mine to Enable Digital Twin Integration, EGU General Assembly 2026, Vienna, Austria, 3–8 May 2026, EGU26-7427, https://doi.org/10.5194/egusphere-egu26-7427, 2026.

EGU26-7462 | Orals | SM3.4

Marine Distributed Acoustic Sensing (DAS) for Detection of Submarine CO₂ Bubble Emissions: Insights from a Shallow-Water Volcanic Setting at Panarea (Italy) 

Cinzia Bellezza, Fabio Meneghini, Andrea Travan, Luca Baradello, Michele Deponte, and Andrea Schleifer

Fibre-optic sensing technologies are rapidly transforming geophysical monitoring by enabling spatially dense, temporally continuous observations of seismic and acoustic wavefields in environments that are difficult to instrument with conventional sensors. In marine settings, Distributed Acoustic Sensing (DAS) applied to seabed fibre-optic cables offers new opportunities for low-impact monitoring of fluid and gas migration processes, which are fundamental both to volcanic–hydrothermal systems and to emerging offshore carbon capture and storage (CCS) applications.

In this study, we investigate the feasibility of marine DAS for detecting natural and artificial CO₂ bubble emissions in a shallow-water volcanic environment offshore Panarea (Aeolian Islands, Italy). Panarea hosts the OGS NatLab Italy, part of ECCSEL-ERIC, thanks to its active submarine degassing associated with a hydrothermal system and therefore represents a natural laboratory and an analogue site for potential subseabed CO₂ leakage scenarios. A 1.1-km-long armored fibre-optic cable was deployed on the seabed and interrogated using two different DAS systems, providing continuous passive acoustic and seismic recordings. To support signal identification and interpretation, the DAS data were complemented by controlled gas releases from scuba tanks, by a High Resolution Seismic (boomer) survey and side-scan sonar imaging, to characterize seabed morphology and shallow subsurface structures along the cable route.

The DAS recordings revealed acoustic signatures associated with both natural CO₂ bubble emissions and controlled artificial releases. Bubble-related signals were detected as localized, temporally variable acoustic responses along the fibre, demonstrating the sensitivity of DAS to gas-driven processes at the seabed. The integration of passive DAS monitoring with active seismic imaging techniques enabled a more robust interpretation of observed signals and seabed processes.

From an Earth sciences perspective, these results demonstrate that marine DAS can serve as a low-impact, spatially continuous monitoring tool for submarine volcanic and hydrothermal systems, complementing traditional geochemical sampling and visual observations and offering new insights into the temporal variability of degassing activity. Beyond natural systems, the demonstrated capability of DAS to detect bubble-related acoustic signals has direct implications for offshore CCS, where early detection of CO₂ leakage is critical for storage integrity and environmental safety.

Overall, this field-scale experiment highlights the potential of fibre-optic sensing to address key challenges in marine monitoring, and underscores the value of integrated approaches for studying fluid and gas migration processes.

Acknowledgements:

  • ECCSELLENT project (“Development of ECCSEL - R.I. ItaLian facilities: usEr access, services and loNg-Term sustainability”)
  • ITINERIS - Italian Integrated Environmental Research Infrastructures System - Next Generation EU Mission 4, Component 2 - CUP B53C22002150006 - Project IR0000032
  • Panarea NatLab Italy: https://eccsel.eu/catalogue/facility/?id=124
  • ECCSEL: https://eccsel.eu/


References:

  • Detection of CO2 emissions from Panarea seabed with Distributed Acoustic Sensing (DAS): a preliminary investigation. Meneghini et al. OGS report (2025).
  • Marine Fiber-Optic Distributed Acoustic Sensing (DAS) for Monitoring Natural CO₂ Emissions: A Case Study from Panarea (Aeolian Islands, Italy). Bellezza et al. Upon submission to Applied Sciences (2026).

How to cite: Bellezza, C., Meneghini, F., Travan, A., Baradello, L., Deponte, M., and Schleifer, A.: Marine Distributed Acoustic Sensing (DAS) for Detection of Submarine CO₂ Bubble Emissions: Insights from a Shallow-Water Volcanic Setting at Panarea (Italy), EGU General Assembly 2026, Vienna, Austria, 3–8 May 2026, EGU26-7462, https://doi.org/10.5194/egusphere-egu26-7462, 2026.

EGU26-7987 | ECS | Orals | SM3.4

Urban-Scale Seismic Imaging Using Ambient Noise and Dark Fiber Distributed Acoustic Sensing in Istanbul 

Laura Pinzon-Rincon, Verónica Rodríguez Tribaldos, Jordi Jordi Gómez Jodar, Patricia Martínez-Garzón, Laura Hillmann, Recai Feyiz Kartal, Tuğbay Kılıç, Marco Bohnhoff, and Charlotte Krawczyk

Urban areas are highly vulnerable to the impacts of geohazards due to their dense populations and complex infrastructure, with potentially severe consequences for human life and economic stability. Improving our knowledge of near-surface and shallow subsurface structures in urban environments is therefore essential for effective seismic hazard assessment and risk mitigation. However, conventional geophysical surveys in cities are often limited by logistical constraints, including strong anthropogenic activity, restricted access, legal limitations, and risks associated with instrument deployment. In this context, repurposing existing telecommunication optical fibers (so-called dark fibers) as dense seismic sensing arrays using Distributed Acoustic Sensing (DAS) offers a powerful alternative for urban subsurface investigations. This approach enables continuous, high-resolution seismic monitoring without the need for extensive field instrumentation.

The megacity of Istanbul (Turkey) is located in one of the most tectonically active regions worldwide and is exposed to significant seismic hazard. Since May 2024, we have been continuously recording passive seismic data using Distributed Acoustic Sensing (DAS) along an amphibious fiber-optic cable, is deployed in the urban district of Kartal (eastern region of Istanbul) and immediately offshore. In this study, we focus on the 3 km-long urban segments of the fiber. We analyze ambient seismic noise generated by various anthropogenic sources, such as train and vehicle traffic and other urban activities, and evaluate their suitability for high-frequency, DAS-based passive seismic interferometry in a complex and heterogeneous urban setting.

We develop and adapt processing strategies for ambient-noise interferometry that address the challenges of dense urban environments and DAS array geometries, including the identification of suitable fiber sections, channels, and source-receiver configurations, as well as preprocessing schemes designed for strongly anthropogenic noise.The objective is to retrieve high-resolution, urban-scale subsurface velocity models that improve our understanding of shallow structures and material properties relevant to seismic hazard. Ultimately, this work aims to establish efficient methodologies for imaging the urban subsurface using existing infrastructure, contributing to improved geohazard assessment and supporting sustainable urban development in seismically active regions.

How to cite: Pinzon-Rincon, L., Rodríguez Tribaldos, V., Jordi Gómez Jodar, J., Martínez-Garzón, P., Hillmann, L., Feyiz Kartal, R., Kılıç, T., Bohnhoff, M., and Krawczyk, C.: Urban-Scale Seismic Imaging Using Ambient Noise and Dark Fiber Distributed Acoustic Sensing in Istanbul, EGU General Assembly 2026, Vienna, Austria, 3–8 May 2026, EGU26-7987, https://doi.org/10.5194/egusphere-egu26-7987, 2026.

Applied to existing but underutilized fiber-optic networks (dark fibers), Distributed Acoustic Sensing (DAS) offers an attractive approach for large-scale seismic monitoring with minimal deployment effort. However, the approach introduces specific challenges, as existing infrastructures were not designed for this purpose, leading to constraints related to sensor coupling, heterogeneous installation conditions, and limited characterization of the measurement points. In the frame of the RUBADO project, we investigate the potential and limitations of DAS applied to dark fibers to provide seismic observations supporting both operational monitoring and characterization of deep geothermal reservoirs. The approach is implemented at multiple spatial scales within the Upper Rhine Graben, where several geothermal plants are currently operating, under development, or in the planning phase. In this context, research activities within the project specifically target key practical challenges related to the use of DAS on dark-fibers for the seismic monitoring of geothermal reservoirs.

Currently, data are recorded along a ~20 km fiber-optic line using the KIT infrastructure, which will support the monitoring of the drilling of a 1.4 km-deep geothermal well at KIT Campus North. We present early results from local and regional seismic monitoring and associated methodological approaches for signal enhancement and seismic event detection. We also introduce a framework for subsurface characterization that leverages the frequent vehicle-generated signals observed in the DAS recordings. We then outline planned measurements at the scale of the Upper Rhine Graben, where a key feature is the simultaneous use of multiple dark-fiber lines. Given the geometry of the planned dark-fiber network, DAS observations will enable the simultaneous monitoring of several geothermal sites with favorable spatial coverage.

How to cite: Azzola, J. and Gaucher, E.: Seismic monitoring of geothermal reservoirs using Distributed Acoustic Sensing on dark fibers: the RUBADO project, EGU General Assembly 2026, Vienna, Austria, 3–8 May 2026, EGU26-8212, https://doi.org/10.5194/egusphere-egu26-8212, 2026.

EGU26-8268 | ECS | Posters on site | SM3.4

Seismic monitoring of alpine lake ice with distributed acoustic sensing (DAS) and nodal arrays 

Ariana David, Cédric Schmelzbach, Thomas Hudson, John Clinton, Elisabetta Nanni, Pascal Edme, and Frederik Massin

Lake ice stability is critical for safe operations on mid- to high-altitude Alpine lakes, such as touristic activities. Existing lake-ice monitoring approaches like ground-penetrating radar and drilling are limited in their ability to resolve spatial variability and to enable continuous monitoring and require direct access to the ice for in situ measurements. Seismological methods offer a complementary approach by recording the wave field generated by lake-ice flexure and fracturing. Here, we assess Distributed Acoustic Sensing (DAS) as a long-term seismic monitoring tool for Alpine lakes.

During Winter 2025, we deployed two complementary seismic sensing systems on frozen Lake Sankt Moritz in the Swiss Alps: a fibre-optic network for DAS measurements and an array of over 40 three-component conventional autonomous seismic nodes to benchmark performance. We installed more than 2 km of fibre-optic cable and connected two interrogators that recorded, over a few weeks, strain and strain-rate data in two cores within the same cable.

To characterise ice properties and icequakes, we implemented workflows for automated icequake detection and location using the waveform-coherency based QuakeMigrate framework, which does not require phase picking, alongside an approach based on semi-automatic phase identification and picking. We successfully detected and located events with both types of instrument networks. Using a baseline catalogue from the three-component node data, we evaluated the DAS performance and achieved location agreement within a few metres between different sensing systems, demonstrating that DAS can robustly capture and localise icequake activity on lake ice and is a promising tool for continuous ice-stability monitoring.

How to cite: David, A., Schmelzbach, C., Hudson, T., Clinton, J., Nanni, E., Edme, P., and Massin, F.: Seismic monitoring of alpine lake ice with distributed acoustic sensing (DAS) and nodal arrays, EGU General Assembly 2026, Vienna, Austria, 3–8 May 2026, EGU26-8268, https://doi.org/10.5194/egusphere-egu26-8268, 2026.

EGU26-8383 | ECS | Orals | SM3.4

Distributed acoustic sensing of very long period strain signals from strombolian explosions 

Francesco Biagioli, Eléonore Stutzmann, Pascal Bernard, Jean-Philippe Métaxian, Valérie Cayol, Giorgio Lacanna, Dario Delle Donne, Yann Capdeville, and Maurizio Ripepe

Very long period (VLP; 0.01-0.2 Hz) seismicity is observed at many volcanoes worldwide, and provides key insights into magma and fluid dynamics within volcanic structures. VLPs are typically recorded by sparse networks of seismometers, which limits the ability to resolve the resulting displacement (or deformation) at fine spatial scales. Distributed acoustic sensing (DAS) may help overcome this limitation by densely sampling the projection of the strain tensor along fibre-optic cables with high spatial and temporal resolution, enabling a more complete view of VLP-induced deformation. Here, we analyse VLP strain signals recorded by DAS at Stromboli volcano (Italy) in November 2022 along a 6-km dedicated fibre-optic cable. We designed the cable geometry to provide broad coverage of the craters and to sample the strain at multiple locations and along different directions. We focus on a dataset of approximately 200 VLP events recorded between November 13 and 14, 2022. The VLP strain signals correlate with explosive activity and show consistent features across multiple events, indicating a persistent, non-destructive source. Leveraging the distributed nature of DAS measurements, we recover the principal strain axes of VLPs and estimate both the location and the volumetric change of the source using a quasi-static deformation model. We retrieve the principal horizontal strains for each VLP by inverting strain amplitudes measured along three different fibre directions and at multiple locations along the cable, allowing us to resolve their spatial distribution. The resulting principal VLP strains exhibit radial and tangential orientations with respect to the craters, consistent with observed seismic particle motions and an axisymmetric source. We then model the VLP strain along the fibre using a point-like deformation source (Mogi). The optimal agreement between modeled and observed VLP strain averaged over the 200 events is for a point source located ~500 m beneath the active craters, with an estimated volumetric change of ~30 m³. Under the assumption of a spherical source with a radius of 87 m, the inferred volumetric change corresponds to a pressure change of ~19 kPa. These results are consistent with previous studies and highlight the capability of DAS to investigate volcano deformation at long periods.

How to cite: Biagioli, F., Stutzmann, E., Bernard, P., Métaxian, J.-P., Cayol, V., Lacanna, G., Delle Donne, D., Capdeville, Y., and Ripepe, M.: Distributed acoustic sensing of very long period strain signals from strombolian explosions, EGU General Assembly 2026, Vienna, Austria, 3–8 May 2026, EGU26-8383, https://doi.org/10.5194/egusphere-egu26-8383, 2026.

EGU26-8769 | ECS | Posters on site | SM3.4

Analyzing volcanic-like earthquakes with distributed acoustic sensing using a short segment of the Tongan seafloor telecommunications cable 

Shunsuke Nakao, Mie Ichihara, Masaru Nakano, Taaniela Kula, Rennie Vaiomounga, and Masanao Shinohara

The January 2022 eruption of the Hunga Tonga-Hunga Ha'apai (HTHH) volcano highlighted the critical challenges in monitoring remote submarine volcanic activity. Distributed Acoustic Sensing (DAS) utilizing existing seafloor telecommunications cables offers a promising solution to bridge this observational gap. We analyzed a one-week DAS dataset recorded in February 2023, approximately one year after the eruption, using a segment of a domestic telecommunication cable in Tonga.

While a previous analysis of this dataset focused on relatively large events with clear phases, our objective was to comprehensively detect small and unclear seismic signals to evaluate the post-eruption activity. We developed a new "duration-based" detection method that identifies temporally sustained energy increases in the array's median power, effectively suppressing spatially incoherent noise. This method successfully detected 770 discrete events, revealing a stable seismicity rate of approximately 110 events per day, significantly more than those detected by conventional triggering algorithms.

To distinguish the origin of these events, we estimated the apparent slowness of the signals using a robust method combining 2D Normalized Cross-Correlation and linear fitting (RANSAC). The results showed that most events have positive apparent slowness values, corresponding to arrivals from the direction of the HTHH volcano, rather than the negative apparent slowness corresponding to tectonic earthquakes from the Tongan Trench. These findings indicate that the HTHH volcano or its surrounding magmatic system maintained a high level of seismic activity even one year after the large 2022 eruption. This study demonstrates the capability of DAS to monitor subtle volcanic seismicity in submarine environments where traditional sensors are absent.

How to cite: Nakao, S., Ichihara, M., Nakano, M., Kula, T., Vaiomounga, R., and Shinohara, M.: Analyzing volcanic-like earthquakes with distributed acoustic sensing using a short segment of the Tongan seafloor telecommunications cable, EGU General Assembly 2026, Vienna, Austria, 3–8 May 2026, EGU26-8769, https://doi.org/10.5194/egusphere-egu26-8769, 2026.

EGU26-9174 | ECS | Posters on site | SM3.4

Clustering of Large Distributed Acoustic Sensing Datasets 

Oliver Bölt, Conny Hammer, and Céline Hadziioannou

Distributed Acoustic Sensing (DAS) turns optical fibers into high resolution strain sensors by monitoring the scattering of light within the fiber. With channel distances in the order of a few meters and a typical sampling frequency of 1 kHz, DAS is capable of recording a wide range of natural and anthropogenic seismic signals. Furthermore, the optical fibers used for DAS can be several kilometers long and are suitable for long-term measurements over weeks, months or years. The datasets obtained by DAS can therefore be very large, with up to several terabytes of data per day. Due to this large amount of data, it is challenging to get a good overview of the different types of seismic signals contained in the data, since a manual inspection can become immensely time-consuming.

In this study we aim to automatize this process by clustering the data to detect and classify different types of seismic signals.  A two-dimensional windowed Fourier transform is used to automatically extract features from the data. In contrast to many other approaches, this allows to not only use temporal information, but to also include the spatial dimension to further distinguish between different seismic sources and wave types.

The clustering is performed in two steps. First, a Gaussian Mixture Model (GMM) is used to cluster the feature set. Then, the final clusters are obtained by merging similar components of the GMM.

A key advantage of this method is that each final cluster represents a specific frequency distribution and can therefore be turned into a filter. While many clustering approaches only assign a list of labels or cluster memberships to the data, our method provides the ability to directly extract the characteristic seismic signals for each cluster. This helps greatly with cluster interpretation and can also be useful for further applications like event detection or denoising.

The proposed procedure is applied to different large DAS datasets, yielding a variety of different clusters. By filtering the data for each cluster and interpreting the obtained waveforms, as well as the long-term spatiotemporal amplitude patterns, different sources like traffic or machinery can be identified.

How to cite: Bölt, O., Hammer, C., and Hadziioannou, C.: Clustering of Large Distributed Acoustic Sensing Datasets, EGU General Assembly 2026, Vienna, Austria, 3–8 May 2026, EGU26-9174, https://doi.org/10.5194/egusphere-egu26-9174, 2026.

EGU26-10581 | ECS | Posters on site | SM3.4

Urban Seismology of a Popular Road Race Using Distributed Acoustic Sensing 

Jorge Canudo, Diego Gella, Pascual Sevillano, and Javier Preciado-Garbayo

Distributed Acoustic Sensing (DAS) has emerged as a powerful tool for monitoring human-induced seismic signals in urban environments, enabling dense, meter-scale observations of dynamic sources. Building on previous studies demonstrating the capability of DAS to image large public events, such as parades and other mass-participation activities, we present a novel experiment in which two different DAS technologies (ΦOTDR and Chirped-Pulse ΦOTDR) were simultaneously deployed to record a popular pedestrian road race held in the surroundings of the University of Zaragoza (Spain).

The experiment took advantage of an already deployed optical-fiber installation with a total effective length of approximately 2 km. The fiber layout captured three distinct geometrical configurations with respect to the race course: (1) a straight section coincident with the runners’ trajectory over the last 300 m of the first kilometer (outbound leg), (2) the same straight section during the return at kilometer 4 (inbound leg), and (3) a perpendicular crossing of the fiber with the race course at the finish line. This geometry provides a unique opportunity to analyze runner-induced ground vibrations under varying crowd densities, running speeds, and fiber–source orientations.

Waterfall representations of the strain-rate data reveal clear, coherent signatures associated with individual runners and runner groups in both DAS systems. Along the straight section, the outbound leg exhibits a compact, high-amplitude wavefield characterized by closely spaced, overlapping runner traces, consistent with the tightly packed peloton early in the race. In contrast, the inbound leg shows a markedly more dispersed pattern, reflecting the progressive spreading of participants according to performance and fatigue. These differences are consistently observed in both phase-based and chirped-pulse DAS data, although with distinct signal-to-noise characteristics across different frequency bands.

At the finish line, where the fiber crosses the race course perpendicularly, the DAS records provide exceptional temporal resolution of runner arrivals. The first five finishers are individually and unambiguously identified, with isolated signatures that can be robustly matched to official arrival times. This demonstrates the potential of DAS not only for bulk crowd characterization but also for resolving individual human-induced seismic sources in real-world conditions.

Our results highlight the complementarity of DAS technologies for urban seismology applications. The experiment underscores the sensitivity of DAS to subtle variations in crowd dynamics and source geometry and illustrates its potential for non-intrusive monitoring of mass-participation events, pedestrian flows, and urban activity. These observations contribute to the growing field of anthropogenic seismology and reinforce the role of optical fiber sensing as a scalable tool for high-resolution monitoring of human activity in cities.

How to cite: Canudo, J., Gella, D., Sevillano, P., and Preciado-Garbayo, J.: Urban Seismology of a Popular Road Race Using Distributed Acoustic Sensing, EGU General Assembly 2026, Vienna, Austria, 3–8 May 2026, EGU26-10581, https://doi.org/10.5194/egusphere-egu26-10581, 2026.

EGU26-10676 | Orals | SM3.4

Storm Amy observations with fibre-optic DAS data at the Svelvik CO₂ Field Lab, Norway: Implications for Monitoring and Networks  

Claudia Pavez Orrego, Marcin Duda, Dias Urozayev, Bastien Dupuy, and Nicolas Barbosa

Distributed Acoustic Sensing (DAS) has become a powerful technique for high-resolution, continuous monitoring of near- and subsurface earth phenomena, with increasing applications in geohazards, seismology, and industry applications such as CO₂ storage monitoring. However, the sensitivity of DAS measurements to atmospheric forcing, particularly during extreme weather events, remains poorly understood. In this study, we investigate the response of a permanent, 1.2 km long straight fibre-optic array installed at the Svelvik CO₂ Field Laboratory (Norway), to intense wind conditions associated with the Amy Storm, which hit Norway from October 3-6, 2025. 


As part of efforts to understand passive methods to monitor CO2 migration in the subsurface, an Alcatel Submarine Networks (ASN) DAS system continuously recorded strain-rate data along a buried fibre that includes both near surface-installed sections and borehole down- and up-going segments reaching depths of approximately 100 m. The near-surface sections were installed inside protective pipes and were therefore not directly coupled to the surrounding ground. To characterise wind-induced seismic signatures, we analyse downsampled recordings using band-limited root-mean-square (RMS) amplitudes and spectral methods across three frequency ranges (0.1–1 Hz, 1–3 Hz, and 3–10 Hz) and time averages over 1 hr intervals. Time–frequency characteristics are examined using group-averaged spectrograms, and a Spectral Energy Index (SEI) is derived by integrating power spectral density within each frequency band. These seismic metrics are compared with near located meteorological observations, including mean wind speed, maximum mean wind speed, and maximum wind gusts. 


The results reveal a pronounced increase in DAS energy coincident with the maximum speed gusts of storm Amy, with the strongest responses observed at frequencies below 3 Hz. Correlation and lag analyses show that seismic energy variations are closely associated with periods of enhanced wind activity, particularly wind gusts, indicating a strong coupling between transient atmospheric forcing and ground vibrations. Importantly, the response differs significantly between surface and depth segments of the fibre. Surface-installed channels exhibit broadband amplitude increases correlated with direct wind–ground interaction, while depth channels display coherent low-frequency spectral patterns, suggesting excitation by wind-generated surface waves or distant secondary sources (e.g., waves from neighbouring fjord) rather than direct aerodynamic loading. 


These findings demonstrate that DAS arrays deployed at wells (abandoned or active) are sensitive to extreme meteorological forcing, which can imprint distinct and depth-dependent seismic signatures. Quantifying and distinguishing wind-induced signals is therefore critical for the robust interpretation of DAS data in long-term passive monitoring applications, particularly when subtle subsurface signals related to CO₂ injection, migration, or leakage must be detected in the presence of strong environmental noise. At the same time, this sensitivity highlights an additional benefit of such fibre-optic installations: DAS infrastructure deployed in future abandoned wells in the context of  Oil & Gas industry and their reutilization for CO2 capture and storage, can also provide valuable information for national seismic and environmental monitoring networks, extending their utility beyond site-specific applications. 

How to cite: Pavez Orrego, C., Duda, M., Urozayev, D., Dupuy, B., and Barbosa, N.: Storm Amy observations with fibre-optic DAS data at the Svelvik CO₂ Field Lab, Norway: Implications for Monitoring and Networks , EGU General Assembly 2026, Vienna, Austria, 3–8 May 2026, EGU26-10676, https://doi.org/10.5194/egusphere-egu26-10676, 2026.

EGU26-10839 | ECS | Posters on site | SM3.4

Fibre sensing at regional scales with telecom cables: the IMAGFib project 

Nicolas Luca Celli, Chris Bean, Adonis Bogris, Georgios Aias Karydis, Eoin Kenny, Rosa Vergara, Örn Jónsson, and Marco Ruffini

Fibre sensing technology can provide seismic data at a variety of scales, but, currently, the difficulty in accessing long telecom fibres, together with the novelty of the instruments, their range limitations and massive data output, mostly constrain its applications to fibre <100 km long.

In this study, we showcase the first results from the new project IMAGFib (multiscale seismic IMAGing with optical FlBre telecom cables), acquiring on-/offshore fibre sensing data on commercial telecom fibres in the North Atlantic Ocean, Irish Sea and across Ireland. This project combines utilising Distributed Strain Sensing (DSS, also known as DAS) on >400 km with 10 m spatial sampling with a new, distributed Microwave Frequency Fiber Interferometer (MFFI) capable sensing over 1700 km of submarine cables connecting Ireland to Iceland, albeit with a coarser 50-100 km spatial sampling. We use the acquired data to assess the performance of fibre sensing as a regional-to-continental scale seismic and ocean monitoring, and a future imaging tool, with a focus on low frequencies (<1 Hz).

By forging research collaborations with multiple telecom operators, we are able to perform DSS on multiple cable sections across the region, aiming to cover a continuous linear profile from Wales to the North Atlantic through different experiments (to be completed early 2026), part of which is performed on live, traffic-carrying telecom fibres. Our DSS results show that while having lower signal to noise ratios compared to nearby seismic stations, DSS on noisy telecom fibres can successfully record most Mw>6 teleseismic events worldwide, as well as microseisms originating in the North Atlantic and/or Irish Sea on all sections of the cable.

In order to extend fibre sensing far into the North Atlantic Ocean, we present the newly developed MFFI sensor, which uses optical interferometry in conjunction with high-loss loop backs at line amplifiers, turning each section of the cable between amplifiers (50-100 km) into independent strain sensors. For our experiment on the Ireland-Iceland cable, this yields 17 traces along the fibre. Ongoing recording in late 2025-early 2026 allows us to evaluate its capability to sense seismic signals, marine storms, currents and possibly ocean-bottom temperature variations across seasons.

With a strong focus on long-range and low-frequency sensing and integration with live telecom infrastructure, IMAGFib is centred on the establishment of fibre sensing as a global geo-sensing tool. Our successful results using DSS on live telecom fibres, and developing MFFI technology using affordable off-the-shelf components represent a key step in advancing the efforts to broaden trusted research utilising existing, commercial telecom cables.

How to cite: Celli, N. L., Bean, C., Bogris, A., Karydis, G. A., Kenny, E., Vergara, R., Jónsson, Ö., and Ruffini, M.: Fibre sensing at regional scales with telecom cables: the IMAGFib project, EGU General Assembly 2026, Vienna, Austria, 3–8 May 2026, EGU26-10839, https://doi.org/10.5194/egusphere-egu26-10839, 2026.

EGU26-11265 | ECS | Posters on site | SM3.4

SmartScape: Distributed Strain Sensing on Dublin City Telecom Fibre to Monitor Urban and Subsurface Dynamics for Smart City Applications 

Bruna Chagas de Melo, Christopher J. Bean, and Colm Browning

Rapid urban growth in Dublin is placing increasing pressure on transport systems, construction activity, and environmental management, creating a clear need for high-resolution observations of how the city operates at both surface and subsurface levels. This study presents the initial stage of a new project that explores the feasibility of using existing optical telecommunication infrastructure as a large-scale urban sensing platform through Distributed Strain Sensing (DSS). DSS converts optical fibres into dense seismic arrays by measuring strain-rate perturbations caused by ground vibrations, offering a cost-efficient approach to city-scale monitoring. This can have a potentially transformative impact on smart and sustainable city management, offering new data insights into urban dynamics while leveraging existing city-owned fibre infrastructure.

We report on a first pilot deployment on a dark ~80 km fibre ring crossing the city centre, residential neighbourhoods, surface tram lines, and an underground tunnel. A FEBUS-A1 interrogator was installed at a data centre in Dublin’s north side and operated for 23 days. Several acquisition configurations were tested, with the most stable setup recording ~60 km of fibre at 500 Hz sampling and 20 m gauge length for a continuous 10-day period. Remote access enabled iterative optimisation of acquisition parameters during the experiment.

The analysis presented here is preliminary and focuses on assessing data quality, signal content, and key technical limitations. Initial observations indicate that the DSS array captures clear signatures of moving vehicles with different velocities, rail-related activity, and teleseismic signals, including the October 10th M7.4 Mindanao, Philippines event. Signal quality progressively degrades beyond ~30 km from the interrogator, where noise becomes dominant, highlighting challenges associated with attenuation, coupling, and urban noise in long fibre links.

Ongoing work focuses on developing denoising and source-identification strategies, including cross-correlation approaches and unsupervised machine-learning, alongside accurate georeferencing of fibre channels onto detailed urban maps. These analyses will be integrated with independent datasets such as traffic records from Dublin City Council and existing environmental acoustic noise maps. Rather than delivering operational products, this study is intended to establish a robust baseline on data quality, signal content, and interpretability, defining what information can realistically be extracted from urban DSS deployments in Dublin at this early stage.

How to cite: Chagas de Melo, B., J. Bean, C., and Browning, C.: SmartScape: Distributed Strain Sensing on Dublin City Telecom Fibre to Monitor Urban and Subsurface Dynamics for Smart City Applications, EGU General Assembly 2026, Vienna, Austria, 3–8 May 2026, EGU26-11265, https://doi.org/10.5194/egusphere-egu26-11265, 2026.

EGU26-11391 | Posters on site | SM3.4

Integrating Distributed Acoustic Sensing and borehole seismometer data for seismic velocity measurements and negative magnitude event location: a case study from the TABOO Near Fault Observatory (Northern Apennines, Italy) 

Nicola Piana Agostinetti, Federica Riva, Irene Molinari, Simone Salimbeni, Alberto Villa, Marta Arcangeli, Giulio Poggiali, Raffaello Pegna, Gilberto Saccorotti, Gaetano Festa, and Lauro Chiaraluce

Distributed Acoustic Sensing (DAS) technology makes use of fiber optic cables to sense vibrations, at the Earth’s surface, at unprecedented spatial resolution, less than one meter over distances of kilometres. DAS data have been used for monitoring both the Solid Earth (earthquakes, dyke intrusions and more) and the environment (landslides, snow avalanches, groundwater). Despite its wide application and the numerous, successful case-studies, DAS technology presents two significant limitations: the lower S/N ratio with respect to standard seismometers and the strong "directivity effect" (vibrations must propagate in the axial direction of the fiber optic cable). In this study, we illustrate how the integration of DAS and borehole seismometer data can be used to improve earthquake location and obtain novel information on seismic velocity of the buried rock mass. We analyse the DAS data recorded along a 1km fiber optic cable deployed in a full 3D geometry. The fiber optic cables have been installed in the framework of a surface and borehole very dense seismic array partaining to the Alto Tiberina Near Fault Observatory (TABOO-NFO). The cable geometry covers two horizontal planes, off-set one from the other and at different altitudes, and a vertical borehole  going to 130m depth. The infrastructure has been installed across (from the hangingwal to the footwall) the Gubbio fault, a secondary fault segment antithetic to the main Alto Tiberina master fault bounding at depth a normal fault system. in the Alto Tiberina fault system (Northern Apennines, Italy). The center of the cable array coincides with a shallow borehole (130m deep)  instrumented with two short period seismometers, one at the surface and one at the bottom. The integration of the data from the seismometes and those recorded along such 3D geometry allows for a better recognition and location of very small seismic events occurring on the fault, which are going largely undetected by the local (dense) seismic network. Moreover, data from small size events (Mag > 1) can be used to estimate the P- and S- wave seismic velocity of the geological formation traversed by the borehole (namely, Maiolica fm and Marne a Fucoidi fm), defining precise measurements of such velocities at larger scale-length (10s of meters) with respect to measurements obtained on the same rock in the laboratory.

How to cite: Piana Agostinetti, N., Riva, F., Molinari, I., Salimbeni, S., Villa, A., Arcangeli, M., Poggiali, G., Pegna, R., Saccorotti, G., Festa, G., and Chiaraluce, L.: Integrating Distributed Acoustic Sensing and borehole seismometer data for seismic velocity measurements and negative magnitude event location: a case study from the TABOO Near Fault Observatory (Northern Apennines, Italy), EGU General Assembly 2026, Vienna, Austria, 3–8 May 2026, EGU26-11391, https://doi.org/10.5194/egusphere-egu26-11391, 2026.

EGU26-11798 | ECS | Posters on site | SM3.4

Distributed Acoustic Sensing of debris-flow activity in the Öschibach torrent (Swiss Alps) 

Juan Sebastian Osorno Bolivar, Malgorzata Chmiel, Fabian Walter, Felix Blumenschein, and Kevin Friedli

The slope instability of Spitze Stei supplies large sediment volumes that accumulate at the slope toe and are subsequently remobilized as debris flows and debris floods in the adjacent Öschibach torrent thus threatening the nearby village of Kandersteg, Switzerland. Since early 2020, continuous monitoring and preventive measures have been implemented in the area. While long-term monitoring has documented frequent torrential activity, the dynamic linkage between sediment supply from the rock slope and debris-flow activity in the torrent remains poorly constrained due to the spatial limitations of point sensors.

In summer 2025, we deployed a dense seismic array on the rock slope and interrogated an existing dark optical fiber running along the ~4 km-long Öschibach torrent using Distributed Acoustic Sensing (DAS). The DAS setup enabled spatially continuous strain-rate measurements at meter-scale resolution with a sampling frequency of ~600 Hz. For the three-month acquisition period, our aim is to detect and characterize debris-flow and debris-flood activity using DAS methods, supported by relative water-level time series and data from nearby seismic stations.

A catalog of possible debris flows and debris floods is generated leveraging an established pre-warning water-level increase threshold (set at 0.6 m), using moving average windowing and duration filtering. This discharge inventory was characterized using the DAS array, whose ~850 channels have been geolocalized with tap test, based on strain rate amplitudes visualized in logarithmic waterfall plots. Analysis of Power Spectral Density (PSD) for the corresponding DAS recordings reveals an increase in seismic energy at high frequencies (~20-40 Hz) concentrated on channels closest to the stream. Vertically offset waveform comparison plots demonstrate high coherence between DAS channels and wavefields recorded at the seismic stations, from which the apparent speed of seismic sources can be estimated. We also observe other coherent signals along the fiber, including mass movements from the Spitze Stei rock slope (e.g., rockfalls and granular flows), as well as local and tele-seismic earthquakes.

Our assessment of signal quality and coherence provides a basis for subsequent event detection, source location, and characterization using array-based methods, particularly during the event initiation phase. Our multisensor approach highlights the potential of DAS to provide spatially dense observations of torrential processes in steep Alpine catchments.

How to cite: Osorno Bolivar, J. S., Chmiel, M., Walter, F., Blumenschein, F., and Friedli, K.: Distributed Acoustic Sensing of debris-flow activity in the Öschibach torrent (Swiss Alps), EGU General Assembly 2026, Vienna, Austria, 3–8 May 2026, EGU26-11798, https://doi.org/10.5194/egusphere-egu26-11798, 2026.

EGU26-12160 | ECS | Orals | SM3.4

Best Practices for Machine Learning based Icequake Picking with Distributed Acoustic Sensing 

Johanna Zitt, Marius Isken, Jannes Münchmeyer, Dominik Gräff, Andreas Fichtner, Fabian Walter, and Josefine Umlauft

Over the past years, a wide range of machine learning–based phase picking methods have been developed, primarily targeting three-component seismometer data from tectonic earthquakes. With the rapid growth of distributed acoustic sensing (DAS) applications, diversification of use cases, and availability of increasingly large DAS datasets, these methods are now being applied to single-component DAS recordings. However, their optimal use for DAS data and for alternative signal types such as cryoseismological events, remains rarely explored.
In this study, we present a systematic analysis of the performance of machine learning–based phase picking methods pretrained on tectonic earthquakes on one-component cryoseismological DAS data obtained on the Rhône Glacier in the Swiss Alps in July 2020. We evaluate multiple strategies for generating pseudo-three-component data from the intrinsically single-component DAS strain-rate data, including zero-padding of missing components, duplication of the single component, and the use of consecutive DAS channels as surrogate components. In addition, we assess the phase-picking performance across different preprocessing schemes, comparing conservatively band-pass filtered data with denoised data obtained using a J-invariant  autoencoder specifically trained on cryoseismological DAS data. Finally, we analyze the spatial and temporal distribution of located events over the full observation period and across the entire glacier. Event clusters are correlated with weather conditions, daily cycles, and the geometry of the glacier bed to explore potential patterns in cryoseismic activity.
Our results indicate that treating consecutive DAS channels as surrogate components yields the most reliable phase-picking performance, whereas extensive denoising can degrade picking accuracy. We further discuss spatial clusters of event locations and their correlations with glacier topography and meteorological conditions.

How to cite: Zitt, J., Isken, M., Münchmeyer, J., Gräff, D., Fichtner, A., Walter, F., and Umlauft, J.: Best Practices for Machine Learning based Icequake Picking with Distributed Acoustic Sensing, EGU General Assembly 2026, Vienna, Austria, 3–8 May 2026, EGU26-12160, https://doi.org/10.5194/egusphere-egu26-12160, 2026.

EGU26-12365 | ECS | Posters on site | SM3.4

Distributed Acoustic Sensing (DAS) for Geothermal Applications: a Case Study Across Dublin City 

Eoghan Totten, Jean Baptiste Tary, and Bruna Chagas de Melo

Seismic monitoring plays an integral role in geothermal renewable energy projects for imaging, site-specific noise characterisation and hazard risk assessment purposes. The number of European geothermal energy projects is expected to rise over the next decade as efforts to mitigate for reliance on fossil fuel-derived energy sources continue. Related to this is the pressing need to prospect for and expand the use of geothermal energy in urban settings.

Distributed Acoustic Sensing (DAS) is increasingly applied in lieu of geophone-based deployments. Instead of measuring seismic waves at a limited number of discrete points, DAS transforms fibre-optic cables into large and dense arrays of virtual sensors by measuring small changes in strain rate, with gauge length resolutions as small as 1-20 metres. DAS interferometry is able to capitalise on extant urban fibre-optic infrastructure, as well as exploit the diverse and passive seismic noise sources available in towns and cities.

Here we present in-progress DAS data analysis from an approximately 70-80km long cable crossing Dublin city (south to north) for three weeks of cumulative recording between September-October 2025. This cable tracks a large portion of the M50 ring road, the main arterial traffic route between north and south Dublin. We identify and characterise the main noise sources as a function of space and time, comparing DAS signals with temporally overlapping broadband seismometer data. We discuss possible approaches to suppress incoherent noise along the cable for future shallow and deep geothermal monitoring, as well as imaging applications using coherent noise.

This research feeds into the European Union-funded Clean Energy Transition partnership project, GEOTWINS, which seeks to extend the state-of-the-art in modular geothermal digital twins, for improved deep geothermal imaging methodologies, drilling risk mitigation and to progress societal acceptance.

How to cite: Totten, E., Tary, J. B., and Chagas de Melo, B.: Distributed Acoustic Sensing (DAS) for Geothermal Applications: a Case Study Across Dublin City, EGU General Assembly 2026, Vienna, Austria, 3–8 May 2026, EGU26-12365, https://doi.org/10.5194/egusphere-egu26-12365, 2026.

EGU26-12403 | Posters on site | SM3.4

Railway Distributed Acoustic Sensing data as an aid to earthquake monitoring in northernmost Sweden 

Björn Lund, Matti Rantatalo, Myrto Papadopoulou, Michael Roth, and Gunnar Eggertsson

The Swedish Transport Administration (STA) currently monitors the railway between Kiruna and the Swedish-Norwegian border with Distributed Acoustic Sensing (DAS), a distance of approximately 130 km. In collaboration with STA and Luleå University of Technology, the Swedish National Seismic Network (SNSN) has established data transmission on a request basis from the interrogator. As the railway crosses the Pärvie fault, the largest known, and still very active, glacially triggered fault, we hope to significantly improve detection and analysis of small earthquakes on that section of the fault. In this presentation we will show how we define low noise sections of the cable, using local and teleseismic events, and then use these as individual seismic stations. Over the 130 km, as the railway winds its way across the mountains, the cable generally runs in directions from N-S via NW-SE to W-E, providing many possible incidence directions. We discuss the technicalities of the data sharing, the existing metadata problems, how the DAS data is analyzed and incorporated into the routine processing at SNSN.

How to cite: Lund, B., Rantatalo, M., Papadopoulou, M., Roth, M., and Eggertsson, G.: Railway Distributed Acoustic Sensing data as an aid to earthquake monitoring in northernmost Sweden, EGU General Assembly 2026, Vienna, Austria, 3–8 May 2026, EGU26-12403, https://doi.org/10.5194/egusphere-egu26-12403, 2026.

EGU26-12609 | ECS | Orals | SM3.4

Understanding fiber optic sensitivity to a wavefield: A framework to separate site amplification from orientation effects 

Olivier Fontaine, Andreas Fichtner, Thomas Hudson, Thomas Lecocq, and Corentin Caudron

Interpreting amplitudes in Distributed Acoustic Sensing (DAS) data is challenging because the recorded signal is influenced by multiple factors.

To differentiate the impact of fiber orientation from site effects, we develop expressions of axial strain for different body wave polarizations. These expressions consider a linear fiber segment with any orientation in space. From these we explore array geometry properties and the potential of the DAS transfer function as a polarization filter. This last property arises from the polarity inversion characteristic of shear waves and the averaging nature of the gauge length. If the gauge length is set to be a loop instead of a linear segment then the DAS will average all azimuth for a horizontal loop, canceling SH waves. For a vertical loop, all dips are averaged canceling SV waves traveling within the loop plane. These results could reflect a link between DAS and rotational seismology. 

From these transfers functions, we develop a low-cost forward model based on ray theory that predicts amplitude recorded in a DAS array. Differences in amplitude between the modeled and observed wavefields relate to local site amplification from which, we create an amplitude correction factor. We evaluated this method using active seismic experiments from the PoroTomo dataset, successfully identifying regions with anomalous high amplitude responses consistent with the recordings following a magnitude 4.3. 

The results, together with the main elements of our approach, are transferable in many new sensing strategies, including optimization of fiber deployment geometry, generations of synthetic data and the acceleration and improvement of existing location methods through DAS-specific amplitude and phase corrections.
In summary, by exploiting the known directional sensitivity of DAS, we draw new insights from amplitude variations along the fiber array, treating energy loss as equally informative as energy gain in interpreting the wavefield. 

How to cite: Fontaine, O., Fichtner, A., Hudson, T., Lecocq, T., and Caudron, C.: Understanding fiber optic sensitivity to a wavefield: A framework to separate site amplification from orientation effects, EGU General Assembly 2026, Vienna, Austria, 3–8 May 2026, EGU26-12609, https://doi.org/10.5194/egusphere-egu26-12609, 2026.

EGU26-12675 | ECS | Orals | SM3.4

Strategies and Challenges in Applications of DAS-based Earthquake Early Warning Systems 

Claudio Strumia, Gaetano Festa, Alister Trabattoni, Diane Rivet, Luca Elia, Francesco Carotenuto, Simona Colombelli, Antonio Scala, Francesco Scotto di Uccio, and Anjali Suresh

Distributed Acoustic Sensing (DAS) transforms fiber-optic cables into ultra-dense strainmeter arrays, providing spatially and temporally continuous earthquake recordings. While its potential for offline seismic characterization is increasingly recognized, a key application of this sensing paradigm is real-time monitoring for Earthquake Early Warning (EEW). The use of existing fiber-optic infrastructures allows for sensing cables located close to seismogenic sources, such as offshore subduction zones, potentially extending the lead time of issued alerts. DAS deployments within Near Fault Observatories further provide dense spatial coverage of epicentral areas, favouring the rapid extraction of robust source information.

The application of DAS to EEW – alone or as a complement to standard accelerometers - has been recently explored, specifically focusing on the estimate of earthquake magnitude from the first seconds of recorded data. Existing approaches rely either on conversion strategies to ground-motion proxies or on direct analysis in the strain-rate domain. However, both the robustness of different conversion strategies and the selection of the most informative physical quantity for early magnitude estimation are not yet consolidated. In offshore environments, additional complexity arises from fiber-optic cables deployed on sediments, where strong converted phases often dominate early waveforms and hinder the direct P-wave signal traditionally used for EEW.

In this work, we analyse earthquakes recorded by the ABYSS network, supported by the ERC – starting program, consisting of 450 km of offshore telecommunication cables deployed along the Chilean subduction trench and interrogated by three DAS units. At this high-seismicity testbed, we develop a strategy for fast magnitude estimation with DAS. We show that converted Ps phases preceding S-wave arrivals carry significant information on earthquake magnitude. Furthermore, we investigated whether the use of time and space-integrated observables on DAS recordings can enhance the predictive power of amplitudes from the first seconds of seismic signals.

Finally, we assess the performance of a DAS-based EEW, grounded on the software PRESTo (Satriano et al., 2011). Using moderate-to-large offshore Chilean earthquakes, we highlight potential and limitations of DAS in regions with sparse conventional instrumentation. Complementary analyses using data from the Irpinia Near Fault Observatory demonstrate the benefits of jointly exploiting DAS and traditional seismic stations within dense monitoring networks, confirming the applicability of DAS-based EEW systems across different tectonic settings.

How to cite: Strumia, C., Festa, G., Trabattoni, A., Rivet, D., Elia, L., Carotenuto, F., Colombelli, S., Scala, A., Scotto di Uccio, F., and Suresh, A.: Strategies and Challenges in Applications of DAS-based Earthquake Early Warning Systems, EGU General Assembly 2026, Vienna, Austria, 3–8 May 2026, EGU26-12675, https://doi.org/10.5194/egusphere-egu26-12675, 2026.

EGU26-13083 | ECS | Orals | SM3.4

Long range Coherent-Optical Frequency Domain Reflectometry for large scale distributed sensing 

Debanjan Show, Biplab Dutta, Maël Abdelhak, Olivier Lopez, Adèle Hilico, Anne Amy-Klein, Christian Chardonnet, Paul-Eric Pottie, and Etienne Cantin

Fig. 1: Map of the REFIMEVE network (green links) and its connection to European links.

In recent years, significant technological progress has demonstrated the feasibility of using the long distance fiber optic links as large scale distributed networks for environmental sensing [1]. Optical fibers are inherently sensitive to external perturbations: their mechanical structure responds to strain, while the light propagating within them undergoes measurable intensity and phase variation when subjected to vibration or seismic waves. A notable example is the French national research infrastructure REFIMEVE [2], which distributes ultrastable time and frequency references across more than 9000 km of fiber links connecting laboratories throughout France and Europe (see Fig. 1). The infrastructure has demonstrated strong potential for geophysical studies [3]. Applications such as earthquake detection, volcano monitoring, and environmental hazard surveillance are attracting increasing interest worldwide, particularly because they can leverage already existing fiber networks. In this context, the European project SENSEI (Smart European Networks for Sensing the Environment and Internet Quality) [4] aims to harness this potential by developing the next generation photonic technologies for detecting both natural phenomena, such as earthquakes, volcano activity, and anthropogenic events including construction activity or vehicular traffic.

Within this framework, one of our objectives is to develop a coherent optical frequency domain reflectometry (C-OFDR) [5]. Current systems are limited to approximately 100 km by the coherence length of the laser source.  Here, we take benefit from the low frequency noise laser source generated by REFIMEVE frequency reference in order to extend the sensing range. In our setup, the output of a low noise laser is frequency modulated and a fiber under test is studied in a Michelson interferometer configuration. By analyzing the Rayleigh backscattered signal along the fiber, the system enables detailed diagnostics of the fiber under test including the detection of localized fiber deformations, faulty connectors, attenuation variations, and disturbances induced by environmental vibrations. As a first demonstration, we tested a prototype over a long range fiber link made of laboratory spools extending up to 335 km. The system successfully identified the position of the optical amplifier and a PC connector placed at the end of the fiber with km scale spatial resolution. In addition, vibration induced perturbation was observed and is under study, highlighting the potential of this technique for seismic applications. In future work, we plan to deploy the C-OFDR system on the operational REFIMEVE fiber network to evaluate its performance under real field conditions. This approach positions C-OFDR as a powerful tool for telecommunication infrastructure monitoring and distributed geophysical sensing.  

References :

[1] G. Marra et al., Science 361 (2018), https://doi.org/10.1126/science.aat4458

[2] REFIMEVE, https://www.refimeve.fr/en/homepage/

[3] M. B. K. Tønnes, PhD Thesis (2022), https://hal.science/tel-03984045v1

[4] SENSEI, https://senseiproject.eu/

[5] C. Liang et al., IEEE Access. 9 (2021), DOI: 10.1109/ACCESS.2021.3061250

How to cite: Show, D., Dutta, B., Abdelhak, M., Lopez, O., Hilico, A., Amy-Klein, A., Chardonnet, C., Pottie, P.-E., and Cantin, E.: Long range Coherent-Optical Frequency Domain Reflectometry for large scale distributed sensing, EGU General Assembly 2026, Vienna, Austria, 3–8 May 2026, EGU26-13083, https://doi.org/10.5194/egusphere-egu26-13083, 2026.

EGU26-13151 | Orals | SM3.4

Fiber optic cables (DAS) for seismic event detection – An underground case study 

Vincent Brémaud and Colin Madelaine

Distributed Acoustic Sensing (DAS), leveraging existing fiber optic infrastructure, represents a groundbreaking advancement in seismic monitoring. By converting telecommunication cables into dense arrays of virtual sensors, DAS enables continuous spatial coverage and enhanced sensitivity to seismic waves in remote or logistically constrained environments. This capability positions DAS as a complementary or alternative tool to traditional seismic networks, offering cost-effective, low-maintenance solutions for geophysical research and hazard monitoring.

This study focuses on the Premise-2 experiment, conducted at the Low-Noise Underground Laboratory (https://www.lsbb.eu/) in Rustrel, France, a site renowned for its low seismic noise. The experiment integrates active and passive seismic acquisitions, capturing both ambient noise and controlled seismic signals to assess DAS’s ability to detect and characterize events. Multiple fiber optic cable types and installation methods (laid on the ground, with sand bags, buried, or structurally attached) are evaluated to determine their impact on signal sensitivity, spatial resolution, and measurement robustness.

This study provides critical insights into optimal DAS deployment configurations for seismological applications while highlighting the challenges posed by large-scale data acquisition. The research underscores the need for advanced algorithms and specific workflows to fully exploit DAS’s potential. To characterized the events, we have used a workflow using automatic P and S arrival phases. We filtered these arrivals with an associator to select only detections that could be linked to an event. Then we tried different location algorithms to get a complete workflow from the acquisition to the location of the events.

How to cite: Brémaud, V. and Madelaine, C.: Fiber optic cables (DAS) for seismic event detection – An underground case study, EGU General Assembly 2026, Vienna, Austria, 3–8 May 2026, EGU26-13151, https://doi.org/10.5194/egusphere-egu26-13151, 2026.

EGU26-13235 | ECS | Orals | SM3.4

Distributed Acoustic Sensing at the Engineering Scale: Experimental Insights from the PITOP Test Site 

Olga Nesterova, Luca Schenato, Alexis Constantinou, Thurian Le Dû, Fabio Meneghini, Andrea Travan, Cinzia Bellezza, Gwenola Michaud, Andrea Marzona, Alessandro Brovelli, Silvia Zampato, Giorgio Cassiani, Jacopo Boaga, and Ilaria Barone

The PITOP geophysical test site, operated by the Istituto Nazionale di Oceanografia e di Geofisica Sperimentale (OGS) in north-eastern Italy, provides a unique experimental environment for testing seismic acquisition technologies under realistic field conditions. Covering ~22,000 m², PITOP was established to support the development and validation of geophysical methods and instrumentation in both surface and borehole installations. Here, we evaluate PITOP’s potential for Distributed Acoustic Sensing (DAS) experiments, focusing on small-scale seismic measurements relevant to urban settings and engineering applications. 

Five boreholes with distinct purposes and instrumentation are available at the PITOP site, including a water well (PITOP1), two 400-m-deep wells associated with geosteering research (PITOP2 and PITOP3), a 150-m-deep borehole permanently equipped with optical fibre for DAS measurements (PITOP4), and a recently drilled well dedicated to geoelectrical surveys (PITOP5). The site also hosts a surface-deployed fibre-optic cable, containing both linear and helicoidal fibers, and about 20 3C seismic nodes. Finally, several seismic sources are available, which are a borehole Sparker Pulse, suitable for crosshole VSP configurations, and two surface vibratory sources, the IVI MiniVib T-2500, which can generate sweeps in the 10–550 Hz frequency range, and the ElViS VII vibrator, designed for frequencies between 20 and 220 Hz.

We conducted three dedicated experiments:  (i) cross-hole measurements with sources in PITOP3 at depths of 10, 50, 75, and 100 m, and DAS recording in PITOP4; (ii) a vertical seismic profiling (VSP) survey using the MiniVib source close to the well head with DAS recording in PITOP4; and  (iii) recordings of the seismic wavefield generated by P- and S-wave vibratory sources using surface DAS arrays in linear and helicoidal configurations, together with co-located 3D geophones for comparison.

DAS data were acquired with multiple gauge lengths and acquisition settings. The resulting datasets enable a systematic evaluation of acquisition parameters selection and highlight processing strategies required for different DAS configurations. They provide a valuable basis for assessing optimal DAS acquisition strategies for small-scale seismic applications and for defining processing workflows adapted to diverse source and receiver geometries.

The present study is being carried out within the framework of the USES2 project, which receives funding from the EUROPEAN RESEARCH EXECUTIVE AGENCY (REA) under the Marie Skłodowska-Curie grant agreement No 101072599.

This research has been supported by the Interdepartmental Research Center for Cultural Heritage CIBA (University of Padova) with the World Class Research Infrastructure (WCRI) SYCURI—SYnergic strategies for CUltural heritage at RIsk, funded by the University of Padova.

How to cite: Nesterova, O., Schenato, L., Constantinou, A., Le Dû, T., Meneghini, F., Travan, A., Bellezza, C., Michaud, G., Marzona, A., Brovelli, A., Zampato, S., Cassiani, G., Boaga, J., and Barone, I.: Distributed Acoustic Sensing at the Engineering Scale: Experimental Insights from the PITOP Test Site, EGU General Assembly 2026, Vienna, Austria, 3–8 May 2026, EGU26-13235, https://doi.org/10.5194/egusphere-egu26-13235, 2026.

EGU26-13315 | ECS | Orals | SM3.4

Deep Learning-Based Earthquakes Localization at Campi Flegrei via Distributed Acoustic Sensing 

Miriana Corsaro, Léonard Seydoux, Gilda Currenti, Flavio Cannavò, Simone Palazzo, Martina Allegra, Philippe Jousset, Michele Prestifilippo, and Concetto Spampinato

The current phase of unrest of the Campi Flegrei caldera (Italy), one of the most dangerous volcanic complexes in the world, requires increasingly rapid and high-resolution seismic monitoring solutions. In this context, Distributed Acoustic Sensing (DAS) has recently emerged as a highly innovative technology, enabling existing fiber-optic cables to be repurposed into ultra-dense seismic arrays capable of sampling the seismic wavefield with unprecedented spatial resolution.

In this study, we present a new earthquake-localization method that uses automatically identified P- and S-wave arrivals on DAS data to localize seismic events. Employing Transformer-based architectures designed to process DAS's high-dimensional strain data, our approach simultaneously estimates key source parameters, including hypocentral location, magnitude, and origin time. A comparative analysis against the official seismic catalogue reveals minimal residuals, validating the model's robustness. 

The model therefore represents a significant advancement, as it enables reliable earthquake localization in extremely short time frames using exclusively automatically picked data, while simultaneously overcoming the computational bottlenecks typical of traditional processing workflows. As a result, this methodology establishes a new benchmark for real-time monitoring of magmatic and hydrothermal systems, substantially contributing to improved seismic hazard assessment.

How to cite: Corsaro, M., Seydoux, L., Currenti, G., Cannavò, F., Palazzo, S., Allegra, M., Jousset, P., Prestifilippo, M., and Spampinato, C.: Deep Learning-Based Earthquakes Localization at Campi Flegrei via Distributed Acoustic Sensing, EGU General Assembly 2026, Vienna, Austria, 3–8 May 2026, EGU26-13315, https://doi.org/10.5194/egusphere-egu26-13315, 2026.

EGU26-13382 | ECS | Posters on site | SM3.4

Towards ambient noise tomography on long telecommunication cables: using DAS for characterisation of the seismo-acoustic soundscape in the Atlantic Ocean and Irish Sea 

Rosa Vergara González, Nicolas Luca Celli, Christopher J. Bean, Marco Ruffini, and Örn Jónsson

The oceans are a noisy place, where ships, waves, storms, currents, earthquakes and marine wildlife all leave their own seismo-acoustic signatures. Fibre sensing has the potential to allow researchers to utilise the thousands of sea-bottom telecommunication fibre-optic cables spread across the globe, and with them, we can record, characterise and monitor these signals from up close. However, at present sensing equipment limitations, lack of established fibre-sensing workflows and access to cables severely limit the use of this technology in the seas.

Here, we present and analyse Distributed Acoustic Sensing (DAS) data newly recorded on long, telecom fibre-optic cables offshore through the east and west coasts of Ireland. The availability of these two different datasets allows us to compare different environments and physical phenomena across a large region. The eastern cable covers 118 km from Dublin, Ireland to Holyhead, Wales with 36 days of data recorded in Spring 2025, while the western one reaches 72 km offshore from Galway, with 60 days of data in Autumn 2025. These datasets form part of a much larger compendium, including data from approximately 300km of onshore fibre-optic cables between both shores. Thanks to the large cable lengths and long recording times, we observe a plethora of short-lived, high frequency signals such as ships, anthropogenic noise, and local earthquakes, as well as long-wavelength, long-period signals such as ocean storms and microseisms, tides, and teleseismic events.

To characterise observations in these noisy environments, we compare our observations with nearby land seismic stations and weather records to track storm systems and wave height. We identify and separate the different seismic and acoustic sources observed, resulting in a preliminary catalogue of dominant signal types observed along the cables. The results are utilised to highlight the differences between the two marine environments and separate marine, seismic and anthropic transient signals from ambient noise. This is key to improve our understanding of ocean processes and to build datasets suitable for deep Earth sensing through Ambient Noise Tomography. While our focus is seismic, characterising marine seismic and acoustic phenomena is key in applications well beyond this field, from telecommunication fibre cable safety, to marine biology and oceanographic applications.

How to cite: Vergara González, R., Celli, N. L., Bean, C. J., Ruffini, M., and Jónsson, Ö.: Towards ambient noise tomography on long telecommunication cables: using DAS for characterisation of the seismo-acoustic soundscape in the Atlantic Ocean and Irish Sea, EGU General Assembly 2026, Vienna, Austria, 3–8 May 2026, EGU26-13382, https://doi.org/10.5194/egusphere-egu26-13382, 2026.

EGU26-13416 | ECS | Posters on site | SM3.4

Temperature and strain monitoring in Reykjanes geothermal field, Iceland, using quasi-distributed fiber-optic sensing 

Julien Govoorts, Corentin Caudron, Jiaxuan Li, Haiyang Liao, Christophe Caucheteur, Yesim Çubuk-Sabuncu, Halldór Geirsson, Vala Hjörleifsdóttir, Kristín Jónsdóttir, and Loic Peiffer

Since December 2023 and after 800 years of inactivity, recurrent volcanic eruptions are taking place at the Svartsengi volcanic system indicating the start of a new volcanic cycle. In contrast, the Reykjanes volcanic system, located to the west of Svartsengi, has remained dormant since the 13th century.  The Reykjanes geothermal area, in particular the Gunnuhver geothermal field, is located at the westernmost end of the Reykjanes Peninsula. This geothermal area is associated with the upflow of seawater-derived hydrothermal fluids and characterized by numerous geothermal features, including steam vents and steam-heated mud pools.

Since October 2022, this geothermal field has been continuously monitored using a variety of technologies to record parameters such as soil temperature, strain and electrical resistivity. The present study focuses primarily on the parameters gathered from August 2024 using the Fiber Bragg Grating (FBG) technology, a point fiber-optic sensing approach. This technique utilizes wavelength-division multiplexing, meaning the fiber is capable of transmitting information at distinct wavelengths. Consequently, given that each FBG possesses its own wavelength, the fiber is transformed into a cost-effective and versatile quasi-distributed sensor.

Over the course of a year, the FBG interrogator deployed on-site has measured the wavelength changes at a sampling frequency ranging from 0.4Hz to 1Hz. These changes were recorded from 24 different temperature probes and 8 strain sensors both buried in-ground throughout the geothermal field. Most of the temperature sensors were installed in areas of the soil where no geothermal surface manifestation was present. These sensors recorded temperature changes primarily driven by variations in atmospheric temperature. In contrast, the remaining sensors were directly located in altered areas or close to steam vents. These sensors exhibit clear cooling patterns due to precipitation but do not show temperature changes that can be attributed to the eruption cycle. Additionally, the FBG temperature sensors allow the identification of fiber sections that are coupled to air temperature fluctuations along a telecom fiber deployed a few hundred meters north and monitored by a Distributed Acoustic Sensing (DAS) interrogator.

In addition to the temperature probes, the strain sensors have recorded signals ranging from periodic dynamic strain changes attributed to industrial processes, to static strain changes assigned to crustal deformation. On April 1, 2025, a volcanic eruption occurred in the Svartsengi volcanic system, resulting in strain variations observed 15 kilometers away from the eruption site using FBG and low-frequency components of DAS recordings. These variations were also observed in strain measurements obtained from permanent network GNSS stations. This experiment demonstrates the capacity and reliability of the FBG technology for monitoring temperature changes and deformation signals in an active geothermal environment.

How to cite: Govoorts, J., Caudron, C., Li, J., Liao, H., Caucheteur, C., Çubuk-Sabuncu, Y., Geirsson, H., Hjörleifsdóttir, V., Jónsdóttir, K., and Peiffer, L.: Temperature and strain monitoring in Reykjanes geothermal field, Iceland, using quasi-distributed fiber-optic sensing, EGU General Assembly 2026, Vienna, Austria, 3–8 May 2026, EGU26-13416, https://doi.org/10.5194/egusphere-egu26-13416, 2026.

EGU26-13921 | ECS | Orals | SM3.4

Seismic Characterisation of an Arctic Glacier 

Tora Haugen Myklebust, Martin Landrø, Robin André Rørstadbotnen, and Calder Robinson

In recent years, Distributed Acoustic Sensing (DAS) has emerged as a cost-effective seismic monitoring tool for cryosphere research. Compared to conventional geophone arrays, the DAS system is compact, easy to transport, and can be rapidly deployed over large distances in glaciated environments.

Previous studies have demonstrated that DAS is a useful tool for ice-sheet imaging and monitoring glacier dynamics. For example, using borehole DAS in conjunction with surface explosives (e.g., Booth et al., 2022; Fitchner et al., 2023) or passive recordings using surface DAS (e.g., Walter et al., 2020; Gräff et al, 2025). Significant progress has been made in applying surface DAS for active marine subsurface imaging (e.g., Pedersen et al., 2022; Raknes et al., 2025). We extend this approach to active englacial and subglacial imaging on Slakbreen, Svalbard.

During a multi-geophysical field campaign in March 2025, we acquired seismic data using surface explosives along an approximately 2 km fibre co-located with a vertical-component geophone array. We process different reflected modes (PP and PS) recorded on the fibre and benchmark the imaging results against the equivalent PP-image from the geophone array. We evaluate differences in wavefield sensitivity across the three datasets and we will present how these can be used to characterise the state of the cryosphere and deeper sedimentary successions.

Despite the relative immaturity of DAS for glacier imaging and current limitations of the processing workflow, our results clearly establish surface DAS as a viable monitoring tool for seismic imaging of the cryosphere and as a potential enabler of large-scale seismic monitoring of glaciers and the subsurface.


References:

Booth, A. D., P. Christoffersen, A. Pretorius, J. Chapman, B. Hubbard, E. C. Smith, S. de Ridder, A. Nowacki, B. P. Lipovsky, and M. Denolle, 2022, Characterising sediment thickness beneath a greenlandic outlet glacier using distributed acoustic sensing: preliminary observations and progress towards an efficient machine learning approach: Annals of Glaciology, 63(87-89):79–82.                                                                                                                                                   

Fichtner, A., C. Hofstede, L. Gebraad, A. Zunino, D. Zigone, and O. Eisen, 2023, Borehole fibre-optic seismology inside the northeast greenland ice stream: Geo-physical Journal International, 235(3):2430–2441.

Gräff, D., B. P. Lipovsky, A. Vieli, A. Dachauer, R. Jackson, D. Farinotti, J. Schmale, J.-P. Ampuero, E. Berg, A. Dannowski, et al., 2025, Calving-driven fjord dynamics resolved by seafloor fibre sensing: Nature, 644(8076):404–412.

Pedersen, A., H. Westerdahl, M. Thompson, C. Sagary, and J. Brenne, 2022, A north sea case study: Does das have potential for permanent reservoir monitoring? In Proceedings of the 83rd EAGE Annual Conference & Exhibition, pages 1–5. European Association of Geoscientists & Engineers.

Raknes, E. B., B. Foseide, and G. Jansson, 2025, Acquisition and imaging of ocean-bottom fiber-optic distributed acoustic sensing data using a full-shot carpet from a conventional 3d survey: Geophysics, 90(5):P99–P112.

Walter, F., D. Gräff, F. Lindner, P. Paitz, M. Köpfli, M. Chmiel, and A. Fichtner,2020, Distributed acoustic sensing of microseismic sources and wave propagation in glaciated terrain: Nature communications, 11(1):2436.

How to cite: Myklebust, T. H., Landrø, M., Rørstadbotnen, R. A., and Robinson, C.: Seismic Characterisation of an Arctic Glacier, EGU General Assembly 2026, Vienna, Austria, 3–8 May 2026, EGU26-13921, https://doi.org/10.5194/egusphere-egu26-13921, 2026.

EGU26-14230 | ECS | Orals | SM3.4

Unveiling type of fiber and coupling conditions effects on geophysical DAS measurements, results from underground experiments 

Vanessa Carrillo-Barra, Diego Mercerat, Vincent Brémaud, Anthony Sladen, Olivier Sèbe, Amaury Vallage, and Jean-Paul Ampuero

Optical fiber measurements have been demonstrated to be useful in assessing geophysical near-surface parameters and in detecting seismological events in newly accessible regions (e.g. cities, ocean floor, highways) by leveraging the existing fiber-optic infrastructure. In particular, laser interferometry performed with DAS systems (Distributed Acoustic Sensing) allows measuring the cable axial strain related to passing seismo-acoustic waves, at any point along the fiber and over tens of kilometers of cable.

However, compared to traditional seismic sensors the instrumental response of DAS remains unclear, and there is in particular a critical need to better understand how the measurements are influenced by the nature of the fiber optic cable and its coupling to the ground or medium under study. To explore this question, we present results from two active seismic campaigns carried out in the low-noise  underground tunnel LSBB (Laboratoire Souterrain à Bas Bruit), in southeastern France.

We recorded multiple active sources (TNT detonations and hammer shots) by a 10km and 2km long underground optical fiber set-ups and with conventional seismic sensors as well. We tested along both campaigns different optical fiber cable designs and different types of coupling conditions (sealed, sandbags weighted, freely posed) installed in parallel. This experimental setup provides a unique opportunity to examine in detail and quantify the possible variations in the strain signals recovered from DAS data.

Preliminary observations reveal significant discrepancies in the recorded data depending on the coupling conditions. The characteristics of the deployed source result in a signal that is primarily concentrated in the high-frequency range, for which the sealed fiber does not necessarily exhibit a significantly improved response. Additionally, the acoustic wave generated by the hammer-shot echo, propagating through the air, is strongly amplified in all cables covered by sandbags. We propose that the sandbags increase the interaction area between that signal and the cables, thereby enhancing reverberation.

Furthermore, we observe systematic differences in the maximum amplitudes recorded by the different cables tested, with the telecom cable consistently exhibiting lower amplitudes than other specialized cables, suggesting a lower sensitivity. However, this reduction is relatively modest, and when combined with the substantially lower cost of telecom cables, indicates that they remain a cost-efficient alternative for certain experiments. Additional observations and detailed analyses from this study will be presented.


Keywords: Coupling, fiber optics, DAS measurements, strain rate, active seismic, LSBB.

How to cite: Carrillo-Barra, V., Mercerat, D., Brémaud, V., Sladen, A., Sèbe, O., Vallage, A., and Ampuero, J.-P.: Unveiling type of fiber and coupling conditions effects on geophysical DAS measurements, results from underground experiments, EGU General Assembly 2026, Vienna, Austria, 3–8 May 2026, EGU26-14230, https://doi.org/10.5194/egusphere-egu26-14230, 2026.

EGU26-15142 | ECS | Orals | SM3.4

Toward Global-Scale Submarine Fiber Sensing: Early Results from Multispan DAS at the OOI Regional Cabled Array 

Zoe Krauss, Bradley Lipovsky, Mikael Mazur, William Wilcock, Nicolas Fontaine, Roland Ryf, Alex Rose, William Dientsfrey, Shima Abadi, Marine Denolle, and Renate Hartog

A recently developed multispan distributed acoustic sensing (multispan-DAS) technique from Nokia Bell Labs enables strain measurements along submarine fiber-optic cables across multiple repeater-separated spans. By leveraging the high-loss loopback couplers within optical repeaters, this technique overcomes the long-standing limitation of conventional DAS to the first span of a repeated cable, typically < 100 km offshore. Dense, continuous arrays of seafloor strain sensors can now extend to hundreds or thousands of kilometers. This technique has been used to successfully record the 2025 M8.8 Kamchatka earthquake and tsunami at teleseismic range with a spatial resolution of ~100 m across 4400 km of a repeated submarine cable.

In November 2025, the multispan-DAS system from Nokia Bell Labs was deployed for three months on both repeated submarine cables of the Ocean Observatories Initiative Regional Cabled Array (OOI RCA) offshore Oregon. The deployment traverses the Cascadia subduction zone forearc and extends approximately 500 km offshore to Axial Seamount. During this period, the first span of the southern cable was simultaneously interrogated using a multiplexed conventional DAS unit, while data continued to stream from co-located cabled seismometers, hydrophones, and other oceanographic instruments on the OOI RCA.

The multispan-DAS system recorded a regional earthquake beyond the first repeater of both cables during testing as well as the ambient seafloor seismic wavefield, demonstrating sensitivity to a broad range of seismic, oceanographic, and acoustic signals. These observations provide a unique opportunity to directly compare multispan-DAS measurements with conventional DAS and established seafloor instrumentation across a large spatial extent. The resulting dataset will be publicly released following documentation and quality control. We will present preliminary results characterizing the noise floor, sensitivity, and signal fidelity of multispan-DAS relative to co-located sensors, and examine the consistency of observed seismic and oceanographic signals across measurement modalities. These results will highlight the potential of multispan-DAS for applications including routine earthquake monitoring, earthquake early warning, and broader seafloor observation, and represent an important step toward establishing this technique as a new tool for the seismological and oceanographic communities.

How to cite: Krauss, Z., Lipovsky, B., Mazur, M., Wilcock, W., Fontaine, N., Ryf, R., Rose, A., Dientsfrey, W., Abadi, S., Denolle, M., and Hartog, R.: Toward Global-Scale Submarine Fiber Sensing: Early Results from Multispan DAS at the OOI Regional Cabled Array, EGU General Assembly 2026, Vienna, Austria, 3–8 May 2026, EGU26-15142, https://doi.org/10.5194/egusphere-egu26-15142, 2026.

EGU26-15227 | Posters on site | SM3.4

Enhancing Earthquake Location in the Central Apennines (Italy): A Hybrid Approach Combining Arrivals from Line-Sensor Telecom Fiber Interferometry and Traditional Point-sensors 

Diana Latorre, Cecilia Clivati, André Herrero, Anthony Lomax, Raffaele Di Stefano, Simone Donadello, Aladino Govoni, Maurizio Vassallo, and Lucia Margheriti

The integration of existing telecommunication fiber-optic infrastructure into seismic monitoring networks offers a transformative opportunity to densify observations in seismically active regions. We present the results of a multi-year monitoring experiment (2021–2026) utilizing a 39-km telecom fiber link from the Italian telecommunication company Open Fiber between Ascoli Piceno and Teramo in the Central Apennines, Italy. The system employs an ultra stable laser to measure seismic-induced deformation of the fiber, operating on a dedicated wavelength in coexistence with commercial data traffic.

A significant challenge in utilizing fiber-optic data for earthquake location is the transition from traditional point-sensor geometry to distributed sensing. To address this, we implemented a hybrid localization approach using a modified version of the NonLinLoc (NLL) algorithm. We move beyond traditional discrete measurements (point sensors) by treating the cable as a continuous "line sensor." Following the NLL algorithm, the most effective strategy is translating both point and line geometries into a unified framework of 3D travel-time maps. Once the sensors are translated into these maps, their combined use for location becomes independent of the sensor type, allowing for a seamless merging of traditional seismic station data and fiber-optic pickings. 

We applied this methodology to the real seismic catalog recorded from the fiber's installation in mid 2021 until January 2026 in the Ascoli-Teramo area, a region where the Italian seismic network is relatively sparse. Specifically, we analyzed signals from: 1) several small seismic sequences occurring at short distances (up to approximately 20 km) from the fiber cable, including the Civitella del Tronto (TE) sequence that followed a Mw 3.9 event (September 22, 2022); and 2) more distant earthquakes (ranging from approximately 20 to 50 km from the fiber) with local magnitudes exceeding ML 2.5, distributed along the Central Apennines axis. For events where the fiber signal allowed for the correct identification of P- and S-wave arrival times, we applied the NLL algorithm using the integrated network. In this work, we present several of these examples and associated tests to discuss how the inclusion of fiber-derived arrival times can provide further hypocentral constraints. This study aims to highlight the scalability of fiber interferometry combined with non-linear inversion as a robust tool for seismic surveillance in populated and high-risk tectonic environments.

How to cite: Latorre, D., Clivati, C., Herrero, A., Lomax, A., Di Stefano, R., Donadello, S., Govoni, A., Vassallo, M., and Margheriti, L.: Enhancing Earthquake Location in the Central Apennines (Italy): A Hybrid Approach Combining Arrivals from Line-Sensor Telecom Fiber Interferometry and Traditional Point-sensors, EGU General Assembly 2026, Vienna, Austria, 3–8 May 2026, EGU26-15227, https://doi.org/10.5194/egusphere-egu26-15227, 2026.

EGU26-16522 | ECS | Posters on site | SM3.4

Detecting Microseismic Events Using Cross-Fault Borehole DAS 

Chih-Chieh Tseng, Hao Kuo-Chen, Li-Yu Kan, Sheng-Yan Pan, Wei-Fang Sun, Chin-Shang Ku, and Ching-Chou Fu

Microseismic events account for the majority of seismicity, however, sparse station spacing hinders the detection of such small events. In recent decades, distributed acoustic sensing (DAS) has shown its power to provide a denser spatial sampling in an array sense, to resolve weak signals that are often missed by conventional seismometers. In eastern Taiwan, the Chihshang fault plays a key role in accommodating deformation along the Longitudinal Valley fault system, where frequent small earthquakes and fault creep occur. In this study, we develop a new workflow for microseismic event detection by integrating borehole DAS data with the deep-learning-based automatic phase picking model PhaseNet. An event is declared when more than 75% of channels record P-wave picks and more than 30% record S-wave picks within a 1-s time window. We analyzed three months of DAS data from March to July 2025. As a result, we identified approximately twice as many events as those reported in a deep-learning-based earthquake catalog constructed using only surface seismic stations. These results suggest that borehole DAS provides an effective complementary constraint for detecting earthquake-generated wave trains. This processing workflow can significantly improve the detection capability for microseismic events, leading to higher seismic catalog completeness and finer fault structure near the Chihshang region.

How to cite: Tseng, C.-C., Kuo-Chen, H., Kan, L.-Y., Pan, S.-Y., Sun, W.-F., Ku, C.-S., and Fu, C.-C.: Detecting Microseismic Events Using Cross-Fault Borehole DAS, EGU General Assembly 2026, Vienna, Austria, 3–8 May 2026, EGU26-16522, https://doi.org/10.5194/egusphere-egu26-16522, 2026.

EGU26-16913 | ECS | Posters on site | SM3.4

Cross-validating Distributed Acoustic Sensing and Seismic Records for Shallow Ground Motion and Near-Surface Properties 

Marco Pascal Roth, Xiang Chen, Gian Maria Bocchini, and Rebecca M Harrington

Distributed Acoustic Sensing (DAS) offers dense spatial sampling of ground motion and has the potential to perform detailed seismic monitoring and constrain shallow velocity structure. In this study, we analyze ground motion recorded by broadband seismometers and a fiber-optic interrogator of two shallow tectonic earthquakes in the Roerdalen region (The Netherlands–Germany border) with local magnitudes ML 2.2 (2025-09-09) and ML 1.9 (2025-09-15) and hypocentral depths of ~15 km to quantify the differences in sensitivity and magnitude estimates from each type of instrumentation. The Distributed Acoustic Sensing (DAS) recordings consist of ground strain sampled at 250 Hz on a 30 km telecommunications dark-fiber with a channel spacing of 5 m and a gauge length of 50 m. Seismometer recordings consist of ground velocity sampled at 100 Hz on a Trillium Compact 20 s seismometer that has a flat frequency response up to ~100 Hz. Both types of sensors recorded the earthquakes with a minimum epicentral distance of ~20 and 10 km, respectively. We will present results showing the differences in frequency sensitivity, conversions to ground displacement, and estimated magnitudes, as well as an interpretation of differences based on the shallow ground velocity. 

We first convert DAS recordings that are initially measured in strain to ground displacement using a semblance-based approach, as well conventional seismic recordings initially recorded in velocity. We make a quantitative comparison of waveform characteristics, including amplitude-frequency dependence and its variability in space for point-wise seismic sensor measurements vs. DAS measurements. We will present an interpretation of the results based on the context of geological setting to identify spatial variations that cannot be resolved by the sparse seismic network alone. As DAS measurements reveal significant lateral variability in ground motion amplitudes that suggest a strong influence of near-surface conditions (density) and/or local coupling effects, we will also quantify the relative influence of each using a comparison of strain and converted ground displacement. In addition, we explore approaches to estimate earthquake magnitude from DAS data by relating observed strain amplitudes to ground-motion parameters derived from the co-located seismometer. Preliminary results suggest that DAS-based observations capture the relative scaling between the two events and show promise for magnitude estimation when calibrated against conventional seismic sensors. Our findings demonstrate the value of DAS for high-resolution observations of near surface properties and their influence on earthquake waveforms.  They also highlight the potential of DAS to complement existing seismic networks for monitoring small-magnitude earthquakes.  

How to cite: Roth, M. P., Chen, X., Bocchini, G. M., and Harrington, R. M.: Cross-validating Distributed Acoustic Sensing and Seismic Records for Shallow Ground Motion and Near-Surface Properties, EGU General Assembly 2026, Vienna, Austria, 3–8 May 2026, EGU26-16913, https://doi.org/10.5194/egusphere-egu26-16913, 2026.

EGU26-17223 | ECS | Orals | SM3.4

Reimagining Seismic Array Processing with Fibre-Optic DAS: The NORFOX Array 

Antoine Turquet, Andreas Wuestefeld, Alan Baird, Kamran Iranpour, and Ravn Rydtun

NORFOX is a purpose-built fibre-optic Distributed Acoustic Sensing (DAS) installation located in southeastern Norway, approximately 150 km north of Oslo. Beyond its primary function of monitoring earthquakes and explosions, the system captures a broad range of other signals, including aircraft, thunder, and atmospheric phenomena. A key advantage of NORFOX is its overlap with the co-located NORES seismometer array, which enables direct calibration of DAS measurements against conventional seismic recordings and supports method development under well-constrained ground-truth conditions. In this contribution, we introduce the NORFOX infrastructure and array layout, discuss key design choices, and summarize practical strengths and limitations using representative examples.

NORFOX is additionally equipped with all-sky cameras operated by Norsk Meteor Nettverk for meteor monitoring, which also capture nearby lightning activity. Lightning locations provide independent timing and spatial context that help interpretation coincident acoustic signatures observed on the fibre. Together with weather information, noise-floor characterization, and optical monitoring, these observations provide a benchmark dataset for both existing and future DAS installations and calibration

We also present in-house approaches to reduce noise, understanding signals, strategies on managing data volumes and edge-computing. Furthermore, we show and interpret signals from nearby quarry blasts, regional earthquakes, thunderstorms, and aircraft. Finally, we demonstrate and evaluate DAS array-processing methodologies for earthquake and explosion monitoring at NORFOX. Overall, dedicated research fibre arrays such as NORFOX provide a controlled environment to develop, benchmark, and calibrate DAS-based monitoring workflows in combination with co-located seismic instrumentation.

How to cite: Turquet, A., Wuestefeld, A., Baird, A., Iranpour, K., and Rydtun, R.: Reimagining Seismic Array Processing with Fibre-Optic DAS: The NORFOX Array, EGU General Assembly 2026, Vienna, Austria, 3–8 May 2026, EGU26-17223, https://doi.org/10.5194/egusphere-egu26-17223, 2026.

EGU26-17496 | ECS | Orals | SM3.4

Privacy Concerns of DAS: Eavesdropping using Neural Network Transcription 

Jack Lee Smith, Karen Lythgoe, Andrew Curtis, Harry Whitelam, Dominic Seager, Jessica Johnson, and Mohammad Belal

Distributed acoustic sensing (DAS) has transformed geophysical, environmental, and infrastructure monitoring. However, the increasing bandwidth and sensitivity of modern interrogators now extend into the audio range, introducing a material privacy risk. Here we demonstrate, through in-situ experiments on live fibre deployments, that human speech, music, and other acoustic signals can be under certain acquisition conditions.

We show that intelligible speech can be accurately recovered and automatically transcribed using neural networks. Experiments were conducted on both linear and spooled fibre geometries, deployed as part of an ongoing geophysical survey. We find that coiled layouts, which are common in access networks (e.g., slack loops or storage spools), exhibit enhanced sensitivity to incident acoustic waves relative to linear layouts. Modelling indicates this arises from increased broadside sensitivity and reduced destructive interference for longer wavelength acoustic fields over the gauge length. We systematically assess how acquisition parameters, such as source-fibre offset, influence signal‑to‑noise ratio, spectral fidelity, and speech intelligibility of recorded audio. We further show that neural network based denoising strategies improves intelligibility and fidelity of recorded audio, thereby exacerbating privacy concerns.

These findings demonstrate that appropriate interrogation of existing fibre infrastructure - including fibre‑to‑the‑premises links, smart-city infrastructure, and research cables – can function as pervasive, passive wide-area acoustic receivers, creating a pathway for inadvertent or malicious eavesdropping. We discuss practical mitigation strategies spanning survey design, interrogation configuration, and data governance, and argue that the incorporation of privacy‑by‑design into deployment and processing is crucial to leverage the unique benefits of DAS while managing emerging ethical and legal risks.

How to cite: Smith, J. L., Lythgoe, K., Curtis, A., Whitelam, H., Seager, D., Johnson, J., and Belal, M.: Privacy Concerns of DAS: Eavesdropping using Neural Network Transcription, EGU General Assembly 2026, Vienna, Austria, 3–8 May 2026, EGU26-17496, https://doi.org/10.5194/egusphere-egu26-17496, 2026.

EGU26-17601 | Posters on site | SM3.4

Ambient signals analysis and cable coupling characterisation from a DAS experiment offshore South Brittany 

Florian Le Pape, Stephan Ker, Shane Murphy, Philippe Schnurle, Mikael Evain, Pascal Pelleau, Alexis Constantinou, and Patrick Jousset

As fibre-sensing measurements on submarine fibre optic cables become more widely used in geophysical studies, new challenges arise that demand a deeper understanding of the collected data. In particular, characterisation of cable coupling to the seafloor as well as the response of local sediment under the cables is needed for a better quantification of external physical phenomena by fibre-sensing measurements.

FiberSCOPE is a research project aiming to implement an intelligent seabed monitoring system for studies in seismology, oceanography and the positioning of acoustic manmade sources (ships, AUVs, etc.) using existing submarine fiber-optic cables. One of the main objectives of the project is to define tools for remote evaluation of fibre optic cable coupling with the seabed using both Brillouin Optical Time Domain Reflectometry (BOTDR) and Distributed Acoustic Sensing (DAS) measurements of ambient noise.

Within the project’s framework, passive and active seismic experiments were performed during March-April 2025 offshore south Brittany. The experiment included acquiring DAS measurements on the electro-optic cable connecting mainland France to Groix island, combined with the deployment of 10 seismic nodes near the cable. Preliminary results show that although ocean waves dominate the DAS signals, ocean wave induced microseisms events can be extracted as they fluctuate over the 18 days’ of the passive acquisition. Interestingly, despite the short distance covered by the offshore portion of the cable, spatial variations of those events are also observed and seem consistent between cable and nodes measurements. Finally, both ocean waves and microseism signals are used to further quantify the cable coupling with the seafloor and cable response connected to changes in seafloor structure.

How to cite: Le Pape, F., Ker, S., Murphy, S., Schnurle, P., Evain, M., Pelleau, P., Constantinou, A., and Jousset, P.: Ambient signals analysis and cable coupling characterisation from a DAS experiment offshore South Brittany, EGU General Assembly 2026, Vienna, Austria, 3–8 May 2026, EGU26-17601, https://doi.org/10.5194/egusphere-egu26-17601, 2026.

EGU26-18270 | ECS | Posters on site | SM3.4

Assessing the Seismic Sensitivity on a Submarine Optical Fiber Link between Malta and Catania (Sicily, Italy) 

Daniele Caruana, Matthew Agius, André Xuereb, Cecilia Clivati, Simone Donadello, Kristian Grixti, and Irena Schulten

Submarine regions remain sparsely instrumented, limiting the spatial coverage of seismic monitoring in offshore environments. Recent studies have shown that optical fibers, including those actively used for telecommunications, can detect ground motion through laser interferometry. We present an ongoing evaluation of the seismic sensitivity of a 260 km optical fiber link between Malta and Catania, predominantly submerged in the Ionian Sea and continuously carrying internet traffic.

The optical-fiber recordings were analysed for signals corresponding to the arrival times of ~1500 earthquakes listed in the INGV catalogue between January 2023 and March 2025. The waveforms were manually inspected for seismic arrivals and compared to seismic data recorded on nearby land stations on Malta and Sicily. Earthquakes ranging from magnitude 1.4 to 7.9 originating from distance of 3 to 6,000 km were successfully observed. Each event was assigned a category according to signal clarity and confidence, ranging from clearly visible arrivals (category A) to non-detectable signals (category E). Preliminary results indicate that <10% of events fall into category A, 10-15% in category B, 20-25% in category C, 20-25% in category D, and >30% in category E, providing an initial characterisation of the optical-fiber cable’s sensitivity. While a majority of observations fall within lower quality categories (D-E), at least 35% of the analysed events remain robustly identifiable, highlighting the contribution of the submarine fiber to existing land-based seismic networks and extending observational coverage in submarine regions. The sensitivity of the fiber strongly depends on the earthquake magnitude-distance relationship, as expected. We compare our results with previously reported measurements on terrestrial fibers (Donadello, et al., 2024), and show that the Malta-Catania submarine cable can be a reliable new seismic tool for a submarine environment, although recording fewer high-confidence events than onshore systems.

Noise in the fiber exhibits correlations with wind and with daytime anthropogenic activity. This reduces the signal-to-noise ratio and limits the detectability of earthquakes with M<2. Ongoing data acquisition will further refine sensitivity estimates and improve the characterisation of the fiber’s seismic performance.

This study is part of the Horizon Europe–funded SENSEI project, which aims to transform fibre-optic communication networks into distributed sensors for detecting environmental and geophysical signals, improving monitoring and early warning across Europe (Project ID 101189545).

How to cite: Caruana, D., Agius, M., Xuereb, A., Clivati, C., Donadello, S., Grixti, K., and Schulten, I.: Assessing the Seismic Sensitivity on a Submarine Optical Fiber Link between Malta and Catania (Sicily, Italy), EGU General Assembly 2026, Vienna, Austria, 3–8 May 2026, EGU26-18270, https://doi.org/10.5194/egusphere-egu26-18270, 2026.

EGU26-19501 | ECS | Posters on site | SM3.4

 Investigating subsea cable sensing for monitoring of marine life, detection of earthquakes and tsunamis with Research and Education network infrastructure 

Shima Ebrahimi, Layla Loffredo, Alexander van den Hil, and Richa Malhotra

Recent advances in fibre-optic sensing enable subsea telecommunication cables to function as large-scale, distributed environmental sensors. Techniques such as Distributed Acoustic Sensing (DAS), State of Polarisation (SOP), and interferometry transform optical fibres into continuous arrays capable of detecting seismic, acoustic, and environmental signals, offering a complementary, future-proof  approach to sparsely deployed subsea instruments. This study, conducted by SURF, the Dutch National Research and Education Network (NREN), assesses the feasibility of leveraging existing and future subsea fibre-optic network infrastructure for scientific sensing within the research ecosystem. The analysis is based on an extensive data collection effort, including 55 semi-structured interviews with international experts across geoscience, marine science, networking, and technology domains, as well as a targeted survey of research institutions, which received 20 responses from 42 invited experts. Results indicate that dry-plant sensing techniques are sufficiently mature for near-term applications, with DAS enabling kilometre-scale seismic and acoustic monitoring, while SOP and interferometry support long-range sensing over thousands of kilometres. Wet-plant approaches, including SMART cables and Fiber Bragg Grating sensors, provide high-precision measurements at extreme depths but remain limited to new cable deployments due to cost and coordination requirements. Strong alignment is observed with current needs in seismology and geophysics, particularly for offshore seismic monitoring and subsurface deformation studies, while applications in oceanography and marine biology remain exploratory. Data volume, standardisation, and real-time processing emerge as key challenges. Research networking organisations play a critical role in enabling scalable, network-centric earth and ocean observation.

How to cite: Ebrahimi, S., Loffredo, L., van den Hil, A., and Malhotra, R.:  Investigating subsea cable sensing for monitoring of marine life, detection of earthquakes and tsunamis with Research and Education network infrastructure, EGU General Assembly 2026, Vienna, Austria, 3–8 May 2026, EGU26-19501, https://doi.org/10.5194/egusphere-egu26-19501, 2026.

EGU26-20683 | Orals | SM3.4

Distributed acoustic fibre sensing for large scientific infrastructures: ocean microseism at the European XFEL 

Celine Hadziioannou, Erik Genthe, Svea Kreutzer, Holger Schlarb, Markus Hoffmann, Oliver Gerberding, and Katharina-Sophie Isleif and the the WAVE initiative

The WAVE seismic network is a dense, multi-instrument monitoring system deployed on a scientific campus in Hamburg, Germany. It combines seismometers, geophones, and a 19 km distributed acoustic sensing fiber loop installed in existing telecommunication infrastructure. The network covers large-scale research facilities including the European X-ray Free-Electron Laser (EuXFEL) and particle accelerators at DESY. Its primary goal is to characterise natural and anthropogenic ground vibrations and to quantify how these signals couple into ultra-precise measurement infrastructures that are limited by environmental noise. Beyond local applications, WAVE serves as a testbed for fibre-optic sensing concepts relevant to fundamental physics, including seismic and strain monitoring for gravitational wave detection.

The EuXFEL is a femtosecond X-ray light source designed for ultrafast imaging and spectroscopy. Its performance depends critically on precise timing and synchronisation of the electron bunches along the linear accelerator. Measurements of bunch arrival times reveal significant noise contributions in the 0.05–0.5 Hz frequency band, with peak-to-peak timing jitter of up to 25 femtoseconds. Using distributed acoustic sensing data, we demonstrate that this jitter is largely explained by secondary ocean-generated microseism, which is identified as a significant limiting factor for stable, high-precision XFEL operation in the sub-Hz regime. 

To assess the potential for prediction and mitigation, we investigate whether ocean wave activity in the North Atlantic can be used to anticipate microseismic signals observed at the EuXFEL site. Output from the WAVEWATCH III ocean wave model is used to generate synthetic Rayleigh wave spectrograms with the WMSAN framework. These are compared to seismic observations at the EuXFEL injector. By subdividing the North Atlantic into source regions, we evaluate their relative contributions to the observed seismic wavefield. While absolute amplitude prediction remains challenging, the modelling reproduces key spectral characteristics and temporal variability.

Our results demonstrate that combining dense fibre-optic sensing with physics-based ocean wave modelling provides a framework to characterise microseismic noise and assess its limiting impact on high-precision experiments. This approach supports noise mitigation efforts at high-precision accelerator facilities and is directly relevant to future ground-based gravitational wave detectors.

How to cite: Hadziioannou, C., Genthe, E., Kreutzer, S., Schlarb, H., Hoffmann, M., Gerberding, O., and Isleif, K.-S. and the the WAVE initiative: Distributed acoustic fibre sensing for large scientific infrastructures: ocean microseism at the European XFEL, EGU General Assembly 2026, Vienna, Austria, 3–8 May 2026, EGU26-20683, https://doi.org/10.5194/egusphere-egu26-20683, 2026.

EGU26-21683 | Posters on site | SM3.4

Leveraging Railway Fiber-Optic Networks with DAS: Multi-Scale Opportunities 

Pascal Edme, Daniel Bowden, Frederick Massin, Anne Obermann, sanket Bajad, John Clinton, and James Fern

Distributed Acoustic Sensing (DAS) enables the acquisition of seismic data with unrivalled spatio-temporal resolution over very large distances. Railway fiber-optic networks, originally deployed for telecommunications, offer cost-effective opportunities to monitor and characterize the subsurface at multiple scales. Here, we present a project conducted with the Swiss Federal Railways (SBB) involving the interrogation of dark fibers running along two perpendicular railway tracks, each approximately 40 km long. Data were acquired over three months using a dual-channel Sintela Onyx interrogator, with variable acquisition setups (spatial sampling, gauge length, and sampling frequency) tailored to different scientific objectives described below.

The primary objective was to assess the feasibility of using pre-existing telecommunications fibers for structural track-bed monitoring, specifically shallow subsurface Vs characterization through inversion of Rayleigh-wave dispersion curves (MASW). This requires high spatial sampling and short gauge length (3 m and 6 m, respectively) to capture short wavelengths. Several ambient noise interferometry strategies were tested, including stacking (1) all available time windows with various preprocessing schemes, (2) only time windows exhibiting strong directional wavefields, and (3) a coherent-source subsampling approach based on a Symmetric Variational Autoencoder to identify time windows contributing the most useful seismic energy. Unsurprisingly, trains constitute the most energetic and reliable seismic sources, from which dense Vs profiles can be derived, demonstrating the effectiveness of both the processing and inversion workflows.

Beyond shallow characterization, the experiment also yielded valuable data to complement dense nodal arrays deployed near Lavey-les-Bains, a site of significant geothermal interest and complex geological structure. The main objectives in this context are to (1) help characterizing the subsurface over the first kilometers, (2) investigate its relationship to geothermal circulation, (3) evaluate the joint use of dense nodal and DAS data for imaging, and (4) establish a high-quality, open-access dataset to support the development of next-generation passive imaging methodologies.

Finally, at an even larger scale, the experiment provided the opportunity to explore how DAS data can be leveraged within the operational Swiss Seismological Service (SED) network and to assess whether DAS can augment standard seismicity catalogues. Lower-resolution data (100 m spatial sampling, 200 Hz sampling frequency) were streamed and converted in real time into standard seismic formats (miniSEED and StationXML), demonstrating the feasibility of integrating DAS data into SeisComP for both automatic and manual processing.

We will present the dataset along with key results relevant to the three purposes outlined above.

We acknowledge Allianz Fahrbahn (grant agreement No. 100 072 202) for enabling this study.

How to cite: Edme, P., Bowden, D., Massin, F., Obermann, A., Bajad, S., Clinton, J., and Fern, J.: Leveraging Railway Fiber-Optic Networks with DAS: Multi-Scale Opportunities, EGU General Assembly 2026, Vienna, Austria, 3–8 May 2026, EGU26-21683, https://doi.org/10.5194/egusphere-egu26-21683, 2026.

EGU26-1349 | Posters on site | SSS6.1

Modeling Saline Soil Remediation Using the Surface Evaporation Capacitor Approach. 

Uri Nachshon, Rotem Golan, and Roee Katzir

Soil salinization is a pervasive problem in arid environments, frequently exacerbated by anthropogenic activities. Remediation commonly involves soil leaching through natural precipitation or controlled, human-made flooding events. Accurate prediction of solute transport during these leaching processes is complex, as it is controlled by soil physical and hydraulic properties, climatic conditions, evaporation rates, and the volume and timing of infiltration. Precise physically-based numerical models are necessary for exact descriptions but demand detailed input regarding soil and environmental parameters.

This study examines a simplified, physically-based alternative: the Surface Evaporation Capacitor (SEC) concept proposed by Or and Lehmann in 2019. Originally developed to predict soil porewater evaporation, the SEC model posits that porewater shallower than the soil capillary length is consumed by surface evaporation, while deeper porewater remains protected from this process.

We adopt the SEC concept to estimate solute dynamics within the vadose zone and predict long-term salt accumulation profiles. By integrating soil capillary length, ambient evaporation, and the depth of natural or artificial wetting, the SEC allows for a simple determination of salt fate, specifically estimating the leaching depth required to prevent salinization in the root zone and near the surface.

We validated the SEC approach by comparing its predictions against detailed field measurements collected in a super-arid region of Israel, alongside results from a detailed physically-based numerical model. Results confirm the Evaporation Capacitor Model's validity as an accurate proxy for estimating annual solute dynamics and salt accumulation in saline soils. While the complex numerical model provides exact temporal descriptions, the simplified SEC model offers an accurate  and easily implementable net estimation of salt transport, making it highly valuable for large-scale practical remediation assessment and management.

How to cite: Nachshon, U., Golan, R., and Katzir, R.: Modeling Saline Soil Remediation Using the Surface Evaporation Capacitor Approach., EGU General Assembly 2026, Vienna, Austria, 3–8 May 2026, EGU26-1349, https://doi.org/10.5194/egusphere-egu26-1349, 2026.

EGU26-2306 | ECS | Orals | SSS6.1

Size effects of desiccation cracking behavior in clayey soil 

Zhaolin Cai, Qing Cheng, Chao-Sheng Tang, Xin-Lun Ji, Jin-Jian Xu, Ying-Dong Gu, and Bin Shi

Desiccation cracking significantly impacts the engineering properties of soils, influencing fluid infiltration and structural stability. A key phenomenon in desiccation cracking is the size effect, where soil dimensions, including thickness and radius, alter cracking behavior. However, the size effect remains poorly understood, particularly in linking laboratory-scale findings to field conditions. Existing studies are often limited to small laboratory samples, leading to discrepancies in crack behavior across scales and a lack of standardized guidelines for determining suitable sample sizes in laboratory tests. This study investigates the size effect on desiccation cracking in clayey soils and identifies suitable laboratory sample sizes to represent field-scale cracking patterns. Desiccation tests were performed on soil samples with varying radii (25-100 mm) and thicknesses (5-18 mm). Cracking behavior during drying and equilibrium-state crack patterns were analyzed. A size parameter (λ), defined as the ratio of sample radius to thickness, was introduced to characterize the soil's volumetric size. Results reveal three distinct stages of the size effect: (i) the crack-free stage (λ <λc), with no visible cracks; (ii) the size-dependent stage (λc <λ <λt​), where cracking behavior changes significantly; and (iii) the size-insensitive stage (λ >λt​), where crack parameters stabilize. Two critical size parameters, the critical cracking size (λc ≈4.0) and the transition size (λt ≈9.0), were identified. The proposed size thresholds (λc and λt​) were found to be applicable across different clayey soils, suggesting the general relevance of the framework for scaling desiccation cracking behavior in diverse geotechnical contexts. These findings enhance the understanding of size effects and provide a framework for optimizing laboratory tests to better reflect field conditions.

How to cite: Cai, Z., Cheng, Q., Tang, C.-S., Ji, X.-L., Xu, J.-J., Gu, Y.-D., and Shi, B.: Size effects of desiccation cracking behavior in clayey soil, EGU General Assembly 2026, Vienna, Austria, 3–8 May 2026, EGU26-2306, https://doi.org/10.5194/egusphere-egu26-2306, 2026.

EGU26-2422 | ECS | Posters on site | SSS6.1

Modeling reference water vapor adsorption in desert soils 

Mulugeta Weldegebriel Hagos, Dilia kool (RIP), and Nurit Agam

Non-rainfall water inputs (NWRIs; i.e., dew, fog, and water vapor adsorption (WVA)) are significant sources of water in arid environments. Amongst all NRWIs, WVA is likely the most common, yet it is the least studied. There is increasing evidence that water vapor adsorption occurs in many arid and hyper-arid regions, that together occupy 26% of the earth’s terrestrial surface. Quantifying WVA is therefore essential to fully understand the water cycle in these regions. While some studies quantified WVA as a function of the surface properties, they were either laboratory trials or limited to a specific location. No studies, to date, have presented a general model to quantify WVA. Given the complexity of the process, we propose an initial step towards bridging this knowledge gap, with the introduction of a new “reference water vapor adsorption” (Ao). Ao is the adsorption of water vapor from the atmosphere to a reference surface, conceptually similar to the “reference evapotranspiration” (ETo) that quantifies the evapotranspiration rate from a reference surface. We propose to calculate Ao as Ao = raCp(ea-es)/lgra where ρa is the density of air, Cp is the specific heat capacity of air, ea and es are the water vapor pressure in the air and in the air-filled pores, respectively, γ is the psychrometric constant, and ra is the aero dynamic resistance. Assuming a completely dry surface (similarly to assuming well-watered crop to calculate ETo), es is set to zero. To test this new concept, we conducted measurements in the Negev desert, Israel, from July to October 2025. Ao was calculated from continuous measurements of temperature and relative humidity at 2m height, and wind speed at two heights (3 and 0.8 m). In parallel, Ao was directly measured every two hours during multiple 24-h campaigns by exposing dry silica gel to the atmosphere. The calculated Ao followed closely the trend of measured Ao, encouraging further development of this index, and potentially allowing mapping of reference adsorption based on simple meteorological measurements.

How to cite: Hagos, M. W., kool (RIP), D., and Agam, N.: Modeling reference water vapor adsorption in desert soils, EGU General Assembly 2026, Vienna, Austria, 3–8 May 2026, EGU26-2422, https://doi.org/10.5194/egusphere-egu26-2422, 2026.

EGU26-7438 | Orals | SSS6.1

The effect of soil macro-structure on bare soil evaporation 

Frederic Leuther, Mathilde Nielsen, and Efstathios Diamantopoulos

Evaporation of soil water is often characterised by water losses over time for a defined soil volume where soils are assumed to be homogeneous in texture and structure. In this study, we hypothesised that evaporation depends not only on climatic conditions, soil texture, and soil hydraulic properties but also on the soils’ macro-structure. Specifically, that the different distribution of air-filled macropores, stones, and the connectivity of soil matrix will affect bare soil evaporation and herewith the transition from stage 1 to stage 2 evaporation. In a climate constant room, we measured evaporation characteristics of undisturbed soil cores taken under various land uses and soil textures (clay and sandy loam) and compared the evaporation rates to columns with sieved soil repacked to the same bulk density. Tensiometers installed in two different depth provided information about the hydraulic gradient along the columns, while weight measurements continuously recorded the mass loss. Soil structure of undisturbed columns was determined by X-ray computed tomography (X-ray µCT) at a voxel size of 50 µm. In addition, we evaluated the effect of macro-structure on bare soil evaporation for unsaturated condition, i.e. visible porosity was air-filled, by 3D image-based simulations using HYDRUS 3D.  The lab study showed that the well-sorted repacked samples lost significantly more water as the undisturbed samples. The differences cannot be explained by the total porosity and thus the total water reservoir. When using the time, the hydraulic gradient along the undisturbed columns was exponentially increasing, it was shown that the well-connected macropore volume could explain most of the evaporation characteristics. In addition, the presence of denser soil clods significantly shortened the time to build up the gradient. Neither stone nor particulate organic matter content had a significant effect on evaporation characteristics. The 3D image-based simulation indicated that air-filled macropores act as barriers for upward water flow and that the loss of water was limited by the connectivity of the soil matrix. It can be concluded that not only soil texture effects bare soil evaporation but also the soil macro-structure.

How to cite: Leuther, F., Nielsen, M., and Diamantopoulos, E.: The effect of soil macro-structure on bare soil evaporation, EGU General Assembly 2026, Vienna, Austria, 3–8 May 2026, EGU26-7438, https://doi.org/10.5194/egusphere-egu26-7438, 2026.

EGU26-10739 | ECS | Posters on site | SSS6.1

Evaluation of the volume of influence of four tubular capacitive probes 

Amelia Bellosta-Diest, Miguel Echeverría, and Miguel Ángel Campo-Bescós

Efficient water management is a critical challenge in agriculture, particularly in regions such as Navarra, Spain, where irrigation accounts for up to 87% of total freshwater consumption. Capacitive soil moisture probes are widely adopted in precision agriculture; however, a notable inconsistency persists between the sensing ranges claimed by manufacturers (typically 5–15 cm) and those reported in the scientific literature (generally <6 cm). This discrepancy arises largely from the absence of standardized criteria to define the effective sensing volume of these sensors.

This study presents a replicable empirical methodology to characterize the volume of influence of four commercially available capacitive probes: AquaCheck, EnviroPro, Gerbil, and Sentek. Controlled laboratory experiments were conducted under air and water conditions, using 0.2 mm paper layers to incrementally simulate increasing distances from the moisture source. Sensor outputs were normalized to enable direct comparison across heterogeneous measurement units, including Volumetric Water Content (VWC%) and Scaled Frequency Units (SFU%).

All probes exhibited a logarithmic decrease in signal intensity with increasing distance from the water source. By modeling the sensing domain as a cylindrical volume with a 10 cm height and defining its effective extent at the 99.5th percentile of cumulative signal response, substantial differences among probes were observed. The estimated sensing volumes ranked as follows: Gerbil (710.59 cm³), EnviroPro, AquaCheck, and Sentek (236.71 cm³).

The results demonstrate that sensing volumes vary considerably among manufacturers and are strongly dependent on the percentile threshold used to define the effective volume of influence. These findings confirm the lack of uniformity in probe sensing behavior and underscore the need for technical standardization. Although derived from controlled laboratory conditions and therefore comparative in nature, the results provide critical insight for interpreting soil moisture measurements and offer a more reliable technical basis for informed decision-making in irrigation management.

How to cite: Bellosta-Diest, A., Echeverría, M., and Campo-Bescós, M. Á.: Evaluation of the volume of influence of four tubular capacitive probes, EGU General Assembly 2026, Vienna, Austria, 3–8 May 2026, EGU26-10739, https://doi.org/10.5194/egusphere-egu26-10739, 2026.

EGU26-13322 | Posters on site | SSS6.1

Scale Dependence of Soil Hydraulic Properties Obtained from Evaporation Experiments: Effect of Sample Height 

Prabhudutta Khatua, Jannis Bosse, Bhabani S. Das, Wolfgang Durner, and Sascha C. Iden

Climate-induced droughts and increasingly erratic precipitation patterns are stressing water resources and underscore the need for a better understanding of soil water flow and storage. Soil hydraulic properties, in particular the water retention curve and the hydraulic conductivity curve, are fundamental inputs for predicting soil water dynamics and for simulating variably-saturated flow with the Richards equation. The simplified evaporation method is a common laboratory technique for estimating SHP. It relies on linearization assumptions that introduce only negligible errors when sample heights are small. While a handful of theoretical studies have addressed how sample height affects SHP estimates, a systematic experimental assessment of this scale-dependence is still lacking.

We performed evaporation experiments on packed soil columns (5, 10 and 15 cm high) using both a sandy and a silty soil. Throughout each run, we recorded column mass to track water content and evaporation rate, and we measured matric potential with mini-tensiometers.  Applying the simplified evaporation method, we derived point data for the water retention curve and hydraulic conductivity curve. A flexible model which accounts for capillary and non-capillary storage and flow was fitted to the data using the program SHYPFIT. Inverse simulations with Hydrus-1D were then applied to assess the influence of sample height without relying on the assumptions of the simplified evaporation method. This allowed to discriminate between an actual scale-dependence of soil hydraulic properties and differences which are caused by the assumptions of the simplified evaporation method.

Our findings reveal that column height has a minimal impact on the water retention curve, with a tendency of a slight broadening of the pore size distribution and a modest increase in residual water content. The effect on hydraulic conductivity was even less pronounced. The results of inverse simulations substantially attenuate these height-related discrepancies in soil hydraulic properties, leaving only marginal differences.

How to cite: Khatua, P., Bosse, J., Das, B. S., Durner, W., and Iden, S. C.: Scale Dependence of Soil Hydraulic Properties Obtained from Evaporation Experiments: Effect of Sample Height, EGU General Assembly 2026, Vienna, Austria, 3–8 May 2026, EGU26-13322, https://doi.org/10.5194/egusphere-egu26-13322, 2026.

EGU26-14166 | Orals | SSS6.1

Multifractal fingerprints of rain events on soil moisture and respiration in a Mediterranean grassland 

Ernesto Sanz, Victor Cicuendez, Rosa M. Inclán, Carlos Yagüe, and Ana M. Tarquis

Mediterranean grasslands operate near the edge of water limitation and are strongly driven by short, discrete rainfall events. Yet, we still know little about how the event-scale dynamics of soil moisture (SWC), soil temperature (ST) and soil respiration (reorganize between wet and dry years. Here we use multifractal detrended fluctuation analysis (MFDFA) on time series in El Escorial (central Spain) to characterise post-rain dynamics in two contrasting years: a relatively wet year (2022) and a dry year (2024). We focus on April (spring) and September (), and six series and interactions of the soil–plant–atmosphere system: SWC, ST, CO₂ and the pairs SWC–ST, SWC–CO₂, ST–CO₂. For each post-rain window (several days after individual events) we quantify for these six series, and compare their behaviour across seasons and years.

In April 2022, Δα is moderate and H2 shows a stable, moisture-dominated backbone: SWC–SWC and SWC–ST are highly persistent, while CO₂–CO₂ and ST–CO₂ are often antipersistent while still moderately multifractal, indicating that CO₂ acts mainly as a reactive signal to water and temperature. In April 2024, Δα increases markedly for CO₂–CO₂ and SWC–CO₂, and their H2 shifts towards stronger persistence, while ST–CO₂ becomes more antipersistent. This points to a reorganisation whereby, under early-season water stress, carbon–moisture couplings become the main carriers of complexity and memory, and ST becomes a more reactive pathway. In September 2022, multifractality remains moderate but a strongly negative asymmetry in SWC–SWC and SWC–CO₂ reveals sharp rewetting and respiration pulses driven by soil moisture. In September 2024, Δα becomes very high for SWC–SWC, SWC–ST and CO₂–CO₂, with H2 ≈ 0.9–1.0 for SWC–SWC, SWC–ST and CO₂–CO₂, while asymmetry shifts: extremes move from moisture-dominated (negative in SWC–CO₂) to carbon-dominated (positive in CO₂–CO₂) and ST–CO₂ becomes strongly antipersistent.

In conclusion, these results show that using SWC, ST and and their interactions it is possible to identify distinct post-rain “modes” of ecosystem functioning: (1) a wet-year regime with a persistent SWC–ST backbone and moisture-driven pulses, and (2) a dry-year regime where long-range memory strengthens in SWC–ST–CO₂ but extremes and intermittency shift into the carbon subsystem, indicating loss of hydrological buffering and increased carbon–thermal stress after rainfall events. Such event-scale indicators could be used to inform adaptive grassland and land management strategies in Mediterranean regions, by identifying when ecosystems are approaching critical thresholds of water and carbon stress.

Acknowledgement: This paper is part of the project Clasificación de Pastizales Mediante Métodos Supervisados—SANTO, from Universidad Politécnica de Madrid (project number: RP220220C024). And funded by the European Union. Views and opinions expressed are however those of the author(s) and do not necesarily reflect those of the European Union or European Research Executive Agency (REA). Neither the European Union nor the granting authority can be held responsible for them.

How to cite: Sanz, E., Cicuendez, V., Inclán, R. M., Yagüe, C., and Tarquis, A. M.: Multifractal fingerprints of rain events on soil moisture and respiration in a Mediterranean grassland, EGU General Assembly 2026, Vienna, Austria, 3–8 May 2026, EGU26-14166, https://doi.org/10.5194/egusphere-egu26-14166, 2026.

EGU26-14368 | ECS | Orals | SSS6.1

Development of an in situ monitoring system for tracking solutes and gas emissions in soil 

Luciano Melo Silva, Simon Schwingenschuh, Minsu Kim, Jens Weber, Christian Holeček, Thomas Birngruber, Bettina Weber, and Stefanie Maier

Soil is a complex medium that supports numerous biological and chemical processes across multiple phases. The transformation of inorganic and organic compounds can lead to the accumulation of harmful substances in soil and the emission of reactive gases that affect air quality and climate. However, quantitative measurements remain limited by the lack of methods for in situ monitoring of multiphase processes and by approaches restricted to one or a few compounds at a time, measured either in the liquid or the gas phase. Thus, gaps persist in quantifying and monitoring transformation processes occurring at the gas-liquid interface.

Here, we describe a newly developed method to continuously measure gas fluxes and solute concentrations in soil by coupling a dynamic gas flux chamber (DC) with an open-flow microperfusion (OFM) technique, hereafter termed OFM-DC. The latter OFM method had previously been applied in medicinal research for drug development, and we have optimized it for the utilization in soil. OFM enables the continuous sampling and concentration measurement of soil solutes (e.g., microbial metabolites) in both laboratory and field settings, whereas DC quantifies soil trace-gas emissions (e.g., CO2, NOx, and HONO) over time.

We will present first experiments using the novel setup with synthetic soil systems that have characterized microbial activity and chemical properties. Our case studies on in situ measurements of microbial nitrogen (N) processes and reactive N gas (NO, HONO) emissions reveal the effectiveness of our methods for investigating multiphase soil transformation mechanisms under dynamic soil water conditions.

The OFM–DC measurement setup demonstrates its potential for long-term field monitoring of soil–air quality and the related impacts on planetary health. The obtained data can support improved soil management, which in turn can minimize soil degradation and trace-gas emissions.

How to cite: Melo Silva, L., Schwingenschuh, S., Kim, M., Weber, J., Holeček, C., Birngruber, T., Weber, B., and Maier, S.: Development of an in situ monitoring system for tracking solutes and gas emissions in soil, EGU General Assembly 2026, Vienna, Austria, 3–8 May 2026, EGU26-14368, https://doi.org/10.5194/egusphere-egu26-14368, 2026.

EGU26-16325 | Posters on site | SSS6.1

Differences in soil water retention properties and plant available water below trees and grasses in a Mediterranean savanna 

Max Wittig, Sinikka J. Paulus, Gerardo Moreno, Arnaud Carrara, Laura Nadolski, Anke Hildebrandt, and Sung-Ching Lee

Feedback loops between plants and soil shape and stabilize plant communities. In savanna-like landscapes, which are common in arid and semi-arid regions, trees and grasses coexist at close spatial scales. These different growth forms can influence soil formation and properties within just a few meters of each other.

In this study, we investigate soil hydraulic properties in an extensively managed Holm oak savanna-like ecosystem (Dehesa) in central Spain by comparing soils beneath trees and in adjacent open grass areas. We analyze saturated hydraulic conductivity, soil water characteristic curves, derived parameters such as field capacity and permanent wilting point, and associated soil texture and organic carbon content. In addition, we analyze a 10-year time series of in situ soil water content and micrometeorological variables within microhabitats to determine whether differences in the static properties also translate into water availability differences within the ecosystem.

On average, the topsoil below trees contained 6.2% more pore space within the range of plant-available water than the topsoil below open grass areas. This was associated with, and likely driven by, higher levels of organic carbon beneath the trees. There was no significant difference in clay content between the two microhabitats. 

However, field observations of soil moisture showed high heterogeneity, with the soil beneath the trees not remaining significantly wetter than in the open area despite the higher storage capacity and reduced radiative energy input due to shading. Data from two eddy covariance towers showed that, unlike grasses, trees sustain transpiration throughout the year, suggesting enhanced water uptake near the trunk.

Together, these results illustrate how different vegetation types affect the same soil just a few metres apart. They also show that, although trees increase soil water storage capacity, it remains unclear whether this positive effect is offset by the large amounts of water extracted by trees and higher interception losses, ultimately leading to the soil being similarly dry beneath trees as in the open area during the Mediterranean summer.

How to cite: Wittig, M., Paulus, S. J., Moreno, G., Carrara, A., Nadolski, L., Hildebrandt, A., and Lee, S.-C.: Differences in soil water retention properties and plant available water below trees and grasses in a Mediterranean savanna, EGU General Assembly 2026, Vienna, Austria, 3–8 May 2026, EGU26-16325, https://doi.org/10.5194/egusphere-egu26-16325, 2026.

EGU26-16443 | Orals | SSS6.1

The International Soil Moisture Network (ISMN): A data service providing free access to in situ observations 

Matthias Zink, Tunde Olarinoye, Fay Böhmer, Kasjen Kramer, and Wolgang Korres

Soil moisture is a key variable impacting land–atmosphere interactions, hydrological extremes, ecosystem processes, and agricultural productivity among others. Reliable in situ observations are essential for understanding soil moisture dynamics and for evaluating satellite-based products and land surface models. However, ground-based soil moisture measurements are often scattered across independent networks and remain difficult to access in a harmonized form. The International Soil Moisture Network (ISMN) was established to overcome these limitations by providing a global, freely-accessible repository of quality-controlled in situ soil moisture observations. Its mission is to support Earth system science, remote sensing validation, and model development through standardized and traceable soil moisture data.

The ISMN collects soil moisture time series from a wide range of regional, national, and international monitoring networks. Contributing datasets are harmonized in terms of format, metadata, and temporal resolution and undergo a consistent quality control procedure. The database includes multi-depth measurements across diverse climates, land cover types, and soil conditions, complemented by ancillary site information. Data are distributed through a dedicated web interface (https://ismn.earth), enabling efficient data discovery and use for large-scale and local studies.

Ongoing efforts are focusing on expanding the database by incorporating additional stations and data providers from institutional or governmental sources, as well as enhancing data quality and consistency to support more robust long-term analyses. Further resources are directed towards fortifying the operational system and improve usability to better serve our users. Beyond research applications, the ISMN increasingly contributes to the data-to-value chain of international initiatives that are led by the World Meteorological Organization (WMO), the Food and Agriculture Organization (FAO), and the Global Climate Observing System (GCOS). One example is the contribution of ISMN data to WMO’s annual State of the Global Water Resources report, supporting global assessments of hydrological conditions.

How to cite: Zink, M., Olarinoye, T., Böhmer, F., Kramer, K., and Korres, W.: The International Soil Moisture Network (ISMN): A data service providing free access to in situ observations, EGU General Assembly 2026, Vienna, Austria, 3–8 May 2026, EGU26-16443, https://doi.org/10.5194/egusphere-egu26-16443, 2026.

Soil salinization dynamics are driven by complex interactions among climatic conditions, hydrological processes, and anthropogenic activities. Due to this complexity, traditional single global models often struggle to capture spatial heterogeneity, leading to high prediction uncertainty and limited robustness at the pixel scale.

To address these challenges, this study proposes a multi-source data-driven framework based on environmental similarity matching to enhance prediction adaptability in heterogeneous environments. We compiled a dataset of approximately 35,000 topsoil samples from arid and semi-arid regions and constructed a multidimensional covariate system grounded in soil-forming factor theory. The framework comprises three components: (1) heterogeneity-based stratification, partitioning samples by climate and land use; (2) model library construction, developing candidate machine learning ensembles within each stratum via repeated cross-validation; and (3) similarity-based prediction, which employs Gower distance to quantify environmental similarity between target locations and training samples to select the optimal model.

Evaluations indicate that the Random Forest algorithm exhibits robust stability across stratified regions. Compared to single models, the environment similarity–constrained selection strategy significantly improved performance in heterogeneous regions; notably, the coefficient of determination (R2) in arid cropland areas increased from 0.748 to 0.807. Feature contribution analysis supports the necessity of stratified modeling, revealing that soil salinity in arid regions is primarily driven by vegetation variables and geographic, whereas remote sensing indices and soil pH dominate in semi-humid regions. The methodological framework developed in this study provides a new approach for high-precision soil salinity mapping.

KEYWORDS: Soil salinization; Environmental similarity; Heterogeneous environments; Machine learning.

How to cite: She, X., Frankl, A., and Luo, G.: Soil salinization prediction for heterogeneous environments: an environmental similarity–based modeling framework, EGU General Assembly 2026, Vienna, Austria, 3–8 May 2026, EGU26-16578, https://doi.org/10.5194/egusphere-egu26-16578, 2026.

Numerous reviews and meta-analyses have examined the vast body of literature evaluating the impact of the different agricultural soil preparation or of the various steps of cultural itinerary on plant growth, water regulation, carbon storage, etc… in short, on soil functions and services, which inherently depends on the soil processes occurring at the pore scale.

For example, the largest pores in the soil (macropores) significantly contribute in regulating the soil water cycle, as they improve infiltration capacity and drainage rates. There is however limited knowledge about the interactions between initial and boundary conditions with the topology and geometry of macropore networks in natural soils, and their influence on water flow. More long-term monitoring data, and dynamic experimentations, are needed to evaluate and model the impact of agricultural management practices on the soil resilience to maintain its functions.

One method to quantify the arrangement and the size distribution of the soil macropore network is X-ray computed tomography (X-ray CT), which is now routinely used world-wide. Images acquisition, pre- and post-processing, and pore structure quantification protocols are increasingly refined and tending towards standardization, thereby contributing to shared and comparable knowledge.

We initiated a research project aiming at monitoring the soil macropore network in agricultural soil and evaluate its response to different management practices (tillage recovery and multispecies cover cropping) using X-ray CT. We are developing a sampling device to extract soil samples (100 cm³) for analysis with X-ray µCT at time zero, after which the samples will be reinserted and embedded into the field for a six-months period before being extracted again. This process will be repeated at least four times.

We hypothesize that tillage, occurring above the sample, where it creates a connected isotropic soil pore structure with a low spatial extent, will modify the living and biochemical equilibrium of the soil and therefore modify the macropore network inside the sampling cylinder, located below the plough pan. On the opposite, we estimate that resistant macropore would remain when no tillage is applied, with an increased resistance under a covered soil. We also hypothesize that persistent macropore network is preferentially used by the main plant roots, as the macropores network created by roots is also the primary contributors of the network connectivity.

The experimental set up will be installed in the field in February 2026 for a short-term trial involving monthly sample extractions in order to assess the feasibility and accuracy of the method. The study per se will be conducted afterwards.  We will present the encountered challenges with this initial trial as well as the first quantifications of temporal changes of the soil macropore network with time.

Sarah Smet, as a post-doctoral research fellow, acknowledges the support of the National Fund for Scientific Research (Brussels, Belgium).

How to cite: Smet, S.: Challenges in monitoring the undisturbed top soil pore scale structure of an agricultural field, EGU General Assembly 2026, Vienna, Austria, 3–8 May 2026, EGU26-17900, https://doi.org/10.5194/egusphere-egu26-17900, 2026.

EGU26-18251 | Posters on site | SSS6.1

Between two Furrows: Soil bulk density from Non-Invasive Seismology 

Maria Tsekhmistrenko, Joe Collins, Jeroen Ritsema, Simon Jeffery, and Tarje Nissen-Meyer

Soil is a critical resource for global food security, yet conventional physical soil analyses, remote sensing and geophysical methods are often labour-intensive and time-consuming. This study explores the potential of ultra-high-frequency (>500 Hz) hammer-source seismology to characterise soil physical properties at the decimetre scale.

Field experiments were conducted within a long-term trial near Harper Adams University (UK) comparing Conservation and Conventional agricultural practices. Two 1.5 m transects were surveyed in each treatment using 16 geophones, with soil samples collected at matching horizontal resolution. P-wave velocity (vp) was estimated in the upper 40 cm of the soil profile and compared with bulk density derived from physical samples.

Results show a strong and statistically significant correlation between vp and bulk density. This relationship is consistent throughout the depth profile, with good agreement between seismic velocity images and interpolated bulk-density measurements from soil cores. The findings demonstrate that ultra-high-frequency seismic methods can reliably resolve small-scale soil structure relevant to agricultural management.

Our results indicate that ultra-high-frequency seismic analysis is a promising and cost-effective approach for estimating soil bulk density. This technique has clear potential to support agronomic and land-management decision making.

How to cite: Tsekhmistrenko, M., Collins, J., Ritsema, J., Jeffery, S., and Nissen-Meyer, T.: Between two Furrows: Soil bulk density from Non-Invasive Seismology, EGU General Assembly 2026, Vienna, Austria, 3–8 May 2026, EGU26-18251, https://doi.org/10.5194/egusphere-egu26-18251, 2026.

EGU26-18983 | Posters on site | SSS6.1

Virtual Soil Simulator -  unsaturated pore media water transport model including film flow and isothermal vapor transport phenomena 

Krzysztof Lamorski, Maciej Kozyra, and Cezary Sławiński

Simulation of unsaturated water movement in porous media has conventionally been based on the Richards equation (RE), coupled with hydraulic conductivity functions that account solely for capillary-driven liquid flow. This approach, however, overlooks the presence of thin water films adsorbed on solid surfaces, which may contribute appreciably to transport processes under moderately dry to dry conditions. Recent advances, particularly the Peters–Durner–Iden (PDI) framework, enable a physically consistent representation of film flow and isothermal vapor diffusion within formulations of unsaturated hydraulic conductivity.

In this work, we introduce the Virtual Soil Simulator, a finite-volume, OpenFOAM-based implementation of the RE augmented with the PDI model to explicitly represent capillary, film, and vapor transport processes. Model performance was assessed using a suite of benchmark tests with analytical or well-established numerical reference solutions, including one-dimensional infiltration, infiltration under steep hydraulic gradients, and two-dimensional nonlinear infiltration scenarios. The results demonstrate high numerical accuracy and robust mass conservation.

The applicability of the model is further demonstrated through two case studies. In the first, inverse simulation of a 12-day soil core drying experiment showed that the classical RE formulation reproduced measurements only during the early, wet stage, whereas the PDI-enhanced model remained consistent with observations over the entire drying period and accurately represented regimes dominated by film and vapor flow. In the second case, a synthetic desaturation analysis conducted across 467 soil types indicated that film flow markedly accelerates drainage, with significant effects persisting even at comparatively high pressure heads (−10 m). These findings indicate that neglecting film flow leads to systematic underestimation of unsaturated hydraulic conductivity and distorted predictions of drying and drainage behavior. Moreover, simulations at very low pressure heads emphasize that reliable representation of transport processes requires the combined consideration of both film and vapor fluxes.

Acknowledgments

This research was founded by the National Science Centre within contract 2021/43/B/ST10/03143.

How to cite: Lamorski, K., Kozyra, M., and Sławiński, C.: Virtual Soil Simulator -  unsaturated pore media water transport model including film flow and isothermal vapor transport phenomena, EGU General Assembly 2026, Vienna, Austria, 3–8 May 2026, EGU26-18983, https://doi.org/10.5194/egusphere-egu26-18983, 2026.

EGU26-19707 | Orals | SSS6.1

Contrasting perspectives on soil evaporation in soil science and land surface modelling 

Jan De Pue, José Miguel Barrios, William Moutier, and Françoise Gellens-Meulenberghs

Soil evaporation is an essential component of the hydrological cycle. Within soil science, the fundamental mechanisms involved in soil evaporation are well-documented. However, within the realm of land surface modelling, the coarse spatial and temporal scale, as well as the computational limitations result in a simplified representation of this highly non-linear process.
Here, we evaluated the current representation of soil evaporation within the RMI evapotranspiration (ET) and surface turbulent fluxes (STF) model applied in the frame of  the EUMETSAT Satellite Applications Facility  (LSA)  on support to Land Surface Analysis (SAF) (http://lsa-saf.eumetsat.int/). This model is used to produce remote-sensing based estimates of the fluxes, using Meteosat Second Generation (MSG) observations. With 30 minutes interval, estimates of these fluxes are provided in near real time, resulting in a data record that spans over 20 years.
We highlighted the discrepancies between the simplified representation of soil evaporation and the soil physical solution. To achieve this, synthetic experiments were performed using Hydrus as a reference for comparison with the LSA SAF ET-STF model. Additionally, a comparison was made with formulations in other land surface models (Surfex, ECLand & GLEAM), the resulting texture-dependent bias was demonstrated and impact of sub-grid heterogeneity was shown. Finally, an updated formulation was tested in large-scale ET simulations and evaluated using in situ observations.
Though widely recognised as one of the fundamental processes in the hydrological cycle, the perspective on soil evaporation is very different in soil physics compared to land surface modelling. Here, we attempted to harmonize both approaches in a pragmatic manner.

How to cite: De Pue, J., Barrios, J. M., Moutier, W., and Gellens-Meulenberghs, F.: Contrasting perspectives on soil evaporation in soil science and land surface modelling, EGU General Assembly 2026, Vienna, Austria, 3–8 May 2026, EGU26-19707, https://doi.org/10.5194/egusphere-egu26-19707, 2026.

EGU26-19852 | ECS | Orals | SSS6.1

 Resolving Event-Driven Soil Gas Fluxes by Coupling High-Frequency Chamber Measurements with Advection–Diffusion Modeling 

Alex Naoki Asato Kobayashi, Neomi Widmer, Clément Roques, Daniel Hunkeler, Laurel ThomasArrigo, and Philip Brunner

Soil greenhouse gas (GHG) emissions in agricultural, forestry, and other land uses are driven by coupled biological and physical processes. To monitor these fluxes, automatic chamber systems are now widely used as point-scale measurement techniques. Their high-frequency records provide richer observational coverage across meteorological and hydrogeological conditions, thereby improving the accuracy of annual soil carbon budgets.

Despite advances in monitoring, long-term soil carbon models usually focus solely on simulating soil carbon turnover and decomposition, omitting mechanisms of soil gas transport. Although this simplification may be reasonable in the topsoil, sharp changes in soil saturation or other meteorological factors are not necessarily captured, which can lead to underestimating short-term emissions and biasing annual GHG budgets.

We investigated this issue in a pilot site in the agricultural region (Seeland region, Switzerland) where the water table depth was controlled. We simulated a short flooding event and continuously monitored soil gas flux at high frequency. And our results showed a dampening in CO2 soil gas flux for the flooded plot compared to our control plot, which persisted after it was drained. While this decrease in CO2 flux can be partly attributed to a reduction in aerobic microbial activity, the timescale to recovery to background CO2 fluxes can be attributed to other mechanisms, including advection-diffusion gas transport in the unsaturated zone.

To interpret these dynamics, we employed a 1-D model to assess the role of advection-diffusion, including pressure-driven gas transport, during short-term events. Our model couples water, heat, and gas transport with microbially driven CO2 production. We conducted a sensitivity analysis evaluating different soil conditions and event intensities.

Finally, the integration between high-frequency soil gas flux monitoring systems and gas transport in the unsaturated zone helps deconvolute the soil gas flux signal, while improving the accuracy of the soil GHG budget. This will enhance the process understanding, which can support agricultural management strategies to minimize GHG emissions.

How to cite: Asato Kobayashi, A. N., Widmer, N., Roques, C., Hunkeler, D., ThomasArrigo, L., and Brunner, P.:  Resolving Event-Driven Soil Gas Fluxes by Coupling High-Frequency Chamber Measurements with Advection–Diffusion Modeling, EGU General Assembly 2026, Vienna, Austria, 3–8 May 2026, EGU26-19852, https://doi.org/10.5194/egusphere-egu26-19852, 2026.

EGU26-20805 | ECS | Orals | SSS6.1

Damage mechanism and spatial heterogeneity of loess subjected to explosion loading 

Dong Tang, Longsheng Deng, Tong Wang, and Wenjie Zhang

The accelerated urbanization of the Chinese Loess Plateau has promoted the wide application of engineering explosion on the rapid excavation in loess regions. However, blasting in loess typically causes the various degrees of damage and failure to the remaining soil mass, compromising the bearing capacity and stability of the surrounding loess. Therefore, understanding the damage characteristics and microstructure changes of loess under explosion loading is essential for the construction of explosion projects in loess regions. In this study, the in-situ explosion experiment, dynamic triaxial tests, and micro-computed tomography (μ-CT) technology were employed to reveal the development characteristics of the blasting cavity, explore the dynamic properties of loess following the explosion, and visualize and quantitatively analyze the variation regulations of the loess microstructure. The results indicated that the shape of the blasting cavity was approximated as an ellipsoid. Explosion caused the breakage and rearrangement of particles and aggregates, significantly increasing the compaction of the loess mass, which promoted the evolution of loess dynamics properties towards high dynamic shear modulus and low dynamic damping ratio. In addition, the explosion loading significantly changed the size, number, morphology, and orientation of the loess pores, thereby causing a degradation in the pore network structure, and reducing its connectivity. Based on the spatial differentiation characteristics of the loess microstructure, the explosion zone outside the blasting chamber was divided into broken, plastic, and elastic zone. These findings provide valuable insights into the damage mechanism of loess under blasting loading.

How to cite: Tang, D., Deng, L., Wang, T., and Zhang, W.: Damage mechanism and spatial heterogeneity of loess subjected to explosion loading, EGU General Assembly 2026, Vienna, Austria, 3–8 May 2026, EGU26-20805, https://doi.org/10.5194/egusphere-egu26-20805, 2026.

EGU26-21721 | ECS | Posters on site | SSS6.1

Biochar effects on soil hydraulic properties: high-resolution analysis for contrasting soil textures 

Jannis Bosse, Magdalena Sut-Lohmann, Wolfgang Durner, and Sascha C. Iden

Biochar amendment is widely promoted as a means to sequester carbon while improving soil physical properties. Its hydraulic effects depend strongly on particle size and application rate. Available studies mainly focus on enhanced water retention in sandy soils. Studies that include fine-textured soils and quantify effects on unsaturated hydraulic conductivity remain limited, hampering the development of reliable management strategies. Here, we present the effects of biochar addition on the soil hydraulic properties (SHP) of two agricultural topsoils with contrasting textures. Water retention and hydraulic conductivity of a loam and a loamy sand were measured after amendment with wood-derived biochar of three particle sizes (<0.5, <2, and <10 mm) applied at three dosages (1, 2 and 4 wt.%). All samples were packed under identical force and characterized over the full moisture range using the simplified evaporation method, complemented by saturated conductivity measurements and dew-point measurements of dry-range water retention. A comprehensive soil hydraulic model incorporating adsorption and film flow was fitted to all data, enabling systematic analysis of how biochar size and amount affect hydraulic behavior. Relative to the controls, all biochar treatments increased porosity and saturated water content. Saturated hydraulic conductivity increased by up to 200% for the loam but decreased for the sand. In the loam, biochar application improved air capacity by up to 6 vol.% but had no effect on plant-available water. In contrast, biochar quantity and particle size had no effect on the air capacity of the sand, but increased its available water content by up to 3 vol.%. Higher biochar application rates were strongly associated with lower air-entry values, reduced bulk density, and a broader pore-size distribution. This indicates a shift toward smaller pores in the loamy sand and larger pores in the loam. Smaller biochar particles slightly increased unsaturated hydraulic conductivity between 100 and 300 cm suction for both soils, but reduced water retention in the sand at suctions greater than 100 cm compared to coarser biochar. Overall, our findings demonstrate a substantial influence of biochar on soil hydraulic conductivity and water retention, with effects being stronger in coarse-textured soils and more sensitive to application rate than to particle size.

How to cite: Bosse, J., Sut-Lohmann, M., Durner, W., and Iden, S. C.: Biochar effects on soil hydraulic properties: high-resolution analysis for contrasting soil textures, EGU General Assembly 2026, Vienna, Austria, 3–8 May 2026, EGU26-21721, https://doi.org/10.5194/egusphere-egu26-21721, 2026.

EGU26-993 | ECS | Posters on site | SSS10.3

Physics-Guided Modeling of Water Flow in the Vadose Zone 

Chinju Saju and Sarmistha Singh

Soil hydraulic properties, including saturated hydraulic conductivity and water retention parameters, play a central role in regulating infiltration, redistribution, and storage of water in the root zone, making them fundamental for understanding soil moisture dynamics and plant water availability. Their spatial variability must be characterized to enable accurate field‑scale predictions of soil water dynamics using process‑based models. The Richards equation, which serves as a core framework for modeling water movement in unsaturated soils, poses major difficulties for conventional numerical approaches because of its pronounced nonlinearity, intricate boundary conditions, and high computational demands. Physics‑informed neural networks (PINNs) have emerged as a promising tool that integrates governing physical laws into deep learning frameworks and provides a mesh‑free approach for inverse estimation of hydraulic parameters from limited and noisy datasets. While PINNs have proven effective for homogeneous soils, layered profiles remain challenging due to unknown interface depths and parameter heterogeneity. This study develops a novel PINN‑based framework with progressive physics training to estimate saturated and residual soil moisture contents and the α parameter of the van Genuchten model within layered soils by predicting volumetric water content variations from Time Domain Reflectometry (TDR) sensor data. The framework optimizes data fitting and physics regularization to predict soil moisture dynamics across multiple soil depths. Model performance is evaluated using multiple criteria, including Root Mean Square Error (RMSE), Kling–Gupta Efficiency (KGE), and the coefficient of determination (R²), at sensor‑aligned nodes. Incorporating hydraulic continuity constraints into the loss function enhances parameter identifiability and mitigates equifinality. The proposed approach advances vadose zone modeling by embedding hydrological principles within neural networks, thereby improving computational efficiency while preserving physical consistency. By coupling PINNs with field‑scale TDR observations, this framework bridges the gap between theoretical inverse modeling and practical soil monitoring.

How to cite: Saju, C. and Singh, S.: Physics-Guided Modeling of Water Flow in the Vadose Zone, EGU General Assembly 2026, Vienna, Austria, 3–8 May 2026, EGU26-993, https://doi.org/10.5194/egusphere-egu26-993, 2026.

Soil organic matter turnover and microbial metabolism are fundamentally driven by the acquisition and utilization of carbon, energy, nitrogen and further nutrients. Understanding how microbial processes respond to different energy and substrate conditions is therefore essential for revealing the mechanisms controlling soil carbon turnover and storage. This study focuses on the microscale dynamics of microbes interacting with different substrates, as well as the associated evolution of metabolic energy. Using a Cellular Automaton framework, a process-based model is developed to couple microbial activity with carbon, nutrients, energy as well as structural dynamics. The model includes local interactions of microbial consumption of organic carbon, nutrient uptake, degradation, and growth, while simultaneously representing the internal energy dynamics of the system. Based on this model, we investigate how different substrate conditions—characterized by varying energy content, stoichiometric properties, and spatial distributions—and connectivity impact energy dynamics, microbial community formation, and necromass accumulation.

How to cite: Peng, C. and Ray, N.: How Substrate Properties and Spatial Connectivity Shape Microbial Energy Dynamics and SOM Turnover, EGU General Assembly 2026, Vienna, Austria, 3–8 May 2026, EGU26-1852, https://doi.org/10.5194/egusphere-egu26-1852, 2026.

    Spring discharge modelling is often constrained by limited data availability. To address this challenge, we propose a hybrid framework that combines TimeGAN-based data augmentation with LSTM and GRU models for spring discharge forecasting and apply it to the Niangziguan Spring in northern China. First, TimeGAN is trained on the limited historical record to learn the underlying statistical properties and temporal dynamics and is then used to generate high-quality synthetic sequences. To evaluate the usefulness of the generated data, we generate synthetic sequences of the same length as the original training set and train LSTM and GRU models separately using (i) the observed data and (ii) the synthetic data and then compare their performance on the test set. Models trained on observed versus synthetic data show comparable test performance, indicating that the synthetic sequences reproduce the temporal dynamics and statistical properties that are critical for the prediction task and are functionally equivalent to the observed data for model training.

    Next, TimeGAN is used to expand the training set to between one and six times its original size. t-distributed stochastic neighbour embedding (t-SNE) is used to visualise the distributional consistency between observed and synthetic samples. Qualitative assessment shows that similarity in local structure and distribution patterns increases as the amount of generated data increases: synthetic data quality improves markedly when the synthetic dataset reaches three to four times the size of the original dataset, whereas further increases (four times or more) yield no evident additional improvement. Overall, the synthetic data increase sample diversity while remaining consistent with the original time-series distribution, thereby strengthening model learning when incorporated into the training set.

To quantitatively assess the effect of augmentation, we compare the hybrid models with the baseline LSTM and GRU models using training sets with observed-to-synthetic data ratios ranging from 1:1 to 1:4. Results show that both hybrid models consistently outperform their respective baselines across all evaluation metrics (MAE, MAPE, RMSE, and NSE) during training, validation, and testing, demonstrating the effectiveness of TimeGAN-based data augmentation. Notably, performance does not improve linearly with increasing volumes of synthetic data; an optimal observed-to-synthetic ratio of 1:3 is identified. At this ratio, the test NSE reaches 0.91 for the TimeGAN–LSTM model and 0.94 for the TimeGAN–GRU model. Increasing the ratio to 1:4 results in a slight performance decline (e.g. the test NSE decreases from 0.91 to 0.90 for TimeGAN–LSTM and from 0.94 to 0.93 for TimeGAN–GRU), which is likely attributable to minor distributional deviations introduced by excessive synthetic data. These findings highlight the need to determine an appropriate augmentation ratio in generative data augmentation.

    Across all metrics, and particularly at the optimal ratio, TimeGAN–GRU outperforms TimeGAN–LSTM. This advantage is attributed to the GRU’s streamlined architecture, fewer parameters, and stronger adaptability to the “denoised” synthetic sequences generated by TimeGAN, thereby improving prediction accuracy and robustness under data-scarce conditions. Overall, this study demonstrates the effectiveness of TimeGAN in alleviating hydrological data scarcity and provides a practical and quantifiable approach for hydrological time-series prediction in small-sample settings.

How to cite: Hao, Y. and An, L.: A TimeGAN-Augmented LSTM/GRU Framework for Spring Discharge Forecasting Under Limited Data, EGU General Assembly 2026, Vienna, Austria, 3–8 May 2026, EGU26-3628, https://doi.org/10.5194/egusphere-egu26-3628, 2026.

Accurate spatio-temporal information on the soil water balance is critical for an efficient and sustainable irrigation. Recent irrigation scheduling approaches are often limited to a representation of (i) the local or point scale soil water balance by in-situ measurements, (ii) solely surface soil water contents at a coarse spatial resolution by microwave remote sensing technologies, or (iii) only selected components of the soil water balance by simple crop evapotranspiration models. To reconcile the need for accurate estimates of different components of the soil water balance with feasible effort, this study proposes the application of physically-based one-dimensional soil water balance models in a spatially-distributed manner.

The HYDRUS-1D software environment is applied at 70 m spatial resolution across a 1,600 ha study farm in Mecklenburg-Western Pomerania, Germany, with heterogeneous soil textures and different crops. Depth-specific (0 cm to 60 cm, in 10 cm increments) soil water balance simulations were conducted from 1st April to 30th September 2021 and 2022 to estimate the soil water content, plant available water content, infiltration, crop evapotranspiration, root water uptake, and deep percolation, at daily intervals. Simulated soil water contents were validated against in-situ measurements and two microwave remote sensing surface soil water content datasets (“Soil Moisture Active Passive”, SMAP; Sentinel-1, S1-SWC). Spatially distributed irrigation demands and irrigation timings at daily intervals, crop-specific irrigation efficiencies and potential farm-scale water savings are estimated using the simulated soil water balance to explore the contribution of this simulation framework for precision irrigation.

The average simulation performance metrices were Root Mean Square Error (RMSE) = 0.020 m3 m-3, Mean Absolute Error (MAE) = 0.017 m3 m-3, coefficient of determination (R²) = 0.676, and bias = -0.008 m3 m-3, showing a good accuracy of spatially-distributed HYDRUS-1D simulations. The agreement with remotely-sensed data was moderate to weak (RMSEmean = 0.059 (0.150) m3 m-3, MAEmean = 0.049 (0.123) m3 m-3, R2mean = 0.208 (0.141), mean bias = 0.021 (0.108) m3 m-3 for SMAP (S1-SWC)). Average crop specific irrigation efficiencies were 65.0% (potato), 47.3% (wheat), 40.5% (rye), and 58.2% (sugar beet). Potential water savings amounted to 87,006.9 m³ (11.2 % of the applied irrigation water; 2021) and 71,396.6 m³ (10.4 %; 2022).

The proposed simulation framework offers an easy-to-adopt and physically-based foundation for the estimation of crop-specific irrigation demands and irrigation timings at high spatial resolution. Further accuracy improvements by using depth-specific remote-sensing derived soil water contents (“Soil Water Index”) for model calibration are under ongoing investigation.

How to cite: Wenzel, J. L., Conrad, C., Mahmood, T., Volk, M., and Pöhlitz, J.: Supporting precision irrigation scheduling in the heterogeneous landscape of North-Eastern Germany by spatio-temporally distributed HYDRUS-1D soil water balance simulations and remote sensing data, EGU General Assembly 2026, Vienna, Austria, 3–8 May 2026, EGU26-4765, https://doi.org/10.5194/egusphere-egu26-4765, 2026.

Time series of soil moisture is an important status variable for understanding hillslope hydrological processes at the mountain hillside because soil moisture plays a critical role in regulating water retention, generating runoff and controlling vegetation dynamics. In order to explore the ultimate interpretation based on past hydrologic information (e.g., precipitation and soil moisture history) for contemporary soil moisture status, several machine learning models had been applied using systematically collected soil moisture measurements along transects in a hillslope. The fitness of models was evaluated in terms of coefficient of determination, mean absolute error and root mean square error. Appropriate lag extent for parsimonious modeling of soil moisture was explored and determined through heuristic approaches which can be explained by historic gain and loss and uncertainty contribution. Modeling results indicate that the vertical infiltration to weather rock as primary hydrological process for most measurement points. Two distinct modeling performances in soil moisture modeling at top hill and streamside points indicate the degree of hydrologic process complexity can be identified through delineated AI modeling results. This study highlights the potential of machine learning based time series modeling for prediction of soil moisture and corresponding hydrologic process configuration in the mountain hillslope.

How to cite: Kim, S. and Kim, D.: Machine learning modeling of soil moisture time series for a hillside at Sulmachun watershed, South Korea, EGU General Assembly 2026, Vienna, Austria, 3–8 May 2026, EGU26-6123, https://doi.org/10.5194/egusphere-egu26-6123, 2026.

EGU26-7301 | ECS | Orals | SSS10.3

The Effect of Initial Saturation on Solute Transport and Fracture–Matrix Exchange Rates in Chalk 

Hala Jmili, Tuvia Turkeltaub, Ofra Klein-BenDavid, Natalie De Falco, and Noam Weisbrod

Chalk, a high-porosity carbonate rock, is often intersected by fractures, allowing an increase in permeability by orders of magnitude and solute bypass of the matrix, which induces rapid water flow and contaminant migration. However, depending on the level of saturation at the fracture–matrix interface, mass exchange may occur. Consequently, the matrix can store a significant fraction of infiltrating water and solutes, thereby controlling hydrological dynamics. Despite its importance, our understanding of the sensitivity and variability of exchange rates to the initial level of saturation remains limited. Therefore, this study implemented a unique experimental setup to quantify the effects of initial saturation variation on the transport using Rhenium (Re) as a conservative tracer. The system encloses a chalk core drilled from the Eocene-age Avdat Group in the northwestern Negev Desert, containing a 1 mm artificial vertical fracture along its longitudinal axis to mimic preferential flow pathways observed in fractured chalk formations. Three initial saturation levels were considered: nearly saturated conditions (95%), and unsaturated conditions (40% and 60%). Controlled Re tracer injection, followed by artificial rainwater infiltration, was performed, and outlet concentrations were collected under controlled boundary conditions and analyzed using inductively coupled plasma mass spectrometry (ICP–MS).

 The Re breakthrough curve (BTC) results, under unsaturated conditions, show a higher peak and lower dispersion compared to those under nearly saturated conditions.  These results were further validated by a dual-porosity model (DPM) that was solved using the Hydrus 1D code. The Latin hypercube sampling method was used to generate multiple combinations of hydraulic parameters and longitudinal dispersivity for the DPM. Any simulation that produced an NSE larger than 0.9 was identified as a behavioral simulation. The relationship between solute transfer and initial saturation conditions exhibits pronounced nonlinear behavior. At relatively wet initial conditions (low pressure head —h—), solute transfer remains very limited, indicating weak fracture–matrix exchange. As the system becomes progressively drier, solute transfer increases sharply over a relatively narrow range of pressure heads, reflecting enhanced exchange between mobile and immobile water regions. Beyond this transition zone, a further decrease in initial pressure head results in only minor changes in solute transfer due to intrinsic storage limitations.


How to cite: Jmili, H., Turkeltaub, T., Klein-BenDavid, O., De Falco, N., and Weisbrod, N.: The Effect of Initial Saturation on Solute Transport and Fracture–Matrix Exchange Rates in Chalk, EGU General Assembly 2026, Vienna, Austria, 3–8 May 2026, EGU26-7301, https://doi.org/10.5194/egusphere-egu26-7301, 2026.

Integrated simulation of crop growth and soil water dynamics is essential for improving the understanding of agro-hydrological processes and advancing agricultural water resource management. In this study, a coupled agro-hydrological modeling framework was developed by integrating the crop growth model WOFOST with the soil water flow model HYDRUS-1D to explicitly represent interactions among crop development, root water uptake, and soil moisture dynamics. The framework was applied to a maize cropping system located in an arid and semi-arid region characterized by shallow groundwater, where strong soil–crop–atmosphere interactions and groundwater influences pose significant challenges to conventional modeling approaches. Model parameters were calibrated and validated using field observations collected during the 2017–2018 growing seasons, incorporating site-specific climate data, cultivar parameters, and detailed agricultural management information. To address uncertainties arising from parameter variability and model structural limitations, data assimilation techniques were further embedded into the coupled framework. Observations of soil water content (SWC), leaf area index (LAI), and evapotranspiration (ET) were assimilated using the Ensemble Kalman Filter (EnKF) and four-dimensional variational data assimilation (4D-Var), enabling dynamic correction of both soil hydrological states and crop growth variables. The results demonstrate that the coupled WOFOST–HYDRUS-1D system reliably captures crop–soil–groundwater interactions under shallow groundwater conditions. Data assimilation substantially improves simulation accuracy by reducing soil moisture bias, constraining crop growth trajectories, enhancing ET estimation, and lowering predictive uncertainty throughout the growing season. The proposed framework provides a robust and potentially transferable tool for agro-hydrological simulation in water-scarce regions and supports improved irrigation management and decision-making in precision agriculture.

How to cite: Qin, X., Zhang, C., and Huo, Z.: Improving Agro-Hydrological Process Simulations in Cropping Systems by Coupling WOFOST and HYDRUS-1D with Data Assimilation, EGU General Assembly 2026, Vienna, Austria, 3–8 May 2026, EGU26-8632, https://doi.org/10.5194/egusphere-egu26-8632, 2026.

EGU26-10220 | Posters on site | SSS10.3

Modelling soil functions in agroecosystems: the potential of BODIUM4Farmers for science and practice 

Sara König, Judith Rüschhoff, Leonard Franke, Ulrich Weller, Julius Ansorge, Anton Gasser, Luise Ohmann, Ute Wollschläger, and Hans-Jörg Vogel

Soil functions in agroecosystems such as nutrient cycling, water filtering and storage, productivity, and carbon storage are highly affected by agricultural management as well as climate change. To understand and predict the complex dynamics, mechanistic modelling is a powerful tool.  BODIUM is a site-specific systemic soil model, which was developed for exactly this purpose (König et al., 2023). It integrates the main important biological, physical and chemical processes in soil and at the soil-plant interface, including a dynamic soil structure and explicit microbial activity. It allows for simulating different management practices such as crop rotation, cover crops, tillage, organic and inorganic fertilization.

The web application BODIUM4Farmers builds upon this model and provides a user-friendly interface to support effective soil management (https://bodium4farmers.de/). It was developed in co-design with farmers and agricultural advisors and was already tested by several practitioners.  Users can simulate the effect of different management and weather scenarios on soil functions at specific locations within Germany, where soil and weather data are directly provided from our databases.

In this contribution, we will introduce BODIUM4Farmers with selected examples and demonstrate the potential for agricultural practice, but also for teaching and scientific purposes. Although the simulation results in the web application are presented in an aggregated way to easily compare different indicators for soil functions, the underlying process-based model produces daily data along the whole soil profile and thus allows for in-depth analysis of the scenarios. 

We will further give insights into ongoing development in regard to extending the management measures including intercropping and differentiated soil tillage operations. Within the EU-project DeepHorizon, we are currently also extending BODIUM4Farmers to include databases for soil and weather for whole Europe, increasing the potential of web application even more.


König, S., Weller, U., Betancur-Corredor, B., Lang, B., Reitz, T., Wiesmeier, M., Wollschläger, U., & Vogel, H.-J. (2023). BODIUM—A systemic approach to model the dynamics of soil functions. European Journal of Soil Science, 74(5), e13411. https://doi.org/10.1111/ejss.13411

How to cite: König, S., Rüschhoff, J., Franke, L., Weller, U., Ansorge, J., Gasser, A., Ohmann, L., Wollschläger, U., and Vogel, H.-J.: Modelling soil functions in agroecosystems: the potential of BODIUM4Farmers for science and practice, EGU General Assembly 2026, Vienna, Austria, 3–8 May 2026, EGU26-10220, https://doi.org/10.5194/egusphere-egu26-10220, 2026.

EGU26-10508 | ECS | Posters on site | SSS10.3

Exploring Three-dimensional Soil Moisture Variability using Multi-Source Observations 

Doyoung Kim, Seulchan Lee, Junhyuk Jeong, Shinhyeon Cho, and Minha Choi

Soil moisture is a fundamental state variable governing land–atmosphere interactions and hydrological responses to extreme climate events. Although satellite remote sensing has substantially improved the spatial coverage of surface soil moisture observations, most existing products remain confined to the near-surface layer, limiting their applicability to subsurface hydrological processes. The absence of depth-resolved soil moisture information remains a key challenge for representing infiltration, drainage, and root-zone dynamics. This study examines the potential for advancing soil moisture characterization toward three-dimensional (3D) spatial representations by exploiting the complementary information content of multi-source observations. Spatially continuous surface soil moisture fields provide valuable insights into horizontal variability, whereas ground-based measurements offer essential constraints on vertical soil moisture structure. By investigating soil moisture variability across depth and space under varying hydrometeorological conditions, this work highlights the role of subsurface information in improving the interpretation of surface soil moisture patterns. Rather than presenting finalized estimates, this study adopts an exploratory perspective to emphasize the conceptual importance of incorporating subsurface soil moisture into spatial analyses. The findings aim to contribute to ongoing efforts to improve soil moisture representation for hydrological modeling and to inform future applications in flood and drought assessment using 3D soil moisture frameworks.


Keywords: Soil Moisture, Subsurface process, Hydrological extremes


Acknowledgment

This research was supported by the BK21 FOUR (Fostering Outstanding Universities for Research) funded by the Ministry of Education (MOE, Korea) and National Research Foundation of Korea (NRF). This work is financially supported by Korea Ministry of Land, Infrastructure and Transport (MOLIT) as 「Innovative Talent Education Program for Smart City」. This work was supported by the National Research Foundation of Korea (NRF) grant funded by the Korea government (MSIT) (RS-2022-NR070339). This work was supported by the National Research Foundation of Korea (NRF) grant funded by the Korea government (MSIT) (RS-2024-00416443). This work was supported by Korea Environment Industry & Technology Institute(KEITI) through Water Management Program for Drought Project, funded by Korea Ministry of Climate, Energy and Environment(MCEE)(RS-2023-00230286). This work was supported by Korea Environment Industry & Technology Institute (KEITI) through Research and Development on the Technology for Securing the Water Resources Stability in Response to Future Change Project, funded by Korea Ministry of Climate, Energy and Environment(MCEE)(RS-2024-00332300).

How to cite: Kim, D., Lee, S., Jeong, J., Cho, S., and Choi, M.: Exploring Three-dimensional Soil Moisture Variability using Multi-Source Observations, EGU General Assembly 2026, Vienna, Austria, 3–8 May 2026, EGU26-10508, https://doi.org/10.5194/egusphere-egu26-10508, 2026.

EGU26-11791 | Orals | SSS10.3

All in? Soil organic carbon and nitrogen turnover modeling including structure dynamics 

Alexander Prechtel, Maximilian Rötzer, and Nadja Ray

The adequate quantification of soil organic carbon (SOC) turnover is a pressing need for improving soil health and understanding climate dynamics. It is controlled by the complex interplay of microbial activity, availability of carbon (C) and nitrogen (N) sources, and the dynamic restructuring of the soil's architecture. Accurate modeling of SOC dynamics requires the representation of these processes at small spatial scales to help understanding the mechanisms that drive these processes.

Among them are the enzymatic degradation of particulate organic matter, the cycling of microbial necromass, but also short-term influences as root exudation. As such, microbial growth and turnover, C respiration and N cycling depend on the C/N ratios of the different organic carbon sources.

We show the feasibility to include such a variety of processes in a microscale model, along with the possibility to simulate soil structure dynamics including the stabilization of soil particles, POM or microbial necromass via organo‐mineral associations. The computational framework is a cellular automaton model that allows to create virtual soils on the basis of µCT or video analysis data of aggregates. Parameters are chosen consistently from rhizosphere experiments without parameter fitting to explore the influence of soil structural heterogeneity and connectivity, N limitation, or necromass formation on SOC storage.

Our results highlight that evolving soil architecture and pore connectivity control substrate accessibility, creating micro‐scale hot and cold spots for microbes. N availability consistently co-limits microbial growth, while a favorable C/N ratio of root exudates substantially reduces respiration and increases CUE over extended periods. Necromass emerges as long‐term SOC pool, as N from short‐term root exudation pulses promotes biomass growth and is converted into slowly degradable necromass, which can be physically protected through occlusion. The findings align with lab experiments and additionally allow us to elucidate the spatial and temporal dynamics of the drivers of carbon turnover. We also present an option to couple such microscale simulations to macroscale transport  model for, e.g., CO2 across soil profiles.

How to cite: Prechtel, A., Rötzer, M., and Ray, N.: All in? Soil organic carbon and nitrogen turnover modeling including structure dynamics, EGU General Assembly 2026, Vienna, Austria, 3–8 May 2026, EGU26-11791, https://doi.org/10.5194/egusphere-egu26-11791, 2026.

EGU26-13067 | ECS | Orals | SSS10.3

Storm intensity and duration impact on deep infiltration in rocky terrains 

Luca Laudi, Ofer Dahan, Manuel Sapiano, Michael Schembri, and Tuvia Turkeltaub

Anticipated future changes in precipitation patterns are expected to affect deep percolation (DP) through the vadose zone and groundwater recharge (GWR) of semi-arid regions such as Malta. Moreover, a diverse range of agricultural practices, from rainfed to irrigated agriculture, complicates the relationship between storm characteristics (magnitude, duration, intensity, antecedent dry spells) and DP. Variations in agricultural practices are often responsible for variations in wetness conditions within the vadose zone, which ultimately impact DP and GWR potential. To better establish this relationship, four years of deep vadose zone water content measurements obtained using a unique vadose zone monitoring system network across various agricultural land uses in Malta were utilised. Furthermore, the rainfall data over these four years were characterised into storms using minimum inter-event times (MITs) ranging from 12 to 168 hours. DP events in the vadose zone were identified from the VMS by detecting the first >1% absolute increase in volumetric water content at the deepest responding sensor within three days after the onset of each storm event. The optimal MIT selection was based on Cohen’s d effect sizes, which quantify how strongly each storm characteristic distinguishes DP-triggering storms from non-DP storms. MIT of 24 hours generally produces the strongest statistical link between storm characteristics and episodic DP across land uses. DP events typically occur during storms delivering approximately 30 mm of rainfall, lasting 1.5–2 days, and exhibiting peak intensities of 8 mm/h. Thus, it is the combination of event magnitude and rainfall duration that consistently distinguishes storms capable of generating DP. For rainfed agricultural land, which comprises more than half of Malta's agricultural landscape, DP is strongly controlled by storm magnitude and intensity, while also showing dependence on dry spell duration. However, in irrigated land uses, DP becomes less dependent on these storm characteristics due to elevated antecedent moisture from irrigation when compared to rainfed systems. Storm duration remains a moderately important factor in determining DP. Analysis of future rainfall projections for the SSP5-8.5 climatic scenario indicate reductions in storm magnitude and duration, together with longer dry gaps between storms. Ultimately, a decline in episodic DP frequency is expected in the rainfed agricultural land of rocky terrains in semi-arid climates such as Malta.

How to cite: Laudi, L., Dahan, O., Sapiano, M., Schembri, M., and Turkeltaub, T.: Storm intensity and duration impact on deep infiltration in rocky terrains, EGU General Assembly 2026, Vienna, Austria, 3–8 May 2026, EGU26-13067, https://doi.org/10.5194/egusphere-egu26-13067, 2026.

Understanding the migration behavior of thallium (TI) in subsurface environments is essential for Tl pollution prevention. With the wide production and utilization of biochar, the notable ability of biochar colloids to carry environmental contaminants may make these colloids important for Tl(I) mobility. This study systematically investigated the impact of wood-derived biochar (WB) and corn straw-derived biochar (CB) colloids on Tl(I) transport in water-saturated porous media under different pH (5, 7 and 10) and ionic strengths (ISs) (1, 5 and 50 mM NaNO3). WB colloids improved Tl(I) transport under all IS conditions at pH 7 due to the adsorption capacity of biochar and competition for adsorption sites on the sand surface. However, at IS 50 mM, CB colloids slightly impeded Tl(I) mobility due to the straining. In addition, both WB and CB colloids accelerated Tl(I) mobility under all pH conditions at IS 5 mM. At pH 10, the promotion effect was more obvious due to the deprotonation of O-containing functional groups and higher fluidity of biochar colloids. Furthermore, the two-site nonequilibrium model and two-site kinetic attachment/detachment model suitably described the breakthrough curves (BTCs) of Tl(I) and biochar colloids, respectively. The colloid-facilitated solute transport model could also describe Tl(I) transport influenced by biochar colloids reasonably well. This study provides insight into the migration and fate of Tl(I) in the presence of biochar colloids.

How to cite: Chen, W. and Liu, J.: Impact of nanobiochar on thallium(I) transport in water-saturated porous media: Effects of pH and ionic strength, EGU General Assembly 2026, Vienna, Austria, 3–8 May 2026, EGU26-15432, https://doi.org/10.5194/egusphere-egu26-15432, 2026.

Accurately characterizing soil hydraulic properties—specifically water retention and conductivity—is essential for modeling hydrological risks such as flooding, drought, and solute transport. However, direct measurement of these properties in heterogeneous field conditions remains a significant challenge. This study proposes a novel framework for estimating hydraulic parameters using Physics-Informed Neural Networks (PINNs), which constrain deep learning architectures with the fundamental physical laws of subsurface flow. To address the inherent noise and sparsity of field-collected data, we developed a two-stage training strategy: We first introduce a specialized neural network designed to preprocess raw sensor data and capture the complex spatio-temporal dynamics of soil moisture, an the PINN is subsequently refined to map these dynamics back to the underlying hydraulic properties. Furthermore, we enhanced the model’s robustness by integrating empirical soil-water characteristic models into the Activation function ensuring stability across the full moisture spectrum, from desiccation to saturation. Results indicate that this hybrid approach significantly improves parameter estimation accuracy compared to traditional inverse modeling and standard machine learning techniques. This methodology provides a scalable and robust tool for enhancing the predictive reliability of environmental water management models.

How to cite: Li, N.: A Two-Stage Physics-Informed Neural Network Framework for Estimating Soil Hydraulic Properties, EGU General Assembly 2026, Vienna, Austria, 3–8 May 2026, EGU26-15711, https://doi.org/10.5194/egusphere-egu26-15711, 2026.

EGU26-17443 | ECS | Posters on site | SSS10.3

Process-based modelling of soil functions across agricultural land-use types under climate change 

Lucas Kanagarajah, Thomas Reitz, Martin Schädler, Franziska Taubert, Hans-Jörg Vogel, Ulrich Weller, and Sara König

The functioning of agricultural ecosystems is increasingly threatened by global change drivers, including climate change and land-use intensification, through the disruption of vital ecosystem processes. Process-based simulation models offer a powerful tool to disentangle the complex interactions between microbiota, plants and soils, providing a foundation for long-term projections and scenario analyses.

Within the framework of the “Global Change Experimental Facility (GCEF)”, extensive datasets on plant physiology, soil nutrients, soil microbial and faunal communities, and soil physical properties have been collected across multiple agricultural land-use types. These include conventional and organic cropping systems, intensively and extensively managed meadows, and extensively grazed sheep pastures, each exposed to both ambient and experimentally simulated future-climate conditions.

Here, we present an extended version of the process-based soil model BODIUM, now capable of simulating grassland dynamics in addition to cropping systems. This extension allows for a comparison of ecosystem processes across contrasting land-use types. The model was parameterized for various GCEF land-use systems, and simulated outputs, including plant shoot and root biomass, and soil carbon, nitrogen and water dynamics, were compared with empirical data for model validation. We analyze how climate change and land management influence soil functions and ecosystem processes, highlighting differences between arable and grassland systems. Furthermore scenario simulations under future climate projections can provide insights into the potential resilience of different land-use systems, offering a basis for informing more sustainable management practices.

How to cite: Kanagarajah, L., Reitz, T., Schädler, M., Taubert, F., Vogel, H.-J., Weller, U., and König, S.: Process-based modelling of soil functions across agricultural land-use types under climate change, EGU General Assembly 2026, Vienna, Austria, 3–8 May 2026, EGU26-17443, https://doi.org/10.5194/egusphere-egu26-17443, 2026.

EGU26-18178 | ECS | Posters on site | SSS10.3

Inverse modeling of coupled soil heat and moisture transport constrained by eddy covariance observations 

Mariana Hájková and Michal Kuráž

Coupled soil–atmosphere heat and moisture transport is strongly influenced by phase change and water vapor dynamics. Evaporation and condensation form a crucial link between the soil water balance and the surface energy balance by coupling hydrologic and thermal processes through latent heat exchange. Accurate representation of these processes is therefore essential for modeling moisture and energy dynamics in variably saturated soil. In this study, an established physics-based model describing liquid water flow, water vapor transport, heat transfer, and the surface energy balance was calibrated using observations from an eddy covariance monitoring station. The model explicitly incorporates the surface energy balance and computes its individual components using a combination of physically based formulations and empirical parameterizations, making it particularly suitable for direct comparison with eddy covariance observations. Soil hydraulic and thermal properties, together with key surface energy balance parameters, including surface resistance, atmospheric emissivity, and surface albedo, were estimated through inverse modeling without direct soil sampling. Model calibration was performed using an evolutionary optimization approach and resulted in good agreement between simulated and observed soil moisture, temperature, and turbulent energy fluxes. The calibrated model provides a physically consistent representation of the eddy covariance observations while maintaining a closed surface energy balance, which is commonly not achieved with observation data alone. 

How to cite: Hájková, M. and Kuráž, M.: Inverse modeling of coupled soil heat and moisture transport constrained by eddy covariance observations, EGU General Assembly 2026, Vienna, Austria, 3–8 May 2026, EGU26-18178, https://doi.org/10.5194/egusphere-egu26-18178, 2026.

EGU26-18291 | ECS | Orals | SSS10.3

A novel procedure for geostatistical inversion improved bycombining high-resolution initial guess from travel time inversion 

Huiyang Qiu, Ning Luo, Walter Illman, Chao Zhuang, Yong Huang, and Rui Hu

Hydraulic tomography (HT) has been proven as a robust approach to map subsurface heterogeneity through the joint inverse modeling of multiple pumping test data. However, smooth or even erroneous tomograms occur in data sparse areas. In this study, we present a novel procedure of integrating travel time inversion (TTI) results into geostatistical inversion (GI). By treating specific storage (Ss) to be homogeneous, the estimated diffusivity (D) tomogram from TTI is transferred into heterogeneous hydraulic conductivity (K) field. The derived spatial K distribution coupled with effective Ss estimate are utilized as initial guesses for GI. Comparative cases of HT analyses are designed for a numerical case study to highlight the performance of the novel procedure integrated with the TTI result, in which the geostatistical inversion is initialized with: (a) effective homogeneous K and Ss; (2) zonation model results built by different geological information for dividing zones; (3) heterogeneous initial guess of K from the novel procedure. Based on the comparison of lnK and lnSs fields, validation of drawdowns, and examination of travel times indices, results indicate that the novel procedure integrating TTI into HT analysis is demonstrated as an effective approach, which has good performance similar to when a zonation model is integrated with accurate geological information.

How to cite: Qiu, H., Luo, N., Illman, W., Zhuang, C., Huang, Y., and Hu, R.: A novel procedure for geostatistical inversion improved bycombining high-resolution initial guess from travel time inversion, EGU General Assembly 2026, Vienna, Austria, 3–8 May 2026, EGU26-18291, https://doi.org/10.5194/egusphere-egu26-18291, 2026.

EGU26-19286 | Orals | SSS10.3

Large effects of small scales: modelling non equilibrium in soil hydraulics 

Ulrich Weller, Sara König, and Hans-Jörg Vogel

Soil hydraulics is a dominant constituent of ecosystemal site conditions. How the water is redistributed and stored determines the fertility of soils, the fate of pollutants, and the capacity of carbon storage of these systems. Although studied excessively in labs and monitored in big facilities like lysimeters and field instrumentations, the modelling of the water redistribution lacks a dominant feature: non equilibrated fast flows, where water enters an unsaturated soil and gets conducted fast through a  network of larger pores. This has consequences at the large scale: water can either bypass the rooting zone and be lost to plant production, or it can be stored in lower soil horizons and be preserved from soil evaporation and be available for plant transpiration. The systemic soil model BODIUM uses a new approach for modelling soil water, which is capable of reproducing these effects. By implicitely considering redistribution of water locally at the pore scale, the macroscopic behaviour follows the observed non-equilibrium dynamics and better matches field measurements. The work shows the water redistribution and its influence on the vapor exchange at the land surface for the regional water balance, both in modelling and in lysimeter measurement.

How to cite: Weller, U., König, S., and Vogel, H.-J.: Large effects of small scales: modelling non equilibrium in soil hydraulics, EGU General Assembly 2026, Vienna, Austria, 3–8 May 2026, EGU26-19286, https://doi.org/10.5194/egusphere-egu26-19286, 2026.

EGU26-20326 | Posters on site | SSS10.3

Machine Learning with Feature Selection Reveals Key Drivers of Multi-Depth Soil Moisture Content 

xiaoying qiao, ning wang, and qi wu

Soil moisture content (SMC) plays a vital role in agricultural productivity, water resource management, and ecosystem sustainability in semi-arid regions. Despite this importance, most existing machine learning models mainly rely on remote sensing data to predict the soil moisture variation in the surface soil; however, they are constrained by redundant input features and limited interpretability. To address these shortcomings, this study combines the Random Forest (RF) algorithm, Convolutional Neural Networks (CNN), and the Transformer framework to develop a hybrid RF-CNN-Transformer model. Specifically, the RF algorithm, CNN, and Transformer framework are respectively used for selecting influential features, extracting spatial patterns, and capturing long-term temporal dependencies. Applied to the Mu Us Sandy Land using data from six soil depths (5, 10, 20, 40,70, and 87 cm), the model demonstrated high prediction accuracy and training efficiency across all layers compared to baseline models, with values ranging from 0.8586 to 0.984 (mean R² = 0.9507). Interpretability analysis revealed a shift in the controlling mechanisms of soil moisture: shallow-layer SMC is jointly influenced by meteorological conditions and groundwater level, whereas groundwater becomes the dominant factor in deeper layers. Notably, due to the extremely dry climate, precipitation has a relatively minor impact on soil moisture dynamics across all depths. Overall, the proposed RF-CNN-Transformer model enhances both the predictive capability and interpretability of soil moisture variation, supporting precision irrigation and water resource optimization in agriculture, especially in arid and semi-arid regions.

How to cite: qiao, X., wang, N., and wu, Q.: Machine Learning with Feature Selection Reveals Key Drivers of Multi-Depth Soil Moisture Content, EGU General Assembly 2026, Vienna, Austria, 3–8 May 2026, EGU26-20326, https://doi.org/10.5194/egusphere-egu26-20326, 2026.

EGU26-20819 | ECS | Orals | SSS10.3

Linking Soil Properties and Dielectric Response in the Intermediate Frequency Domain 

Mario Nohra, Paul Vandôme, Gilles Belaud, and Sylvain Blayac

The availability of autonomous sensor networks providing information about soil status offers significant potential for optimizing water management in agricultural systems. Realizing this potential requires robust, in-situ, real-time, and non-invasive measurements of soil water content, salinity, and structure. These sensors are sensitive to many soil characteristics, requiring specific calibration or approximations based on soil types.
Among existing monitoring techniques, electrical impedance spectroscopy provides a direct means of transducing soil physical properties into measurable electrical parameters. Many existing dielectric sensing approaches perform well under specific conditions, particularly at the low and high frequency extremes of the electromagnetic spectrum and in coarse-textured soils. However, a large portion of the intermediate frequency range (10 kHz to 10 MHz) remains comparatively underexploited, despite offering rich information content linked to soil physical and structural properties.
In this study, we combine analytical modeling and experimental dielectric spectroscopy to investigate soil electrical behavior across this intermediate frequency domain. Broadband complex dielectric spectra were measured on soils spanning a range of textures, salinities, water contents and porosities. These measurements are interpreted using effective medium approximations (EMAs), including geometric mixing laws and differential effective medium (DEM) formulations, explicitly accounting for soil geometry, grain shape, and phase connectivity. 
The intermediate frequency regime represents a transition zone where ionic conduction and dielectric polarization coexist, giving rise to complex spectral signatures. In this band, Maxwell–Wagner interfacial polarization, strongly controlled by soil structure and connectivity, overlaps with the rotational relaxation of bound, reflecting how water is retained within the soil matrix.  Together, these mechanisms encode information on soil texture, porosity, salinity, and structure, but require appropriate theoretical frameworks to be meaningfully interpreted.
Our preliminary results demonstrate that DEM-based formulations provide a consistent and physically meaningful description of measured soil dielectric spectra across the intermediate frequency range. The agreement between modeled and experimental spectra confirms the adequacy of the analytical approach and highlights its predictive value for inferring soil texture, salinity, and water content from broadband impedance measurements. These findings reposition the intermediate frequency band from a source of interpretative complexity to a powerful indicator of soil structure for next-generation agricultural sensing. Future work will focus on extending this framework toward automated in-situ experiments, leveraging laboratory-derived datasets to support robust inversion and next-generation sensor deployment.

How to cite: Nohra, M., Vandôme, P., Belaud, G., and Blayac, S.: Linking Soil Properties and Dielectric Response in the Intermediate Frequency Domain, EGU General Assembly 2026, Vienna, Austria, 3–8 May 2026, EGU26-20819, https://doi.org/10.5194/egusphere-egu26-20819, 2026.

EGU26-22336 | Posters on site | SSS10.3

Modeling the impact of root exudates and microbes on water and nitrogen uptake using a fully coupled soil plant model 

Erik Kopp, Andrea Schnepf, Mathieu Javaux, Thilo Streck, Holger Pagel, and Mona Giraud

Root architecture and soil-plant interactions affect carbon storage and nutrient uptake efficiency of plants. Mechanistic modeling of the soil-plant system enables a better understanding of coupled processes and allows us to predict the response of the soil-plant system to environmental change.

The fully coupled functional-structural soil-plant model "CPlantBox" can simulate plant growth and soil water flow, solute transport and microbial dynamics. In the rhizosphere, the area influenced by the root activity, focus is put on the influence that special root exudates called mucilage have on the plant water uptake and how the microbial activity promoted by the root exudation impacts the nitrogen uptake.

Both the mucilage and the nitrogen cycling in microbes are investigated using a sensitivity analysis: For a given metric of interest (e.g. total microbial biomass after 10 days of root growth) each parameter gets assigned a measure of importance and of interactions with other parameters. This standard approach of sensitivity analysis is extended to parameter inequalities, enabling the inclusion of additional information.

Through the sensitivity analysis we will be able to identify which model parameters determine the effects of root exudates on microbial N mineralization, plant water and N uptake. Measurements from drought and nitrogen limitation experiments will be used to estimate these important model parameters.


How to cite: Kopp, E., Schnepf, A., Javaux, M., Streck, T., Pagel, H., and Giraud, M.: Modeling the impact of root exudates and microbes on water and nitrogen uptake using a fully coupled soil plant model, EGU General Assembly 2026, Vienna, Austria, 3–8 May 2026, EGU26-22336, https://doi.org/10.5194/egusphere-egu26-22336, 2026.

EGU26-433 | ECS | Posters on site | SSS6.8

MIRS and XRF Data Fusion for Improving Soil Fertility Attributes Prediction 

João Lopes, Magdeline Vlasimsky, Alessandro Migliori, Gerd Dercon, Kalliopi Kanaki, Fábio Melquiades, and Avacir Andrello
The evaluation of soil samples using spectral techniques provides a sustainable approach to soil health assessment, reducing reliance on traditional, waste-producing analytical methods. Over the past few decades, spectroscopic and spectrometric techniques have gained prominence in soil analysis due to their non-destructive nature. X-ray fluorescence (XRF) and mid-infrared spectroscopy (MIRS) are particularly valuable, as they provide complementary information on the elemental and molecular composition of soils, respectively. Both have been successfully combined with machine learning algorithms to model and predict soil fertility parameters as alternatives to conventional wet chemistry. This study explores the potential of data fusion between XRF and MIRS measurements to enhance soil fertility prediction accuracy. A total of 160 soil samples were analyzed using a Panalytical Epsilon 5 EDXRF spectrometer, employing four different secondary targets, and a Bruker Alpha II Fourier-transform mid-infrared spectrometer. Three machine learning models were trained on individual and fused datasets: Partial Least Squares Regression (PLSR), Support Vector Machine (SVM), and Random Forest Regression (RF). The regression models built upon the fused data yielded increased performance for organic Carbon (OC), exchangeable Calcium (exCa), and exchangeable Potassium (exK). For OC, the RF model yielded the best performance, with the fused approach achieving a 5% reduction in RMSE and a 7% increase in RPD relative to standalone XRF. For exCa, RF was again the top-performing algorithm under fusion, providing a 25% reduction in RMSE and a 51% increase in RPD. For exK, the best results were obtained with PLS, which delivered a 16% reduction in RMSE and a 27% increase in RPD. These results demonstrate that integrating complementary spectral information from XRF and MIRS can enhance the prediction of key soil fertility attributes, offering a reliable and sustainable alternative to conventional chemical analyses. Beyond improving model accuracy, the proposed fusion framework highlights the potential of combining multi-sensor data to expand the applicability of spectral techniques for large-scale, rapid soil fertility assessment.

How to cite: Lopes, J., Vlasimsky, M., Migliori, A., Dercon, G., Kanaki, K., Melquiades, F., and Andrello, A.: MIRS and XRF Data Fusion for Improving Soil Fertility Attributes Prediction, EGU General Assembly 2026, Vienna, Austria, 3–8 May 2026, EGU26-433, https://doi.org/10.5194/egusphere-egu26-433, 2026.

EGU26-3825 | ECS | Posters on site | SSS6.8

Water vapor transport in extremely dry soils – does vapor always flow from high to low temperature?    

Kassaye Gurebiyaw, Dilia Kool (RIP), and Nurit Agam

In desert soils, water vapor transport is a key mechanism driving soil moisture dynamics. This transport occurs along vapor density gradients that arise from variations in soil matric potential and temperature in the soil. In hyper-arid soils, extremely high negative matric potentials across the near surface lead to uniform matric potential gradients (∇Ψₘ). Therefore, in these soils, variations in temperature (∇T) primarily drive vapor movement by affecting vapor concentration. In cases where soil moisture is high enough so that the relative humidity in the air-filled pores approaches 100%, vapor flows from warmer to cooler soil sections. This is because an increase in temperature under these conditions causes an exponential rise in vapor concentration, which triggers vapor migration toward cooler soil regions. We hypothesize that in very dry soils, the opposite is the case. When the relative humidity in the air-filled pores is much lower than 100%, an increase in temperature does not translate to an increase in water vapor because there is no liquid water to evaporate. In contrast, the increase in temperature results in a decrease in air density, forming a lower water vapor concentration compared to a cooler soil, resulting in water vapor flow from cooler to warmer soil sections. To test this hypothesis, we conducted an in-situ experiment in the Negev Desert, Israel, where the total soil-atmosphere water flux was measured by lysimeters, and the soil water content at depths of 0.5, 2, 5 and 10 cm were measured using temperature and relative humidity sensors. Water vapor transport was also simulated using a HYDRUS 1D numerical model. We found that vapor transport in these hyper-arid soils is dominated by thermally driven vapor flux (total soil water flux ≈ thermal vapor flux​), while liquid fluxes (thermal and isothermal) and isothermal vapor fluxes are negligible. While the experimental data support our hypothesis, the HYDRUS configuration does not allow for an influx of water vapor from the atmosphere, nor does it allow for water vapor to move from cooler to warmer soil layers, both of which may limit the model’s prediction accuracy. These results highlight the need to reconsider the description of water vapor flow in extremely dry soils in HYDRUS and potentially other land-surface and hydrological models.            

How to cite: Gurebiyaw, K., Kool (RIP), D., and Agam, N.: Water vapor transport in extremely dry soils – does vapor always flow from high to low temperature?   , EGU General Assembly 2026, Vienna, Austria, 3–8 May 2026, EGU26-3825, https://doi.org/10.5194/egusphere-egu26-3825, 2026.

EGU26-5167 | Orals | SSS6.8

Comparing field-saturated soil hydraulic conductivity determined by the single-ring pressure infiltrometer and bottomless bucket methods 

Dario Autovino, Vincenzo Bagarello, Angelo Basile, Gaetano Caltabellotta, Rosaria Ciotta, Mariachiara Fusco, and Massimo Iovino

Reliable estimates of field-saturated soil hydraulic conductivity, Kfs, are necessary for characterizing and modelling flow and solute transport. However, field determination of Kfs is challenging since this parameter is sensitive to the applied measurement method and the underlying assumptions. Infiltration experiments provide a relatively simple and low-cost way to determine Kfs, but different devices and analysis frameworks can yield method-dependent estimates. In this context, it is necessary to benchmark simple field techniques against more established methods and to quantify how the choice of the method influences estimation of Kfs before such techniques can be widely adopted.
The aim of this investigation was to compare the Kfs values obtained with two single-ring infiltrometers methods. In particular, the classical single-ring pressure infiltrometer (PI) and the bottomless bucket (BB) method were applied in three Mediterranean agricultural fields in Italy under summer dry conditions. The soils were classified as sandy-loam at two sites and clay at the third one.
At each site, 15 PI runs with two consecutively applied ponded depths of water, H (H1 = 5 cm, H2 = 10 cm), and 15 BB falling-head runs (H ranging repeatedly from 10 to 1 cm) were performed. The data obtained with the PI were analyzed using two different approaches. In particular, the Two-Ponding-Depth (TPD) approach was applied for estimating both Kfs and the site-specific sorptive number, α*. The One-Ponding-Depth (OPD) approach was also applied by using the site-specific α* value and averaging the Kfs estimates for the two ponded depths of water. The site-specific α* parameter was also used to analyze the data obtained with the BB method.
The Kfs distribution was predominantly log-normal for all developed datasets whereas the α* distribution was normal. The α* values were consistent with expectations based on soil texture for the three sites (α* ≈ 4.7 m-1 in the finer soil and 9.7–16.4 m-1 in the coarser soils).
At each site, mean Kfs values differed by up to 1.2 times in the two sandy loam soils (70-85 and 249-293 mm h-1) and by up to 1.9 times in the clay soil (150-279 mm h-1). Coefficients of variation ranged from 27% to 130%, depending on soil type and measurement method, with both extremes observed in the clay soil. Differences among soils depended on the experimental method (PI, BB) but not on the PI data analysis approach.
In conclusion, a satisfactory correspondence between the PI and BB methods can be expected in sandy-loam soils but less in clay soils. In any case, the differences between the two methods seem more appreciable with reference to Kfs data variability than the mean value of this soil hydrodynamic parameters.

How to cite: Autovino, D., Bagarello, V., Basile, A., Caltabellotta, G., Ciotta, R., Fusco, M., and Iovino, M.: Comparing field-saturated soil hydraulic conductivity determined by the single-ring pressure infiltrometer and bottomless bucket methods, EGU General Assembly 2026, Vienna, Austria, 3–8 May 2026, EGU26-5167, https://doi.org/10.5194/egusphere-egu26-5167, 2026.

Soil moisture dynamics exhibit puzzling regime transitions: under slow processes (evaporation, gentle infiltration), matric potential ψ controls behavior as expected from equilibrium theory; under intense rainfall, macropores activate and dominate flow independent of ψ, with connectivity apparently decoupled from capillary forces. Current models treat these as separate phenomena requiring different physics.
At microscopic level, distribution g(r,t) across pore sizes seeks equilibrium governed by chemical potential μ_w[g]. At macroscopic level, imposed matric potential ψ(t) defines target distribution g_eq(r,ψ) toward which the system evolves on relaxation timescale τ_relax (days to weeks). This dual-level structure generates three regimes depending on Damkhölet number, Da:
For Da << 1 (slow processes) system tracks g_eq(ψ) quasi-statically. Matric potential controls which pores fill/drain via Young-Laplace or adsorption forces. Classical equilibrium models, Richards equation is valid and hysteresis absent (equilibrium limit).
For Da ~ 1 (typical field conditions): Partial level coupling. Gap emerges: Δg = g - g_eq ≠ 0. This decoupling creates memory and path-dependence and hysteresis emerges as natural consequence of non-equilibrium, and non commutativity of the dynamic paths. Standard laboratory measurements (Da ~ 5 in 48-hour protocols) capture quasi-steady states with persistent gaps, explaining lab-field mismatch.
For Da >> 1 (intense rainfall) Water invades network via kinetic percolation—fills largest accessible pores first, independent of local ψ. There is macropores activation when topological connectivity threshold reached (Euler characteristic M_3 > M_3^crit), governed by network geometry not capillary forces.
The meta-dynamics framework unifies these regimes: single physics (g(r,t) evolution toward target g_eq(ψ)) with behavior determined by Da-dependent level coupling.
The apparent dichotomy between “matrix flow” and “macropore flow” reflects degree of meta-dynamic coupling, not different physics.
Based on these theoretical arguments, we generalize Richards equation to track connectivity via Euler characteristic χ(x,t), representing macroscopic signature of microscopic distribution. we show how hydraulic conductivity depends on both water content and connectivity: K = K(θ, χ).
We discuss measurement Implications: Different methods probe system at different Da and sample different aspects of g(r,t). Pressure plate (Da ~ 5) measures quasi-steady states. Rainfall simulators (Da ~ 10-100) capture kinetic regime. Tensiometers sample connected pathways weighted by connectivity, not equilibrium ψ. We provide operational definitions relating measurements to meta-dynamic state and Da regime, explaining systematic method-dependent discrepancies as physics not error.
The framework connects structurally to glass physics (Deborah number = Damköhler, measuring level coupling), plasticity theory (internal state variables bridging scales), and exhibits mathematical parallels to gauge theory (though ψ is control parameter, not gauge field), validated through universal patterns across path-dependent systems. Non-commutativity of wetting-drying [W,D] ≠ 0 emerges as topological property, proving path-dependence unavoidable.
Keywords: Meta-dynamics, path-dependence, dual-level structure, non-equilibrium, Damköhler number, macropore flow, connectivity, soil moisture

How to cite: Rigon, R.: A Meta-Dynamics Framework for Non-Equilibrium Soil Moisture and Unified Matrix-Macropore Flow., EGU General Assembly 2026, Vienna, Austria, 3–8 May 2026, EGU26-5803, https://doi.org/10.5194/egusphere-egu26-5803, 2026.

EGU26-5918 | ECS | Posters on site | SSS6.8

Thermal and hydraulic behavior of substrates for extensive green roofs in mediterranean urban area 

Rosaria Ciotta, Dario Autovino, Cristina Bondì, Massimo Iovino, and Radka Kodešová

The rapid increase in sealed surface in urban area have contributed to the alteration of climatic conditions. The use of vegetation integrated with buildings and other forms of vegetation provides a sustainable solution to these problems, bringing numerous benefits, including the decrease of CO2 emissions consequent to reduction of electricity consumption to regulate the temperature comfort inside buildings and the reduction of surface runoff into urban sewage systems. The main objective of this work was to study the thermal and hydraulic behavior of vegetated and not-vegetated extensive green roofs. For the purpose, two green roof plots were installed on the roof of the building of the Faculty of Agriculture at the University of Palermo. The experiment was carried out in the spring-summer season of 2025. Meteorological data were acquired through a weather station installed on the roof and substrate temperature and volumetric water content were monitored by Teros 12® capacitive probes (Meter Group GmbH) embedded into the green roof plots. Drainage was collected into tanks equipped with ultrasonic transducers for automatic acquisition of water level measurements. A commercial substrate (TMT, Harpo VerdePensile s.r.l) was used with expanded clay as drainage layer. Water retention and hydraulic conductivity function were determined from the laboratory measurements carried out with the evaporation method (Schindler, 1980) using HYPROP apparatus (Meter Group GmbH). Substrate thermal conductivity function parameters were determined according to the Chung and Horton model (1987) on data acquired through the THERMOLINK (Meter Group GmbH). Thermal and hydraulic processes that occur on the roof were then simulated considering both 2D and 3D flow domain by the Hydrus 2D/3D software. Comparison between simulated and measured data during either rainfall events and inter-rainfall periods allowed to highlight the role that vegetation plays on the thermo-hydrological processes and support the use of HYDRUS as a predictive tool in green infrastructure planning and management.

References

Chung, S., Horton, R., 1987. Soil heat and water flow with a partial surface mulch. Water Resources Research 23, 2175–2186. https://doi.org/10.1029/WR023i012p02175

Schindler, U., 1980. Ein Schnellverfahren zur Messung der Wasserleitfähigkeit im teilgesättigten Boden an Stechzylinderproben. Archiv für Acker- und Pflanzenbau und Bodenkunde 24 (1): 1-7.


How to cite: Ciotta, R., Autovino, D., Bondì, C., Iovino, M., and Kodešová, R.: Thermal and hydraulic behavior of substrates for extensive green roofs in mediterranean urban area, EGU General Assembly 2026, Vienna, Austria, 3–8 May 2026, EGU26-5918, https://doi.org/10.5194/egusphere-egu26-5918, 2026.

Accurate soil hydraulic properties (SHP) are essential for groundwater modeling with Richards’ equation. In coastal soils affected by sea-level rise, SHP shift in response to changing salinity and repeated wetting-drying cycles, yet the combined effects of soil salinity and drying memory remain poorly quantified. We conducted a controlled laboratory study to investigate these interactions across the full moisture range in three soils of different textures (sand, sandy loam, and silt loam). Soils were saturated with artificial seawater at three salinity levels, 0, 15, and 30 dS m⁻¹. SHP were measured using HYPROP evaporation experiments and WP4C dewpoint potentiometry over repeated drying cycles. Salinity induced strong, texture-dependent responses. Although salinity imposed a limited influence on the water retention behavior of the sandy silt loam, it resulted in a pronounced increase in unsaturated hydraulic conductivity, consistent with salt-driven flocculation and pore-domain reorganization. Across all textures, SHP exhibited non-linear dependencies on salinity, texture, and drying memory. Model fitting of the measured data showed that the Peters-Durner-Iden (PDI) model outperformed the van Genuchten model, due to its explicit representation of adsorptive water and film flow. The resulting dataset provides a mechanistic foundation for next-generation SHP models that incorporate dynamic soil structure and texture-specific coupling between matric and osmotic effects.

How to cite: Naseri, M. and Jin, Y.: Drying-memory effects and texture-dependent salinity responses revealed by full-range measurements of soil hydraulic properties, EGU General Assembly 2026, Vienna, Austria, 3–8 May 2026, EGU26-6028, https://doi.org/10.5194/egusphere-egu26-6028, 2026.

EGU26-6243 | Posters on site | SSS6.8

Effects of systematic errors in observations on model prediction uncertainty. 

Jan Vanderborght, Marit Hendrickx, Jan Diels, and Pieter Janssens

Observations of soil states obtained from in-situ or remote sensors have various sources of errors. A crude way to represent these errors is to assume that part of the error is purely random whereas another part persists and does not change over time. Since the persistent part does not cancel out when more data become available over time whereas the random part does, the partitioning of the error into a persistent and random part is important to assess the uncertainty of model parameters and model predictions that are derived from these observations. Two approaches can be followed to represent these systematic errors in model parameter estimation. The first approach represents the systematic error as an additional parameter representing the bias that is estimated using additional unbiased observations, which we assumed to have only random errors. A second approach represents the systematic error as a covariance in the error-covariance matrix. The uncertainty of the model predictions in the first approach consists of a term that represents the uncertainty of the bias estimation, which is independent of the magnitude of the bias and depends only on the uncertainty of the unbiased additional observations. When additional unbiased measurements are included in the second approach, which represents bias as error covariance, smaller model prediction uncertainty is obtained than using the first approach. This is especially the case when the covariance representing the bias is smaller than the variance of the average error of the random observations. Including prior knowledge about the bias in the error covariance, reduces the model parameter and prediction uncertainty.

How to cite: Vanderborght, J., Hendrickx, M., Diels, J., and Janssens, P.: Effects of systematic errors in observations on model prediction uncertainty., EGU General Assembly 2026, Vienna, Austria, 3–8 May 2026, EGU26-6243, https://doi.org/10.5194/egusphere-egu26-6243, 2026.

EGU26-6728 | ECS | Posters on site | SSS6.8

Integrated Assessment of Vadose Zone Physical and Hydraulic Properties in Semiarid and Arid Mining Landscapes in Namibia 

Karoline Kny, Stefan Norra, Elisabeth Eiche, Kamuiiua Kamundu, Paulina Nagombe, Sanja Russ, Rosa Sengl, and Theo Wassenaar

Mining deposits form anthropogenic vadose zones with physical, hydrological, and chemical characteristics that diverge strongly from natural soils. Observations show that these deposits rarely undergo spontaneous revegetation, although surrounding landscapes recover without intervention. The mechanisms controlling this failure remain poorly understood, quantitative datasets on these materials are scarce, and no framework currently links deposit genesis, material properties, hydrological functioning, and plant viability. This knowledge gap is critical in countries such as Namibia, where mining underpins the national economy but also causes severe ecological disturbance. As the driest nation in Sub-Saharan Africa, restoration of mine deposits in Namibia is not only constrained by toxicity and altered physical soil properties, but also water scarcity.

The WaMiSAR project aims to develop a toolbox for sustainable, climate-adapted water management within the mining sector of the Southern African Region by jointly addressing water scarcity and restoration of disturbed substrates. A combination of field monitoring, laboratory analyses, and process-based modeling is needed to identify the dominant factors limiting plant growth and to evaluate remediation strategies and irrigation effects in mine residue deposits. The central hypothesis is that plant-available water, rather than chemical contamination, constitutes the primary limiting factor for vegetation establishment on mine deposits in the region, particularly during early seedling stages.

To date, three field campaigns have quantified chemical, physical, and hydrological properties at two contrasting sites in Namibia: (i) Tsumeb, a decommissioned copper mine in the semi-arid north, and (ii) Rosh Pinah, an active zinc-lead mine in the arid south. Initial observations indicate that spontaneous vegetation occurs almost exclusively on sandy surface materials, whereas silt-rich layers, salt crusts, and gravelly substrates remain largely unvegetated. Where vegetation is present, roots extend several decimeters into the substrate. Elevated concentrations of copper, zinc, or lead do not appear to inhibit plant growth, whereas strong contrasts in texture and water-holding capacity are evident. Soil moisture sensors installed at multiple depths capture vadose zone dynamics. The usage of low-cost, humidity-based sensors enable the characterization of water retention in the ultra-dry range, overcoming limitations of conventional techniques.

The project generates a quantitative hydro-physical dataset for mining residues across the full moisture spectrum, identify key constraints on plant establishment, and improve hydraulic parameterizations for dry, anthropogenically altered substrates. These outcomes will support scientifically grounded remediation strategies and form the basis for an operational framework linking deposit origin, climate, substrate properties, and appropriate restoration interventions.

How to cite: Kny, K., Norra, S., Eiche, E., Kamundu, K., Nagombe, P., Russ, S., Sengl, R., and Wassenaar, T.: Integrated Assessment of Vadose Zone Physical and Hydraulic Properties in Semiarid and Arid Mining Landscapes in Namibia, EGU General Assembly 2026, Vienna, Austria, 3–8 May 2026, EGU26-6728, https://doi.org/10.5194/egusphere-egu26-6728, 2026.

Infiltration events, such as rain-on-dry soil or snowmelt over frozen ground, often introduce water at a temperature different from the surrounding soil and air. In such cases, Local Thermal Non-Equilibrium (LTNE) conditions arise, where water, air, ice, and the solid matrix maintain distinct temperatures over extended periods. This is especially true in macropores systems, where rapid flow enhances thermal decoupling.

We present a novel dual-permeability model that resolves water, air, and solid temperatures independently under LTNE conditions. The framework captures the dynamic behavior of macropores and micropores during infiltration and freeze-thaw cycles and is validated against controlled laboratory experiments.

In the first stage, we simulate unsaturated infiltration into soils featuring laboratory-defined macropore configurations under non-isothermal boundary conditions. Sensitivity analyses identified the mass exchange coefficient (γ=10-4 , 10-2 [s-1]) and the macropore volume fraction (ωMa= 0.2, 0.3 [-]) as key parameters controlling thermal equilibration between pore domains. Results show that thermal disequilibrium persists significantly longer in macropores than in micropores, reflecting the dominance of advective transport in larger pore structures. To expand this investigation, we apply the model to freezing and thawing scenarios in cold-region soils. By integrating a three-phase formulation (liquid, ice, solid) and freezing point depression, we reproduce key phenomena such as delayed freezing fronts, preferential flow paths during thaw, and pore-wall ice formation in macropores. These results demonstrate the importance of domain-specific phase dynamics and the need for LTNE frameworks in frozen soil simulations.

This work provides a numerical approach for calibrating thermo-hydraulic dual-permeability models, highlighting how structural features like macropores influence the transient thermal regime during both infiltration and freeze-thaw cycles. Our approach can be extended to support multi-scale modeling and soil temperature prediction under climate-sensitive scenarios.

How to cite: Khanahmadi, H., Heinze, T., Baselt, I., and Bauer, J.: Modeling Heat and Mass Transfer under Local Thermal Non-Equilibrium Conditions in Structured Soils: A Dual-Permeability Approach for Infiltration and Freeze-Thaw Dynamics, EGU General Assembly 2026, Vienna, Austria, 3–8 May 2026, EGU26-7095, https://doi.org/10.5194/egusphere-egu26-7095, 2026.

Dry drainage systems enhance the leaching and migration of soil salinity in cultivated areas through evaporation in fallow zones (low-lying wastelands), improving soil quality in a cost-effective and environmentally friendly manner. However, the ongoing expansion of arable land reduces the extent of such wastelands, underscoring the need to optimize their management for maximal salt discharge. This study examines the contribution of wasteland to regional salt removal and its subsequent effects on arable land distribution, land-use conversion, and salinization dynamics. Taking the Hetao Irrigation District—a large irrigation area located in the upper reaches of the Yellow River and the largest designed irrigation area in China—as the research area, we conducted a salt inversion analysis based on Landsat remote sensing data and land use datasets to extract the distribution, location, and salinization levels of different land types. Our findings reveal substantial changes in both arable land and wasteland in the Hetao Irrigation District. From 2003 to 2023, arable land remained the dominant land-use type in the Hetao Irrigation District, characterized by widespread distribution and relatively large contiguous patches. In contrast, wasteland was primarily distributed in the western and northern regions in 2003, but after 2008, its area decreased significantly, exhibiting a trend toward smaller, more fragmented, and dispersed patches. Specifically, arable land expanded from about 7,800 km² to 8,600 km², accounting for 76.51% of the total area. Wasteland area declined annually from 2008 to 2018 but showed signs of recovery from 2018 to 2023. Although wasteland occupies a relatively small area, it acts as a major salinity sink, concentrating approximately 15.74%–35.09% of the total soil salts in the region. The spatial dispersion of wasteland fluctuated over the observation period. The distribution of wasteland showed the highest dispersion in 2003, followed by alternating phases of aggregation and re-dispersion, without forming a clear long-term trend and maintaining an overall dynamic equilibrium. This suggests that the spatial distribution of wasteland exhibits temporal elasticity, with its dispersion and aggregation significantly influenced by short-term factors, yet no systematic large-scale expansion or contraction occurred. Due to elevated salinization, some cultivated land became unsuitable for crops and transitioned primarily into wasteland or grassland. Spatially, wasteland shifted westward from 2003 to 2018, then returned eastward by 2023, with minimal north–south movement. The salinity dynamics in these discharge zones are influenced by climate, groundwater, and evaporation, which collectively alter salinization patterns and land suitability. Newly formed wastelands continue to absorb salts from surrounding soils, thereby modulating regional salinity levels and influencing land-use configurations. Overall, this study not only provides critical insights into the interactions between arable land and wasteland but also emphasizes the necessity of sustainable land management practices to address salinization challenges. Our findings can inform policymakers and land managers in developing strategies aimed at optimizing land use while preserving soil health and enhancing agricultural resilience in the face of increasing salinity pressures.

How to cite: Yan, S.: The role of wasteland in salt discharge and its impact on the distribution and transformation of arable land, EGU General Assembly 2026, Vienna, Austria, 3–8 May 2026, EGU26-7350, https://doi.org/10.5194/egusphere-egu26-7350, 2026.

EGU26-8364 | Posters on site | SSS6.8

Use of generalized power series for the modeling of 1D and 3D (disc-source) water infiltration into soils 

Laurent Lassabatere, Dario Autovino, Vincenzo Bagarello, and Massimo Iovino

Climate and global changes increase pressure on natural resources, particularly water. Climate change affects hydrological processes and threatens water resources in both quantity and quality. Societal adaptation therefore requires a paradigm shift in water management, including reducing human impacts on the water cycle and restoring the natural cycle. Achieving this transition relies on a detailed understanding of hydrological processes, especially those governing water infiltration into soils. Soil water infiltration modeling has been studied for decades, with approaches ranging from analytical to numerical modeling. Analytical solutions, developed as approximations of Richards’ equation, were initially favored before advances in computational capacity enabled numerical models. Despite this evolution, analytical approaches remain essential for validating and consolidating numerical developments. Among the analytical models proposed, power series expansions in time—more precisely in t1/2 - were the earliest, based on Philip’s pioneering work (Philip, 1957). Later, Haverkamp et al. (1994) introduced an implicit quasi-exact formulation for infiltration into soils with uniform initial water content, afterwards adapted to circular surface sources. These models, along with their short-time expansions, form the basis for experimental data analysis and are typically truncated after the first three terms, as higher-order contributions are negligible (Moret-Fernández et al., 2020).

This study investigates a general power series formulation for modeling water infiltration, I(t) = a1 tα1 + a2 tα2 + a3 tα3, and evaluates its ability to fit numerically generated infiltration data for different choices of exponents and coefficients. The study first demonstrates that the simultaneous estimation of all three exponents and coefficients leads to an ill-posed inversion problem due to model overparameterization. The analysis is therefore restricted to a two-term formulation, I(t) = a1 tα1 + a2 tα2, with parameters optimized sequentially to reduce non-uniqueness. One-dimensional horizontal infiltration data are first analyzed using the single-term model I(t) = a1 tα1, with several inversion strategies, including fixing the parameters to the reference values a1 = S (soil sorptivity) and α1=1/2. One-dimensional vertical infiltration and disc-source infiltration are then fitted to estimate the remaining parameters a2 and α2. Parameter estimation options, including reference values from Haverkamp et al. (1994), are evaluated across multiple soils and initial saturation conditions. Finally, the obtained parameter values are discussed in light of physical considerations. This study aims to contribute to the development and application of analytical approaches for modeling water infiltration.

References

  • Haverkamp, R., Ross, P.J., Smettem, K.R.J., Parlange, J.Y., 1994. Three-dimensional analysis of infiltration from the disc infiltrometer. 2. Physically based infiltration equation. Water Resour. Res. 30, 2931–2935.
  • Moret-Fernández, D., Latorre, B., López, M.V., Pueyo, Y., Lassabatere, L., Angulo-Jaramilo, R., Rahmati, M., Tormo, J., Nicolau, J.M., 2020. Three- and four-term approximate expansions of the Haverkamp formulation to estimate soil hydraulic properties from disc infiltrometer measurements. Hydrol. Process. 34, 5543–5556. https://doi.org/10.1002/hyp.13966
  • Philip, J., 1957. The theory of infiltration: 1. The infiltration equation and its solution. Soil Sci. 83, 345–358.

This project has received funding from European Union’s HORIZON EUROPE research and innovation program GA N°101072777-PlasticUnderground HEUR-MSCA-2021-DN-01.

How to cite: Lassabatere, L., Autovino, D., Bagarello, V., and Iovino, M.: Use of generalized power series for the modeling of 1D and 3D (disc-source) water infiltration into soils, EGU General Assembly 2026, Vienna, Austria, 3–8 May 2026, EGU26-8364, https://doi.org/10.5194/egusphere-egu26-8364, 2026.

EGU26-8667 | ECS | Posters on site | SSS6.8

Soil water and salt transport in seasonally frozen cropland: isotopic tracing method with geochemical modelling  

Huili Zhang, Chengwei Wan, Grzegorz Skrzypek, and John J Gibson

Understanding the dynamics of water and salt migration in seasonally frozen agricultural soils is critical for effective arid land management. This study combined field monitoring with a three-method extraction strategy for stable isotope analyses (direct vapor equilibration, centrifugation, and cryogenic vacuum distillation). By integrating resulting isotope signatures into an Isotope Mass Balance (IMB) model, we quantitatively differentiated phase-state water pools. The results confirmed that freezing induces significant Rayleigh fractionation, enriching ice in heavy isotopes relative to mobile water. In contrast, the bound water fraction remains hydraulically isolated and isotopically distinct, requiring its exclusion from phase-change calculations. Coupling with geochemical modelling (FREZCHEM) revealed that salt migration is controlled by the interplay between thermally driven convective fluxes and concentration-driven diffusive fluxes, although individual ion exhibited distinct redistribution pathways.

Cryogenic precipitation regulates soil salt transport regime: extensive surface crystallization reduces dissolved ion concentrations, thereby maintaining the steep upward gradient required for continuous salt accumulation. The model demonstrated that crystallization accounted for up to 40.5 % of the total salt load incorporated into solid phases during freezing. These solid salts create a "geochemical trap" in which re-dissolution lags behind the initial spring meltwater pulse, significantly reducing leaching efficiency. Consequently, sustainable salinity management cannot rely on hydraulic regulation alone. Effective irrigation strategies must integrate groundwater management with the specific composition of the salt load to overcome these persistent geochemical constraints.

How to cite: Zhang, H., Wan, C., Skrzypek, G., and Gibson, J. J.: Soil water and salt transport in seasonally frozen cropland: isotopic tracing method with geochemical modelling , EGU General Assembly 2026, Vienna, Austria, 3–8 May 2026, EGU26-8667, https://doi.org/10.5194/egusphere-egu26-8667, 2026.

One dimensional dual-permeability models are used to simulate preferential flow and transport in soils. In these models, soil structure, including large biopores and cracks, is accounted for in a simple way by splitting the total porosity into a micropore and a macropore domain with first-order equations governing the transfer of water and solutes between the domains. The transfer equations are central in dual-permeability models because the values of the included parameters have a strong influence on the degree of simulated preferential flow and transport. These transfer terms include a parameter describing the characteristic length of the soil matrix structure. This characteristic length is well defined for idealised pore geometries. However, such idealised pore geometries are poor representations of macropore networks in intact soil. Our objective was to test if values of parameters governing the degree of preferential transport in dual-permeability models could be estimated from measures of soil structure derived from X-ray tomography images. To achieve this, we calibrated the dual-permeability model MACRO against non-reactive solute breakthrough curves obtained at two flow rates from 33 intact soil columns sampled from a field with large variation in soil properties. Relations between measures of soil structure derived from images of the same columns and values for parameters governing preferential transport were then evaluated. The MACRO model could reproduce all BTCs well except those for three sandy soils. When the saturated water content of the soil matrix, here used to account for possible water repellency, was included in the calibration also the BTCs for the sandy soils were well reproduced. Preliminary results indicate that the fractal dimension of the total imaged pore network is the strongest predictor for the characteristic length of the soil matrix. The other included model parameters were not strongly correlated with any measures of the total imaged pore network. We will also present results for the imaged percolating macropore networks (i.e. the parts of the pore networks connected to both the top and bottom of the imaged region of interest), which is a better representation of the pore network that was active during the transport experiments.

How to cite: Larsbo, M. and Fukumasu, J.: The relation between X-ray-derived measures of soil structure and dual-permeability model parameter values, EGU General Assembly 2026, Vienna, Austria, 3–8 May 2026, EGU26-9525, https://doi.org/10.5194/egusphere-egu26-9525, 2026.

EGU26-9587 | Orals | SSS6.8

A Generic Data-driven model for Soil Moisture Prediction  

Vidya Sumathy, Ilektra Tsimpidi, and George Nikolakopoulos

In the literature, most of the scientific approaches that appeared in the related Soil Moisture (SM) have been generated by trying to model physical interactions between the sampled parameters and their effect on their environment. Classical approaches in this direction have been physics-based models, such as the water balance model, which describe hydrological processes [Hu, Xiande et.al.2025]. These models use physics-based equations and require high-quality input data. Furthermore, their high computational cost limits their use in large-scale applications. Statistical methods were subsequently incorporated to enhance model adaptability [Fu, Rong, et.al., 2023]. Through data-driven approaches, empirical relationships between soil moisture and environmental parameters can be established with efficient computational costs. 

In contrast to these well-known areas, this work is trying to develop a comprehensive survey of the most popular data driven algorithms reported in the literature. These algorithms could be further categorized as: a) classical machine learning models (e.g., Random Forests and Support Vector Machines), b) deep learning models (e.g., Long Short-Term Memory, Artificial Neural Networks and Convolutional Neural Networks), c) statistical models (Multiple Linear Regression and Autoregressive Integrated Moving Average) and d) geostatistical models (Kriging). As the name indicates, these models use data as input, which are either historical data of SM, or environmental data, or both to predict soil classification such as wet or dry soil, or continuous soil moisture estimation using regression. The construction of such models typically entails an initial exploration of the data, the evaluation of several candidate models, and the final selection and training of a model using an appropriate learning algorithm [Ding et. al.2018].    

As an overall conclusion, the most common physical parameters utilized in data drive models that affect SM variation include air temperature, precipitation, air relative humidity, solar radiation, soil type, topography, and vegetation cover data. GPS location data is also important for allowing generality and adaptability in the field. Thus, we are aiming to create a novel generic data driven model, as depicted in Figure1, that will take into consideration all the previous parameters to generalize the estimation of the SM and expand its applicability in other fields without real field measurements. For achieving this, the first potential candidate as a data driven learning model will be the Long Short-Term Memory (LSTM).  

Figure 1: A block diagram of the proposed Generic Data-Driven Model.

References 

Hu, Xiande et.al. "Urban rainwater resource utilization: A sustainable environmental impact assessment using life cycle assessment (LCA) and water balance model." Desalination and Water Treatment 322 (2025): 101094. 

Fu, Rong, et.al. "A soil moisture prediction model, based on depth and water balance equation: A case study of the Xilingol League Grassland." International Journal of Environmental Research and Public Health 20, no. 2 (2023): 1374. 

Ding, Jie, et.al. "Model selection techniques: An overview." IEEE Signal Processing Magazine 35, no. 6 (2018): 16-34. 

How to cite: Sumathy, V., Tsimpidi, I., and Nikolakopoulos, G.: A Generic Data-driven model for Soil Moisture Prediction , EGU General Assembly 2026, Vienna, Austria, 3–8 May 2026, EGU26-9587, https://doi.org/10.5194/egusphere-egu26-9587, 2026.

EGU26-10008 | ECS | Posters on site | SSS6.8

Disentangling Plant-Induced Soil Effects on Runoff: Experiments and Modeling of Miscanthus 

Florian Bucher, Mark Tuschen, Mariele Evers, and Markus Weiler

Land use is a key driver of differences in runoff generation and play an important role in water retention and the mitigation of surface runoff during high-intensity rainfall events. Perennial crops’ permanent root system and persistent mulch layers can substantially modify soil physical properties in comparison to annual crops, thereby influencing soil hydraulic functioning and runoff generation processes. While existing studies commonly compare the effects of perennial crops on infiltration, runoff, or water balance at longer temporal scales, experimental data on runoff responses under short, high-intensity rainfall events are quite scarce. In particular the hydrological behavior of agricultural fields cultivated with perennial crops remains poorly understood. For Miscanthus x giganteus, a perennial crop commonly grown for bioenergy production and increasingly investigated as a sustainable building material, observations on hillslopes in the Erft catchment during heavy rainfall events in 2016 and 2022 suggest runoff retention effects. Therefore, we quantified the influence of Miscanthus on runoff generation during heavy rainfall events. A series of different artificial rainfall experiments were conducted on three different 10 x 10 m plots cultivated with Miscanthus, winter wheat and permanent pasture serving as reference land-use type. Surface and subsurface runoff were measured at the bottom of each hillslope plot under different rainfall intensities producing in total 36 experiments. To separate the plant-induced effects on soil structure and hydrological processes, the experiments were also simulated with the process-based runoff-generation model RoGeR, which includes various preferential flow processes. The results from the measurements indicate a pronounced retention effect of Miscanthus during the runoff initiation phase, leading to lower runoff rates than winter wheat. However, no clear differences in total surface runoff volumes were observed under the applied rainfall conditions. These findings indicate that the persistent mulch layer associated with perennial crops such as Miscanthus can substantially modify runoff dynamics during high-intensity rainfall events and reduce soil erosion. Ongoing modelling of the experiments with RoGeR aims to quantify the contribution of different preferential flow paths and to investigate why Miscanthus does not reduce total surface runoff relative to tall, fully developed winter wheat. The results will improve process-level understanding of the effects of perennial crops on runoff generation under extreme rainfall events and have implications for the assessment of nature-based solutions and land-management strategies aimed at flood mitigation.

How to cite: Bucher, F., Tuschen, M., Evers, M., and Weiler, M.: Disentangling Plant-Induced Soil Effects on Runoff: Experiments and Modeling of Miscanthus, EGU General Assembly 2026, Vienna, Austria, 3–8 May 2026, EGU26-10008, https://doi.org/10.5194/egusphere-egu26-10008, 2026.

EGU26-12069 | Posters on site | SSS6.8

Mapping Infiltration Shape Parameters for Enhanced Soil Hydraulic Characterization 

Simone Di Prima, Frederic Do, Olivier Roupsard, and Laurent Lassabatere

Purpose. Accurate characterization of water infiltration into the vadose zone requires estimating key soil hydrodynamic properties, including the macroscopic capillary length (λc) and saturated hydraulic conductivity (Ks). These parameters quantify the contributions of capillarity and gravity (λc) and gravity-driven flow (Ks) during infiltration. Both λc and Ks can be estimated in the field using a simple Beerkan infiltration test, which requires minimal equipment, limited water, and no specialized operators. Their calculation, however, depends on “integral” shape parameters that vary strongly with soil type. In this study, we present new formulations based on integrating the hydraulic conductivity function expressed in terms of pressure head. These formulations allow accurate estimation of shape parameters even under dry soil conditions, providing an alternative to previous methods that rely on diffusivity or conductivity expressed as a function of water content.

Method. We applied the new formulations to calculate soil-dependent shape parameters for the twelve USDA textural classes. Their performance in estimating λc and Ks was evaluated using synthetic cumulative infiltration curves generated with HYDRUS-2D/3D and compared with results obtained using default literature values. For practical applications, we propose two approaches to select appropriate shape parameters: (i) based on soil samples to determine textural class, and (ii) using texture-dependent parameter maps for site-specific selection. Both approaches were tested using a dataset of 167 Beerkan infiltration experiments across seven sites in Burundi, Ghana, Italy, and Senegal.

Results. The sample-based approach provides higher accuracy in estimating λc and Ks, whereas the map-based approach eliminates the need for laboratory analysis and still outperforms default literature values, making it suitable for large-scale studies. To support the map-based method, we provide parameter maps at 250 m resolution for six countries (Burundi, Cameroon, Ghana, Italy, Kenya, and Senegal), alongside complementary soil property maps from the SoilGrids database (clay, sand, silt content, dry bulk density, and USDA soil texture classes), all freely accessible. Additionally, we propose a simplified method for estimating λc using a new empirical relationship that requires only the Mualem–van Genuchten shape parameter n, which can be derived from SoilGrids texture data using pedotransfer functions such as Rosetta3. Complementary maps of all Mualem–van Genuchten parameters are also provided.

Conclusions. This work improves and simplifies the field estimation of key soil hydrodynamic properties by providing shape parameters for all USDA texture classes and accessible maps for parameter extraction. The approach facilitates the hydraulic characterization of large areas and extensive datasets, supporting both local and regional-scale infiltration studies.

Data availability

Soil property and parameter maps at 250 m resolution for Burundi, Cameroon, Ghana, Italy, Kenya, and Senegal are available in the open-access digital repository Zenodo at https://doi.org/10.5281/zenodo.17397791

Funding

This work was supported through the project GALILEO ― Strengthening rural livelihoods and resilience to climate change in Africa: innovative agroforestry integrating people, trees, crops and livestock (project number: 101181623), funded by the European Union.

How to cite: Di Prima, S., Do, F., Roupsard, O., and Lassabatere, L.: Mapping Infiltration Shape Parameters for Enhanced Soil Hydraulic Characterization, EGU General Assembly 2026, Vienna, Austria, 3–8 May 2026, EGU26-12069, https://doi.org/10.5194/egusphere-egu26-12069, 2026.

EGU26-12159 | ECS | Orals | SSS6.8

Effect of woodchips on water infiltration into soil : evidence of mitigating clogging and hydraulic conductivity reduce  

Margot Coisnon, Pauline Louis, Vincent Chatain, Laurent Lassabatere, and Remi Clement

The infiltration of urban water is an increasingly adopted practice downstream of wastewater treatment plants for the disposal of treated effluents. To maintain optimal infiltration conditions, materials such as gravel are commonly added to soils receiving the treated water. However, these materials involve significant economic and environmental costs, and their long-term effectiveness when combined with soil remains limited.

This study investigates the use of woodchips as an alternative material for the infiltration of treated wastewater. This material, primarily composed of organic matter, is less costly and may offer advantageous properties to sustain soil infiltration over time, both in terms of hydraulic performance and treatment capacity.

To this end, two pilot columns composed solely of a low-infiltration-capacity soil layer and two columns composed of the same soil layer overlain by a woodchip layer were hydraulically monitored over a four-year period. The objective was to assess the potential of woodchips to maintain or enhance infiltration in soils over time and to follow water infiltration into the two systems soil (control) and soil with an upper layer of woodchips. Two large columns—one consisting of soil alone and the other of soil overlain by woodchips—were subjected to successive infiltrations of treated wastewater volumes (mimicking a wastewater treatment plant outlet). Water infiltration, storage, and drainage were monitored in both systems. One-dimensional hydraulic modeling of the columns was performed using HYDRUS-1D to solve Richards’ equation and simulate the system behavior. The modeling was based on the van Genuchten–Mualem formulation for the water retention and hydraulic conductivity functions, as commonly adopted. Fitting the experimentally measured quantities enabled the estimation of intrinsic soil hydraulic parameters and the characterization of their temporal evolution over the four years of operation.

In addition to inversion and parameter estimation, a sensitivity analysis of the hydraulic parameters—namely saturated hydraulic conductivity (Kₛ), α, and n—was performed to strengthen the reliability of the modeling results and parameter estimates. This analysis highlights the predominant influence of Kₛ on variations in the soil water retention curves, leading to its selection as a key indicator of the evolution of soil infiltration performance. Furthermore, electrical resistivity tomography (ERT) measurements were used to monitor water distribution within the columns during feeding and resting phases. These data also served to further calibrate the model and gave insights on processes at the interface between the woodchips and the soil below, then improving system representation.

The modeling results demonstrate the significant role of woodchips in sustaining infiltration capacity. The Kₛ values estimated for soils amended with woodchips are consistently higher than those obtained for soils without woodchips. Such benefits is expected to result to the release of organic matter with a benefic effect on the soil structure.

How to cite: Coisnon, M., Louis, P., Chatain, V., Lassabatere, L., and Clement, R.: Effect of woodchips on water infiltration into soil : evidence of mitigating clogging and hydraulic conductivity reduce , EGU General Assembly 2026, Vienna, Austria, 3–8 May 2026, EGU26-12159, https://doi.org/10.5194/egusphere-egu26-12159, 2026.

EGU26-12963 | ECS | Posters on site | SSS6.8

Hierarchical modelling to map soil salinity using proximal sensing and a multispectral UAV 

Lorena Salgado, Andrea Martín, Verónica Peña, Diego Soto-Gómez, Carlos Rad, Carlos Cambra, José Luis R. Gallego, and Rocío Barros

Soil salinity commonly exhibits strong within-field variability, and operational diagnosis requires scaling point-based reference measurements to spatially continuous estimates. This study evaluates a hierarchical, cascading modelling framework to map soil salinity at field scale in agricultural plots in Belorado (Burgos, Spain), integrating laboratory reference data with diffuse reflectance spectroscopy, proximal apparent electrical conductivity sensing, and very-high-resolution multispectral UAV products.

In each plot, 40 sampling locations are established and georeferenced using GNSS RTK. Soil samples collected at these locations are analysed in the laboratory to obtain salinity reference values. On the same day, and prior to the commencement of sampling operations, a multispectral UAV survey (DJI P4 Multispectral) is conducted to generate high-resolution orthomosaics and derived spectral variables. This is followed by a full-coverage proximal survey using a VERIS Q2800 system to measure apparent electrical conductivity (ECa) continuously across each plot. After these surveys, sampling is performed and diffuse reflectance spectra are acquired in situ at the GNSS-referenced locations using a NeoSpectra (Si-Ware) instrument. In addition, laboratory spectroscopy is repeated on air-dried samples to quantify moisture effects and to assess the consistency between field and laboratory spectral acquisitions.

The upscaling strategy is implemented as a cascade of transfer models: (i) laboratory salinity and diffuse reflectance spectroscopy, (ii) diffuse reflectance spectroscopy and ECa (VERIS), and (iii) ECa and UAV-derived spectral variables, enabling plot-wide prediction. Model performance is assessed using cross-validation, including spatially explicit schemes, and uncertainty propagation along the cascade is examined where feasible. The outcome is a reproducible workflow for producing field-scale salinity maps and quantifying the added value of each sensing layer in the hierarchical framework.

How to cite: Salgado, L., Martín, A., Peña, V., Soto-Gómez, D., Rad, C., Cambra, C., Gallego, J. L. R., and Barros, R.: Hierarchical modelling to map soil salinity using proximal sensing and a multispectral UAV, EGU General Assembly 2026, Vienna, Austria, 3–8 May 2026, EGU26-12963, https://doi.org/10.5194/egusphere-egu26-12963, 2026.

A fundamental challenge in soil physics is understanding how particle size distribution and structural organization jointly determine hydraulic behavior. Traditional analytical methods systematically destroy structural context to isolate "pure" texture measurements, eliminating the very relationships we seek to understand. While we know texture and structure interact, quantifying their relative contributions and functional interdependence across diverse soils remains elusive. We use interpretable machine learning as a discovery tool to disentangle texture and structure effects on soil water retention and hydraulic conductivity. Through staged training experiments, we systematically isolate texture-only predictions (sand, silt, clay) from structure-mediated modifications (bulk density, organic carbon). By freezing model components that interpret hydraulic behavior and controlling input availability during training, we extract learned representations that reveal how structural context alters the hydraulic meaning of identical particle size distributions. Our approach incorporates physical constraints while learning representations that capture functional complexity beyond what simple texture classes encode. Initial analyses suggest that structural inputs progressively reorganize texture-based patterns in the learned embedding space, with the magnitude of structural modulation varying systematically across soil types. Soils with identical particle size distributions occupy distinct functional spaces depending on bulk density and organic matter content—texture acquires hydraulic meaning only through structural context. These learned representations align with physical intuition: structural effects dominate precisely where classical pedotransfer functions show highest uncertainty. This demonstrates how interpretable AI can recover relationships eliminated by reductionist analytical protocols, transforming machine learning from a prediction tool into an instrument for scientific insight. Beyond improving hydraulic property estimation, the methodology offers a framework for investigating other soil properties where composition and organization interact to determine function—challenging us to rethink what we measure and how we interpret it.

How to cite: Ghezzehei, T.: Deciphering Texture-Structure Interactions in Soil Hydraulic Behavior Through Interpretable Neural Networks, EGU General Assembly 2026, Vienna, Austria, 3–8 May 2026, EGU26-14966, https://doi.org/10.5194/egusphere-egu26-14966, 2026.

The wide availability of high-performance computing resources has opened possibilities to employ complex, physically-based soil-water flow models at larger scales. While detailed 1D models like SWAP (Soil-Water-Atmosphere-Plant) are ideal for modelling unsaturated flow and crop growth at field scale, their traditional design tailored for single-column applications limits their scalability. This legacy structure creates a significant challenge when attempting to perform quasi-3D distributed simulations or when coupling with regional groundwater models such as MODFLOW, where thousands of interacting columns must be solved simultaneously.

This poster presents a refactoring effort that enables SWAP to run many independent 1D columns truly in parallel within one process, supporting high-throughput simulations with minimal I/O bottlenecks. This modernization targets the needs of modern environmental data science, such as (i) memory-efficient integration with spatial libraries (e.g., NetCDF), and (ii) seamless compatibility with parameter estimation and uncertainty frameworks (e.g., PEST) which require thousands of iterative model calls. By enabling direct memory access to state variables, the updated framework removes the overhead of disk operations, facilitating autocalibration and sensitivity analysis even at scale.

A motivating application is the Kinrooi subirrigation experiment, where spatial variability in soil hydraulic properties and boundary conditions influences the effective recharge rate. The poster shows how the updated parallel approach makes it practical to explore these spatial patterns while preserving the mechanistic detail of the original model.

How to cite: Zawadzki, M.: Scaling up SWAP: multi-instance parallel execution for soil-water–atmosphere-plant simulations, EGU General Assembly 2026, Vienna, Austria, 3–8 May 2026, EGU26-15486, https://doi.org/10.5194/egusphere-egu26-15486, 2026.

EGU26-16664 | ECS | Orals | SSS6.8

Root Zone Soil Moisture dynamics from Terrestrial  Water-Energy Coupling across Indian Agroecological Regions 

Yeswanth Naidu Adigarla and Dr. Sarmistha Singh

Understanding root zone soil moisture dynamics across seasons is essential for improving land–atmosphere coupling estimates and drought monitoring.  Seasonal variability of soil moisture thresholds – the effective critical point (SWT) and effective wilting point (STD) and response (Λ) of root zone soil moisture dynamics to surface soil moisture observations are derived by adjusting the low pass filter parameter (Λ) across India's agroecological zones. Results show that SWT varies substantially across seasons and landscapes, controlled by soil texture, evaporative demand, and infiltration, while STD remains more physiologically constrained with limited spatial variability. We find that the driest regions (northwest India) exhibit the lowest thresholds (<0.12), while humid, forested zones (northeast India, Western Ghats) maintain the highest thresholds (~0.25–0.30) due to deeper soils and persistent vegetation. Seasonally, threshold (SWT) are lowest in the dry winter/premonsoon (JF–MAM) in arid areas and rise sharply during the monsoon (JJAS) when soils recharge, reaching maxima (> 0.30) under dense canopies. The analysis reveals that arid/semi-arid zones have very strong positive feedback in dry seasons ( Λ ≈ 0.8–1.0, m  ≈ 8–10), whereas humid/coastal regions remain largely decoupled (Λ ≈ 0.2–0.5, m ≈2–4) year-round. Correlation with SMAP Level-4 demonstrates strong agreement, with high values (>0.75) across most regions. Areas with lower agreement align with complex terrains and dense vegetation where vertical signal propagation is less coherent. Seasonal variation in the transitional slope (m) and LP filter parameter (Λ) further reveals dynamic coupling regimes that govern evapotranspiration control. These findings emphasize the need to incorporate seasonally adaptive thresholds and infiltration parameters in land surface modeling to better represent ecohydrological processes and surface flux feedbacks.

How to cite: Adigarla, Y. N. and Singh, Dr. S.: Root Zone Soil Moisture dynamics from Terrestrial  Water-Energy Coupling across Indian Agroecological Regions, EGU General Assembly 2026, Vienna, Austria, 3–8 May 2026, EGU26-16664, https://doi.org/10.5194/egusphere-egu26-16664, 2026.

EGU26-17481 | ECS | Posters on site | SSS6.8

Automated Filtering versus Moving Average in the Analysis of Automated Beerkan Infiltrometer Data 

Faye Waly, Orange Didier, Do Frederic, Roupsard Olivier, and Niang Awa

The use of the automated Beerkan infiltrometer (10.1016/j.compag.2015.09.022) represents an interesting alternative to the classical Beerkan infiltration test. The device enables the measurement of field infiltration rates at a higher temporal resolution than manually conducted tests. Although the infiltrometer can be easily implemented in the field and provides good measurement reproducibility, the analysis of raw experimental data requires appropriate processing to ensure reliable estimation of soil hydraulic parameters using the BEST algorithms.

The automated infiltrometer operates as follows. Water infiltrates at the soil surface, and when the water depth decreases below a given threshold, the Mariotte bottle of the infiltrometer is activated and allows an air bubble to enter the reservoir. Consequently, the increase in air pressure in the reservoir releases an amount of water. Under ideal conditions, monitoring of the air pressure in the system produces a piecewise-constant step function. Each plateau corresponds to a constant water height in the reservoir and is separated from the next by oscillations caused by the passage of the air bubble. Therefore, the signal must be filtered using appropriate filtering techniques in order to identify the points that properly define the cumulative infiltration curve. In the ideal case, the selected points should correspond to the end of each plateau, which defines the exact time at which the infiltrometer supplies water. However, in many cases the signal is noisy, making filtering a challenging task.

This study compares the performance of two mathematical approaches commonly used to process raw pressure transducer data: (i) an automatic filtering method based on first and second derivatives to detect plateaus (i.e., periods of constant water height in the reservoir), and (ii) the commonly used moving average technique. Experimental data collected on a well-structured, cultivated sandy soil in Senegal were used to assess the impact of the two filtering approaches on the determination of cumulative infiltration and on the estimation of saturated soil hydraulic conductivity (Ks) and soil sorptivity (S), using the three BEST algorithms (BEST-slope, BEST-intercept, and BEST-steady).

We expect that comparison of the cumulative infiltration curves obtained with the two methods will reveal discrepancies, and that the automated filtering approach will better preserve infiltration dynamics, as suggested by preliminary results. In contrast, the moving average method may excessively smooth the data, potentially leading to biased estimates of hydraulic parameters, particularly under conditions of strong capillary effects. A synthesis of the results from both methods will help identify the most appropriate filtering approach.

How to cite: Waly, F., Didier, O., Frederic, D., Olivier, R., and Awa, N.: Automated Filtering versus Moving Average in the Analysis of Automated Beerkan Infiltrometer Data, EGU General Assembly 2026, Vienna, Austria, 3–8 May 2026, EGU26-17481, https://doi.org/10.5194/egusphere-egu26-17481, 2026.

EGU26-19250 | ECS | Posters on site | SSS6.8

Sentinel-derived soil moisture retrievals during winter and summer cropping: Potential and limitations of S²MP 

Henri Bazzi, Marit Hendrickx, Nicolas Baghdadi, and Sami Najem

Field-scale soil moisture retrieval from Sentinel-1 synthetic aperture radar (SAR) is rather well established for bare soils, winter crops, and grasslands, but its applicability during summer cropping periods remains uncertain due to dense vegetation and complex vegetation structure. This study evaluates the potential and limitations of the Sentinel-derived soil moisture product (S²MP, El Hajj et al. (2017)), based on a neural network that uses Sentinel-1 VV backscatter and Sentinel-2 NDVI, for surface soil moisture estimation during summer cropping.

The first part of this study evaluates S²MP against in situ measurements at 10 cm depth over several winter and summer crops in a Mediterranean context (Bazzi et al., 2023). Results show that Sentinel-1 mainly senses the top few centimetres of soil, leading to strong underestimation in dry conditions (up to ~20 vol.%) and smaller biases under moderately wet conditions, while performance degrades again in very wet soils. Reliable soil moisture retrievals are limited to low–moderate vegetation cover (NDVI < 0.7), with crop-dependent biases under dense canopies, and accuracy improves at lower radar incidence angles (< 35°).

The second part analyses summer vegetable case studies in Flanders, comparing S²MP with in situ observations across irrigated and rainfed fields. S²MP successfully captures rainfall and irrigation signals during early growth stages and differentiates irrigated from non-irrigated areas, but performance under dense canopies strongly depends on crop type. Crops with complex canopy structures (e.g. beans podding stage, pumpkins) show reduced or inconsistent sensitivity, while onions and carrots retain detectable soil moisture dynamics even at high NDVI. These results demonstrate that NDVI alone is insufficient to characterise vegetation effects on SAR soil moisture retrievals and highlight the need for crop-specific parameterisation and complementary longer-wavelength SAR observations.

References:
El Hajj, M., Baghdadi, N., Zribi, M., & Bazzi, H. (2017). Synergic Use of Sentinel-1 and Sentinel-2 Images for Operational Soil Moisture Mapping at High Spatial Resolution over Agricultural Areas. Remote Sensing 2017, Vol. 9, Page 1292, 9(12), 1292. https://doi.org/10.3390/RS9121292

Bazzi, H., Baghdadi, N., Nino, P., Napoli, R., Najem, S., Zribi, M., & Vaudour, E. (2023). Retrieving Soil Moisture from Sentinel-1: Limitations over Certain Crops and Sensitivity to the First Soil Thin Layer. Water 2024, Vol. 16, Page 40, 16(1), 40. https://doi.org/10.3390/W16010040

How to cite: Bazzi, H., Hendrickx, M., Baghdadi, N., and Najem, S.: Sentinel-derived soil moisture retrievals during winter and summer cropping: Potential and limitations of S²MP, EGU General Assembly 2026, Vienna, Austria, 3–8 May 2026, EGU26-19250, https://doi.org/10.5194/egusphere-egu26-19250, 2026.

EGU26-19493 | ECS | Posters on site | SSS6.8

Soil thermal and moisture regime beneath forest canopy:  A coupled modeling approach 

Václav Steinbach, Michal Kuráž, and Marta Kuželkova

The interaction between water, vapor, and heat transport in soils plays a pivotal
role in regulating soil moisture and thermal regimes in forest ecosystems, yet
these processes are often modeled independently. Such approach may overlook
their inter-dependent dynamics, particularly under forest canopies where inter-
ception, evaporation, and energy exchange are strongly correlated. In this study,
a physics-based canopy interception model was developed and calibrated using
throughfall monitoring data from the AMALIA experimental site in central Bo-
hemia. The simulated intercepted rainfall is subsequently used as an upper
boundary condition for the Saito–Sakai model which couples the transport of
water, vapor, and heat in the soil profile. Surface energy balance was applied
as the thermal boundary condition, accounting for coupled heat and vapor ex-
change, while precipitation served as the moisture flux boundary. The model
was calibrated and validated against month-long soil temperature and moisture
measurements across three soil horizons, with meteorological forcing derived
from ERA5-Land hourly reanalysis data interpolated to match the observational
time step. Model performance demonstrated good agreement with observations,
successfully reproducing soil temperature and moisture dynamics beneath the
forest canopy and highlighted the importance of interception-induced delays of
rainfall inputs. Results demonstrate that neglecting canopy–soil interactions
can lead to biased estimates of near-surface soil states, particularly during wet-
ting and drying events. The proposed approach provides a physically consistent
link between canopy processes and subsurface thermal–hydrological dynamics
and can improve the representation of forest soil conditions in land-surface and
ecohydrological models.

How to cite: Steinbach, V., Kuráž, M., and Kuželkova, M.: Soil thermal and moisture regime beneath forest canopy:  A coupled modeling approach, EGU General Assembly 2026, Vienna, Austria, 3–8 May 2026, EGU26-19493, https://doi.org/10.5194/egusphere-egu26-19493, 2026.

EGU26-21574 | Posters on site | SSS6.8

Combining Gamma Ray Sensing and Digital Technology for Soil Moisture and Soil Property Mapping: advancing integrated tools for sustainable soil management 

Hami Said, Mariko Fujisawa, Gerd Dercon, Claudio Jose Chagas, Daniel Francisco Palacios Fernández, Daozhi Gong, Gabriele Baroni, Jacques Bezuidenhout, Leticia Gaspar Ferrer, Majken Caroline Looms Zibar, Modou Modou, Syafiq Mohd Amin Mohamad, Nicola Mansfield, Peter Strauss, Virginia Strati, and William Blake

Soil health and moisture availability are critical for increased productivity and sustainable agricultural systems, particularly in the face of increasing environmental variability and land degradation. The Joint FAO/IAEA Centre Coordinated Research Project (CRP) D12015 brings together 12 Member States to advance gamma-ray spectrometry (GRS) as an innovative, non-invasive nuclear technique for high-resolution soil property mapping. The objective is to advance GRS integrated with digital and remote sensing technologies, such as drone and satellite imagery, environmental sensors, and machine learning, for precise and scalable mapping of soil properties including texture, organic carbon, nitrogen, and moisture. These efforts support the evaluation of erosion risk, improve resource efficiency, and strengthen resilient farming systems.

The first Research Coordination Meeting (Vienna, December 2025) established a clear roadmap for advancing GRS as a nuclear tool for soil monitoring. Key priorities include developing standardized and transferable protocols for GRS deployment and calibration across diverse agro-ecological zones, defining minimal datasets for robust conversion models, and validating both empirical and physics-based predictive approaches for soil physical properties and moisture. The CRP emphasizes the integration of GRS with complementary digital technologies, such as drone-based multispectral and thermal imaging, satellite remote sensing, and geospatial data fusion, to deliver high-resolution soil maps and decision-support tools.

Applications span three primary areas: (i) the synergistic use of stationary and mobile GRS for precision agriculture mapping, (ii) the fusion of GRS and remote sensing to support irrigation efficiency and drought resilience, and (iii) predictive soil property mapping using multi-sensor datasets and machine learning. Discussions highlighted the need for harmonized methodologies, transparent conversion of radionuclide signals to soil attributes, and rigorous uncertainty quantification to ensure reproducibility and trust in science-based GRS evidence. When implemented with rigor and data traceability, GRS offers a transformative pathway for Sustainable and Resilient Agriculture. Planned outputs include illustrated guidelines, validated case studies, and user-friendly decision-support platforms integrating GRS outputs with crop and water management models. These tools will strengthen Member State capacity to apply nuclear and digital technologies for sustainable soil management.

How to cite: Said, H., Fujisawa, M., Dercon, G., Jose Chagas, C., Palacios Fernández, D. F., Gong, D., Baroni, G., Bezuidenhout, J., Gaspar Ferrer, L., Zibar, M. C. L., Modou, M., Mohd Amin Mohamad, S., Mansfield, N., Strauss, P., Strati, V., and Blake, W.: Combining Gamma Ray Sensing and Digital Technology for Soil Moisture and Soil Property Mapping: advancing integrated tools for sustainable soil management, EGU General Assembly 2026, Vienna, Austria, 3–8 May 2026, EGU26-21574, https://doi.org/10.5194/egusphere-egu26-21574, 2026.

CC BY 4.0